UNITED STATES
SECURITIES AND EXCHANGE COMMISSION
Washington, D.C. 20549
FORM 20-F
| ☐ | REGISTRATION STATEMENT PURSUANT TO SECTION 12(b) OR (g) OF THE SECURITIES EXCHANGE ACT OF 1934 |
OR
| ☒ | ANNUAL REPORT PURSUANT TO SECTION 13 OR 15(d) OF THE SECURITIES EXCHANGE ACT OF 1934 |
For the fiscal year ended December 31, 2020
OR
| ☐ | TRANSITION REPORT PURSUANT TO SECTION 13 OR 15(d) OF THE SECURITIES EXCHANGE ACT OF 1934 |
OR
| ☐ | SHELL COMPANY REPORT PURSUANT TO SECTION 13 OR 15(d) OF THE SECURITIES EXCHANGE ACT OF 1934 |
Commission File Number 001-15276
ITAÚ UNIBANCO HOLDING S.A.
(Exact Name of Registrant as Specified in its Charter)
ITAÚ UNIBANCO HOLDING S.A.
(Translation of Registrant’s name into English)
THE FEDERATIVE REPUBLIC OF BRAZIL
(Jurisdiction of incorporation or organization)
Praça Alfredo Egydio de Souza Aranha, 100
04344-902 São Paulo, SP, Brazil
(Address of principal executive offices)
Renato Lulia Jacob
Group Head of Investor Relations
Itaú Unibanco Holding S.A.
Praça Alfredo Egydio de Souza Aranha, 100
04344-902 São Paulo, SP, Brazil
+55 11 2794 3547
drinvest@itau-unibanco.com.br
(Name, Telephone, E-mail and/or Facsimile number and Address of Company Contact Person)
Securities registered or to be registered pursuant to Section 12(b) of the Act.
| | | | |
Title of each class | | Trading
Symbol (s) | | Name of each exchange on which registered |
| Preferred Shares, without par value | | ITUB | | New York Stock Exchange* |
| American Depositary Shares (as evidenced by American Depositary Receipts), each representing one Preferred Share | | New York Stock Exchange |
*Not for trading purposes, but only in connection with the listing on the New York Stock Exchange of American Depositary Shares representing those Preferred Shares.
Securities registered or to be registered pursuant to Section 12(g) of the Act:
None
Securities for which there is a reporting obligation pursuant to Section 15(d) of the Act:
None
Indicate the number of outstanding shares of each of the issuer’s classes of capital or common stock as of the period covered by the annual report:
4,958,290,359 Common Shares, no par value per share
4,801,324,161 Preferred Shares, no par value per share
Indicate by check mark if the registrant is a well-known seasoned issuer, as defined in Rule 405 of the Securities Act
☒ Yes ☐ No
If this annual report is an annual or transition report, indicate by check mark if the registrant is not required to file reports pursuant to Section 13 or 15(d) of the Securities Exchange Act of 1934.
☐ Yes ☒ No
Note—Checking the box above will not relieve any registrant required to file reports pursuant to Section 13 or 15(d) of the Securities Exchange Act of 1934 from their obligations under those Sections.
Indicate by check mark whether the registrant (1) has filed all reports required to be filed by Section 13 or 15(d) of the Securities Exchange Act of 1934 during the preceding 12 months (or for such shorter period that the registrant was required to file such reports), and (2) has been subject to such filing requirements for the past 90 days.
☒ Yes ☐ No
Indicate by check mark whether the registrant has submitted electronically every Interactive Data File required to be submitted pursuant to Rule 405 of Regulation S-T (§232.405 of this chapter) during the preceding 12 months (or for such shorter period that the registrant was required to submit such files).
☒ Yes ☐ No
Indicate by check mark whether the registrant is a large accelerated filer, an accelerated filer, a non-accelerated filer, or an emerging growth company. See definition of “large accelerated filer,” “accelerated filer,” and “emerging growth company” in Rule 12b-2 of the Exchange Act.
☒Large Accelerated filer ☐ Accelerated filer ☐ Non-accelerated filer ☐ Emerging growth company ☐
If an emerging growth company that prepares its financial statements in accordance with U.S. GAAP, indicate by check mark if the registrant has elected not to use the extended transition period for complying with any new or revised financial accounting standards† provided pursuant to Section 13(a) of the Exchange Act. ☐
† The term “new or revised financial accounting standard” refers to any update issued by the Financial Accounting Standards Board to its Accounting Standards Codification after April 5, 2012.
Indicate by check mark whether the registrant has filed a report on and attestation to its management’s assessment
of the effectiveness of its internal control over financial reporting under Section 404(b) of the Sarbanes-Oxley Act
(15 U.S.C. 7262(b)) by the registered public accounting firm that prepared or issued its audit report. ☐
Indicate by check mark which basis of accounting the registrant has used to prepare the financial statements included in this filing:
| | | | |
U.S. GAAP ☐ | | International Financial Reporting Standards as issued by the International Accounting Standards Board ☒ | | Other ☐ |
If “Other” has been checked in response to the previous question, indicate by check mark which financial statement item the registrant has elected to follow:
Item 17 ☐ Item 18 ☐
If this is an annual report, indicate by check mark whether the registrant is a shell company (as defined in Rule 12b-2 of the Exchange Act).
☐ Yes ☒ No
Certain Terms and Conventions
All references in this annual report to (i) “Itaú Unibanco Holding,” “Itaú Unibanco Group,” “we,” “us” or “our” are references to Itaú Unibanco Holding S.A. and its consolidated subsidiaries and affiliates, except where specified or differently required by the context; (ii) the “Brazilian government” are references to the federal government of the Federative Republic of Brazil, or Brazil; (iii) “preferred shares” are references to our authorized and outstanding preferred shares with no par value; and (iv) “common shares” are references to our authorized and outstanding common shares with no par value. All references to “ADSs” are to American Depositary Shares, each representing one preferred share, without par value. The ADSs are evidenced by American Depositary Receipts, or “ADRs,” issued by The Bank of New York Mellon, or BNY Mellon. All references herein to the “real,” “reais” or “R$” are to the Brazilian real, the official currency of Brazil. All references to “US$,” “dollars” or “U.S. dollars” are to United States dollars.
Additionally, unless specified or the context indicates otherwise, the following definitions apply throughout this annual report:
| | • | | “Itaú Unibanco” means Itaú Unibanco S.A., together with its consolidated subsidiaries; |
| | • | | “Itaú BBA” means Banco Itaú BBA S.A., together with its consolidated subsidiaries; |
| | • | | “Central Bank” means the Central Bank of Brazil; |
| | • | �� | “CLP” means the Chilean peso, the official currency of Chile; |
| | • | | “CMN” means the Brazilian National Monetary Council; and |
| | • | | “CVM” means the Securities and Exchange Commission of Brazil. |
Additionally, acronyms used repeatedly, defined and technical terms, specific market expressions and the full names of our main subsidiaries and other entities referenced in this annual report are explained or detailed in the section entitled “Glossary”.
Forward-Looking Statements
This annual report contains statements that are or may constitute forward-looking statements within the meaning of Section 27A of the United States Securities Act of 1933, as amended, or the Securities Act, and Section 21E of the U.S. Securities Exchange Act of 1934, as amended, or Exchange Act. We have based these forward-looking statements largely on our current expectations and projections about future events and financial trends affecting our business. These forward-looking statements are subject to risks, uncertainties and assumptions including, among other risks:
| | • | | The economic, financial and other effects of the outbreak of the 2019 novel strain of coronavirus, or COVID-19, particularly as such factors impact Brazil and the other markets in which we operate and continue to cause severe ongoing negative macroeconomic effects and disruptions to financial markets and the global economy, with a significant impact on the ability of businesses, including ours, to operate normally, thus heightening many of the other risks described in the “Risk Factors” section of this annual report; |
| | • | | General economic, political and business conditions both in Brazil and abroad, including, in Brazil, developments and the perception of risks in connection with ongoing corruption and other investigations and increasing fractious relations and infighting within the administration of President Bolsonaro, as well as policies and potential changes to address these matters or otherwise, including economic and fiscal reforms and in response to the ongoing effects of the COVID-19 pandemic, any of which may negatively affect growth prospects in the Brazilian economy as a whole; |
| | • | | Fluctuations in inflation, interest rates and exchange rates in Brazil and the other markets in which we operate, which have been particularly volatile as a result of the ongoing effects of the COVID-19 pandemic; |
| | • | | Our ability to implement, in a timely and efficient manner, any measure necessary to respond to, or reduce the impacts of, the COVID-19 pandemic on our business, operations, cash flow, prospects, liquidity and financial condition; |
| | • | | The duration and spread of the COVID-19 pandemic and the outbreak of diseases or similar public health threats; |
| | • | | General economic, political, and business conditions in Brazil and variations in inflation indexes, interest rates, foreign exchange rates, and the performance of financial markets; |
| | • | | General economic and political conditions, in particular in the countries where we operate; |
| | • | | Government regulations and tax laws and amendments to such regulations and laws; |
1
| | • | | Developments in high-profile investigations currently in progress and their impact on customers or on our tax exposures; |
| | • | | Disruptions and volatility in the global financial markets; |
| | • | | Increases in compulsory deposits and reserve requirements; |
| | • | | Regulation and liquidation of our business on a consolidated basis; |
| | • | | Obstacles for holders of our shares and ADSs to receive dividends; |
| | • | | Failure or hacking of our security and operational infrastructure or systems; |
| | • | | Our ability to protect personal data; |
| | • | | Strengthening of competition and industry consolidation; |
| | • | | Changes in our loan portfolio and changes in the value of our securities and derivatives; |
| | • | | Losses associated with counterparty exposure; |
| | • | | Our exposure to the Brazilian public debt; |
| | • | | Incorrect pricing methodologies for insurance, pension plan and premium bond products and inadequate reserves; |
| | • | | The effectiveness of our risk management policy; |
| | • | | Damage to our reputation; |
| | • | | The capacity of our controlling stockholder to conduct our business; |
| | • | | Difficulties during the integration of acquired or merged businesses; |
| | • | | Effects from socio-environmental issues; and |
| | • | | Other risk factors as set forth under “Item 3D. Risk Factors.” |
The words “believe”, “may”, “will”, “estimate”, “continue”, “anticipate”, “intend”, “expect” and similar words are intended to identify forward-looking statements, but are not the exclusive means of identifying such statements. We undertake no obligation to update publicly or revise any forward-looking statements because of new information, future events or otherwise. In light of these risks and uncertainties, the forward-looking information, events and circumstances discussed in this annual report might not occur. Our actual results and performance could differ substantially from those anticipated in such forward-looking statements.
Presentation of Financial and Other Information
The information found in this annual report is accurate only as of the date of such information or as of the date of this annual report, as applicable. Our activities, our financial position and assets, the results of transactions and our prospects may have changed since that date.
Information contained in or accessible through our website or any other websites referenced herein does not form part of this annual report unless we specifically state that it is incorporated by reference and forms part of this annual report. All references in this annual report to websites are inactive textual references and are for information only.
Effect of Rounding
Certain amounts and percentages included in this annual report, including in the section of this annual report entitled “Item 5. Operating and Financial Review and Prospects” have been rounded for ease of presentation. Percentage figures included in this annual report have not been calculated in all cases on the basis of the rounded figures but on the basis of the original amounts prior to rounding. For this reason, certain percentage amounts in this annual report may vary from those obtained by performing the same calculations using the figures in the audited consolidated financial statements. Certain other amounts that appear in this annual report may not sum due to rounding.
Market and Industry Data
This annual report contains information, including statistical data, about certain markets and our competitive position. Except as otherwise indicated, this information is taken or derived from external sources. We indicate the name of the external source in each case where industry data is presented in this annual report. We cannot guarantee and we have not independently verified the accuracy of information taken from external sources, or that, in respect of internal estimates, a third party using different methods would obtain the same estimates as the estimates we present in this annual report.
About our Financial Information
The reference date for the quantitative information for balances found in this annual report is as of December 31, 2020 and the reference date for results is the year ended December 31, 2020, except where otherwise indicated.
Our fiscal year ends on December 31 and, in this annual report, any reference to any specific fiscal year is to the twelve-month period ended on December 31 of that year.
2
Our audited consolidated financial statements, included elsewhere in this annual report, are prepared in accordance with IFRS, as issued by the IASB. Unless otherwise stated all audited consolidated financial information related to the years ended December 31, 2020, 2019 and 2018 included in this annual report was prepared in accordance with IFRS, as issued by the IASB.
We use accounting practices adopted in Brazil applicable to institutions authorized to operate by the Central Bank, or Brazilian GAAP, for our reports to Brazilian stockholders, filings with the CVM, and calculation of payments of dividends and tax liabilities.
The CMN establishes that financial institutions meeting certain criteria, such as us, are required to present audited consolidated financial statements in accordance with IFRS as issued by the IASB, in addition to financial statements under Brazilian GAAP.
Please see “Note 30 – Segment Information” to our audited consolidated financial statements for further details about the main differences between our management reporting systems and the audited consolidated financial statements prepared in accordance with IFRS.
Our audited consolidated financial statements as of December 31, 2020 and 2019 and for each of the years ended December 31, 2020, 2019 and 2018 were audited by PricewaterhouseCoopers Auditores Independentes, or PwC, independent auditors, as stated in its audit report contained in this Form 20-F.
Please see “Note 2 – Significant Accounting Policies” to our audited consolidated financial statements for further details about the significant accounting policies applied in the preparation of our audited consolidated financial statements in accordance with IFRS, as issued by the IASB.
3
PART 1
| ITEM 1. | IDENTITY OF DIRECTORS, SENIOR MANAGEMENT AND ADVISORS |
Not applicable.
| ITEM 2. | OFFER STATISTICS AND EXPECTED TIMETABLE |
Not applicable.
4
| 3B. | Capitalization and Indebtedness |
Not applicable.
| 3C. | Reasons for the Offer and Use of Proceeds |
Not applicable.
This section addresses the risks we consider material to our business and an investment in our securities. Should any of the following risks actually occur, our business and financial condition, as well as the value of any investments made in our securities, will be adversely affected. Accordingly, investors should carefully assess the risk factors described below and the information disclosed in this annual report before making an investment decision. The risks described below are those that we currently believe may adversely affect us. Other risks that we do not presently consider material, emerging risks or risks not currently known to us may also adversely affect us.
Macroeconomic Risks
International Scenario
Changes in economic conditions may adversely affect us.
Our operations are dependent upon the performance of the economies of the countries in which we do business, and Latin American countries in particular. Crises and volatility in the financial markets of countries other than Brazil may affect the global financial markets and the Brazilian economy and may have a negative impact on our operations.
The demand for credit and financial services, as well as our clients’ ability to repay, is directly impacted by macroeconomic variables, such as economic growth, income, unemployment rate, inflation, and fluctuations in interest and foreign exchange rates.
Disruptions and volatility in the global financial markets may have significant consequences in the countries in which we operate, such as volatility in the prices of securities, interest rates and foreign exchange rates. Higher uncertainty and volatility may result in a slowdown in the credit market and the economy, which, in turn, could lead to higher unemployment rates and a reduction in the purchasing power of consumers. In addition, such events may significantly impair our clients’ ability to perform their obligations and increase overdue or non-performing loans, resulting in an increase in the risk associated with our lending activity.
The economic and market conditions of other countries, including the United States, countries of the European Union, and emerging markets, may affect the credit availability and the volume of foreign investments in Brazil and in the countries in which we do business, to varying degrees. The spread of the COVID-19 pandemic remains a concern for the global economy, despite the decrease of infection rates in most developed countries and vaccines being distributed worldwide. The number of COVID-19 cases are falling across countries as winter (in the northern hemisphere) and holiday outbreaks dissipate. In the U.S., cases, hospitalizations and deaths are falling in nearly all states, allowing some easing of restrictions. In Europe, recent surges in the virus have been curbed, but some countries are taking new restrictive measures to avoid new waves. Vaccination campaigns are accelerating in several countries and the global vaccine supply is expected to keep increasing in the second and third quarters of 2021.
In our view, the worldwide distribution of vaccines in 2021 is the most important initiative for a full recovery of the global economy. A new surge of infections arising, for example from new strains of the virus and any event that might hinder
5
governments further controlling the spread of COVID-19, such as delays in the distribution of vaccines or inefficient vaccines themselves may lead to governments having to maintain restrictions on mobility to try to contain the further spread of the disease, thus leading to a suppression of economic activity. Although these risks have decreased mostly for developed markets, their materialization would affect global growth and may decrease investors’ interest in assets from Brazil and other countries in which we do business, which would adversely affect the market price of our securities, possibly making it more difficult for us to access capital markets and, as a result, to finance our operations in the future.
The rise in global interest rates reflects the economic recovery outlook and is less of a concern in the near term, as we expect the Fed to maintain its ample accommodative stance in 2021 and gradually withdraw stimulus in 2022. A faster withdrawal of monetary stimulus in developed economies can affect emerging economies and thus affect our operations.
We are exposed to certain risks that are particular to emerging and other markets
In conducting our business in Brazil, as well as other emerging markets, we are subject to political, economic, legal, operational and other risks that are inherent to operating in these countries. Banks that operate in countries considered to be emerging markets, including us, may be particularly susceptible to disruptions and reductions in the availability of credit or increases in financing costs, which may have a material adverse impact on our operations. In particular, the availability of credit to financial institutions operating in emerging markets is significantly influenced by an aversion to global risk. In addition, any factor impacting investor confidence, such as a downgrade in sovereign credit ratings (since the ratings of financial institutions, such as us, tends to be capped to the sovereign’s rating) or an intervention by a government or monetary authority in one of such markets, may affect the price or availability of resources for financial institutions in any of these markets, which may affect us.
In Argentina, international reserves continue at low levels, despite controls on exchange rate purchases. The economy rebounded during the second half of 2020, as a result of the easing of social distancing measures, but GDP fell by 10% in 2020. For 2021, we expect GDP growth of 6.0%, aided by statistical carry-over and higher commodity prices. Loose macro-economic policies are likely to fuel inflation, potentially leading to more control on prices (including foreign exchange).
In Chile, protests led political actors to agree on a referendum process to decide on a new constitution. While uncertainty over the constitutional process and elections later in 2021 is negatively affect the economic activity in Chile, an efficient vaccination process and higher terms of trade are important offsetting factors.
Colombia´s fiscal accounts were pressured during the COVID-19 pandemic and the government recently signaled a postponement of fiscal adjustment (fiscal deficit this year would be even wider than in 2020). While a tax reform may help fiscal consolidation from 2022 onwards, it is unclear whether there is political appetite for unpopular tax hikes. At the same time, contrasting with other countries in the region, Colombia recorded a wide current account deficit in 2020, contributing to an increase in external indebtedness. In this context, Colombia´s sovereign investment grade is at risk.
Crises in these countries may decrease investors’ interest in Brazilian assets, which may materially and adversely affect the market price of our securities, making it more difficult for us to access capital markets and, as a result, to finance our operations in the future. Global financial crises, in addition to the Brazilian macroeconomic environment, may also affect in a material and adverse way the market price of securities of Brazilian issuers or lead to other negative effects in Brazil and in the countries in which we operate and have a material adverse effect on us.
Domestic Scenario
Brazilian authorities exercise influence over the Brazilian economy. Changes in fiscal, monetary and foreign exchange policies as well as a deterioration of government fiscal accounts, may adversely affect us.
Our operations are highly dependent upon the performance of the Brazilian economy. The demand for credit and financial services, as well as our clients’ ability to make payments when due, is directly impacted by macroeconomic variables, such as economic growth, income, unemployment, inflation, and fluctuations in interest and foreign exchange rates. Brazilian GDP grew 1.4% in 2019, but decreased 4.1% in 2020, impacted by the COVID-19 outbreak. The number of new daily deaths rebounded in the first quarter of 2021 and has surpassed the levels registered during the first wave of
6
COVID-19 in 2020. Control of the COVID-19 pandemic is crucial for continued economic recovery. In the long term, growth may be limited by a number of factors, including structural factors, such as inadequate infrastructure, which entail risks of potential energy shortages and deficiencies in the transportation sector, among others, and a lack of qualified professionals, which can reduce the country’s productivity and efficiency levels. Low levels of national savings require relatively large financial flows from abroad, which may falter if political and fiscal instability is perceived by foreign investors. Depending on their intensity, these factors could lead to decreasing employment rates and to lower income and consumption levels, which could result in increased default rates on loans we grant for individuals and non-financial corporations and, therefore, have a material adverse effect on us.
Brazilian authorities intervene from time to time in the Brazilian economy, through changes in fiscal, monetary, foreign exchange policies, and in state-owned public companies—which may adversely affect us. These changes may impact variables that are crucial for our growth strategy (such as foreign exchange and interest rates, liquidity in the currency market, tax burden, and economic growth), thus limiting our operations in certain markets, affecting our liquidity and our client’s ability to pay, the risk appetite of foreign investors with respect to Brazil and, consequently, affecting our business, results of operations and financial condition.
Fiscal
The Brazilian primary public accounts have deteriorated since 2014. To address the structural fiscal imbalance, the Brazilian Congress approved a ceiling on government spending that will limit primary public expenditure growth to the prior year’s inflation for a period of at least ten years, effective as of 2017. Further, Congress approved a comprehensive social security reform and the government started an asset sale program, creating conditions for a cyclical decrease of the public debt, while the primary result gradually improves. In 2021, the Congress approved another round of temporary emergency expenditure to combat the economic effects of the COVID-19 pandemic, in exchange for measures to reinforce the fiscal adjustment framework that will help to limit mandatory expenditure growth and to keep the ceiling on public spending feasible in the years ahead. The government also has a comprehensive reform agenda, the main examples being the Administrative Reform and the Tax Reform. However, these discussions were temporarily put on hold due the COVID-19 pandemic. If the government fails to persist with the fiscal adjustment agenda, the local economy would be negatively impacted, with a depreciation of the Brazilian real, an increase in inflation and interest rates and a deceleration of economic growth, thus adversely affecting our business, results of operations and financial condition.
Monetary
Sudden increases in prices and long periods of high inflation may cause, among other effects, loss of purchasing power and distortions in the allocation of resources in the economy. Measures to combat high inflation rates include a tightening of monetary policy, with an increase in the short-term interest rate (SELIC), resulting in restrictions on credit and short-term liquidity, which may have a material adverse effect on us. Changes in interest rates may have a material effect on our net margins, since they impact our costs of funding and granting credit. In addition, increases in the SELIC interest rate could reduce demand for credit and increase the costs of our reserves and the risk of default by our clients. Conversely, decreases in the SELIC interest rate could reduce our gains from interest-bearing assets, as well as our net margins.
The Central Bank’s Monetary Policy Committee (the “COPOM”) was created on June 20, 1996 and is responsible for setting the SELIC interest rate. The COPOM meets eight times a year, every 45 days. The aim in creating the COPOM was to enhance monetary policy transparency and confer adequate regularity to the monetary policy decision-making process. Currently, many central banks around the world follow similar procedures, facilitating the decision-making process, monetary policy transparency and communication with the public.
After reaching 14.25% per annum at the end of 2015, the Central Bank began to cut interest rates in October 2016. The SELIC rate reached 2.00% in August 2020 and remained at this level until February 2021. In March 2021, the Central Bank increased the SELIC rate by 0.75 percentage points to 2.75%. The widespread decline in inflation, due to the high level of idle capacity in the Brazilian economy, as well as anchored inflation expectations have resulted in the SELIC reaching historically low levels.
The COVID-19 pandemic and the resulting economic slowdown and volatility in the Brazilian and global financial
7
and capital markets had, and may in the future continue to have, a material adverse effect on our business, financial condition, liquidity and results of operations across our business units. To the extent the COVID-19 pandemic adversely affects our business, liquidity, results of operations and financial condition, it will also have the effect of materially heightening many of the other risks described in this “Risk Factors” section.
The COVID-19 pandemic and governmental responses thereto have had, and may continue to have, a severe impact on global and Brazilian macro-economic and financial conditions, including the disruption of supply chains and the closures or interruptions of many businesses, leading to losses of revenues, increased unemployment and economic stagnation and contraction.
The COVID-19 pandemic has also resulted in materially increased volatility in both Brazilian and international financial markets and economic indicators, including exchange rates, interest rates and credit spreads. For example, as a result of heightened volatility, the B3 Exchange’s circuit breaker was triggered eight times in the month of March 2020 and the value of assets was negatively impacted. Any shocks or unexpected movements in these market factors could result in financial losses associated with our trading portfolio or financial assets, which could deteriorate our financial condition. Furthermore, market concerns could translate into liquidity constraints and reduced access to funding in both the local and the international markets, negatively affecting our business.
Measures taken by governmental authorities worldwide, including Brazil, to stabilize markets and support economic growth may not be sufficient to control high volatility or to prevent serious and prolonged reductions in economic activity. In addition, the social distancing measures imposed by governmental authorities to contain the spread of the COVID-19 pandemic resulted in a sharp drop or even a halt in the activities of companies in various sectors that we transact with and otherwise serve. While many of these restrictions have since been lifted, there is no way to predict whether new patterns of contagion, increasing disease severity or other factors related to the pandemic, including access to, or the efficiency of, a vaccine, may result in a renewed tightening of these policies or the imposition of new and different restrictions. These policies and measures have influenced the behavior of the consumer market and the population in general, the demand for services, products and credit.
In addition, there can be no assurance that the restrictive measures imposed by certain Brazilian states and municipalities will not worsen if Brazil faces new waves of COVID-19. For example, at the beginning of 2021, a novel strain of COVID-19 started circulating in Brazil, causing an increase in the number of deaths and hospitalizations. On March 11, 2021, Brazil was considered the epicenter of the COVID-19 pandemic in terms of number of confirmed cases and deaths. In March 2021, Brazil registered 321,515 deaths from COVID-19. As a result, public authorities in Brazil reinstated more severe restrictive measures, including social distancing, quarantine and lockdowns. Moreover, there can be no assurance that there will be no delays in COVID-19 vaccinations in Brazil, including as a result of supply shortages and delays on Brazilian regulatory approval of certain vaccines.
The weakened macroeconomic fundamentals coupled with the market downturn caused by the COVID-19 pandemic had, and may in the future have, a negative impact on our performance across all our business units. Impacts on our business could be widespread, and material impacts may be possible, including but not limited to the following:
| | • | | Employees contracting COVID-19; |
| | • | | Reductions in our operating effectiveness as our employees work from home or disaster-recovery locations; |
| | • | | Unavailability of key personnel necessary to conduct our business activities, including a lack of qualified IT personnel to support remote working or combat any cyber risks; |
| | • | | Unprecedented volatility in global financial markets and exchange markets; |
| | • | | Reductions in revenue across our operating businesses and increased customer defaults; |
| | • | | Closure of our offices or the offices of our clients; and |
| | • | | Potential regulatory scrutiny of our ability to adequately supervise our activities in accordance with applicable regulatory requirements. |
The extent of the impacts of the COVID-19 pandemic on our business, financial condition, liquidity and results will depend on future developments, which are highly uncertain, unpredictable and which depend on several factors that are beyond our control, including the possibility of additional outbreaks, further mutations of the virus and the intensity of the
8
economic downturn resulting from actions taken, or to be taken, by government authorities and the scientific community in response to the COVID-19 pandemic, including in relation to the availability and efficiency of vaccines and other treatments. Consumers affected by the COVID-19 pandemic may continue to show retraction behaviors, even after the end of the crisis, maintaining low levels of discretionary spending in the long term, which is why certain sectors we serve may take longer to recover (particularly sectors such as hotels, civil aviation, shopping centers and wholesale retailers).
To the extent the COVID-19 pandemic adversely affects our business, results of operations and financial condition, it would also have the effect of heightening many of the other risks described in this “Risk Factors” section of this Form 20-F, such as those relating to interest rate changes, economic, social and political developments in Brazil, the market volatility generated by distortions in the international financial markets, cybersecurity, etc.
Please see “Item 5A. Operating Results — Macroeconomic Context – Brazilian Context” for further details about the impact of the COVID-19 pandemic on our business.
Please also see “Note 33 – Supplementary Information” to our audited consolidated financial statements.
Ongoing high profile anti-corruption investigations in Brazil may affect the perception of Brazil and domestic growth prospects.
Certain relevant Brazilian companies in the energy, infrastructure and oil and gas sectors are facing investigations by the CVM, the SEC, the U.S. Department of Justice (DOJ), the Brazilian Federal Police and other Brazilian public entities who are responsible for corruption and cartel investigations, in connection with corruption allegations (so called Lava Jato investigations) and, depending on the outcome of such investigations and the time it takes to conclude them, they may face (as some of them already faced) downgrades from credit rating agencies, experience (as some of them already experienced) funding restrictions and have (as some of them already had) a reduction in revenues, among other negative effects. Such negative effects may hinder the ability of those companies to timely honor their financial obligations bringing loses to us as a number of them are our clients. The companies involved in the Lava Jato investigations, a number of which are our clients, may also be (as some of them already have been) prosecuted by investors on the grounds that they were misled by the information released to them, including their financial statements. Moreover, the current corruption investigations have contributed to reduce the value of the securities of several companies. The investment banks (including Itau BBA Securities in NY) that acted as underwriters on public distributions of securities of such investigated companies, and Banco Itau International, our private banking vehicle in Miami, were in the recent past also parties to certain related lawsuits in the U.S., that were either settled or dismissed, and may become parties to other legal proceedings yet to be filed. We cannot predict how long the corruption investigations may continue, or how significant the effects of the corruption investigations may be for the Brazilian economy and for the financial sector that may be investigated for the commercial relationships it may have held with companies and persons involved in Lava Jato investigations. Another high profile investigation, besides Lava Jato, ongoing in Brazil is the so-called Zelotes operation. If the allegations of such investigations are confirmed they may also affect some of our clients and their credit trustworthiness. In March 2016, the Brazilian Internal Revenue Services, or Brazilian IRS, summoned us to account for certain tax proceedings related to BankBoston Brazil which came under investigation in relation to the Zelotes operations. We acquired BankBoston Brazil’s operation from Bank of America in 2006. On December 1, 2016, the Brazilian Federal Police conducted searches at Itaú Unibanco’s premises, to look for documents related to those proceedings, and documents related to payments made to lawyers and consultants that acted on those proceedings. We clarify that the agreement with Bank of America for the acquisition of BankBoston Brazil’s operations included a provision whereby the seller would remain liable and responsible for the conduct of BankBoston’s tax proceedings, including with regard to the retention of lawyers and consultants. Therefore, according to such agreement, any and all payments made by Itaú Unibanco to lawyers and consultants were made strictly on behalf of Bank of America. On July 2017, the Brazilian Federal Public Prosecutor indicted some lawyers and public agents regarding this case, based on their potential participation on the scheme. None of them was Itau’s employees or executives. We remain fully available and will cooperate with the authorities should any further clarification be needed. After reviewing our control procedures and our monitoring systems, we believe we are in compliance with the existing standards, especially related to anti-money laundering standards; notwithstanding, due to the size and breadth of our operations and our commercial relationship with investigated companies or persons, and due to the several banks, both publicly and privately owned, that Itaú Unibanco acquired throughout the last fifteen years, we may also come within the scope of investigations, which may ultimately result in reputational damage, civil or criminal liability. Negative effects on a number of companies may also impact the level of investments in infrastructure in Brazil, which may also lead to lower economic growth.
9
Legal and Regulatory Risks
Bank Regulations
We are subject to regulation on a consolidated basis and may be subject to liquidation or intervention on a consolidated basis.
We operate in a number of credit and financial services related sectors through entities under our control. For purposes of regulation and supervision, the Central Bank treats us and our subsidiaries and affiliates as a single financial institution. While our consolidated capital base provides financial strength and flexibility to our subsidiaries and affiliates, their individual activities could indirectly put our capital base at risk. Any investigation or intervention by the Central Bank, particularly in the activities carried out by any of our subsidiaries and affiliates, could have a material adverse impact on our other subsidiaries and affiliates and, ultimately, on us. If we or any of our financial subsidiaries become insolvent, the Central Bank may carry out an intervention or liquidation process on a consolidated basis rather than conduct such procedures for each individual entity. In the event of an intervention or a liquidation process on a consolidated basis, our creditors would have claims on our assets and the assets of our consolidated financial subsidiaries. In this case, claims of creditors of the same nature held against us and our consolidated financial subsidiaries would rank equally in respect of payment. If the Central Bank carries out a liquidation or intervention process with respect to us or any of our financial subsidiaries on an individual basis, our creditors will not have a direct claim on the assets of such financial subsidiaries, and the creditors of such financial subsidiaries would have priority in relation to our creditors in connection with such financial subsidiaries’ assets. The Central Bank also has the authority to carry out other corporate reorganizations or transfers of control under an intervention or liquidation process.
Changes in applicable law or regulations may have a material adverse effect on our business.
Changes in the law or regulations applicable to financial institutions in Brazil may affect our ability to grant loans and collect debts in arrears, which may have an adverse effect on us. Our operations could also be adversely affected by other changes, including with respect to restrictions on remittances abroad and other exchange controls as well as by interpretations of the law by courts and agencies in a manner that differs from our legal advisors’ opinions.
In the context of economic or financial crises, the Brazilian government may also decide to implement changes to the legal framework applicable to the operation of Brazilian financial institutions. For example, in response to the global financial crisis which began in late 2007, Brazilian national and intergovernmental regulatory entities, such as the BCBS, proposed regulatory reforms aiming to prevent the recurrence of similar crises, which included a new requirement to increase the minimum regulatory capital (Basel III).
Please see “Item 4B. Business Overview—Supervision and Regulation—Basel III Framework—Implementation of Basel III in Brazil” for further details about regulatory capital requirements.
Moreover, the Brazilian Congress is considering enacting new legislation that, if signed into law as currently drafted, could have an adverse effect on our activities. In 2019, multiple bills sought to limit interest rates, particularly for credit cards’ facilities (rotativo do cartão) and overdrafts facilities (cheque especial) – the latter, with limits that are more restrictive than those recently imposed by the Central Bank (which are described in more detail under “Item 4B. Business Overview – Supervision and Regulation—Rules for Overdraft Facilities in Checking Accounts”). Further caps on interest rates may be adopted. Furthermore, a proposed law to amend the Brazilian consumer protection code would allow courts to modify terms and conditions of credit agreements in certain circumstances, imposing certain difficulties for the collection of amounts from final consumers. In 2021, the Brazilian Congress is expected to consider bills that increase the tax burden of the banking and financial services sectors and to put to vote a bill that will allow the execution of convictions after condemnation in the second instance court, both in the criminal and in the civil spheres, before the exhaustion of all available appeals. If signed into law, the bill may have an impact on the execution of tax debts proceedings of which the bank is part.
In addition, local or state legislatures may from time to time consider bills intending to impose security measures and standards for customer services, such as setting branch opening hours, requiring 24 hour armed guard personnel and
10
specifications on ATM functioning, among others, that, if signed into law, could affect our operations. More recently, certain bills have passed (and others were proposed) in certain Brazilian states or municipalities that affect our ability to evaluate credit risk and collect outstanding debts. For example, legislators often impose, or aim to impose, restrictions on the ability of creditors to include the information about insolvent debtors in the records of credit protection bureaus. These types of restrictions could also adversely affect our ability to collect outstanding credit.
We also have operations outside of Brazil, including, but not limited to, Argentina, the Bahamas, the Cayman Islands, Chile, Colombia, Paraguay, Portugal, Switzerland, the United Kingdom, the United States and Uruguay. Changes in the laws or regulations applicable to our business in the countries where we operate, or the adoption of new laws, and related regulations, may have an adverse effect on us.
Increases in compulsory deposit requirements may have a material adverse effect on us.
Compulsory deposits are reserves that financial institutions are required to maintain with the Central Bank. Compulsory deposits generally do not provide the same returns as other investments and deposits because a portion of these compulsory deposits does not bear interest. The Central Bank has periodically changed the minimum level of compulsory deposits reserves that financial institutions are required to maintain with the Central Bank.
Insurance Regulations
Our insurance operations are subject to oversight by regulatory agencies, such as SUSEP and ANS. Therefore, we may be affected negatively by the penalties applied by such regulators.
Insurance companies are subject to SUSEP intervention and/or liquidation. In case of insufficient resources, technical reserves, or poor economic health with respect to a regulated entity, SUSEP may appoint an inspector to act within the relevant company. If such intervention does not remedy the issue, SUSEP will forward to CNSP a proposal to withdraw the applicable insurance license. In addition, insurance companies are subject to pecuniary penalties, warnings, suspension of authorization of activities and disqualification to engage in business activities as set in Law.
Health insurance companies are subject to ANS regulations. With respect to companies that are deemed to have financial imbalances or serious economic, financial or administrative irregularities, ANS may order the disposal of the applicable health insurance company’s portfolio, or take other measures, such as fiscal or technical direction regime for a period not exceeding 365 days, or extrajudicial liquidation. The penalties established for violations committed by health insurance companies and their directors and officers are: (i) warnings; (ii) pecuniary penalties; (iii) suspension of company’s activities; (iv) temporary disqualification for the exercise of management positions in health insurance companies; (v) permanent disqualification for the exercise of management positions in health insurance companies as well as in open private pension funds, insurance companies, insurance brokers and financial institutions; and (vi) the cancellation of the company’s authorization to operate and sale of its portfolio.
Accordingly, our insurance operations may be affected negatively by any penalties applied by SUSEP or ANS, as described above.
Capital Market and Tax Regulations
Holders of our shares and ADSs may not receive any dividends.
Corporations in Brazil are legally required to pay their stockholders a minimum mandatory dividend at least on a yearly basis (except in specific cases provided for in applicable law). Our Bylaws determine that we must pay our stockholders at least 25% of our annual net income calculated and adjusted pursuant to Brazilian Corporate Law. Applicable Brazilian legislation also allows corporations to consider the amount of interest on shareholders’ equity distributed to their stockholders for purposes of calculating the minimum mandatory dividends. The calculation of net income pursuant to the Brazilian Corporate Law may significantly differ from our net income calculated under IFRS, as issued by the IASB.
11
Brazilian Corporate Law also allows the suspension of the payment of the mandatory dividends in any particular year if our Board of Directors informs our general stockholders’ meeting that such payment would be incompatible with our financial condition. To suspend the dividend payments, our Fiscal Council is required to furnish to the CVM an opinion on the matter along with a statement by our executives. Therefore, upon the occurrence of such event, the holders of our shares and ADSs may not receive any dividends. If this happens, the dividends that were not paid in the particular fiscal year shall be registered as a special reserve and, if not used to cover any losses of subsequent years, the amounts of unpaid dividends still available under such reserve shall be distributed when the financial condition of the corporation allows for such payment.
Furthermore, pursuant to its regulatory powers provided under Brazilian law and banking regulations, the Central Bank may at its sole discretion reduce the dividends or determine that no dividends will be paid by a financial institution if such restriction is necessary to mitigate relevant risks to the Brazilian financial system or the financial institution. Due to the COVID-19 pandemic, the CMN issued Resolution No. 4,820, amended by Resolution No. 4,885, establishing restrictions regarding the distribution by financial institutions of dividends and interest on capital.
Please see “Item 8A. Consolidated Statements and Other Financial Information—Stockholders’ Payment” and “Item 4B. Business Overview—Supervision and Regulation—Basel III Framework—Implementation of Basel III in Brazil.” For further details about CMN’s capital requirements and dividends and interest on capital see “Note 2.4 – Summary of Main Accounting Practices, q) Dividends and Interest on Capital” and “Note 19 – Stockholders’ Equity” to our audited consolidated financial statements.
Tax reforms may adversely affect our operations and profitability.
The Brazilian government regularly amends tax laws and regulations, including by creating new taxes, which can be temporary, and changing tax rates, the basis on which taxes are assessed or the way taxes are calculated, including in respect of tax rates applicable solely to the banking industry.
Currently, the Brazilian Congress is discussing a broad tax reform and there is no clarity as to when such reform may ultimately be enacted. If adopted, any such tax reform may affect our business by increasing our costs, limiting our profitability or having other impacts.
Risks Associated with our Business
Market Risk
The value of our securities and derivatives is subject to market fluctuations due to changes in Brazilian or international economic conditions and, as a result, may subject us to material losses.
Market risk is the risk of losses due to movements in financial market prices.
The securities and derivative financial instruments in our portfolio may cause us to record gains and losses, when sold or marked to market (in the case of trading securities), and may fluctuate considerably from period to period due to domestic and international economic conditions. In addition, we may incur losses from fluctuations in the market value of positions held, including risks associated with transactions subject to variations in foreign exchange rates, interest rates, price indexes, equity and commodity prices.
We cannot predict the amount of realized or unrealized gains or losses for any future period. Gains or losses on our investment portfolio may not contribute to our net revenue in the future or may cease to contribute to our net revenue at levels consistent with more recent periods. We may not successfully realize the appreciation or depreciation now existing in our consolidated investment portfolio or in any assets of such portfolio.
Credit Risks
Past performance of our loan portfolio may not be indicative of future performance, changes in the profile of our business may adversely affect our loan portfolio. In addition, the value of any collateral securing our loans may not be sufficient, and we may be unable to realize the full value of the collateral securing our loan portfolio.
12
Our historical loan loss experience may not be indicative of our future loan losses. While the quality of our loan portfolio is associated with the default risk in the sectors in which we operate, changes in our business profile may occur due, among other factors, to our organic growth, merger and acquisition activity, changes in local economic and political conditions, a slowdown in customer demand, an increase in market competition, the outbreak of communicable diseases such as COVID-19, changes in regulation and in the tax regimes applicable to the sectors in which we operate and, to a lesser extent, other related changes in countries in which we operate and in the international economic environment. More recently, the ongoing COVID-19 pandemic may affect our ability to accurately assess the creditworthiness of borrowers, which would lead to a deterioration of risk profile and adversely affect our business financial condition and results of operations. In addition, the market value of any collateral related to our loan portfolio may fluctuate, from the time we evaluate it at the beginning of the trade to the time such collateral can be executed upon, due to the factors related to changes in economic, political or sectorial factors beyond our control.
For example, historically, when Brazilian banks increased their loan portfolio to consumers, particularly in the automotive sector, this increased demand for vehicle loans has been followed by a significant rise in the level of consumer indebtedness, leading to high nonperforming loan rates. As a result, many financial institutions recorded higher loan losses due to an increased volume of provisions and a decrease in loans for vehicle acquisition.
Any changes affecting any of the sectors to which we have significant lending exposure, and changes in the value of the collateral securing our loans, may result in a reduction in the value we realize from collateral and in our loan portfolio. Consequentially, it may have an adverse impact on our results of operations and financial condition and it could also adversely affect the growth rate and the mix of our loan portfolio.
In addition, if we are unable to recover sums owed to us under secured loans in default through extrajudicial measures such as restructurings, our last recourse with respect to such loans may be to enforce the collateral secured in our favor by the applicable borrower. Depending on the type of collateral granted, we either have to enforce such collateral through the courts or through extrajudicial measures. However, even where the enforcement mechanism is duly established by the law, Brazilian law allows borrowers to challenge the enforcement in the courts, even if such challenge is unfounded, which can delay the realization of value from the collateral. In addition, our secured claims under Brazilian law will in certain cases rank below those of preferred creditors such as employees and tax authorities. As a result, we may not be able to realize value from the collateral, or may only be able to do so to a limited extent or after a significant amount of time, thereby potentially adversely affecting our financial condition and results of operations.
We may incur losses associated with counterparty exposure risks, including the Brazilian federal government.
We routinely conduct transactions with counterparties in the financial services industry, including brokers and dealers, commercial banks, investment banks, mutual and hedge funds and other institutional clients. Like most Brazilian banks, we also invest in debt securities issued by the Brazilian government. As of December 31, 2020, approximately 20.9% of all our assets and 67.5% of our securities portfolio were comprised of these public debt securities.
We may incur losses if any of our counterparties fail to meet their contractual obligations, due to bankruptcy, lack of liquidity, operational failure or other reasons that are exclusively attributable to our counterparties. As an example, an eventual
A downgrade of our ratings may adversely affect our funding cost, our access to capital and debt markets, our liquidity and, as a result, our competitive position.
Credit ratings represent the opinions of independent rating agencies regarding our ability to repay our indebtedness and affect the cost and other terms upon which we are able to obtain funding. Each of the rating agencies reviews its ratings and rating methodologies on a periodic basis and may decide on a grade change at any time, based on factors that affect our
13
financial strength, such as liquidity, capitalization, asset quality and profitability or due to a downgrade of the Brazilian sovereign rating.
Under the criteria utilized by the rating agencies, ratings assigned to Brazilian financial institutions, including Itaú Unibanco are constrained by the grades assigned to the Brazilian sovereign. Events that are not subject to our control, such as economic or political crises, may lead to a downgrade of the Brazilian sovereign rating and a corresponding downgrade of the ratings assigned to Itaú Unibanco.
Credit ratings are essential to our capability to raise capital and funding through the issuance of debt and to the cost of such financing. A downgrade or a potential downgrade in our credit ratings could have an adverse impact on our operations, income and risk weighting. This may affect net earnings, capital requirements and return on capital levels, causing a negative impact on our competitive position. Additionally, if our credit ratings were to be downgraded, rating trigger clauses that may be part of our financing agreements with other institutions could result in an immediate need to deliver additional collateral to counterparties or taking other actions under some of our derivative contracts, adversely affecting our interest margins and results of operations. Thus, a failure to maintain favorable ratings and outlooks can affect the cost and availability of our financing through the capital markets and other sources of financing, affecting our interest margins and capacity to operate.
Changes or uncertainty in base interest rates could adversely affect us.
A significant portion of our business is conducted in Brazil, where the Central Bank’s Monetary Policy Committee (Comitê de Política Monetária), or the COPOM, establishes the target base interest rate for the Brazilian economy (the “SELIC Rate”), and uses changes in this rate as an instrument of monetary policy. The SELIC Rate is the benchmark interest rate payable to holders of certain securities issued by the Brazilian government and traded on the SELIC System operated by the Central Bank. In recent years, the SELIC Rate, has fluctuated significantly reflecting the corresponding volatility in the macroeconomic scenario and inflationary environment. During 2015 and 2016, as a result of increased prospects of inflation and macroeconomic instability, the COPOM increased the SELIC Rate, reaching 14.25% and 13.75% as of December 31, 2015 and December 31, 2016, respectively. In the following years, as a result of the widespread decline in inflation, due to the high level of idle capacity in the Brazilian economy and anchored inflation expectations, the Central Bank started a monetary easing cycle and the COPOM has reduced the SELIC Rate. As of December 31, 2017, and December 31, 2018, the SELIC Rate was 7.00% and 6.50%, respectively. As of December 31, 2019, and December 31, 2020, the SELIC Rate was 4.5% and 2.0%, respectively, reflecting historical lows. As of the date of the filing of this form, the SELIC rate was 2.75%.
We may face challenges associated with IBOR transition.
A significant portion of our income, expenses and liabilities is directly tied to interest rates. Therefore, our results of operations and financial condition are significantly affected by inflation, interest rate fluctuations and related government monetary policies. In addition, various interbank offered rates which are deemed to be “benchmarks” (the “IBORs”, including LIBOR and EURIBOR) are the subject of recent international and other regulatory guidance and proposals for reform. Some of these reforms are already effective while others are still to be implemented, including the majority of the provisions of the EU Benchmark Regulation (Regulation (EU) 2016/1011) as it forms part of domestic law of the United Kingdom by virtue of the European Union (Withdrawal) Act 2018 (together, the “Benchmarks Regulations”).
In particular, the U.K. Financial Conduct Authority (“FCA”) announced that the FCA will no longer oblige banks to contribute to the calculation of LIBOR after the end of 2021. In addition, on March 5, 2021, the FCA confirmed that all LIBOR settings will either cease to be provided by any administrator or no longer be representative immediately after December 31, 2021, in the case of all sterling, euro, Swiss franc and Japanese yen settings, and the 1-week and 2-month US dollar settings and immediately after June 30, 2023, in the case of the remaining US dollar settings. These announcements indicate that the continuation of LIBOR on the current basis (or at all) cannot and will not be guaranteed after 2021.
The cessation of LIBOR for various currencies at the end of 2021 (and in 2023 for certain tenors of U.S. Dollar LIBOR) will also result in replacement rates being used more widely, including in the instruments documenting certain of our financial obligations. For example, in the U.S., a group convened by the Federal Reserve Board and the Federal Reserve Bank of New York, called the Alternative Reference Rate Committee (“ARRC”) and comprised of a diverse set of private sector entities, has identified the Secured Overnight Financing Rate (or “SOFR”) as its preferred alternative rate for the USD LIBOR and the Federal Reserve Bank of New York has begun publishing SOFR daily. Many banks in the U.S. have begun entering into transactions where interest is determined based on SOFR or plan to do so during the course of 2021, as recommended by
14
ARRC and certain regulators. Additionally, many financial contracts, including some which govern our financial obligations, include replacement alternatives for LIBOR upon the cessation of LIBOR. It is possible that some U.S. lenders will elect to use alternative rates other than SOFR. Central banks in several other jurisdictions have also announced plans for publishing alternative reference rates for other currencies.
In addition, on November 29, 2017, the Bank of England and the FCA announced that, as of January 2018, its working group on Sterling risk free rates has been mandated with implementing a broad-based transition to the Sterling Overnight Index Average (“SONIA”) over the next four years across sterling bond, loan and derivative markets so that SONIA is established as the primary sterling interest rate benchmark by the end of 2021.
On September 21, 2017, the European Central Bank announced that it would be part of a new working group tasked with the identification and adoption of a “risk free overnight rate” which can serve as a basis for an alternative to current benchmarks used in a variety of financial instruments and contracts in the euro area. On September 13, 2018, the working group on Euro risk-free rates recommended the new Euro short-term rate (“€STR”) as the new risk-free rate for the euro area. The €STR was published for the first time on October 2, 2019. Although EURIBOR has been reformed in order to comply with the terms of the Benchmark Regulation, it remains uncertain as to how long it will continue in its current form, or whether it will be further reformed or replaced with €STR or an alternative benchmark.
This and other reforms may cause IBORs to perform differently than in the past, or to disappear entirely, or have other consequences, which cannot be fully anticipated, which introduce a number of risks for us including legal risks arising from potential changes required to documentation for new and existing transactions, financial risks arising from any changes in the valuation of financial instruments linked to benchmark rates and hedging mismatch, pricing risks arising from how changes to benchmark indices could impact pricing mechanisms on some instruments, operational risks arising from the potential requirement to adapt information technology systems, trade reporting infrastructure and operational processes, and commercial risks arising from the potential impact of communication with customers and engagement during the transition period. Accordingly, the implementation of alternative benchmark rates may have a material adverse effect on our business, results of operations, financial condition and prospects.
Our approach to the replacement of the IBOR rates is described in more detail in “LIBOR Transition” in item 5A.
Liquidity Risk
We face risks relating to liquidity of our capital resources.
Liquidity risk, as we understand it, is the risk that we will not have sufficient financial resources to meet our obligations by the respective maturity dates or that we will honor such obligations but at an excessive cost. This risk is inherent in the activities of any commercial or retail bank.
Our capacity and cost of funding may be impacted by a number of factors, such as changes in market conditions (e.g., in interest rates), credit supply, regulatory changes, systemic shocks in the banking sector, and changes in the market’s perception of us, among others.
In scenarios where access to funding is scarce and/or becomes too expensive, and the access to capital markets is either not possible or is limited, we may find ourselves obliged to increase the return rate paid to deposits made to attract more clients and/or to settle assets not compromised and/or potentially devalued so that we will be able to meet our obligations. If the market liquidity is reduced, the demand pressure may have a negative impact on prices, since natural buyers may not be immediately available. Should this happen, we may have a significant negative goodwill on assets, which will impact the bank’s results and financial position. The persistence or worsening of such adverse market conditions or rises in basic interest rates may have a material adverse impact on our capacity to access capital markets and on our cost of funding.
Concentration Risk
15
We face risks related to market concentration.
Concentration risk is the risk associated with potentially high financial losses triggered by significant exposure to a particular component of risk, whether it be related to a particular counterparty, industry, geographic region, mitigating instruments, index or currency. Examples of such risks include significant exposure to a single counterparty, to counterparties operating in the same economic sector or geographical region, to businesses segments or credit products, or to financial instruments that depend on the same index or currency.
We believe that failure to diversify transactions with respect to a particular risk factor could generate material financial loss for us.
Hedge Risk
Our hedge strategy may not be able to prevent losses
We use diverse instruments and strategies to hedge our exposures to a number of risks associated with our business, but we may incur losses if such hedges are not effective.
We may not be able to hedge our positions, or do so only partially, or we may not have the desired effectiveness to mitigate our exposure to the diverse risks and market in which we are involved. Any of these scenarios may adversely affect our business and financial results.
Operational Risks
We face risks relating to our operations.
Operational risks, which may arise from errors in the performance of our processes, the conduct of our employees, instability, malfunction or outage of our IT system and infrastructure, or loss of business continuity, or comparable issues with respect to our vendors, may disrupt our businesses and lead to material losses. We face operational risk arising from errors, accidental or premeditated, made in the execution, confirmation or settlement of transactions or from transactions not being properly recorded, evaluated or accounted for. The occurrence of any of these risks may adversely affect our business, financial results and reputations.
We are exposed to failures, deficiency or inadequacy of our internal processes, human error or misconduct and cyberattacks. Additionally, we rely on third-party services. All these factors may adversely affect us.
Due to the high volume of daily processing, we are dependent on technology and management of information, which exposes us to eventual unavailability of systems and infrastructure such as power outages, interruption of telecommunication services, and generalized system failures, as well as internal and external events that may affect third parties with which we do business or that are crucial to our business activities (including stock exchanges, clearing houses, financial dealers or service providers) and events resulting from wider political or social issues, such as cyberattacks or unauthorized disclosures of personal information in our possession. We manage and store certain proprietary information and sensitive or confidential data relating to our clients and to our operations. We may be subject to breaches of the information technology systems we use for these purposes, as well as the theft of technology and intellectual property. Additionally, we operate in many geographic locations and are frequently subject to the occurrence of events outside of our control. Despite the contingency plans we have in place, our ability to conduct business in any of these locations may be adversely impacted by a disruption to the infrastructure that supports our business. We are strongly dependent on technology and thus are vulnerable to viruses, worms and other malicious software, including “bugs” and other problems that could unexpectedly interfere with the operation of our systems and result in data leakage.
Operating failures, including those that result from human error or fraud, not only increase our costs and cause losses, but may also give rise to conflicts with our clients, lawsuits, regulatory fines, sanctions, interventions, reimbursements and other indemnity costs. Ethical misconduct and noncompliance – ethical misconduct or breaches of applicable laws by our businesses or our employees could be damaging to our reputation too, and could result in litigation, regulatory action and penalties. All of which may have a material adverse effect on our business, reputation and results of operations. Operational risk also includes legal risk associated with inadequacy or deficiency in contracts signed by us, as
16
well as penalties due to noncompliance with laws and punitive damages to third parties arising from the activities undertaken by us. Additionally, we have essential other services for the proper functioning of our business and technology infrastructure, such as call centers, networks, internet and systems, among others, provided by external or outsourced companies. Impacts on the provision of these services, caused by these companies due to the lack of supply or the poor quality of the contracted services, can affect the conduct of our business as well as our clients. We also rely in certain limited capacities on third-party data management providers whose possible security problems and security vulnerabilities may have similar effects on us.
As a result of the COVID-19 pandemic, we have rapidly increased the number of employees working remotely. This may cause increases in the unavailability of our systems and infrastructure, interruption of telecommunication services, generalized system failures and heightened vulnerability to cyberattacks. Accordingly, our ability to conduct our business may be adversely impacted.
Failure to protect personal information could adversely affect us.
We manage and hold confidential personal information of clients in the ordinary course of our business. Although we have procedures and controls to safeguard personal information in our possession, unauthorized disclosures or security breaches could subject us to legal action and administrative sanctions as well as damage that could materially and adversely affect our operating results, financial condition and prospects.
Further, our business is exposed to risk from potential non-compliance with policies, employee misconduct or negligence and fraud, which could result in regulatory sanctions and reputational or financial harm.
In addition, we may be required to report events related to cybersecurity issues, events where client information may be compromised, unauthorized access and other security breaches, to the relevant regulatory authority. Any material disruption or slowdown of our systems could cause information, including data related to client requests, to be lost or to be delivered to our clients with delays or errors, which could reduce demand for our services and products and could materially and adversely affect us.
Failure to adequately protect ourselves against risks relating to cybersecurity could materially and adversely affect us.
We face various cybersecurity risks, including but not limited to: penetration of our information technology systems and platforms, by ill-intentioned third parties, infiltration of malware (such as computer viruses) into our systems, contamination (whether intentional or accidental) of our networks and systems by third parties with whom we exchange data, unauthorized access to confidential client and/or proprietary data by persons inside or outside of our organization, and cyberattacks causing systems degradation or service unavailability that may result in business losses.
Although we have procedures and controls to safeguard our information technology systems and platforms, we are subject to cybersecurity risks. We have seen in recent years computer systems of companies and organizations being targeted, not only by cyber criminals, but also by activists and rogue states. We define cyberattack as any type of offensive maneuver employed by states, nations, individuals, groups or organizations that targets computer information systems, infrastructure, networks and/or personal devices, using varied means, such as denial of service, malware and phishing, for the purpose of stealing, altering or destroying a specific target by hacking into a technological susceptible system. Cyberattacks can range from the installation of viruses on a personal computer to attempts to destroy the infrastructure of entire nations. We are exposed to this risk over the entire lifecycle of information, from the moment it is collected to its processing, transmission, storage, analysis and destruction.
A successful cyberattack may result in unavailability of our services, leak or compromise of the integrity of information and could give rise to the loss of significant amounts of client data and other sensitive information, as well as significant levels of liquid assets (including cash) as well as damage to our image, directly affecting our customers and partners. In addition, cyberattacks could give rise to the disabling of our information technology systems used to service our clients. As attempted attacks continue to evolve in scope and sophistication, we may incur significant costs in our attempt to modify or enhance our protective measures against such attacks, or to investigate or remediate any vulnerability or resulting breach.
17
If we fail to effectively manage our cybersecurity risk, for example, by failing to update our systems and processes in response to new threats, this could harm our reputation and adversely affect our operating results, financial condition and prospects through the payment of client compensation, regulatory penalties and fines and/or through the loss of assets. In addition, we may also be subject to cyber-attacks against critical infrastructures of Brazil or of the other countries where we operate. Our information technology systems are dependent on such critical infrastructure and any cyber-attack against such critical infrastructure could negatively affect our ability to service our clients.
In 2020, due to the COVID-19 pandemic, there was a significant increase in employees working from home, which led to a change in the tactics used by cyber criminals to perform attacks, mostly exploiting the fears of people to try to steal data or compromise the technological environment. Due to the new profile of risks, we reinforced our measures to block fraudulent e-mails and to takedown malicious websites, ensuring that workstations are protected by antimalware and only have connectivity to our VPN. We also help third parties to adapt their infrastructure to work securely from home. There are also requirements related to the information security process, such as the Brazilian General Personal Data Protect Act (LGPD), CVM Instruction No. 612/2019 and CMN Resolution No. 4,658 /2018, that we agree on their importance to keep cyber risks mitigated and the related controls are continuous monitored to ensure effectiveness as any failure to comply with these regulatory requirements could adversely affect us.
The loss of senior management, or our ability to attract and maintain key personnel, could have a material adverse effect on us.
Our ability to maintain our competitive position and implement our strategy depends on our senior management. The loss of some of the members of our senior management, or our inability to maintain and attract additional personnel, could have a material adverse effect on our operations and our ability to implement our strategy.
Our performance and success are largely dependent on the talents and efforts of highly skilled individuals. Talent attraction and retention is one of the key pillars for supporting the results of our organization, which is focused on client satisfaction and sustainable performance. Our ability to attract, develop, motivate and retain the right number of appropriately qualified people is critical to our performance and ability to thrive globally. Concurrently, we face the challenge to provide a new experience to employees, so that we are able to attract and retain highly-qualified professionals who value environments offering equal opportunities and who wish to build up their careers in dynamic, cooperative workplaces, which encourage diversity and meritocracy and are up to date with new work models. Also, our current business scenario demands not only a careful look at traditional careers, but also at new career paths that are indispensable for our future.
Our performance could be adversely affected if we are unable to attract, retain and motivate key talent. As we are highly dependent on the technical skills of our personnel, including successors to crucial leadership positions, as well as their relationships with clients, the loss of key components of our workforce (particularly to emerging competitors, such as start-ups and fintechs), could make it difficult to compete, grow and manage the business. A loss of such expertise could adversely affect our financial performance, future prospects and competitive position.
Misconduct of our employees or representatives may adversely affect us.
Our business is based on institutional principles (“Our Way”), among which are “it’s only good for us if it’s good for the client” and “ethics are non-negotiable”. However, part of the customer relationship depends on direct interaction with our employees or representatives. We cannot assure you that our individual employees will always comply with our internal policies and that our internal procedures will effectively monitor and identify misbehavior. Deviations in behavior such as inappropriate sales practices and improper use of information may occur. These risks can give rise to customer attrition, need of compensation or reimbursements, litigation and, according to its extension, may expose the institution to reputation risk, financial and credibility losses with the market and regulators.
We may not be able to prevent our officers, employees or third parties acting on our behalf from engaging in situations that qualify as corruption in Brazil or in any other jurisdiction, which could expose us to administrative and judicial sanctions, as well as have an adverse effect to us.
18
We are subject to Brazilian anticorruption legislation, and similarly-focused legislation of the other countries where we have branches and operations, as well as other anticorruption laws and regulatory regimes with a transnational scope. These laws require the adoption of integrity procedures to mitigate the risk that any person acting on our behalf may offer an improper advantage to a public agent in order to obtain benefits of any kind. Applicable transnational legislation, such as the U.S. Foreign Corrupt Practices Act and U.K. Bribery Act, as well as the applicable Brazilian legislation (mainly Brazilian Law No. 12,846/2013 – Lei Anticorrupção Brasileira), require us, among other things, the maintenance of policies and procedures aimed at preventing any illegal or improper activities related to corruption involving government entities and officials in order to secure any business advantage, and require us to maintain accurate books and a system of internal controls to ensure the accuracy of our books and prevent illegal activities. We have policies and procedures designed to prevent bribery and other corrupt practices. See “Item 4B. Business Overview—Supervision and Regulation” for further details. Unauthorized actions by our officers, employees or third parties acting on our behalf in breach of our internal policies may qualify as corruption in Brazil or in other jurisdiction and we could be exposed to administrative and judicial sanctions, accounting errors or adjustments, monetary losses and reputational damages or other adverse effects. The perception or allegations that we, our employees, our affiliates or other persons or entities associated with us have engaged in any such improper conduct, even if unsubstantiated, may cause significant reputational harm and other adverse effects.
We operate in international markets which subject us to risks associated with the legislative, judicial, accounting, regulatory, political and economic risks and conditions specific to such markets, which could adversely affect us or our foreign units.
We operate in various jurisdictions outside of Brazil through branches, subsidiaries and affiliates, and we expect to continue to expand our international presence. We face, and expect to continue to face, additional risks in the case of our existing and future international operations, including:
| | • | | political instability, adverse changes in diplomatic relations and unfavorable economic and business conditions in the markets in which we currently have international operations or into which we may expand; |
| | • | | more restrictive or inconsistent government regulation of financial services, which could result in increased compliance costs and/or otherwise restrict the manner in which we provide our services; and |
| | • | | difficulties in managing operations and adapting to cultural differences, including issues associated with (i) business practices and customs that are common in certain foreign countries but might be prohibited by Brazilian law and our internal policies and procedures and (ii) management and operational systems and infrastructures, including internal financial control and reporting systems and functions, staffing and managing of foreign operations, which we might not be able to do effectively or cost-efficiently. |
As we expand into these and additional markets these risks could be more significant and have the potential to have an adverse impact on us.
Strategy Risk
Our business strategy may not provide us the results we expect.
Our strategy and challenges are determined by management based on related assumptions, such as the future economic environment, and the regulatory, political and social scenarios in the regions in which we operate. These assumptions are subject to inaccuracies and risks that might not be identified or anticipated.
Accordingly, the results and consequences arising from any possible inaccurate assumptions may compromise our capacity to fully or partially implement strategies, as well as to achieve the results and benefits expected therefrom, which might give rise to financial losses and reduce the value creation to our stockholders.
Additionally, factors beyond our control, such as, but not limited to, economic and market conditions, changes in laws and regulations, including regulations limiting fees or interest rates and fostering an increasingly competitive scenario, and other risk factors stated in this annual report may make it difficult or impossible to implement fully or partially our business model and also our achieving the results and benefits expected from our business plan.
19
Adverse changes to the political and economic scenario in Latin America may affect some of the challenges we have taken on, such as the internationalization of our business, since our strategy to strengthen our position in other countries is also dependent on the respective economic performance of these countries.
The integration of acquired or merged businesses involves certain risks that may have a material adverse effect on us.
As part of our growth strategy in the Brazilian and Latin American financial sector, we have engaged in a number of mergers, acquisitions and partnerships with other companies and financial institutions in the past and may pursue further such transactions in the future. Until we have signed a definitive agreement, we usually do not comment publicly on possible acquisitions. When we do announce, our stock price may fall depending on the size of the acquisition. Even though we review the companies we plan to acquire, it is generally not viable for these reviews to be complete in all respects. Any such transactions involve risks, such as the possible incurrence of unanticipated costs as a result of difficulties in integrating systems, finance, accounting and personnel platforms, failure in diligence or the occurrence of unanticipated contingencies, as well as the breach of the transaction agreements by counterparties. In addition, we may not achieve the operating and financial synergies and other benefits that we expected from such transactions in a timely manner, on a cost-effective basis or at all. There is also the risk that antitrust and other regulatory authorities may impose restrictions or limitations on the transactions or on the businesses that arise from certain combinations or impose fines or sanctions due to the interpretation by the authorities of irregularities with respect to a corporate merger, consolidation or acquisition.
If we are unable to take advantage of business growth opportunities, cost savings, operating efficiencies, revenue synergies and other benefits we anticipate from mergers and acquisitions, or if we incur greater integration costs than we have estimated, then we may be adversely affected.
Our controlling stockholder has the ability to direct our business.
As of December 31, 2020, IUPAR, our controlling stockholder, directly owned 51.71% of our common shares and 26.15% of our total share capital, giving it the power to appoint and remove our directors and officers and determine the outcome of any action requiring stockholder approval, including transactions with related parties, corporate reorganizations and the timing and of dividend payments.
In addition, IUPAR is jointly controlled by Itaúsa, which, in turn, is controlled by the Egydio de Souza Aranha family, and by Cia. E. Johnston, which in turn is controlled by the Moreira Salles family. The interests of IUPAR, Itaúsa and the Egydio de Souza Aranha and Moreira Salles families may be different from the interests of our other stockholders.
Certain of our directors are affiliated with IUPAR and circumstances may arise in which the interests of IUPAR and its affiliates conflict with the interests of our other stockholders. To the extent that these and other conflicting interests exist, our stockholders will depend on our directors duly exercising their fiduciary duties as members of our Board of Directors. Notwithstanding, according to Brazilian Corporation Law the controlling stockholders should always vote in the interest of the company. In addition, they are prohibited from voting in cases of conflict of interest in the matter to be decided.
Litigation Risk
Unfavorable court decisions involving material amounts for which we have no or partial provisions or in the event that the losses estimated turn out to be significantly higher than the provisions made, may adversely affect our results and financial condition.
As part of the ordinary course of our business, we are subject to, and party to various civil, tax and labor lawsuits, which involve financial risks. Our audited consolidated financial statements only include reserves for probable losses that can be reasonably estimated and eventual expenses that we incur in connection with litigation or administrative proceedings, or as otherwise required by Brazilian law. It is currently not possible to estimate the amount of all potential costs that we may incur or penalties that may be imposed on us other than those amounts for which we have reserves. In the event of unfavorable court decisions involving material amounts for which we have no or partial provisions, or in the event that the losses estimated turn out to be significantly higher than the provisions made, the aggregate cost of unfavorable decisions, may adversely affect our results and financial condition.
20
Decisions on lawsuits due to government monetary stabilization plans may have a material adverse effect on us.
We are a defendant in lawsuits for the collection of understated inflation adjustment for savings resulting from the economic plans implemented in the 1980s and 1990s by the Brazilian government as a measure to combat inflation.
Itaú Unibanco Holding is a defendant in lawsuits filed by individuals, as well as class actions filed by (i) consumer protection associations; and (ii) the public attorneys’ office (Ministério Público) on behalf of holders of savings accounts. In connection with these class actions, we established provisions upon service of the individual claim requiring the enforcement of a judgment handed down by the judiciary, using the same criteria used to determine the provisions of individual actions.
The STF has issued a number of decisions in favor of the holders of savings accounts but has not ruled regarding the constitutionality of economic plans and their applicability to savings accounts. Currently, the appeals on this issue are suspended by order of the STF, until there is a definitive decision by the STF regarding the constitutional issue.
In December 2017, under the mediation of the Advocacia-Geral da União (or AGU), the representative entities of banks and the representative entities of holders of savings accounts entered into an agreement with the objective of ending the litigation related to economic plans against the Brazilian banks. The agreement establishes the conditions for the voluntary adhesion of the holders of savings accounts for the receiving of amounts and closure of processes.
The agreement was ratified at a plenary session of the STF on March 1, 2018 and the holders of savings accounts were able to adhere to its terms for a period of 24 months.
As this period expired, the parties signed an addendum to the instrument to extend the adhesion period to include a greater number of saving account holders and, consequently, increase the termination of legal actions. In May 2020, the STF approved this addendum and granted a term of thirty months for new adhesions, which may be extended for another thirty months, conditioned to the number of account holders adhering throughout the first period.
As such, low adherence to the agreement and an eventual unfavorable judgment by the STF may result in Brazilian banks incurring relevant costs, which could have an adverse effect on our financial position. We are currently working with the courts to encourage adherence.
Tax assessments may adversely affect us.
As part of the normal course of business, we are subject to inspections by federal, municipal and state tax authorities. These inspections, arising from the divergence in the understanding of the application of tax laws may generate tax assessments which, depending on their results, may have an adverse effect on our financial results. Also due to such proceedings and for other reasons we may be thwarted by a court decision to pay dividends and other distributions to our shareholders.
Please see “Item 8A. Consolidated Statements and Other Financial Information—Legal Proceedings” for further details.
Management Risk Factor
Our policies, procedures and models related to risk control may be ineffective and our results may be adversely affected by unexpected losses.
Our risk management methods, procedures and policies, including our statistical models and tools for risk measurement, such as value at risk, or VaR, for market risk default probability estimation models for credit risk or customer unusual behavior models for fraud detection or money-laundering risk identification, may not be fully effective in mitigating our risk exposure in all economic environments or against all types of risks, including those that we fail to identify or anticipate. Some of our qualitative tools and metrics for managing risk are based on our observations of the historical market behavior. In addition, due to limitations on information available in Brazil, to assess clients’ creditworthiness, we rely largely
21
on credit information available from our own databases, on certain publicly available consumer credit information and other sources. We apply statistical and other tools to these observations and data to quantify our risk exposure. These tools and metrics may fail to predict all types of future risk exposures. These risk exposures, for example, could arise from factors we did not anticipate or correctly evaluate in our statistical models. This would limit our ability to manage our risks. Our losses, therefore, could be significantly greater than indicated by historical measures. In addition, our quantified modeling may not take all risks into account. Our qualitative approach to managing those risks could prove insufficient, exposing us to material unexpected losses.
Our results of operations and financial position depend on our ability to evaluate losses associated with risks to which we are exposed and on our ability to build these risks into our pricing policies. We recognize an allowance for loan losses aiming at ensuring an allowance level compatible with the expected loss, according to internal models credit risk measurement. The calculation also involves significant judgment on the part of our management. Those judgments may prove to be incorrect or change in the future depending on information as it becomes available. These factors may adversely affect us.
Financial Reporting Risks
We make estimates and assumptions in connection with the preparation of our financial statements, and any changes to those estimates and assumptions could have a material adverse effect on our operating results.
In connection with the preparation of our financial statements, we use certain estimates and assumptions based on historical experience and other factors. While we believe that these estimates and assumptions are reasonable under the circumstances, they are subject to significant uncertainties, some of which are beyond our control. Should any of these estimates and assumptions change or prove to have been incorrect, our reported operating results could be materially adversely affected.
As a result of the inherent limitations in our disclosure and accounting controls, misstatements due to error or fraud may occur and not be detected.
Our disclosure controls and procedures are designed to provide reasonable assurance that information required to be disclosed by us in reports we file with or furnish to the SEC under the Exchange Act is accumulated and communicated to management, recorded, processed summarized and reported within the time periods specified in SEC rules and forms. We believe that any disclosure controls and procedures or internal controls and procedures, including related accounting controls, can provide only reasonable, not absolute, assurance that the objectives of the control system are met. These inherent limitations include the realities that judgments in decision-making can be faulty and that breakdowns can occur because of simple error or mistake. In addition, controls can be circumvented by the individual acts of some persons, by collusion of two or more people or by an unauthorized override of the controls.
Any failure by us to maintain effective internal control over financial reporting may adversely affect investor confidence in our company and, as a result, the value of investments in our securities.
We are required under the Sarbanes-Oxley Act of 2002 to furnish a report by our management on the effectiveness of our internal control over financial reporting and to include a report by our independent auditors attesting to such effectiveness. Any failure by us to maintain effective internal control over financial reporting could adversely affect our ability to report accurately our financial condition or results of operations. If we are unable to conclude that our internal control over financial reporting is effective, or if our independent auditors determine that we have a material weakness or significant deficiency in our internal control over financial reporting, we could lose investor confidence in the accuracy and completeness of our financial reports, the market prices of our shares and ADSs could decline, and we could be subject to sanctions or investigations by the SEC or other regulatory authorities. Failure to remedy any material weakness in our internal control over financial reporting, or to implement or maintain other effective control systems required of public companies subject to SEC regulation, also could restrict our future access to the capital markets.
We adopt Brazilian accounting standards and managerial disclosures that differ from foreign standards, including from the U.S., with which U.S. stockholders are familiar.
22
For regulatory purposes, we prepare and make available consolidated financial statements under IFRS issued by IASB and under the Brazilian GAAP, which may differ from US GAAP in a number of ways. We use Brazilian GAAP for filing with the Brazilian Securities and Exchange Commission (“CVM”) and for calculation of payment of dividends and tax liabilities. Furthermore, we disclose quarterly reports on managerial financial information not required in other countries. U.S. investors may be unfamiliar with these different accounting standards and managerial disclosures adopted by us.
Underwriting Risk
Inadequate pricing methodologies for insurance, pension plan and premium bond products may adversely affect us.
Our insurance and pension plan subsidiaries establish prices and calculations for our insurance and pension products based on actuarial or statistical estimates. The pricing of our insurance and pension plan products is based on models that include a number of assumptions and projections that may prove to be incorrect, since these assumptions and projections involve the exercise of judgment with respect to the levels and timing of receipt or payment of premiums, contributions, provisions, benefits, claims, expenses, interest, investment results, retirement, mortality, morbidity, and persistence. We could suffer losses due to events that are contrary to our expectations directly or indirectly based on incorrect biometric and economic assumptions or faulty actuarial bases used for contribution and provision calculations.
Although the pricing of our insurance and pension plan products and the adequacy of the associated reserves are reassessed on a yearly basis, we cannot accurately determine whether our assets supporting our policy liabilities, together with future premiums and contributions, will be sufficient for the payment of benefits, claims, and expenses. Accordingly, the occurrence of significant deviations from our pricing assumptions could have an adverse effect on the profitability of our insurance and pension products. In addition, if we conclude that our reserves and future premiums are insufficient to cover future policy benefits and claims, we will be required to increase our reserves and record these effects in our financial statements, which may have a material adverse effect on us.
Competition Risk
We face risks associated with the increasingly competitive environment, and recent consolidations in the Brazilian banking industry, as well as competition based on technological alternatives to traditional banking services.
The Brazilian market for financial and banking services is highly competitive. We face significant competition from other Brazilian and international banks, in addition to other non-financial companies competing in certain segments of the banking industry in which we operate. These latter competitors may not be subject to the same regulatory and capital requirements that we are and, therefore, may be able to operate with less stringent regulatory requirements.
Competition has increased as a result of recent consolidations among financial institutions in Brazil and of regulations that (i) increase the ability of clients to switch business between financial institutions, (ii) with the client’s permission, grant access to financial and personal information in such institutions, and (iii) establish rules for an instant payment arrangement. Furthermore, digital technologies are changing the ways customers access banking services and the competitive environment with respect to such services. The use of digital channels has risen steadily over the past few years. In this context, new competitors are seeking to disrupt existing business models through technological alternatives to traditional banking services. If we are not successfully able to compete with these disruptive business models and markets, we may lose market share and, consequently, lower our margins and profitability. Such increased competition may also adversely affect us by, among other things, limiting our ability to retain or increase our current client base and to expand our operations, or by impacting the fees and rates we adopt, which could reduce our profit margins on banking and other services and products we offer.
Please see “Item 4B. Business Overview—Supervision and Regulation—Antitrust Regulation” for further details about the competition on the Brazilian markets.
We are subject to Brazilian antitrust legislation and that of other countries in which we operate or will possibly operate.
We are in a dominant position in certain Brazilian banking markets and, therefore, may be subject to the Brazilian antitrust laws including No. 12,529/11, which address, among other matters, violation of the economic order. Accordingly,
23
we may be subject to penalties from Brazilian antitrust authorities, especially administrative fines and divestiture of assets. Additionally, we are subject to the antitrust legislation in the jurisdictions where we operate, such as the antitrust laws of the U.S. (Sherman Act and Clayton Antitrust Act) and of the European Union (Articles 101 and 102 of the Treaty on the Functioning of the European Union). Consequently, we cannot assure that Brazilian and foreign antitrust regulations will not adversely affect our business in the future.
Reputational Risk
Damage to our reputation could harm our business and outlook.
We are highly dependent on our image and credibility to generate business. A number of factors may tarnish our reputation and generate a negative perception of the institution by our clients, counterparties, stockholders, investors, supervisors, commercial partners and other stakeholders, such as noncompliance with legal obligations, making irregular sales to clients, dealing with suppliers with questionable ethics, unauthorized disclosure of client data, inappropriate behavior by our employees, and third-party failures in risk management, among others. In addition, certain significant actions taken by third parties, such as competitors or other market participants, may indirectly damage our reputation with clients, investors and the market in general. If we are unable, or are perceived unable, to properly address these issues we may be subject to penalties, fines, class actions, and regulatory investigations, among others. Damages to our reputation among clients, investors and other stakeholders may have a material adverse effect on our business, financial performance and prospects.
Environmental and Social Risks
We may incur financial losses and damages to our reputation from environmental and social risks.
Environmental and social risk is considered a material issue for our business, since it can affect the creation of shared value in the short, medium and long terms, from the standpoint of our organization and our main stakeholders. Further, we understand environmental and social risk as the possibility of losses resulting from events of environmental and social origin related to our activities. For more information about our environmental and social risk management please see “Item 11. Quantitative and Qualitative Disclosures about Market Risk—Environmental and Social Risk.”
CMN Resolution No. 4,327/2014 establishes requirements that must be observed in the establishment and implementation of the environmental and social responsibility policies applicable to financial institutions. Accordingly, we are required to assess environmental and social risks and evaluate data from environmental and social related financial losses. The Central Bank is responsible for supervising the implementation of such regulation.
Environmental and social issues may affect our daily activities and the revenue of our clients, causing defaults, especially in case of serious environmental and social incidents, including climate risk as climate change poses relevant risks for the whole financial system.
Climate risks encompass both physical risks, arising from changes in climate patterns such as rainfalls and rises in temperature and extreme weather events; and transition risks arising from economic shifts occurred as a consequence of climate action such as carbon pricing, climate regulation, market risks and reputation risks. Given its relevance, climate risk has become one of our main priorities: we support the Task Force on Climate-related Financial Disclosures (TCFD) since 2017 and we are committed to implement its recommendations by 2022. With this objective we are strengthening our climate risk governance and strategy and developing tools and methodologies to assess and manage climate risks.
These risks are more pronounced when we provide financial support for clients and projects, as we could be held indirectly liable for supporting such activity in case of environmental or social damage, which could also subject us to further reputational risks.
Climate change may have adverse effects on our business
The risks associated with climate change are gaining increasing social, regulatory, economic and political relevance, both nationally and internationally. New regulations related to climate change may affect our operations and business strategy, leading us to incorporate financial costs resulting from: (i) the physical risk of climate change and (ii) the risk of transition to a low carbon economy.
24
The physical risks of climate change are related to the gradual increase in the average temperature of the planet and to the increase in the intensity and frequency of extreme weather events. Despite the uncertainty component related to the intensity and location of these events, their impact on the economy is expected to be more acute in the future. The potential impact on the economy includes, but is not limited to, significant changes in asset prices and industry profitability. Damage to borrowers’ properties and operations may impair asset values and credit quality of customers, leading to higher nonperformance loans, write-offs and impairment charges in our portfolios. In addition, our facilities and resilience may also suffer physical damage due to weather events that result in increased costs for us.
As the economy transitions to a low-carbon economy, financial institutions may face significant and rapid developments in stakeholder expectations, policy, law and regulation which could impact the lending activities we undertake, as well as the risks associated with our lending portfolios, and the value of our financial assets. As concerns about climate change increase and societal preferences change, we may face greater scrutiny of the type of business we conduct, adverse media coverage and reputational damage, which may in turn impact customer demand for our products, returns on certain business activities and the value of certain assets and trading positions resulting in impairment charges. The impacts of climate change may also increase losses for those sensitive sectors, caused by the effects of both physical and transition risks, causing loss of profitability for companies exposed to these risks and impairing their ability to repay any loans. Possible carbon pricing can affect companies’ costs and compromise their ability to generate cash flows. Any subsequent increase in defaults and rising unemployment could create recessionary pressures, which may lead to an increased deterioration in the creditworthiness of our clients, higher expected credit loss, and increased charge-offs and defaults among wholesale and retail customers. If we do not adequately embed risks associated with climate change into our risk framework to appropriately measure, manage and disclose the various financial and operational risks we face as a result of climate change, or fail to adapt our strategy and business model to the changing regulatory requirements and market expectations on a timely basis, it may have a material and adverse impact on our business growth rate, competitiveness, profitability, capital requirements, cost of funding, and financial condition.
For further details on our approach to climate change, “Item 11. Quantitative and Qualitative Disclosures about Market Risk—Environmental and Social Risk.”
Risk Factors for ADS Holders
The relative price volatility and limited liquidity of the Brazilian capital markets may significantly limit the ability of our investors to sell the preferred shares underlying our ADSs, at the price and time they desire
The investment in securities traded in emerging markets frequently involves a risk higher than an investment in securities of issuers from the U.S. or other developed countries, and these investments are generally considered more speculative. The Brazilian securities market is smaller, less liquid, more concentrated and can be more volatile than markets in the U.S. and other countries. Thus, an investor’s ability to sell preferred shares underlying ADSs at the price and time the investor desires may be substantially limited.
The preferred shares underlying our ADSs do not have voting rights, except in specific circumstances.
Pursuant to our Bylaws, the holders of preferred shares and therefore of our ADSs are not entitled to vote in our general stockholders’ meetings, except in specific circumstances. Even in such circumstances, ADS holders may be subject to practical restrictions on their ability to exercise their voting rights due to additional operational steps involved in communicating with these stockholders, as mentioned below.
According to the provisions of the ADSs deposit agreement, in the event of a general stockholders’ meeting, we will provide notice to the depositary bank, which will, to the extent practicable, send such notice to ADS holders and instructions on how such holders can participate in such general stockholders’ meeting, and ADS holders should instruct the depositary bank on how to vote in order to exercise their voting rights. This additional step of instructing the ADS depositary bank may make the process for exercising voting rights longer for ADS holders.
25
Holders of ADSs may be unable to exercise preemptive rights with respect to our preferred shares
We may not be able to offer the U.S. holders of our ADSs preemptive rights granted to holders of our preferred shares in the event of an increase of our share capital by issuing preferred shares unless a registration statement relating to such preemptive rights and our preferred shares is effective or an exemption from such registration requirements of the Securities Act is available. As we are not obligated to file a registration statement relating to preemptive rights with respect to our preferred shares, we cannot assure that preemptive rights will be offered to you. In the event such registration statement is not filed (or in case filed, not declared effective) or if the exemption from registration is not available, the U.S. holders of our ADSs may not receive any value from the granting of such preemptive rights and have their interests in us diluted.
The surrender of ADSs may cause the loss of the ability to remit foreign currency abroad and of certain Brazilian tax advantages
While ADS holders benefit from the electronic certificate of foreign capital registration obtained in Brazil by the custodian for our preferred shares underlying the ADSs, which permits the depositary bank to convert dividends and other distributions with respect to the preferred shares underlying the ADSs into foreign currency and remit the proceeds abroad, the availability and requirements of such electronic certificate may be adversely affected by future legislative changes.
If an ADS holder surrenders the ADSs and, consequently, receives preferred shares underlying the ADSs, such holder will have to register its investment in the preferred shares with the Central Bank either as (i) a Foreign Direct Investment, subject to Law No. 4,131/62, which will require an electronic certificate of foreign capital registration, the Electronic Declaratory Registration of Foreign Direct Investment (RDE-IED), or (ii) as a Foreign Investment in Portfolio, subject to Resolution CMN No. 4,373/14, which among other requirements, requires the appointment of a financial institution in Brazil as the custodian of the preferred shares (except in case the foreign investor is a natural person) and legal representative of the foreign investor in the Electronic Declaratory Registration of Portfolio (RDE – Portfolio). The failure to register the investment in the preferred shares as foreign investment under one of the regimes mentioned above (e.g. RDE – IED or RDE – Portfolio) will impact the ability of the holder non-resident in Brazil to dispose of the preferred shares and to receive dividends. Moreover, upon receipt of the preferred shares underlying the ADSs, Brazilian regulations require the investor to enter into corresponding exchange rate transactions and pay taxes on these exchange rate transactions, as applicable.
The tax treatment for the remittance of distributions on, and the proceeds from any sale of, our preferred shares may be less favorable in case a holder of preferred shares obtains the RDE-IED instead of the RDE-Portfolio. In addition, if a holder of preferred shares attempts to obtain an electronic certificate of foreign capital registration, such holder may incur expenses or suffer delays in the application process, which could impact the investor’s ability to receive dividends or distributions relating to our preferred shares or the return of capital on a timely manner.
The holders of ADSs have rights that differ from those of stockholders of companies organized under the laws of the U.S. or other countries
Our corporate affairs are governed by our Bylaws and Brazilian Corporate Law, which may have legal principles that differ from those that would apply if we were incorporated in the U.S. or in another country. Under Brazilian Corporate Law, the holders of ADSs and the holders of our preferred shares may have different rights with respect to the protection of investor interests, including remedies available to investors in relation to any actions taken by our Board of Directors or the holders of our common shares, which may be different from what is provided in U.S. law or the law of another country.
26
| ITEM 4. | INFORMATION ON THE COMPANY |
| 4A. | History and Development of the Company |
Our legal and commercial name is Itaú Unibanco Holding S.A. We were incorporated on September 27, 1924. We are organized as a publicly held corporation for an unlimited period of time under the laws of Brazil. Our head offices are located at Praça Alfredo Egydio de Souza Aranha, 100, 04344-902, São Paulo, SP, Brazil and our telephone number is +55-11-5019-1267.
Investor information can be found on our Investor Relations website at www.itau-unibanco.com/ir. Information contained on our website is not incorporated by reference in, and shall not be considered a part of, this annual report. Our agent for service of process in the United States is the general manager of our New York branch, which is located at 767 Fifth Avenue, 50th floor, New York, NY 10153.
Our History
In our history, Unibanco was incorporated in 1924. The “Casa Moreira Salles”, as it was called, was founded by João Moreira Salles and used to sell everything: from dishes, clothes, shoes, to beverages. Thereafter, it began to operate as a banking institution, acting as a banking correspondent for the leading banks in Minas Gerais state.
Two decades later, in 1943, Itaú was founded by Alfredo Egydio de Souza Aranha, as Banco Central de Crédito S.A., with its first branch in the city of São Paulo.
João Moreira Salles and Alfredo Egydio de Souza Aranha played a key role in our history. As did the second generation of our founders, Walther Moreira Salles and Olavo Setubal.
During this period, we grew, changed our name a few times, conducted mergers and acquisitions, experienced economic growth in Brazil, hyperinflation, the middle-class boom and certain world crisis. We have witnessed the progress of Brazil and the stories of countless employees and clients who have helped us grow and encouraged us to develop.
In 2008, we undertook the largest merger in Brazil’s history. The partnership between Itaú and Unibanco meant the union of complementary mentalities, two ground-breaking banks in the use of technology and leaders in the Brazilian financial sector, with shared histories. This merger resulted in the largest private financial conglomerate in the southern hemisphere and one of the 20 largest banks in the world as measured by assets.
Over the course of more than 90 years, Itaú Unibanco has traced its firm path with ceaseless commitment to the fostering of social transformation. Our history is marked by incentive of culture, education, sports and urban mobility through programs of the Fundação Itaú para a Educação e Cultura, Instituto Unibanco, and Espaço Itaú de Cinema. The concern we have always shown for social causes became even more evident in the difficult context of the greatest health crisis in history brought about by the COVID-19 pandemic. Faced with this challenge, we went far beyond our immediate business responsibilities and created the program Todos pela Saúde (All for Health) based on the largest philanthropic donation ever made by a private-sector entity in Brazil.
The resources donated through the Fundação Itaú para Educação e Cultura are managed by a group of specialists from the health sector under the leadership of Paulo Chapchap, which operates through actions aimed at informing and guiding the population, purchasing safety equipment, establishing preventative actions, purchasing equipment for hospitals and for testing the population, providing support for the construction of Centros de Acolhimento (Shelters), and supporting research into the epidemiology and treatment of COVID-19.
We believe that a financial institution should help people and companies to achieve their dreams and invest in big ideas. A bank encourages people to grow and companies to move forward. This is how we guide our business. The responsibility we assume for the country’s development is at the core of our activity and is a hallmark of our entire history.
Recent Acquisitions
27
Zup
On October 31, 2019, we entered into a Share Purchase Agreement with ZUP LLC, Bruno Cesar Pierobon, Gustavo Henrique Cunha Debs, Felipe Liguabue Almeida, Flavio Henrique Zago, among others, for the acquisition of 100% of the voting share capital of Zup I.T. Serviços em Tecnologia e Inovação Ltda (“Zup”) for R$575 million, subject to any contractual adjustments to the purchase price.
This acquisition will be implemented in three tranches over four years. In the first tranche, which closed on March 31, 2020, we acquired 52.96% of the total voting share capital of Zup for approximately R$293 million and resulted in us controlling Zup. On the third anniversary of the closing date, we will acquire an additional 19.6% of Zup’s stake, and on the fourth anniversary, we will acquire the remaining shareholding, leading to us holding 100% of the voting share capital by 2024.
This acquisition is linked to our digital transformation process. ZUP is a benchmark company in digital transformation, which has boosted the development of our IT systems. The operation and management of business affairs of Zup will continue to be entirely independent and self-governing in relation to us, preserving its current principles and values.
XP Inc.
On May 11, 2017, we entered into a Share Purchase Agreement with XP Controle Participações S.A., G.A. Brasil IV Fundo de Investimento em Participações, and Dyna III Fundo de Investimento em Participações, among others, as sellers, to acquire 49.9% of the capital stock (corresponding to 30.1% of the common shares) of XP Investimentos S.A., a holding company that consolidates all the investments of the XP group, including XP Investimentos Corretora de Câmbio, Títulos e Valores Mobiliários S.A. In the first tranche, we contributed to a capital increase of R$600 million and acquired of XP Investimentos S.A.’s shares from the Sellers for R$5.7 billion, provided that such amounts are subject to contractual adjustments. The value attributed to 100% of the total capital stock of XP Investimentos S.A. (before the first tranche) was approximately R$12 billion.
The first tranche was approved (i) in March 2018, by CADE, and (ii) in August 2018, by the Central Bank. As a condition, for such approvals, we entered into concentration control agreements (i) with CADE, whereby we undertook, among other obligations (a) if requested, to distribute proprietary investment products through open platforms competing with XP Investimentos S.A. platforms in a non-discriminatory manner; and (b) to not promote the targeting of its customers to XP Investimentos S.A. platforms; and (ii) with the Central Bank, whereby we undertook: (a) not to acquire control of XP Investimentos S.A. for 8 years counted from the execution of the concentration control agreement; and (b) to cancel our call options and XP Controle’s put options.
In August 2018, we closed the First Tranche and, together with some of the Sellers, entered into a shareholders’ agreement which contains, among others, provisions with respect to our rights as a minority shareholder, including our right to appoint two out of the seven members of the Board of Directors of XP Investimentos S.A.
On November 29, 2019, the shareholders of XP Investimentos S.A., including us, exchanged their shares of XP Investimentos S.A., incorporated in Brazil, for Class A common shares and Class B common shares of XP Inc., incorporated in the Cayman Islands. Each Class A common share entitles its holder to one vote and each Class B common share entitles its holder to ten votes in all shareholders’ resolutions of XP Inc.. As a result of the contribution mentioned above, XP Inc. issued to us 792,861,320 Class A common shares and 223,595,962 Class B common shares, which represent 49.9% of the total capital of XP Inc. and 30.06% of its voting rights. XP Inc. became the sole shareholder of XP Investimentos S.A., owning 100% of its total and voting capital.
Further, the shareholders of XP Inc. entered into a shareholders’ agreement substantially similar to the then existing shareholders’ agreement of XP Investimentos S.A.. XP Inc. has a board of directors comprised of thirteen members, out of which XP Controle Participações S.A. nominated seven, we nominated two, General Atlantic (XP) Bermuda, LP (successor of G.A. Brasil IV Fundo de Investimento em Participações) nominated one, and the remaining three members are independent directors. The independent directors are also members of the audit committee of XP Inc., which is comprised of three members nominated as follows: we nominated two members, and XP Controle Participações S.A. nominated one member of the audit committee.
28
Subsequently, on November 30, 2019, XP Inc. carried out a reverse stock split of one share for each four shares and, as a result, the number of shares held by us was adjusted to 198,215,329 Class A common shares and 55,898,991 Class B common shares.
In December 2019, XP Inc. completed its initial public offering and listing on Nasdaq. We did not sell any shares of XP Inc. in this offering and, as a result, our ownership interest decreased from 49.9% to 46.05%.
On November 26, 2020, we announced that our Board of Directors approved the partial spin-off of our investment in XP Inc. to a new company (XPart S.A.).
In December 2020, XP Inc. held a follow-on on Nasdaq, whereby we sold approximately 4.51% of our equity interests in XP Inc.’s share capital. In that same offering, XP Inc. issued new shares, resulting in the dilution of our stake to 41% of its share capital.
At the Extraordinary General Stockholders’ Meeting held on January 31, 2021, our shareholders voted in favor of a corporate reorganization in order to transfer the business line related to our interest in XP Inc.’s capital to a new company that will be named XPart S.A. XPart S.A. will be constituted by a portion of the investment currently held by us in XP Inc. and cash in the amount of R$10 million. The completion of this transaction is subject to regulatory approval to be obtained by our controlling shareholders.
The percentage of XP Inc.’s capital to be held by XPart S.A. will be 40.52%, totaling R$9,371 million on the base date of December 31, 2020. Our stockholders will then hold an ownership interest in XPart S.A., following the completion of the transaction. After registration as a publicly held company and authorization to list securities issued by XPart S.A., the ownership interest in XPart S.A. will be distributed to our shareholders. The shares issued by XPart S.A. will be attributed to our stockholders in the same number, type and proportion of the shares previously held by them in Itaú Unibanco Holding.
Subject to the Central Bank’s approval, we expect to acquire an additional stake corresponding to approximately 11.38% of the share capital of XP Inc, in 2022.
The management and conduct of business of all companies within XP group, including XP Inc., remains independent, segregated and autonomous, preserving the same principles and values that are currently in force. XP Controle’s partners will maintain control of the XP group, and the current directors, officers and executives of XP Investimentos S.A. and other subsidiaries will remain at the forefront of their respective businesses, in order to ensure that XP Investimentos S.A. will continue to act as an open and independent platform, offering a diversified range of proprietary and third party products to its clients, competing freely with other brokers and capital market distributors, including those controlled by us, without any restrictions or barriers.
The purpose of the spin-off is to segregate this business line from the Itaú Unibanco Group into a new company (XPart SA), which is represented by a portion of Itaú Unibanco Group’s investment in XP Inc., so that our stockholders will receive an equity interest in the same number and proportion of the shares they hold in Itaú Unibanco. Additionally, the transaction allows Itaú Unibanco and XPart S.A to operate independently, with well-defined business goals. Accordingly, the main benefit of the transaction is value creation for our stockholders.
Operations Overview
We report the following segments: (i) Retail Banking, (ii) Wholesale Banking, and (iii) Activities with the Market and Corporation. Through these operational segments, we provide a broad range of banking services to a diverse client base that includes individuals and corporate clients, on an integrated basis as follows:
29
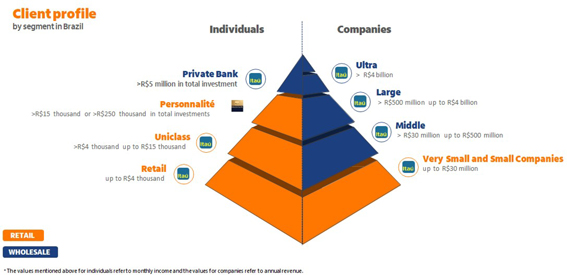
The Retail Banking segment offers services to a diversified base of account holders and non-account holders, individuals and companies in Brazil. The segment includes retail customers, mass affluent clients (Itaú Uniclass and Personnalité) and very small and small companies. Our offering of products and services in this segment includes: personal loans, credit cards, payroll loans, vehicle financing, mortgage loans, insurance, pension plan and premium bond products, and acquiring services, among others. The Retail Banking segment represents an important funding source for our operations and generates significant financial income and banking fees.
The Wholesale Banking segment is responsible for our private banking clients, the activities of our Latin America units, our middle-market banking business, asset management, capital market solutions, corporate and investment banking activities. Our wholesale banking management model is based on building close relationships with our clients by obtaining an in-depth understanding of our clients’ needs and offering customized solutions. Corporate activities include providing banking services to large corporations and investment banking activities include offering funding resources to the corporate sector, including fixed and variable income instruments.
The Activities with the Market and Corporation segment manages interest income associated with our capital surplus, subordinated debt surplus and the net balance of tax credits and debits. This segment also manages net interest income from the trading of financial instruments through proprietary positions, currency interest rate gaps and other risk factors, arbitrage opportunities in the foreign and Brazilian domestic markets, and mark-to-market of financial instruments. It also includes our interest in Porto Seguro S.A. For more information on our interest in Porto Seguro S.A., see “ —Insurance.”
We carry out a wide range of operations outside of Brazil with units strategically located in the Americas, Europe and Asia. Our international presence creates significant synergies in foreign trade finance, in the placement of Eurobonds and in the offering of more sophisticated financial transactions to our clients.
Please see “Note 30 – Segment Information” to our audited consolidated financial statements for further details.
The diversification of our business is reflected in the changing composition of our loan portfolio over the last few years, focusing on origination in lower risk segments with enhanced guarantees. We continuously seek to implement and focus on offering new products and services that add value to our clients and diversify our income sources. This allows for the growth of our non-financial income arising mainly from banking service fees, income from bank charges and from insurance, pension plan and capitalization operations.
Retail Banking
We have a large and diverse portfolio of products, such as credit and investments, and services to address our clients’ needs. Our retail banking business is segmented according to customer profiles, which allows us to connect with and
30
understand our customers’ needs, better enabling us to offer suitable products to meet their demands. Our main activities under the retail banking segment are the following:
Itaú Retail Banking (individuals)
Our core business is retail banking and through our retail operation we offer a dedicated service structure to consumer clients throughout Brazil. Our customer service structure is targeted to offering the best solutions for each client profile. We classify our retail clients as individuals with a monthly income of up to R$4,000.
Our Itaú Uniclass services are available at every branch for clients who earn more than R$4,000 and less than R$15,000 per month. We offer exclusive services to our Itaú Uniclass clients, including investment advisory services, exclusive cashiers and higher credit limits and a large team of dedicated relationship managers. For clients who prefer remote services, our Itaú Uniclass provides a “digital bank platform” where relationship managers service clients through telephone, e-mail, SMS, videoconference and chat from 9 a.m. to 6 p.m. on business days, at no additional cost.
Our focus on digital transformation led to an increase of the share of our digital operations, which are sales, account openings and accesses through the internet and mobile app. For instance, the online account opening process via mobile app, launched in 2016, already represents 49% of the individual accounts opened on a monthly basis (excluding salary accounts), as of December 31, 2020.
We also continue to focus on initiatives to improve customer satisfaction. The satisfaction ratings (Net Promoter Score, or NPS) of our retail bank improved by 11 percentage points between August 2018 and December 2020.
Itaú Personnalité (banking for high-income individuals)
We began providing customized services to high-income individuals in 1996 with the creation of the Itaú Personnalité segment, which currently serves individuals who earn more than R$15,000 per month or have investments in excess of R$250,000.
Itaú Personnalité is focused on providing (i) financial advisory services by managers who understand the specific needs of our higher-income clients, (ii) a large portfolio of exclusive products and services and (iii) special benefits based on the type and length of relationship with the client, including discounts on various products and services. Itaú Personnalité services its clients through a dedicated network of 232 branches, located in the main Brazilian cities. Itaú Personnalité clients also have access to our retail banking network of branches and ATMs throughout the country and can also access our internet, telephone and mobile banking.
For clients who prefer remote services, Itaú Personnalité provides a “digital bank platform” where relationship managers service clients through telephone, email, SMS and videoconference. We also developed apps for smartphones and tablets that enable our clients to make investments, buy products such as credit and insurance, make check deposits, transfers and payments, check account balances and find nearby branches and ATMs using GPS features.
The table below shows our market position and information about competitors for our retail banking (including Itaú Personnalité) business:
| | | | |
| Product/Service | | Market Position | | Additional Information and Main Competitors |
Retail Banking (Including Itaú Personnalité) | | In December 2020, we reached a market share of 11.4% based on total outstanding loan balance in reais, positioning us as the fourth largest bank in this segment in Brazil. | | Itaú Unibanco Holding has a leading position in many sectors of the Brazilian domestic financial market. Based on Central Bank data and publicly available financial information, our main competitors are Banco Bradesco, Banco Santander (Brazil), Banco do Brasil and Caixa Econômica Federal. |
Source: Itaú Unibanco Holding and the Central Bank.
31
Itaú Empresas (very small and small companies)
To meet and fulfill the needs of our corporate customers, we specialize in offering customized solutions and detailed advice on all products and services for:
| | • | | Microenterprises: customer base consisting of companies with annual revenues of up to R$ 1.2 million, served by 2,587 bank branches and 2,144 relationship managers as of December 31, 2020; and |
| | • | | Small businesses: customer base consisting of companies with annual revenues between R$1.2 million and R$30 million, served by 342 bank branches and 1,600 relationship managers as of December 31, 2020. |
ANBIMA certifies all of our relationship managers, who are trained and skilled to offer the appropriate banking solutions for each client, guided by all the variables that can affect the companies that we serve and their owners.
Our customers rely on our main strategy of capturing market opportunities and meeting their needs, particularly regarding cash flow management, credit facilities, investments and banking services.
Since the beginning of the COVID-19 pandemic and the resulting economic crisis, we have sought to support our customers with complete and sustainable solutions. In mid-April 2020, we launched a more comprehensive program called Travessia. The range of customized solutions offered includes grace periods, extended loan terms and new interest rate conditions. We also provided new government sponsored credit facilities to support our clients.
The COVID-19 pandemic has accelerated the process of customer digitalization. To help our customers with this process, we developed new products, services and digital processes, as well as improving the tools used by our sales and relationship teams, aiming at greater efficiency in business generation and service.
We strive to maintain high levels of customer satisfaction by placing them at the heart of our business approach. To achieve this goal, using the NPS system we constantly monitor the NPS indicator and intensify customer journey mapping as a means to identify opportunities to excel at meeting the needs of our customers. Our NPS indicator for this segment increased 13 percentual points between August 2018 and December 2020.
Credit Cards and Commercial Agreements
We are the leader in the Brazilian credit card segment with a market share in terms of purchase volume of 32.4% in the fourth quarter of 2020, according to ABECS. Through our proprietary segments and partnerships with major retailers, telephone companies, automakers and airlines established in Brazil, we offer a wide range of credit and debit cards to account holders and non-account holders.
Our purpose is to provide the best customer experience and satisfaction. In order to achieve this, as one of our priorities, we established the “Customer First”. Our aim is to continuously grow our credit card portfolio increasing digitalization, profitability and the quality of our assets. Accordingly, our credit card division is dedicated to developing the best payment solutions for our clients,new products and new digital services while managing the credit quality of our portfolio.
Our global NPS, a measure of customer satisfaction, indicates that our score improved two basis points compared to 2018. In order to continue evolving our credit card portfolio, our strategic focus is based on three main business segmentations: Account Holders, Non-Account Holders and Retail Partnerships.
In 2020, the Account Holders businesses – Itaú Agências, Itaú Uniclass e Personnalité – launched fast growing sales products: Itaú Uniclass Visa Infinity, Itau Agências Click and the Itaú Personnalité Visa Signature card, in which we were pioneers in the Brazilian market. In a context of high demand for purchases through delivery services, Itaú Personnalité Visa Signature card offers 70% discount on the Rappi Prime subscription, possibility of payment via NFC technology (contactless) and travel benefits that include luggage loss, theft insurance and trip cancellation. Another highlight of 2020 was the launch of “pontos que rendem” on Itau’s Loyalty program for Personnalité cardholders, which are investors. The program yields loyalty points along the year just like our clients investments.
In the Non-Account Holders segment our focus was on improving and expanding our co-branded program and the Credicard division transformation. In 2020, the airline cobranded cards, increased total accounts by 7.4% and purchase
32
volume by 3.8%. The Azul Itaucard was rebranded, and we launched the Azul infinite card, with a series of benefits such as: better score in the rewards program, free annual fee when the customer reaches a monthly spending goal, discount on airline tickets, access to VIP lounges and cabin upgrade. In the Credicard division, we made many changes to our way of doing business, such as the institution of a new purpose in 2019 “To awaken in people the power of believing.” In 2020, even amid the COVID-19 pandemic, we experienced significant improvement in our business. Based on our three pillars (“Smart,” connection and partnership), Credicard improved its retention rates and sales levels for the three-month period ended December 31, 2020 compared to the same period in 2019. In addition, in 2020 Credicard outperformed its 2019 Black Friday numbers, created a new robust cashback model and delivered some great systemic improvements alongside the launch of a new product “Credicard On” in co-creation with our clients.
Our Retail Partnerships business is one of our fastest growing businesses in the credit card division. We have partnerships with the main national retail brands, such as Magazine Luiza, Ponto Frio, Pão de Açúcar, Extra
Walmart operation in Brazil was re-branded to BIG (supermarket chain) and the credit card product was relaunched with a new platform of benefits and discounts. In the Sam’s Club partnership credit card, which is part of BIG group, all “international” credit cards were up-graded to the “gold” category, more compatible with our clients’ profile. For our partnership with Magazine Luiza, we continued to reinforce our strategy of growing purchase volume and new accounts, launching a new sales channel offering credit cards through Magazine Luiza’s app. In “Passaí,” we launched a new POS machine focusing on the small entrepreneur. It became available in all Assaí stores.
The table below shows our market position and information about competitors for our credit card business:
| | | | |
| Product/Service | | Market Position | | Additional Information and Main Competitors |
| Credit Cards | | We are the leaders in terms of transaction purchase volume of cards in Brazil, with 32.2% market share in the period from January to December 2020. | | Our traditional competitors in this business are Banco Bradesco, Banco Santander (Brazil), Banco do Brasil and Caixa Econômica Federal. However, in recent years an increasing number of small and new digital competitors has entered this market, among which we highlight Nubank, Banco Inter and Banco Original. |
Source: Itaú Unibanco Holding and ABECS.
Payroll Deducted Loans
In Brazil, a payroll deducted loan is a specific type of loan entered into by salaried employees or pensioners of the Brazilian social security system, as borrowers, and banks, as lenders, in which fixed monthly installments are deducted directly from the borrower’s payroll or pension, as the case may be, for the payment of the amount owed to the lender.
Our strategy is directed mainly to the pensioners of the Brazilian social security system and employees of public and private companies.
We offer payroll deducted loans in Brazil mainly through two sales channels: (i) our branch network and our remote service channels, focusing on retail account holders, and (ii) the network of acquisition partners, focusing on non-account holders. This strategy allows us to expand our business activities with historically lower credit risk, achieving a competitive position in the offer, distribution and sale of payroll deducted loans in Brazil and improving the risk profile of our loans portfolio to individuals.
The table below shows our market position and information about competitors for the business listed below:
33
| | | | |
| Product/Service | | Market Position | | Additional Information and Main Competitors |
| Payroll Deducted Loans | | In December 2020, we obtained a market share of 12.6% in terms of payroll deducted loans, positioning us as the fourth largest bank in this segment in Brazil. | | Our main competitors in this business are Banco do Brasil, Caixa Econômica Federal, Banco Bradesco and Banco Santander (Brazil). |
Source: Itaú Unibanco Holding and the Central Bank.
Mortgage
We assist our clients with their financial development, as we help them with their personal assets. Mortgage financing products allow us to create long-lasting relationships with our clients, as mortgage financing products are of a long-term nature.
Since 2008, we have been the market leaders among Brazilian private banks in mortgage loans to individuals in terms of the total size of our portfolio. This is a result of our business focus, which is in line with our strategy to migrate to lower-risk portfolios.
We have several sales channels that are utilized for purposes of mortgage financing products: (i) branch network, (ii) construction and development companies, (iii) mortgage agencies, and (iv) partnerships with REMAX, a realtor company, and CrediPronto, a mortgage financing company.
We prioritize customer satisfaction by providing our clients with a specialized mortgage financing advisor to support them during the mortgage process. Our process is expeditious and efficient, and it takes us less than two hours to get back to the client for loans up to R$1 million. This financing process can be fully digital.
In line with our strategic focus on digital processes, our simulator is included on the websites of partner development companies and real estate agencies, placing our brand closer to clients when they are looking to acquire real property. Our services are customized for every moment of the client’s digital journey, from internet banking services to social networks, providing us with increasing client exposure levels. In 2019 and 2018 we were awarded the “Best Digital Mortgage Bank Brazil” by Global Finance.
The number of mortgages we provided directly to individuals in 2020 was 58 thousand, for an aggregate value of R$18.9 billion during the year. In 2020, our portfolio had an average Loan to Value (LTV) of 40.0%, compared to 38.7% in 2019. In commercial loans, we financed 92 new real estate units during 2020, with an aggregate value of R$3.2 billion.
Another positive feature of the Brazilian market is the constant amortization system pursuant to which decreasing installments provide faster amortization of a contract, reducing our loan-to-value indicator at a faster rate than other amortization systems.
The table below shows our market position and information about competitors for the business listed below:
| | | | |
| Product/Service | | Market Position | | Additional Information and Main Competitors |
| Real Estate Financing and Mortgages | | In the period from January to December 2020 we were the second in new loans to individuals among Brazilian banks, with 21.4% market share. | | Our main competitors in this business are Caixa Econômica Federal, Banco Bradesco, Banco Santander (Brazil), and Banco do Brasil. |
Source: Itaú Unibanco Holding and ABECIP.
34
Merchant Acquirer
Rede is one of the leading companies in the electronic payment solutions industry in Brazil. It is a multi-brand merchant acquirer of credit, debit and benefit cards. Rede’s activities include merchant acquiring, capturing, transmission, processing and settlement of credit and debit card transactions, prepayment of receivables to merchants (resulting from credit card transactions), rental of point of sale (POS) terminals, e-commerce solutions, e-wallet and check verification through POS terminals.
In 2020, we continued to restructure our business model, focusing on the following priorities: 1) integration of our banking operations; 2) strengthening of direct sales channels; and 3) digital transformation.
We generated R$506.6 billion in transactions with respect to credit and debit cards during the year ended December 31, 2020 an increase of 4.5% compared to the same period in 2019. The following table sets forth the financial volume of credit and debit card transactions processed by us in 2020, 2019 and 2018:
| | | | | | | | | | | | |
| | | Financial Volume | |
| | (In billions of R$) | |
| | | 2020 | | | 2019 | | | 2018 | |
Credit cards | | | 308.8 | | | | 312.7 | | | | 280.8 | |
Debit cards | | | 197.8 | | | | 172.3 | | | | 156.3 | |
| | | | | | | | | | | | |
Total | | | 506.6 | | | | 485.0 | | | | 437.1 | |
| | | | | | | | | | | | |
The table below shows our market position and information about competitors for the business listed below:
| | | | |
| Product/Service | | Market Position | | Additional Information and Main Competitors |
| Merchant Acquirer | | In the period from January to December 2020 we reached a market share of 34.1% in terms of total transaction volume (credit and debit) generated by the acquiring services, positioning us as the second largest player in this segment in Brazil. | | Our traditional competitors in this business are Cielo and Santander GetNet. In recent years, changes in legislation made by the Central Bank combined with the growing number of fintechs, contributed to an increase in competition in the segment. Among non-traditional players, we highlight PagSeguro and Stone. |
Source: Itaú Unibanco Holding and ABECS.
Private Pension Plans
We offer private pension plans to our clients as an option for wealth, inheritance planning and income tax purposes (these products are tax-deferred). We provide our clients with a solution to ensure the maintenance of their quality of life through long-term investments, as a supplement to government general social security system plans.
Product innovation has been important for the sustainable growth of our private sector pension operations. For legal entities, we offer specialized advice and develop customized solutions for each company. We establish long-term partnerships with our corporate clients, maintaining a close relationship with their human resources departments and adopting a communication strategy focused on our employees’ financial education.
According to the National Federation of Private Pension and Life (Federação Nacional de Previdência Privada e Vida), or FENAPREVI, contributions to Itaú Private Pension Plans reached R$15.4 billion in the year ended December 31, 2020. The decrease compared to the contributions registered in December 2019 is mainly due to the COVID-19 pandemic.
The table below shows our market position and information about competitors for the business listed below:
35
| | | | |
| Product/Service | | Market Position | | Additional Information and Main Competitors |
| Private pension plans | | In December 2020 our balance of provisions represented 21.2% of the market share for private pension plans, positioning us as the third largest pension provider in Brazil. Considering only Individuals plans, our market share reached 20.8%, positioning us as the second largest private bank. | | Our main competitors in private pension plan products are controlled by large commercial banks, such as Banco Bradesco and Banco do Brasil, which, like us, take advantage of their branch network to gain access to the retail market. |
Source: FENAPREVI (Balance of provisions—Pension Plans for Individuals and Companies).
Vehicle Financing
We developed and launched a series of new products and services during 2020, some of which are:
Digital Retail – the evolution in our digital retail platform had an important impact in our journey. We launched automotive e-commerce with digital assistant, integrating means of payment and financial services, in a 100% digital experience for the customer. Further, to ensure safety in our transactions and to optimize the client experience, we deployed a facial biometrics solution and electronic signature.
Programa Travessia – we launched new solutions to support our clients during the COVID-19 pandemic. Accordingly, we offered grace periods of 60 and 120 days or loan reprofiling with an extension of the contract term, keeping the original contracted rate. These solutions benefited a significant amount of vehicle financing clients.
VEC – we announced to the market our new service of electric vehicle shared, Vec Itaú, which will be available to customers in the second half of 2021. This new solution will allow users to unlock the cars at stations directly through the application and return them at the same place or at another charging station. These measured enable us to enhance our presence and position in the sustainable urban mobility sector.
iCarros products – our solutions help dealers make their sales process more efficient. iCarros’ Lead Managers are now fully integrated with Linx Auto solution to help dealers on sales and billing process, ensuring a unique journey experience; “Garagem do Conhecimento” is an educational platform with distant education classes to prepare professionals of the automotive sector. iCarros is the first Brazilian automotive marketplace integrated with several banks, who offer personalized credit that match customer’s profiles; “Check-up” iCarros is a car management app for end consumers, focused on services to drivers and also supplying detailed data from clients cars to the service providers.“Entrega Fácil” is a new solution that allows sales to be delivered directly to the consumer’s home, whether it is for a test-drive or after the purchase has been made. The iCarros Club is a B2B trade-in platform, built to help our clients to increase sales in a safe and faster manner.
As of December 31, 2020, our individual and corporate vehicle financing portfolio (not considering FINAME) totaled R$35.7 billion, an 27% increase from the previous year. The average loan to value ratio of our individuals vehicle portfolio (the ratio of a loan to the value of an asset purchased) was 61.4% as of December 31, 2020, a 180 basis points increase compared to 2019. Since 2012, we have reduced our risk exposure in the sector and focused on clients with better risk profiles, which has allowed us to improve the credit quality of our vehicle loan portfolio.
The total amount of new contracts during the year ended December 31, 2020 reached R$22.5 billion, a 9% growth compared to 2019, for our individual and corporate vehicle financing operations. The average vehicle loan term was 44 months, with 33% of the transactions carried out with terms up to 36 months.
The table below shows our market position and information about competitors for the business listed below:
36
| | | | |
| Product/Service | | Market Position | | Additional Information and Main Competitors |
| Vehicles | | In December 2020, we reached a market share of 10.6% in terms of loans to individuals among banks, positioning us as third in Brazil in this segment. | | Our main bank competitors in this business are Banco Santander (Brazil), Banco do Brasil and Banco Bradesco. |
Source: Itaú Unibanco Holding and the Central Bank.
Insurance
Our insurance business provides a wide range of life and personal accident products, automobile and property insurance, credit insurance and travel insurance. Our insurance core activities, which include our 30% stake in Porto Seguro S.A, consist of mass-market insurance products related to life, property and credit. These products are offered in synergy with retail channels – our branch network, partnerships with retailers, credit card clients, real estate and vehicle financing, personal loans – and the wholesale channel. These products have characteristics such as a low combined ratio, low volatility in results and less use of capital, making them strategic and increasingly relevant in the diversification of the Itaú Unibanco Group’s revenues. Other insurance activities encompass extended warranty, health insurance, our 11.6% stake in IRB – Brasil Resseguros S.A. and other operations.
Our insurance products have been receiving updates on coverage and assistance, bringing more value to these customers. In order to expand our insurance products portfolio, we are concentrating on our own existing distribution channels as well as expanding our insurance brokerage activities and providing third-party insurance policies from partner insurers to our clients through an open platform.
There was a reduction in the sales volume in 2020 due to the COVID-19 pandemic, although there was no reduction in the amount of insurance from our customer portfolio. There was also a substantial impact on death, unemployment and hospitalization coverage due to the COVID-19 pandemic.
The table below shows our market position and information about competitors for the business listed below:
| | | | |
| Product/Service | | Market Position | | Additional Information and Main Competitors |
| Insurance | | Giving effect to our 30% ownership interest in Porto Seguro S.A., we reached 8.1% of market share based on earned premiums, excluding VGBL (Redeemable Life Insurance), from January to December 2020, positioning us as the fifth largest insurance provider in this segment in Brazil. Considering only our recurring insurance activities, our market share reached 10.4% in the same period. | | Our main competitors are controlled by or have partnerships with large commercial banks, such as Banco Bradesco, Banco Santander (Brazil) and Banco do Brasil which, like us, take advantage of their branch network to gain access to the retail market. Despite the high concentration of Brazilian banks in the market, the growing number of Insurtechs (startup companies focused on insurance) has facilitated customer access to insurance companies, making this market even more competitive. |
Source: SUSEP. Recurring insurance activities include: Personal Insurance (Life, Personal Accidents, Credit Insurance, Travel, Unemployment, Funeral Allowance, Serious Diseases, Random Events), Housing, Multiple Peril and Homeowners. Health Insurance and VGBL — Redeemable Life Insurance products are not included.
Premium Bonds (títulos de capitalização, or capitalization plans)
37
Premium bonds are fixed deposit products pursuant to which a client makes a one-time deposit or monthly deposits of a fixed sum that will be returned at the end of a designated term. Ownership of premium bonds automatically qualifies a customer to participate in periodic raffles, each time with the opportunity to win a significant cash prize.
We currently market our premium bonds products portfolio through our branch network, electronic channels and ATMs, and we are currently developing new technologies for channel diversification. The net collection, taking into account the deduction of redemptions, from capitalization plans decreased 39.5% in the year ended December 31, 2020 when compared to the same period of 2019.
The table below shows our market position and information about competitors for the business listed below:
| | | | |
| Product/Service | | Market Position | | Additional Information and Main Competitors |
| Premium Bonds | | In the period from January to December 2020 we had a market share of 11% in terms of revenues from sales of premium bonds, positioning us as the fourth largest provider of such products in this segment in Brazil. | | Our main competitors in premium bonds are controlled by or have partnerships with large commercial banks, such as Banco Bradesco, Banco do Brasil and Banco Santander (Brazil) which, like us, take advantage of their branch network to gain access to the retail market. |
Source: SUSEP.
Consortia
A consortium is a pool of people and/or legal persons in a group with the purpose of allowing their members, on an equal basis, to acquire assets, such as vehicles, properties, or services, through self-financing. The payments made by the group participants are applied to a common fund, used by one or more members of the consortium at a time, to acquire the assets elected by the members when the product was contracted. The participants receive the assets during the validity of the contract through the following methods: (i) random drawing; (ii) bid offer with own resources; (iii) part of the letter of credit; and (iv) FGTS tax (only for properties consortium), with the exception of the random drawing, the other options may be combined.
As consortia are regarded as a provision of services under Brazilian law, the management of consortia does not give rise to default risk or regulatory capital requirements for us.
Consortia do not charge interest rates and our revenues come mainly from the administration fee charged to clients.
Given these characteristics, this business is strategic to us, contributing to revenue diversification and to a more complete product portfolio offering to our clients. As of December 31, 2020, we achieved the following results:
| | • | | Monthly average of R$1,154 million of sales in the three-month period ended December 31, 2020; |
| | • | | R$3.5 billion of sales recorded in the three-month period ended December 31, 2020, an increase of 10% compared to the same period of 2019 and an increase of 33% compared to the three-month period ended September 30, 2020; |
| | • | | New products implemented: trucks and motorcycles; and |
| | • | | New feature: in our app, customers can find a new feature to help them buying a consortium. They only have to fill a form and they will receive a call offering the best options for them. |
The table below shows our market position and information about competitors for the business listed below:
38
| | | | |
| Product/Service | | Market Position | | Additional Information and Main Competitors |
| Consortia Services Fees | | In the period from January to December 2020 we had a market share of 6.2% in total consortia services fees. Considering only banks, we are the third largest provider of such services in terms of fees in Brazil. | | Considering only banks, our main competitors in the Brazilian consortia market are Bradesco Consortia and BB Consortia. |
Source: Central Bank.
Microcredit
Our microcredit unit offers to low-income, informal entrepreneurs’ access to credit to expand and develop their businesses. As a tool to stimulate entrepreneurship and part of the government’s National Program for Oriented and Productive Microcredit (PNMPO), Itau Microcrédito is focused on entrepreneurs with up to R$360,000.00 in annual revenue. Loans are granted by specifically trained microcredit loan officers who discuss the client’s financial situation and understand their business’s needs, as well as provide information to help them improve their financial management.
In 2020, our most important initiative was to help our clients navigate the significant impacts of the COVID-19 pandemic in the Brazilian economy. We postponed the due dates of all interested, compliant clients in 60 days during the second quarter of 2020 and offered a renegotiation campaign with special discounts for those who defaulted during the third quarter of 2020. Another important evolution was the start of the commercialization of microcredit in our retail branches and through online channels in November 2020.
Public Sector Group
The Public Sector Group is tasked with client coverage and business development efforts for Brazilian Federal, State and Municipal government branches as well as select State Owned Enterprises. Its value proposition entails coverage in key locations of clients in the Public Sector space by a team of seasoned professionals, offering a comprehensive array of Transaction Services, Asset Management, Foreign Exchange, Payroll Services, Payment Solutions and Credit Products for select clients.
During 2020 the Public Sector Group underwent a restructuring effort aimed at streamlining its operations and reinforcing its product portfolio with the goal of creating a more encompassing and Full Bank Experience for our clientele. As of December 31, 2020, the Public Sector Group was responsible for managing the relationships with 6,505 client accounts from its 13 offices across Brazil.
Wholesale Banking
Wholesale Banking is the segment responsible for banking operations of middle-market, agribusiness, large and ultra-large companies (those with annual revenues from R$30 million) and investment banking services. The breakdown of revenue among these segments is set out in the section “Item 4B. – Business Overview – Operations Overview” above. Our Wholesale Banking segment offers a wide range of products and services to the largest economic groups of Brazil.
Our activities in this business range from typical operations of a commercial bank to capital markets operations and advisory services for mergers and acquisitions. These activities are fully integrated, which enables us to achieve a performance tailored to our clients’ needs.
One of the most important features of our strategy for our Wholesale Banking segment is the set of initiatives linked to improving efficiency in our operations. These ongoing actions, which are expected to continue to grow in the coming years, are designed to increase revenues, improve processes and reduce costs.
Investment Banking
39
Our investment banking business carried out through Itaú BBA, assists companies raising capital through fixed income and equity instruments in public and private capital markets, and provides advisory services in mergers and acquisitions. We advise companies, private equity funds and investors in the structuring of variable income products and in mergers and acquisitions. We believe we offer a wide portfolio of investment banking services ranging from research to Brazilian and other Latin American companies.
Our fixed income department acts as bookrunner or manager in the issuance of debentures, promissory notes and securitization transactions at the investment banking segment.
The table below shows our market position and information about competitors for the business listed below:
| | | | |
| Product/Service | | Market Position | | Additional Information and Main Competitors |
| Investment Banking | | At December 2020, Itaú BBA ranked first in mergers and acquisitions and equities markets deals(1). Itaú BBA also ranked first in origination and in distribution in debt capital markets transactions(2). | | In investment banking, Itaú BBA’s main competitors include Santander , Credit Suisse (Brazil) S.A., Merrill Lynch S.A. (Brazil), Morgan Stanley S.A. (Brazil), JP Morgan S.A. (Brazil), Bradesco BBI and BTG Pactual S.A. |
Source: (1) Dealogic. (2) ANBIMA ranking in terms of volume.
Asset Management
With more than 60 years of experience in investment management, as of December 31, 2020, Itaú Asset Management has R$ 752.7 billion in assets under management (including Itaú Unibanco and Intrag) according to ANBIMA (Ranking de Gestão – December 2020) and recorded a 170 basis points decrease of assets under management in 2020 as compared to 2019. Itaú Asset Management ranked as the largest non-government owned asset manager in Brazil, with a 12.5% market share as of December 31, 2020, according to ANBIMA.
Kinea Investimentos LTDA., an alternative investments management company controlled by us, held R$56.3 billion in managed assets as of December 31, 2020, compared to R$68.5 billion as of December 31, 2019, according to ANBIMA.
The reduction in assets under management in 2020 was intensified due to the COVID-19 pandemic which led to an asset migration out of funds and into the Bank Deposit Certificates portfolio.
The table below shows our market position and information about competitors for the business listed below:
| | | | |
| Product/Service | | Market Position | | Additional Information and Main Competitors |
| Asset Management | | In December 2020, we had a market share of 12.5% in terms of assets under management, positioning us as the second asset manager in Brazil. | | According to ANBIMA, the asset management industry in Brazil held assets totaling R$6,030 billion as of December 2020 and with 688 Financial Institutions and Assets Managers, among them, XP Investimentos. The competition is concentrated among large and well-established retail banks. Our main competitors are Banco do Brasil, Banco Bradesco and Caixa Econômica Federal |
Source: ANBIMA.
40
Investment Services
Itaú Investment Services business units provide
| | (i) | local custody and fiduciary services, |
| | (ii) | international custody services, and |
| | (iii) | corporate solutions that act as transfer agent and stockholder servicer for Brazilian companies issuing equity, corporate bonds, promissory and bank credit notes. We also work as guarantor in transactions for project finance, escrow accounts and loan and financing contracts. |
We provide the technological tools to perform daily activities of each service and rely on compliance and contingency procedures. Thus, our clients can direct the focus on their business management.
Pension funds, insurance companies, asset managers, international global custodians and equity and debt issuers are our primary clients in these businesses, representing approximately 1,000 groups of clients, that reached R$3.9 trillion of assets under service as of December 31, 2020, which includes investment funds, underwriting, pension funds, trustee and brokerage services.
In 2020, Global Finance named Itaú Investment Services as the best sub-custodian in Brazil, Uruguay and Paraguay. We are currently updating our technological platform regarding securities services and investing in new solutions for our clients, such as iServices, that includes custody, brokerage and clearing all integrated as a service.
The table below shows our market position and information about competitors for the businesses listed below:
| | | | |
| Product/Service | | Market Position | | Additional Information and Main Competitors |
| Local Custody | | In December 2020, we had a market share of 23.0% based on total assets under local custody, positioning us as the second position Local Custodian. | | According to ANBIMA, the local custody in Brazil held assets totaling R$6,276 billion as of December 2020. Our main competitors are Banco Bradesco S.A. and Banco do Brasil S.A. |
| International Custody | | Our market share in December 2020 was 7.0% in terms of total assets under international custody, positioning us as the fourth largest International Custodian. | | Based on ANBIMA, the international custody service in Brazil totaled R$2,122 billion of assets as of December 2020. Our main competitors are Banco Citibank S.A., JP Morgan’s Securities Services and Banco Bradesco S.A. |
| Corporate Solutions | | In December 2020, we had a leading position as agent and register provider to 204 companies listed on B3, which represents 59.1% of companies listed on that exchange. Moreover, we were the second largest transfer agent with 338 debentures offerings in the Brazilian market, representing 27.5% of the debentures market in Brazil. | | Our main competitors in the equities market are Banco Bradesco S.A. and Banco do Brasil S.A. Our main competitor in debentures is Banco Bradesco S.A. |
Source: Itaú Unibanco Holding, ANBIMA and B3.
41
Itaú Private Bank
With a full global wealth management platform, we are one of the private bank market leaders in Brazil and one of the main private bank players in Latin America. Our multidisciplinary team, which is supported by a team of investment advisers and product experts, provides comprehensive financial services to clients, understanding and addressing their needs from our eight offices in Brazil and in our offices located in Zurich, Miami, New York, Santiago and Nassau.
Our clients have access to a complete portfolio of products and services, ranging from investment management to wealth planning, as well as credit and banking solutions. In addition to our in-house customized products and services, we offer our clients access to an open architecture of alternative products from third-party providers.
Aligned with our vision to be the leading bank in sustainable performance and customer satisfaction, we decided to focus our strategic priorities on the following Itaú Private Bank initiatives:
| | • | | Being the leading private bank in terms of client satisfaction; |
| | • | | Adding value to clients and stockholders with a complete offering of long-term proactive advisory services; |
| | • | | Continuing to invest in our international platforms to enhance Brazilian clients’ experience; |
| | • | | Improving our operational efficiency through continuous investments in technology; and |
| | • | | Maintaining a focus on risk management and regulatory considerations. |
The table below shows our market position for the business:
| | | | |
| Product/Service | | Market Position | | Additional Information and Main Competitors |
| Itaú Private Bank | | In December 2020, we had a market share of 27.3% in terms of Itaú Private Bank. Reduction of 340 basis points compared to December 2019, mostly explained by the entrance of new players in the monitoring of ANBIMA and the impact of the market volatility caused by COVID-19 pandemic. | | Banco do Brasil S.A., Bradesco S.A., BTG Pactual S.A., Credit Suisse (Brasil) S.A. and Santander S.A.. |
Source: ANBIMA.
Itaú Corretora (Brokerage)
Itaú Corretora has been providing brokerage services since 1965. We provide retail brokerage services in Brazil to over 302 thousand clients with positions in the equity and fixed income markets, accounting for approximately R$133.5 billion in trading volume in 2020. The brokerage services are also provided to international clients through our broker-dealer in New York.
The following table shows our market position and information about competitors for the businesses listed below:
42
| | | | |
| Product/Service | | Market Position | | Additional Information and Main Competitors |
| Retail Brokerage Services (1) | | Ranked third in Retail Brokerage Services by equity trading volume in the year ended December 31, 2020(2). | | Main competitors: XP Investimentos, Ágora Corretora de Títulos e Valores Mobiliários S.A., Rico Corretora de Títulos e Valores Mobiliários S.A., Easynvest Título Corretora de Valores S.A., BTG Pactual Corretora de Títulos e Valores Mobiliários S.A., Bradesco S.A. Corretora de Títulos e Valores Mobiliários, Santander Corretora de Câmbio e Valores Mobiliários S.A. and Safra Corretora de Titulos e Valores Mobiliários S.A. |
(1) Source: CBLCnet (2) Includes clients from Itaú Private Bank segment. |
International Operations
We want to achieve, in the countries where we operate, the same management quality and level of results we have in Brazil. Through our internationalization strategy, we seek to understand different markets, business, products and services, identifying opportunities to integrate our units and to expand our operations to new countries.
The table below shows some of our operations in Latin America, excluding Brazil:
| | | | | | |
| Countries | | Branches & CSBs | | ATMs | | Employees |
| Argentina | | 84 | | 175 | | 1,584 |
| Chile | | 183 | | 408 | | 5,340 |
| Colombia(1) | | 111 | | 125 | | 3,098 |
| Paraguai | | 40 | | 301 | | 975 |
| Uruguai(2) | | 24 | | 62 | | 1,065 |
| (1) | Includes employees in Panamá. |
| (2) | Does not include the 33 OCA points of service. |
Overview
Latin America is a priority in our international expansion due to the geographic and cultural proximity to Brazil. Our goal is to be recognized as the “Latin American Bank”, becoming a reference in the region for all financial services provided to individuals and companies.
Over the past years, we consolidated our presence in Argentina, Chile, Paraguay and Uruguay. In these countries, we operate in the retail, companies, corporate and treasury segments, with commercial banking as our main focus. With the recent merger between Banco Itaú Chile and CorpBanca, which assured our presence in Colombia and Panama, we expanded our operations in the region even further. In Mexico, we are present through an office dedicated to equity research activities.
As of December 31, 2020, we had a network of 444 branches, including 8 digital branches, and client service branches in Latin America (excluding Brazil). In Paraguay, we had 60 non-bank correspondent locations, which are points of service with a simplified structure, strategically located in supermarkets to provide services to our clients in that country. As of December 31, 2020, we also had 33 points of service through OCA S.A., our credit card operator in Uruguay. Please see “Distribution Channels”, for further details about our distribution network in Latin America.
Banco Itaú Argentina
We have operated in Argentina since 1979, where we began with a focus on large companies with business ties to Brazil. In 1995, we began our retail operations in Buenos Aires. In 1998, we increased our presence through the acquisition of Buen Ayre Bank, subsequently renamed Banco Itaú Argentina.
43
Through Banco Itaú Argentina we offer products and services in corporate banking, small and middle-market companies and retail banking. Our corporate banking business focuses on large and institutional clients, providing lending, structured finance, investment and cash management services. Our small and middle-market operations provide credit for working capital and investments in production capacity increases. Our retail banking business focuses on middle and upper-income clients, and our services offerings include current and savings accounts, personal loans and credit cards. In 2019 Banco Itaú Argentina opened two digital branches enhancing its presence in Argentina’s financial market.
The table below shows our market position and information about competitors for the business listed below:
| | | | |
| Product/Service | | Market Position | | Additional Information and Main Competitors |
Total Loan Portfolio (includes privately-owned banks only) | | In November 2020, we had a market share of 2.8% in terms of total outstanding loan balance in Argentine pesos, positioning us as the tenth largest private bank in Argentina. | | Our main competitors are Banco Santander Río, Banco de Galicia y Buenos Aires, BBVA Banco Argentina and Banco Macro. |
Source: Central Bank of Argentina.
Itaú Corpbanca
In April 2016, we closed the merger of Banco Itaú Chile with and into CorpBanca and, as a result, acquired control of the resulting entity – Itaú Corpbanca. On the same date, we entered into the Shareholders’ Agreement of Itaú Corpbanca, or Itaú Corpbanca’s Shareholders’ Agreement, which entitles us to appoint, together with the Corp Group, the former controlling shareholder of Corpbanca, the majority of the members of Itaú Corpbanca’s Board of Directors. In the following years, we increased our equity stakes to 39.22%, pursuant to the exercise of put options by Corp Group, as set out in Itaú Corpbanca´s Shareholder´s Agreement.
Itaú Corpbanca provides a broad range of wholesale and retail banking services to customers in Chile and Colombia. In addition, it provides financial advisory services, mutual fund management, insurance brokerage and securities brokerage services through subsidiaries, and banking services. It operates in two main geographic areas: Chile and Colombia. The Chile segment also includes operations carried out by Itaú Corpbanca New York Branch and the Colombia segment also includes the operations carried out by Itaú S.A. (Panama).
Business activities in Chile have been strategically aligned onto three areas directly related not only to our medium-term strategy but to customers’ needs: 1) Wholesale Banking (a. Corporate, b. Large Companies and c. Real Estate and Construction); 2) Retail Banking (a. Itaú Personal Bank, b. Itaú, c. Itaú Private Bank, d. Midsize Companies, e. SMEs and f. Banco Condell, a Consumer Finance Division); and 3) Treasury. Itaú Corpbanca Colombia provides a broad range of commercial and retail banking services to its customers in Colombia, operating principally in the cities of Bogotá, Medellín, Cali, Bucaramanga, Cartagena and Barranquilla.
The table below shows our market position and information about competitors for the business listed below:
| | | | |
| Product/Service | | Market Position | | Additional Information and Main Competitors |
Total Loan Portfolio (includes privately-owned banks only) | | In December 2020, our market share was 11.2% based on total outstanding loan balance in Chilean pesos, positioning us as the fifth largest private bank in Chile. | | Our main competitors are Banco Santander-Chile, Banco de Chile, Scotiabank Chile and Banco de Crédito e Inversiones. |
Source: Chilean Commission for the Financial Market (CMF).
Banco Itaú Paraguay
Our operations in Paraguay began in 1978 and comprise retail and wholesale banking, through Interbanco, which was acquired in 1995 by Unibanco. In 2010, the Itaú brand was introduced and our bank’s name was changed to Banco Itaú
44
Paraguay. Banco Itaú Paraguay distributes products and services to small and middle market companies, agribusiness, large companies, institutional clients and consumer clients. The retail segment also focuses on payroll clients. Under corporate banking, Banco Itaú Paraguay has a well-established presence in the agribusiness sector. Banco Itaú Paraguay’s qualification is based on its strong positioning, with leadership in several segments, reflecting high returns.
In 2019 Banco Itaú Paraguay opened its first digital branch enhancing its presence in Paraguay’s financial market.
The table below shows our market position and information about our competitors for the Banco Itaú Paraguay business:
| | | | |
| Product/Service | | Market Position | | Additional Information and Main Competitors |
Total Loan Portfolio (includes privately-owned banks only) | | In December 2020, we had a market share of 13.5% in terms of total outstanding loan balance in guaranis, positioning us as the third largest private bank in Paraguay. | | Our main competitors are Banco Continental, Banco Regional, Sudameris and BBVA Paraguay. |
Source: Central Bank of Paraguay.
Banco Itaú Uruguay
Our banking operations in Uruguay include Banco Itaú Uruguay, OCA (the largest credit card issuer in Uruguay, in accordance with data from Uruguay’s central bank) and the pension fund management company Unión Capital. Our strategy in Uruguay is to serve a broad range of clients through customized banking solutions.
Our retail banking business is focused on individuals and small business clients. Retail products and services focus on the middle and upper-income segments, and also include current and savings accounts, payroll payment, self-service areas and ATMs in all branches, and phone and internet banking. The wholesale banking division is focused on multinational companies, financial institutions, large and middle market companies and the public sector, providing lending, cash management, treasury, trade and investment services.
In 2019 Banco Itaú Uruguay opened its first digital branch enhancing its presence in Uruguay’s financial market.
The table below shows our market position and information about our competitors for the Banco Itaú Uruguay business:
| | | | |
| Product/Service | | Market Position | | Additional Information and Main Competitors |
Total Loan Portfolio (includes privately-owned banks only) | | In December 2020, we had a market share of 23.3% based on total outstanding loan balance in Uruguayan pesos, positioning us as the second largest private bank in Uruguay. | | Our main competitors are Banco Santander Uruguay, BBVA Uruguay and Scotiabank Uruguay. |
Source: Central Bank of Uruguay.
Itau BBA International
Our banking activities carried out under the corporate structure of Itau BBA International are mainly focused on two business lines:
45
| | • | | Corporate and Investment Banking: through Itau BBA International, headquartered in the United Kingdom, and its subsidiary Itaú Europe, headquartered in Portugal, with business platforms in Madrid and Paris, this segment supports the financial needs of companies with international presence and operations, focusing on transactions related to financing and investment relationships between companies in Latin America and the Northern Hemisphere. The services offered include the origination of structured financing, hedging, trade financing and advisory to Latin American and U.S. companies undertaking business in the Northern Hemisphere and large economic groups investing into Latin America. |
| | • | | Private Banking: under the corporate structure of Itau BBA International, we manage private banking activities in Miami and Zurich, offering specialized financial and asset management services for Latin American clients with high net worth by providing a diversified and specialized basis of investment funds, trading and managing on their account securities and other financial instruments, as well as by managing trusts and investment companies on behalf of customers. |
Other International Operations
Our other international operations have the following objectives:
| | • | | Support our clients in cross-border financial transactions and services, our international units are active in providing our clients with a variety of financial products, such as trade financing, loans from multilateral credit agencies, off-shore loans, international cash management services, foreign exchange, letters of credit, guarantees required in international bidding processes, derivatives for hedging or proprietary trading purposes, structured transactions and international capital markets offerings. Our international units offer a variety of financial products through their branches. |
| | • | | Manage proprietary portfolios and raise funds through the issuance of securities in the international market. Fundraising through the issuance of securities, certificates of deposit, commercial paper and trade notes can be conducted by our branches located in the Cayman Islands, the Bahamas and New York, as well as through Itaú Bank Ltd., a banking subsidiary incorporated in the Cayman Islands. Our proprietary portfolios are mainly held by Itaú Bank and our Nassau and Cayman Islands branches. These offices also enhance our ability to manage our international liquidity. |
Through our international operations, we establish and monitor trade-related lines of credit from foreign banks, maintain correspondent banking relationships with money centers and regional banks throughout the world and oversee our other foreign currency-raising activities.
Revenues from Operations in Brazil and Abroad
We conduct most of our business activities in Brazil, but we do not break down our revenues by geographic markets within Brazil. Our interest income from loans and leases, banking service fees and income from insurance, private pension plans and premium bonds transactions are divided between revenues earned in Brazil and outside of Brazil. The following information is presented in IFRS, as issued by the IASB, after eliminations on consolidation.
The following table sets forth the consolidated statement of income with respect to our revenues from operations in Brazil and abroad for the years ended December 31, 2020, 2019 and 2018:
46
| | | | | | | | | | | | | | | | | | | | | | | | | | | | |
Revenues from operations in Brazil and abroad | | For the Year Ended | | | Variation | |
| | 2020 | | | 2019 | | | 2018 | | | 2020-2019 | | | 2019-2018 | |
| | | (In millions of R$, except percentages) | |
Income related to financial operations (1) (2) | | | 123,611 | | | | 145,308 | | | | 131,317 | | | | (21,697 | ) | | | (14.9 | )% | | | 13,991 | | | | 10.7% | |
Brazil | | | 102,016 | | | | 117,541 | | | | 108,362 | | | | (15,525 | ) | | | (13.2 | )% | | | 9,179 | | | | 8.5% | |
Abroad | | | 21,595 | | | | 27,767 | | | | 22,955 | | | | (6,172 | ) | | | (22.2 | )% | | | 4,812 | | | | 21.0% | |
Revenues from banking services | | | 38,557 | | | | 39,032 | | | | 36,809 | | | | (475 | ) | | | (1.2 | )% | | | 2,223 | | | | 6.0% | |
Brazil | | | 34,533 | | | | 35,283 | | | | 33,211 | | | | (750 | ) | | | (2.1 | )% | | | 2,072 | | | | 6.2% | |
Abroad | | | 4,024 | | | | 3,749 | | | | 3,598 | | | | 275 | | | | 7.3 | % | | | 151 | | | | 4.2% | |
Income from insurance and private pension operations before claim and selling expenses | | | 4,488 | | | | 4,553 | | | | 3,961 | | | | (65 | ) | | | (1.4 | )% | | | 592 | | | | 14.9% | |
Brazil | | | 4,488 | | | | 4,423 | | | | 3,812 | | | | 65 | | | | 1.5 | % | | | 611 | | | | 16.0% | |
Abroad | | | — | | | | 130 | | | | 149 | | | | (130 | ) | | | (100.0 | )% | | | (19 | ) | | | (12.8)% | |
| | | | | | | | | | | | | | | | | | | | | | | | | | | | |
| (1) | Includes interest and similar income, dividend income, net gain (loss) on investment securities and derivatives, foreign exchange results, and exchange variation on transactions abroad. |
| (2) | ITAÚ UNIBANCO HOLDING does not have clients representing 10% or greater of its revenues. |
Competition
The last several years have been characterized by increased competition and consolidation in the financial services industry in Brazil. According to the Central Bank, as of December 31, 2020, there were 139 conglomerates, commercial banks and multiple-service banks, development banks and Caixa Econômica Federal, among a total of 1,291 institutions in Brazil.
We, together with Banco Bradesco S.A. and Banco Santander Brasil S.A., are the leaders in the privately-owned multiple-services banking sector. As of December 31, 2020, these three banks accounted for 39.0% of the Brazilian banking sector’s total assets, according to the Central Bank. We also face competition from state-owned banks. According to the Central Bank, as of December 31, 2020, Banco do Brasil S.A., Caixa Econômica Federal, and Banco Nacional de Desenvolvimento Econômico e Social (BNDES) accounted for 35.8% of the banking system’s total assets.
The following table sets for the total assets of the 10 main banks in Brazil, classified according to their interest in the total assets of the Brazilian banking sector
| | | | | | | | | | | | |
(In billions of R$) | |
Position | | Banks by total assets(1) | | Control Type | | As of December 31, | |
| | | | | | | 2020 | | | % of Total | |
1st | | Itaú Unibanco Holding S.A. | | privately-owned | | | 1,941.9 | | | | 17.5 | |
2nd | | Banco do Brasil S.A.(2) | | state-owned | | | 1,713.3 | | | | 15.5 | |
3rd | | Caixa Econômica Federal | | state-owned | | | 1,448.9 | | | | 13.1 | |
4th | | Banco Bradesco S.A. | | privately-owned | | | 1,371.0 | | | | 12.4 | |
5th | | Banco Santander Brasil S.A. | | privately-owned | | | 1,004.0 | | | | 9.1 | |
6th | | Banco Nacional de Desenvolvimento Econômico e Social | | state-owned | | | 798.4 | | | | 7.2 | |
7th | | Banco BTG Pactual S.A. | | privately-owned | | | 266.3 | | | | 2.4 | |
8th | | Banco Safra S.A. | | privately-owned | | | 218.4 | | | | 2.0 | |
9th | | J.P. Morgan S.A | | privately-owned | | | 104.1 | | | | 0.9 | |
10th | | Banco Citibank S.A. | | privately-owned | | | 91.8 | | | | 0.8 | |
n.a. | | Others | | n.a. | | | 2,114.5 | | | | 19.1 | |
| | Total(3) | | | | | 11,072.7 | | | | 100.0 | |
| | | | | | | | | | | | |
| (1) | Based on banking services, except insurance and pension funds. |
| (2) | Includes the consolidation of 50.0% do Banco Votorantim S.A. based on Banco do Brasil’s shareholding stake and excludes these 50.0% of National Financial System. |
| (3) | Excludes Payments Institutions |
Source: Central Bank (IF.data).
Along with our traditional competitors, there are also new technology-driven financial institutions such as fintechs, Asset Management firms and Acquiring Services which are disrupting the Brazilian financial industry. In general, these competitors act in specific business lines such as Credit Cards (e.g. Nubank), Investment Services (e.g. XP Investimentos), Acquiring Services (e.g. StoneCo, PagSeguro), Banking Services (e.g. Banco Inter, BTG Digital) and others. Although many of our non-traditional competitors are still in early stages of development, they start to gradually increase the number of products and services offered. As
47
technology advances and clients’ preferences and expectations change, boosted by innovations introduced by the new competition, traditional competitors are also changing and redesigning their products, distribution and communication channels.
Distribution Channels
As a universal bank, we provide a wide range of financial services and products to our clients, from commercial banking to asset management and investment banking. Those products are distributed through two main channels: traditional and digital.
The traditional channels are composed of brick & mortar branches – which could be either full-service branches or in-house corporate service centers – and ATMs. The digital channels are operated remotely, via the internet or mobile phones.
Our network of 3,232 branches, which includes physical and digital branches, as of December 31, 2020, distributes all of products and services in Brazil.
ATMs, both our own proprietary network of machines and additional 23,798 via partnership with Tecban, (as of December 31, 2020) are a very convenient and efficient way of serving clients, due to its low operating costs, 24/7 availability and very complete services offering.
Clients who prefer to use digital channels, such as internet and mobile banking, are served remotely by our relationship managers based on one of our 196 digital branches in Brazil.
| | | | | | | | | | | | | | | | | | | | | | | | | | | | | | | | | | | | |
Standard channels | | Branches | | | CSBs | | | ATMs | |
| | | 2020 | | | 2019 | | | 2018 | | | 2020 | | | 2019 | | | 2018 | | | 2020 | | | 2019 | | | 2018 | |
Brazil | | | 3,232 | | | | 3,348 | | | | 3,717 | | | | 656 | | | | 671 | | | | 703 | | | | 20,687 | | | | 21,384 | | | | 24,252 | |
Abroad | | | 413 | | | | 448 | | | | 483 | | | | 36 | | | | 37 | | | | 37 | | | | 1,071 | | | | 1,107 | | | | 1,175 | |
Argentina | | | 71 | | | | 74 | | | | 72 | | | | 13 | | | | 13 | | | | 13 | | | | 175 | | | | 176 | | | | 176 | |
Chile and Uruguay | | | 208 | | | | 219 | | | | 224 | | | | 1 | | | | 1 | | | | 2 | | | | 470 | | | | 486 | | | | 525 | |
Colombia | | | 101 | | | | 117 | | | | 148 | | | | 10 | | | | 11 | | | | 13 | | | | 125 | | | | 147 | | | | 174 | |
Paraguay | | | 28 | | | | 32 | | | | 31 | | | | 12 | | | | 12 | | | | 9 | | | | 301 | | | | 298 | | | | 300 | |
Other | | | 5 | | | | 6 | | | | 8 | | | | — | | | | — | | | | — | | | | — | | | | — | | | | — | |
Total in Brazil and abroad | | | 3,645 | | | | 3,796 | | | | 4,200 | | | | 692 | | | | 708 | | | | 740 | | | | 21,758 | | | | 22,491 | | | | 25,427 | |
| | | | | | | | | | | | | | | | | | | | | | | | | | | | | | | | | | | | |
Digital Channels (internet and mobile banking)
In 2020, due to the COVID-19 pandemic, the world faced one of the greatest economic and social challenges, where technology and digitalization became even more necessary. Many habits and customs were adjusted to the “new normal” and digital channels have become a very safe way to continue interacting with other people and companies without leaving home.
We invested a substantial amount of effort to give our customers the best possible experience through digital channels. Improvements in the regulatory and competitive scenario reinforced that commitments we made to our customers and other stakeholders a couple of years ago were of utter importance and resulted in important achievements. Our year over year growth in 2020 in monthly active users was 13% and there was a 108% growth in accounts opened digitally for individuals, which represented almost 50% of the total accounts opened in 2020. We also had two records: the download of Itaú App was 1.3x higher than the daily average of 2020 and the download of Itaú Empresas App was 5x higher than the daily average of the same period.
Due to the COVID-19 pandemic, we encouraged our customers to use our digital channels, such as our apps and online banking website, and our digital products. Our website was reconfigured to give prominence to Digital Channels, including a step by step for those who have never used the Itaú App and how to use the main financial services tutorials (view transactions, transfer money and pay bills, credit card payment, virtual cards, unlocking credit and debit card passwords,
48
tracking card orders). We also communicated the services that can be done online on our social networks and sent e-mails and SMS to our customers.
We created the “Services HUB”, a feature in Itaú Apps, with a simple and pragmatic interface, which includes many forms where customers can make requests for operational services. Requests are automatically sent to back office teams, thus reducing the demand for branches and call centers, balancing the experience and practical benefits with efficiency and process optimization. We have more than 16 new forms available and have already processed more than 853 thousand transactions. Besides, we improved the interaction of customers with managers and specialists to purchase products and receiving recommendations, assuring contextualized and quality service. In addition, we are enhancing the connection between online and offline (o2o) channels to optimize the bank’s results.
At WhatsApp Itaú, our focus was to expand the number of services and customers served by the channel. We launched the contact number to serve business customers and the exclusive contact number to deal with renegotiation for retail customers, which now serves active and inactive bank accounts, from simulation to contracting. In addition, we provide a feature that allows non-digitized customers to interact with WhatsApp Itaú, becoming a highly relevant digitization tool. These solutions illustrate our commitment to an omnichannel experience, to always be the bank our clients want to partner with.
Also, in 2020, to help businesses during the COVID-19 crisis, we offered three types of loans in partnership with the government, with special conditions, all available through our digital channels. The first one was exclusive for the payment of salaries and financed 136 thousand payrolls, benefiting almost 50 thousand companies and over 1 million employees and R$2.9 billion in financings. We also offered a loan to support micro and small businesses, which resulted in more than 16 thousand contracts in the first 24 hours and an aggregate amount of R$4 billion borrowed. And the final loan, was a loan for small, medium and large businesses, which resulted in an aggregate amount of R$15 billion borrowed. The NPS in this segment increased by 5 points in 2020, which indicates that we were able to attend the needs of our customers with great quality.
Another important service that we launched was Pix, an online payment and transfer system from the Central Bank. We built Pix considering simple and intuitive interfaces that can offer the best solution to our customers. This product was built by a 300 people multidisciplinary team, working remotely. Within less than two months, the transfers and payments made by Pix represented, organically, 26% of all the bank transfers in our main individual app, showing its disruptive potential and also an excellent basis to build new products and services for our customers.
Our communications channel became more efficient every year, and as we are closer to our customers, we can understand the best direction to follow, not only in terms of service evolution, but also in more efficient ways to help people manage their financial life. Another important point is that everything that is developed in digital channels, is not only built for, but with our customers, taking into consideration their daily routine, pain points and needs. This is a great differential – we have the knowledge and the tools to make our journeys simpler and more intuitive, considering each customer profile. We are also adapting our portfolio and products to serve a larger amount of customers. To mention some of these products, we have investment recommendations according to the clients’ objectives, online check deposit, buying foreign currency in the mobile app, iPhone pra Sempre (an online iPhone update program with credit card) and online renegotiation.
We are constantly recognized for being close to the customer and always delivering best-in-class innovation. As an example, we earned the Folha Top of Mind 2019 as the Best Banking Mobile App category, and in 2020 we earned a national award called Digital Transformation Bank Report, in the categories Credit innovation and Customer/User Experience. In addition, we won the Finances category in Datafolha research about companies and services which had a positive impact during the pandemic.
Our Brand and Marketing Channels
We strive to provide complete solutions in terms of products and services, through financial intelligence and an ecosystem of partnerships. This echoes in our continuous effort to fully attend the needs of each customer, from individuals and micro companies to large organizations, and provide the best experience both digitally and physically, which is reflected in our brand positioning.
Our brand is committed to encouraging people to have an easier and closer relationship with their finances in their daily lives. We are active in social media with constant publications about the economic environment and tutorials. In
49
December 2020, we reached over one billion views on our YouTube channel and over nine million followers on Facebook. In the same period, our Twitter and Instagram profiles had over 641 thousand and 521 thousand followers, respectively.
We continue to monitor all of our social media profiles 24 hours a day, seven days a week. We have 150 dedicated employees to interact with the public on all matters related to Itaú Unibanco Group in Brazil, including questions, suggestions, comments, and complaints. We received more than 2.9 million mentions on social media in 2020, according to Oliver, consulting agency that assist us in the analysis of social media data.
Social media is a pillar in engaging people in our role beyond banking. Itaú Unibanco invests in several projects, with a focus in education, culture, mobility, and sport. Our urban mobility platform has more than 1,400 bike stations and is present in seven cities in Brazil as well as in Santiago (Chile) and Buenos Aires (Argentina). According to the operator TemBici, in 2020 an average of more than 1 million trips were made each month using bikes from our urban mobility platform. This is due to the amount of bikes we offer people: there are over 7,000 laranjinhas (orange bikes) across Brazil.
In education, our programs are equally powerful: since the “Leia para uma criança” (Read to a child) program was created, more than 61 million printed books were distributed to people and 38 thousand braille books were offered to visually impaired children. Three million books have already been sent to public libraries, civil society organizations, and schools. This shows our commitment to mobilize clients and non-clients to make a difference in our country.
As a result, in 2020 we were ranked for the 17th consecutive year at the top of the Interbrand ranking of most valuable Brazilian brands with an estimated value of R$37,383 million. The analysis is based on our brand’s ability to generate financial results, influence the clients’ selection process, and ensure long-term demand.
Our Vision, Our Culture
Our culture supports us in attracting and retaining talent, directing our business path and, promoting a competitive advantage.
It is translated into the seven attitudes listed below, which we call “Our Way”, that keep us up-to-date with the context, demands and transformations of our business and organizational culture. Our Way directs how we intend to achieve our vision to be a leader in sustainable performance and in client satisfaction.
Our way:
| | 1. | It’s only good for us if it’s good for the client; |
| | 2. | We are passionate about performance; |
| | 3. | People mean everything to us; |
| | 4. | The best argument is the only one that matters; |
| | 6. | We think and act like owners; and |
| | 7. | Ethics is not negotiable. |
Ownership Structure
The following chart shows a simplified overview of our share ownership and our direct and indirect subsidiaries as of March 31, 2021:
50
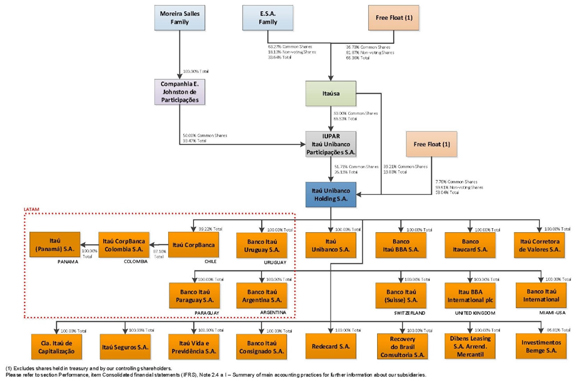
Sustainability
Sustainability is embedded in our corporate strategy through a consolidated governance structure and it is integrated into our business, which allows us to incorporate environmental and social issues into daily activities and processes across the entire Itaú Unibanco Group. Long-term strategic decisions on sustainability are discussed on an annual basis by our Board of Directors and twice a year at the meetings of our Executive Committee.
In 2019, we disclosed our new sustainability strategy, which is targeted at the positive impact we seek to create through our businesses and in our actions. In 2019 we signed, the Principles for Responsible Banking, by the United Nations Environment Programme Finance Initiative (UNEP FI), which encourages the global financial sector to comply with the Sustainable Development Goals and the Paris Agreement.
Our sustainability strategy includes eight Positive Impact Commitments, which we announced at an event for investors at the beginning of September 2019, and published on our Sustainability website and in our 2019 Annual Report. With clear goals, KPIs and sponsors in the business and institutional areas, the commitments we made will make us incorporate best sustainability practices throughout the organization, and they are divided into three pillars:
| | • | | Conduct and behavior, to foster the creation of a fair and ethical financial ecosystem; improve the employees’ experience and promote a diverse, inclusive and healthy workplace with a purpose; increase the environmental performance of our operations and promote sustainable practices in our supply chain. |
| | • | | Positive impact, to increase the financial inclusion of micro, small and medium entrepreneurs; increase the access to financial services and offer tools and content that support healthier financial decisions; foster the increase of financing for positive impact sectors and increase the inclusion of environmental, social and governance issues in investment decisions, and increase the offer of our products and services. |
51
| | • | | Accountability, to strengthen the transparency of our business in addition to our financial results, showing value to all of our stakeholders in a fair way and in line with best market practices. |
The path of the Positive Impact Commitments was even more challenging in this year of so many changes. However, this only reiterated the importance of dealing with environmental and social issues in an immediate and meaningful way for everyone, and we try our best to adapt our projects impacted by the scenario, in order to guarantee the evolution of our goals. In 2020, we also reaffirmed our positive impact agenda by building other initiatives such as a private social investment commitment, Todos pela Saúde (All for Health) initiative and the Amazon Plan.
In 2020, with the relevance of private social investment in the scenario in which we live, we dedicated efforts to create a new specific commitment to the theme. The objective was to reaffirm Itaú Unibanco’s pact alongside our institutes and foundations with Brazilian society, strengthening bonds of trust amid uncertainty. This new commitment establishes guidelines and goals aimed at Private Social Investment with the objective of promoting access and expanding rights, improving the quality of life in cities and strengthening the power of transformation of people.
The Todos pela Saúde project aims at supporting and strengthening the coronavirus relief efforts in Brazil by reaching all tiers of society, as well as supporting public health sector initiatives, such as the Brazilian unified health system (SUS), in such a challenging time. Itaú has started this project with the largest philanthropic donation ever made by a Brazilian company: the bank has donated R$1 billion to make the project come true. Out of this amount, R$790 million has already been allocated to the novel coronavirus relief efforts. In addition to the initial donation, the initiative has already collected over R$18 million in donations from companies and individuals across Brazil.
The Amazon Plan has arisen from a joint plan between Itaú, Santander and Bradesco, three large banks with a common clear goal: promoting effective actions to ensure the sustainable development of the Amazon region. In addition to being a vital region for the health of the world climate, the Amazon Plan was developed in a particularly critical year for this territory. The National Institute for Space Research (INPE) has disclosed that deforestation in the Amazon region was up 34% between August 2019 and July 2020 from the same period in the prior twelve months. The Amazon Plan includes ten measures designed to meet three action fronts essential for the sustainable development of the region: environmental conservation and bio economic development, sustainable infrastructure investments, and basic rights guaranteed for the population of the Amazon region. These measures are essential for ensuring preservation and the sustainable development of the economy of the region and its population.
In 2020, we created a working group with the aim of integrating ESG criteria in our credit portfolio. As we deepen the work with the group, we felt the need to create a specific governance to conduct discussions about deliveries and the challenges that this agenda imposes on financial institutions in general. With this, an ESG business committee was established, composed of executives from the Wholesale bank, to monitor the evolution of projects, discuss trends in the local and international market, as well as the progress of the ESG agenda, assess ESG operations and connect strategic matters involving ESG in large companies. We have also established an ESG working group in the area of Fixed Income that aims to evaluate capital markets operations in addition to providing ESG advisory, specialized advice to clients regarding ESG criteria, when necessary.
Since 2018, we have been working on a multidisciplinary basis involving the Sustainability, Environmental and Social Risk, Finance, Asset Management and Investor Relations departments to develop a Climate Finance agenda. We participate in the main national and international forums and initiatives in order to anticipate trends and help us guide the way we do business in the short and long terms. Together with 36 other banks, we are part of a working group to address the TCFD of the United Nations Environment Programme Finance (UNEP-FI) for the purpose of developing indicators and tools to improve the assessment and disclosure of risks and opportunities related to climate change. In 2019, we undertook to implement the TCFD recommendations by 2022, with actions determined and periodically monitored to ensure the achievement of this target. Compliance with TCFD’s recommendations at 79% in December 2020.
In August 2018, Itau and Natura launched the platform Commitment to Climate Program, whose main objective is to promote the carbon market and invite other organizations to participate in this initiative. Currently, this program has grown, and other companies are participating to offset their emissions, like B3, Lojas Renner, MRV, Raia Drogasil, Localiza and Mattos Filho, together with Natura and Itaú. Over the years of the Program, it has helped to protect more than 8,500 ha of forests, to generate more than 85,000 MWh of renewable electric energy and verified more than 1 million of emissions
52
reductions. In 2020, with the impacts of COVID-19 crisis, Itau selected to support only one project, which was a clean energy generation project, to offset Itau’s emissions during 2019, which was more than 17,000 metric tons of CO2.
On January 8, 2021, we established a framework, or the Framework, to allow us to contribute to the development of sustainable financing solutions, with the objective of raising funds for new and existing projects with environmental or social benefits. We are committed to increasing (i) the financing for positive impact sectors; (ii) the inclusion of environmental, social and governance issues in investment decisions; (iii) the financial inclusion of micro, small and medium entrepreneurs; and (iv) the access to financial services and offer tools and content that support healthier financial decisions. The Eligibility Criteria (as defined in our Framework) have been developed in alignment with the four core components of the GBP, SBP and SBG administered by the International Capital Markets Association (ICMA) – use of proceeds, process for project evaluation and selection, management of proceeds and reporting. The Framework has also been analyzed and recommended by a second party opinion provider, Sustainalytics, as part of a regular sustainability bond issue.
On the topic of human rights, in 2019, we launched a revised version of Itaú’s Human Rights Commitment, which aims to reinforce our commitment of respect for human rights with respect to employees, clients, suppliers, stockholders, partners and society. This commitment guides our actions related to critical topics, mitigation practices, remediation and monitoring measures and work with vulnerable groups (children, adolescents, indigenous people, women, migrants, black people, people with disabilities, LGBT+ and others). With this in mind, we conducted action plans to discuss case studies of human rights violations reported by clients through our channels and the training of service teams to address these cases. Further, we started a broad education process including the organization of “diversity weeks” focused on discussions about race, LGBT+ people, gender and people with disabilities. Additionally, in order to support knowledge about human rights and diversity, we launched a training on this topic for all our employees and we organized the “Diversity Library”, with a curatorship of content related to Diversity, Inclusion and Human Rights. In order to establish communications that are relevant to topics related to human rights in the organization, we also organized a mental health and financial education week, with lectures on those topics.
Our sustainable management contributed to our access to funding through development agencies and to our presence in sustainability indexes. We are the only Latin American bank to participate in the Dow Jones Sustainability Index since its inception in 1999, and we also participate in the Corporate Sustainability Index (ISE) and the Carbon Efficient Index (ICO2), both of B3.
Dependence on Patents, Licenses, Contracts and Processes
We own, in Brazil and abroad, a number of patents and patent applications related to methods for security code checking and for a method, user device and system to submit financial transaction information. We and our affiliates are not dependent on such patents to perform our activities.
Risk Management
Taking on and managing risks is one of our activities and, to this end, we must have well-established risk management objectives. In this context, risk appetite defines the nature and level of risks that are acceptable to us and the risk culture guides the attitudes necessary to manage them.
We invest in robust risk management processes that are the basis for our strategic decisions to ensure the sustainability of the business and to maximize the creation of shareholder value. These processes are aligned with the guidelines of the Board of Directors and the Executives who, through collegiate, define the global objectives, expressed in goals and limits for the risk management business units. The control and capital management units, in turn, support our management through risk and capital monitoring and analysis processes.
The principles that provide the foundations of risk management, the risk appetite, and the guidelines for how our employees act in their day-to-day decision-making are:
| | • | | Sustainability and customer satisfaction: our vision is to be the leading bank in performance and customer satisfaction. Therefore we are concerned with generating shared value for employees, customers, shareholders and society, and ensuring the perpetuity of our business. We are concerned with doing business that is good for the client and for us. |
| | • | | Risk culture: our risk culture goes beyond policies, procedures and processes, strengthening the individual and collective responsibility of all employees to manage and mitigate risks in a conscious manner, respecting the way business is ethically done. |
| | • | | Risk pricing: we act and assume risks in businesses we know and understand, and avoid those we do not know or for which we have no competitive advantage, carefully evaluating the relation between risk and return. |
| | • | | Diversification: we have a low appetite for volatility in results and, for this reason, we operate in a diversified base of clients, products and businesses, seeking the diversification of risks, in addition to prioritizing lower risk business. |
| | • | | Operational excellence: we want to be an agile bank, with a robust and stable infrastructure, in order to offer a high quality service; |
| | • | | Ethics and respect for regulations: for us ethics is non-negotiable. For this reason, we promote an institutional environment of integrity, educating our employees to cultivate ethical relationships and businesses, as well as respecting the norms, and therefore looking our reputation. |
The CMN Resolution 4,557/2017, which provides for the structure of risk and capital management framework, with which we must comply, highlights the implementation of a continuous and integrated risk management framework, the requirements for defining the Risk Appetite Statement (RAS), and the RAS (Risk Appetite Statement) and the stress test program, the constitution of a Risk Committee and the appointment, before BACEN, of the Risk Management Officer (CRO), with the attribution of roles responsibilities and independence requirements.
Our risk appetite establishes the types and levels of risk acceptable to us.
53
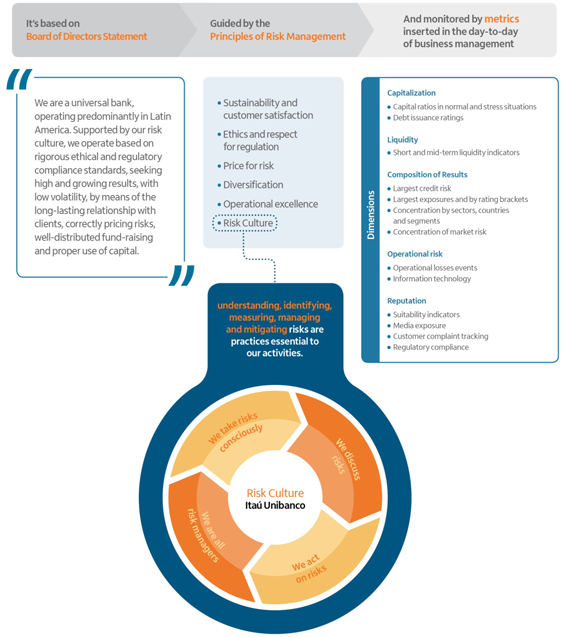
Governance and organizational structure
Our risk management organizational structure complies with Brazilian and applicable international regulations currently in place and is aligned with best market practices. There is a structure in place for coordination and consolidation of information and related processes, which are all subject to verification by independent validation, internal controls and audit areas. The following committees are part of our risk and capital management governance structure:
54
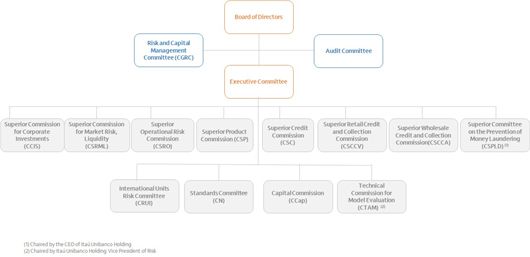
Risk & Capital Management Committee (CGRC): supports our Board of Directors in performing its duties related to our risk and capital management by meeting, at least, four times annually, and submitting reports and recommendations to assist the Board of Directors in its decision-making with respect to:
| | ◾ | Decisions regarding our risk appetite, in terms of capital, liquidity, results, operational risk and reputation, ensuring these aspects are in alignment with our strategy, and including acceptable capital and liquidity levels and types of risks to which we may be exposed, as well as overall limits for each type of risk, tolerance for volatility of results and risk concentration, and general guidelines about tolerance for risks that may impact our brand (e.g., brand risk). |
| | ◾ | Supervision of our risk management and control activities in order to ensure their suitability to the risk levels assumed and to the complexity of the operations as well as compliance with regulatory requirements; |
| | ◾ | Review and approval of policies and strategies for capital management, to establish mechanisms and procedures aimed at keeping capital consistent with the risks we incur; |
| | ◾ | Establishing our minimum expected return on capital as a whole and for our lines of business, as well as monitoring performance; |
| | ◾ | Supervision of our incentive structures, including compensation, aimed at ensuring its alignment with risk control and value creation goals; and |
| | ◾ | Fostering improvement in our Risk Culture. |
Superior Commission for Market Risk and Liquidity (CSRML): meets on a monthly basis and is responsible for setting guidelines and governance for investments and market and liquidity risks regarding our consolidated positions and business lines.
Superior Operational Risk Commission (CSRO): meets on a bimonthly basis and is responsible for understanding the risks of our processes and business, defining guidelines for operational risks management and assessing the results achieved by our Internal Controls and Compliance System. The CSRO is our main decision-making committee for all operational risk management matters. It is responsible for defining our operational risk framework and structure and related policies for identification, measurement, assessment, reporting and monitoring of operational risk.
Superior Products Commission (CSP): meets on a weekly basis and is responsible for evaluating products, operations, services and processes that are beyond the authority of our Products Committees that report to it or that involve image risk to us.
Superior Credit Commission (CSC): meets on a weekly basis and is responsible for analyzing and deciding on credit proposals that are beyond the authority of the credit committees that report to the CSC. It is also responsible for analyzing decisions which may have not been taken due to a lack of consensus at the committee immediately subordinate to it or cases where, due to the relevance or characteristics of the topic or other features, such Credit Committees decide to submit to the CSC’s review.
55
Superior Retail Credit and Collection Commission (CSCCV): meets on a monthly basis and is responsible for approving credit policies and assessing the performance of Retail Credit and Collection portfolios and strategies.
Superior Wholesale Credit and Collection Commission (CSCCA): meets on a monthly basis and is responsible for approving credit policies and assessing the performance of Wholesale Credit and Collection portfolios and strategies.
Superior Committee on Prevention of Money Laundering (CSPLD): summoned on demand, the Committee aims to analyze and deliberate on claims involving the opening / maintenance of transfers and other services / operations (M&A, credit granting, KYC exchange validation, among others) to bidders with greater exposure to money laundering risk.
Superior Commission for Corporate Investment (CSIS): meeting on demand, its purpose is to evaluate temporary corporate investments of interest to the Investment Bank (DGA).
Additionally, we have sub-committees, chaired by our chief risk officer and CFO, which are also responsible for risk and capital management. Any such sub-committee may report directly to the Risk and Capital Management Committee or to the sub-committees mentioned above.
Standards Committee (CN): meets at least quarterly (may be via Fast Track) and aims to approve / validate standards with the scope of the Standards Committee, being the minimum scope for approval of policies. Higher-level policies must be approved by the Normative Committee before proceeding to other forums.
Technical Commission for Model Evaluation (CTAM):
CTAM - Market: meets bimonthly or on demand, for approval and assessment of market risk models and pricing, based on the independent opinion of the model validation area, as well as suggesting and monitoring action plans for the validated models. Its main responsibilities are: to approve models related to the calculation of market risk and pricing, to decide whether or not to use market risk and pricing models, to approve, recommend, suggest and monitor the proposed action plans for the validated models and monitor the performance of the market risk model over time, determining new developments, if necessary.
CTAM - Credit: recommend or veto the use of credit risk models based on an independent opinion from the model validation area, inform any risk points and monitor action plans. Its responsibilities are divided into Director Alçada (which meets monthly or on demand) and Superintendent Alçada.
Capital Committee (CCAP): meeting at least bimonthly, it aims to monitor the capital adequacy of the Holding and International Units, the capital projections in normal and adverse scenarios, in addition to reviewing the assessment of the materiality of the risks, the need for additional capital for material risks and the quantification methodologies for calculating capital for risks whose need has been completed for the purposes of the Internal Capital Adequacy Assessment Process.
International Units Risk Committee (CRUI): held on a quarterly basis, it aims to present and discuss the main risks of International Units and the corresponding strategies and action plans proposed to mitigate the identified risks. It monitors the risk indicators and risk appetite of International Units, as well as the measures for maintenance at acceptable levels, considering the particularities of each country or region. Deliberates on situations that require mobilization of Units and respective management areas in Brazil, including monitoring of risk events, notes from regulators, results of internal and external audits, risk maps and regulatory demands. Evaluates the evolution of maturity in the risk management of the Units and in the governance and supervision exercised by the ARF risk areas, ensuring alignment with our strategy. Promotes the Risk Culture Program in International Units and its dissemination.
To support this structure, we have the Risks & Finance Control and Management Area, structured with specialized departments and subordinated to our chief risk officer and CFO, intending to independently and in a centralized manner to ensure that the institution’s risks and capital are managed in accordance with established policies and procedures.
Risk governance at foreign subsidiaries
56
Our foreign subsidiaries follow the risk management and governance model established by the holding in its policies and guidelines, keeping an effective flow of information on risk levels between headquarters and each subsidiary and alignment of strategies for maintaining such risks at an acceptable level.
To ensure the continuous improvement of the units in risk management and controls, a maturity program was established, comprising the definition and periodic assessment of best practices of risk management and controlling conducted in each location as also the supervision and governance activities performed by the holding.
The proximity in the monitoring of our units allows us to better understand the peculiarities of each country and region where we do business with and to quickly adapt to changes in different regulatory, social, and economic environments where we operate, even in stress scenarios as observed with COVID-19 pandemic.
In this regard, there was an increase of volume and frequency of information shared between units and holding when related to customers and employees’ safety and well-being preservation, the availability of banking channels, products and services, the regulatory changes instituted in different countries and their impacts in the units.
Finally, advances in actions to strengthen the Risk Culture on abroad subsidiaries have fostered individual and collective responsibilities of all our employees, empowering them to do the right thing, at the right time, and in the right way respecting the ethical and sustainable way of doing business.
Supervision and Regulation
We are subject to regulation by, and supervision of, several entities, in the countries and for the segments in which we operate. The supervisory activities of these entities are essential to the structure of our business, and they directly impact our growth strategies. Below we describe the main entities that regulate and supervise our activities in Brazil:
| | |
| CMN | | the highest authority of the Brazilian National Financial System (SFN) responsible for the currency and credit policy in Brazil to guarantee stability and social and economic development. Its major purpose is to disclose the general rules for the operation of the entire financial market. |
| Central Bank | | autonomous authority responsible for regulating and overseeing the entire National Financial System (SFN), ensuring the stability of the purchasing power of the currency and a solid and efficient financial system and for implementing the policies established by the CMN, authorizing the establishment of financial institutions and supervising them. |
| CVM | | a government agency linked to the Ministry of the Economy with purpose of regulating, supervising and developing the securities market. |
| CNSP | | responsible for establishing the guidelines and directives for insurance and premium bond companies and open private pension entities. |
| SUSEP | | responsible for regulating and supervising the insurance, open private pension funds and capitalization markets in Brazil and their participants. |
| ANS | | responsible for regulating and supervising the health insurance market in Brazil and its participants. |
Our main operations outside of Brazil are subject to oversight by local regulatory authorities in the following jurisdictions:

57
| | |
| Noteworthy regulatory requirements and restrictions on financial institutions: | | • prohibition against operating in Brazil without prior approval of the Central Bank; • prohibition against acquiring real estate that is not for the financial institution’s own use, except those received for settlement of loan losses or as expressly authorized by the Central Bank, pursuant to CMN regulation; • prohibition against acquiring interests in companies without prior approval of the Central Bank, except for ownership interest typical of investment portfolios held by investment banks; • prohibition against granting loans that represent more than 25% of the financial institution’s regulatory capital to only one person or group; • restrictions on credit transactions to certain related individuals and legal entities; • obligation to deposit a portion of the deposits received from clients with the Central Bank (compulsory deposit); • obligation to maintain enough capital reserves to absorb unexpected losses, pursuant to the rules proposed by the Basel Committee and implemented by the Central Bank; • obligation to prepare and submit, by December 31, annual recovery plans that aim to re-establish adequate levels of capital and liquidity and to preserve the viability of the institution under stress scenarios; • obligation to create, in respect to financial guarantees, specific accounting procedures for the assessment and registration of passive provisions (provisão passiva); • prohibition against holding, on a consolidated basis, permanent assets, including investments in unconsolidated subsidiaries, real estate, equipment and intangible assets, exceeding 50.0% of the adjusted regulatory capital; • prohibition against granting loans or advances, and guarantees, including derivative transactions, underwriting or holding in their investment portfolio securities of any clients or group of affiliated clients that, in the aggregate, give rise to exposure to such client or group of affiliated clients that exceeds the threshold determined by the Central Bank. |
Supplementary law establishing the independence of the Central Bank approved by the Brazilian Congress
On February 25, 2021, Supplementary Law No. 179 of February 24, 2021 (“Supplementary Law No. 179”) was published, establishing the purposes of the Central Bank and its autonomy, as well as regulating the appointment and removal of its president and directors.
Among other matters, Supplementary Law No. 179 sets forth that the Central Bank shall obtain the status of “special autarchy” characterized by the absence of ties to a Ministry, guardianship or hierarchical subordination, with technical, operational, administrative and financial autonomy. Additionally, the law also sets forth that, while the President of Brazil will still be responsible for appointing the president and the board of directors of the Central Bank (with the Brazilian Senate’s approval of their names), their terms of office will no longer coincide, which will further guarantee the independence of the Central Bank from political decisions. Supplementary Law No. 179 came into effect on the date of its publication.
Basel III Framework
On December 16, 2010, the Basel Committee issued its Basel III framework, which was revised and republished on June 1, 2011. The Basel III framework increases minimum capital requirements, creates new conservation and countercyclical buffers, changes risk-based capital measures, and introduces a new leverage limit and new liquidity standards in comparison to the former framework. The rules were phased in gradually and were fully implemented by January 1, 2019.
The Basel III framework requires banks to maintain minimum capital levels corresponding to the following percentages of risk-weighted assets: (i) a minimum common equity capital ratio of 4.5% composed of common shares; (ii) a minimum Tier 1 Capital ratio of 6.0%; and (iii) a minimum total capital ratio of 8.0%. In addition to the minimum capital requirements, Basel III requires a “capital conservation buffer” of 2.5% and each national regulator is given discretion to institute a “countercyclical buffer” if it perceives a greater system-wide risk to the banking system as the result of a build-up of excess credit growth in its jurisdiction. Further, Basel III introduces a new leverage ratio, defined as Tier 1 Capital divided by the bank’s total risk weighted exposure.
Basel III implemented a liquidity coverage ratio, or LCR, which requires affected banks to maintain sufficient high-quality liquid assets to cover the net cash outflows that could occur under a potential liquidity disruption scenario over a thirty-day period; and implemented a net stable funding ratio, or NSFR, which establishes a minimum amount of stable sources of funding that banks will be required to maintain based on the liquidity profile of the banks’ assets, as well as the potential for contingent liquidity needs arising from off-balance sheet commitments over a one-year period.
58
Additional requirements apply to non-common equity Tier 1 Capital or Tier 2 Capital instruments issued by internationally active banks. To be included in Additional Tier 1 Capital or Tier 2 Capital, an instrument must contain a provision that requires that, at the discretion of the relevant authority, such instrument be either written-off or converted into common shares upon a “trigger event”. A “trigger event” is the decision of a competent authority pursuant to which, for a bank to remain a feasible financial institution, it is necessary (i) to write-off an instrument, or (ii) to inject government funds, or equivalent support, into such bank, whichever occurs first. The requirements are applicable to all instruments issued after January 1, 2013 and those instruments qualified as capital issued before that date that do not comply with these requirements will be phased out of banks’ capital over a ten-year period, beginning on January 1, 2013.
Additional regulatory capital requirements apply to systemically important financial institutions, or G-SIFIs. The Basel Committee’s assessment methodology to determine which financial institutions are G-SIFIs is based on indicators that reflect the following aspects of G-SIFIs: (i) size; (ii) interconnectedness; (iii) lack of readily available substitute or financial institution infrastructure for the services provided; (iv) global or cross-jurisdictional activity; and (v) complexity. Each of these factors receives an equal weight of 20.0% in the assessment.
The Basel Committee has also issued a framework for the regulation of domestic systemically important banks, or D-SIBs, which supplements the G-SIFI framework by focusing on the impact that the distress or failure of systemically important banks would have on the domestic economy of each country.
Implementation of Basel III in Brazil
Financial institutions based in Brazil are subject to capital measurement and standards based on a weighted risk-asset ratio, according to CMN Resolutions No. 4,192/2013 and No. 4,193/2013. Brazilian banks’ minimum total capital ratio is calculated as the sum of two components: Regulatory Capital (Patrimônio de Referência); and Additional Core Capital (Adicional de Capital Principal), both aligned to the guidelines of the Basel III framework.
Brazilian banks’ Regulatory Capital is comprised of Tier 1 Capital and Tier 2 Capital. Tier 1 Capital is further divided into two elements: Common Equity Tier 1 Capital (common equity capital and profit reserves after adjustments, or Capital Principal) and Additional Tier 1 Capital (hybrid debt and equity instruments authorized by the Central Bank, or Capital Complementar).
In order to qualify as Additional Tier 1 Capital or Tier 2 Capital, according to CMN Resolution No. 4,192/13, all instruments issued after October 1, 2013 by a Brazilian bank must contain loss-absorbency provisions, including a requirement that such instruments be automatically written off or converted into equity upon a “trigger event”. A “trigger event” is the earlier of: (i) Common Equity Tier 1 Capital being less than 5.125% of the risk-weighted assets for Additional Tier 1 Capital instruments and 4.5% for Tier 2 Capital instruments; (ii) the execution of a firm irrevocable written agreement for the government to inject capital in the financial institution; (iii) the Central Bank declaring the beginning of a special administration regime (Regime de Administração Especial Temporária, or RAET) or intervention in the financial institution; or (iv) a decision by the Central Bank, according to criteria established by the CMN, that the write-off or conversion of the instrument is necessary to maintain the bank as a viable financial institution and to mitigate relevant risks to the Brazilian financial system. Specific procedures and criteria for the conversion of shares and the write-off of outstanding debt related to funding instruments eligible to qualify as regulatory capital are established by CMN regulation. The legal framework applicable to financial bills (letras financeiras) was adapted to allow Brazilian financial institutions to issue Basel III-compliant debt instruments in the Brazilian market.
Existing hybrid instruments and subordinated debt previously approved by the Central Bank as eligible capital instruments may continue to qualify as Additional Tier 1 Capital or Tier 2 Capital, as the case may be, provided that they comply with the above requirements and a new authorization from the Central Bank is obtained. Instruments that do not comply with these requirements will be phased out as eligible capital instruments by deducting 10.0% of their book value per year from the amount that qualifies as Additional Tier 1 Capital or Tier 2 Capital. The first deduction occurred on October 1, 2013, and subsequent deductions will take place annually starting January 1, 2014 until January 1, 2022.
The Additional Core Capital requirement is subdivided into three elements: the capital conservation buffer (Adicional de Conservação de Capital Principal), the countercyclical capital buffer (Adicional Contracíclico de Capital Principal) and the higher loss absorbency requirement for domestic systemically important banks (Adicional de Capital Principal Sistêmico). The capital conservation buffer is aimed at increasing the loss absorption ability of financial institutions.
59
The countercyclical capital buffer can be imposed within a range by the Central Bank if it judges that credit growth is increasing systematic risk. The higher loss absorbency requirement for domestic systemically important banks seeks to address the impact that the distress or failure of Brazilian banks may have on the local economy. In the event of non-compliance with the Additional Core Capital requirement, certain restrictions will apply, including the inability of the financial institution to: (i) pay officers and directors their share of variable compensation; (ii) distribute dividends and interest on equity to stockholders; and (iii) repurchase its own shares and effect reductions in its share capital. We are considered domestic systemically important financial institution, hence having to fulfill the 1% Additional Core Capital for higher loss absorbency (Adicional de Capital Principal Sistêmico). The Central Bank’s implementation of the capital adequacy requirements under Basel III was phased-in from 2013 to 2019. In 2020, in response to the economic crisis related to the COVID-19 pandemic, the CMN temporarily eased the capital conservation buffer, which will gradually return to the fully implemented level in April 2022.
Moreover, since October 1, 2018, a minimum LCR in a standardized liquidity stress scenario requirement applies to banks with total assets that are equal or superior to 10% of the Brazilian GDP or to banks with relevant international activity (in such case, regardless of total assets). The calculation of the LCR follows the methodology set forth by the Central Bank which is aligned with the international guidelines. During periods of increased need for liquidity, banks may report a lower LCR than the minimum required ratio, provided that they also report to the Central Bank the causes for not meeting the minimum requirement, the contingent sources of liquidity it has available, and the measures it plans to adopt to be in compliance with the LCR requirement. Since April 1, 2016, banks must also publicly disclose their LCR on a quarterly basis.
The following table sets forth the minimum capital ratios and liquidity coverage ratio requirements under Basel III implemented by the Central Bank, as applicable to Itaú Unibanco Holding on December 31, 2020. The figures presented below refer to the percentage of our risk-weighted assets:
Basel III Requirements
| | | | |
| | | 2020 | |
Common Equity Tier I | | | 4,5% | |
Tier I | | | 6,0% | |
Total Capital | | | 8,0% | |
Additional Capital Buffers (ACP) | | | 2,25% | |
conservation (1) | | | 1,25% | |
countercyclical (2) | | | 0% | |
systemic | | | 1,0% | |
Common Equity Tier I + ACP | | | 6,75% | |
Total Capital + ACP | | | 10,25% | |
Prudential adjustments deductions | | | 100% | |
| | | | |
| (1) | For purposes of calculating the Conservation capital buffer, BACEN Resolution 4,783 establishes, for defined periods, percentages to be applied to the RWA value with a gradual increase until April/22, when it reaches 2.5%. |
| (2) | The countercyclical capital buffer is fixed by the Financial Stability Committee (Comef) based on discussions about the pace of credit expansion, and currently is set zero (BECAN Communication No. 36,830/21). Should the requirement increase, the new percentage takes effect twelve months after the announcement. |
Limit to be observed
| | | | |
| | | 2020(1) | |
Liquidity Coverage Ratio (LCR) | | | 100% | |
| (1) | Mininum requirement valid from 1 January, 2019 onwards. |
Since October 1, 2015, banks are required to prepare public disclosures of their leverage ratios (Razão de Alavancagem, or RA) on a quarterly basis. In November 2017, the CMN established the minimum limit for the Net Stable Funding Ratio (Índice de Liquidez de Longo Prazo, or NSFR) and the Leverage Ratio (Razão de Alavancagem, or RA) to be observed by certain Brazilian Financial institutions, including those classified as Segment 1 pursuant to CMN regulation (such as us — please refer to item “Segmentation for the proportional application of the prudential regulation” for more information), and the terms for compliance with such requirements.
60
The NSFR corresponds to the ratio between the Available Stable Funds (Recursos Estáveis Disponíveis, or ASF) and the Required Stable Funds (Recursos Estáveis Requeridos, or RSF) of the financial institution. This new rule for NSFR, which came into effect on October 1, 2018, determines that the minimum limit for the NSFR for Segment 1 financial institutions is 100%. The RA, which calculation methodology was established by the Central Bank in 2015, consists of the ratio between the sum of the Common Equity Tier 1 Capital and the Additional Tier 1 Capital and the total exposure of the financial institution ascertained as established by the applicable regulation. The RA rule enacted in November 2017 came into effect on January 1, 2018 and determined the threshold of 3% as the minimum requirement for the RA for Segment 1 financial institutions (which is our case).
CMN regulation also defines the entities that compose the consolidated enterprise level (conglomerado prudencial) of Brazilian financial institutions and establishes the requirement that a financial institution prepare and file with the Central Bank monthly consolidated financial statements at the consolidated enterprise level (conglomerado prudencial) pursuant to the parameters defined therein. Such financial statements should also be audited by external auditors on a semi-annual basis. Since January 1, 2015, minimum capital and ratio requirements apply at the consolidated enterprise level (conglomerado prudencial).
Brazilian financial institutions are also required to implement a capital management structure compatible with the nature of their transactions, the complexity of the products and services it offers, as well as with the extent of its exposure to risks. In February 2017, the CMN enacted a rule that unified and expanded Brazilian regulation on risk and capital management. Such regulation provides that risk management must be conducted through an integrated effort by the relevant entity and sets out different structures for risk and capital management, which are applicable for different risk profiles.
According to such regulation, capital management is defined as a process that includes: (i) monitoring and controlling the financial institution’s capital; (ii) assessing capital needs in light of the risks to which the financial institution is subject; and (iii) setting goals and conducting capital planning in order to meet capital needs due to changes in market conditions. Financial institutions should publish a report describing the structure of their capital management at least on an annual basis. Disclosure and reporting of risk management matters, risk-weighted asset calculation, and adequate compliance with regulatory capital requirements are regulated by the Central Bank and reflect the so-called “Pillar 3” of regulatory capital recommended under Basel III, aimed at improving governance and disclosure.
Pillar 3 Report
Since January 1, 2020, the Central Bank requires certain financial institutions to furnish a Pillar 3 Report. We are required to publish this report on a consolidated basis covering the following topics:
| | |
• prudential indicators and risk management; | | • comparison between accounting and prudential information; |
• capital composition; | | • macroprudential indicators; |
• leverage ratio (RA); | | • liquidity indicators; |
• credit risk; | | • counterparty credit risk (CCR); |
• securitization exposures; | | • market risk; |
• risk of interest rate fluctuation in instruments classified in the banking book (IRRBB); and | | • remuneration of administrators. |
The Pillar 3 Report must be furnished on a quarterly, biannual or annual basis, according to the type of information being disclosed.
In addition to the rules issued in accordance with the criteria set forth in Basel III, in July, 2013, Law No. 12,838 was enacted, allowing the determination of deemed credit based on deferred tax assets arising from temporary differences resulting from allowances for loan losses, which, in practice, exempts financial institutions from deducting this type of credit from its core capital. The law also changes the rules for the issue of subordinated debt, requiring the inclusion of clauses for
61
the suspension of the stipulated compensation and the extinction of the credit right or its conversion into shares, and conditions stockholders’ remuneration to compliance with the prudential requirements established by the CMN.
Global Systemically Important Financial Institutions (G-SIFI) Assessment in Brazil
The Central Bank has adopted the same indicators set out by the Basel Committee to determine if Brazilian financial institutions qualify as G-SIFIs. Please see “Basel III Framework,” for further details. This assessment is required of banks with total exposure – the denominator for the leverage ratio – in excess of EUR 200 billion, individually. However, no additional loss absorbency requirements for Brazilian G-SIFIs have been established. We were not included on the latest list of G-SIFIs issued on November 11, 2020, by the Financial Stability Board. The next update is expected in November 2021.
Recovery Plans for Systematically Important Financial Institutions
On June 30, 2016, the CMN issued a rule providing stricter guidelines for recovery plans (Planos de Recuperação) for Brazil’s systemically important financial institutions. The rule which incorporated recommendations from the Financial Stability Board, requires financial institutions to prepare recovery plans that aim to re-establish adequate levels of capital and liquidity and to preserve the viability of such institutions under stress scenarios.
The guidelines require, among other things, that subject financial institutions must identify their critical functions for the National Financial System (Sistema Financeiro Nacional) and their core business lines, monitor indicators and their critical levels, adopt stress-testing scenarios, predict recovery strategies, assess possible risks and barriers related to the strategies and define clear and transparent governance procedures, as well as effective communication plans with key stakeholders. The rule provides for the submission of such recovery plans by December 31st, annually.
Segmentation for the Proportional Application of the Prudential Regulation
On January 30, 2017, the CMN issued a resolution establishing segmentation for financial institutions, financial institution groups and other institutions authorized to operate by the Central Bank for proportional application of the prudential regulation, considering the size, international activity and risk profile of members of each segment. According to such resolution, out of the five possible segments, we are classified as Segment 1, which is composed of universal banks, commercial banks, investment banks, foreign exchange banks and federal saving banks that (a) have a size equivalent or superior to 10% of the Brazilian GDP; or that (b) perform relevant international activities, independently from the magnitude of the institution.
Brazilian Covered Bond (“Letra Imobiliária Garantida” – “LIG”)
Law No. 13,097/2015 created the Brazilian covered bond (Letra Imobiliária Garantida, or LIG), a debt instrument for funding Brazilian financial institutions that follows the covered bonds structure. Since the law’s adoption, both the CMN and the Central Bank have regulated its provisions and established procedures relating to the issuance of Brazilian covered bonds.
Since then, Itaú Unibanco completed two bullet issuances of Brazilian covered bonds, the first on December 14, 2018 in the total amount of R$1.224 billion and the second on April 24, 2019, in the total amount of R$350 million.
On July 24, 2019, Itaú Unibanco established its first Brazilian covered bond program. The first issuance under the covered bond program took place on July 29, 2019, in the total amount of R$1 million. As of December 31, 2020, the accrued value of the outstanding Brazilian covered bonds issued by Itaú Unibanco, which includes the bullet issuances as well as the issuances under the program (as reflected in our financial statements), amounted to R$11,029 million.
Foreign Currency Transactions and Exposure
Transactions involving the sale and purchase of foreign currency in Brazil may only be conducted by institutions authorized to do so by the Central Bank. There are no limits for long or short positions in foreign currency for banks authorized to carry out transactions on the foreign exchange market. Currently there is no compulsory deposit requirement rate on the foreign currency short position held by financial institutions.
62
In accordance with CMN regulation, financial institutions in Brazil may raise funds abroad, either through direct loans or through the issuance of debt securities. Funds raised accordingly may be freely invested in Brazil, including but not limited to on-lending to Brazilian companies and financial institutions. Brazilian banks authorized to operate in foreign currency markets which hold regulatory capital higher than R$5 billion may also use these funds to grant loans abroad to Brazilian companies, their offshore subsidiaries and to foreign companies controlled by Brazilians or to acquire securities issued or guaranteed by such companies in the primary market. Cross-border loans, in which one party is in Brazil and the other party is abroad, require previous registration with the Central Bank, which may establish limits on the conditions of such foreign currency loan transactions. Please see “Item 10E. Taxation” for further details about tax on foreign exchange transactions.
Financial institutions may also grant loans in or indexed to a foreign currency to their clients’ trade-related activities, such as by granting advances on foreign exchange contracts (Adiantamento sobre Contrato de Câmbio), advances on delivered export register (Adiantamento sobre Cambiais Entregues) or export or import prepayment agreements (Pré-Pagamento de Exportação e Financiamento à Importação), all in accordance with Brazilian regulations on foreign exchange markets and international capital flows.
The Central Bank and the Brazilian government frequently change rules and regulations applicable to foreign currency borrowing and loans in accordance with the economic scenario and Brazilian monetary policy.
In addition, the legislation sets forth that the total exposure in gold and other assets and liabilities indexed or linked to the foreign exchange rate variation undertaken by financial institutions (including their offshore branches), and their direct and indirect subsidiaries, on a consolidated basis, may not exceed 30.0% of their regulatory capital.
New Foreign Exchange Bill Approved by the Brazilian House of Representatives
By initiative of the Central Bank, the President of Brazil has presented to the Congress a draft bill to reformulate the Brazilian foreign exchange market (“New Foreign Exchange Bill”). The draft also includes provisions regarding the Brazilian capital held abroad and foreign capital held in Brazil. The initiative intends to modernize, simplify and increase legal certainty associated with the current regulatory framework for Brazilian foreign exchange legislation.
The main aspects of the New Foreign Exchange Bill are: (i) the confirmation, at the legal level, that foreign exchange transactions may be carried out freely (provided that through entities authorized to operate in this market and subject to applicable rules); (ii) the granting of broad powers to the CMN and the Central Bank to regulate the foreign exchange market and its operations; (iii) the expansion of the international correspondence activity of Brazilian banks; (iv) the possibility of Brazilian banking institutions to invest and lend abroad funds raised in Brazil or abroad; (v) the exclusion of foreign currency purchase and sale operations of up to US$1,000 carried out between individuals on an occasional and non-professional basis, from its scope; and (vi) the granting of powers to the monetary authorities to establish situations in which the prohibition of private offsetting of credits between residents and nonresidents, as well as the payment in foreign currency in Brazil, would not apply.
On December 22, 2020, the Brazilian House of Representatives approved the draft of the New Foreign Exchange Bill. The House voted on many motions by representatives for amendment or redaction of specific sections of the New Foreign Exchange Bill on February 10, 2021 with no material alterations to the proposal. Considering the approval by the Brazilian House of Representatives, the bill will be sent to the Brazilian Senate for approval. As of this date, it is not possible to estimate if and when it will be approved by the Brazilian Senate, or which changes (if any) will be approved by the Senate.
Central Bank Launches Public Consultation to Improve Foreign Exchange Regulations
The Central Bank launched Public Consultation No. 079/2020, which contains a proposal to improve foreign exchange regulations in the context of technological innovations and new business models related to international payments and transfers.
63
The improvements considered recent developments related to international payments and transfers, advancing competition, financial inclusion and innovation in the sector within the possibilities allowed by the current legal framework. According to the Central Bank, the structural innovations in the Brazilian foreign exchange market can only be implemented after updating the legal framework of the foreign exchange market through the approval of the New Foreign Exchange Bill.
The proposal seeks to expand competition in the segment of remittances, provide better services and facilitate the execution of these transactions. It also aims to significantly improve the domestic payments market and foster the use by the public of payment accounts by bringing such alternatives to the foreign exchange market.
In this sense, the proposal includes the following measures: (i) allowing payment institutions authorized to operate by the Central Bank to require authorization to operate in the foreign exchange market for the intermediation of certain operations and limited to USD100 thousand per transaction; and (ii) regulating the use of prepaid payment accounts held by Brazilians residing, domiciled or headquartered abroad, to be maintained at an institution authorized to operate in the foreign exchange market.
The proposal also consolidates and modernizes the regulation of international payment or transfer services in the foreign exchange market, providing uniform treatment for the acquisition of goods and services carried out with the participation of issuers of payment instruments for international use, international payment facilitators and intermediaries and representatives in international purchases. The provider of such services would now be referred to in the exchange regulations by the term eFX.
Large Exposure Limits
We are legally prevented from granting loans or advances, and guarantees, including derivative transactions, underwriting or holding in our investment portfolio securities of any clients or group of affiliated clients that, in the aggregate, exceeds the threshold determined by the Central Bank. On July 31, 2018 the CMN released a resolution in order to comply with the Basel III reforms, introducing a new basis for calculating the exposure limits applicable to financial institutions classified as Segment 1 to their Tier 1 Regulatory Capital and increasing the scope of transactions that increase exposure to clients subject to the limit, including exposure from securities and derivatives held in our investment portfolio. The maximum exposure to any individual counterparty or group of connected counterparties of a Segment 1 financial institution is 25% of its Tier 1 Regulatory Capital, and to concentrated individual clients or group of connected clients of such Segment 1 financial institution is 600% of its Tier 1 Regulatory Capital (a concentrated individual client means, for the purpose of the rule, any one client to which exposure is equal to or higher than 10% of its Tier 1 Regulatory Capital).
Under this exposure limits, the following entities are considered to be different clients: (i) the Brazilian government, including the Central Bank; (ii) an entity which 50% or more of its voting capital is held directly by the Brazilian Government, jointly with its controlled entities; (iii) a State of the Federative Republic of Brazil or the Federal District, jointly with its controlled entities and with entities which are financially dependent on a State, the Federal District or their controlled entities; (iv) each Brazilian municipal district, jointly with its controlled entities and with entities which are financially dependent on a municipality or its controlled entities; (v) each central government of a foreign jurisdiction; (vi) each central bank of a foreign jurisdiction, if this entity is not included in the central government; (vii) each entity which 50% or more of its voting capital is held directly by a central government of a foreign jurisdiction, jointly with its controlled entities and with entities that are financially dependent on it; (viii) a governmental body of a foreign jurisdiction, jointly with its controlled entities and with entities that are financially dependent on it or its controlled entities; and (ix) any other entity, public or private, which share the credit risk calculated by the financial institution according to CMN regulations.
The rule provides that, for certain financial institutions (including those classified as Segment 1, which is our segment), individual exposures to the Brazilian Federal Union (including the Brazilian Central Bank) as well as to central governments or to central banks of foreign jurisdictions are not subject to the observance of the large exposure limits.
Banks must identify possible related counterparties, considering its economic interdependence in all cases where the sum of all exposures to one specific counterparty exceeds 5% of the eligible capital base. Two or more counterparties have an economic interdependence relationship whenever one experiences financial difficulties and the other, as a result, would also be likely to encounter financial difficulties, including those related to funding, payment of obligations and insolvency.
64
Counterparties identified as economically interdependent must be treated as a single counterparty that is subject to the aforementioned requirements.
Risk Weighted Asset Calculation
The calculation of risk exposure is based on several factors set forth by the Central Bank regulations and impacts the capital requirements. The components take into consideration the type of risk and include the parameters and procedures for calculation of the risk weighted asset, or RWA, to determine the capital requirements resulting from each risk exposure. The Central Bank has been frequently changing and updating the rules and regulations for the RWA calculation.
Financial Bills (“Letras Financeiras”)
According to Law No. 12,249 of June11, 2010, as amended, Brazilian financial institutions can issue financial bills (letras financeiras), a debt funding instrument for financial institution aimed at larger volumes and longer terms. The regulatory framework for financial bills permits financial institutions to issue such instruments with subordination clauses as Basel III-compliant. As per the CMN Resolutions Nos. 4,733 of 2019 and 4,192 of 2013, the main characteristics of Basel III-compliant financial bills are:
| | • | | The possibility of issuance of financial bills convertible into equity. The conversion may not be requested by the investor or the issuer financial institution; |
| | • | | The suspension of interest payments in case of non-compliance with capital requirements. Additionally, in order to preserve the regular functioning of the Brazilian financial system, the Central Bank may determine that financial bills be converted into equity or be written-off. These determinations will not be considered as a default by financial institutions and will not accelerate the maturity of its other debts; |
| | • | | The possibility of issuance of perpetual financial bills, which will only mature in case of default on interest payments or at the time of the dissolution of the financial institution; and |
| | • | | The possibility of a broad authorization for the use of funds raised by the issuance of financial bills in the composition of the issuer’s Regulatory Capital (such authorization is pending Central Bank’s regulation). |
In addition, CMN Resolution 4,733 of 2019 establishes important provisions for the issuance of financial bills such as:
| | • | | Certain due diligence obligations to be observed by the issuer or any intermediary institutions involved in the distribution, placement and trading of the financial bills, in order to ensure the provision of information regarding the investment and its suitability to the investor’s profile; and |
| | • | | The flexibilization of the rates that can be used for the remuneration of financial bills, allowing the use of floating rates regardless of a combination with a fixed rate or any other rate (fixed or floating) that is publicly known and regularly calculated. |
On September 24, 2019, the Central Bank issued Circular 3,963, a rule systematizing the requirements for the registration of financial bills in authorized central depositary entities, which were previously dispersed in different documents. The new rule establishes in its annexes the content of the subordination clauses that must be included in financial bills issued to compose the issuer’s Regulatory Capital.
Establishment of a Succession Policy
Financial institutions and other institutions authorized to operate by the Central Bank are required to maintain a succession policy for its management, which shall cover recruiting, promotion, election and retention processes, based on rules that regulate the identification, evaluation and training of senior management positions.
Our Board of Directors approved our Manager’s Succession Policy in accordance with CMN’s resolution. Our succession policy aims to consolidate the internal procedures and practices of the Itaú Unibanco Group regarding the succession of our management team.
Code of Corporate Governance
65
The Brazilian Corporate Governance Code for publicly-held companies (Código Brasileiro de Governança Corporativa – Companhias Abertas) sets forth corporate governance-related principles, guidelines and actions applicable to publicly-held companies and determines that companies adopt the “apply or explain” model in respect of its principles, guidelines and actions. Pursuant to this code, companies must furnish to CVM a report regarding their adherence to the Brazilian Corporate Governance Code within seven months of the closing date of the fiscal year. The implementation of the Corporate Governance Code was integrated in the local regulatory framework by means of the CVM Ruling No. 586/17.
In addition, the CMN has included the principles and criteria of corporate governance of financial institutions established by the Basel Committee into the Brazilian regulatory framework, through the “Core Principles for Effective Banking Supervision.”
CMN rules establish the terms for the remittance of information on the management of financial institutions to the Central Bank, controlling group and relevant shareholders, including the obligation to communicate to the regulator any information that may affect the reputation of any person classified in one of such categories. For this purpose, financial institutions must provide a communication channel which allows employees, contributors, clients, users, associates, or services providers to anonymously report situations indicating illegal acts of any nature related to the institution. The financial institutions must also determine the internal body responsible for receiving the information and complying with the reporting obligations.
Anti-Corruption Law
The Brazilian anti-corruption law establishes that legal entities will have strict liability (regardless of fault or willful misconduct) if they are involved in any form of bribery. The law also encompasses other injurious acts contrary to the Brazilian or foreign public administration, including bid rigging and obstruction of justice. The law provides for heavy penalties, both through administrative and judicial proceedings including determination of dissolution of a company, prohibition against undertaking to finance with public entities and prohibition against participating in public biddings.
In addition, the law authorizes the public administrative authorities responsible for the investigation to enter into leniency agreements. The self-disclosure of violations and cooperation by legal entities may result in the reduction of fines and other sanctions.
The regulation also provides parameters for the application of the anti-corruption law, including with respect to penalties and compliance programs. Please refer:
| | (i) | Our Anti-corruption Corporate Policy is available on our Investor Relations website. |
| | (ii) | Our Corporate Conduct, Integrity and Ethics Policy is available on our Investor Relations website, from which you can electronically access further details about our Integrity and Ethics Program and guidelines for situations of conflicts of interests. |
| | (iii) | We also have a webpage dedicated to Integrity and Ethics in our Investor Relations website, from which you can access further details about our Integrity and Ethics Program. |
Compensation of Directors and Officers of Financial Institutions
According to rules set forth by the CMN, Brazilian financial institutions are required to have a compensation policy. If variable compensation is to be paid to management, at least 50% of the total compensation should be paid in shares or share-based instruments and at least 40% of the total compensation should be deferred for future payment for at least three years. If the institution records a significant decrease in the realized recurring profit or a negative result during the deferral period, the deferred and unpaid portions of the compensation should be reversed proportionally to the decrease in result, in order to minimize the loss incurred by the financial institutions and their stockholders.
Our compensation policy, applicable to directors and officers in Brazil (constituting the major part of the management population of the Itaú Unibanco Group), complies with CMN’s regulatory requirements. Our compensation
66
principles and practices worldwide comply with each local regulation and seek to increase alignment between the interests of our stockholders and our management.
For further information, see “Item 6B—Compensation.”
Antitrust Regulation
The Brazilian Antitrust Law requires that transactions resulting in economic concentration should be submitted to CADE, the Brazilian antitrust authority, for prior approval in the event these transactions meet the following criteria: (i) the economic group of any of the parties to a transaction recorded, in the fiscal year prior to that of the transaction, minimum gross revenues of R$750 million; and (ii) at least one of the other economic groups involved in the transaction recorded, for the same time period, minimum gross revenues of R$75 million.
The closing of a transaction prior to CADE’s approval subjects the parties to fines ranging from R$60,000 to R$60 million, the nullity of the relevant agreement, and potential administrative proceedings.
In addition to submitting such transactions to CADE’s approval, financial institutions are required by Circular No. 3,590/2012 of the Central Bank (updated by Circular No. 3,800/2016) to submit to the Central Bank’s antitrust approval any concentration acts involving two or more financial institutions authorized to operate by the Central Bank in the following cases: (i) acquisition of corporate control, (ii) a merger, (iii) transfer of the business to another financial institution, and (iv) contracts or legal entities, aimed at cooperation in the financial sector; (v) acquisition of a minority stake of at least 5% of the voting shares of a financial institution.
It is worth mentioning that legislations in force in other jurisdictions may require that concentration acts be submitted to the relevant antitrust authority.
The Brazilian antitrust law provides for penalties in the event of violations of the economic order. Accordingly, an undertaking in a dominant position (as the law assumes of one holding over 20% interest) in a certain market in which it operates, which, irrespective thereof, carries out an illegal interaction with competitors, including through professional associations, may be subject to an administrative fine of 0.1% to 20% of the gross revenues of the group operating in the industry affected by such violation and to the divestiture of assets, among other penalties. Additionally, the antitrust legislation of other jurisdictions, such as the U.S. (Sherman Act and Clayton Antitrust Act) and the European (Articles 101 and 102 of the Treaty on the Functioning of the European Union), may also be applicable to companies whenever these carry out alleged anticompetitive practices with effects in the aforementioned jurisdictions.
Our Antitrust Corporate Policy is available on our Investors Relations website.
Treatment of Past Due Debts
Brazilian financial institutions are required to classify their credit transactions (including leasing transactions and other transactions characterized as credit advances) at different levels and recognize provisions according to the level attributed to each such transaction. The classification is based on the financial condition of the clients the terms and conditions of the transaction and the period of time during which the transaction is past due, if any. For purposes of Central Bank requirements, transactions are classified as level AA, A, B, C, D, E, F, G or H, with AA being the highest classification. Credit classifications must be reviewed on a monthly basis and, apart from additional provisions required by the Central Bank which are deemed necessary by the management of financial institutions, each level has a specific allowance percentage that is applied to it and which we use to calculate our allowance for loan losses, as specified in more detail in the table below:
| | | | | | | | | | | | | | | | | | |
Classification (1) | | AA | | A | | B | | C | | D | | E | | F | | G | | H |
Allowance (%) | | 0 | | 0.5 | | 1 | | 3 | | 10 | | 30 | | 50 | | 70 | | 100 |
Past due (in days) | | — | | — | | 15 to 30 | | 31 to 60 | | 61 to 90 | | 91 to 120 | | 121 to 150 | | 151 to 180 | | Over 180 |
| (1) | Our credit classification also takes into account the client’s credit profile, which may negatively impact the past due classification. |
67
Under IFRS, as issued by the IASB, the allowance for loan losses is based on our internally developed incurred loss models, which calculate the allowance for loan losses by multiplying the probability of default by the clients or counterparty, or PD, by the potential for recovery on defaulted credits (LGD) for each transaction, as described in Note 2.4(d) I – Classification and Measurement of Financial Assets and Note 32 Risk and Capital Management, our audited consolidated financial statements. The risk levels are categorized as:
Lower risk: PD lower or equal than 4.44%
Satisfactory: PD from 4.44% up to 25.95%
Higher risk: PD higher than 25.95%
Credit-Impaired: loans classified in Stage 3
Bank insolvency
The insolvency of financial institutions is handled pursuant to applicable laws and regulations by the Central Bank, which initiates and monitors all applicable administrative proceedings. There are three types of special regimes that may be imposed to either privately-held financial institutions or state-owned (other than federal government-owned) financial institutions or similar institutions:
| | |
| (i) Temporary special administration regime or RAET: | | a less severe special regime with limited duration which allows financial institutions to continue to operate – the whole management loses its offices and is replaced by a steering committee appointed by the Central Bank with broad management powers, which will adopt of measures aimed at the resumption of the financial institution’s regular activities. If resumption is not possible, this regime may be turned into an extrajudicial liquidation. |
| (ii) Intervention: | | a time-limited regime in which the Central Bank appoints an intervenor that takes charge of the financial institution’s management, suspending its regular activities and dismissing the financial institution’s management, with the main purpose of preventing the continuation of certain irregularities and the aggravation of the financial situation of the financial institution, which can put assets at risk and harm the financial institution’s creditors – it suspends all actions related to payment obligations of the financial institution, prevents the early settlement or maturity of its obligations and freezes pre-existing deposits. |
| (iii) Extrajudicial liquidation: | | process of dissolution of the company in cases of unrecoverable insolvency or severe violations of the rules that regulate a financial institution’s activities. The extrajudicial liquidation aims at promoting the liquidation of the existing assets for the payment of creditors, with the return of any amounts left to stockholders. Controlling stockholders may be held responsible for remaining liabilities. |
In the course of the special regimes described above, the steering committee, the intervenor, and the liquidator may, when authorized by the Central Bank: (i) dispose of assets and rights of the financial institution to third parties and (ii) proceed with corporate restructuring processes in the financial institution or its subsidiaries, among other possible measures of similar effect.
68
Financial institutions may also be subject to the bankruptcy regime.
On December 24, 2020, the President of Brazil sanctioned Law 14,112 (“Law 14,112”), which overhauls the current Brazilian Bankruptcy and Reorganization Law (Law 11,101/05) in several material aspects. Law 14,112 will enter into effect on January 23, 2021. It is possible that certain changes will potentially affect material matters concerning enforcement and priority rankings, such as: (i) the possibility of creditors putting forward an alternative judicial reorganization plan; (ii) new rules on the approval of post-petition loans in judicial reorganization and on priority claims in case of conversion to bankruptcy liquidation; (iii) more flexible quorum and mechanics of the extrajudicial reorganization process; (iv) new rules to expedite the bankruptcy liquidation process; (v) new methods for restructuring of the debtor’s tax liabilities and installment payments, as well as new taxation schemes; and (vi) incorporation of rules on cross-border insolvency proceedings into the Brazilian framework.
Law 14,112 replicates, with some adjustments, the provisions of the UNCITRAL Model Law on Cross-Border Insolvency. As a result, Law 14,112 sets out some rules on access of foreign representatives to courts in Brazil, the method and requirements for recognition of foreign main and ancillary proceedings, authorization for the debtor and his representatives to act in other countries, methods of communication and cooperation between foreign authorities and representatives and the Brazilian jurisdiction, and the processing of concurrent proceedings.
Law 14,112 also sets forth, among other measures, (i) a protection for creditors that agree on the conversion of debt into equity against potential transfer of liability with regard to the debtor’s obligations; (ii) the stay period and constraints on the assets of the debtor under judicial reorganization; (iii) conciliation and mediation measures before and during judicial reorganization proceedings; and (iv) the rules on procedural and substantive consolidation. Law 14,112 also sets out that a bankruptcy decree does not reach beyond the bankrupt itself, save when the disregard doctrine is to apply.
Deposit Insurance
In the event of intervention, extrajudicial liquidation or liquidation of a financial institution in a bankruptcy proceeding, the Credit Insurance Fund, or FGC, a deposit insurance system, guarantees the maximum amount of R$250,000 for certain deposits and credit instruments held by an individual, a company or another legal entity with a financial institution (or financial institutions of the same economic group). Such deposits and credit instruments contracted as of December 22, 2017, are subject to an additional limit: the total coverage of the referred guarantee is R$1,000,000 per investor regardless of the number of accounts held in different financial groups and such limit is valid for a period of four years. The resources of the FGC come primarily from mandatory contributions from all Brazilian financial institutions that receive deposits from clients, currently at a monthly rate of 0.01% of the amount of the balances of accounts corresponding to the financial instruments that are the subject matter of the ordinary guarantee, even if the related credits are not fully covered by FGC, and certain special contributions. Deposits and funds raised abroad are not guaranteed by the FGC. Credits of financial institutions and other institutions authorized to operate by the Central Bank, complementary welfare entities, insurance companies, capitalization companies, investment clubs and investment funds, as well as those representing any interest in or financial instrument held by such entities, are not protected by the ordinary guarantee of FGC.
Payment of Creditors in Liquidation
In the event of extrajudicial liquidation of a financial institution or liquidation of a financial institution in a bankruptcy proceeding, the salaries of employees and the related labor claims up to a certain amount, secured credits and tax charges have priority in any claims against the entity in liquidation. The payment of unsecured credits, including deposits from regular retail clients that are not guaranteed by the FGC, is subject to the prior payment of preferred credits. Additionally, upon the payment of the deposits guaranteed by the FGC, the FGC becomes an unsecured creditor of the estate in liquidation.
Insurance Regulation
With governmental approval, insurance companies in Brazil may offer all types of insurance (except for workers’ compensation insurance) directly to clients or through qualified brokers.
Insurance companies must set aside reserves to be invested in specific types of securities. As a result, insurance companies are among the main investors in the Brazilian securities market and subject to CMN regulations regarding the investment of technical reserves.
69
In the event an insurance company is declared bankrupt, the insurance company will be subject to a special procedure administered by SUSEP or by ANS. If an insurance company is declared bankrupt and (i) its assets are not sufficient to guarantee at least half of the unsecured credits or (ii) procedures relating to acts that may be considered bankruptcy-related crimes are in place, the insurance company will be subject to ordinary bankruptcy procedures.
There is currently no restriction on foreign investments in insurance companies in Brazil.
Brazilian legislation establishes that insurance companies must buy reinsurance to the extent their liabilities exceed their technical limits under the rules of the regulatory bodies (CNSP and SUSEP), and reinsurance contracts may be entered into through a direct negotiation between the insurance and reinsurance companies or through a reinsurance broker authorized to operate in Brazil.
Anti-Money Laundering Regulation
The Brazilian anti-money laundering law (Law No. 9,613, as amended) establishes the basic framework to prevent and punish money laundering as a crime. It prohibits the concealment or dissimulation of origin, location, availability, handling or ownership of assets, rights or financial resources directly or indirectly originated from crimes, subjecting the agents of these illegal practices to imprisonment, temporary disqualification from managing enterprises for up to ten years and monetary fines.
The Brazilian anti-money laundering law also created the Council for Financial Activities Control (COAF), which is subordinated to the Central Bank and performs a key role in the Brazilian system of preventing and combating money laundering, financing of terrorism and the proliferation of weapons of mass destruction.
In compliance with the Brazilian anti-money laundering law and related regulations enacted by the Central Bank, including the rules applicable to procedures that must be adopted by financial institutions to prevent and combat money laundering and terrorism financing, as well as in response to the recommendation of Financial Action Task Force (FATF) and United Nations Security Council (UNSC), financial institutions in Brazil must establish internal control and procedures aiming at:
| | • | | identifying and knowing their clients, which includes determining if they are PEPs, and also identifying Ultimate Beneficial Owners (UBOs). These records should be kept up-to-date; |
| | • | | checking the origin of funds of a client, as well as the compatibility between the movement of its funds and its economic and financial capacity; |
| | • | | carrying out a prior analysis of new products and services, including the use of new technologies, if applicable, under the perspective of money laundering prevention; |
| | • | | keeping records of all transactions carried out or financial services provided on behalf of a certain client or for that client; |
| | • | | reporting to COAF, within one business day, any transaction deemed to be suspicious by the financial institution, as well as all transactions in cash equivalent to or higher than R$50,000, without informing the involved person or any third party; |
| | • | | applying special attention to (i) unusual transactions or proposed transactions with no apparent economic or legal bases; (ii) transactions involving PEPs, (iii) indication of evading client identification and transaction registering procedures; (iv) clients and transactions for which the UBO cannot be identified; (v) transactions originated from or destined to countries that do not fully comply with the recommendations of the FATF; and (vi) situations in which it is not possible to keep the clients’ identification records duly updated; |
| | • | | determining criteria for hiring personnel and offering anti-money laundering training for employees; |
| | • | | establishing procedures to be complied with by all branches and subsidiaries of Brazilian financial institutions located abroad with respect to anti-money laundering; |
| | • | | establishing that any institutions authorized to operate in the Brazilian foreign exchange market with financial institutions located abroad, must verify whether the foreign financial institution is physically located in the jurisdiction where it was incorporated and licensed, and that it is subject to effective supervision; |
| | • | | monitoring transactions and situations which could be considered suspicious for anti-money laundering purposes; |
70
| | • | | reporting to COAF the occurrence of suspicious transactions, as required under applicable regulations, and also, at least once a year, whether or not suspicious transactions are verified, in order to certify the non-occurrence of transactions subject to reporting to COAF (negative report); |
| | • | | requiring clients to inform the financial institution, at least three business days in advance, of their intention to withdraw amounts equal to or exceeding R$50,000; |
| | • | | maintaining specific records of all operations carried out, products and services contracted by financial institutions, including deposit, contribution, withdrawal, payments, receipts and transfers of funds; |
| | • | | ensuring that policies, procedures and internal controls are commensurate with its size and volume of transactions; and |
| | • | | unavailability, without delay, of goods, values and rights of possession or ownership and all other rights, real or personal, owned, directly or indirectly, of natural or legal persons subject to sanctions by the resolutions of the UNSC. |
Non-compliance with any of the obligations above subjects the financial institution and its officers to penalties ranging from: (i) formal notice, (ii) fines (from 1.0% to 200.0% of the amount of the transaction, 200.0% of the profit generated thereby, or a fine of up to R$20,000,000), (iii) rendering executive officers ineligible for holding any management position in financial institutions, to (iv) the cancellation of the financial institution’s license to operate.
Central Bank Circular No. 3,978 of 2020, which came into force on October 1, 2020, also requires that financial institutions maintain Anti-Money Laundering Program (in compliance with regulatory standards) and conduct periodic Internal Risk Assessments.
Politically Exposed Persons (PEPs)
According to the Central Bank, PEPs are public agents who hold or have held a relevant public position, as well as their representatives, family members or other close associates, over the past five years, in Brazil or other countries, territories and foreign jurisdictions. It also includes their legal entities. Financial institutions must develop and implement internal procedures to identify PEPs and obtain higher level of approval than the person responsible for contracting, according to Risk-Based Approach, prior to establishing any relationship with those individuals. They should also adopt reinforced and continuous surveillance actions regarding transactions with PEPs and report all suspicious transactions to COAF.
Leasing Regulation
Although leasing transactions are not classified as credit transactions under Brazilian legislation, the Central Bank regulates and oversees leasing transactions. The parties involved in a leasing transaction are the “lessor” (the bank) and “lessee” (our client). The leased asset, owned by the lessor, is delivered to be used by the lessee until the end of the contract, when the lessee may opt to either acquire it or return it to the lessor or renew the contract for a new period.
Brazilian legislation establishes a specific methodology to account for the profits or losses in leasing transactions and all information that should be included in a lease agreement. The guaranteed residual amount paid by a lessee should correspond to a minimum return required for the transaction to be viable for the lessor, whether the purchase option is exercised or not. The laws and regulations applicable to financial institutions, such as those related to reporting requirements, capital adequacy and leverage, assets composition limits and allowance for losses, are also generally applicable to leasing companies.
Correspondent Agents
We may engage other entities to provide certain services to our clients, including customer service. These entities are generally called correspondents, and our relationship with correspondents is regulated by the Central Bank. Among other requirements, the Central Bank establishes that employees of all correspondent agents must hold a technical certification authorizing them to serve customers involved in credit and leasing operations.
71
Regulation of the Brazilian Securities Market
According to the Brazilian Corporate Law, a company is considered publicly-traded or closely-held depending on whether the securities issued by it are accepted for trading in the securities market or not. All publicly-held companies, such as our company, are registered with the CVM, are subject to specific regulations and are also subject to information disclosure and reporting requirements.
Disclosure Requirements
Under CVM rules, publicly-traded companies are subject to disclosure requirements and rules governing the use of material information. Any decision that may reasonably influence the price of the securities issued by a publicly-held company or the decision of investors to buy, sell, or hold these securities, is considered material.
The CVM improved the quality of the information that must be presented in periodic filings by securities issuers by requiring such issuers to file a “Reference Form” with the CVM. This form was modeled after IOSCO’s shelf registration system in gathering all of the issuer’s information in a single document.
Since 2018, the publicly-held companies, like us, have to present a form about a “Brazilian Corporate Governance Code” in the “apply or explain” format.
Asset Management Regulation
The Brazilian asset management regulation requires a previous registration with the CVM to perform the services of portfolio management and fund administration.
Itaú Unibanco Group provides several services in the capital markets and, in particular, performs activities related to fund administration and portfolio management under CVM registration and in accordance with CVM regulation.
By providing these services, our entities engaged in the asset management business can be held civilly and administratively liable in certain circumstances for losses arising from either intentional acts or negligence in conducting their activities.
The CVM has regulatory powers to oversee these activities, including powers to impose fines and other sanctions on registered asset managers.
Investments of Foreign Investors
Individuals or legal entities domiciled outside Brazil may invest in companies or other assets in Brazilian financial and capital markets, subject to the restrictions and requirements set forth in the local regulation. All foreign investments in Brazil shall be registered with the Central Bank and/or CVM, depending on the type of the investment.
The foreign direct investment (RDE-IED) enables the non-resident investors to hold stock of companies in Brazil, whereas the portfolio investment (RDE – Portfolio) entitles the investment in almost all financial assets and transactions available in the Brazilian financial and capital markets, being subject to some restrictions set forth in Brazilian regulation.
In order to invest in the Brazilian financial and capital markets, investors non-resident in Brazil must engage a financial institution authorized to act as legal representative and, unless the investor is a natural person, a custodian of their investments in Brazil. Such investments are regulated by Resolution CMN 4,373/14 and Resolution CVM 13/20. The transactions performed by foreign investors must be carried out in the markets organized by entities authorized by CVM (such as B3, for example) and securities must be held in custody with depositary and registration systems authorized by CVM and/or Central Bank (such as SELIC and CETIP). The rules establish certain exceptions which allow transactions outside of the organized markets such as subscription of securities in initial public offerings, tender offerings of securities and payment of dividends in kind.
72
Brazilian rules also allow the issuance abroad of depositary receipts based on (i) any security issued by Brazilian publicly owned companies, (ii) credit instruments issued by financial institutions and other types of publicly owned institutions authorized by the Central Bank of Brazil, and eligible to be included in the financial institution’s regulatory capital (Patrimônio de Referência), and (iii) Letras Imobiliárias Garantidas, which are a type of real estate note issued in the Brazilian market.
Regulatory Sandbox
On October 26, 2020, the CMN and the Central Bank of Brazil (“BCB”) published CMN Resolution No. 4,865/2020 and BCB Resolution No. 29/2020, both regarding Controlled Testing Environment for Financial Innovations (“Sandbox”), which is intended to allow businesses, including institutions that are not yet authorized to operate by the Central Bank, to test innovative projects related to matters under the supervision of the CMN or the Central Bank with real consumers. CMN Resolution 4,865/2020 and BCB Resolution 29/2020 came into effect on December 1, 2020.
The specific rules of the first cycle such as duration period and number of participants, necessary documentation, criteria for the classification of institutions and the schedule of the registration, selection and authorization processes of such entities were published on December 16, 2020 and is expected to start in the second half of 2021.
The Central Bank approved on December 15, 2020, through BCB Resolution No. 50 of December 16, 2020 (“Resolution 50/20”), the rules applicable to the first cycle of its Regulatory Sandbox, scheduled to begin in the first semester of 2021.
Resolution 50/20 sets forth that the participants of the first cycle must register between February 22 and March 19, 2021, and 10 to 15 projects will be selected from among those enrolled. The selection and authorization of registered participants will take place between March 22 and June 25, 2021, and may be extended by a maximum of 90 days, depending on the number of registrants.
The topics chosen by the Central Bank as priorities and which will be considered in the selection of projects include:
| | • | | Solutions for the foreign exchange market; |
| | • | | Development of capital markets through synergy mechanisms with the credit market; |
| | • | | Stimulus of credit to microentrepreneurs and small businesses; |
| | • | | Open Banking Solutions; |
| | • | | Solutions for the rural credit market; |
| | • | | Solutions for increasing competition in National Financial System and Brazilian Payments System; |
| | • | | Financial and payment solutions with potential effects of stimulating financial inclusion; and |
| | • | | Fostering of sustainable finance. |
Open Banking
The Brazilian Central Bank announced the initial guidelines for open banking regulation in Brazil through Notice No. 33,455 on April 25, 2019. Open Banking consists in the sharing of data and payment initiation services by financial institutions and other authorized entities, upon customer’s authorization and via integration of information systems. The Central Bank has looked at open banking as an important tool for innovation in the financial market, making the banking industry more efficient and competitive.
The Brazilian open banking model will comprise financial institutions, payment institutions and other Central Bank-licensed entities by making it possible to share, in a phased-in approach, data on products and services, customer record data and customer transaction data. Open banking will eventually cover the provision of initiation payment services.
On November 28, 2019, the Brazilian Central Bank launched Public Consultation No. 73/2019, which disclosed the draft resolution to implement open banking in Brazil to the public. Among other topics, the draft resolution sets forth in detail
73
the participating institutions (mandatory and voluntary), the data and services covered, the requirements for sharing, the responsibilities for sharing, the implementation schedule and the convention to be concluded between the participating institutions. The period for commenting the Public Consultation ended on January 31, 2020 and the Brazilian Central Bank received contributions form market agents.
On May, 4, 2020, a regulation was published by the Central Bank and CMN (Joint Resolution No. 1/2020) and enables the sharing of registration and transactional data from individuals or legal entities through a secure, prompt, accurate and convenient manner — at the customers’ discretion, in the case of data and services that identifies the customer. It is an important step in the process of digitizing the financial system, creating an environment conducive to the emergence of new solutions for inclusive, competitive, safe and suitable provision of financial services.
The open banking in Brazil will be implemented gradually, from February 2021 to December 2021, pursuant to the new dates established by the Joint Resolution No. 1/2020 (as amended by Joint Resolution No. 2/2020):
Stage I – as of February 2021: public access to information from participating institutions regarding their customer service channels and their products and services related to demand deposit or savings accounts, payment accounts or credit transactions;
Stage II – up to July 15, 2021: sharing of customers’ or their representatives’ registry information, and the customers’ transactional data related to products and services listed in Stage I;
Stage III – up to August 30, 2021: sharing of services of initiating payment transactions and forwarding loan proposals; and
Stage IV – up to December 15, 2021: expansion of the scope of covered data, in order to include foreign exchange operations, investments, insurance, and open pension funds, among other financial products.
Regulation on Payment Agents and Payment Arrangements
A Brazilian law enacted in October 2013 establishes the legal framework for “payment arrangements” (i.e. the set of rules governing a payment scheme, such as a credit or debit card transaction), and “payment agents” (i.e., any agent that issues a payment instrument or acquires a merchant for payment acceptance), which became part of the Brazilian Payments System and subject to oversight by the Central Bank. Payment agents, in spite of being regulated by the Central Bank, are not deemed to be financial institutions and are prohibited from engaging in activities that are exclusive of financial institutions.
The CMN and the Central Bank published rules in November 2013 regulating payment arrangements and payment agents. This regulation establishes, among other matters: (i) consumer protection and anti-money laundering compliance and loss prevention rules that should be followed by all entities supervised by the Central Bank when acting as payment agents and payment arrangers; (ii) the procedures for the incorporation, organization, authorization and operation of payment agents, as well for the transfer of control, subject to the Central Bank’s prior approval; (iii) capital requirements; (iv) definition of arrangements excluded from the Brazilian Payments System; (v) payment accounts, which are divided into prepaid and post-paid accounts; and (vi) a liquidity requirement for prepaid accounts that demands the allocation of their balance to a special account at the Central Bank or to be invested in government bonds, starting at 20% in 2014 and rising gradually up to the totality of the total account balance in 2019.
In October 2015, a regulation was published by the Central Bank regulating limitations on closed payment arrangements, the concept of domicile institution, the obligation of centralized clearing and settlement for the payment arrangements, and transparency of interoperability rules within an arrangement and between arrangements.
On March 26, 2018, the Central Bank enacted Circular No. 3,887 establishing limitations to the interchange fee for debit transactions, which is the remuneration of the issuer paid by the merchant for each transaction. The average fee for the interchange is 0.5% and the maximum fee is 0.8%. These limitations are not applicable to non-face-to-face transactions and to corporate cards.
On November 28, 2018, the Central Bank enacted Circular No. 3,918, which modified Circular No. 3,691, regarding the international use of credit cards. Effective as of March 1, 2020, credit cards issuers offer customers the option to pay credit card invoices in reais, converting the amounts due on the date that such expenses was incurred. This option must be adopted for all credit cards issued, unless the customer waives converting foreign amounts on the day that the expense was incurred and chooses to have all amounts converted on the invoice due date.
74
On June 27, 2019, the CMN and the Central Bank published Resolution No. 4,734 and Circular No. 3,952, which will come into effect on June 7, 2021, and impose new regulations regarding (i) the discount and prepayment operations of receivables from credit and debit payment instruments issued under the Brazilian Payment System; (ii) credit operations guaranteed by such receivables; and (iii) the constitution of liens and encumbrances on these. With the new regulation, the Central Bank intends to provide greater efficiency and security to the discount, prepayment and credit operations linked to receivables from payment arrangements by merchants, increasing competition and thus reducing the cost of credit.
On October 22, 2020, the Central Bank published the Resolution No 24, which modified Circular No. 3.885, establishing the authorization process for payment institutions classified as a payment initiation service providers. The payment initiation service provider is characterized by being a payment institution that, without managing a payment account or holding at any time any part of the funds transfer, initiate a payment transaction. To operate as a payment initiation service provider is necessary a previously authorization by the Central Bank, institutions that already hold a financial institution authorization or a payment institution authorization have a simplified procedure. The Central Bank Resolution No. 24 also modified the authorization process for payments institutions that operate as prepaid issuers and start their operation after March 2021, requiring a previous authorization by the Central Bank.
On March 25, 2021, the Central Bank published Resolution No. 80 and Resolution No. 81, which repealed Circular No. 3,885 and altered the rules relating to the operation and authorization process for payment institutions. Among the main changes introduced by Resolution No. 80, are: (i) the requirement that payment institutions include the term “Instituição de Pagamento” in their corporate name; (ii) the requirement that payment institutions be managed by three or more statutory officers; and (iii) that securities broker dealers are no longer required to request prior authorization to offer some payment services. The main changes set forth in Resolution No. 81 include changes to the definition of qualified equity interest held in payment intuitions, as well as an obligation for payment institutions to maintain a business plan available to the Central Bank, which may be requested before or after the granting of the authorization to operate. Resolution No. 80 and Resolution No. 81 will come into effect on May 3, 2021. Similar to Resolution No. 24, Resolution No. 80 requires all payment institutions incorporated after its entry into effect to require previous authorization by the Central Bank to operate.
Instant Payments
Central Bank approves regulation of its Instant Payment Arrangement (“Pix System”)
On August 13, 2020, the Central Bank issued Central Bank Resolution No. 1 (“Central Bank Resolution 1/2020”), establishing the Pix System payment arrangement and approving its regulation (the “Pix Regulation”). Central Bank Resolution 1/2020 came into effect on September 1, 2020. Pix System transactions will operate on a restricted basis through November 3, 2020 and will be fully operational after November 16, 2020.
Pursuant to Central Bank Resolution 1/2020, the participation in the Pix System is mandatory for financial institutions and payment agents authorized to operate by the Central Bank that have more than 500,000 active customer accounts, considering cash deposit accounts, savings deposit accounts and prepaid payment accounts. Participation in the PIX System is optional for financial institutions and payment agents that do not meet this threshold, as well as the National Treasury Secretariat.
The Pix Regulation applies to all participants in the Pix System. According to the Pix Regulation, there are three participation types: (i) transactional account provider, which is a financial institution or a payment institution that offers deposit accounts or payment accounts to end users; (ii) government entity, which is the National Treasury Secretariat, with the exclusive purpose of making collections and payments related to its activities; and (iii) special clearing houses, that are the financial institutions and payment agents that (a) within the scope of the Pix System have the exclusive purpose of providing settlement services to other participants, (b) meet the requirements to act as settlement participants in the Central Bank’s Instant Payments System (“SPI”), and (c) do not meet the criteria of mandatory participation in the Pix System.
Provision of Financial Services through Electronic Channels
CMN regulation establishes that financial institutions are not required to provide clients access to traditional banking services channels for collection and receipt services based on agreements that demand exclusively electronic channels.
Credit Performance Information
CMN regulates a database known as Credit Information System (Sistema de Informações de Crédito, or SCR), which comprises information regarding credit operations sent to the Central Bank. SCR’s purpose is to provide information for the Central Bank to monitor and supervise credit in the financial system, and also to enable information exchange among financial institutions.
75
New rules applicable to Brazilian capital abroad and non-resident accounts in Brazil.
On July 30, 2020, the CMN enacted Resolution No. 4,841 and Resolution No. 4,844, which provide new rules related to the presentation of the Declaration of Brazilian Capital Abroad (“DCBE”), as well as the provision of information regarding non-resident accounts (conta de não-residente – “CNR”) in Brazil, both of which provide for the modernization and cost reduction of the compliance and supervision process in the National Financial System. According to Resolution No. 4,841, only Brazilian residents who maintain capital abroad above US$ 1 million by December 31 of each year are required to submit the DCBE, a declaration of assets abroad, to the Central Bank. Nevertheless, the rules for the provision of information to the Brazilian Tax Authority (Receita Federal do Brasil or “RFB”) have been kept unchanged. In addition, Resolution No. 4,844 alters the minimum threshold for the mandatory registration of transactions in CNRs from R$10,000 to R$100,000, which has the purpose of simplifying the monitoring procedures by Brazilian financial institutions.
Consumer Protection Code
The Brazilian Consumer Protection Code, or CDC, which is applicable to financial institutions according to Brazilian higher courts, sets forth consumer defense and protection rules applicable to consumers’ relationships with suppliers of products or services.
| | |
| Basic consumer rights dealing with financial institutions: | | • Reverse burden of proof in court; • Proper and clear information provided with respect to the products and services offered (e.g.; quantity, characteristics, composition, quality, price and risks such products pose); • Proportional reduction of interest charged in connection with personal credit and consumer directed credit transactions in case of early payment of debts; • In limited circumstances, amounts charged improperly may have to be returned in an amount equal to twice what was paid in excess of due amounts, except in cases of justifiable mistakes (e.g.; systemic failure or operational error); • Collection of credits cannot expose the client to embarrassment or be performed in a threatening manner; • Prohibition on the release of misleading or abusive publicity or information about contracts or services, as well as on the promoting of overbearing or disloyal commercial practices; and • Liability for any damages caused to consumers by misrepresentations in their publicity or information provided. |
Late payment and default
CMN Resolution No. 4,882 provides that in case of delay or non-payment of credit operations, financial leasing and credit card and other post-paid payment instruments, the financial institutions may only charge customers the following: (i) the interest rate established in the agreement; (ii) default interest and late payment fines in accordance with the law.
Limitation to the fees and interest rates on overdraft-secured checks
On November 27, 2019, the CMN issued Resolution No. 4,765 (“Resolution No. 4,765/2019”), providing for new rules on the overdraft granted by financial institutions in checking accounts held by individuals and individual micro entrepreneurs (MEI).
The new rule limits the charging of fees on overdraft-secured checks to: (i) 0% for the opening credit facilities of up to R$ 500.00; and (ii) 0.25% for the opening of credit facilities larger than R$500.00, calculated with the amount of the facility that exceeds R$500.00.
Resolution No. 4,765/2019 also limits interest rates over the overdraft-secured check to up to 8% per month, to which must be added a discount of the overdraft fees already charged monthly by the financial institution. According to the new rule, if the interest is less than or equal to the overdraft fees, such interest rates must be equal to zero.
76
In addition, Resolution No. 4,765/2019 establishes that the overdraft-secured check must be compatible with the customer’s risk profile.
Resolution No. 4,765/2019 came into force on January 6, 2020, for agreements executed after the referred date, and came into force on June 1, 2020, for agreements executed prior to such date. Regarding the 8% limitation the rule applies to all contracts from 06 January 2020 regardless of the date of contracting.
Data Protection
The Brazilian General Data Protection Act, or the GDPA, came into effect in September 2020 (except for administrative sanctions, which will enter into effect on August 1, 2021, according to Law No. 14,010/2020). The GDPA brings a set of rules to be observed in activities such as collection, processing, storage, use, transfer, sharing and erasure of information concerning identified or identifiable natural persons. The application of the GDPA will apply irrespective of industry or business when dealing with personal data.
The GDPA also created the Brazilian National Data Protection Authority, or the ANPD, which will exercise the triple role of investigation, enforcement and education. More importantly, it will be able to issue norms and procedures, deliberate on the interpretation of the act, request information to controllers and processors and, in cases of noncompliance with the law, enforce the law through an administrative process. The ANPD has been assured technical independence, though it is subordinated to the Presidency of the Republic.
Cybersecurity
We comply with the requirements of GDPA, especially in relation to the security and protection of personal data, as well as CMN Resolution No. 4,658/2021 and of Central Bank Circular No. 3,909/2018, which require financial institutions to institute a Cybersecurity Policy, as well as regulates the outsourcing of relevant data processing and storage and cloud computing services. We also comply with CVM Ruling No. 612/2019, which amends, expands and repeals provisions to CVM Ruling No. 505, which sets forth the standards and procedures to be observed in security transactions carried out in regulated securities markets requiring the implementation of cybersecurity controls and data protection.
Automatic debit of banking accounts
On March 26, 2020, CMN issued Resolution No. 4,790, which sets forth new rules for the automatic debit payments from checking account and accounts designated for the payment of an individual’s wages.
In order to foster the transparency on the relationship between the financial institutions and their clients, the new rule sets forth that financial institutions should only process automatic debit payments upon prior and express authorization of the client. Resolution No. 4,790 provides for the procedures for the authorization and cancellation of automatic debit payments.
The new rule will come into force on May 1st, 2021.
Regulation of Independent Auditors
In accordance with CMN regulations establishing the rules that govern external audit services provided to financial institutions, the financial statements and financial information of financial institutions must be audited by independent auditors who are (i) duly registered with the CVM; (ii) qualified as specialists in audit of banks by the CFC and the IBRACON; and (iii) meet the requirements that ensure auditor independence.
After issuing audit reports for five consecutive fiscal years, the responsible audit partner and audit team members with management responsibilities must rotate-off and cannot be part of the audit team of such institution for three consecutive fiscal years.
CMN regulations also prohibit the engagement and maintenance of independent auditors by financial institutions in the event that: (i) any of the circumstances of impediment or incompatibility for the provision of audit services provided for in the rules and regulations of the CVM, CFC or IBRACON arise; (ii) ownership of shares of or entering into financial
77
transactions (either asset or liability) with the audited financial institution by the audit firm or members of the audit team involved in the audit work of the financial institution; and (iii) fees payable by the institution represent 25% or more of the total annual fees of the audit firm. Additionally, the audited financial institution is prohibited from hiring partners and members of the audit team with managerial responsibilities who were involved in the audit work at the financial institution during the preceding 12 months.
In addition to the audit report, the independent auditor must prepare the following reports, as required by CMN regulation.
| | • | | An assessment of the internal controls and risk management procedures of the financial institution, including its electronic data processing system; |
| | • | | A description of non-compliance with legal and regulatory provisions that have, or may have, a significant impact on the audited financial statements or operations of the audited financial institution; and |
| | • | | Others reports required by Central Bank. |
These reports, as well as working papers, correspondence, service agreements and other documents related to the audit work must be retained and made available to the Central Bank for at least five years.
Under Brazilian law, our financial statements must be prepared in accordance with the accounting practices adopted in Brazil applicable to institutions authorized to operate by the Central Bank. We also prepare financial statements in accordance with the IFRS as issued by IASB. Please see “Presentation of Financial and Other Information—About our Financial Information” for further details. Financial institutions must have their financial statements audited every six months. Quarterly financial statements filed with the CVM must be reviewed by independent auditors of the financial institutions. CVM rules require publicly-held companies, including financial institutions, to disclose information related to non-audit services provided by independent auditors when they represent more than 5% of the fees for audit services. Such information should include the type of service, the amount paid and the percentage that they represent of the fees for the audit of financial statements. Please see “Item 16C. Principal Accountant Fees and Services” for further details about fees and services of the principal auditors.
Self-Regulators
We are signatories of self-regulation codes that establish principles, rules and recommendations of best corporate governance practices and determined activities, as applicable. Some of the self-regulatory entities that we are subject to are the ABRASCA, ABECS, ANBIMA, and FEBRABAN, among others.
Portability of Credit Transactions
Regulated by the Central Bank since 2013, portability of credit transactions consists of the transfer of a credit transaction from the original creditor to another institution, at the request of the debtor, maintaining the same outstanding balance and remaining term. The regulation establishes standard procedures and deadlines for the exchange of information and the mandatory use of an electronic system authorized by the Central Bank for the transfer of funds between financial institutions, prohibiting the use of any alternative procedure to produce the same effects of the portability, including so-called “debt purchases.”
Rules Governing the Charging of Fees on Banking and Credit Card Operations
Banking fees and credit card operations are extensively regulated by the CMN and the Central Bank. According to Brazilian legislation, we must classify the services we provide to individuals under pre-determined categories and are subject to limitations on the collection of fees for such services.
Brazilian financial institutions are generally not authorized to charge fees from individuals for providing services classified as “essential” with respect to checking and savings accounts, such as supplying debit cards, check books, withdrawals, statements and transfers, among others.
78
Brazilian legislation also authorizes financial institutions to charge fees related to “priority services”, a standard set of services defined by Central Bank regulation. Financial institutions must offer to their individual clients “standard packages” of priority services. Clients may also choose between these or other packages offered by the financial institution, or to use and pay for services individually instead of selecting a package.
Current rules also authorize financial institutions to charge fees for specific services called “additional services” (serviços diferenciados), provided that the account holder or user is informed of the use and payment conditions relating to such services, or that fees and collection methods are defined in the contract.
The CMN also establishes rules applicable to credit cards, determining the events that allow for the collection of fees by issuers, as well as the information that must be disclosed in credit card statements and in the credit card agreement. There is also a list of priority services. The rules define two types of credit cards: (i) basic credit cards, with simpler services, without rewards programs and (ii) “special credit cards”, with benefits and reward programs.
A minimum of 30-days’ prior notice to the public must precede the creation or increase of a fee. In addition, fees related to priority services may only be increased 180 days after the date of a previous increase (the reduction of a fee can take place at any time). With respect to credit cards, a 45-days’ prior notice to the public is required for any increase or creation of fees and such fees may only be increased 365 days after the previous increase. The period of 365 days is also subject to changes in the rules applicable to benefit or reward programs.
At the end of 2016 and the beginning of 2017, two major changes occurred in the Brazilian payment market. In December 2016 a provisional measure was published authorizing the surcharge by payment instrument as a way to stimulate retail sales, allowing retailers to charge different prices depending on the payment method. In January 2017 the CMN published a new resolution establishing that revolving credit for the financing of credit card bills may only be extended to clients until the due date of the following credit card bill. After such term, the credit provider must offer the client another type of financing with conditions more favorable than the ones that are provided in the credit card market. In addition, the credit provider shall no longer offer this type of credit to clients that already contracted revolving credit for the financing of credit card bills which were not repaid on time.
In 2018, the CMN issued a new resolution establishing that the following fees may be collected in the event of late payment or settlement of obligations related to credit card bills and other postpaid payment instruments: (i) compensatory interest, per day of delay, on overdue installments or on unpaid debtor balances; (ii) a fine and (iii) interest for late payment.
The same resolution also established that the change in credit limits, if not carried out at the request of the customer, should, in the case of: (i) reduction, be preceded by at least 30-days’ advance notice to the client, except if there is a deterioration of the customer’s credit risk profile, according to the criteria defined in the credit risk management policy, in which case notice may be made at any time prior to the reduction; and (ii) increase, be conditioned upon the customer’s prior acquiescence.
In 2019, the CMN issued a standard setting rules for the collection of interest and tariff on overdraft for individuals and Individual Microentrepreneurs (entrepreneurs with annual revenues of R$81,000 and subject to specific legislation). According to the new regulation, can only be charged for use of overdraft limit exceeding R$500.00.
Brazilian financial institutions must maintain the secrecy of banking transactions and services provided to their clients. Except as permitted under Brazilian legislation or by judicial order, a breach of bank secrecy is a criminal offense. The only circumstances in which information about clients, services or transactions by Brazilian financial institutions or credit card companies may be disclosed to third parties are the following:
| | |
the disclosure of information with the express consent of the interested parties; | | the exchange of information between financial institutions for record purposes; |
79
| | |
the disclosure of information to credit reference agencies based on data from the records of subscribers of checks drawn on accounts without sufficient funds and defaulting debtors; | | the disclosure of information to the competent authorities relating to the actual or suspected occurrence of criminal acts or administrative wrongdoings, including the disclosure of information on transactions involving funds related to any unlawful activities; |
the disclosure of some information established by law to tax authorities; and | | the disclosure of information in compliance with a judicial order. |
Digitalization of Documents and Record Keeping
According to CMN’s resolution on the digitalization of documents with respect to transactions carried out by financial institutions and other institutions authorized to operate by the Central Bank, these institutions are authorized to maintain digital documents, instead of paper documents, for recordkeeping purposes, if certain requirements to ensure the documents authenticity, validity and protection are met. The resolution also permits the disposal of original paper documents provided that this measure will not prejudice the institution’s ability to exercise any rights or to commence any proceeding or exercise any protective remedy related to the relevant document.
Dividends and other payments by financial institutions during the COVID-19 pandemic
On May 29, 2020 the CMN enacted Resolution No. 4,820, in response to the COVID-19 pandemic, which prohibited financial institutions, such as us, to: (i) remunerate their own capital, including by means of early payment, in excess of amounts equivalent to the minimum mandatory dividend required by Law No. 6,404/76 (the “Brazilian Corporation Law”), including as interest on capital (ii) repurchase their own shares, subject to certain exceptions as authorized by the Central Bank (restriction applicable until December 31, 2020); (iii) reduce their capital stock, except if such reduction is required by law or approved by the Central Bank (restriction applicable until December 31, 2020); and (iv) increase the compensation of their officers, directors and members of the board of directors and audit committee, including fixed and variable compensation with respect to 2020 fiscal year. CMN Resolution No. 4,280 repealed CMN Resolution No. 4,797 of April 6, 2020, that had previously established similar restrictions.
On December 23, 2020, the CMN enacted Resolution 4,885, which modified Resolution No. 4,820 in order to provide more flexibility for the payment of dividends or interest on capital. As a result, financial institutions are not allowed to pay dividends in excess of the greater of (x) the amount corresponding to 30% of the adjusted net profit in accordance with item I of article 202 of the Brazilian Corporation Law; and (y) the amount equivalent to the mandatory dividends as set forth in article 202 of the Brazilian Corporation Law. This is the only restriction still in force as a result of Resolution No. 4,820/20.
Public Consultation to Replace Prudential Regulation Referring to Credit and Market Risk
On December 11, 2020, the Central Bank launched a public consultation on a proposal for a regulation that implements the minimum standard of the Basel Committee for Banking Supervision (BCBS) for calculating the capital requirement related to credit risk according to standardized approach (RWACPAD). This new regulation will replace Central Bank Circular No. 3,644, of March 4, 2013, pursuant to “Basel III” requirements.
The proposal increases the granularity of the weights applicable to exposures, bringing refinements in the differentiation in credit risk to the prudential framework. The proposal is addressed to financial institutions classified in Segments 1 (S1) to Segment 4 (S4), which currently opt for the standardized approach for credit risk. The consultation ended on February 23, 2021 and the final rule is still pending issuance.
On December 11, 2020, the Central Bank also launched a public consultation on a proposal for a rule contemplating the first phase – of a total of four planned phases – of the process of reviewing the prudential standard for determining the capital requirement related to market risk, as provided for in Basel III. This first phase contains the requirements related to the risk management process, including improvements in governance and the identification of financial instruments classified in the trading portfolio.
Under the terms proposed in the consultation, the first phase will come into effect on January 1, 2022, through amendments to Resolution 4,557, of February 23, 2017, and the publication of a new rule that will replace Circular No. 3,354, of 27 June 2007. The consultation ended on February 9, 2021 and the final rule is still pending issuance. The Central Bank expects to launch new public consultations relating to Phases 2 and 3 throughout 2021.
80
Proceedings for Administrative Sanctions in the Brazilian National Financial System, the SPB and Capital Markets
Law No. 13,506 provides for administrative sanctioning procedures by the Central Bank and the CVM. Some of the key aspects of Law No. 13,506 are: (i) it increases the maximum fine applicable by the Central Bank from R$250 thousand to R$2 billion or 0.5% of the revenues of the company arising from services and financial products in the year prior to the violation; (ii) it increases the maximum fine applicable by the CVM from R$500 thousand to R$50 million; (iii) it sets forth new types of violations and subject to penalties; (iv) it increases the maximum penalty with respect to disqualification to a period of twenty years; (v) it provides that the Central Bank may enter into cease-and-desist commitments; and (vi) it provides that the Central Bank and the CVM may enter into administrative agreements similar to leniency agreements.
Centralized Registration and Deposit of Financial Assets and Securities
Law No. 13,476/2017, Law No. 12,810/2013, as amended, and consolidated the provisions on the creation of liens over financial assets and securities requiring that the constitution of liens on financial assets and securities subject to registration or centralized deposit be carried out exclusively at the registering entities or at the central depositories where such financial assets or securities are registered or deposited, regardless of the nature of the legal transaction to which they relate to, including for purposes of publicity and effectiveness with third parties.
The CMN issued a rule to regulate the provisions of Law No. 13,476/2017 and to consolidate the regulation on centralized deposit and the registry of financial assets and securities issued or owned by institutions authorized to operate by the Central Bank, requiring, amongst other provisions, that such institutions be generally, subject to limited exceptions, obligated to: (i) register and deposit, in registration and/or centralized deposit systems authorized to operate by the Central Bank or the CVM, all financial assets and securities they are obligated or co-obligated to pay; and (ii) only keep in their asset portfolio securities that are registered and/or deposited in the terms of the CMN rule.
On September 5, 2018, the Central Bank issued a new rule amending the existing procedural rule on centralized registration and deposit of financial assets and securities and the creation of liens on deposited financial assets and established the terms for the creation of liens over financial assets registered with registering entities. The referred rule established, amongst other changes, that such liens are effective in the moment that the central depositary accepts the command from its participant, pursuant to its internal regulations.
Taxation of closed investment funds
MP 806/17 issued on October 30, 2017, which intended to extinguish the tax deferral regime applicable to closely held investment funds and subject them to taxation, was not converted into law. As a consequence, it was repealed.
Taxes on Transactions entered into by the Itaú Unibanco Group
We summarize below the main taxes levied on the transactions entered into by entities in the Itaú Unibanco Group in Brazil. This description does not represent a comprehensive analysis of all tax considerations applicable to the Itaú Unibanco Group. For a more in-depth analysis, we recommend that potential investors consult their own tax advisors. The main taxes we are subject to, with their respective rates, are as follows:
| | | | |
| | | |
| Tax | | Rate | | Tax calculation basis |
| | | |
| IRPJ | | 15.0% plus a 10.0% surtax | | Net income with adjustments (exclusions, additions, and deductions) |
81
| | | | |
| | | |
| CSLL | | 20.0% (financial institutions, insurance companies and capitalization entities) or 9.0% (other Itaú Unibanco Group companies). 25.0% (banking institutions) and 20.0% (other institutions authorized to operate by the Central Bank and insurance and capitalization companies) as of July 1, 2021 and until December 31, 2021. From January 1, 2019 to February 2020, the CSLL tax rate, as defined below, applicable to financial institutions, insurance companies, capitalization and similar entities was reduced to 15.0% | | Net income with adjustments (exclusions, additions, and deductions) |
| | | |
| COFINS | | 4.0% (financial institutions, insurance companies, capitalization and similar entities) or 7.6% (other Itaú Unibanco Group companies) | | Gross revenue minus specific deductions |
| | | |
| PIS | | 0.65% (financial institutions, insurance companies, capitalization and similar entities) or 1.65% (other Itaú Unibanco Group companies) | | Gross revenue minus specific deductions |
| | | |
| ISS | | 2.0% to 5.0% | | Price of service rendered |
| | | |
| IOF | | Depends on the type of the transaction, as described below. | | Transaction nominal value |
Corporate Income Tax and Social Contribution on Net Income
In accordance with applicable legislation, corporate income tax (Imposto de Renda da Pessoa Jurídica, or IRPJ), and social contribution on profits (Contribuição Social Sobre o Lucro Líquido, or CSLL) are determined by the taxable income regime. Under this regime, our taxable income, on which IRPJ and CSLL will be levied, must be adjusted by additions, deductions, and exclusions, such as nondeductible expenses, operating costs and equity accounting, respectively.
The IRPJ is levied at a basic 15.0% rate, and a 10.0% surtax is applicable when the total amount of profit for the fiscal period exceeds R$20,000 per month or R$240,000 per year. In other words, any portion of our profit exceeding this limit is taxed at an effective 25.0% rate.
The CSLL is levied on our taxable income at a 20.0% rate, which is specific for financial institutions, insurance, and similar companies. From January 1, 2019 to February 2020, the CSLL rate for financial institutions is 15.0%. Note that this tax is generally levied at a 9.0% for non-financial legal entities. Provisional Measure No. 1,034 increased the CSLL (i) for banking institutions from 20.0% to 25.0%; (ii) for other institutions authorized to operate by the Central Bank from 15.0% to 20.0%; and (iii) for insurance and capitalization companies from 15.0% to 20.0% from July 1, 2021 to December 31, 2021. These modifications were introduced by a provisional measure and are awaiting approval of the Brazilian Congress.
As other Brazilian legal entities, our companies may offset the historical nominal amount of tax losses determined in prior years against results of subsequent years at any time (i.e., with no limitations with respect to time periods), provided that such offsetting does not exceed 30.0% of the annual taxable income of such future year. For purposes of IRPJ and CSLL taxation, companies should consider their income abroad as well rather than income solely from Brazilian operations. Therefore, profits, capital gains and other income earned abroad by Itaú Unibanco Group entities in Brazil, their branches, representations, affiliates or subsidiaries, will also be computed for determination of the entities taxable income. However, Brazilian legislation provides the possibility of deducting the amounts paid as corporate income tax abroad against the IRPJ and CSLL due in Brazil, provided certain limits are observed.
Contribution on Social Integration Program and Social Security Financing Contribution
82
In addition to IRPJ and CSLL, Brazilian legal entities are subject to the following taxes on revenue: PIS and COFINS.
According to applicable legislation, financial institutions are subject to the cumulative regime for calculation of these taxes. Under the cumulative regime, financial institutions are required to pay PIS at a 0.65% rate and COFINS at a 4.0% rate. The cumulative regime provides for rates lower than those levied under the non-cumulative regime, which is explained below, but it prevents the use of tax credits.
Service Tax
The ISS is generally levied on the price of services rendered (e.g., banking services) and is charged by the municipality where our branch or office rendering the service is located. The tax rates vary from 2.0% up to the maximum rate of 5.0%, depending on the municipality in which the service is provided and its respective nature.
A new tax law enacted on December 30, 2016, caused a number of changes with respect to Brazilian Tax on Service, or ISS. Among these modifications, the new law introduced a minimum tax rate of 2%.
The original proposed legislation approved by the Brazilian Congress provided changes related to ISS assessment on activities such as credit card and leasing operations but former President Temer vetoed these changes. However, on May 30, 2017, the Brazilian Congress overturned the presidential veto. As a result, beginning on January 1, 2018, ISS levied on the services of leasing, cards administration, funds administration and consortium administration would be charged by the municipality where the client is located. Due to this change, in November 2017, a lawsuit was filed by CONSIF and CNSEG in the Federal Supreme Court, and, on March, 23, 2018, the required preliminary injunction was granted, in order to suspend the amendment introduced by the new law and to resume the previous treatment of ISS collection in the Municipality where the establishment is located. However, it is important to mention that this is not a final decision, as it is still pending the final pronouncement by the Federal Supreme Court.
A law was published in September 2020 which provides for changes in relation to the Services Tax that are similar to those provided for in the legislation published in December 2016. Considering the injunction obtained in the Supreme Federal Court, on March 23, 2018, which suspended the amendments introduced by the law published in December 2016, the new law published in September 2020 has its applicability suspended until the Supreme Court rules on the injunction, as it is related to the previous law.
Tax on Financial Transactions
The tax on financial transactions is levied at specific rates according to the transaction in question, and may be changed by a decree from the Executive Branch (which may become effective as of its publication date), rather than by a law enacted by the Brazilian Congress.
The table below summarizes the main IOF rates levied on our transactions. Notwithstanding, we note that IOF is a very comprehensive tax. Therefore, for a more in-depth analysis, we recommend that tax advisors be consulted accordingly.
| | |
| | |
| Type of transaction | | Applicable Rates (Rates may be changed by a decree enacted by the Brazilian government up to a maximum rate, as described below, which may become effective as of its publication date) |
| | |
| Foreign exchange transactions | | IOF/FX: zero to 6.38% (depending on the transaction) Maximum rate: 25% |
| | |
| Insurance transactions | | IOF/Insurance: zero to 7.38% Maximum rate: 25% |
| | |
| Loans and credit transactions | | IOF/Credit: 0.0082% (individual) or 0.0041% (legal entities) per day, until it reaches 365 days, plus a flat 0.38% rate Maximum rate: 1.5% per day |
| | |
| Securities | | IOF/Securities: zero to 1.5% as a general rule Maximum rate: 1.5% per day |
83
| | |
| | |
| Securities – Derivatives | | IOF/Securities – Derivatives: zero Maximum rate: 25% |
U.S. Foreign Account Tax Compliance Act (FATCA)
FATCA attempts to minimize tax avoidance by U.S. persons investing in foreign assets both through their own accounts and through their investments in foreign entities. FATCA requires U.S. withholding agents such as Itaú to provide information to the IRS regarding their U.S. account holders including substantial U.S. owners of certain non-financial foreign entities, or NFFEs, and specified U.S. persons having an interest in certain professionally managed investment vehicles and trusts known as owner-documented foreign financial institutions, or FFIs.
To the extent a U.S. withholding agent is not able to properly document an account, it generally will be required to deduct 30% FATCA withholding on certain payments of U.S. source income.
U.S. federal income tax law has detailed rules for determining the source of income. Different rules apply for each type of income. Interest and dividends, two of the most common types of income for investors, are generally sourced by reference to the residence of the obligor. Specifically, dividends are generally treated as U.S. source income when paid by a U.S. corporation with respect to its stock, and interest is generally treated as U.S. source income when paid by a U.S. borrower of money.
The United States collaborated with other governments to develop Intergovernmental Agreements, or IGAs, to implement FATCA. IGAs with partner jurisdictions facilitate the effective and efficient implementation of FATCA. The purpose of these agreements is essentially to remove domestic legal impediments to compliance with FATCA and sharing of information and to reduce burdens on FFIs located in partner jurisdictions.
More than 70 jurisdictions have signed an IGA, including Brazil, the Cayman Islands, Switzerland and United Kingdom. In addition, approximately 30 other jurisdictions are deemed as having an IGA in effect. Some countries signed a reciprocal agreement, meaning that the country (such as Brazil) and the U.S. will automatically exchange annually, on a reciprocal basis, specific account holder information.
There are two types of IGAs – Model 1 IGA, where local FFIs are required to implement account opening and due diligence procedures to identify U.S. accounts and report them to the local tax authority for exchange with the IRS (examples of Model 1 IGA countries are Brazil, Cayman Islands, The Bahamas, Peru and Colombia), and Model 2 IGA, where local FFIs are required to implement account opening and due diligence procedures to identify U.S. accounts, but report such information directly to the IRS (examples of Model 2 IGA countries are Switzerland, Chile, Paraguay and Japan).
The governments of Brazil and the United States entered into a Model 1 IGA on September 23, 2014, effective in Brazil on August 24, 2015, after the approval by the Brazilian Congress, ratification by the President and enactment of Decree 8,506 (IGA-BR).
Under the IGA-BR, Brazilian financial institutions and other entities subject to FATCA disclosure requirements are generally required to provide certain information on their U.S. account holders to the Brazilian tax authorities, which will share this information with the IRS.
Furthermore, Normative Ruling No. 1,680, dated December 28, 2016, was enacted to introduce the so-called Common Reporting Standard, or CRS, in Brazil, which seeks to implement a system of reporting financial accounts in a manner similar to FATCA. CRS is the result of discussions on the necessity of exchanging information between tax authorities of many countries in the context of the Base Erosion and Profit Shifting, or BEPS Project, coordinated by the Organization for Economic Co-operation and Development, or OECD. In connection therewith, an ancillary obligation called “e-financeira” provided by Normative Ruling No. 1,571, dated July 2, 2016, was created to be the mandatory report filed by financial institutions in order to fulfill FATCA and CRS obligations.
Moreover, on May 6, 2016, Brazilian tax authorities issued the Normative Ruling No. 1,634, effective as of January 1, 2017, that amended the regulation applicable to the National Registry of Legal Entities, or CNPJ. This regulation
84
introduced a new rule providing an ancillary obligation by which certain entities have to indicate the “Final Beneficiary” in each CNPJ, which is defined as the natural person who ultimately, directly or indirectly, owns, controls or significantly influences a particular entity or on whose behalf a transaction is conducted. Currently, this subject is regulated by Normative Ruling No. 1,863, dated December 27, 2018.
In addition, Normative Ruling No. 1,681 was enacted on December 28, 2016 providing the obligation to annually deliver the so-called Country-by-Country Statement, an ancillary obligation also arising from the discussions under the BEPS Project, before the Brazilian Federal Revenue Service (RFB), which in its turn is also expected to exchange such information with other countries’ tax authorities.
Pursuant to FATCA, the issuer, any other financial institution or other entities subject to FATCA disclosure requirements to or through which any payment with respect to the preferred shares or ADSs is made may be required, pursuant to the IGA-BR or under applicable law, to (i) request certain information from holders or beneficial owners of our preferred shares or ADSs, which information may be provided to the IRS; and (ii) withhold U.S. federal tax at a 30.0% rate on some portion or all of the payments considered “pass-thru payments” made after December 31, 2018, with respect to the preferred shares or ADSs if such information is not duly provided by such a holder or beneficial owner (referred to under FATCA as a “recalcitrant account holder”). If the issuer or any other person is required to withhold amounts under or in connection with FATCA from any payments made in respect of the preferred shares or ADSs, holders and beneficial owners of the preferred shares or ADSs will not be entitled to receive any gross up or other additional amounts to compensate them for such withholding.
The above description is based on guidance issued to date by the U.S. Treasury Department, including the final U.S. Treasury regulations and IGA-BR. Future guidance may affect the application of FATCA to the preferred shares or ADSs.
4B. Business Overview – Selected Statistical Information
The following information is included for analytical purposes and should be read in together with our audited consolidated financial statements and “Item 5. Operating and Financial Review and Prospects”.
The data included or referenced in this section are presented in accordance with IFRS, as issued by the IASB, unless otherwise indicated.
Average Balance Sheet and Interest Rate Data
The following tables present the average balances of our interest-earning assets and interest-bearing liabilities, other assets and liabilities accounts, the related interest income and expense amounts and the average real yield/rate for each period.
The following methodologies were used when calculating the average balances of our assets and liabilities presented in the following tables. For the 2020, 2019 and 2018 average balances, we used the monthly balances prepared in accordance with IFRS, as issued by the IASB.
The majority of our business is comprised of operations with individuals and corporate entities without significant fluctuations over short periods. Non-accrual loans and leases are disclosed as a non-interest earning asset in the table below:
85
| | | | | | | | | | | | | | | | | | | | | | | | | | | | | | | | | | | | |
Assets | | 2020 | | | 2019 | | | 2018 | |
| | Average
balance | | | Interest | | | Average
yield/rate | | | Average
balance | | | Interest | | | Average
yield/rate | | | Average
balance | | | Interest | | | Average
yield/rate | |
| | | | | (In millions of R$, except percentages) | | | | |
Interest-earning assets (1) | | | 1,677,115 | | | | 128,978 | | | | 7.7 | | | | 1,428,272 | | | | 140,283 | | | | 9.8 | | | | 1,343,713 | | | | 133,177 | | | | 9.9 | |
Interest-bearing deposits in other banks | | | 52,958 | | | | 1,102 | | | | 2.1 | | | | 30,728 | | | | 1,173 | | | | 3.8 | | | | 26,174 | | | | 1,080 | | | | 4.1 | |
Securities purchased under agreements to resell | | | 274,811 | | | | 9,832 | | | | 3.6 | | | | 258,763 | | | | 16,197 | | | | 6.3 | | | | 265,218 | | | | 17,365 | | | | 6.5 | |
Central Bank compulsory deposits | | | 81,254 | | | | 2,242 | | | | 2.8 | | | | 90,190 | | | | 4,734 | | | | 5.2 | | | | 91,421 | | | | 5,063 | | | | 5.5 | |
Financial Assets | | | 537,764 | | | | 36,327 | | | | 6.8 | | | | 432,618 | | | | 36,100 | | | | 8.3 | | | | 402,846 | | | | 34,661 | | | | 8.6 | |
Financial assets at fair value through profit or loss | | | 308,867 | | | | 15,716 | | | | 5.1 | | | | 259,318 | | | | 22,760 | | | | 8.8 | | | | 248,274 | | | | 22,853 | | | | 9.2 | |
Financial assets at fair value through other comprehensive income | | | 94,763 | | | | 16,982 | | | | 17.9 | | | | 56,415 | | | | 10,758 | | | | 19.1 | | | | 53,948 | | | | 9,194 | | | | 17.0 | |
Financial assets at amortized cost | | | 134,134 | | | | 3,629 | | | | 2.7 | | | | 116,885 | | | | 2,582 | | | | 2.2 | | | | 100,624 | | | | 2,614 | | | | 2.6 | |
Other Financial Assets | | | 96,403 | | | | (28 | ) | | | (0.0 | ) | | | 80,600 | | | | 1,033 | | | | 1.3 | | | | 64,618 | | | | 1,368 | | | | 2.1 | |
Loans and leases | | | 633,926 | | | | 79,503 | | | | 12.5 | | | | 535,374 | | | | 81,046 | | | | 15.1 | | | | 493,436 | | | | 73,640 | | | | 14.9 | |
Non-interest-earning assets | | | 219,964 | | | | | | | | | | | | 156,953 | | | | | | | | | | | | 134,723 | | | | | | | | | |
Cash and due from banks | | | 42,186 | | | | | | | | | | | | 31,964 | | | | | | | | | | | | 26,616 | | | | | | | | | |
Central Bank compulsory deposits | | | 5,474 | | | | | | | | | | | | 5,380 | | | | | | | | | | | | 5,132 | | | | | | | | | |
Derivatives | | | 71,241 | | | | | | | | | | | | 33,351 | | | | | | | | | | | | 25,242 | | | | | | | | | |
Non-accrual loans | | | 23,317 | | | | | | | | | | | | 22,777 | | | | | | | | | | | | 22,419 | | | | | | | | | |
Provisions for Expected Loss | | | (45,641 | ) | | | | | | | | | | | (35,152 | ) | | | | | | | | | | | (36,042 | ) | | | | | | | | |
Premises and equipment, net | | | 6,869 | | | | | | | | | | | | 7,238 | | | | | | | | | | | | 7,202 | | | | | | | | | |
Investments in unconsolidated companies | | | 15,335 | | | | | | | | | | | | 12,544 | | | | | | | | | | | | 7,730 | | | | | | | | | |
Goodwill | | | 3,928 | | | | | | | | | | | | 10,970 | | | | | | | | | | | | 11,109 | | | | | | | | | |
Intangible assets, net | | | 15,310 | | | | | | | | | | | | 12,473 | | | | | | | | | | | | 8,545 | | | | | | | | | |
Tax assets | | | 65,419 | | | | | | | | | | | | 43,143 | | | | | | | | | | | | 43,741 | | | | | | | | | |
Assets held for sale | | | 494 | | | | | | | | | | | | 718 | | | | | | | | | | | | 767 | | | | | | | | | |
Other assets | | | 16,031 | | | | | | | | | | | | 11,547 | | | | | | | | | | | | 12,263 | | | | | | | | | |
Total | | | 1,897,080 | | | | | | | | | | | | 1,585,225 | | | | | | | | | | | | 1,478,435 | | | | | | | | | |
| (1) | For the net yield on total average interest-earning assets, see “Net Interest Margin and Spread”. |
| | | | | | | | | | | | | | | | | | | | | | | | | | | | | | | | | | | | |
Liabilities | | 2020 | | | 2019 | | | 2018 | |
| | Average
balance | | | Interest | | | Average
yield/rate | | | Average
balance | | | Interest | | | Average
yield/rate | | | Average
balance | | | Interest | | | Average
yield/rate | |
| | | | | (In millions of R$, except percentages) | | | | |
Interest-bearing liabilities | | | 1,487,359 | | | | 73,558 | | | | 4.9 | | | | 1,259,993 | | | | 75,958 | | | | 6.0 | | | | 1,176,795 | | | | 70,612 | | | | 6.0 | |
Interest-bearing deposits | | | 569,449 | | | | 17,478 | | | | 3.1 | | | | 394,787 | | | | 18,559 | | | | 4.7 | | | | 357,684 | | | | 17,484 | | | | 4.9 | |
Savings deposits | | | 161,226 | | | | 5,245 | | | | 3.3 | | | | 138,034 | | | | 7,186 | | | | 5.2 | | | | 126,987 | | | | 6,809 | | | | 5.4 | |
Deposits from banks and time deposits | | | 408,223 | | | | 12,233 | | | | 3.0 | | | | 256,752 | | | | 11,373 | | | | 4.4 | | | | 230,697 | | | | 10,675 | | | | 4.6 | |
Securities sold under repurchase agreements | | | 287,212 | | | | 10,690 | | | | 3.7 | | | | 299,225 | | | | 20,473 | | | | 6.8 | | | | 308,306 | | | | 20,889 | | | | 6.8 | |
Interbank market debt and Institutional market debt | | | 307,600 | | | | 37,278 | | | | 12.1 | | | | 256,057 | | | | 20,068 | | | | 7.8 | | | | 232,802 | | | | 20,359 | | | | 8.7 | |
Interbank market debt | | | 174,466 | | | | 28,878 | | | | 16.6 | | | | 155,977 | | | | 13,231 | | | | 8.5 | | | | 135,357 | | | | 13,587 | | | | 10.0 | |
Institutional market debt | | | 133,135 | | | | 8,400 | | | | 6.3 | | | | 100,080 | | | | 6,837 | | | | 6.8 | | | | 97,445 | | | | 6,773 | | | | 7.0 | |
Reserves for insurance and private pension and Liabilities for capitalization plans | | | 220,274 | | | | 8,121 | | | | 3.7 | | | | 212,972 | | | | 16,720 | | | | 7.9 | | | | 193,908 | | | | 11,815 | | | | 6.1 | |
Other interest-bearing liabilities | | | 102,824 | | | | (9 | ) | | | (0.0 | ) | | | 96,953 | | | | 138 | | | | 0.1 | | | | 84,095 | | | | 64 | | | | 0.1 | |
Non-interest bearing liabilities | | | 262,081 | | | | | | | | | | | | 180,954 | | | | | | | | | | | | 158,960 | | | | | | | | | |
Non-interest bearing deposits | | | 112,519 | | | | | | | | | | | | 76,865 | | | | | | | | | | | | 70,205 | | | | | | | | | |
Other non-interest-bearing liabilities | | | 149,562 | | | | | | | | | | | | 104,089 | | | | | | | | | | | | 88,755 | | | | | | | | | |
Total stockholders’ equity attributed to the owners of the parent company | | | 135,087 | | | | | | | | | | | | 130,500 | | | | | | | | | | | | 128,851 | | | | | | | | | |
Non-controlling interests | | | 12,552 | | | | | | | | | | | | 13,779 | | | | | | | | | | | | 13,829 | | | | | | | | | |
Total | | | 1,897,080 | | | | | | | | | | | | 1,585,225 | | | | | | | | | | | | 1,478,435 | | | | | | | | | |
Changes in Interest Income and Expenses – Volume and Rate Analysis
The following table sets forth the allocation of the changes in our interest income and expense in terms of average volume and changes in the average yields/rates for the periods indicated below. Volume balance and rate variations have been calculated based on variations of average balances over the period and changes in average interest yield/rates on interest earning assets and interest-bearing liabilities from one period to the other.
86
| | | | | | | | | | | | | | | | | | | | | | | | |
| | | Increase/(decrease) due to changes in: | | | Increase/(decrease) due to changes in: | |
| | | 2020-2019 | | | 2019-2018 | |
| | | Volume (1) | | | Yield/rate (2) | | | Net change (3) | | | Volume (1) | | | Yield/rate (2) | | | Net change (3) | |
| | | (In millions of R$, except percentages) | |
Interest-earning assets | | | (8,828 | ) | | | (2,477 | ) | | | (11,305 | ) | | | 8,639 | | | | (1,533 | ) | | | 7,106 | |
Interest-bearing deposits in other banks | | | (191 | ) | | | 120 | | | | (71 | ) | | | 163 | | | | (70 | ) | | | 93 | |
Securities purchased under agreements to resell | | | 1,077 | | | | (7,442 | ) | | | (6,365 | ) | | | (416 | ) | | | (752 | ) | | | (1,168 | ) |
Central Bank compulsory deposits | | | (431 | ) | | | (2,061 | ) | | | (2,492 | ) | | | (67 | ) | | | (262 | ) | | | (329 | ) |
Financial Assets | | | 13,117 | | | | (12,890 | ) | | | 227 | | | | 2,061 | | | | (622 | ) | | | 1,439 | |
Financial assets at fair value through profit or loss | | | 5,873 | | | | (12,917 | ) | | | (7,044 | ) | | | 2,059 | | | | (2,153 | ) | | | (93 | ) |
Financial assets at fair value through other comprehensive income | | | 6,829 | | | | (605 | ) | | | 6,224 | | | | 434 | | | | 1,130 | | | | 1,564 | |
Financial assets at amortized cost | | | 415 | | | | 632 | | | | 1,047 | | | | (433 | ) | | | 401 | | | | (32 | ) |
Other Financial Assets | | | 252 | | | | (1,313 | ) | | | (1,061 | ) | | | 563 | | | | (898 | ) | | | (335 | ) |
Loans and leases | | | (22,652 | ) | | | 21,109 | | | | (1,543 | ) | | | 6,336 | | | | 1,070 | | | | 7,406 | |
Interest-bearing liabilities | | | 7,058 | | | | (9,458 | ) | | | (2,400 | ) | | | 23,544 | | | | (18,198 | ) | | | 5,346 | |
Interest-bearing deposits | | | 3,479 | | | | (4,560 | ) | | | (1,081 | ) | | | 1,689 | | | | (614 | ) | | | 1,075 | |
Saving deposits | | | 1,575 | | | | (3,516 | ) | | | (1,941 | ) | | | 566 | | | | (190 | ) | | | 377 | |
Deposits from Banks and Time Deposits | | | 1,904 | | | | (1,044 | ) | | | 860 | | | | 1,123 | | | | (425 | ) | | | 698 | |
Securities sold under repurchase agreements | | | (792 | ) | | | (8,991 | ) | | | (9,783 | ) | | | (624 | ) | | | 208 | | | | (416 | ) |
Interbank market debt and Institutional market debt | | | 3,767 | | | | 13,443 | | | | 17,210 | | | | 21,221 | | | | (21,512 | ) | | | (291 | ) |
Interbank market debt | | | 1,734 | | | | 13,913 | | | | 15,647 | | | | 21,047 | | | | (21,402 | ) | | | (356 | ) |
Institutional market debt | | | 2,034 | | | | (471 | ) | | | 1,563 | | | | 175 | | | | (110 | ) | | | 64 | |
Reserves for insurance and private pension and Liabilities for capitalization plans | | | 594 | | | | (9,193 | ) | | | (8,599 | ) | | | 1,247 | | | | 3,658 | | | | 4,905 | |
Other Interest-bearing liabilities | | | 9 | | | | (156 | ) | | | (147 | ) | | | 11 | | | | 63 | | | | 74 | |
| | | | | | | | | | | | | | | | | | | | | | | | |
| (1) | Volume change has been computed as the change in the average interest-earning assets or interest-bearing liabilities from one period to the other multiplied by the average yield/rate in the earlier period. |
| (2) | Yield/rate change has been computed as the change in the yield/rate in the period multiplied by the average interest-earning assets or interest-bearing liabilities in the earlier period. |
| (3) | We allocated the net change from the combined effects of volume and yield/rate proportionately to volume change and yield/rate change, in absolute terms. |
Net Interest Margin and Spread
The following table sets forth our average interest-earning assets, total average interest bearing liabilities, net interest income and the comparative net interest margin and net interest spread for the periods indicated below.
| | | | | | | | | | | | |
| | | 2020 | | | 2019 | | | 2018 | |
| | | (In millions of R$, except percentages) | |
Total average interest-earning assets | | | 1,677,115 | | | | 1,428,272 | | | | 1,343,713 | |
Total average interest-bearing liabilities | | | 1,487,359 | | | | 1,259,993 | | | | 1,176,795 | |
Net interest income (1) | | | 55,420 | | | | 64,325 | | | | 62,565 | |
Average yield on average interest-earning assets (2) | | | 7.7% | | | | 9.8% | | | | 9.9% | |
Average rate on average interest-bearing liabilities (3) | | | 4.9% | | | | 6.0% | | | | 6.0% | |
Net interest spread (4) | | | 2.7% | | | | 3.8% | | | | 3.9% | |
Net interest margin (5) | | | 3.3% | | | | 4.5% | | | | 4.7% | |
| | | | | | | | | | | | |
| (1) | Is the sum of total interest, similar income and dividends less total interest and similar expenses. |
| (2) | Total interest, similar income and dividends divided by total average interest-earning assets. |
| (3) | Total interest and similar expenses divided by total average interest-bearing liabilities. |
| (4) | Difference between the average yield on interest-earning assets and the average rate on interest-bearing liabilities. |
| (5) | Net interest income divided by total average interest-earning assets. |
87
| | | | | | | | | | | | |
| | | 2020 | | | 2019 | | | 2018 | |
| | | (In millions of R$, except percentages) | |
Net income attributable to owners of the parent company | | | 18,896 | | | | 27,113 | | | | 24,907 | |
Average total assets | | | 1,897,080 | | | | 1,585,225 | | | | 1,478,435 | |
Average stockholders’ equity | | | 135,087 | | | | 130,500 | | | | 128,851 | |
Net income as a percentage of average total assets (1) | | | 1.0 | % | | | 1.7 | % | | | 1.7 | % |
Recurring Managerial Return on Average Equity—Annualized—Consolidated (2) | | | 14.3 | % | | | 21.1 | % | | | 20.5 | % |
Return on Average Equity – Annualized—Consolidated (3) | | | 14.2 | % | | | 21.8 | % | | | 20.4 | % |
Average stockholder’s equity as a percentage of average total assets | | | 7.1 | % | | | 8.2 | % | | | 8.7 | % |
| | | | | | | | | | | | |
| (1) | Net Income attributable to owners of the parent company. |
| (2) | The Recurring Managerial Return on Average Equity is obtained by dividing the Recurring Managerial Result (R$19,077 million, R$26,311 million and R$25,082 million in the years ended December 31, 2020, 2019 and 2018, respectively) by the Average Stockholders’ Equity adjusted by the dividends proposed (R$133,403 million, R$124,436 million and R$122,070 million in the years ended December 31, 2020, 2019 and 2018, respectively). The resulting amount is multiplied by the number of periods in the year to derive the annualized rate. The calculation bases of returns were adjusted by the dividends proposed after the balance sheet closing dates, which have not yet been approved at annual Stockholders’ or Board meetings. |
| (3) | The return on average equity is calculated by dividing the Net Income (R$18,896 million, R$27,113 million and R$24,907 million in the years ended December 31, 2020, 2019 and 2018, respectively) by the Average Stockholders’ Equity adjusted by the dividends proposed (R$133,403 million, R$124,436 million and R$122,070 million in the years ended December 31, 2020, 2019 and 2018, respectively). This average considers the Stockholders’ Equity from the four previous quarters. The quotient of this division was multiplied by the number of periods in the year to arrive at the annual ratio. The calculation bases of returns were adjusted by the proposed dividend amounts after the balance sheet dates not yet approved at the annual shareholders ‘meeting or at the Board of Directors’ meetings. |
Assets
Portfolio of Securities and Derivative Financial Instruments
General information
We present below our portfolio of Financial assets at fair value through profit or loss – Securities, Financial Assets at Fair Value Through Other Comprehensive Income, Financial Assets at Amortized Cost and Derivative Financial Instruments as of December 31, 2020, 2019 and 2018.
The amounts exclude our investments in securities of unconsolidated companies. For further information on our investments in unconsolidated companies, see “Note 2.4I – Investments in Associates and Joint Ventures” to our audited consolidated financial statements. Financial assets held for trading and designated at fair value through profit or loss and Financial Assets at Fair Value Through Other Comprehensive Income are stated at fair value and Financial assets at amortized cost — Securities are stated at amortized cost. Please see “Note 2 – Significant Accounting Policies” to our audited consolidated financial statements for further details.
As of December 31, 2020, we held securities issued by the Brazilian federal government classified as “Government Securities – Domestic” with an aggregate book value and an aggregate market value of R$417,818 million and R$422,098 million, respectively, which represented 273.16% of our consolidated stockholders’ equity as of that date. As of December 31, 2019, we held securities issued by the Brazilian federal government classified as “Government Securities – Domestic” with an aggregate book value and an aggregate market value of R$324,673 million and R$327,681million, respectively, which represented 219.24% of our consolidated stockholders’ equity as of that date. As of December 31, 2018, we held securities issued by the Brazilian federal government classified as “Government Securities – Domestic” with an aggregate book value and an aggregate market value of R$298,352 million and R$300,172 million, respectively, which represented 199.49% of our consolidated stockholders’ equity as of that date. As of December 31, 2020, we did not hold securities of any other issuer the book value of which in the aggregate represented more than 10.0% of our consolidated stockholders’ equity. This is due to our conservative asset and liabilities management and our liquidity in local currency maintained in securities issued by the Brazilian federal government. Additionally, securities issued by the Brazilian federal government are accepted as deposits in our operations in the market on B3.
Financial Assets at Fair Value Through Profit or Loss and Designated at Fair Value Through Profit or Loss—Securities
Listed below are the assets acquired and accrued which are either available for sale in the short term or are part of a portfolio of financial instruments that are managed as a whole and for which there is a recent history of sales in the short term. Please see “Note 5 – Financial Assets at Fair Value Through Profit or Loss and Designated at Fair Value Through Profit or Loss - Securities” to our audited consolidated financial statements for further details.
88
| | | | | | | | | | | | | | | | | | | | | | | | | | | | | | | | | | | | |
| | | 12/31/2020 | | | 12/31/2019 | | | 12/31/2018 | |
| | | Cost | | | Adjustments
to Fair Value
(in Income) | | | Fair value | | | Cost | | | Adjustments
to Fair Value
(in Income) | | | Fair value | | | Cost | | | Adjustments
to Fair Value
(in Income) | | | Fair value | |
| | | (In millions of R$) | |
Investment funds | | | 15,407 | | | | (1,203 | ) | | | 14,204 | | | | 9,277 | | | | (1,010 | ) | | | 8,267 | | | | 5,253 | | | | (927 | ) | | | 4,326 | |
Brazilian government securities (1a) | | | 284,280 | | | | 1,605 | | | | 285,885 | | | | 218,548 | | | | 1,063 | | | | 219,611 | | | | 217,188 | | | | 1,139 | | | | 218,327 | |
Government securities – abroad (1b) | | | 8,199 | | | | 11 | | | | 8,210 | | | | 1,541 | | | | (21 | ) | | | 1,520 | | | | 2,066 | | | | 9 | | | | 2,075 | |
Argentina | | | 1,480 | | | | 18 | | | | 1,498 | | | | 349 | | | | (31 | ) | | | 318 | | | | 1,121 | | | | 8 | | | | 1,129 | |
Chile | | | 839 | | | | 1 | | | | 840 | | | | 487 | | | | 1 | | | | 488 | | | | 301 | | | | 1 | | | | 302 | |
Colombia | | | 3,599 | | | | 4 | | | | 3,603 | | | | 399 | | | | 10 | | | | 409 | | | | 207 | | | | — | | | | 207 | |
United States | | | 2,096 | | | | (11 | ) | | | 2,085 | | | | 141 | | | | — | | | | 141 | | | | 117 | | | | — | | | | 117 | |
Mexico | | | 5 | | | | — | | | | 5 | | | | 57 | | | | — | | | | 57 | | | | 120 | | | | — | | | | 120 | |
Paraguay | | | 3 | | | | — | | | | 3 | | | | 2 | | | | — | | | | 2 | | | | 1 | | | | — | | | | 1 | |
Peru | | | 4 | | | | 1 | | | | 5 | | | | 8 | | | | — | | | | 8 | | | | — | | | | — | | | | — | |
Uruguay | | | 40 | | | | 1 | | | | 41 | | | | 98 | | | | (1 | ) | | | 97 | | | | 84 | | | | — | | | | 84 | |
Italy | | | 133 | | | | (3 | ) | | | 130 | | | | — | | | | — | | | | — | | | | 115 | | | | — | | | | 115 | |
Corporate securities(1c) | | | 78,113 | | | | (1,081 | ) | | | 77,032 | | | | 51,744 | | | | (1,102 | ) | | | 50,642 | | | | 38,953 | | | | (505 | ) | | | 38,448 | |
Shares | | | 20,063 | | | | (1,016 | ) | | | 19,047 | | | | 15,459 | | | | (822 | ) | | | 14,637 | | | | 9,778 | | | | (332 | ) | | | 9,446 | |
Rural product note | | | 2,371 | | | | (22 | ) | | | 2,349 | | | | — | | | | — | | | | — | | | | — | | | | — | | | | — | |
Bank deposit certificates | | | 729 | | | | — | | | | 729 | | | | 792 | | | | — | | | | 792 | | | | 969 | | | | — | | | | 969 | |
Real estate receivables certificates | | | 561 | | | | (13 | ) | | | 548 | | | | 1,414 | | | | 30 | | | | 1,444 | | | | 1,391 | | | | 20 | | | | 1,411 | |
Debentures | | | 30,022 | | | | (85 | ) | | | 29,937 | | | | 12,958 | | | | (303 | ) | | | 12,655 | | | | 5,147 | | | | (187 | ) | | | 4,960 | |
Eurobonds and other | | | 2,341 | | | | 42 | | | | 2,383 | | | | 2,178 | | | | (5 | ) | | | 2,173 | | | | 1,403 | | | | (7 | ) | | | 1,396 | |
Financial bills | | | 15,784 | | | | (1 | ) | | | 15,783 | | | | 18,517 | | | | (3 | ) | | | 18,514 | | | | 19,724 | | | | — | | | | 19,724 | |
Promissory notes | | | 5,588 | | | | 28 | | | | 5,616 | | | | 313 | | | | — | | | | 313 | | | | 435 | | | | — | | | | 435 | |
Other | | | 654 | | | | (14 | ) | | | 640 | | | | 113 | | | | 1 | | | | 114 | | | | 106 | | | | 1 | | | | 107 | |
| | | | | | | | | | | | | | | | | | | | | | | | | | | | | | | | | | | | |
Total | | | 385,999 | | | | (668 | ) | | | 385,331 | | | | 281,110 | | | | (1,070 | ) | | | 280,040 | | | | 263,460 | | | | (284 | ) | | | 263,176 | |
| | | | | | | | | | | | | | | | | | | | | | | | | | | | | | | | | | | | |
| 1) | Financial assets at fair value through profit or loss – Securities pledged as Guarantee of Funding of Financial Institutions and Clients were: a) R$ 12.181 (R$ 28,759 at 12/31/2018 and R$ 30,114 at 12/31/2018), b) R$ 765 (R$ 329 at 12/31/2018 at R$ 131 at 12/31/2018) and c) R$ 8.556 (R$104 at 12/31/2019), totaling R$ 21.502 (R$ 30,245 at 12/31/2018 and R$ 30,245 at 12/31/2018). |
We note that Brazilian government securities represented over 74.4% of our portfolio of financial assets at fair value through profit or loss in 2020. Brazilian government securities classified at fair value through profit or loss represented 14.3% of our total assets in the same period. Please see “Item 3D. Risk Factors—Risks Associated with our Business—Credit Risks—We may incur losses associated with counterparty exposure risks, including the Brazilian federal government” for further details.
Assets at Fair Value Through Other Comprehensive Income
Listed below are financial assets that, according to our management’s understanding, may be sold in response to, or before changes in, market conditions and are not classified as financial assets at fair value through profit or loss, loans and receivables or held to maturity. Please see “Note 8 – Financial Assets at Fair Value Through Other Comprehensive Income – Securities” to our audited consolidated financial statements for further details.
| | | | | | | | | | | | | | | | | | | | | | | | | | | | | | | | | | | | | | | | | | | | | | | | |
| | | 12/31/2020 | | | 12/31/2019 | | | 12/31/2018 | |
| | | Cost | | | Fair value
adjustments (in
stockholders’
equity) | | | Expected
loss | | | Fair
value | | | Cost | | | Fair value
adjustments (in
stockholders’
equity) | | | Expected
loss | | | Fair
value | | | Cost | | | Fair value
adjustments (in
stockholders’
equity) | | | Expected
loss | | | Fair
value | |
| | | (In millions of R$) | |
Brazilian government securities (1a) | | | 65,235 | | | | 2,714 | | | | — | | | | 67,949 | | | | 48,718 | | | | 2,014 | | | | — | | | | 50,732 | | | | 27,064 | | | | 775 | | | | — | | | | 27,839 | |
Other | | | 36 | | | | — | | | | (36 | ) | | | — | | | | 36 | | | | — | | | | (36 | ) | | | — | | | | 36 | | | | — | | | | (36 | ) | | | — | |
Government securities – abroad (1b) | | | 34,365 | | | | 38 | | | | (1 | ) | | | 34,402 | | | | 20,638 | | | | (64 | ) | | | (3 | ) | | | 20,571 | | | | 18,844 | | | | (70 | ) | | | (2 | ) | | | 18,772 | |
Germany | | | — | | | | — | | | | — | | | | — | | | | 23 | | | | — | | | | — | | | | 23 | | | | 22 | | | | — | | | | — | | | | 22 | |
Colombia | | | 3,913 | | | | 73 | | | | — | | | | 3,986 | | | | 3,851 | | | | 27 | | | | — | | | | 3,878 | | | | 5,491 | | | | 14 | | | | — | | | | 5,505 | |
Chile | | | 21,639 | | | | 12 | | | | — | | | | 21,651 | | | | 11,119 | | | | 89 | | | | — | | | | 11,208 | | | | 7,647 | | | | 7 | | | | (1 | ) | | | 7,653 | |
United States | | | 3,751 | | | | (1 | ) | | | — | | | | 3,750 | | | | 2,758 | | | | (2 | ) | | | — | | | | 2,756 | | | | 2,634 | | | | (16 | ) | | | — | | | | 2,618 | |
France | | | — | | | | — | | | | — | | | | — | | | | — | | | | — | | | | — | | | | — | | | | 891 | | | | — | | | | — | | | | 891 | |
Italy | | | — | | | | — | | | | — | | | | — | | | | 328 | | | | 1 | | | | — | | | | 329 | | | | — | | | | — | | | | — | | | | — | |
Mexico | | | 1,180 | | | | 1 | | | | — | | | | 1,181 | | | | — | | | | | | | | | | | | | | | | — | | | | — | | | | — | | | | — | |
Paraguay | | | 3,008 | | | | (60 | ) | | | (1 | ) | | | 2,947 | | | | 1,957 | | | | (174 | ) | | | (3 | ) | | | 1,780 | | | | 1,601 | | | | (71 | ) | | | (1 | ) | | | 1,529 | |
Uruguay | | | 874 | | | | 13 | | | | — | | | | 887 | | | | 602 | | | | (5 | ) | | | — | | | | 597 | | | | 557 | | | | (4 | ) | | | — | | | | 553 | |
Other | | | — | | | | — | | | | — | | | | — | | | | — | | | | — | | | | — | | | | — | | | | 1 | | | | — | | | | — | | | | 1 | |
Corporate securities (1c) | | | 7,799 | | | | (152 | ) | | | (56 | ) | | | 7,591 | | | | 5,308 | | | | 96 | | | | (47 | ) | | | 5,357 | | | | 2,719 | | | | 40 | | | | (47 | ) | | | 2,712 | |
Shares | | | 1,640 | | | | (258 | ) | | | — | | | | 1,382 | | | | 83 | | | | 66 | | | | — | | | | 149 | | | | 77 | | | | 84 | | | | — | | | | 161 | |
Bank deposit certificates | | | 305 | | | | 2 | | | | — | | | | 307 | | | | 2,371 | | | | — | | | | — | | | | 2,371 | | | | 1,053 | | | | — | | | | — | | | | 1,053 | |
Securitized real estate loans | | | — | | | | — | | | | — | | | | — | | | | 25 | | | | 1 | | | | — | | | | 26 | | | | — | | | | — | | | | — | | | | — | |
Debentures | | | 956 | | | | (23 | ) | | | (44 | ) | | | 889 | | | | 387 | | | | (10 | ) | | | (43 | ) | | | 334 | | | | 44 | | | | — | | | | (42 | ) | | | 2 | |
Eurobonds and others | | | 4,895 | | | | 127 | | | | (9 | ) | | | 5,013 | | | | 2,439 | | | | 39 | | | | (1 | ) | | | 2,477 | | | | 1,542 | | | | (44 | ) | | | (2 | ) | | | 1,496 | |
Other | | | 3 | | | | — | | | | (3 | ) | | | — | | | | 3 | | | | 3 | | | | (3 | ) | | | — | | | | 3 | | | | — | | | | (3 | ) | | | — | |
| | | | | | | | | | | | | | | | | | | | | | | | | | | | | | | | | | | | | | | | | | | | | | | | |
Total | | | 107,435 | | | | 2,600 | | | | (93 | ) | | | 109,942 | | | | 74,700 | | | | 2,046 | | | | (86 | ) | | | 76,660 | | | | 48,663 | | | | 745 | | | | (85 | ) | | | 49,323 | |
| | | | | | | | | | | | | | | | | | | | | | | | | | | | | | | | | | | | | | | | | | | | | | | | |
| (1) | Financial assets at fair value through other comprehensive income—Securities pledged in guarantee of funding transactions of financial institutions and clients were: a) R$ 35,203 (R$ 27,864 at 12/31/2018 and R$ 25,147 at 12/31/2018 ), b) R$ 2,398 (R$ 590 at 12/31/2018 and R$ 3,583 at 12/31/2018) and c) 518 ( R$ 237 at 12/31/2018 ), totaling R$ 38,119 (R$ 28,454 at 12/31/2018 and R$ 28,967 at 12/31/2018); |
Brazilian government securities and corporate securities represented 61.8% and 6.9%, respectively, of our portfolio of assets at Fair Value Through Other Comprehensive Income in 2020. Brazilian government securities and corporate securities classified as assets at Fair Value Through Other Comprehensive Income, which are used as a hedge for our subordinated debt portfolio, represented 3.4% and 0.4%, respectively, of our total assets in the same period.
89
Financial Assets at Amortized Cost
Listed below are non-derivative financial assets that we have the intention and financial ability to held to maturity. Please see “Note 9– Financial assets at amortized cost – Securities” to our audited financial statements for further details.
| | | | | | | | | | | | | | | | | | | | | | | | | | | | | | | | | | | | |
| | | 12/31/2020 | | | 12/31/2019 | | | 12/31/2018 | |
| | | Amortized
cost | | | Expected
loss | | | Fair
Value | | | Amortized
cost | | | Expected
loss | | | Fair
Value | | | Amortized
cost | | | Expected
loss | | | Fair
Value | |
| | | (In millions of R$) | |
Brazilian government securities (1a) | | | 64,568 | | | | (44 | ) | | | 64,524 | | | | 56,355 | | | | (52 | ) | | | 56,303 | | | | 54,064 | | | | (58 | ) | | | 54,006 | |
Government securities – abroad (1b) | | | 19,095 | | | | (14 | ) | | | 19,081 | | | | 17,226 | | | | — | | | | 17,226 | | | | 6,700 | | | | (3 | ) | | | 6,697 | |
Colombia | | | 500 | | | | — | | | | 500 | | | | 335 | | | | — | | | | 335 | | | | 356 | | | | (3 | ) | | | 353 | |
Chile | | | 705 | | | | (1 | ) | | | 704 | | | | 621 | | | | — | | | | 621 | | | | 256 | | | | — | | | | 256 | |
Korea | | | 3,951 | | | | (4 | ) | | | 3,947 | | | | 3,427 | | | | — | | | | 3,427 | | | | 1,385 | | | | — | | | | 1,385 | |
Spain | | | 4,847 | | | | (3 | ) | | | 4,844 | | | | 4,984 | | | | — | | | | 4,984 | | | | 2,411 | | | | — | | | | 2,411 | |
United States | | | — | | | | — | | | | — | | | | 80 | | | | — | | | | 80 | | | | 19 | | | | — | | | | 19 | |
Mexico | | | 9,042 | | | | (6 | ) | | | 9,036 | | | | 7,763 | | | | — | | | | 7,763 | | | | 2,258 | | | | — | | | | 2,258 | |
Uruguay | | | 50 | | | | — | | | | 50 | | | | 16 | | | | — | | | | 16 | | | | 15 | | | | — | | | | 15 | |
Corporate securities (1c) | | | 46,141 | | | | (3,007 | ) | | | 43,134 | | | | 59,538 | | | | (2,601 | ) | | | 56,937 | | | | 49,631 | | | | (3,585 | ) | | | 46,046 | |
Rural product note | | | 3,499 | | | | (25 | ) | | | 3,474 | | | | 5,388 | | | | (47 | ) | | | 5,341 | | | | 4,181 | | | | (178 | ) | | | 4,003 | |
Bank deposit certificates | | | 30 | | | | — | | | | 30 | | | | 54 | | | | — | | | | 54 | | | | 123 | | | | — | | | | 123 | |
Securitized real estate loans | | | 4,806 | | | | (12 | ) | | | 4,794 | | | | 5,844 | | | | (2 | ) | | | 5,842 | | | | 9,876 | | | | (361 | ) | | | 9,515 | |
Debentures | | | 34,849 | | | | (2,952 | ) | | | 31,897 | | | | 41,053 | | | | (2,532 | ) | | | 38,521 | | | | 29,001 | | | | (3,013 | ) | | | 25,988 | |
Eurobonds and others | | | 209 | | | | (1 | ) | | | 208 | | | | 1,083 | | | | (1 | ) | | | 1,082 | | | | 4,005 | | | | (2 | ) | | | 4,003 | |
Promissory notes | | | 2,023 | | | | (10 | ) | | | 2,013 | | | | 5,001 | | | | (3 | ) | | | 4,998 | | | | 1,069 | | | | (14 | ) | | | 1,055 | |
Other | | | 725 | | | | (7 | ) | | | 718 | | | | 1,115 | | | | (16 | ) | | | 1,099 | | | | 1,376 | | | | (17 | ) | | | 1,359 | |
| | | | | | | | | | | | | | | | | | | | | | | | | | | | | | | | | | | | |
Total | | | 129,804 | | | | (3,065 | ) | | | 126,739 | | | | 133,119 | | | | (2,653 | ) | | | 130,466 | | | | 110,395 | | | | (3,646 | ) | | | 106,749 | |
| | | | | | | | | | | | | | | | | | | | | | | | | | | | | | | | | | | | |
| (1) | Financial Assets at Amortized Cost – Securities Pledged as Collateral of Funding Transactions of Financial Institutions and Clients were: a) R$ 13.786 (R$ 24,988 at 12/31/2019 and R$ 24,988 at 12/31/2018), b) R$ 14.364 (R$ 17,457 at 12/31/2019) and c) with no amount as of that date ( R$ 8,860 at 12/31/2018), totaling R$ 28.150 (R$ 27,040 at 12/31/2019 and R$ 33,848 at 12/31/2018). |
The fair value of Financial assets at amortized cost—Securities assets see “Note 28 – Fair Value of Financial Instruments” to our audited consolidated financial statements.
Derivatives
Derivatives are classified on the date of their acquisition in accordance with our management’s intention to use them as a hedging instrument, as determined by Brazilian regulations. Please see Note 6 – “Derivatives” of our audited financial statements for further details. Our derivatives portfolio (assets and liabilities) is composed of futures, forward, swaps, options and credit derivatives, as stated in the table below:
| | | | | | | | | | | | | | | | | | | | | | | | |
| | | As of December 31, | |
Derivative Financial Instruments | | 2020 | | | % of total | | | 2019 | | | % of total | | | 2018 | | | % of total | |
| | | (In millions of R$, except percentages) | |
Assets | | | | | | | | | | | | | | | | | | | | | | | | |
Options agreements | | | 20,418 | | | | 26.7 | | | | 8,456 | | | | 20.2 | | | | 4,215 | | | | 18.0 | |
Forwards (onshore) | | | 2,085 | | | | 2.7 | | | | 2,162 | | | | 5.2 | | | | 1,835 | | | | 7.8 | |
Swaps – adjustment receivable | | | 46,019 | | | | 60.2 | | | | 26,458 | | | | 63.2 | | | | 13,093 | | | | 55.8 | |
Credit derivatives | | | 156 | | | | 0.2 | | | | 167 | | | | 0.4 | | | | 120 | | | | 0.5 | |
NDF—Non Deliverable Foward | | | 7,596 | | | | 9.9 | | | | 4,446 | | | | 10.6 | | | | 3,711 | | | | 15.8 | |
Others—derivative financial instruments | | | 230 | | | | 0.3 | | | | 165 | | | | 0.4 | | | | 492 | | | | 2.1 | |
Total derivative financial instruments assets | | | 76,504 | | | | 100.0 | | | | 41,854 | | | | 100.0 | | | | 23,466 | | | | 100.0 | |
Derivative financial instruments as percentage of total assets | | | 3.8% | | | | | | | | 2.6% | | | | | | | | 1.5% | | | | | |
| | | | | | | | | | | | | | | | | | | | | | | | |
Liabilities | | | | | | | | | | | | | | | | | | | | | | | | |
Options agreements | | | (20,262 | ) | | | 25.5 | | | | (9,061 | ) | | | 18.9 | | | | (3,929 | ) | | | 14.3 | |
Forwards (onshore) | | | (905 | ) | | | 1.1 | | | | (754 | ) | | | 1.6 | | | | (470 | ) | | | 1.7 | |
Swaps – adjustment payable | | | (51,789 | ) | | | 65.1 | | | | (32,927 | ) | | | 68.8 | | | | (19,516 | ) | | | 70.9 | |
Credit derivatives | | | (76 | ) | | | 0.1 | | | | (40 | ) | | | 0.1 | | | | (140 | ) | | | 0.5 | |
NDF—Non Deliverable Foward | | | (6,426 | ) | | | 8.1 | | | | (4,971 | ) | | | 10.4 | | | | (3,384 | ) | | | 12.3 | |
Others—derivative financial instruments | | | (47 | ) | | | 0.1 | | | | (75 | ) | | | 0.2 | | | | (80 | ) | | | 0.3 | |
Total derivative financial instruments liabilities | | | (79,505 | ) | | | 100.0 | | | | (47,828 | ) | | | 100.0 | | | | (27,519 | ) | | | 100.0 | |
Derivative financial instruments as percentage of total liabilities and stockholder’s equity | | | 3.9% | | | | | | | | 2.9% | | | | | | | | 1.8% | | | | | |
| | | | | | | | | | | | | | | | | | | | | | | | |
90
| | | | | | | | | | | | | | | | | | | | | | | | | | | | | | | | | | | | | | | | | | | | | | | | |
| | | As of December 31, 2020 | |
Distribution of our financial
assets by maturity | | No stated maturity | | | Due in 1 year or less | | | Due after 1 year to
5 years | | | Due after 5 years to
10 years | | | Due after 10 years | | | Total | |
| | R$ | | | Average yield (%) | | | R$ | | | Average yield (%) | | | R$ | | | Average yield (%) | | | R$ | | | Average yield (%) | | | R$ | | | Average yield (%) | | | R$ | | | Average yield (%) | |
| | | | | | | | | | | | | | | (In millions of R$, except percentages) | | | | | | | | | | | | | |
At Fair Value Through Profit or Loss | | | 33,251 | | | | | | | | 152,183 | | | | | | | | 196,903 | | | | | | | | 58,715 | | | | | | | | 20,783 | | | | | | | | 461,835 | | | | | |
Investment funds (1) | | | 14,204 | | | | — | | | | — | | | | — | | | | — | | | | — | | | | — | | | | — | | | | — | | | | — | | | | 14,204 | | | | — | |
Government securities—domestic | | | — | | | | — | | | | 95,904 | | | | 2.9 | | | | 147,370 | | | | 1.9 | | | | 28,054 | | | | 7.8 | | | | 14,557 | | | | 3.2 | | | | 285,885 | | | | 2.9 | |
Government securities—abroad | | | — | | | | — | | | | 2,373 | | | | — | | | | 5,551 | | | | — | | | | 231 | | | | — | | | | 55 | | | | — | | | | 8,210 | | | | | |
Argentina | | | — | | | | — | | | | 1,250 | | | | 1.0 | | | | 235 | | | | 10.8 | | | | 9 | | | | 0.1 | | | | 4 | | | | 0.3 | | | | 1,498 | | | | 2.5 | |
United States | | | — | | | | — | | | | 208 | | | | 0.1 | | | | 1,877 | | | | 0.3 | | | | — | | | | — | | | | — | | | | — | | | | 2,085 | | | | 0.3 | |
Mexico | | | — | | | | — | | | | — | | | | — | | | | — | | | | — | | | | 4 | | | | 8.8 | | | | 1 | | | | 11.7 | | | | 5 | | | | 9.4 | |
Chile | | | — | | | | — | | | | 350 | | | | 0.0 | | | | 296 | | | | — | | | | 186 | | | | — | | | | 8 | | | | 8.9 | | | | 840 | | | | 0.1 | |
Paraguay | | | — | | | | — | | | | — | | | | — | | | | — | | | | 3.4 | | | | 3 | | | | 4.2 | | | | — | | | | — | | | | 3 | | | | 4.2 | |
Uruguay | | | — | | | | — | | | | 32 | | | | 1.1 | | | | 2 | | | | 7.6 | | | | 4 | | | | 7.5 | | | | 3 | | | | 14.7 | | | | 41 | | | | 3.0 | |
Colombia | | | — | | | | — | | | | 403 | | | | — | | | | 3,136 | | | | 3.5 | | | | 25 | | | | 3.8 | | | | 39 | | | | 0.5 | | | | 3,603 | | | | 3.1 | |
Italy | | | — | | | | — | | | | 130 | | | | 1.3 | | | | — | | | | — | | | | — | | | | — | | | | — | | | | — | | | | 130 | | | | 1.3 | |
Peru | | | — | | | | — | | | | — | | | | — | | | | 5 | | | | — | | | | — | | | | — | | | | — | | | | 7.3 | | | | 5 | | | | — | |
Corporate securities | | | 19,047 | | | | | | | | 18,770 | | | | | | | | 23,729 | | | | | | | | 9,315 | | | | | | | | 6,171 | | | | | | | | 77,032 | | | | | |
Shares | | | 19,047 | | | | — | | | | — | | | | — | | | | — | | | | — | | | | — | | | | — | | | | — | | | | — | | | | 19,047 | | | | — | |
Securitized real estate loans | | | — | | | | — | | | | 2 | | | | 0.3 | | | | 205 | | | | 0.2 | | | | 7 | | | | 0.8 | | | | 334 | | | | 1.4 | | | | 548 | | | | 0.9 | |
Bank deposit certificates | | | — | | | | — | | | | 729 | | | | 1.2 | | | | — | | | | — | | | | — | | | | — | | | | — | | | | — | | | | 729 | | | | 1.2 | |
Debentures | | | — | | | | — | | | | 1,836 | | | | 1.1 | | | | 14,653 | | | | 0.0 | | | | 8,055 | | | | 0.8 | | | | 5,393 | | | | 6.4 | | | | 29,937 | | | | 1.5 | |
Eurobonds and other | | | — | | | | — | | | | 488 | | | | 2.6 | | | | 1,173 | | | | 4.5 | | | | 529 | | | | 7.1 | | | | 193 | | | | 14.6 | | | | 2,383 | | | | 5.5 | |
Financial credit bills | | | — | | | | — | | | | 11,443 | | | | 0.2 | | | | 4,078 | | | | 0.4 | | | | 11 | | | | — | | | | 251 | | | | — | | | | 15,783 | | | | 0.2 | |
Promissory notes | | | — | | | | — | | | | 3,175 | | | | 3.4 | | | | 2,441 | | | | 3.0 | | | | — | | | | — | | | | — | | | | — | | | | 5,616 | | | | 3.2 | |
Rural product note | | | — | | | | — | | | | 946 | | | | 5.5 | | | | 765 | | | | 4.0 | | | | 638 | | | | 0.4 | | | | — | | | | — | | | | 2,349 | | | | 3.6 | |
Other | | | — | | | | — | | | | 151 | | | | 0.4 | | | | 414 | | | | 0.5 | | | | 75 | | | | 0.3 | | | | — | | | | — | | | | 640 | | | | 0.5 | |
| | | | | | | | | | | | | | | | | | | | | | | | | | | | | | | | | | | | | | | | | | | | | | | | |
Financial assets designated at fair value through profit or loss—Government securities—domestic—Brazilian external debt bonds | | | — | | | | | | | | 1,826 | | | | | | | | 1,914 | | | | | | | | — | | | | | | | | — | | | | | | | | 3,740 | | | | | |
| | | | | | | | | | | | | | | | | | | | | | | | | | | | | | | | | | | | | | | | | | | | | | | | |
Derivatives | | | — | | | | | | | | 35,136 | | | | | | | | 20,253 | | | | | | | | 21,115 | | | | | | | | | | | | | | | | 76,504 | | | | | |
| | | | | | | | | | | | | | | | | | | | | | | | | | | | | | | | | | | | | | | | | | | | | | | | |
At Fair Value Through Other Comprehensive Income | | | 1,382 | | | | | | | | 31,490 | | | | | | | | 54,452 | | | | | | | | 14,853 | | | | | | | | 7,765 | | | | | | | | 109,942 | | | | | |
Government securities—domestic | | | — | | | | — | | | | 10,456 | | | | 5.3 | | | | 38,065 | | | | 8.8 | | | | 12,094 | | | | 10.6 | | | | 7,334 | | | | 11.3 | | | | 67,949 | | | | 8.9 | |
Government securities—abroad | | | — | | | | | | | | 19,525 | | | | | | | | 12,986 | | | | | | | | 1,501 | | | | | | | | 390 | | | | | | | | 34,402 | | | | | |
United States | | | — | | | | — | | | | 3,749 | | | | 0.0 | | | | 1 | | | | — | | | | — | | | | — | | | | — | | | | — | | | | 3,750 | | | | 0.0 | |
Mexico | | | — | | | | — | | | | 1,181 | | | | 9.0 | | | | — | | | | — | | | | — | | | | — | | | | — | | | | — | | | | 1,181 | | | | 9.0 | |
Chile | | | — | | | | — | | | | 10,420 | | | | 0.0 | | | | 9,548 | | | | 0.3 | | | | 1,488 | | | | — | | | | 195 | | | | 0.6 | | | | 21,651 | | | | 0.2 | |
Paraguay | | | — | | | | — | | | | 2,652 | | | | 2.6 | | | | 101 | | | | 1.6 | | | | — | | | | — | | | | 194 | | | | 3.2 | | | | 2,947 | | | | 2.6 | |
Uruguay | | | — | | | | — | | | | 818 | | | | 4.7 | | | | 55 | | | | 0.9 | | | | 13 | | | | 0.5 | | | | 1 | | | | 0.7 | | | | 887 | | | | 4.4 | |
Colombia | | | — | | | | — | | | | 705 | | | | 1.6 | | | | 3,281 | | | | 2.7 | | | | — | | | | — | | | | — | | | | — | | | | 3,986 | | | | 2.5 | |
Corporate securities | | | 1,382 | | | | — | | | | 1,509 | | | | — | | | | 3,401 | | | | — | | | | 1,258 | | | | — | | | | 41 | | | | — | | | | 7,591 | | | | — | |
Shares | | | 1,382 | | | | — | | | | — | | | | — | | | | — | | | | — | | | | — | | | | — | | | | — | | | | — | | | | 1,382 | | | | — | |
Bank deposit certificates | | | — | | | | — | | | | 303 | | | | 0.3 | | | | 4 | | | | 3.1 | | | | — | | | | — | | | | — | | | | — | | | | 307 | | | | 0.4 | |
Debentures | | | — | | | | — | | | | — | | | | — | | | | 46 | | | | — | | | | 843 | | | | 1.9 | | | | — | | | | — | | | | 889 | | | | 1.8 | |
Eurobonds and others | | | — | | | | — | | | | 1,206 | | | | 0.2 | | | | 3,351 | | | | 0.8 | | | | 415 | | | | 5.2 | | | | 41 | | | | 6.0 | | | | 5,013 | | | | 1.1 | |
| | | | | | | | | | | | | | | | | | | | | | | | | | | | | | | | | | | | | | | | | | | | | | | | |
At Amortized Cost | | | — | | | | | | | | 37,672 | | | | | | | | 55,070 | | | | | | | | 23,697 | | | | | | | | 10,300 | | | | | | | | 126,739 | | | | | |
Government securities—domestic | | | — | | | | — | | | | 18,311 | | | | 12.3 | | | | 29,912 | | | | 26.1 | | | | 8,005 | | | | 1.7 | | | | 8,296 | | | | 15.9 | | | | 64,524 | | | | 17.9 | |
Government securities—abroad | | | — | | | | | | | | 14,323 | | | | | | | | 4,382 | | | | | | | | 356 | | | | | | | | 20 | | | | | | | | 19,081 | | | | | |
Colombia | | | — | | | | — | | | | 500 | | | | 0.1 | | | | — | | | | — | | | | — | | | | — | | | | — | | | | — | | | | 500 | | | | 0.1 | |
Chile | | | — | | | | — | | | | 180 | | | | 2.1 | | | | 168 | | | | 2.9 | | | | 356 | | | | 7.1 | | | | — | | | | — | | | | 704 | | | | 4.8 | |
Korea | | | — | | | | — | | | | 1,329 | | | | 0.6 | | | | 2,618 | | | | 0.3 | | | | — | | | | — | | | | — | | | | — | | | | 3,947 | | | | 0.4 | |
Spain | | | — | | | | — | | | | 3,248 | | | | 0.7 | | | | 1,596 | | | | 0.2 | | | | — | | | | — | | | | — | | | | — | | | | 4,844 | | | | 0.6 | |
Mexico | | | — | | | | — | | | | 9,036 | | | | 5.3 | | | | — | | | | — | | | | — | | | | — | | | | — | | | | — | | | | 9,036 | | | | 5.3 | |
Uruguay | | | — | | | | — | | | | 30 | | | | — | | | | — | | | | — | | | | — | | | | — | | | | 20 | | | | — | | | | 50 | | | | — | |
Corporate securities | | | — | | | | | | | | 5,038 | | | | | | | | 20,776 | | | | | | | | 15,336 | | | | | | | | 1,984 | | | | | | | | 43,134 | | | | | |
Rural product note | | | — | | | | — | | | | 891 | | | | 3.3 | | | | 1,956 | | | | 0.9 | | | | 627 | | | | 0.4 | | | | — | | | | — | | | | 3,474 | | | | 1.5 | |
Bank deposit certificates | | | — | | | | 0.1 | | | | — | | | | — | | | | 30 | | | | 0.2 | | | | — | | | | — | | | | — | | | | — | | | | 30 | | | | 0.2 | |
Securitized real estate loans | | | — | | | | — | | | | 229 | | | | 1.1 | | | | 2,013 | | | | 1.7 | | | | 1,898 | | | | 0.3 | | | | 654 | | | | 0.1 | | | | 4,794 | | | | 0.9 | |
Debentures | | | — | | | | — | | | | 3,299 | | | | 10.6 | | | | 14,489 | | | | 1.5 | | | | 12,779 | | | | 2.9 | | | | 1,330 | | | | 12.5 | | | | 31,897 | | | | 3.5 | |
Eurobonds and other | | | — | | | | — | | | | 85 | | | | 0.2 | | | | 123 | | | | 0.9 | | | | — | | | | — | | | | — | | | | — | | | | 208 | | | | 0.6 | |
Promissory notes | | | — | | | | — | | | | 481 | | | | 10.0 | | | | 1,520 | | | | 4.2 | | | | 12 | | | | 3.8 | | | | — | | | | — | | | | 2,013 | | | | 5.6 | |
Other | | | — | | | | — | | | | 53 | | | | — | | | | 645 | | | | — | | | | 20 | | | | — | | | | — | | | | — | | | | 718 | | | | — | |
| (1) | Average yields are not shown for these securities, as such yields are not meaningful because future yields are not quantifiable. These securities have been excluded from the calculation of the total yield. |
91
| | | | | | | | | | | | | | | | | | | | |
| | | Securities | | | Derivatives | | | | |
Distribution of our financial assets by currency | | Amortized Cost | | | Fair Value
Through Profit
or Loss | | | Fair Value
Through other
Comprehensive
Income | | | Fair Value
Through Profit
or Loss | | | Total | |
| | | (In millions of R$) | |
As of December 31, 2020 | | | 126,739 | | | | 389,071 | | | | 109,942 | | | | 76,504 | | | | 702,256 | |
Denominated in Brazilian currency | | | 100,083 | | | | 360,885 | | | | 46,704 | | | | 9,794 | | | | 517,466 | |
Denominated in Brazilian currency and indexed by foreign currency(1) | | | — | | | | 4,833 | | | | 2,298 | | | | 8,436 | | | | 15,567 | |
Denominated in foreign currency(1) | | | 26,656 | | | | 23,353 | | | | 60,940 | | | | 58,274 | | | | 169,223 | |
As of December 31, 2019 | | | 130,466 | | | | 281,075 | | | | 76,660 | | | | 41,854 | | | | 530,055 | |
Denominated in Brazilian currency | | | 109,555 | | | | 267,612 | | | | 38,139 | | | | 7,974 | | | | 423,280 | |
Denominated in Brazilian currency and indexed by foreign currency(1) | | | — | | | | 3,444 | | | | 853 | | | | 2,231 | | | | 6,528 | |
Denominated in foreign currency(1) | | | 20,911 | | | | 10,019 | | | | 37,668 | | | | 31,649 | | | | 100,247 | |
As of December 31, 2018 | | | 106,749 | | | | 263,180 | | | | 49,323 | | | | 23,466 | | | | 442,718 | |
Denominated in Brazilian currency | | | 82,191 | | | | 248,921 | | | | 14,055 | | | | 9,321 | | | | 354,488 | |
Denominated in Brazilian currency and indexed by foreign currency(1) | | | — | | | | 3,242 | | | | 801 | | | | 2,526 | | | | 6,569 | |
Denominated in foreign currency(1) | | | 24,558 | | | | 11,017 | | | | 34,467 | | | | 11,619 | | | | 81,661 | |
| | | | | | | | | | | | | | | | | | | | |
| (1) | Predominantly U.S. dollars. |
For the purpose of analyzing the exposure of variations in foreign exchange rates, the table below presents the composition of our derivative financial instruments as of December 31, 2020 in reais and in foreign currency, including the instruments denominated in foreign currencies. For the notional amount of derivative financial instruments, please see “Note 6 – Derivatives” to our audited consolidated financial statements.
92
| | | | | | | | | | | | |
| | | As of December 31, 2020 | |
Derivative financial instruments (notional amounts) | | Brazilian Currency | | | Denominated
in or linked to
Foreign Currency | | | Total | |
| | | (In millions of R$) | |
Swap contracts
Buy (Sale) commitments, net | | | (2,941 | ) | | | 2,941 | | | | — | |
Forward contracts
Buy (Sale) commitments, net | | | 2,090 | | | | 13,138 | | | | 15,228 | |
Future contracts
Buy (Sale) commitments, net | | | (92,969 | ) | | | (12,154 | ) | | | (105,123 | ) |
Option contracts
Buy (Sale) commitments, net | | | 1,917 | | | | 8,648 | | | | 10,565 | |
Others
Buy (Sale) commitments, net | | | 15,827 | | | | 2 | | | | 15,829 | |
| | | | | | | | | | | | |
Reserve Requirements
Brazilian financial institutions are required to place reserves with the Central Bank. The reserve requirements are tools utilized by the Central Bank to control the liquidity of the Brazilian financial system, for both monetary policy and risk mitigation purposes. These requirements are applied to balances on demand deposits, saving account deposits and time deposits. The below table sets forth the required reserve for each type of deposit:
93
| | | | | | | | | | | | | | | | | | | | | | |
Required reserve deposits | | Regulation(1) | | Yield | | 2020 | | 2019 | | | 2018 | | | 2017 | | | 2016 | |
Demand Deposits | |
Compulsory | | Circular No. 3,917 | | Zero | | 21% | | | 21% | | | | 21% | | | | 40% | | | | 45% | |
Rural (2) | | Resolution No. 4,669 | | Zero | | 30% | | | 30% | | | | 30% | | | | 34% | | | | 34% | |
Microcredit (2) | | Resolution No. 4,861 | | Zero | | 2% | | | 2% | | | | 2% | | | | 2% | | | | 2% | |
| | | | | | | | | | | | | | | | | | | | | | |
Savings Accounts (3) | |
Compulsory | | Circular No. 3,975 | | TR + 6.17% p.a. | | 20.0% | | | 20.0% | | | | 20.0% | | | | 24.5% | | | | 24.5% | |
Real estate financing (2) | | Resolution No. 4,676 | | 80% (TR + 6.17% p.a.) | | 65% | | | 65% | | | | 65% | | | | 65% | | | | 65% | |
| | | | | | | | | | | | | | | | | | | | | | |
Time and Interbank Deposits Received from Leasing Companies | | | | | | | | | | | | | | | | | | | | | | |
Compulsory | | Circular No. 3,916 | | SELIC | | 17% | | | 31% | | | | 33% | | | | 36% | | | | 25% | |
| | | | | | | | | | | | | | | | | | | | | | |
| (1) | Most recent regulation on the matter. |
| (2) | This is a compulsory investment of resources that is made in eligible transactions, that is, the funds are granted to other economic entities. |
| (3) | Remuneration on funds in savings deposits: |
For deposits made until March 5, 2012, inclusive: TR + 6.17% per annum.
For deposits made after March 5, 2012: (a) If the target of the Selic rate is higher than 8.5% per annum: TR + 6.17% per annum; (b) If the target of the Selic rate is lower than 8.5% per annum: TR + 70% of the target of the Selic rate per annum.
In 2020 the Central Bank modified the rules of the reserve requirements that changed the amount of money in economy. The deductions from saving account deposits and time deposit aim to reduce the medium-term and long-term credit costs resulting from the economic effects of the COVID-19 pandemic.
As of December 31, 2020, we recorded R$90,059 million in compulsory deposits in cash compared to R$91,248 million as of December 31, 2019 and R$83,133 million in interest-bearing deposits as of December 31, 2020 compared to R$86,836 million as of December 31, 2019.
| | | | | | | | | | | | |
| | | 2020 | | 2019 | | 2018 |
Required reserve deposits | | R$ | | % of total
required
reserve
deposits | | R$ | | % of total
required
reserve
deposits | | R$ | | % of total
required
reserve
deposits |
| | | (In millions of R$, except percentages) |
Non-interest bearing deposits (1) | | 6,926 | | 7.7 | | 4,412 | | 4.8 | | 5,600 | | 5.9 |
Interest-bearing deposits (2) | | 83,133 | | 92.3 | | 86,836 | | 95.2 | | 88,548 | | 94.1 |
Total | | 90,059 | | 100.0 | | 91,248 | | 100.0 | | 94,148 | | 100.0 |
| | | | | | | | | | | | |
| (1) | Mainly related to demand deposits. |
| (2) | Mainly related to time and savings deposits. |
Loan and lease operations
Most of our loans are granted to clients domiciled in Brazil and are denominated in Brazilian reais. Additionally, 45.4% of our credit portfolio consists of transactions with fixed interest rates and 54.6% of our credit portfolio consists of transactions with variable interest rates.
Indexation
Most of our portfolio is denominated in Brazilian reais. However, a portion of our portfolio is indexed to foreign currencies, primarily the U.S. dollar. The foreign currency portion of our portfolio consists of loans and financing for foreign trade and on lending operations. Our loans abroad represented 34.4%, 34.1% and 35.6% of our loan portfolio as of December 31, 2020, 2019 and 2018, respectively, see “Note 32 – Risk and Capital Management, 1.4. Maximum Exposure of Financial Assets to Credit Risk” to our audited consolidated financial statements for further details.
Loan and lease operations by type
The following table sets forth the distribution of our credit portfolio according to the type of loan and lease operations, as follows:
| | • | | The Individuals portfolio consists primarily of credit cards, personal loans (primarily including consumer finance and overdrafts), payroll loans, vehicle financing and residential mortgage loans; |
| | • | | The Corporate portfolio consists primarily of loans made to large corporate clients; |
| | • | | The Small and Medium Businesses portfolio consists primarily of loans to small and medium-sized companies; and |
| | • | | The Foreign Loans – Latin America portfolio consists of loans granted to individuals and companies by our operations in Argentina, Chile, Colombia, Paraguay and Uruguay. |
94
| | | | | | | | | | | | | | | | | | | | | | | | |
| | | 2020 | | | 2019 | | | 2018 | |
Loan and Lease Operations, by type(1) | | Loan | | | Allowance(2) | | | Loan | | | Allowance(2) | | | Loan | | | Allowance(2) | |
| | | (In millions of R$) | |
Individuals | | | 255,483 | | | | 21,130 | | | | 240,490 | | | | 19,453 | | | | 212,564 | | | | 14,425 | |
Corporate | | | 134,521 | | | | 7,953 | | | | 100,789 | | | | 6,885 | | | | 102,643 | | | | 9,367 | |
Small and Medium Businesses | | | 121,955 | | | | 6,369 | | | | 90,733 | | | | 4,549 | | | | 68,812 | | | | 4,532 | |
Foreign Loans Latin America (3) | | | 202,145 | | | | 12,870 | | | | 153,779 | | | | 6,621 | | | | 152,072 | | | | 5,185 | |
| | | | | | | | | | | | | | | | | | | | | | | | |
Total Loan operations and lease operations portfolio | | | 714,104 | | | | 48,322 | | | | 585,791 | | | | 37,508 | | | | 536,091 | | | | 33,509 | |
| | | | | | | | | | | | | | | | | | | | | | | | |
| (1) | We classify all loans and leases more than 60 days overdue as non-accrual loans and we discontinue accruing financial income related to them. The contractual amount of non-accrual loans were R$22,611 million, R$23,555 million and R$22,369 million as of December 31, 2020, 2019 and 2018, respectively. The total of renegotiated loans in the balance of non-accrual loans reflected herein was R$5,944 million, R$4,092 million and R$4,973 million as of December 31, 2020, 2019 and 2018, respectively. Non-accrual loans are presented herein in the appropriate category of loan and lease operations. |
| (2) | Comprises Provision for Expected Loss for Financial Guarantees Pledged R$907 million (R$837 million and R$1,191 million as of December 31, 2019 and 2018) and Commitments to be Released R$3,485 million (R$3,303 million and R$2,601 million as of December 31, 2019 and 2018). |
| (3) | As of December 31, 2020 other than “Foreign Loans Latin America”, 20% of Corporate and 14% of Small and Medium Businesses correspond to cross-border outstanding. |
Loan and lease operations by maturity
The following table sets forth the distribution of our credit portfolio by maturity, including non-overdue and overdue installments, according to the type of loan and lease:
| | | | | | | | | | | | | | | | | | | | | | | | | | | | |
Non-Overdue Installments | | 12/31/2020 | |
Type of loan and lease | | Due in
30 days or less | | | Due in
31-90 days | | | Due in
91-180 days | | | Due in
181-360 days | | | Due in
one year
to five years | | | Due after
five years | | | Total
Non-Overdue
Installments | |
| | | (In millions of R$) | |
| Individuals | | | 38,677 | | | | 32,704 | | | | 28,364 | | | | 32,060 | | | | 79,572 | | | | 33,473 | | | | 244,850 | |
| Corporate | | | 12,434 | | | | 20,632 | | | | 20,749 | | | | 22,385 | | | | 51,695 | | | | 5,246 | | | | 133,141 | |
| Small and Medium Businesses | | | 12,217 | | | | 20,897 | | | | 13,164 | | | | 20,787 | | | | 52,024 | | | | 795 | | | | 119,884 | |
| Foreign Loans Latin America | | | 15,502 | | | | 19,911 | | | | 23,176 | | | | 20,860 | | | | 67,432 | | | | 50,665 | | | | 197,546 | |
| Total (1) | | | 78,830 | | | | 94,144 | | | | 85,453 | | | | 96,092 | | | | 250,723 | | | | 90,179 | | | | 695,421 | |
| | | | | | | | | | | | | | | | | | | | | | | | | | | | |
| (1) | Includes R$8,986 million related to non-overdue installments of the non-accrual loans. |
| | | | | | | | | | | | | | | | | | | | | | | | | | | | |
Non-Overdue Installments | | 12/31/2019 | |
Type of loan and lease | | Due in
30 days or less | | | Due in
31-90 days | | | Due in
91-180 days | | | Due in
181-360 days | | | Due in
one year
to five years | | | Due after
five years | | | Total
Non-Overdue
Installments | |
| | | (In millions of R$) | |
Individuals | | | 41,009 | | | | 34,884 | | | | 27,907 | | | | 30,161 | | | | 68,822 | | | | 24,283 | | | | 227,066 | |
Corporate | | | 12,307 | | | | 12,508 | | | | 16,894 | | | | 16,334 | | | | 34,716 | | | | 7,199 | | | | 99,958 | |
Small and Medium Businesses | | | 16,612 | | | | 18,048 | | | | 10,624 | | | | 14,929 | | | | 27,492 | | | | 624 | | | | 88,329 | |
Foreign Loans Latin America | | | 13,097 | | | | 16,683 | | | | 15,212 | | | | 17,419 | | | | 52,173 | | | | 34,591 | | | | 149,175 | |
Total (1) | | | 83,025 | | | | 82,123 | | | | 70,637 | | | | 78,843 | | | | 183,203 | | | | 66,697 | | | | 564,528 | |
| | | | | | | | | | | | | | | | | | | | | | | | | | | | |
| (1) | Includes R$8,454 million related to non-overdue installments of the non-accrual loans. |
| | | | | | | | | | | | | | | | | | | | | | | | | | | | |
Non-Overdue Installments | | 12/31/2018 | |
Type of loan and lease | | Due in
30 days or less | | | Due in
31-90 days | | | Due in
91-180 days | | | Due in
181-360 days | | | Due in
one year
to five years | | | Due after
five years | | | Total
Non-Overdue
Installments | |
| | | (In millions of R$) | |
Individuals | | | 36,728 | | | | 28,842 | | | | 22,681 | | | | 23,435 | | | | 57,329 | | | | 32,529 | | | | 201,544 | |
Corporate | | | 10,224 | | | | 11,813 | | | | 14,912 | | | | 14,748 | | | | 36,995 | | | | 12,056 | | | | 100,748 | |
Small and Medium Businesses | | | 12,143 | | | | 14,567 | | | | 8,346 | | | | 11,047 | | | | 20,188 | | | | 165 | | | | 66,456 | |
Foreign Loans Latin America | | | 14,862 | | | | 15,779 | | | | 15,716 | | | | 17,301 | | | | 49,848 | | | | 34,274 | | | | 147,780 | |
Total (1) | | | 73,957 | | | | 71,001 | | | | 61,655 | | | | 66,531 | | | | 164,360 | | | | 79,024 | | | | 516,528 | |
| | | | | | | | | | | | | | | | | | | | | | | | | | | | |
| (1) | Includes R$8,786 million related to non-overdue installments of the non-accrual loans. |
95
| | | | | | | | | | | | | | | | | | | | | | | | | | | | | | | | | | | | | | | | |
Overdue Installments(1) | | 12/31/2020 | |
Type of loan and lease | | 01-30
days | | | 31-60
days | | | 61-90
days | | | 91-180
days | | | 181-360
days | | | One year
or more | | | Total
overdue
installments | | | Total
gross loans | | | Allowance
for loan losses | | | Total net | |
| | | (In millions of R$) | |
Individuals | | | 1,313 | | | | 728 | | | | 748 | | | | 2,008 | | | | 3,996 | | | | 1,840 | | | | 10,633 | | | | 255,483 | | | | (21,130 | ) | | | 234,353 | |
Corporate | | | 463 | | | | 331 | | | | 241 | | | | 127 | | | | 175 | | | | 43 | | | | 1,380 | | | | 134,521 | | | | (7,953 | ) | | | 126,568 | |
Small and Medium Businesses | | | 413 | | | | 196 | | | | 172 | | | | 398 | | | | 474 | | | | 418 | | | | 2,071 | | | | 121,955 | | | | (6,369 | ) | | | 115,586 | |
Foreign Loans Latin America | | | 1,921 | | | | 572 | | | | 290 | | | | 698 | | | | 947 | | | | 171 | | | | 4,599 | | | | 202,145 | | | | (12,870 | ) | | | 189,275 | |
Total (2) | | | 4,110 | | | | 1,827 | | | | 1,451 | | | | 3,231 | | | | 5,592 | | | | 2,472 | | | | 18,683 | | | | 714,104 | | | | (48,322 | ) | | | 665,782 | |
| (1) | Defined as loans and leases contractually past due as to payment of interest or principal. |
| (2) | Includes R$ 13,625 million related to overdue installments of the non-accrual loans. |
| | | | | | | | | | | | | | | | | | | | | | | | | | | | | | | | | | | | | | | | |
Overdue Installments(1) | | 12/31/2019 | |
Type of loan and lease | | 01-30
days | | | 31-60
days | | | 61-90
days | | | 91-180
days | | | 181-360
days | | | One year
or more | | | Total
overdue
installments | | | Total
gross loans | | | Allowance
for loan losses | | | Total net | |
| | | (In millions of R$) | |
Individuals | | | 1,908 | | | | 1,102 | | | | 1,191 | | | | 3,186 | | | | 4,181 | | | | 1,856 | | | | 13,424 | | | | 240,490 | | | | (19,453 | ) | | | 221,037 | |
Corporate | | | 368 | | | | 38 | | | | 139 | | | | 173 | | | | 111 | | | | 2 | | | | 831 | | | | 100,789 | | | | (6,885 | ) | | | 93,904 | |
Small and Medium Businesses | | | 582 | | | | 231 | | | | 191 | | | | 507 | | | | 504 | | | | 389 | | | | 2,404 | | | | 90,733 | | | | (4,549 | ) | | | 86,184 | |
Foreign Loans Latin America | | | 2,146 | | | | 646 | | | | 344 | | | | 643 | | | | 673 | | | | 152 | | | | 4,604 | | | | 153,779 | | | | (6,621 | ) | | | 147,158 | |
Total (2) | | | 5,004 | | | | 2,017 | | | | 1,865 | | | | 4,509 | | | | 5,469 | | | | 2,399 | | | | 21,263 | | | | 585,791 | | | | (37,508 | ) | | | 548,283 | |
| (1) | Defined as loans and leases contractually past due as to payment of interest or principal. |
| (2) | Includes R$15,101 million related to overdue installments of the non-accrual loans. |
| | | | | | | | | | | | | | | | | | | | | | | | | | | | | | | | | | | | | | | | |
Overdue Installments (1) | | 12/31/2018 | |
Type of loan and lease | | 01-30
days | | | 31-60
days | | | 61-90
days | | | 91-180
days | | | 181-360
days | | | One year
or more | | | Total
overdue
installments | | | Total
gross loans | | | Allowance
for loan losses | | | Total net | |
| | | (In millions of R$) | |
Individuals | | | 1,596 | | | | 886 | | | | 941 | | | | 2,347 | | | | 3,116 | | | | 2,134 | | | | 11,020 | | | | 212,564 | | | | (14,425 | ) | | | 198,139 | |
Corporate | | | 568 | | | | 281 | | | | 631 | | | | 176 | | | | 236 | | | | 3 | | | | 1,895 | | | | 102,643 | | | | (9,367 | ) | | | 93,276 | |
Small and Medium Businesses | | | 478 | | | | 207 | | | | 155 | | | | 390 | | | | 466 | | | | 660 | | | | 2,356 | | | | 68,812 | | | | (4,532 | ) | | | 64,280 | |
Foreign Loans Latin America | | | 2,110 | | | | 598 | | | | 324 | | | | 465 | | | | 443 | | | | 352 | | | | 4,292 | | | | 152,072 | | | | (5,185 | ) | | | 146,887 | |
Total (2) | | | 4,752 | | | | 1,972 | | | | 2,051 | | | | 3,378 | | | | 4,261 | | | | 3,149 | | | | 19,563 | | | | 536,091 | | | | (33,509 | ) | | | 502,582 | |
| (1) | Defined as loans and leases contractually past due as to payment of interest or principal. |
| (2) | Includes R$13,583 million related to overdue installments of the non-accrual loans. |
Loan and Lease Operations by interest rate
The following table sets forth the classification of our credit portfolio into fixed and variable rates, including non-overdue and overdue installments:
96
| | | | | | | | | | | | | | | | | | | | | | | | | | | | |
| | | 12/31/2020 | |
Non-Overdue Installments | | Due in
30 days
or less | | | Due in
31-90
days | | | Due in
91-180
days | | | Due in
181-360
days | | | Due in
one year
to five
years | | | Due
after
five
years | | | Total Non-
Overdue
Installments | |
| | | (In millions of R$) | |
Interest rate of loans to customers by maturity | | | | | | | | | | | | | | | | | | | | | | | | | | | | |
Variable rates | | | 22,139 | | | | 44,581 | | | | 41,260 | | | | 44,080 | | | | 147,098 | | | | 85,079 | | | | 384,237 | |
Fixed rates | | | 56,691 | | | | 49,563 | | | | 44,193 | | | | 52,012 | | | | 103,625 | | | | 5,100 | | | | 311,184 | |
Total (1) | | | 78,830 | | | | 94,144 | | | | 85,453 | | | | 96,092 | | | | 250,723 | | | | 90,179 | | | | 695,421 | |
| | | | | | | | | | | | | | | | | | | | | | | | | | | | |
| (1) | Includes R$8,986 million related to non-overdue installments of the non-accrual loans. |
| | | | | | | | | | | | | | | | | | | | | | | | | | | | |
| | | 12/31/2019 | |
Non-Overdue Installments | | Due in
30 days
or less | | | Due in
31-90
days | | | Due in
91-180
days | | | Due in
181-360
days | | | Due in
one year
to five
years | | | Due
after
five
years | | | Total Non-
Overdue
Installments | |
| | | (In millions of R$) | |
Interest rate of loans to customers by maturity | | | | | | | | | | | | | | | | | | | | | | | | | | | | |
Variable rates | | | 21,113 | | | | 34,706 | | | | 29,566 | | | | 34,968 | | | | 108,615 | | | | 64,412 | | | | 293,380 | |
Fixed rates | | | 61,912 | | | | 47,417 | | | | 41,071 | | | | 43,875 | | | | 74,588 | | | | 2,285 | | | | 271,148 | |
Total (1) | | | 83,025 | | | | 82,123 | | | | 70,637 | | | | 78,843 | | | | 183,203 | | | | 66,697 | | | | 564,528 | |
| | | | | | | | | | | | | | | | | | | | | | | | | | | | |
| (1) | Includes R$8,454 million related to non-overdue installments of the non-accrual loans. |
| | | | | | | | | | | | | | | | | | | | | | | | | | | | |
| | | 12/31/2018 | |
Non-Overdue Installments | | Due in
30 days
or less | | | Due in
31-90
days | | | Due in
91-180
days | | | Due in
181-360
days | | | Due in
one year
to five
years | | | Due
after
five
years | | | Total Non-
Overdue
Installments | |
| | | (In millions of R$) | |
Interest rate of loans to customers by maturity | | | | | | | | | | | | | | | | | | | | | | | | | | | | |
Variable rates | | | 21,129 | | | | 30,729 | | | | 26,210 | | | | 29,854 | | | | 96,461 | | | | 76,828 | | | | 281,211 | |
Fixed rates | | | 52,828 | | | | 40,272 | | | | 35,445 | | | | 36,677 | | | | 67,899 | | | | 2,196 | | | | 235,317 | |
Total (1) | | | 73,957 | | | | 71,001 | | | | 61,655 | | | | 66,531 | | | | 164,360 | | | | 79,024 | | | | 516,528 | |
| | | | | | | | | | | | | | | | | | | | | | | | | | | | |
| (1) | Includes R$8,786 million related to non-overdue installments of the non-accrual loans. |
| | | | | | | | | | | | | | | | | | | | | | |
| | | 12/31/2020 | | |
Overdue Installments (1) | | 01-30
days | | | 31-60
days | | 61-90
days | | 91-180
days | | | 181-360
days | | | One
year
or
more | | Total
overdue
installments | | Total
gross
loans |
| | | (In millions of R$) | | |
Interest rate of loans to customers by maturity | | | | | | | | | | | | | | | | | | | | | | |
Variable rates | | | 2,178 | | | 922 | | 541 | | | 808 | | | | 1,130 | | | 242 | | 5,821 | | 390,058 |
Fixed rates | | | 1,932 | | | 906 | | 910 | | | 2,423 | | | | 4,461 | | | 2,230 | | 12,862 | | 324,046 |
Total (2) | | | 4,110 | | | 1,828 | | 1,451 | | | 3,231 | | | | 5,591 | | | 2,472 | | 18,683 | | 714,104 |
| | | | | | | | | | | | | | | | | | | | | | |
| (1) | Defined as loans and leases contractually past due as to payment of interest or principal. |
| (2) | Includes R$13,625 millon related to overdue installments of the non-accrual loans. |
| | | | | | | | | | | | | | | | | | | | | | |
| | | 12/31/2019 |
Overdue Installments (1) | | 01-30
days | | | 31-60
days | | 61-90
days | | 91-180
days | | | 181-360
days | | | One
year
or
more | | Total
overdue
installments | | Total
gross
loans |
| | | (In millions of R$) |
Interest rate of loans to customers by maturity | | | | | | | | | | | | | | | | | | | | | | |
Variable rates | | | 2,547 | | | 699 | | 491 | | | 753 | | | | 762 | | | 163 | | 5,415 | | 298,795 |
Fixed rates | | | 2,457 | | | 1,318 | | 1,374 | | | 3,756 | | | | 4,707 | | | 2,236 | | 15,848 | | 286,996 |
Total (2) | | | 5,004 | | | 2,017 | | 1,865 | | | 4,509 | | | | 5,469 | | | 2,399 | | 21,263 | | 585,791 |
| | | | | | | | | | | | | | | | | | | | | | |
| (1) | Defined as loans and leases contractually past due as to payment of interest or principal. |
| (2) | Includes R$15,101 million related to overdue installments of the non-accrual loans. |
| | | | | | | | | | | | | | | | | | | | | | |
| | | 12/31/2018 |
Overdue Installments (1) | | 01-30
days | | | 31-60
days | | 61-90
days | | 91-180
days | | | 181-360
days | | | One
year
or
more | | Total
overdue
installments | | Total
gross
loans |
| | | (In millions of R$) |
Interest rate of loans to customers by maturity | | | | | | | | | | | | | | | | | | | | | | |
Variable rates | | | 2,484 | | | 792 | | 962 | | | 617 | | | | 702 | | | 387 | | 5,944 | | 287,155 |
Fixed rates | | | 2,268 | | | 1,180 | | 1,089 | | | 2,761 | | | | 3,559 | | | 2,762 | | 13,619 | | 248,936 |
Total (2) | | | 4,752 | | | 1,972 | | 2,051 | | | 3,378 | | | | 4,261 | | | 3,149 | | 19,563 | | 536,091 |
| | | | | | | | | | | | | | | | | | | | | | |
| (1) | Defined as loans and leases contractually past due as to payment of interest or principal. |
| (2) | Includes R$13,583 million related to overdue installments of the non-accrual loans. |
Loan and Lease Operations by economic activity
The following table sets forth the composition of our credit portfolio, including non-accrual loan operations, by economic activity of the borrower:
97
As of December 31, 2020 there was no concentration of loan and lease operations exceeding 10% of the total portfolio that had not been disclosed in a category of loan and losses.
| | | | | | | | | | | | |
| | | 12/31/2020 | | 12/31/2019 | | 12/31/2018 |
Economic Activities | | Loan
portfolio | | % of Loan
portfolio | | Loan
portfolio | | % of Loan
portfolio | | Loan
portfolio | | % of Loan
portfolio |
| | | (In millions of R$, except percentages) |
Industry and commerce | | 163,784 | | 22.9 | | 129,998 | | 22.2 | | 115,225 | | 21.5 |
Services | | 172,322 | | 24.1 | | 126,718 | | 21.6 | | 119,487 | | 22.3 |
Individuals | | 340,433 | | 47.7 | | 302,382 | | 51.6 | | 271,991 | | 50.7 |
Other sectors | | 37,565 | | 5.3 | | 26,693 | | 4.6 | | 29,388 | | 5.5 |
Total | | 714,104 | | 100.0 | | 585,791 | | 100.0 | | 536,091 | | 100.0 |
| | | | | | | | | | | | |
Loan and Lease Operations by concentration
The following table sets forth the composition of our credit portfolio by concentration with respect to the amounts owed by the debtors:
| | | | | | | | | | | | |
| | | 12/31/2020 | | 12/31/2019 | | 12/31/2018 |
Concentration | | Loan
portfolio | | % of Loan
portfolio | | Loan
portfolio | | % of Loan
portfolio | | Loan
portfolio | | % of Loan
portfolio |
| | | (In millions of R$, except percentages) |
Largest debtor | | 7,243 | | 1.0 | | 5,389 | | 0.9 | | 5,193 | | 1.0 |
10 largest debtors | | 37,863 | | 5.3 | | 29,340 | | 5.0 | | 31,564 | | 5.9 |
20 largest debtors | | 54,812 | | 7.7 | | 44,712 | | 7.6 | | 47,433 | | 8.8 |
50 largest debtors | | 83,438 | | 11.7 | | 71,965 | | 12.3 | | 73,358 | | 13.7 |
100 largest debtors | | 112,333 | | 15.7 | | 97,695 | | 16.7 | | 98,675 | | 18.4 |
| | | | | | | | | | | | |
Rating of the Loan and Lease Portfolio
The following table sets forth the rating of our loan and lease portfolio based on the probability of default for the periods indicated below.
98
| | | | | | | | |
| | | 12/31/2020 |
Internal Rating | | Stage 1 | | Stage 2 | | Stage 3 | | Total loans |
| | | (In millions of R$, except percentages) |
Lower Risk | | 501,463 | | 13,172 | | — | | 514,635 |
Satisfactory | | 84,193 | | 37,249 | | — | | 121,442 |
Higher Risk | | 1,552 | | 15,822 | | — | | 17,374 |
Credit-Impaired | | — | | — | | 60,653 | | 60,653 |
Total | | 587,208 | | 66,243 | | 60,653 | | 714,104 |
| | | | | | | | |
% | | 82.2 | | 9.3 | | 8.5 | | 100.0 |
| | | | | | | | |
| | | | | | | | |
| | | 12/31/2019 |
Internal Rating | | Stage 1 | | Stage 2 | | Stage 3 | | Total loans |
| | | (In millions of R$, except percentages) |
Lower Risk | | 420,936 | | 4,204 | | — | | 425,140 |
Satisfactory | | 80,106 | | 17,871 | | — | | 97,977 |
Higher Risk | | 847 | | 19,845 | | — | | 20,692 |
Credit-Impaired | | — | | — | | 41,982 | | 41,982 |
Total | | 501,889 | | 41,920 | | 41,982 | | 585,791 |
| | | | | | | | |
% | | 85.6 | | 7.2 | | 7.2 | | 100.0 |
| | | | | | | | |
| | | | | | | | |
| | | 12/31/2018 |
Internal Rating | | Stage 1 | | Stage 2 | | Stage 3 | | Total loans |
| | | (In millions of R$, except percentages) |
Lower Risk | | 385,846 | | 4,536 | | — | | 390,382 |
Satisfactory | | 72,921 | | 19,723 | | — | | 92,644 |
Higher Risk | | 859 | | 12,635 | | — | | 13,494 |
Credit-Impaired | | — | | — | | 39,571 | | 39,571 |
Total | | 459,626 | | 36,894 | | 39,571 | | 536,091 |
| | | | | | | | |
% | | 85.7 | | 6.9 | | 7.4 | | 100.0 |
| | | | | | | | |
For individual, small and middle-market companies, the credit rating is attributed based on application of statistical models (in the early phases of the client relationship) and behavior score (used for clients with which we already have a relationship).
For large companies, the credit rating is based on information such as the counterparty’s economic and financial condition, their cash-generating capability, the economic group to which they belong, and the current and prospective situation of the economic sector in which they operate. The credit proposals are analyzed on a case-by-case basis, through an approval-level mechanism.
We strictly control the credit exposure of clients and counterparties, taking action to address situations in which the actual exposure exceeds the desired one. For this purpose, contractually provided actions can be taken, such as early settlement or the requirement of additional collateral.
The risk ratings are grouped into the following four categories:
| | (i) | Lower risk: probability of default (PD) lower or equal than 4.44% |
| | (ii) | Satisfactory: PD from 4.44% up to 25.95% |
| | (iii) | Higher risk: PD higher than 25.95%; and |
| | (iv) | Credit-Impaired: loans classified in Stage 3 |
Non-accrual Loans
We consider a loan to be a non-accrual loan if the payment of principal or interest is in default for 60 days or more. When this occurs, accrual of interest is no longer recognized.
Write-offs
99
When there is no reasonable expectation of recovery of a financial asset, considering historical curves, we carry out a total or partial write-off concurrently with the use of the related allowance for expected credit loss, with no effect on our Consolidated Statement of Income. Subsequent recoveries of amounts previously written off are accounted for as income in our Consolidated Statement of Income.
Information on the Quality of Loans and Leases
The table below shows our non-accrual loans together with certain asset quality ratios.
| | | | | | | | | | | | | | | | | | | | |
| | | 12/31/2020 | | | 12/31/2019 | | | 12/31/2018 | | | 12/31/2017(2) | | | 12/31/2016(2) | |
| | | (In millions of R$, except percentages) | |
Non-accrual loans | | | 22,611 | | | | 23,555 | | | | 22,369 | | | | 23,340 | | | | 24,284 | |
Allowance for loan losses (1) | | | 48,322 | | | | 37,508 | | | | 33,509 | | | | 36,469 | | | | 34,525 | |
Total loans and leases operations portfolio | | | 714,104 | | | | 585,791 | | | | 536,091 | | | | 497,719 | | | | 494,851 | |
Non-accrual loans as a percentage of total loans (%) | | | 3.2 | | | | 4.0 | | | | 4.2 | | | | 4.7 | | | | 4.9 | |
Allowance for loan losses as a percentage of total loans (%) | | | 6.8 | | | | 6.4 | | | | 6.3 | | | | 7.3 | | | | 7.0 | |
Allowance for loan losses as a percentage of non-accrual loans (%) | | | 213.7 | | | | 159.2 | | | | 149.8 | | | | 156.3 | | | | 142.2 | |
| | | | | | | | | | | | | | | | | | | | |
| (1) | Comprises Provision for Expected Loss for Financial Guarantees Pledged R$ 907 million (R$ 837 million and R$ 1,191 million as of December 31,2019 and 2018) and Commitments to be Released R$ 3,303 million (R$ 3,485 million and R$ 2,601 million as of December 31,2019 and 2018). |
| (2) | Restated to take into account the effect of IFRS9, which we retroactively adopted as of January 1, 2016. |
Impairment
The requirements for assessing the impairment of financial assets are based on an expected credit loss model.
The expected credit loss model includes the use of prospective information and classification of financial assets in three stages:
| | • | | Stage 1 – 12-month expected credit loss: represents default events possible within 12 months. Applicable to financial assets originated or purchased without credit recovery issues; |
| | • | | Stage 2 – Lifetime expected credit loss of financial instrument: considers all possible default events. Applicable to financial assets originated or purchased without credit recovery issues and which credit risk has increased significantly; and |
| | • | | Stage 3 – Credit loss expected for credit-impaired assets: considers all possible default events. Applicable to financial assets originated or purchased with credit recovery issues. The measurement of assets classified in this stage is different from Stage 2 due to the recognition of interest income by applying the effective interest rate at amortized cost (net of provision) rather than at the gross carrying amount. |
An asset will migrate from one stage to another as its credit risk increases or decreases. Therefore, a financial asset that began in Stage 1 and migrated to Stage 2 and 3 may return to Stage 1, unless it was originated or purchased with credit recovery issues.
| | | | | | | | | | | | | | | | | | | | |
Allowance for Loan and Leases Losses (1) | | 12/31/2020 | | | 12/31/2019 | | | 12/31/2018 | | | 12/31/2017(2) | | | 12/31/2016(2) | |
| | | (In millions of R$, except percentages) | |
Amount Recognized in the Balance Sheet at the beginning of period | | | 37,508 | | | | 33,509 | | | | 36,469 | | | | 34,525 | | | | 32,033 | |
Write-offs | | | (13,638 | ) | | | (14,299 | ) | | | (13,547 | ) | | | (16,437 | ) | | | (19,974 | ) |
Individuals | | | (11,764 | ) | | | (9,710 | ) | | | (8,520 | ) | | | (10,728 | ) | | | (12,103 | ) |
Corporate | | | 570 | | | | (868 | ) | | | (1,172 | ) | | | (956 | ) | | | (2,995 | ) |
Small and Medium Businesses | | | (1,836 | ) | | | (2,011 | ) | | | (2,471 | ) | | | (3,648 | ) | | | (3,862 | ) |
Foreign Loans Latin America | | | (608 | ) | | | (1,710 | ) | | | (1,384 | ) | | | (1,105 | ) | | | (1,014 | ) |
Expected Loss with Loan Operations and Lease Operations | | | 24,452 | | | | 18,298 | | | | 10,587 | | | | 18,381 | | | | 22,466 | |
Amount Recognized in the Balance Sheet at the end of period | | | 48,322 | | | | 37,508 | | | | 33,509 | | | | 36,469 | | | | 34,525 | |
Net Write-offs | | | (13,638 | ) | | | (14,299 | ) | | | (13,547 | ) | | | (16,437 | ) | | | (19,974 | ) |
Ratio of Write-offs during the period to average loans outstanding during the period (%) | | | 2.1 | | | | 2.5 | | | | 2.6 | | | | 3.4 | | | | 4.1 | |
Ratio of allowance for loan losses to total loans and leases (%) | | | 6.8 | | | | 6.4 | | | | 6.3 | | | | 7.3 | | | | 7.0 | |
| | | | | | | | | | | | | | | | | | | | |
| (1) | Receivables are partially written off based on an estimate of recovery on a portfolio level. The recovery of receivables partially written off is the recovery on a contract level adjusted by the reduction in the estimate of remaining receivables of the portfolio. As of December 31, 2020 the recovery of loans were R$ 1.149 million. According to the criteria applicable and published on our 2017 form 20-F write offs for 2017 and 2016 were respectively R$19,823 million and R$24,251 million. The recovery of loans for 2017 and 2016 were respectively R$3,698 million and R$3,742 million. |
| (2) | Restated to take into account the effect of IFRS9, which we retroactively adopted as of January 1, 2016. |
100
During the year ended December 31, 2020, we wrote off a total amount of R$13,638 million from our loan portfolio and our ratio of the allowance for loan and lease losses to total loans and leases was 6.8%.
During the year ended December 31, 2019, we wrote off a total amount of R$14,299 million from our loan portfolio and our ratio of the allowance for loan and lease losses to total loans and leases was 6.4%.
During the year ended December 31, 2018, we wrote off a total amount of R$13,547 million from our loan portfolio and our ratio of the allowance for loan and lease losses to total loans and leases was 6.3%. The decrease in loans written off the previous year, is a result of the adoption of a policy of stricter selectivity in origination of credits.
During the year ended December 31, 2017, we wrote off a total amount of R$16,437 million from our loan portfolio and our ratio of the allowance for loan and lease losses to total loans and leases was 7.3%.
During the year ended December 31, 2016, we wrote off a total amount of R$19,974 million from our loan portfolio and our ratio of the allowance for loan and lease losses to total loans and leases was 7.0%.
Allocation of the Allowance for Loan and Lease Losses
The table below presents the details, by segment and class, as defined in the segmentation of our portfolio, of the allowance for loan and lease losses, of this allowance as a percentage of the total loan and lease losses for the corresponding segment or class, and the percentage of the total loan and leases in each segment and class in relation to the total loans and leases.
| | | | | | | | | | | | | | | | | | | | | | | | | | | | | | | | | | | | | | | | | | | | | | | | | | | | | | | | | | | | |
| | | 12/31/2020 | | | 12/31/2019 | | | 12/31/2018 | | | 12/31/2017 (2) | | | 12/31/2016 (2) | |
| | | Allocated
allowance(1)
| | | Allocated
allowance
as a % of
total
loans and
leases | | | Loans
category
as a %
of total
loans | | | Allocated
allowance(1)
| | | Allocated
allowance
as a % of
total
loans and
leases | | | Loans
category
as a %
of total
loans | | | Allocated
allowance(1)
| | | Allocated
allowance
as a % of
total
loans and
leases | | | Loans
category
as a %
of total
loans | | | Allocated
allowance(1)
| | | Allocated
allowance
as a % of
total
loans and
leases | | | Loans
category
as a %
of total
loans | | | Allocated
allowance | | | Allocated
allowance
as a % of
total
loans and
leases | | | Loans
category
as a %
of total
loans | |
| | | (In millions of R$, except percentages) | |
Individuals | | | 21,130 | | | | 3.0 | | | | 35.8 | | | | 19,453 | | | | 3.3 | | | | 41.1 | | | | 14,425 | | | | 2.7 | | | | 39.7 | | | | 14,830 | | | | 2.9 | | | | 38.9 | | | | 14,790 | | | | 3.0 | | | | 37.7 | |
Corporate | | | 7,953 | | | | 1.1 | | | | 18.8 | | | | 6,885 | | | | 1.2 | | | | 17.2 | | | | 9,367 | | | | 1.7 | | | | 19.1 | | | | 11,452 | | | | 2.3 | | | | 21.6 | | | | 11,089 | | | | 2.2 | | | | 24.6 | |
Small and Medium Businesses | | | 6,369 | | | | 0.9 | | | | 17.1 | | | | 4,549 | | | | 0.8 | | | | 15.5 | | | | 4,532 | | | | 0.8 | | | | 12.8 | | | | 5,404 | | | | 1.1 | | | | 12.1 | | | | 6,366 | | | | 1.3 | | | | 12.1 | |
Foreign Loans Latin America | | | 12,870 | | | | 1.8 | | | | 28.3 | | | | 6,621 | | | | 1.1 | | | | 26.2 | | | | 5,185 | | | | 1.0 | | | | 28.4 | | | | 4,783 | | | | 1.0 | | | | 27.4 | | | | 2,280 | | | | 0.5 | | | | 25.6 | |
Total | | | 48,322 | | | | 6.8 | | | | 100.0 | | | | 37,508 | | | | 6.4 | | | | 100.0 | | | | 33,509 | | | | 6.2 | | | | 100.0 | | | | 36,469 | | | | 7.3 | | | | 100.0 | | | | 34,525 | | | | 7.0 | | | | 100.0 | |
| | | | | | | | | | | | | | | | | | | | | | | | | | | | | | | | | | | | | | | | | | | | | | | | | | | | | | | | | | | | |
| (1) | Comprises Provision for Expected Loan for Financial Guarantees Pledged R$ 907 million( R$ 837 million and R$ 1,191 million as of December 31,2019 and 2018) and Commitments to be Released R$ 3,485 million( R$ 3,303 million and R$ 2,601 million as of December 31,2019 and 2018). |
| (2) | Restated to take into account the effect of IFRS9, which we retroactively adopted as of January 1, 2016. |
Renegotiated loans include both loans for which the corresponding credit agreement’s original terms were amended (amendments) and new loans originated in order to settle past due contracts or transactions with the same client (restructured loans). Amendments and restructured loans usually reflect changes in contract terms, rates or payment conditions.
Renegotiated loans return to non-performing and non-accrual status when they are 60 days past due under the renegotiated terms, which typically corresponds to the borrower missing two or more payments.
The fact that a loan or lease has been renegotiated is also taken into consideration when determining the allowance for loan and lease losses after the renegotiation. The past performance and the payment history of the client and the transaction, including the probability of another default for renegotiated transactions, are considered in our risk models in order to determine the probability of default. This probability of default is generally higher than the probability assigned to similar transactions that have never been renegotiated. Another factor considered in determining the appropriate level of the allowance for loan and lease losses is the additional collateral to be offered by the debtor. The resulting allowance levels are compatible with the risk profile of each transaction.
Our renegotiated loan portfolio decreased to 3.4% of our total loan portfolio as of December 31, 2020, compared to 3.0% as of December 31, 2019. At the end of 2020, the ratio of the renegotiated portfolio to the allowance for loan and lease losses was 33.6% compared to 34.1% as of December 31, 2019.
Our renegotiated loan portfolio decreased to 3.0% of our total loan portfolio as of December 31, 2019, compared to 3.3% as of December 31, 2018. At the end of 2019, the ratio of the renegotiated portfolio to the allowance for loan and lease losses was 34.1% compared to 36.2% as of December 31, 2018.
Our renegotiated loan portfolio decreased to 3.3% of our total loan portfolio as of December 31, 2018, compared to 3.8% as of December 31, 2017. At the end of 2018, the ratio of the renegotiated portfolio to the allowance for loan and lease losses was 36.2% compared to 36.0% as of December 31, 2017.
101
Our renegotiated loan portfolio increased to 3.8% of our total loan portfolio as of December 31, 2017, compared to 3.6% as of December 31, 2016. At the end of 2017, the ratio of the renegotiated portfolio to the allowance for loan and lease losses was 36.0% compared to 35.2% as of December 31, 2016.
Since 2013, we maintain our policy for the recovery of overdue loans, including loans already written off as losses, and to reduce losses, we enhanced our collection and recovery initiatives. We also adopted a policy of stricter selectivity in origination of loans, which led to lower levels of delinquency and a decreased volume of renegotiated loans.
The tables below present an additional breakdown of renegotiated loans by portfolio, in segments and types, based on the type of modification, as of December 31, 2020, 2019 and 2018:
| | | | | | | | |
| | | As of December 31, 2020 |
Renegotiated loan and lease operations | | Stage 1 | | Stage 2 | | Stage 3 | | Total |
| | | (In millions of R$) |
Individuals | | 322 | | 750 | | 9,422 | | 10,494 |
Corporate | | 82 | | 434 | | 3,342 | | 3,858 |
Small and medium businesses | | 149 | | 927 | | 5,306 | | 6,382 |
Foreign loans—Latin America | | 104 | | 1,228 | | 2,085 | | 3,417 |
Total renegotiated loan and lease operations | | 657 | | 3,339 | | 20,155 | | 24,151 |
| | | | | | | | |
| | | | | | | | |
Renegotiated loan and lease operations | | As of December 31, 2019 |
| | Stage 1 | | Stage 2 | | Stage 3 | | Total |
| | | (In millions of R$) |
Individuals | | 220 | | 683 | | 7,267 | | 8,170 |
Corporate | | 60 | | 182 | | 3,661 | | 3,903 |
Small and medium businesses | | 87 | | 469 | | 2,913 | | 3,469 |
Foreign loans—Latin America | | 223 | | 643 | | 1,263 | | 2,129 |
Total renegotiated loan and lease operations | | 590 | | 1,977 | | 15,104 | | 17,671 |
| | | | | | | | |
| | | | | | | | |
Renegotiated loan and lease operations | | As of December 31, 2018 |
| | Stage 1 | | Stage 2 | | Stage 3 | | Total |
| | | (In millions of R$) |
Individuals | | 259 | | 545 | | 6,495 | | 7,299 |
Corporate | | 43 | | 767 | | 3,906 | | 4,716 |
Small and medium businesses | | 90 | | 417 | | 3,240 | | 3,747 |
Foreign loans—Latin America | | 140 | | 697 | | 1,116 | | 1,953 |
Total renegotiated loan and lease operations | | 532 | | 2,426 | | 14,757 | | 17,715 |
| | | | | | | | |
Renegotiated Loans
The following tables present an additional breakdown of renegotiated loans and leases by segment and class, as of December 31, 2020, 2019 and 2018:
102
| | | | | | | | | | | | | | | | | | | | |
Renegotiated loan and lease operations | | As of December 31, 2020 | |
| | Impaired
performing | | | Non-impaired
performing | | | Impaired non-
performing | | | Non-impaired
non-performing | | | Total | |
| | | (In millions of R$) | |
Individuals | | | 4,338 | | | | 794 | | | | 5,085 | | | | 278 | | | | 10,495 | |
Corporate | | | 2,648 | | | | 516 | | | | 694 | | | | — | | | | 3,858 | |
Small and medium businesses | | | 2,467 | | | | 881 | | | | 2,839 | | | | 194 | | | | 6,381 | |
Foreign loans—Latin America | | | 1,394 | | | | 1,207 | | | | 690 | | | | 126 | | | | 3,417 | |
Total renegotiated loan and lease operations | | | 10,847 | | | | 3,398 | | | | 9,308 | | | | 598 | | | | 24,151 | |
| | | | | | | | | | | | | | | | | | | | |
| | | | | | | | | | | | | | | | | | | | |
Renegotiated loan and lease operations | | As of December 31, 2019 | |
| | Impaired
performing | | | Non-impaired
performing | | | Impaired
non- performing | | | Non-impaired
non-performing | | | Total | |
| | | (In millions of R$) | |
Individuals | | | 3,659 | | | | 749 | | | | 3,608 | | | | 154 | | | | 8,170 | |
Corporate | | | 2,619 | | | | 195 | | | | 1,042 | | | | 47 | | | | 3,903 | |
Small and medium businesses | | | 1,352 | | | | 410 | | | | 1,561 | | | | 146 | | | | 3,469 | |
Foreign loans—Latin America | | | 652 | | | | 738 | | | | 612 | | | | 127 | | | | 2,129 | |
Total renegotiated loan and lease operations | | | 8,282 | | | | 2,092 | | | | 6,823 | | | | 474 | | | | 17,671 | |
| | | | | | | | | | | | | | | | | | | | |
| | | | | | | | | | | | | | | | | | | | |
Renegotiated loan and lease operations | | As of December 31, 2018 | |
| | Impaired
performing | | | Non-impaired
performing | | | Impaired
non- performing | | | Non-impaired
non-performing | | | Total | |
| | | (In millions of R$) | |
Individuals | | | 3,367 | | | | 672 | | | | 3,129 | | | | 131 | | | | 7,299 | |
Corporate | | | 2,459 | | | | 748 | | | | 1,447 | | | | 62 | | | | 4,716 | |
Small and medium businesses | | | 1,312 | | | | 372 | | | | 1,927 | | | | 136 | | | | 3,747 | |
Foreign loans—Latin America | | | 619 | | | | 711 | | | | 497 | | | | 126 | | | | 1,953 | |
Total renegotiated loan and lease operations | | | 7,757 | | | | 2,503 | | | | 7,000 | | | | 455 | | | | 17,715 | |
| | | | | | | | | | | | | | | | | | | | |
| | | | | | | | | | | | | | | | | | | | |
| | | Year Ended December 31, | |
| | | 2020 | | | 2019 | | | 2018 | | | 2017 (3) | | | 2016(3) | |
| | | (In millions of R$, except percentages) | |
Renegotiated loans (1) (2) | | | 24,151 | | | | 17,671 | | | | 17,715 | | | | 18,784 | | | | 17,960 | |
Allowance for loan and lease losses | | | 8,122 | | | | 6,027 | | | | 6,414 | | | | 6,756 | | | | 6,315 | |
Allowance for loan and lease losses/renegotiated loans (%) | | | 33.6 | | | | 34.1 | | | | 36.2 | | | | 36.0 | | | | 35.2 | |
| | | | | | | | | | | | | | | | | | | | |
| (1) | Includes debt consolidation, deferment or any other arrangement that modifies the periods or conditions, of operations originally overdue. |
| (2) | Renegotiated Loans Overdue over 30 days. |
| (3) | Restated to take into account the effect of IFRS9, which we retroactively adopted as of January 1, 2016. |
103
| | | | | | | | | | | | | | | | | | | | |
| | | As of December 31, 2020 | |
Type of Loan | | Total Renegotiated
Loans | | | Total Allowance for
Loan Losses | | | Allowance for Loan
Losses/Renegotiated
Loans (%) | | | Total Redefaulted
Renegotiated
Loans (1) | | | Redefaulted
Renegotiated
Loans (%) | |
| | | (In millions of R$, except percentages) | |
Restructured Loans | | | 18,819 | | | | 6,312 | | | | 33.5 | | | | 5,187 | | | | 27.6 | |
Agreements | | | 5,332 | | | | 1,810 | | | | 33.9 | | | | 757 | | | | 14.2 | |
Total | | | 24,151 | | | | 8,122 | | | | 33.6 | | | | 5,944 | | | | 24.6 | |
| | | | | | | | | | | | | | | | | | | | |
| (1) | Our redefaulted renegotiated loans are renegotiated transactions 60 days or more overdue. |
| | | | | | | | | | | | | | | | | | | | |
| | | As of December 31, 2019 | |
Type of Loan | | Total Renegotiated
Loans | | | Total Allowance for
Loan Losses | | | Allowance for Loan
Losses/Renegotiated
Loans (%) | | | Total Redefaulted
Renegotiated
Loans (1) | | | Redefaulted
Renegotiated
Loans (%) | |
| | | (In millions of R$, except percentages) | |
Restructured Loans | | | 13,957 | | | | 4,452 | | | | 31.9 | | | | 3,198 | | | | 22.9 | |
Agreements | | | 3,714 | | | | 1,575 | | | | 42.4 | | | | 894 | | | | 24.1 | |
Total | | | 17,671 | | | | 6,027 | | | | 34.1 | | | | 4,092 | | | | 23.2 | |
| | | | | | | | | | | | | | | | | | | | |
| (1) | Our redefaulted renegotiated loans are renegotiated transactions 60 days or more overdue. |
| | | | | | | | | | | | | | | | | | | | |
| | | As of December 31, 2018 | |
Type of Loan | | Total Renegotiated
Loans | | | Total Allowance for
Loan Losses | | | Allowance for Loan
Losses/Renegotiated
Loans (%) | | | Total Redefaulted
Renegotiated
Loans (1) | | | Redefaulted
Renegotiated
Loans (%) | |
| | | (In millions of R$, except percentages) | |
Restructured Loans | | | 13,096 | | | | 4,173 | | | | 31.9 | | | | 3,681 | | | | 28.1 | |
Agreements | | | 4,619 | | | | 2,241 | | | | 48.5 | | | | 1,292 | | | | 28.0 | |
Total | | | 17,715 | | | | 6,414 | | | | 36.2 | | | | 4,973 | | | | 28.1 | |
| | | | | | | | | | | | | | | | | | | | |
| (1) | Our redefaulted renegotiated loans are renegotiated transactions 60 days or more overdue. |
The table below presents the changes in our loan and lease portfolio with loss event, including the changes of the renegotiated loans and leases with loss event related to each year as of December 31, 2020, 2019 and 2018:
| | | | | | | | | | | | |
Impaired loans | | 2020 | | | 2019 | | | 2018 | |
| | | (In millions of R$) | |
Balance at the beginning of the period | | | 41,982 | | | | 39,571 | | | | 44,439 | |
(+) Loan operations added | | | 54,898 | | | | 32,958 | | | | 27,215 | |
(-) Loans removed due to write-off | | | (13,638 | ) | | | (14,299 | ) | | | (13,547 | ) |
(-) Loans removed due to total or partial pay-off | | | (22,589 | ) | | | (16,248 | ) | | | (18,536 | ) |
Balance at the end of the period | | | 60,653 | | | | 41,982 | | | | 39,571 | |
| | | | | | | | | | | | |
Please see “Note 10 – Loan Operations and Lease Operations” to our audited consolidated financial statements for further details.
Cross border outstanding
Cross border outstanding are monetary assets which are denominated in non-local currency and exceeded 1% of our total assets in the case of transactions with foreign clients entered into by our subsidiaries in the United Kingdom, the Cayman Islands, the Bahamas, Chile and Uruguay. The aggregate cross border outstanding breakdown of these subsidiaries for the periods indicated below is as follows:
104
| | | | | | | | | | | | | | | | | | | | | | | | |
Cross border outstanding | | 12/31/2020 | | | % | | | 12/31/2019 | | | % | | | 12/31/2018 | | | % | |
| | | (In millions of R$, except percentages) | |
Cash and deposits on demand | | | 46,078 | | | | 2.3 | | | | 57,735 | | | | 3.5 | | | | 32,104 | | | | 2.1 | |
Interbank deposits | | | 151,233 | | | | 7.5 | | | | 98,175 | | | | 6.0 | | | | 97,069 | | | | 6.3 | |
Securities purchased under agreements to resell | | | 16,436 | | | | 0.8 | | | | 16,777 | | | | 1.0 | | | | 17,453 | | | | 1.1 | |
Central Bank compulsory deposits | | | 5,839 | | | | 0.3 | | | | 87 | | | | 0.0 | | | | 2 | | | | 0.0 | |
Financial assets held for trading and designated at fair value through profit or loss | | | 25,651 | | | | 1.3 | | | | 28,051 | | | | 1.7 | | | | 28,691 | | | | 1.8 | |
Derivatives | | | 67,284 | | | | 3.3 | | | | 41,666 | | | | 2.6 | | | | 27,638 | | | | 1.8 | |
Financial assets at Fair Value Through Other Comprehensive Income | | | 46,035 | | | | 2.3 | | | | 40,423 | | | | 2.5 | | | | 66,985 | | | | 4.3 | |
Financial assets at amortized cost | | | 36,889 | | | | 1.8 | | | | 19,236 | | | | 1.2 | | | | 19,760 | | | | 1.3 | |
Loan and lease operations | | | 74,155 | | | | 3.7 | | | | 68,370 | | | | 4.2 | | | | 63,460 | | | | 4.1 | |
Total outstanding | | | 469,600 | | | | 23.3 | | | | 370,520 | | | | 22.7 | | | | 353,162 | | | | 22.8 | |
| | | | | | | | | | | | | | | | | | | | | | | | |
The aggregate cross border outstanding breakdown by country of these subsidiaries for the periods indicated below is as follows:
| | | | | | | | | | | | | | | | | | | | | | | | |
Cross border outstanding by country | | 12/31/2020 | | | % | | | 12/31/2019 | | | % | | | 12/31/2018 | | | % | |
| | | (In millions of R$, except percentages) | |
Bahamas | | | 273,781 | | | | 13.6 | | | | 227,561 | | | | 13.9 | | | | 185,931 | | | | 12.0 | |
Cayman | | | 99,642 | | | | 4.9 | | | | 91,226 | | | | 5.6 | | | | 113,555 | | | | 7.3 | |
United Kingdom | | | 34,994 | | | | 1.8 | | | | 28,445 | | | | 1.8 | | | | 30,842 | | | | 2.0 | |
Chile | | | 37,986 | | | | 1.9 | | | | 23,288 | | | | 1.4 | | | | 22,834 | | | | 1.5 | |
Uruguay | | | 23,197 | | | | 1.1 | | | | 15,455 | | | | 0.9 | | | | 13,932 | | | | 0.9 | |
Total outstanding | | | 469,600 | | | | 23.3 | | | | 370,520 | | | | 22.7 | | | | 353,162 | | | | 22.8 | |
| | | | | | | | | | | | | | | | | | | | | | | | |
Liabilities
Funding
Main sources
Our current funding strategy is to continue to use all of our sources of funds in accordance with their costs and availability and our general asset and liability management strategy. In order to fund our operations, we intensified the use of the liquidity generated by savings deposits, interbank deposits, debt in the interbank market and debt in the institutional market during 2020, 2019 and 2018.
We also used Brazilian debentures subject to repurchase as a source of funding, reported as deposits received under securities repurchase agreements and offered to institutional clients as well as private banking, corporate banking and retail clients. This funding is designed to provide increased profitability through higher spreads in our savings deposits and higher fees earned on market funds.
Our ability to obtain funding depends on several factors, including credit ratings, general economic conditions and investors’ perception of emerging markets in general and of Brazil (particularly, current political and economic conditions in Brazil and government regulations for foreign currency funding).
Part of our long-term debt provides for the advance payment of the outstanding principal balance upon the occurrence of certain facts, as is customary for long-term financing agreements. As of December 31, 2020, none of these events, including default events and non-compliance with any financial covenant, had occurred, and we have no reason to believe that any of these events are likely to occur in 2021.
Our main sources of funding are our deposits, which are split into demand deposits, savings deposits, time deposits and interbank deposits. As of December 31, 2020, total deposits were R$809,010 million, which represented 58.8% of total funding. As of December 31, 2019, total deposits amounted to R$507,060 million, representing 48.7% of total funding. As of December 31, 2018, total deposits amounted to R$463,424 million, representing 45.4% of our total funding. Our time deposits represent one of our major sources of funding which, as of December 31, 2020, 2019 and 2018 accounted for 35.7%, 26.6% and 24.6% of total funding, respectively.
The table below shows the breakdown of our main sources of funds as of December 31, 2020, 2019 and 2018:
105
| | | | | | | | | | | | | | | | | | | | | | | | |
Breakdown of the main sources of funds | | 2020 | | | % of
total
funding | | | 2019 | | | % of
total
funding | | | 2018 | | | % of
total
funding | |
| | | (In millions of R$, except percentages) | |
Deposits | | | 809,010 | | | | 58.8 | | | | 507,060 | | | | 48.7 | | | | 463,424 | | | | 45.4 | |
Demand deposits | | | 134,805 | | | | 9.8 | | | | 82,306 | | | | 7.9 | | | | 72,581 | | | | 7.1 | |
Savings accounts | | | 179,470 | | | | 13.0 | | | | 144,558 | | | | 13.9 | | | | 136,865 | | | | 13.4 | |
Time deposits | | | 491,234 | | | | 35.7 | | | | 277,166 | | | | 26.6 | | | | 251,300 | | | | 24.6 | |
Interbank | | | 3,430 | | | | 0.2 | | | | 3,021 | | | | 0.3 | | | | 2,675 | | | | 0.3 | |
Other deposits | | | 71 | | | | 0.0 | | | | 9 | | | | 0,0 | | | | 3 | | | | 0,0 | |
Securities sold under repurchase agreements | | | 273,364 | | | | 19.9 | | | | 256,583 | | | | 24.6 | | | | 330,237 | | | | 32.3 | |
Interbank market funds | | | 156,035 | | | | 11.3 | | | | 174,862 | | | | 16.7 | | | | 134,670 | | | | 13.2 | |
Real estate credit bills | | | 4,205 | | | | 0.3 | | | | 7,635 | | | | 0.7 | | | | 9,546 | | | | 0.9 | |
Agribusiness credit bills | | | 14,285 | | | | 1.0 | | | | 21,204 | | | | 2.0 | | | | 18,013 | | | | 1.8 | |
Financial credit bills | | | 43,589 | | | | 3.2 | | | | 65,433 | | | | 6.3 | | | | 37,928 | | | | 3.7 | |
Guaranteed real state notes | | | 11,029 | | | | 0.8 | | | | 4,320 | | | | 0.4 | | | | 1,227 | | | | 0.1 | |
Import and export Financing | | | 71,470 | | | | 5.2 | | | | 64,622 | | | | 6.2 | | | | 50,050 | | | | 4.9 | |
Onlending-domestic | | | 11,457 | | | | 0.8 | | | | 11,648 | | | | 1.1 | | | | 17,906 | | | | 1.8 | |
Institutional market funds | | | 138,308 | | | | 10.0 | | | | 104,244 | | | | 10.0 | | | | 93,974 | | | | 9.1 | |
Subordinated debt | | | 74,916 | | | | 5.4 | | | | 59,462 | | | | 5.7 | | | | 49,313 | | | | 4.8 | |
Obligations on securities abroad | | | 62,433 | | | | 4.5 | | | | 43,672 | | | | 4.2 | | | | 41,863 | | | | 4.0 | |
Raisings through Structured Operations Certificates | | | 959 | | | | 0.1 | | | | 1,110 | | | | 0.1 | | | | 2,798 | | | | 0.3 | |
Total | | | 1,376,717 | | | | 100.0 | | | | 1,042,749 | | | | 100.0 | | | | 1,022,305 | | | | 100.0 | |
| | | | | | | | | | | | | | | | | | | | | | | | |
Deposits by maturity
The table below shows the maturity profile of our deposits as of December 31, 2020, 2019 and 2018:
| | | | | | | | | | | | | | | | | | | | |
Deposits by maturity | | 2020 | |
| | | 0-30 days | | | 31-180
days | | | 181-365
days | | | Over 365
days | | | Total | |
| | | (In millions of R$) | |
Non-interest bearing deposits | | | 134,876 | | | | — | | | | — | | | | — | | | | 134,876 | |
Demand deposits | | | 134,805 | | | | — | | | | — | | | | — | | | | 134,805 | |
Other deposits | | | 71 | | | | — | | | | — | | | | — | | | | 71 | |
Interest bearing deposits | | | 235,728 | | | | 80,456 | | | | 59,955 | | | | 297,995 | | | | 674,134 | |
Savings accounts | | | 179,470 | | | | | | | | | | | | | | | | 179,470 | |
Time deposits | | | 55,778 | | | | 78,624 | | | | 59,082 | | | | 297,750 | | | | 491,234 | |
Interbanks | | | 480 | | | | 1,832 | | | | 873 | | | | 245 | | | | 3,430 | |
Total | | | 370,604 | | | | 80,456 | | | | 59,955 | | | | 297,995 | | | | 809,010 | |
| | | | | | | | | | | | | | | | | | | | |
| | | | | | | | | | | | | | | | | | | | |
Deposits by maturity | | 2019 | |
| | | 0-30 days | | | 31-180
days | | | 181-365
days | | | Over 365
days | | | Total | |
| | | (In millions of R$) | |
Non-interest bearing deposits | | | 82,315 | | | | — | | | | — | | | | — | | | | 82,315 | |
Demand deposits | | | 82,306 | | | | — | | | | — | | | | — | | | | 82,306 | |
Other deposits | | | 9 | | | | — | | | | — | | | | — | | | | 9 | |
Interest bearing deposits | | | 190,131 | | | | 38,873 | | | | 22,878 | | | | 172,863 | | | | 424,745 | |
Savings accounts | | | 144,558 | | | | — | | | | — | | | | — | | | | 144,558 | |
Time deposits | | | 44,855 | | | | 36,928 | | | | 22,675 | | | | 172,708 | | | | 277,166 | |
Interbanks | | | 718 | | | | 1,945 | | | | 203 | | | | 155 | | | | 3,021 | |
Total | | | 272,446 | | | | 38,873 | | | | 22,878 | | | | 172,863 | | | | 507,060 | |
| | | | | | | | | | | | | | | | | | | | |
| | | | | | | | | | | | | | | | | | | | |
Deposits by maturity | | 2018 | |
| | | 0-30 days | | | 31-180
days | | | 181-365
days | | | Over 365
days | | | Total | |
| | | (In millions of R$) | |
Non-interest bearing deposits | | | 72,584 | | | | — | | | | — | | | | — | | | | 72,584 | |
Demand deposits | | | 72,581 | | | | — | | | | — | | | | — | | | | 72,581 | |
Other deposits | | | 3 | | | | — | | | | — | | | | — | | | | 3 | |
Interest bearing deposits | | | 176,329 | | | | 36,857 | | | | 22,062 | | | | 155,592 | | | | 390,840 | |
Savings accounts | | | 136,865 | | | | — | | | | — | | | | — | | | | 136,865 | |
Time deposits | | | 37,784 | | | | 36,211 | | | | 21,919 | | | | 155,386 | | | | 251,300 | |
Interbanks | | | 1,680 | | | | 646 | | | | 143 | | | | 206 | | | | 2,675 | |
Total | | | 248,913 | | | | 36,857 | | | | 22,062 | | | | 155,592 | | | | 463,424 | |
| | | | | | | | | | | | | | | | | | | | |
The table below sets forth the maturity of outstanding time deposits with balances in excess of US$100,000 (or its equivalent) issued by us as of December 31, 2020, 2019 and 2018:
106
| | | | | | | | | | | | | | | | | | | | | | | | | | | | | | | | | | | | |
(In millions of R$) | | 2020 | | | 2019 | | | 2018 | |
| | | Domestic | | | Foreign | | | Total | | | Domestic | | | Foreign | | | Total | | | Domestic | | | Foreign | | | Total | |
Maturity within three months | | | 7,271 | | | | 80,140 | | | | 87,411 | | | | 2,826 | | | | 45,663 | | | | 48,489 | | | | 2,415 | | | | 46,757 | | | | 49,172 | |
Maturity after three months to six months | | | 20,413 | | | | 19,896 | | | | 40,309 | | | | 1,716 | | | | 32,547 | | | | 34,263 | | | | 1,750 | | | | 18,810 | | | | 20,560 | |
Maturity after six months to twelve months | | | 40,480 | | | | 12,735 | | | | 53,215 | | | | 5,782 | | | | 16,493 | | | | 22,275 | | | | 5,045 | | | | 24,830 | | | | 29,875 | |
Maturity after twelve months | | | 128,451 | | | | 11,330 | | | | 139,781 | | | | 89,529 | | | | 8,446 | | | | 97,975 | | | | 82,072 | | | | 9,259 | | | | 91,331 | |
Total time deposits in excess of US$100,000 | | | 196,615 | | | | 124,101 | | | | 320,716 | | | | 99,853 | | | | 103,149 | | | | 203,002 | | | | 91,282 | | | | 99,656 | | | | 190,938 | |
| | | | | | | | | | | | | | | | | | | | | | | | | | | | | | | | | | | | |
The following table sets forth the mix of the individual and corporate time deposits divided among our retail, Itaú Personnalité, middle market and corporate markets (each expressed as a percentage of total time deposits) as of December 31, 2020, 2019 and 2018:
| | | | | | | | | | | | |
| | | 2020 | | | 2019 | | | 2018 | |
| | | | | | (%) | | | | |
Retail | | | 7.8 | | | | 11.3 | | | | 10.5 | |
Itaú Personnalité | | | 29.4 | | | | 27.3 | | | | 28.8 | |
Middle market | | | 30.1 | | | | 29.2 | | | | 27.9 | |
Corporate | | | 32.3 | | | | 31.4 | | | | 31.0 | |
Institutional | | | 0.4 | | | | 0.8 | | | | 1.8 | |
Total | | | 100.0 | | | | 100.0 | | | | 100.0 | |
| | | | | | | | | | | | |
Other sources
We also act as a financial agent in borrowing funds from BNDES and FINAME, and lending such funds at a spread determined by the Brazilian government to targeted sectors of the economy. We obtain U.S. dollar-denominated lines of credit from our affiliates, including Itaú Unibanco Holding – Grand Cayman branch, Banco Itaú Chile and Itaú BBA S.A. – Nassau branch to provide trade finance funding for Brazilian companies. For further details on domestic lending and import and export financing, please see “Note 17 – Securities Sold under Repurchase Agreements and Interbank and Institutional Market Funds” to our audited consolidated financial statements.
Short-term borrowings
Short-term borrowings are included in our balance in the line item “Securities sold under repurchase agreement.” The main category for short-term borrowings is “Deposits Received under Securities Repurchase Agreements with Own and Third-Party Financial Assets”. The table below shows our short-term borrowings as of December 31, 2020, 2019 and 2018:
| | | | | | | | | | | | |
| | | As of December 31, | |
Securities sold under repurchase agreements | | 2020 | | | 2019 | | | 2018 | |
| | | (In millions of R$, except
percentages) | |
Amount outstanding | | | 273,364 | | | | 256,583 | | | | 330,237 | |
Maximum amount outstanding during the period | | | 306,713 | | | | 330,237 | | | | 332,297 | |
Weighted average interest rate at period-end (%) | | | 2.9 | | | | 5.3 | | | | 6.7 | |
Average amount outstanding during period | | | 287,212 | | | | 299,225 | | | | 308,306 | |
Weighted average interest rate (%) | | | 1.9 | | | | 4.0 | | | | 6.5 | |
| | | | | | | | | | | | |
| 4C. | Organizational Structure |
We are a financial holding company controlled by IUPAR, a holding company jointly controlled by Itaúsa and E. Johnston. Itaúsa and Cia. E. Johnston. Itaúsa is controlled by members of the Egydio de Souza Aranha family, and Cia. E. Johnston is controlled by members of the Moreira Salles family. See “Item 7A. Major Stockholders” for further information. For further information about our significant subsidiaries as of December 31, 2020, see Exhibit 8.1 to this annual report.
107
| 4D. | Property, Plant and Equipment |
As of December 31, 2020, we owned and leased our principal administrative offices, which include office buildings in 9 different addresses, comprising a total area of 403,968 square meters, located primarily in São Paulo, Brazil. Such offices include our head office, and a number of other administrative buildings, where administrative functions are performed, such as commercial departments, back offices, wholesale and investment bank activities, and also our data processing center.
We lease most of our bank branches at competitive market prices through renewable leases that expire from the second half of 2020 (currently under renewal under similar terms and conditions) until the second half of 2042.
As of December 31, 2020, we owned approximately 33% of our branches (including electronic service points, banking sites and parking lots) and leased approximately 67%.
| ITEM 4A. | UNRESOLVED STAFF COMMENTS |
None.
| ITEM 5. | OPERATING AND FINANCIAL REVIEW AND PROSPECTS |
The following discussion should be read in conjunction with our consolidated audited financial statements and accompanying notes and other financial information included elsewhere in this annual report, and in conjunction with the information included under “Item 3A. Selected Financial Data” and “Item 4B. Business Overview – Selected Statistical Information.” The following discussion contains forward-looking statements that involve risks and uncertainties. Our actual results may differ materially from these discussed in forward-looking statements as a result of various factors, including those set in forth in “Forward-Looking Statements” and “Item 3D. Risk Factors.”
Factors Affecting Our Results of Operations
Our results of operations are affected by, among others, the following factors:
Macroeconomic Context
Global Context
Global economic activity is entering a broad recovery this year after the widespread recession in 2020 as a result of the COVID-19 outbreak and the measures taken to contain the pandemic. In 2020, GDP declined in many important economies: -6.8% in the Eurozone and -3.5% in the US. In China, GDP was up by 2.3%, a slowdown from a growth of 6.1% in 2019. However, vaccination is accelerating across countries and will allow a reopening in most economies. Also, continued fiscal and monetary stimulus will keep supporting a recovery this year.
The spread of the COVID-19 pandemic remains a concern for the global economy, despite decrease in infection rates in most developed countries and the distribution of vaccines globally. The number of COVID-19 cases is falling across countries as winter (in the Northern hemisphere) and holiday outbreaks dissipate. In the U.S., cases, hospitalizations and deaths are falling in nearly all states, allowing some easing of restrictions. In Europe, recent surges in the virus have been curbed, but some countries are taking new restrictive measures to avoid new waves. Vaccination campaigns have begun in several countries and the global vaccine supply is expected to keep increasing in the second and third quarters of 2021.
In the U.S., congress approved a new fiscal stimulus of US$1.9 trillion in March 2021, which adds to the US$900 billion package already approved last December. Stronger fiscal stimulus, along with loose financial conditions and control of the COVID-19 through a vaccination program, will boost economic growth. We forecast a growth of 6.7% for 2021. We also expect that “Bidenomics” will mean some regulatory risks but more predictable policies. In Europe, lockdowns still restrict activity in the first quarter of 2021, but the improving pace of vaccinations in the second quarter of 2021 should allow the reopening. Vaccines, reduced political uncertainty with the Brexit resolution, and continued
108
ECB (European Central Bank) and fiscal stimulus will be the basis for a recovery in 2021. We forecast Eurozone growth of 4.5% for 2021. In China, we expect growth of 8.5% in 2021.
Latin America Context
The COVID-19 pandemic led to a sharp deterioration in asset prices in emerging markets (including Latin America), tightening financial conditions during the first half of 2020. The global recovery in the second half of 2020, the reduced U.S. policy risk, a dovish Fed and news on vaccines contributed to a rebound of asset prices during the second part of 2020.
In Latin America, specifically, these factors are offsetting domestic uncertainties. Some countries in the region have recently experienced an uptick in inflation, reflecting high commodity prices, past exchange rate depreciation and supply disruptions of some products due to the pandemic. But a wide negative output gap and stronger exchange rates are likely to keep inflation under control in 2021, and monetary policy in the region is set to remain expansionary.
Activity in the region rebounded strongly in the second half of 2020, but GDP is still below pre-pandemic levels. As the COVID-19 contagion is reaccelerating in many Latin American countries, new social distancing measures are being implemented (although less harshly than in the early stages of the pandemic). Still an above-trend GDP growth is likely in 2021, benefited by carry-over effect, high terms of trade and expansionary monetary policy, factors that will more than offset an expected fiscal drag.
The table below shows the real GDP growth rates in seven Latin American countries as of and for the year ended December 31, 2020, 2019, 2018, 2017 and 2016, except as otherwise indicated.
| | | | | | | | | | | | | | | | | | | | |
Real GDP Growth | | | | | | | | | | | | | | | |
| | | 2020 | | | 2019 | | | 2018 | | | 2017 | | | 2016 | |
| | | (%) | |
Argentina(1) | | | -9.9 | | | | -2.1 | | | | -2.6 | | | | 2.8 | | | | -2.1 | |
Chile(2) | | | -5.8 | | | | 0.9 | | | | 3.7 | | | | 1.2 | | | | 1.7 | |
Colombia(3) | | | -6.8 | | | | 3.3 | | | | 2.6 | | | | 1.4 | | | | 2.1 | |
Mexico(4) | | | -8.2 | | | | -0.1 | | | | 2.2 | | | | 2.1 | | | | 2.6 | |
Paraguay(5) | | | -0.6 | | | | -0.4 | | | | 3.2 | | | | 4.8 | | | | 4.3 | |
Peru(6) | | | -11.1 | | | | 2.2 | | | | 4.0 | | | | 2.1 | | | | 4.4 | |
Uruguay(7) | | | -5.9 | | | | 0.4 | | | | 0.5 | | | | 1.6 | | | | 1.7 | |
| (1) | Source: Instituto Nacional de Estadĺstica y Censos |
| (2) | Source: Banco Central de Chile. |
| (3) | Source: Banco de la República. |
| (4) | Source: Instituto Nacional de Estadĺstica y Geografĺa. |
| (5) | Source: Banco Central del Paraguay. GDP |
| (6) | Source: Banco Central de Reserva del Perú. |
| (7) | Source: Banco Central de Uruguay. |
Brazilian Context
As a Brazilian bank with most of our operations in Brazil, we are significantly affected by the economic, political and social conditions in the country. Brazilian GDP, which grew 1.4% in 2019, declined by 4.1% for the year ended 2020, primarily due to the economic effects of the COVID-19 pandemic. Quarterly comparisons show declines of 2.1% and 9.2% of Brazil’s GDP in the first and second quarters of 2020, respectively. GDP recovered by 7.7% in the third quarter and by 3.2% in the fourth quarter of 2020, primarily due to the fiscal response, the loosening of the monetary policy and the gradual reopening of the economic activity from June 2020 onward.
109
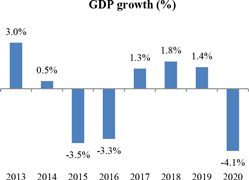
Source: IBGE; Itaú
The number of new daily deaths caused by COVID-19 rebounded in the first quarter of 2021 and surpassed the levels registered during the first wave of COVID-19. Deaths and hospitalizations are expected to recede as the vaccination campaign accelerates, allowing the economy to normalize. We forecast growth of 3.8% for 2021.
The widespread decline in inflation, due to the high level of idle capacity in the Brazilian economy and anchored inflation expectations, created an opportunity for the Central Bank to start a monetary easing cycle. After reaching 14.25% per annum at the end of 2015, the Central Bank began to cut interest rates in October 2016. The SELIC rate reached 2.00% in August 2020 and remained at this level until February 2021 In March 2021, the Central Bank increased the SELIC rate by 0.75 percentage points to 2.75%. Bank lending as a proportion of GDP increased to 54.2% in December 2020 from 47.0% in December 2019.
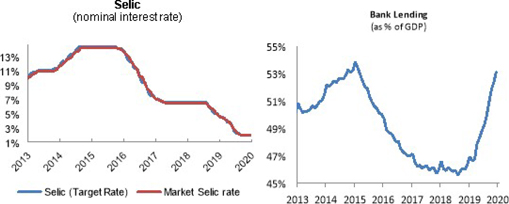
Source: Itaú Unibanco Holding and Central Bank
Inflation reached 4.5% in the year ended December 31, 2020, up from 4.3% in the year ended December 31, 2019. Government-regulated prices (such as gasoline, health insurance, medicines, electricity, urban bus and others) increased by 2.6% in 2020 (from 5.5% in 2019), while market-set prices increased by 5.2% in the same period (from 3.9% in 2019).
110
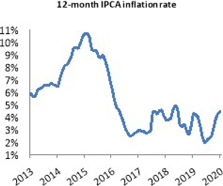
The Brazilian primary public accounts have deteriorated since 2014. To address the structural fiscal imbalance, the Brazilian Congress approved a ceiling on government spending that will limit primary public expenditure growth to the prior year’s inflation for a period of at least ten years, effective as of 2017. Further, Brazilian Congress approved a comprehensive social security reform and government started an asset sale program, creating conditions for a cyclical decrease of the public debt, while the primary result gradually improves. In 2021, Brazilian Congress approved another round of temporary emergency expenditure to combat the economic effects of the COVID-19 pandemic, in exchange of measures to reinforce the fiscal adjustment framework that will help to limit mandatory expenditure growth and to keep the ceiling on public spending feasible in the years ahead. The government also has a comprehensive reform agenda, the main examples being the Administrative Reform and the Tax Reform. However, these discussions were temporarily put on hold due the COVID-19 pandemic. For more information on the COVID-19, see “Item 3D. Risk Factors—Macroeconomic Risks—Domestic Scenario.”
The weakened macroeconomic fundamentals coupled with the market downturn caused by the COVID-19 pandemic had, and may in the future have, a negative impact on our performance across all our business units, particularly in the form of:
| a) | an increase in loan and financing operations, especially for micro, small and medium-sized companies due to the measures adopted to mitigate the economic impacts of the COVID-19 pandemic by the authorities in 2020 with the creation of programs such as the Emergency Employment Support Program (PESE), National Support Program for Micro and Small Companies (Pronampe), Emergency Program for Access to Credit in the modality of guarantee (Peac-FGI) and Working Capital Program for Business Preservation (CGPE.) in the aggregate amount of R$24,169 million. Through timely monitoring of credit standards and client behavior, we maintained the usual course of our operations, despite these adverse conditions, and we were able to help clients in their sustainable search for their financial rebalancing; |
| b) | with the purpose of treating indebtedness in a structured way and giving financial impetus to clients, we established initiatives that allowed the extension of grace periods, terms and better interest rate conditions for individuals, and micro and small business clients. In March 2020, we stablished the Program 60+, which, among other measures, allowed a 60-day grace period for defaulting agreements and in mid-April the Travessia (Crossing) Program. Travessia allowed the extension of grace periods between 120 and 180 days and terms of operations between 5 and 6 years, respectively, for individual and micro and small companies clients, under better interest rate conditions; |
| c) | a 28.05% increase in debt renegotiations and extension of terms for loan operations as the economic situation changed, which caused our allowance for loan losses to increase by R$4,194 million, due to the increased level of risk and defaults as a result of changes in the financial perspectives of our clients and the visible deterioration in macroeconomic variables. To fully reflect these risks on our loan operations, we adopted the expected credit loss model for provisioning of operations since the moment they are granted, and we update it periodically in accordance with macroeconomic variables and the particular circumstances of each of our clients. In 2020, in view of the COVID-19 pandemic, we changed the weighting for economic scenarios when measuring our provision for loan losses. As of December 31, 2020, our coverage ratio was 319.9% compared to a ratio of 229.5% as of December 31, 2019, as a result of the changes in the macroeconomic variables and specific circumstances of each of our clients. Specifically, for the expected credit loss of operations that have not shown any signs of deterioration so far (default or downgrading of the client’s rating), we increased our provisions for credit loss by 28.8% in the year ended December 31, 2020. Our credit risk governance allowed us to respond rapidly to the impacts of the COVID-19 pandemic on our loan portfolio, permitting quick access to the information needed for discussions and decisions at the daily crisis management forums; |
111
| d) | the mark-to-market component of our securities portfolio was reduced to -1.3% in the first quarter of 2020, partially due to exchange rate fluctuations and high price volatility in the markets in the beginning of the COVID-19 pandemic, influencing the measurement of items stated at fair value in their different levels; |
| e) | due to the COVID-19 pandemic, instability in the variable income market was noted causing a migration to fixed income products, such as bank deposit certificates, as a response to a stronger demand from our clients for lower risk investments and products with higher liquidity. This movement resulted in an increase in our Bank Deposit Certificates portfolio. Additionally, we experienced impacts on funding, as well as an increase in deposits. Please refer to the section “Item 4B. Business Overview – Selected Statistical Information – Liabilities – Funding” for further details. With the purpose of mitigating any systemic liquidity risk, the Central Bank made credit lines available to financial institutions through repurchase agreements in foreign currency and the purchase of financial bills with guarantee, leading to a total amount of R$30,547 million in these operations; |
| f) | increase in the recognition of deferred income tax and social contribution due to the greater volume of deductible temporary differences recorded for the period. The COVID-19 pandemic reduced the projections for taxable income, however, it was not responsible for the generation of tax losses and social contribution loss carryforwards; and |
| g) | increase in expenses with insurance claims related to COVID-19 of R$104 million, mainly related to credit life insurance and life insurance. |
In addition, Brazil implemented a large number of regulatory changes, such as changes in reserve and capital requirements for financial institutions, as well as other macro-prudential policies. Please refer to the section “Item 4B. Business Overview—Supervision and Regulation—Basel III Framework—Implementation of Basel III in Brazil” and to the section “Item 4B. Business Overview—Selected Statistical Information—Securities Portfolio—Compulsory Reserve Deposits with the Central Bank” for further details.
Total outstanding loans provided by Brazilian financial institutions increased in year-over-year real terms in December 2020, by 10.6%, after an increase of 2.1% in December 2019. Total new loans increased by 1.4% as of December 31, 2020, when compared to an increase of 9.1% as of December 30, 2019, both on an annualized basis. The rate of non-performing household loans decreased by 0.6 percentage points to 2.9% as of December 31, 2020 when compared with the same month in 2019. The rate of non-performing loans to non-financial corporations reached 1.2% in December 2020, below the level observed in December 2019 (2.1%).
The Brazilian real depreciated against the U.S. dollar, with the exchange rate reaching R$5.19 per US$1.00 as of December 31, 2020, compared to R$4.03 per US$1.00 as of December 31, 2019.
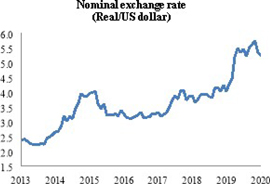
Brazil’s current account deficit (comprised of the net balance from the trade of goods and services and international transfers) totaled 0.9% of GDP as of December 2020. Brazil has maintained its external solvency, with US$356 billion in international reserves as of December 2020.
The table below shows real GDP growth, the inflation rate, exchange rate variation and interest rates in Brazil as of and for the twelve-month period ended December 31, 2020, 2019, 2018, 2017 and 2016, except as otherwise indicated.
112
| | | | | | | | | | | | | | | | | | | | |
| | | As of and for the Year Ended December 31, | |
| | | 2020 | | | 2019 | | | 2018 | | | 2017 | | | 2016 | |
| | | (%) | |
Real GDP growth(1) | | | -4.1 | | | | 1.4 | | | | 1.8 | | | | 1.3 | | | | -3.3 | |
Inflation rate — IGP-DI(2) | | | 23.1 | | | | 7.7 | | | | 7.1 | | | | -0.4 | | | | 7.2 | |
Inflation rate — IPCA(3) | | | 4.5 | | | | 4.3 | | | | 3.7 | | | | 2.9 | | | | 6.3 | |
Exchange rate variation (R$/US$)(4) | | | 28.9 | | | | 4.0 | | | | 13.5 | | | | 1.5 | | | | -16.5 | |
TR (reference interest rate)(5) | | | 0.00 | | | | 0.00 | | | | 0.00 | | | | 0.00 | | | | 1.98 | |
CDI (interbank interest rate)(6) | | | 1.90 | | | | 4.59 | | | | 6.40 | | | | 6.99 | | | | 13.63 | |
Selic (overnight interest rate)6) | | | 1.90 | | | | 4.59 | | | | 6.40 | | | | 7.00 | | | | 13.65 | |
Sovereign 5-year CDS(7) | | | 150.9 | | | | 107.7 | | | | 207.9 | | | | 165.0 | | | | 291.3 | |
| (1) | Source: Instituto Brasileiro de Geografia e Estatística, or IBGE. |
| (2) | Source: General Price Index – Internal Supply (Índice Geral de Preços – Disponibilidade Interna, or IGP-DI) published by the Fundação Getulio Vargas. |
| (3) | Source: Extended National Consumer Price Index (Índice de Preços ao Consumidor Amplo, or IPCA) published by IBGE. |
| (4) | Source: Bloomberg (cumulative rates for the period); positive numbers mean depreciation of the Brazilian real. |
| (5) | Source: Mortgage reference rate (Taxa Referencial, or TR) published by the Central Bank. Data presented in percentage per year. |
| (6) | Source: Central Bank. Data presented in percentage per year. |
| (7) | Source: Bloomberg (period-end). Sovereign credit default swaps or CDS is a measure of country risk (and is measured using basis points). |
Significant Accounting Policies
General Information
The preparation of our audited consolidated financial statements involves certain assumptions that are based on our historical experience and other factors that we deem reasonable and material. Although we review these estimates and assumptions in the ordinary course of business, the presentation of our financial condition and results of operations often requires our management to make judgments regarding the effects of matters that are uncertain by nature on our financial condition and results of operations. The following section describes those aspects that require significant judgment or involve a higher degree of complexity in the application of the accounting policies that currently affect our financial condition and results of operations. The accounting estimates we make in these contexts involve making assumptions about highly uncertain matters and actual results may differ from those estimated based on different variables, assumptions or conditions.
Use of Estimates and Assumptions
The preparation of the audited consolidated financial statements in accordance with IFRS requires management to make estimates and assumptions that affect the reported amounts of assets and liabilities at the date of the audited consolidated financial statements, as well as the reported amounts of revenue, expenses and gains and losses during the reporting period because the actual results may differ from those determined based on such estimates and assumptions.
All estimates and assumptions made by management are in accordance with IFRS and represent our best estimates made in conformity with applicable standards. Estimates and judgments are evaluated on an ongoing basis and are based on past experience and other factors.
Please see “Note 2.3 – Critical Accounting Estimates and Judgments” to our audited consolidated financial statements for further details.
New accounting standards changes and interpretations of existing standards
Accounting standards applicable for period ended December 31, 2020
| | • | | Interest Rate Benchmark Reform (IBOR Reform) Phase – I — Amendments to IFRS 9 — Financial Instruments, IAS 39 — Financial Instruments: Recognition and Measurement and IFRS 7 — Financial Instruments: Disclosures — Due |
113
| | to the changes in the interest rates used as market references – IBOR (Interbank Offered Rate), that will be terminated in future periods, there may be uncertainties in the evaluation of hedge accounting structures. Regulatory changes aim at minimizing possible impacts on these structures in the current scenario of pre-replacement of rates. The regulatory exemption setting forth that these rates will not be replaced during the period of uncertainty in the analysis of hedge accounting relationships will be applied. These changes are effective for the years beginning January 1, 2020 and they will be applied until the effective replacement of IBORs occurs or until the hedge accounting relationships are discontinued. No significant impacts have been identified in the hedge accounting structures for our Consolidated Financial Statements, in the pre-replacement period of IBORs. |
We are exposed mainly to LIBOR and EURIBOR rates in hedge accounting structures. Since 2018, we bring together working groups to follow the progress of discussions in the international market about the replacement of IBORs. For standardized agreements, we will assume the updates of rates made by the respective clearings and the International Swaps and Derivatives Association—ISDA). For the other agreements, whenever possible, they will be negotiated and adjusted gradually until the end of 2021, the date on which the market expects the end of IBOR publications.
| | • | | Amendments to IFRS 16 – Leases: Practical expedient that enables lessees not to characterize the lease concessions motivated by the COVID-19 pandemic as an agreement modification. This standard is effective for the years beginning on June 1, 2020, and earlier application is permitted. We opted for not relying on the exception from this standard, and, therefore, there was no impact on our Consolidated Financial Statements. |
Derivative Instruments that Qualify for Hedge Accounting
Hedging transactions may be classified into three categories: Fair value hedge, Cash flow hedge, and Hedge of net investment in foreign operations:
| | • | | Fair value hedge: aimed at protecting us against changes in market risk due to changes in the fair value of interest subject to variable rates. |
| | • | | Cash flow hedge: aimed at protecting us against future cash flows of payments of interest. |
| | • | | Hedge of net investment of foreign operations: aimed at protecting us against changes in future cash flows of foreign exchange variations in net investments of foreign operations. |
Please see “Item 11. Quantitative and Qualitative Disclosures about Market Risk—Market and Liquidity Risk” for further details about hedge accounting.
Please see “Note –7—Hedge Accounting” to our audited consolidated financial statements for further details. With respect to the hedge accounting policy, please see “Note 2.4 – Summary of Main Accounting Practices—d) Financial Assets and Liabilities—IV – Derivatives” to our audited consolidated financial statements.
Fair Value of Financial Instruments
Financial instruments recorded at fair value on our balance sheet include securities classified as Fair Value Through Other Comprehensive Income and Fair Value Through Profit or Loss, including derivatives. Other financial instruments are classified at historical amortized cost on our balance sheet, and their corresponding fair values are shown in the notes to our audited consolidated financial statements. We present information on the fair value of our financial instruments in the table below as of December 31, 2020, 2019 and 2018.
114
| | | | | | | | | | | | |
| | | As of December 31, | |
Financial instruments recorded at fair value | | 2020 | | | 2019 | | | 2018 | |
| | | (In millions of R$) | |
Assets | | | | |
Financial assets at fair value through profit or loss | | | 389,071 | | | | 281,075 | | | | 263,180 | |
Derivatives | | | 76,504 | | | | 41,854 | | | | 23,466 | |
Financial assets at fair value through other comprehensive income | | | 109,942 | | | | 76,660 | | | | 49,323 | |
Other financial assets | | | 6 | | | | — | | | | — | |
Total | | | 575,523 | | | | 399,589 | | | | 335,969 | |
| | | | | | | | | | | | |
Liabilities | | | | | | | | | | | | |
Other financial liabilities | | | 5 | | | | — | | | | — | |
Structured notes | | | 143 | | | | 201 | | | | 192 | |
Derivatives | | | 79,505 | | | | 47,828 | | | | 27,519 | |
Total | | | 79,653 | | | | 48,029 | | | | 27,711 | |
| | | | | | | | | | | | |
We determine the fair value of our financial instruments based on IFRS 13, which defines fair value as the price that would be received to sell an asset or paid to transfer a liability in an orderly transaction between market participants at the measurement date.
According to IFRS 13, there are different levels of inputs that may be used to measure the fair value of financial instruments classified as levels 1, 2 and 3.
| | • | | Level 1: observable inputs reflect the quoted prices (unadjusted) of identical assets or liabilities in active markets; |
| | • | | Level 2: observable inputs reflect the information on assets and liabilities that are either directly (such as prices) or indirectly (derived from prices) observable, except for the quoted prices included in Level 1; and |
| | • | | Level 3: information on assets and liabilities that are not based on observable market data due to little market activity on the measurement date. We present information on our level 3 financial instruments in the table below as of December 31, 2020 and 2019. |
| | | | | | | | |
| | | As of
December 31, | |
Level 3 | | 2020 | | | 2019 | |
| | | (In millions of R$) | |
Financial assets at fair value through profit or loss | | | 1,968 | | | | 1,719 | |
Financial assets at fair value through other comprehensive income | | | — | | | | 34 | |
Net position of derivatives | | | (5 | ) | | | 18 | |
Total | | | 1,963 | | | | 1,771 | |
| | | | | | | | |
Please refer to “Note 28 – Fair Value of Financial Instruments” to our audited consolidated financial statements for further details.
Contingent Liabilities
Contingent liabilities arise mainly from judicial and administrative proceedings inherent to the ordinary course of our business and that are filed by third parties, including former employees and public bodies related to civil, labor, tax and social security claims. These contingencies are assessed based on the best estimates of our management, taking into consideration the opinion of legal advisors when there is a probability that financial resources will be required to settle obligations and the amount of such obligations can be reliably measured.
Contingencies are classified as follows, based on the likelihood of loss:
| | • | | Probable: liabilities are recognized as “provisions” on our consolidated balance sheet; |
115
| | • | | Possible: liabilities are disclosed in our audited consolidated financial statements but no provisions are recorded; and |
| | • | | Remote: liabilities that do not require provision or disclosure. |
Contingent liabilities for which provisions are recorded and those classified as having a “possible” likelihood of loss are evaluated based on our best estimates, using models and criteria that allow for their proper evaluation despite the uncertainty that is inherent to their terms and amounts.
Significant Changes in Accounting Standards
Please see “Note 2.2 – New Accounting Standards and New Accounting Standards Changes and Interpretations” to our audited consolidated financial statements for further details about information on significant changes in accounting standards.
Accounting Practices Adopted in Brazil
Our books and records are maintained in Brazilian reais, the official currency in Brazil, and our audited consolidated financial statements, for statutory and regulatory purposes, are prepared in accordance with accounting practices adopted in Brazil (BRGAAP). The accounting principles and standards generally applicable under Brazilian GAAP include those established under Brazilian Corporate Law, by the Accounting Pronouncements Committee, or CPC, which started issuing standards in 2007, and by the Federal Accounting Council. In the case of companies subject to regulation by the Central Bank, such as Itaú Unibanco Holding, the effectiveness of the accounting pronouncements issued by entities such as the CPC depends on approval of the pronouncement by the CMN, which also establishes the date of effectiveness of any pronouncements with respect to financial institutions. Additionally, the CVM and other regulatory bodies, such as SUSEP and the Central Bank, provide additional industry-specific guidelines.
Regulation Applicable to the Presentation of the Audited Consolidated Financial Statements
Brazilian regulations establish specific rules for the consolidation of audited consolidated financial statements by financial institutions. Under current Central Bank regulations, financial institutions, except for credit cooperatives, are required to prepare consolidated financial statements including investments directly or indirectly held in other companies, individually or jointly controlled, and with respect to which such financial institutions have (i) the right to appoint or designate the majority of the company’s board of directors; (ii) the right to appoint or remove the majority of the company’s executives and directors; and/or (iii) operational or shareholding control. These regulations apply to the entire group to which a financial institution belongs.
OPERATING AND FINANCIAL REVIEW AND PROSPECTS
The following discussion should be read in conjunction with our audited consolidated financial statements and accompanying notes and other financial information included in the description of our business in “Item 4. Information on the Company.” The following discussion contains forward-looking statements that involve risks and uncertainties. Our actual results may differ materially from these discussed in forward-looking statements as a result of various factors, including those set forth in “Forward-Looking Statements” herein.
In this section, we discuss the results of our operations for the year ended December 31, 2020 compared to the year ended December 31, 2019. For a discussion of the results of our operations for the year ended December 31, 2019 compared to the year ended December 31, 2018, please refer to “Item 5. – A. Operating Results – Operating and Financial Review and Prospects” in our 2019 Form 20-F.
Results of Operations
The table below presents our summarized consolidated statement of income for the years ended December 31, 2020 and 2019. The interest rates cited are expressed in Brazilian reais and include the effect of the variation of the real against foreign currencies. For more information on the products and services we offer, see “Item 4. Information on the Company.”
Please see our audited consolidated financial statements for further details about our Consolidated Statement of Income.
116
| | | | | | | | | | | | | | | | |
| | | For the years ended December 31, | | | Variation | |
Summarized Consolidated Statement of Income | | 2020 | | | 2019 | | | R$ million | | | % | |
| | | (In millions of R$) | | | | | | | |
Operating revenues | | | 100,199 | | | | 117,079 | | | | (16,880 | ) | | | (14.4 | ) |
Net interest income(1) | | | 50,053 | | | | 69,350 | | | | (19,297 | ) | | | (27.8 | ) |
Non-interest income(2) | | | 50,146 | | | | 47,729 | | | | 2,417 | | | | 5.1 | |
Expected loss from financial assets and claims | | | (25,980 | ) | | | (18,567 | ) | | | (7,413 | ) | | | 39.9 | |
Other operating income (expenses) | | | (68,989 | ) | | | (67,269 | ) | | | (1,720 | ) | | | 2.6 | |
Net income before income tax and social contribution | | | 5,230 | | | | 31,243 | | | | (26,013 | ) | | | (83.3 | ) |
Current and deferred income and social contribution taxes | | | 9,834 | | | | (3,430 | ) | | | 13,264 | | | | (386.7 | ) |
Net income | | | 15,064 | | | | 27,813 | | | | (12,749 | ) | | | (45.8 | ) |
Net income attributable to owners of the parent company | | | 18,896 | | | | 27,113 | | | | (8,217 | ) | | | (30.3 | ) |
| | (i) | interest and similar income of financial assets at amortized cost and fair value through other comprehensive income (R$113,262 million and R$117,523 million in the years ended December 31, 2020 and 2019, respectively); |
| | (ii) | interest, similar income and dividend of financial assets at fair value through profit or loss (R$15,716 million and R$22,760 million in the years ended December 31, 2020 and 2019, respectively); |
| | (iii) | interest and similar expenses (R$(73,558) million and R$(75,958) million in the years ended December 31, 2020 and 2019, respectively); |
| | (iv) | adjustments to fair value of financial assets and liabilities (R$(8,056) million and R$4,098 million in the years ended December 31, 2020 and 2019, respectively); and |
| | (v) | foreign exchange results and exchange variations in foreign transactions (R$2,689 million and R$927 million in the years ended December 31, 2020 and 2019, respectively). |
| (2) | Includes commissions and banking fees, income from insurance and private pension operations before claim and selling expenses and other income. |
For the year ended December 31, 2020 compared to December 31, 2019.
Net income attributable to owners of the parent company decreased by 30.3% to R$18,896 million for the year ended December 31, 2020 from R$27,113 million for the same period of 2019. This result is mainly due to a 14.4% decrease in operating revenues and a 39.9% increase in expected losses from financial assets and claims. The decrease in net income attributable to owners of the parent company was partially offset by a R$13,264 million increase in current and deferred income and social contribution taxes. These line items are further described below:
Net interest income decreased by R$19,297 million, or 27.8%, for the year ended December 31, 2020 compared to the same period of 2019, mainly due to a decrease of R$12,154 million in the adjustment to the fair value of financial assets and liabilities, especially due to the fiscal effect on the hedging instruments for our investments abroad.
The result of exchange rate fluctuations on our investments abroad is non-taxable, whereas revenues from our hedging instruments are taxable. Accordingly, the depreciation of the real against foreign currencies, especially the U.S. dollar, generates losses on our hedging instruments abroad. Conversely, the appreciation of the real against foreign currencies, generates gains on our hedging instruments abroad. This affects our tax expenses recorded in the line items “current and deferred income and social contribution taxes” and “other operating income (expenses).” The nominal depreciation of the real against the U.S. dollar was 28.9% for the year ended December 31, 2020 compared to a depreciation of 4.0% for the same period of 2019.
The fiscal effect on the hedging instruments for our investments abroad resulted in a gain of R$17,701 million for the year ended December 31, 2020, compared to a gain of R$2,499 million for 2019.
As a result, disregarding the fiscal effect on the hedging instruments for our investments abroad mentioned above, net interest income decreased by R$4,095 million for the year ended December 31, 2020 compared to 2019.
| | • | | Interest and similar income of financial assets at amortized cost and at fair value through other comprehensive income decreased by 3.6% for the year ended December 31, 2020 compared to 2019 due to a R$6,365 million decrease in income from securities purchased under agreements to resell and a R$2,492 million decrease in compulsory deposits with the Central Bank, as a result of lower interest rates. As of December 31, 2020, the effective SELIC rate was 1.90% per annum compared to 4.40% per annum as of December 31, 2019. While the balance of our loan portfolio increased 21.9% in this period, income from our loan portfolio decreased by 1.9%. This is mainly due to: (i) lower spreads on credit products, particularly for government sponsored facilities for our micro/small and medium businesses segment, (ii) lower interest rates for working capital loans and (iii) regulatory changes, especially CMN Resolution No. 4,765, which caps interest rates for checking |
117
| | account overdraft facilities up to 8% per month. In addition, this result was partially offset by an increase of R$6,224 million in income from financial assets at fair value through other comprehensive income mainly due to exchange rate fluctuations. |
| | • | | Interest and similar expenses decreased by 3.2% for the year ended December 31, 2020 compared to 2019, due to: (i) a decrease of R$9,783 million in securities sold under repurchase agreements, mainly as a result of the decrease of R$23,236 million in the balance of assets pledged as collateral, especially in government securities; and (ii) a decrease in our financial expenses from technical provisions for insurance and private pension plans, which amounted to an expense of R$8,121 million for the year ended December 31, 2020 compared to an expense of R$16,720 million for the year ended December 31, 2019, as a result of the decrease in the net asset value of investment fund quotas and resulting impact on private pension plans. |
This result was partially offset by an increase in expenses from interbank market funds mainly as a result of a R$6,848 million increase in the balance of import and export financings, which was affected by exchange rate fluctuations.
Please see “Note 21—Interest and Similar Income and Expense and Net Gain (Loss)” to our audited consolidated financial statements for further details on interest and similar expenses.
Non-interest income increased by 5.1% to R$50,146 million for the year ended December 31, 2020 compared to 2019. This increase was mainly due to a 71.4%, or R$2,957 million, increase in other income, mainly driven by the gain on the partial sale of our shares in XP Inc. On December 2 and 17, 2020, we sold 4.44% and 0.07%, respectively, of our investments in XP Inc., through the public offering on the Nasdaq, giving rise to a result before taxes of R$ 3,996 million. Concurrently with the sales, XP Inc. completed a public offering (follow-on) which resulted in the dilution of the interest held by us, which then reached 41.00% of XP Inc.’s total capital, resulting in a gain from our investment in XP Inc. primary subscription of R$ 545 million.
The increase in non-interest income was partially offset by a 1.2%, or R$475 million, decrease in commissions and banking fees, compared to the same period in 2019, mainly driven by a R$1,806 million decrease in revenues from credit and debit card transactions, including acquiring business, revenues from merchant discount rate, rental of equipment and prepayments, all of which decreased particularly in the first semester of 2020 due to social distancing measures adopted in response to the COVID-19 pandemic. This decrease in commissions and banking fees was offset by:
| | (i) | a 15.2%, or R$382 million, increase in income from advisory and brokerage services compared to the same period in 2019, mainly due to an increase in activities in the capital markets. As of December 31, 2020, we acted as underwriter on fixed income transactions in Brazil totaling R$6,936 million and we were ranked first in volume of deals by the Associação Brasileira de Entidades dos Mercados Financeiro e de Capitais (“ANBIMA”) in this segment. We also provided financial advisory services for 47 M&A transactions in South America during 2020, totaling US$8,139 million in deal volume and we were ranked first place in number of deals by Dealogic; and |
| | (ii) | a 10.8%, or R$614 million, increase in asset management fees from funds compared to the same period in 2019. Our assets under management increased by 14.2% in the year ended December 31, 2020 compared to 2019, representing an increase of 14.7% in income from fees generated through offerings of our own products and an increase of 11.2% in income from fees generated through our open platform. |
The following chart shows the main components of our banking service fees for the years ended December 31, 2020 and 2019:
118
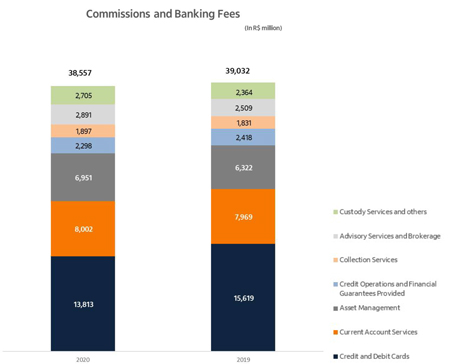
Please see “Note 3 – Business Development” to our audited consolidated financial statements for further details on our stake in XP Inc.
Please see “Note 22 – Commissions and Banking Fees” to our audited consolidated financial statements for further details on banking service fees.
Expected Loss from Financial Assets and Claims
To fully reflect the risk of our loan operations, we adopt the expected loss model for provisioning of operations since the moment they are granted, which is periodically updated according to the macroeconomic variables and specific circumstances of each of our clients. In 2020, in view of the COVID-19 pandemic, the weighting for economic scenarios was increased when measuring our provision for loan losses. As of December 31, 2020, our coverage ratio was 319.9% compared to a ratio of 229.5% as of December 31, 2019, as a result of the changes in the macroeconomic variables and specific circumstances of each of our clients. Specifically, in 2020 we increased the provision for the expected loss of operations for clients that had not shown any signs of deterioration until the outbreak of the COVID-19 pandemic (default or downgrading of the client’s rating). The credit risk governance enabled us to quickly respond to the impacts of the COVID-19 pandemic on our loan portfolio, permitting quick access to the information required for the daily discussions and actions of the crisis management forum.
Our expected loss from financial assets and claims increased by R$7,413 million, or 39.9%, for the year ended December 31, 2020 compared to 2019, mainly due to an increase in expected loss with loan and lease operations of R$6,154 million for the year ended December 31, 2020. This increase is related to the changes in the macroeconomic scenario and adverse financial perspectives for individuals and companies as from the second half of March 2020, as a result of the COVID-19 pandemic. In the year ended December 31, 2020, we constituted R$6,249 million in expected credit loss for our Foreign Loans—Latin American operations, mainly due to certain corporate clients in Latin America. Our micro/small and medium companies expected credit loss increased by R$1,820 million, mainly due to the increase in the balance of loans operations in this segment, due to government sponsored facilities such as the National Support Program for Micro and Very Small Businesses (Pronampe) and the Investment Guarantee Fund (FGI).
119
Please see “Note 2— Significant Accounting Policies” to our audited consolidated financial statements for further details on our expected credit loss assessment.
Please see “Note 10— Loan and Lease Operations” to our audited consolidated financial statements for further details on our loan and lease operations portfolio.
| | • | | Non-performing loans: We calculate our 90-day non-performing loan (“NPL”) ratio as the value of our 90-days non-performing loans to our loan portfolio. |
As of December 31, 2020, our 90-day NPL ratio was 2.7%, a decrease of 76 basis points compared to December 31, 2019. The decrease was due to the decrease of 78 basis points in the 90-day NPL ratio in respect of our individuals loan portfolio, and the decrease of 49 basis points in the 90-day NPL ratio in respect of our companies loan portfolio, mainly due to measures of loan reprofiling offered to our clients in response to the COVID-19 pandemic. The increase in the balance of renegotiated loans resulted in a decrease in the balance of our 90-day non-performing loans in the period. Compared to September 30, 2020, our 90-day NPL ratio increased by 10 basis points, in the three-month period ended December 31, 2020, mainly driven by the end of the grace period of loans reprofiled in previous periods.
| | • | | We calculate our 15 to 90 days non-performing loan ratio as the value of our 15 to 90 days non-performing loans to our loan portfolio. The 15 to 90 days NPL ratio is an indicator of early delinquency. |
As of December 31, 2020, our 15 to 90 days NPL ratio was 1.8% a decrease of 50 basis points when compared to December 31, 2019. In this period there was an increase of 9 basis points in the 15 to 90-day NPL ratio in respect of our companies loans portfolio. The 15 to 90-day NPL ratio for our individuals loan portfolio decreased by 96 basis points due to the reprofiling offered to our clients in response to the COVID-19 pandemic. The increase in the balance of renegotiated loans resulted in a decrease in the balance of our 15 to 90-day non-performing loans in the period compared to 2019. In the three-month period ended December 31, 2020, we had an increase of 47 basis points in our 15 to 90-day non-performing loans for companies mainly driven by the end of the grace period of loans reprofiled in previous periods.
As of December 31, 2020, our reprofiled loan portfolio was R$50.8 million, a decrease of 5.0% when compared to September 30, 2020.
Further, by the end of December 31, 2020, 96.1% of the grace periods relating to the reprofiled loan portfolio had expired, of which 82.6% were performing (8.3% of the amount outstanding under the non-performing reprofiled loan portfolio was delinquent between 15 and 90 days and 5.2% were delinquent for more than 90 days).

The chart below shows a comparison of both NPL ratios for each quarter as of December 31, 2019 through to December 31, 2020:
120
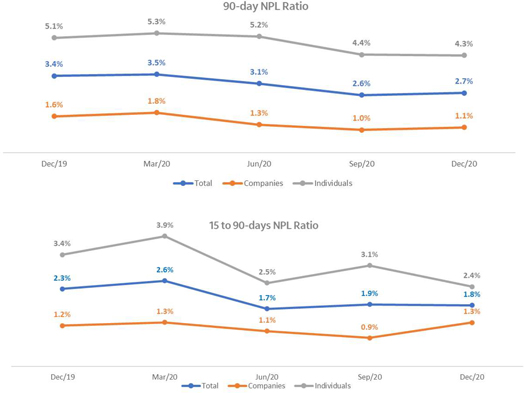
| | • | | Coverage ratio (90 days): We calculate our coverage ratio as provisions for expected losses to 90-day non-performing loans. As of December 31, 2020, our coverage ratio was 319.9% compared to a ratio of 229.5% as of December 31, 2019. This increase was mainly due to decrease in the balance of non-performing loans over 90 days overdue, driven by the loan portfolio reprofiling and the provisioning recognized due to the change in the macroeconomic scenario as from the second half of March, which was captured by our expected loss provisioning model. In the three-month period ended December 31, 2020, our coverage ratio decreased 1,934 basis points due to an increase in non-performing loans past 90 days overdue, driven by the end of the grace period of loans reprofiled in previous periods. |
The chart below shows a comparison in the coverage ratios for each quarter as of December 31, 2019 through December 31, 2020:
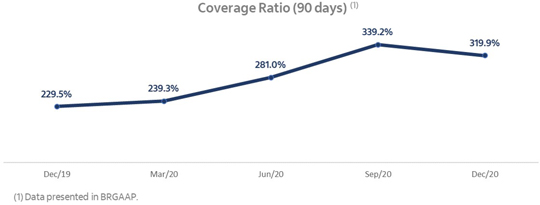
121
Other Operating Income (Expenses) increased by 2.6% to an expense of R$68,989 million for the year ended December 31, 2020 from an expense of R$67,269 million for 2019 mainly due to the following non-recurring events: (i) the goodwill and intangible assets impairment recorded by Itaú Corpbanca of R$5,906 million; (ii) a donation of R$1,047 million made to Todos pela Saúde (All for Health) and (iii) an increase of R$2,385 million in personnel expenses due to our 2019 Voluntary Severance Program. Todos pela Saúde is an initiative created by us in April 2020 to combat the effects of the COVID-19 pandemic on the Brazilian society.
Disregarding the non-recurring events discussed above, our general and administrative expenses decreased by 2.3% to an expense of R$57,254 million for the year ended December 31, 2020 from an expense of R$58,627 million for 2019, mainly due to:
(i) a R$872 million decrease in personnel expenses due to a reduced number of employee terminations, which were suspended from March through September 2020, due to measures implemented to address the impacts of the COVID-19 pandemic. In addition, our expenses with profit sharing were reduced as a result of the challenging macroeconomic scenario, due to the COVID-19 pandemic, which resulted in lower profits. This result was partially offset by: (a) an increase in compensation, mainly due to an increase in the total number of employees, particularly information technology professionals, and (b) the negotiation of the collective bargaining labor agreement, which provided for a 1.5% salary increase and a R$2,000 bonus paid to employees in Brazil in September 2020;
(ii) a R$567 million decrease in credit card selling expenses, related to REDE’s accreditation and reduction in expenses with credit card brands, due to reduced economic activity, as a result of the social distancing measures adopted in relation to the COVID-19 pandemic, and;
(iii) a R$55 million decrease in administrative expenses, particularly reduced data processing and telecommunications, advertising, promoting and publicity expenses, and travel and transportation expenses, due to reduced commuting and remote working arrangements adopted during the COVID-19 pandemic.
Please see “Note 23—General and Administrative Expenses” to our audited consolidated financial statements for further details.
Current and deferred income and social contribution taxes amounted to a gain of R$9,834 million for the year ended December 31, 2020, from an expense of R$3,430 million for 2019.
This was partially due to the fiscal effect on the hedging instruments for our investments abroad, as mentioned in “ —Net interest income,” which amounted to a gain of R$16,097 million for the year ended December 31, 2020 compared to a gain of R$2,281 million for 2019. Disregarding this fiscal effect, current and deferred income and social contribution taxes increased by 9.7% for the year ended December 31, 2020 compared to 2019.
In 2019, fiscal authorities temporarily decreased the recognition rate for income and social contribution taxes to 40%. However, as from March 1, 2020, the recognition rate was increased again to 45%. The increase in the recognition rate was partially offset by: (i) increases in provisions for expected loss in the period (which generate tax credits) and (ii) a decrease in net income before tax and social contribution.
Please see “Note 24 – Taxes” to our audited consolidated financial statements for further details.
Basis for Presentation of Segment Information
We maintain segment information based on reports used by senior management to assess the financial performance of our businesses and to make decisions regarding the allocation of funds for investment and other purposes.
122
Segment information is not prepared in accordance with IFRS, as issued by the IASB, but based on accounting practices adopted in Brazil applicable to institutions authorized to operate by the Central Bank. It also includes the following adjustments: (i) the recognition of the impact of capital allocation using a proprietary model; (ii) the use of funding and cost of capital at market prices, using certain managerial criteria; (iii) the exclusion or inclusion of non-recurring events from our results; and (iv) the reclassification of the tax effects from hedging transactions we enter into for our investments abroad.
Non-recurring events correspond to relevant events (with a positive or negative accounting effect) identified in our results of operations for each relevant period. We apply a historically consistent methodology (approved by our governance procedures) pursuant to which, relevant events are either not related to our core operations or are related to previous fiscal years. The impairment of goodwill and intangible assets recorded by Itaú Corpbanca, the donation made to “Todos pela Saúde” and our 2019 voluntary severance program are non-recurring events and, as such, do not impact the results and analysis regarding our segment information below.
For more information on our segments, see “Item 4. Information on the Company” and “Note 30 – Segment Information” to our audited consolidated financial statements.
We present below the summarized results from our operating segments from January 1, 2020 to December 31, 2020:
| | | | | | | | | | | | | | | | | | | | | | | | |
Summarized Consolidated Statement of Income
from January 1, 2020 to December 31, 2020(1) | | Retail
Banking
(a) | | | Wholesale
Banking
(b) | | | Activities with the
Market +
Corporation
(c) | | | Total
(a)+(b)+(c) | | | Adjustments | | | IFRS
consolidated(2)
| |
| | | | | | | | | (In millions of R$) | | | | | | | |
Operating revenues | | | 72,680 | | | | 32,187 | | | | 9,918 | | | | 114,785 | | | | (14,586 | ) | | | 100,199 | |
Cost of Credit | | | (21,247 | ) | | | (8,968 | ) | | | 6 | | | | (30,209 | ) | | | 5,583 | | | | (24,626 | ) |
Claims | | | (1,345 | ) | | | (8 | ) | | | — | | | | (1,353 | ) | | | (1 | ) | | | (1,354 | ) |
Other operating income (expenses) | | | (40,221 | ) | | | (16,133 | ) | | | (650 | ) | | | (57,004 | ) | | | (11,985 | ) | | | (68,989 | ) |
Income tax and social contribution | | | (3,071 | ) | | | (1,893 | ) | | | (3,099 | ) | | | (8,063 | ) | | | 17,897 | | | | 9,834 | |
Non-controlling interest in subsidiaries | | | (175 | ) | | | 601 | | | | (46 | ) | | | 380 | | | | 3,452 | | | | 3,832 | |
Net income | | | 6,621 | | | | 5,786 | | | | 6,129 | | | | 18,536 | | | | 360 | | | | 18,896 | |
| | | | | | | | | | | | | | | | | | | | | | | | |
| (1) | The first three columns are our business segments. Additional information about each of our business segments can be found below under the headings “(a) Retail Banking”, “(b) Wholesale Banking” and “(c) Activities with the Market + Corporation”. |
| | The adjustments column includes the following pro forma adjustments: (i) the recognition of the impact of capital allocation using a proprietary model; (ii) the use of funding and cost of capital at market prices, using certain managerial criteria; (iii) the exclusion of non-recurring events from our results; and (iv) the reclassification of the tax effects from hedging transactions we enter into for our investments abroad. |
| | The IFRS consolidated column is the total result of our three segments plus adjustments. |
| (2) | Net income presented refers to “net income attributable to owners of the parent company”. |
The following discussion should be read in conjunction with our audited consolidated financial statements, especially “Note 30 – Segment Information.” The adjustments column shown in this note shows the effects of the differences between the segmented results (substantially in accordance with the accounting practices adopted in Brazil) and those calculated according to the principles adopted in our audited consolidated financial statements in IFRS, as issued by the IASB.
Year ended December 31, 2020 compared to the year ended December 31, 2019.
This segment consists of business with retail customers, account holders and non-account holders, individuals and legal entities, high income clients (Itaú Uniclass and Personnalité) and the companies segment (microenterprises and small companies). It includes financing and credit offers made outside the branch network, in addition to credit cards and payroll loans.
The following table sets forth our summarized consolidated statement of income with respect to our Retail Banking segment for the years ended December 31, 2020 and 2019:
123
| | | | | | | | | | | | | | | | |
Summarized Consolidated Statement of Income—Retail Banking | | For the years ended
December 31, | | | Variation | |
| | | 2020 | | | 2019 | | | R$ million | | | % | |
Operating revenues | | | 72,680 | | | | 79,227 | | | | (6,547 | ) | | | (8.3 | ) |
Interest margin | | | 41,818 | | | | 46,764 | | | | (4,946 | ) | | | (10.6 | ) |
Non-interest income (1) | | | 30,861 | | | | 32,463 | | | | (1,601 | ) | | | (4.9 | ) |
Cost of credit and claims | | | (22,593 | ) | | | (17,278 | ) | | | (5,314 | ) | | | — | |
Other operating income (expenses) | | | (40,221 | ) | | | (41,430 | ) | | | 1,209 | | | | (2.9 | ) |
Income tax and social contribution | | | (3,071 | ) | | | (7,095 | ) | | | 4,024 | | | | — | |
Non-controlling interest in subsidiaries | | | (175 | ) | | | (198 | ) | | | 24 | | | | (11.9 | ) |
Net income | | | 6,621 | | | | 13,226 | | | | (6,605 | ) | | | (49.9 | ) |
| | | | | | | | | | | | | | | | |
| (1) | Non-interest income include: commissions and banking fees; income from insurance and private pension operations before claim and selling expenses and other revenues. |
Net income from Retail Banking decreased by 49.9%, to R$6,621 million for the year ended December 31, 2020 from R$13.226 million for the same period of 2019. These results are explained as follows:
Operating revenues: decreased by 8.3% for the year ended December 31, 2020 compared to the same period of 2019, due to:
(i) a decrease of 10.6% in interest margin driven by an increase in credit products that command lower spreads, especially in government sponsored facilities to our micro/small and medium businesses segment; and lower interest rates for working capital loans, and
(ii) a decrease of 4.9% in non-interest income, especially due to reduced revenues from credit and debit cards fees, resulting from a reduction in the volume of credit and debit cards transactions since the second half of March 2020, due to social distancing measures adopted in response to the COVID-19 pandemic.
Cost of credit and claims increased by R$5,314 million for the year ended December 31, 2020 compared to 2019, mainly due to the change in the macroeconomic scenario and the adverse financial perspectives for individuals and companies as from the second half of March 2020, as a result of the COVID-19 pandemic.
Other operating income (expenses) decreased by R$1,209 million for the year ended December 31, 2020 compared to the same period in 2019, mainly due to a decrease in personnel expenses as a result of a reduction in employee terminations, which were suspended from March through September 2020, due to measures implemented to address the impacts of the COVID-19 pandemic. In addition, we incurred reduced profit-sharing expenses as a result of the challenging macroeconomic scenario. This result was partially offset by: (i) an increase in compensation, mainly due to an increase in the total number of employees, particularly information technology professionals, and (ii) the negotiation of the collective bargaining labor agreement, which provided for a 1.5% salary increase and a R$2,000 bonus paid to employees in Brazil in September 2020.
Income tax and social contribution for this segment, as well as for the Wholesale Banking and Activities with the Market + Corporation segments, is calculated by adopting the full income tax rate, net of the tax effect of any payment of interest on capital. The difference between the income tax amount determined for each segment and the effective income tax amount, as stated in our audited consolidated financial statements, is recorded under the Activities with the Market + Corporation segment. As discussed above under “Net income attributable to owners of the parent company—Current and deferred income and social contribution taxes,” our current and deferred income and social contribution taxes decreased mainly as a result of: (i) increases in provisions for expected loss in the period (which generate tax credits) and (ii) a decrease in net income before tax and social contribution.
(b) Wholesale Banking
124
This segment consists of products and services offered to middle-market companies, high net worth clients (Private Banking), and the operation of Latin American units and Itaú BBA, which is the unit responsible for business with large companies and investment banking operations.
The following table sets forth our summarized consolidated statement of income with respect to our Wholesale Banking segment for the years ended December 31, 2020 and 2019:
| | | | | | | | | | | | | | | | |
Summarized Consolidated Statement of Income-Wholesale Banking | | For the years ended
December 31, | | | Variation | |
| | | 2020 | | | 2019 | | | R$ million | | | % | |
| | | (In millions of R$) | | | | | | | |
Operating revenues | | | 32,187 | | | | 30,650 | | | | 1,537 | | | | 5.0 | |
Interest margin | | | 19,883 | | | | 18,778 | | | | 1,105 | | | | 5.9 | |
Non-interest income (1) | | | 12,304 | | | | 11,872 | | | | 432 | | | | 3.6 | |
Cost of credit and claims | | | (8,976 | ) | | | (2,141 | ) | | | (6,835 | ) | | | — | |
Other operating income (expenses) | | | (16,133 | ) | | | (15,403 | ) | | | (730 | ) | | | 4.7 | |
Income tax and social contribution | | | (1,893 | ) | | | (3,856 | ) | | | 1,963 | | | | — | |
Non-controlling interest in subsidiaries | | | 601 | | | | (444 | ) | | | 1,045 | | | | (235.3 | ) |
Net income | | | 5,786 | | | | 8,806 | | | | (3,020 | ) | | | (34.3 | ) |
| | | | | | | | | | | | | | | | |
| (1) | Non-interest income include: commissions and banking fees; income from insurance and private pension operations before claim and selling expenses and other revenues. |
Net income from Wholesale Banking decreased 34.3% to R$5,786 million for the year ended December 31, 2020 from R$8,806 million for the same period of 2019. These results are explained as follows:
Operating revenues: increased by R$1,537 million, or 5.0%, for the year ended December 31, 2020 compared to the same period of 2019, due to:
(i) an increase of 5.9% in the interest margin, driven by a 33.5% increase in the balance of our corporate loan portfolio (credit origination by aggregate amount of loans increased by 51.7%), mainly due to an increase in working capital, vehicle and export/import financings. Due to the COVID-19 pandemic and the resulting economic crisis, demand for liquidity by companies increased; and
(ii) an increase of 3.6% in non-interest income, especially due to: (a) revenues from asset management fees, which increased by 10.8%; and (b) income from advisory and brokerage services, which increased by 15.2%, mainly due to increased activity in the capital markets. As of December 31, 2020, we acted as underwriter on fixed income transactions in Brazil totaling R$6,936 million and were ranked first in volume of deals by the ANBIMA in this segment. We also provided financial advisory services for 47 M&A transactions in South America, totaling US$ 8,139 million and were ranked first place in number of deals by Dealogic.
Cost of credit and claims increased by R$6,835 million for the year ended December 31, 2020 compared to the same period of 2019, mainly due to changes in the macroeconomic scenario and the adverse financial perspectives of companies as from the second half of March 2020 as a result of the COVID-19 pandemic, during which we recorded a provision for loan losses and impairment charges in our portfolio of corporate securities in Brazil of R$498 million, compared to the same period of 2019, in which we recorded a reversal of R$1,547 million in provisions for loan losses and impairment charges.
Income tax and social contribution for this segment, as well as for the Retail Banking and Activities with the Market + Corporation segments, is calculated by adopting the full income tax rate, net of the tax effect of any payment of interest on capital. The difference between the income tax amount determined for each segment and the effective income tax amount, as stated in our audited consolidated financial statements, is recorded under the Activities with the Market + Corporation
125
segment. As discussed above, our current and deferred income and social contribution taxes decreased mainly a result of: (i) increases in provisions for expected loss in the period (which generate tax credits) and (ii) a decrease in net income before tax and social contribution.
(c) Activities with the Market + Corporation (formerly Trading & Institutional)
This segment consists of results from capital surplus, subordinated debt surplus and the net balance of tax credits and debits. It also includes the financial margin on market trading, treasury operating costs, and equity in earnings of companies not included in either of the other segments.
The following table sets forth our summarized consolidated statement of income with respect to our Activities with the Market + Corporation segment for the years ended December 31, 2020 and 2019:
| | | | | | | | | | | | | | | | |
| Summarized Consolidated Statement of Income-Activities with the Market + Corporation | | For the years ended
December 31, | | | Variation | |
| | | 2020 | | | 2019 | | | R$ million | | | % | |
| | | (In millions of R$) | | | | | | | |
Operating revenues | | | 9,918 | | | | 9,913 | | | | 6 | | | | 0.1 | |
Interest margin | | | 8,394 | | | | 9,088 | | | | (694 | ) | | | (7.6 | ) |
Non-interest income (1) | | | 1,524 | | | | 825 | | | | 699 | | | | 84.7 | |
Cost of credit and claims | | | 6 | | | | 0 | | | | 6 | | | | — | |
Other operating income (expenses) | | | (650 | ) | | | (987 | ) | | | 337 | | | | (34.2 | ) |
Income tax and social contribution | | | (3,099 | ) | | | (2,545 | ) | | | (554 | ) | | | — | |
Non-controlling interest in subsidiaries | | | (46 | ) | | | (51 | ) | | | 5 | | | | (9.8 | ) |
Net income | | | 6,129 | | | | 6,331 | | | | (202 | ) | | | (3.2 | ) |
| | | | | | | | | | | | | | | | |
| (1) | Non-interest income include: commissions and banking fees; income from insurance and private pension operations before claim and selling expenses and other revenues. |
Net income from Activities with the Market + Corporation decreased 3.2%, or R$202 million, for the year ended December 31, 2020 from 2019. We recorded a reduction in investments abroad, which were partially offset by earnings from other companies.
Income tax and social contribution for this segment, as well as for the Retail Banking and Wholesale Banking segments, is calculated by adopting the full income tax rate, net of the tax effect of any payment of interest on capital. The difference between the income tax amount determined for each segment and the effective income tax amount, as stated in our audited consolidated financial statements, is recorded under the Activities with the Market + Corporation segment. In 2019, fiscal authorities temporarily decreased the recognition rate for income and social contribution taxes to 40%. However, as from March 1, 2020, the recognition rate was increased again to 45%. The increase in the recognition rate was partially offset by increases in provisions for expected loss in the period (which generate tax credits).
Balance Sheet
We present below our summarized balance sheet as of December 31, 2020 and 2019. Please see our audited consolidated financial statements for further details about our Consolidated Balance Sheet.
126
| | | | | | | | | | | | | | | | |
Summarized Balance Sheet—Assets | | As of December 31, | | | Variation | |
| | | 2020 | | | 2019 | | | R$ million | | | % | |
| | | (In millions of R$) | | | | | | | |
Cash | | | 46,224 | | | | 30,367 | | | | 15,857 | | | | 52.2 | |
Financial assets at amortized cost | | | 1,275,799 | | | | 1,101,892 | | | | 173,907 | | | | 15.8 | |
Compulsory deposits in the Central Bank of Brazil | | | 90,059 | | | | 91,248 | | | | (1,189 | ) | | | (1.3 | ) |
Interbank deposits, securities purchased under agreements to resell and | | | 425,432 | | | | 366,130 | | | | 59,302 | | | | 16.2 | |
securities at amortized cost | | | | | | | | | | | | | | | | |
Loan and lease operations portfolio | | | 714,104 | | | | 585,791 | | | | 128,313 | | | | 21.9 | |
Other financial assets | | | 93,255 | | | | 94,752 | | | | (1,497 | ) | | | (1.6 | ) |
(-) Provision for Expected Loss | | | (47,051 | ) | | | (36,029 | ) | | | (11,022 | ) | | | 30.6 | |
Financial assets at fair value through other comprehensive income | | | 109,942 | | | | 76,660 | | | | 33,282 | | | | 43.4 | |
Financial assets at fair value through profit or loss | | | 465,581 | | | | 322,929 | | | | 142,652 | | | | 44.2 | |
Investments in associates and join ventures, Fixed assets, Goodwill and Intangible assets, assets held for sale and other assets | | | 55,610 | | | | 56,673 | | | | (1,063 | ) | | | (1.9 | ) |
Tax assets | | | 66,095 | | | | 48,960 | | | | 17,135 | | | | 35.0 | |
| | | | | | | | | | | | | | | | |
Total assets | | | 2,019,251 | | | | 1,637,481 | | | | 381,770 | | | | 23.3 | |
| | | | | | | | | | | | | | | | |
December 31, 2020 compared to December 31, 2019.
Total assets increased by R$381,770 million, or 23.3%, as of December 31, 2020 compared to the same period in 2019, mainly due to an increase in financial assets at fair value through profit or loss and in our loan and lease operations portfolio. This result was partially offset by an increase in provisions for expected losses. These results are further described below:
| | • | | Financial assets at fair value through profit or loss increased by R$142,652 million, or 44.2%, as of December 31, 2020 compared to December 31, 2019, mainly due to: (i) a R$107,996 million increase in securities at fair value through profit or loss, especially in Brazilian government securities, which increased by R$66,274 million; and (ii) a R$34,650 million increase in the balance of derivatives, both for our own hedge strategy and clients’ operations. This increase in the balance of derivatives is related to increased market volatility following the uncertainties brought by changes in the macroeconomic scenario due to the COVID-19 pandemic. |
Please see “Note 5 – Financial Assets at Fair Value Through Profit or Loss and Designated at Fair Value Through Profit or Loss —Securities” and “Note 6 – Derivatives” to our audited consolidated financial statements for further details.
| | • | | Loan and lease operations portfolio increased by R$128,313 million, or 21.9%, as of December 31, 2020, compared to December 31, 2019, mainly due to the following increases: |
(i) 34.4% in our micro/small and medium businesses loan portfolio (credit origination by aggregate amount of loans increased by 24.0%), mainly due to an increase in working capital loans, due to government sponsored facilities such as the National Support Program for Micro and Very Small Businesses (Pronampe) and the Investment Guarantee Fund (FGI). These government initiatives aim to guarantee financial resources for micro and small enterprises to enable them to maintain their activities during the COVID-19 pandemic and the resulting economic crisis.
(ii) 33.5% in our corporate loan portfolio (credit origination by aggregate amount of loans increased by 51.7%), mainly due to working capital loans, vehicle and export/import financings. Due to the COVID-19 pandemic and the resulting economic crisis, demand for liquidity by companies increased.
(iii) 31.5% in our Latin America loan portfolio as a result of exchange rate fluctuations; and
(iv) 6.2% in our individuals loan portfolio mainly due to increases of 22.8% in vehicle loans and 19.7% in mortgage loans. Credit origination in our individuals loan portfolio increased by 14.1% in the same period compared to 2019. This result was partially offset by the decrease of 5.0% in our credit cards portfolio, especially due to the reduction of the volume of credit cards transactions in the first semester of 2020, due to social distancing measures adopted in response to the COVID-19 pandemic.
127
| | | | | | | | | | | | | | | | |
| | | As of December 31, | | | Variation | |
Loan and Lease Operations, by asset type | | 2020 | | | 2019 | | | R$ million | | | % | |
| | | (In millions of R$) | | | | | | | |
Individuals | | | 255,483 | | | | 240,490 | | | | 14,993 | | | | 6.2 | |
Credit card | | | 87,073 | | | | 91,676 | | | | (4,603 | ) | | | (5.0 | ) |
Personal loan | | | 35,346 | | | | 34,892 | | | | 454 | | | | 1.3 | |
Payroll loans | | | 55,508 | | | | 49,608 | | | | 5,900 | | | | 11.9 | |
Vehicles | | | 23,290 | | | | 18,968 | | | | 4,322 | | | | 22.8 | |
Mortgage loans | | | 54,266 | | | | 45,346 | | | | 8,920 | | | | 19.7 | |
Corporate | | | 134,521 | | | | 100,789 | | | | 33,732 | | | | 33.5 | |
Micro/Small and Medium Businesses | | | 121,955 | | | | 90,733 | | | | 31,222 | | | | 34.4 | |
Foreign Loans Latin America | | | 202,145 | | | | 153,779 | | | | 48,366 | | | | 31.5 | |
| | | | | | | | | | | | | | | | |
Total Loan operations and lease operations portfolio | | | 714,104 | | | | 585,791 | | | | 128,313 | | | | 21.9 | |
| | | | | | | | | | | | | | | | |
Please see “Note 10—Loan and Lease Operations” to our audited consolidated financial statements for further details.
| | • | | Interbank deposits, securities purchased under agreements to resell and securities at amortized cost increased by R$59,302 million, or 16.2% as of December 31, 2020 compared to December 31, 2019, mainly due to the following increases: (i) R$41,513 million in securities purchased under agreements to resell; (ii) R$21,056 million in interbank deposits impacted by exchange rate variation. |
Please see “Note 4—Interbank Deposits and Securities Purchased Under Agreements to Resell” and “Note 9—Financial Assets at Amortized Cost – Securities” to our audited consolidated financial statements for further details.
| | • | | Financial assets at fair value through other comprehensive income increased by R$33,282 million, or 43.4% as of December 31, 2020 compared to December 31, 2019, mainly due to (i) an increase of R$17,217 million in Brazilian government securities, due to increased demand for liquidity, and (ii) a R$13,831 million increase in the balance of government securities – abroad, especially in Chile which increased by R$10,443 million, as compared to December 31, 2019, due to higher demand for liquidity. |
Please see “Note 8 – Financial Assets at Fair Value Through Other Comprehensive Income – Securities” to our audited consolidated financial statements for further details.
| | • | | Tax assets increased by R$17,135 million, or 35.0% as of December 31, 2020, compared to December 31, 2019, due to (i) the impact of the fiscal hedge from our investments abroad and (ii) increases in provisions for expected loss in the period. |
Please see “Note 24 – Taxes” to our audited consolidated financial statements for further details.
We present below our summarized balance sheet – liabilities and stockholders’ equity as of December 31, 2020 and 2019. Please see our audited consolidated financial statements for further details about our Consolidated Balance Sheet.
128
| | | | | | | | | | | | | | | | |
| | | As of December 31, | | | Variation | |
Summarized Balance Sheet—Liabilities and Stockholders’ Equity | | 2020 | | | 2019 | | | R$ million | | | % | |
| | | (In millions of R$) | | | | | | | |
Financial Liabilities | | | 1,579,686 | | | | 1,211,999 | | | | 367,687 | | | | 30.3 | |
At Amortized Cost | | | 1,495,641 | | | | 1,159,830 | | | | 335,811 | | | | 29.0 | |
Deposits | | | 809,010 | | | | 507,060 | | | | 301,950 | | | | 59.5 | |
Securities sold under repurchase agreements | | | 273,364 | | | | 256,583 | | | | 16,781 | | | | 6.5 | |
Interbank market funds, Institutional market funds and other financial liabilities | | | 413,267 | | | | 396,187 | | | | 17,080 | | | | 4.3 | |
At Fair Value Through Profit or Loss | | | 79,653 | | | | 48,029 | | | | 31,624 | | | | 65.8 | |
Provision for Expected Loss | | | 4,392 | | | | 4,140 | | | | 252 | | | | 6.1 | |
Provision for insurance and private pensions | | | 221,000 | | | | 218,334 | | | | 2,666 | | | | 1.2 | |
Provisions | | | 19,819 | | | | 21,454 | | | | (1,635 | ) | | | (7.6 | ) |
Tax liabilities | | | 5,710 | | | | 7,891 | | | | (2,181 | ) | | | (27.6 | ) |
Other liabilities | | | 38,511 | | | | 28,338 | | | | 10,173 | | | | 35.9 | |
Total liabilities | | | 1,864,726 | | | | 1,488,016 | | | | 376,710 | | | | 25.3 | |
Total stockholders’ equity attributed to the owners of the parent company | | | 142,993 | | | | 136,925 | | | | 6,068 | | | | 4.4 | |
Non-controlling interests | | | 11,532 | | | | 12,540 | | | | (1,008 | ) | | | (8.0 | ) |
Total stockholders’ equity | | | 154,525 | | | | 149,465 | | | | 5,060 | | | | 3.4 | |
| | | | | | | | | | | | | | | | |
Total liabilities and stockholders’ equity | | | 2,019,251 | | | | 1,637,481 | | | | 381,770 | | | | 23.3 | |
| | | | | | | | | | | | | | | | |
Total liabilities and stockholders’ equity increased by R$381,770 million, or 23.3% as of December 31, 2020 compared to December 31, 2019, mainly due to an increase in deposits, securities sold under repurchase agreements, interbank and institutional market debt and financial liabilities at fair value through profit and loss. These results are detailed as follows:
| | • | | Deposits increased by 59.5% as of December 31, 2020 compared to December 31, 2019, mainly due to an increase of R$214,068 million in time deposits, R$52,499 million in demand deposits and R$34,912 million in saving deposits. These increases are mainly associated with the inflow of resources from our clients into the Retail Banking and Wholesale Banking segments as from the second half of March 2020. This inflow resulted from our strategy to offer fixed income products (such as bank deposit certificates) combined with a stronger demand from our clients for lower risk investments and products with higher liquidity. |
Please see “Note 15 – Deposits” to our audited consolidated financial statements for further details.
| | • | | Interbank and Institutional market funds and other financial liabilities increased by R$17,080 million, or 4.3%, as of December 31, 2020 compared to December 31, 2019, mainly due to the following increases: |
(i) R$18,761 million in obligations on securities issued abroad, including the issuance of US$1,500 million of Senior Notes in January 2020 (equivalent to approximately R$6,404 million, as of January 31, 2020);
(ii) R$15,454 million in subordinated debt, including the issuance of US$690 million of Tier 1 Subordinated Notes in February 2020 (equivalent to approximately R$3,149 million, as of February 28, 2020); and
(iii) R$6,848 million in import and export financings.
These items were also directly affected by exchange rate fluctuations.
This increase was partially offset by a R$21,844 million reduction in financial bills and a R$6,919 million reduction in agribusiness credit bills, as of December 31, 2020 compared to December 31, 2019, mainly due to the maturity of these bills.
Please see “Note 17 – Securities Sold Under Repurchase Agreements and Interbank and Institutional Market Funds” to our audited consolidated financial statements for further details.
129
Securities sold under repurchase agreements increased by R$16,781 million, or 6.5%, as of December 31, 2020 compared to December 31, 2019, mainly due to a R$28,651 million increase in securities with right to sell or repledge the collateral and R$11,366 million increase in assets received as collateral. This result was partially offset by a decrease of R$23,236 million in assets pledged as collateral, especially government securities.
Please see “Note 17 – Securities sold under repurchase agreements and interbank and institutional market funds” to our audited consolidated financial statements for further details.
Financial liabilities at fair value through profit and loss increased by R$31,624 million, or 65.8%, as of December 31, 2020, compared to December 31, 2019, mainly due to a R$31,677 million increase in the balance of derivatives, both for our proprietary hedging strategy and that for our clients’ operations. This increase is related to increased market volatility resulting from the COVID-19 pandemic.
Please see “Note 6 – Derivatives” to our audited consolidated financial statements for further details.
Total Stockholders’ equity increased by R$5,060 million, or 3.4%, as of December 31, 2020 compared to December 31, 2019, mainly due to R$15,064 million net income in the period which was partially offset by the distribution of R$9,811 million in dividends and interest on capital
Capital Management
Key Indicators
Our Board of Directors is the main body responsible for our capital management, and for approving our capital management policies and guidelines regarding our capitalization level. It is also responsible for approving the ICAAP (Internal Capital Adequacy Assessment Process) report, a process which is intended to assess our capital adequacy. At the executive level, corporate bodies are responsible for approving risk assessment and capital calculation methodologies, as well as reviewing, monitoring and recommending capital-related documents and topics to the Board of Directors.
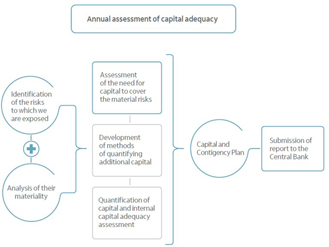
In compliance with CMN and Central Bank regulations, we have implemented a capital management structure and ICAAP, taking a prospective stance in relation to capital management.
In addition, we have a Recovery Plan, which is a report that aims at defining how to reestablish adequate levels of capital and liquidity in response to stress situations.
Requirements and Capital Composition
130
Our minimum capital requirements are expressed as ratios of the capital available, or the Total Capital, and the risk-weighted assets, or RWA. These ratios follow the set of resolutions and circulars disclosed by the Central Bank that implemented, in Brazil, the global capital requirement standards known as Basel III.
The Total Capital is the sum of three items, as shown below:
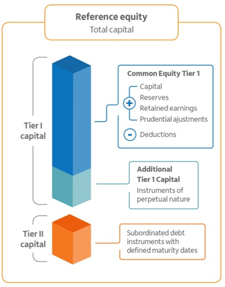
For purposes of calculating these minimum capital requirements, the total RWA is determined as the sum of the risk-weighted asset amounts for credit, market and operational risks.
The minimum Total Capital ratio required is 8.0% as from January 1st, 2019.
The Central Bank rules call for Additional Capital Buffers, or ACP, corresponding to the sum of the components ACPConservation, ACPCountercyclicaland ACPSystemic, which, in conjunction with the requirements mentioned, increase capital requirements over time, as provided for CMN Resolution 4,193 of March 1, 2013 as amended (“CMN Resolution 4,193”). The amount of each component and the minimum regulatory requirements are provided for in CMN Resolution 4,193, as amended.
According to CMN Resolution 4,193, for assessing the minimum capital requirements, the RWA must be calculated by adding the following portions:
| | • | | RWACPAD – Credit Risk: calculated using standardized approach; |
| | • | | RWAMINT – Market Risk: made up of the maximum between the internal model and 80% of the standardized model; and |
| | • | | RWAOPAD – Operational Risk: calculated using standardized approach. |
Capital Adequacy
Through our ICAAP, we assess the adequacy of our capital to face the risks to which we are subject. For ICAAP, capital is composed of regulatory capital for credit, market and operational risks, and by the necessary capital to cover other risks.
In order to ensure our capital soundness and availability to support business growth, we maintain capital levels above the minimum requirements, according to the Common Equity Tier I, Additional Tier I Capital, and Tier II minimum ratios.
131
| | | | | | | | |
| | | As of December 31, | |
| | | 2020 | | | 2019 | |
| | | (In R$ million, except percentages) | |
Available capital (amounts) | | | | | | | | |
Common Equity Tier I (CET1) | | | 119,960 | | | | 117,328 | |
Tier I | | | 137,157 | | | | 128,696 | |
Total capital | | | 151,244 | | | | 140,596 | |
Risk-weighted assets (amounts) | | | | | | | | |
Total risk-weighted assets (RWA) | | | 1,042,207 | | | | 891,300 | |
Risk-based capital ratios as a percentage of RWA | | | | | | | | |
Common Equity Tier I ratio (%) | | | 11.5 | % | | | 13.2 | % |
Tier I ratio (%) | | | 13.2 | % | | | 14.4 | % |
Total capital ratio (%) | | | 14.5 | % | | | 15.8 | % |
Additional CET1 buffer requirements as a percentage of RWA | | | | | | | | |
Capital conservation buffer requirement (%) (1) | | | 1.25 | % | | | 2.5 | % |
Countercyclical buffer requirement (%) | | | 0.0 | % | | | 0.0 | % |
Bank G-SIB and/or D-SIB additional requirements (%) | | | 1.0 | % | | | 1.0 | % |
Total of bank CET1 specific buffer requirements (%) | | | 2.25 | % | | | 3.5 | % |
| (1) | For purposes of calculating the Conservation capital buffer, BACEN Resolution 4,783 establishes, for defined periods, percentages to be applied to the RWA value with a gradual increase until April/22, when it reaches 2.5%. |
| | The countercyclical capital buffer is fixed by the Financial Stability Committee and currently is set to zero. |
Our Total Capital, Tier I Capital and Common Equity Tier I Capital ratios are calculated on a consolidated basis, applied to institutions included in our Prudential Conglomerate which comprises not only financial institutions but also consortia (consórcios), payment entities, factoring companies or companies that directly or indirectly assume credit risk, and investment funds in which our Itaú Unibanco Group retains substantially all risks and rewards.
As of December 31, 2020, our Total Capital reached R$151,244 million, an increase of R$10,648 million compared to December 31, 2019. Our Basel Ratio (calculated as the ratio between our Total Capital and the total amount of RWA) reached 14.5%, as of December 31, 2020, a decrease of 130 basis points compared to 15.8% as of December 31, 2019, mainly due to the foreign exchange rate impact, the provision of interest on capital, dividends referring to fiscal year 2019, and increase in risk weighted assets, partially offset by net income in the period and the issuance of Tier I and Tier II debts.
Additionally, the Fixed Assets Ratio (Índice de Imobilização) indicates the level of total capital committed to adjusted permanent assets. Itaú Unibanco Holding is within the maximum limit of 50% of the adjusted total capital, as established by the Central Bank. On December 31, 2020, our Fixed Assets Ratio reached 24.0%, which presents a buffer of R$39,274 million.
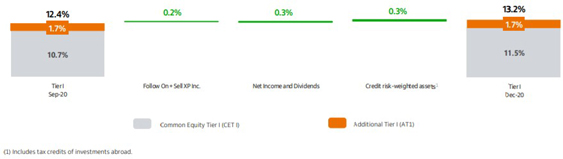
Our Tier I ratio increased 80 basis points in relation to September 30, 2020 mainly due to net income in the period, including the result from the sale of shares issued by XP Inc. owned by us and the decrease in credit risk weighted assets.
132
Please see “Item 4B. Business Overview – Supervision and Regulation – Basel III Framework – Implementation of Basel III in Brazil” for further details about minimum capital ratios.
Please see “Note 32 – Risk and Capital Management” of our audited consolidated financial statements for further details about regulatory capital.
Liquidity Ratios
The Basel III Framework introduced global liquidity standards, providing for minimum liquidity requirements and aims to ensure that banks can rely on their own sources of liquidity, leaving central banks as a lender of last resort. Basel III provides for two liquidity ratios to ensure that financial institutions have sufficient liquidity to meet their short-term and long-term obligations: (i) the liquidity coverage ratio, or LCR, and (ii) the net stable funding ratio, or NSFR. We believe that the LCR and NSFR provide more relevant information than an analysis of summarized cash flows.
We present below a discussion of our LCR for the three-month period ended December 31, 2020 and our NSFR as of December 31, 2020.
Liquidity Coverage Ratio
The LCR measures the short-term resistance of a bank’s liquidity risk profile. It is the ratio of the stock of high-quality liquid assets to expected net cash outflows over the next 30 days, assuming a scenario of idiosyncratic or systemic liquidity stress.
We calculate our LCR according to the methodology established in Central Bank Circular No. 3,749/2015. We measure our total high liquidity assets for the end of each period to cash outflows and inflows as the daily average value for each period. Pursuant to Central Bank regulations, effective as of January 1, 2019, the minimum LCR is 100%.
| | | | | | | | |
| | | Three-month periods
ended December 31, | |
Liquidity Coverage Ratio | | 2020 | | | 2019 | |
| | | Total Weighted
Value (average) | |
| | | (In millions of R$) | |
Total High Liquidity Assets (HQLA)1 | | | 343,174 | | | | 170,004 | |
Cash Outflows2 | | | 309,652 | | | | 225,349 | |
Cash Inflows3 | | | 133,297 | | | | 111,313 | |
Total Net Cash Outflows | | | 176,355 | | | | 114,035 | |
| | | | | | | | |
LCR% | | | 194.6 | % | | | 149.1 | % |
| | | | | | | | |
| (1) | High Quality Liquidity Assets correspond to inventories, in some cases weighted by a discount factor, of assets that remain liquid in the market even in periods of stress, that can easily be converted into cash and that are classified as low risk. |
| (2) | Outflows — total potential cash outflows for a 30-day horizon, calculated for a standard stress scenario as defined by BACEN Circular 3,749. |
| (3) | Inflows — total potential cash inflows for a 30-day horizon, calculated for a standard stress scenario as defined by BACEN Circular 3,749. |
Our average LCR as of December 31, 2020 was 194.6% and, accordingly, above Central Bank requirements.
133
Net Stable Funding Ratio
The NSFR measures long-term liquidity risk. It is the ratio of available stable funding to required stable funding over a one-year time period, assuming a stressed scenario.
We calculate our NSFR according to the methodology established in Central Bank Circular No. 3,869/2017. The NSFR corresponds to the ratio of our available stable funds (ASF) for the end of each period to our required stable funds (RSF) for the end of each period.
Pursuant to Central Bank regulations, effective as of October 1, 2018, the minimum NSFR is 100%.
| | | | | | | | |
| | | As of December 31, | |
Net Stable Funding Ratio | | 2020 | | | 2019 | |
| | | Total Ajusted Value | |
| | | (In millions of R$) | |
Total Available Stable Funding (ASF)¹ | | | 956,033 | | | | 733,242 | |
Total Required Stable Funding (RSF)² | | | 758,907 | | | | 599,963 | |
| | | | | | | | |
NSFR (%) | | | 126.0 | % | | | 122.2 | % |
| | | | | | | | |
| (1) | ASF – Available Stable Funding – refers to liabilities and equity weighted by a discount factor according to their stability, pursuant to Central Bank Circular 3,869/2017. |
| (2) | RSF – Required Stable Funding – refers to assets and off-balance exposures weighted by a discount factor to their necessity, pursuant to Central Bank Circular 3,869/2017. |
As of December 31, 2020, our ASF totaled R$956.0 billion, mainly due to capital and Retail Banking and Wholesale Banking funding, and our RSF totaled R$758.9 billion, particularly due to loans and financing with Wholesale Banking and Retail Banking customers, central governments and transactions with central banks.
As of December 31, 2020, our NSFR was 126.0% and, accordingly, above Central Bank requirements.
| 5B. | Liquidity and Capital Resources |
Our Board of Directors determines our policy regarding liquidity risk management and establishes broad quantitative liquidity risk management limits in line with our risk appetite. The CSRML (Comitê Superior de Risco de Mercado e Liquidez), composed of members of senior management, is responsible for strategic liquidity risk management in line with the board-approved liquidity risk framework and risk appetite. In establishing our guidelines, the CSRML considers the liquidity implications of each market segment and product. Our institutional treasury unit is responsible for the day-to-day management of the Itaú Unibanco Group’s liquidity profile, within the parameters set by our Board of Directors and the CSRML. This includes an oversight responsibility with respect to all business units operating outside of Brazil.
We maintain separate liquidity pools at our Brazilian operations and at each of our subsidiaries outside of Brazil. Our Brazilian operations include financial institutions in Brazil and the entities used by the Brazilian operations for funding and serving their clients abroad. Each of our subsidiary has its own treasury function with appropriate autonomy to manage liquidity according to local needs and regulations, while remaining in compliance with the liquidity limits established by our senior management. In general, there are rarely liquidity transfers between subsidiaries or between the head office and a subsidiary, except under very specific circumstances (e.g., targeted capital increases).
CMN regulations establish capital conservation and countercyclical buffers for Brazilian financial institutions such as ourselves, and determines their minimum percentages as well as which sanctions and limitations will apply in case of non-compliance with such additional requirements.
134
We define our consolidated group operational liquidity reserve as the total amount of assets that can be rapidly turned into cash, based on local market practices and legal restrictions. The operational liquidity reserve generally includes cash and deposits on demand, funded positions of securities purchased under agreements to resell and unencumbered government securities.
The following table presents our operational liquidity reserve as of December 31, 2020, 2019 and 2018:
| | | | | | | | | | | | | | | | |
| | | As of December 31, | | | 2020 Average | |
Operational Liquidity Reserve | | 2020 | | | 2019 | | | 2018 | | | Balance(1) | |
| | | (In millions of R$) | | | | |
Cash | | | 46,224 | | | | 30,367 | | | | 37,159 | | | | 41,061 | |
Securities purchased under agreements to resell – Funded position (2) | | | 44,743 | | | | 26,797 | | | | 45,335 | | | | 37,361 | |
Unencumbered government securities (3) | | | 232,245 | | | | 115,774 | | | | 74,760 | | | | 178,124 | |
Operational reserve | | | 323,212 | | | | 172,938 | | | | 157,254 | | | | 256,546 | |
| | | | | | | | | | | | | | | | |
| (1) | Average calculated based on audited interim financial statements. |
| (2) | Net of R$ 11,119 (R$8,544 at 12/31/2019 and R$5,120 at 12/31/2018), which securities are restricted to guarantee transactions at B3 S.A.—Brasil, Bolsa, Balcão (B3) and the Central Bank. |
| (3) | Present values are included as a result of the change in the reporting of future flows of assets that are now reported as future value as of September 2016. |
Our management controls our liquidity reserves by projecting the resources that will be available for investment by our treasury department. The technique we employ involves the statistical projection of scenarios for our assets and liabilities, considering the liquidity profiles of our counterparties.
Short-term minimum liquidity limits are defined according to guidelines set by the CSRML. These limits aim at ensuring that the Itaú Unibanco Group always has sufficient liquidity available to cover unforeseen market events. These limits are revised periodically, based on the projection of cash needs in atypical market situations (i.e., stress scenarios).
Management of liquidity makes it possible for us to simultaneously meet our operating requirements, protect our capital and exploit market opportunities. Our strategy is to maintain adequate liquidity to meet our present and future financial obligations and to capitalize on business opportunities as they arise.
We are exposed to effects of the disruptions and volatility in the global financial markets and the economies in those countries where we do business, especially Brazil. However, due to our stable sources of funding, which include a large deposit base, the large number of correspondent banks with which we have long-standing relationships, as well as facilities in place which enable us to access further funding when required, we have not historically experienced liquidity challenges, even during periods of disruption in the international financial markets.
Particularly in 2020, a year with unusual volatility in the global financial markets, we had a significant improvement in the reserve and liquidity indicators. This improvement was due to the increase in our retail and wholesale funding and also to the liquidity measures conducted by central banks.
Our main sources of funding are interest-bearing deposits, deposits received under repurchase agreements, on-lending from government financial institutions, lines of credit with foreign banks and the issuance of securities abroad. Please see “Note 15 – Deposits” to our audited consolidated financial statements for further details about funding.
We may from time to time seek to retire or purchase our outstanding debt, including our subordinated notes (subject to the approval of the Central Bank), and senior notes, through cash purchases in the open market purchases, privately negotiated transactions or otherwise. Such repurchases, if any, will depend on prevailing market conditions, our liquidity requirements, contractual restrictions and other factors. Notes repurchased may be held, cancelled or resold and any resale thereof will need to comply with applicable requirements or exemptions under the relevant securities laws.
135
Some of our long-term debt provides for acceleration of the outstanding principal balance upon the occurrence of specified events, which are events ordinarily found in long-term financing agreements. Up to December 31, 2020, none of these events, including any events of default or failure to satisfy financial covenants, have occurred.
Under Brazilian law, cash dividends may only be paid if the subsidiary paying such dividends has reported a profit in its financial statements. In addition, subsidiaries that are financial institutions are prohibited from making loans to Itaú Unibanco Holding, but they are allowed to make deposits in Itaú Unibanco Holding, which represent interbank certificates of deposit (Certificado de Depósito Interbancário). These restrictions have not had, and are not expected to have, a material impact on our ability to meet our cash obligations. For more information on our dividend policy, see “Item 8A. Consolidated Statements and Other Financial Information – Stockholders’ Payment”.
Sustainable Tier 2 Subordinated Notes Issuance
On January 15, 2021, we, acting through our Grand Cayman branch, issued US$500,000,000 5,875% Tier 2 Subordinated Notes due 2031, under our global medium programme. The net proceeds of the issuance are expected to be used to finance and/or refinance green and/or social projects pursuant to the Framework.
Capital Expenditures
In accordance with our practice in the last few years, our capital expenditures in the year ended December 31, 2020 were funded with internal resources. We cannot provide assurance that we will make capital expenditures in the future and, if made, that the amounts will correspond to the current estimates. The table below shows our capital expenditures as of December 31, 2020, 2019 and 2018:
| | | | | | | | | | | | | | | | | | | | | | | | | | | | |
Capital Expenditures | | For the Year Ended
December 31, | | | | | | Variation | |
| | | 2020 | | | 2019 | | | 2018 | | | 2020-2019 | | | 2019-2018 | |
| | | (In millions of R$, except percentages) | |
Fixed Assets | | | 1,716 | | | | 1,621 | | | | 1,483 | | | | 95 | | | | 5.9 | % | | | 138 | | | | 9.3 | % |
Fixed assets under construction | | | 457 | | | | 473 | | | | 474 | | | | (16 | ) | | | (3.4 | )% | | | (1 | ) | | | (0.2 | )% |
Land and buildings | | | 38 | | | | 52 | | | | — | | | | (14 | ) | | | (26.9 | )% | | | 52 | | | | — | |
Leasehold improvements | | | 39 | | | | 60 | | | | 35 | | | | (21 | ) | | | (35.0 | )% | | | 25 | | | | 71.4 | % |
Furniture and data processing equipment | | | 1,112 | | | | 946 | | | | 845 | | | | 166 | | | | 17.5 | % | | | 101 | | | | 12.0 | % |
Other | | | 70 | | | | 90 | | | | 129 | | | | (20 | ) | | | (22.2 | )% | | | (39 | ) | | | (30.2 | )% |
Intangible Assets | | | 3,591 | | | | 2,691 | | | | 1,381 | | | | 900 | | | | 33.4 | % | | | 1,310 | | | | 94.9 | % |
Goodwill | | | 287 | | | | — | | | | 8 | | | | 287 | | | | — | | | | (8 | ) | | | — | |
Association for the promotion and offer of financial products and services | | | — | | | | — | | | | 1 | | | | — | | | | — | | | | (1 | ) | | | — | |
Software developed or obtained for internal use | | | 2,763 | | | | 1,976 | | | | 964 | | | | 787 | | | | 39.8 | % | | | 1,012 | | | | 105.0 | % |
Other intangibles | | | 541 | | | | 715 | | | | 408 | | | | (174 | ) | | | (24.3 | )% | | | 307 | | | | 75.2 | % |
Total | | | 5,307 | | | | 4,312 | | | | 2,864 | | | | 995 | | | | 23.1 | % | | | 1,448 | | | | 50.6 | % |
| | | | | | | | | | | | | | | | | | | | | | | | | | | | |
See “Note 13 – Fixed Assets” and “Note 14 – Goodwill and Intangible Assets” to our audited consolidated financial statements for further details.
Capitalization
The table below presents our capitalization as of December 31, 2020. The information described is derived from our audited consolidated financial statements as of and for the year ended December 31, 2020. As of the date of this annual report, there has been no material change in our capitalization since December 31, 2020.
136
You should read the table below in conjunction with the information included in “Item 4B. Business Overview – Selected Statistical Information” for further details.
| | | | | | | | |
| | | As of December 31, 2020 | |
Capitalization | | R$ | | | US$ (1) | |
| | | (In millions, except percentages) | |
Current liabilities | | | | | | | | |
Deposits | | | 511,015 | | | | 98,335 | |
Securities sold under repurchase agreements | | | 225,182 | | | | 43,332 | |
Structured notes | | | 11 | | | | 2 | |
Derivatives | | | 36,465 | | | | 7,017 | |
Interbank market funds | | | 94,921 | | | | 18,266 | |
Institutional market funds | | | 19,339 | | | | 3,721 | |
Other financial liabilities | | | 112,745 | | | | 21,695 | |
Provision for insurance and private pension | | | 3,063 | | | | 589 | |
Provisions | | | 5,927 | | | | 1,141 | |
Tax liabilities | | | 2,878 | | | | 554 | |
Other Non-financial liabilities | | | 35,248 | | | | 6,783 | |
| | | | | | | | |
Total | | | 1,046,794 | | | | 201,435 | |
| | | | | | | | |
Long-term liabilities | | | | | | | | |
Deposits | | | 297,995 | | | | 57,343 | |
Securities sold under repurchase agreements | | | 48,182 | | | | 9,272 | |
Structured notes | | | 132 | | | | 25 | |
Derivatives | | | 43,040 | | | | 8,282 | |
Interbank market funds | | | 61,114 | | | | 11,760 | |
Institutional market funds | | | 118,969 | | | | 22,893 | |
Other financial liabilities | | | 6,184 | | | | 1,190 | |
Provision for insurance and private pension | | | 217,937 | | | | 41,939 | |
Provision for Expected Loss | | | 4,392 | | | | 845 | |
Provisions | | | 13,892 | | | | 2,673 | |
Tax liabilities | | | 2,411 | | | | 464 | |
Other Non-financial liabilities | | | 3,263 | | | | 628 | |
| | | | | | | | |
Total | | | 817,511 | | | | 157,314 | |
| | | | | | | | |
Income tax and social contribution—deferred | | | 421 | | | | 81 | |
Non-controlling interests | | | 11,532 | | | | 2,219 | |
Stockholders’ equity attributed to the owners of the parent company (2) | | | 142,993 | | | | 27,516 | |
| | | | | | | | |
Total capitalization (3) | | | 2,019,251 | | | | 388,565 | |
| | | | | | | | |
BIS ratio (4) | | | 14.5 | % | | | | |
| | | | | | | | |
| (1) | Convenience translation at 5.1967 reais per U.S. dollar, the exchange rate in effect on December 31, 2020. 5.1967 |
| (2) | Itaú Unibanco Holding’s authorized and outstanding share capital consists of 4,958,290,359 common shares and 4,801,324,161 preferred shares, all of which are fully paid. For more information regarding our share capital see Note 19 to our audited consolidated financial statements as of and for the period ended December 31, 2020. |
| (3) | Total capitalization corresponds to the sum of total current liabilities, long-term liabilities, deferred income, minority interest in subsidiaries and stockholders’ equity. |
| (4) | Calculated by dividing total regulatory capital by risk weight assets. |
Sensitivity Analyses (Trading and Banking Portfolios)
As required by Brazilian regulation, we conduct sensitivity analyses for market risk factors considered important. The highest resulting losses are presented below, with impact on result, by risk factor, in each such scenario and are calculated net of tax effects, providing a view of our exposure under different circumstances.
The sensitivity analyses of the Trading Portfolio and Banking Portfolio presented here are based on a static assessment of the portfolio exposure. Therefore, such analyses do not consider the dynamic response capacity of management (e.g., treasury and market risk control unit) to initiate mitigating measures, whenever a situation of high loss or risk is identified, minimizing the possibility of significant losses. In addition, the analysis is intended to assess risk exposure and the respective protective actions, taking into account the fair value of financial instruments, regardless of whether or not financial instruments are accounted for on an accrual basis.
137
| | | | | | | | | | | | | | | | | | | | | | | | | | |
Exposures | | | | Trading Portfolio(1)
December 31, 2020 | | | Trading and Banking Portfolios(1)
December 31, 2020 | |
Risk Factors | | Risk of varitions in: | | Scenario
I | | | Scenario
II | | | Scenario
III | | | Scenario
I | | | Scenario
II | | | Scenario
III | |
| | | | | (In millions of R$) | |
Interest Rate | | Fixed Income Interest Rates in reais | | | — | | | | (12.6) | | | | (24.7) | | | | (7.4) | | | | (731.9) | | | | (1,435.6) | |
Foreign Exchange Linked | | Foreign Exchange Linked Interest Rates | | | 0.5 | | | | 0.6 | | | | 4.0 | | | | (5.4) | | | | (224.6) | | | | (430.0) | |
Foreign Exchange Rates | | Prices of Foreign Currencies | | | (3.8) | | | | (69.4) | | | | 112.6 | | | | (0.7) | | | | (49.3) | | | | 123.9 | |
Price Index Linked | | Interest of Inflation coupon | | | (0.7) | | | | (36.7) | | | | (72.7) | | | | (0.9) | | | | (215.3) | | | | (516.2) | |
TR | | TR Linked Interest Rates | | | — | | | | — | | | | — | | | | 1.1 | | | | (67.9) | | | | (161.9) | |
Equities | | Prices of Equities | | | 0.7 | | | | 16.4 | | | | 3.3 | | | | 9.3 | | | | (197.7) | | | | (425.2) | |
Other | | Exposures that do not fall under the definitions above | | | — | | | | (11.0) | | | | (33.3) | | | | (0.1) | | | | (11.3) | | | | (34.4) | |
Total | | | | | (3.3) | | | | (112.7) | | | | (10.8) | | | | (4.1) | | | | (1,498.0) | | | | (2,879.4) | |
| | | | | | | | | | | | | | | | | | | | | | | | | | |
| (1) | Amounts net of tax effects. |
| | • | | Scenario I: Addition of one basis point to fixed interest rates, currency coupon, inflation and interest rate indexes and one percentage point to currency and equity prices; |
| | • | | Scenario II: Shocks of 25% in fixed interest rates, currency coupon, inflation, interest rate indexes and currency and share prices, both for growth and fall, considering the largest resulting losses per risk factor; and |
| | • | | Scenario III: Shocks of 50% in fixed interest rates, currency coupon, inflation, interest rate indexes and currency and share prices, both for growth and fall, considering the largest resulting losses per risk factor. |
Interest Rate Sensitivity
Interest rate sensitivity is the relationship between market interest rates and net interest income arising from the maturity or the renegotiation of prices of interest-bearing assets and liabilities.
Our strategy for interest rate sensitivity considers the return rates, the underlying risk level and the liquidity requirements, including our minimum regulatory cash reserves, mandatory liquidity ratios, withdrawals and maturity of deposits, capital costs and additional demand for funds.
The pricing structure is matched when equal amounts of these assets or liabilities mature or are renegotiated. Any mismatch of interest-bearing assets and liabilities is known as a gap position. The interest rate sensitivity may vary in the renegotiation periods presented due to the different renegotiation dates within the period. Also, variations among the different currencies in which the interest rate positions are denominated may arise.
These relationships are material for a particular date, and significant fluctuations may occur on a daily basis as a result of both market forces and management decisions. Our “CSRML” analyzes Itaú Unibanco Group’s gap position on a monthly basis and establishes limits for market risk exposure, interest rate positions and foreign currency positions.
Please see “Note 32 – Risk and Capital Management, 2. Market Risk” of our audited consolidated financial statements for further details about the position of our interest-bearing assets and liabilities as of December 31, 2020. This note provides a snapshot view, and accordingly, does not reflect the interest rate gaps that may exist at other times, due to changing asset and liability positions, and management’s actions to manage risk in these changing positions.
LIBOR Transition
In 2018 we assembled a working group to follow up on the international financial markets discussions regarding the replacement of the IBOR rates by new reference rates. The main goal of this working group was, and still is, to support our senior executives in the decision-making process on this subject. In order to achieve that, this group is comprised of several areas of the bank, including representatives from Treasury, Risk, Accounting, Legal, Compliance, External Units, etc., and is being led by the Products team at the head office in Brazil.
Among its actions over the past two years, we can highlight the following: (i) assessment of the bank’s exposure to IBORs; (ii) the amendment of fallback clauses in the contracts of assets, liabilities and derivatives transactions indexed to IBORs; (iii) monitoring and active participation in market consultations held by ISDA and the Fed with regards to new
138
replacement rates and its methodologies; (iv) follow up reports for the Senior Management in several committees (Products, Accounting, Audit and Market Risk Committees); (v) analysis of accounting impacts and new procedures to be applied to the transactions in our portfolios, as well as monitoring any announcements of the main global accounting bodies (IASB and FASB) and participation in discussions held in specific international forums; (vi) mapping out the operational impact of the transition to the new rates; and (vii) communications to clients regarding the discontinuity of IBOR rates, in addition to discussions with foreign banks that are members of the Alternative Reference Rate Committee to further monitor the subject.
Throughout 2020, the working group continued to follow market guidelines and acted in the implementation of previously defined action plans, including systems changes to the new rate methodologies for both new transactions and for the current portfolio, which are still pending. We have also adhered, in February 2021, to the IBOR Fallbacks Protocol of the International Swaps and Derivatives Association published on October 23, 2020, which will enable market participants to incorporate the revisions into their legacy non-cleared derivatives trades with other counterparties as part of IBOR transition. The Itaú Unibanco Group will keep up with the periodic reports to Senior Management and clients whenever it deems necessary.
Exchange Rate Sensitivity
Most of our banking operations are denominated in or indexed to Brazilian reais. We also have assets and liabilities denominated in foreign currency, mainly in U.S. dollars, as well as assets and liabilities that, although denominated in Brazilian reais, are indexed to U.S. dollars and, therefore, expose us to exchange rate risk. The Central Bank regulates our foreign currency positions. Please see “Note 32 – Risk and Capital Management, 2. Market Risk” of our audited consolidated financial statements for further details.
The gap management adopted by the CSRML takes into consideration the tax effects with respect to our foreign exchange positions. Since the gains from the foreign exchange rate variation on investments abroad are not taxed, we set up a hedge (a liability in foreign currency derivative instruments) in an amount sufficient so that our total foreign exchange exposure, net of tax effects, is consistent with our low risk exposure strategy.
Our foreign exchange position on the liability side is composed of various elements, including the issuance of securities in international capital markets, credit from foreign banks used to finance import and export transactions, dollar-linked onlendings from government financial institutions and deposits in currencies of Latin America countries. The proceeds of these financial operations are usually invested in loans and in the purchase of dollar-linked securities.
The information set forth in the table below was prepared on a consolidated basis, eliminating transactions between related parties. Our investments abroad, which are eliminated when we consolidate the accounting information, represented R$60,7 billion as of December 31, 2020, under the gap management policy adopted, as mentioned above. We apply either economic hedges or hedge accounting to those net investments abroad.
139
| | | | | | | | | | | | | | | | | | | | |
| | | As of December 31, 2020 | |
Exchange Rate Sensitivity | | Brazilian
currency | | | Denominated
in foreign
currency(1) | | | Indexed to
foreign
currency(1) | | | Total | | | % of amounts
denominated in
and indexed to
foreign currency
of total | |
| | | (In millions of R$, except percentages) | |
Assets | | | 1,464,342 | | | | 514,648 | | | | 40,260 | | | | 2,019,251 | | | | 27.5 | |
Cash | | | 9,169 | | | | 34,133 | | | | 2,922 | | | | 46,224 | | | | 80.2 | |
At Amortized Cost | | | 929,754 | | | | 324,291 | | | | 21,754 | | | | 1,275,799 | | | | 27.1 | |
Compulsory deposits in the Central Bank of Brazil | | | 90,059 | | | | — | | | | — | | | | 90,059 | | | | — | |
Interbank deposits | | | 17,775 | | | | 37,910 | | | | — | | | | 55,685 | | | | 68.1 | |
Securities purchased under agreements to resell | | | 237,529 | | | | 2,414 | | | | — | | | | 239,943 | | | | 1.0 | |
Securities | | | 103,146 | | | | 26,658 | | | | — | | | | 129,804 | | | | 20.5 | |
Loan operations and lease operations portfolio | | | 446,207 | | | | 245,815 | | | | 22,082 | | | | 714,104 | | | | 37.5 | |
Other financial assets | | | 67,425 | | | | 25,830 | | | | — | | | | 93,255 | | | | 27.7 | |
(-) Provision for Expected Loss | | | (32,387 | ) | | | (14,336 | ) | | | (328 | ) | | | (47,051 | ) | | | 31.2 | |
At Fair Value Through Other Comprehensive Income | | | 46,704 | | | | 60,940 | | | | 2,298 | | | | 109,942 | | | | 57.5 | |
Securities | | | 46,704 | | | | 60,940 | | | | 2,298 | | | | 109,942 | | | | 57.5 | |
At Fair Value Through Profit or Loss | | | 370,685 | | | | 81,627 | | | | 13,269 | | | | 465,581 | | | | 20.4 | |
Securities | | | 360,885 | | | | 23,353 | | | | 4,833 | | | | 389,071 | | | | 7.2 | |
Derivatives | | | 9,794 | | | | 58,274 | | | | 8,436 | | | | 76,504 | | | | 87.2 | |
Other financial assets | | | 6 | | | | — | | | | — | | | | 6 | | | | — | |
Investments in associates and joint ventures | | | 15,568 | | | | 2 | | | | — | | | | 15,570 | | | | — | |
Fixed assets, net | | | 5,790 | | | | 1,147 | | | | — | | | | 6,937 | | | | 16.5 | |
Goodwill and Intangible assets, net | | | 11,305 | | | | 6,025 | | | | — | | | | 17,330 | | | | 34.8 | |
Tax assets | | | 62,443 | | | | 3,652 | | | | — | | | | 66,095 | | | | 5.5 | |
Other assets | | | 12,925 | | | | 2,831 | | | | 17 | | | | 15,773 | | | | 18.1 | |
Percentage of total assets | | | 72.5 | | | | 25.6 | | | | 2.0 | | | | 100.1 | | | | | |
| | | | | | | | | | | | | | | | | | | | |
Liabilities and Stockholders’ Equity | | | 1,428,446 | | | | 571,148 | | | | 19,657 | | | | 2,019,251 | | | | 29.3 | |
At Amortized Cost | | | 986,826 | | | | 498,388 | | | | 10,427 | | | | 1,495,641 | | | | 34.0 | |
Deposits | | | 559,303 | | | | 249,115 | | | | 592 | | | | 809,010 | | | | 30.9 | |
Securities sold under repurchase agreements | | | 225,476 | | | | 47,888 | | | | — | | | | 273,364 | | | | 17.5 | |
Interbank market debt | | | 86,017 | | | | 68,649 | | | | 1,369 | | | | 156,035 | | | | 44.9 | |
Institutional market debt | | | 14,154 | | | | 117,470 | | | | 6,684 | | | | 138,308 | | | | 89.8 | |
Other financial liabilities | | | 101,876 | | | | 15,266 | | | | 1,782 | | | | 118,924 | | | | 14.3 | |
At Fair Value Through Profit or Loss | | | 12,750 | | | | 63,985 | | | | 2,918 | | | | 79,653 | | | | 84.0 | |
Derivatives | | | 12,745 | | | | 63,842 | | | | 2,918 | | | | 79,505 | | | | 84.0 | |
Structured notes | | | — | | | | 143 | | | | — | | | | 143 | | | | 100.0 | |
Other financial liabilities | | | 5 | | | | — | | | | — | | | | 5 | | | | — | |
Provision for Expected Loss | | | 3,638 | | | | 737 | | | | 17 | | | | 4,392 | | | | 17.2 | |
Loan Commitments | | | 3,124 | | | | 350 | | | | 11 | | | | 3,485 | | | | 10.4 | |
Financial Guarantees | | | 514 | | | | 387 | | | | 6 | | | | 907 | | | | 43.3 | |
Reserves for insurance and private pension | | | 221,000 | | | | — | | | | — | | | | 221,000 | | | | — | |
Provisions | | | 19,659 | | | | 160 | | | | — | | | | 19,819 | | | | 0.8 | |
Tax liabilities | | | 4,716 | | | | 994 | | | | — | | | | 5,710 | | | | 17.4 | |
Other liabilities | | | 25,332 | | | | 6,884 | | | | 6,295 | | | | 38,511 | | | | 34.2 | |
Non-controlling interests | | | 11,532 | | | | — | | | | — | | | | 11,532 | | | | — | |
Total stockholders’ equity attributed to the owners of the parent company | | | 142,993 | | | | — | | | | — | | | | 142,993 | | | | — | |
Percentage of total liabilities and stockholders’ equity | | | 70.7 | | | | 28.3 | | | | 1.0 | | | | 100.0 | | | | | |
| | | | | | | | | | | | | | | | | | | | |
| (1) | Predominantly U.S. dollar. |
Backtesting
The effectiveness of the VaR model is validated by the use of backtesting techniques that compare hypothetical and effective daily results with the estimated daily VaR. The number of exceptions to the VaR pre-established limits should be consistent, within an acceptable margin, with the hypothesis of 99% confidence level considering a period of 250 business days. Confidence levels of 97.5% and 95%, and periods of 500 and 750 business days are also considered. The backtesting analysis presented below considers the ranges suggested by the Basel Committee on Banking Supervision. The ranges are divided into:
| | • | | Green (0 to 4 exceptions): corresponds to backtesting results that do not suggest any problems with the quality or accuracy of the adopted models; |
| | • | | Yellow (5 to 9 exceptions): refers to an intermediate range group, which indicates an early warning and/or monitoring and may indicate the need to review the model; and |
| | • | | Red (10 or more exceptions): demonstrates the need for improvement action. |
According to Central Bank Circular No. 3,646, hypothetical testing consists of applying market price variations for a specific day to the portfolio balance at the end of the preceding business day. The effective test is the variation in the portfolio value up to the end of the day, including intraday transactions and excluding amounts not related to market price variations, such as fees, brokerage fees and commissions.
The regulatory VaR model had two backtesting exceptions in the 250 business days ended December 31, 2020.
140
| 5C. | Research and Development, Patents and Licenses, Etc. |
For the past three years, we have not had any research and development policies in effect.
We expect many factors to affect our future results of operations, liquidity and capital resources, including:
| • | | the Brazilian economic environment (please see “Item 5A. Operating Results — Factors Affecting Our Results of Operations — Brazilian Context” and “Item 3D. Risk Factors — Macroeconomic Risks —Domestic Scenario” for further details); |
| • | | legal and regulatory developments (please see “Item 4B. Business Overview — Supervision and Regulation,” “Item 5A. Operating Results — Factors Affecting Our Results of Operations — Brazilian Context” and “Item 3D. Risk Factors — Legal and Regulatory Risks” for further details); |
| • | | the effects of any ongoing international financial turmoil, including on the liquidity and capital requirement (please see “Item 4B. Business Overview — Supervision and Regulation,” “Item 5A. Operating Results — Factors Affecting Our Results of Operations — Global Context” and “Item 3D. Risk Factors — Macroeconomic Risks — Domestic Scenario” for further details); |
| • | | the inflation effects on the results of our operations (please see “Item 5A. Operating Results — Factors Affecting Our Results of Operations — Brazilian Context” and “Item 3D. Risk Factors — Macroeconomic Risks — Domestic Scenario” for further details); |
| • | | the effects of the variations in the value of the Brazilian real, foreign exchange rates and interest rates on our net interest income (please see “Item 5A. Operating Results” and “Item 3D. Risk Factors— Macroeconomic Risks—Domestic Scenario” for further details); and |
| • | | any acquisitions we may make in the future (please see “Item 3D. Risk Factors—Risks Associated with our Business—The integration of acquired or merged businesses involves certain risks that may have a material adverse effect on us” for further details). |
As part of our strategy, we continue to review growth opportunities, both in Brazil and outside of Brazil. Additionally, please see “Item 3D. Risk Factors” for comments on the risks faced in our operations and that could affect our business, results of operations or financial condition.
| 5E. | Off-Balance Sheet Arrangements |
We do not have any off-balance sheet arrangements, other than the guarantees we granted that are described in “Note 32 – Risk and Capital Management, 1.1 – Collateral and policies for mitigating credit risk” and “1.4 – Maximum Exposure of Financial Assets to Credit Risk” of our audited consolidated financial statements and Item 4B. Business Overview – Selected Statistical Information – Assets – Portfolio of Securities and Derivative Financial Instruments”. Please see “Item 5B. Liquidity and Capital –, Exchange Rate Sensitivity” for further details.
| 5F. | Tabular Disclosure of Contractual Obligations |
The table below summarizes the maturity profile of our consolidated long-term debt, operating leases and other contractual commitments as of December 31, 2020:
141
| | | | | | | | | | | | | | | | | | | | |
| | | Payments due by period | |
Contractual Obligations | | Total | | | Less
than 1
year | | | 1-3 years | | | 3-5 years | | | More
than 5
years | |
| | | (In millions of R$) | |
Interbank market debt (1)(3) | | | 164,353 | | | | 111,635 | | | | 43,549 | | | | 3,357 | | | | 5,812 | |
Institutional market debt (2)(3) | | | 161,497 | | | | 23,071 | | | | 64,703 | | | | 34,681 | | | | 39,042 | |
Time Deposits(3) | | | 577,580 | | | | 197,424 | | | | 137,722 | | | | 218,061 | | | | 24,373 | |
Operating and capital (finance) lease obligations | | | 6,038 | | | | 1,278 | | | | 2,085 | | | | 745 | | | | 1,930 | |
Financial Guarantees | | | 68,933 | | | | 27,350 | | | | 8,702 | | | | 975 | | | | 31,906 | |
Commitments to be released | | | 320,905 | | | | 155,936 | | | | 27,579 | | | | 29,866 | | | | 107,524 | |
Letters of credit to be released | | | 41,477 | | | | 41,477 | | | | — | | | | — | | | | — | |
Pension Obligations | | | 1,160 | | | | 120 | | | | 236 | | | | 233 | | | | 571 | |
Health Benefits | | | 923 | | | | 144 | | | | 289 | | | | 197 | | | | 293 | |
Total | | | 1,342,866 | | | | 558,435 | | | | 284,865 | | | | 288,115 | | | | 211,451 | |
| | | | | | | | | | | | | | | | | | | | |
| (1) | Includes mortgage notes, real estate credit bills, agribusiness credit bills, financial credit bills, import and export financing and on-lending - domestic. |
| (2) | Includes subordinated debt, debentures and foreign borrowings through securities. |
| (3) | Includes total estimated interest payments (including for derivatives). These estimated interest payments were calculated substantially based on the interbank forward rates at the specific periods. |
See “Forward-Looking Statements” of this annual report.
| ITEM 6. | DIRECTORS, SENIOR MANAGEMENT AND EMPLOYEES |
| 6A. | Directors and Senior Management |
Executive Committee
Our Executive Committee is responsible for conducting strategies for business and products developed by us and implementing guidelines proposed by the Board of Directors.
Our Executive Committee has a term of office of one year, which continues to be effective until the investiture of the members elected by the Board of Directors held immediately after the Annual Shareholders’ Meeting.
In 2020, we made significant changes to our Executive Committee. The new configuration aims to bring the Executive Committee closer to the business and, thus, simplify our operation and management model, allowing greater autonomy and speed in decision making.
Below are details of the new Executive Committee and its composition:

Change in the Board of Directors
On April 27, 2021, Maria Helena dos Santos Fernandes de Santana and Candido Botelho Bracher were elected as members of the Board of Directors.
Annual Shareholder’s Meeting
As of December 31, 2020, our Board of Directors consisted of the following members: Pedro Moreira Salles, Roberto Egydio Setubal, Ricardo Villela Marino, Alfredo Egydio Setubal, Ana Lucia de Mattos Barretto Villela, Fábio Colletti Barbosa, Frederico Trajano Ignácio Rodrigues, Gustavo Jorge Laboissière Loyola, João Moreira Salles, José Galló, Marco Ambrogio Crespi Bonomi, Pedro Luiz Bodin de Moraes.
On April 27, 2021 at our annual shareholders’ meeting Pedro Moreira Salles, Roberto Egydio Setubal, Alfredo Egydio Setubal, Ana Lúcia de Mattos Barretto Villela, Fábio Colletti Barbosa, Frederico Trajano Inácio Rodrigues João Moreira Salles, Marco Ambrogio Crespi Bonomi, Pedro Luiz Bodin de Moraes and Ricardo Villela Marino were reelected as members of our Board of Directors, each for a term of one year. We deemed the directors Fábio Colletti Barbosa, Frederico Trajano Inácio Rodrigues, Marco Ambrogio Crespi Bonomi, Maria Helena dos Santos Fernandes de Santana and Pedro Luiz Bodin de Moraes to be independent members representing 41.66% of our Board of Directors. With respect to our Fiscal Committee on the same date, Alkimar Ribeiro Moura was reelected as an effective member and João Costa was reelected as his alternate; José Caruso Cruz Henriques was reelected as an effective member and Reinaldo Guerreiro, was reelected as his alternate. Artemio Bertholini was elected as an effective member and Rene Guimarães Andrich was reelected an alternate member.
142
Board of Officers and Members of our Audit Committee
As of December 31, 2020, our Audit Committee consisted of the following members: Antonio Carlos Barbosa de Oliveira, Antonio Francisco de Lima Neto, Diego Fresco Gutierrez (the financial expert), Gustavo Jorge Laboissière Loyola, Luciana Pires Dias, Otavio Yazbek and Rogério Paulo Calderón Peres.
On April 29, 2021 at the Meeting of the Board of Directors, the members of our Board of Officers were reelected for a term of office of one year. Gustavo Jorge Laboissière Loyola, Luciana Pires Dias and Otávio Yazbek were reelected as members of the Audit Committee for a term of office of one year. Alexandre de Barros, Rogério Carvalho Braga and Ricardo Baldin (the financial expert) were also elected.
The elections and reelections of the members are subjective to approval by the Central Bank.
143
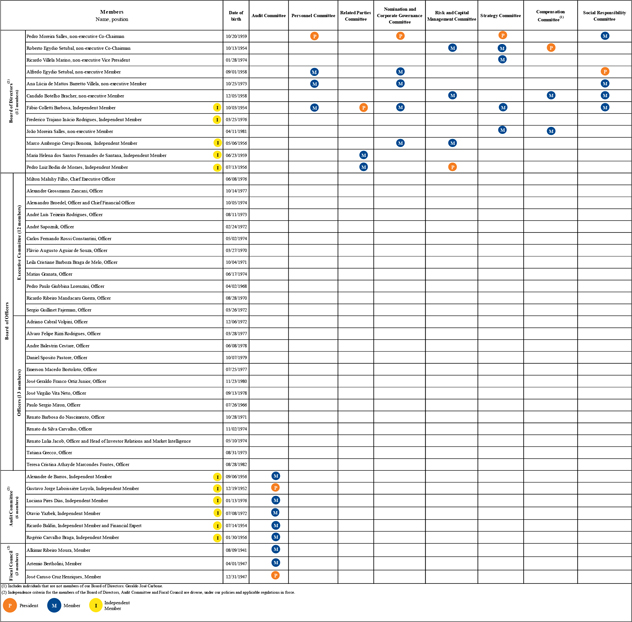
144
Board of Directors
Pedro Moreira Salles (Non-Executive Co-Chairman) has been a Co-chairman of the Board of Directors at the Itaú Unibanco Group since 2017, and he was also the Chairman of the Board of Directors (2009 to 2017) and Executive Vice President (2008 to 2009). He has held several positions at the Itaú Unibanco Group, including CEO (2004 to 2008).
He serves as the Chairman of the Board of Directors at Instituto Unibanco; Board of Directors at the Federação Brasileira de Bancos (FEBRABAN); Board of Directors at Companhia Brasileira de Metalurgia e Mineração (CBMM); and Board of Directors at Alpargatas S.A. He is also a Member of the Decision-Making Council, the INSPER’s Board of Associates, and the Board of Directors at Fundação Osesp.
He holds a Bachelor’s degree, magna cum laude, in Economics and History from the University of California, Los Angeles (UCLA), U.S. He holds a Master’s degree in International Relations from the Yale University and he has attended the OPM – Owner/President Management Program at the Harvard University, both in the United States.
Roberto Egydio Setubal (Non-Executive Co-Chairman) has been a Co-chairman of the Board of Directors at the Itaú Unibanco Group since 2017. He was also the Vice Chairman of the Board of Directors (2003 to 2017) and CEO (1994 to 2017). He has held several positions at the Itaú Unibanco Group, including Senior Vice President (“Diretor Geral”) (1990 to 1994).
He has served as Vice President at Itaúsa S.A. since 1994 and as the Chairman of the Accounting Policies Committee (2008 to 2011).
Since 1994 he has been a Member of the Board of the International Monetary Conference. He was President of the Federação Nacional dos Bancos (FENABAN) and of the Federação Brasileira de Bancos (FEBRABAN) (1997 to 2001) and President of the Advisory Board of the Federação Brasileira de Bancos (FEBRABAN) (2008 to 2017). In 2000, Mr. Setubal became a Member of the Trilateral Commission and the International Board of the NYSE and in 2002 he became a Member of the International Advisory Committee of the Federal Reserve Bank of New York. In 2010, he became a Member of the China Development Forum.
He holds a Bachelor’s degree in Production Engineering from the Escola Politécnica da Universidade de São Paulo (USP), São Paulo, Brazil and a Master of Science degree in Engineering from the Stanford University, California, U.S.
Ricardo Villela Marino (Non-Executive Vice President) has been a Vice President of the Board of Directors at the Itaú Unibanco Group since 2020. He was also a Member of the Board of Directors (2008 a 2020) and the Chairman of the bank’s Latin America Strategic Council since 2018. He has held several positions at the Itaú Unibanco Group since 2002, including Vice President (2010 to 2018). He has also been an Alternate Member of the Board of Directors of Itaúsa S.A. since 2011; Alternate Member of the Board of Directors of Duratex S.A. since 2009; Alternate Member of the Board of Directors of Itautec S.A. (2009 to 2019) and Alternate Member of the Board of Directors of Elekeiroz S.A. (2009 to 2018).
He holds a Bachelor’s degree in Mechanical Engineering from the Escola Politécnica da Universidade de São Paulo (USP), São Paulo, Brazil and a Master’s degree in Business Administration from the MIT Sloan School of Management, Cambridge, Massachusetts, U.S.
Alfredo Egydio Setubal (Non-Executive Member) has been a Member of the Board of Directors at the Itaú Unibanco Group since 2007. He has held several positions at the Itaú Unibanco Group, including Vice President (1996 to 2015), Investor Relations Officer (1995 to 2015), Executive Officer (1993 to 1996), and Managing Director (1988 to 1993). He has been a Member of the Nomination and Corporate Governance Committee since 2009, a Member of the Personnel Committee and the Risk and Capital Management Committee since 2015, a Member of the Social Responsibility Committee since 2019, and he was a Member of the Accounting Policies Committee (2008 to 2009).
He has been the CEO and Investor Relations Officer at Itaúsa S.A. since 2015, Vice Chairman of the Board of Directors since 2008, a Member of the Disclosure and Trading Committee since 2009, having been Coordinator to this Committee since 2015, a Member of the Investment Policies Committee (2008 to 2011), Coordinator of the Investment Committee and a Member of the Finance, the Personnel and Ethics, and the Sustainability and Risks committees since 2017.
Mr. Setubal has been a Member of the Board of Directors and of the Strategy Committee at Alpargatas S.A. since 2017, a Member of the Board of Directors since 2015, Co-chairman of the Board since 2017 and a Member of the Personnel, Governance and Nomination Committee since 2015 at Duratex S.A.
He has been Chairman of the Board of Trustees since 2008 at the Fundação Itaú para Educação e Cultura; a Member of the Board of Directors of the Museu de Arte Moderna de São Paulo (MAM) since 1992 and of the Instituto de Arte Contemporânea. He has been Vice Chairman of the Board of Directors at the Fundação Bienal de São Paulo since 2017 (and a Member since 2009) and Chairman of the Decision-Making Council at the Museu de Arte de São Paulo (MASP) since 2018.
145
Mr. Setubal also served as a Member of the Board of Directors of the Associação Brasileira das Companhias Abertas (ABRASCA) (1999 to 2017) and Vice Chairman of the Board of Directors at the Instituto Itaú Cultural (2005 to 2019), having worked as a Board Member (1993 to 2005), Executive Vice President (2005 to 2019) and an Executive Officer (1996 to 2005).
He holds Bachelor’s and Postgraduate degrees in Business Administration from the Fundação Getulio Vargas (FGV), São Paulo, Brazil, with specialization from INSEAD, Fontainebleau, France.
Ana Lúcia de Mattos Barretto Villela (Non-Executive Member) has been a Member of the Board of Directors at the Itaú Unibanco Group since 2018. She has held several positions at the Itaú Unibanco Group, including Member of the Board of Directors (1996 to 2001).
Ms. Villela has also been an Alternate Member of the Board of Directors of IUPAR – Itaú Unibanco Participações S.A. since 2018; Vice Chairman of the Board of Directors (non-executive Member) of Itaúsa S.A. since 2017; Member of the Sustainability Committee (2015 to 2018) of Duratex S.A.; Co-Founder of AlanaLab (Maria Farinha Filmes, Flow, Jungle Bee) since 2014; Founding President of Alana Foundation since 2012; CEO of Instituto Alana since 2002; Member of the Advisory Board at Instituto Brincante since 2001 and Fellow Ashoka since 2010.
She has been a Member of the Innovation Board of XPRIZE since 2018. First representative from Latin America on the Innovation Board of XPRIZE, a non-profit organization created by Peter Diamandis, who designs and manages global competitions to encourage the development of new technologies that may help solve some of mankind’s major challenges.
She was a Member of the Advisory Board at Instituto Akatu (2013 to 2017); Member of the Advisory Board at Commercial Free Childhood (CCFC) (2015 to 2017) and Member of the Advisory Board at Conectas (2003 to 2018).
She holds a Bachelor’s degree in Teaching with major in School Administration and a Master’s degree in Educational Psychology, both from the Pontifícia Universidade Católica de São Paulo (PUC-SP), São Paulo, Brazil and took graduate studies in Business Administration from Fundação Armando Álvares Penteado (FAAP), São Paulo, Brazil (incomplete), and postgraduate studies in Administration in the Third Sector from the Fundação Getulio Vargas (FGV), São Paulo, Brazil (incomplete).
Candido Botelho Bracher (Non-Executive Member) has been a Member of the Board of Directors at the Itaú Unibanco Group since 2021. He has held several positions at the Itaú Unibanco Group, including CEO (2017 to 2021), Wholesale Banking Senior Vice President (“Diretor Geral”) (2015 to 2017) and Vice President (2004 a 2015).
Mr. Bracher was also a Member of the Board of Directors (2009 to 2014) of BM&FBOVESPA S.A. – Bolsa de Valores, Mercadorias e Futuros (currently B3 S.A. – Brasil, Bolsa, Balcão), an Alternate Member of the Board of Directors (1999 to 2005), and a Member of the Board of Directors (2005 to 2013) of Pão de Açúcar – Companhia Brasileira de Distribuição.
He holds a Bachelor’s degree in Business Administration from the Fundação Getulio Vargas (FGV), São Paulo, Brazil.
Fábio Colletti Barbosa (Independent Member) has been a Member of the Board of Directors at the Itaú Unibanco Group since 2015.
He has been a Member of the Board of Directors of Natura Group since 2017; a Member of the Board of Directors of Cia. Hering since 2017; and a Member of the Board of Directors of Companhia Brasileira de Metalurgia e Mineração (CBMM) since 2015.
He was CEO (2011 to 2014) at Abril Comunicações S.A.; Chairman of the Board of Directors (2011) at Banco Santander (Brazil) S.A.; CEO (2008 to 2010) at Banco Santander S.A.; and CEO (1998 to 2008) at Banco Real S.A.
Mr. Barbosa also served as Chairman of the Board of Directors of Fundação OSESP (2012 to 2019) and is presently a Board Member at UN Foundation (U.S.) since 2011; a Member of the Board of Directors of Instituto Empreender Endeavor since 2008 (Chairman since 2015); a Member of the Board of Directors of Almar Participações S.A. since 2013 and a Member of the Investment Committee of Gávea Investimentos since 2015.
He holds a Bachelor’s degree in Economics from the Fundação Getulio Vargas (FGV), São Paulo, Brazil and a Master’s degree in Business Administration from the Institute for Management Development, Lausanne, Switzerland.
Frederico Trajano Inácio Rodrigues (Independent Member) has been a Member of the Board of Directors of the Itaú Unibanco Group since 2020.
He has been the Chief Executive Officer (CEO) of Magazine Luiza S.A. since 2015 and was an Executive Sales and Marketing Officer (2010 to 2015), a Commercial Officer, and was in charge of the Marketing Office (2004 to 2010). He started his career in 2000, being responsible for the E-Commerce department. Mr. Rodrigues has been an Effective Member of the Board of Directors of Luizaseg Seguros S.A. since 2005 and worked in the retail and consumer goods departments at Deutsche Bank Securities (1998 to 1999).
He holds a Bachelor’s degree in Business Administration from the Fundação Getulio Vargas (FGV), São Paulo, Brazil and attended the Program for Executives from the University of California, Stanford, U.S.
146
João Moreira Salles (Non-Executive Member) has been a Member of the Board of Directors at the Itaú Unibanco Group since 2017.
He has held several positions at the Itaú Unibanco Group, including Officer at IUPAR – Itaú Unibanco Participações S.A. since 2018, and he was a Member of the Board of Directors (2015 to 2018). He was a Member of the Board of Directors at XP Investimentos S.A. (2018 to 2019).
Mr. Moreira Salles is currently an Officer of Brasil Warrant Administração de Bens e Empresas S.A. (BWSA), where, since 2013, he has been overseeing the management of BW Gestão de Investimentos (BWGI) as a member of the Investment, Risk and Operational Committees of the firm, and has been responsible for the monitoring of other BWSA subsidiaries. He has been a Partner and a Member of the Investment Committee of Cambuhy Investimentos Ltda. since 2013 and was a Member of the Board of Directors of investee Parnaíba Gás Natural (2014 to 2017). Before joining BWSA and Cambuhy, he had been an Investment Banker at J. P. Morgan Chase, New York, U.S.
He holds a Bachelor’s degree in Economics from Instituto de Ensino e Pesquisa (INSPER), São Paulo, Brazil; Master’s degree in Economics from Columbia University, GSAS, New York, U.S.; Master’s degree in Finance from Columbia University, GSB, New York, U.S. and a Ph.D. in Economic Theory from the Universidade de São Paulo (FEA-USP), São Paulo, Brazil.
Marco Ambrogio Crespi Bonomi (Independent Member) has been a Member of the Board of Directors at the Itaú Unibanco Group since 2017. He has held several positions at the Itaú Unibanco Group since 1998, including Senior Vice President (“Diretor Geral”) (2015 to 2017).
He was Vice President (2004 to 2011) of the Associação Nacional das Instituições de Crédito, Financiamento e Investimento (ACREFI).
He holds a Bachelor’s degree in Economics from the Fundação Armando Álvares Penteado (FAAP), São Paulo, Brazil and attended a Financial Executive Advanced course at the Fundação Getulio Vargas (FGV), São Paulo, Brazil and a course on Capital Markets at the New York University, New York, U.S.
Maria Helena dos Santos Fernandes de Santana (Independent Member) has been a Member of the Board of Directors at the Itaú Unibanco Group since 2021. She has held several positions at the Itaú Unibanco Group, including Member of the Audit Committee (2014 to 2020).
She has been a Member of the Board of Directors and the Chairwoman of the Audit Committee at XP Inc. since 2019, having served as the Chairwoman of the Audit Committee at XP Investimentos S.A. (2018 to 2019). She has been a Member of the Board of Directors and Coordinator of the People, Appointment and Governance Committee at Oi S.A. since 2018, and a Member of the Board of Directors at Grupo BIG S.A. since 2021.
Ms. Santana served as a Member of the Board of Directors at Bolsas y Mercados Españoles (BME) (2016 to 2020); Member of the Board of Trustees at the IFRS Foundation (2014 to 2019); Member of the Board of Directors and Chairwoman of the Corporate Governance Committee at Companhia Brasileira de Distribuição S.A. (2013 to 2017); Member of the Board of Directors and Audit Committee Coordinator at Totvs S.A. (2013 to 2017); Member of the Board of Directors at CPFL Energia S.A. (2013 a 2015); Chairwoman of the Brazilian Securities and Exchange Commission (CVM) (2007 to 2012) and Officer (2006 to 2007). She represented CVM at the Financial Stability Board (FSB) (2009 to 2012).
She was Chairwoman of the Executive Committee at the International Organization of Securities Commissions (IOSCO) (2011 to 2012), and also a Member of the International Integrated Reporting Committee (IIRC) in the same period.
She worked at the Bolsa de Valores de São Paulo – BM&F Bovespa S.A. (currently B3 S.A. – Brasil, Bolsa, Balc��o) (1994 to 2006), initially at the Special Projects department and subsequently as Executive Superintendent of Company Relations (2000 to 2006).
Ms. Santana was Vice President of the Instituto Brasileiro de Governança Corporativa (IBGC) (2004 to 2006). She has been a Member of the Latin-American Roundtable on Corporate Governance (OECD/WB Group) since 2000.
She holds a Bachelor’s degree in Economics from the Faculdade de Economia, Administração, Contabilidade e Atuária (FEA) of the Universidade de São Paulo (USP) São Paulo, Brazil.
Pedro Luiz Bodin de Moraes (Independent Member) has been a Member of the Board of Directors at the Itaú Unibanco Group since 2009. He was a Member of the Board of Directors (2003 to 2008) at the Itaú Unibanco Group.
He has been a partner at Cambuhy Investimentos Ltda. since 2011 and at Ventor Investimentos Ltda. since 2009.
He was an Officer (2002 to 2003) and a Partner (2005 to 2014) at Icatu Holding S.A.; and an Officer and a Partner (1993 to 2002) at Banco Icatu S.A.
Mr. Bodin de Moraes also served as Monetary Policy Officer at the Banco Central do Brasil (1991 to 1992) and as an Officer at Banco Nacional de Desenvolvimento Econômico e Social (BNDES) (1990 to 1991).
147
He holds Bachelor’s and Master’s degrees in Economics from the Pontifícia Universidade Católica do Rio de Janeiro (PUC-RJ), Rio de Janeiro, Brazil and a Ph.D. in Economics from the Massachusetts Institute of Technology (MIT), Cambridge, Massachusetts, U.S.
Board of Officers—Executive Committee
Milton Maluhy Filho (CEO) has been a partner in the Partners Program since 2011 and Chief Executive Officer at Itaú Unibanco Group since February 2, 2021, having served as CFO and CRO. Mr. Maluhy has held several positions at the Itaú Unibanco Group, including Vice President (2019 to 2020) and CEO of Itaú Corpbanca (Chile) (2016 to 2018), being responsible for the merger of two banks, CorpBanca and Banco Itaú Chile.
He joined the Itaú Unibanco Group in 2002 and was elected Officer in 2007.
He holds a Bachelor’s degree in Business Administration from the Fundação Armando Álvares Penteado (FAAP), São Paulo, Brazil.
Alexandre Grossmann Zancani (Officer) has been a partner in the Partners Program since 2019 and an Officer of the Executive Committee at the Itaú Unibanco Group since 2021, having held the position of Executive Officer at the Itaú Unibanco Group (2019 to 2021).
He was a Digital Business, Data, New Undertakings and Innovation Officer (2017 to 2019); a Risk Officer – Individuals and Consumers (2015 to 2017); an Executive Credit Superintendent at Santander – Individuals and Financing Companies (2013 to 2015); an Executive Credit Superintendent at Santander – Companies (2012 to 2013) at Santander (Brazil); an Executive Credit and Collection Superintendent (2009 to 2012) at Santander Cards and a Member of the Board of Directors (2017 to 2018) at Banco PSA Finance Brasil S.A.
He holds a Bachelor’s degree in Computer Engineering from the Escola Politécnica da Universidade de São Paulo (USP), São Paulo, Brazil and an MBA from the INSEAD, Fontainebleau, France.
Alexsandro Broedel (Officer and Chief Financial Officer) has been a partner in the Partners Program since 2017 and CFO of the Executive Committee since 2021, having held the position of Group Executive Finance Director (2015 to 2020) and Head of Investor Relations (2017 to 2020) at the Itaú Unibanco Group. He joined the Itaú Unibanco Group in 2012 as the Finance and Control Officer. Mr. Broedel has previously served as an Officer at the Comissão de Valores Mobiliários (CVM). He is a Full Professor at FEA-USP and Trustee of the IFRS Foundation.
He holds Bachelor’s degrees in Accounting and Law from the Universidade de São Paulo (USP), São Paulo, Brazil. He holds a Ph.D. in Accounting and Finance from the Manchester Business School, Manchester, United Kingdom, and is a Chartered Management Accountant (FCMA, CGMA), London, United Kingdom.
André Luís Teixeira Rodrigues (Officer) has been a partner in the Partners Program since 2010 and an Officer of the Executive Committee at the Itaú Unibanco Group since 2021. He is currently responsible for the Retail Banking segment, which includes Itaú Branches, Itaú Personnalité, Companies departments, Public Authorities and Payroll segments, and is also responsible in the Retail Banking segment for the Products and Franchising – Individuals and Companies, CRM, Digital Channels and User Experience (UX) departments, having held the position of Executive Officer (2008 to 2021). He joined the Itaú Unibanco Group in 2000 and has been an Officer since 2005, having worked at the Banco Itaú BBA (2003 to 2018).
He holds a Bachelor’s degree in Mechanical Engineering with major in Automation and Systems (“Mechatronics”) from the Escola Politécnica da Universidade de São Paulo (USP), São Paulo, Brazil.
André Sapoznik (Officer) has been a partner in the Partners Program since 2007 and an Officer of the Executive Committee at the Itaú Unibanco Group since 2021, having held the position of Vice President (2016 to 2021). He joined the Itaú Unibanco Group in 1998 and was elected Officer in 2009.
He holds a Bachelor’s degree in Business Administration from the Fundação Getulio Vargas (FGV), São Paulo, Brazil.
Carlos Fernando Rossi Constantini (Officer) has been a partner in the Partners Program since 2015 and an Officer of the Executive Committee at the Itaú Unibanco Group since 2021. He is currently responsible for the Wealth Management & Services division, which comprises Private Banking, Asset Management, and the Investment Products and Services departments, having held the position of Executive Officer (2019 to 2021). In 2017, Mr. Constantini became the CEO at Itaú Unibanco in the United States and the Head of International Private Banking in Miami (2017 to 2018). He has held several positions at the Itaú Unibanco Group, including Officer (2009 to 2017). He joined the Itaú Unibanco Group in 2007 as a Deputy Officer (2007 to 2009).
148
He holds a Bachelor’s degree in Production Engineering from the Escola Politécnica da Universidade de São Paulo (USP), São Paulo, Brazil.
Flávio Augusto Aguiar de Souza (Officer) has been a partner in the Partners Program since 2015 and an Officer of the Executive Committee at the Itaú Unibanco Group since 2021. He is currently responsible for the Commercial Banking department, which consolidates services to Large Corporate, Middle Market, Agribusiness segments and the Real Estate market niche. He is also responsible for the Credit Recovery and Restructuring department, having held the position of Executive Officer (2013 to 2021).
Mr. de Souza served as Global Head of Wealth Management & Services department (2015 to 2018) and Global Head of Private Bank department (2012 to 2015). He started his career at Itaú Unibanco Group in 2009, when he joined as CEO at Banco Itaú International in Miami, U.S.
He was also Vice President of the Associação Brasileira das Entidades dos Mercados Financeiro e de Capitais (ANBIMA) and Chairman of Anbima Board of Regulation and Best Practices for the Private Banking Market in Brazil.
He holds a Bachelor’s degree in Business Administration from Universidade Federal de Minas Gerais, Belo Horizonte, Minas Gerais, Brazil; postgraduate degrees in Finance from Fundação Dom Cabral, São Paulo, Brazil and in Leadership Executive Education from Harvard Business School, Boston, U.S.
Leila Cristiane Barboza Braga de Melo (Officer) has been a partner in the Partners Program since 2007 and an Officer of the Executive Committee at the Itaú Unibanco Group since 2021. She is currently responsible for the entire Legal, External Ombudsman’s Office, Government Relations, Corporate Communication and Sustainability departments. She has held several positions at the Itaú Unibanco Group, including Officer (2010 to 2015) and Executive Officer (2015 to 2021).
She joined the Itaú Unibanco Group in 1997, working in the Legal Advisory Department of Unibanco in operations involving banking products, credit card, and real estate and vehicle financing, and in projects related to mergers and acquisitions, corporate restructuring processes and capital markets, among others, and was elected Deputy Officer in 2008.
She is also a Member of W.I.L.L. – Women in Leadership in Latin America (a nongovernmental organization with international coverage focused on improving the individual and collective value of women in leadership positions in Latin America).
Ms. Melo also worked in the Project Finance and Securities Departments of the Debevoise & Plimpton firm in New York.
She holds a Bachelor’s degree in Law from the Universidade de São Paulo (USP), São Paulo, Brazil and attended a Specialization course on Financial Law and Capital Markets from the Instituto Brasileiro de Mercado de Capitais (IBMEC), Brazil and on Fundamentals of Business Law from New York University, New York, U. S., and attended the Fellows Program IWF World Leadership Conference and Gala, Atlanta, Georgia, U.S.; from Harvard Business School, Cambridge, Massachusetts, U.S. and from INSEAD, Fontainebleau, France.
Matias Granata (Officer) has been a partner in the Partners Program since 2019 and an Officer of the Executive Committee at the Itaú Unibanco Group since 2021. He has held several positions at the Itaú Unibanco Group, including Officer (2014 to 2021), Market Risk Superintendent (2010 to 2014); Operational Risk Superintendent (2009 to 2010); Senior Treasury Trader, Proprietary Desk, São Paulo (2007 to 2009); Senior Treasury Trader, Proprietary Desk, London (2004 to 2007); Treasury Trader, Proprietary Desk, São Paulo (2003 to 2004) and Senior Economic Research Economist (2002 to 2003).
He holds a Bachelor’s degree in Economics from Universidad de Buenos Aires (UBA), Buenos Aires, Argentina; postgraduate degree in Economics from Universidad Torcuato Di Tella (UTDT), Buenos Aires, Argentina and a Master’s degree in International Economic Policy from the University of Warwick, British Chevening Scholarship, London, United Kingdom.
Pedro Paulo Giubbina Lorenzini (Officer) has been an Officer of the Executive Committee at the Itaú Unibanco Group since 2021. He is currently responsible for the Treasury, Client and Product Desks and Macroeconomics departments and for the bank`s operations in South America (Argentina, Paraguay, Uruguay and Itaú Corpbanca), having held the position of Executive Officer 2021).
Mr. Lorenzini was responsible for the Markets, Securities Services and Treasury (2008 to 2021); Sales and Structuring, ALM Management (2004 to 2008); Trading and Currency Management (2000 to 2004); Management of the ALM Department (1997 to 2000); several departments of the Treasury Products Sales to Corporate Clients (1995 to 1997); Structuring and Development of Treasury Products (1993 to 1995); Product and Risk Management Manager (1992 to 1993); and responsible for Controllership and Management of Managerial Results from Corporate Products (1991 to 1992) at Citigroup Brazil, and was a Trainee (1989 to 1991) at Citibank Brazil.
He was Chairman of the Treasury Committee (2010 to 2013) and Citibank’s representative at the Board of Executive Officers at the Federação Brasileira de Bancos (FEBRABAN) (2013 to 2021), and Chairman of the Treasury Committee (2010 to 2012),
149
and Vice President of the Associação Brasileira das Entidades dos Mercados Financeiro e de Capitais (ANBIMA) (2010 to 2021).
He holds a Bachelor’s degree in Economics from the Pontifícia Universidade Católica de São Paulo (PUC-SP), São Paulo, Brazil.
Ricardo Ribeiro Mandacaru Guerra (Officer) has been a partner in the Partners Program since 2015 and an Officer of the Executive Committee at the Itaú Unibanco Group since 2021, having been in charge of the technology department in the position of CIO since 2015. He has held several positions at the Itaú Unibanco Group, including Executive Officer (2014 to 2021), Channels Officer (2008 to 2014); Financing Products Superintendent—Individuals (2007 to 2008); Credit Policies Superintendent (2006 to 2007); Electronic Channels Management Superintendent (2002 to 2006), and Internet Project Leader (1996 to 2000).
He joined the Itaú Unibanco Group in 1993 as a System Analyst.
He holds Bachelor’s degrees in Civil Engineering from the Escola Politécnica da Universidade de São Paulo (USP), São Paulo, Brazil, and in Business Administration from the Faculdade de Economia, Administração, Contabilidade e Atuária da Universidade de São Paulo (FEA-USP), São Paulo, Brazil, and an MBA from the Kellogg School of Management at Northwestern University, Illinois, U.S.
Sergio Guillinet Fajerman (Officer) has been a partner in the Partners Program since 2007 and an Officer of the Executive Committee at the Itaú Unibanco Group since 2021. He is currently responsible for the Personnel department. He has held several positions at the Itaú Unibanco Group, including Executive Officer (2017 to 2021) and Corporate Personnel Management Officer and Personnel Officer at the General Wholesale Banking Office (2010 to 2017). He is a representative of the Itaú Unibanco Group in the Human Resources Committee (CHR) of FEBRABAN.
He holds a Bachelor’s degree in Economics from the Universidade Federal do Rio de Janeiro (UFRJ), Rio de Janeiro, Brazil; MBA in Corporate Finance from the Instituto Brasileiro de Mercado de Capitais (IBMEC), Brazil; MBA from INSEAD, Fontainebleau, France and has attended the Advanced HR Executive Program from the University of Michigan, Michigan, U.S.
Board of Officers—Officers
Adriano Cabral Volpini (Officer) has been a partner in the Partners Program since 2017 and an Officer at the Itaú Unibanco Group since 2012. He has held several positions at the Itaú Unibanco Group, including Superintendent of Prevention of Unlawful Acts (2005 to 2012); Manager of Prevention of Unlawful Acts (2004 to 2005); Inspection Manager (2003); Inspector (1998 to 2003); Auditor (1996 to 1997) and in the Branch Operation Department (1991 to 1996). He also holds management positions in several companies of the Itaú Unibanco Group.
He holds a Bachelor’s degree in Social Communication and a postgraduate degree in Accounting and Financial Administration, both from the Fundação Armando Álvares Penteado (FAAP), São Paulo, Brazil and an MBA in Finance from the Instituto Brasileiro de Mercado de Capitais (IBMEC), Brazil.
Álvaro Felipe Rizzi Rodrigues (Officer) has been a partner in the Partners Program since 2017 and an Officer at the Itaú Unibanco Group since 2014. He is currently responsible for the Legal Wholesale Banking Department (investment banking, treasury, wealth management services, banking products, allocated funds and onlending, international loans and foreign exchange), the Proprietary M&A Legal Matters and Anti-Trust Legal Matters. Mr. Rodrigues had been previously responsible for the Institutional Legal Department (Corporate and Corporate Governance, Contracts, Intellectual Property and Corporate Paralegal Matters), the International Legal Department and Legal Retail Banking Department (responsible for legal issues related to products and services of the retail banking, insurance and pension plan business). He joined the Itaú Unibanco Group in 2005, serving as Legal Manager and Legal Superintendent (2005 to 2014). He also worked in the Corporate Law and Contract Law departments (1998 to 2005) at Tozzini Freire Advogados.
He has a Bachelor’s degree in Law from the Universidade de São Paulo (USP), São Paulo, Brazil. He has also attended a specialization course in Corporate Law from the Pontifícia Universidade Católica de São Paulo (PUC-SP), São Paulo, Brazil, and holds a Master of Laws (L.L.M.) from Columbia University Law School, New York, U.S.
Andre Balestrin Cestare (Officer) has been an Officer at the Itaú Unibanco Group since 2017. He is currently responsible for the Financial Planning of the Wholesale Banking and Technology and Operations department. He has held several positions at the Itaú Unibanco Group, including Financial Planning Officer—Retail Banking (2017 to 2019) and Finance Superintendent (2010 to 2017).
Mr. Cestare was also a Member of the Board of Directors at Financeira Itaú CBD and ConectCar from 2017 to 2019.
150
He holds a Bachelor’s degree in Mechanical Engineering from Escola Politécnica da Universidade de São Paulo (USP), São Paulo, Brazil; postgraduate degree in Business Administration and a Professional Master’s degree in Finance and Economics, both from the Fundação Getulio Vargas (FGV), São Paulo, Brazil. He also attended the Executive Qualification Program from Fundação Dom Cabral, São Paulo, Brazil.
Daniel Sposito Pastore (Officer) has been an Officer at the Itaú Unibanco Group since 2020. He has held several positions at the Itaú Unibanco Group, including Legal Superintendent working at the labor, criminal, union relations, higher courts, labor advisory and WMS areas (2012 to 2020); Legal Manager, WMS, working at the international, Asset and Brokerage departments (2008 to 2011), Legal Lawyer, WMS (2004 to 2008); Lawyer, Banking Law (2002 to 2003), and Legal Assistant (M&A Legal) (2000 to 2002).
Mr. Pastore served at the Associação Brasileira das Entidades dos Mercados Financeiro e de Capitais (ANBIMA) as an effective member of the Legal Committee (2012 to 2016), having served as Vice President (2015 to 2016); Coordinator and Liaison on behalf of ANBIMA with the Comissão de Valores Mobiliários (CVM) for issuing and implementing new rules on suitability, asset management and trust management and investment funds (2014 to 2016), and Coordinator of the revision of self-regulation codes for trust management, asset management and investment funds (2015 to 2016). He was also a member of the legal labor committee (2017 to 2020) and the union negotiation committee (2020) at the Federação Brasileira de Bancos (FEBRABAN).
He holds a Bachelor’s degree in Law from the Universidade Presbiteriana Mackenzie, São Paulo, Brazil, and a post-graduate degree in Financial and Capital Markets Law from the Instituto de Ensino e Pesquisa (INSPER), São Paulo, Brazil.
Emerson Macedo Bortoloto (Officer) has been an Officer at the Itaú Unibanco Group since 2011. He joined the Itaú Unibanco Group in 2003, taking over a number of positions in the Internal Audit department. He is currently responsible for managing the Audit department, whose mission is to plan, carry out and report on audits in Itaú Unibanco Group Retail processes and business, as well as its Wealth Management Services unit. He is also currently responsible for managing the planning, control and reporting of Itaú Unibanco’s Audit Committee’s activities.
He holds a Bachelor’s degree in Data Processing Technology; postgraduate degree in Audit and Consulting in Information Security from Faculdades Associadas de São Paulo (FASP), São Paulo, Brazil. In 2004, he obtained the CISA certification issued by the Information Systems Audit and Control Association (ISACA). He also has an MBA in Internal Auditing from Fundação Instituto de Pesquisas Contábeis, Atuariais e Financeiras (FIPECAFI), Brazil.
José Geraldo Franco Ortiz Junior (Officer) has been an Officer at the Itaú Unibanco Group since 2021. He joined the Itaú Unibanco Group in 2003 as an intern, and has served in a number of positions, such as: Legal Assistant (2003 to 2004); Lawyer (2004 to 2006); Senior Lawyer (2006 to 2008); Legal Manager (2009 to 2013), and Legal Superintendent (2013 to 2020). Mr. Ortiz Junior also worked as a foreign intern at law firm Jones Day of New York (2009) and as an intern at IBM Brasil (2001 to 2003).
He holds a Bachelor’s degree in Law from the Faculdade de Direito da Universidade de São Paulo (USP), São Paulo, Brazil, and a Master’s degree (LL.M) from the Columbia University Law School, New York, U.S.
José Virgilio Vita Neto (Officer) has been a partner in the Partners Program since 2008 and an Officer at the Itaú Unibanco Group since 2011, being currently responsible for Tax Advisory and Litigation, Corporate Legal departments, in addition to the Legal Advisory of all Business departments of the General Retail Banking Office. He joined the Itaú Unibanco Group in 2000, working as a lawyer until 2003, being responsible for the Wholesale Banking Legal Consulting department, particularly structured operations, and real estate loans. Mr. Vita Neto worked as Legal Manager (2003 to 2008), being responsible for the Wholesale Banking Legal department, particularly structured operations, real estate loans, foreign exchange, derivatives and project finance, retail legal advisory and administrative and investigative proceedings, including those related to consumer protection bodies. He also acted as Legal Superintendent (2008 to 2009), responsible for retail legal advisory, administrative and investigative proceedings, litigation for major cases and public-interest civil actions. He worked as Legal Superintendent (2009 to 2011), being responsible for the Retail Legal Advisory, litigation for major cases and public-interest civil actions, management of appeals in higher courts, administrative and investigative proceedings, and criminal prosecution.
He holds a Bachelor’s degree in Law from the Universidade de São Paulo (USP), São Paulo, Brazil; Master’s degree in Civil Law – Contracts from the Universidad de Salamanca – Spain; Ph.D. in Civil Law – Contracts from the Universidade de São Paulo (USP) São Paulo, Brazil, and has attended the Authentic Leadership Development Program from the Harvard Business School, Boston, U.S.
Paulo Sergio Miron (Officer) has been a partner in the Partners Program since 2019 and an Officer at the Itaú Unibanco Group since 2021, having held the position of Executive Officer (2015 to 2021).
151
He has been an Executive Officer at the Instituto Unibanco, and a Member of the Fiscal Council at the Fundação Maria Cecilia Souto Vidigal and of the Fiscal Council at the Fundação Nova Escola.
He was a Partner at PricewaterhouseCoopers, São Paulo, Brazil (1996 to 2015), having been the engagement partner responsible for the audit work at large Brazilian financial conglomerates, including Unibanco – União de Bancos Brasileiros (1997 to 2000), Banco do Brasil (2001 to 2005), and Itaú Unibanco S.A. (2009 to 2013).
He was a Partner at PricewaterhouseCoopers, responsible for the Brasília office, Distrito Federal (DF), Brazil (2001 to 2008), having also been responsible for PwC Brazil’s government services (2004 to 2008) and banking departments (1997 to 2008).
Mr. Miron also coordinated the PwC Brazil’s department of training at financial institutions for over ten years, and worked as a college professor for a number of years teaching financial market-related courses.
He is a Member of the Institute of Internal Auditors (The IIA) and a speaker at many seminars on financial instruments and auditing issues.
He holds Bachelor’s degrees in Accounting from the Universidade São Judas Tadeu, São Paulo, Brazil, and in Economics from the Universidade Presbiteriana Mackenzie, São Paulo, Brazil.
Renato Barbosa do Nascimento (Officer) has been an Officer at the Itaú Unibanco Group since 2017, responsible for the internal audit function of the Wholesale Banking, Treasury, Risks, Accounting, Fiscal, Finance departments and foreign units.
He held several positions within PricewaterhouseCoopers Auditores Independentes (São Paulo, Brazil), including Audit Partner from 2009 to 2017. He took part in a three-year professional exchange program (2014 to 2017) and worked at PricewaterhouseCoopers in Mexico City, Mexico, as audit officer leading external audits in subsidiaries of international entities of the financial industry in Mexico. His main responsibility as Audit Partner was to lead external audits in entities of the financial industry in São Paulo (2009 to 2017). In that period, Mr. Nascimento was also responsible for monitoring external audits carried out by the PricewaterhouseCoopers teams of the United States, United Kingdom, Switzerland, Portugal, Chile, Argentina, Paraguay and Uruguay of subsidiaries of Brazilian financial institutions in these countries.
Also, at PricewaterhouseCoopers Auditores Independentes (São Paulo, Brazil) he was Audit Senior Manager of the financial industry (2008 to 2009), and his main responsibility was to manage teams in charge of carrying out audits of entities of the financial industry, regulated by the Banco Central do Brasil. Mr. Nascimento served as an Audit Senior Manager of the financial industry (2006 to 2008), and took part in a two-year professional exchange program working at PricewaterhouseCoopers in London, United Kingdom, and his main responsibilities were managing external audits of British financial institutions in England, managing external audits of subsidiaries of international banks, as well as the resulting development of knowledge on the application of the International Financial Reporting Standards (IFRS), Sarbanes Oxley (SOx) rules and policies issued by the Public Company Accounting Oversight Board (PCAOB).
He holds Bachelor’s degrees in Accounting and in Business Administration, both from the Universidade Paulista, São Paulo, Brazil and Master’s degree in Business Administration (MBA) from Fundação Getulio Vargas (FGV), São Paulo, Brazil.
Renato da Silva Carvalho (Officer) has been an Officer at the Itaú Unibanco Group since 2020. He is currently responsible for the Wholesale Banking’s Financial Planning department. Mr. Carvalho has held several positions at the Itaú Unibanco Group, including Finance Superintendent, Wholesale Banking (2017 to 2020) and Market and Liquidity Risk Superintendent/Manager (2010 to 2017).
He worked as Investment Market Risk Associate Director (2008 to 2010) at Fidelity International LTD (London, United Kingdom), Market Risk Associate Director (2006 to 2008) at Mizuho International LTD (London, United Kingdom), and Market and Liquidity Risk Analyst (1998 to 2006) at Banco Brascan S.A. (Rio de Janeiro, Brazil).
He holds a Bachelor’s degree in Production Engineering from the Universidade Federal do Rio de Janeiro (UFRJ), Rio de Janeiro, Brazil; an Executive MBA in Finance from the Instituto Brasileiro de Mercado de Capitais (IBMEC), Brazil; an MBA in System Analysis, Project and Management from the Pontifícia Universidade Católica do Rio de Janeiro (PUC-RJ), Rio de Janeiro, Brazil; and a M.Sc.in Production Engineering from the Universidade Federal do Rio de Janeiro (UFRJ), Rio de Janeiro, Brazil; and he has attended the Executive Program from the Fundação Dom Cabral, Minas Gerais, Brazil. He is a certified Professional Risk Manager (PRM) by the Professional Risk Management International Association (PRMIA) and a Financial Risk Manager (FRM) by the Global Association of Risk Professionals (GARP).
Renato Lulia Jacob (Officer and Head of Investor Relations and Market Intelligence) has been an Officer at the Itaú Unibanco Group and concurrently held the position of Investor Relations Officer at the Itaú Unibanco Group since 2020. He has been a Member of the Disclosure and Trading Committee since 2019, having served as its Chairman since 2020. Mr. Jacob has been at the Itaú Unibanco Group for 19 years, having held several positions, including CEO and Member of the Board of Directors at Itau BBA International plc, in the United Kingdom, and Member of the Boards of Directors at Itaú International,
152
in the U.S., and Itaú Suisse, in Switzerland (2016 to 2020), a Managing Director of Banco Itaú Argentina S.A. (2006 to 2010) and a Managing Director, Head of CIB Europe (2011 to 2015).
He holds a Bachelor’s degree in Civil Engineering from the Universidade de São Paulo (USP), São Paulo, Brazil, and has attended the Advanced Management Program and taken part in the CEO Academy, both from The Wharton School of the University of Pennsylvania, Philadelphia, U.S.
Tatiana Grecco (Officer) has been an Officer at the Itaú Unibanco Group since 2017.
She has worked at the financial and capital markets since 1994, when she joined the Capital Markets Department. She has built a consistent and successful career over the years within the firm, starting as a Back-Office Analyst of institutional and private banking investors’ portfolios. In 1998, she became a Fund Portfolio Manager at Itaú Asset Management. After that, she worked as a Senior Portfolio Manager of fixed income and technical provision portfolios for five years and later became the Superintendent of Technical Provision Portfolio Management.
In 2009, Ms. Grecco commenced the indexed fund business at Itaú Asset Management, through mutual funds and ETFs – Exchange Traded Funds. In 2014, she also became the Superintendent of Solutions for Asset Allocation and Quantitative Funds.
She has coordinated the ETF Committee and the ESG Workgroup at ANBIMA for several years. She was also Vice President of Fixed Income and Multimarket Funds Committee at the same Association, contributing to the development of Brazilian Mutual Funds.
Since 2017, she has been responsible for the market and liquidity risk control at the Itaú Unibanco, Itaú Asset Management and Itaú Corretora de Valores units.
She holds a Bachelor’s degree in Civil Construction from the Universidade Estadual Paulista (UNESP), São Paulo, Brazil, a Postgraduate degree in Finance from the Instituto Brasileiro de Mercado de Capitais (IBMEC), Brazil, a Master’s degree in Business Administration from the Fundação Getulio Vargas (FGV), São Paulo, Brazil, and is certified by the Executive Education Program on Risk and Asset Management from the Yale University, Connecticut, U.S. She has been also a Certified Financial Planner (CFP) since 2009.
Teresa Cristina Athayde Marcondes Fontes (Officer) has been an Officer at the Itaú Unibanco Group since 2020, being responsible for the Civil Litigation department. She joined the Itaú Unibanco Group in 2003 as an intern, and since then has worked at the legal advisory to a number of business lines, including corporate, government relations, insurance, capitalization, private pension, health plans, real estate loans, vehicles, consortia, intellectual property/marketing, E&S, supplier contracts, technology contracts and equity and labor departments. Ms. Fontes worked as Compliance Superintendent, responsible for the Retail Banking and Labor segments (2017 to 2020).
She holds a Bachelor’s degree in Law from the Faculdade de Direito da Universidade de São Paulo (USP), São Paulo, Brazil; a post-graduate degree in Commercial Law from the University of Paris, Panthéon Sorbonne, Paris, France; an MBA from the Fundação Dom Cabral, São Paulo, Brazil; a post-MBA from the Kellogg School of Management at Northwestern University, Illinois, U.S., and has attended the Executive Education Program from the Fundação Dom Cabral, São Paulo, Brazil.
Audit Committee
Alexandre de Barros (Independent Member) has been a Member of the Audit Committee at the Itaú Unibanco Group since 2021. He has held several positions at the Itaú Unibanco Group, including Executive Vice President of the Technology Department (2011 to 2015), Executive Officer (2005 to 2010), Senior Managing Officer (2004 to 2005) and Managing Officer (1994 to 2004).
He has been an alternate Member of Duratex’s Board of Directors since 2020 and Chairman of the IT and Digital Innovation Committee since 2020 and has been a specialist Member since 2017 and a Member of the Board of Directors since 2015 at Diagnósticos da América S.A. (DASA).
Mr. de Barros was a Member of the Board of Directors (2003 to 2007) at Serasa S.A., where he also served as the Chairman (2006 to 2007).
He holds a Bachelor’s degree in Aeronautics Infrastructure Engineering from the Instituto Tecnológico de Aeronáutica (ITA), São José dos Campos, São Paulo, Brazil; a specialization in Risk Management from INSEAD, Fontainebleau, France, and an MBA from the New York University, New York, U.S.
153
Gustavo Jorge Laboissière Loyola (Independent Member) has been Chairman of the Audit Committee at the Itaú Unibanco Group since 2017, having been a Member of the Board of Directors (2006 to 2021) and a Member of the Fiscal Council (2003 to 2006).
He has been a partner at Tendências Consultoria Integrada S/S Ltda. since 2002 and at Tendências Conhecimento Assessoria Econômica Ltda. since 2003 and a Managing Partner at Gustavo Loyola Consultoria S/C since 1998.
Mr. Loyola was Governor (1992 to 1993 and 1995 to 1997) of the Banco Central do Brasil and Governor of the National Financial System Regulation and Organization (1990 to 1992).
He holds a Bachelor’s degree in Economics from the Universidade de Brasília, Distrito Federal, Brazil and a Ph.D. in Economics from the Fundação Getulio Vargas (FGV), Rio de Janeiro, Brazil.
Luciana Pires Dias (Independent Member) has been a Member of the Audit Committee at the Itaú Unibanco Group since 2020.
She has been a Partner at L. Dias Advogados since 2016, where she serves as an Advisor, Arbitrator and Opinion Giver in financial and capital market issues. She is a Professor at the Escola de Direito da Fundação Getulio Vargas (FGV) since 2008.
She has been a Member of the Audit Committee at B3 S.A.– Brasil, Bolsa, Balcão since 2016; of the Audit Committee at CERC – Serviço de Desenvolvimento de Sistemas para Recebíveis Ltda. since 2017, and of the Audit Committee at Vale S.A. since 2020.
She was an Officer at the Comissão de Valores Mobiliários (CVM) (2011 to 2015) and Market Development Superintendent at CVM (2007 to 2010). Ms. Dias served in law firms in São Paulo and Rio de Janeiro, Brazil, and in New York, U.S. (1998 to 2006).
She holds Bachelor’s and Master’s degrees and a Ph.D. in Business Law from the Escola de Direito da Universidade de São Paulo (USP), São Paulo, Brazil, and a Master of the Science of Law (J.S.M) from the Stanford Law School, Stanford University, California, U.S.
Otavio Yazbek (Independent Member) has been a Member of the Audit Committee at the Itaú Unibanco Group since 2020.
He has been a partner at Yazbek Advogados law firm since 2015, working as a specialist lawyer in corporate law, and financial and capital markets.
Mr. Yazbek has been the Chairman of the Mergers and Acquisitions Committee (CAF) since 2015; Arbitrator in arbitration procedures involving corporate law at several chambers since 2015; Independent Compliance Monitor at Odebrecht S.A. nominated by the Federal Public Attorney’s Office, within the scope of the agreement entered with this authority, approved by the U.S. Department of Justice to support the US monitorship, since 2017; Independent Member of the Bank Self-Regulation Committee of the Federação Brasileira de Bancos (FEBRABAN) since 2015; Member of the Editorial Council of law magazine Revista de Direito das Sociedades e dos Valores Mobiliários (RDSVM), Almedina Publisher; Member of the Special Corporate Law Committee of the Brazilian Bar Association (OAB) since 2019. He has been a Professor of the Specialization and Continuing Education Program of the Law School of the Fundação Getulio Vargas since 2000, and of the postgraduate programs of Instituto de Ensino e Pesquisa (INSPER) since 2015.
He worked as an Officer at the Comissão de Valores Mobiliários (CVM) and as a Member of the Standing Committee on Supervisory and Regulatory Cooperation of the Financial Stability Board (FSB) (2009 to 2013) and was a Regulation Officer at BM&FBOVESPA S.A. – Bolsa de Valores, Mercadorias e Futuros (currently B3 S.A. – Brasil, Bolsa, Balcão) (2006 to 2008), having joined as a lawyer (2000 a 2006).
He holds a Bachelor’s degree and a Ph.D in Law from the Faculdade de Direito da Universidade de São Paulo (USP), São Paulo, Brazil.
Ricardo Baldin (Independent Member and Financial Expert) has been a Member of the Audit Committee at the Itaú Unibanco Group since 2021. He has held several positions at the Itaú Unibanco Group, including Executive Officer, Internal Audit at Itaú Unibanco S.A. (2009 to 2015).
He has been the Audit Committee Coordinator at Alpargatas S.A. since 2018 and at Eneva S.A. since 2019; a Member of the Governance of Financial Institutions Committee at IBGC since 2021; and a Business Consultant at RMB Assessoria e Consultoria Empresarial e Contábil EIRELI.
He served as a Member of the Fiscal Council at the Fundo Garantidor de Crédito (FGC) (2018 to 2019); a Member of the Board of Directors and Audit Committee Coordinator at Ecorodovias (2018 to 2020); a Member of the Audit Committee at Totvs S.A. (2020); Audit Committee Coordinator at Redecard S.A. (2013 to 2014); and as a Member of the Audit Committee at Câmara Interbancária de Pagamentos (CIP) (2014) and Tecnologia Bancária (TECBAN) (2015).
154
He was Controllership, Technology and Internal Controls and Risks Officer at Banco Nacional de Desenvolvimento Econômico e Social (BNDES) (2016 to 2017).
Mr. Baldin has worked as an independent auditor for 31 years and was a former Partner at PricewaterhouseCoopers Auditores Independentes and the partner in charge for the Financial Institutions Group at PwC in South America, having coordinated a number of engagements in this region, including the assessment of the Ecuadorian Financial System and the assessment of the Brazilian Public Financial System, in addition to having participated in a number of due diligence projects in connection with this system.
He holds a Bachelor’s degree in Accounting from the Universidade do Vale do Rio dos Sinos, São Leopoldo, Rio Grande do Sul, Brazil, and has attended a number of specialization courses in corporate governance, administration and finance from IBGC, the Fundação Dom Cabral, São Paulo, Brazil, and the Fundação Getulio Vargas (FGV), São Paulo, Brazil, and from other entities, in addition to several internal courses at PwC.
Rogério Carvalho Braga (Independent Member) has been a Member of the Audit Committee at the Itaú Unibanco Group since 2021. He has held a number of positions at the Itaú Unibanco Group, including Officer (2020) and Corporate Manager of Marketing, Franchise and Products at Itaú Corpbanca (2016 to 2018). He joined the Itaú Unibanco Group in 1999 and was elected Officer in 2000.
He holds a Bachelor’s degree in Law from the Pontifícia Universidade Católica de São Paulo (PUC-SP), São Paulo, Brazil, and an MBA from the Pepperdine University, Malibu, California, U.S.
Fiscal Council
Alkimar Ribeiro Moura (Member) has been a Member of the Fiscal Council at the Itaú Unibanco Group since 2016. He has held several positions at the Itaú Unibanco Group, including Member of the Audit Committee (2010 to 2015).
Mr. Moura is a retired Economics Professor at the Escola de Administração de Empresas de São Paulo of the Fundação Getulio Vargas (FGV), São Paulo, Brazil.
He was an Independent Member of the Board of Directors (2012 to 2017) and a Coordinating Member of the Audit Committee (2013 to 2017) of Cetip S.A. Mercados Organizados.
Mr. Moura was an Independent Member of the Supervisory Board of BM&FBOVESPA S.A. – Bolsa de Valores, Mercadorias e Futuros (currently B3 S.A. – Brasil, Bolsa, Balcão): Market Supervision (2007 to 2010).
He was Chairman of Investment Banking (2001 to 2003) and Vice Chairman of Finance and Capital Markets (2001 to 2003) at Banco do Brasil S.A.
Mr. Moura held several positions at the Banco Central do Brasil, including Standards and Financial System Organization Officer (1996 to 1997); Monetary Policy Officer (1994 to 1996); Public Debt and Open Market Transactions Officer (1987 to 1988).
He was an Officer at Banco Pirelli-Fintec (1988 to 1993).
He holds a Bachelor’s degree in Economics from the Universidade Federal de Minas Gerais, Belo Horizonte, Minas Gerais, Brazil; Master’s degree from the University of California, Berkeley, and a Ph.D. in Applied Economics from the Stanford University, California, U.S.
Artemio Bertholini (Member) has been a Member of the Fiscal Council at the Itaú Unibanco Group since 2021. He has held several positions at the Itaú Unibanco Group, including Member of the Board of Directors (2009 to 2011).
He has been a Member of the Audit Committee of BB Seguridade S.A. since 2015, Cia. de Saneamento do Paraná (SANEPAR) since 2017, Cia. de Saneamento de Minas Gerais (COPASA) since 2018, and Member of the Fiscal Council of Investimentos e Participações em Infraestrutura S.A. (INVEPAR) since 2021.
He has also been responsible for the Audit and Accounting modules of post-graduation courses on Controllership at the Universidade Estadual de Campinas (UNICAMP), since 2015, and Lecturer engaged for events related with Accounting, Audit, Arbitration and Corporate Governance at the Regional Accounting Council (CRC/SP).
Mr. Bertholini served as a Member of the Board of Directors at Americel S.A. (2000 to 2001), Telet S.A. (2000 to 2001), Petrobrás Distribuidora S.A. (2018 to 2019), as a Member of the Audit Committee at Petrobrás Distribuidora S.A. (2018 to 2019), as a Member of the Fiscal Council at Banco do Brasil S.A. (2001 and 2003 to 2005), Itaúsa S.A. (2006 to 2008), Indústrias Romi S.A. (2009) and Tekno S.A. Ind. e Comércio (2018 to 2020).
155
He was also CEO and Vice Chairman of the Board of Directors at Grant Thornton Brasil (2013 to 2015), Managing Partner at Grupo Directa Auditores (1978 to 2013), and Audit Manager at Arthur Andersen & Co. (1968 to 1978).
He holds Bachelor’s degrees in Accounting and Economics and a Master’s degree in Accounting and Finance from the Pontifícia Universidade Católica de São Paulo (PUC-SP), São Paulo, Brazil, and a Ph.D in Business Administration from the Florida Christian University, Orlando, Florida, U.S.
José Caruso Cruz Henriques (Member) has been a Member of the Fiscal Council at the Itaú Unibanco Group since 2011 and Chairman of this Board since 2017. He has held several positions at the Itaú Unibanco Group, including Officer (1988 to 2003).
He has been Executive President of Corhen Serviços Ltda. since 2003.
He holds a Bachelor’s degree in Law from the Universidade de São Paulo (USP) São Paulo, Brazil and a postgraduate degree in Business Administration from the Fundação Getulio Vargas (FGV), São Paulo, Brazil.
Performance Evaluation of the Board of Directors and Board of Officers
Board of Directors
Our Board of Directors, its members and co-chairmen, as well as the Board of Directors committees, are evaluated annually for their performance as management members and bodies, in compliance with best corporate governance practices. The reelection of members of the Board of Directors and Board of Directors committees takes into account each director’s positive performance, regular attendance at meetings over the previous term and experience and independence level.
This evaluation consists of each director’s own self-evaluation, a cross-evaluation of the members of the Board of Directors (where members of our Board of Directors evaluate each other), the evaluation of the Board of Directors by its members, the evaluation of the co-chairmen by directors and evaluation of the Board of Directors committees by their members. This process is structured based on specific characteristics and responsibilities of the Board of Directors, its members, Co-chairmen, and each of its committees, seeking to achieve a high expertise level. Furthermore, this process is carried out by a third party responsible for distributing specific questionnaires to the Board of Directors and every Board of Directors committee, as well as for interviewing individual members of the Board of Directors and its committees. This person is also responsible for analyzing responses and comparing them to the responses from previous years in order to identify and address any Board of Directors and the Board of Director committee gaps.
Additionally, the Nomination and Corporate Governance Committee provides methodological and procedural support to the evaluation process, in addition to discussing the outcomes of the evaluation, the composition and the succession plan to the Board of Directors. In addition to the support provided by this committee, an independent person is responsible for carrying out the evaluation.
Ultimately, our Board of Directors is composed of outstanding knowledgeable professionals with expertise in different areas of operation.
Pre-established Rules of our Board of Directors:
The members of our Board of Directors must act fairly, in accordance with pre-established rules to avoid conflicts of interest. These rules include:
| | • | | Refraining from taking part in resolutions related to matters in which the director’s interests conflict with ours. The director must inform the Board of Directors of any possible conflict of interest as soon as the matter giving rise to such conflict is included in the agenda or proposed by the Board of Director’s co-chairmen, and, in any event, before the beginning of any discussion on such matter. |
156
| | • | | In the event the director or a company controlled or managed by this director carries out a transaction with any company in the Itaú Unibanco Group: (a) the transaction must be carried out at arm’s length; (b) if it is not a customary transaction or a provision of services, an appraisal report must be issued by recognized financial advisors evidencing that the transaction was carried out at arm’s length; and (c) the transaction must be disclosed to and conducted under the supervision of the Related Parties Committee, the Ethics and Ombudsman Office or of channels within the Itaú Unibanco Group that are competent in the specific area, subject to the rules and conditions set forth in our Transactions with Related Parties Policy. |
| | • | | Serving on no more than four boards of directors of companies that do not belong to the same group. |
| | • | | Our directors have no service contracts with us or any of our subsidiaries providing for benefits upon termination of employment. |
Please see “Item 6A. Directors and Senior Management – Board of Directors” for further information on the members of our Board of Directors.
Officers
The performance appraisal of our officers is defined by the manager based on the priorities of the year discussed together with the appraised
Performance metrics
The officers’ evaluation process is carried out annually and takes into account what was defined as a priority for the year. Results are based on the following:
| | • | | Manager Evaluation: Together with the manager, the priorities for the year are defined. These priorities are monitored throughout the year and, at the end of the year, they are evaluated. In order to support the evaluation, managers receive financial and market information, if applicable. |
| | • | | Rapporteur: It is an evaluation process of behaviors and main deliveries, in addition to defining the career moment carried out by an independent appraiser, pursuing complementary elements to the executive’s evaluation. |
| | • | | Evaluation Committee: Collegiate discussion to validate the manager’s evaluation and the proposed career moment in the Rapporteur. This committee can also discuss development and succession recommendations. |
Compensation and Benefits
Governance of compensation
Our compensation strategy adopts clear and transparent processes, aimed at complying with applicable regulation and the best national and international practices, as well as at ensuring consistency with our risk management policy.
Compensation Committee
We have a statutory compensation committee, or Compensation Committee, that reports to the Board of Directors, which duties include:
| | |
Preparing a policy for the compensation of management members, proposing to the Board of Directors the many forms of fixed and variable compensation, in addition to special benefits and recruitment and termination programs. | | Discussing, analyzing and supervising the implementation and operation of existing compensation models, by discussing general principles of the employee compensation policy and recommending improvements to the Board of Directors based on the policy principles. |
Proposing to the Board of Directors the aggregate compensation amount for management members to be submitted to the Annual Stockholders’ Meeting. | | Preparing the “Compensation Committee Report” on an annual basis. |
Compensation policy
157
Our compensation policy aims to consolidate our compensation principles and practices so as to attract, reward, retain and motivate management members and employees in the sustainable running of business, subject to proper risk limits and always in line with stockholders’ interests.
Compensation strategy
Our compensation and benefit strategies vary according to the area of activity and market parameters. We periodically verify these parameters by:
| | • | | commissioning salary surveys conducted by specialized consultants, who are independent of management; |
| | • | | participating in surveys conducted by other banks; and |
| | • | | participating in specialized compensation and benefit forums. |
Compensation of employees
Employees compensation is composed of:
|
Monthly fixed compensation: Determined in accordance with the complexity of an individual’s work duties and such individual’s performance with respect with such duties. Employees’ fixed compensation changes according to our promotion and merit policy, which takes into account the employees’ seniority, responsibilities and personal performance when carrying out duties over the period under evaluation. In addition, employees are entitled to salary adjustments, in accordance with applicable collective bargaining agreements. |
Variable compensation: It acknowledges the level of dedication, results achieved and the short, medium and long-term sustainability of these results. Additionally, employees are entitled to receive additional amounts if provided in applicable collective bargaining agreements. |
Benefits: We provide several benefits agreed with labor unions representing our employees’ many professional categories, which are established in the respective collective bargaining agreements, such as: food allowance, day care/babysitter, transportation etc. |
In addition to those benefits set forth in collective bargaining agreements, we offer the following benefits to our employees:
| | • | | medical and dental care plans; |
| | • | | annual health check-up; and |
These benefits may be granted according to each employee’s category or regulation applicable to each jurisdiction.
Moreover, we present below the benefits that are available to all employees:
| | • | | differentiated banking products and services; |
| | • | | Itaú Unibanco Club Foundation (Fundação Itaú Unibanco Clube); |
| | • | | discounts for health or sports related activities with several fitness centers; |
| | • | | discount partnership with several companies of goods and services; |
| | • | | pharmacy discounts and payment facilities; and |
| | • | | psychosocial and personal care services. |
Stock-based Profit Sharing to Employees
We have a stock-based profit-sharing program for a specific group of employees, acknowledging those who had outstanding performance during the relevant year.
158
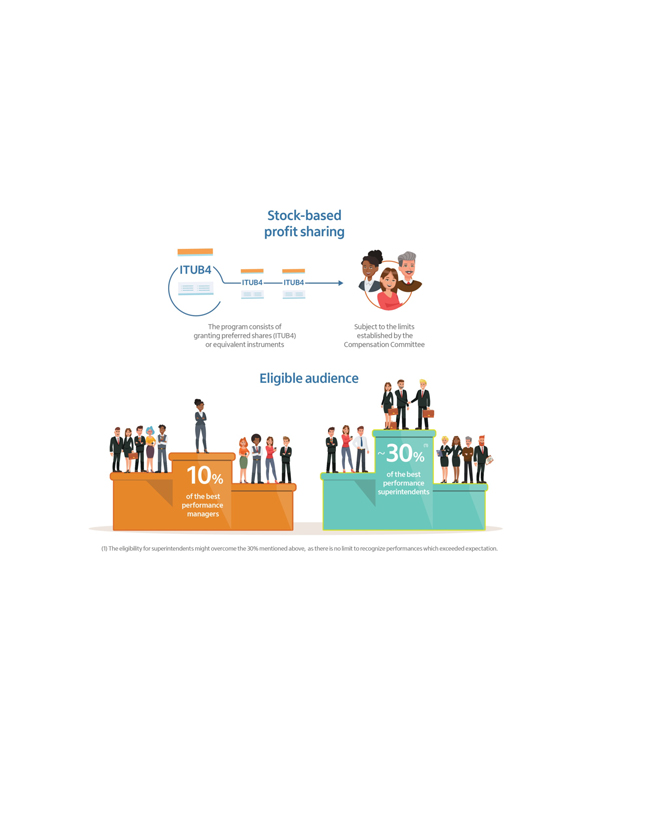
159
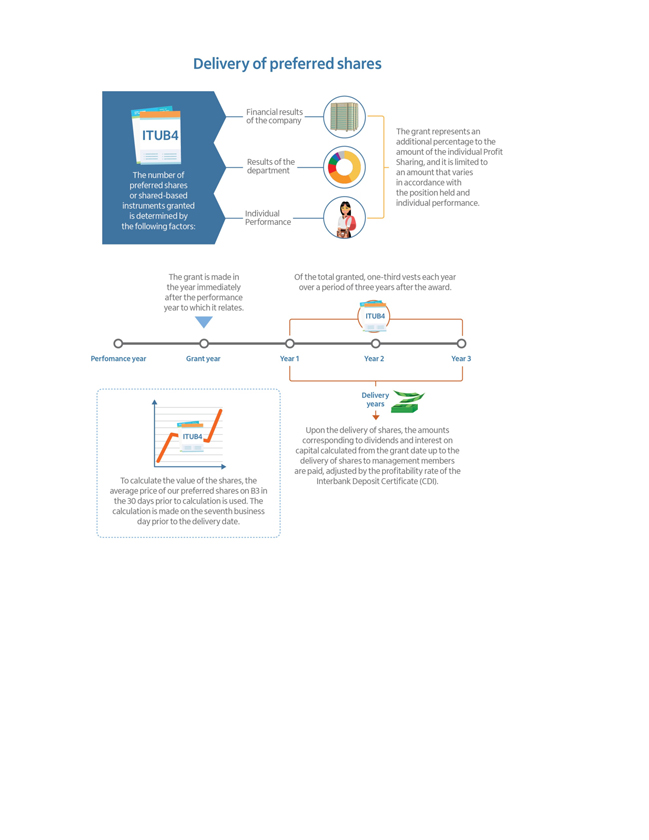
160
Compensation of Management Members
| | | | | | | | |
| | | Board of Directors (1) (2) (3) | | Board of Officers (2) | | Fiscal Council | | Audit Committee(3) (4) |
| Monthly Fixed Compensation | | Aggregate amount of fees in cash approved at the Annual General Stockholders’ Meeting | | Aggregate amount of fees in cash approved at the Annual General Stockholders’ Meeting | | Fees in cash approved at the Annual General Stockholders’ Meeting | | Fees in cash determined by the Board of Directors |
| Annual Fixed Compensation | | Stock-based compensation approved at the Annual General Stockholder’s Meeting. | | N.A. | | N.A. | | N.A. |
| Benefit Plan | | N.A. | | Composed of medical and dental care plans, check-up, private pension plan, parking lot and life insurance. | | N.A. | | N.A. |
| Annual Variable Compensation | | Stock-based compensation approved only in the event of a resolution of the Compensation Committee, subject to the guidelines of CMN Resolution No. 3,921 and limited to the extent determined by the Annual General Stockholders’ Meeting. | | Statutory profit, sharing and fees (in cash and in shares) approved by the Compensation Committee and limited to the annual amount approved at the Annual General Stockholders’ Meeting. | | N.A. | | N.A. |
| (1) | In the event that a member of the Board of Directors is also part of the Board of Officers of Itaú Unibanco or its subsidiaries, the compensation will be in line with the compensation model of the Board of Officers. Management members who are also part of statutory on non-statutory committees or of our subsidiaries or affiliates are compensated according to their duties in the executive bodies or areas in which they work. As a rule, they do not receive a specific compensation for belonging to these committees. A non-management member of the Compensation Committee is compensated for his/her duties executed in the referred Committee. |
| (2) | Maximum compensation amounts are defined based on the limits imposed by Article 152 of the Brazilian Corporate Law. |
| (3) | Member of the Board of Directors and Audit Committee only receive benefits in they have previously been officers of the Company. |
| (4) | For those members of the Audit Committee who are also part of the Board of Directors, the compensation policy of the Board of Directors is applied. |
161
Composition of compensation of management members
| | | | | | | | | | | | | | | | | | | | |
Member | | Year | | | Monthly
fixed
compensation | | | Annual fixed
compensation | | | Annual
variable
compensation | | | Benefits | |
Board of Directors | | | 2020 | | | | 34% | | | | 24% | | | | 39% | | | | 3% | |
| | | 2019 | | | | 26% | | | | 18% | | | | 53% | | | | 3% | |
| | | 2018 | | | | 28% | | | | 23% | | | | 46% | | | | 3% | |
Board of Officers | | | 2020 | | | | 13% | | | | 0% | | | | 83% | | | | 4% | |
| | | 2019 | | | | 7% | | | | 0% | | | | 92% | | | | 1% | |
| | | 2018 | | | | 9% | | | | 0% | | | | 91% | | | | 1% | |
Fiscal Council | | | 2020 | | | | 100% | | | | 0% | | | | 0% | | | | 0% | |
| | | 2019 | | | | 100% | | | | 0% | | | | 0% | | | | 0% | |
| | | 2018 | | | | 100% | | | | 0% | | | | 0% | | | | 0% | |
Audit Committee | | | 2020 | | | | 100% | | | | 0% | | | | 0% | | | | 0% | |
| | | 2019 | | | | 100% | | | | 0% | | | | 0% | | | | 0% | |
| | | 2018 | | | | 100% | | | | 0% | | | | 0% | | | | 0% | |
| | | | | | | | | | | | |
Year ended in December 31, 2020 | | | | | | | | | |
| a Body | | Board of
Directors | | | Executive
Board | | | Fiscal
Council | |
b Number of members | | | 11.50 | | | | 19.80 | | | | 6.00 | |
c Number of members who receive compensation | | | 11.50 | | | | 19.80 | | | | 6.00 | |
d Amount of the highest individual compensation (in R$) | | | 9,710,000 | | | | 34,737,000 | | | | 220,500 | |
e Amount of the lowest individual compensation (in R$) | | | 2,643,000 | | | | 2,588,000 | | | | 88,200 | |
f Average amount of individual compensation (total compensation divided by the number of compensated members) (in R$) | | | 4,364,438 | | | | 11,681,451 | | | | 145,950 | |
For the annual amount of the lowest individual compensation, members who have not performed their duties for the full 12 months of the relevant year were disregarded. Members who received the amount of the highest compensation in each body performed their duties during the 12 months of the relevant year.
| | | | | | | | | | | | |
Year ended in December 31, 2019 | | | | | | | | | |
| a Body | | Board of
Directors | | | Executive
Board | | | Fiscal
Council | |
b Number of members | | | 11.75 | | | | 21.00 | | | | 6.00 | |
c Number of members who receive compensation | | | 11.75 | | | | 21.00 | | | | 6.00 | |
d Amount of the highest individual compensation (in R$) | | | 14,560,000 | | | | 52,060,000 | | | | 220,500 | |
e Amount of the lowest individual compensation (in R$) | | | 2,643,000 | | | | 2,953,000 | | | | 88,200 | |
f Average amount of individual compensation (total compensation divided by the number of compensated members) (in R$) | | | 5,236,316 | | | | 16,930,128 | | | | 154,350 | |
For the annual amount of the lowest individual compensation, members who have not performed their duties for the full 12 months of the relevant year were disregarded. Members who received the amount of the highest compensation in each body performed their duties during the 12 months of the relevant year.
| | | | | | | | | | | | |
Year ended in December 31, 2018 | | | | | | | | | |
| a Body | | Board of
Directors | | | Executive
Board | | | Fiscal
Council | |
b Number of members | | | 11.25 | | | | 20.83 | | | | 6.00 | |
c Number of members who receive compensation | | | 11.25 | | | | 20.83 | | | | 6.00 | |
d Amount of the highest individual compensation (in R$) | | | 12,941,000 | | | | 46,880,000 | | | | 220,500 | |
e Amount of the lowest individual compensation (in R$) | | | 2,652,000 | | | | 2,604,000 | | | | 88,200 | |
f Average amount of individual compensation (total compensation divided by the number of compensated members) (in R$) | | | 5,218,146 | | | | 13,316,714 | | | | 154,500 | |
For the annual amount of the lowest individual compensation, members who have not performed their duties for the full 12 months of the relevant year were disregarded. Members who received the amount of the highest compensation in each body performed their duties during the 12 months of the relevant year.
162
Criteria for defining monthly and annual fixed compensation of management members:
Fixed compensation of members of the Board of Directors and Board of Officers, as well as the benefit plan granted to officers, is not impacted by performance indicators, as discussed below:
| | |
| | |
Fiscal Council | | Within the limits established by legislation, members of the Fiscal Council are paid monthly fixed compensation amount only and are not eligible for the benefit plan. Additionally, in accordance with applicable legislation, compensation members of the Fiscal Council may not be lower, for each acting member, than 10% of the fixed compensation assigned to each officer (i.e., not including benefits, representation allowances and profit sharing). |
| | |
Board of Directors | | The monthly fixed compensation is consistent with market practices and periodically revised to attract qualified professionals. Additionally, history and résumé, among other factors, are taken into account. |
| | |
Audit Committee | | The members of the Audit Committee are paid monthly fixed compensation amount only are not eligible for the benefit plan. For those members of the Audit Committee who are also part of the Board of Directors, the compensation policy of the Board of Directors is applied. |
| | |
Board of Officers | | The monthly fixed compensation is established in accordance with the position held and is based on the internal equality principle, since all officers holding the same position earn the same monthly fixed compensation amount, also enabling their mobility in our different businesses. Fixed compensation amounts are determined taking into account market competition. |
Criteria for Defining the Annual Variable Compensation of the Board of Officers(1):
The annual variable compensation takes into account three main factors:
| | • | | Performance of the officer; |
| | • | | The result of the applicable business area; and |
| | • | | Financial results of the company. |
| (1) | Within the limits established by legislation, the compensation of Officers in charge of internal control and risk departments is determined irrespective of the performance of the business areas they control and assess so as not to give rise to any conflicts of interest. However, even though compensation is not impacted by the results from business areas, it is still subject to any impacts arising from our results. |
Distribution of the Annual Variable Compensation of the Board of Officers(2):
Regarding the annual variable compensation:
| | • | | 30% is paid in cash on demand; and |
| | • | | 70% is paid through the delivery of our preferred shares, deferred for payment within three years, in the proportion of 1/3 of the amount due per year. |
| (2) | In accordance with CMN Resolution No. 3,921, a portion of the variable compensation must be deferred. |
163
Delivery of Preferred Shares Related to the Annual Variable Compensation of the Board of Officers:
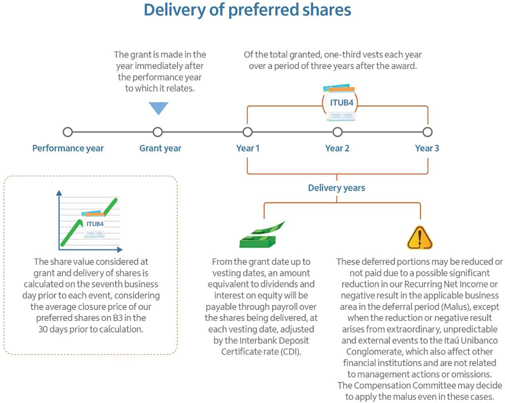
Partnership Program for Officers and Employees
Aimed at aligning the interests of our officers and employees to those of our stockholders, this program offers participants the opportunity to invest in our preferred shares, traded under ticker symbol “ITUB4”, sharing short, medium and long-term risks.
The program is aimed at officers and employees approved by the Personnel Committee due to their history of contribution, relevant work and outstanding performance. It has two types of appointments: partners and associates, and the person must join the program first as an associate. Main differences in the two types of appointments are as follows:
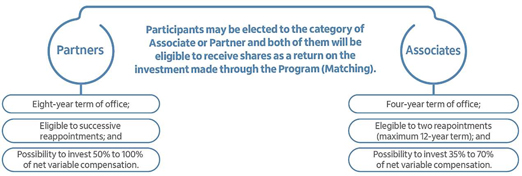
164
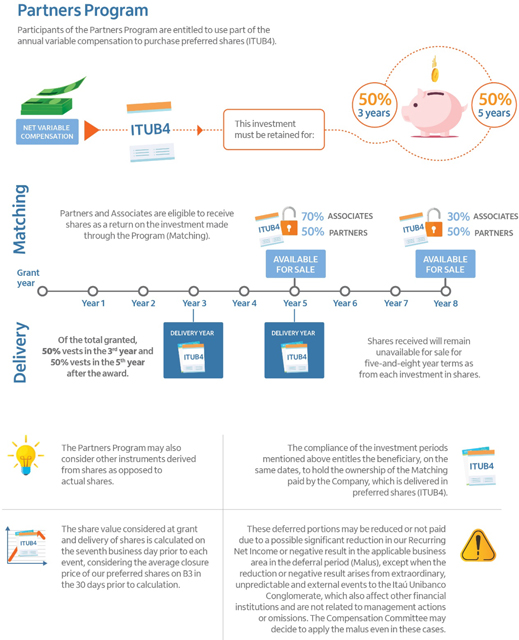
Stock Grant Plan and Stock Ownership Requirements
In order to consolidate the rules of our long-term stock-based incentive programs, described under items above, under the terms of CVM Ruling No. 567/15, we approved the Stock Grant Plan at the 2017 Extraordinary General Stockholders’ Meeting.
In addition, in 2019 the Compensation Committee determined that members of the Executive Committee must comply with a stock ownership requirement of a minimum equivalent (i) to 10 times the annual salary for the CEO and (ii) to 5 times of the annual salary for other Executive Committee members, which must be complied within a five-year period of after their position’s start date. Currently, all Executive Committee members comply with the minimum requirement.
With the Stock Grant Plan and the share ownership requirements, we reinforce the alignment of interests of management members and employees of our company and its direct and indirect subsidiaries with our interests and stockholders’ interests.
165
Stock Option Plan to Officers and Employees
We have a Stock Option Plan through which our officers and employees with outstanding performance are entitled to receive stock options. These options enable them to share the risk of price fluctuations of our preferred shares with other stockholders and are intended to integrate the participants of this program into the Itaú Holding Group’s development process in the medium and long term. Our Personnel Committee manages the Stock Option Plan, including matters such as strike prices, vesting periods and effectiveness of options, in compliance with the rules set forth in the Stock Option Plan.
Options may be granted only to participants if there is net income sufficient to be distributed as mandatory dividends. Also, to avoid the dilution of stockholders, the sum of shares to be used in the programs described in the Stock Grant Plan and Stock Option Plan every year will not exceed the limit of 0.5% of total outstanding shares. In the event the number of shares delivered and options granted is below the 0.5% limit, the difference may be added for purposes of stock-based compensation or granting of options in any one of the seven subsequent fiscal years.
Since 2012, no simple option has been granted within the scope of our Stock Option Plan. For further information on changes in the plan, see “Financial Performance”, and “Note 22 – “Banking Service Fees” to our audited consolidated financial statements.
Board of Directors Committees
The organizational chart below presents our eight committees, reporting directly to our Board of Directors, the body responsible for electing these committee members for a one-year term of office, conditioned on their having proven knowledge in the respective areas of work and technical qualification compatible with their duties.
The committees may hire outside experts but must always maintain the integrity and the confidentiality of their work.
| | |
Audit Committee Since 2014 | | • Oversees the quality and integrity of the financial statements • Oversees compliance with legal and regulatory requirements • Supervision of internal controls and risk management • Supervision of performance, independence and quality of internal audit activities and of the work of the independent accountant |
| | 100% of the members are independent |
| | 61 meetings |
Compensation Committee Since 2011 | | • Promote discussions on incentive and compensation models • Develops compensation policies for management members and employees • Establishes Goals |
| | 100% of the members are non-executive |
| | 5 meetings |
Personnel Committee Since 2009 | | • Establishes policies for attracting and retaining talented professionals • Proposes guidelines for recruiting and training employees • Presents long-term incentive programs and monitors the culture of meritocracy |
| | 100% of the members are non-executive |
| | 5 meetings |
Strategy Committee Since 2009 | | • Proposes budgetary guidelines • Provides inputs for decision-making processes • Recommends strategic guidelines and investments opportunities (Mergers and Acquisitions) • Internationalizes and creates new business areas |
166
| | |
| | | 100% of the members are non-executive |
| | | 6 meetings |
Related Parties Committee Since 2013 | | • Manages transactions between related parties • Ensures equality and transparency for these transactions |
| | 100% of the members are independent |
| | 8 meetings |
Risk and Capital Management Committee Since 2009 | | • Supports the Board of Directors • Establishes the risk appetite • Evaluates the cost of capital x the minimum return expected • Allocates capital • Oversees management activities and risk control • Improve risk culture • Complies with regulatory requirements |
| | 100% of the members are non-executives |
| | 12 meetings |
Nomination and Corporate Governance Committee Since 2013 | | • Periodically reviews the criteria for nomination and succession • Provides methodological support for the assessment of the Board of Directors and Chief Executive Officer • Nominates members of the Board of Directors and General Managers • Analyzes potential conflicts of interests |
| | 100% of the members are non-executive |
| | 3 meetings |
Corporate Social Responsibility Committee Since 2019 | | • Defines strategies to strengthen the corporate social responsibility of the Company in all its elements, including a voluntary strategy; • Analyzes the performance of social institutions related to the Company and the initiatives directly executed by the Company; • Ensures the appropriate degree of autonomy among social institutions and the Company; • Fosters the search for synergies and opportunities to increase efficiency between institutions and the Company as well as the institutions themselves; • Approves multi-annual budget for initiatives that depend on the Company’s resources; • Monitors the quality of governance of each institution; • Defines the allocation process of the Rouanet Law as well as the other existing incentive laws and approve the contributions to be made by the Company or other companies of the Itaú Unibanco Group. |
| | Executive and non-executive members |
| | 3 meetings |
Two of these committees are statutory bodies:
Audit Committee
We have an Audit Committee, which complies with the rules issued by the National Monetary Council for audit committees of financial institutions. The Audit Committee is responsible for overseeing the quality and integrity of the financial statements, the compliance with legal and regulatory requirements, the performance, independence and quality of
167
the services provided by independent auditors and by our internal auditors, and the quality and effectiveness of the internal control and risk management systems. Set up in April 2004 by the Annual General Stockholders’ Meeting, it is the only audit committee for institutions authorized to operate by the Central Bank and for companies overseen by SUSEP that are part of Itaú Unibanco Group.
The members of the Audit Committee are annually elected by the Board of Directors from among its members or professionals with renowned competence and outstanding knowledge, taking into account that at least member of this Committee will be designated Financial Expert and must have proven knowledge in the accounting and auditing areas.
All members of the Audit Committee are independent, in accordance with CMN regulation, and the Board of Directors will terminate the term of office of any member of the Audit Committee if their independence is affected by any conflict of interest or potential conflict of interest. The evaluations of the Audit Committee are based on information received from management, external auditors, internal auditors, departments responsible for risk management and internal controls, and on analyses made by the members of the Committee as a result of direct observation.
Compensation Committee
It is incumbent upon the Compensation Committee to promote discussions on matters related to our management compensation. Its duties include, but are not limited to: developing a policy for the compensation of our management, proposing to the Board of Directors the many forms of fixed and variable compensation, in addition to special benefits and programs for recruitment and termination; discussing, examining and overseeing the implementation and operation of existing compensation models, discussing general principles of the compensation policy for our employees and recommending adjustments or improvements to the Board of Directors.
Internal Audit
Under the Audit Committee’s technical supervision, our Internal Audit function provides the Board of Directors and senior management with independent, unbiased and timely evaluations of the effectiveness of risk management, adequacy of controls and compliance with relevant rules and regulations related to the Itaú Unibanco Group’s operations. These evaluations occur periodically, and follow a methodology in compliance with The Institute of Internal Auditors (IIA) standards.
The Internal Audit requires the area being audited to establish action plans for any deficiencies identified, based on deadlines that vary according to risk rating criteria.
Ombudsman
The Itaú Unibanco Client ombudsman focuses on three pillars:
| | • | | Customer service: last resource to resolve clients’ complaints. Clients who are not satisfied with the answers received from previous requests within 30 days are eligible to use this resource. |
| | • | | Continuous improvement: root cause analysis, addressing action plans to improve service, products and processes to impact customer satisfaction |
| | • | | Compliance with regulatory obligations. |
One of the main responsibilities of the Ombudsman’s Office is to receive and respond to complaints received from clients who are not satisfied with answers received from previous requests within the last 30 days. In order to contact us, clients may use the phone number provided on our website, credit cards and bank receipts and/or directly online from our website.
The Ombudsman is also responsible for the governance of all processes related to client complaints through regulators (Central Bank, SUSEP, CVM, etc) and consumer protection bureaus. Processes are subject to regulatory supervision by the agencies. helping ensure adequate solutions to our clients.
168
Additionally, the Ombudsman works together with all different areas (products, operations, quality assurance and customer service departments) aiming to reduce complaints and improve customer satisfaction while analyzing the root causes of the major complaints and addressing action plans in a timely manner. Our goal is to improve processes and services and guarantee ethics and transparency principles.
The Ombudsman’s Office is also responsible for monitoring and reporting key quality and performance indicators (regarding complaints) to all executives and upper management in strategic management committees.
As part of our strategy to improve consumer relations throughout and reduce complaints, we have established and maintain an open dialogue and close agenda with consumer protection bureaus, regulators and civil entities. This agenda is a strong instrument to help improve customer satisfaction.
Every semester, the Ombudsman’s Office prepares a report regarding the most critical complaints received, which includes case studies and action plans to reduce complaints and improve customer experience. This report is submitted to our management and audit committee, as well as to Central Bank.
The Ombudsman’s Office also participates in the validation process when analyzing and approving new products and services using an institutional General Risk Assessment System, which is managed by our compliance governance model, to help reinforce attention and assure customer focus and needs along the process.
We had 96,540 employees on December 31, 2020 compared to 94,881 employees on December 31, 2019.
The following tables show the total number of employees for the years ended December 31, 2020, 2019 and 2018, segmented by region (Brazil and abroad) and operating unit:
| | | | | | | | | | | | | | | | | | | | | | | | | | | | |
Employees (Brazil and abroad) | | As of December 31, | | | Variation | |
| | 2020 | | | 2019 | | | 2018 | | | 2020-2019 | | | 2019-2018 | |
In Brazil | | | 83,919 | | | | 81,691 | | | | 86,801 | | | | 2,228 | | | | 2.7 | % | | | (5,110 | ) | | | (5.9 | )% |
Abroad | | | 12,621 | | | | 13,190 | | | | 13,534 | | | | (569 | ) | | | (4.3 | )% | | | (344 | ) | | | (2.5 | )% |
Argentina | | | 1,584 | | | | 1,613 | | | | 1,692 | | | | (29 | ) | | | (1.8 | )% | | | (79 | ) | | | (4.7 | )% |
Chile | | | 5,340 | | | | 5,755 | | | | 5,820 | | | | (415 | ) | | | (7.2 | )% | | | (65 | ) | | | (1.1 | )% |
Colombia | | | 3,098 | | | | 3,326 | | | | 3,495 | | | | (228 | ) | | | (6.9 | )% | | | (169 | ) | | | (4.8 | )% |
Uruguay | | | 1,065 | | | | 1,101 | | | | 1,117 | | | | (36 | ) | | | (3.3 | )% | | | (16 | ) | | | (1.4 | )% |
Paraguay | | | 975 | | | | 869 | | | | 844 | | | | 106 | | | | 12.2 | % | | | 25 | | | | 3.0 | % |
Europe | | | 209 | | | | 212 | | | | 213 | | | | (3 | ) | | | (1.4 | )% | | | (1 | ) | | | (0.5 | )% |
Other | | | 350 | | | | 314 | | | | 353 | | | | 36 | | | | 11.5 | % | | | (39 | ) | | | (11.0 | )% |
Total | | | 96,540 | | | | 94,881 | | | | 100,335 | | | | 1,659 | | | | 1.7 | % | | | (5,454 | ) | | | (5.4 | )% |
| | | | | | | | | | | | | | | | | | | | | | | | | | | | |
| | | | | | | | | | | | | | | | | | | | | | | | | | | | |
| | | As of December 31, | | | Variation | |
Employees (by operating unit) | | 2020 | | | 2019 | | | 2018 | | | 2020-2019 | | | 2019-2018 | |
Wholesale | | | 18,730 | | | | 19,198 | | | | 19,770 | | | | (468 | ) | | | (2.4 | )% | | | (572 | ) | | | (2.9 | )% |
Retail | | | 58,136 | | | | 59,434 | | | | 63,853 | | | | (1,298 | ) | | | (2.2 | )% | | | (4,419 | ) | | | (6.9 | )% |
Technology (1) | | | 10,987 | | | | 7,223 | | | | 6,908 | | | | 3,764 | | | | 52.1 | % | | | 315 | | | | 4.6 | % |
Support Areas (2) | | | 8,687 | | | | 9,026 | | | | 9,804 | | | | (339 | ) | | | (3.8 | )% | | | (778 | ) | | | (7.9 | )% |
Total | | | 96,540 | | | | 94,881 | | | | 100,335 | | | | 1,659 | | | | 1.7 | % | | | (5,454 | ) | | | (5.4 | )% |
| | | | | | | | | | | | | | | | | | | | | | | | | | | | |
| (1) | Includes 1,994 ZUP employees in 2020. |
| (2) | Includes: Human Resources, Legal, Audit, Corporation, Finance, Operations and Risks. |
169
Labor Relations
Itaú Unibanco has a permanent channel for dialog throughout the year with the labor unions representing the employees in their various professional categories. Meetings between the company and the labor unions are constantly held to discuss themes for furthering a good organizational climate and to discuss matters relating to the organization and workplace safety. We meet to discuss specific collective bargaining agreements, such as Profits or Results Sharing, Time Clock Registration and Working Day Compensation (work-hour tracking) schemes, among others.
From the point of view of labor relations, we recognize the labor unions as legitimate representatives of our employees. We guarantee our employees’ rights to freedom of association as well as the absolute freedom for employees to take part in labor union activities, always recognizing the rights and prerogatives of those elected to executive positions in the unions pursuant to the current Brazilian legislation and the collective agreements for each professional category to which we are a party. The company has 829 active employees with roles in the various boards of directories of the representative labor unions. As set forth in the collective labor agreement for bank employees, 470 work full time for these union entities. In addition, we allow the unions to hold membership campaigns and, when requested, to hold meetings between the union entities, our managers and employees, with a view to seeking negotiated solutions in a respectful manner and in line with ethical principles.
We note that all activities within the scope of relations with union entities are conducted with a focus on innovation and negotiated solutions with a view to minimizing possible differences and conflicts involving our employees.
At Itaú Unibanco, all employees are covered by collective labor agreements which guarantee rights, not only those granted under the labor legislation but also other benefits which may be granted to our employees on a one-off basis in accordance with our internal human resources policies. Collective labor agreement rules, as well as other alterations and adjustments to internal norms that affect the routine of employees or modify their rights are widely disclosed by the company’s various means of communication. Among such means are e-mail, videos, electronic media, advertising totems, our internal magazine and our corporative portal (where human resources policies are detailed in our personnel regulations). In addition, employees have a call center at their disposal, to which they may have recourse in the event of questions.
We are a party to an annual round table consisting of labor unions representing bank, insurance and finance employees professional associations, and employer associations for the collective drafting of agreements that define employee rights and benefits. In the last years, the banking sector has not faced strikes or significant interruptions in its operations.
Notwithstanding the foregoing, we believe that the way to solve labor disputes is through direct negotiation, avoiding litigating issues which can be resolved through an exhaustive process of dialog and transparency in relations with labor union entities.
As of December 31, 2020, our Board of Directors and our Board of Officers directly owned an aggregate amount of 0.6168% common shares and 0.7242% preferred shares. Except for the shares indirectly owned by our controlling stockholders (through their participation in IUPAR and Itaúsa), the members of our Board of Directors and our Board of Officers, on an individual basis and as a group, beneficially owned less than 1% of our common shares and less than 1% of our preferred shares as of December 31, 2020.
170
| ITEM 7. | MAJOR STOCKHOLDERS AND RELATED PARTY TRANSACTIONS |
Main Stockholders
We are controlled by IUPAR, which is jointly controlled by Itaúsa and Cia. E. Johnston. Itaúsa is controlled by members of the Egydio de Souza Aranha family, and Cia. E. Johnston is controlled by members of the Moreira Salles family.
Except for the shares indirectly owned by our controlling stockholders (through their participation in IUPAR and Itaúsa), the members of our Board of Directors and our Board of Officers, on an individual basis and as a group, beneficially owned less than 1% of our common shares and less than 1% of our preferred shares as of December 31, 2020.
The table below presents information on the persons that, to our knowledge, beneficially own over 5% of our common or preferred shares as of March 31, 2021:
| | | | | | | | | | | | | | | | | | | | | | | | |
| | | Common Shares | | | | | | Preferred
Shares | | | | | | Total | | | | |
Stockholders | | Total Number of
Shares | | | % of
Total | | | Total Number of
Shares | | | % of
Total | | | Total Number of
Shares | | | % of
Total | |
IUPAR – Itaú Unibanco Participacőes S.A. | | | 2,564,084,404 | | | | 51.71 | % | | | — | | | | 0.00 | % | | | 2,564,084,404 | | | | 26.15 | % |
Itaúsa S.A. | | | 1,943,906,577 | | | | 39.21 | % | | | 169,323 | | | | 0.00 | % | | | 1,944,075,900 | | | | 19.83 | % |
BlackRock (1) | | | — | | | | 0.00 | % | | | 349,925,097 | | | | 7.22 | % | | | 349,925,097 | | | | 3.57 | % |
Others | | | 450,299,378 | | | | 9.08 | % | | | 4,471,274,660 | | | | 92.27 | % | | | 4,921,574,038 | | | | 50.20 | % |
Subtotal | | | 4,958,290,359 | | | | 100.00 | % | | | 4,821,369,080 | | | | 99.49 | % | | | 9,779,659,439 | | | | 99.75 | % |
Treasury stock | | | — | | | | 0.00 | % | | | 24,475,909 | | | | 0.51 | % | | | 24,475,909 | | | | 0.25 | % |
Total | | | 4,958,290,359 | | | | 100.00 | % | | | 4,845,844,989 | | | | 100.00 | % | | | 9,804,135,348 | | | | 100.00 | % |
| | | | | | | | | | | | | | | | | | | | | | | | |
| (1) | Share ownership information provided by stockholder. |
Date: 2021, 03.31
ADSs Held in Host Country
As of December 31, 2020, 1,268,460,798 ADSs (26.4% of the total outstanding shares of our preferred shares) were outstanding and held of record by 67 institutional depositary receipts. We are aware that many ADSs are held of record by brokers and other nominees, and accordingly the above numbers are not necessarily representative of the actual number of U.S. persons who are beneficial holders of ADSs or the number of ADSs beneficially held by such persons.
IUPAR stockholders’ agreement
Itaúsa and Cia. E. Johnston have a stockholders’ agreement that governs their relationship as controlling stockholders of IUPAR and, indirectly, as our controlling stockholders and as controlling stockholders of our subsidiaries. IUPAR stockholders’ agreement is available on our Investor Relations website.
Transfer of control and increase of interest in the share capital
Subject to the provisions of the IUPAR stockholders’ agreement, our Bylaws do not contain any provision that is intended to delay, defer or prevent a change in our shareholding control or that would operate only with respect to a merger, acquisition or corporate restructuring of our Company or its subsidiaries. However, according to Brazilian regulation all such transactions must be carried out in accordance with procedures established by CMN and be previously approved by the Central Bank.
Brazilian legislation provides that acquisition of control of a publicly held company triggers the requirement for the acquiring party to make a tender offer for all outstanding common shares, at a price equivalent to at least 80% of the price per share paid to the controlling stockholders. Additionally, our Bylaws establish the same price rule for the holders of our preferred shares. This legislation also requires our controlling stockholders to make a tender offer for all of our shares if they increase their interest in our share capital to a level that materially and negatively affects the liquidity of our shares.
171
| 7B. | Related Party Transactions |
Transactions with controllers, joint control and related parties, and key management personnel are required to be conducted on arms’ length terms.
Under the Laws No. 4,595/64, No. 7,492/86 and CMN Resolution No. 4,693/18, financial institutions must observe specific terms and conditions when granting credit to:
| | • | | its controllers (individuals or legal entities), pursuant to Article 116 of Law No. 6,404/76, as well as their spouses, partners and their direct relatives, in the collateral line or affinity, up to the second degree; |
| | • | | its officers, managers, and members of statutory or contractual bodies, as well as their spouses, partners and their direct relatives, in the collateral line or by affinity, up to the second degree; |
| | • | | individuals with qualified equity interest; and |
| | • | | legal entities: (i)��with qualified equity interest; (ii) in which capital, directly or indirectly, there is qualified equity interest; (iii) in which there is effective operational control or relevance in the deliberations, regardless of equity interest; and (iv) that have an officer or member of the board of directors in common. |
CMN Resolution No. 4,693/18 established the definition of “qualified equity interest” as a holder that owns 15% or more of the capital of the legal entity for purposes of credit transactions by financial institutions with its related parties.
For further details on restrictions on the operations of financial institutions, see “Item 4B. Business Overview – Supervision and Regulation.”
On October 22, 2012, our Board of Directors approved a Transactions with Related Parties Policy, which is reviewed annually. The definition of related party for the purpose of disclosures in financial statements is provided in this Transactions with Related Parties Policy, and includes controlling shareholders and entities controlled by or under common control with, us, as well as the directors and officers of these entities, certain family members of such individuals and any entities controlled directly or indirectly by them. Our Transactions with Related Parties Policy provides that any transaction involving related parties must be carried out at arm’s length, comply with all practices put in place by our management, be executed in writing, and be clearly disclosed in our financial statements according to the materiality criteria provided by accounting standards.
Any related party transaction or series of transactions within a one-year period that exceeds R$1 million, defined as a “Significant Amount” (except those exclusively involving entities controlled, directly or indirectly, by us), is analyzed by the Related Parties Committee and reported to our Board of Directors on a quarterly basis.
Transactions between companies included in the consolidation were eliminated in our audited consolidated financial statements and take into consideration the absence of risk. See “Note 31 – Related parties” to our audited consolidated financial statements for more information.
| 7C. | Interests of Experts and Counsel |
Not applicable.
| ITEM 8. | FINANCIAL INFORMATION |
| 8A. | Consolidated Statements and Other Financial Information |
172
The information included in Item 18 of this annual report is referred to and incorporated by reference into this Item 8A.
Legal Proceedings
Overview
We are not defendants in any significant administrative proceeding before the CVM, SUSEP, the Central Bank or any municipalities. As part of the ordinary course of our business, we are party to various legal and administrative proceedings (including consumer complaints) filed against us with SUSEP, certain municipalities or the Central Bank.
Our audited consolidated financial statements only include reserves for probable losses that can be reasonably estimated and expenses that we may incur in connection with pending litigation or administrative proceedings, or as otherwise required by Brazilian law. Our management believes that our provisions, including interest, for legal proceedings in which we are defendants are sufficient to cover probable losses that can be reasonably estimated in the event of unfavorable court decisions. It is currently not possible to estimate the amount of all potential costs that we may incur or penalties that may be imposed on us other than those amounts for which we have reserves. We believe that any potential liabilities related to these lawsuits and administrative proceedings will not have a material adverse effect on our business, financial condition or results. There are no material proceedings in which any of our directors, any member of our senior management or any of our affiliates is either a party adverse to us or to our subsidiaries or has a material interest adverse to us or our subsidiaries.
Please see “Note 2.3 – Critical Accounting Estimates and Judgments, j) Provisions, Contingencies and Legal Liabilities” to our audited consolidated financial statements for further information and details about the changes in the provisions and respective escrow deposits for tax and social security lawsuits and main types of tax disputes. The following table sets forth our provisions for such contingencies as of December 31, 2020, 2019 and 2018.
| | | | | | | | | | | | |
Provision | | 12/31/2020 | | | 12/31/2019 | | | 12/31/2018 | |
| | | (In millions of R$) | |
Civil | | | 3,511 | | | | 3,633 | | | | 4,426 | |
Labor | | | 8,015 | | | | 8,579 | | | | 6,821 | |
Tax proceedings and legal obligations | | | 6,810 | | | | 8,266 | | | | 6,793 | |
Other | | | 1,483 | | | | 976 | | | | 573 | |
Total | | | 19,819 | | | | 21,454 | | | | 18,613 | |
| | | | | | | | | | | | |
Civil Litigation
Litigation Arising from Government Monetary Stabilization Plans
We are a defendant in lawsuits for the collection of understated inflation adjustment for savings resulting from the economic plans implemented in the 1980s and 1990s by the Brazilian Federal Government as a measure to combat inflation. Please see “Item 3D. Risk Factors – Legal and Regulatory Risks, Decision on lawsuits due to government monetary stabilization plans may have a material adverse effect on us” for further information.
Other Civil Litigation
In addition to litigation arising from government monetary stabilization plans, we are defendants in numerous civil lawsuits arising in the normal course of our business. We are not able to currently predict the total amounts involved in these claims, due to the nature of the matters disputed. However, we believe that any potential liabilities related to these lawsuits will not have a material adverse effect on our financial condition or results.
Labor Litigation
In 2020, we and our subsidiaries were not exposed to any labor liabilities or labor contingencies which individually significantly impacted our results. The pool of labor claims for our subsidiaries in such period is composed of labor claims filed by employees, former employees and outsourced service providers.
Labor unions and former employees have filed labor claims against us, seeking compensation for alleged breaches of employment agreements or rights under the applicable labor laws. As of December 31, 2020, there were 56,555 labor claims filed against us.
The main requests in the labor claims filed by our current and former employees include:
173
| | • | | Salary differences arising from the application of the 30 working hours per week limit, provided for in art. 224 of the CLT, which is applicable to bank employees whose function does not require special trust from the employer; |
| | • | | Salary differences arising from overtime not duly registered in the internal systems; |
| | • | | Claims with respect to the method used to establish overtime pay; and |
Labor class actions filed against us mainly relate to the continuation of health care plans, safety rules and strikes. We are also defendants in connection with labor claims filed by the labor prosecution office regarding union classification, outsourcing, occupational diseases, health and safety and compliance with the minimum quotas for disabled personnel. In the year ended December 31, 2020, we paid approximately R$ 3,126 million in direct labor expenses, mainly in settlements and convictions involving former employees, in accordance to the agreements signed and to the rulings imposed by labor courts.
Regarding labor claims filed by outsourced service providers, they generally involve allegations of subsidiary liability of the companies within our group.
Please see “Note 2.3 – Critical Accounting Estimates and Judgments, j) Provisions, Contingencies and Legal Liabilities” to our audited consolidated financial statements for further information about labor claims.
Tax Litigation
We have certain tax disputes that arise in our ordinary business activities, mainly relating to the constitutionality or legality of certain taxes imposed on us.
We classify tax due as legal liability when the legality and / or unconstitutionality of the legislation in force is being challenged. Legal liability taxes are accrued regardless of the likelihood of loss.
Tax contingencies correspond to the principal amount of taxes involved in tax, administrative or judicial challenges, subject to tax assessment notices, plus interest and, when applicable, fines and charges. A provision is recognized whenever the chance of prevailing is probable.
On June 25, 2013, we received a notice of deficiency from the Brazilian tax authorities alleging that we failed to pay approximately R$11,844.7 million of corporate income tax (IRPJ), plus accrued penalties and interest, and approximately R$6,867.0 million of CSLL, plus accrued penalties and interest, in 2008 fiscal year, as a result of the corporate transaction that led to the association of Itaú Holding and Unibanco Holdings S.A. The Brazilian tax authorities allege that corporate transactions of a different kind should have been used. However, the transaction suggested by the Brazilian tax authorities is not supported in the rules applicable to financial institutions. We defend that the transactions conducted were appropriate and legitimate, having been approved by the involved companies’ management bodies and their respective stockholders, and subsequently sanctioned as well by the relevant regulatory authorities, including the CVM, the Central Bank and CADE. We and our external counsel assess the risk of loss in this tax proceeding as remote. On April, 10, 2017, the Administrative Board of Tax Appeals (CARF), by the Ordinary Instance, issued a favorable decision to us, canceling the tax assessment notice. The Brazilian federal government appealed to the Superior Chamber of CARF. We understand that the CARF decision is final, and there is no possibility of a review. As such, we presented a writ of security to have the final judgment of the administrative proceeding judicially recognized. Our injunction and sentence were favorable. Currently, the writ of security awaits judgment of the Brazilian federal government’s appeal and request for suspension of judgment.
Additionally, relating to the same transaction on November 14, 2013, we received a notice of tax assessment issued on behalf of Itaú Unibanco, charging R$1,439.9 million of corporate income tax (IRPJ) and R$502.6 million of CSLL, plus accrued penalties and interest. We also assess the chance of prevailing in this litigation as remote. We filed a voluntary appeal that was dismissed by CARF and by the Superior Administrative Court of Federal Tax Appeals (CSRF). On September, 2020, a favorable ruling was issued to us. However, the other party has appealed the favorable ruling and we are discussing the case in court.
In November 2019, we received tax assessments from the Municipality of São Paulo, in the approximate amount of R$4 billion, for the alleged non-payment of municipal tax on services (ISS) in connection with leasing and credit card operations. In our defense, we state that such tax was duly paid to the Municipality of Poá, State of São Paulo, where we
174
have had operations for about 30 years, with a structure comprising staff, physical space and technology consistent with the operations carried out in that location.
Please see “Note 2.3 – Critical Accounting Estimates and Judgments, j) Provisions, Contingencies and Legal Liabilities” to our audited consolidated financial statements for further details about the changes in the provisions and respective escrow deposits for tax and social security lawsuits and main types of tax disputes.
Stockholders’ Payment
Our Bylaws establish the distribution to stockholders of mandatory dividends equivalent to 25% of our net income calculated for each fiscal year, adjusted by the decrease or increase of amounts related to legal reserve, to reserve for contingencies and to its reversal related to prior years.
The mandatory dividend may be paid as dividends or interest on capital. The main difference between these forms of payment is tax-related. The payment of dividends is tax-free for stockholders.
The payment of interest on capital is subject to withholding income tax at a 15% rate, or 25% if the stockholder is a resident of or domiciled in a tax haven jurisdiction or a privileged tax regime.
The amount paid to stockholders as interest on capital, net of any withholding tax, may be included as part of the mandatory dividend. In such case, we are required to distribute to stockholders an amount sufficient to ensure that the net amount received by stockholders, after the payment by us of applicable withholding taxes in respect of the distribution of interest on capital, is at least equal to the mandatory dividend. For further information, please see “Item 10E. Taxation”.
Our Stockholder Remuneration Policy, which was approved by the Board of Directors, establishes the monthly payment of R$0.015 per share as an advance mandatory dividend. The date used as a reference to determine which stockholders are entitled to receive such dividend in Brazil is determined based on the stockholding position registered on the last day of the preceding month. With respect to our ADSs, however, the date used to determine which stockholders are entitled to receive the monthly dividend is three days after the Brazilian reference date. In both cases, monthly dividends for a given month are paid on the first business day of the following month.
Stockholders may claim the payment of any dividend for a period of three years counted from the dividend payment date. After this period we have no responsibility whatsoever for such payment. Stockholders not residing in Brazil must register with the Central Bank so that dividends, interest on capital and other share-related amounts can be remitted abroad in foreign currency.
Currently, we pay dividends and interest on capital equivalent to or higher than the mandatory dividends, but this may not continue to happen if our stockholders decide that such distribution is not advisable in view of our financial condition. In this case, if our Fiscal Council is constituted, it must issue an opinion about that decision, and management must present a report to the CVM detailing the reasons for the suspension of the dividend payment. Profits not distributed due to a suspension of the dividend payment must be allocated to a special reserve and, if it is not absorbed by losses in subsequent years, it must be paid as dividends as soon as our financial position so permits.
For information regarding recent amounts paid or provisioned and reserved in stockholder’s equity, dividends and interest on own capital, see “Item 5A. Operating Results—Results.”
Please see “Note 21 – Interest and Similar Income and Expense and Net Gain (Loss), b) Interest and Similar Expense,” to our audited consolidated financial statements and “Item 4B. Business Overview—Supervision and Regulation—Basel III Framework—Implementation of Basel III in Brazil.”
Please see “Item 12D. American Depositary Shares—ADS Holders’ Payment of Dividends” for details on the payment of dividends to our ADS holders.
175
None.
| ITEM 9. | THE OFFER AND LISTING |
| 9A. | Offer and Listing Details |
Our shares and ADSs
Beginning in 1996, we have meetings with institutional investors in Brazil, the United States and Europe to present our governance practices, financial performance and value creation strategy, among other significant issues. Since 2002, in line with the commitment to strengthening our position in the Brazilian capital market and forge closer ties with stockholders and investors, we have held a number of presentations every year in different Brazilian regions where APIMEC operates.
Please refer to Exhibit 2(c) to this annual report for the remaining information relating to our American Depositary Shares.
| | | | |
Brazil | | United States |
B3—Brasil, Bolsa, Balcão | | NYSE |
Level 1 ITUB3 Common Shares | | Level 1 ITUB4 Preferred Shares | | Level 2 ITUB Preferred Shares American Depositary Shares (ADSs) |
Shareholders’ rights | | ADS holder rights |
– Entitle the holder to one vote at our general stockholders’ meetings (one share has one voting right) —the voting rights of our controlling stockholders do not differ from the voting rights of other holders of common shares . – 80% tag-along; and – Preemptive right in the subscription of new shares in any capital increase | | – Priority to receive mandatory dividends, in the amount of R$0.022 per share; – 80% tag-along; – Preemptive right in the subscription of new shares in any capital increase; – Voting right when the company fails to pay fixed, or minimum, dividends, for the period provided in the company’s Bylaws, which may never exceed three consecutive fiscal years, until the dividends are paid; and – The creation of a new class of shares with priority over preferred shares, as well as any change in preference or in right associated with preferred shares, must be approved by at least 50% of common shares and also approved by stockholders representing the majority of preferred shares in a special general meeting. | | – Preemptive right in the subscription of new shares in any capital increase. |
Not applicable.
Our preferred shares and common shares have traded on the São Paulo Stock Exchange (currently B3) since 1944. Our preferred shares have been traded on the NYSE in the form of ADSs (one ADS represents one preferred share) since
176
February 21, 2002, in compliance with NYSE and SEC requirements. ADS holders have no stockholder rights, which are governed by Brazilian Corporate Law. The depositary is the holder of the preferred shares underlying the ADSs. Holders of ADSs have ADS holder rights.
Disclosure Requirements
See “Item 4B. Business Overview – Supervision and Regulation” for more details regarding disclosure requirements.
Trading on the B3
B3 is a publicly traded corporation. Beginning in April 2000, the Brazilian stock exchanges were reorganized through the execution of protocols of intention by the Brazilian stock exchanges. Until April 2004, all shares underlying securities were traded only on the B3, with the exception of privatization auctions, which occurred on the Rio de Janeiro Stock Exchange. In May 2004, the Rio de Janeiro Stock Exchange reopened for the trading of certain Brazilian government securities.
Until May, 2019, if you were to trade in our shares on the B3, your trade would settle in three business days after the trade date. The seller was ordinarily required to deliver the shares to the exchange on the third business day following the trade date. As of May 27, 2019, the trade is settled in two business days after the trade date. Delivery of and payment for shares are made through the facilities of the Central Depository of B3.
In September 2014, the CMN issued Resolution No. 4,373/14, amending and improving the provisions for (i) foreign investments through a depositary receipt mechanism; and (ii) investments made by non-resident investors in the financial and capital markets in Brazil. The main changes were: (a) increasing the number of instruments that may be issued through depositary receipts; (b) making it possible for non-resident investors to invest in financial and capital markets without having previously entered into foreign exchange operations; (c) clarifying the criteria for simultaneous foreign exchange operations; and (d) increasing the responsibility of the non-resident investor’s representative. CMN Resolution No. 4,373/14 became effective in March 2015.
See “Item 10E. Taxation – Brazilian Tax Considerations—Taxation of Gains” for a description of certain tax benefits extended to non-Brazilian holders who qualify under CMN Resolution No. 4,373/14.
Corporate Governance Practices of B3
In 2000, B3 introduced three special listing segments known as “Levels 1 and 2 of Differentiated Corporate Governance Practices and Novo Mercado” with the purpose of stimulating the market of securities issued by Brazilian companies listed on B3, encouraging these companies to follow good corporate governance practices. B3 subsequently introduced two new segments called “Bovespa Mais” and “Bovespa Mais Nível 2”, specifically for small- and medium-scale companies. The listing segments were designed for the trading of shares issued by companies that voluntarily commit themselves to follow corporate governance practices and disclosure requirements beyond those required by Brazilian legislation. These rules generally increase shareholders’ rights and increase the quality of the information made available to shareholders. Newly amended rules for Levels 1 and 2 of Differentiated Corporate Governance Practices came into effect in May 2011 and newly amended rules for “Novo Mercado” came into effect in May 2018.
To become a “Level 1” company, like us, the issuer must agree to the following requirements, in addition to those imposed by applicable law: (i) ensure that shares that represent at least 25.0% of its total capital are actually available for trading; (ii) adopt offering procedures that favor the widespread ownership of the shares whenever a public offer is made; (iii) comply with minimum standards for quarterly disclosure; (iv) follow stricter disclosure policies for transactions done by its controlling shareholders, members of its Board of Directors and executives that involve securities issued by the issuer; (v) submit any existing shareholders agreement and stock option plans to B3; and (vi) prepare a schedule of corporate events and make it available to the shareholders.
To become a “Level 2” company, the issuer must agree to the following requirements, in addition to those imposed by applicable law: (i) comply with all Level 1 listing requirements; (ii) grant tag-along rights to all shareholders in case the company’s control is transferred, offering to common shareholders the same price paid per share for the controlling block of common and preferred shares; (iii) give holders of preferred shares voting rights for decisions on certain corporate restructurings and related-party transactions, such as: (a) conversions, acquisitions, mergers or splits; (b) approval of any transactions between the company and its controlling shareholder, if such decisions are within the competence of the general meeting; (c) valuation of assets to be used for payment of a share capital increase; (d) selecting an institution or specialized
177
company to determine the economic value of the company; and (e) any alterations to these voting rights that will prevail as long as the agreement to adhere to the B3’s “Level 2” segment is in force; (iv) the Board of Directors must be made up of at least five members, of which at least a minimum of 20.0% shall be independent members with a term of office limited to two years, and reelection is permitted; (v) prepare financial statements in English, including the statement of cash flows, according to international accounting standards such as U.S. GAAP or IFRS; (vi) effect a tender offer by the company’s controlling shareholder (the minimum price of the shares to be offered shall be determined by an assessment process), if the controlling shareholder decides on the delisting from the “Level 2” segment; and (vii) exclusively adopt the B3 “Arbitration Board” rules for resolving any conflicts between the company and its investors.
To join B3’s “Novo Mercado” segment, an issuer must meet all requirements described in “Levels 1 and 2,” including the issuance of common shares only (with voting rights) and granting tag-along rights to all shareholders in case the company’s control is transferred, offering the same price paid per share for the controlling block of shares.
In 2001, we executed an agreement with B3 to list our shares in the Level 1 segment, effective immediately after the disclosure of the offer’s opening date in Brazil. We agreed to comply with and continue to comply with all of the Level 1 listing requirements.
Not applicable.
Not applicable.
Not applicable.
| ITEM 10. | ADDITIONAL INFORMATION |
Not applicable.
| 10B. | Memorandum and Articles of Association |
Set forth below is certain information concerning our capital stock and a brief summary of certain significant provisions of our Bylaws and Brazilian Corporate Law. This description does not purport to be complete and is qualified by reference to our Bylaws and to Brazilian Corporate Law.
Corporate Purpose
We are organized as a publicly held corporation for an unlimited period of time under the laws of Brazil. Our head offices are located at Praça Alfredo Egydio de Souza Aranha, 100, 04344-902, São Paulo, SP, Brazil and our telephone number is +55 (11) 2794-3547. We are primarily governed by Brazilian Corporate Law and our Bylaws. Our Tax Payer’s Registry (CNPJ) is 60.872.504/0001-23, and we are registered with the São Paulo Commercial Registry (Junta Comercial do Estado de São Paulo) under NIRE 35300010230.
Our corporate purpose, as set forth in Article 2 of our Bylaws, is to perform banking activity in all its authorized forms, including foreign exchange transactions. Our agent for service of process in the United States is the general manager of our New York branch, which is located at 767 Fifth Avenue, 50th floor, New York, NY 10153.
178
Adoption of Cumulative Voting
Under Brazilian Corporate Law and CVM’s regulation, stockholders that represent at least 5% of share capital with voting rights may demand a cumulative voting process up to 48 hours before a general stockholders’ meeting. Each share will be entitled to as many votes as the members of the board being elected, and the stockholder has the right to concentrate votes in one candidate or distribute them among several candidates. The presiding officer must inform the stockholders in advance about the number of votes required for the election of each member of the Board of Directors.
Whenever the election of the Board of Directors is held under the cumulative vote process and the common or preferred stockholders exercise their right of electing one director, the controlling stockholder will have the right to elect directors in the same number as those elected by the other stockholders plus one, regardless of the number of directors that, according to our Bylaws, compose the board.
Preemptive right, capital increase and payment for subscribed shares
Each stockholder has the preemptive right to subscribe for shares in any capital increase, in proportion to his equity interest, except in specific cases, in compliance with Brazilian Corporate Law.
Our Bylaws authorize the Board of Directors to increase our capital stock up to a limit of 13,176,900,000 shares, of which 6,588,450,000 must be common shares and 6,588,450,000 preferred shares (authorized capital). Up to the limit of our authorized capital, shares may be issued without considering our stockholders preemptive rights if it is made: (i) for sale on a stock exchange; (ii) by public subscription; and (iii) in exchange for our shares at a public offering for acquisition of our control. Regardless of this provision, all increases in capital stock must be ratified by stockholders and approved by the Central Bank.
After the approval of the capital increase by the Central Bank, stockholders must pay the amount corresponding to subscribed shares under the terms established in the subscription documentation in connection with that capital increase. A stockholder that fails to make payments under the terms of the subscription documentation will be deemed to be in default in accordance with Brazilian Corporate Law.
Brazilian legislation does not provide for liability in capital calls, therefore the ownership interest of our stockholders may be diluted if they decide not to exercise their preemptive rights to subscribe shares in cases of capital increase.
Form and Transfer
Our shares are book-entry and Itaú Corretora de Valores S.A. is our bookkeeping service provider. Therefore, the shares issued by us are to be kept in deposit accounts, under the investor’s name.
As an alternative, the investor may also deposit shares in the B3 via a custodian institution authorized by the CVM. In such case, the B3, as central depositary, holds the shares under its name but controls the ownership of the securities through a structure of deposit accounts kept under the investors’ name. There is no distinction in the rights and obligations of stockholders, regardless of whether their shares are deposited with a broker-dealer or with B3.
Redemption and withdrawal rights
Our common shares and our preferred shares are not redeemable, except upon delisting. Pursuant to Brazilian Corporate Law, however, the approval of certain matters entitles a dissenting stockholder to withdraw from the company, such right expiring thirty days after publication of the minutes of the applicable stockholders’ meeting. This withdrawal may occur under certain conditions upon reimbursement of the value of such holder’s shares, calculated based on criteria set forth under Brazilian Corporate Law. Also, in accordance with Brazilian Corporate Law, we are entitled to reconsider any resolution that gives rise to a withdrawal within ten days following the expiration of the withdrawal period, if such exercise of withdrawal rights jeopardizes our financial stability.
Withdrawal rights are not available to stockholders whose shares have liquidity and are actively traded in the stock market in cases of merger or takeover or in case the company elects to take part in a group of companies.
Common and preferred shares should be reimbursed upon cancellation of their registration at their value, calculated based on the criteria set forth under Brazilian Corporate Law. If the resolution that gave rise to withdrawal rights was approved more than 60 days after the date when the last balance sheet was approved, the stockholder may demand that his shares be redeemed at a value based on a new balance sheet, dated up to 60 days after the date of the general meeting.
179
Threshold above which shareholder ownership must be disclosed
Brazilian regulations require that any person or group of persons representing the same interest that has directly or indirectly acquired an interest corresponding to 5.0% of any type or class of shares of a publicly traded company must disclose its share ownership to the CVM and to Brazilian stock exchanges. Any subsequent increase or decrease of 5.0% or more in ownership of any type or class of shares must be similarly disclosed.
Our Governance
Our governance structure
The main goal of our corporate governance is to create an efficient set of incentive and monitoring mechanisms to ensure that management members are always aligned with our stockholders’ best interests in a sustainable way. In order to achieve this goal, we have set up decision-making bodies and institutionalized procedures to align management with our meritocratic, performance-focused and long-term value-creation culture.
The three main pillars of our corporate governance structure are:
| | | | |
IUPAR (Itaú Unibanco Participações) | | - Alignment and union among shareholders; - Group’s vision, mission and values; - Significant mergers and acquisitions; - Performance evaluation and admission of family members; and - Discussion and approval of the long-term strategy. | | Family Control With a long-term strategic vision |
Itaú Unibanco Board of Directors | | - Definition and monitoring of the company’s strategy; - Mergers and acquisitions; - Monitor the Executive Committee’s performance - Nomination of officers (meritocracy); - Budget approval; - Definition and monitoring of incentive and compensation models and goal settings; - Supervision of the technologies strategy; - Definition of the meritocracy policies; and - Business operation supervision. | | Value Creation Strategy definition |
Executive Committee | | - Implementation of Board of Director’s guidelines and goals; - Business operation and strategies for products and segments; - Ensure better allocation and management of financial, operational and human resources; - Monitoring of market, credit and operational risks; and - Operate the Bank in purpose of value creation | | Professional management Implementation of strategy and day-to-day management |
180
Our Policies
We adopt policies in order to formalize and consolidate existing structures to protect the interests of our employees, management members and stockholders, as well as promote our culture and values, always seeking to run business in an ethical and transparent manner, preventing and fighting fraud and illegal acts and ensuring our business sustainability.
Below we present the main documents related to our corporate governance, including our Bylaws, as approved by our Board of Directors.
| | • | | Bylaws: establish our principles and rules of operations, such as the definition of our corporate purpose, composition of capital stock, responsibilities of statutory bodies, appropriation of net income, and our listing segment in stock exchanges, among others. |
| | • | | Internal Charters: we have internal charters that regulate the operation of our Board of Directors, Board of Directors Committees, Board of Officers and Fiscal Council, in conformity with applicable legislation and best corporate governance practices. |
| | • | | Policy for the Nomination of Members of the Board of Directors, Committees Reporting to the Board of Directors and the Executive Board: this policy establishes minimum requirements for the nomination of members to the Board of Directors, Board of Directors committees and our Board of Officers. |
| | • | | Code of Ethics: applies to all of our employees, members of the Board of Directors and officers and is based on principles that support an organizational culture focused on the enhancement of people, strict compliance with rules and regulations and continuous development. |
| | • | | Policy for Trading Itaú Unibanco S.A. Securities: the purpose of this policy is to establish guidelines and procedures to be followed by us and bound persons, to ensure transparency in the trading of our securities by all interested parties, without privileging some to the detriment of others. |
| | • | | Transactions with Related Parties: the purpose of this policy is to establish rules and consolidate procedures to be followed in related party transactions, ensuring equality and transparency and as such, ensuring stockholders, investors and other stakeholders that we are in compliance with best corporate governance policies. |
| | • | | Corporate Policy and Procedure Disclosure of Material Information: this policy address the public disclosure of material information and the requirement to keep such information confidential until disclosed in accordance with applicable rules. |
| | • | | Relationship Policy with Public Officials and Contracting with Bodies, Entities and Companies of Public Administration: this policy guides the relationship with public officials and public entities with respect to our institutional interests and the financial system in general, in an organized manner. |
| | • | | Corporate Governance Policy: this policy consolidates the Corporate Governance principles and practices adopted by us so that they can be disseminated throughout our company. |
| | • | | Anti-Corruption Corporate Policy: the purpose of this policy is to establish rules for avoiding conflicts of interests in processes related to donations and sponsorship and in relationships with clients, suppliers and partners, in the public and private sectors, and also to establish guidelines and procedures to prevent and combat corruption, such as training, communication, consultation and complaint channels. |
Our Practices
Given that our shares have traded on the São Paulo Stock Exchange (currently B3) since 1944 and our ADSs have traded on the NYSE since 2002, we are required to comply with the rules of the CVM, the B3, the SEC and the NYSE.
The following timeline illustrates the main Corporate Governance practices adopted over recent years:
181
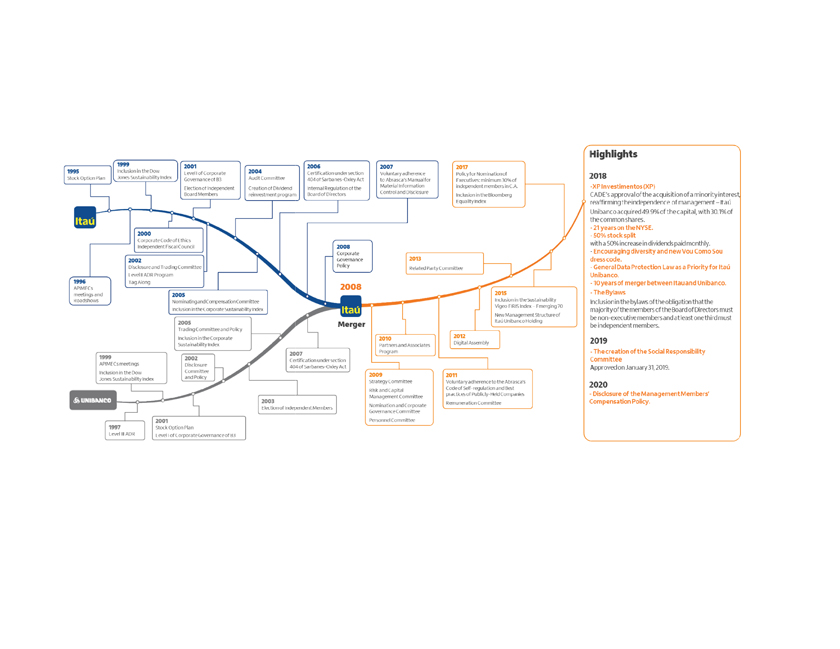
182
Management structure
Our management is structured to ensure that matters are extensively discussed and decisions are made on a collective basis. The information below concerns our management bodies, their main duties and composition:
183
| | | | |
| | | Duties | | Composition |
General Stockholder’s Meeting | | The company’s supreme body that brings stockholders together, either on an ordinary or extraordinary basis, through a convening notice as set forth by law. Annual Stockholders’ Meeting: It is held in the first four-month period of each year, to review, discuss and vote the financial statements submitted by management, resolve on the allocation of net income for the year, payout of dividends and election of members to the Board of Directors and the Fiscal Council. Extraordinary Stockholders’ Meeting: It is held when convened to resolve on key matters that are not the exclusive responsibility of the Annual General Stockholders’ Meeting. | | The Annual Stockholders’ Meeting is open on first call with the attendance of stockholders representing at least 25% of voting capital. Any amendments to the Bylaws should be resolved on at an Extraordinary Stockholders’ Meeting, which will be open on first call with the attendance of stockholders representing at least two thirds (2/3) of the voting capital. Our meetings are held with a quorum representing approximately 90% of our voting capital. |
Fiscal Council | | An independent body operating independently from Management, our external auditors and Audit Committee. It supervises the activities of our Management, examines and opines on our financial statements for the year ended, among other duties established by Brazilian law. | | It is composed of 3 to 5 members elected annually by our stockholders, one of whom by minority preferred stockholders. |
Board of Directors | | It is responsible for establishing our general business guidelines, including for our subsidiaries, and holds ordinary meetings eight times per year and extraordinary meetings when necessary. | | It is composed of 12 members, all non-executive, and of whom 6 are deemed independent (50%). The turnover of the Board members is carried out in accordance with our bylaws, which provide for the ineligibility of persons who have reached the age of 70. Members are elected annually by our stockholders. |
Board of Officers | | It implements the guidelines proposed by the Board of Directors. Officers manage our daily business activities, ensuring the best allocation and management funds to accomplish the goals we have set. | | It is composed of 5 to 30 members, including Chief Executive Officer and Officers, in conformity with the guidelines established by the Board of Directors for filling these positions. Members are elected annually by the Board of Directors. Each member elected to our Board of Officers must be approved by the Central Bank. According to Brazilian law, an acting officer retains their position until they are reelected or a successor takes office. |
Disclosure and Trading Committee | | This Committee is responsible for: Managing the Policy for the Disclosure of Material information and the Policy for Trading Itaú Unibanco Holding S.A. Securities. Carrying out internal actions intendent to improve the information flow. Promoting the ethical conduct of our management members and employees. Ensuring transparency, quality, equality and security of the information provided to our stockholders, investors and other capital market players. | | It is composed of: Members of the Board of Directors. Members of the Board of Officers of Itaú Unibanco Holding or any other Itaú Unibanco Group company. Professionals of proven knowledge in the capital markets area. Investors Relations Officer (a permanent member of the Committee). |
184
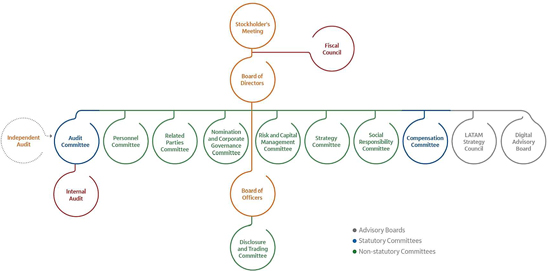
None.
Individuals or legal entities domiciled outside Brazil may own our stock through ADSs negotiated in a U.S. Exchange or through direct investments in the Brazilian Market.
However, the right to convert dividend payments and proceeds from the sale of our shares in the Brazilian Market, into foreign currency and to remit such amounts abroad is subject to compliance with requirements of Brazilian foreign investment and foreign currency legislation. This legislation generally requires, among other things, documentary evidence that establishes the legality, the legitimacy and the economic validity of the exchange operation and that the relevant investment was registered with the Central Bank and the CVM, as applicable.
In case the investment in our stock is made through ADS, the ADS holders benefit from the electronic certificate of foreign capital registration obtained in Brazil by the custodian of the preferred shares underlying the ADSs, which permits the depositary bank to convert dividends and other distributions with respect to the preferred shares underlying the ADSs into foreign currency and remit the proceeds abroad.
In case the investment in our stock is made directly in the Brazilian Market, such investment needs to be registered with the Central Bank either as (i) a foreign direct investment, the Electronic Declaratory Registration of Foreign Direct Investment (RDE-IED), or (ii) a portfolio investment, the Electronic Declaratory Registration of Portfolio (RDE – Portfolio).
The registration as foreign direct investment (RDE-IED) enables non-resident investors to hold stock of companies, although it, limits the ability of the investor to negotiate such stocks in the Brazilian Capital Markets. On the other hand, the registration as portfolio investment (RDE – Portfolio) entitles certain foreign investors to invest not only in stocks, but also in other financial assets and securities, and to engage in a variety of transactions available in the Brazilian financial and capital markets, provided that certain requirements of the regulation are fulfilled.
Registration under RDE – Portfolio affords favorable tax treatment to non-resident investors who are not residents or domiciled in tax haven jurisdictions, as defined by Brazilian tax laws.
185
Taxation Considerations for ADS Holders
This summary is based upon tax laws of Brazil and the United States in effect as of the date hereof, and contains a description of the main Brazilian and U.S. federal income tax considerations regarding the acquisition, ownership and disposition of our preferred shares or ADSs, but it does not purport to be a comprehensive description of all the tax considerations that may be relevant to these matters, considering that laws are subject to change and to differing interpretations (possibly with retroactive effect). Although there is no income tax treaty between Brazil and the United States in place, the tax authorities of the two countries have agreed in applicable provisions of reciprocal tax treatment as to compensation of tax withheld at the source country in the residence country. No assurance can be given, however, as to whether or when a treaty will enter into force or how it will affect a U.S. Holder (as defined below) of our preferred shares or ADSs.
Prospective purchasers of our preferred shares or ADSs should consult their own tax advisors as to the tax consequences of the acquisition, ownership and disposition of our preferred shares and ADSs, including, in particular, the effect of any non-U.S., non-resident, state or local tax laws.
INVESTORS ARE STRONGLY ADVISED TO CONSULT THEIR OWN TAX ADVISORS AS TO BRAZILIAN TAX CONSIDERATIONS RELATING TO THE PURCHASE, OWNERSHIP AND DISPOSITION OF OUR PREFERRED SHARES OR ADSs CONSIDERING THEIR PARTICULAR FACTS AND CIRCUMSTANCES, AS WELL AS THE EFFECT OF ANY NON-BRAZILIAN TAX LAWS.
Brazilian Tax Considerations
The following discussion summarizes the main Brazilian tax consequences related to the acquisition, ownership and disposition by Non-Resident Holders of our preferred shares or ADSs.
Non-Resident Holders Resident or Domiciled in Tax Haven Jurisdictions
Under Brazilian tax laws, as regulated by Article 1 of Normative Instruction No. 1,037 of June 4, 2010, as amended, a “tax haven” is defined as a country or location (a) that does not impose any income tax or where the maximum income tax rate is 20%, or 17% as further detailed below (b) where the local legislation imposes restrictions on disclosure regarding shareholder composition or investment ownership. A list of current tax haven jurisdictions has been published per such Normative Instruction. Non-Resident Holders resident or domiciled in tax haven jurisdictions may be subject to withholding tax in Brazil at higher rates than Non-Resident Holders not resident or domiciled in tax havens, as described below.
Additionally, on June 24, 2008, Law No. 11,727 introduced the concept of “privileged tax regime,” which is defined as a tax regime that (i) does not tax income or taxes it at a maximum rate lower than 20%; (ii) grants tax benefits to non-resident entities or individuals (a) without the requirement to carry out substantial economic activity in the country or dependency or (b) contingent to the non-exercise of substantial economic activity in the country or dependency; (iii) does not tax or that taxes income generated abroad at a maximum rate lower than 20%; or (iv) does not provide access to information related to shareholding composition, ownership of assets and rights or economic transactions carried out. A list of current privileged tax jurisdictions has been published on Normative Instruction 1,037 and, currently, withholding rates for Non-Resident Holders resident or domiciled in privileged tax regimes are the same applicable for Non-Resident Holders non domiciled in tax haven jurisdictions.
On November 28, 2014, the Brazilian tax authorities issued Ordinance No. 488, which decreased these minimum thresholds from 20% to 17% in certain cases. Under Ordinance No. 488, the 17% threshold applies only to countries and regimes aligned with international standards of fiscal transparency, in accordance with rules to be established by the Brazilian tax authorities.
Notwithstanding the above, we recommend that you consult your own tax advisors regarding the consequences of the implementation of Law No. 11,727, Normative Ruling No. 1,037 and of any related Brazilian tax law or regulation concerning tax havens and privileged tax regimes.
186
Income Tax for Non-Resident Holders
Law No. 13,259 enacted on March 16, 2016 increased the flat 15% rate of the income tax levied on capital gains derived by individuals, certain corporations and foreign investors (individuals and corporations) as a result of the disposal of assets and rights in general exceeding R$5 million, by adopting a system of progressive rates that may reach a 22.5% tax rate (for positive results exceeding R$30 million). Since capital gains arising from transactions executed through a securities exchange are subject to specific tax rules, which are not included under the scope of Law No. 13,259, it is possible to sustain the position that the provisions of this rule should not apply to such transactions, applying a fixed rate of 15%. This rule applies since January 1, 2017. If the stockholder is a resident of or domiciled in a tax haven jurisdiction, the capital gains are subject to the withholding income tax at a 25% rate, while gains arising from transactions executed through a securities exchange are subject to a 15% withholding income tax.
Taxation of Dividends
Payment of dividends derived from profits generated after January 1, 1996, including dividends paid in kind, are not subject to withholding tax in Brazil.
Taxation of Interest on Net Equity
Law No. 9,249, dated December 26, 1995, as amended, allows a Brazilian corporation, such as ourselves, to also make payments of interest on net equity in addition to dividend distributions. Currently, payments of interest on net equity are subject to withholding tax at a rate of 15%, or 25% in the case of a Non-Resident Holder that is resident or domiciled in a tax haven jurisdiction.
Taxation of Gains
Sales or Other Dispositions of ADSs
Gains realized outside Brazil by a Non-Resident Holder from the sale or other disposal of ADSs to another Non-Resident Holder should not be subject to Brazilian taxation. However, according to Law No. 10,833, dated December 29, 2003, as amended, the disposition of assets located in Brazil by a Non-Resident Holder may be tax exempt, if carried in the stock exchange, or subject to Brazilian withholding tax at a 15% flat rate or a progressive rate varying from 15% to 22.5% depending on the kind of investment made into Brazil and the location where the Non-Resident Holder is resident or domiciled (also, a 25% rate may apply if the foreign beneficiary is resident or domiciled in a jurisdiction deemed to be a tax haven for Brazilian tax purposes).
Although the referred Law does not clarify what is considered to be an asset located in Brazil, ADSs generally should not be considered to be assets located in Brazil for purposes of such Law, because they represent securities issued and negotiated in an offshore exchange market. It is important to note that even if ADSs were considered to be assets located in Brazil, Non-Resident Holders not resident or domiciled in tax haven jurisdictions may still apply for exemption from capital gains tax according to Article 81 of Law No. 8,981, dated January 20, 1995, as amended.
Conversion of Our Preferred Shares into ADSs
The deposit by a Non-Resident Holder of our preferred shares with the depositary for conversion into ADSs may be subject to Brazilian capital gains tax, if such Non-Resident Holder is resident or domiciled in a tax haven jurisdiction or if such preferred shares have not been registered under the Central Bank according to CMN Resolution No. 4,373, dated September 29, 2014, effective as of March 30, 2015 (former CMN Resolution No. 2,689, dated January 26, 2000, and CMN Resolution No. 1,927, dated May 18, 1992), as amended. In those cases, the positive difference between the acquisition cost of such preferred shares or the amount otherwise previously registered under the Central Bank and the average price of such preferred shares, according to the mentioned CMN Resolution No. 4,373/14), may be considered taxable capital gain, and may be subject to income tax. Please refer to “Investments of Foreign Investors”, for further details.
187
Non-Resident Holders that are resident or domiciled in tax haven jurisdictions may be subject to capital gain tax at a 25% rate on sale or transfer of shares outside of the financial and capital markets upon such a conversion or 15% if the sale or transfer of shares is carried on the financial and capital markets.On the other hand, when Non-Resident Holders that are not resident or domiciled in tax haven jurisdictions deposit preferred shares registered according to CMN Resolution No. 4,373/14 in exchange for ADSs, such deposit should not be subject to capital gain tax.
Sales or Other Dispositions of Our Preferred Shares
Non-Resident Holders not resident or domiciled in tax haven jurisdictions that register their portfolio according to CMN Resolution No. 4,373/14 may benefit from a special capital gains tax exemption available for the sale of securities in the Brazilian stock exchange. On the other hand, sale of shares not registered according to CMN Resolution No. 4,373/14 or made outside of Brazilian stock exchanges is generally subject to 15% capital gain tax.
Such special treatment is not applicable to Non-Resident Holders resident or domiciled in tax haven jurisdictions, who are subject to general taxation rules applicable to Brazilian residents on the sale of their investments in the financial markets, including stock exchanges and over-the-counter markets. In these cases, the tax rate is generally 15%. If such Non-Resident Holders sell shares outside of the financial and capital markets, the income taxation rate will instead be of 25%. Any exercise of preemptive rights related to our preferred shares (and in connection with the ADS program) will not be subject to Brazilian taxation. The gains from the sale or assignment of preemptive rights will be subject to the Brazilian income tax according to the same rules applicable to disposition of shares or ADSs.
Tax on Financial Transactions IOF/Exchange (IOF/FX) and IOF/Securities
According to the Decree No. 6,306/2007, and further amendments, Tax on Financial Transactions may levy on some foreign exchange transactions.
The acquisition of ADSs and preferred shares currently are not subject to IOF/Exchange. We stress that that IOF/Exchange may change via Presidential Decree, with immediate effects.
As of December 24, 2013, pursuant to Decree No. 8,165, the IOF/Securities tax levied on the assignment of shares traded in the Brazilian stock exchange market in order to permit the issuance of depositary receipts to be negotiated overseas has been reduced to 0% rate.
Other Brazilian Taxes
There are no Brazilian inheritance, gift or succession taxes applicable to the transfer of ownership or title (ownership without beneficial interest) of our preferred shares or ADSs or the vesting of free beneficial interest of such shares or ADSs outside Brazil by a Non-Resident Holder, except for gift, inheritance and legacy taxes that are levied by some states of Brazil if bestowed in such states of Brazil or abroad when the receiver is resident or domiciled in these states of Brazil. There are no Brazilian stamp, issue, registration, or similar taxes or duties payable to Non-Resident Holders of our preferred shares or ADSs.
U.S. Federal Income Tax Considerations
The following is a general discussion of certain U.S. federal income tax considerations relating to the purchase, ownership and disposition of our preferred shares or ADSs by U.S. Holders (as defined below) who hold such preferred shares or ADSs as capital assets within the meaning of section 1,221 of the U.S. Internal Revenue Code of 1986, as amended, or the Code. This discussion does not address all of the U.S. federal income tax considerations that may be relevant to specific U.S. Holders in light of their particular circumstances or to U.S. Holders subject to special treatment under U.S. federal income tax law, such as banks, insurance companies, retirement plans, regulated investment companies, real estate investment trusts, dealers in securities, brokers, tax-exempt entities, certain former citizens or residents of the United States, U.S. Holders that hold our preferred shares or ADSs as part of a “straddle,” “hedging,” “conversion” or other integrated transaction, U.S. Holders that mark their securities to market for U.S. federal income tax purposes, U.S. Holders that have a functional currency
188
other than the U.S. dollar, U.S. Holders that own (or are deemed to own) 10% or more (by voting power or value) of our shares or U.S. Holders that receive our preferred shares or ADSs as compensation. In addition, this discussion does not address the effect of any U.S. state, local or non-U.S. tax considerations or any U.S. estate, gift or alternative minimum tax considerations.
This discussion is based on the Code, U.S. Treasury regulations promulgated or proposed thereunder and administrative and judicial interpretations thereof, all as in effect on the date hereof, and all of which are subject to change, possibly with retroactive effect, or subject to differing interpretations. This discussion also assumes that each obligation in the deposit agreement and any related agreement will be performed in accordance with its terms.
For purposes of this discussion, the term “U.S. Holder” means a beneficial owner of our preferred shares or ADSs that is, for U.S. federal income tax purposes, (i) an individual who is a citizen or resident of the United States, (ii) a corporation (or entity treated as a corporation) created or organized in or under the laws of the United States, any state thereof, or the District of Columbia, (iii) an estate the income of which is subject to U.S. federal income tax regardless of its source, or (iv) a trust (x) with respect to which a court within the United States is able to exercise primary supervision over its administration and one or more U.S. persons have the authority to control all of its substantial decisions or (y) that has in effect a valid election under applicable U.S. Treasury regulations to be treated as a U.S. person.
If an entity or arrangement treated as a partnership for U.S. federal income tax purposes invests in our preferred shares or ADSs, the U.S. federal income tax treatment of a partner will depend in part upon the status and activities of such entity or arrangement and the particular partner. Any such entity and partners in such entity or arrangement should consult their own tax advisors regarding the U.S. federal income tax considerations applicable to them relating to the purchase, ownership and disposition of such preferred shares or ADSs, especially in light of recent changes to U.S. tax law.
INVESTORS ARE STRONGLY ADVISED TO CONSULT THEIR OWN TAX ADVISORS AS TO THE U.S. FEDERAL, STATE AND LOCAL TAX CONSIDERATIONS RELATING TO THE PURCHASE, OWNERSHIP AND DISPOSITION OF OUR PREFERRED SHARES OR ADSs IN LIGHT OF THEIR PARTICULAR CIRCUMSTANCES, AS WELL AS THE EFFECT OF ANY NON-U.S. TAX LAWS.
Except where specifically described below, this discussion assumes that we are not and will not be a passive foreign investment company, or a PFIC, for U.S. federal income tax purposes. Please see the discussion under “Passive Foreign Investment Company Considerations” below.
Treatment of ADSs
A U.S. Holder of ADSs generally will be treated for U.S. federal income tax purposes as the owner of such U.S. Holder’s proportionate interest in our preferred shares held by the depositary (or its custodian) that are represented and evidenced by such ADSs. Accordingly, any deposit or withdrawal of our preferred shares in exchange for ADSs generally will not result in the realization of gain or loss to such U.S. Holder for U.S. federal income tax purposes.
Distributions
A U.S. Holder that receives a distribution with respect to our preferred shares (whether held through ADSs or directly), including payments of interest on net equity as described above under “Brazilian Tax Considerations – Taxation of Interest on Net Equity,” generally will be required to include the amount of such distribution (without reduction for any Brazilian withholding tax with respect thereto) in gross income as a dividend to the extent of our current or accumulated earnings and profits (as determined for U.S. federal income tax purposes) on the date such U.S. Holder (or the depositary, in the case of ADSs) actually or constructively receives such distribution, and will not be eligible for the dividends received deduction allowed to corporations. A distribution on our preferred shares (whether held through ADSs or directly) in excess of current and accumulated earnings and profits generally will be treated first as a non-taxable return of capital to the extent of such U.S. Holder’s basis in such preferred shares or ADSs, as the case may be, and thereafter as gain from the sale or exchange of such preferred shares or ADSs (which will be treated in the same manner described below under “Sale, Exchange or Other Disposition of Preferred Shares or ADSs”). We have not maintained and do not plan to maintain calculations of earnings and profits for U.S. federal income tax purposes. As a result, a U.S. Holder may need to include the entire amount of any such distribution in income as a dividend.
189
The U.S. dollar value of any distribution on our preferred shares (whether held through ADSs or directly) made in Brazilian reais generally should be calculated by reference to the exchange rate between the U.S. dollar and the Brazilian real in effect on the date of receipt of such distribution by the U.S. Holder (or the depositary, in the case of ADSs), regardless of whether the reais so received are in fact converted into U.S. dollars. Such U.S. Holder generally will have a basis in such reais equal to the U.S. dollar value of such reais on the date of receipt. Any gain or loss on a subsequent conversion or other disposition of such reais by such U.S. Holder generally will be treated as ordinary income or loss and generally will be income or loss from sources within the United States.
Distributions treated as dividends that are received by certain non-corporate U.S. persons (including individuals) in respect of shares of a non-U.S. corporation (other than a corporation that is, in the taxable year during which the distributions are made or the preceding taxable year, a PFIC) that is readily tradable on an established securities market in the United States generally qualify for a 20% reduced maximum tax rate (and potentially additional tax discussed below under “Medicare Tax”) so long as certain holding period and other requirements are met. Since the ADSs are listed on the NYSE, unless we are treated as a PFIC with respect to a U.S. Holder, dividends received by such a U.S. Holder in respect of the ADSs should qualify for the reduced rate. Based on existing guidance, it is not entirely clear whether dividends received by such a U.S. Holder of our preferred shares in respect of such shares will qualify for the reduced rate, because our preferred shares are not themselves listed on a United States exchange. Special rules apply for purposes of determining the recipient’s investment income (which may limit deductions for investment interest) and foreign income (which may affect the amount of U.S. foreign tax credit) and to certain extraordinary dividends. Each U.S. Holder that is a non-corporate taxpayer should consult its own tax advisor regarding the possible applicability of the reduced tax rate and the related restrictions and special rules.
Sale, Exchange or Other Disposition of Preferred Shares or ADSs
Upon a sale, exchange or other taxable disposition of our preferred shares or ADSs, a U.S. Holder generally will recognize gain or loss for U.S. federal income tax purposes in an amount equal to the difference, if any, between the amount realized on such sale, exchange or other taxable disposition and such U.S. Holder’s adjusted tax basis in such preferred shares or ADSs. A U.S. Holder’s adjusted tax basis in such preferred shares or ADSs generally will be its U.S. dollar cost. Any gain or loss so recognized generally will be long-term capital gain or loss if such U.S. Holder has held such preferred shares or ADSs for more than one year at the time of such sale, exchange or other taxable disposition. Certain non-corporate U.S. Holders are entitled to preferential treatment for net long-term capital gains. The ability of a U.S. Holder to offset capital losses against ordinary income is limited.
A U.S. Holder that receives Brazilian reais from the sale, exchange or other disposition of our preferred shares (whether held through ADSs or directly) generally will realize an amount equal to the U.S. dollar value of such reais on the settlement date of such sale, exchange or other taxable disposition if (i) such U.S. Holder is a cash basis or electing accrual basis taxpayer and our preferred shares are treated as being “traded on an established securities market” or (ii) such settlement date is also the date of such sale, exchange or other taxable disposition. Such U.S. Holder generally will have a basis in such reais equal to the U.S. dollar value of such reais on the settlement date. Any gain or loss on a subsequent conversion or other taxable disposition of such reais by such U.S. Holder generally will be treated as ordinary income or loss and generally will be income or loss from sources within the United States. Each U.S. Holder should consult its own tax advisor regarding the U.S. federal income tax consequences of receiving reais from the sale, exchange or other taxable disposition of our preferred shares in cases not described in the first sentence of this paragraph.
Foreign Tax Credit Considerations
Distributions on our preferred shares (whether held through ADSs or directly), including payments of interest on net equity as described above under “Brazilian Tax Considerations – Taxation of Interest on Net Equity,” that are treated as dividends, before reduction for any Brazilian withholding taxes with respect thereto, generally will be included in the gross income of a U.S. Holder. Thus, such U.S. Holder may be required to report income for such purposes in an amount greater than the actual amount such U.S. Holder receives in cash. Distributions treated as dividends generally will constitute income from sources outside the United States and generally will be categorized for U.S. foreign tax credit purposes as “passive category income” or, in the case of some U.S. Holders, as “general category income.” Subject to applicable limitations and holding period requirements, a U.S. Holder may be eligible to elect to claim a U.S. foreign tax credit against its U.S. federal income tax liability for any such Brazilian withholding taxes. Under current law, gains resulting from a sale or other disposal of our preferred shares or ADSs may be subject to Brazilian income or withholding taxes. A U.S. Holder’s use of a foreign
190
tax credit with respect to any such Brazilian income or withholding taxes could be limited, as such gain generally will constitute income from sources within the United States. A U.S. Holder that does not claim a U.S. foreign tax credit generally may instead claim a deduction for any such Brazilian taxes, but only for a taxable year in which such U.S. Holder elects to do so with respect to all non-U.S. income taxes paid or accrued by such U.S. Holder in such taxable year. Foreign currency exchange gain or loss generally will constitute income from sources within the United States. The rules relating to foreign tax credits are complex, and each U.S. Holder should consult its own tax advisor regarding the application of such rules.
Passive Foreign Investment Company Considerations
Special U.S. federal income tax rules apply to U.S. persons owning shares of a PFIC. A non-U.S. corporation generally will be classified as a PFIC for U.S. federal income tax purposes in any taxable year in which, after applying relevant look-through rules with respect to the income and assets of certain subsidiaries, either: at least 75% of its gross income is “passive income”, or on average at least 50% of the gross value of its assets is attributable to assets that produce passive income or are held for the production of passive income.
For this purpose, passive income generally includes, among other things, dividends, interest, rents, royalties, gains from the disposition of passive assets and gains from commodities transactions.
The application of the PFIC rules to banks is unclear under present U.S. federal income tax law. Banks generally derive a substantial part of their income from assets that are interest bearing or that otherwise could be considered passive under the PFIC rules. The IRS, has issued a notice, and has proposed regulations, that exclude from passive income any income derived in the active conduct of a banking business by a qualifying foreign bank, also known as the Active Bank Exception. The IRS notice and proposed regulations have different requirements for qualifying as a foreign bank, and for determining the banking income that may be excluded from passive income under the Active Bank Exception. Moreover, the proposed regulations have been outstanding since 1994 and will not be effective unless finalized.
Based on estimates of our current and projected gross income and gross assets, we do not believe that we will be classified as a PFIC for our current or future taxable years. The determination of whether we are a PFIC, however, is made annually and is based upon the composition of our income and assets (including income and assets of entities in which we hold at least a 25% interest), and the nature of our activities (including our ability to qualify for the Active Bank Exception).
Because final regulations have not been issued and because the notice and the proposed regulations are inconsistent, our status under the PFIC rules is subject to considerable uncertainty. While we conduct, and intend to continue to conduct, a significant banking business, there can be no assurance that we will satisfy the specific requirements for the Active Bank Exception under either the IRS notice or the proposed regulations. Accordingly, U.S. Holders could be subject to U.S. federal income tax under the rules described below.
If we are treated as a PFIC for any taxable year during which a U.S. Holder owns our preferred shares or ADSs, any gain realized on a sale or other taxable disposition of such preferred shares or ADSs and certain “excess distributions” (generally distributions in excess of 125% of the average distribution over the prior three-year period, or if shorter, the holding period for such preferred shares or ADSs) will be treated as ordinary income and will be subject to tax as if (i) the excess distribution or gain had been realized ratably over the U.S. Holder’s holding period for such preferred shares or ADSs, (ii) the amount deemed realized in each year had been subject to tax in each such year at the highest marginal rate for such year (other than income allocated to the current period or any taxable period before we became a PFIC, which would be subject to tax at such U.S. Holder’s regular ordinary income rate for the current year and would not be subject to the interest charge discussed below), and (iii) the interest charge generally applicable to underpayments of tax had been imposed on the taxes deemed to have been payable in those years.
If we are treated as a PFIC and, at any time, we invest in non-U.S. corporations that are classified as PFICs, or Subsidiary PFICs, U.S. Holders generally will be deemed to own, and also would be subject to the PFIC rules with respect to, their indirect ownership interest in any such Subsidiary PFIC. If we are treated as a PFIC, a U.S. Holder could incur liability for the deferred tax and interest charge described above if either (i) we receive a distribution from, or dispose of all or part of our interest in, any such Subsidiary PFIC or (ii) such U.S. Holder disposes of all or part of our preferred shares or ADSs.
191
We do not expect to provide information that would allow U.S. Holders to avoid the foregoing consequences by making a “qualified electing fund” election.
A U.S. Holder of shares in a PFIC (but possibly not a Subsidiary PFIC, as discussed below) may make a “mark-to-market” election, provided the PFIC shares are “marketable stock” as defined under applicable Treasury regulations (i.e., “regularly traded” on a “qualified exchange or other market”). Under applicable Treasury regulations, a “qualified exchange or other market” includes (i) a national securities exchange that is registered with the U.S. Securities and Exchange Commission or the national market system established under the Exchange Act or (ii) a foreign securities exchange that is regulated or supervised by a governmental authority of the country in which the market is located and meets certain trading, listing, financial disclosure and other requirements set forth in applicable Treasury regulations. The ADSs are traded on the NYSE and the preferred shares are traded on the B3. The NYSE constitutes a qualified exchange or other market. Although the IRS has not addressed whether the B3 meets the requirements to be treated as a qualified exchange or other market, we believe that the B3 should be so treated. PFIC shares traded on a qualified exchange or other market are regularly traded on such exchange or other market for any calendar year during which such shares are traded, other than in de minimis quantities, on at least 15 days during each calendar quarter. We cannot assure U.S. Holders that our preferred shares or ADSs will be treated as “marketable stock” for any taxable year.
The tax consequences that would apply if we were a PFIC would be different from those described above if a “mark-to-market” election is available and a U.S. Holder validly makes such an election as of the beginning of such U.S. Holder’s holding period. If such an election were made, such U.S. Holder generally would (i) include in gross income, entirely as ordinary income, an amount equal to the excess, if any, of the fair market value of our preferred shares or ADSs as of the close of each taxable year and such U.S. Holder’s adjusted tax basis in such preferred shares or ADSs, and (ii) deduct as an ordinary loss the excess, if any, of such U.S. Holder’s adjusted tax basis in such preferred shares or ADSs over the fair market value of such preferred shares or ADSs at the end of the taxable year, but only to the extent of the net amount previously included in gross income as a result of the mark-to-market election. Any gain from a sale, exchange or other disposition of our preferred shares or ADSs in a taxable year in which we were a PFIC would be treated as ordinary income, and any loss from such sale, exchange or other disposition would be treated first as ordinary loss (to the extent of any net mark-to-market gains previously included in income) and thereafter as capital loss. A U.S. Holder’s adjusted tax basis in such preferred shares or ADSs would increase or decrease by the amount of the gain or loss taken into account under the mark-to-market regime. Even if a U.S. Holder is eligible to make a mark-to-market election with respect to our preferred shares or ADSs, however, it is not clear whether or how such election would apply with respect to the shares of any Subsidiary PFIC that such U.S. Holder is treated as owning, because such Subsidiary PFIC shares might not be marketable stock. The mark-to-market election is made with respect to marketable stock in a PFIC on a shareholder-by-shareholder basis and, once made, can only be revoked with the consent of the IRS. Special rules would apply if the mark-to-market election is not made for the first taxable year in which a U.S. Holder owns any equity interest in us while we are a PFIC.
A U.S. Holder who owns our preferred shares or ADSs during any taxable year that we are treated as a PFIC generally would be required to file an information return with respect to us and any Subsidiary PFIC in which the U.S. Holder holds a direct or indirect interest. U.S. Holders should consult their own tax advisors regarding the application of the PFIC rules to our preferred shares or ADSs and the availability and advisability of making a mark-to-market election should we be considered a PFIC for any taxable year.
Medicare Tax
In addition to regular U.S. federal income tax, certain U.S. Holders that are individuals, estates or trusts are subject to a 3.8% tax on all or a portion of their “net investment income,” which may include all or a portion of their income arising from a distribution with respect to a preferred share or ADS and net gain from the sale, exchange or other disposition of a preferred share or ADS.
Backup Withholding and Information Reporting
Backup withholding at a rate of 24% and information reporting requirements generally apply to certain U.S. Holders with respect to payments made on or proceeds from the sale, exchange or other disposition of our preferred shares or ADSs. A U.S. Holder not otherwise exempt from backup withholding generally can avoid backup withholding by providing a
192
properly executed IRS Form W-9. Backup withholding is not an additional tax. Any amounts withheld under the backup withholding rules generally will be allowed as a refund or a credit against the U.S. Holder’s U.S. federal income tax liability, provided the required information is timely furnished by the U.S. Holder to the IRS.
Disclosure Requirements for Specified Foreign Financial Assets
Individual U.S. Holders (and certain U.S. entities specified in U.S. Treasury Department guidance) who, during any taxable year, hold any interest in any “specified foreign financial asset” generally will be required to file with their U.S. federal income tax returns certain information on IRS Form 8938 if the aggregate value of all such assets exceeds certain specified amounts. A “specified foreign financial asset” generally includes any financial account maintained with a non-U.S. financial institution and may also include our preferred shares or ADSs if they are not held in an account maintained with a financial institution. Substantial penalties may be imposed, and the period of limitations on assessment and collection of U.S. federal income taxes may be extended, in the event of a failure to comply. U.S. Holders should consult their own tax advisors as to the possible application to them of this filing requirement.
Disclosure Requirements for Certain U.S. Holders Recognizing Significant Losses
A U.S. Holder that claims significant losses in respect of our preferred shares or ADSs for U.S. federal income tax purposes (generally (i) US$10 million or more in a taxable year or US$20 million or more in any combination of taxable years for corporations or partnerships all of whose partners are corporations, (ii) US$2 million or more in a taxable year or US$4 million or more in any combination of taxable years for all other taxpayers, or (iii) US$50,000 or more in a taxable year for individuals or trusts) with respect to a foreign currency transaction, may be required to file Form 8886 for “reportable transactions.” U.S. Holders should consult their own tax advisors concerning any possible disclosure obligation with respect to our preferred shares or ADSs.
U.S. Foreign Account Tax Compliance Act (FATCA)
Please see “Item 4B, Business Overview – Taxes on Transactions Entered into by Itaú Unibanco Group – U.S. Foreign Account Tax Compliance Act (FATCA)” for more clarification on FATCA.
| 10F. | Dividends and Paying Agents |
Not applicable.
Not applicable.
We are subject to the reporting requirements under the Exchange Act, for foreign private issuers. Accordingly, we are required to file reports and other information with the SEC, including annual reports on Form 20-F and current reports on Form 6-K. You may inspect and copy reports and other information filed with the SEC at the public reference facilities maintained by the SEC at 100 F Street, N.E., Washington D.C. 20549. Copies of the materials may be obtained by mail from the Public Reference Room of the SEC at 100 F Street, N.E., Washington, D.C. 20549 at prescribed rates. The public may obtain information on the operation of the SEC’s Public Reference Room by calling the SEC in the United States at 1-800-SEC-0330. In addition, the SEC maintains an Internet website at www.sec.gov, from which you can electronically access those materials, including this annual report and the accompanying exhibits. The information contained on this website does not form part of this annual report on Form 20-F. We also file financial statements and other periodic reports with the CVM located at Rua Sete de Setembro, 111, Rio de Janeiro, Rio de Janeiro 20050-901, Brazil. The CVM maintains an Internet website at www.cvm.gov.br. The information contained on this website does not form part of this annual report on Form 20-F.
193
Copies of our Form 20-F will be available for inspection upon request to the Investor Relations department at our office at Avenida Engenheiro Armando de Arruda Pereira, 707, Torre Eudoro Villela, Piso Térreo – São Paulo – SP – 04309-010 – Brazil.
Investors may receive a hard copy of this annual report, including our audited consolidated financial statements for the last fiscal year, free of charge, by requesting a copy from our Investor Relations department, by e-mail, at investor.relations@itau-unibanco.com.br, indicating their contact information and their complete mailing address.
| 10I. | Subsidiary Information |
Not required.
| ITEM 11. | QUANTITATIVE AND QUALITATIVE DISCLOSURES ABOUT MARKET RISK |
Credit Risk
Overview
We define credit risk as the risk of loss associated with: failure by a borrower, issuer or counterparty to fulfill their respective financial obligations as defined in the contracts; value loss of a credit agreement resulting from a deterioration of the borrower’s, issuer’s or counterparty’s credit rating; reduction of profits or income; benefits granted upon subsequent renegotiation; or debt recovery costs.
Our credit risk management is intended to preserve the quality of the loan portfolio at levels compatible with our risk appetite, for each market segment in which we operate.
Governance
The credit risk management structure is based on principles described in the internal Policy for Credit Risk Management and Control:
| | • | | To follow the guidelines established by the Board of Directors, as well as to provide information for the Board to monitor the strategies and policies related to credit risk, so that there is a clear understanding of the tolerance for risk and the level of profitability that the institution expects to achieve for incurring the various credit risks; |
| | • | | Ensure that policies and strategies for credit risk management are clearly defined, establishing operating limits, risk mitigation mechanisms, and procedures designed to maintain credit risk exposure in line with our risk appetite; |
| | • | | Establish processes and instruments to measure, monitor and control risk, which allow quantifying the credit risk inherent to all products, portfolio concentrations and the impacts of potential changes in the economic environment; |
| | • | | To promote the continuous monitoring of our portfolio and the policies and strategies adopted, reporting to the executive board any indications of deterioration in the quality of operations and any exceptions to the established rules; and |
| | • | | To ensure the compliance of operations and controls with the rules and legislation in force in each country. |
Procedures and Key Indicators
The key assignments of the business units are (i) monitoring the portfolios under their responsibility, (ii) granting credit, considering approval levels, market conditions, macroeconomic prospects, changes in markets and products, and (iii) credit risk management aimed at making the business sustainable.
194
Our credit policy is based on internal factors, such as: client rating criteria, performance and evolution of our portfolio, default levels, return rates and allocated economic capital, among others; and also takes into account external factors such as: interest rates, market default indicators, inflation and changes in consumption, among others.
With respect to our individuals, small and medium companies, credit ratings are assigned based on statistical models (in the early stages of our relationship with a customer) and behavior score models (used for customers with whom we already have a relationship). For large companies, classification is based on information such as the counterparty’s economic and financial situation, its cash-generating capacity, and the business group to which it belongs, the current and prospective situation of the economic sector in which it operates. Credit proposals are analyzed on a case-by-case basis through the approval governance.
The concentrations are continuously monitored for economic sectors, and largest debtors, allowing preventive measures to be taken to avoid the violation of the established limits.
We also strictly control our credit exposure to clients and counterparties, acting to reverse occasional limit breaches. We may use contractual covenants for these purposes, such as the right to demand early payment or require additional collateral.
To measure credit risk, we take into account the probability of default by the borrower, issuer or counterparty, the estimated amount of exposure in the event of default, past losses from default and concentration of borrowers. Quantifying these risk components is part of the lending process, portfolio management and definition of limits.
The models used by us are independently validated, to ensure that the databases used in constructing the models are complete and accurate, and that the method of estimating parameters is adequate, so as to reduce the modeling risk and keep the models calibrated, so that they reflect risk parameters more accurately.
In compliance with the principles of the CMN Resolution 3,721, our credit risk management structure and institutional policy are approved by our Board of Directors and are applicable to all companies and subsidiaries in Brazil and abroad.
Please see “Note 32 – Risk and Capital Management” to our audited consolidated financial statements for further details about credit risk.
Loan Approval Process
Extensions of credit are approved based on policies at the business unit level, determined in accordance with the criteria of each department and our bank’s risk appetite. The decision to extend credit may be granted by means of a pre-approval process or the traditional approval mechanism, which is applied on a client by client basis. In both cases, decisions are made based on principles of credit quality such as credit rating supported by statistical models, percentage of income committed by/leverage of the client and credit restrictions determined by us and the market.
The business units prepare and maintain the policies and procedures of the credit cycle.
The credit granting process contemplates the use of credit protection services with the purpose of checking whether a client’s credit history includes information that could be considered an obstacle to granting a loan, such as assets blocked by court orders, invalid tax payer identification numbers, prior or pending debt restructuring or renegotiation processes and checks not honored due to insufficient funds.
The policy assessment process allows for the identification of potential risks and is intended to ensure that credit decisions make sense from both an economic and a risk perspective.
195
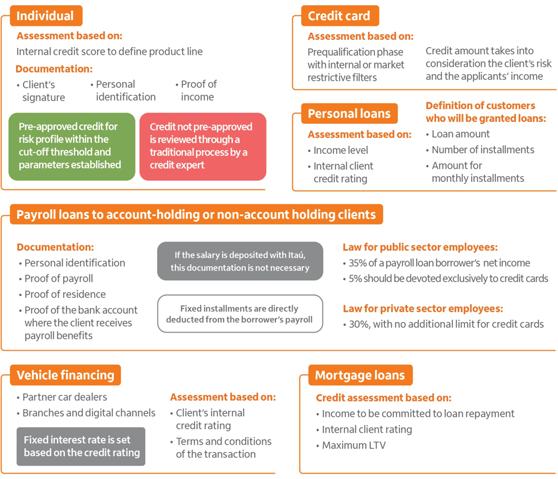
196
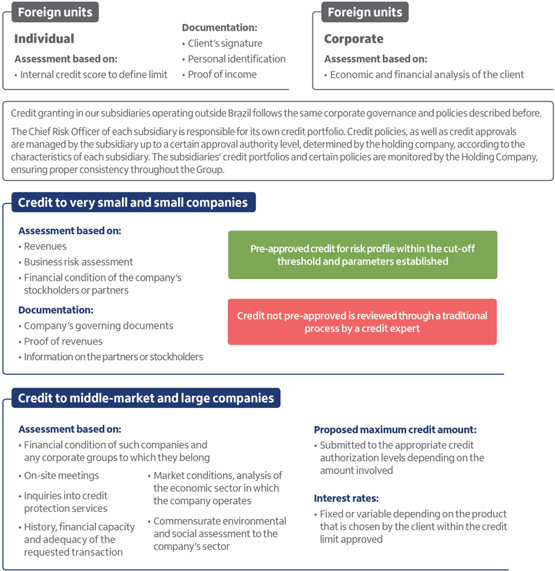
Please see “Note 32 – Risk and Capital Management, 1.1 Collateral and policies for mitigating credit risk”, to our audited consolidated financial statements for further details about our risk mitigating instruments.
Operational Risk
Overview
Operational risk is defined as the possibility of losses arising from failure, deficiency or inadequacy of internal processes, people or systems or from external events that affect the achievement of strategic, tactical or operational objectives. It includes legal risk associated with inadequacy or deficiency in contracts signed by us, as well as penalties due to noncompliance with applicable laws and damages to third parties arising from the activities undertaken by us.
Internally, we classify these exposures to risk within the following categories:
| | • | | Labor claims and deficient security in the workplace; |
197
| | • | | Inadequate practices related to clients, products and services; |
| | • | | Damage to our own physical assets or assets in use; |
| | • | | Interruption of our activities; |
| | • | | Failures in information technology systems; and |
| | • | | Failures in the performance, compliance with deadlines and management of our activities. |
Operational risk management includes conduct risk, which is subject to mitigating procedures to assess product design (suitability) and incentive models. The inspection area is responsible for fraud prevention. Irrespective of their origin, specific cases may be handled by risk committees and integrity and ethics committees.
Governance
We have a governance process that is structured through forums and corporate bodies composed of senior management, which report to the Board of Directors, with well-defined roles and responsibilities in order to segregate the business and management and control activities, ensuring independence between the areas and, consequently, well-balanced decisions with respect to risks. This is reflected in the risk management process carried out on a decentralized basis under the responsibility of the business areas and by a centralized control carried out by the internal control compliance and operational risk department, by means of methodologies, training courses, certification and monitoring of the control environment in an independent way.
The managers of the executive areas use corporate methods constructed and made available by the internal control, compliance and operational risk area. Among the methodologies and tools used are the self-evaluation and the map of our prioritized risks, the approval of processes, products, and system development products and projects, the monitoring of key risk indicators and the database of operational losses, guaranteeing a single conceptual basis for managing processes, systems, projects and new products and services.
Within the governance of the risk management process, the consolidated reports on risk monitoring, controls, action plans and operational losses are regularly presented to the business area executives.
Procedures and Key Indicators
Crisis Management and Business Continuity
The purpose of our Business Continuity Program is to protect our employees, ensure the continuity of the critical functions of our business lines, safeguard revenue and sustain both a stable financial market in which we operate and the trust of our clients and strategic partners in providing our services and products.
Our Business Continuity Program is composed of procedures for relocating and/or recovering operations in response to a variety of interruption levels and can be divided into four key elements:
| | • | | Disaster Recovery Plan: focused on the recovery of our primary data center, ensuring the continuity of the processing of critical systems within minimum pre-established periods; |
| | • | | Workplace Contingency Plan: employees responsible for carrying out critical business functions have alternative facilities from which to perform their activities in the event the buildings in which they usually work become unavailable. There are approximately 187 contingency dedicated seats that are fully equipped to meet the needs of critical business units with some technical dependency and the major part are performed from remote work (home office) in emergency situations; |
| | • | | Emergency Plan: procedures aimed at minimizing the effects of emergency situations that may impact our facilities, with a preventive focus; and |
| | • | | Processes Contingency Plan: alternatives (Plan B) to carry out the critical processes identified in the business areas. |
In order to keep the continuity solutions aligned with the business requirements the program applies the following tools to understand the institution:
| | • | | Business Impact Analysis (BIA): evaluates the criticality and resumption requirement of the processes that support the delivery of products and services. Through this analysis the businesses’ resumption priorities are defined; and |
198
| | • | | Threats and Vulnerabilities Analysis (AVA): identification of threats to the locations where our buildings are located. |
In addition, we have a corporate-wide Crisis Management Program, which is aimed at managing business interruption events, natural disasters, impacts of an environmental, social, and infrastructural/operational (including information technology) nature or of any other nature that jeopardize the image and reputation and/or viability of Itaú Unibanco’s processes with its employees, clients, strategic partners and regulators, with timely and integrated responses.
Our Corporate Business Continuity Policy is available on our Investor Relations website.
Liquidity risk
Overview
Liquidity risk is defined as the likelihood that an institution will not be able to effectively honor its expected and unexpected obligations, current and future, including those from guarantees commitment, without affecting its daily operations or incurring significant losses.
Governance
Our liquidity risk control is managed by an independent area and is responsible for determining the composition of our reserve, estimating cash flow and exposure to liquidity risk over several time horizons, and monitoring the minimum limits of the risk appetite in countries in which we operate. All activities are subject to assessment by an independent validation, internal controls and audit departments.
Procedures and Key Indicators
In accordance with the requirements of Central Bank regulations, we report monthly our Liquidity Risk Statements (DLR and DLP). Besides, the following items are periodically produced and submitted to the senior management for monitoring and decision support:
| | • | | Different scenarios for liquidity projections to decision support, also using stressed macroeconomics scenarios and reversed stress according to risk appetite; |
| | • | | Contingency plans for potential crisis, which contains procedures ordered by levels of execution, considering each countries’ characteristics; |
| | • | | Reports of risk indicators; and |
| | • | | Tracking, and monitoring of funding sources considering counterparty type, maturity and other aspects, considering the risk appetite. |
Market risk
Overview
Market risk is the possibility of losses resulting from fluctuations in the market value of positions held by a financial institution, including the risk of operations subject to variations in foreign exchange rates, interest rates, price indexes, equity and commodity prices.
Governance
Our policies and general market risk management framework are in line with the principles of CMN Resolution No. 4,557, and its subsequent amendments. These principles guide our approach to market risk control across our Itaú Unibanco Group.
Our market risk management strategy is aimed at balancing corporate business goals, taking into account, among other factors:
199
| | • | | Political, economic and market conditions; |
| | • | | The profile of our portfolio; and |
| | • | | Capacity to act in specific markets. |
The key principles underlying our market risk control structure are as follows:
| | • | | Provide visibility and comfort for all senior management levels that market risks assumed must be in line with our risk-return objectives; |
| | • | | Provide disciplined and informed dialogue on the overall market risk profile and its evolution over time; |
| | • | | Increase transparency as to how the business works to optimize results; |
| | • | | Provide early warning mechanisms to facilitate effective risk management, without obstructing the business objectives; and |
| | • | | Monitor and avoid risk concentration. |
Market risk is controlled by an area independent of the business units, which is responsible for the daily activities: (i) measuring and assessing risk; (ii) monitoring stress scenarios, limits and alerts; (iii) applying, analyzing and stress testing scenarios; (iv) reporting risk to the individuals responsible in the business units, in compliance with our governance procedures; (v) monitoring the measures needed to adjust positions and/or risk levels to make them viable; and (vi) supporting the secure launch of new financial products.
The CMN has regulations establishing the segregation of market risk exposure at a minimum into risk factors, such as: interest rates, exchange rates, stocks and commodities. Brazilian inflation indexes are also treated as a group of risk factors and follow the same structure.
Our structure of limits and alerts follows the Board of Directors guidelines, which are reviewed and approved by our Board of Directors on an annual basis. This structure extends to specific limits and is aimed at improving the process of risk monitoring and understanding as well as preventing risk concentration. Limits and alerts are calibrated based on projections of future balance sheets, stockholders’ equity, liquidity, complexity and market volatility, as well as our risk appetite.
Procedures and key indicators
In an attempt to fit the transactions into the defined limits, we hedge transactions with clients and proprietary positions, including investments overseas. Derivatives are the most commonly used instruments for carrying out these hedging activities, and can be characterized as either accounting or economic hedge, both of which are governed by our institutional regulations.
Our market risk framework categorizes transactions as ‘Trading Book’ or ‘Banking Book’, in accordance with general criteria established by specific regulation.
Our Trading Book is composed of all trades with financial and commodity instruments (including derivatives) undertaken with the intention of trading.
Our Banking Book is predominantly characterized by portfolios originated from the banking business and operations related to balance sheet management, and intended to be either held to maturity, or sold in the medium or long term.
Market risk management is based on the following key metrics:
| | • | | Value at Risk (VaR): a statistical metric that quantifies the maximum potential economic loss expected in normal market conditions, considering a defined holding period and confidence interval; |
| | • | | Losses in Stress Scenarios (Stress Testing): a simulation technique to evaluate the impact, in the assets, liabilities and derivatives of the portfolio, of various risk factors in extreme market situations (based on prospective and historic scenarios); |
| | • | | Stop Loss: metrics that trigger a management review of positions, if the accumulated losses in a given period reach specified levels; |
200
| | • | | Concentration: cumulative exposure of certain financial instruments or risk factors calculated at market value (mark to market); and |
| | • | | Stressed VaR: a statistical metric derived from VaR calculation, aimed at capturing the biggest risk in simulations of the current portfolio, taking into consideration the observable returns in historical scenarios of extreme volatility. |
In addition to the risk metrics described above, sensitivity and loss control measures are also analyzed. They include:
| | • | | Gap Analysis: accumulated exposure of cash flows by risk factor, which are marked-to-market and positioned by settlement dates; |
| | • | | Sensitivity (DV01 – Delta Variation Risk): impact on the market value of cash flows when a one basis point change is applied to current interest rates or on the index rates; and |
| | • | | Sensitivities to Various Risk Factors (Greek): partial derivatives of a portfolio of options on the prices of the underlying assets, implied volatilities, interest rates and time. |
Please see “Note 32 – Risk and Capital Management” to our audited consolidated financial statements for further details about market risk.
VaR – Consolidated Itaú Unibanco Holding
Our consolidated VaR is calculated through the Historical Simulation. The assumption underlying Historical Simulation is that the expected distribution for the possible gains and losses (P&Ls—Profit and Loss Statement) for a portfolio over a desired time horizon can be estimated based on the historical behavior of the returns of the market risk factors to which this portfolio is exposed. For the VaR calculation of non-linear instruments, a full re-pricing is carried out (full valuation), without any potential simplifications in the calculation.
The VaR is calculated with a confidence interval of 99%, a historical period of 4 years (1000 working days) and a holding period that varies in accordance with the portfolio’s market liquidity, considering a minimum horizon of 10 working days. Also, under a conservative approach, the VaR is calculated on a daily basis with and without volatility weighting, with the final VaR being the most restrictive value between the two methodologies.
As from the third quarter of 2016, we have been calculating VaR for the regulatory portfolio (exposure of the trading portfolio and exposure to foreign currency and commodities of the banking portfolio) according to internal models approved by the Central Bank. The Consolidated Total VaR table provides an analysis of our portfolio exposure to market risk.
| | | | | | | | | | | | | | | | | | | | | | | | | | | | | | | | |
Consolidaded VaR (Historical Simulation approach)(1) | | Average | | | Minimum | | | Maximum | | | December 31, 2020 | | | Average | | | Minimum | | | Maximum | | | December 31, 2019 | |
| | | (In millions of R$) | |
Group of Risk Factor | | | | | | | | | | | | | | | | | | | | | | | | | | | | | | | | |
Interest rate | | | 614 | | | | 292 | | | | 1,961 | | | | 431 | | | | 816 | | | | 652 | | | | 960 | | | | 813 | |
Currencies | | | 20 | | | | 9 | | | | 71 | | | | 24 | | | | 28 | | | | 11 | | | | 59 | | | | 11 | |
Equities | | | 23 | | | | 9 | | | | 49 | | | | 30 | | | | 30 | | | | 14 | | | | 57 | | | | 29 | |
Commodities | | | 2 | | | | 1 | | | | 4 | | | | 1 | | | | 2 | | | | 1 | | | | 5 | | | | 1 | |
Diversification effect (2) | | | | | | | | | | | | | | | (263 | ) | | | | | | | | | | | | | | | (576 | ) |
| | | | | | | | | | | | | | | | | | | | | | | | | | | | | | | | |
Total | | | 282 | | | | 166 | | | | 763 | | | | 223 | | | | 334 | | | | 209 | | | | 472 | | | | 278 | |
| | | | | | | | | | | | | | | | | | | | | | | | | | | | | | | | |
| (1) | Determined in local currency and converted into Brazilian reais at the closing price on the reporting date. |
| (2) | Reduction of risk due to the combination of all risk factors. |
As of December 31, 2020, our average global VaR (Historical Simulation) was R$282 million, or 0.2% of our consolidated stockholders’ equity as of December 31, 2020, compared to our average global VaR (Historical Simulation) of R$334 million as of December 31, 2019 or 0.2% of our consolidated stockholders’ equity as of December 31, 2019.
VaR – Trading Book
201
The table below presents risks arising from all positions with the intention of trading, following the criteria defined above for our Trading Book. Our total average Trading Book VaR was R$42.0 million as of December 31, 2020, compared to R$44.0 million as of December 31, 2019 and to R$48.4 million as of December 31, 2018.
| | | | | | | | | | | | | | | | | | | | | | | | | | | | | | | | |
Trading Book VaR(1) | | Average | | | Minimum | | | Maximum | | | December 31,
2020 | | | Average | | | Minimum | | | Maximum | | | December 31,
2019 | |
| | | (In millions of R$) | |
Group of Risk Factor | | | | | | | | | | | | | | | | | | | | | | | | | | | | | | | | |
Interest rate | | | 38.0 | | | | 12.3 | | | | 146.6 | | | | 20.7 | | | | 25.1 | | | | 11.6 | | | | 43.8 | | | | 34.5 | |
Currencies | | | 14.5 | | | | 6.0 | | | | 61.4 | | | | 14.5 | | | | 21.1 | | | | 6.4 | | | | 48.4 | | | | 6.4 | |
Equities | | | 19.7 | | | | 5.8 | | | | 61.4 | | | | 15.4 | | | | 21.8 | | | | 6.0 | | | | 47.0 | | | | 14.4 | |
Commodities | | | 1.8 | | | | 0.7 | | | | 5.8 | | | | 1.1 | | | | 1.9 | | | | 0.5 | | | | 6.1 | | | | 1.0 | |
Diversification effect (2) | | | | | | | | | | | | | | | (8.2 | ) | | | | | | | | | | | | | | | (12.9 | ) |
| | | | | | | | | | | | | | | | | | | | | | | | | | | | | | | | |
Total | | | 42.0 | | | | 20.9 | | | | 138.2 | | | | 43.5 | | | | 44.0 | | | | 25.2 | | | | 84.9 | | | | 43.4 | |
| | | | | | | | | | | | | | | | | | | | | | | | | | | | | | | | |
| (1) | Determined in local currency and converted into Brazilian reais at the closing price on the reporting date. |
| (2) | Reduction of risk due to the combination of all risk factors. |
Other Risks
Business and Strategy Risk
We define the business and strategy risk as the risk of a negative impact on our financial results or capital as a consequence of faulty strategic planning, making adverse strategic decisions, and our inability to implement the proper strategic plans and/or changes in its business environment.
We have implemented many mechanisms to ensure that both the business and the strategic decision-making processes follow proper governance standards, have the active participation of executives and the Board of Directors, are based on market, macroeconomic and risk information and are aimed at optimizing the risk-return ratio. Decision-making and the establishment of business and strategy guidelines, count on the full engagement of the Board of Directors, primarily through the Strategy Committee, and of the executives, through the Executive Committee. In order to handle risk adequately, we have governance and processes that involve the Risks and Finance Area in business and strategy decisions, so as to ensure that risk is managed and decisions are sustainable in the long term. They are: (i) the qualifications and incentives of board members and executives; (ii) the budgetary process; (iii) product assessment; (iv) the evaluation and prospecting of proprietary mergers and acquisitions; and (v) a risk appetite framework which, for example, restricts the concentration of credit and exposure to specific and material risks.
Regulatory or Compliance Risk
We consider regulatory or compliance risk as the risk associated with any financial losses or damage to reputation, arising from non-compliance with external or internal standards, commitments to regulators, codes of self-regulation, methods or codes of conduct related to our activities.
The regulatory or compliance risk is managed through a structured process aimed at identifying changes in the regulatory environment, analyzing their impacts on the institution and monitoring the implementation of actions directed at adherence to the regulatory requirements.
This structured process includes the following actions: (i) to understand the changes in the regulatory environment; (ii) to monitor regulatory trends; (iii) to care for the relationship between the institution and the regulator, self-regulatory bodies and the representation entity; (iv) to monitor action plans on regulatory or self-regulatory compliance; (v) to coordinate a program to comply with significant norms, such as integrity and ethics; and (vi) to report regulatory issues in operational and compliance risk forums, according to the structure of committees established in internal policies.
Insurance Products, Pension Plan and Premium Bonds Risks
Products that compose portfolios of our insurance companies are related to life and elementary insurance, as well as pension plans and premium bonds. Accordingly, we understand that the main risks inherent to these products are:
202
| | • | | Underwriting risk: the possibility of losses arising from insurance products, pension plans and premium bonds that go against our expectations, directly or indirectly associated with technical and actuarial bases used for calculating premiums, contributions and technical provisions; |
In line with domestic and international practices, we have a risk management structure which ensures that risks resulting from insurance, pension and special savings products are properly assessed and reported to the relevant forums.
The process of risk management for insurance, pensions and premium bond plans is independent and focuses on the special nature of each risk.
As part of the risk management process, there is a governance structure where decisions may be escalated to sub-committees, thus ensuring compliance with several regulatory and internal requirements, as well as balanced decisions relative to risks.
Our objective is to ensure that assets serving as collateral for long-term products, with guaranteed minimum returns, are managed according to the characteristics of the liabilities, so that they are actuarially balanced and solvent over the long term.
Model Risk
Model risk is the risk that arises from the incorrect development or maintenance of models, such as mistaken assumptions and inappropriate use or application of the model.
The use of models can lead to decisions that are more accurate and therefore it is a major practice. The models have supported strategic decisions in several contexts, such as credit approval, pricing, volatility curve estimation, calculation of capital, among others.
Due to the increasing use of models, driven by the application of new technologies and the expansion of data use, we have improved our governance in relation to the development and monitoring, through the definition of guidelines, policies and procedures aimed at assuring the quality and mitigation of the associated risks.
Contagion Risk
Contagion Risk is the possibility of losses occurring for entities that are part of the Itaú Unibanco Group as a result of financial support to unconsolidated entities, in a stressful situation, in the absence or in addition to the obligations provided for in the contract.
We have a structure for risk management and control, a dedicated team and a policy that defines roles and responsibilities. This structure covers (i) the identification of entities in relation to the potential generation of contagion risk, (ii) the assessment of risks in relationships, (iii) the monitoring, control and mitigation of contagion risk, (iv) the assessment of impact on capital and liquidity and (v) reports.
It is part of the scope of contagion risk governance: related party audiences, mainly composed of controllers, controlled and related entities (as defined in Central Bank Resolution No. 4,693/18), and investments in non-consolidated entities, suppliers of critical products and services, buyers and sellers of relevant assets, third parties with products distributed by us and third parties to whom we distribute products.
Cybersecurity Management and Processes
203
We consider cybersecurity and information security at the highest strategic level. Our Information Security department contributes to the security pillar by handling information and data. The purpose of this department is to safeguard our data and that of our clients and preserve the integrity, availability, and confidentiality of information, thus mitigating financial losses and reputational risk. Our cybersecurity information strategy is designed to prevent security incidents, minimize unavailability, protect integrity and prevent data leakage. It is based on strict control processes aimed at preventing, detecting, and immediately responding to attacks and attempts to hack our infrastructure, thus ensuring the security risk is managed and a safe foundation is built for an increasingly digital future.
The information security strategy has been developed considering the global scenario, regulations and best practices and standards, in order to focus on establishing data protection for our customers. Our organization also maintains an effective security governance through executive committees and a set of information security policies.
Our infrastructure defenses are structured to protect our organization against external and internal attacks, with tools such as network behavioral analysis, intrusion prevention systems (IPS), firewalls, antiviruses and antispam systems.
In order to reach this purpose, we use the strategy of protecting an expanded perimeter. Under this concept, information must be protected regardless of where it is located, within the bank infrastructure, in a cloud provider, at a third party or a foreign unit. This strategy also considers the entire information lifecycle, from collection to processing, transmission, storage, analysis and destruction.
We have a specialized monitoring team, capable of identifying potential threats and establishing an active and effective defense (SOC — Security Operational Centers). Additionally, we have a cyber-intelligence team working to identify threats and manage any necessary counter measures.
In order to be successful in our information security defense strategy, we consider the culture of security as the basis to improve our information security program as well as the investment in awareness campaigns for employees and customers, so they remain prepared to identify and address inherent risks and threats.
Environmental and Social Risk
We understand environmental and social risk as the possibility of losses resulting from events of environmental and/or social origin related to the activities developed by us. Environmental and social risk mitigation actions are carried out through mapping of processes, risks and controls, monitoring of new rules related to the theme and recording of occurrences in internal systems. In addition to identification, the stages of prioritization, risk response, monitoring and reporting of the assessed risks complement the management of this risk at Itaú Unibanco. Governance for climate-related risks is embedded into our existing governance structure and is complementary to governance of our sustainability strategy.
Our Sustainability and Social Environmental Responsibility Policy (PRSA) is available on our Investor Relations website.
Environmental and social risk management is carried out by our business areas (i.e. first line of defense), which carry out the management in their daily activities, following the guidelines of PRSA, specific manuals and procedures, with specialized support and evaluation by dedicated technical teams located in the Corporate Compliance, Credit Risk and Modeling and Institutional Legal teams, which act in an integrated manner in the management of all dimensions of Social and Environment Risk linked to the activities of the conglomerate. As an example of specific guidelines for the management of this risk, the governance for approval of new products and services applicable to our business units include environmental and social risk in their assessment, ensuring compliance with this requirement in the process of approving new products as well as with specific environmental and social processes applicable to our operations (equity, branch infrastructure and technology), suppliers, credit, investments and key subsidiaries. The second line of defense, in turn, is represented by Credit and Modeling Risk, by Internal Controls, and by Compliance, through the Corporate Social and Environmental Risk Management, which supports and guarantees the governance of the activities of the first line. The third line of defense, composed of Internal Audit, acts independently, carrying out the mapping and assessment of risk management, controls and governance. The governance of Environmental and Social Risk also counts on the Environmental and Social Committee, whose main role is to evaluate and deliberate on institutional and strategic matters, as well as deliberate on products, operations, services, among others that involve the theme of environmental and social risk, including Climate Risk as climate change also poses relevant risks for the whole financial system.
204
Climate risks encompass both physical risks, arising from changes in climate patterns such as rainfalls and temperature rise and extreme weather events; and transition risks arising from economic shifts occurred as a consequence of climate action such as carbon pricing, climate regulation, market risks and reputation risks. Given its relevance, climate risk has become one of our main priorities: we have supported the TCFD since 2017 and we are committed to implementing its recommendations by 2022. With this objective we are strengthening our climate risk governance and strategy and developing tools and methodologies to assess and manage climate risks.
Given the growing importance of an integrated approach for environmental and social risk management, in 2019, we increased our governance creating a new structure under the Compliance department: the Corporate Environmental and Social Risk Management unit. Such area has the mandate to strengthen the environmental and social risk governance, counsel on related matters, and to lead integrated reports to the high management.
We consistently pursue to evolve in environmental and social risk management, always attentive to challenges including those arising from regulations and from a changing stakeholders’ expectations. We have assumed and incorporated several national and international voluntary commitments into our governance aiming at continuously improving our integrated environmental and social risk management. We have committed with the Principles for Responsible Investment (PRI), Principles for Responsible Banking (PRB), the Charter for Human Rights – Ethos, Equator Principles (EP), Global Impact, Carbon Disclosure Project (CDP), Brazilian GHG Protocol Program, National Pact for Eradicating Slave Labor (Pacto Nacional para Erradicação do Trabalho Escravo), among others. Our efforts to increase knowledge and governance of environmental and social risk have been recognized in Brazil and abroad, as shown by our recurring presence in sustainability indexes, such as Dow Jones Sustainability Index, Euronext Vigeo – Emerging 70, and in B3’s Corporate Sustainability Index, as well as numerous prizes and recognitions which we have been awarded.
Country Risk
Country risk is the risk of losses arising from noncompliance with obligations in connection with borrowers, issuers, counterparties or guarantors as a result of political, economic and social events or actions taken by the government of the country where the borrower, issuer, counterparty or guarantor is located.
We have a specific structure for the management and control of country risk, consisting of corporate bodies and dedicated teams, with responsibilities defined in policies. The institution has a structured and consistent procedure for managing and controlling country risk, including: (i) the establishment of country ratings; (ii) the determination of limits for countries; and (iii) the monitoring of limits.
Reputational Risk
We understand reputational risk to be the risk arising from internal practices, risk events and external factors that may generate a negative perception of us among clients, counterparties, stockholders, investors, supervisors and commercial partners, among others, which could affect the value of our brand and financial losses, in addition to adversely affecting our capability to maintain our existing commercial relations, start new businesses and continue to have access to financing sources.
We believe that our reputation is extremely important for achieving our long-term goals. As a result, we strive to align our speech with ethical and transparent practices and work, which is essential to raise the confidence of our stakeholders. Our reputation depends on our strategy (vision, culture and skills) and derives from direct and indirect relationship between us and our stakeholders.
Since reputational risk directly or indirectly permeates all of our operations and processes, we have governance procedures that are structured in a way to ensure that potential reputational risks be identified, analyzed and managed in the initial phases of our operations and the analysis of new products.
The treatment given to reputational risk is structured by means of many processes and internal initiatives, which, in turn, are supported by our internal policies. Their main purpose is to provide mechanisms for the monitoring, management, control and mitigation of the main reputational risks. Among those processes and internal initiatives are (i) risk appetite statement; (ii) processes to prevent and combat the use of Itaú Unibanco in unlawful acts; (iii) crisis management processes and business continuity procedures; (iv) processes and guidelines with respect to governmental and institutional relations;
205
(v) corporate communication processes; (vi) brand management processes; (vii) ombudsman offices initiatives and commitment to customer satisfaction; and (viii) ethics and corruption prevention guidelines.
Money Laundering Prevention
Financial institutions play a key role in preventing and fighting illicit acts, which includes money laundering, terrorism financing and fraud.
The challenge is to identify and prevent increasingly sophisticated operations that seek to conceal the source, ownership and transfer of goods and assets, derived from illegal activities.
We have established a corporate policy to prevent our involvement in illicit activities, protecting our reputation and image among employees, customers, strategic partners, suppliers, service providers, regulators and the society. Our policy is based on a governance structure focused on transparency, strict compliance with the rules and regulations and cooperation with enforcement and judicial authorities. We also strive to conduct our business in accordance with the local and international best practices to prevent and fight illicit acts, through investments and training our employees on an ongoing basis.
In order to comply with our corporate policy, we have established a program to prevent and fight illicit acts, which includes the following pillars:
| | • | | Policies and Procedures; |
| | • | | Customer Identification Process; |
| | • | | Know Your Customer—KYC; |
| | • | | Know Your Supplier—KYS; |
| | • | | Know Your Employee—KYE; |
| | • | | Evaluation of New Products and Services; |
| | • | | Monitoring, Selection and Analysis pf Suspicious Operations or Situations; |
| | • | | Reporting Suspicious Transactions to Regulators and Authorities; and |
This program is applicable to us and our entities in Brazil and abroad. The oversight of prevention and detection of illegal activities is carried out by the Board of Directors, the Audit Committee, Compliance and Operational Risk Committees, Risks and Capital Management Committee and the Anti-Money Laundering Committee.
Please refer to “Item 4B. Business Overview – Supervision and Regulation – Anti-Money Laundering Regulations” for further details about money laundering regulation.
Our Illicit Acts Prevention and Combat Corporate Policy is available on our Investors Relation website.
Politically Exposed Persons (PEPs)
Our commitment to compliance with applicable law and to the adoption of the best practices for prevention and detection of money laundering activity is also reflected in the identification, assessment and monitoring of PEPs, whether as individuals or entities.
As per our policies, we conduct enhanced due diligence with respect to PEPs, in line with our risk-based approach. We require a higher level of approval prior to establishing any relationship with a PEP.
Please refer to “Item 4B. Business Overview – Supervision and Regulation – Politically Exposed Persons (PEPs)” for further details about politically exposed persons.
206
| ITEM 12. | DESCRIPTION OF SECURITIES OTHER THAN EQUITY SECURITIES |
Not applicable.
Not applicable.
Not applicable.
| 12D. | American Depositary Shares |
Our preferred shares have been traded on the NYSE in the form of ADSs (one ADS represents one preferred share) since February 21, 2002, in compliance with NYSE and SEC requirements. These requirements include disclosure of financial statements in IFRS since 2011 and compliance with U.S. legal requirements, including the Exchange Act and the Sarbanes-Oxley Act of 2002.
Our ADSs are issued by BNY Mellon, as depositary, under a Deposit Agreement, dated as of May 31, 2001, as amended and restated as of February 20, 2002 and as of April 3, 2009, and as of August 17, 2018, effective as of August 27, 2018 and post-effective as of January 13, 2020, among us, the depositary and the owners and beneficial owners of ADSs from time to time. The depositary’s principal executive office is located at 240 Greenwich Street, New York, New York 10286.
ADS holders have no stockholder rights, which are governed by Brazilian Corporate Law. The depositary is the holder of the preferred shares underlying the ADSs. Holders of ADSs have ADS holder rights.
An investor may hold the ADSs directly, registered under his or her name, or indirectly, through a broker or another financial institution. The holders of our ADSs do not have the same rights as our stockholders and the depositary and holders of corresponding shares in Brazil. The deposit agreement determines the rights and obligations of the ADS holders and is governed by New York law.
Please refer to Exhibit 2(c) to this annual report for further information relating to our American Depositary Shares.
In the event of a capital increase that maintains or increases the proportion of our capital represented by preferred shares, the holders of ADSs, except as described above, have preemptive rights to subscribe only to newly issued preferred shares. In the event of a capital increase that reduces the proportion of capital represented by preferred shares, the holders of ADSs, except as described above, have preemptive rights to preferred shares in proportion to their interests and to common shares only to the extent necessary to prevent dilution of their interests.
Please refer to “Item 10E. Taxation” for further information.
Fees and Expenses
The following table summarizes the fees and expenses payable by holders of ADSs to the depositary:
207
| | |
| | |
| Event | | Fees |
| | |
| Issuance (1) or cancellation for the purpose of withdrawal (2) of ADSs | | US$5.00 (or less) per 100 ADSs (or portion thereof) plus any additional fees charged by any governmental authorities or other institutions for the execution and delivery or surrender of ADSs. |
| | |
| Any cash distribution | | US$0.05 (or less) per ADS (or portion thereof). |
| | |
| Depositary services | | US$0.05 (or less) per ADS (or portion thereof) per calendar year (in addition to cash distribution fee of US$0.05 per ADS during the year). |
| | |
(1) Including issuances resulting from a distribution of preferred shares or rights or other property, substitution of underlying shares and transferring, splitting or grouping of receipts. (2) Including if the deposit agreement terminates. |
In addition, set below are other fees and expenses payable by holders of ADSs:
| | • | | Registration fees: registration of transfers of preferred shares on our preferred share register to or from the name of the depositary or its agent when the holder deposit or withdraws preferred shares. |
| | • | | Distribution of securities by the depositary to ADS holders fee: equivalent to the fee that would be payable if securities distributed to the holder thereof had been preferred shares and the shares had been deposited for issuance of ADSs. |
| | • | | Foreign currency conversion expenses: expenses of the depositary in converting foreign currency to U.S. dollars. |
| | • | | Depositary expenses: cable, telex and facsimile transmissions (when expressly provided in the Deposit Agreement). |
Moreover, taxes and other governmental charges which the depositary or the custodian has to pay on any ADR or preferred share underlying an ADS (for example, stock transfer taxes, stamp duty or withholding taxes) would be payable by holders of ADSs. Any other charges incurred by the depositary or its agents for servicing the deposited securities are not currently assessed in the Brazilian market.
Payment of Taxes
The depositary may deduct the amount of any taxes owed from any payments to investors. It may also sell deposited securities, by public or private sale, to pay any taxes owed. Investors will remain liable if the proceeds of the sale are not sufficient to pay the taxes. If the depositary sells deposited securities, it will, if appropriate, reduce the number of ADSs to reflect the sale and pay to investors any proceeds or send to investors any property remaining after it has paid the taxes.
Reimbursement of Fees
BNY Mellon, as depositary, has agreed to reimburse us for expenses we incur that are related to establishment and maintenance of the ADS program. The depositary has agreed to reimburse us for our continuing annual stock exchange listing fees. The depositary has also agreed to pay the standard out-of-pocket maintenance costs for the ADSs, which consist of the expenses of postage and envelopes for mailing annual and interim financial reports, printing and distributing dividend checks, electronic filing of United States federal tax information, mailing required tax forms, stationery, facsimile, and telephone calls, as well as to reimburse us annually for certain investor relationship programs or special investor relations promotional activities. In certain instances, the depositary has agreed to provide additional payments to us based on applicable performance indicators relating to the ADS facility. There are limits on the amount of expenses for which the depositary will reimburse us, but the amount of reimbursement available to us is not necessarily tied to the amount of fees the depositary collects from investors.
The depositary collects its fees for delivery and surrender of ADSs directly from investors, depositing shares or surrendering ADSs in case of exercise of withdrawal rights or from intermediaries acting for them. The depositary collects fees for making distributions to investors by deducting those fees from the amounts distributed or by selling a portion of distributable property to pay the fees. The depositary may collect its annual fee for depositary services by deducting from cash distributions, by directly billing investors or by charging the book-entry system accounts of participants acting for them. The depositary may generally refuse to provide services subject to fees until its fees for those services have been paid.
208
In 2020, we received from the depositary US$35.26 million for promoting and encouraging the ADR program in the market, out-of-pocket maintenance costs for the ADSs (as described above), any applicable performance indicators relating to the ADS facility, underwriting fees and legal fees.
ADS holders’ Payment of Dividends
Preferred shares underlying ADSs are kept in Brazil by the custodian, Itaú Unibanco, which is the owner recorded in the register service of our preferred shares. The depositary of our ADS program is BNY Mellon. The payments of dividends and distributions in cash for our preferred shares underlying the ADSs are made directly to the depositary bank abroad, which is responsible for passing them on to the stockholders within an average period of 10 days after payment is made in Brazil. The amount received by the ADS holder may be reduced if we, the custodian or the depositary are required to retain an amount related to taxes and other government charges.
Please see “Item 8A. Consolidated Statements and Other Financial Information—Stockholders’ Payment” for details on our dividend policy.
PART II
| ITEM 13. | DEFAULTS, DIVIDEND ARREARAGES AND DELINQUENCIES |
None.
| ITEM 14. | MATERIAL MODIFICATIONS TO THE RIGHTS OF SECURITY HOLDERS AND USE OF PROCEEDS |
None.
| ITEM 15. | CONTROLS AND PROCEDURES |
Disclosure Controls and Procedures
We carried out an evaluation, under the supervision and with the participation of our management, including our CEO, and our CFO, of the effectiveness of our “disclosure controls and procedures” (as defined in the Exchange Act Rules 13a-15(e) and 15d-15(e)) as required by paragraph (b) of the Exchange Act Rules 13a-15 or 15d-15, as of December 31, 2020.
A control system, no matter how well designed and operated, can provide only reasonable, not absolute, assurance that the control system’s objectives will be met. Therefore, our management does not expect that the controls will prevent all errors and all fraud.
Based upon the evaluation performed, our CEO and CFO have concluded that as of December 31, 2020, our disclosure controls and procedures were effective to provide reasonable assurance that material information relating to us and our consolidated subsidiaries is (i) recorded, processed, summarized and reported within the time periods specified in the SEC’s rules and forms and (ii) accumulated and communicated to our management, including our principal executive officers and principal financial officers, to allow timely decisions regarding required disclosure.
Management’s Annual Report on Internal Control Over Financial Reporting
Our management is responsible for establishing and maintaining adequate internal control over financial reporting as defined in Rules 13a-15(f) and 15d-15(f) under the Exchange Act. Our internal control was designed to provide reasonable assurance regarding the reliability of financial reporting and the preparation of consolidated financial statements for external purposes, in accordance with the IFRS issued by the IASB.
209
Because of its inherent limitations, internal control over financial reporting may not prevent all or detect misstatements. Also, projections of any evaluation of effectiveness to future periods are subject to risk that controls may become inadequate because of changes in conditions, or a decline in the level of compliance with policies or procedures may occur. Our management assessed the effectiveness of our internal control over financial reporting as of December 31, 2020. In making this assessment, our management used the criteria set forth in “Internal Control – Integrated Framework (2013)” issued by the COSO. Based on its evaluation and those criteria, our management has concluded that our internal control over financial reporting was effective as of December 31, 2020.
The effectiveness of our internal control over financial reporting as of December 31, 2020, has been audited by PricewaterhouseCoopers Auditores Independentes, an independent registered public accounting firm.
Attestation Report of the Independent Registered Public Accounting Firm
The report of PricewaterhouseCoopers Auditores Independentes, our independent registered public accounting firm, dated April 30, 2021, on the effectiveness of our internal control over financial reporting as of December 31, 2020 is presented with our consolidated financial statements.
Please refer to our audited consolidated financial statements for further details about our independent auditor’s report.
Changes in Internal Control Over Financial Reporting
In connection with the evaluation required by the Exchange Act Rule 13a-15(d), our management, including our CEO and CFO, concluded that the changes that occurred during the year ended December 31, 2020 have not materially affected, and are not reasonably likely to materially affect, our internal control over financial reporting.
| 16A. | Audit Committee Financial Expert |
As of December 31, 2020, our Board of Directors had designated Mr. Diego Fresco Gutierrez as our audit committee financial expert that meets the requirements set forth by the SEC, the NYSE and the Central Bank. On April 29, 2021 at the Meeting of the Board of Directors, Ricardo Baldin was elected as a member of the Audit Committee and designated as our audit committee financial expert. This election is subject to the approval of the Central Bank. Our audit committee financial expert along with the other members of our audit committee are independent pursuant to CMN Resolution No. 3,198, which requires that the members not be, or have been in the last year, an officer or employee of the company or its affiliates or an employee with managerial responsibilities in the internal audit division of the financial institution. Other members of our audit committee are financially literate and we believe the skills, experience and education of our audit committee members qualify them to carry out all of their duties as members of the audit committee, including overseeing the preparation of our IFRS financial statements. In addition, our audit committee has the ability to retain independent accountants, financial advisors or other consultants, advisors and experts whenever it deems appropriate. For more information on our Audit Committee, see “Item 6A. Board Practices—Audit Committee.”
We consider ethics to be an essential value for our reputation and longevity. We, including all of our employees, are subject to our Code of Ethics. We report each year under this Item 16B of our annual report on Form 20-F any waivers of the Code of Ethics, in favor of our principal executive officer, chief financial officer, principal accounting officer and persons performing similar functions. In 2020 we did not grant any such waivers. The Code of Ethics governs all relations between companies in our corporate group and their stakeholders (shareholders, clients, employees, suppliers, service providers, governments, communities and society).
A copy of the Code of Ethics is available on our Investors Relations website.
210
| 16C. | Principal Accountant Fees and Services |
Pre-approval of Policies and Procedures
The Audit Committee’s responsibilities include establishing policies and procedures for services that can be provided by our external auditors. On an annual basis, the Audit Committee issues (i) the list of services that cannot be provided by our external auditors, due to the fact that such services could, eventually, affect their independence, (ii) the list of pre-approved services, and (iii) those services that need to be pre-approved by the Audit Committee.
Fees and Services of the Principal Auditor
The following table sets forth the total amount charged by PwC by category for services provided in the years ended December 31, 2020 and 2019:
| | | | | | | | | | | | | | | | |
| | | (In thousands of R$) | |
Fees | | 2020 | | | % Approved
by the Audit
Committee | | | 2019 | | | % Approved
by the Audit
Committee | |
Audit Fees | | | 66,631 | | | | 100.0 | | | | 62,125 | | | | 100.0 | |
Audit-Related Fees | | | 4,896 | | | | 100.0 | | | | 3,635 | | | | 100.0 | |
Tax Fees | | | 541 | | | | 100.0 | | | | 635 | | | | 100.0 | |
All Other Fees | | | 88 | | | | 100.0 | | | | 285 | | | | 100.0 | |
Total | | | 72,156 | | | | | | | | 66,680 | | | | | |
| | | | | | | | | | | | | | | | |
| | |
| | |
Audit fees: For the audit of our consolidated financial statements, the review of our quarterly financial statements, as well as the audit and review of financial statements of our subsidiaries, services relating to issuing comfort letters in securities offerings, issuance of reports required by regulatory bodies and audit of internal control over financial reporting in connection with the Sarbanes-Oxley Act requirements. | | Audit-related fees: For independent assurance on system implementation controls by a subsidiary; on internal controls, including certain services provided to customers; on our sustainability report, MD&A, Integrated Report and Consolidated Annual Report; on certain agreements signed with regulatory authorities and on compliance with financial covenants. Independent opinions on the book value of assets / liabilities transferred on internal reorganizations. Agreed upon procedures on the balance sheets and on profit share calculation on certain businesses. |
| | |
Tax fees: For review of tax authorities’ inquiries, review of the calculation and payments of taxes and review of compliance with certain tax regulations. | | Other fees: For training, use of surveys and technical materials, reviews on assessment of new accounting standards, review of valuation methods for certain derivatives and independent review of the financial and prudential information reporting processes. |
211
| 16D. | Exemptions from the Listing Standards for Audit Committees |
Under the audit committee rules of the NYSE and the SEC, listed companies must comply with Rule 10A-3 of the Exchange Act (Listing Standards Relating to Audit Committees). Rule 10A-3 requires that listed companies establish an audit committee composed of members of the Board of Directors that meets specified requirements or designate and empower a board of auditors or similar body to perform the role of the audit committee in reliance on the general exemption for audit committees of foreign private issuers set forth in Rule 10A-3(c)(3) of the Exchange Act.
In accordance with Central Bank regulations, we have established a body similar to the audit committee of the board of directors of a U.S. company, which we are required to call an “audit committee.” All the members of our Audit Committee are independent in accordance with the criteria established by the Central Bank. For more information, see “Item 6A. Board Practices — Director and Senior Management – Statutory Bodies — Audit Committee.”
Our Audit Committee, to the extent permitted under Brazilian law, performs all the functions required of an audit committee under Rule 10A-3. As required by Brazilian law, our Board of Directors and Audit Committee are separate corporate bodies. Only one of the six members of our Audit Committee is also member of our Board of Directors. In addition, under Brazilian law, the function of hiring independent auditors is a power reserved exclusively for a company’s Board of Directors. Therefore, our Board of Directors acts as our audit committee, as permitted under Rule 10A-3(c)(3)(v) of the Exchange Act for the purpose of the appointment of our independent auditors.
Except in these respects, our Audit Committee is comparable to, and performs the functions of, an audit committee of the Board of Directors of a U.S. company. We believe that our Audit Committee is able to act independently in performing the responsibilities of an audit committee under Sarbanes-Oxley, satisfies the other requirements of the exemption of Rule 10A-3(c)(3) and therefore is in compliance with Rule 10A-3 of the Exchange Act.
| 16E. | Purchases of Equity Securities by the Issuer and Affiliated Purchasers |
In conformity with best corporate governance practices, on November 18, 2004, we started to voluntarily disclose our Policy for Trading Itaú Unibanco Holding S.A. Securities available on our Investor Relations website. We disclose to the market the transactions carried out with our own shares by our Treasury department through “Announcements to the Market” on a monthly basis, as well as the other disclosure requirements imposed by the Brazilian securities regulation and the SEC.
The repurchase program initially effective in 2020 was approved by our Board of Directors on May 30, 2019 with limits of 15.0 million common shares and 75.0 million preferred shares, without reducing our capital stock.
The share repurchase program has the following potential objectives: (i) to maximize the allocation of capital through the efficient application of available funds; (ii) to provide for the delivery of shares to the employees and management of our company and those of its subsidiaries within the scope of the compensation models and the long-term incentive plans; and (iii) to use the repurchased shares in the event of business opportunities arising in the future. All repurchases shall be made on the open market through stock exchanges.
212
| | | | | | | | | | | | | | | | | | | | |
Period(l) | | (a)
Total
number
of
preferred
shares
purchased
(2) | | (b)
Average
price paid
per
preferred
share(2)(3) | | (c) Total
number of preferred shares
purchased as part of publicly announced plans or programs(2) | | (d)
Maximum
number of
preferred
shares that
may yet be
purchased
under the
plans or
programs | | | (e)
Total
number
of
common
shares
purchased | | (f)
Average
price
paid per
common
share | | (g) Total
number
of
common
shares
purchased
as part of
publicly
announced
plans or
programs | | (h)
Maximum
number of
common
shares that
may yet be
purchased
under the
plans or
programs | |
01/02 to 01/31/2020 | | — | | — | | — | | | 75,000,000 | | | — | | — | | — | | | 15,000,000 | |
02/03 to 02/28/2020 | | — | | — | | — | | | 75,000,000 | | | — | | — | | — | | | 15,000,000 | |
03/02 to 03/31/2020 | | — | | — | | — | | | 75,000,000 | | | — | | — | | — | | | 15,000,000 | |
04/01 to 04/30/2020 | | — | | — | | — | | | 75,000,000 | | | — | | — | | — | | | 15,000,000 | |
05/02 to 05/29/2020 | | — | | — | | — | | | 75,000,000 | | | — | | — | | — | | | 15,000,000 | |
06/01 to 06/30/2020 | | — | | — | | — | | | 75,000,000 | | | — | | — | | — | | | 15,000,000 | |
07/01 to 07/31/2020 | | — | | — | | — | | | 75,000,000 | | | — | | — | | — | | | 15,000,000 | |
08/03 to 08/31/2020 | | — | | — | | — | | | 75,000,000 | | | — | | — | | — | | | 15,000,000 | |
09/01 to 09/30/2020 | | — | | — | | — | | | 75,000,000 | | | — | | — | | — | | | 15,000,000 | |
10/01 to 10/30/2020 | | — | | — | | — | | | 75,000,000 | | | — | | — | | — | | | 15,000,000 | |
11/03 to 11/30/2020 | | — | | — | | — | | | 75,000,000 | | | — | | — | | — | | | 15,000,000 | |
12/01 to 12/31/2020 | | — | | — | | — | | | — | | | — | | — | | — | | | — | |
| (1) | On May 30, 2019 our Board of Directors approved the purchase of up to 15.0 million common shares and 75.0 million preferred shares, ending on November 30, 2020. |
| (2) | Includes brokerage costs. |
| 16F. | Change in Registrant’s Certifying Accountant |
Not applicable.
Our ADSs are registered on the NYSE in the US as a foreign private issuer. As a result, NYSE allows us to comply with certain corporate governance requirements established by applicable Brazilian legislation, rather than those set forth in the NYSE corporate governance listing rules applicable to US companies with securities traded on that exchange.
The following is a description of the main differences between our corporate governance practices and those required for US publicly traded companies.
| | |
| | |
| NYSE REQUIREMENTS | | OUR PRACTICES |
| |
| Independent members of the Board of Directors |
| | |
| Companies listed on the NYSE must have a majority of independent members on their Board of Directors (as defined in applicable rules). However, controlled listed companies (companies with more than 50% of capital held by an individual, group or another company), do not need to comply with this requirement and are exempt from the rule. | | Even though we fall under the exception to the NYSE’s rule and there is no similar requirement under Brazilian law, our Board of Directors has six directors considered independent pursuant to the criteria established in our Corporate Governance Policy. The criteria we use to determine independence are also different from those adopted by the NYSE. |
| |
| Executive Sessions |
| | |
| Non-executive members of the Board of Directors should meet at regularly scheduled executive sessions without the presence of directors who are also officers of the company | | All members of our Board of Directors are currently non-executive. |
| |
| Nomination and Corporate Governance Committee |
| | |
| Companies listed on the NYSE should have a nomination and corporate governance committee entirely comprised of independent directors and governed by charters on the purposes and responsibilities of such committee. However, controlled listed companies of which more than 50% of the voting power is held by an individual, a group or another company, such as in our case, are not required to comply with such requirement. | | We have a Nomination and Corporate Governance Committee responsible for encouraging and overseeing the discussion of the company’s governance-related matters. All members of our Nomination and Corporate Governance Committee are non-executive, and two of them are independent, in accordance with our Corporate Governance Policy. |
213
| | |
| |
| Compensation Committee |
| | |
| Companies listed on the NYSE have a compensation committee composed of independent directors and governed by charters on the purposes and responsibilities of such committee. However, controlled listed companies of which more than 50% of voting capital is held by an individual, a group or another company, such as in our case, are not required to comply with such requirements. | | CVM rules do not require publicly-listed companies to have a compensation committee. Nonetheless, Brazilian banking regulation requires that we have a compensation committee. In compliance with this regulation, our Compensation Committee reports to the Board of Directors and the members of this committee are not required to be independent. However, currently two out of five members of our Compensation Committee are considered independent under our Corporate Governance Policy, and one is not a member of management. |
| |
| Audit Committee |
| | |
| Companies listed on the NYSE are required to have an audit committee that: (i) is composed of at least three independent members who are financially literate; (ii) complies with SEC rules on audit committees of companies registered with the NYSE; (iii) has at least one member who has accounting of financial management expertise; and (iv) is governed by a charter that expressly sets out the purpose and responsibilities of the committee and establishes annual performance evaluations. | | CMN regulates independent audit services rendered to financial institutions and requires the establishment of an audit committee composed of at least three independent members, in accordance with the independence criteria set forth in these rules. Our Audit Committee, that was established on April 28, 2004, meets the applicable Brazilian legal requirements, is elected annually by the Board of Directors and composed of professionals with proven technical qualifications compatible with this Committee’s responsibilities. Under SEC rules, we are not required to have an Audit Committee established or operating in accordance with NYSE rules if we meet some specified SEC requirements. We believe that our Audit Committee meets the requirements of Rule 10A-3(c)(3) under the Exchange Act and is able to act independently when performing its duties. To the extent permitted by Brazilian legislation, our Audit Committee performs all functions required to be performed by an audit committee by Rule 10A-3 under the Exchange Act. |
| |
| Stockholders’ approval of management members’ compensation and stock options plans |
| | |
| Stockholders have the opportunity to vote on all stock-based compensation plans and significant amendments thereto, as well as on significant increases in the number of shares available to the plan, with a few exceptions | | Brazilian legislation sets forth a similar requirement, as it establishes the need for approval to the aggregate annual compensation of management members (including shares) at the General Stockholders’ Meeting. |
| |
| Corporate Governance Code |
| | |
| Companies listed on NYSE are required to adopt and disclose their corporate governance guidance. | | We have a Corporate Governance Policy that consolidates the corporate governance principles and practices we adopt. We believe these principles and practices, consistent with Brazilian legislation, are compatible with the guidelines established by the NYSE. We have adopted stricter rules than those required by Brazilian legislation, as we have voluntarily adhered to B3’s Level 1 of Corporate Governance and have granted tag-along rights to all stockholders, regardless of their voting rights. In 2020, we disclosed the Brazilian Corporate Governance Code, in accordance with CVM Instruction No. 480/09, and we have complied or partially complied with 96.29% of the 54 practices recommended. |
| |
| Code of Ethics |
| | |
| NYSE rules require that listed companies adopt and disclose a code of business conduct and ethics for their directors, officers and employees. NYSE also requires that listed companies promptly disclose any waiver of the provisions of the code of ethics for directors or executive officers. | | Brazilian legislation has no similar requirement. However, we have a Code of Ethics that, among other matters, governs the conduct of all members of the Board of Directors, officers and employees of the Itaú Unibanco Group, detailing the principles that guide our attitudes and practices. |
214
| | |
| |
| Internal Audit |
| | |
| NYSE rules require that listed companies have an internal audit function to provide management and the Audit Committee with ongoing assessments of the company’s risk management processes and internal control systems. | | Brazilian banking legislation establishes a similar requirement, since it requires that financial institution have an internal audit function compatible with the nature, size, complexity, structure, risk profile and business model of the financial institution, that it is undertaken by a specific unit directly reporting to the Board of Directors or by an independent auditor (provided that such auditor is not responsible for auditing the financial statements of the institution or any other activity that may imply a conflict of interest). Our internal audit function is responsible for assessing the sufficiency and effectiveness of our operating and management controls, as well as the adequacy of our risk identification and management process. In addition, our internal audit function is independent from management in carrying out its activities and has access to all places, executives and information necessary to carry out its duties. The internal audit function administratively reports to the Chairman of the Board of Directors, and its activities are supervised by the Audit Committee. |
| 16H. | Mine Safety Disclosure |
Not applicable.
PART III
| ITEM 17. | FINANCIAL STATEMENTS |
We have responded to Item 18 in lieu of responding to this item.
| ITEM 18. | FINANCIAL STATEMENTS |
Our audited consolidated financial statements, together with the Report of Independent Registered Public Accounting Firm, are filed as part of this annual report.
Glossary
A
| | • | | ABECS – Associação Brasileira de Empresas de Cartões de Crédito e Serviços (Brazilian Association of Credit Cards and Services Companies) |
| | • | | ABRASCA – Associação Brasileira de Companhias Abertas (Brazilian Association of Public Companies) |
| | • | | ADS – American Depositary Shares |
| | • | | ANBIMA – Associação Brasileira das Entidades dos Mercados Financeiro e de Capitais (Brazilian Financial and Capital Markets Association) |
| | • | | ANS – Agência Nacional de Saúde Suplementar (National Regulatory Agency for Private Health Insurance and Plans) |
| | • | | APIMEC – Associação dos Analistas e Profissionais de Investimento do Mercado de Capitais (Association of Capital Markets Analysts and Investment Professionals) |
215
| | • | | ATM – Automated Teller Machine |
B
| | • | | B3 S.A. – Brasil, Bolsa, Balcão (Brazilian Exchange and OTC, formerly BM&FBovespa – Bolsa de Valores, Mercadorias e Futuros S.A.) |
| | • | | Banco Itaú Argentina – Banco Itaú Argentina S.A |
| | • | | Banco Itaú Chile – Banco Itaú Chile S.A. |
| | • | | Banco Itaú Paraguay – Banco Itaú Paraguay S.A |
| | • | | Banco Itaú Uruguay – Banco Itaú Uruguay S.A |
| | • | | BCBS – Basel Committee on Banking Supervision |
| | • | | BIS – Bank for International Settlements |
| | • | | BNDES – Banco Nacional de Desenvolvimento Econômico e Social (Brazilian Development Bank) |
| | • | | BNY Mellon – The Bank of New York Mellon |
| | • | | Brazilian Corporate Law – Law No. 6,404, of December 15, 1976, as amended (including by Law No. 11,638) |
| | • | | Brazilian Payment System – encompasses the institutions, the systems and the procedures related to the transfer of funds and other financial assets, among the diverse economic agents of the Brazilian market, or that involve the processing, clearing and settlement of payments in any of its forms. |
C
| | • | | CADE – Conselho Administrativo de Defesa Econômica (Administrative Council for Economic Defense) |
| | • | | CCR – Counterparty Credit Risk |
| | • | | CDC – Código de Defesa do Consumidor (Consumer Protection Code) |
| | • | | CDI – Certificado de Depósito Interbancário (Interbank Deposit Certificate) |
| | • | | CEDEAR – Argentine Certificates of Deposits |
| | • | | Central Bank – Banco Central do Brasil (Brazilian Central Bank) |
| | • | | CFC – Conselho Federal de Contabilidade (Federal Accounting Council) |
| | • | | CGRC – Risk and Capital Management Committee |
| | • | | Cia E. Johnston – Companhia E. Johnston de Participações |
| | • | | CMN – Conselho Monetário Nacional (National Monetary Council) |
| | • | | CNSEG – Confederação Nacional das Empresas de Seguros Gerais, Previdência Privada e Vida, Saúde Suplementar e Capitalização (National Council of General Insurance, Private Pension and Life, Supplementary Health and Capitalization Companies) |
| | • | | CNSP – Conselho Nacional de Seguros Privados (National Council of Private Insurance) |
| | • | | COAF – Conselho de Controle de Atividades Financeiras (Financial Activities Control Council) |
| | • | | COSO – Committee of Sponsoring Organizations of the Treadway Commission |
| | • | | COFINS – Contribuição Para o Financiamento da Seguridade Social (Social Security Financing Contribution) |
| | • | | CONSIF – Confederação Nacional do Sistema Financeiro (National Association of the Financial System) |
| | • | | CSB – Client Service Branches |
| | • | | CSC – Superior Credit Committee |
| | • | | CSCCA – Superior Wholesale Credit and Collection Committee |
| | • | | CSCCV – Superior Retail Credit and Collection Committee |
| | • | | CSLL – Contribuição Social Sobre o Lucro Líquido (Social Contribution on Profits) |
| | • | | CSP – Superior Products Committee |
| | • | | CSRML – Superior Market Risk and Liquidity Committee |
| | • | | CSRO – Superior Operational Risk Management Committee |
| | • | | CTAM – Model Assessment Technical Committee |
| | • | | CVM – Comissão de Valores Mobiliários (Brazilian Securities and Exchange Commission) |
D
| | • | | DJSI – Dow Jones Sustainability Index |
F
| | • | | FATF – Financial Action Task Force |
| | • | | FEBRABAN – Federação Brasileira de Bancos (Brazilian Federation of Banks) |
| | • | | Fed – U.S. Federal Reserve System |
| | • | | FGC – Fundo Garantidor de Crédito (Credit Insurance Fund) |
| | • | | FINAME – Agência Especial de Financiamento Industrial (Special Agency for Industrial Financing) |
I
| | • | | IASB – International Accounting Standards Board |
| | • | | IBRACON – Instituto de Auditores Independentes do Brasil (Institute of Independent Auditors of Brazil) |
216
| | • | | IBRI – Instituto Brasileiro de Relações com Investidores (Brazilian Investor Relations Institute) |
| | • | | ICAAP – Internal Capital Adequacy Assessment Process |
| | • | | IFRS – International Financial Reporting Standards |
| | • | | IOF – Imposto Sobre Operações Financeiras (Tax on Financial Transactions) |
| | • | | IRPJ – Imposto de Renda da Pessoa Jurídica (Corporate Income Tax) |
| | • | | IRS – U.S. Internal Revenue Service |
| | • | | ISE – Índice de Sustentabilidade Empresarial (Corporate Sustainability Index) |
| | • | | ISS – Imposto sobre Serviços (Service Tax) |
| | • | | Itaú BBA Colombia – Itaú BBA Colombia S.A. Corporación Financiera |
| | • | | Itau BBA International – Itau BBA International plc |
| | • | | Itaucard – Banco Itaucard S.A. |
| | • | | Itaú Europe – Itaú BBA Europe S.A. |
| | • | | Itaú Holding Financeira – Itaú Holding Financeira S.A. |
| | • | | Itaú Unibanco Group – Itaú Unibanco Holding S.A. and all its subsidiaries and affiliates |
| | • | | Itaúsa – Itaú Investimentos S.A. |
| | • | | IUPAR – Itaú Unibanco Participações S.A. |
K
| | • | | KYC – Know Your Customer |
| | • | | KYP – Know Your Partner |
| | • | | KYS – Know Your Supplier |
| | • | | KYE – Know Your Employee |
L
| | • | | LCR – Liquidity Coverage Ratio |
N
| | • | | NSFR – Net Stable Funding Ratio |
| | • | | NYSE – New York Stock Exchange |
P
| | • | | PEP – Politically Exposed Person |
| | • | | PFIC – Passive Foreign Investment Company |
| | • | | PIS – Programa de Integração Social (Social Integration Program) |
| | • | | PwC – PricewaterhouseCoopers Auditores Independentes |
R
| | • | | RAET – Regime Especial de Administração Temporária (Temporary Special Administration Regime) |
S
| | • | | SEC – U.S. Securities and Exchange Commission |
| | • | | SELIC – Sistema Especial de Liquidação e Custódia (Special Clearing and Settlement System) |
| | • | | SOX – The Sarbanes-Oxley Act of 2002 |
| | • | | STF – Superior Tribunal Federal (Brazilian Federal Supreme Court) |
| | • | | STJ – Superior Tribunal de Justiça (Brazilian Superior Court of Justice) |
| | • | | SUSEP – Superintendência de Seguros Privados (Superintendency of Private Insurance) |
T
| | • | | TR – Taxa Referencial (Brazilian Reference Interest Rate) |
U
| | • | | Unibanco – União de Bancos Brasileiros S.A. |
V
| | |
No. | | Description |
| |
| 1 | | Bylaws of Itaú Unibanco Holding S.A. (unofficial English translation) (incorporated by reference to our Report on Form 6-K filed on August 7, 2018 (Commission File No. 001-15276)). |
| |
| 2(a) | | Amended and Restated Deposit Agreement among the Registrant, The Bank of New York, as depositary, and the Holders from time to time of American Depositary Shares issued thereunder, including the form of American Depositary Receipts (incorporated by reference to our Registration Statement on Form F-6 Post-effective amendments for immediately effective filing January 6, 2020 (Commission File No. 333- 191758)). |
| |
| 2(b)(i) | | The total amount of long-term debt securities of Itaú Unibanco Holding S.A. and our subsidiaries under any one instrument does not exceed 10.0% of our total assets on a consolidated basis. We agree to furnish copies of instruments defining the rights of certain holders of long-term debt to the SEC upon request. |
| |
| 2(c) | | Description of Securities Registered Under Section 12 of the Exchange Act. |
| |
| 4 (a) | | Shareholders’ Agreement, dated as of January 27, 2009, between Itaúsa—Investimentos Itaú S.A. and the Moreira Salles family (unofficial English translation) (incorporated by reference to our Annual Report on Form 20-F/A filed on May 17, 2010 (Commission File No. 001-15276)). |
| |
| 4(b) | | Plan for Granting Stock Options (incorporated by reference to our Report on Form 6-K furnished to the Commission on May 12, 2015 (Commission File No.: 001-15276)). |
| |
| 4(c) | | Stock Grant Plan (incorporated by reference to our Report on Form 6-K furnished to the Commission on May 02, 2017 (Commission File No.: 001-15276)). |
| |
| 8.1 | | List of subsidiaries (incorporated by reference to “Note 2.4—Summary of Main Accounting Practices, item a) Consolidation, I. Subsidiaries” to our audited Consolidated financial statements included in this Annual Report on Form 20-F). |
| |
| 11.1 | | Code of Ethics (unofficial English translation) (incorporated by reference to our Report on Form 6-K filed with the Commission on February 11, 2020 (Commission File No.: 001-15276)). |
| |
| 12.1 | | Chief Executive Officer Certification pursuant to Section 302 of the Sarbanes-Oxley Act of 2002. |
| |
| 12.2 | | Chief Financial Officer Certification pursuant to Section 302 of the Sarbanes-Oxley Act of 2002. |
| |
| 13 | | Chief Executive Officer and Chief Financial Officer Certification pursuant to 18 U.S.C. Section 1350 as Adopted Pursuant to Section 906 of the Sarbanes-Oxley Act of 2002. |
| |
| 101.INS | | XBRL Instance Document. |
| |
| 101.SCH | | XBRL Taxonomy Extension Schema Document. |
| |
| 101.CAL | | XBRL Taxonomy Extension Calculation Linkbase Document. |
| |
| 101.DEF | | XBRL Taxonomy Extension Definition Linkbase Document. |
| |
| 101.LAB | | XBRL Taxonomy Extension Label Linkbase Document. |
| |
| 101.PRE | | XBRL Taxonomy Extension Extension Linkbase Document. |
217
SIGNATURES
The registrant hereby certifies that it meets all of the requirements for filing on Form 20-F and that it has duly caused and authorized the undersigned to sign this annual report on its behalf.
| | | | | | | | |
| | ITAÚ UNIBANCO HOLDING S.A. |
| | | |
| | By: | | | | /s/ Milton Maluhy Filho |
| | | | | | Name: | | Milton Maluhy Filho |
| | | | | | Title: | | Chief Executive Officer |
| | | | | | |
| | | |
| | By: | | | | /s/ Alexsandro Broedel Lopes |
| | | | | | Name: | | Alexsandro Broedel Lopes |
| | | | | | Title: | | Chief Financial Officer |
Dated: April 30, 2021

Report of independent registered public accounting firm
To the Board of Directors and Stockholders
Itaú Unibanco Holding S.A.
Opinions on the Financial Statements and Internal Control over Financial Reporting
We have audited the accompanying consolidated balance sheets of Itaú Unibanco Holding S.A. and its subsidiaries (the “Company”) as of December 31, 2020 and 2019, and the related consolidated statements of income, comprehensive income, changes in stockholders’ equity and cash flows for each of the three years in the period ended December 31, 2020, including the related notes (collectively referred to as the consolidated financial statements). We also have audited the Company’s internal control over financial reporting as of December 31, 2020, based on criteria established in Internal Control - Integrated Framework (2013) issued by the Committee of Sponsoring Organizations of the Treadway Commission (COSO).
In our opinion, the consolidated financial statements referred to above present fairly, in all material respects, the financial position of the Company as of December 31, 2020 and 2019, and the results of its operations and its cash flows for each of the three years in the period ended December 31, 2020 in conformity with International Financial Reporting Standards as issued by the International Accounting Standards Board. Also in our opinion, the Company maintained, in all material respects, effective internal control over financial reporting as of December 31, 2020, based on criteria established in Internal Control - Integrated Framework (2013) issued by the COSO.
Basis for Opinions
The Company’s management is responsible for these consolidated financial statements, for maintaining effective internal control over financial reporting, and for its assessment of the effectiveness of internal control over financial reporting, included in Management’s Annual Report on Internal Control over Financial Reporting. Our responsibility is to express opinions on the Company’s consolidated financial statements and on the Company’s internal control over financial reporting based on our audits. We are a public accounting firm registered with the Public Company Accounting Oversight Board (United States) (PCAOB) and are required to be independent with respect to the Company in accordance with the U.S. federal securities laws and the applicable rules and regulations of the Securities and Exchange Commission and the PCAOB.
We conducted our audits in accordance with the standards of the PCAOB. Those standards require that we plan and perform the audits to obtain reasonable assurance about whether the consolidated financial statements are free of material misstatement, whether due to error or fraud, and whether effective internal control over financial reporting was maintained in all material respects.
PricewaterhouseCoopers, Av. Francisco Matarazzo 1400, Torre Torino, São Paulo, SP, Brasil, 05001-903, Caixa Postal 61005, T: +55 (11) 3674 2000, www.pwc.com/br
Itaú Unibanco Holding S.A.
Our audits of the consolidated financial statements included performing procedures to assess the risks of material misstatement of the consolidated financial statements, whether due to error or fraud, and performing procedures that respond to those risks. Such procedures included examining, on a test basis, evidence regarding the amounts and disclosures in the consolidated financial statements. Our audits also included evaluating the accounting principles used and significant estimates made by management, as well as evaluating the overall presentation of the consolidated financial statements. Our audit of internal control over financial reporting included obtaining an understanding of internal control over financial reporting, assessing the risk that a material weakness exists, and testing and evaluating the design and operating effectiveness of internal control based on the assessed risk. Our audits also included performing such other procedures as we considered necessary in the circumstances. We believe that our audits provide a reasonable basis for our opinions.
Definition and Limitations of Internal Control over Financial Reporting
A company’s internal control over financial reporting is a process designed to provide reasonable assurance regarding the reliability of financial reporting and the preparation of financial statements for external purposes in accordance with generally accepted accounting principles. A company’s internal control over financial reporting includes those policies and procedures that (i) pertain to the maintenance of records that, in reasonable detail, accurately and fairly reflect the transactions and dispositions of the assets of the company; (ii) provide reasonable assurance that transactions are recorded as necessary to permit preparation of financial statements in accordance with generally accepted accounting principles, and that receipts and expenditures of the company are being made only in accordance with authorizations of management and directors of the company; and (iii) provide reasonable assurance regarding prevention or timely detection of unauthorized acquisition, use, or disposition of the company’s assets that could have a material effect on the financial statements.
Because of its inherent limitations, internal control over financial reporting may not prevent or detect misstatements. Also, projections of any evaluation of effectiveness to future periods are subject to the risk that controls may become inadequate because of changes in conditions, or that the degree of compliance with the policies or procedures may deteriorate.
Critical Audit Matters
The critical audit matters communicated below are matters arising from the current period audit of the consolidated financial statements that were communicated or required to be communicated to the audit committee and that (i) relate to accounts or disclosures that are material to the consolidated financial statements and (ii) involved our especially challenging, subjective, or complex judgments. The communication of critical audit matters does not alter in any way our opinion on the consolidated financial statements, taken as a whole, and we are not, by communicating the critical audit matters below, providing separate opinions on the critical audit matters or on the accounts or disclosures to which they relate.
Measurement of the provision for expected credit loss of loan and lease operations
As described in Notes 2.3(f), 10 and 33(a) to the consolidated financial statements, the measurement of the provision for expected credit loss of loan and lease operations involves management’s judgment in the application of methodologies and assumptions, especially during 2020 as a result of the COVID-19
Itaú Unibanco Holding S.A.
pandemic, including term to maturity, prospective information and probability weighted loss scenarios. At December 31, 2020, the provision for expected credit loss of loan and lease operations was BRL 48,322 million on a total loan and lease operations portfolio of BRL 714,104 million.
The principal considerations for our determination that performing procedures relating to the measurement of the provision for expected credit loss of loan and lease operations is a critical audit matter are (i) the was significant judgment used by management in determining the appropriate methodologies and assumptions used, which in turn led to a high degree of auditor judgment and subjectivity in performing procedures relating to the methodologies and assumptions used, (ii) the significant judgment in evaluating audit evidence obtained relating to the methodologies and assumptions; and (iii) the audit effort involved the use of professionals with specialized skills and knowledge.
Addressing the matter involved performing procedures and evaluating audit evidence in connection with forming our overall opinion on the consolidated financial statements. These procedures included: i) testing the effectiveness of controls related to management’s measurement of the provision for expected credit loss of loan and lease operations, which included controls over the methodologies and assumptions used; ii) testing of the reasonableness of significant assumptions and data inputs used in the calculation of the provision for expected loss, including management´s approval and validation process; and iii) evaluating the disclosures in the financial statements in relation to the measurement of the provision for expected credit loss.
Valuation of financial assets not actively traded in the market
As described in Notes 2.3(b), and 28 to the consolidated financial statements, the valuation of financial assets not actively traded in the market is calculated using valuation techniques that use assumptions such as historical data, information on similar transactions and pricing techniques derived from market information or internally developed models when no pricing information in active market is available. At December 31, 2020, the Company had total financial assets measured at fair value of BRL 499,013 million, of which BRL 6,769 million is represented by Level 2 shares and Level 3 real estate receivables certificates and debentures not actively traded in the market.
The principal considerations for our determination that performing procedures relating to these financial assets not actively traded in the market is a critical audit matter due to the significant judgments applied by management in choosing the pricing techniques and the assumptions to determine the fair value of not actively traded financial assets. This in turn led to a high degree of auditor judgment, effort and subjectivity in performing procedures, including the involvement of professionals with specialized skill and knowledge.
Addressing the matter involved performing procedures and evaluating audit evidence in connection with forming our overall opinion on the consolidated financial statements. These procedures included: i) evaluating the appropriateness of the valuation techniques used for these financial assets at fair value not actively traded in the market and the significant assumptions used by management, by comparing them with independent methodologies and assumptions; ii) testing the effectiveness of controls in relation to valuation techniques, including the relevant inputs and data to these controls; iii) calculating with the assistance of professionals with specialized skills and knowledge, an independent estimate of fair value for a sample of certain financial instruments and comparing management’s estimate with the
Itaú Unibanco Holding S.A.
independently developed estimate of fair value; iv) evaluating disclosures in the financial statements in relation to the valuation of financial assets.
Provision for litigations
As described in Notes 2.3(j), 2.4.(n) and 29 to the consolidated financial statements, the Company recognizes liabilities in the consolidated financial statements for the resolution of pending litigation when management determines that a loss is probable, and the amount of the loss can be reasonably estimated. The Company’s consolidated provisions for pending litigations related to civil, labor, tax and legal obligations was BRL 18,336 million at December 31, 2020. No liability for an estimated loss is accrued in the consolidated financial statements for unfavorable outcomes when, after assessing the information available, (i) management concludes that it is not probable that a loss has been incurred in any of the pending litigation; or (ii) management is unable to estimate the loss or range of loss for any of the pending matters. The Company also discloses the contingency in circumstances where management concludes no loss is probable or reasonably estimable but it is reasonably possible that a loss may be incurred.
The principal consideration for our determination that performing procedures relating to the provision for litigations is a critical audit matter is there was significant judgment by management when assessing the likelihood of a loss being incurred and when determining whether a reasonable estimate of the loss or range of loss for each claim can be made, which in turn led to a high degree of auditor judgment and effort in evaluating management’s assessment of the loss contingencies associated with litigation claims.
Addressing the matter involved performing procedures and evaluating audit evidence in connection with forming our overall opinion on the consolidated financial statements. These procedures included testing the design and the effectiveness of controls relating to identifying, assessing, monitoring, measuring, recording, disclosing the provision for litigations, and the completeness and the accuracy of the data used. Our procedures also included testing the models used to quantify judicial proceedings of civil and labor natures considered on a collective basis and performing, on a sample basis, external confirmation procedures with lawyers responsible for the proceedings.
/s / PricewaterhouseCoopers Auditores Independentes
São Paulo, Brazil
April 30, 2021
We have served as the Company’s auditor since 2001.
ITAÚ UNIBANCO HOLDING S.A.
Consolidated Balance Sheet
(In millions of Reais)
| | | | | | | | | | | | |
Assets | | Note | | | 12/31/2020 | | | 12/31/2019 | |
Cash | | | | | | | 46,224 | | | | 30,367 | |
Financial Assets | | | | | | | 1,851,322 | | | | 1,501,481 | |
At Amortized Cost | | | | | | | 1,275,799 | | | | 1,101,892 | |
Compulsory deposits in the Central Bank of Brazil | | | | | | | 90,059 | | | | 91,248 | |
Interbank deposits | | | 4 | | | | 55,685 | | | | 34,583 | |
Securities purchased under agreements to resell | | | 4 | | | | 239,943 | | | | 198,428 | |
Securities | | | 9 | | | | 129,804 | | | | 133,119 | |
Loan and lease operations | | | 10 | | | | 714,104 | | | | 585,791 | |
Other financial assets | | | 18a | | | | 93,255 | | | | 94,752 | |
(-) Provision for Expected Loss | | | 4, 9 and 10 | | | | (47,051 | ) | | | (36,029 | ) |
At Fair Value Through Other Comprehensive Income | | | | | | | 109,942 | | | | 76,660 | |
Securities | | | 8 | | | | 109,942 | | | | 76,660 | |
At Fair Value Through Profit or Loss | | | | | | | 465,581 | | | | 322,929 | |
Securities | | | 5 | | | | 389,071 | | | | 281,075 | |
Derivatives | | | 6 and 7 | | | | 76,504 | | | | 41,854 | |
Other financial assets | | | 18a | | | | 6 | | | | — | |
Investments in associates and joint ventures | | | 11 | | | | 15,570 | | | | 15,097 | |
Fixed assets, net | | | 13 | | | | 6,937 | | | | 7,166 | |
Goodwill and Intangible assets, net | | | 14 | | | | 17,330 | | | | 19,719 | |
Tax assets | | | | | | | 66,095 | | | | 48,960 | |
Income tax and social contribution - current | | | | | | | 3,547 | | | | 1,644 | |
Income tax and social contribution - deferred | | | 24b | | | | 56,583 | | | | 38,914 | |
Other | | | | | | | 5,965 | | | | 8,402 | |
Other assets | | | 18a | | | | 15,773 | | | | 14,691 | |
| | | | | | | | | | | | |
Total assets | | | | 2,019,251 | | | | 1,637,481 | |
| | | | | | | | | |
The accompanying notes are an integral part of these consolidated financial statements.
| | |
| Itaú Unibanco Holding S.A. – Complete Financial Statements in IFRS – December 31, 2020 | | F-6 |
ITAÚ UNIBANCO HOLDING S.A.
Consolidated Balance Sheet
(In millions of Reais)
| | | | | | | | | | | | |
Liabilities and stockholders’ equity | | Note | | | 12/31/2020 | | | 12/31/2019 | |
Financial Liabilities | | | | | | | 1,579,686 | | | | 1,211,999 | |
At Amortized Cost | | | | | | | 1,495,641 | | | | 1,159,830 | |
Deposits | | | 15 | | | | 809,010 | | | | 507,060 | |
Securities sold under repurchase agreements | | | 17a | | | | 273,364 | | | | 256,583 | |
Interbank market funds | | | 17b | | | | 156,035 | | | | 174,862 | |
Institutional market funds | | | 17c | | | | 138,308 | | | | 104,244 | |
Other financial liabilities | | | 18b | | | | 118,924 | | | | 117,081 | |
At Fair Value Through Profit or Loss | | | | | | | 79,653 | | | | 48,029 | |
Derivatives | | | 6 and 7 | | | | 79,505 | | | | 47,828 | |
Structured notes | | | 16 | | | | 143 | | | | 201 | |
Other financial liabilities | | | 18b | | | | 5 | | | | — | |
Provision for Expected Loss | | | 10 | | | | 4,392 | | | | 4,140 | |
Loan commitments | | | | | | | 3,485 | | | | 3,303 | |
Financial guarantees | | | | | | | 907 | | | | 837 | |
Provision for insurance and private pensions | | | 27c | | | | 221,000 | | | | 218,334 | |
Provisions | | | 29 | | | | 19,819 | | | | 21,454 | |
Tax liabilities | | | 24c | | | | 5,710 | | | | 7,891 | |
Income tax and social contribution—current | | | | | | | 2,878 | | | | 3,997 | |
Income tax and social contribution—deferred | | | 24b | | | | 421 | | | | 1,058 | |
Other | | | | | | | 2,411 | | | | 2,836 | |
Other liabilities | | | 18b | | | | 38,511 | | | | 28,338 | |
Total liabilities | | | | | | | 1,864,726 | | | | 1,488,016 | |
Capital | | | 19a | | | | 97,148 | | | | 97,148 | |
Treasury shares | | | 19a | | | | (907 | ) | | | (1,274 | ) |
Additional paid-in capital | | | 19c | | | | 2,519 | | | | 2,175 | |
Appropriated reserves | | | 19c | | | | 17,228 | | | | 12,948 | |
Unappropriated reserves | | | 19c | | | | 29,926 | | | | 29,878 | |
Other comprehensive income | | | | | | | (2,921 | ) | | | (3,950 | ) |
Total stockholders’ equity attributed to the owners of the parent company | | | | | | | 142,993 | | | | 136,925 | |
Non-controlling interests | | | 19d | | | | 11,532 | | | | 12,540 | |
Total stockholders’ equity | | | | | | | 154,525 | | | | 149,465 | |
| | | | | | | | | | | | |
Total liabilities and stockholders’ equity | | | | | | | 2,019,251 | | | | 1,637,481 | |
| | | | | | | | | | | | |
The accompanying notes are an integral part of these consolidated financial statements.
| | |
| Itaú Unibanco Holding S.A. – Complete Financial Statements in IFRS – December 31, 2020 | | F-7 |
ITAÚ UNIBANCO HOLDING S.A.
Consolidated Statement of Income
Periods ended
(In millions of Reais, except for number of shares and earnings per share information)
| | | | | | | | | | | | | | | | |
| | | Note | | | 01/01 to
12/31/2020 | | | 01/01 to
12/31/2019 | | | 01/01 to
12/31/2018 | |
Operating Revenues | | | | | | | 100,199 | | | | 117,079 | | | | 104,200 | |
Interest and similar income of financial assets at amortized cost and at fair value through other comprehensive income | | | 21a | | | | 113,262 | | | | 117,523 | | | | 110,324 | |
Interest, similar income and dividend of financial assets at fair value through profit or loss | | | | | | | 15,716 | | | | 22,760 | | | | 22,853 | |
Interest and similar expenses | | | 21b | | | | (73,558 | ) | | | (75,958 | ) | | | (70,612 | ) |
Adjustments to Fair Value of Financial Assets and Liabilities | | | 21c | | | | (8,056 | ) | | | 4,098 | | | | (4,834 | ) |
Foreign exchange results and exchange variations in foreign transactions | | | | | | | 2,689 | | | | 927 | | | | 2,974 | |
Commissions and Banking Fees | | | 22 | | | | 38,557 | | | | 39,032 | | | | 36,809 | |
Income from insurance and private pension operations before claim and selling expenses | | | | | | | 4,488 | | | | 4,553 | | | | 3,961 | |
Revenues from insurance premiuns and private pensions | | | | | | | 14,804 | | | | 19,624 | | | | 24,097 | |
Change in provision for insurance and private pension | | | | | | | (10,316 | ) | | | (15,071 | ) | | | (20,136 | ) |
Other income | | | 3 | | | | 7,101 | | | | 4,144 | | | | 2,725 | |
Expected Loss from Financial Assets and Claims | | | | | | | (25,980 | ) | | | (18,567 | ) | | | (10,182 | ) |
Expected Loss with Loan and Lease Operations | | | 10c | | | | (24,452 | ) | | | (18,298 | ) | | | (10,587 | ) |
Expected Loss with Other Financial Asset, net | | | | | | | (174 | ) | | | 1,026 | | | | 1,633 | |
(Expenses) / Recovery of claims | | | | | | | (1,354 | ) | | | (1,295 | ) | | | (1,228 | ) |
Operating Revenues Net of Expected Losses from Financial Assets and Claims | | | | | | | 74,219 | | | | 98,512 | | | | 94,018 | |
Other operating income (expenses) | | | | | | | (68,989 | ) | | | (67,269 | ) | | | (63,410 | ) |
General and administrative expenses | | | 23 | | | | (64,207 | ) | | | (61,012 | ) | | | (57,538 | ) |
Tax expenses | | | | | | | (6,181 | ) | | | (7,572 | ) | | | (6,619 | ) |
Share of profit or (loss) in associates and joint ventures | | | 11 | | | | 1,399 | | | | 1,315 | | | | 747 | |
Income / (loss) before income tax and social contribution | | | | | | | 5,230 | | | | 31,243 | | | | 30,608 | |
Current income tax and social contribution | | | 24a | | | | (8,655 | ) | | | (9,092 | ) | | | (2,564 | ) |
Deferred income tax and social contribution | | | 24a | | | | 18,489 | | | | 5,662 | | | | (2,405 | ) |
Net income / (loss) | | | | | | | 15,064 | | | | 27,813 | | | | 25,639 | |
Net income attributable to owners of the parent company | | | 25 | | | | 18,896 | | | | 27,113 | | | | 24,907 | |
Net income / (loss) attributable to non-controlling interests | | | 19d | | | | (3,832 | ) | | | 700 | | | | 732 | |
Earnings per share - basic | | | 25 | | | | | | | | | | | | | |
Common | | | | | | | 1.94 | | | | 2.78 | | | | 2.56 | |
Preferred | | | | | | | 1.94 | | | | 2.78 | | | | 2.56 | |
Earnings per share - diluted | | | 25 | | | | | | | | | | | | | |
Common | | | | | | | 1.93 | | | | 2.77 | | | | 2.55 | |
Preferred | | | | | | | 1.93 | | | | 2.77 | | | | 2.55 | |
Weighted average number of outstanding shares - basic | | | 25 | | | | | | | | | | | | | |
Common | | | | | | | 4,958,290,359 | | | | 4,958,290,359 | | | | 4,958,290,359 | |
Preferred | | | | | | | 4,801,324,161 | | | | 4,781,855,588 | | | | 4,759,872,085 | |
Weighted average number of outstanding shares - diluted | | | 25 | | | | | | | | | | | | | |
Common | | | | | | | 4,958,290,359 | | | | 4,958,290,359 | | | | 4,958,290,359 | |
Preferred | | | | | | | 4,843,233,835 | | | | 4,826,925,107 | | | | 4,815,473,777 | |
The accompanying notes are an integral part of these consolidated financial statements
| | |
| Itaú Unibanco Holding S.A. – Complete Financial Statements in IFRS – December 31, 2020 | | F-8 |
ITAÚ UNIBANCO HOLDING S.A.
Consolidated Statement of Comprehensive Income
Periods ended
(In millions of Reais)
| | | | | | | | | | | | | | | | |
| | | Note | | | 01/01 to
12/31/2020 | | | 01/01 to
12/31/2019 | | | 01/01 to
12/31/2018 | |
Net income | | | | | | | 15,064 | | | | 27,813 | | | | 25,639 | |
Financial assets at fair value through other comprehensive income | | | | | | | 148 | | | | 1,810 | | | | (166 | ) |
Change in fair value | | | | | | | 1,214 | | | | 2,883 | | | | (576 | ) |
Tax effect | | | | | | | (457 | ) | | | (696 | ) | | | 270 | |
(Gains) / losses transferred to income statement | | | 21c | | | | (1,107 | ) | | | (628 | ) | | | 254 | |
Tax effect | | | | | | | 498 | | | | 251 | | | | (114 | ) |
Hedge | | | | | | | (3,557 | ) | | | (16 | ) | | | (1,135 | ) |
Cash flow hedge | | | 7 | | | | 499 | | | | (56 | ) | | | (81 | ) |
Change in fair value | | | | | | | 947 | | | | (191 | ) | | | (256 | ) |
Tax effect | | | | | | | (448 | ) | | | 135 | | | | 175 | |
Hedge of net investment in foreign operation | | | 7 | | | | (4,056 | ) | | | 40 | | | | (1,054 | ) |
Change in fair value | | | | | | | (7,616 | ) | | | 83 | | | | (1,793 | ) |
Tax effect | | | | | | | 3,560 | | | | (43 | ) | | | 739 | |
Remeasurements of liabilities for post-employment benefits (*) | | | | | | | (192 | ) | | | (350 | ) | | | (164 | ) |
Remeasurements | | | 26 | | | | (349 | ) | | | (648 | ) | | | (267 | ) |
Tax effect | | | | | | | 157 | | | | 298 | | | | 103 | |
Foreign exchange variation in foreign investments | | | | | | | 4,630 | | | | (1,582 | ) | | | 1,139 | |
Total other comprehensive income | | | | | | | 1,029 | | | | (138 | ) | | | (326 | ) |
Total comprehensive income | | | | | | | 16,093 | | | | 27,675 | | | | 25,313 | |
Comprehensive income attributable to non-controlling interests | | | | | | | (3,832 | ) | | | 700 | | | | 732 | |
Comprehensive income attributable to the owners of the parent company | | | | | | | 19,925 | | | | 26,975 | | | | 24,581 | |
| (*) | Amounts that will not be subsequently reclassified to income. |
The accompanying notes are an integral part of these consolidated financial statements.
| | |
| Itaú Unibanco Holding S.A. – Complete Financial Statements in IFRS – December 31, 2020 | | F-9 |
ITAÚ UNIBANCO HOLDING S.A.
Consolidated Statement of Changes in Stockholders’ Equity (Notes 19 and 20)
Periods ended December 31, 2020, 2019 and 2018
(In millions of Reais)
| | | | | | | | | | | | | | | | | | | | | | | | | | | | | | | | | | | | | | | | | | | | | | | | | | | | |
| | | Attributed to owners of the parent company | | | | | | | | | | |
| | | | | | | | | | | | | | | | | | | | | Other comprehensive income | | | | | | | | | | |
| | | Capital | | | Treasury
shares | | | Additional
paid-in
capital | | | Appropriated
reserves | | | Unappropriated
reserves | | | Retained
earnings | | | Financial
Assets at Fair
Value Through
Other
Comprehensive
Income (1) | | | Remeasurements
of liabilities of
post-
employment
benefits | | | Conversion
adjustments
of foreign
investments | | | Gains and
losses –
hedge (2) | | | Total
stockholders’
equity –
owners of the
parent
company | | | Total
stockholders’
equity – non-
controlling
interests | | | Total | |
Balance at 01/01/2018 | | | 97,148 | | | | (2,743 | ) | | | 1,930 | | | | 12,499 | | | | 26,030 | | | | — | | | | (944 | ) | | | (825 | ) | | | 2,667 | | | | (4,384 | ) | | | 131,378 | | | | 12,978 | | | | 144,356 | |
Transactions with owners | | | — | | | | 923 | | | | 190 | | | | (534 | ) | | | — | | | | — | | | | — | | | | — | | | | — | | | | — | | | | 579 | | | | 131 | | | | 710 | |
Cancellation of treasury shares – Meeting of the Board of Directors 02/22/2018 | | | — | | | | 534 | | | | — | | | | (534 | ) | | | — | | | | — | | | | — | | | | — | | | | — | | | | — | | | | — | | | | — | | | | — | |
Acquisition of treasury shares | | | — | | | | (510 | ) | | | — | | | | — | | | | — | | | | — | | | | — | | | | — | | | | — | | | | — | | | | (510 | ) | | | — | | | | (510 | ) |
Result of delivery of treasury shares | | | — | | | | 899 | | | | 422 | | | | — | | | | — | | | | — | | | | — | | | | — | | | | — | | | | — | | | | 1,321 | | | | — | | | | 1,321 | |
Recognition of share-based payment plans | | | — | | | | — | | | | (232 | ) | | | — | | | | — | | | | — | | | | — | | | | — | | | | — | | | | — | | | | (232 | ) | | | — | | | | (232 | ) |
(Increase) / Reduction of interest of controlling stockholders (Note 2.4a I and 3) | | | — | | | | — | | | | — | | | | — | | | | — | | | | — | | | | — | | | | — | | | | — | | | | — | | | | — | | | | 131 | | | | 131 | |
Dividends | | | — | | | | — | | | | — | | | | 7,394 | | | | — | | | | (12,650 | ) | | | — | | | | — | | | | — | | | | — | | | | (5,256 | ) | | | (157 | ) | | | (5,413 | ) |
Interest on capital | | | — | | | | — | | | | — | | | | 7,285 | | | | — | | | | (8,198 | ) | | | — | | | | — | | | | — | | | | — | | | | (913 | ) | | | — | | | | (913 | ) |
Dividends / Interest on capital paid in 2018 – declared after 12/31/2017 | | | — | | | | — | | | | — | | | | (13,673 | ) | | | — | | | | — | | | | — | | | | — | | | | — | | | | — | | | | (13,673 | ) | | | — | | | | (13,673 | ) |
Unclaimed dividends | | | — | | | | — | | | | — | | | | — | | | | — | | | | 4 | | | | — | | | | — | | | | — | | | | — | | | | 4 | | | | — | | | | 4 | |
Corporate reorganizations (Note 2.4 a III) | | | — | | | | — | | | | — | | | | (592 | ) | | | — | | | | — | | | | — | | | | — | | | | — | | | | — | | | | (592 | ) | | | — | | | | (592 | ) |
Other | | | — | | | | — | | | | — | | | | — | | | | 674 | | | | — | | | | — | | | | — | | | | — | | | | — | | | | 674 | | | | — | | | | 674 | |
Total comprehensive income | | | — | | | | — | | | | — | | | | — | | | | — | | | | 24,907 | | | | (166 | ) | | | (164 | ) | | | 1,139 | | | | (1,135 | ) | | | 24,581 | | | | 732 | | | | 25,313 | |
Net income | | | — | | | | — | | | | — | | | | — | | | | — | | | | 24,907 | | | | — | | | | — | | | | — | | | | — | | | | 24,907 | | | | 732 | | | | 25,639 | |
Other comprehensive income for the period | | | — | | | | — | | | | — | | | | — | | | | — | | | | — | | | | (166 | ) | | | (164 | ) | | | 1,139 | | | | (1,135 | ) | | | (326 | ) | | | — | | | | (326 | ) |
Appropriations: | | | | | | | | | | | | | | | | | | | | | | | | | | | | | | | | | | | | | | | | | | | | | | | | | | | | |
Legal reserve | | | — | | | | — | | | | — | | | | 1,097 | | | | — | | | | (1,097 | ) | | | — | | | | — | | | | — | | | | — | | | | — | | | | — | | | | — | |
Statutory reserve | | | — | | | | — | | | | — | | | | 4 | | | | 2,962 | | | | (2,966 | ) | | | — | | | | — | | | | — | | | | — | | | | — | | | | — | | | | — | |
Balance at 12/31/2018 | | | 97,148 | | | | (1,820 | ) | | | 2,120 | | | | 13,480 | | | | 29,666 | | | | — | | | | (1,110 | ) | | | (989 | ) | | | 3,806 | | | | (5,519 | ) | | | 136,782 | | | | 13,684 | | | | 150,466 | |
| | | | | | | | | | | | | | | | | | | | | | | | | | | | | | | | | | | | | | | | | | | | | | | | | | | | |
Change in the period | | | — | | | | 923 | | | | 190 | | | | 981 | | | | 3,636 | | | | — | | | | (166 | ) | | | (164 | ) | | | 1,139 | | | | (1,135 | ) | | | 5,404 | | | | 706 | | | | 6,110 | |
| | | | | | | | | | | | | | | | | | | | | | | | | | | | | | | | | | | | | | | | | | | | | | | | | | | | |
Balance at 01/01/2019 | | | 97,148 | | | | (1,820 | ) | | | 2,120 | | | | 13,480 | | | | 29,666 | | | | — | | | | (1,110 | ) | | | (989 | ) | | | 3,806 | | | | (5,519 | ) | | | 136,782 | | | | 13,684 | | | | 150,466 | |
Transactions with owners | | | — | | | | 546 | | | | 55 | | | | — | | | | — | | | | — | | | | — | | | | — | | | | — | | | | — | | | | 601 | | | | — | | | | 601 | |
Result of delivery of treasury shares | | | — | | | | 546 | | | | 351 | | | | — | | | | — | | | | — | | | | — | | | | — | | | | — | | | | — | | | | 897 | | | | — | | | | 897 | |
Recognition of share-based payment plans | | | — | | | | — | | | | (296 | ) | | | — | | | | — | | | | — | | | | — | | | | — | | | | — | | | | — | | | | (296 | ) | | | — | | | | (296 | ) |
(Increase) / Reduction of interest of controlling stockholders (Note 2.4a I and 3) | | | — | | | | — | | | | — | | | | — | | | | — | | | | — | | | | — | | | | — | | | | — | | | | — | | | | — | | | | (1,567 | ) | | | (1,567 | ) |
Dividends | | | — | | | | — | | | | — | | | | 4,709 | | | | — | | | | (14,129 | ) | | | — | | | | — | | | | — | | | | — | | | | (9,420 | ) | | | (277 | ) | | | (9,697 | ) |
Interest on capital | | | — | | | | — | | | | — | | | | 5,102 | | | | — | | | | (5,468 | ) | | | — | | | | — | | | | — | | | | — | | | | (366 | ) | | | — | | | | (366 | ) |
Dividends / Interest on capital paid in 2019 – declared after 12/31/2018 | | | — | | | | — | | | | — | | | | (17,500 | ) | | | — | | | | — | | | | — | | | | — | | | | — | | | | — | | | | (17,500 | ) | | | — | | | | (17,500 | ) |
Unclaimed dividends and Interest on capital | | | — | | | | — | | | | — | | | | — | | | | — | | | | 42 | | | | — | | | | — | | | | — | | | | — | | | | 42 | | | | — | | | | 42 | |
Other (3) | | | — | | | | — | | | | — | | | | — | | | | (189 | ) | | | — | | | | — | | | | — | | | | — | | | | — | | | | (189 | ) | | | — | | | | (189 | ) |
Total comprehensive income | | | — | | | | — | | | | — | | | | — | | | | — | | | | 27,113 | | | | 1,810 | | | | (350 | ) | | | (1,582 | ) | | | (16 | ) | | | 26,975 | | | | 700 | | | | 27,675 | |
Net income | | | — | | | | — | | | | — | | | | — | | | | — | | | | 27,113 | | | | — | | | | — | | | | — | | | | — | | | | 27,113 | | | | 700 | | | | 27,813 | |
Other comprehensive income for the period | | | — | | | | — | | | | — | | | | — | | | | — | | | | — | | | | 1,810 | | | | (350 | ) | | | (1,582 | ) | | | (16 | ) | | | (138 | ) | | | — | | | | (138 | ) |
Appropriations: | | | | | | | | | | | | | | | | | | | | | | | | | | | | | | | | | | | | | | | | | | | | | | | | | | | | |
Legal reserve | | | — | | | | — | | | | — | | | | 1,336 | | | | — | | | | (1,336 | ) | | | — | | | | — | | | | — | | | | — | | | | — | | | | — | | | | — | |
Statutory reserve | | | — | | | | — | | | | — | | | | 5,821 | | | | 401 | | | | (6,222 | ) | | | — | | | | — | | | | — | | | | — | | | | — | | | | — | | | | — | |
Balance at 12/31/2019 | | | 97,148 | | | | (1,274 | ) | | | 2,175 | | | | 12,948 | | | | 29,878 | | | | — | | | | 700 | | | | (1,339 | ) | | | 2,224 | | | | (5,535 | ) | | | 136,925 | | | | 12,540 | | | | 149,465 | |
| | | | | | | | | | | | | | | | | | | | | | | | | | | | | | | | | | | | | | | | | | | | | | | | | | | | |
Change in the period | | | — | | | | 546 | | | | 55 | | | | (532 | ) | | | 212 | | | | — | | | | 1,810 | | | | (350 | ) | | | (1,582 | ) | | | (16 | ) | | | 143 | | | | (1,144 | ) | | | (1,001 | ) |
| | | | | | | | | | | | | | | | | | | | | | | | | | | | | | | | | | | | | | | | | | | | | | | | | | | | |
Balance at 01/01/2020 | | | 97,148 | | | | (1,274 | ) | | | 2,175 | | | | 12,948 | | | | 29,878 | | | | — | | | | 700 | | | | (1,339 | ) | | | 2,224 | | | | (5,535 | ) | | | 136,925 | | | | 12,540 | | | | 149,465 | |
Transactions with owners | | | — | | | | 367 | | | | 344 | | | | — | | | | — | | | | — | | | | — | | | | — | | | | — | | | | — | | | | 711 | | | | 3,329 | | | | 4,040 | |
Result of delivery of treasury shares | | | — | | | | 367 | | | | 200 | | | | — | | | | — | | | | — | | | | — | | | | — | | | | — | | | | — | | | | 567 | | | | — | | | | 567 | |
Recognition of share-based payment plans | | | — | | | | — | | | | 144 | | | | — | | | | — | | | | — | | | | — | | | | — | | | | — | | | | — | | | | 144 | | | | — | | | | 144 | |
(Increase) / Reduction of interest of controlling stockholders (Note 2.4a I and 3) | | | — | | | | — | | | | — | | | | — | | | | — | | | | — | | | | — | | | | — | | | | — | | | | — | | | | — | | | | 3,329 | | | | 3,329 | |
Dividends | | | — | | | | — | | | | — | | | | — | | | | — | | | | (1,756 | ) | | | — | | | | — | | | | — | | | | — | | | | (1,756 | ) | | | (505 | ) | | | (2,261 | ) |
Interest on capital | | | — | | | | — | | | | — | | | | — | | | | — | | | | (3,232 | ) | | | — | | | | — | | | | — | | | | — | | | | (3,232 | ) | | | — | | | | (3,232 | ) |
Dividends / Interest on capital paid in 2020 – declared after 12/31/2019 | | | — | | | | — | | | | — | | | | (9,811 | ) | | | — | | | | — | | | | — | | | | — | | | | — | | | | — | | | | (9,811 | ) | | | — | | | | (9,811 | ) |
Unclaimed dividends and Interest on capital | | | — | | | | — | | | | — | | | | — | | | | — | | | | 118 | | | | — | | | | — | | | | — | | | | — | | | | 118 | | | | — | | | | 118 | |
Other (3) | | | — | | | | — | | | | — | | | | — | | | | 113 | | | | — | | | | — | | | | — | | | | — | | | | — | | | | 113 | | | | — | | | | 113 | |
Total comprehensive income | | | — | | | | — | | | | — | | | | — | | | | | | | | 18,896 | | | | 148 | | | | (192 | ) | | | 4,630 | | | | (3,557 | ) | | | 19,925 | | | | (3,832 | ) | | | 16,093 | |
Net income | | | — | | | | — | | | | — | | | | — | | | | — | | | | 18,896 | | | | — | | | | — | | | | — | | | | — | | | | 18,896 | | | | (3,832 | ) | | | 15,064 | |
Other comprehensive income for the period | | | — | | | | — | | | | — | | | | — | | | | — | | | | — | | | | 148 | | | | (192 | ) | | | 4,630 | | | | (3,557 | ) | | | 1,029 | | | | — | | | | 1,029 | |
Appropriations: | | | | | | | | | | | | | | | | | | | | | | | | | | | | | | | | | | | | | | | | | | | | | | | | | | | | |
Legal reserve | | | — | | | | — | | | | — | | | | 948 | | | | — | | | | (948 | ) | | | — | | | | — | | | | — | | | | — | | | | — | | | | — | | | | — | |
Statutory reserve | | | — | | | | — | | | | — | | | | 13,143 | | | | (65 | ) | | | (13,078 | ) | | | — | | | | — | | | | — | | | | — | | | | — | | | | — | | | | — | |
Balance at 12/31/2020 | | | 97,148 | | | | (907 | ) | | | 2,519 | | | | 17,228 | | | | 29,926 | | | | — | | | | 848 | | | | (1,531 | ) | | | 6,854 | | | | (9,092 | ) | | | 142,993 | | | | 11,532 | | | | 154,525 | |
| | | | | | | | | | | | | | | | | | | | | | | | | | | | | | | | | | | | | | | | | | | | | | | | | | | | |
Change in the period | | | — | | | | 367 | | | | 344 | | | | 4,280 | | | | 48 | | | | — | | | | 148 | | | | (192 | ) | | | 4,630 | | | | (3,557 | ) | | | 6,068 | | | | (1,008 | ) | | | 5,060 | |
| | | | | | | | | | | | | | | | | | | | | | | | | | | | | | | | | | | | | | | | | | | | | | | | | | | | |
| (1) | Includes the share in other comprehensive income of investments in associates and joint ventures related to financial assets at fair value through other comprehensive income. |
| (2) | Includes cash flow hedge and hedge of net investment in foreign operation. |
| (3) | Includes Argentina´s hyperinflation adjustment. |
The accompanying notes are an integral part of these consolidated financial statements.
| | |
| Itaú Unibanco Holding S.A. – Complete Financial Statements in IFRS – December 31, 2020 | | F-10 |
ITAÚ UNIBANCO HOLDING S.A.
Consolidated Statement of Cash Flows
(In millions of Reais)
| | | | | | | | | | | | | | | | |
| | | Note | | | 01/01 to
12/31/2020 | | | 01/01 to
12/31/2019 | | | 01/01 to
12/31/2018 | |
Adjusted net income | | | | | | | 60,953 | | | | 61,134 | | | | 62,855 | |
Net income | | | | | | | 15,064 | | | | 27,813 | | | | 25,639 | |
Adjustments to net income: | | | | | | | 45,889 | | | | 33,321 | | | | 37,216 | |
Share-based payment | | | | | | | 217 | | | | (141 | ) | | | (98 | ) |
Adjustments to fair value of financial assets through Profit or Loss and Derivatives | | | | | | | 739 | | | | 310 | | | | 551 | |
Effects of changes in exchange rates on cash and cash equivalents | | | | | | | 11,677 | | | | (54 | ) | | | (990 | ) |
Expected Loss from Financial Assets and Claims | | | | | | | 25,980 | | | | 18,567 | | | | 10,182 | |
Income from interest and foreign exchange variation from operations with subordinated debt | | | | | | | 20,774 | | | | 4,433 | | | | 8,759 | |
Provision for insurance and private pension | | | | | | | 10,316 | | | | 15,071 | | | | 20,136 | |
Depreciation and amortization | | | 13 and 14 | | | | 3,729 | | | | 3,561 | | | | 3,567 | |
Expense from update / charges on the provision for civil, labor, tax and legal obligations | | | | | | | 893 | | | | 1,925 | | | | 1,037 | |
Provision for civil, labor, tax and legal obligations | | | | | | | 3,602 | | | | 5,132 | | | | 2,465 | |
Revenue from update / charges on deposits in guarantee | | | | | | | (344 | ) | | | (519 | ) | | | (199 | ) |
Deferred taxes (excluding hedge tax effects) | | | 24b | | | | (239 | ) | | | 2,499 | | | | 10,287 | |
Income from share in the net income of associates and joint ventures and other investments | | | | | | | (1,399 | ) | | | (1,315 | ) | | | (747 | ) |
Income from Financial assets - At fair value through other comprehensive income | | | 21c | | | | (1,107 | ) | | | (628 | ) | | | 254 | |
Income from interest and foreign exchange variation of financial assets at fair value through other comprehensive income | | | | | | | (21,057 | ) | | | (8,420 | ) | | | (12,808 | ) |
Income from Interest and foreign exchange variation of financial assets at amortized cost | | | | | | | (8,309 | ) | | | (3,332 | ) | | | (4,353 | ) |
(Gain) loss on sale of investments and fixed assets | | | | | | | (4,165 | ) | | | (168 | ) | | | (297 | ) |
Other | | | 23 | | | | 4,582 | | | | (3,600 | ) | | | (530 | ) |
Change in assets and liabilities | | | | | | | (1,462 | ) | | | (25,974 | ) | | | (33,132 | ) |
(Increase) / decrease in assets | | | | | | | | | | | | | | | | |
Interbank deposits | | | | | | | (21,775 | ) | | | (6,897 | ) | | | (9,404 | ) |
Securities purchased under agreements to resell | | | | | | | (21,639 | ) | | | 62,487 | | | | (29,561 | ) |
Compulsory deposits with the Central Bank of Brazil | | | | | | | 1,189 | | | | 2,900 | | | | 4,689 | |
Loan operations | | | | | | | (141,951 | ) | | | (63,999 | ) | | | (51,919 | ) |
Derivatives (assets / liabilities) | | | | | | | (3,012 | ) | | | 1,918 | | | | 217 | |
Financial assets designated at fair value through profit or loss | | | | | | | (108,696 | ) | | | (18,202 | ) | | | (13,105 | ) |
Other financial assets | | | | | | | 1,841 | | | | (19,143 | ) | | | (15,323 | ) |
Other tax assets | | | | | | | 534 | | | | 3 | | | | (1,669 | ) |
Other assets | | | | | | | (18,008 | ) | | | (9,232 | ) | | | (7,447 | ) |
(Decrease) / increase in liabilities | | | | | | | | | | | | | | | | |
Deposits | | | | | | | 301,950 | | | | 43,636 | | | | 60,486 | |
Deposits received under securities repurchase agreements | | | | | | | 16,781 | | | | (73,654 | ) | | | 17,603 | |
Funds from interbank markets | | | | | | | (18,827 | ) | | | 40,192 | | | | 10,083 | |
Funds from institutional markets | | | | | | | 18,611 | | | | 121 | | | | (1,125 | ) |
Other financial liabilities | | | | | | | 1,843 | | | | 19,652 | | | | 11,486 | |
Financial liabilities at fair value throught profit or loss | | | | | | | (60 | ) | | | 9 | | | | (273 | ) |
Provision for insurance and private pension | | | | | | | (9,004 | ) | | | 781 | | | | (1,409 | ) |
Provisions | | | | | | | (3,550 | ) | | | 673 | | | | (495 | ) |
Tax liabilities | | | | | | | (1,910 | ) | | | (3,526 | ) | | | (1,739 | ) |
Other liabilities | | | | | | | 10,048 | | | | 2,568 | | | | (348 | ) |
Payment of income tax and social contribution | | | | | | | (5,827 | ) | | | (6,261 | ) | | | (3,879 | ) |
Net cash from / (used in) operating activities | | | | | | | 59,491 | | | | 35,160 | | | | 29,723 | |
Dividends / Interest on capital received from investments in associates and joint ventures | | | | | | | 487 | | | | 838 | | | | 671 | |
Cash from the sale of financial assets - At fair value through other comprehensive income | | | | | | | 38,738 | | | | 9,074 | | | | 16,622 | |
Cash upon sale of investments in associates and joint ventures | | | | | | | 4,982 | | | | 68 | | | | 266 | |
Cash upon sale of fixed assets | | | 13 | | | | 331 | | | | 175 | | | | 215 | |
Mutual rescission of intangible assets agreements | | | | | | | 309 | | | | 64 | | | | 35 | |
(Purchase) of financial assets at fair value through other comprehensive income | | | | | | | (50,598 | ) | | | (24,820 | ) | | | (591 | ) |
(Purchase) / redemptions of financial assets at amortized cost | | | | | | | 11,863 | | | | (19,359 | ) | | | 5,479 | |
(Purchase) of investments in associates and joint ventures | | | | | | | (52 | ) | | | (387 | ) | | | (6,718 | ) |
(Purchase) of fixed assets | | | 13 | | | | (1,716 | ) | | | (1,621 | ) | | | (1,483 | ) |
(Purchase) of intangible assets | | | 14 | | | | (3,591 | ) | | | (2,691 | ) | | | (1,381 | ) |
Net cash from / (used in) investment activities | | | | | | | 753 | | | | (38,659 | ) | | | 13,115 | |
Funding from institutional markets | | | | | | | 5,260 | | | | 8,548 | | | | 2,906 | |
Redemptions in institutional markets | | | | | | | (10,581 | ) | | | (2,833 | ) | | | (15,048 | ) |
Change in non-controlling interests stockholders | | | | | | | 3,330 | | | | (1,617 | ) | | | 128 | |
Result of delivery of treasury shares | | | | | | | 494 | | | | 742 | | | | 1,187 | |
Purchase of treasury shares | | | | | | | — | | | | — | | | | (510 | ) |
Dividends and interest on capital paid to non-controlling interests | | | | | | | (506 | ) | | | (227 | ) | | | (154 | ) |
Dividends and interest on capital paid | | | | | | | (11,552 | ) | | | (25,915 | ) | | | (20,093 | ) |
Net cash from / (used in) financing activities | | | | | | | (13,555 | ) | | | (21,302 | ) | | | (31,584 | ) |
Net increase / (decrease) in cash and cash equivalents | | | 2.4c | | | | 46,689 | | | | (24,801 | ) | | | 11,254 | |
Cash and cash equivalents at the beginning of the period | | | | | | | 70,811 | | | | 95,558 | | | | 83,314 | |
Effects of changes in exchange rates on cash and cash equivalents | | | | | | | (11,677 | ) | | | 54 | | | | 990 | |
Cash and cash equivalents at the end of the period | | | | | | | 105,823 | | | | 70,811 | | | | 95,558 | |
| | | | | | | | | | | | | | | | |
Cash | | | | | | | 46,224 | | | | 30,367 | | | | 37,159 | |
Interbank deposits | | | | | | | 3,888 | | | | 4,561 | | | | 3,295 | |
Securities purchased under agreements to resell - Collateral held | | | | | | | 55,711 | | | | 35,883 | | | | 55,104 | |
Additional information on cash flow (Mainly Operating activities) | | | | | | | | | | | | | | | | |
Interest received | | | | | | | 121,558 | | | | 134,225 | | | | 122,405 | |
Interest paid | | | | | | | 77,011 | | | | 77,315 | | | | 84,668 | |
Non-cash transactions | | | | | | | | | | | | | | | | |
Loans transferred to assets held for sale | | | | | | | — | | | | — | | | | — | |
Dividends and interest on capital declared and not yet paid | | | | | | | 3,178 | | | | 838 | | | | 515 | |
The accompanying notes are an integral part of these consolidated financial statements.
| | |
| Itaú Unibanco Holding S.A. – Complete Financial Statements in IFRS – December 31, 2020 | | F-11 |
ITAÚ UNIBANCO HOLDING S.A.
Notes to the Consolidated Financial Statements
At 12/31/2020 and 12/31/2019 for balance sheet accounts and
From 01/01 to 12/31 of 2020, 2019 and 2018 for income statement accounts
(In millions of Reais, except information per share)
Note 1 - Overview
Itaú Unibanco Holding S.A. (ITAÚ UNIBANCO HOLDING) is a publicly-held company, organized and existing under the laws of Brazil. The head office is located at Praça Alfredo Egydio de Souza Aranha, n° 100, in the city of São Paulo, state of São Paulo, Brazil.
ITAÚ UNIBANCO HOLDING has a presence in 18 countries and territories and offers a wide variety of financial products and services to personal and corporate customers in Brazil and abroad, not necessarily related to Brazil, through its branches, subsidiaries and international affiliates. It offers a full range of banking services, through its different portfolios: commercial banking; investment banking; real estate lending; loans, financing and investment; leasing and foreign exchange business. Its operations are divided into three segments: Retail Banking, Wholesale Banking, and Activities with the Market + Corporation. Further detailed segment information is presented in Note 30.
ITAÚ UNIBANCO HOLDING is a financial holding company controlled by Itaú Unibanco Participações S.A. (“IUPAR”), a holding company which owns 51.71% of our common shares, and which is jointly controlled by (i) Itaúsa S.A. (“ITAÚSA”), a holding company controlled by members of the Egydio de Souza Aranha family, and (ii) Companhia E. Johnston de Participações (“E. JOHNSTON”), a holding company controlled by the Moreira Salles family. Itaúsa also directly holds 39.21% of ITAÚ UNIBANCO HOLDING’s common shares.
These consolidated financial statements were approved by the Board of Directors on February 01, 2021.
| | |
| Itaú Unibanco Holding S.A. – Complete Financial Statements in IFRS – December 31, 2020 | | F-12 |
ITAÚ UNIBANCO HOLDING S.A.
Notes to the Consolidated Financial Statements
At 12/31/2020 and 12/31/2019 for balance sheet accounts and
From 01/01 to 12/31 of 2020, 2019 and 2018 for income statement accounts
(In millions of Reais, except information per share)
Note 2 – Significant accounting policies
The Consolidated Financial Statements of ITAÚ UNIBANCO HOLDING were prepared in accordance with the requirements and guidelines of the National Monetary Council (CMN), which require that as from December 31, 2010 annual Consolidated Financial Statements are prepared in accordance with the International Financial Reporting Standards (IFRS), issued by the International Accounting Standards Board (IASB).
In the preparation of these Consolidated Financial Statements, ITAÚ UNIBANCO HOLDING adopted the criteria for recognition, measurement and disclosure established in the IFRS and in the interpretations of the International Financial Reporting Interpretation Committee (IFRIC).
Management believes that the information included in these Consolidated Financial Statements is relevant and a faithful representation of the information used in the management of the ITAÚ UNIBANCO HOLDING.
| 2.2. | New accounting standards changes and interpretations of existing standards |
| | a) | Accounting standards applicable for period ended December 31, 2020 |
| | • | | Amendment in Conceptual Framework – The main changes refer to: definitions of assets and liabilities, recognition criteria, derecognition, measurement, presentation and disclosure for equity and results elements. These changes are effective for the years started on January 1st, 2020 and there are no impacts on the Consolidated Financial Statements of ITAÚ UNIBANCO HOLDING. |
| | • | | Interest Rate Benchmark Reform (IBOR Reform) Phase I—Amendments to IFRS 9 – Financial Instruments, IAS 39 – Financial Instruments: Recognition and Measurement and IFRS 7 – Financial Instruments: Disclosures – Due to the changes in the interest rates used as market references – IBOR (Interbank Offered Rate), that will be terminated in future periods, there may be uncertainties in the evaluation of hedge accounting structures. Regulatory changes aim at minimizing possible impacts on these structures in the current scenario of prereplacement of rates. The regulatory exemption setting forth that these rates will not be replaced during the period of uncertainty in the analysis of hedge accounting relationships will be applied. These changes are effective for the years beginning January 1st, 2020 and they will be applied until the effective replacement of IBORs occurs or until the hedge accounting relationships are discontinued. No significant impacts have been identified in the hedge accounting structures for the Consolidated Financial Statements of ITAÚ UNIBANCO HOLDING, in the prereplacement period of IBORs. |
ITAÚ UNIBANCO HOLDING is exposed mainly to Libor and Euribor rates in hedge accounting structures. Since 2018, ITAÚ UNIBANCO HOLDING brings together working groups to follow the progress of discussions in the international market about the replacement of IBORs. For standardized agreements, ITAÚ UNIBANCO HOLDING will assume the updates of rates made by the respective clearings and the International Swaps and Derivatives Association—ISDA). For the other agreements, whenever possible, they will be negotiated and adjusted gradually until the end of 2021, date on which the market expects the end of disclosures of IBORs.
| | • | | Amendments to IFRS 16 – Leases: Practical expedient that enables lessees not to characterize the lease concessions motivated by the COVID-19 pandemic as an agreement modification. This standard is effective for the years beginning on June 1st, 2020, and earlier application is permitted. ITAÚ UNIBANCO HOLDING opted for not using the exception arising from this standard, and, therefore, there were no impacts on the Consolidated Financial Statements. |
| | |
| Itaú Unibanco Holding S.A. – Complete Financial Statements in IFRS – December 31, 2020 | | F-13 |
ITAÚ UNIBANCO HOLDING S.A.
Notes to the Consolidated Financial Statements
At 12/31/2020 and 12/31/2019 for balance sheet accounts and
From 01/01 to 12/31 of 2020, 2019 and 2018 for income statement accounts
(In millions of Reais, except information per share)
| | b) | Accounting standards recently issued and applicable in future periods |
| | • | | Interest Rate Benchmark Reform (IBOR Reform) Phase II—Amendments to IFRS 4 – Insurance Contracts, IFRS7 – Financial Instruments: Disclosures, IFRS 9 – Financial Instruments, IFRS 16 – Leases and IAS 39 – Financial Instruments: Recognition and Measurement: Phase II of the inter-bank offered rates reform used as market benchmarks (IBOR). The amendments are summarized as: |
| | • | | Changes in financial assets and liabilities: Practical expedient that allows to replace, as a consequence of the reform, the effective interest rate of a financial asset or financial liability with a new economically equivalent rate, without derecognition of the contract; |
| | • | | Hedge accounting: End of exemptions for evaluating the effectiveness of hedge relationships (Phase I) with recognition in Profit or Loss of the ineffective portion, creation of sub-portfolios to segregate contracts with the amended rates for hedges of group items, 24-month term for identification and segregation of new risk based on changes in interest rates, and updates of hedge documentation; |
| | • | | Disclosure: Requirements about the disclosure of risks to which the entity is exposed by the reform, risk management and evolution of the IBORs transition. |
These amendments are effective for years beginning on January 1st, 2021. ITAÚ UNIBANCO HOLDING is exposed mainly to Libor and Euribor rates in hedge accounting structures and financial assets and liabilities, including derivatives. Agreements linked to IBORs facing extinction will be (i) updated to an alternative rate plus spread; or (ii) settled in advance should there be no agreement between the parties. To mitigate the risks associated with IBOR Reform in standardized agreements, ITAÚ UNIBANCO HOLDING will assume the update of rates made by the respective clearing houses with the accretion of a spread so that the restated cash flows are economically equivalent to the original cash flows. The fallback clauses protocols suggested by international self -regulatory entities (International Swaps and Derivatives Association—ISDA) will be adopted. For the other agreements will be negotiated between the parties seeking to approach the model adopted for standardized agreements and they will be adjusted gradually until the end of 2021, date on which the market expects the end of disclosures of IBORs. Accordingly, ITAÚ UNIBANCO HOLDING does not expect significant impacts resulting from the IBOR Reform.
| | • | | IFRS 17 – Insurance Contracts: The pronouncement replaces IFRS 4 – Insurance Contracts and presents three approaches for valuation: |
| | • | | General Model: applicable to all contracts without direct participation features; |
| | • | | Premium Allocation Approach (PAA): applicable to contracts with term is up to 12 months or when it produces results similar to those that would be obtained if the general model was used. It is more simplified than the general model; |
| | • | | Variable Fee Approach: applicable to insurance contracts with direct participation features, the insurance contracts which are substantially investment related service contracts under which an entity promises an investment return based on underlying items. |
Insurance contracts must be recognized based on an analysis of four components:
| | • | | Expected Future Cash Flows: estimate of all components of cash flow of the contract, considering inflows and outflows; |
| | • | | Risk Adjustment: estimate of offset required for differences that may occur between cash flows; |
| | • | | Contractual Margin: difference between any amounts received before the beginning of the contract coverage and present value of cash flows estimated at the beginning of the contract; |
| | • | | Discount: projected cash flows must be discounted to present value, to reflect the time value of money, at rates that reflect the characteristics of the respective flows. |
This standard is effective for annual periods beginning January 1st, 2023. Possible impacts are being assessed and the assessment will be completed by the date this standard comes into force.
| 2.3. | Critical accounting estimates and judgments |
The preparation of Consolidated Financial Statements in accordance with the IFRS requires Management to make estimates and assumptions that affect the reported amounts of assets, liabilities, and contingent assets and liabilities at the date of the Financial Statements, due to uncertainties and the high level of subjectivity involved in the recognition and measurement of certain items. Estimates and judgments considered more relevant by ITAÚ UNIBANCO HOLDING are related to the following topics:
| | |
| Itaú Unibanco Holding S.A. – Complete Financial Statements in IFRS – December 31, 2020 | | F-14 |
ITAÚ UNIBANCO HOLDING S.A.
Notes to the Consolidated Financial Statements
At 12/31/2020 and 12/31/2019 for balance sheet accounts and
From 01/01 to 12/31 of 2020, 2019 and 2018 for income statement accounts
(In millions of Reais, except information per share)
| | |
Topic | | Notes |
| Consolidation | | Note 2.3 (a) and Note 3 |
| Fair value of financial instruments | | Note 2.3 (b) and Note 28 |
| Effective interest rate | | Note 2.3 (c), Notes 5, 8, 9 and 10 |
| Change to financial assets | | Note 2.3 (d), Notes 5, 8, 9 and 10 |
| Transfer and write-off of financial assets | | Note 2.3 (e), Notes 5, 8, 9 and 10 |
| Expected credit loss | | Note 2.3 (f), Notes 8, 9, 10 and 32 |
| Goodwill impairment | | Note 2.3 (g) and Note 14 |
| Deferred income tax and social contribution | | Note 2.3 (h) and Note 24 |
| Defined benefit pension plan | | Note 2.3 (i) and Note 26 |
| Provisions, contingencies and legal liabilities | | Note 2.3 (j) and Note 29 |
| Technical provisions for insurance and private pension | | Note 2.3 (k) and Note 27 |
Subsidiaries are all those in which ITAÚ UNIBANCO HOLDING’s involvement exposes it or entitles it to variable returns and can affect these returns through its influence on the entity. The existence of control is assessed continuously. Subsidiaries are consolidated from the date control is established to the date on which it ceases to exist.
| | b) | Fair value of financial instruments not traded in active markets, including derivatives |
The fair value of financial instruments, including derivatives that are not traded in active markets, is calculated by using valuation techniques based on assumptions that consider market information and conditions. The main assumptions are: historical data, information on similar transactions and pricing techniques. For more complex or illiquid instruments, significant judgment is necessary to determine the model used with the selection of specific inputs and, in certain cases, evaluation adjustments are applied to the model amount our price quoted for financial instruments that are not actively traded.
The methodologies used to estimate the fair value of certain financial instruments are described in Note 28.
| | |
| Itaú Unibanco Holding S.A. – Complete Financial Statements in IFRS – December 31, 2020 | | F-15 |
ITAÚ UNIBANCO HOLDING S.A.
Notes to the Consolidated Financial Statements
At 12/31/2020 and 12/31/2019 for balance sheet accounts and
From 01/01 to 12/31 of 2020, 2019 and 2018 for income statement accounts
(In millions of Reais, except information per share)
| | c) | Effective interest rate |
For the calculation of the effective interest rate, the ITAÚ UNIBANCO HOLDING estimates cash flows considering all contractual terms of the financial instrument, but without consider future credit losses. The calculation includes all commissions paid or received between parties to the contract, transaction costs, and all other premiums or discounts.
Interest revenue is calculated by applying the effective interest rate to the gross carrying amount of a financial asset. In the case of purchased or originated credit impaired financial assets, the adjusted effective interest rate is applied (taking into account the expected credit loss) to the amortized cost of the financial asset.
| | d) | Modification of financial assets |
The factors used to determine whether has been substantial modification of a contract are: evaluation if there is a renegotiation that is not part of the original contractual terms, change to contractual cash flows and significant extensions of the term of the transaction due to the debtor’s financial constraints, significant changes to the interest rate and changes to the currency in which the transaction is denominated.
| | e) | Transfer and write-off of financial assets |
When there are no reasonable expectations of recovery of a financial asset, considering historical curves, its total or partial write-off is carried out concurrently with the use of the related allowance for expected credit loss, with no effect on the Consolidated Statement of Income of ITAÚ UNIBANCO HOLDING. Subsequent recoveries of amounts previously written off are accounted for as income in the Consolidated Statement of Income.
Thus, financial assets are written off, either totally or partially, when there is no reasonable expectation of recovering a financial asset or when ITAÚ UNIBANCO HOLDING substantially transfers all risks and benefits of ownership and said transfer is qualified to be written off.
The measurement of expected credit loss requires the application of significant assumptions and use of quantitative models. Management exercises its judgment in the assessment of the adequacy of the expected loss amounts resulting from models and, according to its experience, makes adjustments that may result from certain client’s credit condition or temporary adjustments resulting from situations or new circumstances that have not been reflected in the modeling yet.
The main assumptions are:
| | • | | Term to maturity: ITAÚ UNIBANCO HOLDING considers the maximum contractual period on which it will be exposed a financial instrument’s credit risk. However, the estimated useful life of assets that do not have fixed maturity date is based on the period of exposure to credit risk. Additionally, all contractual terms are taken into account when determining the expected life, including prepayment and rollover options. |
| | • | | Prospective information: IFRS 9 requires a balanced and impartial estimate of credit loss that includes forecasts of future economic conditions. ITAÚ UNIBANCO HOLDING uses macroeconomic forecasts and public information with projections prepared internally to determine the impact of these estimates on the calculation of expected credit loss. Main prospective information used to determine the expected loss is related to Selic Rate, Credit Default Swap (CDS), unemployment rate, Gross Domestic Product (GDP), wages, industrial production and retail sales. |
| | • | | Macroeconomic scenarios: This information involves inherent risks, market uncertainties and other factors that may give rise to results different from expected. |
| | • | | Probability-weighted loss scenarios: ITAÚ UNIBANCO HOLDING uses weighted scenarios to determine credit loss expected over a suitable observation horizon adequate to classification in phases, considering the projection based on economic variables. |
| | |
| Itaú Unibanco Holding S.A. – Complete Financial Statements in IFRS – December 31, 2020 | | F-16 |
ITAÚ UNIBANCO HOLDING S.A.
Notes to the Consolidated Financial Statements
At 12/31/2020 and 12/31/2019 for balance sheet accounts and
From 01/01 to 12/31 of 2020, 2019 and 2018 for income statement accounts
(In millions of Reais, except information per share)
| | • | | Determining criteria for significant increase or decrease in credit risk: in each period of the consolidated financial statements, ITAÚ UNIBANCO HOLDING assesses whether the credit risk on a financial asset has increased significantly since the initial recognition using relative and absolute triggers (indicators), which consider delay and the probability of default (PD) by product and by country. ITAÚ UNIBANCO HOLDING assesses several factors to determine a significant increase in credit risk, such as: the counterparty, type and characteristics of the product and region in which it was contracted, considering the following objective criteria as minimum factors: |
| | • | | Stage 1 to stage 2: default exceeding 30 days, except for payroll loans for government agency, which are recognized is made after 45 days in arrears; |
| | • | | Stage 2 to stage 3: default exceeding 90 days, except for the mortgage loan portfolio, for which arrears of 180 days is a parameter for stage migration. |
ITAÚ UNIBANCO HOLDING assesses whether the credit risk has significantly increased on an individual or collective basis. For collective assessment purposes, financial assets are grouped based on characteristics of shared credit risk, considering the type of instrument, credit risk classifications, initial recognition date, remaining term, industry, geographical location of the counterparty, among other significant factors.
| | • | | Brazilian and foreign government securities are considered to have low credit risk, in accordance with a study conducted by ITAÚ UNIBANCO HOLDING and therefore they remain in stage 1. |
Details on the expected credit loss are in Note 32.
The review of goodwill due to impairment reflects the Management’s best estimate for future cash flows of Cash Generating Units (CGU), with the identification of the CGU and estimate of their fair value less costs to sell and/or value in use. These flows are subject to market conditions and uncertain factors, as follows:
| | • | | Cash flows projected for periods of available forecasts and long-term assumptions for these flows; |
| | • | | Discount rates, since they generally reflect financial and economic variables, such as the risk-free interest rate and a risk premium. |
Cash-Generating Units or CGU groups are identified at the lowest level at which goodwill is monitored for internal management purposes. Goodwill is allocated to cash flow generating units for purposes of testing for impairment.
| | h) | Deferred income tax and social contribution |
As explained in Note 2.4j, deferred tax assets are recognized only in relation to deductible temporary differences, tax losses and social contribution loss carryforwards for offset only to the extent that it is probable that ITAÚ UNIBANCO HOLDING will generate future taxable profit for its use. The expected realization of deferred tax assets is based on the projection of future taxable profits and technical studies, as disclosed in Note 24.
| | i) | Defined benefit pension plan |
The current amount of pension plans is obtained from actuarial calculations, which use assumptions such as discount rate, which is appropriated at the end of each year and used to determine the present value of estimated future cash outflows. To determine the appropriate discount rate, ITAÚ UNIBANCO HOLDING considers the interest rates of National Treasury Notes that have maturity terms similar to the terms of the respective liabilities.
The main assumptions for Pension plan obligations are partly based on current market conditions. Additional information is disclosed in Note 26.
| | |
| Itaú Unibanco Holding S.A. – Complete Financial Statements in IFRS – December 31, 2020 | | F-17 |
ITAÚ UNIBANCO HOLDING S.A.
Notes to the Consolidated Financial Statements
At 12/31/2020 and 12/31/2019 for balance sheet accounts and
From 01/01 to 12/31 of 2020, 2019 and 2018 for income statement accounts
(In millions of Reais, except information per share)
| | j) | Provisions, contingencies and legal liabilities |
ITAÚ UNIBANCO HOLDING periodically reviews its contingencies. These contingencies are evaluated based on management´s best estimates, taking into account the opinion of legal counsel when there is a likelihood that financial resources will be required to settle the obligations and the amounts may be reasonably estimated.
Contingencies classified as probable losses are recognized in the Balance Sheet under Provisions.
Contingent amounts are measured using appropriate models and criteria, despite the uncertainty surrounding the ultimate timing and amounts. Additional information is described in Note 29.
| | k) | Technical provisions for insurance and private pension |
Technical provisions are liabilities arising from obligations of ITAÚ UNIBANCO HOLDING to its policyholders and participants. These obligations may be short term liabilities (property and casualty insurance) or medium and long term liabilities (life insurance and pension plans).
The determination of the actuarial liability is subject to several uncertainties inherent in the coverage of insurance and pension contracts, such as assumptions of persistence, mortality, disability, life expectancy, morbidity, expenses, frequency and severity of claims, conversion of benefits into annuities, redemptions and return on assets.
The estimates for these assumptions are based on the historical experience of ITAÚ UNIBANCO HOLDING, benchmarks and the experience of the actuary, in order to comply with best market practices and constantly review of the actuarial liability. The adjustments resulting from these continuous improvements, when necessary, are recognized in the statement of income for the corresponding period. Additional information is described in Note 27.
| 2.4. | Summary of main accounting practices |
In accordance with IFRS 10 - Consolidated Financial Statements, subsidiaries are all entities in which ITAÚ UNIBANCO HOLDING holds control.
The consolidated financial statements are prepared using consistent accounting policies. Intercompany asset and liability account balances, income accounts and transaction values have been eliminated.
In the 3rd quarter of 2018, ITAÚ UNIBANCO HOLDING started adjusting the financial statements of its subsidiaries in Argentina to reflect the effects of hyperinflation, pursuant to IAS 29 – Financial Reporting in Hyperinflationary Economies.
| | |
| Itaú Unibanco Holding S.A. – Complete Financial Statements in IFRS – December 31, 2020 | | F-18 |
ITAÚ UNIBANCO HOLDING S.A.
Notes to the Consolidated Financial Statements
At 12/31/2020 and 12/31/2019 for balance sheet accounts and
From 01/01 to 12/31 of 2020, 2019 and 2018 for income statement accounts
(In millions of Reais, except information per share)
The following table shows the main consolidated companies, which together represent over 95% of total consolidated assets, as well as the interests of ITAÚ UNIBANCO HOLDING in their voting capital.
| | | | | | | | | | | | | | | | | | | | |
| | | Functional
currency (1) | | Incorporation
country | | Activity | | Interest in voting
capital % | | | Interest in total
capital % | |
| | | | | | | | | 12/31/2020 | | 12/31/2019 | | | 12/31/2020 | | | 12/31/2019 | |
In Brazil | | | | | | | | | | | | | | | | | | | | |
Banco Itaú BBA S.A. | | Real | | Brazil | | Financial institution | | 100.00% | | | 100.00 | % | | | 100.00 | % | | | 100.00 | % |
Banco Itaú Consignado S.A. | | Real | | Brazil | | Financial institution | | 100.00% | | | 100.00 | % | | | 100.00 | % | | | 100.00 | % |
Banco Itaucard S.A. | | Real | | Brazil | | Financial institution | | 100.00% | | | 100.00 | % | | | 100.00 | % | | | 100.00 | % |
Banco Itauleasing S.A. | | Real | | Brazil | | Financial institution | | 100.00% | | | 100.00 | % | | | 100.00 | % | | | 100.00 | % |
Cia. Itaú de Capitalização | | Real | | Brazil | | Premium Bonds | | 100.00% | | | 100.00 | % | | | 100.00 | % | | | 100.00 | % |
Dibens Leasing S.A. - Arrendamento Mercantil | | Real | | Brazil | | Leasing | | 100.00% | | | 100.00 | % | | | 100.00 | % | | | 100.00 | % |
Financeira Itaú CBD S.A. Crédito, Financiamento e Investimento | | Real | | Brazil | | Consumer finance
credit | | 50.00% | | | 50.00 | % | | | 50.00 | % | | | 50.00 | % |
Hipercard Banco Múltiplo S.A. | | Real | | Brazil | | Financial institution | | 100.00% | | | 100.00 | % | | | 100.00 | % | | | 100.00 | % |
Itauseg Seguradora S.A. | | Real | | Brazil | | Insurance | | 100.00% | | | 100.00 | % | | | 100.00 | % | | | 100.00 | % |
Itaú Corretora de Valores S.A. | | Real | | Brazil | | Securities Broker | | 100.00% | | | 100.00 | % | | | 100.00 | % | | | 100.00 | % |
Itaú Seguros S.A. | | Real | | Brazil | | Insurance | | 100.00% | | | 100.00 | % | | | 100.00 | % | | | 100.00 | % |
Itaú Unibanco S.A. | | Real | | Brazil | | Financial institution | | 100.00% | | | 100.00 | % | | | 100.00 | % | | | 100.00 | % |
Itaú Vida e Previdência S.A. | | Real | | Brazil | | Pension plan | | 100.00% | | | 100.00 | % | | | 100.00 | % | | | 100.00 | % |
Luizacred S.A. Sociedade de Crédito, Financiamento e Investimento | | Real | | Brazil | | Consumer finance
credit | | 50.00% | | | 50.00 | % | | | 50.00 | % | | | 50.00 | % |
Redecard S.A. | | Real | | Brazil | | Acquirer | | 100.00% | | | 100.00 | % | | | 100.00 | % | | | 100.00 | % |
Foreign | | | | | | | | | | | | | | | | | | | | |
Itaú CorpBanca Colombia S.A. | | Colombian peso | | Colombia | | Financial institution | | 34.16% | | | 33.22 | % | | | 34.16 | % | | | 33.22 | % |
Banco Itaú (Suisse) SA | | Swiss franc | | Switzerland | | Financial institution | | 100.00% | | | 100.00 | % | | | 100.00 | % | | | 100.00 | % |
Banco Itaú Argentina S.A. | | Argentinian peso | | Argentina | | Financial institution | | 100.00% | | | 100.00 | % | | | 100.00 | % | | | 100.00 | % |
Banco Itaú Paraguay S.A. | | Guarani | | Paraguay | | Financial institution | | 100.00% | | | 100.00 | % | | | 100.00 | % | | | 100.00 | % |
Banco Itaú Uruguay S.A. | | Uruguayan peso | | Uruguay | | Financial institution | | 100.00% | | | 100.00 | % | | | 100.00 | % | | | 100.00 | % |
Itau Bank, Ltd. | | Real | | Cayman Islands | | Financial institution | | 100.00% | | | 100.00 | % | | | 100.00 | % | | | 100.00 | % |
Itau BBA International plc | | US Dollar | | United Kingdom | | Financial institution | | 100.00% | | | 100.00 | % | | | 100.00 | % | | | 100.00 | % |
Itau BBA USA Securities Inc. | | Real | | United States | | Securities Broker | | 100.00% | | | 100.00 | % | | | 100.00 | % | | | 100.00 | % |
Itaú CorpBanca (2) | | Chilean peso | | Chile | | Financial institution | | 39.22% | | | 38.14 | % | | | 39.22 | % | | | 38.14 | % |
| (1) | All overseas offices of ITAÚ UNIBANCO HOLDING have the same functional currency as the parent company, except for CorpBanca New York Branch, which uses the US dollar. |
| (2) | ITAÚ UNIBANCO HOLDING controls ITAÚ CORPBANCA due to the shareholders’ agreement. |
| | |
| Itaú Unibanco Holding S.A. – Complete Financial Statements in IFRS – December 31, 2020 | | F-19 |
ITAÚ UNIBANCO HOLDING S.A.
Notes to the Consolidated Financial Statements
At 12/31/2020 and 12/31/2019 for balance sheet accounts and
From 01/01 to 12/31 of 2020, 2019 and 2018 for income statement accounts
(In millions of Reais, except information per share)
In general, a business consists of an integrated set of activities and assets that may be conducted and managed so as to provide a return, in the form of dividends, lower costs or other economic benefits, to investors or other stockholders, members or participants. If there is goodwill in a set of activities and assets transferred, it is presumed to be a business.
The acquisition method is used to account for business combinations, except for those classified as under common control.
Acquisition cost is measured at the fair value of the assets transferred, equity instruments issued and liabilities incurred or assumed at the acquisition date. Acquired assets and assumed liabilities and contingent liabilities identifiable in a business combination are initially measured at fair value at the date of acquisition, regardless of the existence of non-controlling interests. When the amount paid, plus non-controlling interests, is higher than the fair value of identifiable net assets acquired, the difference will be accounted for as goodwill. On the other hand, if the difference is negative, it will be treated as bargain purchase gain and the amount will be recognized directly in income.
Goodwill is not amortized, but its recoverable value is assessed semi-annually or when there is an indication of impairment loss using an approach that involves the identification of Cash Generating Units (CGUs) and the estimate of its fair value less the cost to sell and/or its value in use.
To determine this estimate, ITAÚ UNIBANCO HOLDING adopts the discounted cash flow methodology for a period of 5 years, macroeconomic assumptions, growth rate and discount rate.
The units or Cash Flow Generating Units are identified at the lowest level in which goodwill is monitored for internal Management purposes. Goodwill is allocated to cash flow generating units for purposes of testing for impairment.
The breakdown of intangible assets is described in Note 14.
| | IV. | Capital Transactions with non-controlling stockholders |
IFRS 10 – Consolidated Financial Statements establishes that, changes in an ownership interest in a subsidiary, which do not result in a loss of control, are accounted for as capital transactions and any difference between the amount paid and the carrying amount of non-controlling stockholders is recognized directly in consolidated stockholders’ equity.
| | b) | Foreign currency translation |
| | I. | Functional and presentation currency |
The Consolidated Financial Statements of ITAÚ UNIBANCO HOLDING are presented in Brazilian Reais, its functional and presentation currency. For each subsidiary, joint venture or investment in associates, ITAÚ UNIBANCO HOLDING defines the functional currency as the currency of the primary economic environment in which the entity operates.
| | II. | Foreign currency operations |
Foreign currency operations are translated into the functional currency using the exchange rates prevailing on the dates of the transactions. Foreign exchange gains and losses are recognized in the consolidated statement of income, unless they are related to cash flow hedges and hedge of net investment in foreign operations, which are recognized in stockholders’ equity.
| | c) | Cash and cash equivalents |
Defined as cash and current accounts with banks, shown in the Consolidated Balance Sheet under the heading Cash, Interbank Deposits and Securities purchased under agreements to resell (Collateral Held) with original maturities not exceeding 90 days.
| | |
| Itaú Unibanco Holding S.A. – Complete Financial Statements in IFRS – December 31, 2020 | | F-20 |
ITAÚ UNIBANCO HOLDING S.A.
Notes to the Consolidated Financial Statements
At 12/31/2020 and 12/31/2019 for balance sheet accounts and
From 01/01 to 12/31 of 2020, 2019 and 2018 for income statement accounts
(In millions of Reais, except information per share)
| | d) | Financial assets and liabilities |
Financial assets and liabilities are initially recognized at fair value and subsequently measured at amortized cost or fair value.
I - Classification and measurement of financial assets
Financial assets are classified in the following categories:
| | • | | Amortized cost: used when financial assets are managed to obtain contractual cash flows, consisting solely of payments of principal and interest; |
| | • | | Fair value through other comprehensive income: used when financial assets are held both for obtaining contractual cash flows, consisting solely by payments of principal and interest, and for sale; |
| | • | | Fair value through profit or loss: used for financial assets that do not meet the aforementioned criteria. |
The classification and subsequent measurement of financial assets depend on:
| | • | | The business model under which they are managed; |
| | • | | The characteristics of their cash flows (Solely Payment of Principal and Interest Test – SPPI Test). |
Business model: represents how financial assets are managed to generate cash flows and does not depend on the Management’s intention regarding an individual instrument. Financial assets may be managed with the purpose of: i) obtaining contractual cash flows; ii) obtaining contractual cash flows and sale; or iii) others. To assess business models, ITAÚ UNIBANCO HOLDING considers risks that affect the performance of the business model; how the managers of the business are compensated; and how the performance of the business model is assessed and reported to Management.
When a financial asset is subject to business models i) or ii) the application of the SPPI Test is required.
SPPI Test: assessment of cash flows generated by a financial instrument for the purpose of checking whether they represent solely payments of principal and interest. To fit into this concept, cash flows should include only consideration for the time value of money and credit risk. If contractual terms introduce risk exposure or cash flow volatilities, such as exposure to changes in prices of equity instruments or prices of commodities, the financial asset is classified at fair value through profit or loss. Hybrid contracts must be assessed as a whole, including all embedded characteristics. The accounting of a hybrid contract that contains an embedded derivative is performed on a joint basis, i.e. the whole instrument is measured at fair value through profit or loss.
Amortized cost
Amortized cost is the amount for which a financial asset or liability is measured at its initial recognition, plus adjustments made under the effective interest method, less amortization of principal and interest, and any provision for expected credit loss.
Fair value
Fair value is the price that would be received for the sale of an asset or that would be paid for the transfer of a liability in an orderly transaction between market players on the measurement date.
ITAÚ UNIBANCO HOLDING classifies the fair value hierarchy according to the relevance of data observed in the measurement process.
Details of the fair value of financial instruments, including Derivatives, and of the hierarchy of fair value are given in Note 28.
Average cost is used to determine the gains and losses realized on disposal of financial assets at fair value, which are recorded in the Consolidated Statement of Income as Adjustments to Fair Value of Financial Assets and Liabilities. Dividends on assets at fair value through other comprehensive
| | |
| Itaú Unibanco Holding S.A. – Complete Financial Statements in IFRS – December 31, 2020 | | F-21 |
ITAÚ UNIBANCO HOLDING S.A.
Notes to the Consolidated Financial Statements
At 12/31/2020 and 12/31/2019 for balance sheet accounts and
From 01/01 to 12/31 of 2020, 2019 and 2018 for income statement accounts
(In millions of Reais, except information per share)
income are recognized in the Consolidated Statement of Income as Dividend income when it is probable that ITAÚ UNIBANCO HOLDING’s right to receive such dividends is assured.
Regular purchases and sales of financial assets are recognized and derecognized, respectively, on the trading date.
Financial assets and liabilities are offset against each other and the net amount is reported in the Balance Sheet only solely when there is a legally enforceable right to offset them and the intention to settle them on a net basis, or to simultaneously realize the asset and settle the liability.
Equity instruments
An equity instrument is any contract that evidences a residual interest in an entity’s assets, after the deduction of all its liabilities, such as Shares and Units.
ITAÚ UNIBANCO HOLDING subsequently measures all its equity instruments at fair value through profit or loss, except when Management opts, on initial recognition, to irrevocably designate an equity instrument at fair value through other comprehensive income when it is held for a purpose other than only generating returns. When this option is selected, gains and losses on the fair value of the instrument are recognized in the Consolidated Statement of Comprehensive Income and are not subsequently reclassified to the Consolidated Statement of Income, even on sale. Dividends continue to be recognized in the Consolidated Statement of Income when ITAÚ UNIBANCO HOLDING’s right to receive them is assured.
Gains and losses on equity instruments measured at fair value through profit or loss are accounted in the Consolidated Statement of Income.
Expected credit loss
ITAÚ UNIBANCO HOLDING makes a forward-looking assessment of the expected credit loss on financial assets measured at amortized cost or through other comprehensive income, loan commitments and financial guarantee contracts:
| | • | | Financial assets: loss is measured at present value of the difference between contractual cash flows and the cash flows that ITAÚ UNIBANCO HOLDING expects to receive; |
| | • | | Loan commitments: expected loss is measured at present value of the difference between contractual cash flows that would be due if the commitment was drawn down and the cash flows that ITAÚ UNIBANCO HOLDING expects to receive; |
| | • | | Financial guarantees: the loss is measured at the difference between the payments expected for refunding the counterparty and the amounts that ITAÚ UNIBANCO HOLDING expects to recover. |
ITAÚ UNIBANCO HOLDING applies a three-stage approach to measuring the expected credit loss, in which financial assets migrate from one stage to the other in accordance with changes in credit risk.
| | • | | Stage 1 – 12-month expected credit loss: represents default events possible within 12 months. Applicable to financial assets which are not credit impaired when purchased or originated; |
| | • | | Stage 2 – Lifetime expected credit loss of financial instrument: considers all possible default events. Applicable to financial assets originated which are not credit impaired when originated or purchased but for which credit risk has increased significantly; and |
| | • | | Stage 3 – Credit loss expected for credit-impaired assets: considers all possible default events. Applicable to financial assets which are credit impaired when purchased or originated. The measurement of assets classified in this stage is different from Stage 2 due to the recognition of interest income by applying the effective interest rate to amortized cost (net of provision) rather than to the gross carrying amount. |
| | |
| Itaú Unibanco Holding S.A. – Complete Financial Statements in IFRS – December 31, 2020 | | F-22 |
ITAÚ UNIBANCO HOLDING S.A.
Notes to the Consolidated Financial Statements
At 12/31/2020 and 12/31/2019 for balance sheet accounts and
From 01/01 to 12/31 of 2020, 2019 and 2018 for income statement accounts
(In millions of Reais, except information per share)
An asset will migrate between stages as its credit risk increases or decreases. Therefore, a financial asset that migrated to stages 2 and 3 may return to stage 1, unless it was purchased or originated credit impaired financial asset.
Macroeconomic scenarios
Forward-looking information is based on macroeconomic scenarios that are reassessed annually or when market conditions so require.
Additional information is described in Note 32.
Modification of contractual cash flows
When contractual cash flows of a financial asset are renegotiated or otherwise modified and this does not substantially change its terms and conditions, ITAÚ UNIBANCO HOLDING does not derecognize it. However, the gross carrying amount of this financial asset is recalculated as the present value of the renegotiated or changed contractual cash flows, discounted at the original effective interest rate and a modification gain or loss is recognized in profit or loss. Any costs or fees incurred adjust the modified carrying amount and are amortized over the remaining term of the financial asset.
If, on the other hand, the renegotiation or change substantially modifies the terms and conditions of the financial asset, ITAÚ UNIBANCO HOLDING derecognises the original asset and recognizes a new one. Accordingly, the renegotiation date is taken as the initial recognition date of the new asset for expected credit loss calculation purposes, and to determine significant increases in credit risk.
ITAÚ UNIBANCO HOLDING also assesses if the new financial asset may be considered as purchased or originated credit impaired financial asset, particularly when the renegotiation was motivated by the debtor’s financial constraints. Differences between the carrying amount of the original asset and fair value of the new asset are immediately recognized in the Consolidated Statement of Income.
The effects of changes in cash flows of financial assets and other details about methodologies and assumptions adopted by Management to measure the allowance for expected credit loss, including the use of prospective information, are detailed in Note 32.
Derecognition of financial assets
Financial assets are derecognized when ITAÚ UNIBANCO HOLDING substantially transfers all risks and benefits of its property. In the event it is not possible to identify the transfer of all risks and benefits, the control should be assessed to determine the continuous involvement related to the transaction.
If there is a retention of risks and benefits, the financial asset continues to be recorded and a liability is recognized for the consideration received.
II – Classification and measurement of financial liabilities
Financial liabilities are initially recognized at fair value and subsequently measured at amortized cost, except for:
| | • | | Financial liabilities at fair value through profit or loss: this classification applied to derivatives and other financial liabilities designated at fair value through profit or loss to reduce “accounting mismatches”. ITAÚ UNIBANCO HOLDING irrevocably designates financial liabilities at fair value through profit or loss in the initial recognition (fair value option), when the option eliminates or significantly reduces measurement or recognition inconsistencies. |
| | • | | Loan commitments and financial guarantees: see details in Note 2.4d Vll. |
| | |
| Itaú Unibanco Holding S.A. – Complete Financial Statements in IFRS – December 31, 2020 | | F-23 |
ITAÚ UNIBANCO HOLDING S.A.
Notes to the Consolidated Financial Statements
At 12/31/2020 and 12/31/2019 for balance sheet accounts and
From 01/01 to 12/31 of 2020, 2019 and 2018 for income statement accounts
(In millions of Reais, except information per share)
Derecognition and modification of financial liabilities
ITAÚ UNIBANCO HOLDING derecognises a financial liability from the Consolidated Balance Sheet when it is extinguished, i.e., when the obligation specified in the contract is discharged, cancelled or expires.
A debt instrument change or substantial terms modification of a financial liability is accounted as a derecognition of the original financial liability and a new one is recognized.
A substantial change to contractual terms occurs when the discounted present value of cash flows under the new terms, including any fees paid/received and discounted using the original effective interest rate, is at least 10% different from discounted present value of the remaining cash flow of the original financial liabilities.
III – Securities purchased under agreements to resell
ITAÚ UNIBANCO HOLDING purchases financial assets with a resale commitment (resale agreements) and sells securities with a repurchase commitment (repurchase agreement) of financial assets. Resale and repurchase agreements are accounted for under Securities purchased under agreements to resell and Securities sold under repurchase agreements, respectively.
The difference between the sale and repurchase prices is treated as interest and recognized over the life of the agreements using the effective interest rate method.
The financial assets taken as collateral in resale agreements can be used as collateral for repurchase agreements it provided for in the agreements or can be sold.
IV - Derivatives
All derivatives are accounted for as financial assets when the fair value is positive and as financial liabilities when the fair value is negative.
The valuation of active hybrid contracts that are subject to IFRS 9 is carried out as a whole, including all embedded characteristics, whereas the accounting is carried out on a joint basis, i.e. each instrument is measured at fair value through profit or loss.
When a contract has a main component outside the scope of IFRS 9, such as a lease agreement receivable or an insurance contract, or even a financial liability, embedded derivatives are treated as separate financial instruments if:
| | (i) | their characteristics and economic risks are not closely related to those of the main component; |
| | (ii) | the separate instrument meets the definition of a derivative; and |
| | (iii) | the underlying instrument is not booked at fair value through profit or loss. |
These embedded derivatives are accounted for separately at fair value, with variations recognized in the Consolidated Statement of Income as Adjustments to Fair Value of Financial Assets and Liabilities.
ITAÚ UNIBANCO HOLDING will continue applying all the hedge accounting requirements of IAS 39; however, it may adopt the provisions of IFRS 9, if Management so decides. According to this standard, derivatives may be designated and qualified as hedging instruments for accounting purposes and, the method for recognizing gains or losses of fair value will depending on the nature of the hedged item.
At the beginning of a hedging transaction, ITAÚ UNIBANCO HOLDING documents the relationship between the hedging instrument and the hedged items, as well as its risk management objective and strategy. The hedge is assessed on an ongoing basis to determine if it has been highly effective throughout all periods of the Financial Statements for which it was designated.
IAS 39 describes three hedging strategies: fair value hedge, cash flow hedge, and hedge of net investments in a foreign operation. ITAÚ UNIBANCO HOLDING uses derivatives as hedging instruments under all three hedge strategies, as detailed in Note 7.
| | |
| Itaú Unibanco Holding S.A. – Complete Financial Statements in IFRS – December 31, 2020 | | F-24 |
ITAÚ UNIBANCO HOLDING S.A.
Notes to the Consolidated Financial Statements
At 12/31/2020 and 12/31/2019 for balance sheet accounts and
From 01/01 to 12/31 of 2020, 2019 and 2018 for income statement accounts
(In millions of Reais, except information per share)
Fair value hedge
The following practices are adopted for these operations:
| | a) | The gain or loss arising from the remeasurement of the hedging instrument at fair value is recognized in income; and |
| | b) | The gain or loss arising from the hedged item, attributable to the effective portion of the hedged risk, is applied to the book value of the hedged item and is also recognized in income. |
When a derivative expires or is sold or a hedge no longer meets the hedge accounting criteria or in the event the designation is revoked, the hedge accounting must be prospectively discontinued. In addition, any adjustment to the book value of the hedged item must be amortized in income.
Cash flow hedge
For derivatives that are designated and qualify as hedging instruments in a cash flow hedge, the practices are:
| | a) | The effective portion of gains or losses on derivatives is recognized directly in Other comprehensive income – Cash flow hedge; |
| | b) | The portion of gain or loss on derivatives that represents the ineffective portion or on hedge components excluded from the assessment of effectiveness is recognized in income. |
Amounts originally recorded in Other comprehensive income and subsequently reclassified to Income are recognized in the caption Interest, similar income and dividend of financial assets at fair value through profit or loss at the same time that the corresponding income or expense item of the financial hedge item affects income. For non-financial hedge items, the amounts originally recognized in Other Comprehensive Income are included in the initial cost of the corresponding asset or liability.
When a derivative expires or is sold, when hedge accounting criteria are no longer met or when the entity revokes the hedge accounting designation, any cumulative gain or loss existing in Other comprehensive income will be reclassified to income at the time the expected transaction occurs or is no longer expected to occur.
Hedge of net investments in foreign operations
The hedge of a net investment in a foreign operation, including the hedge of a monetary item that is booked as part of the net investment, is accounted for in a manner similar to a cash flow hedge:
| | a) | The portion of gain or loss on the hedging instrument determined as effective is recognized in other comprehensive income; |
| | b) | The ineffective portion is recognized in income. |
Gains or losses on the hedging instrument related to the effective portion of the hedge which are recognized in Other comprehensive income are reclassified to income for the period when the foreign operation is partially or totally sold.
V - Loan operations
ITAÚ UNIBANCO HOLDING classifies a loan as non-performing if the payment of the principal or interest has been overdue for 60 days or more. In this case, accrual of interest is no longer recognized.
VI - Premium bonds plans
In Brazil they are regulated by the insurance regulator. These plans do not meet the definition of an insurance contract under IFRS 4, and therefore they are classified as a financial liability at amortized cost under IFRS 9.
| | |
| Itaú Unibanco Holding S.A. – Complete Financial Statements in IFRS – December 31, 2020 | | F-25 |
ITAÚ UNIBANCO HOLDING S.A.
Notes to the Consolidated Financial Statements
At 12/31/2020 and 12/31/2019 for balance sheet accounts and
From 01/01 to 12/31 of 2020, 2019 and 2018 for income statement accounts
(In millions of Reais, except information per share)
Revenue from premium bonds plans is recognized during the period of the contract and measured as the difference between the amount deposited by the customer and the amount that ITAÚ UNIBANCO HOLDING has to reimburse.
VII – Loan commitments and financial guarantees
ITAÚ UNIBANCO HOLDING recognizes as an obligation in the Consolidated Balance Sheet, on the issue date, the fair value of commitments for loans and financial guarantees. The fair value is generally represented by the fee charged to the customer. This amount is amortized over the term of the instrument and is recognized in the Consolidated Statement of Income under the heading Commissions and Banking Fees.
After issue, if ITAÚ UNIBANCO HOLDING concludes based on the best estimate, that the expected credit loss in relation to the guarantee issued is higher that the fair value less accumulated amortization, this amount is replaced by a provision for loss.
| | e) | Investments in associates and joint ventures |
I – Associates
Associates are companies in which the investor has a significant influence but does not hold control. Investments in these companies are initially recognized at cost of acquisition and subsequently accounted for using the equity method. Investments in associates and joint ventures include the goodwill identified upon acquisition, net of any cumulative impairment loss.
II – Joint ventures
ITAÚ UNIBANCO HOLDING has joint venture whereby the parties that have joint control of the arrangement have rights to the net assets.
ITAÚ UNIBANCO HOLDING’s share in profits or losses of its associates and joint ventures after acquisition is recognized in the Consolidated statement of income. Its share of the changes in the share in other comprehensive income of corresponding stockholders’ equity of its associates and joint ventures is recognized in its own capital reserves. The cumulative changes after acquisition are adjusted against the carrying amount of the investment. When the ITAÚ UNIBANCO HOLDING’s share of losses in an associates and joint ventures is equal to or more than the value of its interest, including any other receivables, ITAÚ UNIBANCO HOLDING does not recognize additional losses, unless it has incurred any obligations or made payments on behalf of the associates and joint ventures.
Unrealized profits on transactions between ITAÚ UNIBANCO HOLDING and its associates and joint ventures are eliminated to the extent of the interest of ITAÚ UNIBANCO HOLDING. Unrealized losses are also eliminated, unless the transaction provides evidence of impairment of the transferred asset. The accounting policies on associates and joint ventures entities are changed, as necessary, to ensure consistency with the policies adopted by ITAÚ UNIBANCO HOLDING.
If its interest in the associates and joint ventures decreases, but ITAÚ UNIBANCO HOLDING retains significant influence or joint control, only the proportional amount of the previously recognized amounts in Other comprehensive income is reclassified in Income, when appropriate.
ITAÚ UNIBANCO HOLDING leases mainly real estate properties (underlying assets) to carry out its business activities. The initial recognition occurs when the agreement is signed, in the heading Other Liabilities, which corresponds to the total future payments at present value as a contra entry to the Right-of-Use Assets, depreciated under the straight-line method for the lease term and tested semiannually to identify possible impairment losses.
The financial expense corresponding to interest on lease liabilities is recognized in the heading Interest and Similar Expense in the Consolidated Statement of Income.
| | |
| Itaú Unibanco Holding S.A. – Complete Financial Statements in IFRS – December 31, 2020 | | F-26 |
ITAÚ UNIBANCO HOLDING S.A.
Notes to the Consolidated Financial Statements
At 12/31/2020 and 12/31/2019 for balance sheet accounts and
From 01/01 to 12/31 of 2020, 2019 and 2018 for income statement accounts
(In millions of Reais, except information per share)
Fixed assets are booked at their acquisition cost less accumulated depreciation, and adjusted for impairment, if applicable. Depreciation is calculated on the straight-line method using rates based on the estimated useful lives of these assets. Such rates and other details are presented in Note 13.
The residual values and useful lives of assets are reviewed and adjusted, if appropriate, at the end of each period.
ITAÚ UNIBANCO HOLDING reviews its assets in order to identify indications of impairment in their recoverable amounts. The recoverable amount of an asset is defined as the higher of its fair value less the cost to sell and its value in use. For the purposes of assessing impairment, assets are grouped at the lowest level for which independent cash flows can be identified (cash-generating units). The assessment may be made at an individual asset level when the fair value less the cost to sell can be reliably determined.
Gains and losses on disposals of fixed assets are recognized in the Consolidated statement of income under Other income or General and administrative expenses.
Intangible assets are non-physical assets, including software and other assets, and are initially recognized at cost. Intangible assets are recognized when they arise from legal or contractual rights, their costs can be reliably measured, and in the case of intangible assets not arising from separate acquisitions or business combinations, it is probable that future economic benefits may arise from their use. The balance of intangible assets refers to acquired assets or those internally generated.
Intangible assets may have definite or indefinite useful lives. Intangible assets with definite useful lives are amortized using the straight-line method over their estimated useful lives. Intangible assets with indefinite useful lives are not amortized, but periodically tested in order to identify any impairment.
ITAÚ UNIBANCO HOLDING semi-annually assesses its intangible assets in order to identify whether any indications of impairment exist, as well as possible reversal of previous impairment losses. If such indications are found, intangible assets are tested for impairment. The recoverable amount of an asset is defined as the higher of its fair value less the cost to sell and its value in use. For the purposes of assessing impairment, assets are grouped at the lowest level for which independent cash flows can be identified (cash-generating units). The assessment may be made at an individual asset level when the fair value less the cost to sell can be reliably determined.
ITAÚ UNIBANCO HOLDING uses the cost model to measure its intangible assets after its initial recognition.
A breakdown of intangible assets is given in Note 14.
Assets held for sale are recognized in the consolidated balance sheet under the line Other assets when they are actually repossessed or there is intention to sell. These assets are initially recorded at the lower of: (i) the fair value of the asset less the estimated selling expenses, or (ii) the carrying amount of the related asset held for sale.
| | j) | Income tax and social contribution |
There are two components of the provision for income tax and social contribution: current and deferred.
The current component is approximately the total of taxes to be paid or recovered during the reporting period.
Deferred income tax and social contribution, represented by deferred tax assets and liabilities, is obtained based on the differences between the tax bases of assets and liabilities and the amounts reported in the financial statements at each year end.
The income tax and social contribution expense is recognized in the Consolidated statement of income under Income tax and social contribution, except when it refers to items directly recognized in Other
| | |
| Itaú Unibanco Holding S.A. – Complete Financial Statements in IFRS – December 31, 2020 | | F-27 |
ITAÚ UNIBANCO HOLDING S.A.
Notes to the Consolidated Financial Statements
At 12/31/2020 and 12/31/2019 for balance sheet accounts and
From 01/01 to 12/31 of 2020, 2019 and 2018 for income statement accounts
(In millions of Reais, except information per share)
comprehensive income, such as: tax on fair value of financial assets measured at fair value through Other comprehensive income, post-employment benefits and tax on cash flow hedges and hedge of net investment in foreign operations. Subsequently, these items are recognized in income upon realization of the gain/loss on the instruments.
Changes in tax legislation and rates are recognized in the Consolidated statement of income in the period in which they are enacted. Interest and fines are recognized in the Consolidated statement of income under General and administrative expenses.
To determine the proper level of provisions for taxes to be maintained for uncertain tax positions, the approach applied, is that a tax benefit is recognized if it is more likely than not that a position can be sustained, under the assumptions for recognition, detailed in item 2.4 n.
| | k) | Insurance contracts and private pensions |
Insurance contracts are contracts under which ITAÚ UNIBANCO HOLDING accepts a significant insurance risk of the counterparty, by agreeing to compensate it if a specified uncertain future event adversely affects it. An insurance risk is significant only if the insurance event could cause ITAÚ UNIBANCO HOLDING to pay significant additional benefits in any scenario, other than those that do not have commercial substance. Additional benefits refer to amounts that exceed those that would be payable if no insured event occurred.
Upon its first-time adoption of the IFRS, ITAÚ UNIBANCO HOLDING decided not to change its accounting policies for insurance contracts, which follow the accounting practices generally accepted in Brazil (“BRGAAP”).
Although investment agreements with discretionary participation characteristics are financial instruments, they are treated as insurance contracts, as established by IFRS 4, as well as those transferring a significant financial risk.
Once a contract is classified as an insurance contract, it remains as such until the end of its life, even if the insurance risk is significantly reduced during the period, unless all rights and obligations are extinguished or expire.
Note 27 provides a detailed description of all products classified as insurance contracts.
Private pension plans
Contracts that provide for retirement benefits after an accumulation period (known as PGBL, VGBL and FGB) provide a guarantee, at the commencement date of the contract, of the basis for calculating the retirement benefit (mortality table and minimum interest rates). The contracts specify the annuity rates and, therefore, the insurance risk is transferred to the issuer from the start. These contracts are classified as insurance contracts.
Insurance premiums
Insurance premiums are recognized upon issue of an insurance policy or over the period of the contracts in proportion to the amount of the insurance coverage.
If there is evidence of impairment losses with respect to receivables for insurance premiums, ITAÚ UNIBANCO HOLDING recognizes a provision, sufficient to cover this loss, based on a risk analysis of realization of insurance premiums receivable with installments overdue for over 60 days.
Reinsurance
In the ordinary course of business, ITAÚ UNIBANCO HOLDING reinsures a portion of the risks underwritten, particularly property and casualty risks that exceed the maximum limits of responsibility that determine to be appropriate for each segment and product (after a study which considers size, experience, special features, and the capital necessary to support these limits). These reinsurance agreements allow the recovery of a portion of the losses from the reinsurer, although they do not release the insurer from the main obligation as direct insurer of the risks covered by the reinsurance.
| | |
| Itaú Unibanco Holding S.A. – Complete Financial Statements in IFRS – December 31, 2020 | | F-28 |
ITAÚ UNIBANCO HOLDING S.A.
Notes to the Consolidated Financial Statements
At 12/31/2020 and 12/31/2019 for balance sheet accounts and
From 01/01 to 12/31 of 2020, 2019 and 2018 for income statement accounts
(In millions of Reais, except information per share)
ITAÚ UNIBANCO HOLDING mainly holds non-proportional contracts, which transfer part of responsibility to the reinsurance company for losses that will materialize after a certain level of claims in the portfolio. Reinsurance premiums of these contracts are accounted for under Other Assets, over the life of each contract.
If there is any evidence of impairment loss, ITAÚ UNIBANCO HOLDING recognizes a provision when the default period exceeds 180 days from the registration of the request for fund of claims paid.
Acquisition costs
Acquisition costs include direct and indirect costs related to the origination of insurance. These costs are recorded directly in result as incurred, except for deferred acquisition costs (commissions paid for brokerage services, agency and prospecting efforts), which are recorded proportionally to the recognition of premium revenues, i.e. over the term corresponding to the insurance contract.
Insurance Contract Liabilities
Reserves for claims are established based on past experience, claims in process of payment, estimated amounts of claims incurred but not yet reported, and other factors relevant to the required reserve levels.
Liability Adequacy Test
ITAÚ UNIBANCO HOLDING tests liability adequacy by adopting current actuarial assumptions for future cash flows of all insurance contracts in force at the balance sheet date.
Should the analysis show insufficiency, any shortfall identified will immediately be accounted for in income for the period.
The assumptions used to conduct the liability adequacy test are detailed in Note 27.
| | l) | Post-employments benefits |
ITAÚ UNIBANCO HOLDING sponsors Defined Benefit Plans and Defined Contribution Plans, which are accounted for in accordance with IAS 19 – Benefits to Employees.
ITAÚ UNIBANCO HOLDING is required to make contributions to government social security and labor indemnity plans, in Brazil and in other countries where it operates.
Pension plans - Defined benefit plans
The liability or asset, as the case may be, is recognized in the Consolidated Balance Sheet with respect to a defined benefit plan corresponds to the present value of defined benefit obligations at the balance sheet date less the fair value of plan assets. The defined benefit obligations are calculated annually using the projected unit credit method.
Pension plans - Defined contribution
For defined contribution plans, contributions to plans made by ITAÚ UNIBANCO HOLDING, through pension plan funds, are recognized as liabilities, with a counter-entry to expenses, when due. If contributions made exceed the liability for a service provided, it will be accounted for as an asset recognized at fair value, and any adjustments are recognized in Stockholders’ equity, under Other comprehensive income, in the period when they occur.
Other post-employment benefit obligations
Like defined benefit pension plans, these obligations are assessed annually by independent, qualified actuaries, and costs expected from these benefits are accrued over the period of employment. Gains and losses arising from changes in practices and variations in actuarial assumptions are recognized in Stockholders’ equity, under Other comprehensive income, in the period in which they occur.
| | |
| Itaú Unibanco Holding S.A. – Complete Financial Statements in IFRS – December 31, 2020 | | F-29 |
ITAÚ UNIBANCO HOLDING S.A.
Notes to the Consolidated Financial Statements
At 12/31/2020 and 12/31/2019 for balance sheet accounts and
From 01/01 to 12/31 of 2020, 2019 and 2018 for income statement accounts
(In millions of Reais, except information per share)
Share-based payments are booked for the value of equity instruments granted, which may be shares or stock options according to the plan, based on their fair value at the grant date. This cost is recognized during the vesting period of the right to exercise the instruments.
The total amount to be expensed is determined by reference to the fair value of the equity instruments excluding the impact of any service commissions and fees and non-market performance vesting conditions (in particular when an employee remains with the company for specific period of time).
| | n) | Provisions, contingent assets and contingent liabilities |
Contingent assets and liabilities are possible rights and potential obligations arising from past events for which realization depends on uncertain future events.
Contingent assets are not recognized in the Consolidated Financial Statements, except when the Management of ITAÚ UNIBANCO HOLDING considers that realization is practically certain. In general they correspond to lawsuits with favorable outcomes in final and unappealable judgments and to the withdrawal of lawsuits as a result of a settlement payment received or an agreement for set-off against an existing liability.
These contingencies are evaluated based on Management’s best estimates, and are classified as:
| | • | | Probable: in which liabilities are recognized in the consolidated balance sheet under Provisions; |
| | • | | Possible: which are disclosed in the Consolidated Financial Statements, but no provision is recorded; |
| | • | | Remote: which require neither a provision nor disclosure. |
The amount of deposits in guarantee is adjusted in accordance with current legislation.
Common and preferred shares, which for accounting purposes are equivalent to common shares but without voting rights are classified in Stockholders’ equity. The additional costs directly attributable to the issue of new shares are included in Stockholders’ equity as a deduction from the proceeds, net of taxes.
Common and preferred shares repurchased are recorded in Stockholders’ equity under Treasury shares at their average purchase price.
Shares that are subsequently sold, such as those sold to grantees under our share-based payment scheme, are recorded as a reduction in treasury shares, measured at the average price of treasury stock held at that date.
The difference between the sale price and the average price of the treasury shares is recorded as a reduction or increase in Additional paid-in capital. The cancellation of treasury shares is recorded as a reduction in Treasury shares against Appropriated reserves, at the average price of treasury shares at the cancellation date.
| | q) | Dividends and interest on capital |
Minimum dividend amounts established in the bylaws are recorded as liabilities at the end of each year. Any other amount above the mandatory minimum dividend is accounted for as a liability when approved by of the Board of Directors.
Interest on capital is treated for accounting purposes as a dividend, and it is presented as a reduction of stockholders’ equity in the consolidated financial statements.
| | |
| Itaú Unibanco Holding S.A. – Complete Financial Statements in IFRS – December 31, 2020 | | F-30 |
ITAÚ UNIBANCO HOLDING S.A.
Notes to the Consolidated Financial Statements
At 12/31/2020 and 12/31/2019 for balance sheet accounts and
From 01/01 to 12/31 of 2020, 2019 and 2018 for income statement accounts
(In millions of Reais, except information per share)
Dividends have been and continue to be calculated and paid on the basis of the financial statements prepared under Brazilian accounting standards and regulations for financial institutions, not these Consolidated financial statements prepared according to the IFRS.
Dividends and interest on capital are presented in Note 19.
ITAÚ UNIBANCO HOLDING grants stock options whose dilutive effect is reflected in diluted earnings per share, with the application of the “treasury stock method”. Whereby earnings per share are calculated as if all the stock options had been exercised and the proceeds used to purchase shares of ITAÚ UNIBANCO HOLDING.
Earnings per share are presented in Note 25.
Segment information disclosed is consistent with the internal reports prepared for the Executive Committee which makes the operational decisions ITAÚ UNIBANCO HOLDING.
ITAÚ UNIBANCO HOLDING has three reportable segments: (i) Retail Banking (ii) Wholesale Banking and (iii) Market + Corporation.
Segment information is presented in Note 30.
| | t) | Commissions and Banking Fees |
Commissions and Banking Fees is recognized when ITAÚ UNIBANCO HOLDING provides or offers services to customers, in an amount that reflects the consideration ITAÚ UNIBANCO HOLDING expects to collect in exchange for those services. A five-step model is applied to account for revenues: i) identification of the contract with a customer; ii) identification of the performance obligations in the contract; iii) determination of the transaction price; iv) allocation of the transaction price to the performance obligations in the contract; and v) revenue recognition, when performance obligations agreed upon in agreements with clients are met. Incremental costs and costs to fulfill agreements with clients are recognized as an expense as incurred.
The main services provided by ITAÚ UNIBANCO HOLDING are:
| | • | | Credit and debit cards - refer mainly to fees charged by card issuers and acquirers for processing card transactions; annuities charged for the availability and management of credit card; and the rental of Rede machines. |
| | • | | Current account services - substantially comprised of current account maintenance fees, according to each service package granted to the customer; transfers carried through TED/DOC; withdrawals from demand deposit account and money order. |
| | • | | Economic, Financial and Brokerage Advisory - refer mainly to financial transaction structuring services; placement of securities, and intermediation of operations on stock exchanges. |
Service revenues related to credit, debit, current account and economic, financial and brokerage advisory cards are recognized when said services are provided.
| | • | | Funds management - refers to fees charged for the management and performance of investment funds and consortia administration. |
| | • | | Credit operations and financial guarantees provided - refer mainly to advance depositor fees; asset appraisal service; and commission on guarantees provided. |
| | • | | Collection services - refer to collection and charging services. |
Revenue from certain services, such as fees from funds management, collection and custody, are recognized over the life of the respective agreements, as services are provided.
| | |
| Itaú Unibanco Holding S.A. – Complete Financial Statements in IFRS – December 31, 2020 | | F-31 |
ITAÚ UNIBANCO HOLDING S.A.
Notes to the Consolidated Financial Statements
At 12/31/2020 and 12/31/2019 for balance sheet accounts and
From 01/01 to 12/31 of 2020, 2019 and 2018 for income statement accounts
(In millions of Reais, except information per share)
Note 3 – Business development
Recovery do Brasil Consultoria S.A.
On December 31, 2015, ITAÚ UNIBANCO HOLDING, through its subsidiary Itaú Unibanco S.A., (ITAÚ UNIBANCO), entered into an agreement for purchase and sale and other covenants with Banco BTG Pactual S.A. (BTG) and with Misben S.A. for acquisition of 89.08% of interest in capital of Recovery do Brasil Consultoria S.A. (RECOVERY), corresponding to total interest of RECOVERY’s parties, for the amount of R$ 735. On July 7, 2016 an additional interest of 6.92% was acquired from International Finance Corporation, for the amount of R$ 59, then holding 96% of its capital.
On May 26, 2020, ITAÚ UNIBANCO HOLDING, through its subsidiary ITAÚ UNIBANCO, acquired from International Finance Corporation an additional interest of 4% for the amount of R$ 20.7, then holding 100% of capital of RECOVERY.
The effective acquisition and financial settlement occurred on May 28, 2020.
Acquisition of Zup I.T. Serviços em Tecnologia e Inovação S.A.
On October 31, 2019, ITAÚ UNIBANCO HOLDING, through its subsidiary Redecard S.A. (REDE), entered into a purchase and sale agreement of 100% of the capital of Zup I.T. Serviços em Tecnologia e Inovação S.A. (ZUP). The purchase will be carried out in three phases over four years. In the first phase, ITAÚ UNIBANCO HOLDING acquired 52.96% of ZUP’s total voting capital for approximately R$ 293, then holding the company’s control. In the third year, after the operation is closed, ITAÚ UNIBANCO HOLDING will acquire an additional 19.6% interest; in the fourth year, the remaining interest, so as to achieve 100% of ZUP’s capital.
Effective acquisitions and financial settlements occurred on March 31, 2020, after obtaining the regulatory authorizations required.
Acquisition of non-controlling interest in Pravaler S.A.
On December 27, 2019, ITAÚ UNIBANCO HOLDING, through its subsidiary ITAÚ UNIBANCO, increased its ownership interest in Pravaler S.A. (PRAVALER), acquiring 43.07% of total capital social (corresponding to 75.71% of preferred shares and 28.65% of common shares) for the amount of R$ 330.9. PRAVALER, with head office in São Paulo, is the manager of the largest private college loan program in Brazil, and it will continue operating independently from ITAÚ UNIBANCO HOLDING.
PRAVALER is classified as an associate measured under the equity method.
Effective acquisitions and financial settlements occurred on the same date, after obtaining the regulatory authorizations required.
Reduction of non-controlling interest in XP Inc.
On November 29, 2019, there was a corporate reorganization of XP Investimentos S.A., in which the shareholders subscribed their respective shares of the holding company XP Inc. (XP INC), keeping the percentages in total capital. After the initial public offering held on December 11, 2019 at Nasdaq in New York, the ownership interest of ITAÚ UNIBANCO HOLDING changed from 49.9% to 46.05%, giving rise to a R$ 1,991 result in the primary subscription of XP Inc.
On November 26, 2020, ITAÚ UNIBANCO HOLDING disclosed that the Board of Directors approved the partial spin-off of the investment in XP INC for a new company (XPart S.A.).
On December 2 and 17, 2020, ITAÚ UNIBANCO HOLDING sold 4.44% and 0.07%, respectively, of its investments in XP INC, through the public offering on the Nasdaq, giving rising to a result before taxes of R$ 3,996. Concurrently with the sales, XP INC completed a public offering (follow-on) which resulted in the dilution of the interest held by ITAÚ UNIBANCO HOLDING, which is now 41.00% of capital, giving rising to a result in XP INC primary subscription of R$ 545.
| | |
| Itaú Unibanco Holding S.A. – Complete Financial Statements in IFRS – December 31, 2020 | | F-32 |
ITAÚ UNIBANCO HOLDING S.A.
Notes to the Consolidated Financial Statements
At 12/31/2020 and 12/31/2019 for balance sheet accounts and
From 01/01 to 12/31 of 2020, 2019 and 2018 for income statement accounts
(In millions of Reais, except information per share)
Acquisition of non-controlling interest in Ticket Serviços S.A.
On September 4, 2018, ITAÚ UNIBANCO HOLDING, through its subsidiary ITAÚ UNIBANCO, entered into a strategic partnership with Edenred Participações S.A. (EDENRED) in the benefits market for workers covered mainly by PAT, the Workers’ Meals Program. EDENRED is the parent company of Ticket Serviços S.A. (TICKET) in Brazil.
The strategic partnership enables ITAÚ UNIBANCO to add the benefits issued by TICKET to its current range of products and services for customers in the wholesale, medium, micro and small company segments.
In addition, ITAÚ UNIBANCO made a minority investment of 11% in TICKET, through a capital increase with contribution of (i) cash, equivalent to said interest in the company’s equity value, and (ii) right to exclusive distribution of Ticket Restaurante, Ticket Alimentação, Ticket Cultura and Ticket Transporte products to the ITAÚ UNIBANCO legal entities base during the partnership term. TICKET will continue distributing its products through other commercial agreements and will continue under EDENRED’s control and management.
Effective acquisitions and financial settlements occurred on August 30, 2019, after obtaining the regulatory authorizations required.
Itaú CorpBanca
Itaú Corpbanca (ITAÚ CORPBANCA) is controlled as of April 1st, 2016 by ITAÚ UNIBANCO HOLDING. On the same date, ITAU UNIBANCO HOLDING entered into a shareholders’ agreement with Corp Group, which sets forth, among others, the right of ITAÚ UNIBANCO HOLDING and Corp Group to appoint members for the Board of Directors of ITAÚ CORPBANCA in accordance to their interests in capital stock, and this group of shareholders have the right to appoint the majority of members of the Board of Directors of ITAÚ CORPBANCA and ITAÚ UNIBANCO HOLDING are be entitled to appoint the majority of members elected by this block.
On September 10, 2020, ITAÚ UNIBANCO HOLDING, through its subsidiary ITB Holding Brasil Participações Ltda, indirectly acquired additional ownership interest of 1.08% (5,558,780,153 shares) in the ITAÚ CORPBANCA’s capital for the amount of R$ 229, and now it holds 39.22%.
The effective acquisition and financial settlement occurred on September 14, 2020, after obtaining the regulatory authorizations.
Note 4 - Interbank deposits and securities purchased under agreements to resell
| | | | | | | | | | | | | | | | | | | | | | | | |
| | | 12/31/2020 | | | 12/31/2019 | |
| | | Current | | | Non-current | | | Total | | | Current | | | Non-current | | | Total | |
Securities purchased under agreements to resell(1) | | | 239,848 | | | | 87 | | | | 239,935 | | | | 198,260 | | | | 162 | | | | 198,422 | |
Collateral held | | | 63,087 | | | | 87 | | | | 63,174 | | | | 44,901 | | | | 162 | | | | 45,063 | |
Collateral repledge | | | 150,591 | | | | — | | | | 150,591 | | | | 134,116 | | | | — | | | | 134,116 | |
Assets received as collateral with right to sell or repledge | | | 20,367 | | | | — | | | | 20,367 | | | | 6,644 | | | | — | | | | 6,644 | |
Assets received as collateral without right to sell or repledge | | | 130,224 | | | | — | | | | 130,224 | | | | 127,472 | | | | — | | | | 127,472 | |
Collateral sold | | | 26,170 | | | | — | | | | 26,170 | | | | 19,243 | | | | — | | | | 19,243 | |
Interbank deposits | | | 48,586 | | | | 7,051 | | | | 55,637 | | | | 31,075 | | | | 3,506 | | | | 34,581 | |
| | | | | | | | | | | | | | | | | | | | | | | | |
Total (2) | | | 288,434 | | | | 7,138 | | | | 295,572 | | | | 229,335 | | | | 3,668 | | | | 233,003 | |
| | | | | | | | | | | | | | | | | | | | | | | | |
| (1) | The amounts of R$ 11,119 (R$ 8,544 at 12/31/2019) are pledged in guarantee of operations on B3 S.A. - Brasil, Bolsa, Balcão (B3) and Central Bank of Brazil and the amounts of R$ 176,760 (R$ 153,359 at 12/31/2019) are pledged in guarantee of repurchase commitment transactions. |
| (2) | Includes losses in the amounts of R$ (56) (R$ (8) at 12/31/2019). |
| | |
| Itaú Unibanco Holding S.A. – Complete Financial Statements in IFRS – December 31, 2020 | | F-33 |
ITAÚ UNIBANCO HOLDING S.A.
Notes to the Consolidated Financial Statements
At 12/31/2020 and 12/31/2019 for balance sheet accounts and
From 01/01 to 12/31 of 2020, 2019 and 2018 for income statement accounts
(In millions of Reais, except information per share)
Note 5 – Financial assets at fair value through profit or loss and designated at fair value through profit or loss—Securities
a) Financial assets at fair value through profit or loss—Securities are presented in the following table:
| | | | | | | | | | | | | | | | | | | | | | | | |
| | | 12/31/2020 | | | 12/31/2019 | |
| | Cost | | | Adjustments to Fair
Value (in Income) (2) | | | Fair value | | | Cost | | | Adjustments to Fair
Value (in Income) | | | Fair value | |
|
Investment funds | | | 15,407 | | | | (1,203 | ) | | | 14,204 | | | | 9,277 | | | | (1,010 | ) | | | 8,267 | |
Brazilian government securities (1a) | | | 284,280 | | | | 1,605 | | | | 285,885 | | | | 218,548 | | | | 1,063 | | | | 219,611 | |
Government securities – abroad (1b) | | | 8,199 | | | | 11 | | | | 8,210 | | | | 1,541 | | | | (21 | ) | | | 1,520 | |
Argentina | | | 1,480 | | | | 18 | | | | 1,498 | | | | 349 | | | | (31 | ) | | | 318 | |
Chile | | | 839 | | | | 1 | | | | 840 | | | | 487 | | | | 1 | | | | 488 | |
Colombia | | | 3,599 | | | | 4 | | | | 3,603 | | | | 399 | | | | 10 | | | | 409 | |
United States | | | 2,096 | | | | (11 | ) | | | 2,085 | | | | 141 | | | | — | | | | 141 | |
Mexico | | | 5 | | | | — | | | | 5 | | | | 57 | | | | — | | | | 57 | |
Paraguay | | | 3 | | | | — | | | | 3 | | | | 2 | | | | — | | | | 2 | |
Peru | | | 4 | | | | 1 | | | | 5 | | | | 8 | | | | — | | | | 8 | |
Uruguay | | | 40 | | | | 1 | | | | 41 | | | | 98 | | | | (1 | ) | | | 97 | |
Italy | | | 133 | | | | (3 | ) | | | 130 | | | | — | | | | — | | | | — | |
Corporate securities (1c) | | | 78,113 | | | | (1,081 | ) | | | 77,032 | | | | 51,744 | | | | (1,102 | ) | | | 50,642 | |
Shares | | | 20,063 | | | | (1,016 | ) | | | 19,047 | | | | 15,459 | | | | (822 | ) | | | 14,637 | |
Rural product note | | | 2,371 | | | | (22 | ) | | | 2,349 | | | | — | | | | — | | | | — | |
Bank deposit certificates | | | 729 | | | | — | | | | 729 | | | | 792 | | | | — | | | | 792 | |
Real estate receivables certificates | | | 561 | | | | (13 | ) | | | 548 | | | | 1,414 | | | | 30 | | | | 1,444 | |
Debentures | | | 30,022 | | | | (85 | ) | | | 29,937 | | | | 12,958 | | | | (303 | ) | | | 12,655 | |
Eurobonds and other | | | 2,341 | | | | 42 | | | | 2,383 | | | | 2,178 | | | | (5 | ) | | | 2,173 | |
Financial bills | | | 15,784 | | | | (1 | ) | | | 15,783 | | | | 18,517 | | | | (3 | ) | | | 18,514 | |
Promissory notes | | | 5,588 | | | | 28 | | | | 5,616 | | | | 313 | | | | — | | | | 313 | |
Other | | | 654 | | | | (14 | ) | | | 640 | | | | 113 | | | | 1 | | | | 114 | |
| | | | | | | | | | | | | | | | | | | | | | | | |
Total | | | 385,999 | | | | (668 | ) | | | 385,331 | | | | 281,110 | | | | (1,070 | ) | | | 280,040 | |
| | | | | | | | | | | | | | | | | | | | | | | | |
| (1) | Financial assets at fair value through profit or loss – Securities pledged as Guarantee of Funding of Financial Institutions and Customers were: a) R$ 12,181 (R$ 28,759 at 12/31/2019), b) R$ 765 (R$ 329 at 12/31/2019) and c) R$ 8,556 (R$ 104 at 12/31/2019), totaling R$ 21,502 (R$ 29,192 at 12/31/2019). |
| (2) | In the period, the result of Adjustment to Fair Value of Financial Assets (particularly private securities) had their amounts affected by oscillations of rates and other market variables arising from the impact of the COVID-19 pandemic on the macroeconomic scenario in the period (Note 33a). |
| | |
| Itaú Unibanco Holding S.A. – Complete Financial Statements in IFRS – December 31, 2020 | | F-34 |
ITAÚ UNIBANCO HOLDING S.A.
Notes to the Consolidated Financial Statements
At 12/31/2020 and 12/31/2019 for balance sheet accounts and
From 01/01 to 12/31 of 2020, 2019 and 2018 for income statement accounts
(In millions of Reais, except information per share)
The cost and fair value per maturity of Financial Assets at Fair Value Through Profit or Loss - Securities were as follows:
| | | | | | | | | | | | | | | | |
| | | 12/31/2020 | | | 12/31/2019 | |
| | | Cost | | | Fair value | | | Cost | | | Fair value | |
Current | | | 152,413 | | | | 150,298 | | | | 82,183 | | | | 80,372 | |
Non-stated maturity | | | 35,470 | | | | 33,251 | | | | 24,736 | | | | 22,904 | |
Up to one year | | | 116,943 | | | | 117,047 | | | | 57,447 | | | | 57,468 | |
Non-current | | | 233,586 | | | | 235,033 | | | | 198,927 | | | | 199,668 | |
From one to five years | | | 175,530 | | | | 176,651 | | | | 136,727 | | | | 137,186 | |
From five to ten years | | | 37,783 | | | | 37,600 | | | | 41,744 | | | | 41,759 | |
After ten years | | | 20,273 | | | | 20,782 | | | | 20,456 | | | | 20,723 | |
| | | | | | | | | | | | | | | | |
Total | | | 385,999 | | | | 385,331 | | | | 281,110 | | | | 280,040 | |
| | | | | | | | | | | | | | | | |
Financial Assets at Fair Value Through Profit or Loss - Securities include assets with a fair value of R$ 205,820 (R$ 204,530 at 12/31/2019) that belong to investment funds wholly owned by Itaú Vida e Previdência S.A.. The return of those assets (positive or negative) is fully transferred to customers of our PGBL and VGBL private pension plans whose premiums (net of fees) are used by our subsidiary to purchase quotas of those investment funds.
b) Financial assets designated at fair value through profit or loss - Securities are presented in the following table:
| | | | | | | | | | | | |
| | | 12/31/2020 | |
| | | Cost | | | Adjustments
to Fair Value (in Income) | | | Fair value | |
Brazilian external debt bonds | | | 3,699 | | | | 41 | | | | 3,740 | |
| | | | | | | | | | | | |
Total | | | 3,699 | | | | 41 | | | | 3,740 | |
| | | | | | | | | | | | |
| | | | | | | | | | | | |
| | | 12/31/2019 | |
| | | Cost | | | Adjustments
to Fair Value (in Income) | | | Fair value | |
Brazilian external debt bonds | | | 1,016 | | | | 19 | | | | 1,035 | |
| | | | | | | | | | | | |
Total | | | 1,016 | | | | 19 | | | | 1,035 | |
| | | | | | | | | | | | |
The cost and fair value by maturity of financial assets designated as fair value through profit or loss - Securities were as follows:
| | | | | | | | | | | | | | | | |
| | | 12/31/2020 | | | 12/31/2019 | |
| | | Cost | | | Fair value | | | Cost | | | Fair value | |
Current | | | 1,806 | | | | 1,826 | | | | 592 | | | | 609 | |
Up to one year | | | 1,806 | | | | 1,826 | | | | 592 | | | | 609 | |
Non-current | | | 1,893 | | | | 1,914 | | | | 424 | | | | 426 | |
From one to five years | �� | | 1,893 | | | | 1,914 | | | | 424 | | | | 426 | |
| | | | | | | | | | | | | | | | |
Total | | | 3,699 | | | | 3,740 | | | | 1,016 | | | | 1,035 | |
| | | | | | | | | | | | | | | | |
| | |
| Itaú Unibanco Holding S.A. – Complete Financial Statements in IFRS – December 31, 2020 | | F-35 |
ITAÚ UNIBANCO HOLDING S.A.
Notes to the Consolidated Financial Statements
At 12/31/2020 and 12/31/2019 for balance sheet accounts and
From 01/01 to 12/31 of 2020, 2019 and 2018 for income statement accounts
(In millions of Reais, except information per share)
Note 6 – Derivatives
ITAÚ UNIBANCO HOLDING trades in derivative financial instruments with various counterparties to manage its overall exposures and to assist its customers in managing their own exposures.
Futures – Interest rate and foreign currency futures contracts are commitments to buy or sell a financial instrument at a future date, at an agreed price or yield, and may be settled in cash or through delivery. The notional amount represents the face value of the underlying instrument. Commodity futures contracts or financial instruments are commitments to buy or sell commodities (mainly gold, coffee and orange juice) at a future date, at an agreed price, which are settled in cash. The notional amount represents the quantity of such commodities multiplied by the future price on the contract date. Daily cash settlements of price movements are made for all instruments.
Forwards – Interest rate forward contracts are agreements to exchange payments on a specified future date, based on the variation in market interest rates from trade date to contract settlement date. Foreign exchange forward contracts represent agreements to exchange the currency of one country for the currency of another at an agreed price, on an agreed settlement date. Financial instrument forward contracts are commitments to buy or sell a financial instrument on a future date at an agreed price and are settled in cash.
Swaps – Interest rate and foreign exchange swap contracts are commitments to settle in cash on a future date or dates the differentials between specific financial indices (either two different interest rates in a single currency or two different rates each in a different currency), as applied to a notional principal amount. Swap contracts shown under Other in the table below correspond substantially to inflation rate swap contracts.
Options – Option contracts give the purchaser, for a fee, the right, but not the obligation, to buy or sell a financial instrument within a limited time, including a flow of interest, foreign currencies, commodities, or financial instruments at an agreed price that may also be settled in cash, based on the differential between specific indices.
Credit Derivatives – Credit derivatives are financial instruments with value deriving from the credit risk on debt issued by a third party (the reference entity), which permits one party (the buyer of the hedge) to transfer the risk to the counterparty (the seller of the hedge). The seller of the hedge must pay out as provided for in the contract if the reference entity undergoes a credit event, such as bankruptcy, default or debt restructuring. The seller of the hedge receives a premium for the hedge but, on the other hand, assumes the risk that the underlying instrument referenced in the contract undergoes a credit event, and the seller may have to make payment to the purchaser of the hedge for up to the notional amount of the credit derivative.
The total value of margins pledged in guarantee by ITAÚ UNIBANCO HOLDING was R$ 18,000 (R$ 15,823 at 12/31/2019) and was basically comprised of government securities.
Further information on internal controls and parameters used to management risks, may be found in Note 32 – Risk and Capital Management.
| | |
| Itaú Unibanco Holding S.A. – Complete Financial Statements in IFRS – December 31, 2020 | | F-36 |
ITAÚ UNIBANCO HOLDING S.A.
Notes to the Consolidated Financial Statements
At 12/31/2020 and 12/31/2019 for balance sheet accounts and
From 01/01 to 12/31 of 2020, 2019 and 2018 for income statement accounts
(In millions of Reais, except information per share)
I - Derivatives Summary
See below the composition of the Derivative financial instruments portfolio (assets and liabilities) by type of instrument, stated fair value and maturity date.
| | | | | | | | | | | | | | | | | | | | | | | | | | | | | | | | |
| | | 12/31/2020 | |
| | | Fair value (*) | | | % | | | 0-30 | | | 31-90 | | | 91-180 | | | 181-365 | | | 366-720 | | | Over 720
days | |
Assets | | | | | | | | | | | | | | | | | | | | | | | | | | | | | | | | |
Swaps – adjustment receivable | | | 46,019 | | | | 60.2 | | | | 4,064 | | | | 515 | | | | 629 | | | | 1,808 | | | | 5,117 | | | | 33,886 | |
Option agreements | | | 20,418 | | | | 26.7 | | | | 10,103 | | | | 2,325 | | | | 523 | | | | 5,935 | | | | 992 | | | | 540 | |
Forwards (onshore) | | | 2,085 | | | | 2.7 | | | | 1,323 | | | | 367 | | | | 297 | | | | 93 | | | | 5 | | | | — | |
Credit derivatives | | | 156 | | | | 0.2 | | | | — | | | | — | | | | 8 | | | | 7 | | | | 29 | | | | 112 | |
NDF - Non Deliverable Forward | | | 7,596 | | | | 9.9 | | | | 2,088 | | | | 2,345 | | | | 1,387 | | | | 1,255 | | | | 323 | | | | 198 | |
Other Derivative Financial Instruments | | | 230 | | | | 0.3 | | | | 56 | | | | 1 | | | | 6 | | | | 1 | | | | 12 | | | | 154 | |
| | | | | | | | | | | | | | | | | | | | | | | | | | | | | | | | |
Total | | | 76,504 | | | | 100.0 | | | | 17,634 | | | | 5,553 | | | | 2,850 | | | | 9,099 | | | | 6,478 | | | | 34,890 | |
% per maturity date | | | | | | | | | | | 23.0 | | | | 7.3 | | | | 3.7 | | | | 11.9 | | | | 8.5 | | | | 45.6 | |
| | | | | | | | | | | | | | | | | | | | | | | | | | | | | | | | |
| | | | | | | | | | | | | | | | | | | | | | | | | | | | | | | | |
| | | 12/31/2020 | |
| | | Fair value (*) | | | % | | | 0-30 | | | 31-90 | | | 91-180 | | | 181-365 | | | 366-720 | | | Over 720
days | |
Liabilities | | | | | | | | | | | | | | | | | | | | | | | | | | | | | | | | |
Swaps – adjustment payable | | | (51,789 | ) | | | 65.1 | | | | (7,344 | ) | | | (651 | ) | | | (1,135 | ) | | | (1,826 | ) | | | (5,573 | ) | | | (35,260 | ) |
Option agreements | | | (20,262 | ) | | | 25.5 | | | | (6,355 | ) | | | (1,969 | ) | | | (543 | ) | | | (9,869 | ) | | | (998 | ) | | | (528 | ) |
Forwards (onshore) | | | (905 | ) | | | 1.1 | | | | (892 | ) | | | — | | | | (11 | ) | | | (2 | ) | | | — | | | | — | |
Credit derivatives | | | (76 | ) | | | 0.1 | | | | — | | | | — | | | | — | | | | (2 | ) | | | (9 | ) | | | (65 | ) |
NDF - Non Deliverable Forward | | | (6,426 | ) | | | 8.1 | | | | (2,200 | ) | | | (1,669 | ) | | | (1,013 | ) | | | (972 | ) | | | (301 | ) | | | (271 | ) |
Other Derivative Financial Instruments | | | (47 | ) | | | 0.1 | | | | — | | | | (1 | ) | | | (10 | ) | | | (1 | ) | | | (14 | ) | | | (21 | ) |
| | | | | | | | | | | | | | | | | | | | | | | | | | | | | | | | |
Total | | | (79,505 | ) | | | 100.0 | | | | (16,791 | ) | | | (4,290 | ) | | | (2,712 | ) | | | (12,672 | ) | | | (6,895 | ) | | | (36,145 | ) |
% per maturity date | | | | | | | | | | | 21.1 | | | | 5.4 | | | | 3.4 | | | | 15.9 | | | | 8.7 | | | | 45.5 | |
| | | | | | | | | | | | | | | | | | | | | | | | | | | | | | | | |
| (*) | In the period, the result of Derivative had its amounts affected by oscillations of rates and other market variables arising from the impact of the COVID-19 pandemic on the macroeconomic scenario in the period (Note 33a). |
| | |
| Itaú Unibanco Holding S.A. – Complete Financial Statements in IFRS – December 31, 2020 | | F-37 |
ITAÚ UNIBANCO HOLDING S.A.
Notes to the Consolidated Financial Statements
At 12/31/2020 and 12/31/2019 for balance sheet accounts and
From 01/01 to 12/31 of 2020, 2019 and 2018 for income statement accounts
(In millions of Reais, except information per share)
See below the composition of the Derivative financial instruments portfolio (assets and liabilities) by type of instrument, stated fair value and maturity date.
| | | | | | | | | | | | | | | | | | | | | | | | | | | | | | | | |
| | | 12/31/2019 | |
| | | Fair value | | | % | | | 0-30 | | | 31-90 | | | 91-180 | | | 181-365 | | | 366-720 | | | Over 720
days | |
Assets | | | | | | | | | | | | | | | | | | | | | | | | | | | | | | | | |
Swaps – adjustment receivable | | | 26,458 | | | | 63.2 | | | | 107 | | | | 1,807 | | | | 564 | | | | 1,668 | | | | 4,464 | | | | 17,848 | |
Option agreements | | | 8,456 | | | | 20.2 | | | | 4,696 | | | | 1,963 | | | | 354 | | | | 726 | | | | 500 | | | | 217 | |
Forwards (onshore) | | | 2,162 | | | | 5.2 | | | | 940 | | | | 636 | | | | 484 | | | | 87 | | | | 15 | | | | — | |
Credit derivatives | | | 167 | | | | 0.4 | | | | — | | | | — | | | | 5 | | | | 3 | | | | 23 | | | | 136 | |
NDF - Non Deliverable Forward | | | 4,446 | | | | 10.6 | | | | 1,251 | | | | 1,314 | | | | 787 | | | | 561 | | | | 347 | | | | 186 | |
Other Derivative Financial Instruments | | | 165 | | | | 0.4 | | | | 4 | | | | — | | | | — | | | | — | | | | 6 | | | | 155 | |
| | | | | | | | | | | | | | | | | | | | | | | | | | | | | | | | |
Total | | | 41,854 | | | | 100.0 | | | | 6,998 | | | | 5,720 | | | | 2,194 | | | | 3,045 | | | | 5,355 | | | | 18,542 | |
% per maturity date | | | | | | | | | | | 16.7 | | | | 13.7 | | | | 5.2 | | | | 7.3 | | | | 12.8 | | | | 44.3 | |
| | | | | | | | | | | | | | | | | | | | | | | | | | | | | | | | |
| | | | | | | | | | | | | | | | | | | | | | | | | | | | | | | | |
| | | 12/31/2019 | |
| | | Fair value | | | % | | | 0-30 | | | 31-90 | | | 91-180 | | | 181-365 | | | 366-720 | | | Over 720
days | |
Liabilities | | | | | | | | | | | | | | | | | | | | | | | | | | | | | | | | |
Swaps – adjustment payable | | | (32,927 | ) | | | 68.8 | | | | (326 | ) | | | (2,557 | ) | | | (898 | ) | | | (1,763 | ) | | | (8,349 | ) | | | (19,034 | ) |
Option agreements | | | (9,061 | ) | | | 18.9 | | | | (3,668 | ) | | | (3,494 | ) | | | (383 | ) | | | (690 | ) | | | (571 | ) | | | (255 | ) |
Forwards (onshore) | | | (754 | ) | | | 1.6 | | | | (753 | ) | | | — | | | | — | | | | (1 | ) | | | — | | | | — | |
Credit derivatives | | | (40 | ) | | | 0.1 | | | | — | | | | — | | | | — | | | | (1 | ) | | | (3 | ) | | | (36 | ) |
NDF - Non Deliverable Forward | | | (4,971 | ) | | | 10.4 | | | | (1,891 | ) | | | (1,108 | ) | | | (657 | ) | | | (637 | ) | | | (526 | ) | | | (152 | ) |
Other Derivative Financial Instruments | | | (75 | ) | | | 0.2 | | | | (15 | ) | | | (1 | ) | | | (2 | ) | | | (4 | ) | | | (9 | ) | | | (44 | ) |
| | | | | | | | | | | | | | | | | | | | | | | | | | | | | | | | |
Total | | | (47,828 | ) | | | 100.0 | | | | (6,653 | ) | | | (7,160 | ) | | | (1,940 | ) | | | (3,096 | ) | | | (9,458 | ) | | | (19,521 | ) |
% per maturity date | | | | | | | | | | | 13.9 | | | | 15.0 | | | | 4.1 | | | | 6.5 | | | | 19.7 | | | | 40.8 | |
| | | | | | | | | | | | | | | | | | | | | | | | | | | | | | | | |
| | |
| Itaú Unibanco Holding S.A. – Complete Financial Statements in IFRS – December 31, 2020 | | F-38 |
ITAÚ UNIBANCO HOLDING S.A.
Notes to the Consolidated Financial Statements
At 12/31/2020 and 12/31/2019 for balance sheet accounts and
From 01/01 to 12/31 of 2020, 2019 and 2018 for income statement accounts
(In millions of Reais, except information per share)
II - Derivatives by index and Risk Fator
| | | | | | | | | | | | | | | | |
| | | Off-balance sheet
notional amount | | | Balance sheet account
receivable / (received)
(payable) / paid | | | Adjustment to fair
value (in income /
stockholders’ equity) | | | Fair value | |
| | | 12/31/2020 | | | 12/31/2020 | | | 12/31/2020 | | | 12/31/2020 | |
Future contracts | | | 781,453 | | | | — | | | | — | | | | — | |
Purchase commitments | | | 338,165 | | | | — | | | | — | | | | — | |
Shares | | | 8,300 | | | | — | | | | — | | | | — | |
Commodities | | | 1,170 | | | | — | | | | — | | | | — | |
Interest | | | 304,454 | | | | — | | | | — | | | | — | |
Foreign currency | | | 24,241 | | | | — | | | | — | | | | — | |
Commitments to sell | | | 443,288 | | | | — | | | | — | | | | — | |
Shares | | | 7,535 | | | | — | | | | — | | | | — | |
Commodities | | | 2,201 | | | | — | | | | — | | | | — | |
Interest | | | 397,157 | | | | — | | | | — | | | | — | |
Foreign currency | | | 36,395 | �� | | | — | | | | — | | | | — | |
Swap contracts | | | | | | | (6,054 | ) | | | 284 | | | | (5,770 | ) |
Asset position | | | 1,442,449 | | | | 16,840 | | | | 29,179 | | | | 46,019 | |
Commodities | | | 278 | | | | 1 | | | | — | | | | 1 | |
Interest | | | 1,423,134 | | | | 14,030 | | | | 27,953 | | | | 41,983 | |
Foreign currency | | | 19,037 | | | | 2,809 | | | | 1,226 | | | | 4,035 | |
Liability position | | | 1,442,449 | | | | (22,894 | ) | | | (28,895 | ) | | | (51,789 | ) |
Shares | | | 108 | | | | (12 | ) | | | 2 | | | | (10 | ) |
Commodities | | | 341 | | | | (9 | ) | | | — | | | | (9 | ) |
Interest | | | 1,425,904 | | | | (19,112 | ) | | | (28,584 | ) | | | (47,696 | ) |
Foreign currency | | | 16,096 | | | | (3,761 | ) | | | (313 | ) | | | (4,074 | ) |
Option contracts | | | 1,738,849 | | | | 22 | | | | 134 | | | | 156 | |
Purchase commitments – long position | | | 131,134 | | | | 14,538 | | | | 1,828 | | | | 16,366 | |
Shares | | | 12,400 | | | | 345 | | | | 976 | | | | 1,321 | |
Commodities | | | 356 | | | | 14 | | | | 13 | | | | 27 | |
Interest | | | 50,771 | | | | 614 | | | | (282 | ) | | | 332 | |
Foreign currency | | | 67,607 | | | | 13,565 | | | | 1,121 | | | | 14,686 | |
Commitments to sell – long position | | | 743,573 | | | | 2,933 | | | | 1,119 | | | | 4,052 | |
Shares | | | 14,659 | | | | 728 | | | | 62 | | | | 790 | |
Commodities | | | 75 | | | | 2 | | | | (1 | ) | | | 1 | |
Interest | | | 659,826 | | | | 1,087 | | | | 1,373 | | | | 2,460 | |
Foreign currency | | | 69,013 | | | | 1,116 | | | | (315 | ) | | | 801 | |
Purchase commitments – short position | | | 129,150 | | | | (13,934 | ) | | | (1,797 | ) | | | (15,731 | ) |
Shares | | | 13,080 | | | | (348 | ) | | | (1,119 | ) | | | (1,467 | ) |
Commodities | | | 899 | | | | (28 | ) | | | (18 | ) | | | (46 | ) |
Interest | | | 55,369 | | | | (532 | ) | | | 318 | | | | (214 | ) |
Foreign currency | | | 59,802 | | | | (13,026 | ) | | | (978 | ) | | | (14,004 | ) |
Commitments to sell – short position | | | 734,992 | | | | (3,515 | ) | | | (1,016 | ) | | | (4,531 | ) |
Shares | | | 13,200 | | | | (524 | ) | | | (156 | ) | | | (680 | ) |
Commodities | | | 246 | | | | (10 | ) | | | 6 | | | | (4 | ) |
Interest | | | 653,376 | | | | (978 | ) | | | (1,317 | ) | | | (2,295 | ) |
Foreign currency | | | 68,170 | | | | (2,003 | ) | | | 451 | | | | (1,552 | ) |
Forward operations (onshore) | | | 23,989 | | | | 1,195 | | | | (15 | ) | | | 1,180 | |
Purchases receivable | | | 18,666 | | | | 1,014 | | | | (3 | ) | | | 1,011 | |
Shares | | | 304 | | | | 304 | | | | (3 | ) | | | 301 | |
Interest | | | 584 | | | | 710 | | | | — | | | | 710 | |
Foreign currency | | | 17,778 | | | | — | | | | — | | | | — | |
Purchases payable obligations | | | — | | | | (584 | ) | | | — | | | | (584 | ) |
Interest | | | — | | | | (584 | ) | | | — | | | | (584 | ) |
Sales receivable | | | 1,132 | | | | 1,073 | | | | 1 | | | | 1,074 | |
Shares | | | 770 | | | | 765 | | | | 1 | | | | 766 | |
Interest | | | — | | | | 308 | | | | — | | | | 308 | |
Foreign currency | | | 362 | | | | — | | | | — | | | | — | |
Sales deliverable obligations | | | 4,191 | | | | (308 | ) | | | (13 | ) | | | (321 | ) |
Interest | | | 308 | | | | (308 | ) | | | — | | | | (308 | ) |
Foreign currency | | | 3,883 | | | | — | | | | (13 | ) | | | (13 | ) |
Credit derivatives | | | 20,060 | | | | (432 | ) | | | 512 | | | | 80 | |
Asset position | | | 15,877 | | | | (270 | ) | | | 426 | | | | 156 | |
Shares | | | 2,796 | | | | (84 | ) | | | 172 | | | | 88 | |
Commodities | | | 19 | | | | — | | | | 1 | | | | 1 | |
Interest | | | 13,062 | | | | (186 | ) | | | 253 | | | | 67 | |
Liability position | | | 4,183 | | | | (162 | ) | | | 86 | | | | (76 | ) |
Shares | | | 1,154 | | | | (45 | ) | | | 11 | | | | (34 | ) |
Commodities | | | 3 | | | | — | | | | — | | | | — | |
Interest | | | 3,026 | | | | (117 | ) | | | 75 | | | | (42 | ) |
NDF – Non Deliverable Forward | | | 313,463 | | | | 1,214 | | | | (44 | ) | | | 1,170 | |
Asset position | | | 156,542 | | | | 7,467 | | | | 129 | | | | 7,596 | |
Commodities | | | 1,715 | | | | 278 | | | | (16 | ) | | | 262 | |
Foreign currency | | | 154,827 | | | | 7,189 | | | | 145 | | | | 7,334 | |
Liability position | | | 156,921 | | | | (6,253 | ) | | | (173 | ) | | | (6,426 | ) |
Commodities | | | 975 | | | | (37 | ) | | | (1 | ) | | | (38 | ) |
Foreign currency | | | 155,946 | | | | (6,216 | ) | | | (172 | ) | | | (6,388 | ) |
Other derivative financial instruments | | | 6,413 | | | | 181 | | | | 2 | | | | 183 | |
Asset position | | | 5,274 | | | | 196 | | | | 34 | | | | 230 | |
Shares | | | 47 | | | | (3 | ) | | | 3 | | | | — | |
Interest | | | 5,225 | | | | 199 | | | | (26 | ) | | | 173 | |
Foreign currency | | | 2 | | | | — | | | | 57 | | | | 57 | |
Liability position | | | 1,139 | | | | (15 | ) | | | (32 | ) | | | (47 | ) |
Shares | | | 705 | | | | (6 | ) | | | (22 | ) | | | (28 | ) |
Interest | | | 434 | | | | (9 | ) | | | (10 | ) | | | (19 | ) |
| | | Asset | | | | 43,791 | | | | 32,713 | | | | 76,504 | |
| | | Liability | | | | (47,665 | ) | | | (31,840 | ) | | | (79,505 | ) |
| | | Total | | | | (3,874 | ) | | | 873 | | | | (3,001 | ) |
Derivative contracts mature as follows (in days):
| | | | | | | | | | | | | | | | | | | | |
Off-balance sheet – notional amount | | 0 - 30 | | | 31 - 180 | | | 181 - 365 | | | Over 365 days | | | 12/31/2020 | |
Future contracts | | | 305,076 | | | | 242,842 | | | | 108,338 | | | | 125,197 | | | | 781,453 | |
Swap contracts | | | 272,932 | | | | 123,360 | | | | 118,617 | | | | 927,540 | | | | 1,442,449 | |
Option contracts | | | 1,012,965 | | | | 216,425 | | | | 250,966 | | | | 258,493 | | | | 1,738,849 | |
Forwards (onshore) | | | 19,013 | | | | 3,999 | | | | 972 | | | | 5 | | | | 23,989 | |
Credit derivatives | | | — | | | | 8,515 | | | | 804 | | | | 10,741 | | | | 20,060 | |
NDF - Non Deliverable Forward | | | 131,205 | | | | 124,470 | | | | 38,006 | | | | 19,782 | | | | 313,463 | |
Other derivative financial instruments | | | 15 | | | | 709 | | | | 279 | | | | 5,410 | | | | 6,413 | |
| | |
| Itaú Unibanco Holding S.A. – Complete Financial Statements in IFRS – December 31, 2020 | | F-39 |
ITAÚ UNIBANCO HOLDING S.A.
Notes to the Consolidated Financial Statements
At 12/31/2020 and 12/31/2019 for balance sheet accounts and
From 01/01 to 12/31 of 2020, 2019 and 2018 for income statement accounts
(In millions of Reais, except information per share)
| | | | | | | | | | | | | | | | |
| | | Off-balance sheet
notional amount | | | Balance sheet account
receivable / (received)
(payable) / paid | | | Adjustment to fair
value (in income /
stockholders’ equity) | | | Fair value | |
| | | 12/31/2019 | | | 12/31/2019 | | | 12/31/2019 | | | 12/31/2019 | |
Future contracts | | | 664,884 | | | | — | | | | — | | | | — | |
Purchase commitments | | | 325,468 | | | | — | | | | — | | | | — | |
Shares | | | 1,084 | | | | — | | | | — | | | | — | |
Commodities | | | 76 | | | | — | | | | — | | | | — | |
Interest | | | 301,898 | | | | — | | | | — | | | | — | |
Foreign currency | | | 22,410 | | | | — | | | | — | | | | — | |
Commitments to sell | | | 339,416 | | | | — | | | | — | | | | — | |
Shares | | | 1,163 | | | | — | | | | — | | | | — | |
Commodities | | | 1,049 | | | | — | | | | — | | | | — | |
Interest | | | 308,824 | | | | — | | | | — | | | | — | |
Foreign currency | | | 28,380 | | | | — | | | | — | | | | — | |
Swap contracts | | | | | | | (5,267 | ) | | | (1,202 | ) | | | (6,469 | ) |
Asset position | | | 1,094,378 | | | | 5,566 | | | | 20,892 | | | | 26,458 | |
Commodities | | | 574 | | | | — | | | | 9 | | | | 9 | |
Interest | | | 1,075,534 | | | | 4,596 | | | | 19,813 | | | | 24,409 | |
Foreign currency | | | 18,270 | | | | 970 | | | | 1,070 | | | | 2,040 | |
Liability position | | | 1,094,378 | | | | (10,833 | ) | | | (22,094 | ) | | | (32,927 | ) |
Shares | | | 49 | | | | (9 | ) | | | — | | | | (9 | ) |
Commodities | | | 855 | | | | — | | | | (12 | ) | | | (12 | ) |
Interest | | | 1,068,660 | | | | (9,383 | ) | | | (21,855 | ) | | | (31,238 | ) |
Foreign currency | | | 24,814 | | | | (1,441 | ) | | | (227 | ) | | | (1,668 | ) |
Option contracts | | | 1,720,205 | | | | (546 | ) | | | (59 | ) | | | (605 | ) |
Purchase commitments – long position | | | 245,824 | | | | 6,191 | | | | (6 | ) | | | 6,185 | |
Shares | | | 11,513 | | | | 256 | | | | 515 | | | | 771 | |
Commodities | | | 268 | | | | 7 | | | | 10 | | | | 17 | |
Interest | | | 188,110 | | | | 465 | | | | (331 | ) | | | 134 | |
Foreign currency | | | 45,933 | | | | 5,463 | | | | (200 | ) | | | 5,263 | |
Commitments to sell – long position | | | 626,187 | | | | 1,667 | | | | 604 | | | | 2,271 | |
Shares | | | 12,294 | | | | 396 | | | | (40 | ) | | | 356 | |
Commodities | | | 228 | | | | 5 | | | | (2 | ) | | | 3 | |
Interest | | | 568,442 | | | | 513 | | | | 887 | | | | 1,400 | |
Foreign currency | | | 45,223 | | | | 753 | | | | (241 | ) | | | 512 | |
Purchase commitments – short position | | | 172,703 | | | | (6,671 | ) | | | (19 | ) | | | (6,690 | ) |
Shares | | | 6,312 | | | | (180 | ) | | | (451 | ) | | | (631 | ) |
Commodities | | | 235 | | | | (10 | ) | | | (8 | ) | | | (18 | ) |
Interest | | | 129,647 | | | | (412 | ) | | | 329 | | | | (83 | ) |
Foreign currency | | | 36,509 | | | | (6,069 | ) | | | 111 | | | | (5,958 | ) |
Commitments to sell – short position | | | 675,491 | | | | (1,733 | ) | | | (638 | ) | | | (2,371 | ) |
Shares | | | 11,152 | | | | (269 | ) | | | (37 | ) | | | (306 | ) |
Commodities | | | 485 | | | | (11 | ) | | | — | | | | (11 | ) |
Interest | | | 621,405 | | | | (428 | ) | | | (888 | ) | | | (1,316 | ) |
Foreign currency | | | 42,449 | | | | (1,025 | ) | | | 287 | | | | (738 | ) |
Forward operations (onshore) | | | 5,134 | | | | 1,412 | | | | (4 | ) | | | 1,408 | |
Purchases receivable | | | 668 | | | | 796 | | | | (6 | ) | | | 790 | |
Shares | | | 488 | | | | 488 | | | | (6 | ) | | | 482 | |
Interest | | | 160 | | | | 308 | | | | — | | | | 308 | |
Foreign currency | | | 20 | | | | — | | | | — | | | | — | |
Purchases payable obligations | | | 660 | | | | (160 | ) | | | — | | | | (160 | ) |
Interest | | | — | | | | (160 | ) | | | — | | | | (160 | ) |
Foreign currency | | | 660 | | | | — | | | | — | | | | — | |
Sales receivable | | | 1,653 | | | | 1,368 | | | | 4 | | | | 1,372 | |
Shares | | | 786 | | | | 776 | | | | 3 | | | | 779 | |
Interest | | | — | | | | 592 | | | | 1 | | | | 593 | |
Foreign currency | | | 867 | | | | — | | | | — | | | | — | |
Sales deliverable obligations | | | 2,153 | | | | (592 | ) | | | (2 | ) | | | (594 | ) |
Interest | | | 592 | | | | (592 | ) | | | (1 | ) | | | (593 | ) |
Foreign currency | | | 1,561 | | | | — | | | | (1 | ) | | | (1 | ) |
Credit derivatives | | | 12,739 | | | | (236 | ) | | | 363 | | | | 127 | |
Asset position | | | 9,878 | | | | (165 | ) | | | 332 | | | | 167 | |
Shares | | | 2,307 | | | | (81 | ) | | | 215 | | | | 134 | |
Commodities | | | 27 | | | | (1 | ) | | | 3 | | | | 2 | |
Interest | | | 7,423 | | | | (87 | ) | | | 114 | | | | 27 | |
Foreign currency | | | 121 | | | | 4 | | | | — | | | | 4 | |
Liability position | | | 2,861 | | | | (71 | ) | | | 31 | | | | (40 | ) |
Shares | | | 719 | | | | (28 | ) | | | 8 | | | | (20 | ) |
Commodities | | | 2 | | | | — | | | | — | | | | — | |
Interest | | | 2,140 | | | | (43 | ) | | | 23 | | | | (20 | ) |
NDF – Non Deliverable Forward | | | 295,508 | | | | (552 | ) | | | 27 | | | | (525 | ) |
Asset position | | | 138,772 | | | | 4,239 | | | | 207 | | | | 4,446 | |
Commodities | | | 570 | | | | 34 | | | | (1 | ) | | | 33 | |
Foreign currency | | | 138,202 | | | | 4,205 | | | | 208 | | | | 4,413 | |
Liability position | | | 156,736 | | | | (4,791 | ) | | | (180 | ) | | | (4,971 | ) |
Commodities | | | 316 | | | | (10 | ) | | | (1 | ) | | | (11 | ) |
Foreign currency | | | 156,420 | | | | (4,781 | ) | | | (179 | ) | | | (4,960 | ) |
Other derivative financial instruments | | | 6,581 | | | | 216 | | | | (126 | ) | | | 90 | |
Asset position | | | 5,428 | | | | 226 | | | | (61 | ) | | | 165 | |
Interest | | | 5,428 | | | | 226 | | | | (65 | ) | | | 161 | |
Foreign currency | | | — | | | | — | | | | 4 | | | | 4 | |
Liability position | | | 1,153 | | | | (10 | ) | | | (65 | ) | | | (75 | ) |
Shares | | | 695 | | | | 2 | | | | (41 | ) | | | (39 | ) |
Interest | | | 458 | | | | (12 | ) | | | (6 | ) | | | (18 | ) |
Foreign currency | | | — | | | | — | | | | (18 | ) | | | (18 | ) |
| | | Asset | | | | 19,888 | | | | 21,966 | | | | 41,854 | |
| | | Liability | | | | (24,861 | ) | | | (22,967 | ) | | | (47,828 | ) |
| | | Total | | | | (4,973 | ) | | | (1,001 | ) | | | (5,974 | ) |
Derivative contracts mature as follows (in days):
| | | | | | | | | | | | | | | | | | | | |
Off-balance sheet – notional amount | | 0 - 30 | | | 31 - 180 | | | 181 - 365 | | | Over 365 days | | | 12/31/2019 | |
Future contracts | | | 196,055 | | | | 238,485 | | | | 87,747 | | | | 142,597 | | | | 664,884 | |
Swap contracts | | | 24,094 | | | | 204,065 | | | | 103,013 | | | | 763,206 | | | | 1,094,378 | |
Option contracts | | | 988,793 | | | | 320,300 | | | | 258,488 | | | | 152,624 | | | | 1,720,205 | |
Forwards (onshore) | | | 953 | | | | 2,514 | | | | 1,651 | | | | 16 | | | | 5,134 | |
Credit derivatives | | | — | | | | 4,746 | | | | 733 | | | | 7,260 | | | | 12,739 | |
NDF - Non Deliverable Forward | | | 105,809 | | | | 129,278 | | | | 38,851 | | | | 21,570 | | | | 295,508 | |
Other derivative financial instruments | | | 12 | | | | 786 | | | | 320 | | | | 5,463 | | | | 6,581 | |
| | |
| Itaú Unibanco Holding S.A. – Complete Financial Statements in IFRS – December 31, 2020 | | F-40 |
ITAÚ UNIBANCO HOLDING S.A.
Notes to the Consolidated Financial Statements
At 12/31/2020 and 12/31/2019 for balance sheet accounts and
From 01/01 to 12/31 of 2020, 2019 and 2018 for income statement accounts
(In millions of Reais, except information per share)
III - Derivatives by notional amount
See below the composition of the Derivative Financial Instruments portfolio by type of instrument, stated at their notional amounts, per trading location (organized or over-the-counter market) and counterparties.
| | | | | | | | | | | | | | | | | | | | | | | | | | | | |
| | | 12/31/2020 | |
| | Future
contracts | | | Swap
contracts | | | Option
contracts | | | Forwards
(onshore) | | | Credit derivatives | | | NDF - Non
Deliverable
Forward | | | Other derivative
financial
instruments | |
Stock exchange | | | 781,453 | | | | 835,744 | | | | 1,617,643 | | | | 23,097 | | | | 3,743 | | | | 67,887 | | | | — | |
Over-the-counter market | | | — | | | | 606,705 | | | | 121,206 | | | | 892 | | | | 16,317 | | | | 245,576 | | | | 6,413 | |
Financial institutions | | | — | | | | 531,303 | | | | 84,865 | | | | 892 | | | | 16,317 | | | | 124,124 | | | | 5,140 | |
Companies | | | — | | | | 69,337 | | | | 35,021 | | | | — | | | | — | | | | 120,476 | | | | 1,273 | |
Individuals | | | — | | | | 6,065 | | | | 1,320 | | | | — | | | | — | | | | 976 | | | | — | |
| | | | | | | | | | | | | | | | | | | | | | | | | | | | |
Total | | | 781,453 | | | | 1,442,449 | | | | 1,738,849 | | | | 23,989 | | | | 20,060 | | | | 313,463 | | | | 6,413 | |
| | | | | | | | | | | | | | | | | | | | | | | | | | | | |
| | | | | | | | | | | | | | | | | | | | | | | | | | | | |
| | | 12/31/2019 | |
| | Future
contracts | | | Swap
contracts | | | Option
contracts | | | Forwards
(onshore) | | | Credit derivatives | | | NDF - Non
Deliverable
Forward | | | Other derivative
financial
instruments | |
Stock exchange | | | 664,884 | | | | 595,221 | | | | 1,624,988 | | | | 4,381 | | | | 61 | | | | 69,463 | | | | — | |
Over-the-counter market | | | — | | | | 499,157 | | | | 95,217 | | | | 753 | | | | 12,678 | | | | 226,045 | | | | 6,581 | |
Financial institutions | | | — | | | | 398,585 | | | | 66,291 | | | | 292 | | | | 12,678 | | | | 125,550 | | | | 5,340 | |
Companies | | | — | | | | 69,185 | | | | 28,511 | | | | 461 | | | | — | | | | 99,151 | | | | 1,241 | |
Individuals | | | — | | | | 31,387 | | | | 415 | | | | — | | | | — | | | | 1,344 | | | | — | |
| | | | | | | | | | | | | | | | | | | | | | | | | | | | |
Total | | | 664,884 | | | | 1,094,378 | | | | 1,720,205 | | | | 5,134 | | | | 12,739 | | | | 295,508 | | | | 6,581 | |
| | | | | | | | | | | | | | | | | | | | | | | | | | | | |
| | |
| Itaú Unibanco Holding S.A. – Complete Financial Statements in IFRS – December 31, 2020 | | F-41 |
ITAÚ UNIBANCO HOLDING S.A.
Notes to the Consolidated Financial Statements
At 12/31/2020 and 12/31/2019 for balance sheet accounts and
From 01/01 to 12/31 of 2020, 2019 and 2018 for income statement accounts
(In millions of Reais, except information per share)
IV - Credit derivatives
ITAÚ UNIBANCO HOLDING buys and sells credit protection in order to meet the needs of its customers, management and mitigation of its portfolios’ risk.
CDS (credit default swap) is a credit derivative in which, upon a default related to the reference entity, the protection buyer is entitled to receive, the amount equivalent to the difference between the face value of the CDS contract and the fair value of the liability on the date the contract was settled, also known as the recovered amount. The protection buyer does not need to hold the debt instrument of the reference entity for it to receive the amounts due pursuant to the CDS contract terms when a credit event occurs.
TRS (total return swap) is a transaction in which a party swaps the total return of an asset or of a basket of assets for regular cash flows, usually interest and a guarantee against capital loss. In a TRS contract, the parties do not transfer the ownership of the assets.
| | | | | | | | | | | | | | | | | | | | |
| | | 12/31/2020 | |
| | | Maximum potential
of future payments,
gross | | | Up to 1 year | | | From 1 to 3
years | | | From 3 to 5
years | | | Over 5 years | |
By instrument | | | | | | | | | | | | | | | | | | | | |
CDS | | | 8,501 | | | | 1,181 | | | | 3,928 | | | | 3,372 | | | | 20 | |
TRS | | | 7,854 | | | | 7,854 | | | | — | | | | — | | | | — | |
| | | | | | | | | | | | | | | | | | | | |
Total by instrument | | | 16,355 | | | | 9,035 | | | | 3,928 | | | | 3,372 | | | | 20 | |
| | | | | | | | | | | | | | | | | | | | |
By risk rating | | | | | | | | | | | | | | | | | | | | |
Investment grade | | | 752 | | | | 296 | | | | 372 | | | | 84 | | | | — | |
Below investment grade | | | 15,603 | | | | 8,739 | | | | 3,556 | | | | 3,288 | | | | 20 | |
| | | | | | | | | | | | | | | | | | | | |
Total by risk | | | 16,355 | | | | 9,035 | | | | 3,928 | | | | 3,372 | | | | 20 | |
| | | | | | | | | | | | | | | | | | | | |
By reference entity | | | | | | | | | | | | | | | | | | | | |
Brazilian government | | | 12,433 | | | | 8,255 | | | | 1,627 | | | | 2,551 | | | | — | |
Governments – abroad | | | 243 | | | | 66 | | | | 122 | | | | 55 | | | | — | |
Private entities | | | 3,679 | | | | 714 | | | | 2,179 | | | | 766 | | | | 20 | |
| | | | | | | | | | | | | | | | | | | | |
Total by entity | | | 16,355 | | | | 9,035 | | | | 3,928 | | | | 3,372 | | | | 20 | |
| | | | | | | | | | | | | | | | | | | | |
| | | | | | | | | | | | | | | | | | | | |
| | | 12/31/2019 | |
| | | Maximum potential
of future payments,
gross | | | Up to 1 year | | | From 1 to 3
years | | | From 3 to 5
years | | | Over 5 years | |
By instrument | | | | | | | | | | | | | | | | | | | | |
CDS | | | 6,283 | | | | 1,013 | | | | 2,675 | | | | 2,539 | | | | 56 | |
TRS | | | 4,161 | | | | 4,161 | | | | — | | | | — | | | | — | |
| | | | | | | | | | | | | | | | | | | | |
Total by instrument | | | 10,444 | | | | 5,174 | | | | 2,675 | | | | 2,539 | | | | 56 | |
| | | | | | | | | | | | | | | | | | | | |
By risk rating | | | | | | | | | | | | | | | | | | | | |
Investment grade | | | 1,049 | | | | 135 | | | | 602 | | | | 312 | | | | — | |
Below investment grade | | | 9,395 | | | | 5,039 | | | | 2,073 | | | | 2,227 | | | | 56 | |
| | | | | | | | | | | | | | | | | | | | |
Total by risk | | | 10,444 | | | | 5,174 | | | | 2,675 | | | | 2,539 | | | | 56 | |
| | | | | | | | | | | | | | | | | | | | |
By reference entity | | | | | | | | | | | | | | | | | | | | |
Brazilian government | | | 7,301 | | | | 4,921 | | | | 1,117 | | | | 1,263 | | | | — | |
Governments – abroad | | | 200 | | | | 34 | | | | 88 | | | | 78 | | | | — | |
Private entities | | | 2,943 | | | | 219 | | | | 1,470 | | | | 1,198 | | | | 56 | |
| | | | | | | | | | | | | | | | | | | | |
Total by entity | | | 10,444 | | | | 5,174 | | | | 2,675 | | | | 2,539 | | | | 56 | |
| | | | | | | | | | | | | | | | | | | | |
ITAÚ UNIBANCO HOLDING assesses the risk of a credit derivative based on the credit ratings attributed to the reference entity by independent credit rating agencies. Investment grade entities are those for which credit risk is rated as Baa3 or higher, as rated by Moody’s, and BBB- or higher, by Standard & Poor’s and Fitch Ratings.
The following table presents the notional amount of credit derivatives purchased. The underlying amounts are identical to those for which ITAÚ UNIBANCO HOLDING has sold credit protection.
| | |
| Itaú Unibanco Holding S.A. – Complete Financial Statements in IFRS – December 31, 2020 | | F-42 |
ITAÚ UNIBANCO HOLDING S.A.
Notes to the Consolidated Financial Statements
At 12/31/2020 and 12/31/2019 for balance sheet accounts and
From 01/01 to 12/31 of 2020, 2019 and 2018 for income statement accounts
(In millions of Reais, except information per share)
| | | | | | | | | | | | |
| | | 12/31/2020 | |
| | | Notional amount of credit
protection sold | | | Notional amount of credit protection
purchased with identical underlying
amount | | | Net position | |
CDS | | | (8,501 | ) | | | 3,705 | | | | (4,796 | ) |
TRS | | | (7,854 | ) | | | — | | | | (7,854 | ) |
| | | | | | | | | | | | |
Total | | | (16,355 | ) | | | 3,705 | | | | (12,650 | ) |
| | | | | | | | | | | | |
| | | | | | | | | | | | |
| | | 12/31/2019 | |
| | | Notional amount of credit
protection sold | | | Notional amount of credit protection
purchased with identical underlying
amount | | | Net position | |
CDS | | | (6,283 | ) | | | 2,295 | | | | (3,988 | ) |
TRS | | | (4,161 | ) | | | — | | | | (4,161 | ) |
| | | | | | | | | | | | |
Total | | | (10,444 | ) | | | 2,295 | | | | (8,149 | ) |
| | | | | | | | | | | | |
| | |
| Itaú Unibanco Holding S.A. – Complete Financial Statements in IFRS – December 31, 2020 | | F-43 |
ITAÚ UNIBANCO HOLDING S.A.
Notes to the Consolidated Financial Statements
At 12/31/2020 and 12/31/2019 for balance sheet accounts and
From 01/01 to 12/31 of 2020, 2019 and 2018 for income statement accounts
(In millions of Reais, except information per share)
V - Financial instruments subject to offsetting, enforceable master netting arrangements and similar agreements
The following tables set forth the financial assets and liabilities that are subject to offsetting, enforceable master netting arrangements and similar agreements, as well as how these financial assets and liabilities have been presented in ITAÚ UNIBANCO HOLDING’s consolidated financial statements. These tables also reflect the amounts of collateral pledged or received in relation to financial assets and liabilities subject to enforceable arrangements that have not been presented on a net basis in accordance with IAS 32.
Financial assets subject to offsetting, enforceable master netting arrangements and similar agreements:
| | | | | | | | | | | | | | | | | | | | | | | | |
| | | 12/31/2020 | |
| | | Gross
amount of
recognized
financial
assets (1) | | | Gross amount
offset in the
Balance Sheet | | | Net amount of
financial assets
presented in
the Balance
Sheet | | | Related amounts not
offset in the Balance
Sheet (2) | | | | |
| | | Financial
instruments (3) | | | Cash
collateral
received | | | Total | |
Securities purchased under agreements to resell | |
| 239,935
|
| | | — | | | | 239,935 | | | | (1,657 | ) | | | — | | |
| 238,278
|
|
Derivatives financial instruments | |
| 76,504
|
| | | — | | | | 76,504 | | | | (15,621 | ) | | | — | | |
| 60,883
|
|
| | | | | | | | | | | | | | | | | | | | | | | | |
| | | 12/31/2019 | |
| | | Gross
amount of
recognized
financial
assets (1) | | | Gross amount
offset in the
Balance Sheet | | | Net amount of
financial assets
presented in
the Balance
Sheet | | | Related amounts not
offset in the Balance
Sheet (2) | | | | |
| | | Financial
instruments (3) | | | Cash
collateral
received | | | Total | |
Securities purchased under agreements to resell | | | 198,422 | | | | — | | | | 198,422 | | | | (596 | ) | | | — | | | | 197,826 | |
Derivatives financial instruments | | | 41,854 | | | | — | | | | 41,854 | | | | (14,121 | ) | | | — | | | | 27,733 | |
Financial liabilities subject to offsetting, enforceable master netting arrangements and similar agreements:
| | | | | | | | | | | | | | | | | | | | | | | | |
| | | 12/31/2020 | |
| | | Gross
amount of
recognized
financial
liabilities (1) | | | Gross amount
offset in the
Balance Sheet | | | Net amount of
financial liabilities
presented in the
Balance Sheet | | | Related amounts not
offset in the Balance
Sheet (2) | | | | |
| | | Financial
instruments (3) | | | Cash
collateral
pledged | | | Total | |
Securities sold under repurchase agreements | | | 273,364 | | | | — | | |
| 273,364
|
| | | (42,161 | ) | | | — | | | | 231,203 | |
Derivatives financial instruments | | | 79,505 | | | | — | | |
| 79,505
|
| | | (15,621 | ) | | | (574 | ) | | | 63,310 | |
| | | | | | | | | | | | | | | | | | | | | | | | |
| | | 12/31/2019 | |
| | | Gross
amount of
recognized
financial
liabilities (1) | | | Gross amount
offset in the
Balance Sheet | | | Net amount of
financial liabilities
presented in the
Balance Sheet | | | Related amounts not
offset in the Balance
Sheet (2) | | | | |
| | | Financial
instruments (3) | | | Cash
collateral
pledged | | | Total | |
Securities sold under repurchase agreements | | | 256,583 | | | | — | | | | 256,583 | | | | (23,509 | ) | | | — | | | | 233,074 | |
Derivatives financial instruments | | | 47,828 | | | | — | | | | 47,828 | | | | (14,121 | ) | | | (148 | ) | | | 33,559 | |
| (1) | Includes amounts of master offset agreements and other such agreements, both enforceable and unenforceable. |
| (2) | Limited to amounts subject to enforceable master offset agreements and other such agreements. |
| (3) | Includes amounts subject to enforceable master offset agreements and other such agreements, and guarantees in financial instruments. |
Financial assets and financial liabilities are offset in the balance sheet only when there is a legally enforceable right to offset the recognized amounts and there is an intention to settle on a net basis, or realize the asset and settle the liability simultaneously.
Derivatives financial instruments and repurchased agreements not set off in the balance sheet relate to transactions in which there are enforceable master netting agreements or similar agreements, but the offset criteria have not been met in accordance with paragraph 42 of IAS 32 mainly because ITAÚ UNIBANCO HOLDING has no intention to settle on a net basis, or realize the asset and settle the liability simultaneously.
| | |
| Itaú Unibanco Holding S.A. – Complete Financial Statements in IFRS – December 31, 2020 | | F-44 |
ITAÚ UNIBANCO HOLDING S.A.
Notes to the Consolidated Financial Statements
At 12/31/2020 and 12/31/2019 for balance sheet accounts and
From 01/01 to 12/31 of 2020, 2019 and 2018 for income statement accounts
(In millions of Reais, except information per share)
Note 7 – Hedge accounting
There are three types of hedge relations: Fair value hedge, Cash flow hedge and Hedge of net investment in foreign operations.
In hedge accounting, the groups of risk factors measured by ITAÚ UNIBANCO HOLDING are:
| | • | | Interest Rate: Risk of loss in transactions subject to interest rate variations; |
| | • | | Currency: Risk of loss in transactions subject to foreign exchange variation. |
The structure of risk limits is extended to the risk factor level, where specific limits aim at improving the monitoring and understanding process, as well as avoiding concentration of these risks.
The structures designed for interest rate and exchange rate categories take into account total risk when there are compatible hedging instruments. In certain cases, management may decide to hedge a risk for the risk factor term and limit of the hedging instrument.
The other risk factors hedged by the institution are shown in Note 32.
To protect cash flows and fair value of instruments designated as hedged items, ITAÚ UNIBANCO HOLDING uses derivative financial instruments and financial assets. Currently, Futures Contracts, Options, NDF (non deliverable forwards), Forwards, Swaps and Financial Assets are used.
ITAÚ UNIBANCO HOLDING manages risks through the economic relationship between hedging instruments and hedged items, where the expectation is that these instruments will move in opposite directions and in the same proportion, with the purpose of neutralizing risk factors.
The designated coverage ratio is always 100% of the risk factor eligible for coverage. Sources of ineffectiveness are in general related to the counterparty’s credit risk and possible mismatches of terms between the hedging instrument and the hedged item.
a) Cash flow hedge
The cash flow hedge strategies of ITAÚ UNIBANCO HOLDING consist of hedging exposure to variations in cash flows, in interest payment and currency exposure which are attributable to changes in interest rates on recognized and unrecognized assets and liabilities.
ITAÚ UNIBANCO HOLDING applies cash flow hedge strategies as follows:
Interest rate risks:
| | • | | Hedge of time deposits and repurchase agreements: to hedge fluctuations in cash flows of interest payments resulting from changes in the DI interest rate, through futures contracts; |
| | • | | Hedge of asset transactions: to hedge fluctuations in cash flows of interest receipts resulting from changes in the DI rate, through futures contracts; |
| | • | | Hedge of assets denominated in UF*: to hedge fluctuations in cash flows of interest receipts resulting from changes in the UF*, through swap contracts; |
| | • | | Hedge of Funding: to hedge fluctuations in cash flows of interest payments resulting from changes in the TPM* rate, through swap contracts; |
| | • | | Hedge of loan operations: to hedge fluctuations in cash flows of interest receipts resulting from changes in the TPM* rate, through swap contracts; |
| | • | | Hedge of repurchase agreements: to hedge fluctuations in cash flows of interest received from changes in Selic (benchmark interest rate), through futures contracts; |
| | • | | Hedging of expected highly probable transactions: to hedge the risk of variation in the amount of the commitments assumed when resulting from variation in the exchange rates. |
| *UF | – Chilean unit of account / TPM – Monetary policy rate |
ITAÚ UNIBANCO HOLDING does not use the qualitative method to evaluate the effectiveness or to measure the ineffectiveness of these strategies.
For cash flow hedge strategies, ITAÚ UNIBANCO HOLDING uses the hypothetical derivative method. This method is based on a comparison of the change in the fair value of a hypothetical derivative with terms identical to the critical terms of the variable-rate liability, and this change in the fair value is considered a proxy of the present value of the cumulative change in the future cash flow expected for the hedged liability.
| | |
| Itaú Unibanco Holding S.A. – Complete Financial Statements in IFRS – December 31, 2020 | | F-45 |
ITAÚ UNIBANCO HOLDING S.A.
Notes to the Consolidated Financial Statements
At 12/31/2020 and 12/31/2019 for balance sheet accounts and
From 01/01 to 12/31 of 2020, 2019 and 2018 for income statement accounts
(In millions of Reais, except information per share)
| | | | | | | | | | | | | | | | | | | | | | | | | | |
| | | | | 12/31/2020 | |
| | | | | Hedged item | | | Hedge instrument | |
| | | | | Book Value | | | Variation in value recognized in Other | | | Cash flow hedge | | | Notional | | | Variation in fair value used to calculate hedge | |
Strategies | | Heading | | Assets | | | Liabilities | | | comprehensive income | | | reserve | | | Amount | | | ineffectiveness | |
Interest rate risk | | | | | | | | | | | | | | | | | | | | | | | | | | |
Hedge of deposits and repurchase agreements | | Securities purchased under agreements to resell | | | — | | | | 103,407 | | | | (2,423 | ) | | | (2,458 | ) | | | 103,407 | | | | (2,429 | ) |
Hedge of assets transactions | | Loans and lease operations and Securities | | | 5,673 | | | | — | | | | 66 | | | | 66 | | | | 5,743 | | | | 66 | |
Hedge of asset-backed securities under repurchase agreements | | Securities purchased under agreements to resell | | | 29,533 | | | | — | | | | 697 | | | | 697 | | | | 31,417 | | | | 699 | |
Hedge of loan operations | | Loans and lease operations | | | 327 | | | | — | | | | 12 | | | | 12 | | | | 316 | | | | 15 | |
Hedge of funding | | Deposits | | | — | | | | 2,007 | | | | (10 | ) | | | (10 | ) | | | 1,996 | | | | (11 | ) |
Hedge of assets denominated in UF | | Securities | | | 16,674 | | | | — | | | | (4 | ) | | | (4 | ) | | | 16,677 | | | | (1 | ) |
Foreign exchange risk | | | | | | | | | | | | | | | | | | | | | | | | | | |
Hedge of highly probable forecast transactions | | | | | 1,314 | | | | — | | | | (105 | ) | | | 148 | | | | 1,314 | | | | (105 | ) |
| | | | | | | | | | | | | | | | | | | | | | | | | | |
Total | | | | | 53,521 | | | | 105,414 | | | | (1,767 | ) | | | (1,549 | ) | | | 160,870 | | | | (1,766 | ) |
| | | | | | | | | | | | | | | | | | | | | | | | | | |
| | | | | | | | | | | | | | | | | | | | | | | | | | |
| | | | | 12/31/2019 | |
| | | | | Hedged item | | | Hedge instrument | |
| | | | | Book Value | | | Variation in value recognized in Other | | | Cash flow hedge | | | Notional | | | Variation in fair value used to calculate hedge | |
Strategies | | Heading | | Assets | | | Liabilities | | | comprehensive income | | | reserve | | | Amount | | | ineffectiveness | |
Interest rate risk | | | | | | | | | | | | | | | | | | | | | | | | | | |
Hedge of deposits and repurchase agreements | | Securities purchased under agreements to resell | | | — | | | | 24,543 | | | | (2,808 | ) | | | (3,310 | ) | | | 24,543 | | | | (2,814 | ) |
Hedge of assets transactions | | Loans and lease operations and Securities | | | 5,564 | | | | — | | | | 91 | | | | 91 | | | | 5,656 | | | | 91 | |
Hedge of asset-backed securities under repurchase agreements | | Securities purchased under agreements to resell | | | 30,896 | | | | — | | | | 520 | | | | 520 | | | | 32,130 | | | | 523 | |
Hedge of loan operations | | Loans and lease operations | | | 269 | | | | — | | | | 12 | | | | 12 | | | | 257 | | | | 14 | |
Hedge of funding | | Deposits | | | — | | | | 4,617 | | | | (27 | ) | | | (22 | ) | | | 4,590 | | | | (27 | ) |
Hedge of assets denominated in UF | | Securities | | | 12,588 | | | | — | | | | 6 | | | | 6 | | | | 12,582 | | | | 5 | |
Foreign exchange risk | | | | | | | | | | | | | | | | | | | | | | | | | | |
Hedge of highly probable forecast transactions | | | | | 294 | | | | — | | | | (11 | ) | | | 179 | | | | 294 | | | | (11 | ) |
| | | | | | | | | | | | | | | | | | | | | | | | | | |
Total | | | | | 49,611 | | | | 29,160 | | | | (2,217 | ) | | | (2,524 | ) | | | 80,052 | | | | (2,219 | ) |
| | | | | | | | | | | | | | | | | | | | | | | | | | |
For strategies of deposits and repurchase agreements to resell, asset transactions and asset-backed securities under repurchase agreements, the entity frequently reestablishes the coverage ratio, since both the hedged item and the instruments change over time. This occurs because they are portfolio strategies that reflect the risk management strategy guidelines approved in the proper authority level.
The remaining balance in the reserve of cash flow hedge for which the hedge accounting is no longer applied is R$ 218 (R$ (307) at 12/31/2019).
| | | | | | | | | | | | | | | | | | | | | | | | | | | | |
| | | 12/31/2020 | |
| | | Notional | | | Book Value (*) | | | Variations in fair
value used to
calculate hedge | | | Variation in value
recognized in Other
comprehensive | | | Hedge ineffectiveness
recognized in | | | Amount
reclassified from
Cash flow hedge | |
Hedge Instruments | | amount | | | Assets | | | Liabilities | | | ineffectiveness | | | income | | | income | | | reserve to income | |
Interest rate risk | | | | | | | | | | | | | | | | | | | | | | | | | | | | |
Futures | | | 140,567 | | | | 146 | | | | — | | | | (1,664 | ) | | | (1,660 | ) | | | (4 | ) | | | (381 | ) |
Swap | | | 18,989 | | | | 2,007 | | | | 17,006 | | | | 3 | | | | (2 | ) | | | 5 | | | | — | |
Foreign exchange risk | | | | | | | | | | | | | | | | | | | | | | | | | | | | |
Futures | | | 1,314 | | | | 5 | | | | 298 | | | | (105 | ) | | | (105 | ) | | | — | | | | — | |
| | | | | | | | | | | | | | | | | | | | | | | | | | | | |
Total | | | 160,870 | | | | 2,158 | | | | 17,304 | | | | (1,766 | ) | | | (1,767 | ) | | | 1 | | | | (381 | ) |
| | | | | | | | | | | | | | | | | | | | | | | | | | | | |
| | | | | | | | | | | | | | | | | | | | | | | | | | | | |
| | | 12/31/2019 | |
| | | Notional | | | Book Value (*) | | | Variations in fair
value used to
calculate hedge | | | Variation in value
recognized in Other
comprehensive | | | Hedge ineffectiveness
recognized in | | | Amount
reclassified from
Cash flow hedge | |
Hedge Instruments | | amount | | | Assets | | | Liabilities | | | ineffectiveness | | | income | | | income | | | reserve to income | |
Interest rate risk | | | | | | | | | | | | | | | | | | | | | | | | | | | | |
Futures | | | 62,329 | | | | — | | | | 14 | | | | (2,200 | ) | | | (2,197 | ) | | | (3 | ) | | | (762 | ) |
Swap | | | 17,429 | | | | 4,617 | | | | 12,858 | | | | (8 | ) | | | (9 | ) | | | 1 | | | | — | |
Foreign exchange risk | | | | | | | | | | | | | | | | | | | | | | | | | | | | |
Futures | | | 294 | | | | — | | | | 156 | | | | (11 | ) | | | (11 | ) | | | — | | | | — | |
| | | | | | | | | | | | | | | | | | | | | | | | | | | | |
Total | | | 80,052 | | | | 4,617 | | | | 13,028 | | | | (2,219 | ) | | | (2,217 | ) | | | (2 | ) | | | (762 | ) |
| | | | | | | | | | | | | | | | | | | | | | | | | | | | |
| (*) | Amounts recorded under heading Derivatives. |
| | |
| Itaú Unibanco Holding S.A. – Complete Financial Statements in IFRS – December 31, 2020 | | F-46 |
ITAÚ UNIBANCO HOLDING S.A.
Notes to the Consolidated Financial Statements
At 12/31/2020 and 12/31/2019 for balance sheet accounts and
From 01/01 to 12/31 of 2020, 2019 and 2018 for income statement accounts
(In millions of Reais, except information per share)
b) Hedge of net investment in foreign operations
ITAÚ UNIBANCO HOLDING’s strategies for net investments in foreign operations consist of hedging the exposure in the functional currency of the foreign operation against the functional currency of head office.
The risk hedged in this type of strategy is the currency risk.
ITAÚ UNIBANCO HOLDING does not use the qualitative method to evaluate the effectiveness or to measure the ineffectiveness of these strategies.
Instead, ITAÚ UNIBANCO HOLDING uses the Dollar Offset Method, which is based on a comparison of the change in fair value (cash flow) of the hedging instrument, attributable to changes in the exchange rate and the gain (loss) arising from variations in exchange rates on the amount of investment abroad designated as the object of the hedge.
| | | | | | | | | | | | | | | | | | | | | | | | |
| | | 12/31/2020 | |
| | | Hedged item | | | Hedge instrument | |
| | | Book Value (2) | | | Variation in value recognized in Other | | | Foreign currency | | | Notional | | | Variation in fair value used to calculate
hedge | |
Strategies | | Assets | | | Liabilities | | | comprehensive income | | | convertion reserve | | | amount | | | ineffectiveness | |
Foreign exchange risk | | | | | | | | | | | | | | | | | | | | | | | | |
Hedge of net investment in foreign operations (1) | | | 15,277 | | | | — | | | | (14,598 | ) | | | (14,598 | ) | | | 24,619 | | | | (14,601 | ) |
| | | | | | | | | | | | | | | | | | | | | | | | |
Total | | | 15,277 | | | | — | | | | (14,598 | ) | | | (14,598 | ) | | | 24,619 | | | | (14,601 | ) |
| | | | | | | | | | | | | | | | | | | | | | | | |
| | | | | | | | | | | | | | | | | | | | | | | | |
| | | 12/31/2019 | |
| | | Hedged item | | | Hedge instrument | |
| | | Book Value (2) | | | Variation in value recognized in Other | | | Foreign currency | | | Notional | | | Variation in fair value used to calculate
hedge | |
Strategies | | Assets | | | Liabilities | | | comprehensive income | | | convertion reserve | | | amount | | | ineffectiveness | |
Foreign exchange risk | | | | | | | | | | | | | | | | | | | | | | | | |
Hedge of net investment in foreign operations (1) | | | 14,396 | | | | — | | | | (7,217 | ) | | | (7,217 | ) | | | 16,947 | | | | (7,220 | ) |
| | | | | | | | | | | | | | | | | | | | | | | | |
Total | | | 14,396 | | | | — | | | | (7,217 | ) | | | (7,217 | ) | | | 16,947 | | | | (7,220 | ) |
| | | | | | | | | | | | | | | | | | | | | | | | |
| (1) | Hedge instruments consider the gross tax position. |
| (2) | Amounts recorded under heading Derivatives - Hedge of investments in foreign operation. |
| | | | | | | | | | | | | | | | | | | | | | | | | | | | |
| | | 12/31/2020 | |
| | | | | | | | | Variations in fair | | | Variation in the value | | | Hedge | | | Amount reclassified | |
| | | | | | | | | value used to | | | recognized in Other | | | ineffectiveness | | | from foreign currency | |
| | | Notional | | | Book Value (*) | | | calculate hedge | | | comprehensive | | | recognized in | | | convertion reserve | |
Hedge instruments | | amount | | | Assets | | | Liabilities | | | ineffectiveness | | | income | | | income | | | into income | |
Foreign exchange risk | | | | | | | | | | | | | | | | | | | | | | | | | | | | |
Futures | | | 44,186 | | | | — | | | | 150 | | | | (18,732 | ) | | | (18,695 | ) | | | (37 | ) | | | — | |
Forward | | | (4,262 | ) | | | 4,474 | | | | — | | | | 332 | | | | 305 | | | | 27 | | | | — | |
NDF - Non Deliverable Forward | | | (15,196 | ) | | | 538 | | | | — | | | | 3,556 | | | | 3,547 | | | | 9 | | | | — | |
Financial Assets | | | (109 | ) | | | 109 | | | | — | | | | 243 | | | | 245 | | | | (2 | ) | | | — | |
| | | | | | | | | | | | | | | | | | | | | | | | | | | | |
Total | | | 24,619 | | | | 5,121 | | | | 150 | | | | (14,601 | ) | | | (14,598 | ) | | | (3 | ) | | | — | |
| | | | | | | | | | | | | | | | | | | | | | | | | | | | |
| | | | | | | | | | | | | | | | | | | | | | | | | | | | |
| | | 12/31/2019 | |
| | | | | | | | | Variations in fair | | | Variation in the value | | | Hedge | | | Amount reclassified | |
| | | | | | | | | value used to | | | recognized in Other | | | ineffectiveness | | | from foreign currency | |
| | | Notional | | | Book Value (*) | | | calculate hedge | | | comprehensive | | | recognized in | | | convertion reserve | |
Hedge instruments | | amount | | | Assets | | | Liabilities | | | ineffectiveness | | | income | | | income | | | into income | |
Foreign exchange risk | | | | | | | | | | | | | | | | | | | | | | | | | | | | |
Futures | | | 32,966 | | | | 228 | | | | — | | | | (12,329 | ) | | | (12,292 | ) | | | (37 | ) | | | — | |
Forward | | | (2,990 | ) | | | 2,977 | | | | — | | | | 408 | | | | 381 | | | | 27 | | | | — | |
NDF - Non Deliverable Forward | | | (11,525 | ) | | | 260 | | | | — | | | | 4,443 | | | | 4,434 | | | | 9 | | | | — | |
Financial Assets | | | (1,504 | ) | | | 1,523 | | | | — | | | | 258 | | | | 260 | | | | (2 | ) | | | — | |
| | | | | | | | | | | | | | | | | | | | | | | | | | | | |
Total | | | 16,947 | | | | 4,988 | | | | — | | | | (7,220 | ) | | | (7,217 | ) | | | (3 | ) | | | — | |
| | | | | | | | | | | | | | | | | | | | | | | | | | | | |
| (*) | Amounts recorded under heading Derivatives. |
| | |
| Itaú Unibanco Holding S.A. – Complete Financial Statements in IFRS – December 31, 2020 | | F-47 |
ITAÚ UNIBANCO HOLDING S.A.
Notes to the Consolidated Financial Statements
At 12/31/2020 and 12/31/2019 for balance sheet accounts and
From 01/01 to 12/31 of 2020, 2019 and 2018 for income statement accounts
(In millions of Reais, except information per share)
The fair value hedging strategy of ITAÚ UNIBANCO HOLDING consists of hedging the exposure to variation in fair value on the receipt and payment of interest on recognized assets and liabilities.
ITAÚ UNIBANCO HOLDING applies fair value hedges as follows:
Interest rate risk:
| | • | | To protect the risk of variation in the fair value of receipt and payment of interest resulting from variations in the fair value of the variable rates involved, by contracting swaps and futures. |
ITAÚ UNIBANCO HOLDING does not use the qualitative method to evaluate the effectiveness or to measure the ineffectiveness of these strategies.
Instead, ITAÚ UNIBANCO HOLDING uses the percentage approach and dollar offset method:
| | • | | The percentage approach is based on the calculation of change in the fair value of the revised estimate for the hedged position (hedged item) attributable to the protected risk versus the change in the fair value of the derivative hedging instrument. |
| | • | | The dollar offset method is based on the difference between the variation in the fair value of the hedging instrument and the variation in the fair value of the hedged item attributed to changes in the interest rate. |
The effects of hedge accounting on the financial position and performance of ITAÚ UNIBANCO HOLDING are presented below:
| | | | | | | | | | | | | | | | | | | | | | | | | | | | |
| | | 12/31/2020 | |
| | | Hedge Item | | | Hedge Instruments(2) | |
| | | | | | | | | | | | | | | Variation in fair | |
| | | | | | | | | | | | | | | Variation in fair value | | | | | | value used to | |
| | | Book Value (1) | | | Fair value | | | recognized in | | | Notional | | | calculate hedge | |
Strategies | | Assets | | | Liabilities | | | Assets | | | Liabilities | | | income | | | amount | | | ineffectiveness | |
Interest rate risk | | | | | | | | | | | | | | | | | | | | | | | | | | | | |
Hedge of loan operations | | | 9,205 | | | | — | | | | 9,616 | | | | — | | | | 411 | | | | 9,205 | | | | (423 | ) |
Hedge of funding | | | — | | | | 10,200 | | | | — | | | | 11,591 | | | | (1,391 | ) | | | 10,200 | | | | 1,390 | |
Hedge of securities at fair value through other comprehensive income | | | 10,192 | | | | — | | | | 10,412 | | | | — | | | | 220 | | | | 10,383 | | | | (226 | ) |
| | | | | | | | | | | | | | | | | | | | | | | | | | | | |
Total | | | 19,397 | | | | 10,200 | | | | 20,028 | | | | 11,591 | | | | (760 | ) | | | 29,788 | | | | 741 | |
| | | | | | | | | | | | | | | | | | | | | | | | | | | | |
| | | | | | | | | | | | | | | | | | | | | | | | | | | | |
| | | 12/31/2019 | |
| | | Hedge Item | | | Hedge Instruments | |
| | | | | | | | | | | | | | | Variation in fair | |
| | | | | | | | | | | | | | | Variation in fair value | | | | | | value used to | |
| | | Book Value (1) | | | Fair value | | | recognized in | | | Notional | | | calculate hedge | |
Strategies | | Assets | | | Liabilities | | | Assets | | | Liabilities | | | income | | | amount | | | ineffectiveness | |
Interest rate risk | | | | | | | | | | | | | | | | | | | | | | | | | | | | |
Hedge of loan operations | | | 7,386 | | | | — | | | | 7,642 | | | | — | | | | 256 | | | | 7,386(264 | ) | | | | |
Hedge of funding | | | — | | | | 7,436 | | | | — | | | | 8,195 | | | | (759 | ) | | | 7,436 | | | | 775 | |
Hedge of securities at fair value through other comprehensive income | | | 4,482 | | | | — | | | | 4,574 | | | | — | | | | 92 | | | | 4,609(85 | ) | | | | |
| | | | | | | | | | | | | | | | | | | | | | | | | | | | |
Total | | | 11,868 | | | | 7,436 | | | | 12,216 | | | | 8,195 | | | | (411 | ) | | | 19,431 | | | | 426 | |
| | | | | | | | | | | | | | | | | | | | | | | | | | | | |
| (1) | Amounts recorded under heading Deposits, Securities, Funds from Interbank Markets and Loan and Lease Operations. |
| (2) | Comprises the amount of R$ 4,915 at 12/31/2020, related to instruments exposed by the change in reference interest rates - IBORs. |
For loan operations strategies, the entity reestablishes the coverage ratio, since both the hedged item and the instruments change over time. This occurs because they are portfolio strategies that reflect the risk management strategy guidelines approved in the proper authority level.
| | |
| Itaú Unibanco Holding S.A. – Complete Financial Statements in IFRS – December 31, 2020 | | F-48 |
ITAÚ UNIBANCO HOLDING S.A.
Notes to the Consolidated Financial Statements
At 12/31/2020 and 12/31/2019 for balance sheet accounts and
From 01/01 to 12/31 of 2020, 2019 and 2018 for income statement accounts
(In millions of Reais, except information per share)
| | | | | | | | | | | | | | | | | | | | |
| | | 12/31/2020 | |
| | | Notional | | | Book value (1) | | | Variation in fair value used to calculate hedge | | | Hedge ineffectiveness | |
Hedge Instruments | | amount | | | Assets | | | Liabilities | | | ineffectiveness | | | recognized in income | |
Interest rate risk | | | | | | | | | | | | | | | | | | | | |
Swap (2) | | | 29,788 | | | | 2,871 | | | | 5,812 | | | | 741 | | | | (19 | ) |
| | | | | | | | | | | | | | | | | | | | |
Total | | | 29,788 | | | | 2,871 | | | | 5,812 | | | | 741 | | | | (19 | ) |
| | | | | | | | | | | | | | | | | | | | |
| | | | | | | | | | | | | | | | | | | | |
| | | 12/31/2019 | |
| | | Notional | | | Book value (1) | | | Variation in fair value used to calculate hedge | | | Hedge ineffectiveness | |
Hedge Instruments | | amount | | | Assets | | | Liabilities | | | ineffectiveness | | | recognized in income | |
Interest rate risk | | | | | | | | | | | | | | | | | | | | |
Swap (2) | | | 19,431 | | | | 766 | | | | 4,636 | | | | 426 | | | | 15 | |
| | | | | | | | | | | | | | | | | | | | |
Total | | | 19,431 | | | | 766 | | | | 4,636 | | | | 426 | | | | 15 | |
| | | | | | | | | | | | | | | | | | | | |
| (1) | Amounts recorded under heading Derivatives. |
| (2) | The amount of R$ 183 is no longer qualified as hedge, with effect on result of R$ (17) (R$ 408 at 12/31/2019, with effect on result of R$ (15) from 01/01 to 12/31/2019). |
| | |
| Itaú Unibanco Holding S.A. – Complete Financial Statements in IFRS – December 31, 2020 | | F-49 |
ITAÚ UNIBANCO HOLDING S.A.
Notes to the Consolidated Financial Statements
At 12/31/2020 and 12/31/2019 for balance sheet accounts and
From 01/01 to 12/31 of 2020, 2019 and 2018 for income statement accounts
(In millions of Reais, except information per share)
The table below presents, for each strategy, the notional amount and the fair value adjustments of hedge instruments and the book value of the hedged item:
| | | | | | | | | | | | | | | | | | | | | | | | |
| | | 12/31/2020 | | | 12/31/2019 | |
| | | Hedge instruments | | | Hedged item | | | Hedge instruments | | | Hedged item | |
Strategies | | Notional
amount | | | Fair value
adjustments | | | Book
Value | | | Notional
amount | | | Fair value
adjustments | | | Book
Value | |
Hedge of deposits and repurchase agreements | | | 103,407 | | | | 158 | | | | 103,407 | | | | 24,543 | | | | (37 | ) | | | 24,543 | |
Hedge of highly probable forecast transactions | | | 1,314 | | | | (105 | ) | | | 1,314 | | | | 294 | | | | (11 | ) | | | 294 | |
Hedge of net investment in foreign operations | | | 24,619 | | | | 4,971 | | | | 15,277 | | | | 16,947 | | | | 4,988 | | | | 14,396 | |
Hedge of loan operations (Fair value) | | | 9,205 | | | | (423 | ) | | | 9,205 | | | | 7,386 | | | | (264 | ) | | | 7,386 | |
Hedge of loan operations (Cash flow) | | | 316 | | | | 15 | | | | 327 | | | | 257 | | | | 14 | | | | 269 | |
Hedge of funding (Fair value) | | | 10,200 | | | | 1,390 | | | | 10,200 | | | | 7,436 | | | | 775 | | | | 7,436 | |
Hedge of funding (Cash flow) | | | 1,996 | | | | (11 | ) | | | 2,007 | | | | 4,590 | | | | (27 | ) | | | 4,617 | |
Hedge of assets transactions | | | 5,743 | | | | 66 | | | | 5,673 | | | | 5,656 | | | | 91 | | | | 5,564 | |
Hedge of asset-backed securities under repurchase agreements | | | 31,417 | | | | (11 | ) | | | 29,533 | | | | 32,130 | | | | 20 | | | | 30,896 | |
Hedge of assets denominated in UF | | | 16,677 | | | | (1 | ) | | | 16,674 | | | | 12,582 | | | | 5 | | | | 12,588 | |
Hedge of securities at fair value through other comprehensive income | | | 10,383 | | | | (226 | ) | | | 10,192 | | | | 4,609 | | | | (85 | ) | | | 4,482 | |
| | | | | | | | | | | | | | | | | | | | | | | | |
Total | | | | | | | 5,823 | | | | | | | | | | | | 5,469 | | | | | |
| | | | | | | | | | | | | | | | | | | | | | | | |
The table below shows the breakdown by maturity of the hedging strategies:
| | | | | | | | | | | | | | | | | | | | | | | | | | | | | | | | |
| | | 12/31/2020 | |
| | | 0-1 year | | | 1-2 years | | | 2-3 years | | | 3-4 years | | | 4-5 years | | | 5-10 years | | | over 10 years | | | Total | |
Hedge of deposits and repurchase agreements | | | 70,200 | | | | 9,077 | | | | 13,059 | | | | 5,504 | | | | 4,848 | | | | 719 | | | | — | | | | 103,407 | |
Hedge of highly probable forecast transactions | | | 1,314 | | | | — | | | | — | | | | — | | | | — | | | | — | | | | — | | | | 1,314 | |
Hedge of net investment in foreign operations (*) | | | 24,619 | | | | — | | | | — | | | | — | | | | — | | | | — | | | | — | | | | 24,619 | |
Hedge of loan operations (Fair value) | | | 2,999 | | | | 1,793 | | | | 1,297 | | | | 447 | | | | 898 | | | | 1,771 | | | | — | | | | 9,205 | |
Hedge of loan operations (Cash flow) | | | 212 | | | | 104 | | | | — | | | | — | | | | — | | | | — | | | | — | | | | 316 | |
Hedge of funding (Fair value) | | | 213 | | | | 657 | | | | 549 | | | | 176 | | | | 581 | | | | 5,448 | | | | 2,576 | | | | 10,200 | |
Hedge of funding (Cash flow) | | | 1,765 | | | | 27 | | | | 204 | | | | — | | | | — | | | | — | | | | — | | | | 1,996 | |
Hedge of assets transactions | | | 3,604 | | | | 2,139 | | | | — | | | | — | | | | — | | | | — | | | | — | | | | 5,743 | |
Hedge of asset-backed securities under repurchase agreements | | | 22,186 | | | | 2,297 | | | | 6,130 | | | | — | | | | 804 | | | | — | | | | — | | | | 31,417 | |
Hedge of assets denominated in UF | | | 15,400 | | | | 1,277 | | | | — | | | | — | | | | — | | | | — | | | | — | | | | 16,677 | |
Hedge of securities at fair value through other comprehensive income | | | 5,876 | | | | 1,382 | | | | 10 | | | | — | | | | 719 | | | | 2,396 | | | | — | | | | 10,383 | |
| | | | | | | | | | | | | | | | | | | | | | | | | | | | | | | | |
Total | | | 148,388 | | | | 18,753 | | | | 21,249 | | | | 6,127 | | | | 7,850 | | | | 10,334 | | | | 2,576 | | | | 215,277 | |
| | | | | | | | | | | | | | | | | | | | | | | | | | | | | | | | |
| | | | | | | | | | | | | | | | | | | | | | | | | | | | | | | | |
| | | 12/31/2019 | |
| | | 0-1 year | | | 1-2 years | | | 2-3 years | | | 3-4
years | | | 4-5 years | | | 5-10 years | | | over 10 years | | | Total | |
Hedge of deposits and repurchase agreements | | | 5,533 | | | | 4,409 | | | | 1,627 | | | | 8,464 | | | | — | | | | 4,510 | | | | — | | | | 24,543 | |
Hedge of highly probable forecast transactions | | | 294 | | | | — | | | | — | | | | — | | | | — | | | | — | | | | — | | | | 294 | |
Hedge of net investment in foreign operations (*) | | | 16,947 | | | | — | | | | — | | | | — | | | | — | | | | — | | | | — | | | | 16,947 | |
Hedge of loan operations (Fair value) | | | 381 | | | | 2,490 | | | | 1,248 | | | | 993 | | | | 623 | | | | 1,111 | | | | 540 | | | | 7,386 | |
Hedge of loan operations (Cash flow) | | | 27 | | | | 156 | | | | 74 | | | | — | | | | — | | | | — | | | | — | | | | 257 | |
Hedge of funding (Fair value) | | | 299 | | | | 152 | | | | 375 | | | | 423 | | | | 129 | | | | 4,220 | | | | 1,838 | | | | 7,436 | |
Hedge of funding (Cash flow) | | | 2,562 | | | | — | | | | — | | | | 1,646 | | | | 161 | | | | 221 | | | | — | | | | 4,590 | |
Hedge of assets transactions | | | — | | | | 3,671 | | | | 1,985 | | | | — | | | | — | | | | — | | | | — | | | | 5,656 | |
Hedge of asset-backed securities under repurchase agreements | | | 6,225 | | | | 18,739 | | | | 812 | | | | 5,621 | | | | — | | | | 733 | | | | — | | | | 32,130 | |
Hedge of assets denominated in UF | | | 9,628 | | | | 2,954 | | | | — | | | | — | | | | — | | | | — | | | | — | | | | 12,582 | |
Hedge of securities at fair value through other comprehensive income | | | 4,230 | | | | — | | | | 28 | | | | — | | | | — | | | | 351 | | | | — | | | | 4,609 | |
| | | | | | | | | | | | | | | | | | | | | | | | | | | | | | | | |
Total | | | 46,126 | | | | 32,571 | | | | 6,149 | | | | 17,147 | | | | 913 | | | | 11,146 | | | | 2,378 | | | | 116,430 | |
| | | | | | | | | | | | | | | | | | | | | | | | | | | | | | | | |
| (*) | Classified as current, since instruments are frequently renewed. |
| | |
| Itaú Unibanco Holding S.A. – Complete Financial Statements in IFRS – December 31, 2020 | | F-50 |
ITAÚ UNIBANCO HOLDING S.A.
Notes to the Consolidated Financial Statements
At 12/31/2020 and 12/31/2019 for balance sheet accounts and
From 01/01 to 12/31 of 2020, 2019 and 2018 for income statement accounts
(In millions of Reais, except information per share)
Note 8 – Financial assets at fair value through other comprehensive income - Securities
The fair value and corresponding gross carrying amount of Financial Assets at Fair Value Through Other Comprehensive Income - Securities assets are as follows:
| | | | | | | | | | | | | | | | | | | | | | | | | | | | | | | | |
| | | 12/31/2020 | | | 12/31/2019 | |
| | Gross
carrying
amount | | | Fair value
adjustments (in
stockholders’
equity) (2) | | | Expected
loss | | | Fair
value | | | Gross
carrying
amount | | | Fair value
adjustments (in
stockholders’
equity) | | | Expected
loss | | | Fair
value | |
Brazilian government securities (1a) | | | 65,235 | | | | 2,714 | | | | — | | | | 67,949 | | | | 48,718 | | | | 2,014 | | | | — | | | | 50,732 | |
Other government securities | | | 36 | | | | — | | | | (36 | ) | | | — | | | | 36 | | | | — | | | | (36 | ) | | | — | |
Government securities – abroad (1b) | | | 34,365 | | | | 38 | | | | (1 | ) | | | 34,402 | | | | 20,638 | | | | (64 | ) | | | (3 | ) | | | 20,571 | |
Germany | | | — | | | | — | | | | — | | | | — | | | | 23 | | | | — | | | | — | | | | 23 | |
Colombia | | | 3,913 | | | | 73 | | | | — | | | | 3,986 | | | | 3,851 | | | | 27 | | | | — | | | | 3,878 | |
Chile | | | 21,639 | | | | 12 | | | | — | | | | 21,651 | | | | 11,119 | | | | 89 | | | | — | | | | 11,208 | |
United States | | | 3,751 | | | | (1 | ) | | | — | | | | 3,750 | | | | 2,758 | | | | (2 | ) | | | — | | | | 2,756 | |
Italy | | | — | | | | — | | | | — | | | | — | | | | 328 | | | | 1 | | | | — | | | | 329 | |
Mexico | | | 1,180 | | | | 1 | | | | — | | | | 1,181 | | | | — | | | | — | | | | — | | | | — | |
Paraguay | | | 3,008 | | | | (60 | ) | | | (1 | ) | | | 2,947 | | | | 1,957 | | | | (174 | ) | | | (3 | ) | | | 1,780 | |
Uruguay | | | 874 | | | | 13 | | | | — | | | | 887 | | | | 602 | | | | (5 | ) | | | — | | | | 597 | |
Corporate securities (1c) | | | 7,799 | | | | (152 | ) | | | (56 | ) | | | 7,591 | | | | 5,308 | | | | 96 | | | | (47 | ) | | | 5,357 | |
Shares | | | 1,640 | | | | (258 | ) | | | — | | | | 1,382 | | | | 83 | | | | 66 | | | | — | | | | 149 | |
Bank deposit certificates | | | 305 | | | | 2 | | | | — | | | | 307 | | | | 2,371 | | | | — | | | | — | | | | 2,371 | |
Securitized real estate loans | | | — | | | | — | | | | — | | | | — | | | | 25 | | | | 1 | | | | — | | | | 26 | |
Debentures | | | 956 | | | | (23 | ) | | | (44 | ) | | | 889 | | | | 387 | | | | (10 | ) | | | (43 | ) | | | 334 | |
Eurobonds and other | | | 4,895 | | | | 127 | | | | (9 | ) | | | 5,013 | | | | 2,439 | | | | 39 | | | | (1 | ) | | | 2,477 | |
Other | | | 3 | | | | — | | | | (3 | ) | | | — | | | | 3 | | | | — | | | | (3 | ) | | | — | |
| | | | | | | | | | | | | | | | | | | | | | | | | | | | | | | | |
Total | | | 107,435 | | | | 2,600 | | | | (93 | ) | | | 109,942 | | | | 74,700 | | | | 2,046 | | | | (86 | ) | | | 76,660 | |
| | | | | | | | | | | | | | | | | | | | | | | | | | | | | | | | |
| (1) | Financial assets at fair value through other comprehensive income - Securities pledged in guarantee of funding transactions of financial institutions and customers were: a) R$ 35,203 (R$ 27,864 at 12/31/2019), b) R$ 2,398 (R$ 590 at 12/31/2019) and c) R$ 518, totaling R$ 38,119 (R$ 28,454 at 12/31/2019). |
| (2) | In the period, the result of Adjustment to Fair Value of Financial Assets (particularly private securities) had their amounts affected by oscillations of rates and other market variables arising from the impact of the COVID-19 pandemic on the macroeconomic scenario in the period (Note 33a). |
The gross carrying amount and the fair value of financial assets through other comprehensive income - securities by maturity are as follows:
| | | | | | | | | | | | | | | | |
| | | 12/31/2020 | | | 12/31/2019 | |
| | Gross
carrying
amount | | | Fair
value | | | Gross
carrying
amount | | | Fair
value | |
Current | | | 33,094 | | | | 32,872 | | | | 10,258 | | | | 10,272 | |
Non-stated maturity | | | 1,640 | | | | 1,382 | | | | 83 | | | | 149 | |
Up to one year | | | 31,454 | | | | 31,490 | | | | 10,175 | | | | 10,123 | |
Non-current | | | 74,341 | | | | 77,070 | | | | 64,442 | | | | 66,388 | |
From one to five years | | | 52,825 | | | | 54,452 | | | | 45,704 | | | | 46,456 | |
From five to ten years | | | 14,084 | | | | 14,852 | | | | 11,101 | | | | 11,649 | |
After ten years | | | 7,432 | | | | 7,766 | | | | 7,637 | | | | 8,283 | |
| | | | | | | | | | | | | | | | |
Total | | | 107,435 | | | | 109,942 | | | | 74,700 | | | | 76,660 | |
| | | | | | | | | | | | | | | | |
Equity instruments at fair value through other comprehensive income- securities are presented in the table below:
| | | | | | | | | | | | | | | | |
| | | 12/31/2020 | |
| | | Gross carrying
amount | | | Adjustments to fair value
(in Stockholders’ equity) | | | Expected loss | | | Fair Value | |
Shares | | | 1,640 | | | | (258 | ) | | | — | | | | 1,382 | |
| | | | | | | | | | | | | | | | |
Total | | | 1,640 | | | | (258 | ) | | | — | | | | 1,382 | |
| | | | | | | | | | | | | | | | |
| | | | | | | | | | | | | | | | |
| | | 12/31/2019 | |
| | | Gross carrying
amount | | | Adjustments to fair value
(in Stockholders’ equity) | | | Expected loss | | | Fair Value | |
Shares | | | 83 | | | | 66 | | | | — | | | | 149 | |
| | | | | | | | | | | | | | | | |
Total | | | 83 | | | | 66 | | | | — | | | | 149 | |
| | | | | | | | | | | | | | | | |
In the period there was no receipt of dividends and there was no reclassification in Stockholders´ Equity.
ITAÚ UNIBANCO HOLDING adopted the option of designating equity instruments at fair value through other comprehensive income due to the particularities of a certain market.
| | | | | | | | | | | | | | | | |
| | | 12/31/2020 | | | 12/31/2019 | |
| | | Gross carrying
amount | | | Fair
Value | | | Gross carrying
amount | | | Fair
Value | |
Current | | | 1,640 | | | | 1,382 | | | | 83 | | | | 149 | |
Non-stated maturity | | | 1,640 | | | | 1,382 | | | | 83 | | | | 149 | |
| | |
| Itaú Unibanco Holding S.A. – Complete Financial Statements in IFRS – December 31, 2020 | | F-51 |
ITAÚ UNIBANCO HOLDING S.A.
Notes to the Consolidated Financial Statements
At 12/31/2020 and 12/31/2019 for balance sheet accounts and
From 01/01 to 12/31 of 2020, 2019 and 2018 for income statement accounts
(In millions of Reais, except information per share)
Reconciliation of expected loss for Other financial assets, segregated by stages:
| | | | | | | | | | | | | | | | | | | | | | | | | | | | | | | | | | | | |
Stage 1 | | Expected
loss
12/31/2019 | | | Gains /
(Losses) | | | Purchases | | | Settlements | | | Transfer
to stage 2 | | | Transfer
to stage 3 | | | Cure from
stage 2 | | | Cure from
stage 3 | | | Expected
loss
12/31/2020 | |
Financial assets at fair value through other comprehensive income | | | (86 | ) | | | (8 | ) | | | (17 | ) | | | 18 | | | | — | | | | — | | | | — | | | | — | | | | (93 | ) |
| | | | | | | | | | | | | | | | | | | | | | | | | | | | | | | | | | | | |
Brazilian government securities | | | (36 | ) | | | — | | | | — | | | | — | | | | — | | | | — | | | | — | | | | — | | | | (36 | ) |
Other | | | (36 | ) | | | — | | | | — | | | | — | | | | — | | | | — | | | | — | | | | — | | | | (36 | ) |
Government securities - abroad | | | (3 | ) | | | 2 | | | | (1 | ) | | | 1 | | | | — | | | | — | | | | — | | | | — | | | | (1 | ) |
Corporate securities | | | (47 | ) | | | (10 | ) | | | (16 | ) | | | 17 | | | | — | | | | — | | | | — | | | | — | | | | (56 | ) |
Debentures | | | (43 | ) | | | — | | | | (1 | ) | | | — | | | | — | | | | — | | | | — | | | | — | | | | (44 | ) |
Eurobonds and other | | | (1 | ) | | | (10 | ) | | | (15 | ) | | | 17 | | | | — | | | | — | | | | — | | | | — | | | | (9 | ) |
Other | | | (3 | ) | | | — | | | | — | | | | — | | | | — | | | | — | | | | — | | | | — | | | | (3 | ) |
| | | | | | | | | | | | | | | | | | | | | | | | | | | | | | | | | | | | |
Stage 1 | | Expected
loss
12/31/2018 | | | Gains /
(Losses) | | | Purchases | | | Settlements | | | Transfer
to stage 2 | | | Transfer
to stage 3 | | | Cure from
stage 2 | | | Cure from
stage 3 | | | Expected
loss
12/31/2019 | |
Financial assets at fair value through other comprehensive income | | | (85 | ) | | | — | | | | (1 | ) | | | — | | | | — | | | | — | | | | — | | | | — | | | | (86 | ) |
| | | | | | | | | | | | | | | | | | | | | | | | | | | | | | | | | | | | |
Brazilian government securities | | | (36 | ) | | | — | | | | — | | | | — | | | | — | | | | — | | | | — | | | | — | | | | (36 | ) |
Other | | | (36 | ) | | | — | | | | — | | | | — | | | | — | | | | — | | | | — | | | | — | | | | (36 | ) |
Government securities - abroad | | | — | | | | (2 | ) | | | (1 | ) | | | — | | | | — | | | | — | | | | — | | | | — | | | | (3 | ) |
Corporate securities | | | (49 | ) | | | 2 | | | | — | | | | — | | | | — | | | | — | | | | — | | | | — | | | | (47 | ) |
Debentures | | | (43 | ) | | | — | | | | — | | | | — | | | | — | | | | — | | | | — | | | | — | | | | (43 | ) |
Eurobond and other | | | (3 | ) | | | 2 | | | | — | | | | — | | | | — | | | | — | | | | — | | | | — | | | | (1 | ) |
Other | | | (3 | ) | | | — | | | | — | | | | — | | | | — | | | | — | | | | — | | | | — | | | | (3 | ) |
Note 9 - Financial assets at amortized cost - Securities
The Financial assets at amortized cost - Securities are as follows:
| | | | | | | | | | | | | | | | | | | | | | | | |
| | | 12/31/2020 | | | 12/31/2019 | |
| | | Amortized
Cost | | | Expected
Loss | | | Net Amortized
Cost | | | Amortized
Cost | | | Expected
Loss | | | Net Amortized
Cost | |
Brazilian government securities (1a) | | | 64,568 | | | | (44 | ) | | | 64,524 | | | | 56,355 | | | | (52 | ) | | | 56,303 | |
Government securities – abroad | | | 19,095 | | | | (14 | ) | | | 19,081 | | | | 17,226 | | | | — | | | | 17,226 | |
Colombia | | | 500 | | | | — | | | | 500 | | | | 335 | | | | — | | | | 335 | |
Chile | | | 705 | | | | (1 | ) | | | 704 | | | | 621 | | | | — | | | | 621 | |
Korea | | | 3,951 | | | | (4 | ) | | | 3,947 | | | | 3,427 | | | | — | | | | 3,427 | |
Spain | | | 4,847 | | | | (3 | ) | | | 4,844 | | | | 4,984 | | | | — | | | | 4,984 | |
United States | | | — | | | | — | | | | — | | | | 80 | | | | — | | | | 80 | |
Mexico | | | 9,042 | | | | (6 | ) | | | 9,036 | | | | 7,763 | | | | — | | | | 7,763 | |
Uruguay | | | 50 | | | | — | | | | 50 | | | | 16 | | | | — | | | | 16 | |
Corporate securities (1b) | | | 46,141 | | | | (3,007 | ) | | | 43,134 | | | | 59,538 | | | | (2,601 | ) | | | 56,937 | |
Rural product note | | | 3,499 | | | | (25 | ) | | | 3,474 | | | | 5,388 | | | | (47 | ) | | | 5,341 | |
Bank deposit certificates | | | 30 | | | | — | | | | 30 | | | | 54 | | | | — | | | | 54 | |
Real estate receivables certificates | | | 4,806 | | | | (12 | ) | | | 4,794 | | | | 5,844 | | | | (2 | ) | | | 5,842 | |
Debentures | | | 34,849 | | | | (2,952 | ) | | | 31,897 | | | | 41,053 | | | | (2,532 | ) | | | 38,521 | |
Eurobonds and other | | | 209 | | | | (1 | ) | | | 208 | | | | 1,083 | | | | (1 | ) | | | 1,082 | |
Promissory notes | | | 2,023 | | | | (10 | ) | | | 2,013 | | | | 5,001 | | | | (3 | ) | | | 4,998 | |
Other | | | 725 | | | | (7 | ) | | | 718 | | | | 1,115 | | | | (16 | ) | | | 1,099 | |
| | | | | | | | | | | | | | | | | | | | | | | | |
Total | | | 129,804 | | | | (3,065 | ) | | | 126,739 | | | | 133,119 | | | | (2,653 | ) | | | 130,466 | |
| | | | | | | | | | | | | | | | | | | | | | | | |
| (1) | Financial Assets at Amortized Cost – Securities Pledged as Collateral of Funding Transactions of Financial Institutions and Customers were: a) R$ 13,786 (R$ 9,583 at 12/31/2019); b) R$ 14,364 (R$ 17,457 at 12/31/2019), totaling R$ 28,150 (R$ 27,040 at 12/31/2019). |
The amortized cost of Financial assets at amortized cost - Securities by maturity is as follows:
| | | | | | | | | | | | | | | | |
| | | 12/31/2020 | | | 12/31/2019 | |
| | | Amortized
Cost | | | Net Amortized
Cost | | | Amortized
Cost | | | Net Amortized
Cost | |
Current | | | 38,285 | | | | 37,672 | | | | 30,113 | | | | 29,766 | |
Up to one year | | | 38,285 | | | | 37,672 | | | | 30,113 | | | | 29,766 | |
Non-current | | | 91,519 | | | | 89,067 | | | | 103,006 | | | | 100,700 | |
From one to five years | | | 56,447 | | | | 55,070 | | | | 57,120 | | | | 56,178 | |
From five to ten years | | | 24,434 | | | | 23,697 | | | | 34,599 | | | | 33,512 | |
After ten years | | | 10,638 | | | | 10,300 | | | | 11,287 | | | | 11,010 | |
| | | | | | | | | | | | | | | | |
Total | | | 129,804 | | | | 126,739 | | | | 133,119 | | | | 130,466 | |
| | | | | | | | | | | | | | | | |
| | |
| Itaú Unibanco Holding S.A. – Complete Financial Statements in IFRS – December 31, 2020 | | F-52 |
ITAÚ UNIBANCO HOLDING S.A.
Notes to the Consolidated Financial Statements
At 12/31/2020 and 12/31/2019 for balance sheet accounts and
From 01/01 to 12/31 of 2020, 2019 and 2018 for income statement accounts
(In millions of Reais, except information per share)
Reconciliation of expected loss to financial assets at amortized cost- securities, segregated by stages:
| | | | | | | | | | | | | | | | | | | | | | | | | | | | | | | | | | | | |
Stage 1 | | Expected
loss
12/31/2019 | | | Gains /
(Losses) | | | Purchases | | | Settlements | | | Transfer to
Stage 2 | | | Transfer to
Stage 3 | | | Cure from
Stage 2 | | | Cure from
Stage 3 | | | Expected
loss
12/31/2020 | |
Financial assets at amortized cost | | | (198 | ) | | | (113 | ) | | | (172 | ) | | | 311 | | | | 21 | | | | — | | | | — | | | | (34 | ) | | | (185 | ) |
| | | | | | | | | | | | | | | | | | | | | | | | | | | | | | | | | | | | |
Brazilian government securities | | | (52 | ) | | | 8 | | | | — | | | | — | | | | — | | | | — | | | | — | | | | — | | | | (44 | ) |
Government securities - abroad | | | — | | | | 8 | | | | (34 | ) | | | 12 | | | | — | | | | — | | | | — | | | | — | | | | (14 | ) |
Chile | | | — | | | | (1 | ) | | | — | | | | — | | | | — | | | | — | | | | — | | | | — | | | | (1 | ) |
Colombia | | | — | | | | — | | | | (2 | ) | | | 2 | | | | — | | | | — | | | | — | | | | — | | | | — | |
Korea | | | — | | | | 7 | | | | (14 | ) | | | 3 | | | | — | | | | — | | | | — | | | | — | | | | (4 | ) |
Spain | | | — | | | | — | | | | (3 | ) | | | — | | | | — | | | | — | | | | — | | | | — | | | | (3 | ) |
Mexico | | | — | | | | 2 | | | | (15 | ) | | | 7 | | | | — | | | | — | | | | — | | | | — | | | | (6 | ) |
Corporate securities | | | (146 | ) | | | (129 | ) | | | (138 | ) | | | 299 | | | | 21 | | | | — | | | | — | | | | (34 | ) | | | (127 | ) |
Rural product note | | | (9 | ) | | | 15 | | | | (44 | ) | | | 15 | | | | — | | | | — | | | | — | | | | — | | | | (23 | ) |
Real estate receivables certificates | | | (2 | ) | | | (10 | ) | | | (9 | ) | | | 13 | | | | — | | | | — | | | | — | | | | — | | | | (8 | ) |
Debentures | | | (131 | ) | | | (124 | ) | | | (60 | ) | | | 250 | | | | 21 | | | | — | | | | — | | | | (34 | ) | | | (78 | ) |
Eurobond and other | | | (1 | ) | | | (6 | ) | | | (2 | ) | | | 8 | | | | — | | | | — | | | | — | | | | — | | | | (1 | ) |
Promissory notes | | | (3 | ) | | | (7 | ) | | | (10 | ) | | | 10 | | | | — | | | | — | | | | — | | | | — | | | | (10 | ) |
Other | | | — | | | | 3 | | | | (13 | ) | | | 3 | | | | — | | | | — | | | | — | | | | — | | | | (7 | ) |
| | | | | | | | | | | | | | | | | | | | | | | | | | | | | | | | | | | | |
Stage 2 | | Expected
loss
12/31/2019 | | | Gains /
(Losses) | | | Purchases | | | Settlements | | | Transfer to
Stage 1 | | | Transfer to
Stage 3 | | | Cure from
Stage 1 | | | Cure from
Stage 3 | | | Expected
loss
12/31/2020 | |
Financial assets at amortized cost | | | (58 | ) | | | (9 | ) | | | (67 | ) | | | 61 | | | | — | | | | 54 | | | | (21 | ) | | | (13 | ) | | | (53 | ) |
| | | | | | | | | | | | | | | | | | | | | | | | | | | | | | | | | | | | |
Corporate securities | | | (58 | ) | | | (9 | ) | | | (67 | ) | | | 61 | | | | — | | | | 54 | | | | (21 | ) | | | (13 | ) | | | (53 | ) |
Rural product note | | | (5 | ) | | | (3 | ) | | | — | | | | 5 | | | | — | | | | 1 | | | | — | | | | — | | | | (2 | ) |
Real estate receivables certificates | | | — | | | | (4 | ) | | | — | | | | — | | | | — | | | | — | | | | — | | | | — | | | | (4 | ) |
Debentures | | | (53 | ) | | | (1 | ) | | | (67 | ) | | | 55 | | | | — | | | | 53 | | | | (21 | ) | | | (13 | ) | | | (47 | ) |
Eurobond and other | | | — | | | | (1 | ) | | | — | | | | 1 | | | | — | | | | — | | | | — | | | | — | | | | — | |
| | | | | | | | | | | | | | | | | | | | | | | | | | | | | | | | | | | | |
Stage 3 | | Expected
loss
12/31/2019 | | | Gains /
(Losses) | | | Purchases | | | Settlements | | | Transfer to
Stage 1 | | | Transfer to
Stage 2 | | | Cure from
Stage 1 | | | Cure from
Stage 2 | | | Expected
loss
12/31/2020 | |
Financial assets at amortized cost | | | (2,397 | ) | | | (1,278 | ) | | | (238 | ) | | | 1,093 | | | | 34 | | | | 13 | | | | — | | | | (54 | ) | | | (2,827 | ) |
| | | | | | | | | | | | | | | | | | | | | | | | | | | | | | | | | | | | |
Corporate securities | | | (2,397 | ) | | | (1,278 | ) | | | (238 | ) | | | 1,093 | | | | 34 | | | | 13 | | | | — | | | | (54 | ) | | | (2,827 | ) |
Rural product note | | | (33 | ) | | | (7 | ) | | | (1 | ) | | | 42 | | | | — | | | | — | | | | — | | | | (1 | ) | | | — | |
Debentures | | | (2,348 | ) | | | (1,287 | ) | | | (207 | ) | | | 1,021 | | | | 34 | | | | 13 | | | | — | | | | (53 | ) | | | (2,827 | ) |
Other | | | (16 | ) | | | 16 | | | | (30 | ) | | | 30 | | | | — | | | | — | | | | — | | | | — | | | | — | |
| | | | | | | | | | | | | | | | | | | | | | | | | | | | | | | | | | | | |
Stage 1 | | Expected
loss
12/31/2018 | | | Gains /
(Losses) | | | Purchases | | | Settlements | | | Transfer to
Stage 2 | | | Transfer to
Stage 3 | | | Cure from
Stage 2 | | | Cure from
Stage 3 | | | Expected
loss
12/31/2019 | |
Financial assets at amortized cost | | | (223 | ) | | | 36 | | | | (38 | ) | | | 48 | | | | 74 | | | | — | | | | (75 | ) | | | (20 | ) | | | (198 | ) |
| | | | | | | | | | | | | | | | | | | | | | | | | | | | | | | | | | | | |
Brazilian government securities | | | — | | | | 7 | | | | — | | | | — | | | | — | | | | — | | | | (59 | ) | | | — | | | | (52 | ) |
Government securities - abroad - Colombia | | | (4 | ) | | | 5 | | | | (3 | ) | | | 2 | | | | — | | | | — | | | | — | | | | — | | | | — | |
Corporate securities | | | (219 | ) | | | 24 | | | | (35 | ) | | | 46 | | | | 74 | | | | — | | | | (16 | ) | | | (20 | ) | | | (146 | ) |
Rural product note | | | (7 | ) | | | 4 | | | | (7 | ) | | | 1 | | | | — | | | | — | | | | — | | | | — | | | | (9 | ) |
Real estate receivables certificates | | | (2 | ) | | | — | | | | (4 | ) | | | 23 | | | | — | | | | — | | | | — | | | | (19 | ) | | | (2 | ) |
Debentures | | | (206 | ) | | | 19 | | | | (21 | ) | | | 20 | | | | 74 | | | | — | | | | (16 | ) | | | (1 | ) | | | (131 | ) |
Eurobond and other | | | (2 | ) | | | — | | | | — | | | | 1 | | | | — | | | | — | | | | — | | | | — | | | | (1 | ) |
Promissory notes | | | (2 | ) | | | 1 | | | | (3 | ) | | | 1 | | | | — | | | | — | | | | — | | | | — | | | | (3 | ) |
| | | | | | | | | | | | | | | | | | | | | | | | | | | | | | | | | | | | |
Stage 2 | | Expected
loss
12/31/2018 | | | Gains /
(Losses) | | | Purchases | | | Settlements | | | Transfer to
Stage 1 | | | Transfer to
Stage 3 | | | Cure from
Stage 1 | | | Cure from
Stage 3 | | | Expected
loss
12/31/2019 | |
Financial assets at amortized cost | | | (824 | ) | | | 82 | | | | (2 | ) | | | 66 | | | | 75 | | | | 619 | | | | (74 | ) | | | — | | | | (58 | ) |
| | | | | | | | | | | | | | | | | | | | | | | | | | | | | | | | | | | | |
Brazilian government securities | | | (59 | ) | | | — | | | | — | | | | — | | | | 59 | | | | — | | | | — | | | | — | | | | — | |
Corporate securities | | | (765 | ) | | | 82 | | | | (2 | ) | | | 66 | | | | 16 | | | | 619 | | | | (74 | ) | | | — | | | | (58 | ) |
Rural product note | | | — | | | | (8 | ) | | | (2 | ) | | | — | | | | — | | | | 5 | | | | — | | | | — | | | | (5 | ) |
Debentures | | | (765 | ) | | | 90 | | | | — | | | | 66 | | | | 16 | | | | 614 | | | | (74 | ) | | | — | | | | (53 | ) |
| | | | | | | | | | | | | | | | | | | | | | | | | | | | | | | | | | | | |
Stage 3 | | Expected
loss
12/31/2018 | | | Gains /
(Losses) | | | Purchases | | | Settlements | | | Transfer to
Stage 1 | | | Transfer to
Stage 2 | | | Cure from
Stage 1 | | | Cure from
Stage 2 | | | Expected
loss
12/31/2019 | |
Financial assets at amortized cost | | | (2,599 | ) | | | (35 | ) | | | (193 | ) | | | 1,029 | | | | 20 | | | | — | | | | — | | | | (619 | ) | | | (2,397 | ) |
| | | | | | | | | | | | | | | | | | | | | | | | | | | | | | | | |
Corporate securities | | | (2,599 | ) | | | (35 | ) | | | (193 | ) | | | 1,029 | | | | 20 | | | | — | | | | — | | | | (619 | ) | | | (2,397 | ) |
Rural product note | | | (173 | ) | | | (3 | ) | | | (50 | ) | | | 198 | | | | — | | | | — | | | | — | | | | (5 | ) | | | (33 | ) |
Real estate receivables certificates | | | (361 | ) | | | 16 | | | | — | | | | 326 | | | | 19 | | | | — | | | | — | | | | — | | | | — | |
Debentures | | | (2,037 | ) | | | (48 | ) | | | (127 | ) | | | 477 | | | | 1 | | | | — | | | | — | | | | (614 | ) | | | (2,348 | ) |
Promissory notes | | | (11 | ) | | | — | | | | — | | | | 11 | | | | — | | | | — | | | | — | | | | — | | | | — | |
Other | | | (17 | ) | | | — | | | | (16 | ) | | | 17 | | | | — | | | | — | | | | — | | | | — | | | | (16 | ) |
| | |
| Itaú Unibanco Holding S.A. – Complete Financial Statements in IFRS – December 31, 2020 | | F-53 |
ITAÚ UNIBANCO HOLDING S.A.
Notes to the Consolidated Financial Statements
At 12/31/2020 and 12/31/2019 for balance sheet accounts and
From 01/01 to 12/31 of 2020, 2019 and 2018 for income statement accounts
(In millions of Reais, except information per share)
Note 10 - Loan and lease operations
| a) | Composition of loans and lease operations portfolio |
Below is the composition of the carrying amount of loan operations and lease operations by type, sector of debtor, maturity and concentration:
| | | | | | | | |
Loans and lease operations by type | | 12/31/2020 | | | 12/31/2019 | |
Individuals | | | 255,483 | | | | 240,490 | |
Credit card | | | 87,073 | | | | 91,676 | |
Personal loan | | | 35,346 | | | | 34,892 | |
Payroll loans | | | 55,508 | | | | 49,608 | |
Vehicles | | | 23,290 | | | | 18,968 | |
Mortgage loans | | | 54,266 | | | | 45,346 | |
Corporate | | | 134,521 | | | | 100,789 | |
Micro / small and medium companies | | | 121,955 | | | | 90,733 | |
Foreign loans - Latin America | | | 202,145 | | | | 153,779 | |
| | | | | | | | |
Total loans and lease operations | | | 714,104 | | | | 585,791 | |
| | | | | | | | |
Provision for Expected Loss (1) | | | (48,322 | ) | | | (37,508 | ) |
| | | | | | | | |
Total loans and lease operations, net of Expected Credit Loss | | | 665,782 | | | | 548,283 | |
| | | | | | | | |
| (1) | Comprises Expected Credit Loss for Financial Guarantees Pledged R$ (907) (R$ (837) at 12/31/2019) and Commitments to be Released R$ (3,485) (R$ (3,303) at 12/31/2019). |
| | | | | | | | |
By maturity | | 12/31/2020 | | | 12/31/2019 | |
Overdue as from 1 day | | | 18,683 | | | | 21,263 | |
Falling due up to 3 months | | | 172,497 | | | | 165,028 | |
Falling due from 3 months to 12 months | | | 181,033 | | | | 149,388 | |
Falling due after 1 year | | | 341,891 | | | | 250,112 | |
| | | | | | | | |
Total loans and lease operations | | | 714,104 | | | | 585,791 | |
| | | | | | | | |
| | | | | | | | |
By concentration | | 12/31/2020 | | | 12/31/2019 | |
Largest debtor | | | 7,243 | | | | 5,389 | |
10 largest debtors | | | 37,863 | | | | 29,340 | |
20 largest debtors | | | 54,812 | | | | 44,712 | |
50 largest debtors | | | 83,438 | | | | 71,965 | |
100 largest debtors | | | 112,333 | | | | 97,695 | |
The breakdown of the loans and lease operations portfolio by debtor’s industry is described in Note 32, item 1.4.1 - By business sector.
| | |
| Itaú Unibanco Holding S.A. – Complete Financial Statements in IFRS – December 31, 2020 | | F-54 |
ITAÚ UNIBANCO HOLDING S.A.
Notes to the Consolidated Financial Statements
At 12/31/2020 and 12/31/2019 for balance sheet accounts and
From 01/01 to 12/31 of 2020, 2019 and 2018 for income statement accounts
(In millions of Reais, except information per share)
| b) | Gross Carrying Amount (Loan Portfolio) |
Reconciliation of gross portfolio of loans and lease operations, segregated by stages:
| | | | | | | | | | | | | | | | | | | | | | | | | | | | | | | | |
Stage 1 | | Balance at
12/31/2019 | | | Transfer to
Stage 2 | | | Transfer to
Stage 3 (*) | | | Cure from the
Stage 2 | | | Cure from the
Stage 3 | | | Derecognition | | | Acquisition/
(Settlement) | | | Closing balance
12/31/2020 | |
Individuals | | | 199.907 | | | | (32.363 | ) | | | (1.779 | ) | | | 10.186 | | | | 38 | | | | — | | | | 23.169 | | | | 199.158 | |
Corporate | | | 91.448 | | | | (2.822 | ) | | | (82 | ) | | | 996 | | | | 299 | | | | — | | | | 33.826 | | | | 123.665 | |
Micro / Small and medium companies | | | 77.722 | | | | (14.370 | ) | | | (1.501 | ) | | | 4.827 | | | | 875 | | | | — | | | | 29.231 | | | | 96.784 | |
Foreign loans - Latin America | | | 132.812 | | | | (12.793 | ) | | | (2.456 | ) | | | 3.229 | | | | 47 | | | | — | | | | 46.762 | | | | 167.601 | |
| | | | | | | | | | | | | | | | | | | | | | | | | | | | | | | | |
Total | | | 501.889 | | | | (62.348 | ) | | | (5.818 | ) | | | 19.238 | | | | 1.259 | | | | — | | | | 132.988 | | | | 587.208 | |
| | | | | | | | | | | | | | | | | | | | | | | | | | | | | | | | |
| | | | | | | | |
Stage 2 | | Balance at
12/31/2019 | | | Transfer to
Stage 1 | | | Transfer to
Stage 3 | | | Cure from the
Stage 1 | | | Cure from the
Stage 3 | | | Derecognition | | | Acquisition/
(Settlement) | | | Closing balance
12/31/2020 | |
Individuals | | | 19.070 | | | | (10.186 | ) | | | (7.158 | ) | | | 32.363 | | | | 964 | | | | — | | | | (4.260 | ) | | | 30.793 | |
Corporate | | | 911 | | | | (996 | ) | | | (370 | ) | | | 2.822 | | | | 51 | | | | — | | | | 375 | | | | 2.793 | |
Micro / Small and medium companies | | | 7.225 | | | | (4.827 | ) | | | (2.193 | ) | | | 14.370 | | | | 483 | | | | — | | | | 907 | | | | 15.965 | |
Foreign loans - Latin America | | | 14.714 | | | | (3.229 | ) | | | (11.998 | ) | | | 12.793 | | | | 834 | | | | — | | | | 3.578 | | | | 16.692 | |
| | | | | | | | | | | | | | | | | | | | | | | | | | | | | | | | |
Total | | | 41.920 | | | | (19.238 | ) | | | (21.719 | ) | | | 62.348 | | | | 2.332 | | | | — | | | | 600 | | | | 66.243 | |
| | | | | | | | | | | | | | | | | | | | | | | | | | | | | | | | |
| | | | | | | | |
Stage 3 | | Balance at
12/31/2019 | | | Transfer to
Stage 1 | | | Transfer to
Stage 2 | | | Cure from the
Stage 1 | | | Cure from the
Stage 2 | | | Derecognition | | | Acquisition/
(Settlement) | | | Closing balance
12/31/2020 | |
Individuals | | | 21.513 | | | | (38 | ) | | | (964 | ) | | | 1.779 | | | | 7.158 | | | | (11.764 | ) | | | 7.848 | | | | 25.532 | |
Corporate | | | 8.430 | | | | (299 | ) | | | (51 | ) | | | 82 | | | | 370 | | | | 570 | | | | (1.039 | ) | | | 8.063 | |
Micro / Small and medium companies | | | 5.786 | | | | (875 | ) | | | (483 | ) | | | 1.501 | | | | 2.193 | | | | (1.836 | ) | | | 2.920 | | | | 9.206 | |
Foreign loans - Latin America | | | 6.253 | | | | (47 | ) | | | (834 | ) | | | 2.456 | | | | 11.998 | | | | (608 | ) | | | (1.366 | ) | | | 17.852 | |
| | | | | | | | | | | | | | | | | | | | | | | | | | | | | | | | |
Total | | | 41.982 | | | | (1.259 | ) | | | (2.332 | ) | | | 5.818 | | | | 21.719 | | | | (13.638 | ) | | | 8.363 | | | | 60.653 | |
| | | | | | | | | | | | | | | | | | | | | | | | | | | | | | | | |
| | | | | | | | | | | | | | | | |
Consolidated 3 Stages | | Balance at
12/31/2019 | | | Derecognition | | | Acquisition /
(Settlement) | | | Closing balance
12/31/2020 | |
Individuals | | | 240.490 | | | | (11.764 | ) | | | 26.757 | | | | 255.483 | |
Corporate | | | 100.789 | | | | 570 | | | | 33.162 | | | | 134.521 | |
Micro / Small and medium companies | | | 90.733 | | | | (1.836 | ) | | | 33.058 | | | | 121.955 | |
Foreign loans—Latin America | | | 153.779 | | | | (608 | ) | | | 48.974 | | | | 202.145 | |
Total | | | 585.791 | | | | (13.638 | ) | | | 141.951 | | | | 714.104 | |
| (*) | In the movement of transfer of operations from stage 1 to stage 3 over the period, a representative part thereof have first gone through stage 2. |
Reconciliation of gross portfolio of loan and lease operations, segregated by stages:
| | | | | | | | | | | | | | | | | | | | | | | | | | | | | | | | |
Stage 1 | | Balance at
12/31/2018 | | | Transfer to
Stage 2 | | | Transfer to
Stage 3 (*) | | | Cure from the
Stage 2 | | | Cure from the
Stage 3 | | | Derecognition | | | Acquisition /
(Settlement) | | | Closing balance
12/31/2019 | |
Individuals | | | 177,488 | | | | (19,661 | ) | | | (2,009 | ) | | | 8,680 | | | | — | | | | — | | | | 35,409 | | | | 199,907 | |
Corporate | | | 87,344 | | | | (904 | ) | | | (36 | ) | | | 875 | | | | 8 | | | | — | | | | 4,161 | | | | 91,448 | |
Micro / Small and medium companies | | | 60,471 | | | | (5,484 | ) | | | (823 | ) | | | 3,224 | | | | 44 | | | | — | | | | 20,290 | | | | 77,722 | |
Foreign loans - Latin America | | | 134,323 | | | | (12,022 | ) | | | (1,001 | ) | | | 5,029 | | | | 74 | | | | — | | | | 6,409 | | | | 132,812 | |
| | | | | | | | | | | | | | | | | | | | | | | | | | | | | | | | |
Total | | | 459,626 | | | | (38,071 | ) | | | (3,869 | ) | | | 17,808 | | | | 126 | | | | — | | | | 66,269 | | | | 501,889 | |
| | | | | | | | | | | | | | | | | | | | | | | | | | | | | | | | |
| | | | | | | | | | | | | | | | | | | | | | | | | | | | | | | | |
Stage 2 | | Balance at
12/31/2018 | | | Transfer to
Stage 1 | | | Transfer to
Stage 3 | | | Cure from the
Stage 1 | | | Cure from the
Stage 3 | | | Derecognition | | | Acquisition /
(Settlement) | | | Closing balance
12/31/2019 | |
Individuals | | | 17,029 | | | | (8,680 | ) | | | (7,579 | ) | | | 19,661 | | | | 977 | | | | — | | | | (2,338 | ) | | | 19,070 | |
Corporate | | | 2,038 | | | | (875 | ) | | | (753 | ) | | | 904 | | | | 1 | | | | — | | | | (404 | ) | | | 911 | |
Micro / Small and medium companies | | | 6,059 | | | | (3,224 | ) | | | (1,841 | ) | | | 5,484 | | | | 483 | | | | — | | | | 264 | | | | 7,225 | |
Foreign loans - Latin America | | | 11,768 | | | | (5,029 | ) | | | (3,335 | ) | | | 12,022 | | | | 731 | | | | — | | | | (1,443 | ) | | | 14,714 | |
| | | | | | | | | | | | | | | | | | | | | | | | | | | | | | | | |
Total | | | 36,894 | | | | (17,808 | ) | | | (13,508 | ) | | | 38,071 | | | | 2,192 | | | | — | | | | (3,921 | ) | | | 41,920 | |
| | | | | | | | | | | | | | | | | | | | | | | | | | | | | | | | |
| | | | | | | | | | | | | | | | | | | | | | | | | | | | | | | | |
Stage 3 | | Balance at
12/31/2018 | | | Transfer to
Stage 1 | | | Transfer to
Stage 2 | | | Cure from the
Stage 1 | | | Cure from the
Stage 2 | | | Derecognition | | | Acquisition /
(Settlement) | | | Closing balance
12/31/2019 | |
Individuals | | | 18,047 | | | | — | | | | (977 | ) | | | 2,009 | | | | 7,579 | | | | (9,710 | ) | | | 4,565 | | | | 21,513 | |
Corporate | | | 9,674 | | | | (8 | ) | | | (1 | ) | | | 36 | | | | 753 | | | | (868 | ) | | | (1,156 | ) | | | 8,430 | |
Micro / Small and medium companies | | | 5,869 | | | | (44 | ) | | | (483 | ) | | | 823 | | | | 1,841 | | | | (2,011 | ) | | | (209 | ) | | | 5,786 | |
Foreign loans - Latin America | | | 5,981 | | | | (74 | ) | | | (731 | ) | | | 1,001 | | | | 3,335 | | | | (1,710 | ) | | | (1,549 | ) | | | 6,253 | |
| | | | | | | | | | | | | | | | | | | | | | | | | | | | | | | | |
Total | | | 39,571 | | | | (126 | ) | | | (2,192 | ) | | | 3,869 | | | | 13,508 | | | | (14,299 | ) | | | 1,651 | | | | 41,982 | |
| | | | | | | | | | | | | | | | | | | | | | | | | | | | | | | | |
| | | | | | | | | | | | | | | | |
Consolidated 3 Stages | | Balance at
12/31/2018 | | | Derecognition | | | Acquisition /
(Settlement) | | | Closing balance
12/31/2019 | |
Individuals | | | 212,564 | | | | (9,710 | ) | | | 37,636 | | | | 240,490 | |
Corporate | | | 99,056 | | | | (868 | ) | | | 2,601 | | | | 100,789 | |
Micro / Small and medium companies | | | 72,399 | | | | (2,011 | ) | | | 20,345 | | | | 90,733 | |
Foreign loans - Latin America | | | 152,072 | | | | (1,710 | ) | | | 3,417 | | | | 153,779 | |
| | | | | | | | | | | | | | | | |
Total | | | 536,091 | | | | (14,299 | ) | | | 63,999 | | | | 585,791 | |
| | | | | | | | | | | | | | | | |
| (*) | In the movement of transfer of operations from stage 1 to stage 3 over the period, a representative part thereof have first gone through stage 2. |
| | |
| Itaú Unibanco Holding S.A. – Complete Financial Statements in IFRS – December 31, 2020 | | F-55 |
ITAÚ UNIBANCO HOLDING S.A.
Notes to the Consolidated Financial Statements
At 12/31/2020 and 12/31/2019 for balance sheet accounts and
From 01/01 to 12/31 of 2020, 2019 and 2018 for income statement accounts
(In millions of Reais, except information per share)
Reconciliation of expected credit loss of loans and lease operations, segregated by stages:
| | | | | | | | | | | | | | | | | | | | | | | | | | | | | | | | |
Stage 1 | | Balance at
12/31/2019 | | | Transfer to
Stage 2 | | | Transfer to
Stage 3 (1) | | | Cure from the
Stage 2 | | | Cure from the
Stage 3 | | | Derecognition | | | (Increase) /
Reversal | | | Closing balance
12/31/2020 | |
Individuals | | | (5,215 | ) | | | 1,541 | | | | 197 | | | | (525 | ) | | | — | | | | — | | | | (1,401 | ) | | | (5,403 | ) |
Corporate | | | (506 | ) | | | 205 | | | | 3 | | | | (180 | ) | | | (17 | ) | | | — | | | | (245 | ) | | | (740 | ) |
Micro / Small and medium companies | | | (1,092 | ) | | | 698 | | | | 90 | | | | (306 | ) | | | (41 | ) | | | — | | | | (622 | ) | | | (1,273 | ) |
Foreign loans - Latin America | | | (1,353 | ) | | | 275 | | | | 513 | | | | (104 | ) | | | (12 | ) | | | — | | | | (1,708 | ) | | | (2,389 | ) |
| | | | | | | | | | | | | | | | | | | | | | | | | | | | | | | | |
Total | | | (8,166 | ) | | | 2,719 | | | | 803 | | | | (1,115 | ) | | | (70 | ) | | | — | | | | (3,976 | ) | | | (9,805 | ) |
| | | | | | | | | | | | | | | | | | | | | | | | | | | | | | | | |
| | | | | | | | | | | | | | | | | | | | | | | | | | | | | | | | |
Stage 2 | | Balance at
12/31/2019 | | | Transfer to
Stage 1 | | | Transfer to
Stage 3 | | | Cure from the
Stage 1 | | | Cure from the
Stage 3 | | | Derecognition | | | (Increase) /
Reversal | | | Closing balance
12/31/2020 | |
Individuals | | | (2,811 | ) | | | 525 | | | | 2,872 | | | | (1,541 | ) | | | (69 | ) | | | — | | | | (2,231 | ) | | | (3,255 | ) |
Corporate | | | (91 | ) | | | 180 | | | | 63 | | | | (205 | ) | | | (9 | ) | | | — | | | | (1,199 | ) | | | (1,261 | ) |
Micro / Small and medium companies | | | (890 | ) | | | 306 | | | | 550 | | | | (698 | ) | | | (92 | ) | | | — | | | | (513 | ) | | | (1,337 | ) |
Foreign loans - Latin America | | | (2,765 | ) | | | 104 | | | | 2,084 | | | | (275 | ) | | | (218 | ) | | | — | | | | (959 | ) | | | (2,029 | ) |
| | | | | | | | | | | | | | | | | | | | | | | | | | | | | | | | |
Total | | | (6,557 | ) | | | 1,115 | | | | 5,569 | | | | (2,719 | ) | | | (388 | ) | | | — | | | | (4,902 | ) | | | (7,882 | ) |
| | | | | | | | | | | | | | | | | | | | | | | | | | | | | | | | |
| | | | | | | | | | | | | | | | | | | | | | | | | | | | | | | | |
Stage 3 | | Balance at
12/31/2019 | | | Transfer to
Stage 1 | | | Transfer to
Stage 2 | | | Cure from the
Stage 1 | | | Cure from the
Stage 2 | | | Derecognition | | | (Increase) /
Reversal | | | Closing balance
12/31/2020 | |
Individuals | | | (11,427 | ) | | | — | | | | 69 | | | | (197 | ) | | | (2,872 | ) | | | 11,764 | | | | (9,809 | ) | | | (12,472 | ) |
Corporate | | | (6,288 | ) | | | 17 | | | | 9 | | | | (3 | ) | | | (63 | ) | | | (570 | ) | | | 946 | | | | (5,952 | ) |
Micro / Small and medium companies | | | (2,567 | ) | | | 41 | | | | 92 | | | | (90 | ) | | | (550 | ) | | | 1,836 | | | | (2,521 | ) | | | (3,759 | ) |
Foreign loans - Latin America | | | (2,503 | ) | | | 12 | | | | 218 | | | | (513 | ) | | | (2,084 | ) | | | 608 | | | | (4,190 | ) | | | (8,452 | ) |
| | | | | | | | | | | | | | | | | | | | | | | | | | | | | | | | |
Total | | | (22,785 | ) | | | 70 | | | | 388 | | | | (803 | ) | | | (5,569 | ) | | | 13,638 | | | | (15,574 | ) | | | (30,635 | ) |
| | | | | | | | | | | | | | | | | | | | | | | | | | | | | | | | |
| | | | | | | | | | | | | | | | |
Consolidated 3 Stages | | Balance at
12/31/2019 | | | Derecognition | | | (Increase) /
Reversal (2) | | | Closing balance at
12/31/2020 (3) | |
Individuals | | | (19,453 | ) | | | 11,764 | | | | (13,441 | ) | | | (21,130 | ) |
Corporate | | | (6,885 | ) | | | (570 | ) | | | (498 | ) | | | (7,953 | ) |
Micro / Small and medium companies | | | (4,549 | ) | | | 1,836 | | | | (3,656 | ) | | | (6,369 | ) |
Foreign loans - Latin America | | | (6,621 | ) | | | 608 | | | | (6,857 | ) | | | (12,870 | ) |
| | | | | | | | | | | | | | | | |
Total | | | (37,508 | ) | | | 13,638 | | | | (24,452 | ) | | | (48,322 | ) |
| | | | | | | | | | | | | | | | |
| (1) | In the movement of transfer of operations from stage 1 to stage 3 over the period, a representative part thereof have first gone through stage 2. |
| (2) | The increase in the Expected Credit Loss is related to the change in the macroeconomic scenario as from the second half of March 2020 and that impacted our provisioning model for expected loss (Note 33a). |
| (3) | Comprises Expected Credit Loss for Financial Guarantees R$ (907) (R$ (837) at 12/31/2019) and Loan Commitments R$ (3,485) (R$ (3,303) at 12/31/2019). |
Reconciliation of expected credit loss of loans and lease operations, segregated by stages:
| | | | | | | | | | | | | | | | | | | | | | | | | | | | | | | | |
Stage 1 | | Balance at
12/31/2018 | | | Transfer to
Stage 2 | | | Transfer to
Stage 3 (1) | | | Cure from the
Stage 2 | | | Cure from the
Stage 3 | | | Derecognition | | | (Increase)
/ Reversal | | | Closing balance
12/31/2019 | |
Individuals | | | (3,892 | ) | | | 846 | | | | 282 | | | | (264 | ) | | | — | | | | — | | | | (2,187 | ) | | | (5,215 | ) |
Corporate | | | (520 | ) | | | 59 | | | | 1 | | | | (158 | ) | | | — | | | | — | | | | 112 | | | | (506 | ) |
Micro / Small and medium companies | | | (1,123 | ) | | | 225 | | | | 72 | | | | (148 | ) | | | (10 | ) | | | — | | | | (108 | ) | | | (1,092 | ) |
Foreign loans - Latin America | | | (1,396 | ) | | | 258 | | | | 18 | | | | (160 | ) | | | (40 | ) | | | — | | | | (33 | ) | | | (1,353 | ) |
| | | | | | | | | | | | | | | | | | | | | | | | | | | | | | | | |
Total | | | (6,931 | ) | | | 1,388 | | | | 373 | | | | (730 | ) | | | (50 | ) | | | — | | | | (2,216 | ) | | | (8,166 | ) |
| | | | | | | | | | | | | | | | | | | | | | | | | | | | | | | | |
| | | | | | | | | | | | | | | | | | | | | | | | | | | | | | | | |
Stage 2 | | Balance at
12/31/2018 | | | Transfer to
Stage 1 | | | Transfer to
Stage 3 | | | Cure from the
Stage 1 | | | Cure from the
Stage 3 | | | Derecognition | | | (Increase)
/ Reversal | | | Closing balance
12/31/2019 | |
Individuals | | | (2,116 | ) | | | 264 | | | | 3,117 | | | | (846 | ) | | | (155 | ) | | | — | | | | (3,075 | ) | | | (2,811 | ) |
Corporate | | | (549 | ) | | | 158 | | | | 245 | | | | (59 | ) | | | — | | | | — | | | | 114 | | | | (91 | ) |
Micro / Small and medium companies | | | (603 | ) | | | 148 | | | | 514 | | | | (225 | ) | | | (144 | ) | | | — | | | | (580 | ) | | | (890 | ) |
Foreign loans - Latin America | | | (1,183 | ) | | | 160 | | | | 562 | | | | (258 | ) | | | (268 | ) | | | — | | | | (1,778 | ) | | | (2,765 | ) |
| | | | | | | | | | | | | | | | | | | | | | | | | | | | | | | | |
Total | | | (4,451 | ) | | | 730 | | | | 4,438 | | | | (1,388 | ) | | | (567 | ) | | | — | | | | (5,319 | ) | | | (6,557 | ) |
| | | | | | | | | | | | | | | | | | | | | | | | | | | | | | | | |
| | | | | | | | | | | | | | | | | | | | | | | | | | | | | | | | |
Stage 3 | | Balance at
12/31/2018 | | | Transfer to
Stage 1 | | | Transfer to
Stage 2 | | | Cure from the
Stage 1 | | | Cure from the
Stage 2 | | | Derecognition | | | (Increase)
/ Reversal | | | Closing balance
12/31/2019 | |
Individuals | | | (8,417 | ) | | | — | | | | 155 | | | | (282 | ) | | | (3,117 | ) | | | 9,710 | | | | (9,476 | ) | | | (11,427 | ) |
Corporate | | | (8,231 | ) | | | — | | | | — | | | | (1 | ) | | | (245 | ) | | | 868 | | | | 1,321 | | | | (6,288 | ) |
Micro / Small and medium companies | | | (2,873 | ) | | | 10 | | | | 144 | | | | (72 | ) | | | (514 | ) | | | 2,011 | | | | (1,273 | ) | | | (2,567 | ) |
Foreign loans - Latin America | | | (2,606 | ) | | | 40 | | | | 268 | | | | (18 | ) | | | (562 | ) | | | 1,710 | | | | (1,335 | ) | | | (2,503 | ) |
| | | | | | | | | | | | | | | | | | | | | | | | | | | | | | | | |
Total | | | (22,127 | ) | | | 50 | | | | 567 | | | | (373 | ) | | | (4,438 | ) | | | 14,299 | | | | (10,763 | ) | | | (22,785 | ) |
| | | | | | | | | | | | | | | | | | | | | | | | | | | | | | | | |
| | | | | | | | | | | | | | | | |
Consolidated 3 Stages | | Balance at
12/31/2018 | | | Derecognition | | | (Increase) /
Reversal (2) | | | Closing balance at
12/31/2019 (3) | |
Individuals | | | (14,425 | ) | | | 9,710 | | | | (14,738 | ) | | | (19,453 | ) |
Corporate | | | (9,300 | ) | | | 868 | | | | 1,547 | | | | (6,885 | ) |
Micro / Small and medium companies | | | (4,599 | ) | | | 2,011 | | | | (1,961 | ) | | | (4,549 | ) |
Foreign loans - Latin America | | | (5,185 | ) | | | 1,710 | | | | (3,146 | ) | | | (6,621 | ) |
| | | | | | | | | | | | | | | | |
Total | | | (33,509 | ) | | | 14,299 | | | | (18,298 | ) | | | (37,508 | ) |
| | | | | | | | | | | | | | | | |
| (1) | In the movement of transfer of operations from stage 1 to stage 3 over the period, a representative part thereof have first gone through stage 2. |
| (2) | Change in macroeconomic scenarios used gave rise, in the fourth quarter, to a reversal of the Provision for Expected Loss in the amount of R$ 8. |
| (3) | Comprises expected credit loss for Financial Guarantees R$ (837) (R$ (1,191) at 12/31/2018) and Loan Commitments R$ (3,303) (R$ (2,601) at 12/31/2018). |
| | |
| Itaú Unibanco Holding S.A. – Complete Financial Statements in IFRS – December 31, 2020 | | F-56 |
ITAÚ UNIBANCO HOLDING S.A.
Notes to the Consolidated Financial Statements
At 12/31/2020 and 12/31/2019 for balance sheet accounts and
From 01/01 to 12/31 of 2020, 2019 and 2018 for income statement accounts
(In millions of Reais, except information per share)
| | d) | Lease operations - Lessor |
Finance leases are composed of vehicles, machines, equipment and real estate in Brazil and abroad. The analysis of portfolio maturities is presented below:
| | | | | | | | | | | | | | | | | | | | | | | | |
| | | 12/31/2020 | | | 12/31/2019 | |
| | | Payments
receivable | | | Future financial
income | | | Present
value | | | Payments
receivable | | | Future financial
income | | | Present
value | |
Current | | | 2,277 | | | | (597 | ) | | | 1,680 | | | | 1,899 | | | | (421 | ) | | | 1,478 | |
Up to 1 year | | | 2,277 | | | | (597 | ) | | | 1,680 | | | | 1,899 | | | | (421 | ) | | | 1,478 | |
Non-current | | | 10,553 | | | | (2,956 | ) | | | 7,597 | | | | 8,613 | | | | (2,640 | ) | | | 5,973 | |
From 1 to 2 years | | | 1,809 | | | | (472 | ) | | | 1,337 | | | | 1,535 | | | | (439 | ) | | | 1,096 | |
From 2 to 3 years | | | 1,424 | | | | (398 | ) | | | 1,026 | | | | 1,223 | | | | (368 | ) | | | 855 | |
From 3 to 4 years | | | 1,153 | | | | (337 | ) | | | 816 | | | | 982 | | | | (310 | ) | | | 672 | |
From 4 to 5 years | | | 930 | | | | (289 | ) | | | 641 | | | | 1,001 | | | | (287 | ) | | | 714 | |
Over 5 years | | | 5,237 | | | | (1,460 | ) | | | 3,777 | | | | 3,872 | | | | (1,236 | ) | | | 2,636 | |
| | | | | | | | | | | | | | | | | | | | | | | | |
Total | | | 12,830 | | | | (3,553 | ) | | | 9,277 | | | | 10,512 | | | | (3,061 | ) | | | 7,451 | |
| | | | | | | | | | | | | | | | | | | | | | | | |
Financial lease revenues are composed of:
| | | | | | | | |
| | | 01/01 to
12/31/2020 | | | 01/01 to
12/31/2019 | |
Financial Income | | | 645 | | | | 612 | |
Variable payments | | | 40 | | | | 39 | |
| | | | | | | | |
Total | | | 685 | | | | 651 | |
| | | | | | | | |
| | e) | Operations of securitization or transfer and acquisition of financial assets |
ITAÚ UNIBANCO HOLDING carried out operations of securitization or transfer of financial assets in which there was retention of credit risks of financial assets transferred under co-obligation covenants. Thus, these credits are still recorded in the Consolidated Balance Sheet and are represented as follows:
| | | | | | | | | | | | | | | | | | | | | | | | | | | | | | | | |
| | | 12/31/2020 | | | 12/31/2019 | |
| | | Assets | | | Liabilities (*) | | | Assets | | | Liabilities (*) | |
Nature of operation | | Book
value | | | Fair value | | | Book
value | | | Fair value | | | Book
value | | | Fair value | | | Book
value | | | Fair value | |
Mortgage loan | | | 349 | | | | 366 | | | | 347 | | | | 362 | | | | 1,305 | | | | 1,352 | | | | 1,303 | | | | 1,349 | |
Working capital | | | 1,297 | | | | 1,299 | | | | 1,310 | | | | 1,312 | | | | 1,211 | | | | 1,213 | | | | 1,207 | | | | 1,208 | |
Other | | | — | | |
| —
|
| | | — | | | | — | | | | — | | | | — | | | | 1 | | | | 1 | |
| | | | | | | | | | | | | | | | | | | | | | | | | | | | | | | | |
Total | | | 1,646 | | | | 1,665 | | | | 1,657 | | | | 1,674 | | | | 2,516 | | | | 2,565 | | | | 2,511 | | | | 2,558 | |
| | | | | | | | | | | | | | | | | | | | | | | | | | | | | | | | |
| (*) | Under Other liabilities. |
From 01/01 to 12/31/2020 operations of transfer of financial assets with no retention of risks and benefits generated impact on the result of R$ 309, net of the Allowance for Loan Losses (R$ 403 from 01/01 to 12/31/2019).
| | |
| Itaú Unibanco Holding S.A. – Complete Financial Statements in IFRS – December 31, 2020 | | F-57 |
ITAÚ UNIBANCO HOLDING S.A.
Notes to the Consolidated Financial Statements
At 12/31/2020 and 12/31/2019 for balance sheet accounts and
From 01/01 to 12/31 of 2020, 2019 and 2018 for income statement accounts
(In millions of Reais, except information per share)
Note 11 - Investments in associates and joint ventures
| a) | The following table presents non-material individual investments of ITAÚ UNIBANCO HOLDING: |
| | | | | | | | | | | | | | | | |
| | | 12/31/2020 | | | 01/01 to 12/31/2020 | |
| | | Investment | | | Equity in
earnings | | | Other
comprehensive
income | | | Total
Income | |
Associates (a) | | | 15.344 | | | | 1.556 | | | | (59 | ) | | | 1.497 | |
Joint ventures (b) | | | 226 | | | | (157 | ) | | | — | | | | (157 | ) |
| | | | | | | | | | | | | | | | |
Total | | | 15.570 | | | | 1.399 | | | | (59 | ) | | | 1.340 | |
| | | | | | | | | | | | | | | | |
| | | | | | | | | | | | | | | | | | | | |
| | | 12/31/2019 | | | 01/01 to 12/31/2019 | | | 01/01 to 12/31/2018 | |
| | | Investment | | | Equity in
earnings | | | Other
comprehensive
income | | | Total
Income | | | Equity in
earnings | |
Associates (a) | | | 14.870 | | | | 1.380 | | | | 1 | | | | 1.381 | | | | 798 | |
Joint ventures (b) | | | 227 | | | | (65 | ) | | | — | | | | (65 | ) | | | (51 | ) |
| | | | | | | | | | | | | | | | | | | | |
Total | | | 15.097 | | | | 1.315 | | | | 1 | | | | 1.316 | | | | 747 | |
| | | | | | | | | | | | | | | | | | | | |
| (a) | At 12/31/2020, this includes interest in total capital and voting capital of the following companies: XP Inc. (41% total capital and 29.32% voting capital; 46.05% total capital and 32.49% voting capital at 12/31/2019); Pravaler S.A. (52.65% total capital and 42.42% voting capital, 52.67% total capital and 42.49% voting capital at 12/31/2019); Porto Seguro Itaú Unibanco Participações S.A. (42.93% total and voting capital; 42.93% at 12/31/2019); BSF Holding S.A. (49% total and voting capital; 49% at 12/31/2019); Gestora de Inteligência de Crédito S.A. (20% total and voting capital; 20% at 12/31/2019), Compañia Uruguaya de Medios de Procesamiento S.A. (31.47% total and voting capital; 31.93% at 12/31/2019); Rias Redbanc S.A. (25% total and voting capital; 25% at 12/31/2019); Kinea Private Equity Investimentos S.A. (80% total capital and 49% voting capital; 80% total capital and 49% voting capital at 12/31/2019) and Tecnologia Bancária S.A. (28.05% total capital and 28.95% voting capital; and 28.95% at 12/31/2019). As from April 20, 2020, ITAÚ UNIBANCO HOLDING does not exercise significant influence on IRB-Brasil Resseguros S.A., so that its ownership interest is no longer classified as associate and started being classified as Financial Asset at Fair Value through Other Comprehensive Income. |
| (b) | At 12/31/2020, this includes interest in total and voting capital of the following companies: Olímpia Promoção e Serviços S.A. (50% total and voting capital; 50% at 12/31/2019); ConectCar Soluções de Mobilidade Eletrônica S.A. (50% total and voting capital; 50% at 12/31/2019) and includes result not arising from subsidiaries’ net income. |
| | |
| Itaú Unibanco Holding S.A. – Complete Financial Statements in IFRS – December 31, 2020 | | F-58 |
ITAÚ UNIBANCO HOLDING S.A.
Notes to the Consolidated Financial Statements
At 12/31/2020 and 12/31/2019 for balance sheet accounts and
From 01/01 to 12/31 of 2020, 2019 and 2018 for income statement accounts
(In millions of Reais, except information per share)
Note 12 – Lease - Lessee
ITAÚ UNIBANCO HOLDING is the lessee mainly of properties for use in its operations, which include renewal options and restatement clauses. During the period ended December 31, 2020, total cash outflow with lease amounted to R$ 673. Lease agreements in the amount of R$ 455 were renewed. There are no relevant sublease agreements.
Total liabilities in accordance with remaining contractual maturities, considering their undiscounted flows, is presented below:
| | | | | | | | |
| | | 12/31/2020 | | | 12/31/2019 | |
Up to 3 months | | | 333 | | | | 320 | |
3 months to 1 year | | | 945 | | | | 886 | |
From 1 to 5 years | | | 2,830 | | | | 2,457 | |
Over 5 years | | | 1,930 | | | | 1,135 | |
| | | | | | | | |
Total Financial Liability | | | 6,038 | | | | 4,798 | |
| | | | | | | | |
Lease amounts recognized in the Consolidated Statement of Income:
| | | | | | | | |
| | | 01/01 to
12/31/2020 | | | 01/01 to
12/31/2019 | |
Sublease revenues | | | 8 | | | | 12 | |
Depreciation expenses | | | (1,209 | ) | | | (1,060 | ) |
Interest expenses | | | (227 | ) | | | (271 | ) |
Lease expenses for low value assets | | | (87 | ) | | | (82 | ) |
Variable expenses not include in lease liabilities | | | (66 | ) | | | (81 | ) |
| | | | | | | | |
Total | | | (1,581 | ) | | | (1,482 | ) |
| | | | | | | | |
In the period from 01/01 to 12/31/2020, there was no impairment adjustment (R$ (175) from 01/01 to 12/31/2019), recorded under the heading General and Administrative Expenses.
| | |
| Itaú Unibanco Holding S.A. – Complete Financial Statements in IFRS – December 31, 2020 | | F-59 |
ITAÚ UNIBANCO HOLDING S.A.
Notes to the Consolidated Financial Statements
At 12/31/2020 and 12/31/2019 for balance sheet accounts and
From 01/01 to 12/31 of 2020, 2019 and 2018 for income statement accounts
(In millions of Reais, except information per share)
Note 13 - Fixed assets
| | | | | | | | | | | | | | | | | | | | | | | | | | | | | | | | | | | | |
| | | | | | Real estate | | | Other fixed assets | | | | |
Fixed Assets (1) | | Fixed assets
under
construction | | | Land | | | Buildings | | | Improvements | | | Installations | | | Furniture
and
equipment | | | Data
processing
systems | | | Other
(communication,
security and
transportation) | | | Total | |
Annual depreciation rates | | | | | | | | | | | 4 | % | | | 10 | % | | | 10% to 20 | % | | | 10% to 20 | % | | | 20% to 50 | % | | | 10% to 20 | % | | | | |
Cost | | | | | | | | | | | | | | | | | | | | | | | | | | | | | | | | | | | | |
Balance at 12/31/2019 | | | 734 | | | | 1,099 | | | | 3,065 | | | | 2,560 | | | | 1,729 | | | | 1,260 | | | | 9,564 | | | | 1,335 | | | | 21,346 | |
Acquisitions | | | 457 | | | | 1 | | | | 37 | | | | 39 | | | | 59 | | | | 77 | | | | 976 | | | | 70 | | | | 1,716 | |
Disposals | | | (38 | ) | | | (27 | ) | | | (79 | ) | | | (327 | ) | | | (30 | ) | | | (104 | ) | | | (471 | ) | | | (25 | ) | | | (1,101 | ) |
Exchange variation | | | — | | | | 4 | | | | 20 | | | | 191 | | | | 29 | | | | 83 | | | | 152 | | | | 12 | | | | 491 | |
Transfers | | | (596 | ) | | | — | | | | 196 | | | | 303 | | | | 79 | | | | 4 | | | | 10 | | | | — | | | | (4 | ) |
Other (2) | | | 6 | | | | 25 | | | | (85 | ) | | | 84 | | | | (3 | ) | | | 65 | | | | (1,984 | ) | | | 15 | | | | (1,877 | ) |
Balance at 12/31/2020 | | | 563 | | | | 1,102 | | | | 3,154 | | | | 2,850 | | | | 1,863 | | | | 1,385 | | | | 8,247 | | | | 1,407 | | | | 20,571 | |
Depreciation | | | | | | | | | | | | | | | | | | | | | | | | | | | | | | | | | | | | |
Balance at 12/31/2019 | | | — | | | | — | | | | (1,823 | ) | | | (1,755 | ) | | | (1,147 | ) | | | (909 | ) | | | (7,536 | ) | | | (983 | ) | | | (14,153 | ) |
Depreciation expenses | | | — | | | | — | | | | (81 | ) | | | (285 | ) | | | (147 | ) | | | (82 | ) | | | (777 | ) | | | (122 | ) | | | (1,494 | ) |
Disposals | | | — | | | | — | | | | 50 | | | | 320 | | | | 25 | | | | 94 | | | | 418 | | | | 22 | | | | 929 | |
Exchange variation | | | — | | | | — | | | | (4 | ) | | | (103 | ) | | | (19 | ) | | | (52 | ) | | | (117 | ) | | | (12 | ) | | | (307 | ) |
Other (2) | | | — | | | | — | | | | 8 | | | | (62 | ) | | | 30 | | | | (64 | ) | | | 1,639 | | | | (13 | ) | | | 1,538 | |
Balance at 12/31/2020 | | | — | | | | — | | | | (1,850 | ) | | | (1,885 | ) | | | (1,258 | ) | | | (1,013 | ) | | | (6,373 | ) | | | (1,108 | ) | | | (13,487 | ) |
Impairment | | | | | | | | | | | | | | | | | | | | | | | | | | | | | | | | | | | | |
Balance at 12/31/2019 | | | — | | | | — | | | | — | | | | — | | | | — | | | | — | | | | (27 | ) | | | — | | | | (27 | ) |
Increase | | | — | | | | — | | | | (3 | ) | | | (112 | ) | | | (2 | ) | | | (3 | ) | | | — | | | | — | | | | (120 | ) |
Reversals | | | — | | | | — | | | | — | | | | — | | | | — | | | | — | | | | — | | | | — | | | | — | |
Balance at 12/31/2020 | | | — | | | | — | | | | (3 | ) | | | (112 | ) | | | (2 | ) | | | (3 | ) | | | (27 | ) | | | — | | | | (147 | ) |
Book value | | | | | | | | | | | | | | | | | | | | | | | | | | | | | | | | | | | | |
Balance at 12/31/2020 | | | 563 | | | | 1,102 | | | | 1,301 | | | | 853 | | | | 603 | | | | 369 | | | | 1,847 | | | | 299 | | | | 6,937 | |
| (1) | The contractual commitments for purchase of the fixed assets totaled R$ 36, achievable by 2024 (Note 32b 3.2—Off balance commitments). |
| (2) | Includes the total amount of R$ 54 related to the hyperinflationary adjustment for Argentina. |
| | |
| Itaú Unibanco Holding S.A. – Complete Financial Statements in IFRS – December 31, 2020 | | F-60 |
ITAÚ UNIBANCO HOLDING S.A.
Notes to the Consolidated Financial Statements
At 12/31/2020 and 12/31/2019 for balance sheet accounts and
From 01/01 to 12/31 of 2020, 2019 and 2018 for income statement accounts
(In millions of Reais, except information per share)
| | | | | | | | | | | | | | | | | | | | | | | | | | | | | | | | | | | | |
| | | | | | Real estate | | | Other fixed assets | | | | |
Fixed Assets | | Fixed assets
under
construction | | | Land | | | Buildings | | | Improvements | | | Installations | | | Furniture and
equipment | | | Data processing
systems (1) | | | Other
(communication,
security and
transportation) | | | Total | |
Annual depreciation rates | | | | | | | | | | | 4 | % | | | 10 | % | | | 10% to 2 | 0% | | | 10% to 2 | 0% | | | 20% to 5 | 0% | | | 10% to 2 | 0% | | | | |
Cost | | | | | | | | | | | | | | | | | | | | | | | | | | | | | | | | | | | | |
Balance at 12/31/2018 | | | 556 | | | | 1,084 | | | | 3,111 | | | | 2,487 | | | | 1,988 | | | | 1,209 | | | | 9,328 | | | | 1,253 | | | | 21,016 | |
Acquisitions | | | 473 | | | | 14 | | | | 38 | | | | 60 | | | | 10 | | | | 68 | | | | 868 | | | | 90 | | | | 1,621 | |
Disposals | | | — | | | | (8 | ) | | | (30 | ) | | | (97 | ) | | | (10 | ) | | | (7 | ) | | | (534 | ) | | | (5 | ) | | | (691 | ) |
Exchange variation | | | (1 | ) | | | — | | | | (6 | ) | | | (16 | ) | | | (6 | ) | | | (12 | ) | | | (34 | ) | | | (1 | ) | | | (76 | ) |
Transfers | | | (278 | ) | | | — | | | | 107 | | | | 130 | | | | 27 | | | | — | | | | 14 | | | | — | | | | — | |
Other (2) | | | (16 | ) | | | 9 | | | | (155 | ) | | | (4 | ) | | | (280 | ) | | | 2 | | | | (78 | ) | | | (2 | ) | | | (524 | ) |
Balance at 12/31/2019 | | | 734 | | | | 1,099 | | | | 3,065 | | | | 2,560 | | | | 1,729 | | | | 1,260 | | | | 9,564 | | | | 1,335 | | | | 21,346 | |
Depreciation | | | | | | | | | | | | | | | | | | | | | | | | | | | | | | | | | | | | |
Balance at 12/31/2018 | | | — | | | | — | | | | (1,929 | ) | | | (1,670 | ) | | | (1,290 | ) | | | (834 | ) | | | (7,128 | ) | | | (863 | ) | | | (13,714 | ) |
Depreciation expenses | | | — | | | | — | | | | (79 | ) | | | (191 | ) | | | (136 | ) | | | (87 | ) | | | (1,043 | ) | | | (126 | ) | | | (1,662 | ) |
Disposals | | | — | | | | — | | | | 21 | | | | 94 | | | | 8 | | | | 6 | | | | 483 | | | | 4 | | | | 616 | |
Exchange variation | | | — | | | | — | | | | 5 | | | | 8 | | | | 4 | | | | 6 | | | | 21 | | | | 1 | | | | 45 | |
Other (2) | | | — | | | | — | | | | 159 | | | | 4 | | | | 267 | | | | — | | | | 131 | | | | 1 | | | | 562 | |
Balance at 12/31/2019 | | | — | | | | — | | | | (1,823 | ) | | | (1,755 | ) | | | (1,147 | ) | | | (909 | ) | | | (7,536 | ) | | | (983 | ) | | | (14,153 | ) |
Impairment | | | | | | | | | | | | | | | | | | | | | | | | | | | | | | | | | | | | |
Balance at 12/31/2018 | | | — | | | | — | | | | — | | | | — | | | | — | | | | — | | | | — | | | | — | | | | — | |
Increase | | | — | | | | — | | | | — | | | | — | | | | — | | | | — | | | | (27 | ) | | | — | | | | (27 | ) |
Reversals | | | — | | | | — | | | | — | | | | — | | | | — | | | | — | | | | — | | | | — | | | | — | |
Balance at 12/31/2019 | | | — | | | | — | | | | — | | | | — | | | | — | | | | — | | | | (27 | ) | | | — | | | | (27 | ) |
Book value | | | | | | | | | | | | | | | | | | | | | | | | | | | | | | | | | | | | |
Balance at 12/31/2019 | | | 734 | | | | 1,099 | | | | 1,242 | | | | 805 | | | | 582 | | | | 351 | | | | 2,001 | | | | 352 | | | | 7,166 | |
| (1) | Includes financial lease contracts, mainly related to data processing equipment, which are accounted for as financial lease operations. Assets and the liabilities are recognized in the Financial Statements. |
| (2) | Includes the total amount of R$ 67 related to the hyperinflationary adjustment for Argentina. |
| | |
| Itaú Unibanco Holding S.A. – Complete Financial Statements in IFRS – December 31, 2020 | | F-61 |
ITAÚ UNIBANCO HOLDING S.A.
Notes to the Consolidated Financial Statements
At 12/31/2020 and 12/31/2019 for balance sheet accounts and
From 01/01 to 12/31 of 2020, 2019 and 2018 for income statement accounts
(In millions of Reais, except information per share)
Note 14 – Goodwill and Intangible assets
| | | | | | | | | | | | | | | | | | | | | | | | |
| | | | | | Intangible assets | | | | |
| | | Goodwill and
intangible from
acquisition | | | Association for the
promotion and offer
of financial
products and
services | | | Software Acquired | | | Internally developed
software | | | Other intangible
assets (1) | | | Total | |
Annual amortization rates | | | | | | | 8 | % | | | 20 | % | | | 20 | % | | | 10% to 20 | % | | | | |
Cost | | | | | | | | | | | | | | | | | | | | | | | | |
Balance at 12/31/2019 | | | 11,158 | | | | 2,518 | | | | 5,899 | | | | 5,716 | | | | 2,971 | | | | 28,262 | |
Acquisitions | | | 287 | | | | — | | | | 795 | | | | 1,968 | | | | 541 | | | | 3,591 | |
Rescissions / disposals | | | — | | | | — | | | | (1,121 | ) | | | (20 | ) | | | (137 | ) | | | (1,278 | ) |
Exchange variation | | | 2,514 | | | | 320 | | | | 901 | | | | — | | | | 232 | | | | 3,967 | |
Other (3) | | | — | | | | (16 | ) | | | 10 | | | | — | | | | (333 | ) | | | (339 | ) |
Balance at 12/31/2020 | | | 13,959 | | | | 2,822 | | | | 6,484 | | | | 7,664 | | | | 3,274 | | | | 34,203 | |
Amortization | | | | | | | | | | | | | | | | | | | | | | | | |
Balance at 12/31/2019 | | | — | | | | (1,057 | ) | | | (3,206 | ) | | | (2,497 | ) | | | (1,242 | ) | | | (8,002 | ) |
Amortization expense (2) | | | — | | | | (174 | ) | | | (825 | ) | | | (779 | ) | | | (457 | ) | | | (2,235 | ) |
Rescissions / disposals | | | — | | | | — | | | | 834 | | | | — | | | | 136 | | | | 970 | |
Exchange variation | | | — | | | | (126 | ) | | | (451 | ) | | | — | | | | (174 | ) | | | (751 | ) |
Other (3) | | | — | | | | 10 | | | | (32 | ) | | | (12 | ) | | | 327 | | | | 293 | |
Balance at 12/31/2020 | | | — | | | | (1,347 | ) | | | (3,680 | ) | | | (3,288 | ) | | | (1,410 | ) | | | (9,725 | ) |
Impairment (Note 2.4h) | | | | | | | | | | | | | | | | | | | | | | | | |
Balance at 12/31/2019 | | | — | | | | — | | | | (171 | ) | | | (370 | ) | | | — | | | | (541 | ) |
Increase | | | (5,772 | ) | | | (789 | ) | | | (33 | ) | | | (13 | ) | | | — | | | | (6,607 | ) |
Disposals | | | — | | | | — | | | | — | | | | — | | | | — | | | | — | |
Balance at 12/31/2020 | | | (5,772 | ) | | | (789 | ) | | | (204 | ) | | | (383 | ) | | | — | | | | (7,148 | ) |
Book value | | | | | | | | | | | | | | | | | | | | | | | | |
Balance at 12/31/2020 | | | 8,187 | | | | 686 | | | | 2,600 | | | | 3,993 | | | | 1,864 | | | | 17,330 | |
| (1) | Includes amounts paid for acquisition of rights to provide services of payment of salaries, proceeds, retirement and pension benefits and similar benefits. |
| (2) | Amortization expenses related to the rights for acquisition of payrolls and associations, in the amount of R$ (594) (R$ (519) from 01/01 to 12/31/2019) are disclosed in the General and administrative expenses (Note 23). |
| (3) | Includes the total amount of R$ 17 related to the hyperinflationary adjustment for Argentina. |
Goodwill and Intangible Assets from Acquisition are mainly represented by Itaú Corpbanca’s goodwill in the amount of R$ 3,606.
ITAÚ UNIBANCO HOLDING recognized adjustments to the recoverable amount of goodwill and intangible assets related to Itaú Corpbanca, in the amounts of R$ 5,772 and R$ 789. The value in use of the Cash
Generating Unit (CGU) in which Itáu Corpbanca is allocated was considered and cash flows were based on the result of June 2020 and internal projects of results until 2025.
The adjustment to recoverable amount results from economic conditions at June 30, 2020, of Itaú Corpbanca’s market capitalization, discount rates applicable and other changes in variables triggered by the current uncertain macroeconomic condition that, when combined, resulted in a CGU amount lower than its book value. The discount rates used for the impairment test were 10.4% for operations in Chile and 12.3% for operations in Colombia, determined by the cost of capital calculated based on CAPM model. Long-term interest rates considered were 5.2% p.a. and 6.5% p.a. for Chile and Colombia, respectively. The most sensitive assumptions are cost of capital and perpetuity growth rate.
Impairment was recognized in the Consolidated Statement of Income under General and administrative expenses (Note 23).
| | |
| Itaú Unibanco Holding S.A. – Complete Financial Statements in IFRS – December 31, 2020 | | F-62 |
ITAÚ UNIBANCO HOLDING S.A.
Notes to the Consolidated Financial Statements
At 12/31/2020 and 12/31/2019 for balance sheet accounts and
From 01/01 to 12/31 of 2020, 2019 and 2018 for income statement accounts
(In millions of Reais, except information per share)
| | | | | | | | | | | | | | | | | | | | | | | | |
| | | | | | Intangible assets (1) | | | | |
| | | Goodwill and
intangible from
acquisition | | | Association for the
promotion and offer
of financial
products and
services | | | Software Acquired | | | Internally developed
software | | | Other intangible
assets (2) | | | Total | |
Annual amortization rates | | | | | | | 8 | % | | | 20 | % | | | 20 | % | | | 10% to 20% | | | | | |
Cost | | | | | | | | | | | | | | | | | | | | | | | | |
Balance at 12/31/2018 | | | 11,464 | | | | 2,529 | | | | 5,247 | | | | 4,529 | | | | 2,360 | | | | 26,129 | |
Acquisitions | | | — | | | | — | | | | 789 | | | | 1,187 | | | | 715 | | | | 2,691 | |
Rescissions / disposals | | | (26 | ) | | | (4 | ) | | | (93 | ) | | | — | | | | (130 | ) | | | (253 | ) |
Exchange variation | | | (285 | ) | | | 22 | | | | (84 | ) | | | — | | | | 6 | | | | (341 | ) |
Other (4) | | | 5 | | | | (29 | ) | | | 40 | | | | — | | | | 20 | | | | 36 | |
Balance at 12/31/2019 | | | 11,158 | | | | 2,518 | | | | 5,899 | | | | 5,716 | | | | 2,971 | | | | 28,262 | |
Amortization | | | | | | | | | | | | | | | | | | | | | | | | |
Balance at 12/31/2018 | | | (26 | ) | | | (867 | ) | | | (2,501 | ) | | | (1,823 | ) | | | (1,015 | ) | | | (6,232 | ) |
Amortization expense (3) | | | — | | | | (218 | ) | | | (675 | ) | | | (674 | ) | | | (332 | ) | | | (1,899 | ) |
Rescissions / disposals | | | 26 | | | | 4 | | | | 28 | | | | — | | | | 130 | | | | 188 | |
Exchange variation | | | — | | | | (5 | ) | | | 45 | | | | — | | | | (13 | ) | | | 27 | |
Other (4) | | | — | | | | 29 | | | | (103 | ) | | | — | | | | (12 | ) | | | (86 | ) |
Balance at 12/31/2019 | | | — | | | | (1,057 | ) | | | (3,206 | ) | | | (2,497 | ) | | | (1,242 | ) | | | (8,002 | ) |
Impairment (Note 2.4h) | | | | | | | | | | | | | | | | | | | | | | | | |
Balance at 12/31/2018 | | | — | | | | — | | | | (225 | ) | | | (343 | ) | | | — | | | | (568 | ) |
Incresase | | | — | | | | — | | | | (4 | ) | | | (27 | ) | | | — | | | | (31 | ) |
Disposals | | | — | | | | — | | | | 58 | | | | — | | | | — | | | | 58 | |
Balance at 12/31/2019 | | | — | | | | — | | | | (171 | ) | | | (370 | ) | | | — | | | | (541 | ) |
Book value | | | | | | | | | | | | | | | | | | | | | | | | |
Balance at 12/31/2019 | | | 11,158 | | | | 1,461 | | | | 2,522 | | | | 2,849 | | | | 1,729 | | | | 19,719 | |
| (1) | The contractual commitments for the purchase of the new intangible assets totaled R$ 273, achievable by 2020. |
| (2) | Includes amounts paid for acquisition of rights to provide services of payment of salaries, proceeds, retirement and pension benefits and similar benefits. |
| (3) | Amortization expenses related to the rights for acquisition of payrolls and associations, in the amount of R$ (519) (R$ (452) from 01/01 to 12/31/2018) are disclosed in the General and administrative expenses (Note 23). |
| (4) | Includes the total amount of R$ 3 related to the hyperinflationary adjustment for Argentina. |
| | |
| Itaú Unibanco Holding S.A. – Complete Financial Statements in IFRS – December 31, 2020 | | F-63 |
ITAÚ UNIBANCO HOLDING S.A.
Notes to the Consolidated Financial Statements
At 12/31/2020 and 12/31/2019 for balance sheet accounts and
From 01/01 to 12/31 of 2020, 2019 and 2018 for income statement accounts
(In millions of Reais, except information per share)
Note 15 – Deposits
| | | | | | | | | | | | | | | | | | | | | | | | |
| | | 12/31/2020 | | | 12/31/2019 | |
| | Current | | | Non-current | | | Total | | | Current | | | Non-current | | | Total | |
Interest-bearing deposits | | | 376,139 | | | | 297,995 | | | | 674,134 | | | | 251,882 | | | | 172,863 | | | | 424,745 | |
Savings deposits | | | 179,470 | | | | — | | | | 179,470 | | | | 144,558 | | | | — | | | | 144,558 | |
Interbank deposits | | | 3,185 | | | | 245 | | | | 3,430 | | | | 2,866 | | | | 155 | | | | 3,021 | |
Time deposits | | | 193,484 | | | | 297,750 | | | | 491,234 | | | | 104,458 | | | | 172,708 | | | | 277,166 | |
Non-interest bearing deposits | | | 134,876 | | | | — | | | | 134,876 | | | | 82,315 | | | | — | | | | 82,315 | |
Demand deposits | | | 134,805 | | | | — | | | | 134,805 | | | | 82,306 | | | | — | | | | 82,306 | |
Others deposits | | | 71 | | | | — | | | | 71 | | | | 9 | | | | — | | | | 9 | |
Total | | | 511,015 | | | | 297,995 | | | | 809,010 | | | | 334,197 | | | | 172,863 | | | | 507,060 | |
Note 16 – Financial liabilities designated at fair value through profit or loss
| | | | | | | | | | | | | | | | | | | | | | | | |
| | | 12/31/2020 | | | 12/31/2019 | |
| | Current | | | Non-current | | | Total | | | Current | | | Non-current | | | Total | |
Structured notes | | | | | | | | | | | | | | | | | | | | | | | | |
Shares | | | — | | | | — | | | | — | | | | 11 | | | | — | | | | 11 | |
Debt securities | | | 11 | | | | 132 | | | | 143 | | | | 38 | | | | 152 | | | | 190 | |
| | | | | | | | | | | | | | | | | | | | | | | | |
Total | | | 11 | | | | 132 | | | | 143 | | | | 49 | | | | 152 | | | | 201 | |
| | | | | | | | | | | | | | | | | | | | | | | | |
The effect of credit risk of these instruments is not significant at 12/31/2020 and 12/31/2019.
Shares and debt securities do not have a defined amount on maturity, since they vary according to stock market quotation and an exchange variation component, respectively.
| | |
| Itaú Unibanco Holding S.A. – Complete Financial Statements in IFRS – December 31, 2020 | | F-64 |
ITAÚ UNIBANCO HOLDING S.A.
Notes to the Consolidated Financial Statements
At 12/31/2020 and 12/31/2019 for balance sheet accounts and
From 01/01 to 12/31 of 2020, 2019 and 2018 for income statement accounts
(In millions of Reais, except information per share)
Note 17 – Securities sold under repurchase agreements and interbank and institutional market funds
| a) | Securities sold under repurchase agreements |
The table below shows the breakdown of funds:
| | | | | | | | | | | | | | | | | | | | | | | | | | |
| | | | | 12/31/2020 | | | 12/31/2019 | |
| | | Interest rate (p.a.) | | Current | | | Non-
current | | | Total | | | Current | | | Non-
current | | | Total | |
Assets pledged as collateral | | | | | 45,961 | | | | 564 | | | | 46,525 | | | | 67,065 | | | | 2,696 | | | | 69,761 | |
Government securities | | 1.70% to 1.90% | | | 22,088 | | | | — | | | | 22,088 | | | | 46,271 | | | | — | | | | 46,271 | |
Corporate securities | | 45% of CDI to 98.5% of CDI | | | 20,773 | | | | — | | | | 20,773 | | | | 17,665 | | | | — | | | | 17,665 | |
Own issue | | 100% of Selic to 16.40% | | | 1,965 | | | | 20 | | | | 1,985 | | | | 2,831 | | | | 2,427 | | | | 5,258 | |
Foreign | | 0.03% to 2.20% | | | 1,135 | | | | 544 | | | | 1,679 | | | | 298 | | | | 269 | | | | 567 | |
Assets received as collateral | | 1.38% to 1.90% | | | 151,370 | | | | — | | | | 151,370 | | | | 140,004 | | | | — | | | | 140,004 | |
Right to sell or repledge the collateral | | 0.01% to 10.0% | | | 27,851 | | | | 47,618 | | | | 75,469 | | | | 16,807 | | | | 30,011 | | | | 46,818 | |
| | | | | | | | | | | | | | | | | | | | | | | | | | |
Total | | | | | 225,182 | | | | 48,182 | | | | 273,364 | | | | 223,876 | | | | 32,707 | | | | 256,583 | |
| | | | | | | | | | | | | | | | | | | | | | | | | | |
| | | | | | | | | | | | | | | | | | | | | | | | | | |
| | | | | 12/31/2020 | | | 12/31/2019 | |
| | | Interest rate (p.a.) | | Current | | | Non-
current | | | Total | | | Current | | | Non-
current | | | T otal | |
Financial bills | | 2.76% to 29.34% | | | 21,898 | | | | 21,691 | | | | 43,589 | | | | 20,829 | | | | 44,604 | | | | 65,433 | |
Real state credit bills | | 1.65% to 11.83% | | | 2,600 | | | | 1,605 | | | | 4,205 | | | | 6,194 | | | | 1,441 | | | | 7,635 | |
Agribusiness credit bills | | 1.39% to 14.30% | | | 10,166 | | | | 4,119 | | | | 14,285 | | | | 14,543 | | | | 6,661 | | | | 21,204 | |
Guaranteed real state notes | | 2.62% to 9.43% | | | 437 | | | | 10,592 | | | | 11,029 | | | | — | | | | 4,320 | | | | 4,320 | |
Import and export financing | | 0% to 9.60% | | | 56,148 | | | | 15,322 | | | | 71,470 | | | | 59,810 | | | | 4,812 | | | | 64,622 | |
On-lending-domestic | | 0% to 18% | | | 3,672 | | | | 7,785 | | | | 11,457 | | | | 3,863 | | | | 7,785 | | | | 11,648 | |
| | | | | | | | | | | | | | | | | | | | | | | | | | |
Total | | | | | 94,921 | | | | 61,114 | | | | 156,035 | | | | 105,239 | | | | 69,623 | | | | 174,862 | |
| | | | | | | | | | | | | | | | | | | | | | | | | | |
Funding for import and export financing represents credit facilities available for financing of imports and exports of Brazilian companies, in general denominated in foreign currency.
| c) | Institutional market funds |
| | | | | | | | | | | | | | | | | | | | | | | | | | |
| | | | | 12/31/2020 | | | 12/31/2019 | |
| | | Interest rate (p.a.) | | Current | | | Non-
current | | | Total | | | Current | | | Non-
current | | | Total | |
Subordinated debt (1) | | LIBOR to IGPM + 4.63% | | | 12,125 | | | | 62,791 | | | | 74,916 | | | | 4,098 | | | | 55,364 | | | | 59,462 | |
Obligations on securities abroad | | (0.05%) to 29.75% | | | 6,636 | | | | 55,797 | | | | 62,433 | | | | 9,162 | | | | 34,510 | | | | 43,672 | |
Raisings through Structured Operations Certificates (2) | | 1.41% to 11.12% | | | 578 | | | | 381 | | | | 959 | | | | 575 | | | | 535 | | | | 1,110 | |
| | | | | | | | | | | | | | | | | | | | | | | | | | |
Total | | | | | 19,339 | | | | 118,969 | | | | 138,308 | | | | 13,835 | | | | 90,409 | | | | 104,244 | |
| | | | | | | | | | | | | | | | | | | | | | | | | | |
| (1) | At 12/31/2020, the amount of R$ 41,000 (R$ 36,627 at 12/31/2019) is included in the Reference Equity, under the proportion defined by CMN Resolution No. 4,192, on March 01, 2013. |
| (2) | At 12/31/2020, the fair value of raisings through Structured Operations Certificates issued is R$ 1,018 (R$ 1,204 at 12/31/2019). |
| | |
| Itaú Unibanco Holding S.A. – Complete Financial Statements in IFRS – December 31, 2020 | | F-65 |
ITAÚ UNIBANCO HOLDING S.A.
Notes to the Consolidated Financial Statements
At 12/31/2020 and 12/31/2019 for balance sheet accounts and
From 01/01 to 12/31 of 2020, 2019 and 2018 for income statement accounts
(In millions of Reais, except information per share)
Note 18 - Other assets and liabilities
| | | | | | | | | | | | | | | | | | | | | | | | |
| | | 12/31/2020 | | | 12/31/2019 | |
| | Current | | | Non-
current | | | Total | | | Current | | | Non-
current | | | Total | |
Financial | | | 81,144 | | | | 12,117 | | | | 93,261 | | | | 87,498 | | | | 7,254 | | | | 94,752 | |
At Amortized Cost | | | 81,138 | | | | 12,117 | | | | 93,255 | | | | 87,498 | | | | 7,254 | | | | 94,752 | |
Receivables from credit card issuers | | | 43,511 | | | | — | | | | 43,511 | | | | 42,395 | | | | — | | | | 42,395 | |
Deposits in guarantee for contingent liabilities, provisions and legal obligations (Note 29e) | | | 1,338 | | | | 11,355 | | | | 12,693 | | | | 7,990 | | | | 6,530 | | | | 14,520 | |
Trading and intermediation of securities | | | 28,021 | | | | 233 | | | | 28,254 | | | | 26,544 | | | | 207 | | | | 26,751 | |
Income receivable | | | 2,941 | | | | 38 | | | | 2,979 | | | | 3,236 | | | | — | | | | 3,236 | |
Operations without credit granting characteristics, net of provisions | | | 2,995 | | | | 481 | | | | 3,476 | | | | 3,612 | | | | 5 | | | | 3,617 | |
Insurance and reinsurance operations | | | 1,312 | | | | 10 | | | | 1,322 | | | | 836 | | | | 511 | | | | 1,347 | |
Net amount receivables from reimbursement of provisions (Note 29d) | | | 919 | | | | — | | | | 919 | | | | 978 | | | | — | | | | 978 | |
Deposits in guarantee of fund raisings abroad | | | 101 | | | | — | | | | 101 | | | | 1,864 | | | | 1 | | | | 1,865 | |
Other | | | — | | | | — | | | | — | | | | 43 | | | | — | | | | 43 | |
At Fair Value Through Profit or Loss | | | 6 | | | | — | | | | 6 | | | | — | | | | — | | | | — | |
Other financial assets | | | 6 | | | | — | | | | 6 | | | | — | | | | — | | | | — | |
Non-financial | | | 9,175 | | | | 6,598 | | | | 15,773 | | | | 9,323 | | | | 5,368 | | | | 14,691 | |
Sundry foreign | | | 713 | | | | 4 | | | | 717 | | | | 639 | | | | 7 | | | | 646 | |
Prepaid expenses | | | 3,230 | | | | 1,174 | | | | 4,404 | | | | 3,288 | | | | 1,038 | | | | 4,326 | |
Sundry domestic | | | 2,552 | | | | 3 | | | | 2,555 | | | | 2,916 | | | | 9 | | | | 2,925 | |
Assets of post-employment benefit plans (Note 26e) | | | — | | | | 585 | | | | 585 | | | | — | | | | 717 | | | | 717 | |
Lease right-of-use | | | 76 | | | | 4,832 | | | | 4,908 | | | | 211 | | | | 3,597 | | | | 3,808 | |
Other | | | 2,604 | | | | — | | | | 2,604 | | | | 2,269 | | | | — | | | | 2,269 | |
| | | | | | | | | | | | | | | | | | | | | | | | |
| | | 12/31/2020 | | | 12/31/2019 | |
| | | Current | | | Non-
current | | | Total | | | Current | | | Non-
current | | | Total | |
Financial | | | 112,745 | | | | 6,184 | | | | 118,929 | | | | 113,092 | | | | 3,989 | | | | 117,081 | |
At Amortized Cost | | | 112,740 | | | | 6,184 | | | | 118,924 | | | | 113,092 | | | | 3,989 | | | | 117,081 | |
Credit card operations | | | 92,580 | | | | — | | | | 92,580 | | | | 87,361 | | | | — | | | | 87,361 | |
Trading and intermediation of securities | | | 14,995 | | | | 126 | | | | 15,121 | | | | 18,062 | | | | 65 | | | | 18,127 | |
Foreign exchange portfolio | | | 859 | | | | — | | | | 859 | | | | 1,245 | | | | — | | | | 1,245 | |
Finance leases | | | 49 | | | | 5,020 | | | | 5,069 | | | | 207 | | | | 3,924 | | | | 4,131 | |
Other | | | 4,257 | | | | 1,038 | | | | 5,295 | | | | 6,217 | | | | — | | | | 6,217 | |
At Fair Value Through Profit or Loss | | | 5 | | | | — | | | | 5 | | | | — | | | | — | | | | — | |
Other financial liabilities | | | 5 | | | | — | | | | 5 | | | | — | | | | — | | | | — | |
Non-financial | | | 35,248 | | | | 3,263 | | | | 38,511 | | | | 26,275 | | | | 2,063 | | | | 28,338 | |
Funds in transit | | | 15,944 | | | | 127 | | | | 16,071 | | | | 10,573 | | | | 11 | | | | 10,584 | |
Charging and collection of taxes and similar | | | 339 | | | | — | | | | 339 | | | | 335 | | | | — | | | | 335 | |
Social and statutory | | | 6,201 | | | | 558 | | | | 6,759 | | | | 5,057 | | | | 32 | | | | 5,089 | |
Deferred income | | | 3,201 | | | | — | | | | 3,201 | | | | 2,686 | | | | — | | | | 2,686 | |
Sundry domestic | | | 2,957 | | | | 66 | | | | 3,023 | | | | 2,118 | | | | 79 | | | | 2,197 | |
Personnel provision | | | 1,609 | | | | 291 | | | | 1,900 | | | | 1,569 | | | | 75 | | | | 1,644 | |
Provision for sundry payments | | | 2,506 | | | | 70 | | | | 2,576 | | | | 1,761 | | | | 63 | | | | 1,824 | |
Obligations on official agreements and rendering of payment services | | | 1,326 | | | | — | | | | 1,326 | | | | 1,114 | | | | — | | | | 1,114 | |
Liabilities from post-employment benefit plans (Note 26e) | | | — | | | | 2,083 | | | | 2,083 | | | | — | | | | 1,746 | | | | 1,746 | |
Other | | | 1,165 | | | | 68 | | | | 1,233 | | | | 1,062 | | | | 57 | | | | 1,119 | |
| | |
| Itaú Unibanco Holding S.A. – Complete Financial Statements in IFRS – December 31, 2020 | | F-66 |
ITAÚ UNIBANCO HOLDING S.A.
Notes to the Consolidated Financial Statements
At 12/31/2020 and 12/31/2019 for balance sheet accounts and
From 01/01 to 12/31 of 2020, 2019 and 2018 for income statement accounts
(In millions of Reais, except information per share)
Note 19 – Stockholders’ equity
Capital is represented by 9,804,135,348 book-entry shares with no par value, of which 4,958,290,359 are common shares and 4,845,844,989 are preferred shares with no voting rights, but with tag-along rights in a public offering of shares, in an eventual transfer of control, assuring them a price equal to eighty per cent (80%) of the amount paid per voting share in the controlling block, and a dividend at least equal to that of the common shares.
The breakdown and change in shares of paid-in capital in the beginning and end of the period are shown below:
| | | | | | | | | | | | | | | | |
| | | 12/31/2020 | |
| | | Number | | | | |
| | | Common | | | Preferred | | | Total | | | Amount | |
Residents in Brazil at 12/31/2019 | | | 4,931,023,416 | | | | 1,665,657,332 | | | | 6,596,680,748 | | | | 65,366 | |
Residents abroad at 12/31/2019 | | | 27,266,943 | | | | 3,180,187,657 | | | | 3,207,454,600 | | | | 31,782 | |
| | | | | | | | | | | | | | | | |
Shares of capital stock at 12/31/2019 | | | 4,958,290,359 | | | | 4,845,844,989 | | | | 9,804,135,348 | | | | 97,148 | |
Shares of capital stock at 12/31/2020 | | | 4,958,290,359 | | | | 4,845,844,989 | | | | 9,804,135,348 | | | | 97,148 | |
| | | | | | | | | | | | | | | | |
Residents in Brazil at 12/31/2020 | | | 4,929,824,281 | | | | 1,820,159,657 | | | | 6,749,983,938 | | | | 66,885 | |
Residents abroad at 12/31/2020 | | | 28,466,078 | | | | 3,025,685,332 | | | | 3,054,151,410 | | | | 30,263 | |
Treasury shares at 12/31/2019 (1) | | | — | | | | 58,533,585 | | | | 58,533,585 | | | | (1,274 | ) |
Result from delivery of treasury shares | | | — | | | | (16,855,133 | ) | | | (16,855,133 | ) | | | 367 | |
Treasury shares at 12/31/2020 (1) | | | — | | | | 41,678,452 | | | | 41,678,452 | | | | (907 | ) |
| | | | | | | | | | | | | | | | |
Outstanding shares at 12/31/2020 | | | 4,958,290,359 | | | | 4,804,166,537 | | | | 9,762,456,896 | | | | | |
Outstanding shares at 12/31/2019 | | | 4,958,290,359 | | | | 4,787,311,404 | | | | 9,745,601,763 | | | | | |
| | | | | | | | | | | | | | | | |
| | | | | | | | | | | | | | | | |
| | | 12/31/2019 | |
| | | Number | | | | |
| | | Common | | | Preferred | | | Total | | | Amount | |
Residents in Brazil at 12/31/2018 | | | 4,928,076,320 | | | | 1,609,055,166 | | | | 6,537,131,486 | | | | 64,776 | |
Residents abroad at 12/31/2018 | | | 30,214,039 | | | | 3,236,789,823 | | | | 3,267,003,862 | | | | 32,372 | |
| | | | | | | | | | | | | | | | |
Shares of capital stock at 12/31/2018 | | | 4,958,290,359 | | | | 4,845,844,989 | | | | 9,804,135,348 | | | | 97,148 | |
Shares of capital stock at 12/31/2019 | | | 4,958,290,359 | | | | 4,845,844,989 | | | | 9,804,135,348 | | | | 97,148 | |
| | | | | | | | | | | | | | | | |
Residents in Brazil at 12/31/2019 | | | 4,931,023,416 | | | | 1,665,657,332 | | | | 6,596,680,748 | | | | 65,366 | |
Residents abroad at 12/31/2019 | | | 27,266,943 | | | | 3,180,187,657 | | | | 3,207,454,600 | | | | 31,782 | |
Treasury shares at 12/31/2018 (1) | | | — | | | | 83,614,426 | | | | 83,614,426 | | | | (1,820 | ) |
Result from delivery of treasury shares | | | — | | | | (25,080,841 | ) | | | (25,080,841 | ) | | | 546 | |
Treasury shares at 12/31/2019 (1) | | | — | | | | 58,533,585 | | | | 58,533,585 | | | | (1,274 | ) |
| | | | | | | | | | | | | | | | |
Outstanding shares at 12/31/2019 | | | 4,958,290,359 | | | | 4,787,311,404 | | | | 9,745,601,763 | | | | | |
Outstanding shares at 12/31/2018 | | | 4,958,290,359 | | | | 4,762,230,563 | | | | 9,720,520,922 | | | | | |
| | | | | | | | | | | | | | | | |
| (1) | Own shares, purchased based on authorization of the Board of Directors, to be held in Treasury for subsequent cancellation of replacement in the market. |
Below is the average cost of treasury shares and their market price in reais. In 2020, there was none acquisition of treasury shares.
| | | | | | | | |
| | | 12/31/2020 | |
Cost / market value | | Common | | | Preferred | |
Average cost | | | — | | | | 21.76 | |
Market value at 12/31/2020 | | | 27.93 | | | | 31.63 | |
| | | | | | | | |
| | | 12/31/2019 | |
Cost / market value | | Common | | | Preferred | |
Average cost | | | — | | | | 21.76 | |
Market value at 12/31/2019 | | | 32.03 | | | | 37.10 | |
| | |
| Itaú Unibanco Holding S.A. – Complete Financial Statements in IFRS – December 31, 2020 | | F-67 |
ITAÚ UNIBANCO HOLDING S.A.
Notes to the Consolidated Financial Statements
At 12/31/2020 and 12/31/2019 for balance sheet accounts and
From 01/01 to 12/31 of 2020, 2019 and 2018 for income statement accounts
(In millions of Reais, except information per share)
Shareholders are entitled to a mandatory minimum dividend in each fiscal year, corresponding to 25% of adjusted net income, as set forth in the Bylaws. Common and preferred shares participate equally in income distributed, after common shares have received dividends equal to the minimum annual priority dividend payable to preferred shares (R$ 0.022 non-cumulative per share).
ITAÚ UNIBANCO HOLDING monthly advances the mandatory minimum dividend, using the share position of the last day of the previous month as the calculation basis, and the payment made on the first business day of the subsequent month in the amount of R$ 0.015 per share.
l - Calculation of dividends and interest on capital
| | | | | | | | | | | | |
| | | 12/31/2020 | | | 12/31/2019 | | | 12/31/2018 | |
Statutory net income | | | 18,961 | | | | 26,712 | | | | 21,945 | |
Adjustments: | | | | | | | | | | | | |
(-) Legal reserve - 5% | | | (948 | ) | | | (1,336 | ) | | | (1,097 | ) |
Dividend calculation basis | | | 18,013 | | | | 25,376 | | | | 20,848 | |
Minimun mandatory dividend - 25% | | | 4,503 | | | | 6,344 | | | | 5,212 | |
Dividends and Interest on Capital Paid / Accrued | | | 4,503 | | | | 18,777 | | | | 22,437 | |
ll - Stockholders’ compensation
| | | | | | | | | | | | | | | | |
| | | 12/31/2020 | |
| | | Gross value
per share (R$) | | | Value | | | WHT (With
holding
tax) | | | Net | |
Paid / Prepaid | | | | | | | 2,127 | | | | (78 | ) | | | 2,049 | |
Dividends - 11 monthly installments paid from February to
December 2020 | | | 0.0150 | | | | 1,610 | | | | — | | | | 1,610 | |
Interest on capital - paid on 08/26/2020 | | | 0.0450 | | | | 517 | | | | (78 | ) | | | 439 | |
Accrued (Recorded in Other Liabilities) | | | | | | | 2,861 | | | | (407 | ) | | | 2,454 | |
Dividends - 1 monthly installment paid on 01/04/2021 | | | 0.0150 | | | | 146 | | | | — | | | | 146 | |
Interest on capital - credited on December 17, 2020 to be paid until
April 30, 2021 | | | 0.0544 | | | | 624 | | | | (93 | ) | | | 531 | |
Interest on capital - credited on January 28, 2021 to be paid until
April 30, 2021 | | | 0.0426 | | | | 490 | | | | (74 | ) | | | 416 | |
Dividends or Interest on capital | | | 0.1394 | | | | 1,601 | | | | (240 | ) | | | 1,361 | |
Total from 01/01 to 12/31/2020 | | | | | | | 4,988 | | | | (485 | ) | | | 4,503 | |
| | | | | | | | | | | | | | | | |
| | | 12/31/2019 | |
| | | Gross value
per share (R$) | | | Value | | | WHT (With
holding
tax) | | | Net | |
Paid / Prepaid | | | | | | | 9,274 | | | | — | | | | 9,274 | |
Dividends - 11 monthly installments paid from February to
December 2019 | | | 0.0150 | | | | 1,606 | | | | — | | | | 1,606 | |
Dividends - paid on 08/23/2019 | | | 0.7869 | | | | 7,668 | | | | — | | | | 7,668 | |
Accrued (Recorded in Other Liabilities) | | | | | | | 512 | | | | (55 | ) | | | 457 | |
Dividends - 1 monthly installment paid on 01/02/2020 | | | 0.0150 | | | | 146 | | | | — | | | | 146 | |
Interest on capital - credited on December 19, 2019 to be paid until
April 30, 2020 | | | 0.0376 | | | | 366 | | | | (55 | ) | | | 311 | |
Identified in Profit Reserves In Stockholders’ Equity | | | 1.0067 | | | | 9,811 | | | | (765 | ) | | | 9,046 | |
Total from 01/01 to 12/31/2019 | | | | | | | 19,597 | | | | (820 | ) | | | 18,777 | |
| | | | | | | | | | | | | | | | |
| | | 12/31/2018 | |
| | | Gross value
per share (R$) | | | Gross | | | WHT (With
holding
tax) | | | Net | |
Paid / prepaid | | | | | | | 5,921 | | | | (122 | ) | | | 5,799 | |
Dividends - 11 monthly installments from February to
December 2018 | | | 0.0150 | | | | 1,069 | | | | — | | | | 1,069 | |
Dividends - paid on 08/30/2018 | | | 0.6240 | | | | 4,041 | | | | — | | | | 4,041 | |
Interest on capital - paid on 08/30/2018 | | | 0.1252 | | | | 811 | | | | (122 | ) | | | 689 | |
Accrued (Recorded in Other Liabilities) | | | | | | | 248 | | | | (15 | ) | | | 233 | |
Dividends - 1 monthly installment paid on 01/02/2019 | | | 0.0150 | | | | 145 | | | | — | | | | 145 | |
Interest on capital - credited on December 27, 2018 to be paid until
April 30, 2019 | | | 0.0106 | | | | 103 | | | | (15 | ) | | | 88 | |
Identified in Profit Reserves In Stockholders’ Equity | | | 1.8001 | | | | 17,498 | | | | (1,093 | ) | | | 16,405 | |
Total from 01/01 to 12/31/2018 | | | | | | | 23,667 | | | | (1,230 | ) | | | 22,437 | |
| | |
| Itaú Unibanco Holding S.A. – Complete Financial Statements in IFRS – December 31, 2020 | | F-68 |
ITAÚ UNIBANCO HOLDING S.A.
Notes to the Consolidated Financial Statements
At 12/31/2020 and 12/31/2019 for balance sheet accounts and
From 01/01 to 12/31 of 2020, 2019 and 2018 for income statement accounts
(In millions of Reais, except information per share)
| c) | Capital reserves and profit reserves |
l – Additional paid-in capital
Additional paid-in capital corresponds to: (i) the difference between the sale price of treasury shares and the average cost of such shares, and (ii) the yield expenses recognized in accordance with the stock option plan and variable compensation.
ll – Appropriated reserves
| | | | | | | | | | | | |
| | | 12/31/2020 | | | 12/31/2019 | | | 12/31/2018 | |
Capital reserves | | | 285 | | | | 285 | | | | 285 | |
Premium on subscription of shares | | | 284 | | | | 284 | | | | 284 | |
Reserves from tax incentives, restatement of equity securities and other | | | 1 | | | | 1 | | | | 1 | |
Profit reserves | | | 16,943 | | | | 12,663 | | | | 13,195 | |
Legal (1) | | | 12,274 | | | | 11,326 | | | | 9,989 | |
Statutory (2) | | | 16,186 | | | | 3,043 | | | | (2,775 | ) |
Corporate reorganizations (Note 2.4 a IV) | | | (11,517 | ) | | | (11,517 | ) | | | (11,517 | ) |
Special profit reserves (3) | | | — | | | | 9,811 | | | | 17,498 | |
| | | | | | | | | | | | |
Total reserves at parent company | | | 17,228 | | | | 12,948 | | | | 13,480 | |
| | | | | | | | | | | | |
| (1) | Its purpose is to ensure the integrity of capital, compensate loss or increase capital. |
| (2) | Its main purpose is to ensure the yield flow to shareholders. |
| (3) | Refers to Dividends or Interest on Capital declared after 12/31/2020, 12/31/2019 and 12/31/2018. |
lll - Unappropriated reserves
Refers to balance of net income remaining after the distribution of dividends and appropriations to statutory reserves in the statutory accounts of ITAÚ UNIBANCO HOLDING.
| d) | Non-controlling interests |
| | | | | | | | | | | | | | | | |
| | | Stockholders’ equity | | | Income | |
| | | 12/31/2020 | | | 12/31/2019 | | | 01/01 to
12/31/2020 | | | 01/01 to
12/31/2019 | |
Itaú CorpBanca | | | 9,891 | | | | 11,270 | | | | (4,135 | ) | | | 504 | |
Itaú CorpBanca Colômbia S.A. | | | 491 | | | | 406 | | | | (15 | ) | | | (16 | ) |
Financeira Itaú CBD S.A. Crédito, Financiamento e Investimento | | | 580 | | | | 446 | | | | 164 | | | | 131 | |
Luizacred S.A. Soc. Cred. Financiamento Investimento | | | 385 | | | | 295 | | | | 102 | | | | 20 | |
Other | | | 185 | | | | 123 | | | | 52 | | | | 61 | |
| | | | | | | | | | | | | | | | |
Total | | | 11,532 | | | | 12,540 | | | | (3,832 | ) | | | 700 | |
| | | | | | | | | | | | | | | | |
| | |
| Itaú Unibanco Holding S.A. – Complete Financial Statements in IFRS – December 31, 2020 | | F-69 |
ITAÚ UNIBANCO HOLDING S.A.
Notes to the Consolidated Financial Statements
At 12/31/2020 and 12/31/2019 for balance sheet accounts and
From 01/01 to 12/31 of 2020, 2019 and 2018 for income statement accounts
(In millions of Reais, except information per share)
Note 20 – Share-based payment
ITAÚ UNIBANCO HOLDING and its subsidiaries have share-based payment plans aimed at involving its management members and employees in the medium and long term corporate development process.
The grant of these benefits is only made in years in which there are sufficient profits to permit the distribution of mandatory dividends, limiting dilution to 0.5% of the total shares held by the controlling and minority stockholders at the balance sheet date. These programs are settled through the delivery of ITUB4 treasury shares to stockholders.
Expenses on share-based payment plans are presented in the table below:
| | | | | | | | | | | | |
| | | 01/01 to
12/31/2020 | | | 01/01 to
12/31/2019 | | | 01/01 to
12/31/2018 | |
Partner Plan | | | (241 | ) | | | (242 | ) | | | (226 | ) |
Share-based plan | | | (489 | ) | | | (384 | ) | | | (377 | ) |
| | | | | | | | | | | | |
Total | | | (730 | ) | | | (626 | ) | | | (603 | ) |
| | | | | | | | | | | | |
l – Partner Plan
The program enables employees and managers of ITAÚ UNIBANCO HOLDING to invest a percentage of their bonus to acquire shares and share-based instruments. There is a lockup period of from three to five years, counted from the initial investment date, and the shares are thus subject to market price variations. After complying with the preconditions outlined in the program, beneficiaries are entitled to receive shares as consideration, in accordance with the number of shares indicated in the regulations.
The acquisition price of shares and share-based instruments is established every six months as the average of the share price over the last 30 days, which is performed on the seventh business day prior to the remuneration grant date.
The fair value of the consideration in shares is the market price at the grant date, less expected dividends.
Change in the Partner Program
| | | | | | | | |
| | | 01/01 to
12/31/2020 | | | 01/01 to
12/31/2019 | |
| | | Quantity | | | Quantity | |
Opening balance | | | 39,305,211 | | | | 48,871,182 | |
| | | | | | | | |
New | | | 10,488,126 | | | | 8,096,700 | |
Delivered | | | (11,408,109 | ) | | | (15,627,167 | ) |
Cancelled | | | (2,093,468 | ) | | | (2,035,504 | ) |
| | | | | | | | |
Closing balance | | | 36,291,760 | | | | 39,305,211 | |
| | | | | | | | |
Weighted average of remaining contractual life (years) | | | 1.69 | | | | 1.59 | |
| | | | | | | | |
Market value weighted average (R$) | | | 23.37 | | | | 25.49 | |
| | | | | | | | |
| | |
| Itaú Unibanco Holding S.A. – Complete Financial Statements in IFRS – December 31, 2020 | | F-70 |
ITAÚ UNIBANCO HOLDING S.A.
Notes to the Consolidated Financial Statements
At 12/31/2020 and 12/31/2019 for balance sheet accounts and
From 01/01 to 12/31 of 2020, 2019 and 2018 for income statement accounts
(In millions of Reais, except information per share)
II – Variable compensation
In this plan, 50% of variable compensation of managers is paid in cash and 50% is paid in shares for a period of three years. Shares are delivered on a deferred basis, of which one-third per year, will be contingent upon the executive’s permancence in the institution. The deferred unpaid portions may be reversed proportionally to a significant reduction in the recurring income realized or the negative income for the period.
Management members become eligible for the receipt of these benefits according to individual performance, business performance or both. The benefit amount is established according to the activities of each management member who should meet at least the performance and conduct requirements.
The fair value of the share is the market price at its grant date.
Change in share-based variable compensation
| | | | | | | | |
| | | 01/01 to
12/31/2020 | | | 01/01 to
12/31/2019 | |
| | | Quantity | | | Quantity | |
Opening balance | | | 20,220,934 | | | | 25,016,145 | |
| | | | | | | | |
New | | | 18,329,108 | | | | 9,794,250 | |
Delivered | | | (10,574,321 | ) | | | (14,237,280 | ) |
Cancelled | | | (568,490 | ) | | | (352,181 | ) |
| | | | | | | | |
Closing balance | | | 27,407,231 | | | | 20,220,934 | |
| | | | | | | | |
Market value weighted average (R$) | | | 31.22 | | | | 37.55 | |
| | | | | | | | |
Ill – Stock Option Plan (Simple Options)
ITAÚ UNIBANCO HOLDING had a Stock Option Plan (“Simple Options”), which was discontinued, and the last options were vested in 2019.
Simple options have the following characteristics:
| | a) | Exercise price: calculated as the average prices of shares in the three months of the year prior to the grant date. The prices determined are inflation-adjusted to the last business day of the month prior to the option exercise date in line with the IGP-M inflation index or, in its absence, an index to be determined internally, and must be paid according to the regulations for the settlement of trading on B3. |
| | b) | Vesting period: determined upon issue, from one to seven years, counted from the grant date. The vesting period is normally five years. |
Change in the Simple options plan
| | | | | | | | | | | | | | | | |
| | | 01/01 to 12/31/2020 | | | 01/01 to 12/31/2019 | |
| | | Quantity
| | | Weighted average
exercise price | | | Quantity | | | Weighted average
exercise price | |
Opening balance | | | — | | | | — | | | | 3,089,599 | | | | 22.11 | |
Options vested at the end of the period | | | — | | | | — | | | | 3,089,599 | | | | 22.11 | |
| | | | | | | | | | | | | | | | |
Options: | | | | | | | | | | | | | | | | |
Canceled / Forfeited (*) | | | — | | | | — | | | | (72,318 | ) | | | 24.36 | |
Exercised | | | — | | | | — | | | | (3,017,281 | ) | | | 22.68 | |
| | | | | | | | | | | | | | | | |
Closing balance | | | — | | | | — | | | | — | | | | — | |
Options vested at the end of the period | | | — | | | | — | | | | — | | | | — | |
| | | | | | | | | | | | | | | | |
Range of exercise prices | | | | | | | — | | | | | | | | 22.95 | |
Weighted average of the remaining contractual life (in years) | | | | | | | — | | | | | | | | — | |
| | | | | | | | | | | | | | | | |
Market value weighted average (R$) | | | | | | | — | | | | | | | | 36.34 | |
| | | | | | | | | | | | | | | | |
| (*) | Refers to non-vesting based on the beneficiary’s decision. |
| | |
| Itaú Unibanco Holding S.A. – Complete Financial Statements in IFRS – December 31, 2020 | | F-71 |
ITAÚ UNIBANCO HOLDING S.A.
Notes to the Consolidated Financial Statements
At 12/31/2020 and 12/31/2019 for balance sheet accounts and
From 01/01 to 12/31 of 2020, 2019 and 2018 for income statement accounts
(In millions of Reais, except information per share)
Note 21 - Interest and similar income and expense and net gain (loss)
a) Interest and similar income of financial assets at amortized cost and at fair value through other comprehensive income
| | | | | | | | | | | | |
| | | 01/01 to
12/31/2020 | | | 01/01 to
12/31/2019 | | | 01/01 to
12/31/2018 | |
Compulsory deposits in the Central Bank of Brazil | | | 2,242 | | | | 4,734 | | | | 5,063 | |
Interbank deposits | | | 1,102 | | | | 1,173 | | | | 1,080 | |
Securities purchased under agreements to resell | | | 9,832 | | | | 16,197 | | | | 17,365 | |
Financial assets at fair value through other comprehensive income | | | 16,982 | | | | 10,758 | | | | 9,194 | |
Financial assets at amortized cost | | | 3,629 | | | | 2,582 | | | | 2,614 | |
Loan operations | | | 79,503 | | | | 81,046 | | | | 73,640 | |
Other financial assets | | | (28 | ) | | | 1,033 | | | | 1,368 | |
| | | | | | | | | | | | |
Total | | | 113,262 | | | | 117,523 | | | | 110,324 | |
| | | | | | | | | | | | |
b) Interest and similar expense
| | | | | | | | | | | | |
| | | 01/01 to
12/31/2020 | | | 01/01 to
12/31/2019 | | | 01/01 to
12/31/2018 | |
Deposits | | | (17,478 | ) | | | (18,559 | ) | | | (17,484 | ) |
Securities sold under repurchase agreements | | | (10,690 | ) | | | (20,473 | ) | | | (20,889 | ) |
Interbank market funds | | | (28,878 | ) | | | (13,231 | ) | | | (13,587 | ) |
Institutional market funds | | | (8,400 | ) | | | (6,837 | ) | | | (6,773 | ) |
Financial expense from technical provisions for insurance and private pension | | | (8,121 | ) | | | (16,720 | ) | | | (11,815 | ) |
Other | | | 9 | | | | (138 | ) | | | (64 | ) |
| | | | | | | | | | | | |
Total | | | (73,558 | ) | | | (75,958 | ) | | | (70,612 | ) |
| | | | | | | | | | | | |
c) Adjustment to Fair Value of Financial Assets and Liabilities
| | | | | | | | | | | | |
| | | 01/01 to
12/31/2020 | | | 01/01 to
12/31/2019 | | | 01/01 to
12/31/2018 | |
Financial assets at fair value through profit or loss | | | 319 | | | | 3,628 | | | | (4,110 | ) |
Derivatives (*) | | | (9,393 | ) | | | (70 | ) | | | (260 | ) |
Financial assets designated at fair value through profit or loss | | | (118 | ) | | | (64 | ) | | | (218 | ) |
Financial assets at fair value through other comprehensive income | | | 1,107 | | | | 628 | | | | (254 | ) |
Financial liabilities at fair value through profit or loss | | | (9 | ) | | | — | | | | — | |
Financial liabilities designated at fair value | | | 38 | | | | (24 | ) | | | 8 | |
| | | | | | | | | | | | |
Total | | | (8,056 | ) | | | 4,098 | | | | (4,834 | ) |
| | | | | | | | | | | | |
| (*) | Includes the ineffective derivatives portion related to hedge accounting. |
During the period ended 12/31/2020, ITAÚ UNIBANCO HOLDING recognized R$ (419) of Expected Losses (R$ 1 at 12/31/2019) with loss of R$ (7) for Financial Assets – Fair Value through Other Comprehensive Income and loss of R$ (412) for Financial Assets – Amortized Cost (R$ 993 at 12/31/2019).
| | |
| Itaú Unibanco Holding S.A. – Complete Financial Statements in IFRS – December 31, 2020 | | F-72 |
ITAÚ UNIBANCO HOLDING S.A.
Notes to the Consolidated Financial Statements
At 12/31/2020 and 12/31/2019 for balance sheet accounts and
From 01/01 to 12/31 of 2020, 2019 and 2018 for income statement accounts
(In millions of Reais, except information per share)
Note 22 - Commissions and Banking Fees
| | | | | | | | | | | | |
| | | 01/01 to
12/31/2020 | | | 01/01 to
12/31/2019 | | | 01/01 to
12/31/2018 | |
Credit and debit cards | | | 13,813 | | | | 15,619 | | | | 15,634 | |
Current account services | | | 8,002 | | | | 7,969 | | | | 7,802 | |
Asset management | | | 6,951 | | | | 6,322 | | | | 5,017 | |
Funds | | | 6,316 | | | | 5,702 | | | | 4,470 | |
Consortia | | | 635 | | | | 620 | | | | 547 | |
Credit operations and financial guarantees provided | | | 2,298 | | | | 2,418 | | | | 2,419 | |
Credit operations | | | 964 | | | | 1,048 | | | | 948 | |
Financial guarantees provided | | | 1,334 | | | | 1,370 | | | | 1,471 | |
Collection services | | | 1,897 | | | | 1,831 | | | | 1,770 | |
Advisory services and brokerage | | | 2,891 | | | | 2,509 | | | | 1,632 | |
Custody services | | | 573 | | | | 501 | | | | 435 | |
Other | | | 2,132 | | | | 1,863 | | | | 2,100 | |
| | | | | | | | | | | | |
Total | | | 38,557 | | | | 39,032 | | | | 36,809 | |
| | | | | | | | | | | | |
Note 23 - General and administrative expenses
| | | | | | | | | | | | |
| | | 01/01 to
12/31/2020 | | | 01/01 to
12/31/2019 | | | 01/01 to
12/31/2018 | |
Personnel expenses | | | (25,158 | ) | | | (28,415 | ) | | | (24,846 | ) |
Compensation | | | (10,212 | ) | | | (9,548 | ) | | | (10,226 | ) |
Employees’ profit sharing | | | (4,224 | ) | | | (5,183 | ) | | | (4,425 | ) |
Welfare benefits | | | (4,059 | ) | | | (3,856 | ) | | | (3,764 | ) |
Provision for labor claims and dismissals | | | (2,922 | ) | | | (5,640 | ) | | | (2,907 | ) |
Payroll charges | | | (3,330 | ) | | | (3,276 | ) | | | (3,011 | ) |
Share-based payment (Note 20) | | | (241 | ) | | | (242 | ) | | | (226 | ) |
Training | | | (107 | ) | | | (178 | ) | | | (253 | ) |
Other | | | (63 | ) | | | (492 | ) | | | (34 | ) |
Administrative expenses | | | (16,904 | ) | | | (15,912 | ) | | | (17,268 | ) |
Third party services | | | (5,148 | ) | | | (4,571 | ) | | | (4,482 | ) |
Data processing and telecommunications | | | (3,983 | ) | | | (4,278 | ) | | | (4,273 | ) |
Installations | | | (2,005 | ) | | | (2,068 | ) | | | (3,306 | ) |
Advertising, promotions and publicity | | | (1,095 | ) | | | (1,325 | ) | | | (1,419 | ) |
Financial services expenses | | | (915 | ) | | | (798 | ) | | | (790 | ) |
Security | | | (730 | ) | | | (744 | ) | | | (754 | ) |
Transportation | | | (347 | ) | | | (364 | ) | | | (350 | ) |
Materials | | | (321 | ) | | | (330 | ) | | | (339 | ) |
Travel expenses | | | (84 | ) | | | (240 | ) | | | (232 | ) |
Other (1) | | | (2,276 | ) | | | (1,194 | ) | | | (1,323 | ) |
Depreciation and Amortization | | | (5,064 | ) | | | (4,630 | ) | | | (3,332 | ) |
Other expenses | | | (17,081 | ) | | | (12,055 | ) | | | (12,092 | ) |
Selling – credit cards | | | (4,391 | ) | | | (4,958 | ) | | | (4,285 | ) |
Claims losses | | | (778 | ) | | | (825 | ) | | | (675 | ) |
Loss on sale of other assets, fixed assets and investments in associates and joint ventures | | | (683 | ) | | | (719 | ) | | | (632 | ) |
Provision for lawsuits civil (Note 29) | | | (1,080 | ) | | | (848 | ) | | | (464 | ) |
Provision for tax and social security lawsuits | | | (191 | ) | | | (1,898 | ) | | | (328 | ) |
Refund of interbank costs | | | (270 | ) | | | (307 | ) | | | (272 | ) |
Impairment (2) | | | (6,201 | ) | | | (233 | ) | | | (168 | ) |
Other | | | (3,487 | ) | | | (2,267 | ) | | | (5,268 | ) |
| | | | | | | | | | | | |
Total | | | (64,207 | ) | | | (61,012 | ) | | | (57,538 | ) |
| | | | | | | | | | | | |
| (1) | At 12/31/2020 comprises R$ (1,047) related to donations for the initiative “Todos pela Saúde” (All for Health) (Note 33a). |
| (2) | The effects of impairment of goodwill and intangible assets of Itaú Corpbanca, net of tax effects and ownership interest of non-controlling shareholders total R$ (1,452). |
| | |
| Itaú Unibanco Holding S.A. – Complete Financial Statements in IFRS – December 31, 2020 | | F-73 |
ITAÚ UNIBANCO HOLDING S.A.
Notes to the Consolidated Financial Statements
At 12/31/2020 and 12/31/2019 for balance sheet accounts and
From 01/01 to 12/31 of 2020, 2019 and 2018 for income statement accounts
(In millions of Reais, except information per share)
Note 24 – Taxes
ITAÚ UNIBANCO HOLDING and each one of its subsidiaries calculate separately, in each fiscal year, Income Tax and Social Contribution on Net Income.
Taxes are calculated at the rates shown below and consider, for effects of respective calculation bases, the legislation in force applicable to each charge.
| | | | |
Income tax | | | 15.00 | % |
Additional income tax | | | 10.00 | % |
Social contribution on net income (*) | | | 20.00 | % |
| (*) | Constitutional Amendment (EC) No. 103/2019: disseminated on November 12, 2019, it provides for the Social Security and other matters, also addressing the increase of the tax rate of Social Contribution on Net Income for banks set forth in item I of paragraph 1 of article 1 of Supplementary Law No. 105, of January 10, 2001, that was changed to 20% as from March 1, 2020. For the other financial subsidiaries and equivalent companies, the tax rate remains at 15%, and for the non-financial ones at 9%. |
a) Expenses for taxes and contributions
Breakdown of income tax and social contribution calculation:
| | | | | | | | | | | | |
Due on operations for the period | | 01/01 to
12/31/2020 | | | 01/01 to
12/31/2019 | | | 01/01 to
12/31/2018 | |
Income / (loss) before income tax and social contribution | | | 5,230 | | | | 31,243 | | | | 30,608 | |
Charges (income tax and social contribution) at the rates in effect | | | (2,354 | ) | | | (12,497 | ) | | | (13,774 | ) |
Increase / decrease in income tax and social contribution charges arising from: | | | | | | | | | | | | |
Share of profit or (loss) of associates and joint ventures | | | 384 | | | | 614 | | | | 403 | |
Foreign exchange variation on investments abroad | | | 7,201 | | | | 711 | | | | 4,381 | |
Interest on capital | | | 2,765 | | | | 3,012 | | | | 3,791 | |
Corporate reorganizations (Note 2.4 a IV) | | | — | | | | — | | | | 628 | |
Other nondeductible expenses net of non taxable income (*) | | | (16,651 | ) | | | (932 | ) | | | 2,007 | |
Income tax and social contribution expenses | | | (8,655 | ) | | | (9,092 | ) | | | (2,564 | ) |
Related to temporary differences | | | | | | | | |
Increase / (reversal) for the period | | | 18,489 | | | | 5,750 | | | | (2,650 | ) |
Increase / (reversal) of prior periods | | | — | | | | (88 | ) | | | 245 | |
(Expenses) / Income from deferred taxes | | | 18,489 | | | | 5,662 | | | | (2,405 | ) |
| | | | | | | | | | | | |
Total income tax and social contribution expenses | | | 9,834 | | | | (3,430 | ) | | | (4,969 | ) |
| | | | | | | | | | | | |
| (*) | Includes temporary (additions) and exclusions. |
| | |
| Itaú Unibanco Holding S.A. – Complete Financial Statements in IFRS – December 31, 2020 | | F-74 |
ITAÚ UNIBANCO HOLDING S.A.
Notes to the Consolidated Financial Statements
At 12/31/2020 and 12/31/2019 for balance sheet accounts and
From 01/01 to 12/31 of 2020, 2019 and 2018 for income statement accounts
(In millions of Reais, except information per share)
b) Deferred taxes
I - The deferred tax asset balance and its changes, segregated based on its origin and disbursements, are represented by:
| | | | | | | | | | | | | | | | |
| | | 12/31/2019 | | | Realization /
Reversal | | | Increase | | | 12/31/2020 | |
Reflected in income | | | 43,380 | | | | (12,631 | ) | | | 29,499 | | | | 60,248 | |
Provision for expected loss | | | 22,860 | | | | (3,885 | ) | | | 8,958 | | | | 27,933 | |
Related to tax losses and social contribution loss carryforwards | | | 2,585 | | | | (540 | ) | | | 3,483 | | | | 5,528 | |
Provision for profit sharing | | | 2,162 | | | | (2,162 | ) | | | 1,903 | | | | 1,903 | |
Provision for devaluation of securities with permanent impairment | | | 1,530 | | | | (877 | ) | | | 917 | | | | 1,570 | |
Provisions | | | 6,208 | | | | (2,064 | ) | | | 1,701 | | | | 5,845 | |
| | | | | | | | | | | | | | | | |
Civil lawsuits | | | 1,413 | | | | (547 | ) | | | 465 | | | | 1,331 | |
Labor claims | | | 3,251 | | | | (1,338 | ) | | | 1,143 | | | | 3,056 | |
Tax and social security lawsuits | | | 1,544 | | | | (179 | ) | | | 93 | | | | 1,458 | |
Legal obligations | | | 723 | | | | (7 | ) | | | 58 | | | | 774 | |
Adjustments of operations carried out on the futures settlement market | | | 84 | | | | (84 | ) | | | 52 | | | | 52 | |
Adjustment to Fair Value of Financial Assets – At Fair Value Through Profit or Loss | | | 738 | | | | (738 | ) | | | 8,315 | | | | 8,315 | |
Provision relating to health insurance operations | | | 348 | | | | — | | | | 8 | | | | 356 | |
Other | | | 6,142 | | | | (2,274 | ) | | | 4,104 | | | | 7,972 | |
Reflected in stockholders’ equity | | | 2,354 | | | | (1,191 | ) | | | 212 | | | | 1,375 | |
Adjustment to Fair Value of Financial Assets – At Fair Value Through Other Comprehensive Income | | | 766 | | | | (762 | ) | | | 56 | | | | 60 | |
Cash flow hedge | | | 1,187 | | | | (429 | ) | | | — | | | | 758 | |
Other | | | 401 | | | | — | | | | 156 | | | | 557 | |
| | | | | | | | | | | | | | | | |
Total (1)(2) | | | 45,734 | | | | (13,822 | ) | | | 29,711 | | | | 61,623 | |
| | | | | | | | | | | | | | | | |
| (1) | Deferred income tax and social contribution assets and liabilities are recorded in the balance sheet offset by a taxable entity and amounting to R$ 56,583 and R$ 421, respectively. |
| (2) | The accounting records of deferred tax assets on income tax losses and/or social contribution loss carryforwards, as well as those arising from temporary differences, are based on technical feasibility studies which consider the expected generation of future taxable income, considering the history of profitability for each subsidiary individually, and for the consolidated taken as a whole. |
| | | | | | | | | | | | | | | | |
| | | 12/31/2018 | | | Realization /
Reversal | | | Increase | | | 12/31/2019 | |
Reflected in income | | | 37,252 | | | | (13,667 | ) | | | 19,795 | | | | 43,380 | |
Provision for expected loss | | | 18,563 | | | | (4,712 | ) | | | 9,009 | | | | 22,860 | |
Related to tax losses and social contribution loss carryforwards | | | 4,391 | | | | (2,339 | ) | | | 533 | | | | 2,585 | |
Provision for profit sharing | | | 1,844 | | | | (1,844 | ) | | | 2,162 | | | | 2,162 | |
Provision for devaluation of securities with permanent impairment | | | 1,729 | | | | (902 | ) | | | 703 | | | | 1,530 | |
Provisions | | | 4,464 | | | | (1,552 | ) | | | 3,296 | | | | 6,208 | |
| | | | | | | | | | | | | | | | |
Civil lawsuits | | | 1,586 | | | | (651 | ) | | | 478 | | | | 1,413 | |
Labor claims | | | 2,037 | | | | (790 | ) | | | 2,004 | | | | 3,251 | |
Tax and social security lawsuits | | | 841 | | | | (111 | ) | | | 814 | | | | 1,544 | |
Goodwill on purchase of investments | | | 60 | | | | (60 | ) | | | — | | | | — | |
Legal obligations | | | 676 | | | | (57 | ) | | | 104 | | | | 723 | |
Adjustments of operations carried out in futures settlement market | | | 98 | | | | (98 | ) | | | 84 | | | | 84 | |
Adjustment to Fair Value of Financial Assets – At Fair Value Through Profit or Loss | | | 631 | | | | (631 | ) | | | 738 | | | | 738 | |
Provision relating to health insurance operations | | | 343 | | | | — | | | | 5 | | | | 348 | |
Other | | | 4,453 | | | | (1,472 | ) | | | 3,161 | | | | 6,142 | |
Reflected in stockholders’ equity | | | 1,888 | | | | (509 | ) | | | 975 | | | | 2,354 | |
Adjustment to Fair Value of Financial Assets – At Fair Value Through Other Comprehensive Income | | | 383 | | | | (163 | ) | | | 546 | | | | 766 | |
Cash flow hedge | | | 1,149 | | | | (93 | ) | | | 131 | | | | 1,187 | |
Other | | | 356 | | | | (253 | ) | | | 298 | | | | 401 | |
| | | | | | | | | | | | | | | | |
Total (1) (2) | | | 39,140 | | | | (14,176 | ) | | | 20,770 | | | | 45,734 | |
| | | | | | | | | | | | | | | | |
| (1) | Deferred income tax and social contribution assets and liabilities are recorded in the balance sheet offset by a taxable entity and amounting to R$ 38,914 and R$ 1,058, respectively. |
| (2) | At 12/31/2019, deferred tax asset balance comprised its annual revaluation and effects caused by EC 103/2019 in tax rate of the Social Contribution on Net Income, which was increased from 15% to 20%, reaching the institutions set forth in item I of paragraph 1 of article 1 of Supplementary Law No. 105, of January 10, 2001, totaling R$ 1,614. |
| | |
| Itaú Unibanco Holding S.A. – Complete Financial Statements in IFRS – December 31, 2020 | | F-75 |
ITAÚ UNIBANCO HOLDING S.A.
Notes to the Consolidated Financial Statements
At 12/31/2020 and 12/31/2019 for balance sheet accounts and
From 01/01 to 12/31 of 2020, 2019 and 2018 for income statement accounts
(In millions of Reais, except information per share)
II – The deferred tax liabilities and its changes are represented by:
| | | | | | | | | | | | | | | | |
| | | 12/31/2019 | | | Realization /
reversal | | | Increase | | | 12/31/2020 | |
Reflected in income | | | 6,610 | | | | (2,951 | ) | | | 1,194 | | | | 4,853 | |
Depreciation in excess finance lease | | | 202 | | | | (57 | ) | | | — | | | | 145 | |
Adjustment of deposits in guarantee and provisions | | | 1,531 | | | | (133 | ) | | | 6 | | | | 1,404 | |
Post-employment benefits | | | 282 | | | | (111 | ) | | | 9 | | | | 180 | |
Adjustments of operations carried out on the futures settlement market | | | 1,330 | | | | (1,330 | ) | | | 452 | | | | 452 | |
Adjustment to Fair Value of Financial Assets – At Fair Value Through Profit or Loss | | | 1,149 | | | | (1,149 | ) | | | 136 | | | | 136 | |
Taxation of results abroad – capital gains | | | 581 | | | | — | | | | 63 | | | | 644 | |
Other | | | 1,535 | | | | (171 | ) | | | 528 | | | | 1,892 | |
Reflected in stockholders’ equity | | | 1,268 | | | | (859 | ) | | | 199 | | | | 608 | |
Adjustment to Fair Value of Financial Assets – At Fair Value Through Other Comprehensive Income | | | 1,228 | | | | (826 | ) | | | 199 | | | | 601 | |
Cash flow hedge | | | 30 | | | | (26 | ) | | | — | | | | 4 | |
Post-employment benefits | | | 10 | | | | (7 | ) | | | — | | | | 3 | |
| | | | | | | | | | | | | | | | |
Total (*) | | | 7,878 | | | | (3,810 | ) | | | 1,393 | | | | 5,461 | |
| | | | | | | | | | | | | | | | |
| (*) | Deferred income tax and social contribution asset and liabilities are recorded in the balance sheet offset by a taxable entity and amounting to R$ 56,583 and R$ 421, respectively. |
| | | | | | | | | | | | | | | | |
| | | 12/31/2018 | | | Realization /
reversal | | | Increase | | | 12/31/2019 | |
Reflected in income | | | 6,144 | | | | (3,863 | ) | | | 4,329 | | | | 6,610 | |
Depreciation in excess finance lease | | | 346 | | | | (144 | ) | | | — | | | | 202 | |
Adjustment of deposits in guarantee and provisions | | | 1,348 | | | | (29 | ) | | | 212 | | | | 1,531 | |
Post-employment benefits | | | 287 | | | | (56 | ) | | | 51 | | | | 282 | |
Adjustments of operations carried out on the futures settlement market | | | 923 | | | | (923 | ) | | | 1,330 | | | | 1,330 | |
Adjustment to Fair Value of Financial Assets – At Fair Value Through Profit or Loss | | | 1,790 | | | | (1,790 | ) | | | 1,149 | | | | 1,149 | |
Taxation of results abroad – capital gains | | | 659 | | | | (142 | ) | | | 64 | | | | 581 | |
Other | | | 791 | | | | (779 | ) | | | 1,523 | | | | 1,535 | |
Reflected in stockholders’ equity | | | 662 | | | | (262 | ) | | | 868 | | | | 1,268 | |
Adjustment to Fair Value of Financial Assets – At Fair Value Through Other Comprehensive Income | | | 474 | | | | (107 | ) | | | 861 | | | | 1,228 | |
Cash flow hedge | | | 168 | | | | (142 | ) | | | 4 | | | | 30 | |
Post-employment benefits | | | 7 | | | | — | | | | 3 | | | | 10 | |
Other | | | 13 | | | | (13 | ) | | | — | | | | — | |
| | | | | | | | | | | | | | | | |
Total (*) | | | 6,806 | | | | (4,125 | ) | | | 5,197 | | | | 7,878 | |
| | | | | | | | | | | | | | | | |
| (*) | Deferred income tax and social contribution asset and liabilities are recorded in the balance sheet offset by a taxable entity and amounting to R$ 38,914 and R$ 1,058, respectively. |
III – The estimate of realization and present value of deferred tax assets and deferred tax liabilities are:
| | | | | | | | | | | | | | | | | | | | | | | | | | | | | | | | | | | | | | | | |
| | | Deferred tax assets | | | | | | | | | | | | | |
Year of
realization | | Temporary
differences | | | % | | | Tax loss / social
contribution loss
carryforwards | | | % | | | Total | | | % | | | Deferred tax
liabilities | | | % | | | Net
deferred
taxes | | | % | |
2021 | | | 10,792 | | | | 19 | % | | | 971 | | | | 18 | % | | | 11,763 | | | | 19 | % | | | (168 | ) | | | 3 | % | | | 11,595 | | | | 21 | % |
2022 | | | 15,832 | | | | 28 | % | | | 521 | | | | 9 | % | | | 16,353 | | | | 27 | % | | | (500 | ) | | | 9 | % | | | 15,853 | | | | 28 | % |
2023 | | | 14,821 | | | | 26 | % | | | 566 | | | | 10 | % | | | 15,387 | | | | 25 | % | | | (186 | ) | | | 4 | % | | | 15,201 | | | | 27 | % |
2024 | | | 3,245 | | | | 6 | % | | | 664 | | | | 12 | % | | | 3,909 | | | | 6 | % | | | (136 | ) | | | 2 | % | | | 3,773 | | | | 7 | % |
2025 | | | 2,571 | | | | 5 | % | | | 714 | | | | 13 | % | | | 3,285 | | | | 5 | % | | | (212 | ) | | | 4 | % | | | 3,073 | | | | 5 | % |
After 2025 | | | 8,834 | | | | 16 | % | | | 2,092 | | | | 38 | % | | | 10,926 | | | | 18 | % | | | (4,259 | ) | | | 78 | % | | | 6,667 | | | | 12 | % |
Total | | | 56,095 | | | | 100 | % | | | 5,528 | | | | 100 | % | | | 61,623 | | | | 100 | % | | | (5,461 | ) | | | 100 | % | | | 56,162 | | | | 100 | % |
| | | | | | | | | | | | | | | | | | | | | | | | | | | | | | | | | | | | | | | | |
Present value (*) | | | 53,476 | | | | | | | | 5,147 | | | | | | | | 58,623 | | | | | | | | (4,847) | | | | | | | | 53,776 | | | | | |
| | | | | | | | | | | | | | | | | | | | | | | | | | | | | | | | | | | | | | | | |
| (*) | The average funding rate, net of tax effects, was used to determine the present value. |
Projections of future taxable income include estimates of macroeconomic variables, exchange rates, interest rates, volumes of financial operations and services fees and others factors, which can vary in relation to actual data and amounts.
Net income in the financial statements is not directly related to the taxable income for income tax and social contribution, due to differences between accounting criteria and the tax legislation, in addition to corporate aspects. Accordingly, it is recommended that changes in realization of deferred tax assets presented below are not considered as an indication of future net income.
| IV - | At 12/31/2020, deferred tax assets not accounted for correspond to R$ 780 and result from Management’s evaluation of their perspectives of realization in the long term (R$ 605 at 12/31/2019). |
| | |
| Itaú Unibanco Holding S.A. – Complete Financial Statements in IFRS – December 31, 2020 | | F-76 |
ITAÚ UNIBANCO HOLDING S.A.
Notes to the Consolidated Financial Statements
At 12/31/2020 and 12/31/2019 for balance sheet accounts and
From 01/01 to 12/31 of 2020, 2019 and 2018 for income statement accounts
(In millions of Reais, except information per share)
c) Tax liabilities
| | | | | | | | |
| | | 12/31/2020 | | | 12/31/2019 | |
Taxes and contributions on income payable | | | 970 | | | | 3,083 | |
Other Taxes and Contributions payable | | | 1,908 | | | | 914 | |
Deferred tax liabilities (Note 24b II) | | | 421 | | | | 1,058 | |
Other | | | 2,411 | | | | 2,836 | |
| | | | | | | | |
Total | | | 5,710 | | | | 7,891 | |
| | | | | | | | |
Note 25 – Earnings per share
a) Basic earnings per share
Net income attributable to ITAÚ UNIBANCO HOLDING’s shareholders is divided by the average number of outstanding shares in the period, excluding treasury shares.
| | | | | | | | | | | | |
| | | 01/01 to
12/31/2020 | | | 01/01 to
12/31/2019 | | | 01/01 to
12/31/2018 | |
Net income attributable to owners of the parent company | | | 18,896 | | | | 27,113 | | | | 24,907 | |
Minimum non-cumulative dividends on preferred shares | | | (106 | ) | | | (105 | ) | | | (104 | ) |
Retained earnings to be distributed to common equity owners in an amount per | | | (109 | ) | | | (109 | ) | | | (109 | ) |
share equal to the minimum dividend payable to preferred equity owners | | | | | | | | | | | | |
Retained earnings to be distributed, on a pro rata basis, to common andpreferred equity owners: | | | | | | | | | | | | |
Common | | | 9,491 | | | | 13,693 | | | | 12,599 | |
Preferred | | | 9,190 | | | | 13,206 | | | | 12,095 | |
Total net income available to equity owners: | | | | | | | | | | | | |
Common | | | 9,600 | | | | 13,802 | | | | 12,708 | |
Preferred | | | 9,296 | | | | 13,311 | | | | 12,199 | |
Weighted average number of outstanding shares | | | | | | | | | | | | |
Common | | | 4,958,290,359 | | | | 4,958,290,359 | | | | 4,958,290,359 | |
Preferred | | | 4,801,324,161 | | | | 4,781,855,588 | | | | 4,759,872,085 | |
Basic earnings per share – R$ | | | | | | | | | | | | |
Common | | | 1.94 | | | | 2.78 | | | | 2.56 | |
Preferred | | | 1.94 | | | | 2.78 | | | | 2.56 | |
b) Diluted earnings per share
Calculated similarly to the basic earnings per share; however, it includes the conversion of all preferred shares potentially dilutable in the denominator.
| | | | | | | | | | | | |
| | | 01/01 to
12/31/2020 | | | 01/01 to
12/31/2019 | | | 01/01 to
12/31/2018 | |
Net income available to preferred equity owners | | | 9,296 | | | | 13,311 | | | | 12,199 | |
Dividends on preferred shares after dilution effects | | | 41 | | | | 64 | | | | 72 | |
Net income available to preferred equity owners considering preferred shares after the dilution effect | | | 9,337 | | | | 13,375 | | | | 12,271 | |
Net income available to ordinary equity owners | | | 9,600 | | | | 13,802 | | | | 12,708 | |
Dividend on preferred shares after dilution effects | | | (41 | ) | | | (64 | ) | | | (72 | ) |
Net income available to ordinary equity owners considering preferred shares afterthe dilution effect | | | 9,559 | | | | 13,738 | | | | 12,636 | |
Adjusted weighted average of shares | | | | | | | | | | | | |
Common | | | 4,958,290,359 | | | | 4,958,290,359 | | | | 4,958,290,359 | |
Preferred | | | 4,843,233,835 | | | | 4,826,925,107 | | | | 4,815,473,777 | |
Preferred | | | 4,801,324,161 | | | | 4,781,855,588 | | | | 4,759,872,085 | |
Incremental as per share-based payment plans | | | 41,909,674 | | | | 45,069,519 | | | | 55,601,692 | |
Diluted earnings per share – R$ | | | | | | | | | | | | |
Common | | | 1.93 | | | | 2.77 | | | | 2.55 | |
Preferred | | | 1.93 | | | | 2.77 | | | | 2.55 | |
There was no potentially antidulitive effect of the shares in share-based payment plans in the periods of 2020, 2019 and 2018.
| | |
| Itaú Unibanco Holding S.A. – Complete Financial Statements in IFRS – December 31, 2020 | | F-77 |
ITAÚ UNIBANCO HOLDING S.A.
Notes to the Consolidated Financial Statements
At 12/31/2020 and 12/31/2019 for balance sheet accounts and
From 01/01 to 12/31 of 2020, 2019 and 2018 for income statement accounts
(In millions of Reais, except information per share)
Note 26 – Post-employment benefits
ITAÚ UNIBANCO HOLDING, through its subsidiaries, sponsors retirement plans for its employees.
Retirement plans are managed by Closed-end Private Pension Entities (EFPC) and are closed to new applicants. These entities have an independent structure and manage their plans according to the characteristics of their regulations.
There are three types of retirement plan:
| | • | | Defined Benefit Plans (BD): plans which scheduled benefits have their value established in advance, based on salaries and/or length of service of employees, and its cost is actuarially determined; |
| | • | | Defined Contribution Plans (CD): are those plans which scheduled benefits have their value permanently adjusted to the investments balance, kept in favor of the participant, including in the benefit concession phase, considering net proceedings of its investment, amounts contributed and benefits paid; and |
| | • | | Variable Contribution Plans (CV): in this type of plan, scheduled benefits present a combination of characteristics of defined contribution and defined benefit modalities, and the benefit is actuarially determined based on the investments accumulated balance by the participant on the retirement date. |
Below is a list of benefit plans and their modalities:
| | | | |
Entity | | Benefit Plan | | Modality |
| Fundação Itaú Unibanco – Previdência Complementar - FIU | | Supplementary Retirement Plan Supplementary Retirement Plan – Flexible Premium Annuity Franprev Benefit Plan 002 Benefit Plan Prebeg Benefit Plan UBB PREV Defined Benefit Plan Benefit Plan II Itaulam Basic Plan Itaucard Defined Benefit Plan Itaú Unibanco Main Retirement Plan | | Defined Benefit |
| | Itaubanco Defined Contribution Plan Itaubank Retirement Plan Redecard Pension Plan | | Defined Contribution |
| | | Unibanco Pension Plan – Intelligent Future Itaulam Supplementary Plan Itaucard Variable Contribution Plan Itaú Unibanco Supplementary Retirement Plan | | Variable Contribution |
| FUNBEP – Fundo de Pensão Multipatrocinado | | Benefit Plan l Benefit Plan ll | | Defined Benefit Variable Contribution |
Defined Contribution plans include pension funds consisting of the portions of sponsor’s contributions not included in a participant’s account balance due to loss of eligibility for the benefit, and of monies arising from the migration of retirement plans in defined benefit modality. These funds are used for future contributions to individual participants’ accounts, according to the respective benefit plan regulations.
| | |
| Itaú Unibanco Holding S.A. – Complete Financial Statements in IFRS – December 31, 2020 | | F-78 |
ITAÚ UNIBANCO HOLDING S.A.
Notes to the Consolidated Financial Statements
At 12/31/2020 and 12/31/2019 for balance sheet accounts and
From 01/01 to 12/31 of 2020, 2019 and 2018 for income statement accounts
(In millions of Reais, except information per share)
a) Main Actuarial Assumptions
Actuarial assumptions of demographic and financial nature should reflect the best estimates about the variables that determine the post-employment benefit obligations.
The main demographic assumptions comprise: mortality table and turnover of active participants, while the main financial assumptions include: discount rate, future salary increases, growth of plan benefits and inflation.
| | | | |
| | | 12/31/2020 | | 12/31/2019 |
| Discount rate (1) | | 7.64% p.a. | | 7.64% p.a. |
| Mortality table (2) | | AT-2000 | | AT-2000 |
| Turnover (3) | | Itaú Experience 2008/2010 | | Itaú Experience 2008/2010 |
| Future salary growth | | 4.00% to 7.12% p.a. | | 4.00% to 7.12% p.a. |
| Growth of the pension fund benefits | | 4.00% p.a. | | 4.00% p.a. |
| Inflation | | 4.00% p.a. | | 4.00% p.a. |
| Actuarial method | | Projected Unit Credit | | Projected Unit Credit |
| | | | |
| (1) | Determined based on market yield relating to National Treasury Notes (NTN-B) and compatible with the economic scenario observed on the balance sheet closing date, considering the volatility of interest market and models used. |
| (2) | Correspond to those disclosed by SOA – “Society of Actuaries”, by applying a 10% increase in the probabilities of survival regarding the respective basic tables. |
| (3) | Updated to the new expectation of mass behavior. |
Retired plans sponsored by foreign subsidiaries - Banco Itaú (Suisse) S.A., Itaú CorpBanca Colombia S.A. and PROSERV - Promociones y Servicios S.A. de C.V. - are structured as Defined Benefit modality and adopt actual assumptions adequate to masses of participants and the economic scenario of each country.
b) Risk Management
The EFPCs sponsored by ITAÚ UNIBANCO HOLDING are regulated by the National Council for Complementary Pension (CNPC) and PREVIC, has an Executive Board, Advisory and Tax Councils.
Benefits offered have long-tem characteristics and the main factors involved in the management and measurement of their risks are financial risk, inflation risk and demographic risk.
- Financial Risk – the actuarial liability is calculated by adopting a discount, which may differ from rates earned in investments. If real income from plan investments is lower than yield expected, this may give rise to a deficit. To mitigate this risk and assure the capacity to pay long-term benefits, the plans have a significant percentage of fixed-income securities pegged to the plan commitments, aiming at minimizing volatility and risk of mismatch between assets and liabilities. Additionally, adherence tests are carried out in financial assumptions to ensure their adequacy to obligations of respective plans.
- Inflation risk – a large part of liabilities is pegged to inflation risk, making actuarial liabilities sensitive to increase in rates. To mitigate this risk, the same financial risks mitigation strategies are used.
- Demographic Risk – plans that have any obligation actuarially assessed are exposed to demographic risk. In the event the mortality tables used are not adherent to the mass of plan participants, a deficit or surplus may arise in actuarial evaluation. To mitigate this risk, adherence tests to demographic assumptions are conducted to ensure their adequacy to liabilities of respective plans.
For purposes of registering in the balance sheet the EFPCs that manage them, actuarial liabilities of plans use discount rate adherent to its asset portfolio and income and expense flows, according to a study prepared by an independent consulting company. The actuarial method used is the aggregate method, through which the plan costing is defined by the difference between its equity coverage and the current value of its future liabilities, observing the methodology established in the respective actuarial technical note. In the event deficit is verified in the concession period above the settlement limits set forth by the legislation in force, a debt agreement is entered into with the sponsor with financial guarantees.
| | |
| Itaú Unibanco Holding S.A. – Complete Financial Statements in IFRS – December 31, 2020 | | F-79 |
ITAÚ UNIBANCO HOLDING S.A.
Notes to the Consolidated Financial Statements
At 12/31/2020 and 12/31/2019 for balance sheet accounts and
From 01/01 to 12/31 of 2020, 2019 and 2018 for income statement accounts
(In millions of Reais, except information per share)
c) Asset management
The purpose of the management of the funds is the long-term balance between pension assets and liabilities with payment of benefits by exceeding actuarial goals (discount rate plus benefit adjustment index, established in the plan regulations).
Below is a table with the allocation of assets by category, segmented into Quoted in an Active Market and Not Quoted in an Active Market:
| | | | | | | | | | | | | | | | |
| | | Fair value | | | % Allocation | |
Types | | 12/31/2020 | | | 12/31/2019 | | | 12/31/2020 | | | 12/31/2019 | |
Fixed income securities | | | 21,172 | | | | 20,672 | | | | 91.16 | % | | | 90.93 | % |
Quoted in an active market | | | 20,804 | | | | 20,366 | | | | 89.58 | % | | | 89.59 | % |
Non quoted in an active market | | | 368 | | | | 306 | | | | 1.58 | % | | | 1.34 | % |
Variable income securities | | | 1,387 | | | | 1,392 | | | | 5.97 | % | | | 6.12 | % |
Quoted in an active market | | | 1,378 | | | | 1,384 | | | | 5.93 | % | | | 6.09 | % |
Non quoted in an active market | | | 9 | | | | 8 | | | | 0.04 | % | | | 0.03 | % |
Structured investments | | | 82 | | | | 65 | | | | 0.35 | % | | | 0.29 | % |
Quoted in an active market | | | — | | | | — | | | | 0.00 | % | | | 0.00 | % |
Non quoted in an active market | | | 82 | | | | 65 | | | | 0.35 | % | | | 0.29 | % |
Real estate | | | 506 | | | | 529 | | | | 2.18 | % | | | 2.33 | % |
Loans to participants | | | 78 | | | | 74 | | | | 0.34 | % | | | 0.33 | % |
| | | | | | | | | | | | | | | | |
Total | | | 23,225 | | | | 22,732 | | | | 100.00 | % | | | 100.00 | % |
| | | | | | | | | | | | | | | | |
The defined benefit plan assets include shares of ITAÚ UNIBANCO HOLDING, its main parent company (ITAÚSA) and of subsidiaries of the latter, with a fair value of R$ 11 (R$ 11 at 12/31/2019), and real estate rented to group companies, with a fair value of R$ 410 (R$ 445 at 12/31/2019).
d) Other post-employment benefits
ITAÚ UNIBANCO HOLDING and its subsidiaries do not have additional liabilities related to post-employment benefits, except in cases arising from maintenance commitments assumed in acquisition agreements occurred over the years, as well as those benefits originated from court decision in the terms and conditions established, in which there is total or partial sponsorship of health care plan for a specific mass of former employees and their beneficiaries. Its costing is actuarially determined so as to ensure coverage maintenance. These plans are closed to new applicants.
Assumptions for discount rate, inflation, mortality table and actuarial method are the same used for retirement plans. ITAÚ
UNIBANCO HOLDING used the percentage of 4% p.a. for medical inflation and the percentage of 3% p.a. for aging factor, additionally considering, inflation rate of 4% p.a.
Particularly in other post-employment benefits, there is medical inflation risk associated to increase in medical costs above expectation. To mitigate this risk, the same financial risks mitigation strategies are used.
| | |
| Itaú Unibanco Holding S.A. – Complete Financial Statements in IFRS – December 31, 2020 | | F-80 |
ITAÚ UNIBANCO HOLDING S.A.
Notes to the Consolidated Financial Statements
At 12/31/2020 and 12/31/2019 for balance sheet accounts and
From 01/01 to 12/31 of 2020, 2019 and 2018 for income statement accounts
(In millions of Reais, except information per share)
e) Change in the net amount recognized in the balance sheet
The net amount recognized in the Balance Sheet is limited by the asset ceiling and it is computed based on estimated future contributions to be realized by the sponsor, so that it represents the maximum reduction amount in the contributions to be made.
| | | | | | | | | | | | | | | | | | | | | | | | | | | | | | | | | | | | |
| | | 12/31/2020 | |
| | | BD and CV plans | | | CD plans | | | Other post-
employment
benefits
Liabilities | | | Total
Recognized
amount | |
| | | Net assets | | | Actuarial
liabilities | | | Asset ceiling | | | Recognized
amount | | | Pension plan
fund | | | Asset
ceiling | | | Recognized
amount | |
Amounts at the beginning of the period | | | 22,732 | | | | (19,659 | ) | | | (3,761 | ) | | | (688 | ) | | | 1,475 | | | | (849 | ) | | | 626 | | | | (967 | ) | | | (1,029 | ) |
| | | | | | | | | | | | | | | | | | | | | | | | | | | | | | | | | | | | |
Amounts recognized in income (1+2+3+4) | | | 1,731 | | | | (1,578 | ) | | | (287 | ) | | | (134 | ) | | | 20 | | | | (65 | ) | | | (45 | ) | | | (76 | ) | | | (255 | ) |
1 - Cost of current service | | | — | | | | (80 | ) | | | — | | | | (80 | ) | | | — | | | | — | | | | — | | | | — | | | | (80 | ) |
2 - Cost of past service | | | — | | | | (1 | ) | | | — | | | | (1 | ) | | | — | | | | — | | | | — | | | | — | | | | (1 | ) |
3 - Net interest (1) | | | 1,731 | | | | (1,497 | ) | | | (287 | ) | | | (53 | ) | | | 112 | | | | (65 | ) | | | 47 | | | | (76 | ) | | | (82 | ) |
4 - Other expenses (2) | | | — | | | | — | | | | — | | | | — | | | | (92 | ) | | | — | | | | (92 | ) | | | — | | | | (92 | ) |
Amounts recognized in stockholders´ equity - other comprehensive income (5+6+7) | | | (75 | ) | | | (669 | ) | | | 406 | | | | (338 | ) | | | (41 | ) | | | (37 | ) | | | (78 | ) | | | 6 | | | | (410 | ) |
5 - Effects on asset ceiling | | | — | | | | — | | | | 406 | | | | 406 | | | | — | | | | (37 | ) | | | (37 | ) | | | — | | | | 369 | |
6 - Remeasurements | | | (113 | ) | | | (588 | ) | | | — | | | | (701 | ) | | | (41 | ) | | | — | | | | (41 | ) | | | 6 | | | | (736 | ) |
Changes in demographic assumptions | | | — | | | | (11 | ) | | | — | | | | (11 | ) | | | — | | | | — | | | | — | | | | — | | | | (11 | ) |
Changes in financial assumptions | | | — | | | | 13 | | | | — | | | | 13 | | | | — | | | | — | | | | — | | | | 12 | | | | 25 | |
Experience of the plan (3) | | | (113 | ) | | | (590 | ) | | | — | | | | (703 | ) | | | (41 | ) | | | — | | | | (41 | ) | | | (6 | ) | | | (750 | ) |
7 - Exchange variation | | | 38 | | | | (81 | ) | | | — | | | | (43 | ) | | | — | | | | — | | | | — | | | | — | | | | (43 | ) |
Other (8+9) | | | (1,163 | ) | | | 1,244 | | | | — | | | | 81 | | | | — | | | | ��� | | | | — | | | | 115 | | | | 196 | |
8 - Benefits paid | | | (1,244 | ) | | | 1,244 | | | | — | | | | — | | | | — | | | | — | | | | — | | | | 115 | | | | 115 | |
9 - Contributions and investments from sponsor | | | 81 | | | | — | | | | — | | | | 81 | | | | — | | | | — | | | | — | | | | — | | | | 81 | |
| | | | | | | | | | | | | | | | | | | | | | | | | | | | | | | | | | | | |
Amounts at end of the period | | | 23,225 | | | | (20,662 | ) | | | (3,642 | ) | | | (1,079 | ) | | | 1,454 | | | | (951 | ) | | | 503 | | | | (922 | ) | | | (1,498 | ) |
| | | | | | | | | | | | | | | | | | | | | | | | | | | | | | | | | | | | |
Amount recognized in Assets (Note 18a) | | | | | | | | | | | | | | | 82 | | | | | | | | | | | | 503 | | | | — | | | | 585 | |
Amount recognized in Liabilities (Note 18b) | | | | | | | | | | | | | | | (1,161 | ) | | | | | | | | | | | — | | | | (922 | ) | | | (2,083 | ) |
| | | | | | | | | | | | | | | | | | | | | | | | | | | | | | | | | | | | |
| | | | | | | | | | | | | | | | | | | | | | | | | | | | | | | | | | | | |
| | | 12/31/2019 | |
| | | BD and CV plans | | | CD plans | | | Other post-
employment
benefits
Liabilities | | | Total
Recognized
amount | |
| | | Net assets | | | Actuarial
liabilities | | | Asset ceiling | | | Recognized
amount | | | Pension plan
fund | | | Asset
ceiling | | | Recognized
amount | |
Amounts at the beginning of the period | | | 18,808 | | | | (15,447 | ) | | | (3,664 | ) | | | (303 | ) | | | 1,604 | | | | (939 | ) | | | 665 | | | | (282 | ) | | | 80 | |
| | | | | | | | | | | | | | | | | | | | | | | | | | | | | | | | | | | | |
Amounts recognized in income (1+2+3+4) | | | 1,769 | | | | (1,505 | ) | | | (355 | ) | | | (91 | ) | | | 49 | | | | (91 | ) | | | (42 | ) | | | (459 | ) | | | (592 | ) |
1 - Cost of current service | | | — | | | | (70 | ) | | | — | | | | (70 | ) | | | — | | | | — | | | | — | | | | — | | | | (70 | ) |
2 - Cost of past service | | | — | | | | — | | | | — | | | | — | | | | — | | | | — | | | | — | | | | (418 | ) | | | (418 | ) |
3 - Net interest (1) | | | 1,769 | | | | (1,435 | ) | | | (355 | ) | | | (21 | ) | | | 151 | | | | (91 | ) | | | 60 | | | | (41 | ) | | | (2 | ) |
4 - Other expenses (2) | | | — | | | | — | | | | — | | | | — | | | | (102 | ) | | | — | | | | (102 | ) | | | — | | | | (102 | ) |
Amounts recognized in stockholders´ equity - other comprehensive income (5+6+7) | | | 3,249 | | | | (3,881 | ) | | | 258 | | | | (374 | ) | | | (178 | ) | | | 181 | | | | 3 | | | | (261 | ) | | | (632 | ) |
5 - Effects on asset ceiling | | | — | | | | — | | | | 384 | | | | 384 | | | | — | | | | 176 | | | | 176 | | | | — | | | | 560 | |
6 - Remeasurements | | | 3,255 | | | | (3,907 | ) | | | (126 | ) | | | (778 | ) | | | (178 | ) | | | 5 | | | | (173 | ) | | | (261 | ) | | | (1,212 | ) |
Changes in demographic assumptions | | | — | | | | — | | | | — | | | | — | | | | — | | | | — | | | | — | | | | — | | | | — | |
Changes in financial assumptions | | | — | | | | (3,610 | ) | | | — | | | | (3,610 | ) | | | — | | | | — | | | | — | | | | (123 | ) | | | (3,733 | ) |
Experience of the plan (3) | | | 3,255 | | | | (297 | ) | | | (126 | ) | | | 2,832 | | | | (178 | ) | | | 5 | | | | (173 | ) | | | (138 | ) | | | 2,521 | |
7 - Exchange variation | | | (6 | ) | | | 26 | | | | — | | | | 20 | | | | — | | | | — | | | | — | | | | — | | | | 20 | |
Other (8+9) | | | (1,094 | ) | | | 1,174 | | | | — | | | | 80 | | | | — | | | | — | | | | — | | | | 35 | | | | 115 | |
8 - Benefits paid | | | (1,174 | ) | | | 1,174 | | | | — | | | | — | | | | — | | | | — | | | | — | | | | 35 | | | | 35 | |
9 - Contributions and investments from sponsor | | | 80 | | | | — | | | | — | | | | 80 | | | | — | | | | — | | | | — | | | | — | | | | 80 | |
| | | | | | | | | | | | | | | | | | | | | | | | | | | | | | | | | | | | |
Amounts at end of the period | | | 22,732 | | | | (19,659 | ) | | | (3,761 | ) | | | (688 | ) | | | 1,475 | | | | (849 | ) | | | 626 | | | | (967 | ) | | | (1,029 | ) |
| | | | | | | | | | | | | | | | | | | | | | | | | | | | | | | | | | | | |
Amount recognized in Assets (Note 18a) | | | | | | | | | | | | | | | 91 | | | | | | | | | | | | 626 | | | | — | | | | 717 | |
Amount recognized in Liabilities (Note 18b) | | | | | | | | | | | | | | | (779 | ) | | | | | | | | | | | — | | | | (967 | ) | | | (1,746 | ) |
| | | | | | | | | | | | | | | | | | | | | | | | | | | | | | | | | | | | |
| (1) | Corresponds to the amount calculated on 01/01/2020 based on the initial amount (Net Assets, Actuarial Liabilities and Restriction of Assets), taking into account the estimated amount of payments/ receipts of benefits/ contributions, multiplied by the discount rate of 7.64% p.a.(At 01/01/2019 the rate used was 9.72% p.a.). |
| (2) | Corresponds to the use of asset amounts allocated in pension funds of the defined contribution plans. |
| (3) | Correspond to the income obtained above/below the expected return and comprise the contributions made by participants. |
| | |
| Itaú Unibanco Holding S.A. – Complete Financial Statements in IFRS – December 31, 2020 | | F-81 |
ITAÚ UNIBANCO HOLDING S.A.
Notes to the Consolidated Financial Statements
At 12/31/2020 and 12/31/2019 for balance sheet accounts and
From 01/01 to 12/31 of 2020, 2019 and 2018 for income statement accounts
(In millions of Reais, except information per share)
f) Defined benefit contribution
| | | | | | | | | | | | |
| | | Estimated
contribution | | | Contributions made | |
| | | 2021 | | | 01/01 to
12/31/2020 | | | 01/01 to
12/31/2019 | |
Retirement plan - FIU | | | 47 | | | | 45 | | | | 45 | |
Retiremente plan - FUNBEP | | | 3 | | | | 5 | | | | 8 | |
| | | | | | | | | | | | |
Total | | | 50 | | | | 50 | | | | 53 | |
| | | | | | | | | | | | |
g) Maturity profile of defined benefit liabilities
| | | | | | | | | | | | | | | | | | | | | | | | | | | | |
| | | Duration(*) | | | 2021 | | | 2022 | | | 2023 | | | 2024 | | | 2025 | | | 2026 to 2030 | |
Pension plan - FIU | | | 11.65 | | | | 882 | | | | 915 | | | | 949 | | | | 985 | | | | 1,021 | | | | 5,595 | |
Pension plan - FUNBEP | | | 10.51 | | | | 457 | | | | 472 | | | | 488 | | | | 503 | | | | 517 | | | | 2,757 | |
Other post-employment benefits | | | 9.51 | | | | 124 | | | | 125 | | | | 136 | | | | 131 | | | | 35 | | | | 198 | |
| | | | | | | | | | | | | | | | | | | | | | | | | | | | |
Total | | | | | | | 1,463 | | | | 1,512 | | | | 1,573 | | | | 1,619 | | | | 1,573 | | | | 8,550 | |
| | | | | | | | | | | | | | | | | | | | | | | | | | | | |
| (*) | Average duration of plan´s actuarial liabilities. |
h) Sensitivity analysis
To measure the effects of changes in the key assumptions, sensitivity tests are conducted in actuarial liabilities annually. The sensitivity analysis considers a vision of the impacts caused by changes in assumptions, which could affect the income for the period and stockholders’ equity at the balance sheet date. This type of analysis is usually carried out under the ceteris paribus condition, in which the sensitivity of a system is measured when only one variable of interest is changed and all the others remain unchanged. The results obtained are shown in the table below:
| | | | | | | | | | | | | | | | | | | | | | | | |
| | | BD and CV plans | | | Other post-employment benefits | |
Main assumptions | | Present value
of liability | | | Income | | | Stockholders´ equity
(Other Comprehensive
Incom e) (*) | | | Present value
of liability | | | Income | | | Stockholders´ equity
(Other Comprehensive
Income) (*) | |
Discount rate | | | | | | | | | | | | | | | | | | | | | | | | |
Increase by 0.5% | | | (1,019 | ) | | | — | | | | 346 | | | | (39 | ) | | | — | | | | 39 | |
Decrease by 0.5% | | | 1,116 | | | | — | | | | (533 | ) | | | 44 | | | | — | | | | (44 | ) |
Mortality table | | | | | | | | | | | | | | | | | | | | | | | | |
Increase by 5% | | | (281 | ) | | | — | | | | 94 | | | | (14 | ) | | | — | | | | 14 | |
Decrease by 5% | | | 295 | | | | — | | | | (99 | ) | | | 15 | | | | — | | | | (15 | ) |
Medical inflation | | | | | | | | | | | | | | | | | | | | | | | | |
Increase by 1% | | | — | | | | — | | | | — | | | | 101 | | | | — | | | | (101 | ) |
Decrease by 1% | | | — | | | | — | | | | — | | | | (81 | ) | | | — | | | | 81 | |
| (*) | Net of effects of asset ceiling |
| | |
| Itaú Unibanco Holding S.A. – Complete Financial Statements in IFRS – December 31, 2020 | | F-82 |
ITAÚ UNIBANCO HOLDING S.A.
Notes to the Consolidated Financial Statements
At 12/31/2020 and 12/31/2019 for balance sheet accounts and
From 01/01 to 12/31 of 2020, 2019 and 2018 for income statement accounts
(In millions of Reais, except information per share)
Note 27 – Insurance contracts and private pension
ITAÚ UNIBANCO HOLDING, through its subsidiaries, offers to the market insurance and private pension products, with the purpose of assuming risks and restoring the economic balance of the insured’s assets. Products are offered through insurance brokers (independent and captive brokers), Itaú Unibanco’s electronic channels and branches, in compliance with the regulatory requirements, of the National Council of Private Insurance – CNSP and the Superintendence of Private Insurance - SUSEP.
I – Insurance
A contract entered into by the parties to protect the customer’s assets, upon payment of a premium, by means of replacement or pre-established financial compensation, against damage their property or their person. As backing, ITAÚ UNIBANCO HOLDING insurance companies set up technical reserves, through specialized areas within the conglomerate, with the objective of indemnifying policyholders’ losses in the event of claims of insured risks.
The insurance risks sold by ITAÚ UNIBANCO HOLDING’s insurance companies are divided into property and casualty insurance, covering loss, damage or liabilities for assets or persons, and life insurance that includes coverage for death and personal accidents.
II – Private pension
Designed to ensure the maintenance of the quality of life of participants, as a supplement to the government plans, through long term investments, private pension products are divided into three major groups:
| | • | | PGBL – Free Benefit Generating Plan: The main objective of this plan is the accumulation of financial resources, but it can be purchased with additional risk coverage. Recommended for customers that file the full version of the income tax return, because they can deduct contributions paid for tax purposes up to 12% of their annual taxable gross income; |
| | • | | VGBL - Free Benefit Generating Life Plan: This is insurance structured as a pension plan. Its taxation differs from the PGBL; in this case, the tax basis is the earned income; and |
| | • | | FGB – Benefit Generating Fund: This is a pension plan with minimum income guarantee, and possibility of receiving earnings from asset performance. Although there are plans still in existence, they are no longer sold. |
III – Technical provision for insurance and private pensions
The technical provisions for insurance and private pensions are recognized according to the technical notes approved by SUSEP and criteria established by current legislation, as follows:
| | • | | Provision for unearned premiums (PPNG) – this provision is recognized, based on insurance premiums, to cover amounts payable for future claims and expenses. In the calculation, the term to maturity of risks assumed and issued and risks in effect but not issued (PPNG-RVNE) in the policies or endorsements of contracts in force is taken pro rata on a daily basis; |
| | • | | Provision for unsettled claims (PSL) – this provision is recognized to cover expected amounts for reported and unpaid claims, including administrative and judicial claims. It includes amounts related to indemnities, reserve funds and past-due income, all gross of reinsurance operations and net of coinsurance operations, when applicable. When necessary, it must cover adjustments for IBNER (claims incurred but not sufficiently reported) for the total of claims reported but not yet paid, a total which may change during the process up to final settlement; |
| | • | | Provision for claims incurred and not reported (IBNR) - this provision is recognized for the coverage of expected amount for settlement of claims incurred but not reported up to the calculation base date, including administrative and judicial claims. It includes amounts related to indemnities, reserve funds and income, all gross of reinsurance operations and net of coinsurance operations; |
| | • | | Mathematical provisions for benefits to be granted (PMBAC) - recognized for the coverage of commitments assumed to participants or policyholders, based on the provisions of the contract, while the event that gives rise to the benefit and/or indemnity has not occurred; |
| | |
| Itaú Unibanco Holding S.A. – Complete Financial Statements in IFRS – December 31, 2020 | | F-83 |
ITAÚ UNIBANCO HOLDING S.A.
Notes to the Consolidated Financial Statements
At 12/31/2020 and 12/31/2019 for balance sheet accounts and
From 01/01 to 12/31 of 2020, 2019 and 2018 for income statement accounts
(In millions of Reais, except information per share)
| | • | | Mathematical provisions for benefits granted (PMBC) - recognized for the coverage of commitments to payment of indemnities and/or benefits to participants or insured parties, based on the provisions of the contract, after the event has occurred; |
| | • | | Provision for financial surplus (PEF) - it is recognized to guarantee amounts intended for the distribution of financial surplus, if provided for in the contract. Corresponds to the financial income exceeding the minimum return guaranteed in the product; |
| | • | | Supplemental Coverage Reserve (PCC) - recognized when technical reserves are found to be insufficient, as shown by the Liability Adequacy Test, provided for in the regulations; |
| | • | | Provision for redemptions and other amounts to be regularized (PVR) - this provision is recognized for the coverage of amounts related to redemptions to be regularized, returned premiums or funds, transfers requested but, for any reason, not yet transferred to the recipient insurance company or open private pension entity, and where premiums have been received but not quoted; |
| | • | | Provision for related expenses (PDR) - recognized for the coverage of expected amounts related to expenses on benefits and indemnities, due to events which have occurred or will occur. |
IV - Main information related to Insurance and Private Pension operations
a) Indexes
| | | | | | | | | | | | | | | | | | | | | | | | |
| | | Sales ratio
% | | | | | | Loss ratio
% | |
Main Insurance Lines | | 01/01 to
12/31/2020 | | | 01/01 to
12/31/2019 | | | 01/01 to
12/31/2018 | | | 01/01 to
12/31/2020 | | | 01/01 to
12/31/2019 | | | 01/01 to
12/31/2018 | |
Group Accident Insurance | | | 33.8 | | | | 35.1 | | | | 34.3 | | | | 11.3 | | | | 6.8 | | | | 9.4 | |
Individual Accident Insurance | | | 18.8 | | | | 18.8 | | | | 14.1 | | | | 29.4 | | | | 24.1 | | | | 20.8 | |
Credit Life Insurance | | | 24.2 | | | | 23.7 | | | | 20.4 | | | | 22.3 | | | | 18.0 | | | | 18.3 | |
Random Events | | | 23.5 | | | | 23.5 | | | | 20.3 | | | | 34.3 | | | | 26.3 | | | | 17.1 | |
Multiple Peril | | | 44.4 | | | | 46.4 | | | | 48.1 | | | | 52.9 | | | | 60.2 | | | | 53.3 | |
Mortagage Insurance in Market Policies – Credit Life Insurance | | | 20.4 | | | | 20.0 | | | | 20.4 | | | | 18.5 | | | | 17.3 | | | | 15.3 | |
Group Life | | | 24.0 | | | | 23.2 | | | | 15.1 | | | | 41.0 | | | | 34.4 | | | | 33.2 | |
b) Revenues from insurance premiuns and private pension
| | | | | | | | | | | | |
| | | Premiums and contributions | |
Main lines | | 01/01 to
12/31/2020 | | | 01/01 to
12/31/2019 | | | 01/01 to
12/31/2018 | |
Group Accident Insurance | | | 847 | | | | 867 | | | | 689 | |
Individual Accident Insurance | | | 187 | | | | 222 | | | | 280 | |
Disability Savings Pension | | | 258 | | | | 269 | | | | 291 | |
PGBL | | | 2,235 | | | | 2,282 | | | | 2,193 | |
Credit Life Insurance | | | 624 | | | | 946 | | | | 879 | |
Random Events | | | 195 | | | | 227 | | | | 235 | |
Multiple Peril | | | 370 | | | | 290 | | | | 209 | |
Mortagage Insurance in Market Policies – Credit Life Insurance | | | 339 | | | | 324 | | | | 288 | |
Traditional | | | 117 | | | | 115 | | | | 122 | |
VGBL | | | 8,022 | | | | 12,335 | | | | 17,154 | |
Group Life | | | 955 | | | | 947 | | | | 937 | |
Other lines | | | 655 | | | | 800 | | | | 820 | |
Total | | | 14,804 | | | | 19,624 | | | | 24,097 | |
| | | | | | | | | | | | |
| | |
| Itaú Unibanco Holding S.A. – Complete Financial Statements in IFRS – December 31, 2020 | | F-84 |
ITAÚ UNIBANCO HOLDING S.A.
Notes to the Consolidated Financial Statements
At 12/31/2020 and 12/31/2019 for balance sheet accounts and
From 01/01 to 12/31 of 2020, 2019 and 2018 for income statement accounts
(In millions of Reais, except information per share)
c) Technical provisions balances
| | | | | | | | | | | | | | | | | | | | | | | | |
| | | 12/31/2020 | | | 12/31/2019 | |
| | | Insurance | | | Private Pension | | | Total | | | Insurance | | | Private Pension | | | Total | |
Unearned premiums (PPNG) | | | 2,298 | | | | 12 | | | | 2,310 | | | | 2,343 | | | | 13 | | | | 2,356 | |
Mathematical provisions for benefits to be granted (PMBAC) and granted benefits (PMBC) | | | 17 | | | | 215,216 | | | | 215,233 | | | | 204 | | | | 212,274 | | | | 212,478 | |
Redemptions and Other Unsettled Amounts (PVR) | | | 16 | | | | 332 | | | | 348 | | | | 13 | | | | 318 | | | | 331 | |
Financial surplus (PEF) | | | 2 | | | | 655 | | | | 657 | | | | 2 | | | | 610 | | | | 612 | |
Unsettled claims (PSL) | | | 515 | | | | 68 | | | | 583 | | | | 571 | | | | 47 | | | | 618 | |
Claims / events incurred but not reported (IBNR) | | | 294 | | | | 22 | | | | 316 | | | | 277 | | | | 22 | | | | 299 | |
Related Expenses (PDR) | | | 29 | | | | 88 | | | | 117 | | | | 28 | | | | 89 | | | | 117 | |
Other provisions | | | 132 | | | | 1,304 | | | | 1,436 | | | | 250 | | | | 1,273 | | | | 1,523 | |
Total | | | 3,303 | | | | 217,697 | | | | 221,000 | | | | 3,688 | | | | 214,646 | | | | 218,334 | |
| | | | | | | | | | | | | | | | | | | | | | | | |
Current | | | 2,537 | | | | 526 | | | | 3,063 | | | | 2,613 | | | | 493 | | | | 3,106 | |
Non-current | | | 766 | | | | 217,171 | | | | 217,937 | | | | 1,075 | | | | 214,153 | | | | 215,228 | |
| | | | | | | | | | | | | | | | | | | | | | | | |
d) Change in technical provisions
| | | | | | | | | | | | | | | | | | | | | | | | |
| | | 12/31/2020 | | | 12/31/2019 | |
| | | Insurance | | | Private pension | | | Total | | | Insurance | | | Private pension | | | Total | |
Opening balance - 01/01 | | | 3,688 | | | | 214,646 | | | | 218,334 | | | | 3,809 | | | | 197,378 | | | | 201,187 | |
(+) Additions arising from premiums / contributions | | | 4,176 | | | | 10,389 | | | | 14,565 | | | | 4,634 | | | | 14,735 | | | | 19,369 | |
(-) Deferral due to elapsed risk | | | (4,221 | ) | | | — | | | | (4,221 | ) | | | (4,216 | ) | | | — | | | | (4,216 | ) |
(-) Payment of claims / benefits | | | (1,263 | ) | | | (364 | ) | | | (1,627 | ) | | | (1,349 | ) | | | (566 | ) | | | (1,915 | ) |
(+) Reported claims | | | 1,322 | | | | — | | | | 1,322 | | | | 1,465 | | | | — | | | | 1,465 | |
(-) Redemptions | | | — | | | | (15,431 | ) | | | (15,431 | ) | | | — | | | | (15,623 | ) | | | (15,623 | ) |
(+/-) Net Portability | | | — | | | | 563 | | | | 563 | | | | — | | | | 1,754 | | | | 1,754 | |
(+) Adjustment of reserves and financial surplus | | | 12 | | | | 7,837 | | | | 7,849 | | | | 10 | | | | 16,507 | | | | 16,517 | |
(+/-) Other (increase / reversal) | | | (190 | ) | | | 57 | | | | (133 | ) | | | (665 | ) | | | 461 | | | | (204 | ) |
(+/-) Corporate Reorganization | | | (221 | ) | | | — | | | | (221 | ) | | | — | | | | — | | | | — | |
Closing balance | | | 3,303 | | | | 217,697 | | | | 221,000 | | | | 3,688 | | | | 214,646 | | | | 218,334 | |
| | | | | | | | | | | | | | | | | | | | | | | | |
Through actuarial models based mainly on the portfolio historical experience and on macroeconomic projections, ITAÚ UNIBANCO HOLDING establishes the assumptions that influence the assessment of technical provisions. The assumptions are reassessed annually by experts of the actuarial and risk area, and are subsequently submitted to the executive’s approval. The effects on assumptions are recognized in income for the period in which they occurred.
| | |
| Itaú Unibanco Holding S.A. – Complete Financial Statements in IFRS – December 31, 2020 | | F-85 |
ITAÚ UNIBANCO HOLDING S.A.
Notes to the Consolidated Financial Statements
At 12/31/2020 and 12/31/2019 for balance sheet accounts and
From 01/01 to 12/31 of 2020, 2019 and 2018 for income statement accounts
(In millions of Reais, except information per share)
V - Deferred acquisition costs
They are recorded in assets and charges are shown in the table below:
| | | | | | | | |
| | | 12/31/2020 | | | 12/31/2019 | |
Opening Balance - 01/01 | | | 495 | | | | 409 | |
Increase | | | 1,089 | | | | 1,156 | |
Amortization | | | (1,088 | ) | | | (1,070 | ) |
| | | | | | | | |
Closing Balance | | | 496 | | | | 495 | |
| | | | | | | | |
Balance to be amortized in up to 12 months | | | 380 | | | | 389 | |
Balance to be amortized after 12 months | | | 116 | | | | 106 | |
| | | | | | | | |
VI - Table of Claims Development
| | | | |
Provision for unsettled claims (PSL) | | | 583 | |
(-) IBNER | | | 245 | |
(-) Reinsurance | | | 20 | |
(-) Retrocession and other estimates | | | (19 | ) |
Liability claims presented in the claims development table (a + b) | | | 337 | |
| | | | |
The amount of obligations of the ITAÚ UNIBANCO HOLDING may change. The first part of the table shows how the final loss estimate changes through time. The second part of the table reconciles the amounts pending payment and the liability disclosed in the balance sheet.
a) Administratives claims - net of reinsurance
| | | | | | | | | | | | | | | | | | | | | | | | |
Occurrence date | | 12/31/2016 | | | 12/31/2017 | | | 12/31/2018 | | | 12/31/2019 | | | 12/31/2020 | | | Total | |
At the end of reporting period | | | 938 | | | | 934 | | | | 993 | | | | 1,149 | | | | 1,222 | | | | | |
After 1 year | | | 981 | | | | 977 | | | | 1,012 | | | | 1,132 | | | | | | | | | |
After 2 years | | | 1,001 | | | | 975 | | | | 1,014 | | | | | | | | | | | | | |
After 3 years | | | 1,078 | | | | 973 | | | | | | | | | | | | | | | | | |
After 4 years | | | 1,075 | | | | | | | | | | | | | | | | | | | | | |
Current estimate | | | 1,075 | | | | 973 | | | | 1,014 | | | | 1,132 | | | | 1,222 | | | | | |
Accumulated payments through base date | | | 1,058 | | | | 960 | | | | 1,000 | | | | 1,117 | | | | 1,122 | | | | 5,257 | |
Liabilities recognized in the balance sheet | | | 17 | | | | 13 | | | | 14 | | | | 15 | | | | 100 | | | | 159 | |
Liabilities in relation to prior periods | | | | | | | | | | | | | | | | | | | | | | | 26 | |
Total administratives claims | | | | | | | | | | | | | | | | | | | | | | | 185 | |
| | | | | | | | | | | | | | | | | | | | | | | | |
b) Judicial claims - net of reinsurance
| | | | | | | | | | | | | | | | | | | | | | | | |
Occurrence date | | 12/31/2016 | | | 12/31/2017 | | | 12/31/2018 | | | 12/31/2019 | | | 12/31/2020 | | | Total | |
At the end of reporting period | | | 26 | | | | 28 | | | | 16 | | | | 20 | | | | 12 | | | | | |
After 1 year | | | 35 | | | | 40 | | | | 33 | | | | 36 | | | | | | | | | |
After 2 years | | | 43 | | | | 51 | | | | 47 | | | | | | | | | | | | | |
After 3 years | | | 55 | | | | 60 | | | | | | | | | | | | | | | | | |
After 4 years | | | 63 | | | | | | | | | | | | | | | | | | | | | |
Current estimate | | | 63 | | | | 60 | | | | 47 | | | | 36 | | | | 12 | | | | | |
Accumulated payments through base date | | | 52 | | | | 50 | | | | 35 | | | | 25 | | | | 4 | | | | 166 | |
Liabilities recognized in the balance sheet | | | 11 | | | | 10 | | | | 12 | | | | 11 | | | | 8 | | | | 52 | |
Liabilities in relation to prior periods | | | | | | | | | | | | | | | | | | | | | | | 100 | |
Total judicial claims | | | | | | | | | | | | | | | | | | | | | | | 152 | |
| | | | | | | | | | | | | | | | | | | | | | | | |
The breakdown of the claims development table into administrative and judicial shows the reallocation of admininstrative claims up to a certain base date and that become judicial claims afterwards, which may give the wrong impression of need for adjusting the provisions in each breakdown.
| | |
| Itaú Unibanco Holding S.A. – Complete Financial Statements in IFRS – December 31, 2020 | | F-86 |
ITAÚ UNIBANCO HOLDING S.A.
Notes to the Consolidated Financial Statements
At 12/31/2020 and 12/31/2019 for balance sheet accounts and
From 01/01 to 12/31 of 2020, 2019 and 2018 for income statement accounts
(In millions of Reais, except information per share)
VII - Liability Adequacy Test
ITAÚ UNIBANCO HOLDING tests for Liability Adequacy semiannually, by comparing the amount recognized for its technical reserves with the current estimate of cash flow of its future obligations. The estimate should include all cash flows related to the business, which is the minimum requirement for carrying out the adequacy test.
The Liability Adequacy Test did not indicate significant insufficiency in 2020, 2019 and 2018.
The assumptions used in the test are periodically reviewed and are based on best practices and an analysis of subsidiaries’ experience, thus representing the best estimates for cash flow projections.
Methodology and test grouping
Specifically for insurance products, cash flows were projected using the method known as the run-off triangle for quarterly frequency periods. For pension products, cash flows for the deferral and concession phases are tested separately.
The risk grouping criteria include groups subject to similar risks that are jointly managed as a single portfolio.
Demographic tables
Demographic tables are instruments to measure the demographic risk represented by the probability of death, survival or disability of a participant.
For death and survival estimates, the latest Brazilian Market Insurer Experience tables (BR-EMS) are used, adjusted according to Scale G life expectancy development, and the Álvaro Vindas table is used to estimate benefit requests for disability.
Risk-free interest rate
The relevant risk-free forward interest -rate structure (ETTJ) is an indicator of the pure time value of money used to price the set of projected cash flows.
The ETTJ was obtained from the curve of securities deemed to be credit risk free, available in the Brazilian financial market and determined by ITAÚ UNIBANCO HOLDING using its own method, plus a spread, which takes into account the impact of the market result of securities classified as Financial assets at amortized cost in the Guarantee assets portfolio.
Annuity conversion rate
The annuity conversion rate represents the expected conversion of balances accumulated by participants in retirement benefits. The decision by participants convert into an annuity is influenced by behavioral, economic and tax factors.
Other assumptions
Related expenses, cancellations and partial redemptions, future additions and contributions, are among the assumptions that affect the estimate of projected cash flows since they represent expenses and income arising from insurance agreements assumed.
| | |
| Itaú Unibanco Holding S.A. – Complete Financial Statements in IFRS – December 31, 2020 | | F-87 |
ITAÚ UNIBANCO HOLDING S.A.
Notes to the Consolidated Financial Statements
At 12/31/2020 and 12/31/2019 for balance sheet accounts and
From 01/01 to 12/31 of 2020, 2019 and 2018 for income statement accounts
(In millions of Reais, except information per share)
Note 28 – Fair value of financial instruments
In cases where market prices are not available, fair values are based on estimates using discounted cash flows or other valuation techniques. These techniques are significantly affected by the assumptions adopted, including the discount rate and estimate of future cash flows. The estimated fair value obtained through these techniques cannot be substantiated by comparison with independent markets and, in many cases, cannot be achieved on immediate settlement of the instrument.
The following table summarizes the book values and estimated fair values for financial instruments:
| | | | | | | | | | | | | | | | | | | | |
| | | | | | 12/31/2020 | | | 12/31/2019 | |
| | | | | | Book value | | | Fair value (*) | | | Book value | | | Fair value | |
Cash | | | (a | ) | | | 46,224 | | | | 46,224 | | | | 30,367 | | | | 30,367 | |
Financial assets | | | | | | | 1,851,322 | | | | 1,861,146 | | | | 1,501,481 | | | | 1,513,562 | |
At Amortized Cost | | | | | | | 1,275,799 | | | | 1,285,623 | | | | 1,101,892 | | | | 1,113,973 | |
Central Bank compulsory deposits | | | (a | ) | | | 90,059 | | | | 90,059 | | | | 91,248 | | | | 91,248 | |
Interbank deposits | | | (b | ) | | | 55,685 | | | | 55,883 | | | | 34,583 | | | | 34,622 | |
Securities purchased under agreements to resell | | | (a | ) | | | 239,943 | | | | 239,943 | | | | 198,428 | | | | 198,428 | |
Securities | | | (c | ) | | | 129,804 | | | | 131,159 | | | | 133,119 | | | | 135,891 | |
Loan and Financial Lease | | | (d | ) | | | 714,104 | | | | 722,375 | | | | 585,791 | | | | 595,061 | |
Other financial assets | | | (e | ) | | | 93,255 | | | | 93,255 | | | | 94,752 | | | | 94,752 | |
(-) Provision for Expected Loss | | | | | | | (47,051 | ) | | | (47,051 | ) | | | (36,029 | ) | | | (36,029 | ) |
At Fair Value Through Other Comprehensive Income | | | | | | | 109,942 | | | | 109,942 | | | | 76,660 | | | | 76,660 | |
Securities | | | (c | ) | | | 109,942 | | | | 109,942 | | | | 76,660 | | | | 76,660 | |
At Fair Value Through Profit or Loss | | | | | | | 465,581 | | | | 465,581 | | | | 322,929 | | | | 322,929 | |
Securities | | | (c | ) | | | 389,071 | | | | 389,071 | | | | 281,075 | | | | 281,075 | |
Derivatives | | | (c | ) | | | 76,504 | | | | 76,504 | | | | 41,854 | | | | 41,854 | |
Other financial assets | | | | | | | 6 | | | | 6 | | | | — | | | | — | |
Financial liabilities | | | | | | | 1,579,686 | | | | 1,581,953 | | | | 1,211,999 | | | | 1,214,196 | |
At Amortized Cost | | | | | | | 1,495,641 | | | | 1,497,908 | | | | 1,159,830 | | | | 1,162,027 | |
Deposits | | | (b | ) | | | 809,010 | | | | 808,965 | | | | 507,060 | | | | 507,110 | |
Securities sold under repurchase agreements | | | (a | ) | | | 273,364 | | | | 273,364 | | | | 256,583 | | | | 256,583 | |
Interbank market funds | | | (b | ) | | | 156,035 | | | | 156,106 | | | | 174,862 | | | | 174,949 | |
Institutional market funds | | | (b | ) | | | 138,308 | | | | 140,549 | | | | 104,244 | | | | 106,304 | |
Other financial liabilities | | | (e | ) | | | 118,924 | | | | 118,924 | | | | 117,081 | | | | 117,081 | |
At Fair Value Through Profit or Loss | | | | | | | 79,653 | | | | 79,653 | | | | 48,029 | | | | 48,029 | |
Derivatives | | | (c | ) | | | 79,505 | | | | 79,505 | | | | 47,828 | | | | 47,828 | |
Structured notes | | | | | | | 143 | | | | 143 | | | | 201 | | | | 201 | |
Other financial liabilities | | | | | | | 5 | | | | 5 | | | | — | | | | — | |
Provision for Expected Loss | | | | | | | 4,392 | | | | 4,392 | | | | 4,140 | | | | 4,140 | |
Loan Commitments | | | | | | | 3,485 | | | | 3,485 | | | | 3,303 | | | | 3,303 | |
Financial Guarantees | | | | | | | 907 | | | | 907 | | | | 837 | | | | 837 | |
| (*) | In the period, the result of Derivatives, as well as Adjustment to Fair Value of Financial Assets (particularly private securities) had their amounts affected by oscillations of rates and other market variables arising from the impact of the COVID-19 pandemic on the macroeconomic scenario in the period (Note 33a). |
Financial instruments not included in the Balance Sheet (Note 32) are represented by Standby letters of credit and financial guarantees provided, which amount to R$ 110,410 (R$ 81,733 at 12/31/2019) with an estimated fair value of R$ 520 (R$ 968 at 12/31/2019).
| | |
| Itaú Unibanco Holding S.A. – Complete Financial Statements in IFRS – December 31, 2020 | | F-88 |
ITAÚ UNIBANCO HOLDING S.A.
Notes to the Consolidated Financial Statements
At 12/31/2020 and 12/31/2019 for balance sheet accounts and
From 01/01 to 12/31 of 2020, 2019 and 2018 for income statement accounts
(In millions of Reais, except information per share)
The methods and assumptions used to estimate the fair value are defined below:
| a) | Cash, Central Bank compulsory deposits, Securities purchased under agreements to resell and Securities sold under repurchase agreements – The carrying amounts for these instruments are close to their fair values. |
| b) | Interbank deposits, Deposits, Interbank and Institutional Market Funds – they are calculated by discounting estimated cash flows at market interest rates. |
| c) | Securities and Derivatives – Under normal conditions, the prices quoted in the market are the best indicators of the fair values of these financial instruments. However, not all instruments have liquidity or quoted market prices and, in such cases, it is necessary to adopt present value estimates and other techniques to establish their fair value. In the absence of prices quoted by the Brazilian Association of Financial and Capital Markets Entities (ANBIMA), the fair values of government securities are determined based on the interest rates provided by brokers. The fair values of corporate securities are calculated by discounting estimated cash flows at market interest rates. The fair values of shares are based on the prices quoted in the market. The fair values of derivative financial instruments were determined as follows: |
| | • | | Swaps: The cash flows are discounted to present value based on yield curves that reflect the appropriate risk factors, mainly following swap prices on B3 for derivatives, of Brazilian government securities in the secondary market or derivatives and securities traded abroad. These yield curves may be used to obtain the fair value of currency swaps, interest rate swaps and swaps based on other risk factors (commodities, stock exchange indices, etc.). |
| | • | | Futures and forwards: Quotations on exchanges or using criteria identical to those applied to swaps. |
| | • | | Options: Determined through mathematical models, such as Black-Scholes, using data, in general from Bloomberg, for implicit volatility, interest rate yield curve and fair value of the underlying asset. Current market prices of options are used to compute the implicit volatilities. |
| | • | | Credit Derivatives: They are inversely related to the probability of default (PD) in a financial instrument subject to credit risk. The process of adjusting the market price of these spreads is based on the differences between the yield curves with and without credit risk. |
| d) | Loans and financial leases – Fair value is estimated for groups of loans with similar financial and risk characteristics, using valuation models. The fair value of fixed-rate loans was determined by discounting estimated cash flows, at interest rates applicable to similar loans. For the majority of loans at floating rates, the carrying amount was considered to be close to their market value. The fair value of loan and lease operations not overdue was calculated by discounting the expected payments of principal and interest to maturity. The fair value of overdue loan and lease transactions was based on the discount of estimated cash flows, using a rate proportional to the risk associated with the estimated cash flows, or on the underlying collateral. The assumptions for cash flows and discount rates rely on information available in the market and knowledge of the individual debtor. |
| e) | Other financial assets / liabilities – primarily composed of receivables from credit card issuers, deposits in guarantee for contingent liabilities, provisions and legal obligations and trading and intermediation of securities. The carrying amounts for these assets/liabilities substantially approximate to their fair values, since they principally represent amounts to be received in the short term from credit card holders and to be paid to credit card issuers, deposits in guarantee (indexed to market rates) made by ITAÚ UNIBANCO HOLDING to secure lawsuits or very short-term receivables (generally with a maturity of approximately 5 business days). All of these items represent assets / liabilities without significant associated market, credit or liquidity risks. |
Level 1: Observable inputs that reflect quoted prices (unadjusted) for identical assets or liabilities in active markets. An active market is a market in which transactions for the asset or liability being measured occur often enough and with sufficient volume to provide pricing information on an ongoing basis.
| | |
| Itaú Unibanco Holding S.A. – Complete Financial Statements in IFRS – December 31, 2020 | | F-89 |
ITAÚ UNIBANCO HOLDING S.A.
Notes to the Consolidated Financial Statements
At 12/31/2020 and 12/31/2019 for balance sheet accounts and
From 01/01 to 12/31 of 2020, 2019 and 2018 for income statement accounts
(In millions of Reais, except information per share)
Level 2: Input that is not observable for the asset or liability either directly or indirectly. Level 2 generally includes: (i) quoted prices for similar assets or liabilities in active markets; (ii) quoted prices for identical or similar assets or liabilities in markets that are not active, that is, markets in which there are few transactions for the asset or liability, the prices are not current, or quoted prices vary substantially either over time or among market makers, or in which little information is released publicly; (iii) inputs other than quoted prices that are observable for the asset or liability (for example, interest rates and yield curves observable at commonly quoted intervals, volatilities, etc.); (iv) inputs that are mainly derived from or corroborated by observable market data through correlation or by other means.
Level 3: Inputs are not observable for the asset or liability. Unobservable information is used to measure fair value to the extent that observable information is not available, thus allowing for situations in which there is little, or no market activity for the asset or liability at the measurement date.
Financial assets at fair value through profit or loss, including Derivatives, and at fair value through other comprehensive income:
Level 1: Highly-liquid securities with prices available in an active market and derivatives traded on stock exchanges. This classification level includes most of the Brazilian government securities, other foreign government securities, shares and debentures traded on stock exchanges and other securities traded in an active market.
Level 2: When pricing information is not available for a specific security, valuation is usually based on prices quoted in the market for similar instruments, pricing information obtained from pricing services, such as Bloomberg, Reuters and brokers (only when the prices represent actual transactions) or discounted cash flows, which use information for assets actively traded in an active market. These securities are classified at Level 2 of the fair value hierarchy and consist of certain Brazilian government securities, debentures, some government securities quoted in a less liquid market than for Level 1, and some share prices in investment funds.
Derivatives included in Level 2 are credit default swaps, cross- currency swaps, interest rate swaps, simple options and some forwards, since information adopted by pricing models is immediately observable in actively quoted markets. The models used for these instruments are Black-Scholes, Garman & Kohlhagen, Monte Carlo and discounted cash flow.
ITAÚ UNIBANCO HOLDING does not hold positions in alternative investment funds or private equity funds.
Level 3: When there is no pricing information in an active market, ITAÚ UNIBANCO HOLDING uses internally developed models, from curves generated according to a proprietary model. Level 3 classification includes some Brazilian government and corporate securities falling due after 2025 which are not usually traded in an active market.
Derivatives with fair values classified in Level 3 of the fair value hierarchy are composed of exotic options, certain swaps indexed to non-observable inputs, and swaps with other products, such as swap with options or with verification, credit derivatives and futures of certain commodities.
All the above methods may result in a fair value that is not indicative of the net realizable value or future fair values. However, ITAÚ UNIBANCO HOLDING believes that all the method used are appropriate and consistent with other market participants. Moreover, the adoption of different methods or assumptions to estimate fair value may result in different fair value estimates at the balance sheet date.
| | |
| Itaú Unibanco Holding S.A. – Complete Financial Statements in IFRS – December 31, 2020 | | F-90 |
ITAÚ UNIBANCO HOLDING S.A.
Notes to the Consolidated Financial Statements
At 12/31/2020 and 12/31/2019 for balance sheet accounts and
From 01/01 to 12/31 of 2020, 2019 and 2018 for income statement accounts
(In millions of Reais, except information per share)
Distribution by level
The following table presents the breakdown of fair value hierarchy levels.
| | | | | | | | | | | | | | | | | | | | | | | | | | | | | | | | |
The following table presents the breakdown of fair value hierarchy levels. | | 12/31/2020 | | | 12/31/2019 | |
| | | Level 1 | | | Level 2 | | | Level 3 | | | Total | | | Level 1 | | | Level 2 | | | Level 3 | | | Total | |
Financial assets at fair value through profit or loss | | | 312,572 | | | | 70,791 | | | | 1,968 | | | | 385,331 | | | | 234,583 | | | | 43,738 | | | | 1,719 | | | | 280,040 | |
| | | | | | | | | | | | | | | | | | | | | | | | | | | | | | | | |
Investment funds | | | 576 | | | | 13,628 | | | | — | | | | 14,204 | | | | 318 | | | | 7,949 | | | | — | | | | 8,267 | |
Brazilian government securities | | | 279,180 | | | | 6,705 | | | | — | | | | 285,885 | | | | 216,167 | | | | 3,444 | | | | — | | | | 219,611 | |
Government securities – other countries | | | 8,210 | | | | — | | | | — | | | | 8,210 | | | | 1,520 | | | | — | | | | — | | | | 1,520 | |
| | | | | | | | | | | | | | | | | | | | | | | | | | | | | | | | |
Argentina | | | 1,498 | | | | — | | | | — | | | | 1,498 | | | | 318 | | | | — | | | | — | | | | 318 | |
Chile | | | 840 | | | | — | | | | — | | | | 840 | | | | 488 | | | | — | | | | — | | | | 488 | |
Colombia | | | 3,603 | | | | — | | | | — | | | | 3,603 | | | | 409 | | | | — | | | | — | | | | 409 | |
United States | | | 2,085 | | | | — | | | | — | | | | 2,085 | | | | 141 | | | | — | | | | — | | | | 141 | |
Italy | | | 130 | | | | — | | | | — | | | | 130 | | | | — | | | | — | | | | — | | | | — | |
Mexico | | | 5 | | | | — | | | | — | | | | 5 | | | | 57 | | | | — | | | | — | | | | 57 | |
Paraguay | | | 3 | | | | — | | | | — | | | | 3 | | | | 2 | | | | — | | | | — | | | | 2 | |
Peru | | | 5 | | | | — | | | | — | | | | 5 | | | | 8 | | | | — | | | | — | | | | 8 | |
Uruguay | | | 41 | | | | — | | | | — | | | | 41 | | | | 97 | | | | — | | | | — | | | | 97 | |
Corporate securities | | | 24,606 | | | | 50,458 | | | | 1,968 | | | | 77,032 | | | | 16,578 | | | | 32,345 | | | | 1,719 | | | | 50,642 | |
| | | | | | | | | | | | | | | | | | | | | | | | | | | | | | | | |
Shares | | | 14,176 | | | | 4,871 | | | | — | | | | 19,047 | | | | 9,847 | | | | 4,790 | | | | — | | | | 14,637 | |
Rural product note | | | — | | | | 2,285 | | | | 64 | | | | 2,349 | | | | — | | | | — | | | | — | | | | — | |
Bank deposit certificates | | | — | | | | 729 | | | | — | | | | 729 | | | | — | | | | 792 | | | | — | | | | 792 | |
Real estate receivables certificates | | | — | | | | — | | | | 548 | | | | 548 | | | | — | | | | — | | | | 1,444 | | | | 1,444 | |
Debentures | | | 7,962 | | | | 20,625 | | | | 1,350 | | | | 29,937 | | | | 4,667 | | | | 7,763 | | | | 225 | | | | 12,655 | |
Eurobonds and others | | | 2,383 | | | | — | | | | — | | | | 2,383 | | | | 2,064 | | | | 102 | | | | 7 | | | | 2,173 | |
Financial bills | | | — | | | | 15,777 | | | | 6 | | | | 15,783 | | | | — | | | | 18,501 | | | | 13 | | | | 18,514 | |
Promissory notes | | | — | | | | 5,616 | | | | — | | | | 5,616 | | | | — | | | | 313 | | | | — | | | | 313 | |
Other | | | 85 | | | | 555 | | | | — | | | | 640 | | | | — | | | | 84 | | | | 30 | | | | 114 | |
Other Financial Assets | | | — | | | | 6 | | | | — | | | | 6 | | | | — | | | | — | | | | — | | | | — | |
Financial assets at fair value through other comprehensive income | | | 84,239 | | | | 25,703 | | | | — | | | | 109,942 | | | | 72,455 | | | | 4,171 | | | | 34 | | | | 76,660 | |
| | | | | | | | | | | | | | | | | | | | | | | | | | | | | | | | |
Brazilian government securities | | | 66,701 | | | | 1,248 | | | | — | | | | 67,949 | | | | 49,879 | | | | 853 | | | | — | | | | 50,732 | |
Government securities – other countries | | | 12,751 | | | | 21,651 | | | | — | | | | 34,402 | | | | 20,571 | | | | — | | | | — | | | | 20,571 | |
| | | | | | | | | | | | | | | | | | | | | | | | | | | | | | | | |
Germany | | | — | | | | — | | | | — | | | | — | | | | 23 | | | | — | | | | — | | | | 23 | |
Chile | | | — | | | | 21,651 | | | | — | | | | 21,651 | | | | 11,208 | | | | — | | | | — | | | | 11,208 | |
Colombia | | | 3,986 | | | | — | | | | — | | | | 3,986 | | | | 3,878 | | | | — | | | | — | | | | 3,878 | |
United States | | | 3,750 | | | | — | | | | — | | | | 3,750 | | | | 2,756 | | | | — | | | | — | | | | 2,756 | |
Italy | | | — | | | | — | | | | — | | | | — | | | | 329 | | | | — | | | | — | | | | 329 | |
Mexico | | | 1,181 | | | | — | | | | — | | | | 1,181 | | | | — | | | | — | | | | — | | | | — | |
Paraguay | | | 2,947 | | | | — | | | | — | | | | 2,947 | | | | 1,780 | | | | — | | | | — | | | | 1,780 | |
Uruguay | | | 887 | | | | — | | | | — | | | | 887 | | | | 597 | | | | — | | | | — | | | | 597 | |
Corporate securities | | | 4,787 | | | | 2,804 | | | | — | | | | 7,591 | | | | 2,005 | | | | 3,318 | | | | 34 | | | | 5,357 | |
| | | | | | | | | | | | | | | | | | | | | | | | | | | | | | | | |
Shares | | | 1,382 | | | | — | | | | — | | | | 1,382 | | | | 149 | | | | — | | | | — | | | | 149 | |
Bank deposit certificates | | | — | | | | 307 | | | | — | | | | 307 | | | | — | | | | 2,371 | | | | — | | | | 2,371 | |
Real estate receivables certificates | | | — | | | | — | | | | — | | | | — | | | | — | | | | — | | | | 26 | | | | 26 | |
Debentures | | | 419 | | | | 470 | | | | — | | | | 889 | | | | 334 | | | | — | | | | — | | | | 334 | |
Eurobonds and others | | | 2,986 | | | | 2,027 | | | | — | | | | 5,013 | | | | 1,522 | | | | 947 | | | | 8 | | | | 2,477 | |
Financial assets designated at fair value through profit or loss | | | 3,740 | | | | — | | | | — | | | | 3,740 | | | | 1,035 | | | | — | | | | — | | | | 1,035 | |
| | | | | | | | | | | | | | | | | | | | | | | | | | | | | | | | |
Brazilian external debt bonds | | | 3,740 | | | | — | | | | — | | | | 3,740 | | | | 1,035 | | | | — | | | | — | | | | 1,035 | |
Financial liabilities at fair value through profit or loss | | | — | | | | 5 | | | | — | | | | 5 | | | | — | | | | — | | | | — | | | | — | |
| | | | | | | | | | | | | | | | | | | | | | | | | | | | | | | | |
Other financial liabilities | | | — | | | | 5 | | | | — | | | | 5 | | | | — | | | | — | | | | — | | | | — | |
Financial liabilities designated at fair value through profit or loss | | | — | | | | 143 | | | | — | | | | 143 | | | | — | | | | 201 | | | | — | | | | 201 | |
| | | | | | | | | | | | | | | | | | | | | | | | | | | | | | | | |
Structured notes | | | — | | | | 143 | | | | — | | | | 143 | | | | — | | | | 201 | | | | — | | | | 201 | |
The following table presents the breakdown of fair value hierarchy levels for derivative assets and liabilities.
| | | | | | | | | | | | | | | | | | | | | | | | | | | | | | | | |
| | | 12/31/2020 | | | 12/31/2019 | |
| | | Level 1 | | | Level 2 | | | Level 3 | | | Total | | | Level 1 | | | Level 2 | | | Level 3 | | | Total | |
Assets | | | 23 | | | | 76,376 | | | | 105 | | | | 76,504 | | | | 14 | | | | 41,737 | | | | 103 | | | | 41,854 | |
| | | | | | | | | | | | | | | | | | | | | | | | | | | | | | | | |
Swap Contracts – adjustment receivable | | | — | | | | 45,926 | | | | 93 | | | | 46,019 | | | | — | | | | 26,426 | | | | 32 | | | | 26,458 | |
Option Contracts | | | 4 | | | | 20,402 | | | | 12 | | | | 20,418 | | | | — | | | | 8,385 | | | | 71 | | | | 8,456 | |
Forward Contracts | | | — | | | | 2,085 | | | | — | | | | 2,085 | | | | — | | | | 2,162 | | | | — | | | | 2,162 | |
Credit derivatives | | | — | | | | 156 | | | | — | | | | 156 | | | | — | | | | 167 | | | | — | | | | 167 | |
NDF - Non Deliverable Forward | | | — | | | | 7,596 | | | | — | | | | 7,596 | | | | — | | | | 4,446 | | | | — | | | | 4,446 | |
Other derivative financial instruments | | | 19 | | | | 211 | | | | — | | | | 230 | | | | 14 | | | | 151 | | | | — | | | | 165 | |
| | | | | | | | | | | | | | | | | | | | | | | | | | | | | | | | |
Liabilities | | | (22 | ) | | | (79,373 | ) | | | (110 | ) | | | (79,505 | ) | | | (7 | ) | | | (47,736 | ) | | | (85 | ) | | | (47,828 | ) |
| | | | | | | | | | | | | | | | | | | | | | | | | | | | | | | | |
Swap Contracts – adjustment payable | | | — | | | | (51,680 | ) | | | (109 | ) | | | (51,789 | ) | | | — | | | | (32,881 | ) | | | (46 | ) | | | (32,927 | ) |
Option Contracts | | | (13 | ) | | | (20,248 | ) | | | (1 | ) | | | (20,262 | ) | | | — | | | | (9,022 | ) | | | (39 | ) | | | (9,061 | ) |
Forward Contracts | | | — | | | | (905 | ) | | | — | | | | (905 | ) | | | — | | | | (754 | ) | | | — | | | | (754 | ) |
Credit derivatives | | | — | | | | (76 | ) | | | — | | | | (76 | ) | | | — | | | | (40 | ) | | | — | | | | (40 | ) |
NDF - Non Deliverable Forward | | | — | | | | (6,426 | ) | | | — | | | | (6,426 | ) | | | — | | | | (4,971 | ) | | | — | | | | (4,971 | ) |
Other derivative financial instruments | | | (9 | ) | | | (38 | ) | | | — | | | | (47 | ) | | | (7 | ) | | | (68 | ) | | | — | | | | (75 | ) |
There were no significant transfer between Level 1 and Level 2 during the periods of 12/31/2020 and 12/31/2019. Transfers to and from Level 3 are presented in movements of Level 3.
| | |
| Itaú Unibanco Holding S.A. – Complete Financial Statements in IFRS – December 31, 2020 | | F-91 |
ITAÚ UNIBANCO HOLDING S.A.
Notes to the Consolidated Financial Statements
At 12/31/2020 and 12/31/2019 for balance sheet accounts and
From 01/01 to 12/31 of 2020, 2019 and 2018 for income statement accounts
(In millions of Reais, except information per share)
Measurement of Level 2 fair value based on pricing services and brokers
To ensure that the fair value of these instruments is properly classified as Level 2, in -house analysis of information received are conducted, so as to understand the nature of the inputs used by the service provider.
Prices provided by pricing services that meet the following requirements are considered Level 2: input is immediately available, regularly distributed, provided by sources actively involved in significant markets and it is not proprietary.
For financial instruments classified as Level 2, the pricing service or brokers were used to price securities substantially represented by:
| | • | | Debentures: When available, we use price information for transactions recorded in the Brazilian Debenture System (SND), an electronic platform operated by B3, which provides multiple services for transactions involving debentures in the secondary market. Alternatively, prices of debentures provided by ANBIMA are used. Its methodology includes obtaining, on a daily basis, illustrative non-binding prices from a group of market players deemed to be significant. Such information is subject to statistical filters intended to eliminate outliers. |
| | • | | Financial Bills: In order to mark Financial Bills to market, it is necessary to calculate its future value by projecting the notional issue value and its yields established by contract (fixed rate, floating rate or price index) and discounting the fixed curve in reais, obtained through DI Futures prices traded on B3. |
| | • | | Global and corporate securities: The pricing process for these securities consists of capturing from 2 to 8 quotes from Bloomberg, depending on the asset. The method then compares the highest purchase prices and the lowest sale prices of trades provided by Bloomberg for the last day of the month. These prices are compared with information from purchase orders that the Institutional Treasury of ITAÚ UNIBANCO HOLDING provides to Bloomberg. Should the difference between them be lower than 0.5%, the average price of Bloomberg is used. If it is higher than 0.5% or if the Institutional Treasury does not provide information on this specific security, the average price gathered directly from other banks is used. The Institutional Treasury price is used as a reference only and never in the computation of the final price. |
Level 3 recurring fair value measurements
The departments in charge of defining and applying the pricing models are segregated from the business areas. The models are documented, submitted to validation by an independent area and approved by a specific committee. The daily process of price capture, calculation and disclosure is periodically checked according to formally defined tests and criteria and the information is stored in a single corporate data base.
The most frequent cases of assets classified as Level 3 are justified by the discount factors used. Factors such as the fixed interest curve in Brazilian Reais and the TR coupon curve – and, as a result, their related factors – have inputs with terms shorter than the maturities of fixed-income assets. For swaps, the indexers for both legs are analyzed. There are some cases in which the input periods are shorter than the maturity of the derivative.
| | |
| Itaú Unibanco Holding S.A. – Complete Financial Statements in IFRS – December 31, 2020 | | F-92 |
ITAÚ UNIBANCO HOLDING S.A.
Notes to the Consolidated Financial Statements
At 12/31/2020 and 12/31/2019 for balance sheet accounts and
From 01/01 to 12/31 of 2020, 2019 and 2018 for income statement accounts
(In millions of Reais, except information per share)
Level 3 recurring fair value changes
The tables below show balance sheet changes for financial instruments classified by ITAÚ UNIBANCO HOLDING in Level 3 of the fair value hierarchy. Derivative financial instruments classified in Level 3 correspond to other derivatives indexed to shares.
| | | | | | | | | | | | | | | | | | | | | | | | | | | | | | | | |
| | | | | | Total gains or losses (realized /
unrealized) | | | | | | | | | | | | | | | | |
| | | Fair value at
12/31/2019 | | | Recognized in
income | | | Recognized in
other
comprehensive
income | | | Purchases | | | Settlements | | | Transfers in
and /or out of
Level | | | Fair value
at
12/31/2020 | | | Total Gains or Losses
(Unrealized) | |
Financial assets at fair value through profit or loss | | | 1,719 | | | | (1,160 | ) | | | — | | | | 1,619 | | | | (779 | ) | | | 569 | | | | 1,968 | | | | (700 | ) |
| | | | | | | | | | | | | | | | | | | | | | | | | | | | | | | | |
Corporate securities | | | 1,719 | | | | (1,160 | ) | | | — | | | | 1,619 | | | | (779 | ) | | | 569 | | | | 1,968 | | | | (700 | ) |
Real estate receivables certificates | | | 1,444 | | | | (726 | ) | | | — | | | | 263 | | | | (433 | ) | | | — | | | | 548 | | | | (14 | ) |
Debentures | | | 225 | | | | (369 | ) | | | — | | | | 1,050 | | | | (272 | ) | | | 716 | | | | 1,350 | | | | (635 | ) |
Rural Product Note | | | — | | | | (55 | ) | | | — | | | | 227 | | | | (19 | ) | | | (89 | ) | | | 64 | | | | (51 | ) |
Eurobonds and other | | | 7 | | | | (6 | ) | | | — | | | | 69 | | | | (12 | ) | | | (58 | ) | | | — | | | | — | |
Financial bills | | | 13 | | | | (2 | ) | | | — | | | | — | | | | (5 | ) | | | — | | | | 6 | | | | — | |
Other | | | 30 | | | | (2 | ) | | | — | | | | 10 | | | | (38 | ) | | | — | | | | — | | | | — | |
| | | | | | | | | | | | | | | | | | | | | | | | | | | | | | | | |
Financial assets at fair value through other comprehensive income | | | 34 | | | | 7 | | | | ( 6 | ) | | | 248 | | | | (167 | ) | | | (116 | ) | | | — | | | | — | |
| | | | | | | | | | | | | | | | | | | | | | | | | | | | | | | | |
Corporate securities | | | 34 | | | | 7 | | | | (6 | ) | | | 248 | | | | (167 | ) | | | (116 | ) | | | — | | | | — | |
Real estate receivables certificates | | | 26 | | | | — | | | | — | | | | — | | | | (26 | ) | | | — | | | | — | | | | — | |
Eurobonds and other | | | 8 | | | | 7 | | | | (6 | ) | | | 248 | | | | (141 | ) | | | (116 | ) | | | — | | | | — | |
| | | | | | | | | | | | | | | | | | | | | | | | | | | | | | | | |
| | | Fair value at
12/31/2019 | | | Total gains or losses (realized /
unrealized) | | | Purchases | | | Settlements | | | Transfers in
and / or out of
Level | | | Fair value
at
12/31/2020 | | | Total Gains or Losses
(Unrealized) | |
| | Recognized in
income | | | Recognized in
other
comprehensive
income | |
Derivatives – assets | | | 103 | | | | 89 | | | | — | | | | 193 | | | | (234 | ) | | | (46 | ) | | | 105 | | | | 51 | |
| | | | | | | | | | | | | | | | | | | | | | | | | | | | | | | | |
Swap Contracts – adjustment receivable | | | 32 | | | | 107 | | | | — | | | | 10 | | | | (11 | ) | | | (45 | ) | | | 93 | | | | 91 | |
Option Contracts | | | 71 | | | | (18 | ) | | | — | | | | 183 | | | | (223 | ) | | | (1 | ) | | | 12 | | | | (40 | ) |
| | | | | | | | | | | | | | | | | | | | | | | | | | | | | | | | |
Derivatives – liabilities | | | (85 | ) | | | (93 | ) | | | — | | | | (130 | ) | | | 177 | | | | 21 | | | | (110 | ) | | | (90 | ) |
| | | | | | | | | | | | | | | | | | | | | | | | | | | | | | | | |
Swap Contracts – adjustment payable | | | (46 | ) | | | (74 | ) | | | — | | | | (12 | ) | | | 1 | | | | 22 | | | | (109 | ) | | | (90 | ) |
Option Contracts | | | (39 | ) | | | (19 | ) | | | — | | | | (118 | ) | | | 176 | | | | (1 | ) | | | (1 | ) | | | — | |
| | | | | | | | | | | | | | | | | | | | | | | | | | | | | | | | |
| | | Fair value at
12/31/2018 | | | Total gains or losses (realized /
unrealized) | | | Purchases | | | Settlements | | | Transfers in and / or out of Level | | | Fair value
at
12/31/2019 | | | Total Gains or Losses
(Unrealized) | |
| | Recognized in
income | | | Recognized in
other
comprehensive
income | |
Financial assets at fair value through profit or loss | | | 2,833 | | | | (1,300 | ) | | | — | | | | 1,755 | | | | (907 | ) | | | (662 | ) | | | 1,719 | | | | (307 | ) |
| | | | | | | | | | | | | | | | | | | | | | | | | | | | | | | | |
Corporate securities | | | 2,833 | | | | (1,300 | ) | | | — | | | | 1,755 | | | | (907 | ) | | | (662 | ) | | | 1,719 | | | | (307 | ) |
Shares | | | 1,268 | | | | (285 | ) | | | — | | | | — | | | | — | | | | (983 | ) | | | — | | | | — | |
Real estate receivables certificates | | | 1,411 | | | | (487 | ) | | | — | | | | 573 | | | | (53 | ) | | | — | | | | 1,444 | | | | 29 | |
Debentures | | | 85 | | | | (504 | ) | | | — | | | | 604 | | | | (222 | ) | | | 262 | | | | 225 | | | | (336 | ) |
Eurobonds and other | | | 31 | | | | (4 | ) | | | — | | | | 3 | | | | (51 | ) | | | 28 | | | | 7 | | | | — | |
Financial bills | | | 5 | | | | 6 | | | | — | | | | 8 | | | | (6 | ) | | | — | | | | 13 | | | | — | |
Other | | | 33 | | | | (26 | ) | | | — | | | | 567 | | | | (575 | ) | | | 31 | | | | 30 | | | | — | |
| | | | | | | | | | | | | | | | | | | | | | | | | | | | | | | | |
Financial assets designated at fair value through other comprehensive income | | | — | | | | 43 | | | | (47 | ) | | | 76 | | | | (68 | ) | | | 30 | | | | 34 | | | | (2 | ) |
| | | | | | | | | | | | | | | | | | | | | | | | | | | | | | | | |
Corporate securities | | | — | | | | 43 | | | | (47 | ) | | | 76 | | | | (68 | ) | | | 30 | | | | 34 | | | | (2 | ) |
Real estate receivables certificates | | | — | | | | — | | | | — | | | | 26 | | | | — | | | | — | | | | 26 | | | | — | |
Debentures | | | — | | | | (2 | ) | | | 6 | | | | 50 | | | | (54 | ) | | | — | | | | — | | | | 1 | |
Eurobonds and other | | | — | | | | 45 | | | | (53 | ) | | | — | | | | (14 | ) | | | 30 | | | | 8 | | | | (3 | ) |
| | | | | | | | | | | | | | | | | | | | | | | | | | | | | | | | |
| | | Fair value at
12/31/2018 | | | Total gains or losses (realized /
unrealized) | | | Purchases | | | Settlements | | | Transfers in and / or out of Level | | | Fair value
at
12/31/2019 | | | Total Gains or Losses
(Unrealized) | |
| | Recognized in
income | | | Recognized in
other
comprehensive
income | |
Derivatives – Assets | | | 142 | | | | (78 | ) | | | — | | | | 274 | | | | (156 | ) | | | (79 | ) | | | 103 | | | | (1 | ) |
| | | | | | | | | | | | | | | | | | | | | | | | | | | | | | | | |
Swap Contracts – adjustment receivable | | | 90 | | | | 21 | | | | — | | | | 2 | | | | (2 | ) | | | (79 | ) | | | 32 | | | | 31 | |
Option Contracts | | | 52 | | | | (99 | ) | | | — | | | | 272 | | | | (154 | ) | | | — | | | | 71 | | | | (32 | ) |
Derivatives – Liabilities | | | (26 | ) | | | (17 | ) | | | — | | | | (196 | ) | | | 172 | | | | (18 | ) | | | (85 | ) | | | (2 | ) |
| | | | | | | | | | | | | | | | | | | | | | | | | | | | | | | | |
Swap Contracts – adjustment payable | | | (3 | ) | | | (51 | ) | | | — | | | | (10 | ) | | | 36 | | | | (18 | ) | | | (46 | ) | | | (17 | ) |
Option Contracts | | | (23 | ) | | | 34 | | | | — | | | | (186 | ) | | | 136 | | | | — | | | | (39 | ) | | | 15 | |
| | |
| Itaú Unibanco Holding S.A. – Complete Financial Statements in IFRS – December 31, 2020 | | F-93 |
ITAÚ UNIBANCO HOLDING S.A.
Notes to the Consolidated Financial Statements
At 12/31/2020 and 12/31/2019 for balance sheet accounts and
From 01/01 to 12/31 of 2020, 2019 and 2018 for income statement accounts
(In millions of Reais, except information per share)
Sensitivity analysis of Level 3 operations
The fair value of financial instruments classified in Level 3 is measured through valuation techniques based on correlations and associated products traded in active markets, internal estimates and internal models.
Significant unobservable inputs used for measurement of the fair value of instruments classified in Level 3 are: interest rates, underlying asset prices and volatility. Significant variations in any of these inputs separately may give rise to substantial changes in the fair value.
The table below shows the sensitivity of these fair values in scenarios of changes of interest rates or, asset prices, or in scenarios with varying shocks to prices and volatilities for nonlinear assets:
| | | | | | | | | | | | | | | | | | |
Sensitivity – Level 3 Operations | | 12/31/2020 | | | 12/31/2019 | |
| | | | | Impact | | | | | | Impact | |
Market risk factor groups | | Scenarios | | Income | | | Stockholders’
equity | | | Income | | | Stockholders’
equity | |
Interest rates | | I | | | (0.8 | ) | | | — | | | | (0.9 | ) | | | (0.0 | ) |
| | II | | | (19.8 | ) | �� | | — | | | | (23.3 | ) | | | (0.3 | ) |
| | III | | | (38.2 | ) | | | — | | | | (46.1 | ) | | | (0.6 | ) |
| | | | | | | | | | | | | | | | | | |
Commodities, Index and Shares | | I | | | — | | | | — | | | | — | | | | — | |
| | II | | | — | | | | — | | | | — | | | | — | |
| | | | | | | | | | | | | | | | | | |
Nonlinear | | I | | | (8.3 | ) | | | — | | | | (22.6 | ) | | | — | |
| | II | | | (11.6 | ) | | | — | | | | (43.2 | ) | | | — | |
| | | | | | | | | | | | | | | | | | |
The following scenarios are used to measure sensitivity:
Interest rate
Based on reasonably possible changes in assumptions of 1, 25 and 50 basis points (scenarios I, II and III respectively) applied to the interest curves, both up and down, taking the largest losses resulting in each scenario.
Commodities, Index and Shares
Based on reasonably possible changes in assumptions of 5 and 10 percentage points (scenarios I and II respectively) applied to share prices, both up and down, taking the largest losses resulting in each scenario.
Nonlinear
Scenario I: Based on reasonably possible changes in assumptions of 5 percentage points on prices and 25 percentage points on the volatility level, both up and down, taking the largest losses resulting in each scenario.
Scenario II: Based on reasonably possible changes in assumptions of 10 percentage points on prices and 25 percentage points on the volatility level, both up and down, taking the largest losses resulting in each scenario.
Note 29 - Contingent Assets and Liabilities, Provisions and Legal Obligations
In the ordinary course of its business, ITAÚ UNIBANCO HOLDING may be a party to legal proceedings to labor, civil and tax nature. The contingencies related to these lawsuits are classified as follows:
a) Contingent Assets: There are no contingent assets recorded.
b) Provisions and contingencies: The criteria to quantify of provisions for contingencies are adequate in relation to the specific characteristics of civil, labor and tax lawsuits portfolios, as well as other risks, taking into consideration the opinion of its legal advisors, the nature of the lawsuits, the similarity with previous lawsuits and the prevailing previous court decisions. A provision is recognized whenever the loss is classified as probable.
Legal liabilities arise from lawsuits filed to discuss the legality and unconstitutionality of the legislation in force, being subject to an accounting provision.
| | |
| Itaú Unibanco Holding S.A. – Complete Financial Statements in IFRS – December 31, 2020 | | F-94 |
ITAÚ UNIBANCO HOLDING S.A.
Notes to the Consolidated Financial Statements
At 12/31/2020 and 12/31/2019 for balance sheet accounts and
From 01/01 to 12/31 of 2020, 2019 and 2018 for income statement accounts
(In millions of Reais, except information per share)
I- Civil lawsuits
In general, provisions and contingencies arise from claims related to the revision of contracts and compensation for material and moral damages. The lawsuits are classified as follows:
Collective lawsuits: Related to claims of a similar nature and with individual amounts that are not considered significant. Provisions are calculated on a monthly basis and the expected amount of losses is accrued according to statistical references that take into account the nature of the lawsuit and the characteristics of the court (Small Claims Court or Regular Court). Contingencies and provisions are adjusted to reflect the amounts deposited into court as guarantee for their execution when realized.
Individual lawsuits: Related to claims with unusual characteristics or involving significant amounts. The probability of loss is ascertained periodically, based on the amount claimed and the special nature of each case. The amounts considered as probable losses are recorded as provisions.
ITAÚ UNIBANCO HOLDING, despite having complied with the rules in force at the time, is a defendant in lawsuits filed by individuals referring to payment of inflation adjustments to savings accounts resulting from economic plans implemented in the 1980s and the 1990s, as well as in collective lawsuits filed by: (i) consumer protection associations; and (ii) the Public Attorney’s Office, on behalf of the savings accounts holders. ITAÚ UNIBANCO HOLDING recognizes provisions upon receipt of summons, and when individuals demand the enforcement of a ruling handed down by the courts, using the same criteria as for provisions for individual lawsuits.
The Federal Supreme Court (STF) has issued some decisions favorable to savings account holders, but it has not established its understanding with respect to the constitutionality of the economic plans and their applicability to savings accounts. Currently, the appeals involving these matters are suspended, by order of the STF, until it pronounces its final decision.
In December 2017, through mediation of the Federal Attorney’s Office (AGU) and supervision of the BACEN, savers (represented by two civil associations, FEBRAPO and IDEC) and FEBRABAN entered into an instrument of agreement aiming at resolving lawsuits related the economic plans, and ITAÚ UNIBANCO HOLDING has already accepted its terms. Said agreement was approved on March 1, 2018, by the Plenary Session of the Federal Supreme Court (STF) and savers could adhere to its terms for a 24-month period.
Due to the end of this term, the parties signed an amendment to the instrument of agreement to extend this period in order to contemplate a higher number of holders of savings accounts and, consequently, to increase the end of lawsuits. In May, 2020 the Federal Supreme Court (STF) approved this amendment and granted a 30-month term for new adhesions, and this term may be extended for another 30 months, subject to the reporting of the number of adhesions over the first period.
II- Labor claims
Provisions for contingencies arise from lawsuits in which labor rights provided for in labor legislation specific to the related profession are discussed, such as: overtime, salary equalization, reinstatement, transfer allowance and, pension plan supplement. These lawsuits are classified as follows:
Collective lawsuits: related to claims considered similar and with individual amounts that are not considered significant. The expected amount of loss is determined and accrued on a monthly basis in accordance with a statistical model which calculates the amount of the claims, and is reassessed taking into account court rulings. Provisions for contingencies are adjusted to reflect the amounts deposited into court as security for execution.
Individual lawsuits: related to claims with unusual characteristics or involving significant amounts. These are periodically calculated based on the amounts claimed. The probability of loss is estimated in accordance with the actual and legal characteristics of each lawsuit.
III- Other Risks
These are quantified and accrued on the basis of the value of rural credit transactions with joint liability and FCVS (salary variations compensation fund) credits assigned to Banco Nacional.
| | |
| Itaú Unibanco Holding S.A. – Complete Financial Statements in IFRS – December 31, 2020 | | F-95 |
ITAÚ UNIBANCO HOLDING S.A.
Notes to the Consolidated Financial Statements
At 12/31/2020 and 12/31/2019 for balance sheet accounts and
From 01/01 to 12/31 of 2020, 2019 and 2018 for income statement accounts
(In millions of Reais, except information per share)
Below are the changes in civil, labor and other risks provisions:
| | | | | | | | | | | | | | | | |
| | | 12/31/2020 | |
| | | Civil | | | Labor | | | Other
Risks | | | Total | |
Opening balance - 01/01 | | | 3,634 | | | | 8,579 | | | | 976 | | | | 13,189 | |
(-) Provisions guaranteed by indemnity clause (Note 2.4.n) | | | (216 | ) | | | (980 | ) | | | — | | | | (1,196 | ) |
Subtotal | | | 3,418 | | | | 7,599 | | | | 976 | | | | 11,993 | |
Adjustment / Interest (Note 23) | | | 191 | | | | 482 | | | | — | | �� | | 673 | |
Changes in the period reflected in income (Note 23) | | | 889 | | | | 2,110 | | | | 547 | | | | 3,546 | |
| | | | | | | | | | | | | | | | |
Increase | | | 1,179 | | | | 2,296 | | | | 550 | | | | 4,025 | |
Reversal | | | (290 | ) | | | (186 | ) | | | (3 | ) | | | (479 | ) |
Payment | | | (1,203 | ) | | | (3,126 | ) | | | (40 | ) | | | (4,369 | ) |
Subtotal | | | 3,295 | | | | 7,065 | | | | 1,483 | | | | 11,843 | |
(+) Provisions guaranteed by indemnity clause (Note 2.4.n) | | | 216 | | | | 950 | | | | — | | | | 1,166 | |
Closing balance | | | 3,511 | | | | 8,015 | | | | 1,483 | | | | 13,009 | |
| | | | | | | | | | | | | | | | |
Current | | | 1,254 | | | | 3,125 | | | | 1,483 | | | | 5,862 | |
Non-current | | | 2,257 | | | | 4,890 | | | | — | | | | 7,147 | |
| | | | | | | | | | | | | | | | |
| |
| | | 12/31/2019 | |
| | | Civil | | | Labor | | | Other
Risks | | | Total | |
Opening balance – 01/01 | | | 4,426 | | | | 6,821 | | | | 573 | | | | 11,820 | |
(-) Provisions guaranteed by indemnity clause (Note 2.4.n) | | | (226 | ) | | | (957 | ) | | | — | | | | (1,183 | ) |
Subtotal | | | 4,200 | | | | 5,864 | | | | 573 | | | | 10,637 | |
Adjustment / Interest (Note 23) | | | 122 | | | | 1,024 | | | | — | | | | 1,146 | |
Changes in the period reflected in income (Note 23) | | | 726 | | | | 3,160 | | | | 403 | | | | 4,289 | |
| | | | | | | | | | | | | | | | |
Increase (*) | | | 1,177 | | | | 3,325 | | | | 435 | | | | 4,937 | |
Reversal | | | (451 | ) | | | (165 | ) | | | (32 | ) | | | (648 | ) |
Payment | | | (1,630 | ) | | | (2,449 | ) | | | — | | | | (4,079 | ) |
Subtotal | | | 3,418 | | | | 7,599 | | | | 976 | | | | 11,993 | |
(+) Provisions guaranteed by indemnity clause (Note 2.4.n) | | | 216 | | | | 980 | | | | — | | | | 1,196 | |
Closing balance | | | 3,634 | | | | 8,579 | | | | 976 | | | | 13,189 | |
| | | | | | | | | | | | | | | | |
Current | | | 1,662 | | | | 2,451 | | | | 976 | | | | 5,089 | |
Non-current | | | 1,972 | | | | 6,128 | | | | — | | | | 8,100 | |
| | | | | | | | | | | | | | | | |
| (*) | Includes the effects of the Voluntary Severance Program. |
IV- Tax proceedings and legal obligations
Tax provisions correspond to the principal amount of taxes involved in administrative or judicial tax lawsuits, subject to tax assessment notices, plus interest and, when applicable, fines and charges.
The table below shows the changes in the provisions:
| | | | | | | | |
| | | 12/31/2020 | | | 12/31/2019 | |
Opening balance - 01/01 | | | 8,266 | | | | 6,793 | |
(-) Provisions guaranteed by indemnity clause (Note 2.4 n) | | | (68 | ) | | | (68 | ) |
Subtotal | | | 8,198 | | | | 6,725 | |
Adjustment / Interest (*) | | | 220 | | | | 779 | |
Changes in the period reflected in income | | | 56 | | | | 843 | |
| | | | | | | | |
Increase (*) | | | 142 | | | | 1,135 | |
Reversal (*) | | | (86 | ) | | | (292 | ) |
Payment | | | (1,735 | ) | | | (151 | ) |
Subtotal | | | 6,739 | | | | 8,196 | |
(+) Provisions guaranteed by indemnity clause (Note 2.4 n) | | | 71 | | | | 70 | |
Closing balance | | | 6,810 | | | | 8,266 | |
| | | | | | | | |
Current | | | 65 | | | | 83 | |
Non-current | | | 6,745 | | | | 8,183 | |
| | | | | | | | |
| (*) | The amounts are included in the headings Tax Expenses, General and Administrative Expenses and Current Income Tax and Social Contribution. |
| | |
| Itaú Unibanco Holding S.A. – Complete Financial Statements in IFRS – December 31, 2020 | | F-96 |
ITAÚ UNIBANCO HOLDING S.A.
Notes to the Consolidated Financial Statements
At 12/31/2020 and 12/31/2019 for balance sheet accounts and
From 01/01 to 12/31 of 2020, 2019 and 2018 for income statement accounts
(In millions of Reais, except information per share)
The main discussions related to Tax Lawsuits and Legal Obligations are described below:
| | • | | INSS – Non-compensatory Amounts – R$ 1,769: the non-levy of social security contribution on amounts paid as profit sharing is defended. The balance of the deposits in guarantee is R$ 991; |
| | • | | PIS and COFINS – Calculation Basis – R$ 643: defending the levy of PIS and COFINS on revenue, a tax on revenue from the sales of assets and services. The balance of the deposits in guarantee is R$ 618. |
c) Contingencies not provided for in the Balance Sheet
Amounts involved in administrative and judicial arguments with the risk of loss estimated as possible are not provided for and they are basically composed of:
I - Civil and Labor Claims
In Civil Lawsuits with possible loss, total estimated risk is R$ 4,470 (R$ 4,266 at 12/31/2019), and in this total there are no amounts arising from interests in Joint Ventures.
For Labor Claims with possible loss, estimated risk is R$ 389 (R$ 251 at 12/31/2019).
II – Tax proceedings
The tax proceedings of possible loss totaled R$ 31,330 (R$ 28,959 at 12/31/2019), and the main cases are described below:
| | • | | INSS – Non-compensatory Amounts – R$ 6,303: defends the non-levy of this contribution on these amounts, among which are profit sharing and stock options; |
| | • | | IRPJ, CSLL, PIS and COFINS – Funding Expenses – R$ 4,857: the deductibility of raising costs (Interbank deposits rates) for funds that were capitalized between Group companies; |
| | • | | ISS – Banking Activities – R$ 3,991: the levy and/or payment place of ISS for certain banking revenues are discussed; |
| | • | | IRPJ and CSLL – Goodwill – Deduction – R$ 3,398: the deductibility of goodwill for future expected profitability on the acquisition of investments; |
| | • | | IRPJ, CSLL, PIS and COFINS – Requests for Offsetting Dismissed—R$ 1,642: cases in which the liquidity and the certainty of credits offset are discussed; |
| | • | | PIS and COFINS – Reversal of Revenues from Depreciation in Excess – R$ 1,346: discussing the accounting and tax treatment of PIS and COFINS upon settlement of leasing operations; |
| | • | | IRPJ and CSLL – Disallowance of Losses – R$ 1,188: discussion on the amount of tax loss (IRPJ) and/or social contribution (CSLL) tax loss carryforwards used by the Federal Revenue Service when drawing up tax assessment notes that are still pending a final decision; |
| | • | | IRPJ and CSLL – Deductibility of Losses with Derivatives – R$ 656: the deductibility of losses calculated in the disposal of financial derivative contracts is being discussed. |
| | |
| Itaú Unibanco Holding S.A. – Complete Financial Statements in IFRS – December 31, 2020 | | F-97 |
ITAÚ UNIBANCO HOLDING S.A.
Notes to the Consolidated Financial Statements
At 12/31/2020 and 12/31/2019 for balance sheet accounts and
From 01/01 to 12/31 of 2020, 2019 and 2018 for income statement accounts
(In millions of Reais, except information per share)
d) Accounts Receivables – Reimbursement of Provisions
The receivables balance arising from reimbursements of contingencies totals R$ 919 (R$ 978 at 12/31/2019) (Note 18a), arising basically from the collateral established in Banco Banerj S.A. privatization process occurred in 1997, when the State of Rio de Janeiro created a fund to guarantee the equity recomposition in provisions for Civil, Labor and Tax Claims.
e) Guarantees of contingencies, provisions and legal obligations
The guarantees related to legal proceedings involving ITAÚ UNIBANCO HOLDING and basically consist of:
| | | | | | | | | | | | | | | | | | | | |
| | | 12/31/2020 | | | 12/31/2019 | |
| | Civil | | | Labor | | | Tax | | | Total | | | Total | |
Deposits in guarantee (Note 18a) | | | 1,476 | | | | 2,126 | | | | 9,091 | | | | 12,693 | | | | 14,520 | |
Investment fund quotas | | | 600 | | | | 303 | | | | 84 | | | | 987 | | | | 1,148 | |
Surety | | | 65 | | | | 69 | | | | 3,878 | | | | 4,012 | | | | 3,223 | |
Insurance bond | | | 1,837 | | | | 1,203 | | | | 15,362 | | | | 18,402 | | | | 14,867 | |
Guarantee by government securities | | | 14 | | | | — | | | | 235 | | | | 249 | | | | 96 | |
| | | | | | | | | | | | | | | | | | | | |
Total | | | 3,992 | | | | 3,701 | | | | 28,650 | | | | 36,343 | | | | 33,854 | |
| | | | | | | | | | | | | | | | | | | | |
ITAÚ UNIBANCO HOLDING’s provisions for judicial and administrative challenges are long-term, considering the time required for their questioning, and this prevents the disclosure of a deadline for their conclusion.
The legal advisors believe that ITAÚ UNIBANCO HOLDING is not a party to this or any other administrative proceedings or lawsuits that could significantly affect the results of its operations.
| | |
| Itaú Unibanco Holding S.A. – Complete Financial Statements in IFRS – December 31, 2020 | | F-98 |
ITAÚ UNIBANCO HOLDING S.A.
Notes to the Consolidated Financial Statements
At 12/31/2020 and 12/31/2019 for balance sheet accounts and
From 01/01 to 12/31 of 2020, 2019 and 2018 for income statement accounts
(In millions of Reais, except information per share)
Note 30 – Segment Information
The current operational and reporting segments of ITAÚ UNIBANCO HOLDING are described below:
The segment comprises retail customers, account holders and non-account holders, individuals and legal entities, high income clients (Itaú Uniclass and Personnalité) and the companies segment (microenterprises and small companies). It includes financing and credit offers made outside the branch network, in addition to credit cards and payroll loans.
It comprises products and services offered to middle-market companies, high net worth clients (Private Banking), and the operation of Latin American units and Itaú BBA, which is the unit responsible for business with large companies and Investment Banking operations.
| • | | Activities with the Market + Corporation |
Basically, corresponds to the result arising from capital surplus, subordinated debt surplus and the net balance of tax credits and debits. It also includes the financial margin on market trading, Treasury operating costs, and equity in earnings of companies not included in either of the other segments.
Segment information is based on the reports used by senior management to assess performance and to make decisions about allocation of funds for investment and other purposes.
These reports use a variety of information for management purposes, including financial and non-financial information supported by bases different from information prepared according to accounting practices adopted in Brazil. The main indicators used for monitoring business performance are Recurring Income, and Return on Economic Capital allocated to each business segment.
Information by segment has been prepared in accordance with accounting practices adopted in Brazil and is adjusted by the items below:
Allocated capital: The statements for each segment consider capital allocation based on a proprietary model and consequent impacts on results arising from this allocation. This model includes the following components: Credit risk, operating risk, market risk and insurance underwriting risk.
Income tax rate: We take the total income tax rate, net of the tax effect from the payment of interest on capital, for the Retail Banking, Wholesale Banking and Activities with the Market + Corporation. The difference between the income tax amount calculated by segment and the effective income tax amount, as stated in the consolidated financial statements, is allocated to the Trading + Institutional column.
| | • | | Reclassification and application of managerial criteria |
The managerial statement of income was used to prepare information per segment. These statements were obtained based on the statement of income adjusted by the impact of non-recurring events and the managerial reclassifications in income.
The main reclassifications between the accounting and managerial results are:
Operating revenues: Considers the opportunity cost for each operation. The financial statements were adjusted so that the stockholders’ equity was replaced by funding at market price. Subsequently, the financial statements were adjusted to include revenues related to capital allocated to each segment. The cost of subordinated debt and the respective remuneration at market price were proportionally allocated to the segments, based on the economic capital allocated.
| | |
| Itaú Unibanco Holding S.A. – Complete Financial Statements in IFRS – December 31, 2020 | | F-99 |
ITAÚ UNIBANCO HOLDING S.A.
Notes to the Consolidated Financial Statements
At 12/31/2020 and 12/31/2019 for balance sheet accounts and
From 01/01 to 12/31 of 2020, 2019 and 2018 for income statement accounts
(In millions of Reais, except information per share)
Tax effects of hedging: The tax effects of hedging of investments abroad were adjusted – they were originally recorded as tax expenses (PIS and COFINS) and Income Tax and Social Contribution on Net Income – and are now reclassified to financial margin.
Insurance: The main reclassifications of revenues refer to the financial margins obtained from technical provisions for insurance, pension plans and premium bonds, in addition to revenue from management of pension plan funds.
Other reclassifications: Other Income, Share of Income of Associates and joint ventures, Non-Operating Income, Profit Sharing of Management Members and Expenses for Credit Card Reward Program were reclassified to those lines representing the way the ITAÚ UNIBANCO HOLDING manages its business, to provide a clearer understanding of our performance.
The adjustments and reclassifications column shows the effects of the differences between the accounting principles followed for the presentation of segment information, which are substantially in line with the accounting practices adopted for financial institutions in Brazil, except as described above, and the policies used in the preparation of these consolidated financial statements according to IFRS. Significant adjustments are as follows:
| | • | | Requirements for impairment testing of financial assets are based on the expected credit losses model; |
| | • | | Adjustment to fair value due to reclassifications of financial assets to categories of measurement at amortized cost, at fair value through profit and loss or at fair value through other comprehensive income, as a result of the concept of business models of IFRS 9; |
| | • | | Financial assets modified and not written-off, with their balances recalculated in accordance with the requirements of IFRS 9; |
| | • | | Effective interest rate of financial assets and liabilities measured at amortized cost, appropriating revenues and costs directly attributable to their acquisition, issue or disposal over the transaction term, whereas in the standards adopted in Brazil, recognition of expenses and revenues from fees occurs at the time these transactions are contracted; |
| | • | | Goodwill generated in a business combination is not amortized, whereas in the standards adopted in Brazil, it is amortized. |
| | |
| Itaú Unibanco Holding S.A. – Complete Financial Statements in IFRS – December 31, 2020 | | F-100 |
ITAÚ UNIBANCO HOLDING S.A.
Notes to the Consolidated Financial Statements
At 12/31/2020 and 12/31/2019 for balance sheet accounts and
From 01/01 to 12/31 of 2020, 2019 and 2018 for income statement accounts
(In millions of Reais, except information per share)
b) Consolidated Statement of Managerial Result
| | | | | | | | | | | | | | | | | | | | | | | | |
| | | 01/01 to 12/31/2020 | |
| | | Retail
Banking | | | Wholesale
Banking | | | Activities with the
Market +
Corporation | | | ITAÚ
UNIBANCO | | | Adjustments | | | IFRS consolidated (3) | |
Operating revenues | | | 72,680 | | | | 32,187 | | | | 9,918 | | | | 114,785 | | | | (14,586 | ) | | | 100,199 | |
Interest margin (1) | | | 41,818 | | | | 19,883 | | | | 8,394 | | | | 70,095 | | | | (20,042 | ) | | | 50,053 | |
Revenues from banking services and bank charges | | | 23,918 | | | | 11,911 | | | | 1,401 | | | | 37,230 | | | | 1,327 | | | | 38,557 | |
Income from insurance and private pension operations before claim andselling expenses | | | 6,944 | | | | 393 | | | | 123 | | | | 7,460 | | | | (2,972 | ) | | | 4,488 | |
Other revenues | | | — | | | | — | | | | — | | | | — | | | | 7,101 | | | | 7,101 | |
Cost of Credit | | | (21,247 | ) | | | (8,968 | ) | | | 6 | | | | (30,209 | ) | | | 5,583 | | | | (24,626 | ) |
Claims | | | (1,345 | ) | | | (8 | ) | | | — | | | | (1,353 | ) | | | (1 | ) | | | (1,354 | ) |
Operating margin | | | 50,088 | | | | 23,211 | | | | 9,924 | | | | 83,223 | | | | (9,004 | ) | | | 74,219 | |
Other operating income / (expenses) | | | (40,221 | ) | | | (16,133 | ) | | | (650 | ) | | | (57,004 | ) | | | (11,985 | ) | | | (68,989 | ) |
Non-interest expenses (2) | | | (35,310 | ) | | | (14,592 | ) | | | (287 | ) | | | (50,189 | ) | | | (14,018 | ) | | | (64,207 | ) |
Tax expenses for ISS, PIS and COFINS and Other | | | (4,911 | ) | | | (1,541 | ) | | | (363 | ) | | | (6,815 | ) | | | 634 | | | | (6,181 | ) |
Share of profit or (loss) in associates and joint ventures | | | — | | | | — | | | | — | | | | — | | | | 1,399 | | | | 1,399 | |
Income before income tax and social contribution | | | 9,867 | | | | 7,078 | | | | 9,274 | | | | 26,219 | | | | (20,989 | ) | | | 5,230 | |
Income tax and social contribution | | | (3,071 | ) | | | (1,893 | ) | | | (3,099 | ) | | | (8,063 | ) | | | 17,897 | | | | 9,834 | |
Non-controlling interest in subsidiaries | | | (175 | ) | | | 601 | | | | (46 | ) | | | 380 | | | | 3,452 | | | | 3,832 | |
Net income | | | 6,621 | | | | 5,786 | | | | 6,129 | | | | 18,536 | | | | 360 | | | | 18,896 | |
| | | | | | | | | | | | | | | | | | | | | | | | |
Total assets (*) – 12/31/2020 | | | 1,265,620 | | | | 981,034 | | | | 143,715 | | | | 2,112,586 | | | | (93,335 | ) | | | 2,019,251 | |
| | | | | | | | | | | | | | | | | | | | | | | | |
Total liabilities – 12/31/2020 | | | 1,218,977 | | | | 915,253 | | | | 108,432 | | | | 1,964,880 | | | | (100,154 | ) | | | 1,864,726 | |
| | | | | | | | | | | | | | | | | | | | | | | | |
(*) Includes: | | | | | | | | | | | | | | | | | | | | | | | | |
Investments in associates and joint ventures | | | 2,012 | | | | — | | | | 13,879 | | | | 15,891 | | | | (321 | ) | | | 15,570 | |
Fixed assets, net | | | 4,587 | | | | 806 | | | | — | | | | 5,393 | | | | 1,544 | | | | 6,937 | |
Goodwill and Intangible assets, net | | | 4,978 | | | | 9,901 | | | | — | | | | 14,879 | | | | 2,451 | | | | 17,330 | |
| | | | | | | | | | | | | | | | | | | | | | | | |
| (1) | Includes interest and similar income, expenses and dividend of R$ 55,420, net gains (loss) on investment securities and derivatives of R$ (8,056) and results from foreign exchange operations and exchange variation of transactions abroad of R$ 2,689. |
| (2) | Refers to general and administrative expenses including depreciation and amortization expenses of R$ (5,064). |
| (3) | The IFRS Consolidated figures do not represent the sum of the parties because there are intercompany transactions that were eliminated only in the consolidated statements. Segments are assessed by top management, net of income and expenses between related parties. |
| | |
| Itaú Unibanco Holding S.A. – Complete Financial Statements in IFRS – December 31, 2020 | | F-101 |
ITAÚ UNIBANCO HOLDING S.A.
Notes to the Consolidated Financial Statements
At 12/31/2020 and 12/31/2019 for balance sheet accounts and
From 01/01 to 12/31 of 2020, 2019 and 2018 for income statement accounts
(In millions of Reais, except information per share)
| | | | | | | | | | | | | | | | | | | | | | | | |
| | | 01/01 to 12/31/2019 | |
| | | Retail
Banking | | | Wholesale
Banking | | | Activities with the
Market +
Corporation | | | ITAÚ
UNIBANCO | | | Adjustments | | | IFRS
consolidated (3) | |
Operating revenues | | | 79,227 | | | | 30,650 | | | | 9,913 | | | | 119,790 | | | | (2,711 | ) | | | 117,079 | |
Interest margin (1) | | | 46,764 | | | | 18,778 | | | | 9,088 | | | | 74,630 | | | | (5,280 | ) | | | 69,350 | |
Commissions and Banking Fees | | | 25,411 | | | | 11,306 | | | | 590 | | | | 37,307 | | | | 1,725 | | | | 39,032 | |
Income from insurance and private pension operations before claim and selling expenses | | | 7,052 | | | | 566 | | | | 235 | | | | 7,853 | | | | (3,300 | ) | | | 4,553 | |
Other revenues | | | — | | | | — | | | | — | | | | — | | | | 4,144 | | | | 4,144 | |
Cost of Credit | | | (16,072 | ) | | | (2,082 | ) | | | — | | | | (18,154 | ) | | | 882 | | | | (17,272 | ) |
Claims | | | (1,206 | ) | | | (59 | ) | | | — | | | | (1,265 | ) | | | (30 | ) | | | (1,295 | ) |
Operating margin | | | 61,949 | | | | 28,509 | | | | 9,913 | | | | 100,371 | | | | (1,859 | ) | | | 98,512 | |
Other operating income / (expenses) | | | (41,430 | ) | | | (15,403 | ) | | | (986 | ) | | | (57,819 | ) | | | (9,450 | ) | | | (67,269 | ) |
Non-interest expenses (2) | | | (36,346 | ) | | | (13,940 | ) | | | (365 | ) | | | (50,651 | ) | | | (10,361 | ) | | | (61,012 | ) |
Tax expenses for ISS, PIS and COFINS and Other | | | (5,084 | ) | | | (1,463 | ) | | | (621 | ) | | | (7,168 | ) | | | (404 | ) | | | (7,572 | ) |
Share of profit or (loss) in associates and joint ventures | | | — | | | | — | | | | — | | | | — | | | | 1,315 | | | | 1,315 | |
Income before income tax and social contribution | | | 20,519 | | | | 13,106 | | | | 8,927 | | | | 42,552 | | | | (11,309 | ) | | | 31,243 | |
Income tax and social contribution | | | (7,095 | ) | | | (3,856 | ) | | | (2,545 | ) | | | (13,496 | ) | | | 10,066 | | | | (3,430 | ) |
Non-controlling interest in subsidiaries | | | (198 | ) | | | (444 | ) | | | (51 | ) | | | (693 | ) | | | (7 | ) | | | (700 | ) |
Net income | | | 13,226 | | | | 8,806 | | | | 6,331 | | | | 28,363 | | | | (1,250 | ) | | | 27,113 | |
| | | | | | | | | | | | | | | | | | | | | | | | |
Total assets (*) – 12/31/2019 | | | 1,056,275 | | | | 682,271 | | | | 147,901 | | | | 1,738,713 | | | | (101,232 | ) | | | 1,637,481 | |
| | | | | | | | | | | | | | | | | | | | | | | | |
Total liabilities – 12/31/2019 | | | 1,013,186 | | | | 625,614 | | | | 104,799 | | | | 1,595,865 | | | | (107,849 | ) | | | 1,488,016 | |
| | | | | | | | | | | | | | | | | | | | | | | | |
(*) Includes: | | | | | | | | | | | | | | | | | | | | | | | | |
Investments in associates and joint ventures | | | 1,911 | | | | — | | | | 13,666 | | | | 15,577 | | | | (480 | ) | | | 15,097 | |
Fixed assets, net | | | 5,252 | | | | 1,160 | | | | — | | | | 6,412 | | | | 754 | | | | 7,166 | |
Goodwill and Intangible assets, net | | | 6,681 | | | | 7,645 | | | | — | | | | 14,326 | | | | 5,393 | | | | 19,719 | |
| | | | | | | | | | | | | | | | | | | | | | | | |
| (1) | Includes interest and similar income,expenses and dividend of R$ 64,325, net gains (loss) on investment securities and derivatives of R$ 4,098 and results from foreign exchange operations and exchange variation of transactions abroad of R$ 927. |
| (2) | Refers to general and administrative expenses including depreciation and amortization expenses of R$ (4,630). |
| (3) | The IFRS Consolidated figures do not represent the sum of the segments because there are intercompany transactions that were eliminated only in the consolidated financial statements. Segments are assessed by top management, net of income and expenses between related parties. |
| | |
| Itaú Unibanco Holding S.A. – Complete Financial Statements in IFRS – December 31, 2020 | | F-102 |
ITAÚ UNIBANCO HOLDING S.A.
Notes to the Consolidated Financial Statements
At 12/31/2020 and 12/31/2019 for balance sheet accounts and
From 01/01 to 12/31 of 2020, 2019 and 2018 for income statement accounts
(In millions of Reais, except information per share)
| | | | | | | | | | | | | | | | | | | | | | | | |
| | | 01/01 to 12/31/2018 | |
| | | Retail
Banking | | | Wholesale
Banking | | | Activities with the
Market +
Corporation | | | ITAÚ
UNIBANCO | | | Adjustments | | | IFRS
consolidated (3) | |
Operating revenues | | | 72,182 | | | | 29,389 | | | | 10,246 | | | | 111,817 | | | | (7,617 | ) | | | 104,200 | |
Interest margin (1) | | | 40,243 | | | | 18,930 | | | | 9,912 | | | | 69,085 | | | | (8,380 | ) | | | 60,705 | |
Commissions and Banking Fees | | | 25,131 | | | | 9,810 | | | | 138 | | | | 35,079 | | | | 1,730 | | | | 36,809 | |
Income from insurance and private pension operations before claim and selling expenses | | | 6,808 | | | | 649 | | | | 196 | | | | 7,653 | | | | (3,692 | ) | | | 3,961 | |
Other revenues | | | — | | | | — | | | | — | | | | — | | | | 2,725 | | | | 2,725 | |
Cost of Credit | | | (12,526 | ) | | | (1,540 | ) | | | — | | | | (14,066 | ) | | | 5,112 | | | | (8,954 | ) |
Claims | | | (1,160 | ) | | | (68 | ) | | | — | | | | (1,228 | ) | | | — | | | | (1,228 | ) |
Operating margin | | | 58,496 | | | | 27,781 | | | | 10,246 | | | | 96,523 | | | | (2,505 | ) | | | 94,018 | |
Other operating income / (expenses) | | | (40,002 | ) | | | (15,217 | ) | | | (1,070 | ) | | | (56,289 | ) | | | (7,121 | ) | | | (63,410 | ) |
Non-interest expenses (2) | | | (35,296 | ) | | | (13,817 | ) | | | (331 | ) | | | (49,444 | ) | | | (8,094 | ) | | | (57,538 | ) |
Tax expenses for ISS, PIS and COFINS and Other | | | (4,706 | ) | | | (1,400 | ) | | | (739 | ) | | | (6,845 | ) | | | 226 | | | | (6,619 | ) |
Share of profit or (loss) in associates and joint ventures | | | — | | | | — | | | | — | | | | — | | | | 747 | | | | 747 | |
Net income before income tax and social contribution | | | 18,494 | | | | 12,564 | | | | 9,176 | | | | 40,234 | | | | (9,626 | ) | | | 30,608 | |
Income tax and social contribution | | | (6,939 | ) | | | (3,829 | ) | | | (2,964 | ) | | | (13,732 | ) | | | 8,763 | | | | (4,969 | ) |
Non-controlling interest in subsidiaries | | | (184 | ) | | | (550 | ) | | | (35 | ) | | | (769 | ) | | | 37 | | | | (732 | ) |
Net income | | | 11,371 | | | | 8,185 | | | | 6,177 | | | | 25,733 | | | | (826 | ) | | | 24,907 | |
| | | | | | | | | | | | | | | | | | | | | | | | |
Total assets (*) – 12/31/2018 | | | 1,042,145 | | | | 655,393 | | | | 142,853 | | | | 1,649,613 | | | | (96,816 | ) | | | 1,552,797 | |
| | | | | | | | | | | | | | | | | | | | | | | | |
Total liabilities – 12/31/2018 | | | 1,005,194 | | | | 597,528 | | | | 93,546 | | | | 1,505,490 | | | | (103,159 | ) | | | 1,402,331 | |
| | | | | | | | | | | | | | | | | | | | | | | | |
(*) Includes: | | | | | | | | | | | | | | | | | | | | | | | | |
Investments in associates and joint ventures | | | 1,220 | | | | — | | | | 11,438 | | | | 12,658 | | | | (639 | ) | | | 12,019 | |
Fixed assets, net | | | 5,526 | | | | 879 | | | | — | | | | 6,405 | | | | 897 | | | | 7,302 | |
Goodwill and Intangible assets, net | | | 6,845 | | | | 8,178 | | | | — | | | | 15,023 | | | | 4,306 | | | | 19,329 | |
| | | | | | | | | | | | | | | | | | | | | | | | |
| (1) | Includes net interest and similar income and expenses of R$ 62,565, net gain (loss) on investment securities and derivatives of R$ (4,834) and foreign exchange results and exchange variation on transactions of abroad R$ 2,974. |
| (2) | Refers to general and administrative expenses including depreciation and amortization expenses of R$ (3,332). |
| (3) | The IFRS Consolidated figures do not represent the sum of the segments because there are intercompany transactions that were eliminated only in the consolidated financial statements. Segments are assessed by top management, net of income and expenses between related parties. |
| | |
| Itaú Unibanco Holding S.A. – Complete Financial Statements in IFRS – December 31, 2020 | | F-103 |
ITAÚ UNIBANCO HOLDING S.A.
Notes to the Consolidated Financial Statements
At 12/31/2020 and 12/31/2019 for balance sheet accounts and
From 01/01 to 12/31 of 2020, 2019 and 2018 for income statement accounts
(In millions of Reais, except information per share)
c) Result of Non-Current Assets and Main Services and Products by Geographic Region
| | | | | | | | | | | | | | | | | | | | | | | | |
| | | 12/31/2020 | | | 12/31/2019 | |
| | Brazil | | | Abroad | | | Total | | | Brazil | | | Abroad | | | Total | |
Non-current assets | | | 17,095 | | | | 7,172 | | | | 24,267 | | | | 16,123 | | | | 10,762 | | | | 26,885 | |
| | | | | | | | | | | | | | | | | | | | | | | | | | | | | | | | | | | | |
| | | 01/01 to 12/31/2020 | | | 01/01 to 12/31/2019 | | | 01/01 to 12/31/2018 | |
| | Brazil | | | Abroad | | | Total | | | Brazil | | | Abroad | | | Total | | | Brazil | | | Abroad | | | Total | |
Income related to financial operations (1) (2) | | | 102,016 | | | | 21,595 | | | | 123,611 | | | | 117,541 | | | | 27,767 | | | | 145,308 | | | | 108,362 | | | | 22,955 | | | | 131,317 | |
Income from insurance and private pension operations before claim and selling expenses | | | 4,488 | | | | — | | | | 4,488 | | | | 4,423 | | | | 130 | | | | 4,553 | | | | 3,812 | | | | 149 | | | | 3,961 | |
Commissions and Banking Fees | | | 34,533 | | | | 4,024 | | | | 38,557 | | | | 35,283 | | | | 3,749 | | | | 39,032 | | | | 33,211 | | | | 3,598 | | | | 36,809 | |
| (1) | Includes interest and similar income, dividend income, net gain (loss) on investment securities and derivatives, foreign exchange results, and exchange variation on transactions abroad. |
| (2) | ITAÚ UNIBANCO HOLDING does not have customers representing 10% or higher of its revenues. |
Note 31 – Related parties
Transactions between related parties are carried out for amounts, terms and average rates in accordance with normal market practices during the period, and under reciprocal conditions.
Transactions between companies and investment funds, included in consolidation (note 2.4a), have been eliminated and do not affect the consolidated statements.
The principal unconsolidated related parties are as follows:
| | • | | Itaú Unibanco Participações S.A. (IUPAR), Companhia E. Johnston de Participações S.A. (shareholder of IUPAR) and ITAÚSA, direct and indirect shareholders of ITAÚ UNIBANCO HOLDING; |
| | • | | The associates, non-financial subsidiaries and joint ventures of ITAÚSA, in particular Duratex S.A., Copagaz – Distribuidora de Gás S.A. and Alpargatas S.A.; |
| | • | | Investments in associates and joint ventures, in particular Porto Seguro Itaú Unibanco Participações S.A., BSF Holding S.A. and XP Inc.; |
| | • | | Pension Plans: Fundação Itaú Unibanco – Previdência Complementar and FUNBEP – Fundo de Pensão Multipatrocinado, closed-end supplementary pension entities, that administer retirement plans sponsored by ITAÚ UNIBANCO HOLDING, created exclusively for employees; |
| | • | | Associations: Associação Cubo Coworking Itaú – a partner entity of ITAÚ UNIBANCO HOLDING its purpose is to encourage and promote the discussion and development of alternative and innovative technologies, business models and solutions; the produce and disseminate the resulting technical and scientific knowledge; the attract and bring in new information technology talents that may be characterized as startups; and to research, develop and establish ecosystems for entrepreneur and startups; |
| | • | | Foundations and Institutes maintained by donations from ITAÚ UNIBANCO HOLDING and by the proceeds generated by their assets, so that they can accomplish their objectives and to maintain their operational and administrative structure: |
Fundação Itaú para a Educação e Cultura – promotes education, culture, social assistance, defense and guarantee of rights, and strengthening of civil society.
Instituto Unibanco – supports projects focused on social assistance, particularly education, culture, promotion of integration into the labor market, and environmental protection, directly or as a supplement to civil institutions.
Instituto Unibanco de Cinema – promotes culture in general and provides access of low-income families to screenings of films, videos, video-laser discs etc, in theaters and movie clubs which it owns or manages including showings of popular movies, in particular Brazilian productions.
Associação Itaú Viver Mais – provides social services for the welfare of beneficiaries, on the terms defined in its Internal Regulations, and according to the funds available. These services may include the promotion of cultural, educational, sports, entertainment and healthcare activities.
| | |
| Itaú Unibanco Holding S.A. – Complete Financial Statements in IFRS – December 31, 2020 | | F-104 |
ITAÚ UNIBANCO HOLDING S.A.
Notes to the Consolidated Financial Statements
At 12/31/2020 and 12/31/2019 for balance sheet accounts and
From 01/01 to 12/31 of 2020, 2019 and 2018 for income statement accounts
(In millions of Reais, except information per share)
a) Transactions with related parties:
| | | | | | | | | | | | | | | | | | | | | | | | |
| | | ITAÚ UNIBANCO HOLDING | |
| | | Annual rate | | | Assets / (Liabilities) | | | Revenues / (Expenses) | |
| | | 12/31/2020 | | | 12/31/2019 | | | 01/01 to
12/31/2020 | | | 01/01 to
12/31/2019 | | | 01/01 to
12/31/2018 | |
|
Short-term Interbank investments | | | | | | | 18,539 | | | | 1,000 | | | | 63 | | | | 58 | | | | — | |
Other | | | 1.90% | | | | 18,539 | | | | 1,000 | | | | 63 | | | | 58 | | | | — | |
Loan operations | | | | | | | 591 | | | | 83 | | | | 56 | | | | 6 | | | | 187 | |
Alpargatas S.A. | |
| 2.50% to 6% /SELIC + 2.35 /CDI
+ 3.85% to 3.95% |
| | | 65 | | | | 30 | | | | 36 | | | | 1 | | | | 3 | |
Duratex S.A. | | | CDI + 1.45% | | | | 515 | | | | — | | | | 19 | | | | — | | | | — | |
Other | | | 113% CDI | | | | 11 | | | | 53 | | | | 1 | | | | 5 | | | | 184 | |
Securities and derivative financial instruments (assets and liabilities) | | | | | | | 1,716 | | | | 99 | | | | 6 | | | | — | | | | (138 | ) |
Investment funds | | | | | | | 107 | | | | 99 | | | | 14 | | | | — | | | | — | |
Copagaz – Distribuidora de Gás S.A. | | | CDI + 1.70% | | | | 950 | | | | — | | | | 1 | | | | — | | | | — | |
Itaúsa S.A. | | | CDI + 2.40% | | | | 771 | | | | — | | | | 1 | | | | — | | | | (138 | ) |
Other | | | | | | | (112 | ) | | | — | | | | (10 | ) | | | — | | | | — | |
Deposits | | | | | | | — | | | | — | | | | (1 | ) | | | (1 | ) | | | (10 | ) |
Other | | | | | | | — | | | | — | | | | (1 | ) | | | (1 | ) | | | (10 | ) |
Deposits received under securities repurchase agreements | | | | | | | (165 | ) | | | (374 | ) | | | (13 | ) | | | (14 | ) | | | (2 | ) |
Alpargatas S.A. | | | 95% to 101% CDI | | | | (107 | ) | | | (4 | ) | | | (11 | ) | | | — | | | | — | |
Duratex S.A. | | | 78% to 99% CDI | | | | (49 | ) | | | (43 | ) | | | (2 | ) | | | (2 | ) | | | (1 | ) |
Other | | | 100% CDI | | | | (9 | ) | | | (327 | ) | | | — | | | | (12 | ) | | | (1 | ) |
Amounts receivable (payable) / Commissions and/or Other General and Administrative expenses | | | | | | | (35 | ) | | | (151 | ) | | | 26 | | | | 3 | | | | 50 | |
Instituto Unibanco | | | | | | | 123 | | | | — | | | | 3 | | | | — | | | | 2 | |
Fundação Itaú Unibanco – Previdência Complementar | | | | | | | (93 | ) | | | (93 | ) | | | 42 | | | | 43 | | | | 51 | |
ConectCar Soluções de Mobilidade Eletrônica S.A. | | | | | | | (46 | ) | | | (46 | ) | | | 7 | | | | 7 | | | | 4 | |
Olímpia Promoção e Serviços S.A. | | | | | | | (9 | ) | | | (5 | ) | | | (45 | ) | | | (31 | ) | | | (25 | ) |
Itaúsa S.A. | | | | | | | (8 | ) | | | 1 | | | | 12 | | | | (28 | ) | | | 6 | |
Fundação Itaú para a Educação e Cultura | | | | | | | (4 | ) | | | — | | | | (3 | ) | | | 1 | | | | 1 | |
FUNBEP—Fundo de Pensão Multipatrocinado | | | | | | | (1 | ) | | | — | | | | 7 | | | | 7 | | | | 6 | |
Other | | | | | | | 3 | | | | (8 | ) | | | 3 | | | | 4 | | | | 5 | |
Rent | | | | | | | — | | | | — | | | | (31 | ) | | | (39 | ) | | | (46 | ) |
Fundação Itaú Unibanco – Previdência Complementar | | | | | | | — | | | | — | | | | (28 | ) | | | (32 | ) | | | (36 | ) |
FUNBEP – Fundo de Pensão Multipatrocinado | | | | | | | — | | | | — | | | | (3 | ) | | | (6 | ) | | | (7 | ) |
Other | | | | | | | — | | | | — | | | | — | | | | (1 | ) | | | (3 | ) |
Donation | | | | | | | (500 | ) | | | — | | | | (1,002 | ) | | | (35 | ) | | | (95 | ) |
Fundação Itaú para a Educação e Cultura | | | | | | | (500 | ) | | | — | | | | (1,000 | ) | | | (35 | ) | | | (95 | ) |
Other | | | | | | | — | | | | — | | | | (2 | ) | | | — | | | | — | |
Sponsorship | | | | | | | 12 | | | | 29 | | | | (16 | ) | | | (15 | ) | | | (32 | ) |
Associação Cubo Coworking Itaú | | | | | | | 12 | | | | 29 | | | | (16 | ) | | | (14 | ) | | | (31 | ) |
Other | | | | | | | — | | | | — | | | | — | | | | (1 | ) | | | (1 | ) |
Operations with Key Management Personnel of ITAÚ UNIBANCO HOLDING present Assets of R$ 65, Liabilities of R$ (6,623) and Results of R$ (58) (R$ 49, R$ (5,758) at 12/31/2019 and R$ (28) from 01/01 to 12/31/2019, respectively).
b) Compensation and Benefits of Key Management Personnel
Compensation and benefits attributed to Managers Members, members of the Audit Committee and the Board of Directors of ITAÚ UNIBANCO HOLDING in the period correspond to:
| | | | | | | | | | | | |
| | | 01/01 to
12/31/2020 | | | 01/01 to
12/31/2019 | | | 01/01 to
12/31/2018 | |
Fees | | | (578 | ) | | | (499 | ) | | | (481 | ) |
Profit sharing | | | (112 | ) | | | (363 | ) | | | (258 | ) |
Post-employment benefits | | | (9 | ) | | | (6 | ) | | | (9 | ) |
Share-based payment plan | | | (228 | ) | | | (224 | ) | | | (212 | ) |
| | | | | | | | | | | | |
Total | | | (927 | ) | | | (1,092 | ) | | | (960 | ) |
| | | | | | | | | | | | |
Total amounts related to share-based payment plans, personnel expenses and post-employment benefits is detailed in Notes 20, 23 and 26, respectively.
| | |
| Itaú Unibanco Holding S.A. – Complete Financial Statements in IFRS – December 31, 2020 | | F-105 |
ITAÚ UNIBANCO HOLDING S.A.
Notes to the Consolidated Financial Statements
At 12/31/2020 and 12/31/2019 for balance sheet accounts and
From 01/01 to 12/31 of 2020, 2019 and 2018 for income statement accounts
(In millions of Reais, except information per share)
Note 32 – Risk and Capital Management
a) Corporate Governance
ITAÚ UNIBANCO HOLDING invests in robust risk management processes and capital management that are the basis for its strategic decisions to ensure business sustainability and maximize shareholder value creation.
These processes are aligned with the guidelines of the Board of Directors and Executive which, through collegiate bodies, define the global objectives expressed as targets and limits for the business units that manage risk. Control and capital management units, in turn, support ITAÚ UNIBANCO HOLDING’s management by monitoring and analyzing risk and capital.
The Board of Directors is the main body responsible for establishing guidelines, policies and approval levels for risk and capital management. The Capital and Risk Management Committee (CGRC), in turn, is responsible for supporting the Board of Directors in managing capital and risk. At the executive level, collegiate bodies, presided over by the Chief Executive Officer (CEO) of ITAÚ UNIBANCO HOLDING, are responsible for capital and risk management, and their decisions are monitored by the CGRC.
Additionally, ITAÚ UNIBANCO HOLDING has collegiate bodies with capital and risk management responsibilities delegated to them, chaired by the Executive Vice-President of the Risk and Finance Department (ARF). To support this structure, ARF has departments to ensure, on an independent and centralized basis, that the institution’s risks and capital are managed in compliance with defined policies and procedures.
b) Risk Management
Risk Appetite
The risk appetite of ITAÚ UNIBANCO HOLDING is based on the Board of Director’s statement:
“We are a universal bank, operating mainly in Latin America. Supported by our risk culture, we insist on with strict ethical standards and regulatory compliance, seeking high and increasing returns, with low volatility, through lasting relationships with our customers, accurate risk pricing, widespread funding and proper use of capital.”
Based on this statement, five dimensions have been defined, each dimension consists of a set of metrics associated with the main risks involved, combining supplementary measurement methods, to give a comprehensive vision of our exposure.
The Board of Directors is responsible for approving guidelines and limits for risk appetite, with the support of CGRC and the CRO (Chief Risk Officer).
The limits for risk appetite are monitored regularly and reported to risk committees and to the Board of Directors, which will oversee the preventive measures to be taken to ensure that exposure is aligned with the strategies of ITAÚ UNIBANCO HOLDING.
The five dimensions of risk appetite are:
| | • | | Capitalization: establishes that ITAÚ UNIBANCO HOLDING must have capital sufficient to face any serious recession period or a stress event without the need to adjust its capital structure under unfavorable circumstances. It is monitored by tracking ITAÚ UNIBANCO HOLDING’s capital ratios, both in normal and stress scenarios, and of the ratings of the institution’s debt issues. |
| | • | | Liquidity: establishes that the liquidity of ITAÚ UNIBANCO HOLDING must withstand long periods of stress. It is monitored tracking liquidity indicators. |
| | • | | Composition of results: defines that business will be focused primarily on Latin America, where ITAÚ UNIBANCO HOLDING has a diversified base of customers and products, with low appetite for income volatility or for high risk. This dimension comprises aspects related to business, profitability, market risk and credit risk. By adopting exposure concentration limits, such as industry sectors, counterparty quality, countries and geographical regions and risk factors, these monitored metrics are intended to ensure well-adjusted portfolios, low income volatility and business sustainability. |
| | |
| Itaú Unibanco Holding S.A. – Complete Financial Statements in IFRS – December 31, 2020 | | F-106 |
ITAÚ UNIBANCO HOLDING S.A.
Notes to the Consolidated Financial Statements
At 12/31/2020 and 12/31/2019 for balance sheet accounts and
From 01/01 to 12/31 of 2020, 2019 and 2018 for income statement accounts
(In millions of Reais, except information per share)
| | • | | Operational risk: focuses on the control of operating risk events that may adversely impact business and operating strategy, and involves monitoring the main operational risk events and losses incurred. |
| | • | | Reputation: addresses risks that may impact the institution’s brand value and reputation with customers, employees, regulatory bodies, investors and the general public. The risk monitoring in this dimension is carried out by tracking customer satisfaction or dissatisfaction and media exposure, in addition to monitoring the institution’s conduct. |
Risk appetite, risk management and guidelines for employees of ITAÚ UNIBANCO HOLDING for routine decision-making purposes are based on:
| | • | | Sustainability and customer satisfaction: ITAÚ UNIBANCO HOLDING vision is to be the leading bank in sustainable performance and customer satisfaction and, accordingly, we are committed to creating shared value for staff, customers, stockholders and society, ensuring the continuity of the business. ITAÚ UNIBANCO HOLDING is committed to doing business that is good both for the customer and the institution itself; |
| | • | | Risk culture: ITAÚ UNIBANCO HOLDING’s risk culture goes beyond policies, procedures or processes, reinforcing the individual and collective responsibility of all employees so that they will do the right thing at the right time and in the proper manner, respecting the ethical way of doing business; |
| | • | | Risk pricing: ITAÚ UNIBANCO HOLDING’s operates and assumes risks in business that it knows and understands, avoids the ones that are unknown or that do not provide competitive advantages, and carefully assesses risk-return ratios; |
| | • | | Diversification: ITAÚ UNIBANCO HOLDING has little appetite for volatility in earnings, and it therefore operates with a diverse base of customers, products and business, seeking to diversify risks and giving priority to lower risk business; |
| | • | | Operational excellence: It is the wish of ITAÚ UNIBANCO HOLDING to be an agile bank, with a robust and stable infrastructure enabling us to offer top quality services; |
| | • | | Ethics and respect for regulations: for ITAÚ UNIBANCO HOLDING, ethics is non-negotiable, and it therefore promotes an institutional environment of integrity, encouraging staff to cultivate ethics in relationships and business and to respect the rules, thus caring for the institution’s reputation. |
ITAÚ UNIBANCO HOLDING has various ways of disseminating risk culture, based on four principles: conscious risk-taking, discussion of the risks the institution faces, the corresponding action taken, and the responsibility of everyone for managing risk.
These principles serve as a basis for ITAÚ UNIBANCO HOLDING guidelines, helping employees to conscientiously understand, identify, measure, manage and mitigate risks.
1. Credit risk
The possibility of losses arising from failure by a borrower, issuer or counterparty to meet their financial obligations, the impairment of a loan due to downgrading of the risk rating of the borrower, the issuer or the counterparty, a decrease in earnings or remuneration, advantages conceded on renegotiation or the costs of recovery.
There is a credit risk control and management structure, centralized and independent from the business units, that provides for operating limits and risk mitigation mechanisms, and also establishes processes and tools to measure, monitor and control the credit risk inherent in all products, portfolio concentrations and impacts of potential changes in the economic environment.
The credit policy of ITAÚ UNIBANCO HOLDING is based on internal criteria such as: classification of customers, portfolio performance and changes, default levels, rate of return and economic capital allocated, and external factors such as interest rates, market default indicators, inflation, changes in consumption, and so on.
| | |
| Itaú Unibanco Holding S.A. – Complete Financial Statements in IFRS – December 31, 2020 | | F-107 |
ITAÚ UNIBANCO HOLDING S.A.
Notes to the Consolidated Financial Statements
At 12/31/2020 and 12/31/2019 for balance sheet accounts and
From 01/01 to 12/31 of 2020, 2019 and 2018 for income statement accounts
(In millions of Reais, except information per share)
For personal customers and small and middle-market companies, credit rating is based on statistical application models (at the early stages of the relationship with a customer) and behavior score (used for customers with which ITAÚ UNIBANCO HOLDING already has a relationship).
For large companies, the rating is based on information such as economic and financial condition of the counterparty, their cash-generating capability, the economic group to which they belong, and the current and prospective situation of the economic sector in which they operate. Credit proposals are analyzed on a case by case basis, through an approval-level mechanism.
ITAÚ UNIBANCO HOLDING strictly controls the credit exposure of customers and counterparties, taking action to address situations in which the current exposure exceeds what is desirable. For this purpose, measures provided for in loan agreements are available, such as accelerated maturity or a requirement for additional collateral.
1.1 Collateral and policies for mitigating credit risk
ITAÚ UNIBANCO HOLDING uses guarantees to increase its capacity for recovery in operations exposed to credit risk. The guarantees may be personal, secured, legal structures with mitigating power and offset agreements.
For collateral to be considered instruments that mitigate credit risk, they must comply with the requirements and standards that regulate them, both internal and external ones, and they must be legally valid (effective), enforceable, and assessed on a regular basis.
ITAÚ UNIBANCO HOLDING also uses credit derivatives, to mitigate credit risk of its portfolios of loans and securities. These instruments are priced based on models that use the fair value of market inputs, such as credit spreads, recovery rates, correlations and interest rates.
1.2 Policy for Provisioning and Economic Scenarios
Both the credit risk and the finance areas are responsible for defining the methods used to measure expected loan losses and for periodically assessing changes in the provision amounts.
These areas monitor the trends observed in provisions for expected credit losses by segment, in addition to establishing an initial understanding of the variables that may trigger changes in the allowance for loan losses, the probability of default (PD) or the loss given default (LGD).
Once the trends have been identified and an initial assessment of the variables has been made at the corporate level, the business areas are responsible for further analyzing these trends in more detail and for each segment, in order to understand the underlying reasons for the trends and to decide whether changes are required in credit policies.
Provisions for expected losses take into account the expected risk linked to contracts with similar characteristics and in anticipation of signs of deterioration, over a loss horizon suitable for the remaining period of the contract to maturity. For contracts of products with no determined termination date, average results of deterioration and default are used to determine the loss horizon.
Additionally, information on economic scenarios and public data with internal projections are used to determine and adjust the expected credit loss in line with expected macroeconomic realities.
| | |
| Itaú Unibanco Holding S.A. – Complete Financial Statements in IFRS – December 31, 2020 | | F-108 |
ITAÚ UNIBANCO HOLDING S.A.
Notes to the Consolidated Financial Statements
At 12/31/2020 and 12/31/2019 for balance sheet accounts and
From 01/01 to 12/31 of 2020, 2019 and 2018 for income statement accounts
(In millions of Reais, except information per share)
Sensitivity analysis
ITAÚ UNIBANCO HOLDING prepares studies on the impact of estimates in the calculation of expected credit loss. The expected loss models use three different scenarios: Optimistic, Base and Pessimistic.In Brazil, where operations are substantially carried out, these scenarios are combined by weighting their probabilities: 15%, 40% and 45% (2019 – 10%, 75% and 15%), respectively, which are updated so as to reflect the new economic conditions. For loan portfolios originated in other countries, the scenarios are weighted by different probabilities, considering regional economic aspects and conditions
The table below shows the amount of financial assets at amortized cost and at fair value through other comprehensive income, expected loss and the impacts on the calculation of expected credit loss in the adoption of 100% of each scenario:
| | | | | | | | | | | | | | | | | | | | | | | | | | | | | | | | | | | | |
12/31/2020 | | | 12/31/2019 | |
| | | | | | Reduction/(Increase) of | | | | | | | | | Reduction/(Increase) of | |
Financial Assets (1) | | Expected
Loss (2) | | | Expected Loss | | | Financial
Assets (1) | | | Expected
Loss (2) | | | Expected Loss | |
| | Pessimistic
scenario | | | Base
scenario | | | Optimistic scenario | | | Pessimistic
scenario | | | Base
scenario | | | Optimistic
scenario | |
951,343 | | | (51,480 | ) | | | (830 | ) | | | 491 | | | | 1,416 | | | | 793,610 | | | | (40,247 | ) | | | (328 | ) | | | 13 | | | | 193 | |
| (1) | Composed of Loan operations, lease operations and securities. |
| (2) | Comprises expected credit loss for Financial Guarantees R$ (907) (R$ (837) at 12/31/2019) and Loan Commitments R$ (3,485) (R$ (3,303) at 12/31/2019). |
1.3 Classification of Stages of Credit Impairment
ITAÚ UNIBANCO HOLDING uses customers’ internal information, statistic models, days of default and quantitative analysis in order to determine the credit status of portfolio agreements.
Rules for changing stages take into account lower and higher internal limits (quantitative criteria), in addition to the relative variation in the rating since the initial recognition. Information on days of delay, used on an absolute basis, is an important factor for the classification of stages, and after a certain credit status has been defined for an agreement, it is classified in one of the three stages of credit deterioration. Based on this classification, rules for measuring expected credit loss in each stage are used, as described in Note 2.4d.
For retail and middle market portfolios, ITAÚ UNIBANCO HOLDING classifies loan agreements which are over 30 days overdue in stage 2, except payroll loans for government agency, for which the figure is 45 days, due to the dynamics of payment for transfer of the product.
For the Wholesale business portfolio, information on arrears is taken into account when allocating a rating.
Default parameters are: 90 days with no payments made(*); debt restructuring; adjudication of bankruptcy; loss; and court-ordered restructuring.
| (*) | For the real estate loans portfolio, the figure is 180 days with no payments made. |
| | |
| Itaú Unibanco Holding S.A. – Complete Financial Statements in IFRS – December 31, 2020 | | F-109 |
ITAÚ UNIBANCO HOLDING S.A.
Notes to the Consolidated Financial Statements
At 12/31/2020 and 12/31/2019 for balance sheet accounts and
From 01/01 to 12/31 of 2020, 2019 and 2018 for income statement accounts
(In millions of Reais, except information per share)
1.4 Maximum Exposure of Financial Assets to Credit Risk
| | | | | | | | | | | | | | | | | | | | | | | | |
| | | 12/31/2020 | | | 12/31/2019 | |
| | | Brazil | | | Abroad | | | Total | | | Brazil | | | Abroad | | | Total | |
Financial Assets | | | 1,294,428 | | | | 466,835 | | | | 1,761,263 | | | | 1,073,430 | | | | 336,803 | | | | 1,410,233 | |
At Amortized Cost | | | 861,485 | | | | 324,255 | | | | 1,185,740 | | | | 755,773 | | | | 254,871 | | | | 1,010,644 | |
Interbank deposits | | | 17,775 | | | | 37,910 | | | | 55,685 | | | | 10,620 | | | | 23,963 | | | | 34,583 | |
Securities purchased under agreements to resell | | | 237,528 | | | | 2,415 | | | | 239,943 | | | | 197,157 | | | | 1,271 | | | | 198,428 | |
Securities | | | 103,146 | | | | 26,658 | | | | 129,804 | | | | 114,046 | | | | 19,073 | | | | 133,119 | |
Loan and lease operations | | | 468,461 | | | | 245,643 | | | | 714,104 | | | | 386,206 | | | | 199,585 | | | | 585,791 | |
Other financial assets | | | 67,425 | | | | 25,830 | | | | 93,255 | | | | 75,968 | | | | 18,784 | | | | 94,752 | |
(-) Provision for Expected Loss | | | (32,850 | ) | | | (14,201 | ) | | | (47,051 | ) | | | (28,224 | ) | | | (7,805 | ) | | | (36,029 | ) |
At Fair Value Through Other Comprehensive Income | | | 48,992 | | | | 60,950 | | | | 109,942 | | | | 35,990 | | | | 40,670 | | | | 76,660 | |
Securities | | | 48,992 | | | | 60,950 | | | | 109,942 | | | | 35,990 | | | | 40,670 | | | | 76,660 | |
At Fair Value Through Profit or Loss | | | 383,951 | | | | 81,630 | | | | 465,581 | | | | 281,667 | | | | 41,262 | | | | 322,929 | |
Securities | | | 365,718 | | | | 23,353 | | | | 389,071 | | | | 271,470 | | | | 9,605 | | | | 281,075 | |
Derivatives | | | 18,227 | | | | 58,277 | | | | 76,504 | | | | 10,197 | | | | 31,657 | | | | 41,854 | |
Other financial assets | | | 6 | | | | — | | | | 6 | | | | — | | | | — | | | | — | |
Financial liabilities – provision for expected loss | | | 3,655 | | | | 737 | | | | 4,392 | | | | 3,581 | | | | 559 | | | | 4,140 | |
Loan Commitments | | | 3,135 | | | | 350 | | | | 3,485 | | | | 2,909 | | | | 394 | | | | 3,303 | |
Financial Guarantees | | | 520 | | | | 387 | | | | 907 | | | | 672 | | | | 165 | | | | 837 | |
Off balance sheet | | | 372,542 | | | | 58,773 | | | | 431,315 | | | | 338,262 | | | | 48,893 | | | | 387,155 | |
Financial Guarantees | | | 51,830 | | | | 17,103 | | | | 68,933 | | | | 52,663 | | | | 14,057 | | | | 66,720 | |
Letters of credit to be released | | | 41,477 | | | | — | | | | 41,477 | | | | 15,013 | | | | — | | | | 15,013 | |
Loan commitments | | | 279,235 | | | | 41,670 | | | | 320,905 | | | | 270,586 | | | | 34,836 | | | | 305,422 | |
Mortgage loans | | | 6,357 | | | | — | | | | 6,357 | | | | 5,536 | | | | — | | | | 5,536 | |
Overdraft accounts | | | 126,302 | | | | — | | | | 126,302 | | | | 124,449 | | | | — | | | | 124,449 | |
Credit cards | | | 144,386 | | | | 3,859 | | | | 148,245 | | | | 138,014 | | | | 2,823 | | | | 140,837 | |
Other pre-approved limits | | | 2,190 | | | | 37,811 | | | | 40,001 | | | | 2,587 | | | | 32,013 | | | | 34,600 | |
| | | | | | | | | | | | | | | | | | | | | | | | |
Total | | | 1,663,315 | | | | 524,871 | | | | 2,188,186 | | | | 1,408,111 | | | | 385,137 | | | | 1,793,248 | |
| | | | | | | | | | | | | | | | | | | | | | | | |
| | |
| Itaú Unibanco Holding S.A. – Complete Financial Statements in IFRS – December 31, 2020 | | F-110 |
ITAÚ UNIBANCO HOLDING S.A.
Notes to the Consolidated Financial Statements
At 12/31/2020 and 12/31/2019 for balance sheet accounts and
From 01/01 to 12/31 of 2020, 2019 and 2018 for income statement accounts
(In millions of Reais, except information per share)
Amounts shown for credit risk exposure are based on gross book value and do not take into account any collateral received or other added credit improvements.
The contractual amounts of financial guarantees and letters of credit cards represent the maximum potential of credit risk in the event that a counterparty does not meet the terms of the agreement. The vast majority of loan commitments (mortgage loans, overdraft accounts and other pre-approved limits) mature without being drawn, since they are renewed monthly and can be cancelled unilaterally.
As a result, the total contractual amount does not represent our real future exposure to credit risk or the liquidity needs arising from such commitments.
1.4.1. By business sector
Loans and lease operations
| | | | | | | | | | | | | | | | |
| | | 12/31/2020 | | | % | | | 12/31/2019 | | | % | |
Industry and commerce | | | 163,784 | | | | 22.9 | | | | 129,998 | | | | 22.2 | |
Services | | | 172,322 | | | | 24.1 | | | | 126,718 | | | | 21.6 | |
Other sectors | | | 37,565 | | | | 5.3 | | | | 26,693 | | | | 4.6 | |
Individuals | | | 340,433 | | | | 47.7 | | | | 302,382 | | | | 51.6 | |
| | | | | | | | | | | | | | | | |
Total | | | 714,104 | | | | 100.0 | | | | 585,791 | | | | 100.0 | |
| | | | | | | | | | | | | | | | |
Other financial assets (*)
| | | | | | | | | | | | | | | | |
| | | 12/31/2020 | | | % | | | 12/31/2019 | | | % | |
Public sector | | | 713,705 | | | | 71.2 | | | | 562,485 | | | | 73.5 | |
Services | | | 79,788 | | | | 8.0 | | | | 59,193 | | | | 7.7 | |
Other sectors | | | 67,636 | | | | 6.8 | | | | 45,744 | | | | 6.0 | |
Financial | | | 139,820 | | | | 14.0 | | | | 98,297 | | | | 12.8 | |
| | | | | | | | | | | | | | | | |
Total | | | 1,000,949 | | | | 100.0 | | | | 765,719 | | | | 100.0 | |
| | | | | | | | | | | | | | | | |
| (*) | Includes Financial Assets at Fair Value through Profit and Loss, Financial Assets at Fair Value through Other Comprehensive Income and Financial Assets at Amortized Cost, except for Loan and Lease Operations and Other Financial Assets. |
The exposure of Off Balance financial instruments (Financial Collaterals and Loan Commitments) is neither categorized nor managed by business sector.
| | |
| Itaú Unibanco Holding S.A. – Complete Financial Statements in IFRS – December 31, 2020 | | F-111 |
ITAÚ UNIBANCO HOLDING S.A.
Notes to the Consolidated Financial Statements
At 12/31/2020 and 12/31/2019 for balance sheet accounts and
From 01/01 to 12/31 of 2020, 2019 and 2018 for income statement accounts
(In millions of Reais, except information per share)
1.4.2 By type and classification of credit risk
Loan and lease operations
| | | | | | | | | | | | | | | | | | | | | | | | | | | | | | | | | | | | | | | | | | | | | | | | | | | | | | | | | | | | | | | | |
12/31/2020 | |
| | | Stage 1 | | | Stage 2 | | | Stage 3 | | | Total Consolidated of 3 stages | |
| | | Loans
Operations | | | Loan
commitments | | | Financial
Guarantees | | | Total | | | Loans
Operations | | | Loan
commitments | | | Financial
Guarantees | | | Total | | | Loans
Operations | | | Loan
commitments | | | Financial
Guarantees | | | Total | | | Loans
Operations | | | Loan
commitments | | | Financial
Guarantees | | | Total | |
Individuals | | | 199,158 | | | | 190,273 | | | | 854 | | | | 390,285 | | | | 30,793 | | | | 19,387 | | | | — | | | | 50,180 | | | | 25,532 | | | | 987 | | | | — | | | | 26,519 | | | | 255,483 | | | | 210,647 | | | | 854 | | | | 466,984 | |
Corporate | | | 123,665 | | | | 17,670 | | | | 43,602 | | | | 184,937 | | | | 2,793 | | | | 16 | | | | 595 | | | | 3,404 | | | | 8,063 | | | | 93 | | | | 2,516 | | | | 10,672 | | | | 134,521 | | | | 17,779 | | | | 46,713 | | | | 199,013 | |
Micro/Small and medium companies | | | 96,784 | | | | 50,813 | | | | 5,434 | | | | 153,031 | | | | 15,965 | | | | 3,884 | | | | 440 | | | | 20,289 | | | | 9,206 | | | | 307 | | | | 131 | | | | 9,644 | | | | 121,955 | | | | 55,004 | | | | 6,005 | | | | 182,964 | |
Foreign loans - Latin America | | | 167,601 | | | | 35,960 | | | | 14,498 | | | | 218,059 | | | | 16,692 | | | | 1,414 | | | | 676 | | | | 18,782 | | | | 17,852 | | | | 101 | | | | 187 | | | | 18,140 | | | | 202,145 | | | | 37,475 | | | | 15,361 | | | | 254,981 | |
| | | | | | | | | | | | | | | | | | | | | | | | | | | | | | | | | | | | | | | | | | | | | | | | | | | | | | | | | | | | | | | | |
Total | | | 587,208 | | | | 294,716 | | | | 64,388 | | | | 946,312 | | | | 66,243 | | | | 24,701 | | | | 1,711 | | | | 92,655 | | | | 60,653 | | | | 1,488 | | | | 2,834 | | | | 64,975 | | | | 714,104 | | | | 320,905 | | | | 68,933 | | | | 1,103,942 | |
| | | | | | | | | | | | | | | | | | | | | | | | | | | | | | | | | | | | | | | | | | | | | | | | | | | | | | | | | | | | | | | | |
% | | | 62.1 | | | | 31.1 | | | | 6.8 | | | | 100.0 | | | | 71.5 | | | | 26.7 | | | | 1.8 | | | | 100.0 | | | | 93.3 | | | | 2.3 | | | | 4.4 | | | | 100.0 | | | | 64.7 | | | | 29.1 | | | | 6.2 | | | | 100.0 | |
| | | | | | | | | | | | | | | | | | | | | | | | | | | | | | | | | | | | | | | | | | | | | | | | | | | | | | | | | | | | | | | | |
| | | | | | | | | | | | | | | | | | | | | | | | | | | | | | | | | | | | | | | | | | | | | | | | | | | | | | | | | | | | | | | | |
| | | 12/31/2019 | |
| | | Stage 1 | | | Stage 2 | | | Stage 3 | | | Total Consolidated of 3 stages | |
| | | Loans
Operations | | | Loan
commitments | | | Financial
Guarantees | | | Total | | | Loans
Operations | | | Loan
commitments | | | Financial
Guarantees | | | Total | | | Loans
Operations | | | Loan
commitments | | | Financial
Guarantees | | | Total | | | Loans
Operations | | | Loan
commitments | | | Financial
Guarantees | | | Total | |
Individuals | | | 199,907 | | | | 197,717 | | | | 861 | | | | 398,485 | | | | 19,070 | | | | 6,437 | | | | — | | | | 25,507 | | | | 21,513 | | | | 763 | | | | — | | | | 22,276 | | | | 240,490 | | | | 204,917 | | | | 861 | | | | 446,268 | |
Corporate | | | 91,448 | | | | 16,411 | | | | 44,720 | | | | 152,579 | | | | 911 | | | | 22 | | | | 200 | | | | 1,133 | | | | 8,430 | | | | 102 | | | | 3,420 | | | | 11,952 | | | | 100,789 | | | | 16,535 | | | | 48,340 | | | | 165,664 | |
Micro/Small and medium companies | | | 77,722 | | | | 50,307 | | | | 4,817 | | | | 132,846 | | | | 7,225 | | | | 2,378 | | | | 38 | | | | 9,641 | | | | 5,786 | | | | 190 | | | | 46 | | | | 6,022 | | | | 90,733 | | | | 52,875 | | | | 4,901 | | | | 148,509 | |
Foreign loans - Latin America | | | 132,812 | | | | 29,842 | | | | 12,087 | | | | 174,741 | | | | 14,714 | | | | 1,166 | | | | 424 | | | | 16,304 | | | | 6,253 | | | | 87 | | | | 107 | | | | 6,447 | | | | 153,779 | | | | 31,095 | | | | 12,618 | | | | 197,492 | |
| | | | | | | | | | | | | | | | | | | | | | | | | | | | | | | | | | | | | | | | | | | | | | | | | | | | | | | | | | | | | | | | |
Total | | | 501,889 | | | | 294,277 | | | | 62,485 | | | | 858,651 | | | | 41,920 | | | | 10,003 | | | | 662 | | | | 52,585 | | | | 41,982 | | | | 1,142 | | | | 3,573 | | | | 46,697 | | | | 585,791 | | | | 305,422 | | | | 66,720 | | | | 957,933 | |
| | | | | | | | | | | | | | | | | | | | | | | | | | | | | | | | | | | | | | | | | | | | | | | | | | | | | | | | | | | | | | | | |
% | | | 58.5 | | | | 34.3 | | | | 7.2 | | | | 100.0 | | | | 79.7 | | | | 19.0 | | | | 1.3 | | | | 100.0 | | | | 89.9 | | | | 2.4 | | | | 7.7 | | | | 100.0 | | | | 61.1 | | | | 31.9 | | | | 7.0 | | | | 100.0 | |
| | | | | | | | | | | | | | | | | | | | | | | | | | | | | | | | | | | | | | | | | | | | | | | | | | | | | | | | | | | | | | | | |
| | | | | | | | | | | | | | | | | | | | | | | | | | | | | | | | |
Internal Rating | | 12/31/2020 | | | 12/31/2019 | |
| | Stage 1 | | | Stage 2 | | | Stage 3 | | | Total loans | | | Stage 1 | | | Stage 2 | | | Stage 3 | | | Total loans | |
Low | | | 501,463 | | | | 13,172 | | | | — | | | | 514,635 | | | | 420,936 | | | | 4,204 | | | | — | | | | 425,140 | |
Medium | | | 84,193 | | | | 37,249 | | | | — | | | | 121,442 | | | | 80,106 | | | | 17,871 | | | | — | | | | 97,977 | |
High | | | 1,552 | | | | 15,822 | | | | — | | | | 17,374 | | | | 847 | | | | 19,845 | | | | — | | | | 20,692 | |
Credit-Impaired | | | — | | | | — | | | | 60,653 | | | | 60,653 | | | | — | | | | — | | | | 41,982 | | | | 41,982 | |
| | | | | | | | | | | | | | | | | | | | | | | | | | | | | | | | |
Total | | | 587,208 | | | | 66,243 | | | | 60,653 | | | | 714,104 | | | | 501,889 | | | | 41,920 | | | | 41,982 | | | | 585,791 | |
| | | | | | | | | | | | | | | | | | | | | | | | | | | | | | | | |
% | | | 82.2 | | | | 9.3 | | | | 8.5 | | | | 100.0 | | | | 85.6 | | | | 7.2 | | | | 7.2 | | | | 100.0 | |
| | | | | | | | | | | | | | | | | | | | | | | | | | | | | | | | |
| | |
| Itaú Unibanco Holding S.A. – Complete Financial Statements in IFRS – December 31, 2020 | | F-112 |
ITAÚ UNIBANCO HOLDING S.A.
Notes to the Consolidated Financial Statements
At 12/31/2020 and 12/31/2019 for balance sheet accounts and
From 01/01 to 12/31 of 2020, 2019 and 2018 for income statement accounts
(In millions of Reais, except information per share)
Other financial assets
| | | | | | | | | | | | | | | | | | | | | | | | | | | | |
| | | 12/31/2020 | |
| | | | | | Stage 1 | | | Stage 2 | | | Stage 3 | |
| | | Fair Value | | | Cost | | | Fair Value | | | Cost | | | Fair Value | | | Cost | | | Fair Value | |
Investment funds | | | 14,204 | | | | 3,232 | | | | 2,997 | | | | 10,943 | | | | 10,943 | | | | 1,232 | | | | 264 | |
Government securities | | | 483,791 | | | | 479,477 | | | | 483,791 | | | | — | | | | — | | | | — | | | | — | |
Brazilian government | | | 422,098 | | | | 417,782 | | | | 422,098 | | | | — | | | | — | | | | — | | | | — | |
Other Public | | | — | | | | 36 | | | | — | | | | — | | | | — | | | | — | | | | — | |
Other countries | | | 61,693 | | | | 61,659 | | | | 61,693 | | | | — | | | | — | | | | — | | | | — | |
Argentina | | | 1,498 | | | | 1,480 | | | | 1,498 | | | | — | | | | — | | | | — | | | | — | |
United States | | | 5,835 | | | | 5,847 | | | | 5,835 | | | | — | | | | — | | | | — | | | | — | |
Mexico | | | 10,222 | | | | 10,227 | | | | 10,222 | | | | — | | | | — | | | | — | | | | — | |
Italy | | | 130 | | | | 133 | | | | 130 | | | | — | | | | — | | | | — | | | | — | |
Spain | | | 4,844 | | | | 4,847 | | | | 4,844 | | | | — | | | | — | | | | — | | | | — | |
Korea | | | 3,947 | | | | 3,951 | | | | 3,947 | | | | — | | | | — | | | | — | | | | — | |
Chile | | | 23,195 | | | | 23,183 | | | | 23,195 | | | | — | | | | — | | | | — | | | | — | |
Paraguay | | | 2,950 | | | | 3,011 | | | | 2,950 | | | | — | | | | — | | | | — | | | | — | |
Uruguay | | | 978 | | | | 964 | | | | 978 | | | | — | | | | — | | | | — | | | | — | |
Colombia | | | 8,089 | | | | 8,012 | | | | 8,089 | | | | — | | | | — | | | | — | | | | — | |
Peru | | | 5 | | | | 4 | | | | 5 | | | | — | | | | — | | | | — | | | | — | |
Corporate securities | | | 127,757 | | | | 122,695 | | | | 122,326 | | | | 3,485 | | | | 2,738 | | | | 5,873 | | | | 2,693 | |
Rural product note | | | 5,823 | | | | 5,717 | | | | 5,723 | | | | 38 | | | | 36 | | | | 115 | | | | 64 | |
Real estate receivables certificates | | | 5,342 | | | | 5,290 | | | | 5,268 | | | | 77 | | | | 73 | | | | — | | | | 1 | |
Bank deposit certificate | | | 1,066 | | | | 1,064 | | | | 1,066 | | | | — | | | | — | | | | — | | | | — | |
Debentures | | | 62,723 | | | | 57,963 | | | | 58,365 | | | | 2,402 | | | | 1,779 | | | | 5,462 | | | | 2,579 | |
Eurobonds and other | | | 7,604 | | | | 7,445 | | | | 7,604 | | | | — | | | | — | | | | — | | | | — | |
Financial bills | | | 15,783 | | | | 15,784 | | | | 15,783 | | | | — | | | | — | | | | — | | | | — | |
Promissory notes | | | 7,629 | | | | 7,611 | | | | 7,629 | | | | — | | | | — | | | | — | | | | — | |
Other | | | 21,787 | | | | 21,821 | | | | 20,888 | | | | 968 | | | | 850 | | | | 296 | | | | 49 | |
| | | | | | | | | | | | | | | | | | | | | | | | | | | | |
Total | | | 625,752 | | | | 605,404 | | | | 609,114 | | | | 14,428 | | | | 13,681 | | | | 7,105 | | | | 2,957 | |
| | | | | | | | | | | | | | | | | | | | | | | | | | | | |
| | |
| Itaú Unibanco Holding S.A. – Complete Financial Statements in IFRS – December 31, 2020 | | F-113 |
ITAÚ UNIBANCO HOLDING S.A.
Notes to the Consolidated Financial Statements
At 12/31/2020 and 12/31/2019 for balance sheet accounts and
From 01/01 to 12/31 of 2020, 2019 and 2018 for income statement accounts
(In millions of Reais, except information per share)
| | | | | | | | | | | | | | | | | | | | | | | | | | | | |
| | | 12/31/2019 | |
| | | | | | Stage 1 | | | Stage 2 | | | Stage 3 | |
| | | Fair Value | | | Cost | | | Fair Value | | | Cost | | | Fair Value | | | Cost | | | Fair Value | |
Investment funds | | | 8,267 | | | | 8,322 | | | | 8,062 | | | | — | | | | — | | | | 955 | | | | 205 | |
Government securities | | | 366,998 | | | | 364,078 | | | | 366,998 | | | | — | | | | — | | | | — | | | | — | |
Brazilian government | | | 327,681 | | | | 324,637 | | | | 327,681 | | | | — | | | | — | | | | — | | | | — | |
Other Public | | | — | | | | 36 | | | | — | | | | — | | | | — | | | | — | | | | — | |
Other countries | | | 39,317 | | | | 39,405 | | | | 39,317 | | | | — | | | | — | | | | — | | | | — | |
Argentina | | | 318 | | | | 349 | | | | 318 | | | | — | | | | — | | | | — | | | | — | |
United States | | | 2,977 | | | | 2,979 | | | | 2,977 | | | | — | | | | — | | | | — | | | | — | |
Mexico | | | 7,820 | | | | 7,820 | | | | 7,820 | | | | — | | | | — | | | | — | | | | — | |
Italy | | | 329 | | | | 328 | | | | 329 | | | | — | | | | — | | | | — | | | | — | |
Spain | | | 4,984 | | | | 4,984 | | | | 4,984 | | | | — | | | | — | | | | — | | | | — | |
Korea | | | 3,427 | | | | 3,427 | | | | 3,427 | | | | — | | | | — | | | | — | | | | — | |
Chile | | | 12,317 | | | | 12,227 | | | | 12,317 | | | | — | | | | — | | | | — | | | | — | |
Paraguay | | | 1,782 | | | | 1,959 | | | | 1,782 | | | | — | | | | — | | | | — | | | | — | |
Uruguay | | | 710 | | | | 716 | | | | 710 | | | | — | | | | — | | | | — | | | | — | |
Colombia | | | 4,622 | | | | 4,585 | | | | 4,622 | | | | — | | | | — | | | | — | | | | — | |
Peru | | | 8 | | | | 8 | | | | 8 | | | | — | | | | — | | | | — | | | | — | |
Germany | | | 23 | | | | 23 | | | | 23 | | | | — | | | | — | | | | — | | | | — | |
Corporate securities | | | 112,936 | | | | 109,169 | | | | 108,685 | | | | 637 | | | | 402 | | | | 6,784 | | | | 3,849 | |
Rural product note | | | 5,341 | | | | 5,122 | | | | 5,114 | | | | 62 | | | | 58 | | | | 204 | | | | 169 | |
Real estate receivables certificates | | | 7,312 | | | | 7,253 | | | | 7,280 | | | | 10 | | | | 11 | | | | 20 | | | | 21 | |
Bank deposit certificate | | | 3,217 | | | | 3,217 | | | | 3,217 | | | | — | | | | — | | | | — | | | | — | |
Debentures | | | 51,510 | | | | 47,751 | | | | 47,607 | | | | 336 | | | | 283 | | | | 6,311 | | | | 3,620 | |
Eurobonds and other | | | 5,732 | | | | 5,671 | | | | 5,704 | | | | 29 | | | | 28 | | | | — | | | | — | |
Financial bills | | | 18,514 | | | | 18,517 | | | | 18,514 | | | | — | | | | — | | | | — | | | | — | |
Promissory notes | | | 5,311 | | | | 5,314 | | | | 5,311 | | | | — | | | | — | | | | — | | | | — | |
Other | | | 15,999 | | | | 16,324 | | | | 15,938 | | | | 200 | | | | 22 | | | | 249 | | | | 39 | |
| | | | | | | | | | | | | | | | | | | | | | | | | | | | |
Total | | | 488,201 | | | | 481,569 | | | | 483,745 | | | | 637 | | | | 402 | | | | 7,739 | | | | 4,054 | |
| | | | | | | | | | | | | | | | | | | | | | | | | | | | |
| | |
| Itaú Unibanco Holding S.A. – Complete Financial Statements in IFRS – December 31, 2020 | | F-114 |
ITAÚ UNIBANCO HOLDING S.A.
Notes to the Consolidated Financial Statements
At 12/31/2020 and 12/31/2019 for balance sheet accounts and
From 01/01 to 12/31 of 2020, 2019 and 2018 for income statement accounts
(In millions of Reais, except information per share)
Other Financial Assets—Internal Classification by Level of Risk
| | | | | | | | | | | | | | | | | | | | |
| | | 12/31/2020 | |
| | | Financial Assets - At Amortized Cost | | | | | | | | | | |
Internal rating | | Interbank deposits and
securities purchased under
agreements to resell | | | Securities | | | Financial assets at fair value
through profit or loss (*) | | | Financial Assets at fair value
through other
comprehensive income | | | Total | |
Low | | | 295,334 | | | | 123,553 | | | | 463,168 | | | | 109,942 | | | | 991,997 | |
Medium | | | — | | | | 4,396 | | | | 2,192 | | | | — | | | | 6,588 | |
High | | | 294 | | | | 1,855 | | | | 215 | | | | — | | | | 2,364 | |
| | | | | | | | | | | | | | | | | | | | |
Total | | | 295,628 | | | | 129,804 | | | | 465,575 | | | | 109,942 | | | | 1,000,949 | |
| | | | | | | | | | | | | | | | | | | | |
% | | | 29.5 | | | | 13.0 | | | | 46.5 | | | | 11.0 | | | | 100.0 | |
| | | | | | | | | | | | | | | | | | | | |
| (*) | Includes Derivatives in the amount of R$ 76,504 at 12/31/2020. |
| | | | | | | | | | | | | | | | | | | | |
| | | 12/31/2019 | |
| | | Financial Assets - At Amortized Cost | | | | | | | | | | |
Internal rating | | Interbank deposits and
securities purchased under
agreements to resell | | | Securities | | | Financial assets at fair value
through profit or loss (*) | | | Financial Assets at fair value
through other
comprehensive income | | | Total | |
Low | | | 233,011 | | | | 127,251 | | | | 321,595 | | | | 76,660 | | | | 758,517 | |
Medium | | | — | | | | 3,721 | | | | 952 | | | | — | | | | 4,673 | |
High | | | — | | | | 2,147 | | | | 382 | | | | — | | | | 2,529 | |
| | | | | | | | | | | | | | | | | | | | |
Total | | | 233,011 | | | | 133,119 | | | | 322,929 | | | | 76,660 | | | | 765,719 | |
| | | | | | | | | | | | | | | | | | | | |
% | | | 30.4 | | | | 17.4 | | | | 42.2 | | | | 10.0 | | | | 100.0 | |
| | | | | | | | | | | | | | | | | | | | |
| (*) | Includes Derivatives in the amount of R$ 41,854 at 12/31/2019. |
| | |
| Itaú Unibanco Holding S.A. – Complete Financial Statements in IFRS – December 31, 2020 | | F-115 |
ITAÚ UNIBANCO HOLDING S.A.
Notes to the Consolidated Financial Statements
At 12/31/2020 and 12/31/2019 for balance sheet accounts and
From 01/01 to 12/31 of 2020, 2019 and 2018 for income statement accounts
(In millions of Reais, except information per share)
1.4.3 Collateral for loans and lease operations
| | | | | | | | | | | | | | | | | | | | | | | | | | | | | | | | |
| | | 12/31/2020 | | | 12/31/2019 | |
| | | Over-collateralized assets | | | Under-collateralized assets | | | Over-collateralized assets | | | Under-collateralized assets | |
| | | Carrying
value of
the assets | | | Fair value of
collateral | | | Carrying
value of the
assets | | | Fair value
of collateral | | | Carrying
value of
the assets | | | Fair value
of
collateral | | | Carrying
value of the
assets | | | Fair value
of collateral | |
Individuals | | | 80,907 | | | | 202,819 | | | | 1,746 | | | | 1,621 | | | | 65,921 | | | | 170,045 | | | | 1,997 | | | | 1,867 | |
Personal (1) | | | 1,960 | | | | 6,759 | | | | 737 | | | | 698 | | | | 978 | | | | 2,982 | | | | 857 | | | | 819 | |
Vehicles (2) | | | 21,595 | | | | 44,673 | | | | 999 | | | | 918 | | | | 17,720 | | | | 37,355 | | | | 1,102 | | | | 1,020 | |
Mortgage loans (3) | | | 57,352 | | | | 151,387 | | | | 10 | | | | 5 | | | | 47,223 | | | | 129,708 | | | | 38 | | | | 28 | |
Micro, small and medium companies and corporates (4) | | | 151,129 | | | | 444,696 | | | | 31,582 | | | | 27,011 | | | | 115,608 | | | | 311,043 | | | | 11,097 | | | | 6,142 | |
Foreign loans – Latin America (4) | | | 161,987 | | | | 309,489 | | | | 15,381 | | | | 9,050 | | | | 123,367 | | | | 222,300 | | | | 7,348 | | | | 2,841 | |
Total | | | 394,023 | | | | 957,004 | | | | 48,709 | | | | 37,682 | | | | 304,896 | | | | 703,388 | | | | 20,442 | | | | 10,850 | |
| | | | | | | | | | | | | | | | | | | | | | | | | | | | | | | | |
| (1) | In general requires financial collaterals. |
| (2) | Vehicles themselves are pledged as collateral, as well as assets leased in lease operations. |
| (3) | Properties themselves are pledged as collateral. |
| (4) | Any collateral set forth in the credit policy of ITAÚ UNIBANCO HOLDING (chattel mortgage, surety/joint debtor, mortgage and others). |
Of total loans and lease operations R$ 271,372 (R$ 260,453 at 12/31/2019), represented unsecured loans.
| | |
| Itaú Unibanco Holding S.A. – Complete Financial Statements in IFRS – December 31, 2020 | | F-116 |
ITAÚ UNIBANCO HOLDING S.A.
Notes to the Consolidated Financial Statements
At 12/31/2020 and 12/31/2019 for balance sheet accounts and
From 01/01 to 12/31 of 2020, 2019 and 2018 for income statement accounts
(In millions of Reais, except information per share)
1.4.4 Repossessed assets
Assets received from the foreclosure of loans, including real estate, are initially recorded at the lower of: (i) the fair value of the asset less the estimated selling expenses, or (ii) the carrying amount of the loan.
Further impairment of assets is recorded as a provision, with a corresponding charge to income. The maintenance costs of these assets are expensed as incurred.
The policy for sales of these assets includes periodic auctions that are announced to the market in advance, and provides that the assets cannot be held for more than one year, as stipulated by BACEN.
Total repossessed assets in the period were R$ 224 (R$ 390 from 01/01 to 12/31/2019), mainly composed of real estate.
2. Market risk
The possibility of incurring financial losses from changes in the market value of positions held by a financial institution, including the risks of transactions subject to fluctuations in currency rates, interest rates, share prices, price indexes and commodity prices, as set forth by CMN. Price Indexes are also treated as a risk factor group.
Market risk is controlled by an area independent from the business areas, which is responsible for the daily activities of (i) risk measurement and assessment, (ii) monitoring of stress scenarios, limits and alerts, (iii) application, analysis and testing of stress scenarios, (iv) risk reporting to those responsible within the business areas, in compliance with the governance of ITAÚ UNIBANCO HOLDING, (v) monitoring of actions required to adjust positions and risk levels to make them realistic, and (vi) providing support for the safe launch of new financial products.
The market risk structure categorizes transactions as part of either the banking portfolio or the trading portfolio, in accordance with general criteria established by CMN Resolution 4,557, of February 23, 2017, and BACEN Circular 3,354, of June 27, 2007. The trading portfolio consists of all transactions involving financial instruments and commodities, including derivatives, which are held for trading. The banking portfolio is basically characterized by transactions for the banking business, and transactions related to the management of the balance sheet of the institution, where there is no intention of sale and time horizons are medium and long term.
Market risk management is based on the following metrics:
| | • | | Value at risk (VaR): a statistical measure that estimates the expected maximum potential economic loss under normal market conditions, considering a certain time horizon and confidence level; |
| | • | | Losses in stress scenarios (Stress Test): simulation technique to assess the behavior of assets, liabilities and derivatives of a portfolio when several risk factors are taken to extreme market situations (based on prospective and historical scenarios); |
| | • | | Stop loss: metrics used to revise positions, should losses accumulated in a fixed period reach a certain level; |
| | • | | Concentration: cumulative exposure of a certain financial instrument or risk factor, calculated at market value (MtM – Mark to Market); and |
| | • | | Stressed VaR: statistical metric derived from the VaR calculation, with the purpose is of simulating higher risk in the trading portfolio, taking returns that can be seen in past scenarios of extreme volatility. |
Management of interest rate risk in the Banking Book (IRRBB) is based on the following metrics:
| | • | | DEVE (Delta Economic Value of Equity): difference between the present value of the sum of repricing flows of instruments subject to IRRBB in a base scenario and the present value of the sum of repricing flows of these instruments in a scenario of shock in interest rates; |
| | |
| Itaú Unibanco Holding S.A. – Complete Financial Statements in IFRS – December 31, 2020 | | F-117 |
ITAÚ UNIBANCO HOLDING S.A.
Notes to the Consolidated Financial Statements
At 12/31/2020 and 12/31/2019 for balance sheet accounts and
From 01/01 to 12/31 of 2020, 2019 and 2018 for income statement accounts
(In millions of Reais, except information per share)
| | • | | DNII (Delta Net Interest Income): difference between the result of financial intermediation of instruments subject to IRRBB in a base scenario and the result of financial intermediation of these instruments in a scenario of shock in interest rates. |
In addition, sensitivity and loss control measures are also analyzed. They include:
| | • | | Mismatching analysis (GAPS): accumulated exposure by risk factor of cash flows expressed at market value, allocated at the maturity dates; |
| | • | | Sensitivity (DV01- Delta Variation): impact on the market value of cash flows, when submitted to an one annual basis point increase in the current interest rates or index rate; |
| | • | | Sensitivity to Sundry Risk Factors (Greeks): partial derivatives of an option portfolio in relation to the prices of underlying assets, implied volatilities, interest rates and time. |
In order to operate within the defined limits, ITAÚ UNIBANCO HOLDING hedges transactions with customers and proprietary positions, including its foreign investments. Derivatives are commonly used for these hedging activities, which can be either accounting or economic hedges, both governed by the institutional polices of ITAÚ UNIBANCO HOLDING.
The structure of limits and alerts obeys the Board of Directors’ guidelines, and it is reviewed and approved on an annual basis. This structure has specific limits aimed at improving the process of monitoring and understanding risk, and at avoiding concentration. These limits are quantified by assessing the forecast balance sheet results, the size of stockholders’ equity, market liquidity, complexity and volatility, and ITAU UNIBANCO HOLDING’s appetite for risk.
The consumption of market risk limits is monitored and disclosed daily through exposure and sensitivity maps. The market risk area analyzes and controls the adherence of these exposures to limits and alerts and reports them timely to the Treasury desks and other structures foreseen in the governance.
ITAÚ UNIBANCO HOLDING uses proprietary systems to measure the consolidated market risk. The processing of these systems occurs in a high-availability access -controlled environment, which has data storage and recovery processes and an infrastructure that ensures business continuity in contingency (disaster recovery) situations.
2.1 VaR – Consolidated ITAÚ UNIBANCO HOLDING
Is calculated by Historical Simulation, i.e. the expected distribution for profits and losses (P&L) of a portfolio over time can be estimated from past behavior of returns of market risk factors for this portfolio. VaR is calculated at a confidence level of 99%, historical period of 4 years (1000 business days) and a holding period of one day. In addition, in a conservative approach, VaR is calculated daily, with and without volatility weighting, and the final VaR is the more restrictive of the values given by the two methods.
From 01/01 to 12/31/2020, the average total VaR in Historical Simulation was R$ 282 or 0.2% of total stockholders’ equity (R$ 334 from 01/01 to 12/31/2019 or 0.2% of total stockholders’ equity).
| | | | | | | | | | | | | | | | | | | | | | | | | | | | | | | | |
| | | VaR Total (Historical Simulation) (Reais million) | |
| | | 12/31/2020 (*) | | | 12/31/2019 (*) | |
| | | Average | | | Minimum | | | Maximum | | | Var Total | | | Average | | | Minimum | | | Maximum | | | Var Total | |
VaR by risk factor group | | | 614 | | | | 292 | | | | 1,961 | | | | 431 | | | | 816 | | | | 652 | | | | 960 | | | | 813 | |
Interest rates | | | | | | | | | | | | | | | | | | | | | | | | | | | | | | | | |
Currencies | | | 29 | | | | 9 | | | | 71 | | | | 24 | | | | 28 | | | | 11 | | | | 59 | | | | 11 | |
Shares | | | 23 | | | | 9 | | | | 49 | | | | 30 | | | | 30 | | | | 14 | | | | 57 | | | | 29 | |
Commodities | | | 2 | | | | 1 | | | | 4 | | | | 1 | | | | 2 | | | | 1 | | | | 5 | | | | 1 | |
Effect of diversification | | | — | | | | — | | | | — | | | | (263 | ) | | | — | | | | — | | | | — | | | | (576 | ) |
| | | | | | | | | | | | | | | | | | | | | | | | | | | | | | | | |
Total risk | | | 282 | | | | 166 | | | | 763 | | | | 223 | | | | 334 | | | | 209 | | | | 472 | | | | 278 | |
| | | | | | | | | | | | | | | | | | | | | | | | | | | | | | | | |
| (*) | VaR by Group of Risk Factors considers information from foreign units. |
| | |
| Itaú Unibanco Holding S.A. – Complete Financial Statements in IFRS – December 31, 2020 | | F-118 |
ITAÚ UNIBANCO HOLDING S.A.
Notes to the Consolidated Financial Statements
At 12/31/2020 and 12/31/2019 for balance sheet accounts and
From 01/01 to 12/31 of 2020, 2019 and 2018 for income statement accounts
(In millions of Reais, except information per share)
2.1.1 Interest rate risk
The table below shows the accounting position of financial assets and liabilities exposed to interest rate risk, distributed by maturity (remaining contractual terms). This table is not used directly to manage interest rate risks; it is mostly used to permit the assessment of mismatching between accounts and products associated thereto and to identify possible risk concentration.
| | | | | | | | | | | | | | | | | | | | | | | | | | | | | | | | | | | | | | | | | | | | | | | | |
| | | 12/31/2020 | | | 12/31/2019 | |
| | | 0-30
days | | | 31-180
days | | | 181-365
days | | | 1-5
years | | | Over 5
years | | | Total | | | 0-30
days | | | 31-180
days | | | 181-365
days | | | 1-5
years | | | Over 5
years | | | Total | |
Financial assets | | | 478,065 | | | | 335,803 | | | | 185,587 | | | | 568,219 | | | | 227,397 | | | | 1,795,071 | | | | 264,750 | | | | 382,751 | | | | 141,277 | | | | 443,579 | | | | 203,328 | | | | 1,435,685 | |
At amortized cost | | | 406,497 | | | | 251,388 | | | | 121,432 | | | | 314,949 | | | | 125,282 | | | | 1,219,548 | | | | 222,026 | | | | 354,893 | | | | 102,649 | | | | 244,862 | | | | 111,666 | | | | 1,036,096 | |
Compulsory deposits in the Central Bank of Brazil | | | 83,133 | | | | — | | | | — | | | | — | | | | — | | | | 83,133 | | | | 86,836 | | | | — | | | | — | | | | — | | | | — | | | | 86,836 | |
Interbank deposits | | | 34,998 | | | | 5,410 | | | | 8,178 | | | | 6,864 | | | | 187 | | | | 55,637 | | | | 23,337 | | | | 4,448 | | | | 3,290 | | | | 3,474 | | | | 32 | | | | 34,581 | |
Securities purchased under agreements to resell | | | 196,053 | | | | 43,625 | | | | 170 | | | | 10 | | | | 77 | | | | 239,935 | | | | 22,617 | | | | 175,643 | | | | — | | | | — | | | | 162 | | | | 198,422 | |
Securities | | | 9,325 | | | | 16,907 | | | | 11,440 | | | | 55,070 | | | | 33,997 | | | | 126,739 | | | | 1,290 | | | | 13,659 | | | | 14,817 | | | | 56,178 | | | | 44,522 | | | | 130,466 | |
Loan and lease operations | | | 82,988 | | | | 185,446 | | | | 101,644 | | | | 253,005 | | | | 91,021 | | | | 714,104 | | | | 87,946 | | | | 161,143 | | | | 84,542 | | | | 185,210 | | | | 66,950 | | | | 585,791 | |
At fair value through other comprehensive income | | | 13,357 | | | | 12,557 | | | | 6,958 | | | | 54,452 | | | | 22,618 | | | | 109,942 | | | | 2,464 | | | | 4,524 | | | | 3,284 | | | | 46,456 | | | | 19,932 | | | | 76,660 | |
At fair value through profit and loss | | | 58,211 | | | | 71,858 | | | | 57,197 | | | | 198,818 | | | | 79,497 | | | | 465,581 | | | | 40,260 | | | | 23,334 | | | | 35,344 | | | | 152,261 | | | | 71,730 | | | | 322,929 | |
Securities | | | 40,577 | | | | 63,455 | | | | 48,092 | | | | 178,565 | | | | 58,382 | | | | 389,071 | | | | 33,262 | | | | 15,420 | | | | 32,299 | | | | 137,612 | | | | 62,482 | | | | 281,075 | |
Derivatives | | | 17,634 | | | | 8,403 | | | | 9,099 | | | | 20,253 | | | | 21,115 | | | | 76,504 | | | | 6,998 | | | | 7,914 | | | | 3,045 | | | | 14,649 | | | | 9,248 | | | | 41,854 | |
Other financial assets | | | — | | | | — | | | | 6 | | | | — | | | | — | | | | 6 | | | | — | | | | — | | | | — | | | | — | | | | — | | | | — | |
Financial liabilities | | | 624,542 | | | | 141,647 | | | | 122,233 | | | | 452,797 | | | | 118,616 | | | | 1,459,835 | | | | 508,064 | | | | 115,876 | | | | 74,582 | | | | 309,571 | | | | 86,135 | | | | 1,094,228 | |
At amortized cost | | | 607,741 | | | | 134,640 | | | | 109,560 | | | | 426,488 | | | | 101,753 | | | | 1,380,182 | | | | 501,401 | | | | 106,763 | | | | 71,460 | | | | 288,584 | | | | 77,991 | | | | 1,046,199 | |
Deposits | | | 370,604 | | | | 80,456 | | | | 59,955 | | | | 277,055 | | | | 20,940 | | | | 809,010 | | | | 272,447 | | | | 38,873 | | | | 22,877 | | | | 154,032 | | | | 18,831 | | | | 507,060 | |
Securities sold under repurchase agreements | | | 220,219 | | | | 3,001 | | | | 1,962 | | | | 23,811 | | | | 24,371 | | | | 273,364 | | | | 218,055 | | | | 4,121 | | | | 1,700 | | | | 13,309 | | | | 19,398 | | | | 256,583 | |
Interbank market funds | | | 9,542 | | | | 48,407 | | | | 36,972 | | | | 56,482 | | | | 4,632 | | | | 156,035 | | | | 9,845 | | | | 54,141 | | | | 41,253 | | | | 66,818 | | | | 2,805 | | | | 174,862 | |
Institutional market funds | | | 6,950 | | | | 2,247 | | | | 10,142 | | | | 67,159 | | | | 51,810 | | | | 138,308 | | | | 600 | | | | 8,472 | | | | 4,763 | | | | 53,452 | | | | 36,957 | | | | 104,244 | |
Premium bonds plans | | | 426 | | | | 529 | | | | 529 | | | | 1,981 | | | | — | | | | 3,465 | | | | 454 | | | | 1,156 | | | | 867 | | | | 973 | | | | — | | | | 3,450 | |
At fair value through profit and loss | | | 16,801 | | | | 7,007 | | | | 12,673 | | | | 26,309 | | | | 16,863 | | | | 79,653 | | | | 6,663 | | | | 9,113 | | | | 3,122 | | | | 20,987 | | | | 8,144 | | | | 48,029 | |
Derivatives | | | 16,791 | | | | 7,002 | | | | 12,672 | | | | 26,252 | | | | 16,788 | | | | 79,505 | | | | 6,653 | | | | 9,100 | | | | 3,096 | | | | 20,906 | | | | 8,073 | | | | 47,828 | |
Structured notes | | | 10 | | | | — | | | | 1 | | | | 57 | | | | 75 | | | | 143 | | | | 10 | | | | 13 | | | | 26 | | | | 81 | | | | 71 | | | | 201 | |
Other financial liabilities | | | — | | | | 5 | | | | — | | | | — | | | | — | | | | 5 | | | | — | | | | — | | | | — | | | | — | | | | — | | | | — | |
Difference assets / liabilities (*) | | | (146,477 | ) | | | 194,156 | | | | 63,354 | | | | 115,422 | | | | 108,781 | | | | 335,236 | | | | (243,314 | ) | | | 266,875 | | | | 66,695 | | | | 134,008 | | | | 117,193 | | | | 341,457 | |
Cumulative difference | | | (146,477 | ) | | | 47,679 | | | | 111,033 | | | | 226,455 | | | | 335,236 | | | | | | | | (243,314 | ) | | | 23,561 | | | | 90,256 | | | | 224,264 | | | | 341,457 | | | | | |
Ratio of cumulative difference to total interest-bearing assets | | | (8.2 | %) | | | 2.7 | % | | | 6.2 | % | | | 12.6 | % | | | 18.7 | % | | | | | | | (16.9 | %) | | | 1.6 | % | | | 6.3 | % | | | 15.6 | % | | | 23.8 | % | | | | |
| | | | | | | | | | | | | | | | | | | | | | | | | | | | | | | | | | | | | | | | | | | | | | | | |
| (*) | The difference arises from the mismatch between the maturities of all remunerated assets and liabilities, at the respective period-end date, considering the contractually agreed terms. |
| | |
| Itaú Unibanco Holding S.A. – Complete Financial Statements in IFRS – December 31, 2020 | | F-119 |
ITAÚ UNIBANCO HOLDING S.A.
Notes to the Consolidated Financial Statements
At 12/31/2020 and 12/31/2019 for balance sheet accounts and
From 01/01 to 12/31 of 2020, 2019 and 2018 for income statement accounts
(In millions of Reais, except information per share)
2.1.2 Currency risk
The purpose of ITAÚ UNIBANCO HOLDING’s management of foreign exchange exposure is to mitigate the effects arising from variation in foreign exchange rates, which may present high- volatility periods.
The currency (or foreign exchange) risk arises from positions that are sensitive to oscillations in foreign exchange rates. These positions may be originated by financial instruments that are denominated in a currency other than the functional currency in which the balance sheet is measured or through positions in derivative instruments (for negotiation or hedge). Sensitivity to currency risk is disclosed in the table VaR Total (Historical Simulation) described in item 2.1 – VaR Consolidated – ITAÚ UNIBANCO HOLDING.
2.1.3 Share Price Risk
The exposure to share price risk is disclosed in Note 5, related to Financial Assets Through Profit or Loss - Securities, and Note 8, related to Financial Assets at Fair Value Through Other Comprehensive Income - Securities.
3. Liquidity risk
The possibility that the institution may be unable to efficiently meet its expected and unexpected obligations, both current and future, including those arising from guarantees issued, without affecting its daily operations and without incurring significant losses.
Liquidity risk is controlled by an area independent from the business area and responsible for establishing the reserve composition, estimating the cash flow and exposure to liquidity risk in different time horizons, and for monitoring the minimum limits to absorb losses in stress scenarios for each country where ITAÚ UNIBANCO HOLDING operates. All activities are subject to verification by independent validation, internal control and audit areas.
Liquidity management policies and limits are based on prospective scenarios and senior management’s guidelines. These scenarios are reviewed on a periodic basis, by analyzing the need for cash due to atypical market conditions or strategic decisions by ITAÚ UNIBANCO HOLDING.
ITAÚ UNIBANCO HOLDING manages and controls liquidity risk on a daily basis, using procedures approved in superior committees, including the adoption of liquidity minimum limits, sufficient to absorb possible cash losses in stress scenarios, measured with the use of internal and regulatory methods.
Additionally the following items for monitoring and supporting decisions are periodically prepared and submitted to senior management:
| | • | | Different scenarios projected for changes in liquidity; |
| | • | | Contingency plans for crisis situations; |
| | • | | Reports and charts that describe the risk positions; |
| | • | | Assessment of funding costs and alternative sources of funding; |
| | • | | Monitoring of changes in funding through a constant control of sources of funding, considering the type of investor, maturities and other factors. |
3.1 Primary sources of funding
ITAÚ UNIBANCO HOLDING has different sources of funding, of which a significant portion is from the retail segment. Of total customers’ funds, 37.1% or R$ 379.5 billion, are immediately available to customers. However, the historical behavior of the accumulated balance of the two largest items in this group – demand and savings deposits - is relatively consistent with the balances increasing over time and inflows exceeding outflows for monthly average amounts.
| | |
| Itaú Unibanco Holding S.A. – Complete Financial Statements in IFRS – December 31, 2020 | | F-120 |
ITAÚ UNIBANCO HOLDING S.A.
Notes to the Consolidated Financial Statements
At 12/31/2020 and 12/31/2019 for balance sheet accounts and
From 01/01 to 12/31 of 2020, 2019 and 2018 for income statement accounts
(In millions of Reais, except information per share)
| | | | | | | | | | | | | | | | | | | | | | | | |
Funding from customers | | 12/31/2020 | | | 12/31/2019 | |
| | 0-30 days | | | Total | | | % | | | 0-30 days | | | Total | | | % | |
Deposits | | | 370,604 | | | | 809,010 | | | | | | | | 272,447 | | | | 507,060 | | | | | |
Demand deposits | | | 134,805 | | | | 134,805 | | | | 13.2 | | | | 82,306 | | | | 82,306 | | | | 11.5 | |
Savings deposits | | | 179,470 | | | | 179,470 | | | | 17.5 | | | | 144,558 | | | | 144,558 | | | | 20.2 | |
Time deposits | | | 55,778 | | | | 491,234 | | | | 48.0 | | | | 44,855 | | | | 277,166 | | | | 38.8 | |
Other | | | 551 | | | | 3,501 | | | | 0.3 | | | | 728 | | | | 3,030 | | | | 0.4 | |
Funds from acceptances and issuance of securities(1) | | | 1,978 | | | | 136,638 | | | | 13.4 | | | | 4,293 | | | | 143,569 | | | | 20.1 | |
Funds from own issue (2) | | | 218 | | | | 1,985 | | | | 0.2 | | | | 235 | | | | 5,258 | | | | 0.7 | |
Subordinated debt | | | 6,657 | | | | 74,916 | | | | 7.3 | | | | 2 | | | | 59,462 | | | | 8.3 | |
| | | | | | | | | | | | | | | | | | | | | | | | |
Total | | | 379,457 | | | | 1,022,549 | | | | 100.0 | | | | 276,977 | | | | 715,349 | | | | 100.0 | |
| | | | | | | | | | | | | | | | | | | | | | | | |
| (1) | Includes mortgage notes, guaranteed real estate credit bills, agribusiness, financial recorded in interbank markets funds and Obligations on the issue of debentures, Securities abroad and strutured operations certificates recorded in Institutional Markets Funds. |
| (2) | Refer to deposits received under securities repurchase agreements with securities from own issue. |
3.2 Control over liquidity
ITAÚ UNIBANCO HOLDING manages its liquidity reserves based on estimates of funds that will be available for investment, assuming the continuity of business in normal conditions.
During the period of 2020, ITAÚ UNIBANCO HOLDING maintained sufficient levels of liquidity in Brazil and abroad. Liquid assets totaled R$ 323.2 billion and accounted for 85.2% of the short term redeemable obligations, 31.6% of total funding, and 23.4% of total assets.
The table below shows the indicators used by ITAÚ UNIBANCO HOLDING in the management of liquidity risk:
| | | | | | | | |
Liquidity indicators | | 12/31/2020 | | | 12/31/2019 | |
| | % | | | % | |
Net assets (1) / customers funds within 30 days (2) | |
| 85.2
|
| | | 62.4 | |
Net assets (1) / total customers funds (3) | | | 31.6 | | | | 24.2 | |
Net assets (1) / total financial assets (4) | |
| 23.4
|
| | | 16.6 | |
| (1) | Net assets (present value): Cash, Securities purchased under agreements to resell – Funded position and Government securities—available. Detailed in the table Non discounted future flows – Financial assets. |
| (2) | Table Funding from customers table (Total Funding from customers 0-30 days). |
| (3) | Table funding from customers (Total funding from customers). |
| (4) | Detailed in the table Non discounted future flows – Financial assets, total present value regards R$ 1,381,769 (R$ 1,040,865 at 12/31/2019). |
| | |
| Itaú Unibanco Holding S.A. – Complete Financial Statements in IFRS – December 31, 2020 | | F-121 |
ITAÚ UNIBANCO HOLDING S.A.
Notes to the Consolidated Financial Statements
At 12/31/2020 and 12/31/2019 for balance sheet accounts and
From 01/01 to 12/31 of 2020, 2019 and 2018 for income statement accounts
(In millions of Reais, except information per share)
Assets and liabilities according to their remaining contractual maturities, considering their undiscounted flows, are presented below:
| | | | | | | | | | | | | | | | | | | | | | | | | | | | | | | | | | | | | | | | |
Undiscounted future flows, except for derivatives which
are fair value | | 12/31/2020 | | | 12/31/2019 | |
Financial assets (1) | | 0 - 30 | | | 31 -365
| | | 366 - 720
| | | Over 720
days | | | Total | | | 0 - 30 | | | 31 - 365
| | | 366 - 720
| | | Over 720
days | | | Total | |
Cash | | | 46,224 | | | | — | | | | — | | | | — | | | | 46,224 | | | | 30,367 | | | | — | | | | — | | | | — | | | | 30,367 | |
Interbank investments | | | 234,755 | | | | 43,276 | | | | 6,273 | | | | 1,092 | | | | 285,396 | | | | 69,756 | | | | 151,497 | | | | 1,444 | | | | 1,191 | | | | 223,888 | |
Securities purchased under agreements to resell—Collateral held (2) | | | 44,743 | | | | — | | | | — | | | | — | | | | 44,743 | | | | 26,797 | | | | — | | | | — | | | | — | | | | 26,797 | |
Securities purchased under agreements to resell—Collateral repledge | | | 150,474 | | | | 31,561 | | | | — | | | | — | | | | 182,035 | | | | 17,871 | | | | 144,234 | | | | — | | | | — | | | | 162,105 | |
Interbank deposits (4) | | | 39,538 | | | | 11,715 | | | | 6,273 | | | | 1,092 | | | | 58,618 | | | | 25,088 | | | | 7,263 | | | | 1,444 | | | | 1,191 | | | | 34,986 | |
Securities | | | 239,964 | | | | 16,348 | | | | 17,144 | | | | 101,908 | | | | 375,364 | | | | 131,195 | | | | 17,669 | | | | 19,846 | | | | 108,011 | | | | 276,721 | |
Government securities—available | | | 226,615 | | | | 393 | | | | 379 | | | | 5,779 | | | | 233,166 | | | | 111,487 | | | | 300 | | | | 302 | | | | 4,763 | | | | 116,852 | |
Government securities—under repurchase commitments | | | 93 | | | | 3,905 | | | | 6,749 | | | | 15,132 | | | | 25,879 | | | | 7,744 | | | | 6,616 | | | | 12,445 | | | | 25,366 | | | | 52,171 | |
Corporate securities—available | | | 13,256 | | | | 11,113 | | | | 8,352 | | | | 51,927 | | | | 84,648 | | | | 11,964 | | | | 10,181 | | | | 4,967 | | | | 56,839 | | | | 83,951 | |
Corporate securities—under repurchase commitments | | | — | | | | 937 | | | | 1,664 | | | | 29,070 | | | | 31,671 | | | | — | | | | 572 | | | | 2,132 | | | | 21,043 | | | | 23,747 | |
Derivative financial instruments – Net position | | | 17,634 | | | | 17,502 | | | | 6,478 | | | | 34,890 | | | | 76,504 | | | | 6,998 | | | | 10,959 | | | | 5,355 | | | | 18,542 | | | | 41,854 | |
Swaps | | | 4,064 | | | | 2,952 | | | | 5,117 | | | | 33,886 | | | | 46,019 | | | | 107 | | | | 4,039 | | | | 4,464 | | | | 17,848 | | | | 26,458 | |
Options | | | 10,103 | | | | 8,783 | | | | 992 | | | | 540 | | | | 20,418 | | | | 4,696 | | | | 3,043 | | | | 500 | | | | 217 | | | | 8,456 | |
Forwards (onshore) | | | 1,323 | | | | 757 | | | | 5 | | | | — | | | | 2,085 | | | | 940 | | | | 1,207 | | | | 15 | | | | — | | | | 2,162 | |
Other derivatives | | | 2,144 | | | | 5,010 | | | | 364 | | | | 464 | | | | 7,982 | | | | 1,255 | | | | 2,670 | | | | 376 | | | | 477 | | | | 4,778 | |
Loans and lease operations (3) | | | 60,896 | | | | 236,173 | | | | 114,523 | | | | 317,492 | | | | 729,084 | | | | 63,401 | | | | 197,090 | | | | 93,203 | | | | 236,982 | | | | 590,676 | |
Other financial assets | | | — | | | | 6 | | | | — | | | | — | | | | 6 | | | | — | | | | — | | | | — | | | | — | | | | — | |
| | | | | | | | | | | | | | | | | | | | | | | | | | | | | | | | | | | | | | | | |
Total financial assets | | | 599,473 | | | | 313,305 | | | | 144,418 | | | | 455,382 | | | | 1,512,578 | | | | 301,717 | | | | 377,215 | | | | 119,848 | | | | 364,726 | | | | 1,163,506 | |
| | | | | | | | | | | | | | | | | | | | | | | | | | | | | | | | | | | | | | | | |
| (1) | The assets portfolio does not take into consideration the balance of compulsory deposits in Central Bank, amounting to R$ 90,059 (R$ 91,248 at 12/31/2019), which release of funds is linked to the maturity of the liability portfolios. The amounts of PGBL and VGBL are not considered in the assets portfolio because they are covered in Note 26. |
| (2) | Net of R$ 11,119 (R$ 8,544 at 12/31/2019) which securities are linked to guarantee transactions at B3 S.A. - Brasil, Bolsa, Balcão and the BACEN. |
| (3) | Net of payment to merchants of R$ 71,820 (R$ 69,050 at 12/31/2019) and the amount of liabilities from transactions related to credit assignments R$ 1,623 (R$ 2,451 at 12/31/2019). |
| (4) | Includes R$ 32,477 (R$ 18,938 at 12/31/2019) related to Compulsory Deposits with Central Banks of other countries. |
| | |
| Itaú Unibanco Holding S.A. – Complete Financial Statements in IFRS – December 31, 2020 | | F-122 |
ITAÚ UNIBANCO HOLDING S.A.
Notes to the Consolidated Financial Statements
At 12/31/2020 and 12/31/2019 for balance sheet accounts and
From 01/01 to 12/31 of 2020, 2019 and 2018 for income statement accounts
(In millions of Reais, except information per share)
| | | | | | | | | | | | | | | | | | | | | | | | | | | | | | | | | | | | | | | | |
Undiscounted future flows, except for derivatives which
are fair value | | 12/31/2020 | | | 12/31/2019 | |
Financial liabilities | | 0 – 30 | | | 31 – 365 | | | 366 –720 | | | Over 720
days | | | Total | | | 0 – 30 | | | 31 – 365 | | | 366 – 720 | | | Over 720
days | | | Total | |
Deposits | | | 369,957 | | | | 145,085 | | | | 36,258 | | | | 344,261 | | | | 895,561 | | | | 266,690 | | | | 69,367 | | | | 20,555 | | | | 211,531 | | | | 568,143 | |
Demand deposits | | | 134,805 | | | | — | | | | — | | | | — | | | | 134,805 | | | | 82,306 | | | | — | | | | — | | | | — | | | | 82,306 | |
Savings deposits | | | 179,470 | | | | — | | | | — | | | | — | | | | 179,470 | | | | 144,558 | | | | — | | | | — | | | | — | | | | 144,558 | |
Time deposit | | | 53,978 | | | | 143,446 | | | | 36,182 | | | | 343,974 | | | | 577,580 | | | | 37,570 | | | | 68,757 | | | | 20,502 | | | | 211,395 | | | | 338,224 | |
Interbank deposits | | | 1,633 | | | | 1,639 | | | | 76 | | | | 287 | | | | 3,635 | | | | 2,247 | | | | 610 | | | | 53 | | | | 136 | | | | 3,046 | |
Other deposits | | | 71 | | | | — | | | | — | | | | — | | | | 71 | | | | 9 | | | | — | | | | — | | | | — | | | | 9 | |
Compulsory deposits | | | (36,337 | ) | | | (16,874 | ) | | | (4,412 | ) | | | (32,436 | ) | | | (90,059 | ) | | | (38,576 | ) | | | (14,067 | ) | | | (4,110 | ) | | | (34,495 | ) | | | (91,248 | ) |
Demand deposits | | | (6,926 | ) | | | — | | | | — | | | | — | | | | (6,926 | ) | | | (4,412 | ) | | | — | | | | — | | | | — | | | | (4,412 | ) |
Savings deposits | | | (22,672 | ) | | | — | | | | — | | | | — | | | | (22,672 | ) | | | (26,234 | ) | | | — | | | | — | | | | — | | | | (26,234 | ) |
Time deposit | | | (6,739 | ) | | | (16,874 | ) | | | (4,412 | ) | | | (32,436 | ) | | | (60,461 | ) | | | (7,930 | ) | | | (14,067 | ) | | | (4,110 | ) | | | (34,495 | ) | | | (60,602 | ) |
Securities sold under repurchase agreements (1) | | | 260,846 | | | | 5,024 | | | | 5,183 | | | | 22,591 | | | | 293,644 | | | | 246,499 | | | | 6,509 | | | | 5,218 | | | | 17,585 | | | | 275,811 | |
Government securities | | | 182,848 | | | | 2,070 | | | | 2,414 | | | | 22,564 | | | | 209,896 | | | | 200,499 | | | | 344 | | | | 1,720 | | | | 17,553 | | | | 220,116 | |
Corporate securities | | | 22,056 | | | | 2,954 | | | | 2,769 | | | | 27 | | | | 27,806 | | | | 17,978 | | | | 2,810 | | | | 3,498 | | | | 32 | | | | 24,318 | |
Foreign | | | 55,942 | | | | — | | | | — | | | | — | | | | 55,942 | | | | 28,022 | | | | 3,355 | | | | — | | | | — | | | | 31,377 | |
Funds from acceptances and issuance of securities (2) | | | 2,391 | | | | 40,463 | | | | 35,189 | | | | 68,573 | | | | 146,616 | | | | 4,335 | | | | 47,697 | | | | 39,505 | | | | 67,435 | | | | 158,972 | |
Loans and onlending obligations (3) | | | 11,891 | | | | 64,735 | | | | 6,239 | | | | 6,388 | | | | 89,253 | | | | 6,368 | | | | 65,182 | | | | 6,259 | | | | 7,462 | | | | 85,271 | |
Subordinated debt (4) | | | 6,797 | | | | 8,428 | | | | 28,994 | | | | 45,762 | | | | 89,981 | | | | 251 | | | | 6,594 | | | | 11,794 | | | | 53,745 | | | | 72,384 | |
Derivative financial instruments—Net position | | | 16,791 | | | | 19,674 | | | | 6,895 | | | | 36,145 | | | | 79,505 | | | | 6,653 | | | | 12,196 | | | | 9,458 | | | | 19,521 | | | | 47,828 | |
Swaps | | | 7,344 | | | | 3,612 | | | | 5,573 | | | | 35,260 | | | | 51,789 | | | | 326 | | | | 5,218 | | | | 8,349 | | | | 19,034 | | | | 32,927 | |
Option | | | 6,355 | | | | 12,381 | | | | 998 | | | | 528 | | | | 20,262 | | | | 3,668 | | | | 4,567 | | | | 571 | | | | 255 | | | | 9,061 | |
Forward (onshore) | | | 892 | | | | 13 | | | | — | | | | — | | | | 905 | | | | 753 | | | | 1 | | | | — | | | | — | | | | 754 | |
Other derivatives | | | 2,200 | | | | 3,668 | | | | 324 | | | | 357 | | | | 6,549 | | | | 1,906 | | | | 2,410 | | | | 538 | | | | 232 | | | | 5,086 | |
Other financial liabilities | | | — | | | | 5 | | | | — | | | | — | | | | 5 | | | | — | | | | — | | | | — | | | | — | | | | — | |
| | | | | | | | | | | | | | | | | | | | | | | | | | | | | | | | | | | | | | | | |
Total financial liabilities | | | 632,336 | | | | 266,540 | | | | 114,346 | | | | 491,284 | | | | 1,504,506 | | | | 492,220 | | | | 193,478 | | | | 88,679 | | | | 342,784 | | | | 1,117,161 | |
| | | | | | | | | | | | | | | | | | | | | | | | | | | | | | | | | | | | | | | | |
| (1) | Includes own and third parties’ portfolios. |
| (2) | Includes mortgage notes, Guaranteed real estate notes, agribusiness, financial recorded in interbank market funds and Obligations on issue of debentures, Securities abroad and Structured Transactions certificates recorded in institutional markets funds. |
| (3) | Recorded in funds from interbank markets. |
| (4) | Recorded in funds from institutional markets. |
| | | | | | | | | | | | | | | | | | | | | | | | | | | | | | | | | | | | | | | | |
| | | 12/31/2020 | | | 12/31/2019 | |
Off balance commitments | | 0 – 30 | | | 31 – 365 | | | 366 – 720 | | | Over 720
days | | | Total | | | 0 – 30 | | | 31 – 365 | | | 366 – 720 | | | Over 720
days | | | Total | |
Financial Guarantees | | | 2,859 | | | | 24,491 | | | | 6,428 | | | | 35,155 | | | | 68,933 | | | | 1,286 | | | | 19,447 | | | | 9,359 | | | | 36,628 | | | | 66,720 | |
Commitments to be released | | | 128,792 | | | | 27,144 | | | | 11,776 | | | | 153,193 | | | | 320,905 | | | | 125,664 | | | | 22,818 | | | | 7,064 | | | | 149,876 | | | | 305,422 | |
Letters of credit to be released | | | 41,477 | | | | — | | | | — | | | | — | | | | 41,477 | | | | 15,013 | | | | — | | | | — | | | | — | | | | 15,013 | |
Contractual commitments—Fixed and Intangible assets (Notes 13 and 14) | | | — | | | | 36 | | | | — | | | | — | | | | 36 | | | | — | | | | 273 | | | | — | | | | — | | | | 273 | |
| | | | | | | | | | | | | | | | | | | | | | | | | | | | | | | | | | | | | | | | |
Total | | | 173,128 | | | | 51,671 | | | | 18,204 | | | | 188,348 | | | | 431,351 | | | | 141,963 | | | | 42,538 | | | | 16,423 | | | | 186,504 | | | | 387,428 | |
| | | | | | | | | | | | | | | | | | | | | | | | | | | | | | | | | | | | | | | | |
| | |
| Itaú Unibanco Holding S.A. – Complete Financial Statements in IFRS – December 31, 2020 | | F-123 |
ITAÚ UNIBANCO HOLDING S.A.
Notes to the Consolidated Financial Statements
At 12/31/2020 and 12/31/2019 for balance sheet accounts and
From 01/01 to 12/31 of 2020, 2019 and 2018 for income statement accounts
(In millions of Reais, except information per share)
c) Capital Management Governance
ITAÚ UNIBANCO HOLDING is subject to the regulations of BACEN, which determines minimum capital requirements, procedures to obtain information to assess the global systemic importance of banks, fixed asset limits, loan limits and accounting practices, and requires banks to conform to the regulations based on the Basel Accord for capital adequacy. Additionally, CNSP and SUSEP issue regulations on capital requirements that affect our insurance operations and private pension and premium bonds plans.
The capital statements were prepared in accordance with BACEN’s regulatory requirements and with internationally accepted minimum requirements according to the Bank for International Settlements (BIS).
I – Composition and Capital Adequacy
The Board of Directors is the body responsible for approving the institutional capital management policy and guidelines for the capitalization level of ITAÚ UNIBANCO HOLDING. The Board is also responsible for the full approval of the ICAAP (Internal Capital Adequacy Assessment Process) report, the purpose of which is to assess the capital adequacy of ITAÚ UNIBANCO HOLDING.
The result of the last ICAAP – which was dated December 2019 – indicated that ITAÚ UNIBANCO HOLDING has, in addition to capital to cover all material risks, a significant capital surplus, thus assuring the solidity of the institution’s equity position.
In order to ensure that ITAÚ UNIBANCO HOLDING is sound and has the capital needed to support business growth, the institution maintains PR levels above the minimum level required to face risks, as demonstrated by the Common Equity, Tier I Capital and Basel ratios.
| | | | | | | | |
| | | 12/31/2020 | | | 12/31/2019 | |
Available capital (amounts) | | | | | | | | |
Common Equity Tier 1 | | | 119,960 | | | | 117,328 | |
Tier 1 | | | 137,157 | | | | 128,696 | |
Total capital (PR) | | | 151,244 | | | | 140,596 | |
Risk-weighted assets (amounts) | | | | | | | | |
Total risk-weighted assets (RWA) | | | 1,042,207 | | | | 891,300 | |
Risk-based capital ratios as a percentage of RWA | | | | | | | | |
Common Equity Tier 1 ratio (%) | | | 11.5 | % | | | 13.2 | % |
Tier 1 ratio (%) | | | 13.2 | % | | | 14.4 | % |
Total capital ratio (%) | | | 14.5 | % | | | 15.8 | % |
Additional CET1 buffer requirements as a percentage of RWA | | | | | | | | |
Capital conservation buffer requirement (%) (*) | | | 1.25 | % | | | 2.5 | % |
Countercyclical buffer requirement (%) | | | 0.0 | % | | | 0.0 | % |
Bank G-SIB and/or D-SIB additional requirements (%) | | | 1.0 | % | | | 1.0 | % |
Total of bank CET1 specific buffer requirements (%) | | | 2.25 | % | | | 3.5 | % |
| (*) | For purposes of calculating the Conservation capital buffer, BACEN Resolution 4,783 establishes, for defined periods, percentages to be applied to the RWA value with a gradual increase until April/22, when it reaches 2.5%. |
The Basel Ratio reached 14.5% at 12/31/2020, 1.3 p.p. lower than at 12/31/2019, mainly due to the foreign exchange impact, the provision of interest on capital, dividends referring to fiscal year 2019, and increase in risk-weighted assets, partially diminished by net income in the period and issuance of level 1 and level 2 debts.
Additionally, ITAÚ UNIBANCO HOLDING has a surplus over the required minimum Referential Equity of R$ 67,867 (R$ 69,292 at 12/31/2019), well above the ACP of R$ 23,450 (R$ 31,195 at 12/31/2019), generously covered by available capital.
In December 2020, ITAÚ UNIBANCO HOLDING issued R$ 2.1 billion in Subordinated Financial Notes, which have a repurchase option as from 2025. These subordinated notes are subject to approval by the Central Bank of Brazil for the composition of ITAÚ UNIBANCO HOLDING´S Tier II Capital, with an estimated increase of 0.20 p.p. in its Total Capital Ratio.
The fixed assets ratio shows the commitment percentage of adjusted Referential Equity with adjusted permanent assets. ITAÚ UNIBANCO HOLDING falls within the maximum limit of 50% of adjusted PR, established by BACEN. At 12/31/2020, fixed assets ratio reached 24.0% (27.9% at 12/31/2019), showing a surplus of R$ 39,274 (R$ 31,104 at 12/31/2019).
| | |
| Itaú Unibanco Holding S.A. – Complete Financial Statements in IFRS – December 31, 2020 | | F-124 |
ITAÚ UNIBANCO HOLDING S.A.
Notes to the Consolidated Financial Statements
At 12/31/2020 and 12/31/2019 for balance sheet accounts and
From 01/01 to 12/31 of 2020, 2019 and 2018 for income statement accounts
(In millions of Reais, except information per share)
Funds from the issuance of subordinated debt securities are considered Tier II capital for purpose of capital to risk-weighted assets ratio, as shown below. According to current legislation, the balance of subordinated debt in December 2012 was used for calculating the reference equity as of December 2020, totaling R$ 47,296.
| | | | | | | | | | | | | | | | | | | | | | | | |
Name of security / currency | | Principal amount
(original currency) | | | Issue | | | Maturity | | | Return p.a. | | | Account balance | |
| | 12/31/2020 | | | 12/31/2019 | |
Subordinated financial bills—BRL | | | | | | | | | | | | | | | | | | | | | | | | |
| | | — | | | | 2012 | | | | 2020 | | | | 111% of CDI | | | | — | | | | 2 | |
| | | — | | | | | | | | | | | | IPCA + 6% to 6.17% | | | | — | | | | 49 | |
| | | 6 | | | | 2011 | | | | 2021 | | | | 109.25% to 110.5% of CDI | | | | 14 | | | | 14 | |
| | | 2,307 | | | | 2012 | | | | 2022 | | | | IPCA + 5.15% to 5.83% | | | | 5,484 | | | | 4,994 | |
| | | 20 | | | | | | | | | | | | IGPM + 4.63% | | | | 38 | | | | 30 | |
| | | 2,333 | | | | | | | | | | | | Total | | | | 5,536 | | | | 5,089 | |
Subordinated euronotes—USD | | | | | | | | | | | | | | | | | | | | | | | | |
| | | 990 | | | | 2010 | | | | 2020 | | | | 6.20% | | | | — | | | | 4,041 | |
| | | 1,000 | | | | 2010 | | | | 2021 | | | | 5.75% | | | | 5,360 | | | | 4,152 | |
| | | 730 | | | | 2011 | | | | 2021 | | | | 5.75% to 6.20% | | | | 3,805 | | | | 2,952 | |
| | | 550 | | | | 2012 | | | | 2021 | | | | 6.20% | | | | 2,858 | | | | 2,218 | |
| | | 2,600 | | | | 2012 | | | | 2022 | | | | 5.50% to 5.65% | | | | 13,764 | | | | 10,673 | |
| | | 1,851 | | | | 2012 | | | | 2023 | | | | 5.13% | | | | 9,677 | | | | 7,502 | |
| | | 7,721 | | | | | | | | | | | | Total | | | | 35,464 | | | | 31,538 | |
Debt instruments eligible as capital—USD | | | | | | | | | | | | | | | | | | | | | | | | |
| | | 740 | | | | 2019 | | | | 2029 | | | | 4.50% | | | | 3,865 | | | | — | |
| | | 740 | | | | | | | | | | | | Total | | | | 3,865 | | | | — | |
Debt instruments eligible as capital—BRL | | | | | | | | | | | | | | | | | | | | | | | | |
| | | 50 | | | | 2019 | | | | 2028 | | | | CDI + 0.72% | | | | 52 | | | | — | |
| | | 2,280 | | | | | | | | 2029 | | | | CDI + 0.75% | | | | 2,379 | | | | — | |
| | | 2,330 | | | | | | | | | | | | Total | | | | 2,431 | | | | — | |
| | | | | | | | | | | | | | | | | | | | | | | | |
Total | | | | | | | | | | | | | | | | | | | 47,296 | | | | 36,627 | |
| | | | | | | | | | | | | | | | | | | | | | | | |
II - Risk-Weighted Assets (RWA)
For calculating minimum capital requirements, RWA must be obtained by taking the sum of the following risk exposures:
RWA = RWACPAD + RWAMINT + RWAOPAD
| | • | | RWACPAD = portion related to exposures to credit risk, calculated using the standardized approach; |
| | • | | RWAMINT = portion related to capital required for market risk, composed of the maximum between the internal model and 80% of the standardized model, regulated by BACEN Circular nº 3,646 and nº 3,674; |
| | • | | RWAOPAD = portion related to capital required for operational risk, calculated based on the standardized approach. |
| | |
| Itaú Unibanco Holding S.A. – Complete Financial Statements in IFRS – December 31, 2020 | | F-125 |
ITAÚ UNIBANCO HOLDING S.A.
Notes to the Consolidated Financial Statements
At 12/31/2020 and 12/31/2019 for balance sheet accounts and
From 01/01 to 12/31 of 2020, 2019 and 2018 for income statement accounts
(In millions of Reais, except information per share)
| | | | | | | | |
| | | RWA | |
| | | 12/31/2020 | | | 12/31/2019 | |
Credit Risk—standardized approach | | | 921,934 | | | | 784,730 | |
Credit risk (excluding counterparty credit risk) | | | 778,153 | | | | 690,474 | |
Counterparty credit risk (CCR) | | | 45,674 | | | | 31,356 | |
Of which: standardized approach for counterparty credit risk (SA-CCR) | | | 27,119 | | | | 16,523 | |
Of which: other CCR | | | 18,555 | | | | 14,833 | |
Credit valuation adjustment (CVA) | | | 5,960 | | | | 3,494 | |
Equity investments in funds—look-through approach | | | 4,897 | | | | 7,669 | |
Equity investments in funds—mandate-based approach | | | 623 | | | | 205 | |
Equity investments in funds—fall-back approach | | | 716 | | | | 1,133 | |
Securitisation exposures—standardized approach | | | 1,506 | | | | — | |
Amounts below the thresholds for deduction | | | 84,405 | | | | 50,399 | |
Market Risk | | | 27,481 | | | | 25,002 | |
Of which: standardized approach (RWAMPAD) | | | 34,351 | | | | 28,328 | |
Of which: internal models approach (RWAMINT) | | | 22,362 | | | | 25,002 | |
Operational Risk | | | 92,792 | | | | 81,568 | |
| | | | | | | | |
Total | | | 1,042,207 | | | | 891,300 | |
| | | | | | | | |
III – Recovery Plan
In response to the latest international crises, the Central Bank published Resolution No. 4,502, which requires the development of a Recovery Plan by financial institutions within Segment 1, with total exposure to GDP of more than 10%. This plan aims to reestablish adequate levels of capital and liquidity above regulatory operating limits in the face of severe systemic or idiosyncratic stress shocks. In this way, each institution could preserve its financial viability while also minimizing the impact on the National Financial System.
| | |
| Itaú Unibanco Holding S.A. – Complete Financial Statements in IFRS – December 31, 2020 | | F-126 |
ITAÚ UNIBANCO HOLDING S.A.
Notes to the Consolidated Financial Statements
At 12/31/2020 and 12/31/2019 for balance sheet accounts and
From 01/01 to 12/31 of 2020, 2019 and 2018 for income statement accounts
(In millions of Reais, except information per share)
IV - Stress testing
The stress test is a process of simulating extreme economic and market conditions on ITAÚ UNIBANCO HOLDING’s results, liquidity and capital. The institution has been carrying out this test in order to assess its solvency in plausible scenarios of crisis, as well as to identify areas that are more susceptible to the impact of stress that may be the subject of risk mitigation.
For the purposes of the test, the economic research area estimates macroeconomic variables for each stress scenario. The elaboration of stress scenarios considers the qualitative analysis of the Brazilian and the global conjuncture, historical and hypothetical elements, short and long term risks, among other aspects, as defined in CMN Resolution 4,557.
In this process, the main potential risks to the economy are assessed based on the judgment of the bank’s team of economists, endorsed by the Chief Economist of ITAÚ UNIBANCO HOLDING and approved by the Board of Directors. Projections for the macroeconomic variables (such as GDP, basic interest rate, exchange rates and inflation) and for variables in the credit market (such as raisings, lending, rates of default, margins and charges) used are based on exogenous shocks or through use of models validated by an independent area.
Then, the stress scenarios adopted are used to influence the budgeted result and balance sheet. In addition to the scenario analysis methodology, sensitivity analysis and the Reverse Stress Test are also used.
ITAÚ UNIBANCO HOLDING uses the simulations to manage its portfolio risks, considering Brazil (segregated into wholesale and retail) and External Units, from which the risk-weighted assets and the capital and liquidity ratios are derived.
The stress test is also an integral part of the ICAAP, the main purpose of which is to assess whether, even in severely adverse situations, the institution would have adequate levels of capital and liquidity, without any impact on the development of its activities.
This information enables potential offenders to the business to be identified and provides support for the strategic decisions of the Board of Directors, the budgeting and risk management process, as well as serving as an input for the institution’s risk appetite metrics.
V – Leverage Ratio
The Leverage Ratio is defined as the ratio of Capital Tier I to Total Exposure, calculated pursuant to BACEN Circular 3,748, of February 27, 2015. The purpose of this ratio is to be a simple measure of leverage not sensitive to risk, thus it does not consider weighting or mitigation factors. According to instructions in BACEN Circular Letter 3,706, of May 5, 2015, ITAÚ UNIBANCO HOLDING has sent the Leverage Ratio monthly to BACEN, whose minimum requirement is 3%.
d) Management Risks of insurance and private pension
I – Management Structure, roles and responsibilities
In line with good domestic and international practices, ITAÚ UNIBANCO HOLDING has a risk management structure that ensures that the risks arising from insurance and pension plans products are properly monitored and reported to the appropriate bodies. The management process of insurance and pension plans risks is independent and focuses on the specific nature of each risk.
ITAÚ UNIBANCO HOLDING has committees to define the management of funds from the technical reserves for insurance and private pensions, to issue guidelines for managing these funds with the objective of achieving long term returns, and to define valuation models, risk limits and strategies on allocation of funds to specific financial assets. The members of these committees are not only executives and those directly responsible for the business management process, but also heads and coordinators of commercial and financial areas.
| | |
| Itaú Unibanco Holding S.A. – Complete Financial Statements in IFRS – December 31, 2020 | | F-127 |
ITAÚ UNIBANCO HOLDING S.A.
Notes to the Consolidated Financial Statements
At 12/31/2020 and 12/31/2019 for balance sheet accounts and
From 01/01 to 12/31 of 2020, 2019 and 2018 for income statement accounts
(In millions of Reais, except information per share)
II – Risks of Insurance and Private Pensions
ITAÚ UNIBANCO HOLDING offers its products to customers through a bancassurance structure or direct distribution. Life, personal accident, loan and multiple peril insurance products are mainly distributed by a bancassurance operation.
Life insurance and pension plans are, in general, medium or long-term products and the main risks involved in the business may be classified as demographic, financial and behavioral.
| | • | | Demographic risk relates to: i) a greater than expected increase in life expectancies for products with survivorship coverage (mostly pension plans); and ii) a greater than expected decrease in mortality rates for products with life coverage (mostly life insurance). |
| | • | | Financial risk: is inherent in the underwriting risk of products that offer a contractual financial guarantee, this risk being considered insurance risk. |
| | • | | Behavioral risk relates to a greater than expected increase in the rates of conversion into annuity income, resulting in increased payments of retirement benefits. |
Estimated actuarial assumptions are based on the past experience of ITAÚ UNIBANCO HOLDING, on market benchmarks and on the experience of the actuaries.
| | a) | Effect of changes on actuarial assumptions |
To measure the effects of changes in the key actuarial assumptions, sensitivity tests were conducted in the amounts of current estimates of future liability cash flows. The sensitivity analysis considers a vision of the impacts caused by changes in assumptions, which could affect the income for the period and stockholders’ equity at the balance sheet date. This type of analysis is usually conducted under the ceteris paribus condition, in which the sensitivity of a system is measured when one variable of interest is changed and all the others remain unchanged. The results obtained are shown in the table below:
| | | | | | | | | | | | | | | | |
Sensitivity Test | | Impact in Income and Stockholders’ Equity (1) | |
| | 12/31/2020 | | | 12/31/2019 | |
| | Private Pension | | | Insurance | | | Private Pension | | | Insurance | |
Mortality Rates | | | | | | | | | | | | | | | | |
5% increase | | | 56 | | | | 2 | | | | 25 | | | | — | |
5% decrease | | | (59 | ) | | | (2 | ) | | | (37 | ) | | | (1 | ) |
Risk-free Interest Rates | | | | | | | | | | | | | | | | |
0.1% increase | | | 98 | | | | 10 | | | | 61 | | | | 12 | |
0.1% decrease | | | (100 | ) | | | (11 | ) | | | (63 | ) | | | (12 | ) |
Conversion in Income Rates | | | | | | | | | | | | | | | | |
5% increase | | | (9 | ) | | | — | | | | 20 | | | | — | |
5% decrease | | | 9 | | | | — | | | | (21 | ) | | | — | |
Claims | | | | | | | | | | | | | | | | |
5% increase | | | — | | | | (52 | ) | | | — | | | | (47 | ) |
5% decrease | | | — | | | | 52 | | | | — | | | | 47 | |
| (1) | Amounts net of tax effects. |
| | |
| Itaú Unibanco Holding S.A. – Complete Financial Statements in IFRS – December 31, 2020 | | F-128 |
ITAÚ UNIBANCO HOLDING S.A.
Notes to the Consolidated Financial Statements
At 12/31/2020 and 12/31/2019 for balance sheet accounts and
From 01/01 to 12/31 of 2020, 2019 and 2018 for income statement accounts
(In millions of Reais, except information per share)
b) Risk concentration
For ITAÚ UNIBANCO HOLDING, there is no product concentration in relation to insurance premiums, reducing the risk of product concentration and distribution channels.
| | | | | | | | | | | | | | | | | | | | | | | | | | | | | | | | | | | | |
| | | 01/01 a 12/31/2020 | | | 01/01 a 12/31/2019 | | | 01/01 a 12/31/2018 | |
| | | Insurance | | | Retained | | | Retention | | | Insurance | | | Retained | | | Retention | | | Insurance | | | Retained | | | Retention | |
| | | premiums | | | premium | | | (%) | | | premiums | | | premium | | | (%) | | | premiums | | | premium | | | (%) | |
Individuals | | | | | | | | | | | | | | | | | | | | | | | | | | | | | | | | | | | | |
Group accident insurance | | | 849 | | | | 847 | | | | 99.8 | | | | 867 | | | | 867 | | | | 100.0 | | | | 690 | | | | 689 | | | | 99.9 | |
Individual accident | | | 192 | | | | 187 | | | | 97.3 | | | | 222 | | | | 222 | | | | 100.0 | | | | 275 | | | | 280 | | | | 101.8 | |
Credit life | | | 624 | | | | 624 | | | | 100.0 | | | | 948 | | | | 946 | | | | 99.8 | | | | 881 | | | | 879 | | | | 99.8 | |
Group life | | | 956 | | | | 955 | | | | 99.9 | | | | 948 | | | | 947 | | | | 99.9 | | | | 934 | | | | 937 | | | | 100.3 | |
III) Market, credit and liquidity risk
a) Market risk
Market risk is analyzed, in relation to insurance operations, using the following metrics and sensitivity and loss control measures: Value at Risk (VaR), Losses in Stress Scenarios (Stress Test), Sensitivity (DV01-Delta Variation) and Concentration. In the table, the sensitivity analysis (DV01 – Delta Variation) is presented in relation to insurance operations that demonstrate the impact on the market value of cash flows when submitted to a one basis point increase in the current interest rate or indexer rate and one percentage point in the share price and currency.
| | | | | | | | | | | | | | | | |
| | | 12/31/2020 | | | 12/31/2019 | |
Class | | Account
balance | | | DV01 | | | Account
balance | | | DV01 | |
Government securities | | | | | | | | | | | | | | | | |
National Treasury Notes (NTN-C) | | | 7,025 | | | | (3.11 | ) | | | 5,495 | | | | (2.57 | ) |
National Treasury Notes (NTN-B) | | | 5,215 | | | | (5.42 | ) | | | 8,675 | | | | (9.42 | ) |
National Treasury Notes (NTN-F) | | | 134 | | | | (0.08 | ) | | | — | | | | — | |
National Treasury Bills (LTN) | | | 2,098 | | | | (0.31 | ) | | | — | | | | — | |
Chile Government securities (BTU) | | | — | | | | — | | | | 152 | | | | (0.04 | ) |
Corporate securities | | | | | | | | | | | | | | | | |
Indexed to IPCA | | | 22 | | | | (0.01 | ) | | | 83 | | | | (0.01 | ) |
Indexed to PRE | | | 85 | | | | — | | | | 142 | | | | (0.01 | ) |
Indexed to CLP | | | — | | | | — | | | | 79 | | | | — | |
Indexed to CLF | | | — | | | | — | | | | 6 | | | | — | |
Shares | | | 1,320 | | | | 13 | | | | 6 | | | | — | |
Post-fixed assets | | | 2,414 | | | | — | | | | 2,297 | | | | — | |
Under agreements to resell | | | 697 | | | | — | | | | 777 | | | | — | |
| | | | | | | | | | | | | | | | |
Total
| | | 19,010 | | | | | | | | 17,712 | | | | | |
| | | | | | | | | | | | | | | | |
| | |
| Itaú Unibanco Holding S.A. – Complete Financial Statements in IFRS – December 31, 2020 | | F-129 |
ITAÚ UNIBANCO HOLDING S.A.
Notes to the Consolidated Financial Statements
At 12/31/2020 and 12/31/2019 for balance sheet accounts and
From 01/01 to 12/31 of 2020, 2019 and 2018 for income statement accounts
(In millions of Reais, except information per share)
b) Liquidity Risk
Liquidity risk is identified by ITAÚ UNIBANCO HOLDING as the risk of lack of liquid resources available to cover its current obligations at a given moment. For insurance operations, the liquidity risk is managed continuously by monitoring payment flows against liabilities, compared to the inflows generated by its operations and financial assets portfolio.
Financial assets are managed in order to optimize the risk-return ratio of investments, considering, on a careful basis, the characteristics of their liabilities. The risk integrated control considers the concentration limits by issuer and credit risk, sensitivities and market risk limits and control over asset liquidity risk. Thus, investments are concentrated in government and private securities with good credit quality in active and liquid markets, keeping a considerable amount invested in short-term assets, available on demand, to cover regular needs and any liquidity contingencies. Additionally, ITAÚ UNIBANCO HOLDING constantly monitors the solvency conditions of its insurance operations.
| | | | | | | | | | | | | | | | | | | | | | | | | | |
| | | | | 12/31/2020 | | | 12/31/2019 | |
Liabilities | | Assets | | Liabilities
amounts (1) | | | Liabilities
DU (2) | | | Assets
DU (2) | | | Liabilities
amounts (1) | | | Liabilities
DU (2) | | | Assets
DU (2) | |
Insurance operations | | Backing asset | | | | | | | | | | | | | | | | | | | | | | | | |
Unearned premiums | | LFT, repurchase agreements, NTN-B, CDB, LF and debentures | | | 2,298 | | | | 57.8 | | | | 19.1 | | | | 2,343 | | | | 59.1 | | | | 22.9 | |
IBNR, PDR e PSL | | LFT, repurchase agreements, NTN-B, CDB, LF and debentures | | | 838 | | | | 50.9 | | | | 27.2 | | | | 876 | | | | 49.9 | | | | 29.0 | |
Redemptions and Other Unsettled Amounts | | LFT, repurchase agreements, NTN-B, CDB, LF and debentures | | | 16 | | | | 16.3 | | | | 18.3 | | | | 13 | | | | 7.9 | | | | 22.9 | |
Mathematical reserve for benefits to be granted and benefits granted | | LFT, repurchase agreements, NTN-B, NTN-C, debentures | | | 17 | | | | 172.6 | | | | 24.0 | | | | 204 | | | | 16.9 | | | | 2.6 | |
Financial surplus | | LFT, repurchase agreements, NTN-B, NTN-C, CDB, LF and debentures | | | 2 | | | | 204.1 | | | | 18.3 | | | | 2 | | | | 222.4 | | | | 22.9 | |
Other provisions | | LFT, repurchase agreements, NTN-B, CDB, LF and debentures | | | 132 | | | | 7.0 | | | | 96.4 | | | | 250 | | | | 6.9 | | | | 104.5 | |
Subtotal | | Subtotal | | | 3,303 | | | | | | | | | | | | 3,688 | | | | | | | | | |
Pension plan, VGBL and individual life operations | | | | | | | | | | | | | | | | | | | | | | | | |
Related expenses | | LFT, repurchase agreements, NTN-B, CDB, LF and debentures | | | 88 | | | | 109.4 | | | | 81.3 | | | | 89 | | | | 126.2 | | | | 82.6 | |
Unearned premiums | | LFT, repurchase agreements, NTN-B, CDB and debentures | | | 12 | | | | 17.4 | | | | 22.2 | | | | 13 | | | | 11.1 | | | | 20.8 | |
Unsettled claims | | LFT, repurchase agreements, NTN-B, CDB and debentures | | | 68 | | | | 17.4 | | | | 22.2 | | | | 47 | | | | 11.1 | | | | 20.8 | |
IBNR | | LFT, repurchase agreements, NTN-B, CDB and debentures | | | 22 | | | | 17.4 | | | | 22.2 | | | | 22 | | | | 11.1 | | | | 20.8 | |
Redemptions and Other Unsettled Amounts | | LFT, repurchase agreements, NTN-B, CDB and debentures | | | 332 | | | | 17.4 | | | | 22.2 | | | | 318 | | | | 11.1 | | | | 20.8 | |
Mathematical reserve for benefits granted | | LFT, repurchase agreements, LTN, NTN-B, NTN-C, NTN-F, CDB, LF and debentures | | | 3,278 | | | | 109.4 | | | | 81.4 | | | | 2,781 | | | | 126.2 | | | | 82.8 | |
Mathematical reserve for benefits to be granted – PGBL/ VGBL | | LFT, repurchase agreements, LTN, NTN-B, NTN-C, NTN-F, CDB, LF and debentures (3) | | | 205,670 | | | | 166.5 | | | | 56.2 | | | | 204,394 | | | | 180.6 | | | | 57.0 | |
Mathematical reserve for benefits to be granted – traditional | | LFT, repurchase agreements, NTN-B, NTN-C, debentures | | | 6,268 | | | | 188.5 | | | | 80.9 | | | | 5,099 | | | | 199.8 | | | | 110.1 | |
Other provisions | | LFT, repurchase agreements, NTN-B, NTN-C, CDB, LF and debentures | | | 1,304 | | | | 188.4 | | | | 80.9 | | | | 1,273 | | | | 199.7 | | | | 110.1 | |
Financial surplus | | LFT, repurchase agreements, NTN-B, NTN-C, CDB, LF and debentures | | | 655 | | | | 188.5 | | | | 80.9 | | | | 610 | | | | 199.8 | | | | 110.1 | |
Subtotal | | Subtotal | | | 217,697 | | | | | | | | | | | | 214,646 | | | | | | | | | |
Total technical reserves | | Total backing assets | | | 221,000 | | | | | | | | | | | | 218,334 | | | | | | | | | |
| (1) | Gross amounts of Credit Rights, Deposits in Guarantee and Reinsurance. |
| (2) | DU = Duration in months. |
| (3) | Excluding PGBL / VGBL reserves allocated in variable income. |
| | |
| Itaú Unibanco Holding S.A. – Complete Financial Statements in IFRS – December 31, 2020 | | F-130 |
ITAÚ UNIBANCO HOLDING S.A.
Notes to the Consolidated Financial Statements
At 12/31/2020 and 12/31/2019 for balance sheet accounts and
From 01/01 to 12/31 of 2020, 2019 and 2018 for income statement accounts
(In millions of Reais, except information per share)
c) Credit Risk
I – Reinsurers
Reinsurance operations are controlled through an internal policy, in compliance with the provisions of the regulatory authority governing the reinsurers with which ITAÚ UNIBANCO HOLDING operates.
We present below a breakdown of the risks assigned by ITAÚ UNIBANCO HOLDING’s subsidiaries to reinsurance companies:
| | • | | Insurance Operations: reinsurance premiums operations are basically represented by: IRB Brasil Resseguros S.A. with 59% (86% at 12/31/2019), Mapfre Re do Brasil Companhia de Resseguros with 21% and Austral Resseguradora S.A. with 20% (1% at 12/31/2019). |
| | • | | Private Pension Operations: related to reinsurance premiums are entirely represented by Mapfre Re do Brasil Companhia de Resseguros with 45%, Austral Resseguradora S.A. with 30% (40% at 12/31/2019), IRB Brasil Resseguros S.A. with 25% (30% at 12/31/2019) and General Reinsurance AG without % of interest in the current period (30% at 12/31/2019). |
II – Premiums Receivable
ITAÚ UNIBANCO HOLDING considers the credit risk arising from past-due premiums immaterial, since cases with coverage payment in default may be canceled, pursuant to Brazilian regulations.
III – Risk level of financial assets
The table below shows insurance financial assets, individually evaluated, classified by rating:
| | | | | | | | | | | | | | | | | | | | |
| | | 12/31/2020 | |
| | | Financial Assets at Amortized Cost | | | | | | Financial Assets at Fair
Value Through Other
Comprehensive
Income | | | | |
Internal rating | | Interbank deposits and securities
purchased under agreements to
resell | | | Securities | | | Financial assets at fair
value through profit or
loss (*) | | | Total | |
Low | | | 3,517 | | | | 30,614 | | | | 205,099 | | | | 1,194 | | | | 240,424 | |
Medium | | | — | | | | — | | | | 3 | | | | — | | | | 3 | |
High | | | — | | | | — | | | | — | | | | — | | | | — | |
| | | | | | | | | | | | | | | | | | | | |
Total | | | 3,517 | | | | 30,614 | | | | 205,102 | | | | 1,194 | | | | 240,427 | |
| | | | | | | | | | | | | | | | | | | | |
% | | | 1.5 | | | | 12.7 | | | | 85.3 | | | | 0.5 | | | | 100.0 | |
| | | | | | | | | | | | | | | | | | | | |
| (*) | Includes Derivatives in the amount of R$ 1,336. |
| | | | | | | | | | | | | | | | | | | | |
| | | 12/31/2019 | |
| | | Financial Assets at Amortized Cost | | | | | | Financial Assets at Fair
Value Through Other
Comprehensive
Income | | | | |
Internal rating | | Interbank deposits and securities
purchased under agreements to
resell | | | Securities | | | Financial assets at fair
value through profit or
loss (*) | | | Total | |
Low | | | 3,027 | | | | 31,342 | | | | 197,940 | | | | — | | | | 232,309 | |
Medium | | | — | | | | — | | | | 2 | | | | — | | | | 2 | |
High | | | — | | | | — | | | | — | | | | — | | | | — | |
| | | | | | | | | | | | | | | | | | | | |
Total | | | 3,027 | | | | 31,342 | | | | 197,942 | | | | — | | | | 232,311 | |
| | | | | | | | | | | | | | | | | | | | |
% | | | 1.3 | | | | 13.5 | | | | 85.2 | | | | — | | | | 100.0 | |
| | | | | | | | | | | | | | | | | | | | |
| (*) | Includes Derivatives in the amount of R$ 960. |
| | |
| Itaú Unibanco Holding S.A. – Complete Financial Statements in IFRS – December 31, 2020 | | F-131 |
ITAÚ UNIBANCO HOLDING S.A.
Notes to the Consolidated Financial Statements
At 12/31/2020 and 12/31/2019 for balance sheet accounts and
From 01/01 to 12/31 of 2020, 2019 and 2018 for income statement accounts
(In millions of Reais, except information per share)
Note 33 – Supplementary information
a) “Coronavirus” COVID-19 relief efforts
ITAÚ UNIBANCO HOLDING monitors the economic effects of this COVID-19 pandemic in Brazil and the other countries where it operates, which may adversely affect its Profit or Loss. At the beginning of the COVID-19 outbreak, the Institutional Crisis Management Committee was set up. The Executive Committee established an intensified agenda to manage the crisis, which is responsible for the monitoring the pandemic and its impacts on its operations, in addition to the government actions to mitigate the effects of this pandemic.
In Brazil, measures were taken to mitigate the impacts caused by COVID-19 throughout 2020, by the Federal Government, the National Monetary Council (CMN) and the Central Bank of Brazil (BACEN), particularly:
| | i) | CMN Resolution No. 4,782/20, and amendments made by CMN Resolutions No. 4,791/20 and No. 4.856/20, which established, for a determined period of time, criteria for characterization of restructuring of loan operations; |
| | ii) | CMN Resolution No. 4,838/20, which regulates the Working Capital Program for Business Preservation (CGPE); |
| | iii) | CMN Resolution No. 4,846/20 which provides for loan operations for financing of payroll carried out by financial institutions, under the Emergency Employment Support Program (PESE); |
| | iv) | Law No. 13,999/20 that instituted the National Support Program for Micro and Small Companies (Pronampe) with the purpose of developing and strengthening small businesses; |
| | v) | Law No. 14,042/20 that established the Emergency Program for Access to Credit (Peac), with the purpose of making easier the access to credit and preserving companies, for the protection of jobs and income. The Peac has two modalities: Emergency Program for Access to Credit in the modality of guarantee (Peac-FGI) and Emergency Program for Access to Credit in the modality guarantee of receivables (Peac-Maquininhas); and |
| | vi) | BACEN Circular No. 3,990/20 and amendments made by BACEN Circular 3,992/20 which permits to carry out repurchase agreements in foreign currency by BACEN; |
ITAÚ UNIBANCO HOLDING identified the following impacts on its results, as well as effects on estimates and critical judgments for the preparation of the Consolidated Financial Statements:
| | (a) | increase in loan and financing operations, especially for micro, small and medium-sized companies due to the measures adopted for mitigation of the impacts of COVID-19 by the authorities with the creation of programs such as PESE, Pronampe, Peac-FGI and CGPE in the amount of R$ 24,169. Through timely monitoring of credit standards and behavior of clients, ITAÚ UNIBANCO HOLDING maintained the regularity of its operations, despite the adverse conditions, and helped clients in the sustainable search for their financial rebalancing; |
| | (b) | with the purpose of treating indebtedness in a structured way and giving financial impetus to clients, initiatives were established that allowed the extension of grace periods, terms and better interest rate conditions for individuals, and micro and small business clients. In March 2020, the Program 60+ was established, which, among other measures, allowed a 60-day grace period for defaulting agreements and in mid-April the Travessia (Crossing) Program. Travessia allowed the extension of grace periods between 120 and 180 days and terms of operations between 5 and 6 years, respectively, for individual and micro and small companies clients, under better interest rate conditions; |
| | (c) | 28.05% increase in applications of renegotiation and extension of terms for loan operations as the economic situation changed; |
| | (d) | the allowance for loan losses was increased by R$ 4,194 due to the level of risk and default, due to the changes in the financial perspectives of clients and the visible deterioration of macroeconomic variables. To fully reflect the risk of its loan operations, ITAÚ UNIBANCO HOLDING adopts the expected loss model for provisioning of operations since the moment they are granted and it is periodically updated according to the macroeconomic variables and circumstances of the client, and in 2020, in view of the pandemic, a weighting in the economic scenarios was added. In December 2020, the level of coverage of provisions in the loan portfolio of ITAÚ UNIBANCO HOLDING accounted for 255% as compared to 187% in the same period of 2019. Specifically for the expected loss of operations that have not shown any signs of deterioration so far (default or downgrading of the client’s rating), provisioning posted an increase of 28.8% in 12 months. The credit risk governance allowed ITAÚ UNIBANCO HOLDING a quick response for monitoring the impacts of the COVID-19 pandemic on the loan portfolio, permitting quick access to the information needed for discussions and actions of the crisis management daily forums; |
| | |
| Itaú Unibanco Holding S.A. – Complete Financial Statements in IFRS – December 31, 2020 | | F-132 |
ITAÚ UNIBANCO HOLDING S.A.
Notes to the Consolidated Financial Statements
At 12/31/2020 and 12/31/2019 for balance sheet accounts and
From 01/01 to 12/31 of 2020, 2019 and 2018 for income statement accounts
(In millions of Reais, except information per share)
| | (e) | the mark-to-market component of the securities portfolio was reduced to -1.3% in the first quarter of 2020, partially due to rate fluctuations and high price volatility in the markets in the beginning of the pandemic, influencing the measurement of items stated at fair value in their different levels; |
| | (f) | due to the COVID-19 pandemic, instability in the variable income market was noted causing a migration to fixed income instruments with liquidity. This movement resulted in the increase in the Bank Deposit Certificates portfolio. Additionally, there were impacts on funding, with an increase in deposits too. With the purpose of mitigating the system’s liquidity risk, BACEN made available to financial institutions credit lines through repurchase agreements in foreign currency and purchase of financial bills with guarantee, and operations in the total amount of R$ 30,547 were contracted; |
| | (g) | increase in the recognition of deferred income tax and social contribution due to the greater volume of deductible temporary differences recorded for the period. The pandemic reduced the projections of taxable income, however, it was not responsible for the generation of tax loss and social contribution loss carryforwards in ITAÚ UNIBANCO HOLDING; and |
| | (h) | increase in expenses with claims related to COVID-19 of R$ 104, mainly related to credit life and life insurance. |
There was a reduction in the face-to-face service staff and an increase in the spacing between people in call centers to reduce the circulation of people and the possibilities of contagion. The average number of people circulating in administrative centers was reduced, since they started to work remotely. Approximately 97% of employees in the central management, service centers and digital branches are working from home. It should be noted that despite the aforementioned measures, ITAÚ UNIBANCO HOLDING maintains its operating activities.
In order to reduce the effects of the crisis and ensure the employee’s health and safety, self-declaration was encouraged for employees who consider themselves at risk and those who cannot work remotely were put on vacation. With the purpose of supporting those who possibly had additional expenses due to the current crisis, the 13th salary was advanced in full. Additionally, a process of communication and transparency with employees was established through e-mails, internal employee’s portal and periodic videos prepared by our President and CEO communicating news related to COVID-19. At the branches, masks were delivered to all employees who work in customer service, acrylic protections were implemented and cleaning protocols were reviewed.
The adaptation of ITAÚ UNIBANCO HOLDING in the crisis is the result not only of investments in technology, which allows for these virtual interactions, but also of investments in flexibility in the work environment, such as work from home, communities integrated between different areas of the bank and new layouts in the administrative centers that promote the employees’ mobility.
In 2020, ITAÚ UNIBANCO HOLDING created the initiative “Todos pela Saúde” (All for Health) from the donation of R$ 1 billion, with the purpose of combating the new Coronavirus and its effects on Brazilian society. “Todos Pela Saúde” is conducted based on four axes: Informing, Protecting, Caring, and Resuming.
Note 34 – Subsequent Event
Issue of Subordinate Notes Tier 2
On January 12, 2021, ITAÚ UNIBANCO HOLDING priced the issue of subordinate notes Tier II 2, issued on January 15, maturing in ten years and three months, in the amount of US$ 500 million, at the fixed rate of 3.875%, effective for five years and three months from the issue date. As from this date, inclusive, the interest rate will be recalculated for another 5 years based on the interest rate of securities issued by the Treasury of the United States of America for the same period.
ITAÚ UNIBANCO HOLDING may repurchase the Notes as from the 5th year until the 5th year and three months of the issue date, and it will be subject to BACEN’s approval.
BACEN’s approval will be requested for the Notes to make up the Supplementary Capital of Referential Equity of ITAÚ UNIBANCO HOLDING, thus increasing by 0.25 p.p. its Basel Ratio, considering the exchange rate of January 8, quoted at R$ 5.37.
The Issue is neither subject to registration rules with the Securities Exchange Commission (SEC), in the United States, nor to registration with the Brazilian Securities Commission (CVM), in Brazil, in compliance with applicable law and regulations.
| | |
| Itaú Unibanco Holding S.A. – Complete Financial Statements in IFRS – December 31, 2020 | | F-133 |
ITAÚ UNIBANCO HOLDING S.A.
Notes to the Consolidated Financial Statements
At 12/31/2020 and 12/31/2019 for balance sheet accounts and
From 01/01 to 12/31 of 2020, 2019 and 2018 for income statement accounts
(In millions of Reais, except information per share)
The Notes were offered only to qualified institutional investors and to non-American investors outside the territory of the United States of America.
ITAÚ UNIBANCO HOLDING will use the funds raised by the Notes to finance or refinance green, social and/or sustainable projects.
XP INC Corporate Reorganization
At the Extraordinary Stockholders’ Meeting held on January 31, 2021, the corporate reorganization was decided in order to segregate the business line related to interest in XP INC’s capital to the new company that will be named XPart S.A. The XPart S.A. will be constituted by the portion of investment in XP INC and for the cash amount corresponding to R$ 10, and is subject to a favorable opinion from the regulatory authority obtained by the controllers for the completion of the operation. The percentage of XP INC’s capital to be held by XPart S.A. will be 40.52%, totaling R$ 9,371 on the base of December 31, 2020.
ITAÚ UNIBANCO HOLDING’s stockholders will then hold an ownership interest in XPart S.A., with the completion of the operation. After registration as a publicly-held company and authorization to list securities issued by XPart S.A., the ownership interest on XPart S.A. will be distributed to the shareholders of ITAÚ UNIBANCO HOLDING. The shares issued by XPart S.A. will be attributed to ITAÚ UNIBANCO HOLDING’s stockholders in the same number, type and proportion of the shares previously held by them in ITAÚ UNIBANCO HOLDING.
| | |
| Itaú Unibanco Holding S.A. – Complete Financial Statements in IFRS – December 31, 2020 | | F-134 |