EXHIBIT 99.1
Dear Shareholder:
I am delighted to share with you results from the first quarter of 2005 for Apple Hospitality Two, Inc. Our first quarter occupancy rates were 75 percent, up three percent over our first quarter of 2004, and our average daily rate (ADR) was $99, a five percent increase from this time last year. Additionally, revenue per available room (RevPAR) was $74, an impressive nine percent increase over first quarter 2004.
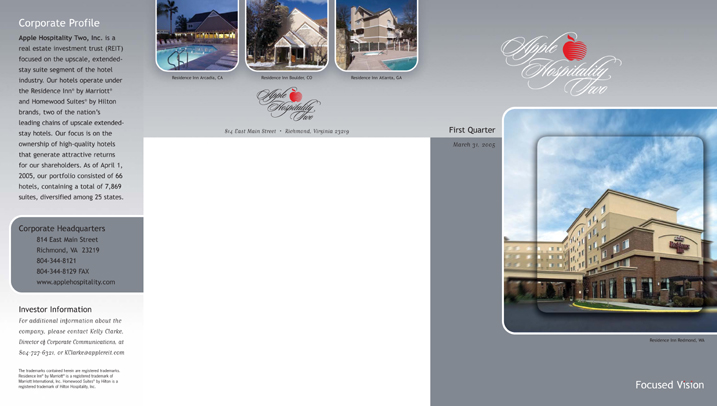
Our carefully selected properties, located in key markets, have consistently performed at the top of their class. For example, our Arcadia, CA Residence Inn®reported first quarter RevPar of $122, an 18 percent increase over last year. The Long Beach, CA Residence Inn®excelled with first quarter RevPar of $101, seven percent ahead of last year’s. Our Portland, OR Homewood Suites®jumped ahead of projected RevPar by 16 percent and our Dulles, VA Homewood Suites®achieved an impressive ADR of $144. In addition, our Residence Inns in Bakersfield, CA, Boca Raton, FL, Pensacola, FL and St. Petersburg, FL all celebrated occupancy rates of 90 percent or higher during the first quarter.
With a primary goal of generating strong returns for our investors, we work to increase our bottom line by monitoring operational costs at our properties including payroll, benefits, utilities and insurance, and ensuring the implementation of new brand initiatives. First quarter funds from operations (FFO) were $10.1 million or $.24 per share, a 26 percent increase over FFO from this time last year. During the first quarter of 2005, we paid shareholders dividends of $0.20 per share, representing an eight percent annual return on a $10 share price.
Reports show that as the economy strengthens, demand for our properties is increasing. According to the March 29, 2005 issue of The New York Times, Smith Travel Research reported demand for extended-stay lodging increased by five percent in 2004, an increase greater than that of the hotel industry overall. Furthermore, Ernst & Young revealed in their “2005 National Lodging Report,” that in 2004 hotels reclaimed pricing power and further improvement is anticipated in 2005—ADR is expected to increase around four percent and it is projected that occupancy rates will rise approximately two percent.
The outlook for 2005 is certainly positive. Favorable industry trends, our strong brand power, the performance of our markets and the continued success of our properties have set the foundation for another great year. I look forward to sharing our progress with you through future shareholder reports. Thank you for being an investor with Apple Hospitality Two.
|
| Sincerely, |
|

|
Glade M. Knight Chairman and Chief Executive Officer |
This quarterly report contains forward-looking statements within the meaning of the Securities Act of 1933 and the Securities Exchange Act of 1934. Such statements involve known and unknown risks, uncertainties, and other factors which may cause the actual results, performance, or achievements of the company to be materially different from any future results, performance or achievements expressed or implied by such forward-looking statements. Such factors include: the availability and terms of financing; changes in national, regional and local economies and business conditions; competitors within the extended-stay hotel industry; and the ability of the company to implement its acquisition strategy and operating strategy and to manage planned growth. In addition, the timing and amounts of distributions to common shareholders are within the discretion of the company’s board of directors. Although the company believes that the assumptions underlying the forward-looking statements contained herein are reasonable, any of the assumptions could be inaccurate; therefore, there can be no assurance that such statements included in this quarterly report will prove to be accurate. In light of the significant uncertainties inherent in the forward-looking statements included herein, the inclusion of such information should not be regarded as a representation by the company or any other person that the results or conditions described in such statements or the objectives and plans of the company will be achieved.
Statement of Operations(Unaudited)
| | | | | | | | |
(In thousands except statistical data)
| | For the three
months ended
March 31, 2005
| | | For the three
months ended
March 31, 2004
| |
Revenues | | | | | | | | |
Suite revenue | | $ | 52,641 | | | $ | 48,116 | |
Other revenue | | | 1,291 | | | | 1,364 | |
| | |
|
|
| |
|
|
|
Total revenues | | $ | 53,932 | | | $ | 49,480 | |
Expenses | | | | | | | | |
Direct operating expense | | $ | 14,133 | | | $ | 13,072 | |
Other hotel operating expenses | | | 22,487 | | | | 21,288 | |
General and administrative | | | 439 | | | | 633 | |
Depreciation of real estate owned | | | 6,393 | | | | 5,925 | |
Interest – net | | | 6,818 | | | | 6,476 | |
| | |
|
|
| |
|
|
|
Total expenses | | $ | 50,270 | | | $ | 47,394 | |
Net Income | | $ | 3,662 | | | $ | 2,086 | |
Funds from Operations (a) | | | | | | | | |
Net Income | | $ | 3,662 | | | $ | 2,086 | |
Depreciation of real estate owned | | | 6,393 | | | | 5,925 | |
| | |
|
|
| |
|
|
|
Funds From Operations | | $ | 10,055 | | | $ | 8,011 | |
| | |
|
|
| |
|
|
|
FFO per share | | $ | 0.24 | | | $ | 0.19 | |
Weighted-average Shares Outstanding | | | 41,714 | | | | 41,717 | |
Operating Statistics | | | | | | | | |
Occupancy | | | 75 | % | | | 73 | % |
Average Daily Rate | | $ | 99 | | | $ | 94 | |
RevPAR | | $ | 74 | | | $ | 68 | |
|
| Balance Sheet Highlights(Unaudited) | |
| | |
(In thousands)
| | March 31, 2005
| | | December 31, 2004
| |
Asset | | | | | | | | |
Investment in real estate – net | | $ | 629,615 | | | $ | 636,206 | |
Cash and cash equivalents | | | 6,986 | | | | 13,118 | |
Other assets | | | 22,303 | | | | 15,280 | |
| | |
|
|
| |
|
|
|
Total assets | | $ | 658,904 | | | $ | 664,604 | |
| | |
|
|
| |
|
|
|
Liabilities and Shareholders’ Equity | | | | | | | | |
Notes payable-secured | | $ | 371,321 | | | $ | 372,762 | |
Other liabilities | | | 16,512 | | | | 16,104 | |
| | |
|
|
| |
|
|
|
Total liabilities | | $ | 387,833 | | | $ | 388,866 | |
Total shareholders’ equity | | | 271,071 | | | | 275,738 | |
| | |
|
|
| |
|
|
|
Total liabilities and shareholders’ equity | | $ | 658,904 | | | $ | 664,604 | |
| | |
|
|
| |
|
|
|
| (a) | Funds from operations (FFO) is defined as net income (computed in accordance with generally accepted accounting principles - GAAP) excluding gains and losses from sales of depreciable property, plus depreciation and amortization. The company considers FFO in evaluating property acquisitions and its operating performance and believes that FFO should be considered along with, but not as an alternative to, net income and cash flows as a measure of the company’s activities in accordance with GAAP. FFO is not necessarily indicative of cash available to fund cash needs. |
The financial information furnished reflects all adjustments necessary for a fair presentation of financial position at March 31, 2005 and the results of operations for the interim period ended March 31, 2005. Such interim results are not necessarily indicative of the results that can be expected for the full year. The accompanying financial statements should be read in conjunction with the audited financial statements and related notes appearing in the Apple Hospitality Two, Inc. 2004 Annual Report.
Apple Hospitality Two
Portfolio of hotels
| | |
| ALABAMA | | Birmingham, |
| |
| | | Montgomery |
| |
| CALIFORNIA | | Arcadia, Bakersfield, |
| |
| | | Concord, Costa Mesa, |
| |
| | | Irvine, La Jolla, Long |
| |
| | | Beach, Placentia, |
| |
| | | San Ramon |
| |
| COLORADO | | Boulder (2) |
| |
| CONNECTICUT | | Meriden |
| |
| FLORIDA | | Boca Raton, |
| |
| | | Clearwater (2), |
| |
| | | Jacksonville, Pensacola |
| |
| GEORGIA | | Atlanta (7) |
| |
| ILLINOIS | | Chicago (2) |
| |
| LOUISIANNA | | Shreveport-Bossier City |
| |
| MARYLAND | | Baltimore |
| |
| MASSACHUSETTS | | Boston (2) |
| |
| MICHIGAN | | Detroit, Kalamazoo, |
| |
| | | Southfield |
| |
| MISSISSIPPI | | Jackson (2) |
| |
| MISSOURI | | St. Louis (3) |
| |
| NEVADA | | Las Vegas |
| |
| NEW MEXICO | | Santa Fe |
| |
| NORTH CAROLINA | | Charlotte, Greensboro |
| |
| OHIO | | Akron, Cincinnati (2), |
| |
| | | Columbus, Dayton (2) |
| |
| OREGON | | Portland |
| |
| PENNSYLVANIA | | Philadelphia (2) |
| |
| SOUTH CAROLINA | | Columbia, Spartanburg |
| |
| TENNESSEE | | Memphis |
| |
| TEXAS | | Dallas (4), Houston, |
| |
| | | Lubbock |
| |
| UTAH | | Salt Lake City |
| |
| VIRGINIA | | Herndon (Washington, D.C.), Richmond |
| |
| WASHINGTON | | Redmond |