Exhibit 99.1
STATEMENTS OF OPERATIONS(Unaudited)
| | | | | | | | | | | | | | | | |
(In thousands except statistical data) | | For the three months
ended June 30, 2006 | | | For the three months
ended June 30, 2005 | | | For the six months
ended June 30, 2006 | | | For the six months
ended June 30, 2005 | |
REVENUES | | | | | | | | | | | | | | | | |
SUITEREVENUE | | $ | 60,044 | | | $ | 56,253 | | | $ | 117,098 | | | $ | 108,204 | |
OTHERREVENUE | | | 1,606 | | | | 1,260 | | | | 2,900 | | | | 2,542 | |
REIMBURSEDEXPENSES | | | 627 | | | | 419 | | | | 1,255 | | | | 837 | |
| | | | | | | | | | | | | | | | |
TOTALREVENUES | | $ | 62,277 | | | $ | 57,932 | | | $ | 121,253 | | | $ | 111,583 | |
EXPENSES | | | | | | | | | | | | | | | | |
DIRECTOPERATINGEXPENSE | | $ | 14,535 | | | $ | 14,421 | | | $ | 28,653 | | | $ | 28,252 | |
OTHERHOTELOPERATINGEXPENSES | | | 23,895 | | | | 22,144 | | | | 47,747 | | | | 44,234 | |
GENERALANDADMINISTRATIVE | | | 554 | | | | 738 | | | | 1,197 | | | | 1,176 | |
REIMBURSEDEXPENSES | | | 627 | | | | 419 | | | | 1,255 | | | | 837 | |
TRANSACTIONADVISORYFEES | | | 92 | | | | — | | | | 112 | | | | — | |
DEPRECIATIONOFREALESTATEOWNED | | | 6,928 | | | | 6,399 | | | | 13,717 | | | | 12,726 | |
INTEREST,NET | | | 6,588 | | | | 6,822 | | | | 13,206 | | | | 13,640 | |
| | | | | | | | | | | | | | | | |
TOTALEXPENSES | | $ | 53,219 | | | $ | 50,943 | | | $ | 105,887 | | | $ | 100,865 | |
NET INCOME | | | | | | | | | | | | | | | | |
INCOMEFROMCONTINUINGOPERATIONS | | $ | 9,058 | | | $ | 6,989 | | | $ | 15,366 | | | $ | 10,718 | |
DISCONTINUEDOPERATIONS | | | — | | | | 83 | | | | 3 | | | | 16 | |
| | | | | | | | | | | | | | | | |
NETINCOME | | $ | 9,058 | | | $ | 7,072 | | | $ | 15,369 | | | $ | 10,734 | |
NETINCOMEPERSHARE | | $ | 0.22 | | | $ | 0.17 | | | $ | 0.37 | | | $ | 0.26 | |
MODIFIED FUNDS FROM OPERATIONS (A) | | | | | | | | | | | | | | | | |
NETINCOME | | $ | 9,058 | | | $ | 7,072 | | | $ | 15,369 | | | $ | 10,734 | |
DEPRECIATIONOFREALESTATEOWNED | | | 6,928 | | | | 6,399 | | | | 13,717 | | | | 12,726 | |
TRANSACTIONADVISORYFEES | | | 92 | | | | — | | | | 112 | | | | — | |
DISCONTINUEDOPERATIONS | | | — | | | | (83 | ) | | | (3 | ) | | | (16 | ) |
| | | | | | | | | | | | | | | | |
MODIFIEDFUNDSFROMOPERATIONS | | $ | 16,078 | | | $ | 13,388 | | | $ | 29,195 | | | $ | 23,444 | |
| | | | | | | | | | | | | | | | |
MODIFIED FFOPERSHARE | | $ | 0.39 | | | $ | 0.32 | | | $ | 0.70 | | | $ | 0.56 | |
WEIGHTED-AVERAGE SHARES OUTSTANDING | | | 41,731 | | | | 41,712 | | | | 41,718 | | | | 41,713 | |
OPERATING STATISTICS | | | | | | | | | | | | | | | | |
OCCUPANCY | | | 80 | % | | | 78 | % | | | 78 | % | | | 77 | % |
AVERAGEDAILYRATE | | $ | 108 | | | $ | 102 | | | $ | 107 | | | $ | 101 | |
REVPAR | | $ | 86 | | | $ | 80 | | | $ | 83 | | | $ | 77 | |
DIVIDENDSPERSHARE | | $ | 0.20 | | | $ | 0.20 | | | $ | 0.40 | | | $ | 0.40 | |
BALANCE SHEET HIGHLIGHTS(Unaudited)
| | | | | | |
(In thousands) | | June 30, 2006 | | December 31, 2005 |
ASSETS | | | | | | |
INVESTMENTINREALESTATE –NET | | $ | 604,998 | | $ | 609,822 |
HOTELSHELDFORSALE | | | — | | | 5,572 |
CASHANDCASHEQUIVALENTS | | | 60 | | | 415 |
OTHERASSETS | | | 23,785 | | | 22,367 |
| | | | | | |
TOTALASSETS | | $ | 628,843 | | $ | 638,176 |
| | | | | | |
LIABILITIES AND SHAREHOLDERS’ EQUITY | | | | | | |
NOTESPAYABLE–SECURED | | $ | 351,916 | | $ | 359,752 |
OTHERLIABILITIES | | | 16,700 | | | 17,067 |
| | | | | | |
TOTALLIABILITIES | | | 368,616 | | | 376,819 |
TOTALSHAREHOLDERS’EQUITY | | | 260,227 | | | 261,357 |
| | | | | | |
TOTALLIABILITIES &SHAREHOLDERS’EQUITY | | $ | 628,843 | | $ | 638,176 |
| | | | | | |
| (a) | Modified funds from operations (FFO) is defined as net income (computed in accordance with generally accepted accounting principles – GAAP) excluding gains and losses from sales of depreciable property, plus depreciation and amortization plus transaction advisory fees. The company considers modified FFO in evaluating property acquisitions and its operating performance and believes that modified FFO should be considered along with, but not as an alternative to, net income and cash flows as a measure of the company’s activities in accordance with GAAP. Modified FFO is not necessarily indicative of cash available to fund cash needs. |
The financial information furnished reflects all adjustments necessary for a fair presentation of financial position at June 30, 2006 and the results of operations for the interim period ended June 30, 2006. Such interim results are not necessarily indicative of the results that can be expected for the full year. The accompanying financial statements should be read in conjunction with the audited financial statements and related notes appearing in the Apple Hospitality Two, Inc. 2005 Annual Report.
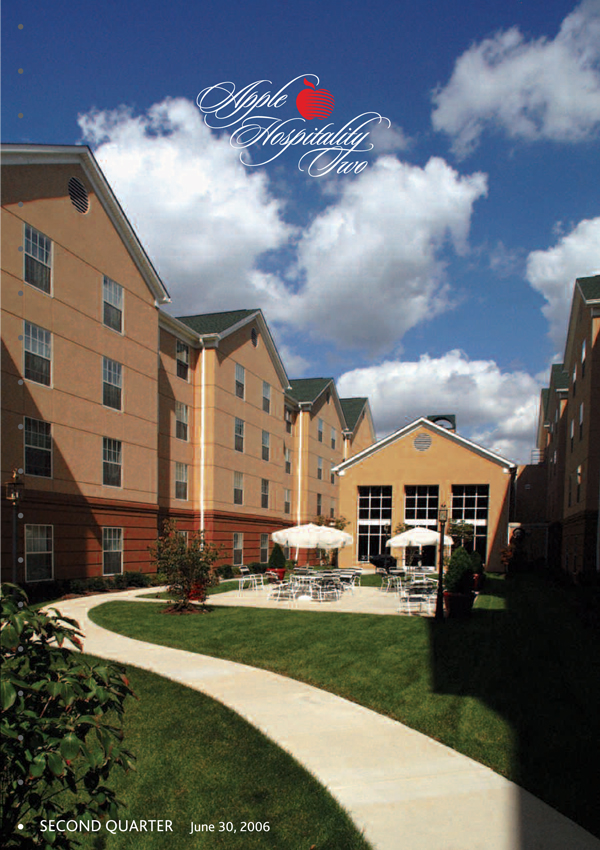
APPLE HOSPITALITY TWO
Portfolio of hotels
| | |
| ALABAMA | | Birmingham, Montgomery |
| |
| CALIFORNIA | | Arcadia, Bakersfield, |
| | Concord, Costa Mesa, Irvine, |
| | La Jolla, Long Beach, |
| | Placentia, San Ramon |
| |
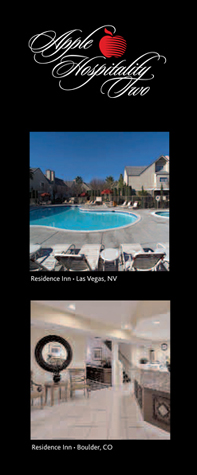
| COLORADO | | Boulder (2) |
| |
| CONNECTICUT | | Meriden |
| |
| FLORIDA | | Boca Raton, Clearwater (2), |
| | Jacksonville, Pensacola |
| |
| GEORGIA | | Atlanta (7) |
| |
| ILLINOIS | | Chicago (2) |
| |
| LOUISIANA | | Shreveport-Bossier City |
| |
| MARYLAND | | Baltimore |
| |
| MASSACHUSETTS | | Boston (2) |
| |
| MICHIGAN | | Detroit, Kalamazoo, |
| | Southfield |
| |
| MISSISSIPPI | | Jackson (2) |
| |
| MISSOURI | | St. Louis (3) |
| |
| NEVADA | | Las Vegas |
| |
| NEW MEXICO | | Santa Fe |
| |
| NORTH CAROLINA | | Greensboro |
| |
| OHIO | | Akron, Cincinnati (2), |
| | Columbus, Dayton (2) |
| |
| OREGON | | Portland |
| |
| PENNSYLVANIA | | Philadelphia (2) |
| |
| SOUTH CAROLINA | | Columbia |
| |
| TENNESSEE | | Memphis |
| |
| TEXAS | | Dallas (4), Houston, |
| | Lubbock |
| |
| UTAH | | Salt Lake City |
| |
| VIRGINIA | | Herndon (Washington, D.C.), |
| | Richmond |
| |
| WASHINGTON | | Redmond |
DEAR SHAREHOLDER
The second quarter of 2006 proved to be another strong period of operations for Apple Hospitality Two, Inc. Our hotels averaged daily rates (ADR) of $108, a six percent increase over the same period last year, and occupancy rates averaged 80%. The resulting revenue per available room (RevPAR) for the second quarter of this year was $86, an eight percent jump from the second quarter of 2005 RevPAR. Our funds from operations (FFO) during the second quarter of 2006 totaled more than $16 million which was equal to $0.39 per share.
According to Smith Travel Research’s 2005 Host Study, the supply of hotel rooms increased by only 0.3 percent in 2005, the lowest growth rate that the industry has experienced in ten years. Furthermore, the demand for hotel rooms during 2005 increased by more than three percent, setting the stage for higher RevPAR levels in 2006. Smith Travel Research’s findings have proven true for Apple Hospitality Two, as we have enjoyed a strong year so far. For the six-month period ending June 30, 2006, RevPAR was $83, nearly eight percent ahead of RevPAR for the same period last year.
Our brand partners and hotel industry icons, Marriott® and Hilton®, continue to lead the way in innovative hotel programs. Marriott International recently rolled out an initiative to make all of its hotels, including the Company’s Residence Inn® by Marriott® properties, completely smoke-free by September of this year. This new policy was created as a direct response to modern-day travelers’ requests and an overall decline in the number of smoking-room nights sold.
The Company and our Board of Directors continue to closely evaluate our strategic alternatives for providing you with the option of liquidity. We anticipate that we will share our progress with you in the near future.
It is a pleasure to write to you at such an exciting time in the hotel industry and for our Company. Favorable industry trends, our strong brand power, the performance of our markets and the continued success of our properties have set the foundation for a great year for Apple Hospitality Two. Thank you for investing with us and I look forward to sharing our progress with you in future shareholder reports.
|
| Sincerely, |
|
 |
| Glade M. Knight |
| Chairman and Chief Executive Officer |
This quarterly report contains forward-looking statements within the meaning of the Securities Act of 1933 and the Securities Exchange Act of 1934. Such statements involve known and unknown risks, uncertainties, and other factors which may cause the actual results, performance, or achievements of the company to be materially different from any future results, performance or achievements expressed or implied by such forward-looking statements. Such factors include: the availability and terms of financing; changes in national, regional and local economies and business conditions; competitors within the extended-stay hotel industry; and the ability of the company to implement its acquisition strategy and operating strategy and to manage planned growth.
In addition, the timing and amounts of distributions to common shareholders are within the discretion of the company’s board of directors. Although the company believes that the assumptions underlying the forward-looking statements contained herein are reasonable, any of the assumptions could be inaccurate; therefore, there can be no assurance that such statements included in this quarterly report will prove to be accurate. In light of the significant uncertainties inherent in the forward-looking statements included herein, the inclusion of such information should not be regarded as a representation by the company or any other person that the results or conditions described in such statements or the objectives and plans of the company will be achieved.
CORPORATE PROFILE
Apple Hospitality Two, Inc. is a real estate investment trust (REIT) focused on the upscale, extended-stay suite segment of the hotel industry. Apple Hospitality Two’s hotels operate under the Residence Inn® by Marriott® and Homewood Suites by Hilton® brands, two of the nation’s leading chains of upscale extended-stay hotels. Our focus is on the ownership of high-quality hotels that generate attractive returns for our shareholders. Our portfolio consists of 64 hotels, containing a total of 7,690 suites, diversified among 25 states.
CORPORATE HEADQUARTERS
814 East Main Street
Richmond, VA 23219
(804) 344-8121
(804) 344-8129 FAX
www.applehospitality.com
INVESTOR INFORMATION
For additional information, please contact:
Kelly Clarke,Director of Corporate Communications
804-727-6321 or KClarke@applereit.com
COVER PHOTO: Homewood Suites, Baltimore, MD
The trademarks contained herein are registered trademarks. Residence Inn® by Marriott® is a registered trademark of Marriott International, Inc.
Homewood Suites by Hilton® is a registered trademark of Hilton Hotels Corporation.