Exhibit 99.2
Chunghwa Telecom Co., Ltd. and Subsidiaries
Consolidated Financial Statements for the
Six Months Ended June 30, 2014 and 2013 and
Independent Auditors’ Review Report
- 1 -
INDEPENDENT AUDITORS’ REVIEW REPORT
The Board of Directors and Stockholders
Chunghwa Telecom Co., Ltd.
We have reviewed the accompanying consolidated balance sheets of Chunghwa Telecom Co., Ltd. and subsidiaries (“the Company”) as of June 30, 2014, and 2013, the related consolidated statements of comprehensive income for the three months ended June 30, 2014 and 2013 and for the six months ended June 30, 2014 and 2013, as well as the consolidated statements of changes in equity and cash flows for the six months ended June 30, 2014 and 2013. These consolidated financial statements are the responsibility of the Company’s management. Our responsibility is to issue a report on these consolidated financial statements based on our review.
We conducted our reviews in accordance with the Statement of Auditing Standards No. 36, “Review of Financial Statements”, issued by the Auditing Committee of the Accounting Research and Development Foundation of the Republic of China. A review consists principally of applying analytical procedures to financial data and making inquiries of persons responsible for financial and accounting matters. It is substantially less in scope than an audit conducted in accordance with auditing standards generally accepted in the Republic of China, the objective of which is the expression of an opinion regarding the financial statements taken as a whole. Accordingly, we do not express such an audit opinion.
Based on our reviews, we are not aware of any material modifications that should be made to the consolidated financial statements referred to above for them to be in conformity with the Guidelines Governing the Preparation of Financial Reports by Securities Issuers and International Accounting Standard 34, “Interim Financial Reporting” endorsed by the Financial Supervisory Commission of the Republic of China.
/s/ DELOITTE & TOUCHE |
Deloitte & Touche |
Taipei, Taiwan |
The Republic of China |
August 12, 2014
Notice to Readers
The accompanying consolidated financial statements are intended only to present the consolidated financial position, financial performance and cash flows in accordance with accounting principles and practices generally accepted in the Republic of China and not those of any other jurisdictions. The standards, procedures and practices to review such consolidated financial statements are those generally accepted and applied in the Republic of China.
For the convenience of readers, the independent auditors’ review report and the accompanying consolidated financial statements have been translated into English from the original Chinese version prepared and used in the Republic of China. If there is any conflict between the English version and the original Chinese version or any difference in the interpretation of the two versions, the Chinese-language independent auditors’ review report and consolidated financial statements shall prevail.
- 2 -
CHUNGHWA TELECOM CO., LTD. AND SUBSIDIARIES
CONSOLIDATED BALANCE SHEETS
(In Thousands of New Taiwan Dollars)
| June 30, 2014 (Reviewed) | December 31, 2013 (Audited) | June 30, 2013 (Reviewed) | ||||||||||||||||||||||
| Amount | % | Amount | % | Amount | % | |||||||||||||||||||
ASSETS | ||||||||||||||||||||||||
CURRENT ASSETS | ||||||||||||||||||||||||
Cash and cash equivalents (Note 6) | $ | 28,141,343 | 6 | $ | 14,585,105 | 3 | $ | 58,987,872 | 13 | |||||||||||||||
Financial assets at fair value through profit or loss (Note 7) | — | — | 337 | — | 944 | — | ||||||||||||||||||
Available-for-sale financial assets (Note 8) | — | — | 24,267 | — | 2,667,257 | — | ||||||||||||||||||
Held-to-maturity financial assets (Note 9) | 4,467,343 | 1 | 4,264,104 | 1 | 4,242,690 | 1 | ||||||||||||||||||
Hedging derivative assets (Notes 3 and 10) | 24 | — | — | — | 193 | — | ||||||||||||||||||
Trade notes and accounts receivable, net (Note 11) | 23,610,397 | 5 | 22,900,902 | 5 | 23,655,430 | 5 | ||||||||||||||||||
Accounts receivable from related parties (Note 38) | 69,680 | — | 69,304 | — | 51,438 | — | ||||||||||||||||||
Inventories (Notes 12 and 39) | 8,193,599 | 2 | 7,848,087 | 2 | 7,656,753 | 2 | ||||||||||||||||||
Prepayments (Notes 13 and 38) | 5,594,815 | 2 | 2,224,130 | 1 | 5,395,517 | 1 | ||||||||||||||||||
Other current monetary assets (Note 14) | 5,183,291 | 1 | 4,636,305 | 1 | 8,974,135 | 2 | ||||||||||||||||||
Other current assets (Note 20) | 5,266,805 | 1 | 3,960,798 | 1 | 3,734,357 | 1 | ||||||||||||||||||
|
|
|
|
|
|
|
|
|
|
|
| |||||||||||||
Total current assets | 80,527,297 | 18 | 60,513,339 | 14 | 115,366,586 | 25 | ||||||||||||||||||
|
|
|
|
|
|
|
|
|
|
|
| |||||||||||||
NONCURRENT ASSETS | ||||||||||||||||||||||||
Available-for-sale financial assets (Note 8) | 2,802,406 | 1 | 3,046,182 | 1 | 3,074,721 | 1 | ||||||||||||||||||
Financial assets carried at cost (Note 15) | 2,412,507 | — | 2,423,646 | — | 2,458,874 | 1 | ||||||||||||||||||
Held-to-maturity financial assets (Note 9) | 5,715,227 | 1 | 7,501,743 | 2 | 10,207,126 | 2 | ||||||||||||||||||
Investments accounted for using equity method (Note 16) | 2,506,021 | — | 2,562,293 | — | 2,153,828 | 1 | ||||||||||||||||||
Property, plant and equipment (Notes 17, 38 and 39) | 298,533,250 | 66 | 302,714,116 | 69 | 296,563,757 | 65 | ||||||||||||||||||
Investment properties (Note 18) | 8,009,747 | 2 | 8,018,031 | 2 | 7,780,608 | 2 | ||||||||||||||||||
Intangible assets (Note 19) | 43,763,380 | 10 | 44,398,888 | 10 | 5,481,211 | 1 | ||||||||||||||||||
Deferred income tax assets | 1,787,114 | — | 1,515,408 | — | 1,346,605 | — | ||||||||||||||||||
Prepayments (Notes 13 and 38) | 3,409,603 | 1 | 3,608,487 | 1 | 3,554,406 | 1 | ||||||||||||||||||
Other noncurrent assets (Notes 20 and 39) | 5,212,094 | 1 | 4,882,974 | 1 | 6,049,843 | 1 | ||||||||||||||||||
|
|
|
|
|
|
|
|
|
|
|
| |||||||||||||
Total noncurrent assets | 374,151,349 | 82 | 380,671,768 | 86 | 338,670,979 | 75 | ||||||||||||||||||
|
|
|
|
|
|
|
|
|
|
|
| |||||||||||||
TOTAL | $ | 454,678,646 | 100 | $ | 441,185,107 | 100 | $ | 454,037,565 | 100 | |||||||||||||||
|
|
|
|
|
|
|
|
|
|
|
| |||||||||||||
LIABILITIES AND EQUITY | ||||||||||||||||||||||||
CURRENT LIABILITIES | ||||||||||||||||||||||||
Short-term loans (Note 21) | $ | 1,085,000 | — | $ | 254,357 | — | $ | 194,865 | — | |||||||||||||||
Financial liabilities at fair value through profit or loss (Note 7) | 456 | — | 246 | — | 120 | — | ||||||||||||||||||
Hedging derivative liabilities (Notes 3 and 10) | 287 | — | — | — | 29,060 | — | ||||||||||||||||||
Trade notes and accounts payable (Note 23) | 12,386,753 | 3 | 15,589,108 | 4 | 11,717,243 | 3 | ||||||||||||||||||
Payables to related parties (Note 38) | 639,736 | — | 556,809 | — | 539,472 | — | ||||||||||||||||||
Current tax liabilities | 4,448,390 | 1 | 4,144,076 | 1 | 4,134,530 | 1 | ||||||||||||||||||
Dividends payables (Note 28) | 18,525,558 | 4 | — | — | 35,913,099 | 8 | ||||||||||||||||||
Other payables (Note 24) | 38,862,229 | 9 | 26,791,769 | 6 | 27,875,023 | 6 | ||||||||||||||||||
Provisions (Notes 25) | 118,904 | — | 129,341 | — | 135,793 | — | ||||||||||||||||||
Advance receipts (Note 26) | 9,060,245 | 2 | 9,463,535 | 2 | 10,013,855 | 2 | ||||||||||||||||||
Current portion of long-term loans (Note 22) | 300,000 | — | 300,000 | — | — | — | ||||||||||||||||||
Other current liabilities | 1,606,491 | — | 1,598,017 | — | 1,570,243 | — | ||||||||||||||||||
|
|
|
|
|
|
|
|
|
|
|
| |||||||||||||
Total current liabilities | 87,034,049 | 19 | 58,827,258 | 13 | 92,123,303 | 20 | ||||||||||||||||||
|
|
|
|
|
|
|
|
|
|
|
| |||||||||||||
NONCURRENT LIABILITIES | ||||||||||||||||||||||||
Long-term loans (Notes 22 and 39) | 1,748,000 | 1 | 1,400,000 | 1 | 1,700,000 | 1 | ||||||||||||||||||
Deferred income taxes liabilities | 110,501 | — | 101,379 | — | 104,407 | — | ||||||||||||||||||
Provisions (Note 25) | 120,935 | — | 123,464 | — | 149,213 | — | ||||||||||||||||||
Customers’ deposits (Note 38) | 4,774,790 | 1 | 4,834,580 | 1 | 4,811,041 | 1 | ||||||||||||||||||
Accrued pension liabilities | 5,713,227 | 1 | 5,519,103 | 1 | 4,744,825 | 1 | ||||||||||||||||||
Deferred revenue | 3,566,075 | 1 | 3,700,949 | 1 | 3,797,237 | 1 | ||||||||||||||||||
Other noncurrent liabilities | 1,329,481 | — | 1,334,220 | — | 1,318,571 | — | ||||||||||||||||||
|
|
|
|
|
|
|
|
|
|
|
| |||||||||||||
Total noncurrent liabilities | 17,363,009 | 4 | 17,013,695 | 4 | 16,625,294 | 4 | ||||||||||||||||||
|
|
|
|
|
|
|
|
|
|
|
| |||||||||||||
Total liabilities | 104,397,058 | 23 | 75,840,953 | 17 | 108,748,597 | 24 | ||||||||||||||||||
|
|
|
|
|
|
|
|
|
|
|
| |||||||||||||
EQUITY ATTRIBUTABLE TO STOCKHOLDERS OF THE PARENT (Note 28) | ||||||||||||||||||||||||
Common stock | 77,574,465 | 17 | 77,574,465 | 18 | 77,574,465 | 17 | ||||||||||||||||||
|
|
|
|
|
|
|
|
|
|
|
| |||||||||||||
Additional paid-in capital | 168,040,721 | 37 | 184,620,065 | 42 | 184,578,623 | 41 | ||||||||||||||||||
|
|
|
|
|
|
|
|
|
|
|
| |||||||||||||
Retained earnings | ||||||||||||||||||||||||
Legal reserve | 76,893,722 | 17 | 74,819,380 | 17 | 74,819,380 | 16 | ||||||||||||||||||
Special reserve | 2,819,899 | 1 | 2,675,894 | — | 2,675,894 | 1 | ||||||||||||||||||
Unappropriated earnings | 20,818,527 | 4 | 20,744,024 | 5 | 1,376,826 | — | ||||||||||||||||||
|
|
|
|
|
|
|
|
|
|
|
| |||||||||||||
Total retained earnings | 100,532,148 | 22 | 98,239,298 | 22 | 78,872,100 | 17 | ||||||||||||||||||
|
|
|
|
|
|
|
|
|
|
|
| |||||||||||||
Other adjustments | (412,430 | ) | — | (144,005 | ) | — | (102,998 | ) | — | |||||||||||||||
|
|
|
|
|
|
|
|
|
|
|
| |||||||||||||
Total equity attributable to stockholders of the parent | 345,734,904 | 76 | 360,289,823 | 82 | 340,922,190 | 75 | ||||||||||||||||||
|
|
|
|
|
|
|
|
|
|
|
| |||||||||||||
NONCONTROLLING INTERESTS | 4,546,684 | 1 | 5,054,331 | 1 | 4,366,778 | 1 | ||||||||||||||||||
|
|
|
|
|
|
|
|
|
|
|
| |||||||||||||
Total equity | 350,281,588 | 77 | 365,344,154 | 83 | 345,288,968 | 76 | ||||||||||||||||||
|
|
|
|
|
|
|
|
|
|
|
| |||||||||||||
TOTAL | $ | 454,678,646 | 100 | $ | 441,185,107 | 100 | $ | 454,037,565 | 100 | |||||||||||||||
|
|
|
|
|
|
|
|
|
|
|
| |||||||||||||
The accompanying notes are an integral part of the consolidated financial statements.
- 3 -
CHUNGHWA TELECOM CO., LTD. AND SUBSIDIARIES
CONSOLIDATED STATEMENTS OF COMPREHENSIVE INCOME
(In Thousands of New Taiwan Dollars, Except Earnings Per Share)
(Reviewed, Not Audited)
| For the Three Months Ended June 30 | For the Six Months Ended June 30 | |||||||||||||||||||||||||||||||
| 2014 | 2013 | 2014 | 2013 | |||||||||||||||||||||||||||||
| Amount | % | Amount | % | Amount | % | Amount | % | |||||||||||||||||||||||||
REVENUES (Notes 29 and 38) | $ | 55,784,235 | 100 | $ | 55,837,956 | 100 | $ | 110,834,147 | 100 | $ | 112,454,949 | 100 | ||||||||||||||||||||
OPERATING COSTS (Notes 12 and 38) | 35,036,373 | 63 | 35,279,063 | 64 | 70,036,540 | 63 | 72,729,744 | 65 | ||||||||||||||||||||||||
|
|
|
|
|
|
|
|
|
|
|
|
|
|
|
| |||||||||||||||||
GROSS PROFIT | 20,747,862 | 37 | 20,558,893 | 36 | 40,797,607 | 37 | 39,725,205 | 35 | ||||||||||||||||||||||||
|
|
|
|
|
|
|
|
|
|
|
|
|
|
|
| |||||||||||||||||
OPERATING EXPENSES (Note 38) | ||||||||||||||||||||||||||||||||
Marketing | 6,427,683 | 11 | 5,961,812 | 11 | 12,594,540 | 11 | 11,949,971 | 11 | ||||||||||||||||||||||||
General and administrative | 1,083,515 | 2 | 1,011,692 | 2 | 2,166,827 | 2 | 2,059,983 | 2 | ||||||||||||||||||||||||
Research and development | 897,016 | 2 | 931,773 | 1 | 1,790,928 | 2 | 1,802,796 | 1 | ||||||||||||||||||||||||
|
|
|
|
|
|
|
|
|
|
|
|
|
|
|
| |||||||||||||||||
Total operating expenses | 8,408,214 | 15 | 7,905,277 | 14 | 16,552,295 | 15 | 15,812,750 | 14 | ||||||||||||||||||||||||
|
|
|
|
|
|
|
|
|
|
|
|
|
|
|
| |||||||||||||||||
OTHER INCOME AND EXPENSE (Note 30) | (10,995 | ) | — | (5,728 | ) | — | (19,505 | ) | — | (30,226 | ) | — | ||||||||||||||||||||
|
|
|
|
|
|
|
|
|
|
|
|
|
|
|
| |||||||||||||||||
INCOME FROM OPERATIONS | 12,328,653 | 22 | 12,647,888 | 22 | 24,225,807 | 22 | 23,882,229 | 21 | ||||||||||||||||||||||||
|
|
|
|
|
|
|
|
|
|
|
|
|
|
|
| |||||||||||||||||
NON-OPERATING INCOME AND EXPENSES | ||||||||||||||||||||||||||||||||
Interest income | 83,609 | — | 172,939 | — | 142,732 | — | 324,410 | 1 | ||||||||||||||||||||||||
Other income (Notes 30 and 38) | 142,342 | — | 69,403 | — | 395,409 | 1 | 138,875 | — | ||||||||||||||||||||||||
Other gains and losses (Notes 30 and 38) | 24,654 | — | (42,464 | ) | — | (6,368 | ) | — | (30,656 | ) | — | |||||||||||||||||||||
Finance costs (Note 30) | (10,559 | ) | — | (6,373 | ) | — | (19,285 | ) | — | (14,347 | ) | — | ||||||||||||||||||||
Share of the profit of associates and jointly controlled entities accounted for using equity method (Note 16) | 219,616 | 1 | 202,653 | 1 | 391,722 | — | 302,359 | — | ||||||||||||||||||||||||
|
|
|
|
|
|
|
|
|
|
|
|
|
|
|
| |||||||||||||||||
Total non-operating income and expenses | 459,662 | 1 | 396,158 | 1 | 904,210 | 1 | 720,641 | 1 | ||||||||||||||||||||||||
|
|
|
|
|
|
|
|
|
|
|
|
|
|
|
| |||||||||||||||||
INCOME BEFORE INCOME TAX | 12,788,315 | 23 | 13,044,046 | 23 | 25,130,017 | 23 | 24,602,870 | 22 | ||||||||||||||||||||||||
INCOME TAX EXPENSE (Notes 3 and 31) | 2,091,946 | 4 | 2,157,517 | 4 | 4,047,979 | 4 | 4,102,241 | 4 | ||||||||||||||||||||||||
|
|
|
|
|
|
|
|
|
|
|
|
|
|
|
| |||||||||||||||||
NET INCOME | 10,696,369 | 19 | 10,886,529 | 19 | 21,082,038 | 19 | 20,500,629 | 18 | ||||||||||||||||||||||||
|
|
|
|
|
|
|
|
|
|
|
|
|
|
|
| |||||||||||||||||
OTHER COMPREHENSIVE INCOME (LOSS), Net | ||||||||||||||||||||||||||||||||
Exchange differences arising from the translation of the foreign operations | (51,248 | ) | — | 15,694 | — | (36,731 | ) | — | 89,812 | — | ||||||||||||||||||||||
Unrealized gain (loss) on available-for-sale financial assets | 26,162 | — | (244,797 | ) | — | (233,805 | ) | — | (333,317 | ) | — | |||||||||||||||||||||
(Continued)
- 4 -
CHUNGHWA TELECOM CO., LTD. AND SUBSIDIARIES
CONSOLIDATED STATEMENTS OF COMPREHENSIVE INCOME
(In Thousands of New Taiwan Dollars, Except Earnings Per Share)
(Reviewed, Not Audited)
| For the Three Months Ended June 30 | For the Six Months Ended June 30 | |||||||||||||||||||||||||||||||
| 2014 | 2013 | 2014 | 2013 | |||||||||||||||||||||||||||||
| Amount | % | Amount | % | Amount | % | Amount | % | |||||||||||||||||||||||||
Cash flow hedges (Note 10) | $ | (263 | ) | — | $ | — | — | $ | (263 | ) | — | $ | — | — | ||||||||||||||||||
Share of other comprehensive loss of associates and jointly controlled entities accounted for using equity method | (32,245 | ) | — | (8,260 | ) | — | (24,641 | ) | — | (36,300 | ) | — | ||||||||||||||||||||
Income tax relating to each component of other comprehensive income (Note 31) | 846 | — | (379 | ) | — | 1,882 | — | 111 | — | |||||||||||||||||||||||
|
|
|
|
|
|
|
|
|
|
|
|
|
|
|
| |||||||||||||||||
Total other comprehensive loss, net of income tax | (56,748 | ) | — | (237,742 | ) | — | (293,558 | ) | — | (279,694 | ) | — | ||||||||||||||||||||
|
|
|
|
|
|
|
|
|
|
|
|
|
|
|
| |||||||||||||||||
TOTAL COMPREHENSIVE INCOME | $ | 10,639,621 | 19 | $ | 10,648,787 | 19 | $ | 20,788,480 | 19 | $ | 20,220,935 | 18 | ||||||||||||||||||||
|
|
|
|
|
|
|
|
|
|
|
|
|
|
|
| |||||||||||||||||
NET INCOME ATTRIBUTABLE TO | ||||||||||||||||||||||||||||||||
Stockholders of the parent | $ | 10,582,991 | 19 | $ | 10,634,960 | 19 | $ | 20,818,408 | 19 | $ | 19,836,066 | 18 | ||||||||||||||||||||
Noncontrolling interests | 113,378 | — | 251,569 | 1 | 263,630 | — | 664,563 | — | ||||||||||||||||||||||||
|
|
|
|
|
|
|
|
|
|
|
|
|
|
|
| |||||||||||||||||
| $ | 10,696,369 | 19 | $ | 10,886,529 | 20 | $ | 21,082,038 | 19 | $ | 20,500,629 | 18 | |||||||||||||||||||||
|
|
|
|
|
|
|
|
|
|
|
|
|
|
|
| |||||||||||||||||
COMPREHENSIVE INCOME ATTRIBUTABLE TO | ||||||||||||||||||||||||||||||||
Stockholders of the parent | $ | 10,542,310 | 19 | $ | 10,386,347 | 19 | $ | 20,549,983 | 19 | $ | 19,532,409 | 17 | ||||||||||||||||||||
Noncontrolling interests | 97,311 | — | 262,440 | — | 238,497 | — | 688,526 | 1 | ||||||||||||||||||||||||
|
|
|
|
|
|
|
|
|
|
|
|
|
|
|
| |||||||||||||||||
| $ | 10,639,621 | 19 | $ | 10,648,787 | 19 | $ | 20,788,480 | 19 | $ | 20,220,935 | 18 | |||||||||||||||||||||
|
|
|
|
|
|
|
|
|
|
|
|
|
|
|
| |||||||||||||||||
EARNINGS PER SHARE (Note 32) | ||||||||||||||||||||||||||||||||
Basic | $ | 1.36 | $ | 1.37 | $ | 2.68 | $ | 2.56 | ||||||||||||||||||||||||
|
|
|
|
|
|
|
| |||||||||||||||||||||||||
Diluted | $ | 1.36 | $ | 1.37 | $ | 2.68 | $ | 2.56 | ||||||||||||||||||||||||
|
|
|
|
|
|
|
| |||||||||||||||||||||||||
The accompanying notes are an integral part of the consolidated financial statements. | (Concluded) |
- 5 -
CHUNGHWA TELECOM CO., LTD. AND SUBSIDIARIES
CONSOLIDATED STATEMENTS OF CHANGES IN EQUITY
(In Thousands of New Taiwan Dollars)
(Reviewed, Not Audited)
| Equity Attributable to Owner of the Company (Notes 10 and 28) | ||||||||||||||||||||||||||||||||||||||||||||||||||||
| Other Equity | ||||||||||||||||||||||||||||||||||||||||||||||||||||
| Retained Earnings | Exchange Differences Arising from the Translation | Unrealized Gain (Loss) on Available- | Total equity | |||||||||||||||||||||||||||||||||||||||||||||||||
| Common Stock | Additional Paid-in Capital | Legal Reserve | Special Reserve | Unappropriated Earnings | Total Retained Earnings | of the Foreign | for-sale Financial Assets | Cash flow Hedges | Total Other Adjustments | Attributable to Stockholders of the Parent | Noncontrolling Interests | Total Equity | ||||||||||||||||||||||||||||||||||||||||
BALANCE, JANUARY 1, 2013 | $ | 77,574,465 | $ | 190,162,430 | $ | 70,828,983 | $ | 2,675,894 | $ | 21,483,854 | $ | 94,988,731 | $ | (96,930 | ) | $ | 257,991 | $ | — | $ | 161,061 | $ | 362,886,687 | $ | 4,441,849 | $ | 367,328,536 | |||||||||||||||||||||||||
Appropriation of 2012 earnings | ||||||||||||||||||||||||||||||||||||||||||||||||||||
Legal reserve | — | — | 3,990,397 | — | (3,990,397 | ) | — | — | — | — | — | — | — | — | ||||||||||||||||||||||||||||||||||||||
Cash dividends distributed by Chunghwa | — | — | — | — | (35,913,099 | ) | (35,913,099 | ) | — | — | — | — | (35,913,099 | ) | — | (35,913,099 | ) | |||||||||||||||||||||||||||||||||||
Cash dividends distributed by subsidiaries | — | — | — | — | — | — | — | — | — | — | — | (810,789 | ) | (810,789 | ) | |||||||||||||||||||||||||||||||||||||
Other changes in additional paid-in capital | ||||||||||||||||||||||||||||||||||||||||||||||||||||
Cash distributed from additional paid-in capital | — | (5,589,240 | ) | — | — | — | — | — | — | — | — | (5,589,240 | ) | — | (5,589,240 | ) | ||||||||||||||||||||||||||||||||||||
Change in additional paid-in capital from investments in associates accounted for using equity method | — | 1,630 | — | — | — | — | — | — | — | — | 1,630 | 4,223 | 5,853 | |||||||||||||||||||||||||||||||||||||||
Net income for the six months ended June 30, 2013 | — | — | — | — | 19,836,066 | 19,836,066 | — | — | — | — | 19,836,066 | 664,563 | 20,500,629 | |||||||||||||||||||||||||||||||||||||||
Other comprehensive income for the six months ended June 30, 2013 | — | — | — | — | (39,598 | ) | (39,598 | ) | 67,687 | (331,746 | ) | — | (264,059 | ) | (303,657 | ) | 23,963 | (279,694 | ) | |||||||||||||||||||||||||||||||||
|
|
|
|
|
|
|
|
|
|
|
|
|
|
|
|
|
|
|
|
|
|
|
|
|
| |||||||||||||||||||||||||||
Total comprehensive income for the six months ended June 30, 2013 | — | — | — | — | 19,796,468 | 19,796,468 | 67,687 | (331,746 | ) | — | (264,059 | ) | 19,532,409 | 688,526 | 20,220,935 | |||||||||||||||||||||||||||||||||||||
|
|
|
|
|
|
|
|
|
|
|
|
|
|
|
|
|
|
|
|
|
|
|
|
|
| |||||||||||||||||||||||||||
Exercise of employee stock option of subsidiaries | — | 3,803 | — | — | — | — | — | — | — | — | 3,803 | 26,269 | 30,072 | |||||||||||||||||||||||||||||||||||||||
Compensation cost of employee stock option of a subsidiary | — | — | — | — | — | — | — | — | — | — | — | 16,950 | 16,950 | |||||||||||||||||||||||||||||||||||||||
Decrease in noncontrolling interests | — | — | — | — | — | — | — | — | — | — | — | (250 | ) | (250 | ) | |||||||||||||||||||||||||||||||||||||
|
|
|
|
|
|
|
|
|
|
|
|
|
|
|
|
|
|
|
|
|
|
|
|
|
| |||||||||||||||||||||||||||
BALANCE, JUNE 30, 2013 | $ | 77,574,465 | $ | 184,578,623 | $ | 74,819,380 | $ | 2,675,894 | $ | 1,376,826 | $ | 78,872,100 | $ | (29,243 | ) | $ | (73,755 | ) | $ | — | $ | (102,998 | ) | $ | 340,922,190 | $ | 4,366,778 | $ | 345,288,968 | |||||||||||||||||||||||
|
|
|
|
|
|
|
|
|
|
|
|
|
|
|
|
|
|
|
|
|
|
|
|
|
| |||||||||||||||||||||||||||
BALANCE, JANUARY 1, 2014 | $ | 77,574,465 | $ | 184,620,065 | $ | 74,819,380 | $ | 2,675,894 | $ | 20,744,024 | $ | 98,239,298 | $ | 5,742 | $ | (149,747 | ) | $ | — | $ | (144,005 | ) | $ | 360,289,823 | $ | 5,054,331 | $ | 365,344,154 | ||||||||||||||||||||||||
Appropriation of 2013 earnings | ||||||||||||||||||||||||||||||||||||||||||||||||||||
Legal reserve | — | — | 2,074,342 | — | (2,074,342 | ) | — | — | — | — | — | — | — | — | ||||||||||||||||||||||||||||||||||||||
Special reserve | — | — | — | 144,005 | (144,005 | ) | — | — | — | — | — | — | — | — | ||||||||||||||||||||||||||||||||||||||
Cash dividends distributed by Chunghwa | — | — | — | — | (18,525,558 | ) | (18,525,558 | ) | — | — | — | — | (18,525,558 | ) | — | (18,525,558 | ) | |||||||||||||||||||||||||||||||||||
Cash dividends distributed by subsidiaries | — | — | — | — | — | — | — | — | — | — | — | (796,789 | ) | (796,789 | ) | |||||||||||||||||||||||||||||||||||||
Other changes in additional paid-in capital | ||||||||||||||||||||||||||||||||||||||||||||||||||||
Cash dividends from additional paid-in capital | — | (16,577,663 | ) | — | — | — | — | — | — | — | — | (16,577,663 | ) | — | (16,577,663 | ) | ||||||||||||||||||||||||||||||||||||
Change in additional paid-in capital from investments in associates and jointly controlled entities accounted for using equity method | — | (1,681 | ) | — | — | — | — | — | — | — | — | (1,681 | ) | (2,486 | ) | (4,167 | ) | |||||||||||||||||||||||||||||||||||
Net income for the six months ended June 30, 2014 | — | — | — | — | 20,818,408 | 20,818,408 | — | — | — | — | 20,818,408 | 263,630 | 21,082,038 | |||||||||||||||||||||||||||||||||||||||
Other comprehensive income for the six months ended June 30, 2014 | — | — | — | — | — | — | (43,791 | ) | (224,371 | ) | (263 | ) | (268,425 | ) | (268,425 | ) | (25,133 | ) | (293,558 | ) | ||||||||||||||||||||||||||||||||
|
|
|
|
|
|
|
|
|
|
|
|
|
|
|
|
|
|
|
|
|
|
|
|
|
| |||||||||||||||||||||||||||
Total comprehensive income for the six months ended June 30, 2014 | — | — | — | — | 20,818,408 | 20,818,408 | (43,791 | ) | (224,371 | ) | (263 | ) | (268,425 | ) | 20,549,983 | 238,497 | 20,788,480 | |||||||||||||||||||||||||||||||||||
|
|
|
|
|
|
|
|
|
|
|
|
|
|
|
|
|
|
|
|
|
|
|
|
|
| |||||||||||||||||||||||||||
Compensation cost of employee stock option of a subsidiary | — | — | — | — | — | — | — | — | — | — | — | 53,131 | 53,131 | |||||||||||||||||||||||||||||||||||||||
|
|
|
|
|
|
|
|
|
|
|
|
|
|
|
|
|
|
|
|
|
|
|
|
|
| |||||||||||||||||||||||||||
BALANCE, JUNE 30, 2014 | $ | 77,574,465 | $ | 168,040,721 | $ | 76,893,722 | $ | 2,819,899 | $ | 20,818,527 | $ | 100,532,148 | $ | (38,049 | ) | $ | (374,118 | ) | $ | (263 | ) | $ | (412,430 | ) | $ | 345,734,904 | $ | 4,546,684 | $ | 350,281,588 | ||||||||||||||||||||||
|
|
|
|
|
|
|
|
|
|
|
|
|
|
|
|
|
|
|
|
|
|
|
|
|
| |||||||||||||||||||||||||||
The accompanying notes are an integral part of the consolidated financial statements.
- 6 -
CHUNGHWA TELECOM CO., LTD. AND SUBSIDIARIES
CONSOLIDATED STATEMENTS OF CASH FLOWS
(In Thousands of New Taiwan Dollars)
(Reviewed, Not Audited)
| Six Months Ended June 30 | ||||||||
| 2014 | 2013 | |||||||
CASH FLOWS FROM OPERATING ACTIVITIES | ||||||||
Income before income tax | $ | 25,130,017 | $ | 24,602,870 | ||||
Adjustments to reconcile income before income tax to net cash provided by operating activities: | ||||||||
Depreciation | 16,105,591 | 15,360,856 | ||||||
Amortization | 784,700 | 601,967 | ||||||
Provision for doubtful accounts | 148,370 | 138,262 | ||||||
Interest expenses | 19,285 | 14,347 | ||||||
Interest income | (142,732 | ) | (324,410 | ) | ||||
Dividend income | (76,998 | ) | (34,451 | ) | ||||
Compensation cost of employee stock options | 53,131 | 16,950 | ||||||
Share of the profit of associates and jointly controlled entities accounted for using equity method | (391,722 | ) | (302,359 | ) | ||||
Impairment loss on financial assets carried at cost | 8,976 | 26,772 | ||||||
Impairment loss on intangible assets | — | 18,055 | ||||||
Provision for inventory and obsolescence | 247,684 | 137,965 | ||||||
Impairment loss on property, plant and equipment | — | 2,262 | ||||||
Loss (gain) on disposal of financial instruments | (44,377 | ) | 6,951 | |||||
Loss on disposal of property, plant and equipment | 19,505 | 9,909 | ||||||
Valuation loss (gain) on financial assets and liabilities at fair value through profit or loss, net | 456 | (34,756 | ) | |||||
Gain arising on adjustments for hedged available-for-sale financial assets | — | (63,566 | ) | |||||
Valuation loss on hedging derivative liabilities, net | — | 57,806 | ||||||
Valuation loss on hedging derivative assets, net | — | 5,760 | ||||||
Loss (gain) on foreign exchange | 107,722 | (68,631 | ) | |||||
Changes in operating assets and liabilities: | ||||||||
Decrease (increase) in: | ||||||||
Financial assets held for trading | 91 | 4,603 | ||||||
Trade notes and accounts receivable | (855,279 | ) | 674,216 | |||||
Receivables from related parties | (376 | ) | (7,501 | ) | ||||
Inventories | (593,196 | ) | (598,617 | ) | ||||
Other current monetary assets | (274,231 | ) | (527,227 | ) | ||||
Prepayment | (3,171,800 | ) | (3,409,982 | ) | ||||
Other current assets | (1,306,006 | ) | 740,238 | |||||
Increase (decrease) in: | ||||||||
Trade notes and accounts payable | (3,255,927 | ) | (1,875,442 | ) | ||||
Payables to related parties | 82,927 | (300,594 | ) | |||||
Other payables | (4,187,853 | ) | (3,622,071 | ) | ||||
Provisions | (12,966 | ) | 18,852 | |||||
Advance receipts | (403,290 | ) | (88,206 | ) | ||||
Other current liabilities | 6,328 | (32,697 | ) | |||||
(Continued)
- 7 -
CHUNGHWA TELECOM CO., LTD. AND SUBSIDIARIES
CONSOLIDATED STATEMENTS OF CASH FLOWS
(In Thousands of New Taiwan Dollars)
(Reviewed, Not Audited)
| Six Months Ended June 30 | ||||||||
| 2014 | 2013 | |||||||
Deferred revenue | $ | (134,874 | ) | $ | (41,617 | ) | ||
Accrued pension liabilities | 194,124 | 128,022 | ||||||
|
|
|
| |||||
Cash generated from operations | 28,057,280 | 31,234,536 | ||||||
Interest paid | (19,270 | ) | (22,264 | ) | ||||
Income tax paid | (4,005,213 | ) | (3,312,033 | ) | ||||
|
|
|
| |||||
Net cash provided by operating activities | 24,032,797 | 27,900,239 | ||||||
|
|
|
| |||||
CASH FLOWS FROM INVESTING ACTIVITIES | ||||||||
Acquisition of available-for-sale financial assets | — | (1,761,867 | ) | |||||
Proceeds from disposal of available-for-sale financial assets | 81,229 | 1,341,910 | ||||||
Acquisition of time deposits and negotiable certificate of deposit with maturities of more than three months | (411,000 | ) | (17,729,546 | ) | ||||
Proceeds from disposal of time deposits and negotiable certificate of deposit with maturities of more than three months | 434,607 | 33,820,230 | ||||||
Proceeds from disposal of held-to-maturity financial assets | 1,570,000 | 1,570,692 | ||||||
Acquisition of financial assets carried at cost | (47,078 | ) | (35,785 | ) | ||||
Proceeds from disposal of financial assets carried at cost | 3,489 | — | ||||||
Capital reduction of financial assets carried at cost | 43,740 | 18,000 | ||||||
Proceeds from disposal of hedging derivative assets | — | 9,635 | ||||||
Derecognition of hedging derivative liabilities | — | (84,133 | ) | |||||
Acquisition of investments accounted for using equity method | (133,485 | ) | (60,000 | ) | ||||
Capital reduction of associates | — | 16,387 | ||||||
Acquisition of property, plant and equipment | (13,089,921 | ) | (15,586,069 | ) | ||||
Proceeds from disposal of property, plant and equipment | 3,808 | 35,847 | ||||||
Acquisition of intangible assets | (149,163 | ) | (321,109 | ) | ||||
Increase in noncurrent assets | (340,956 | ) | (1,451,126 | ) | ||||
Interest received | 21,857 | 334,297 | ||||||
Cash dividends received | 451,807 | 361,115 | ||||||
|
|
|
| |||||
Net cash provided by (used in) investing activities | (11,561,066 | ) | 478,478 | |||||
|
|
|
| |||||
CASH FLOWS FROM FINANCING ACTIVITIES | ||||||||
Proceeds from short-term loans | 830,643 | 227,292 | ||||||
Repayment of short-term loans | — | (143,900 | ) | |||||
Proceeds from long-term loans | 348,000 | — | ||||||
Repayment of long-term loans | — | (358,372 | ) | |||||
Customers’ deposits refunded | (58,707 | ) | (95,308 | ) | ||||
Decrease in other liabilities | (4,739 | ) | (84,389 | ) | ||||
Proceeds from exercise of employee stock option granted by subsidiaries | — | 30,072 | ||||||
|
|
|
| |||||
Net cash provided by (used in) financing activities | 1,115,197 | (424,605 | ) | |||||
|
|
|
| |||||
(Continued)
- 8 -
CHUNGHWA TELECOM CO., LTD. AND SUBSIDIARIES
CONSOLIDATED STATEMENTS OF CASH FLOWS
(In Thousands of New Taiwan Dollars)
(Reviewed, Not Audited)
| Six Months Ended June 30 | ||||||||
| 2014 | 2013 | |||||||
EFFECT OF EXCHANGE RATE CHANGES ON CASH AND CASH EQUIVALENTS | $ | (30,690 | ) | $ | 95,288 | |||
|
|
|
| |||||
NET INCREASE IN CASH AND CASH EQUIVALENTS | 13,556,238 | 28,049,400 | ||||||
CASH AND CASH EQUIVALENTS, BEGINNING OF PERIOD | 14,585,105 | 30,938,472 | ||||||
|
|
|
| |||||
CASH AND CASH EQUIVALENTS, END OF PERIOD | $ | 28,141,343 | $ | 58,987,872 | ||||
|
|
|
| |||||
The accompanying notes are an integral part of the consolidated financial statements. | (Concluded) |
- 9 -
CHUNGHWA TELECOM CO., LTD. AND SUBSIDIARIES
NOTES TO CONSOLIDATED FINANCIAL STATEMENTS
SIX MONTHS ENDED JUNE 30, 2014 AND 2013
(In Thousands of New Taiwan Dollars, Unless Stated Otherwise)
(Reviewed, Not Audited)
| 1. | GENERAL |
Chunghwa Telecom Co., Ltd. (“Chunghwa”) was incorporated on July 1, 1996 in the Republic of China (“ROC”) pursuant to the Article 30 of the Telecommunications Act. Chunghwa is a company limited by shares and, prior to August 2000, was wholly owned by the Ministry of Transportation and Communications (“MOTC”). Prior to July 1, 1996, the current operations of Chunghwa were carried out under the Directorate General of Telecommunications (“DGT”). The DGT was established by the MOTC in June 1943 to take primary responsibility in the development of telecommunications infrastructure and to formulate policies related to telecommunications. On July 1, 1996, the telecom operations of the DGT were spun-off to as Chunghwa which continues to carry out the business and the DGT continues to be the industry regulator.
As the dominate telecommunications service provider of domestic and international fixed-line, Global System for Mobile Communications (“GSM”), and Third Generation (“3G”) mobile service in the ROC, Chunghwa is subject to additional regulations imposed by ROC.
Effective August 12, 2005, the MOTC had completed the process of privatizing Chunghwa by reducing the government ownership to below 50% in various stages. In July 2000, Chunghwa received approval from the Securities and Futures Commission (the “SFC”) for a domestic initial public offering and its common shares were listed and traded on the Taiwan Stock Exchange (the “TWSE”) on October 27, 2000. Certain of Chunghwa’s common shares had been sold, in connection with the foregoing privatization plan, in domestic public offerings at various dates from August 2000 to July 2003. Certain of Chunghwa’s common shares had also been sold in an international offering of securities in the form of American Depository Shares (“ADS”) on July 17, 2003 and were listed and traded on the New York Stock Exchange (the “NYSE”). The MOTC sold common shares of Chunghwa by auction in the ROC on August 9, 2005 and completed the second international offering on August 10, 2005. Upon completion of the share transfers associated with these offerings on August 12, 2005, the MOTC owned less than 50% of the outstanding shares of Chunghwa and completed the privatization plan.
Chunghwa together with its subsidiaries are hereinafter referred to collectively as “the Company”.
The consolidated financial statements are presented in Chunghwa’s functional currency, New Taiwan dollars.
| 2. | APPROVAL OF FINANCIAL STATEMENTS |
The consolidated financial statements were approved and authorized by the Board of Directors on August 12, 2014.
- 10 -
| 3. | SUMMARY OF SIGNIFICANT ACCOUNTING POLICIES |
Statement of Compliance
The accompany consolidated financial statements have been prepared in conformity with the Guidelines Governing the Preparation of Financial Reports by Securities Issuers and International Accounting Standard 34, “Interim Financial Reporting,” endorsed by the Financial Supervisory Commission (the “FSC”). The consolidated financial statements do not present full disclosures required for a complete set of the International Financial Reporting Standards (IFRS), International Accounting Standards (IAS), and the Interpretations as well as related guidance translated by Accounting Research and Development Foundation (ARDF) endorsed by the FSC (collectively, “Taiwan-IFRSs”) annual consolidated financial statements.
Basis of Consolidation
The detailed information of subsidiaries included in the consolidated financial statements was as follows:
| Percentage of Ownership | ||||||||||||||||||||
| Name of Investor | Name of Investee | Main Businesses and Products | June 30, 2014 | December 31, 2013 | June 30, 2013 | Note | ||||||||||||||
Chunghwa Telecom Co., Ltd. | Senao International Co., Ltd. (“SENAO”) | Selling and maintaining mobile phones and its peripheral products | 28 | 28 | 28 | a. | ||||||||||||||
Light Era Development Co., Ltd. (“LED”) | Housing, office building development, rent and sale services | 100 | 100 | 100 | ||||||||||||||||
Donghwa Telecom Co., Ltd. (“DHT”) | International telecommunications IP fictitious internet and internet transfer services | 100 | 100 | 100 | ||||||||||||||||
Chunghwa Telecom Singapore Pte., Ltd. (“CHTS”) | Telecommunication wholesale, internet transfer services international data and long distance call wholesales to carriers | 100 | 100 | 100 | ||||||||||||||||
Chunghwa System Integration Co., Ltd. (“CHSI”) | Providing communication and information aggregative services | 100 | 100 | 100 | ||||||||||||||||
Chunghwa Investment Co., Ltd. (“CHI”) | Investment | 89 | 89 | 89 | ||||||||||||||||
CHIEF Telecom Inc. (“CHIEF”) | Internet communication and internet data center (“IDC”) service | 69 | 69 | 69 | ||||||||||||||||
Chunghwa International Yellow Pages Co., Ltd. (“CHYP”) | Yellow pages sales and advertisement services | 100 | 100 | 100 | ||||||||||||||||
Prime Asia Investments Group Ltd. (B.V.I.) (“Prime Asia”) | Investment | 100 | 100 | 100 | ||||||||||||||||
Spring House Entertainment Tech. Inc. (“SHE”) | Network services, producing digital entertainment contents and broadband visual sound terrace development | 56 | 56 | 56 | ||||||||||||||||
Chunghwa Telecom Global, Inc. (“CHTG”) | International data and internet services and long distance call wholesales to carriers | 100 | 100 | 100 | ||||||||||||||||
Chunghwa Telecom Vietnam Co., Ltd. (“CHTV”) | Information and communications technology, international circuit, and intelligent energy network service | 100 | 100 | 100 | ||||||||||||||||
Smartfun Digital Co., Ltd. (“SFD”) | Software retail | 65 | 65 | 65 | ||||||||||||||||
Chunghwa Telecom Japan Co., Ltd. (“CHTJ”) | Telecom business, information process and information provide service, development and sale of software and consulting services in telecommunication | 100 | 100 | 100 | ||||||||||||||||
Chunghwa Sochamp Technology Inc. (“CHST”) | License plate recognition system | 51 | 51 | 51 | ||||||||||||||||
Honghwa International Co., Ltd. (“HHI”) | Telecommunication constructions, telecommunication service agencies and other service. | 100 | 100 | 100 | b. | |||||||||||||||
New Prospect Investments Holdings Ltd. (B.V.I.) (“New Prospect”) | Investment | 100 | 100 | 100 | ||||||||||||||||
Senao International Co., Ltd. | Senao International (Samoa) Holding Ltd. (“SIS”) | International investment | 100 | 100 | 100 | |||||||||||||||
CHIEF Telecom Inc. | Unigate Telecom Inc. (“Unigate”) | Telecommunication and internet service | 100 | 100 | 100 | |||||||||||||||
Chief International Corp. (“CIC”) | Investment | 100 | 100 | 100 | ||||||||||||||||
Chunghwa System Integrated Co., Ltd. | Concord Technology Co., Ltd. (“Concord”) | Investment | 100 | 100 | 100 | |||||||||||||||
Spring House Entertainment Tech. Inc. | Ceylon Innovation Ltd. (“CEI”) | International trading, general advertisement and book publishment service | 100 | 100 | 100 | |||||||||||||||
Light Era Development Co., Ltd. | Yao Yong Real Property Co., Ltd. (“YYRP”) | Real estate management and leasing business | 100 | 100 | 100 | |||||||||||||||
Chunghwa Investment Co., Ltd. | Chunghwa Precision Test Tech Co., Ltd. (“CHPT”) | Semiconductor testing components and printed circuit board industry production and marketing of electronic products | 51 | 51 | 51 | c. | ||||||||||||||
Chunghwa Investment Holding Co., Ltd. (“CIHC”) | Investment | 100 | 100 | 100 | ||||||||||||||||
(Continued)
- 11 -
| Percentage of Ownership | ||||||||||||||||||||
| Name of Investor | Name of Investee | Main Businesses and Products | June 30, 2014 | December 31, 2013 | June 30, 2013 | Note | ||||||||||||||
Concord Technology Co., Ltd. | Glory Network System Service (Shanghai) Co., Ltd. (“GNSS (Shanghai)”) | Planning and design of software and hardware system services and integration of information system | 100 | 100 | 100 | |||||||||||||||
Chunghwa Precision Test Tech. Co., Ltd. | Chunghwa Precision Test Tech. USA Corporation (“CHPT (US)”) | Semiconductor testing components and printed circuit board industry production and marketing of electronic products | 100 | 100 | 100 | |||||||||||||||
CHPT Japan Co., Ltd. (“CHPT (JP)”) | Sale and maintenance of electronic parts and machinery processed products, and design of printed circuit board | 100 | 100 | 100 | d. | |||||||||||||||
Chunghwa Precision Test Tech. International, Ltd. (“CHPT (International)”) | Electronic materials wholesale and retail and investment | 100 | 100 | — | e. | |||||||||||||||
Senao International (Samoa) Holding Ltd. | Senao International HK Limited (“SIHK”) | International investment | 100 | 100 | 100 | |||||||||||||||
Chunghwa Investment Holding Co., Ltd. | CHI One Investment Co., Limited (“COI”) | Investment | 100 | 100 | 100 | |||||||||||||||
Senao International HK Limited | Senao Trading (Fujian) Co., Ltd. (“STF”) | Information technology services and sale of communication products | 100 | 100 | 100 | |||||||||||||||
Senao International Trading (Shanghai) Co., Ltd. (“SITS”) | Information technology services and sale of communication products | 100 | 100 | 100 | ||||||||||||||||
Senao International Trading (Shanghai) Co., Ltd. (“SEITS”) | Information technology services and maintenance of communication products | 100 | 100 | 100 | ||||||||||||||||
Senao International Trading (Jiangsu) Co., Ltd. (“SITJ”) | Information technology services and sale of communication products | 100 | 100 | 100 | ||||||||||||||||
Prime Asia Investments Group, Ltd. (B.V.I.) | Chunghwa Hsingta Co., Ltd. (“CHC”) | Investment | 100 | 100 | 100 | |||||||||||||||
Chunghwa Hsingta Company Ltd. | Chunghwa Telecom (China) Co., Ltd. (“CTC”) | Planning and design of energy conservation and software and hardware system services, and integration of information system | 100 | 100 | 100 | |||||||||||||||
Jiangsu Zhenhua Information Technology Company, LLC. (“JZIT”) | Intelligent energy conserving and intelligent building services | 75 | 75 | 75 | ||||||||||||||||
Hua-Xiong Information Technology Co., Ltd. (“HXIT”) | Intelligent system and energy saving system services in buildings | 51 | 51 | 51 | ||||||||||||||||
Chunghwa Precision Test Tech. International, Ltd. | Shanghai Taihua Electronic Technology Limited (“STET”) | Design of printed circuit board and related consultation service | 100 | — | — | f. | ||||||||||||||
(Concluded)
| a. | The Company owns 28% equity shares of SENAO. However, the Company has four out of seven seats of the board of directors of SENAO through the support of large beneficial shareholders. Therefore, the Company has control over SENAO and the accounts of SENAO are included in the consolidated financial statements. The decrease of the Company’s equity ownership of SENAO was due to the exercise of options by SENAO’s employees. The Company owned 28.23%, 28.18% and 28.18% equity shares of SENAO as of June 30, 2013, December 31, 2013 and June 30, 2014, respectively. |
| b. | Chunghwa established 100% owned subsidiary of HHI in January 2013. Honghwa Human Resources changed its name to Honghwa International from July 4, 2014. |
| c. | The decrease of the Company’s equity ownership of CHPT was due to the exercise of options by CHPT’s employees and CHPT issued employee stock bonus. The Company owned 51.06%, 50.62% and 50.62% equity shares of CHPT as of June 30, 2013, December 31, 2013 and June 30, 2014, respectively. |
| d. | CHPT established 100% owned subsidiary of CHPT (JP) in January 2013. |
| e. | CHPT established 100% owned subsidiary of CHPT (International) in July 2013. |
| f. | CHPT (International) established 100% owned subsidiary of STET in January 2014. |
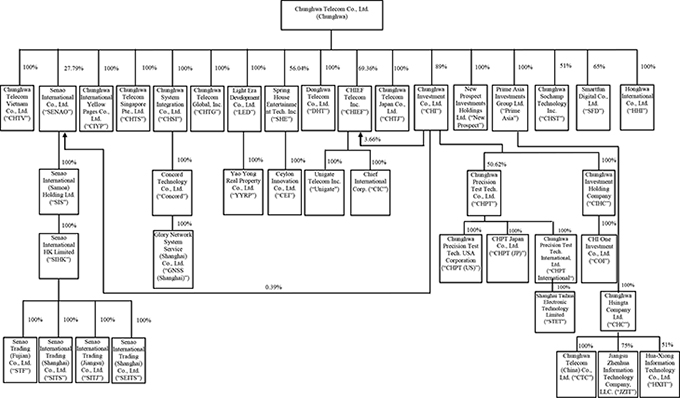
- 12 -
The following diagram presents information regarding the relationship and ownership percentages between Chunghwa and its subsidiaries as of June 30, 2014:
Other Significant Accounting Policies
The accounting policies applied in these consolidated financial statements are consistent with those applied in the consolidated financial statements for the year ended December 31, 2013, except for those described below:
| a. | Retirement benefit costs |
For defined benefit retirement plans, the cost of providing retirement benefit in the interim period is determined using the pension cost rate derived from the actuarial valuation at the end of prior year, adjusted for significant market fluctuation, curtailment, settlement or other one-time events.
| b. | Taxation |
Income tax expense represents the sum of the tax currently payable and deferred tax. Interim period income taxes are assessed on an annual basis. Interim period income tax expense is calculated by applying to an interim period’s pre-tax income and the tax rate that would be applicable to expected total annual earnings.
| c. | Hedge accounting |
The Company designates certain derivatives as cash flow hedges.
The effective portion of changes in the fair value of derivatives that are designated and qualify as cash flow hedges is recognized in other comprehensive income. The gain or loss relating to the ineffective portion is recognized immediately in profit or loss.
- 13 -
The associated gains or losses that were recognized in other comprehensive income are reclassified from equity to profit or loss as a reclassification adjustment in the line item relating to the hedged item in the same period when the hedged item affects profit or loss. However, when the hedged forecast transaction subsequently results in the recognition of a non-financial asset or a non-financial liability, the associated gains and losses previously recognized in other comprehensive income are transferred from equity and are included in the initial cost of the non-financial asset or non-financial liability.
Hedge accounting is discontinued prospectively when the Company revokes the designated hedging relationship, or when the hedging instrument expires or is sold, terminated, or exercised, or when it no longer meets the criteria for hedge accounting. The cumulative gain or loss on the hedging instrument previously recognized in other comprehensive income remains in equity until the forecast transaction occurs. When a forecast transaction is no longer expected to occur, the gain or loss accumulated in equity is recognized immediately in profit or loss.
| 4. | CRITICAL ACCOUNTING JUDGEMENTS AND KEY SOURCES OF ESTIMATION UNCERTAINTY |
In the application of the Company’s accounting policies, the managements are required to make judgments, estimates and assumptions which are based on historical experience and other factors that are not readily apparent from other sources. Actual results may differ from these estimates.
The estimates and underlying assumptions are reviewed on an ongoing basis. Revisions to accounting estimates are recognized in the period in which the estimate is revised if the revision affects only that period, or in the period of the revision and future periods if the revision affects both current and future periods.
The same critical accounting judgments and key sources of estimation uncertainty of consolidated financial statements have been followed in these consolidated financial statements as were applied in the preparation of the consolidated financial statements for the year ended December 31, 2013.
| 5. | APPLICATION OF NEW AND REVISED STANDARDS AND INTERPRETATIONS |
| a. | The 2013 Taiwan-IFRSs version in issue but not yet effective |
On April 3, 2014, according to Rule No. 1030010325 issued by the FSC, the following 2013 IFRS version endorsed by the FSC (collectively, “2013 Taiwan-IFRSs version”) should be adopted by the Company starting 2015.
New, Revised or Amended Standards and Interpretations | Effective Date Issued by IASB (Note) | |||
Amendments to IFRSs | Improvement to IFRSs 2009—amendment to IAS 39 | January 1, 2009 and January 1, 2010, as appropriate | ||
Amendment to IAS 39 | Embedded Derivative | Effective for annual periods ending on or after June 30, 2009 | ||
Amendments to IFRSs | Improvements to IFRSs 2010 | July 1, 2010 or January 1, 2011, as appropriate | ||
Amendments to IFRSs | Annual Improvements to IFRSs 2009-2011 Cycle | January 1, 2013 | ||
(Continued)
- 14 -
New, Revised or Amended Standards and Interpretations | Effective Date Issued by IASB (Note) | |||
Amendment to IFRS 1 | Limited Exemption from Comparative IFRS 7 Disclosures of First-time Adopters | July 1, 2010 | ||
Amendment to IFRS 1 | Severe Hyperinflation and Removal of Fixed Dates for First-time Adopters | July 1, 2011 | ||
Amendment to IFRS 1 | Government Loans | January 1, 2013 | ||
Amendment to IFRS 7 | Disclosures—Offsetting Financial Assets and Financial Liabilities | January 1, 2013 | ||
Amendment to IFRS 7 | Disclosures—Transfers of Financial Assets | July 1, 2011 | ||
Amendment to IFRS 10 | Consolidated Financial Statements | January 1, 2013 | ||
Amendment to IFRS 11 | Joint Arrangements | January 1, 2013 | ||
Amendment to IFRS 12 | Disclosure of Interests in Other Entities | January 1, 2013 | ||
Amendments to IFRS 10, 11 and 12 | Consolidated Financial Statements, Joint Arrangements and Disclosure of Interests in Other Entities: Transition Guidance | January 1, 2013 | ||
Amendments to IFRS 10, IFRS 12 and IAS 27 | Investment Entities | January 1, 2014 | ||
IFRS 13 | Fair Value Measurement | January 1, 2013 | ||
Amendment to IAS 1 | Presentation of Items of Other Comprehensive Income | July 1, 2012 | ||
Amendment to IAS 12 | Deferred Tax: Recovery of Underlying Assets | January 1, 2012 | ||
Amendment to IAS 19 (Revised 2011) | Employee Benefits | January 1, 2013 | ||
Amendment to IAS 27 (Revised 2011) | Separate Financial Statements | January 1, 2013 | ||
Amendment to IAS 28 (Revised 2011) | Investments in Associates and Joint Ventures | January 1, 2013 | ||
Amendment to IAS 32 | Offsetting of Financial Assets and Financial Liabilities | January 1, 2014 | ||
IFRIC 20 | Stripping Costs in Production Phase of a Surface Mine | January 1, 2013 | ||
(Concluded)
| Note: | Unless stated otherwise, the above new, revised or amended standards or interpretations are effective for annual periods beginning on or after the respective effective dates. |
Except for the following, the application of aforementioned 2013 Taiwan-IFRSs version has not had any material impact on the Company’s consolidated financial statements:
| 1) | IFRS 12 “Disclosure of Interests in Other Entities” |
IFRS 12 is a new disclosure standard and is applicable to entities that have interests in subsidiaries, joint arrangements, associates and/or unconsolidated structured entities. In general, the disclosure requirements in IFRS 12 are more extensive than in the current standards. The Company will apply the new disclosure requirements of IFRS 12 in 2015.
- 15 -
| 2) | IFRS 13 “Fair Value Measurement” |
IFRS 13 establishes a single source of guidance for fair value measurements and related disclosures. It defines fair value, establishes a framework for measuring fair value, and requires disclosures about fair value measurements. The disclosure requirements in IFRS 13 are more extensive than those required in the current standards. For example, quantitative and qualitative disclosures based on the three-level fair value hierarchy currently required for financial instruments only will be extended by IFRS 13 to cover all assets and liabilities within its scope.
The Company will apply IFRS 13 prospectively in 2015.
| 3) | Amendments to IAS 1 “Presentation of Items of Other Comprehensive Income” |
The amendments to IAS 1 require items of other comprehensive income to be grouped into those that (1) will not be reclassified to profit or loss; and (2) will be reclassified subsequently to profit or loss when specific conditions are met. Income taxes on related items of other comprehensive income are grouped on the same basis. Previously, there were no such requirements.
The Company will apply the amendments to IAS 1 in 2015. The items that will not be reclassified subsequently to profit or loss are expected to include actuarial gains or losses from defined benefit plans, the share of actuarial gains or losses from defined benefit plans of associates and jointly controlled entities as well as the related income tax on such items. Items that will be reclassified subsequently to profit or loss are expected to include exchange differences arising on translation of foreign operations, changes in fair value of available-for-sale financial assets, cash flow hedges, the share of other comprehensive income of associates and jointly controlled entities as well as the related income tax on items of other comprehensive income (except for the share of actuarial gains or losses from defined benefit plans of associates and jointly controlled entities).
| 4) | Amendments to IAS 19 “Employee Benefits” |
The amendments to IAS 19 change the accounting for defined benefit plans, which require the Company to recognize changes in defined benefit obligations or assets and to disclose the components of the defined benefit costs. According to the amendments, the past service cost, will be expensed immediately when it incurs and no longer be amortized over the average period before vested on a straight-line basis. In addition, the amendment also requires a broader disclosure in defined benefit plans.
When the Company applies the amendments to IAS 19 in 2015, employee benefits will be recognized based on actuarial calculations in accordance with IAS 19. The Company anticipates that as of June 30, 2014 and January 1, 2014, deferred tax assets will be retrospectively restated to decrease by $8,534 thousand and $9,082 thousand, respectively; accrued pension liabilities will be retrospectively restated to decrease by $33,731 thousand and $35,898 thousand, respectively; retained earnings will be retrospectively restated to increase by $21,937 thousand and $23,472 thousand, respectively; noncontrolling interests will be retrospectively restated to increase by $3,260 thousand and $3,344 thousand, respectively. For the three months ended June 30, 2014, pension cost will increase by $1,083 thousand which increase in operating expenses, and income tax expenses will decrease by $274 thousand. For the six months ended June 30, 2014 pension cost will increase by $2,167 thousand which increase in operating expenses, and income tax expenses will decrease by $548 thousand.
- 16 -
Except for the abovementioned impact, as of the date the consolidated financial statements were authorized for issue, the Company is continuingly assessing the possible impact that the application of the 2013 Taiwan-IFRSs version will have on the Company’s financial position and operating result, and will disclose the relevant impact when the assessment is complete.
| b. | The IFRSs issued by IASB but not endorsed by FSC |
The Company has not applied the following IFRSs issued by the IASB but not endorsed by the FSC. As of the date that the consolidated financial statements were authorized for issue, the initial adoption to the following standards and interpretations is still subject to the effective date to be published by the FSC.
New, Revised or Amended Standards and Interpretations | Effective Date Issued by IASB (Note 1) | |||
Amendments to IFRSs | Annual Improvements to IFRSs 2010-2012 Cycle | July 1, 2014 (Note 2) | ||
Amendments to IFRSs | Annual Improvements to IFRSs 2011-2013 Cycle | July 1, 2014 | ||
IFRS 9 | Financial Instruments | January 1, 2018 | ||
Amendments to IFRS 9 and IFRS 7 | Mandatory Effective Date of IFRS 9 and Transition Disclosures | January 1, 2018 | ||
Amendment to IFRS 11 | Acquisitions of Interests in Joint Operations | January 1, 2016 | ||
IFRS 14 | Regulatory Deferral Accounts | January 1, 2016 | ||
IFRS 15 | Revenue from Contracts with Customers | January 1, 2017 | ||
Amendments to IAS 16 and IAS 38 | Clarification of Acceptable Methods of Depreciation and Amortization | January 1, 2016 | ||
Amendments to IAS 16 and IAS 41 | Agriculture: Bearer Plants | January 1, 2016 | ||
Amendment to IAS 19 | Defined Benefit Plans: Employee Contributions | July 1, 2014 | ||
Amendment to IAS 36 | Impairment of Assets: Recoverable Amount Disclosures for Non-financial Assets | January 1, 2014 | ||
Amendment to IAS 39 | Novation of Derivatives and Continuation of Hedge Accounting | January 1, 2014 | ||
IFRIC 21 | Levies | January 1, 2014 | ||
| Note 1: | Unless stated otherwise, the above new standards and interpretations are effective for annual periods beginning on or after the respective effective dates. |
| Note 2: | The amendment to IFRS 2 applies to share-based payment transactions for which the grant date is on or after July 1, 2014; the amendment to IFRS 3 applies to business combinations for which the acquisition date is on or after July 1, 2014; the amendment to IFRS 13 is effective immediately; the remaining amendments are effective for annual periods beginning on or after July 1, 2014. |
- 17 -
Except for the following, the initial application of the above new standards and interpretations have not had any material impact on the Company’s consolidated financial statements:
| 1) | IFRS 9 “Financial Instruments” |
Recognition and measurement of financial assets
With regards to financial assets, all recognized financial assets that are within the scope of IAS 39 “Financial Instruments: Recognition and Measurement” are subsequently measured at amortized cost or fair value. Under IFRS 9, the requirements for the classification and measurement of financial assets are stated as follows:
| a) | For debt instruments, if their contractual terms give rise on specified dates to cash flows that are solely payments of principal and interest on the principal outstanding, and they are held within a business model whose objective is to collect the contractual cash flows, the financial assets are measured at amortized cost and are assessed for impairment continuously with impairment loss recognized in profit or loss, if any. Interest revenue is recognized in profit or loss by using the effective interest method; |
| b) | For debt instruments, if the objective of the Company’s business model is achieved by both collecting the contractual cash flows and selling financial assets, the financial assets are measured at fair value through other comprehensive income (FVTOCI) and are assessed for impairment continuously. Interest revenue is recognized in profit or loss by using the effective interest method, and other gain or loss shall be recognized in other comprehensive income, except for impairment gains or losses and foreign exchange gains and losses. |
| c) | Except for a) and b), all other financial assets are measured at fair value through profit or loss. However, the Company may make an irrevocable election to present subsequent changes in the fair value of an equity investment (that is not held for trading) in other comprehensive income, with only dividend income generally recognized in profit or loss. No subsequent impairment assessment is required. |
The impairment of financial assets
IFRS 9 requires that an entity recognize impairment loss on financial assets by using the “expected credit losses model”. The credit loss allowance is required for financial assets measured at amortized cost, financial assets mandatorily measured at FVTOCI, lease receivables, contract assets arising from IFRS 15 “Revenue from Contracts with Customers”, loan commitments and financial guarantee contracts. A loss allowance for the 12-month expected credit losses is required for a financial asset if its credit risk has not increased significantly since initial recognition. However, a loss allowance for full lifetime expected credit losses is required for (1) a financial asset if its credit risk has increased significantly since initial recognition and (2) trade receivables.
For purchased or originated credit-impaired financial assets, the estimated cash flows used to calculate the credit-adjusted effective interest rate incorporate expected credit losses at initial recognition. Subsequently, any changes in expected losses are recognized as changes in loss allowance with a corresponding gain or loss recognized in profit or loss.
- 18 -
Hedge accounting
The main changes in hedge accounting amended the application requirements for hedge accounting to better reflect the entity’s risk management activities. Compared with IAS 39, the main changes include: (1) enhancing types of transactions eligible for hedge accounting, specifically broadening the risk eligible for hedge accounting of non-financial items; (2) changing the way hedging derivative instruments are accounted for to reduce profit or loss volatility; and (3) replacing retrospective effectiveness assessment with the principle of economic relationship between the hedging instrument and the hedged item.
| 2) | Amendments to IAS 36 “Recoverable Amount Disclosures for Non-financial Assets” |
In issuing IFRS 13 “Fair Value Measurement”, the IASB made some consequential amendments to the disclosure requirements in IAS 36 “Impairment of Assets”, introducing a requirement to disclose in every reporting period the recoverable amount of an asset or each cash-generating unit. The amendment clarifies that the disclosure of such recoverable amount is required during the period when an impairment loss has been recognized or reversed. Furthermore, the Company is required to disclose the discount rate used in current and previous measurements of the recoverable amount based on fair value less costs of disposal measured using a present value technique.
| 3) | Amendments to IAS 39 “Novation of Derivatives and Continuation of Hedge Accounting” |
The amendments to IAS 39 provide an exception to the requirement for the discontinuation of hedge accounting. The amendment states that the novation of a hedging instrument should not be considered an expiration or termination giving rise to the discontinuation of hedge accounting when a hedging derivative is novated:
As a consequence of laws and regulations, or the introduction of laws and regulations, one or more clearing counterparties replace the original counterparty; and
Any changes in terms of the novated derivative are limited to those necessary to effect the replacement of the counterparty.
Any changes to the derivative’s fair value arising from the novation would be reflected in its measurement and therefore in the measurement and assessment of hedge effectiveness. The Company does not anticipate that the application of these amendments to IAS 39 will have a significant impact on the Company’s consolidated financial statements as the Company does not have any novation of derivatives.
| 4) | IFRS 15 “Revenue from Contracts with Customers” |
IFRS 15 establishes principles for recognizing revenue that apply to all contracts with customers, and will supersedes IAS 18 “Revenue”, IAS 11 “Construction Contracts” and a number of revenue-related interpretations from January 1, 2017.
When applying IFRS 15, the Company shall recognize revenue by applying the following steps:
a) Identify the contract with the customer;
b) Identify the performance obligations in the contract;
c) Determine the transaction price;
d) Allocate the transaction price to the performance obligations in the contract; and
e) Recognize revenue when the entity satisfies a performance obligation.
When IFRS 15 is effective, the Company may elect to apply IFRS 15 either retrospectively to each prior reporting period presented or retrospectively with the cumulative effect of initially applying IFRS 15 recognized at the date of initial application.
- 19 -
Except for the abovementioned impact, as of the date the consolidated financial statements were authorized for issue, the Company is continuingly assessing the possible impact that the application other standards and interpretations will have on the Company’s financial position and operating result, and will disclose the relevant impact when the assessment is complete.
| 6. | CASH AND CASH EQUIVALENTS |
| June 30, 2014 | December 31, 2013 | June 30, 2013 | ||||||||||
Cash | ||||||||||||
Cash on hand | $ | 302,808 | $ | 235,955 | $ | 311,389 | ||||||
Bank deposits | 6,495,599 | 10,591,681 | 5,125,359 | |||||||||
|
|
|
|
|
| |||||||
| 6,798,407 | 10,827,636 | 5,436,748 | ||||||||||
|
|
|
|
|
| |||||||
Cash equivalents | ||||||||||||
Commercial paper | 12,887,906 | 2,375,419 | 36,301,572 | |||||||||
Negotiable certificate of deposit with maturities of less than three months | 8,062,195 | — | 15,800,000 | |||||||||
Time deposits with maturities of less than three months | 392,835 | 1,382,050 | 1,449,552 | |||||||||
|
|
|
|
|
| |||||||
| 21,342,936 | 3,757,469 | 53,551,124 | ||||||||||
|
|
|
|
|
| |||||||
| $ | 28,141,343 | $ | 14,585,105 | $ | 58,987,872 | |||||||
|
|
|
|
|
| |||||||
The annual yield rates of bank deposits, commercial paper, negotiable certificate of deposit with maturities of less than three months and time deposits with maturities of less than three months were as follows:
| June 30, 2014 | December 31, 2013 | June 30, 2013 | ||||
Bank deposits | 0.00%-0.39% | 0.00%-0.76% | 0.00%-0.94% | |||
Commercial paper | 0.56%-0.63% | 0.60%-0.65% | 0.68%-0.70% | |||
Negotiable certificate of deposit with maturities of less than three months | 0.60%-1.35% | — | 0.84%-0.87% | |||
Time deposits with maturities of less than three months | 0.30%-5.55% | 0.05%-5.10% | 0.30%-5.50% |
| 7. | FINANCIAL INSTRUMENTS AT FAIR VALUE THROUGH PROFIT OR LOSS |
| June 30, 2014 | December 31, 2013 | June 30, 2013 | ||||||||||
Financial assets held for trading | ||||||||||||
Derivatives (not designated for hedge) | ||||||||||||
Forward exchange contracts | $ | — | $ | 337 | $ | 944 | ||||||
|
|
|
|
|
| |||||||
Financial liabilities held for trading | ||||||||||||
Derivatives (not designated for hedge) | ||||||||||||
Forward exchange contracts | $ | 456 | $ | 246 | $ | 120 | ||||||
|
|
|
|
|
| |||||||
The Company did not apply hedge accounting on the aforementioned contracts at the balance sheet dates.
- 20 -
Outstanding forward exchange contracts as of balance sheet dates were as follows:
| Contract Amount | ||||||||||
| Currency | Maturity Period | (In Thousands) | ||||||||
June 30, 2014 | ||||||||||
Forward exchange contracts—buy | NT$/US$ | 2014.07 | NT$ | 122,962/US$4,100 | ||||||
December 31, 2013 | ||||||||||
Forward exchange contracts—buy | NT$/US$ | 2014.01 | NT$ | 90,092/US$3,021 | ||||||
June 30, 2013 | ||||||||||
Forward exchange contracts—buy | NT$/US$ | 2013.07 | NT$ | 218,679/US$7,300 | ||||||
The Company entered into above forward exchange contracts to manage its exposure to foreign currency risk and impacts in operating results due to fluctuations in exchange rates. However, the aforementioned derivatives did not meet the criteria for hedge accounting and were classified as financial assets or financial liabilities held for trading.
| 8. | AVAILABLE-FOR-SALE FINANCIAL ASSETS |
| June 30, 2014 | December 31, 2013 | June 30, 2013 | ||||||||||
Equity securities | ||||||||||||
Domestic listed stocks and emerging stocks | $ | 2,802,406 | $ | 3,046,182 | $ | 3,074,721 | ||||||
Foreign listed stocks | — | 24,267 | 11,767 | |||||||||
Domestic and foreign open-end mutual funds | — | — | 2,655,490 | |||||||||
|
|
|
|
|
| |||||||
| $ | 2,802,406 | $ | 3,070,449 | $ | 5,741,978 | |||||||
|
|
|
|
|
| |||||||
Current | $ | — | $ | 24,267 | $ | 2,667,257 | ||||||
Non-current | 2,802,406 | 3,046,182 | 3,074,721 | |||||||||
|
|
|
|
|
| |||||||
| $ | 2,802,406 | $ | 3,070,449 | $ | 5,741,978 | |||||||
|
|
|
|
|
| |||||||
| 9. | HELD-TO-MATURITY FINANCIAL ASSETS |
| June 30, 2014 | December 31, 2013 | June 30, 2013 | ||||||||||
Corporate bonds | $ | 8,930,702 | $ | 10,512,893 | $ | 13,195,749 | ||||||
Bank debentures | 1,251,868 | 1,252,954 | 1,254,067 | |||||||||
|
|
|
|
|
| |||||||
| $ | 10,182,570 | $ | 11,765,847 | $ | 14,449,816 | |||||||
|
|
|
|
|
| |||||||
Current | $ | 4,467,343 | $ | 4,264,104 | $ | 4,242,690 | ||||||
Non-current | 5,715,227 | 7,501,743 | 10,207,126 | |||||||||
|
|
|
|
|
| |||||||
| $ | 10,182,570 | $ | 11,765,847 | $ | 14,449,816 | |||||||
|
|
|
|
|
| |||||||
- 21 -
The related information of corporate bonds and bank debentures as of balance sheet dates were as follows:
| June 30, 2014 | December 31, 2013 | June 30, 2013 | ||||||||||
Corporate bonds | ||||||||||||
Par value | $ | 8,902,500 | $ | 10,472,500 | $ | 13,135,000 | ||||||
|
|
|
|
|
| |||||||
Nominal interest rate | 1.15%-2.49% | 1.15%-2.49% | 1.15%-2.90% | |||||||||
Effective interest rate | 1.00%-1.65% | 1.00%-1.95% | 1.00%-2.89% | |||||||||
Average expiry date | 4 years | 4 years | 4 years | |||||||||
Bank debentures | ||||||||||||
Par value | $ | 1,250,000 | $ | 1,250,000 | $ | 1,250,000 | ||||||
|
|
|
|
|
| |||||||
Nominal interest rate | 1.25%-1.60% | 1.25%-1.60% | 1.25%-1.60% | |||||||||
Effective interest rate | 1.15%-1.40% | 1.15%-1.40% | 1.15%-1.40% | |||||||||
Average expiry date | 4 years | 4 years | 4 years | |||||||||
| 10. | HEDGING DERIVATIVE FINANCIAL INSTRUMENTS |
| June 30, 2014 | December 31, 2013 | June 30, 2013 | ||||||||||
Hedging derivative financial assets | ||||||||||||
Fair value hedge—currency swap contracts | $ | — | $ | — | $ | 193 | ||||||
Cash flow hedge—forward exchange contracts | 24 | — | — | |||||||||
|
|
|
|
|
| |||||||
| $ | 24 | $ | — | $ | 193 | |||||||
|
|
|
|
|
| |||||||
Hedging derivative financial liabilities | ||||||||||||
Fair value hedge—currency swap contracts | $ | — | $ | — | $ | 29,060 | ||||||
Cash flow hedge—forward exchange contracts | 287 | — | — | |||||||||
|
|
|
|
|
| |||||||
| $ | 287 | $ | — | $ | 29,060 | |||||||
|
|
|
|
|
| |||||||
| a. | Fair value hedges |
The Company engages in fair vale hedge transactions to manage the foreign currency exposure of available-for-sale financial assets-foreign open-end mutual funds denominated in U.S. dollar.
Outstanding currency swap contracts as of June 30, 2013 were as follows:
| Contract Amount | ||||||||||
| Currency | Maturity Period | (Thousands) | ||||||||
June 30, 2013 | ||||||||||
Currency swap contracts | US$/NT$ | 2013.08 | US$ | 6,000/NT$180,000 | ||||||
| US$/NT$ | 2013.07-2013.09 | US$ | 80,500/NT$2,388,873 | |||||||
- 22 -
| b. | Cash flow hedges |
The Company’s hedge strategy is to enter forward exchange contracts—buy to avoid its foreign currency exposure to certain foreign currency denominated payments in the following six months. In addition, the Company’s management considers the market condition to determine the hedge ratio, and enters into forward exchange contracts with the banks to avoid the foreign currency risk.
The Company signed equipment purchase contracts with suppliers, and entered into foreign exchange forward contracts with maturity less than six months to avoid foreign currency risk exposure to Euro-denominated purchase commitments. Those foreign exchange forward contracts were designated as cash flow hedges. For the three months ended June 30, 2014 and for the six months ended June 30, 2014, loss arising from changes in fair value of the hedged items recognized in other comprehensive income were $263 thousand and $263 thousand, respectively. The purchase expects to occur in the third quarter of 2014, by that time the amounts originally deferred and recognized in equity will be reclassified to the carrying amounts of the equipment purchased.
The outstanding foreign exchange forward contracts at the balance sheet date were as follows:
| Contract Amount | ||||||||||||
| Currency | Maturity Period | (Thousands) | ||||||||||
June 30, 2014 | ||||||||||||
Forward exchange contracts—buy | EUR/NT$ | 2014.09 | EUR2,795/NT$ | 114,027 | ||||||||
| EUR/NT$ | 2014.09 | EUR1,573/NT$ | 64,172 | |||||||||
Losses arising from the hedging derivative instruments reclassified from equity to initial cost of the non-financial asset were as follows:
| Three Months Ended June 30 | Six Months Ended June 30 | |||||||||||||||
| 2014 | 2013 | 2014 | 2013 | |||||||||||||
Construction in Progress and advances related to acquisition of equipment | $ | 3,554 | $ | — | $ | 3,554 | $ | — | ||||||||
|
|
|
|
|
|
|
| |||||||||
| 11. | TRADE NOTES AND ACCOUNTS RECEIVABLE |
| June 30, 2014 | December 31, 2013 | June 30, 2013 | ||||||||||
Trade notes and accounts receivable | $ | 24,602,153 | $ | 23,823,004 | $ | 24,537,731 | ||||||
Less: Allowance doubtful debts | (991,756 | ) | (922,102 | ) | (882,301 | ) | ||||||
|
|
|
|
|
| |||||||
| $ | 23,610,397 | $ | 22,900,902 | $ | 23,655,430 | |||||||
|
|
|
|
|
| |||||||
The average credit terms range from 30 to 90 days. In determining the recoverability of a trade receivable, the Company considers significant change in the credit quality of the trade notes and accounts receivable from the date credit was initially granted up to the end of the reporting period. In general, with few exceptional cases, it is unlikely for the notes and accounts receivable due longer than 180 days to be collected, therefore the Company recognized 100% allowance of notes and accounts receivable overdue longer than 180 days. For the notes and accounts receivable less than 180 days, the allowance for doubtful accounts was estimated based on the Company’s historical recovery experience.
The Company serves a large consumer base; therefore, the concentration of credit risks is limited.
- 23 -
The aging of estimated recoverable amount of receivables that were past due but not impaired as of June 30, 2014, December 31, 2013 and June 30, 2013 was as follows:
| June 30, 2014 | December 31, 2013 | June 30, 2013 | ||||||||||
Less than 30 days | $ | 120,659 | $ | 132,130 | $ | 152,078 | ||||||
31-60 days | 14,133 | 40,492 | 63,238 | |||||||||
61-90 days | 19,511 | 14,377 | 87,648 | |||||||||
91-120 days | 13,866 | 85,210 | 47,414 | |||||||||
121-180 days | 913 | 2,091 | 3,179 | |||||||||
More than 181 days | 19,510 | 11,617 | 2,812 | |||||||||
|
|
|
|
|
| |||||||
| $ | 188,592 | $ | 285,917 | $ | 356,369 | |||||||
|
|
|
|
|
| |||||||
The above aging analysis was based on days overdue.
Movements of the allowance for doubtful accounts were as follows:
| Individually Assessed for Impairment | Collectively Assessed for Impairment | Total | ||||||||||
Balance on January 1, 2013 | $ | 163,779 | $ | 647,020 | $ | 810,799 | ||||||
Add: Provision for doubtful accounts | 27,523 | 104,608 | 132,131 | |||||||||
Deduct: Amounts written off | — | (60,629 | ) | (60,629 | ) | |||||||
|
|
|
|
|
| |||||||
Balance on June 30, 2013 | $ | 191,302 | $ | 690,999 | $ | 882,301 | ||||||
|
|
|
|
|
| |||||||
Balance on January 1, 2014 | $ | 221,164 | $ | 700,938 | $ | 922,102 | ||||||
Add: Provision for doubtful accounts | 35,793 | 104,735 | 140,528 | |||||||||
Deduct: Amounts written off | — | (70,874 | ) | (70,874 | ) | |||||||
|
|
|
|
|
| |||||||
Balance on June 30, 2014 | $ | 256,957 | $ | 734,799 | $ | 991,756 | ||||||
|
|
|
|
|
| |||||||
| 12. | INVENTORIES |
| June 30, 2014 | December 31, 2013 | June 30, 2013 | ||||||||||
Merchandise | $ | 5,044,476 | $ | 5,220,654 | $ | 4,609,041 | ||||||
Project in process | 1,028,685 | 520,238 | 921,203 | |||||||||
Work in process | 16,451 | 26,100 | 24,191 | |||||||||
Raw materials | 54,829 | 26,266 | 25,586 | |||||||||
|
|
|
|
|
| |||||||
| 6,144,441 | 5,793,258 | 5,580,021 | ||||||||||
Land and building held for sale | — | 8,166 | 42,183 | |||||||||
Land held for development | 1,998,733 | 1,998,733 | — | |||||||||
Construction in progress | 46,509 | 44,014 | — | |||||||||
Land held under development | 3,916 | 3,916 | 2,034,549 | |||||||||
|
|
|
|
|
| |||||||
| $ | 8,193,599 | $ | 7,848,087 | $ | 7,656,753 | |||||||
|
|
|
|
|
| |||||||
The operating costs related to inventories were $10,347,161 thousand and $11,336,193 thousand for the three months ended June 30, 2014 and 2013, and $21,596,618 thousand and $25,451,392 thousand for the six months ended June 30, 2014 and 2013, respectively.
- 24 -
For the three months ended June 30, 2014 and 2013, the costs of valuation loss on inventories recognized as operating cost included the amount of $90,836 thousand and $45,958 thousand, and for the six months ended June 30, 2014 and 2013, respectively, the costs of valuation loss on inventories recognized as operating cost included the amount of $247,684 thousand and $137,965 thousand, respectively.
As of June 30, 2014, December 31, 2013 and June 30, 2013, inventories of $2,068,471 thousand, $2,057,191 thousand and $2,013,285 thousand, respectively, were expected to be recovered after more than twelve months. The aforementioned amount of inventories is mainly related to property development owned by LED.
Land held under development and construction in progress on June 30, 2014 and December 31, 2013 was for Qingshan Sec., Dayuan Township, Taoyuan County project. Land held for development on June 30, 2014 and December 31, 2013 was for Yucheng Sec., Nangang Dist., Taipei City. Land held for development on June 30, 2013 was for Subsection 2 Gongyuan Sec., Zhongzheng Dist., Taipei City, Yucheng Sec., Nangang Dist., Taipei City and Qingshan Sec., Dayuan Township, Taoyuan County.
| 13. | PREPAYMENTS |
| June 30, 2014 | December 31, 2013 | June 30, 2013 | ||||||||||
Prepaid rents | $ | 3,282,462 | $ | 3,388,938 | $ | 3,508,186 | ||||||
Prepaid salary and bonus | 3,278,767 | 7,106 | 3,221,869 | |||||||||
Others | 2,443,189 | 2,436,573 | 2,219,868 | |||||||||
|
|
|
|
|
| |||||||
| $ | 9,004,418 | $ | 5,832,617 | $ | 8,949,923 | |||||||
|
|
|
|
|
| |||||||
Current | ||||||||||||
Prepaid salary and bonus | $ | 3,278,767 | $ | 7,106 | $ | 3,221,869 | ||||||
Prepaid rents | 1,156,915 | 953,329 | 967,443 | |||||||||
Others | 1,159,133 | 1,263,695 | 1,206,205 | |||||||||
|
|
|
|
|
| |||||||
| $ | 5,594,815 | $ | 2,224,130 | $ | 5,395,517 | |||||||
|
|
|
|
|
| |||||||
Non-current | ||||||||||||
Prepaid rents | $ | 2,125,547 | $ | 2,435,609 | $ | 2,540,743 | ||||||
Others | 1,284,056 | 1,172,878 | 1,013,663 | |||||||||
|
|
|
|
|
| |||||||
| $ | 3,409,603 | $ | 3,608,487 | $ | 3,554,406 | |||||||
|
|
|
|
|
| |||||||
| 14. | OTHER CURRENT MONETARY ASSETS |
| June 30, 2014 | December 31, 2013 | June 30, 2013 | ||||||||||
Time deposits and negotiable certificate of deposit with maturities of more than three months | $ | 2,511,093 | $ | 2,534,700 | $ | 6,173,157 | ||||||
Receivables from the Fund for Privatization of Government-owned Enterprises under the Executive Yuan | 1,339,107 | 1,317,887 | 1,320,069 | |||||||||
Others | 1,333,091 | 783,718 | 1,480,909 | |||||||||
|
|
|
|
|
| |||||||
| $ | 5,183,291 | $ | 4,636,305 | $ | 8,974,135 | |||||||
|
|
|
|
|
| |||||||
- 25 -
The annual yield rates of time deposits and negotiable certificate of deposit with maturities of more than three months at each period end were as follows:
| June 30, 2014 | December 31, 2013 | June 30, 2013 | ||||
Time deposits and negotiable certificate of deposit with maturities of more than three months | 0.11%-3.20% | 0.11%-3.30% | 0.11%-3.30% |
| 15. | FINANCIAL ASSETS CARRIED AT COST |
| June 30, 2014 | December 31, 2013 | June 30, 2013 | ||||||||||
Non-listed stocks | ||||||||||||
Domestic | $ | 2,165,244 | $ | 2,223,651 | $ | 2,283,222 | ||||||
Foreign | 247,263 | 199,995 | 175,652 | |||||||||
|
|
|
|
|
| |||||||
| $ | 2,412,507 | $ | 2,423,646 | $ | 2,458,874 | |||||||
|
|
|
|
|
| |||||||
The above non-listed stocks are classified as available-for-sale financial assets based on financial assets categories (see Note 37). Since the range of fair values measurement is significant and the probabilities of the various estimates cannot be reasonably assessed, the fair values of the investments cannot be reliably measured, the above non-listed stocks investment owned by the Company were carried at costs less any impairment losses at the balance sheet date.
CHI evaluated and concluded its financial assets carried at cost were partially impaired, and recorded an impairment loss of $8,347 thousand and $20,208 thousand for the three months ended June 30, 2014 and 2013, and $8,976 thousand and $26,772 thousand for the six months ended June 30, 2014 and 2013, respectively.
| 16. | INVESTMENTS ACCOUNTED FOR USING EQUITY METHOD |
| June 30, 2014 | December 31, 2013 | June 30, 2013 | ||||||||||
Investments in associates | $ | 2,238,178 | $ | 2,334,789 | $ | 1,918,611 | ||||||
Jointly controlled entity | 267,843 | 227,504 | 235,217 | |||||||||
|
|
|
|
|
| |||||||
| $ | 2,506,021 | $ | 2,562,293 | $ | 2,153,828 | |||||||
|
|
|
|
|
| |||||||
- 26 -
| a. | Investments in associates |
Investments in associates were as follows:
| Carrying Amount | ||||||||||||
| June 30, 2014 | December 31, 2013 | June 30, 2013 | ||||||||||
Listed | ||||||||||||
Senao Networks, Inc. (“SNI”) | $ | 636,048 | $ | 642,671 | 420,810 | |||||||
Non-listed | ||||||||||||
ST-2 Satellite Ventures Pte., Ltd. (“STS”) | 579,064 | 519,839 | 645,208 | |||||||||
International Integrated System, Inc. (“IISI”) | 283,740 | 292,239 | 273,992 | |||||||||
Viettle-CHT Co., Ltd. | 256,685 | 278,044 | 271,167 | |||||||||
Skysoft Co., Ltd. (“SKYSOFT”) | 118,480 | 158,218 | 121,837 | |||||||||
So-net Entertainment Taiwan Limited (“So-net”) | 97,524 | 92,325 | 86,041 | |||||||||
Dian Zuan Integrating Marketing Co., Ltd. (“DZIM”) | 71,696 | 1,838 | 2,376 | |||||||||
Kingwaytek Technology Co., Ltd. (“KWT”) | 64,491 | 74,838 | 70,382 | |||||||||
Taiwan International Standard Electronics Co., Ltd. (“TISE”) | 62,258 | 214,201 | (4,677 | ) | ||||||||
HopeTech Technologies Limited (“HopeTech”) | 27,749 | 25,564 | 24,148 | |||||||||
Alliance Digital Tech Co., Ltd. (“ADT”) | 25,350 | 28,757 | — | |||||||||
MeWorks LIMITED (HK) (“Meworks”) | 10,029 | — | — | |||||||||
Xiamen Sertec Business Technology Co., Ltd. (“Sertec”) | 5,064 | 6,255 | 7,327 | |||||||||
Panda Monium Company Ltd. | — | — | — | |||||||||
|
|
|
|
|
| |||||||
| $ | 2,238,178 | $ | 2,334,789 | $ | 1,918,611 | |||||||
|
|
|
|
|
| |||||||
At the end of reporting period, the proportion of ownership in associates held by the Company were as follows:
| % of Ownership and Voting Right | ||||||||||||
| June 30, 2014 | December 31, 2013 | June 30, 2013 | ||||||||||
Senao Networks, Inc. (“SNI”) | 34 | 34 | 40 | |||||||||
ST-2 Satellite Ventures Pte., Ltd. (“STS”) | 38 | 38 | 38 | |||||||||
International Integrated System, Inc. (“IISI”) | 33 | 33 | 33 | |||||||||
Viettle-CHT Co., Ltd. | 30 | 30 | 30 | |||||||||
Skysoft Co., Ltd. (“SKYSOFT”) | 30 | 30 | 30 | |||||||||
So-net Entertainment Taiwan Limited (“So-net”) | 30 | 30 | 30 | |||||||||
Dian Zuan Integrating Marketing Co., Ltd. (“DZIM”) | 26 | 13 | 33 | |||||||||
Kingwaytek Technology Co., Ltd. (“KWT”) | 33 | 33 | 33 | |||||||||
Taiwan International Standard Electronics Co., Ltd. (“TISE”) | 40 | 40 | 40 | |||||||||
(Continued)
- 27 -
| % of Ownership and Voting Right | ||||||||||||
| June 30, 2014 | December 31, 2013 | June 30, 2013 | ||||||||||
HopeTech Technologies Limited (“HopeTech”) | 45 | 45 | 45 | |||||||||
Alliance Digital Tech Co., Ltd. (“ADT”) | 17 | 19 | — | |||||||||
MeWorks LIMITED (HK) (“Meworks”) | 20 | — | — | |||||||||
Xiamen Sertec Business Technology Co., Ltd. (“Sertec”) | 49 | 49 | 49 | |||||||||
Panda Monium Company Ltd. | 43 | 43 | 43 | |||||||||
(Concluded)
SNI was listed in December 2013. The fair value based on the closing market price of SNI as of the balance sheet date is as follows:
| June 30, 2014 | December 31, 2013 | June 30, 2013 | ||||||||||
SNI | $ | 2,926,199 | $ | 2,544,870 | $ | — | ||||||
|
|
|
|
|
| |||||||
Chunghwa participated in the capital increase of So-net by investing $60,000 thousand in March 2013. The ownership interest remains 30% after the capital increase.
Chunghwa, President Chain Store Corporation and EasyCard Corporation established an associate, DZIM, in May 2011. DZIM reduced its capital to offset the deficits amounting to $130,787 thousand and made capital reduction of $49,158 thousand during its stockholders’ meeting held on March 31, 2013. Chunghwa received $16,387 thousand from the capital reduction. Chunghwa did not participate in the capital increase of DZIM in July 2013 and the ownership interest decreased from 33% to 13% after the capital increase of DZIM. Chunghwa participated in the capital increase of DZIM by investing $49,485 thousand in April and June 2014. SENAO participated in the capital increase of DZIM by investing $24,000 thousand in April 2014. As of June 30, 2014, the Company held 26% ownership of DZIM. DZIM engages mainly in information technology service and general advertisement service.
Chunghwa, Taiwan Mobile Corporation, Asia Pacific Telecom, Vibo Telecom, EasyCard Corporation and Far EasTone Telecommunications established an associate, ADT, in November 2013. Chunghwa invested $30,000 thousand cash and held 19% ownership of ADT. Based on the share of capital commitments, Chunghwa has one seat out of five seats in the board of directors; therefore it has significant influence over ADT. Chunghwa did not participate in the capital increase of ADT in April 2014 and the ownership interest decreased from 19% to 17% after the capital increase of ADT. Chunghwa still has one seat out of five seats in the board of directors; therefore it remains an investor with significant influence over ADT. ADT engages mainly in the development of mobile payments and information processing service.
- 28 -
Prime Asia participated in the capital increase of MeWorks (HK) by investing $10,000 thousand and held 20% ownership in May 2014. Based on the share of capital commitments, Prime Asia has two seats out of five seats in the board of directors; therefore it has significant influence over MeWorks. MeWorks engages mainly in investment business.
The carrying amount of TISE was negative as of June 30, 2013, because the unrealized gains arising from upstream transactions with the Company were eliminated and the dividend was distributed.
The Company’s share of profit (loss) and other comprehensive income (loss) of investees was recognized based on reviewed financial statements for the three months and six months ended June 30, 2014 and 2013.
| b. | Investments in jointly controlled entity |
Investments in jointly controlled entity were as follows:
| Carrying Amount | % of Ownership and Voting Rights | |||||||||||||||||||||||
| June 30, 2014 | December 31, 2013 | June 30, 2013 | June 30, 2014 | December 31, 2013 | June 30, 2013 | |||||||||||||||||||
Non-listed | ||||||||||||||||||||||||
Huada Digital Corporation (“HDD”) | $ | 222,582 | $ | 227,504 | $ | 235,217 | 50 | 50 | 50 | |||||||||||||||
Chunghwa Benefit One Co., Ltd. (“CBO”) | 45,261 | — | — | 50 | — | — | ||||||||||||||||||
|
|
|
|
|
| |||||||||||||||||||
| $ | 267,843 | $ | 227,504 | $ | 235,217 | |||||||||||||||||||
|
|
|
|
|
| |||||||||||||||||||
Chunghwa invested in CBO in February 2014 at $50,000 thousand cash to acquire 50% of its shares and the rest of 50% ownership interest was held by Benefit One Asia Ptd. Ltd. (“BOA”), and each obtained half of director seats. Thus, neither Chunghwa nor BOA obtained control over CBO. CBO engages mainly in e-commerce of employee benefits.
The Company’s share of profit (loss) of the jointly controlled entities was recognized based on reviewed financial statements for the three months and six months ended June 30, 2014 and 2013.
| 17. | PROPERTY, PLANT AND EQUIPMENT |
| Land | Land Improvements | Buildings | Computer Equipment | Telecommuni- cations Equipment | Transportation Equipment | Miscellaneous Equipment | Construction in Progress and Advances Related to Acquisition of Equipment | Total | ||||||||||||||||||||||||||||
Cost | ||||||||||||||||||||||||||||||||||||
Balance on January 1, 2013 | $ | 102,196,615 | $ | 1,548,184 | $ | 67,428,504 | $ | 15,233,816 | $ | 669,375,712 | $ | 3,315,452 | $ | 7,588,449 | $ | 18,683,121 | $ | 885,369,853 | ||||||||||||||||||
Additions | — | — | 1,130 | 33,676 | 17,839 | 607 | 154,608 | 14,371,562 | 14,579,422 | |||||||||||||||||||||||||||
Disposal | — | (8,971 | ) | (4,091 | ) | (423,767 | ) | (6,451,611 | ) | (75,836 | ) | (241,663 | ) | (35,810 | ) | (7,241,749 | ) | |||||||||||||||||||
Effect of foreign exchange differences | — | — | — | 6,938 | 3,572 | 273 | 6,353 | 32,779 | 49,915 | |||||||||||||||||||||||||||
Other | 561 | 5,159 | 60,428 | 697,733 | 10,924,456 | 263,684 | 287,347 | (12,116,242 | ) | 123,126 | ||||||||||||||||||||||||||
|
|
|
|
|
|
|
|
|
|
|
|
|
|
|
|
|
| |||||||||||||||||||
Balance on June 30, 2013 | $ | 102,197,176 | $ | 1,544,372 | $ | 67,485,971 | $ | 15,548,396 | $ | 673,869,968 | $ | 3,504,180 | $ | 7,795,094 | $ | 20,935,410 | $ | 892,880,567 | ||||||||||||||||||
|
|
|
|
|
|
|
|
|
|
|
|
|
|
|
|
|
| |||||||||||||||||||
(Continued)
- 29 -
| Land | Land Improvements | Buildings | Computer Equipment | Telecommuni- cations Equipment | Transportation Equipment | Miscellaneous Equipment | Construction in Progress and Advances Related to Acquisition of Equipment | Total | ||||||||||||||||||||||||||||
Accumulated depreciation and impairment |
| |||||||||||||||||||||||||||||||||||
Balance on January 1, 2013 | $ | — | $ | (1,067,498 | ) | $ | (20,824,621 | ) | $ | (11,348,414 | ) | $ | (547,845,695 | ) | $ | (1,270,172 | ) | $ | (5,671,104 | ) | $ | — | $ | (588,027,504 | ) | |||||||||||
Depreciation Expenses | — | (27,342 | ) | (606,917 | ) | (673,734 | ) | (13,439,931 | ) | (259,798 | ) | (344,844 | ) | — | (15,352,566 | ) | ||||||||||||||||||||
Disposal | — | 8,971 | 4,091 | 422,370 | 6,446,893 | 75,836 | 237,995 | — | 7,196,156 | |||||||||||||||||||||||||||
Impairment losses | — | — | — | — | (2,262 | ) | — | — | — | (2,262 | ) | |||||||||||||||||||||||||
Effect of foreign exchange differences | — | — | — | (2,005 | ) | (2,257 | ) | (97 | ) | (2,760 | ) | — | (7,119 | ) | ||||||||||||||||||||||
Other | — | — | 2,311 | (39,572 | ) | 34,746 | (3,697 | ) | (117,303 | ) | — | (123,515 | ) | |||||||||||||||||||||||
|
|
|
|
|
|
|
|
|
|
|
|
|
|
|
|
|
| |||||||||||||||||||
Balance on June 30, 2013 | $ | — | $ | (1,085,869 | ) | $ | (21,425,136 | ) | $ | (11,641,355 | ) | $ | (554,808,506 | ) | $ | (1,457,928 | ) | $ | (5,898,016 | ) | $ | — | $ | (596,316,810 | ) | |||||||||||
|
|
|
|
|
|
|
|
|
|
|
|
|
|
|
|
|
| |||||||||||||||||||
Balance on January 1, 2013, net | $ | 102,196,615 | $ | 480,686 | $ | 46,603,883 | $ | 3,885,402 | $ | 121,530,017 | $ | 2,045,280 | $ | 1,917,345 | $ | 18,683,121 | $ | 297,342,349 | ||||||||||||||||||
|
|
|
|
|
|
|
|
|
|
|
|
|
|
|
|
|
| |||||||||||||||||||
Balance on June 30, 2013, net | $ | 102,197,176 | $ | 458,503 | $ | 46,060,835 | $ | 3,907,041 | $ | 119,061,462 | $ | 2,046,252 | $ | 1,897,078 | $ | 20,935,410 | $ | 296,563,757 | ||||||||||||||||||
|
|
|
|
|
|
|
|
|
|
|
|
|
|
|
|
|
| |||||||||||||||||||
Cost | ||||||||||||||||||||||||||||||||||||
Balance on January 1, 2014 | $ | 102,263,330 | $ | 1,546,906 | $ | 67,557,865 | $ | 15,995,696 | $ | 683,118,379 | $ | 3,745,148 | $ | 8,415,325 | $ | 22,852,887 | $ | 905,495,536 | ||||||||||||||||||
Additions | — | — | 860 | 13,136 | 84,757 | 932 | 91,645 | 11,744,017 | 11,935,347 | |||||||||||||||||||||||||||
Disposal | — | (9,645 | ) | (10,787 | ) | (1,230,855 | ) | (10,326,300 | ) | (30,890 | ) | (268,055 | ) | — | (11,876,532 | ) | ||||||||||||||||||||
Effect of foreign exchange differences | — | — | — | (1,296 | ) | 3,434 | 16 | (4,686 | ) | — | (2,532 | ) | ||||||||||||||||||||||||
Other | 408,400 | 4,314 | 134,137 | 256,267 | 14,329,754 | 51,405 | 201,745 | (15,371,162 | ) | 14,860 | ||||||||||||||||||||||||||
|
|
|
|
|
|
|
|
|
|
|
|
|
|
|
|
|
| |||||||||||||||||||
Balance on June 30, 2014 | $ | 102,671,730 | $ | 1,541,575 | $ | 67,682,075 | $ | 15,032,948 | $ | 687,210,024 | $ | 3,766,611 | $ | 8,435,974 | $ | 19,225,742 | $ | 905,566,679 | ||||||||||||||||||
|
|
|
|
|
|
|
|
|
|
|
|
|
|
|
|
|
| |||||||||||||||||||
Accumulated depreciation and impairment |
| |||||||||||||||||||||||||||||||||||
Balance on January 1, 2014 | $ | — | $ | (1,104,400 | ) | $ | (21,971,843 | ) | $ | (11,600,999 | ) | $ | (560,313,927 | ) | $ | (1,671,798 | ) | $ | (6,118,453 | ) | $ | — | $ | (602,781,420 | ) | |||||||||||
Depreciation Expenses | — | (26,797 | ) | (624,013 | ) | (727,827 | ) | (14,003,235 | ) | (296,157 | ) | (419,278 | ) | — | (16,097,307 | ) | ||||||||||||||||||||
Disposal | — | 9,645 | 9,491 | 1,227,433 | 10,320,406 | 30,837 | 255,407 | — | 11,853,219 | |||||||||||||||||||||||||||
Effect of foreign exchange differences | — | — | — | 576 | 215 | (4 | ) | 2,250 | — | 3,037 | ||||||||||||||||||||||||||
Other | — | (11 | ) | (8,975 | ) | (6,486 | ) | (13,134 | ) | (6,551 | ) | 24,199 | — | (10,958 | ) | |||||||||||||||||||||
|
|
|
|
|
|
|
|
|
|
|
|
|
|
|
|
|
| |||||||||||||||||||
Balance on June 30, 2014 | $ | — | $ | (1,121,563 | ) | $ | (22,595,340 | ) | $ | (11,107,303 | ) | $ | (564,009,675 | ) | $ | (1,943,673 | ) | $ | (6,255,875 | ) | $ | — | �� | $ | (607,033,429 | ) | ||||||||||
|
|
|
|
|
|
|
|
|
|
|
|
|
|
|
|
|
| |||||||||||||||||||
Balance on January 1, 2014, net | $ | 102,263,330 | $ | 442,506 | $ | 45,586,022 | $ | 4,394,697 | $ | 122,804,452 | $ | 2,073,350 | $ | 2,296,872 | $ | 22,852,887 | $ | 302,714,116 | ||||||||||||||||||
|
|
|
|
|
|
|
|
|
|
|
|
|
|
|
|
|
| |||||||||||||||||||
Balance on June 30, 2014, net | $ | 102,671,730 | $ | 420,012 | $ | 45,086,735 | $ | 3,925,645 | $ | 123,200,349 | $ | 1,822,938 | $ | 2,180,099 | $ | 19,225,742 | $ | 298,533,250 | ||||||||||||||||||
|
|
|
|
|
|
|
|
|
|
|
|
|
|
|
|
|
| |||||||||||||||||||
(Concluded)
- 30 -
Since there is no impairment indication for property, plant and equipment, the Company did not recognize any impairment loss for the three months and six months ended June 30, 2014, as well as for the three months ended June 30, 2013.
The Company performed the impairment assessment of telecommunications equipment for the three months ended March 31, 2013 and recognized an impairment loss of $2,262 thousand.
Depreciation expense is computed using the straight-line method over the following estimated service lives:
Land improvement | 8-30 years | |||
Buildings | ||||
Main building | 35-60 years | |||
Other building facilities | 3-10 years | |||
Computer equipment | 3-8 years | |||
Telecommunications equipment | ||||
Telecommunication circuits | 9-15 years | |||
Telecommunication machinery and antennas equipment | 5-10 years | |||
Transportation equipment | 3-10 years | |||
Miscellaneous equipment | ||||
Leasehold improvements | 2-6 years | |||
Mechanical and air conditioner equipment | 8-16 years | |||
Others | 3-10 years |
| 18. | INVESTMENT PROPERTIES |
| Investment Properties | ||||
Cost | ||||
Balance on January 1, 2013 and June 30, 2013 | $ | 9,260,015 | ||
|
| |||
Accumulated depreciation and impairment | ||||
Balance on January 1, 2013 | $ | (1,471,117 | ) | |
Depreciation expense | (8,290 | ) | ||
|
| |||
Balance on June 30, 2013 | $ | (1,479,407 | ) | |
|
| |||
Balance on January 1, 2012, net | $ | 7,788,898 | ||
|
| |||
Balance on June 30, 2012, net | $ | 7,780,608 | ||
|
| |||
Cost | ||||
Balance on January 1, 2014 and June 30, 2014 | $ | 9,260,015 | ||
|
| |||
Accumulated depreciation and impairment | ||||
Balance on January 1, 2014 | $ | (1,241,984 | ) | |
Depreciation expense | (8,284 | ) | ||
|
| |||
Balance on June 30, 2014 | $ | (1,250,268 | ) | |
|
| |||
Balance on January 1, 2014, net | $ | 8,018,031 | ||
|
| |||
Balance on June 30, 2014, net | $ | 8,009,747 | ||
|
| |||
- 31 -
Depreciation expense is computed using the straight-line method over the following estimated service lives:
Land improvements | 8-30 years | |||
Buildings | ||||
Main buildings | 35-60 years | |||
Other building facilities | 3-10 years |
The fair value of the Company’s investment properties as of December 31, 2013 and 2012 was determined based on the appraisal reports conducted by independent appraisers. The Company used the abovementioned appraisal reports as the basis to determine the fair value as of June 30, 2014 and 2013 because there was no material change in the economic environment and the market transaction price. Those appraisal reports are based on the comparison approach, income approach or cost approach. Key assumptions and the fair values were as follows:
| June 30, 2014 | December 31, 2013 | June 30, 2013 | ||||||||||
Fair value | $ | 17,501,195 | $ | 17,501,195 | $ | 15,510,857 | ||||||
|
|
|
|
|
| |||||||
Overall capital interest rate | 1.46%-2.20 | % | 1.46%-2.20 | % | 1.46 | % | ||||||
Profit margin ratio | 12%-20 | % | 12%-20 | % | 12%-15 | % | ||||||
Discount rate | 1.36 | % | 1.36 | % | 1.36 | % | ||||||
Capitalization rate | 0.68%-2.02 | % | 0.68%-2.02 | % | 1.5%-2.05 | % | ||||||
All of the Company’s investment properties are held under freehold interest.
| 19. | INTANGIBLE ASSETS |
| 3G and 4G Concession | Computer Software | Goodwill | Others | Total | ||||||||||||||||
Cost | ||||||||||||||||||||
Balance on January 1, 2013 | $ | 10,179,000 | $ | 2,065,542 | $ | 180,631 | $ | 116,650 | $ | 12,541,823 | ||||||||||
Additions-acquired separately | — | 320,569 | — | 540 | 321,109 | |||||||||||||||
Disposal | — | (130,753 | ) | — | — | (130,753 | ) | |||||||||||||
Effect of foreign exchange difference | — | (1,844 | ) | — | 280 | (1,564 | ) | |||||||||||||
|
|
|
|
|
|
|
|
|
| |||||||||||
Balance on June 30, 2013 | $ | 10,179,000 | $ | 2,253,514 | $ | 180,631 | $ | 117,470 | $ | 12,730,615 | ||||||||||
|
|
|
|
|
|
|
|
|
| |||||||||||
Accumulated amortization and impairment | ||||||||||||||||||||
Balance on January 1, 2013 | $ | (5,687,347 | ) | $ | (1,049,664 | ) | $ | — | $ | (23,009 | ) | $ | (6,760,020 | ) | ||||||
Amortization expenses | (374,305 | ) | (223,655 | ) | — | (4,007 | ) | (601,967 | ) | |||||||||||
Disposal | — | 130,753 | — | — | 130,753 | |||||||||||||||
Impairment loss | — | — | (18,055 | ) | — | (18,055 | ) | |||||||||||||
Effect of foreign exchange difference | — | (115 | ) | — | — | (115 | ) | |||||||||||||
|
|
|
|
|
|
|
|
|
| |||||||||||
Balance on June 30, 2013 | $ | (6,061,652 | ) | $ | (1,142,681 | ) | $ | (18,055 | ) | $ | (27,016 | ) | $ | (7,249,404 | ) | |||||
|
|
|
|
|
|
|
|
|
| |||||||||||
Balance on January 1, 2013, net | $ | 4,491,653 | $ | 1,015,878 | $ | 180,631 | $ | 93,641 | $ | 5,781,803 | ||||||||||
|
|
|
|
|
|
|
|
|
| |||||||||||
Balance on June 30, 2013, net | $ | 4,117,348 | $ | 1,110,833 | $ | 162,576 | $ | 90,454 | $ | 5,481,211 | ||||||||||
|
|
|
|
|
|
|
|
|
| |||||||||||
Cost | ||||||||||||||||||||
Balance on January 1, 2014 | $ | 49,254,000 | $ | 2,637,454 | $ | 180,631 | $ | 117,887 | $ | 52,189,972 | ||||||||||
Additions-acquired separately | — | 148,673 | — | 490 | 149,163 | |||||||||||||||
Disposal | — | (24,046 | ) | — | (9 | ) | (24,055 | ) | ||||||||||||
Effect of foreign exchange difference | — | 19 | — | — | 19 | |||||||||||||||
|
|
|
|
|
|
|
|
|
| |||||||||||
Balance on June 30, 2014 | $ | 49,254,000 | $ | 2,762,100 | $ | 180,631 | $ | 118,368 | $ | 52,315,099 | ||||||||||
|
|
|
|
|
|
|
|
|
| |||||||||||
(Continued)
- 32 -
| 3G and 4G Concession | Computer Software | Goodwill | Others | Total | ||||||||||||||||
Accumulated amortization and impairment | ||||||||||||||||||||
Balance on January 1, 2014 | $ | (6,435,956 | ) | $ | (1,306,473 | ) | $ | (18,055 | ) | $ | (30,600 | ) | $ | (7,791,084 | ) | |||||
Amortization expenses | (511,933 | ) | (269,117 | ) | — | (3,650 | ) | (784,700 | ) | |||||||||||
Disposal | — | 24,046 | — | 9 | 24,055 | |||||||||||||||
Effect of foreign exchange difference | — | 10 | — | — | 10 | |||||||||||||||
|
|
|
|
|
|
|
|
|
| |||||||||||
Balance on June 30, 2014 | $ | (6,947,889 | ) | $ | (1,551,534 | ) | $ | (18,055 | ) | $ | (34,241 | ) | $ | (8,551,719 | ) | |||||
|
|
|
|
|
|
|
|
|
| |||||||||||
Balance on January 1, 2014, net | $ | 42,818,044 | $ | 1,330,981 | $ | 162,576 | $ | 87,287 | $ | 44,398,888 | ||||||||||
|
|
|
|
|
|
|
|
|
| |||||||||||
Balance on June 30, 2014, net | $ | 42,306,111 | $ | 1,210,566 | $ | 162,576 | $ | 84,127 | $ | 43,763,380 | ||||||||||
|
|
|
|
|
|
|
|
|
| |||||||||||
(Concluded)
For long-term business development, Chunghwa participated in mobile broadband license (4G license) bidding process announced by NCC and obtained certain spectrums. Chunghwa paid the 4G concession fee amounting to $39,075,000 thousand in November 2013.
Except for goodwill, the amortization expense is computed using the straight-line method over the following estimated service lives:
The concession fee is amortized on a straight-line basis from the date operations commence through the date the license expires.
The computer software is amortized using the straight-line method over the estimated useful lives of 2 to 10 years.
Other intangible assets are amortized using the straight-line method over the estimated useful lives of 3 to 20 years. Goodwill is not amortized.
The Company did not recognize any impairment loss on goodwill for the three months and six months ended June 30, 2014, as well as for the three months ended June 30, 2013. The Company recognized an impairment loss of $18,055 thousand on the goodwill arising from the business combination of a subsidiary, CHI, due to CHI underwent organizational downsizing for the three months ended March 31, 2013.
| 20. | OTHER ASSETS |
| June 30, 2014 | December 31, 2013 | June 30, 2013 | ||||||||||
Spare parts | $ | 4,785,489 | $ | 3,008,145 | $ | 3,533,550 | ||||||
Refundable deposits | 2,435,920 | 2,209,566 | 2,275,950 | |||||||||
Other financial assets | 1,000,000 | 1,000,000 | 1,000,000 | |||||||||
Others | 2,257,490 | 2,626,061 | 2,974,700 | |||||||||
|
|
|
|
|
| |||||||
| $ | 10,478,899 | $ | 8,843,772 | $ | 9,784,200 | |||||||
|
|
|
|
|
| |||||||
Current | ||||||||||||
Spare parts | $ | 4,785,489 | $ | 3,008,145 | $ | 3,533,550 | ||||||
Others | 481,316 | 952,653 | 200,807 | |||||||||
|
|
|
|
|
| |||||||
| $ | 5,266,805 | $ | 3,960,798 | $ | 3,734,357 | |||||||
|
|
|
|
|
| |||||||
(Continued)
- 33 -
| June 30, 2014 | December 31, 2013 | June 30, 2013 | ||||||||||
Non-current | ||||||||||||
Refundable deposits | $ | 2,435,920 | $ | 2,209,566 | $ | 2,275,950 | ||||||
Other financial assets | 1,000,000 | 1,000,000 | 1,000,000 | |||||||||
Others | 1,776,174 | 1,673,408 | 2,773,893 | |||||||||
|
|
|
|
|
| |||||||
| $ | 5,212,094 | $ | 4,882,974 | $ | 6,049,843 | |||||||
|
|
|
|
|
| |||||||
(Concluded)
Other financial assets—noncurrent was Piping Fund. As part of the government’s effort to upgrade the existing telecommunications infrastructure, Chunghwa and other public utility companies were required by the ROC government to contribute to a Piping Fund administered by the Taipei City Government. This fund was used to finance various telecommunications infrastructure projects. Net assets of this fund would be returned proportionately after the project was completed.
| 21. | SHORT-TERM LOANS |
| June 30, 2014 | December 31, 2013 | June 30, 2013 | ||||||||||
Unsecured loans | $ | 1,085,000 | $ | 254,357 | $ | 194,865 | ||||||
|
|
|
|
|
| |||||||
Annual interest rate | 1.18%-2.40% | 1.18%-2.40% | 1.18%-2.40% | |||||||||
| 22. | LONG-TERM LOANS (INCLUDING LONG-TERM LOANS—CURRENT PORTION) |
| June 30, 2014 | December 31, 2013 | June 30, 2013 | ||||||||||
Secured loans (Note 39) | $ | 2,048,000 | $ | 1,700,000 | $ | 1,700,000 | ||||||
Less: Current portion of long-term loans | (300,000 | ) | (300,000 | ) | — | |||||||
|
|
|
|
|
| |||||||
| $ | 1,748,000 | $ | 1,400,000 | $ | 1,700,000 | |||||||
|
|
|
|
|
| |||||||
The annual interest rates of loans were as follows:
| June 30, 2014 | December 31, 2013 | June 30, 2013 | ||||
Secured loans | 1.13%-2.10% | 1.15%-2.10% | 1.15%-2.10% |
LED obtained a secured loan from Chang Hwa Bank in September 2010. Interest is paid monthly. $300,000 thousand and $1,350,000 thousand will become due in December 2014 and September 2015, respectively. LED obtained another secured loan from Chang Hwa Bank in December 2012 in the amount of $400,000 thousand which will be due in December 2017; LED repaid $300,000 thousand and $50,000 thousand in February and May 2013, respectively.
CHPT obtained a secured loan from Bank of Taiwan in April 2014 in the amount of $348,000 thousand. Interest is paid monthly. The principal will be paid periodically starting June 2016. The loan will be due in April 2029.
- 34 -
| 23. | TRADE NOTES AND ACCOUNTS PAYABLE |
| June 30, 2014 | December 31, 2013 | June 30, 2013 | ||||||||||
Trade notes and accounts payable | $ | 12,386,753 | $ | 15,589,108 | $ | 11,717,243 | ||||||
|
|
|
|
|
| |||||||
Trade notes and accounts payable were attributable to operating activities and the trading conditions were agreed separately.
| 24. | OTHER PAYABLES |
| June 30, 2014 | December 31, 2013 | June 30, 2013 | ||||||||||
Payable to stockholders for cash distributions from additional paid-in capital | $ | 16,577,663 | $ | — | $ | 5,589,240 | ||||||
Accrued salary and compensation | 6,376,014 | 10,336,141 | �� | 5,733,530 | ||||||||
Payables to equipment suppliers | 1,934,174 | 1,819,604 | 1,722,671 | |||||||||
Accrued bonuses to employees and remuneration to directors and supervisors | 1,763,026 | 980,363 | 2,267,577 | |||||||||
Payables to contrators | 1,507,144 | 2,732,518 | 1,534,553 | |||||||||
Amounts collected for others | 1,360,376 | 1,325,918 | 1,353,953 | |||||||||
Accrued maintenance costs | 1,083,976 | 990,655 | 1,056,110 | |||||||||
Accrued franchise fees | 948,234 | 2,009,009 | 1,173,122 | |||||||||
Others | 7,311,622 | 6,597,561 | 7,444,267 | |||||||||
|
|
|
|
|
| |||||||
| $ | 38,862,229 | $ | 26,791,769 | $ | 27,875,023 | |||||||
|
|
|
|
|
| |||||||
| 25. | PROVISIONS |
| June 30, 2014 | December 31, 2013 | June 30, 2013 | ||||||||||
Warranties | $ | 184,329 | $ | 201,494 | $ | 236,495 | ||||||
Employee benefits | 50,998 | 47,265 | 45,551 | |||||||||
Others | 4,512 | 4,046 | 2,960 | |||||||||
|
|
|
|
|
| |||||||
| $ | 239,839 | $ | 252,805 | $ | 285,006 | |||||||
|
|
|
|
|
| |||||||
Current | $ | 118,904 | $ | 129,341 | $ | 135,793 | ||||||
Noncurrent | 120,935 | 123,464 | 149,213 | |||||||||
|
|
|
|
|
| |||||||
| $ | 239,839 | $ | 252,805 | $ | 285,006 | |||||||
|
|
|
|
|
| |||||||
| Warranties | Employee Benefits | Others | Total | |||||||||||||
Balance on January 1, 2013 | $ | 221,245 | $ | 41,949 | $ | 2,960 | $ | 266,154 | ||||||||
Additional provisions recognized | 89,309 | 3,602 | — | 92,911 | ||||||||||||
Reductions | (74,059 | ) | — | — | (74,059 | ) | ||||||||||
|
|
|
|
|
|
|
| |||||||||
Balance on June 30, 2013 | $ | 236,495 | $ | 45,551 | $ | 2,960 | $ | 285,006 | ||||||||
|
|
|
|
|
|
|
| |||||||||
(Continued)
- 35 -
| Warranties | Employee Benefits | Others | Total | |||||||||||||
Balance on January 1, 2014 | $ | 201,494 | $ | 47,265 | $ | 4,046 | $ | 252,805 | ||||||||
Additional provisions recognized | 63,755 | 3,733 | 470 | 67,958 | ||||||||||||
Reductions | (80,615 | ) | — | (4 | ) | (80,619 | ) | |||||||||
Reversal | (305 | ) | — | — | (305 | ) | ||||||||||
|
|
|
|
|
|
|
| |||||||||
Balance on June 30, 2014 | $ | 184,329 | $ | 50,998 | $ | 4,512 | $ | 239,839 | ||||||||
|
|
|
|
|
|
|
| |||||||||
(Concluded)
| a. | The provision for warranty claims represents the present values of the management’s best estimate of the future outflow of economic benefits that will be required under the Company’s obligation for warranties in sales agreements. The estimate has been made based on the historical warranty experience. |
| b. | The provision for employee benefits represents vested long-term service leave entitlements accrued. |
| 26. | ADVANCE RECEIPTS |
Advance receipts are mainly from advance telecommunication charges. In accordance with NCC’s regulation named “Mandatory and Prohibitory Provisions To Be Included In Standard Contracts for Telecommunication Goods (Services) Coupons”, the Company entered into a contract with Bank of Taiwan for selling prepaid cards. Bank of Taiwan provided a performance guarantee for advance receipts from prepaid cards amounted to $983,742 thousand as of June 30, 2014.
| 27. | RETIREMENT BENEFIT PLANS |
The recognized pension expenses for the three months and six months ended June 30, 2014 and 2013 were determined by the pension cost rates of actuarial valuation of December 31, 2013 and 2012.
Relevant pension costs for defined benefit plans for the six months ended June 30, 2014 and 2013 were as follows:
| Three Months Ended June 30 | Six Months Ended June 30 | |||||||||||||||
| 2014 | 2013 | 2014 | 2013 | |||||||||||||
Operating costs | $ | 451,654 | $ | 440,451 | $ | 902,974 | $ | 880,932 | ||||||||
Marketing expenses | 216,860 | 214,006 | 433,998 | 427,781 | ||||||||||||
General and administrative expenses | 41,152 | 40,579 | 82,566 | 81,159 | ||||||||||||
Research and development expenses | 26,073 | 25,135 | 52,149 | 50,312 | ||||||||||||
|
|
|
|
|
|
|
| |||||||||
| $ | 735,739 | $ | 720,171 | $ | 1,471,687 | $ | 1,440,184 | |||||||||
|
|
|
|
|
|
|
| |||||||||
- 36 -
| 28. | EQUITY |
| a. | Share capital |
| 1) | Common stock |
| June 30, 2014 | December 31, 2013 | June 30, 2013 | ||||||||||
Number of authorized shares (thousand) | 12,000,000 | 12,000,000 | 12,000,000 | |||||||||
|
|
|
|
|
| |||||||
Authorized shares | $ | 120,000,000 | $ | 120,000,000 | $ | 120,000,000 | ||||||
|
|
|
|
|
| |||||||
Number of shares issued and collected proceeds (thousand) | 7,757,447 | 7,757,447 | 7,757,447 | |||||||||
|
|
|
|
|
| |||||||
Issued shares | $ | 77,574,465 | $ | 77,574,465 | $ | 77,574,465 | ||||||
|
|
|
|
|
| |||||||
The issued common stock of a par value at $10 per share entitled the right to vote and receive dividends.
| 2) | Global depositary receipts |
For the purpose of privatizing Chunghwa, the MOTC sold 1,109,750 thousand common shares of Chunghwa in an international offering of securities in the form of American Depositary Shares (“ADS”) amounting to 110,975 thousand units (one ADS represents ten common shares) on the New York Stock Exchange on July 17, 2003. Afterwards, the MOTC sold 1,350,682 thousand common shares in the form of ADS amounting to 135,068 thousand units on August 10, 2005. Subsequently, the MOTC and Taiwan Mobile Co., Ltd. sold 505,389 thousand and 58,959 thousand common shares of Chunghwa, respectively, in the form of ADS totally amounting to 56,435 thousand units on September 29, 2006. The MOTC and Taiwan Mobile Co., Ltd. have sold 3,024,780 thousand common shares in the form of ADS amounting to 302,478 thousand units. As of June 30, 2014, the outstanding ADSs were 245,658 thousand common shares, which equaled 24,566 thousand units and represented 3.17% of Chunghwa’s total outstanding common shares.
The ADS holders generally have the same rights and obligations as other common stockholders, subject to the provision of relevant laws. The exercise of such rights and obligations shall comply with the related regulations and deposit agreement, which stipulate, among other things, that ADS holders can, through deposit agents:
| a) | Exercise their voting rights, |
| b) | Sell their ADSs, and |
| c) | Receive dividends declared and subscribe to the issuance of new shares. |
| b. | Additional paid-in capital |
The adjustment of additional paid-in capital for the six months ended June 30, 2014 and 2013 were as follows:
| Share Premium | Movements of Paid-in Capital for Associates Accounted for Using Equity Method | Share-based Payment Transactions | Donated Capital | Stockholders’ Contribution Due to Privatization | Total | |||||||||||||||||||
Balance on January 1, 2013 | $ | 169,496,289 | $ | — | $ | 4,893 | $ | 13,170 | $ | 20,648,078 | $ | 190,162,430 | ||||||||||||
Cash distributed from additional paid-in capital | (5,589,240 | ) | — | — | — | — | (5,589,240 | ) | ||||||||||||||||
Change in additional paid-in capital from investments in associates and jointly controlled entities accounted for using equity method | — | 1,630 | — | — | — | 1,630 | ||||||||||||||||||
Exercise of employee stock options of subsidiaries | — | — | 3,803 | — | — | 3,803 | ||||||||||||||||||
|
|
|
|
|
|
|
|
|
|
|
| |||||||||||||
Balance on June 30, 2013 | $ | 163,907,049 | $ | 1,630 | $ | 8,696 | $ | 13,170 | $ | 20,648,078 | $ | 184,578,623 | ||||||||||||
|
|
|
|
|
|
|
|
|
|
|
| |||||||||||||
(Continued)
- 37 -
| Share Premium | Movements of Paid-in Capital for Associates Accounted for Using Equity Method | Share-based Payment Transactions | Donated Capital | Stockholders’ Contribution Due to Privatization | Total | |||||||||||||||||||
Balance on January 1, 2014 | $ | 163,907,049 | $ | 41,396 | $ | 10,372 | $ | 13,170 | $ | 20,648,078 | $ | 184,620,065 | ||||||||||||
Cash distributed from additional paid-in capital | (16,577,663 | ) | — | — | — | — | (16,577,663 | ) | ||||||||||||||||
Change in additional paid-in capital from investments in associates and jointly controlled entities accounted for using equity method | — | (1,681 | ) | — | — | — | (1,681 | ) | ||||||||||||||||
|
|
|
|
|
|
|
|
|
|
|
| |||||||||||||
Balance on June 30, 2014 | $ | 147,329,386 | $ | 39,715 | $ | 10,372 | $ | 13,170 | $ | 20,648,078 | $ | 168,040,721 | ||||||||||||
|
|
|
|
|
|
|
|
|
|
|
| |||||||||||||
(Concluded)
Additional paid-in capital may only be utilized to offset deficits. However, the additional paid-in capital from shares issued in excess of par and donations may be distributed in cash or capitalized when a company has no deficit, which however is limited to a certain percentage of Chunghwa’s paid-in capital.
Additional paid-in capital from investments accounted for using equity method may not be used for any purpose.
| c. | Retained earnings and dividends policy |
Before distributing a dividend or making any other distribution to stockholders, Chunghwa must pay all outstanding taxes, offset deficits in prior years and set aside a legal reserve equal to 10% of its net income, and depending on its business needs or requirements, may also set aside or reverse special reserves. In accordance with Chunghwa’s Articles of Incorporation, no less than 50% of the remaining earnings comprising remaining balance of net income, if any, plus cumulative undistributed earnings shall be distributed in the following order: (a) from 2% to 5% of distributable earnings shall be distributed to employees as employee bonus; (b) no more than 0.2% of distributable earnings shall be distributed to board of directors and supervisors as remuneration; and (c) cash dividends to be distributed shall not be less than 50% of the total amount of dividends to be distributed. If cash dividend to be distributed is less than $0.10 per share, such cash dividend shall be distributed in the form of common shares.
For the six months ended June 30, 2014 and 2013, the accrual amounts for bonuses to employees and remuneration to directors and supervisors were accrued based on past experiences and the probable amount to be paid in accordance with Chunghwa’s Articles of Incorporation and Implementation Guidance for the Employee’s Bonus Distribution of Chunghwa Telecom Co., Ltd.
In the end of the fiscal year, material differences between the initial accrual amounts and the amounts proposed by the board of directors on or before the consolidated financial statements are authorized for issue are charged to the earnings of the year that the initial bonus and remuneration were recognized. If there is a change in the proposed amounts after the consolidated financial statements are authorized for issue, the differences are recorded as a change in accounting estimate. If the shareholders’ meeting approved to distribute the employee bonus as stocks, the share number of the stock bonus were determined by the amount of bonus divided by the fair value of the stocks which was the closing market prices one day before shareholders’ meeting after taking into account the effects of ex-rights and ex-dividends.
The Company should appropriate or reverse a special reserve in accordance with Rule No. 1010012865 and Rule No. 1010047490 issued by the FSC and the directive entitled “Questions and Answers on Special Reserves Appropriated Following the Adoption of Taiwan-IFRSs”. Distributions can be made out of any subsequent reversal of the debit to other equity items.
- 38 -
The appropriation for legal reserve shall be made until the accumulated reserve equals the aggregate par value of the outstanding capital stock of Chunghwa. This reserve can only be used to offset a deficit, or, when the legal reserve has exceeded 25% of the Company’s paid-in capital, the excess may be transferred to capital or distributed in cash.
Except for non-ROC resident shareholders, all shareholders receiving the dividends are entitled a tax credit equal to their proportionate share of the income tax paid by the Company.
The appropriations and distributions of the 2013 and 2012 earnings of Chunghwa have been approved by the stockholders on June 24, 2014 and June 25, 2013 as follows:
| Appropriation of Earnings | Dividends Per Share | |||||||||||||||
| For Fiscal Year 2013 | For Fiscal Year 2012 | For Fiscal Year 2013 | For Fiscal Year 2012 | |||||||||||||
Legal reserve | $ | 2,074,342 | $ | 3,990,397 | ||||||||||||
Special reserve | 144,005 | — | ||||||||||||||
Cash dividends | 18,525,558 | 35,913,099 | $ | 2.39 | $ | 4.63 | ||||||||||
The stockholders of Chunghwa resolved to distribute cash $2.14 per share and the total amount of $16,577,663 thousand from additional paid-in capital on June 24, 2014.
The stockholders of Chunghwa resolved to distribute cash $0.72 per share and the total amount of $5,589,240 thousand from additional paid-in capital on June 25, 2013.
The bonuses to the employees and remuneration to the directors and supervisors of the 2013 and 2012 approved by the stockholders on June 24, 2014 and June 25, 2013 were as follows:
| 2013 | 2012 | |||||||
| Cash Bonus | Cash Bonus | |||||||
Bonus distributed to the employees | $ | 758,627 | $ | 1,533,082 | ||||
Remuneration paid to the directors and supervisors | 19,304 | 37,484 | ||||||
There was no difference between the initial accrual amounts and the amounts resolved in shareholders’ meeting of the aforementioned bonuses to employees and the remuneration to directors and supervisors in 2013 and 2012.
Information of the appropriation of Chunghwa’s earnings, employees bonuses and remuneration to directors and supervisors proposed by the board of directors and approved by the stockholders is available on the Market Observation Post System website.
| d. | Special reserves to be recognized under Rule No. 1010012865 issued by the FSC |
The adjustments of Taiwan-IFRSs adoption resulted in the decrease of retained earnings of the Company; therefore, the Company is not required to appropriate any amount to the special reserve.
| e. | Other equity items |
| 1) | Exchange differences arising from the translation of the foreign operations |
The exchange differences arising from the translation of the foreign operations from their functional currency to New Taiwan Dollars were recognized as exchange differences arising from the translation of the foreign operations in other comprehensive income.
- 39 -
| 2) | Unrealized gain (loss) of available-for-sale financial assets |
| Six Months Ended June 30 | ||||||||
| 2014 | 2013 | |||||||
Beginning balance | $ | (149,747 | ) | $ | 257,991 | |||
Unrealized loss on available-for-sale financial assets | (191,088 | ) | (268,898 | ) | ||||
Income tax relating to unrealized gain (loss) on available- for-sale financial assets | 1,675 | 99 | ||||||
Amount reclassified from equity to profit or loss on disposal | (34,958 | ) | (62,947 | ) | ||||
|
|
|
| |||||
Ending balance | $ | (374,118 | ) | $ | (73,755 | ) | ||
|
|
|
| |||||
| f. | Noncontrolling interests |
| Six Months Ended June 30 | ||||||||
| 2014 | 2013 | |||||||
Beginning balance | $ | 5,054,331 | $ | 4,441,849 | ||||
Shares attributed to noncontrolling interests | ||||||||
Cash dividends distributed by subsidiaries | (796,789 | ) | (810,789 | ) | ||||
Net income of current period | 263,630 | 664,563 | ||||||
Exchange differences arising from the translation of the net investment in foreign operations | (17,581 | ) | 25,423 | |||||
Unrealized loss on available-for-sale financial assets | (7,759 | ) | (1,472 | ) | ||||
Income tax relating to unrealized gain (loss) on available- for-sale financial assets | 207 | 12 | ||||||
Adjustment for change in additional paid-in capital from investments in associates and joint ventures accounted for using equity method | (2,486 | ) | 4,223 | |||||
Compensation cost of employee stock options of a subsidiary | 53,131 | 16,950 | ||||||
Exercise of employee stock option of subsidiaries | — | 26,269 | ||||||
Decrease in noncontrolling interests | — | (250 | ) | |||||
|
|
|
| |||||
Ending balance | $ | 4,546,684 | $ | 4,366,778 | ||||
|
|
|
| |||||
| 29. | REVENUE |
The main source of revenue of the Company includes various telecommunications services in many different streams, and the related information were as discussed in Note 43.
| 30. | INCOME |
| a. | Other income and expenses |
| Three Months Ended June 30 | Six Months Ended June 30 | |||||||||||||||
| 2014 | 2013 | 2014 | 2013 | |||||||||||||
Loss on disposal of property, plant and equipment | $ | (10,995 | ) | $ | (5,728 | ) | $ | (19,505 | ) | $ | (9,909 | ) | ||||
Impairment loss on property, plant and equipment | — | — | — | (2,262 | ) | |||||||||||
Impairment loss on intangible assets | — | — | — | (18,055 | ) | |||||||||||
|
|
|
|
|
|
|
| |||||||||
| $ | (10,995 | ) | $ | (5,728 | ) | $ | (19,505 | ) | $ | (30,226 | ) | |||||
|
|
|
|
|
|
|
| |||||||||
- 40 -
| b. | Other income |
| Three Months Ended June 30 | Six Months Ended June 30 | |||||||||||||||
| 2014 | 2013 | 2014 | 2013 | |||||||||||||
Income from Piping Fund | $ | — | $ | — | $ | 200,000 | $ | — | ||||||||
Dividends income | 76,998 | 16,407 | 76,998 | 34,451 | ||||||||||||
Rental income | 11,467 | 10,940 | 22,386 | 22,053 | ||||||||||||
Others | 53,877 | 42,056 | 96,025 | 82,371 | ||||||||||||
|
|
|
|
|
|
|
| |||||||||
| $ | 142,342 | $ | 69,403 | $ | 395,409 | $ | 138,875 | |||||||||
|
|
|
|
|
|
|
| |||||||||
| c. | Other gains and losses |
| Three Months Ended June 30 | Six Months Ended June 30 | |||||||||||||||
| 2014 | 2013 | 2014 | 2013 | |||||||||||||
Gain (loss) on disposal of financial instruments, net | $ | 28,715 | $ | 21,677 | $ | 44,377 | $ | (6,951 | ) | |||||||
Net foreign currency exchange gains (losses) | 29,946 | (36,463 | ) | 2,293 | (10,914 | ) | ||||||||||
Valuation gain (loss) on financial assets and liabilities at fair value through profit or loss, net | 257 | 5,607 | (456 | ) | 34,756 | |||||||||||
Gain (loss) arising from derivatives as designated hedging instruments in fair value hedges, net | — | 7,587 | — | (63,566 | ) | |||||||||||
Gain (loss) arising from adjustments for hedged item attributable to the hedged risk in a designated fair value hedge accounting relationship | — | (7,587 | ) | — | 63,566 | |||||||||||
Impairment losses of financial assets carried at cost | (8,347 | ) | (20,208 | ) | (8,976 | ) | (26,772 | ) | ||||||||
Others | (25,917 | ) | (13,077 | ) | (43,606 | ) | (20,775 | ) | ||||||||
|
|
|
|
|
|
|
| |||||||||
| $ | 24,654 | $ | (42,464 | ) | $ | (6,368 | ) | $ | (30,656 | ) | ||||||
|
|
|
|
|
|
|
| |||||||||
| d. | Finance costs |
| Three Months Ended June 30 | Six Months Ended June 30 | |||||||||||||||
| 2014 | 2013 | 2014 | 2013 | |||||||||||||
Interest on bank borrowings | $ | 10,502 | $ | 6,203 | $ | 17,456 | $ | 12,390 | ||||||||
Other interest expenses | 57 | 170 | 1,829 | 1,957 | ||||||||||||
|
|
|
|
|
|
|
| |||||||||
| $ | 10,559 | $ | 6,373 | $ | 19,285 | $ | 14,347 | |||||||||
|
|
|
|
|
|
|
| |||||||||
- 41 -
| e. | Impairment loss on financial instruments (reversal gain) |
| Three Months Ended June 30 | Six Months Ended June 30 | |||||||||||||||
| 2014 | 2013 | 2014 | 2013 | |||||||||||||
Notes and accounts receivable | $ | 91,870 | $ | 35,255 | $ | 140,528 | $ | 132,131 | ||||||||
|
|
|
|
|
|
|
| |||||||||
Other receivables | $ | 5,208 | $ | (5,559 | ) | $ | 7,842 | $ | 6,131 | |||||||
|
|
|
|
|
|
|
| |||||||||
Financial assets carried at cost | $ | 8,347 | $ | 20,208 | $ | 8,976 | $ | 26,772 | ||||||||
|
|
|
|
|
|
|
| |||||||||
| f. | Impairment loss of non-fianacial assets |
| Three Months Ended June 30 | Six Months Ended June 30 | |||||||||||||||
| 2014 | 2013 | 2014 | 2013 | |||||||||||||
Inventories | $ | 90,836 | $ | 45,958 | $ | 247,684 | $ | 137,965 | ||||||||
|
|
|
|
|
|
|
| |||||||||
Intangible assets | $ | — | $ | — | $ | — | $ | 18,055 | ||||||||
|
|
|
|
|
|
|
| |||||||||
Property, plant and equipment | $ | — | $ | — | $ | — | $ | 2,262 | ||||||||
|
|
|
|
|
|
|
| |||||||||
| g. | Depreciation and amortization expenses |
| Three Months Ended June 30 | Six Months Ended June 30 | |||||||||||||||
| 2014 | 2013 | 2014 | 2013 | |||||||||||||
Property, plant and equipment | $ | 8,057,544 | $ | 7,697,055 | $ | 16,097,307 | $ | 15,352,566 | ||||||||
Investment properties | 4,142 | 4,145 | 8,284 | 8,290 | ||||||||||||
Intangible assets | 461,204 | 305,379 | 784,700 | 601,967 | ||||||||||||
|
|
|
|
|
|
|
| |||||||||
Total depreciation and amortization expenses | $ | 8,522,890 | $ | 8,006,579 | $ | 16,890,291 | $ | 15,962,823 | ||||||||
|
|
|
|
|
|
|
| |||||||||
Depreciation expenses summarized by functions | ||||||||||||||||
Operating costs | $ | 7,500,664 | $ | 7,164,865 | $ | 14,990,841 | $ | 14,303,904 | ||||||||
Operating expenses | 561,022 | 536,335 | 1,114,750 | 1,056,952 | ||||||||||||
|
|
|
|
|
|
|
| |||||||||
| $ | 8,061,686 | $ | 7,701,200 | $ | 16,105,591 | $ | 15,360,856 | |||||||||
|
|
|
|
|
|
|
| |||||||||
Amortization expenses summarized by functions | ||||||||||||||||
Operating costs | $ | 386,009 | $ | 245,995 | $ | 635,312 | $ | 488,311 | ||||||||
Operating expenses | 75,195 | 59,384 | 149,388 | 113,656 | ||||||||||||
|
|
|
|
|
|
|
| |||||||||
| $ | 461,204 | $ | 305,379 | $ | 784,700 | $ | 601,967 | |||||||||
|
|
|
|
|
|
|
| |||||||||
| h. | Employee benefit expenses |
| Three Months Ended June 30 | Six Months Ended June 30 | |||||||||||||||
| 2014 | 2013 | 2014 | 2013 | |||||||||||||
Post-employment benefit | ||||||||||||||||
Defined contribution plans | $ | 117,508 | $ | 91,122 | $ | 212,248 | $ | 174,959 | ||||||||
Defined benefit plans | 735,739 | 720,171 | 1,471,687 | 1,440,184 | ||||||||||||
|
|
|
|
|
|
|
| |||||||||
| 853,247 | 811,293 | 1,683,935 | 1,615,143 | |||||||||||||
|
|
|
|
|
|
|
| |||||||||
(Continued)
- 42 -
| Three Months Ended June 30 | Six Months Ended June 30 | |||||||||||||||
| 2014 | 2013 | 2014 | 2013 | |||||||||||||
Share-based payment | ||||||||||||||||
Equity-settled share-based payment | $ | 26,565 | $ | 16,950 | $ | 53,131 | $ | 16,950 | ||||||||
|
|
|
|
|
|
|
| |||||||||
Other employee benefit | ||||||||||||||||
Salaries | 6,424,846 | 6,305,741 | 12,608,131 | 12,394,347 | ||||||||||||
Insurance | 661,512 | 621,305 | 1,281,477 | 1,210,964 | ||||||||||||
Others | 3,873,675 | 3,382,788 | 7,261,576 | 6,793,963 | ||||||||||||
|
|
|
|
|
|
|
| |||||||||
| 10,960,033 | 10,309,834 | 21,151,184 | 20,399,274 | |||||||||||||
|
|
|
|
|
|
|
| |||||||||
Total employee benefit expenses | $ | 11,839,845 | $ | 11,138,077 | $ | 22,888,250 | $ | 22,031,367 | ||||||||
|
|
|
|
|
|
|
| |||||||||
Summary by functions | ||||||||||||||||
Operating costs | $ | 6,761,481 | $ | 6,123,656 | $ | 12,770,895 | $ | 12,197,050 | ||||||||
Operating expenses | 5,078,364 | 5,014,421 | 10,117,355 | 9,834,317 | ||||||||||||
|
|
|
|
|
|
|
| |||||||||
| $ | 11,839,845 | $ | 11,138,077 | $ | 22,888,250 | $ | 22,031,367 | |||||||||
|
|
|
|
|
|
|
| |||||||||
(Concluded)
| 31. | INCOME TAX |
| a. | Income tax recognized in profit or loss |
The major components of income tax expense are as follows:
| Three Months Ended June 30 | Six Months Ended June 30 | |||||||||||||||
| 2014 | 2013 | 2014 | 2013 | |||||||||||||
Current tax | ||||||||||||||||
Current tax expenses recognized for the current period | $ | 2,115,165 | $ | 2,161,087 | $ | 4,271,917 | $ | 4,106,736 | ||||||||
Income tax expenses of unappropriated earnings | 29,530 | 27,393 | 29,530 | 27,393 | ||||||||||||
Income tax adjustments on prior years | (453 | ) | (10,575 | ) | (453 | ) | (10,575 | ) | ||||||||
Others | 1,886 | 1,139 | 7,524 | 2,558 | ||||||||||||
|
|
|
|
|
|
|
| |||||||||
| 2,146,128 | 2,179,044 | 4,308,518 | 4,126,112 | |||||||||||||
Deferred tax | ||||||||||||||||
Deferred tax expense recognized for the current period | (54,182 | ) | (21,527 | ) | (260,539 | ) | (23,871 | ) | ||||||||
|
|
|
|
|
|
|
| |||||||||
Income tax recognised in profit or loss | $ | 2,091,946 | $ | 2,157,517 | $ | 4,047,979 | $ | 4,102,241 | ||||||||
|
|
|
|
|
|
|
| |||||||||
- 43 -
| b. | Income tax (benefit) recognized in other comprehensive income |
| Three Months Ended June 30 | Six Months Ended June 30 | |||||||||||||||
| 2014 | 2013 | 2014 | 2013 | |||||||||||||
Deferred tax | ||||||||||||||||
Unrealized gain (loss) on available-for-sale financial assets | $ | (846 | ) | $ | 379 | $ | (1,882 | ) | $ | (111 | ) | |||||
|
|
|
|
|
|
|
| |||||||||
| c. | The related information under the Integrated Income Tax System is as follows: |
Undistributed earnings information
All Chunghwa’s earnings generated prior to June 30, 1988 have been appropriated.
Imputation credit account
| June 30, 2014 | December 31, 2013 | June 30, 2013 | ||||||||||
Balance of Imputation Credit Account (“ICA”) | $ | 7,748,948 | $ | 4,036,735 | $ | 7,675,577 | ||||||
|
|
|
|
|
| |||||||
The creditable ratio for distribution of earnings of 2013 and 2012 was 20.48% (expected ratio) and 19.23%, respectively.
When Chunghwa appropriated the earnings generated in and after 1998, the imputation credit allocated to local shareholders was based on the creditable rate as of the date of the dividends distribution date. The actual imputation credits allocated to shareholders of the Chunghwa was based on the balance of the Imputation Credit Accounts (ICA) as of the date of dividend distribution. Therefore, the expected creditable ratio for the 2013 earnings may differ from the actual creditable ratio to be used in allocating imputation credits to the shareholders.
According to legal interpretation No. 10204562810 announced by the Taxation Administration of the Ministry of Finance, when calculating imputation credits in the year of first-time adoption of Taiwan-IFRSs, the cumulative retained earnings include the net increase or net decrease in retained earnings arising from first-time adoption of Taiwan-IFRSs.
| d. | Income tax examination |
Chunghwa’s and the following subsidiaries income tax returns have been examined by the tax authorities through 2011: SENAO, CHPT, CHI, and CHST. CHIYP, CHIEF, Unigate, SFD, CHSI, LED, SHE, YYRP, and CEI’s income tax returns have been assessed by the tax authorities through 2012.
- 44 -
| 32. | EARNINGS PER SHARE |
Net income and weighted average number of common stock used in the calculation of earnings per share were as follows:
Net Income
| Three Months Ended June 30 | Six Months Ended June 30 | |||||||||||||||
| 2014 | 2013 | 2014 | 2013 | |||||||||||||
Net income used to compute the basic earnings per share | ||||||||||||||||
Net income attributable to the parent | $ | 10,582,991 | $ | 10,634,960 | $ | 20,818,408 | $ | 19,836,066 | ||||||||
Assumed conversion of all dilutive potential common stock | ||||||||||||||||
Employee stock options and bonus of subsidiaries | (224 | ) | (709 | ) | (823 | ) | (2,050 | ) | ||||||||
|
|
|
|
|
|
|
| |||||||||
Net income used to compute the diluted earnings per share | $ | 10,582,767 | $ | 10,634,251 | $ | 20,817,585 | $ | 19,834,016 | ||||||||
|
|
|
|
|
|
|
| |||||||||
Weighted Average Number of Common Stock
| (Thousand Shares) | ||||||||||||||||
| Three Months Ended June 30 | Six Months Ended June 30 | |||||||||||||||
| 2014 | 2013 | 2014 | 2013 | |||||||||||||
Weighted average number of common stock used to compute the basic earnings per share | 7,757,447 | 7,757,447 | 7,757,447 | 7,757,447 | ||||||||||||
Assumed conversion of all dilutive potential common stock | ||||||||||||||||
Employee stock options | 9,950 | 17,959 | 12,084 | 20,229 | ||||||||||||
|
|
|
|
|
|
|
| |||||||||
Weighted average number of common stock used to compute the diluted earnings per share | 7,767,397 | 7,775,406 | 7,769,531 | 7,777,676 | ||||||||||||
|
|
|
|
|
|
|
| |||||||||
If Chunghwa may settle the employee bonus in shares or cash, Chunghwa shall presume that it will be settled in shares and takes those shares into consideration when calculating the weighted average number of outstanding shares used in the calculation of diluted EPS if the shares have a dilutive effect. The dilutive effect of the shares needs to be considered until the stockholders approve the number of shares to be distributed to employees in their meeting in the following year.
- 45 -
| 33. | SHARE-BASED PAYMENT ARRANGEMENT |
| a. | SENAO share-based compensation plans |
SENAO share-based compensation plans (“SENAO Plans”) described as follows:
| Effective Date | Resolution Date by SENAO’s Board of Directors | Stock Options Units (Thousand) | Exercise Price (NT$) | |||||||
2007.10.16 | 2007.10.31 | 6,181 | $ 42.6 (Original price $ 44.2) | |||||||
2012.05.28 | 2013.04.29 | 10,000 | $ 84.3 (Original price $ 93.0) | |||||||
Each option is eligible to subscribe for one common share when exercisable. Under the terms of SENAO Plans, the options are granted at an exercise price equal to the closing price of the SENAO’s common shares listed on the TSE on the higher of closing price or par value. The SENAO Plans have exercise price adjustment formula upon the issuance of new common shares, capitalization of retained earnings and/or capital reserves, stock split as well as distribution of cash dividends, except (i) in the case of issuance of new shares in connection with mergers and in the case of cancellation of outstanding shares in connection with capital reduction, and (ii) except if the exercise price after adjustment exceeds the exercise price before adjustment. The options of all the Plans are valid for six years and the graded vesting schedule is that 50% of option granted will vest two years after the grant date and another two tranches of 25%, each will vest three and four years after the grant date respectively.
SENAO elected not to apply IFRS 2 retrospectively for the share-based payment transactions which were granted and vested before the transition date.
Stock options granted on May 7, 2013 applied IFRS 2. The recognized compensation cost was $53,131 thousand and $16,950 thousand for the six months ended June 30, 2014 and 2013, respectively.
Information about SENAO’s outstanding stock options for the six months ended June 30, 2014 and 2013 were as follows:
| Six Months Ended June 30, 2014 | ||||||||
| Granted on May 7, 2013 | ||||||||
Number of Options (Thousand) | Weighted- average | |||||||
Employee stock options | ||||||||
Balance on January 1 | 9,872 | $ | 89.4 | |||||
Options granted | — | — | ||||||
Options exercised | — | — | ||||||
Options forfeited | (602 | ) | — | |||||
|
| |||||||
Balance on June 30 | 9,270 | 84.3 | ||||||
|
| |||||||
Options exercisable at end of the period | — | — | ||||||
|
| |||||||
- 46 -
| Six Months Ended June 30, 2013 | ||||||||||||||||
| Granted on May 7, 2013 | Granted on October 31, 2007 | |||||||||||||||
Number of Options (Thousand) | Weighted- average | Number of Options (Thousand) | Weighted- average | |||||||||||||
Employee stock options | ||||||||||||||||
Balance on January 1 | — | $ | — | 1,051 | $ | 42.6 | ||||||||||
Options granted | 10,000 | 93.0 | — | — | ||||||||||||
Options exercised | — | — | (514 | ) | 42.6 | |||||||||||
Options forfeited | — | — | — | — | ||||||||||||
|
|
|
| |||||||||||||
Balance on June 30 | 10,000 | 93.0 | 537 | 42.6 | ||||||||||||
|
|
|
| |||||||||||||
Options exercisable at end of the period | — | — | 537 | 42.6 | ||||||||||||
|
|
|
| |||||||||||||
As of June 30, 2014, information about employee stock options outstanding are as follows:
| Options Outstanding | Options Exercisable | |||||||||||||||||||
Range of (NT$) | Number of (Thousand) | Weighted- average | Weighted- average Price (NT$) | Number of (Thousand) | Weighted- average Price (NT$) | |||||||||||||||
$84.3 | 9,270 | 4.85 | $ | 84.3 | — | $ | — | |||||||||||||
As of June 30, 2013, information about employee stock options outstanding are as follows:
| Options Outstanding | Options Exercisable | |||||||||||||||||||
Range of (NT$) | Number of (Thousand) | Weighted- average | Weighted- average Price (NT$) | Number of (Thousand) | Weighted- average Price (NT$) | |||||||||||||||
$42.6 | 537 | 0.42 | $ | 42.6 | 537 | $ | 42.6 | |||||||||||||
93.0 | 10,000 | 5.85 | 93.0 | — | 93.0 | |||||||||||||||
SENAO used the fair value method to evaluate the options using the Black-Scholes model and the related assumptions and the fair value of the options were as follows:
| Stock Options Granted as of May 7, 2013 | ||||
Dividends yield | — | |||
Risk-free interest rate | 0.91 | % | ||
Expected life | 4.375 years | |||
Expected volatility | 36.22 | % | ||
Weighted-average fair value of grants (NT$) | $ | 28.72 | ||
- 47 -
Had SENAO used the fair value method to evaluate the options using the Black-Scholes model, the assumptions SENAO used and the fair value of the options would have been as follows:
| Stock Options Granted as of October 31, 2007 | ||||
Dividends yield | 1.49 | % | ||
Risk-free interest rate | 2.00 | % | ||
Expected life | 4.375 years | |||
Expected volatility | 39.82 | % | ||
Weighted-average fair value of grants (NT$) | $ | 13.69 | ||
| b. | CHPT share-based compensation plan |
CHPT granted 1,000 options to some of its employees in December 2008. Under the terms of CHPT Plan, each option entitles the holder to subscribe for one thousand common shares at $12.6 per share when exercisable. The options are valid for 5 years and based on the graded vesting schedule, two tranches of 30% of option will vest two and three years after the grant date, respectively, and the rest of 40% will vest four years after the grant date. There is exercise price adjustment formula upon the issuance of new common shares, capitalization of retained earnings and/or capital reserves, stock split, issuance of new shares in connection with mergers, issuance of global depositary receipts as well as distribution of cash dividends, except if the exercise price after adjustment exceeds the exercise price before adjustment.
For the six months ended June 30, 2013 information about CHPT’s outstanding stock options were as follows:
| Six Months Ended June 30, 2013 | ||||||||
Number of Options | Weighted- average Price (NT$) | |||||||
Employee stock options | ||||||||
Balance on January 1 | 920 | $ | 10.1 | |||||
Options exercised | (810 | ) | 10.1 | |||||
|
| |||||||
Balance on June 30 | 110 | 10.1 | ||||||
|
| |||||||
Options exercisable at end of the period | 110 | 10.1 | ||||||
|
| |||||||
The share registration of 810 thousand of employee stock options exercised in 2013 has been completed. 110 thousand of outstanding employee stock options have expired in December 2013. As of June 30, 2014, CHPT has no outstanding employee stock options.
- 48 -
As of June 30, 2013, information about employee stock options outstanding is as follows:
| Options Outstanding | Options Exercisable | |||||||||||||||||||
Range of (NT$) | Number of Options | Weighted- average | Weighted Price (NT$) | Number of Options | Weighted Price (NT$) | |||||||||||||||
$10.1 | 110 | 0.5 | $ | 10.1 | 110 | $ | 10.1 | |||||||||||||
CHPT used the fair value to evaluate the options using the Black-Scholes model, the assumptions and the fair value of the options of CHPT would have been as follows:
| Stock Options Granted as of December 31, 2008 | ||||
Dividends yield | — | |||
Risk-free interest rate | 2.00 | % | ||
Expected life | 3.1 years | |||
Expected volatility | 20.00 | % | ||
Weighted-average fair value of grants | $ | 3.80 | ||
| 34. | NON-CASH TRANSACTIONS |
For the six months ended June 30, 2014 and 2013, the Company entered into the following non-cash investing activities:
| Six Months Ended June 30 | ||||||||
| 2014 | 2013 | |||||||
Acquistions in property, plant and equipment | $ | 11,935,347 | $ | 14,579,422 | ||||
Other payables | 1,154,574 | 1,006,647 | ||||||
|
|
|
| |||||
| $ | 13,089,921 | $ | 15,586,069 | |||||
|
|
|
| |||||
| 35. | OPERATING LEASE ARRANGEMENTS |
| a. | The Company as lessee |
The future aggregate minimum lease payments under non-cancellable operating leases are as follows:
| June 30, 2014 | December 31, 2013 | June 30, 2013 | ||||||||||
Within one year | $ | 3,061,611 | $ | 3,061,204 | $ | 2,891,952 | ||||||
Longer than one year but within five years | 6,467,826 | 6,389,468 | 6,296,391 | |||||||||
Longer than five years | 1,619,127 | 1,719,931 | 1,852,394 | |||||||||
|
|
|
|
|
| |||||||
| $ | 11,148,564 | $ | 11,170,603 | $ | 11,040,737 | |||||||
|
|
|
|
|
| |||||||
- 49 -
| b. | The Company as lessor |
The future aggregate minimum lease collection under non-cancellable operating leases are as follows:
| June 30, 2014 | December 31, 2013 | June 30, 2013 | ||||||||||
Within one year | $ | 439,383 | $ | 444,919 | $ | 464,917 | ||||||
Longer than one year but within five years | 630,478 | 659,080 | 672,540 | |||||||||
Longer than five years | 174,474 | 165,260 | 88,677 | |||||||||
|
|
|
|
|
| |||||||
| $ | 1,244,335 | $ | 1,269,259 | $ | 1,226,134 | |||||||
|
|
|
|
|
| |||||||
| 36. | CAPITAL MANAGEMENT |
The Company manages its capital to ensure that entities in the Company will be able to continue as going concerns while maximising the return to stakeholders through the optimisation of the debt and equity balance.
The capital structure of the Company consists of debt of the Company and the equity attributable to the parent.
The management reviews the capital structure of the Company as needed. As part of this review, the management considers the cost of capital and the risks associated with each class of capital.
According to the management’s suggestion, the Company maintains a balanced capital structure through paying cash dividends, increasing its share capital, purchasing treasury stock, proceeds from new debt or repayment of debt.
| 37. | FINANCIAL INSTRUMENTS |
Categories of Financial Instruments
| June 30, 2014 | December 31, 2013 | June 30, 2013 | ||||||||||
Financial assets | ||||||||||||
Measured at FVTPL | ||||||||||||
Held for trading | $ | — | $ | 337 | $ | 994 | ||||||
Hedging derivative financial assets | 24 | — | 193 | |||||||||
Held-to-maturity financial assets | 10,182,570 | 11,765,847 | 14,449,816 | |||||||||
Loans and receivables (Note a) | 60,440,631 | 45,401,182 | 94,944,825 | |||||||||
Available-for-sale financial assets (Note b) | 5,214,913 | 5,494,095 | 8,200,852 | |||||||||
Financial liabilities | ||||||||||||
Measured at FVTPL | ||||||||||||
Held for trading | 456 | 246 | 120 | |||||||||
Hedging derivative financial liabilities | 287 | — | 29,060 | |||||||||
Measured at amortized cost (Note c) | 70,183,026 | 38,410,119 | 74,749,636 | |||||||||
- 50 -
| Note a: | The balances included cash and cash equivalents, trade notes and accounts receivable, accounts receivable from related parties, other financial assets and refundable deposits (classified as other assets) which were loans and receivables. |
| Note b: | The balances included financial assets carried at cost which were classified as available-for-sale financial assets. |
| Note c: | The balances included short-term loans, trade notes and accounts payable, payables to related parties, dividends payables, certain other payables, customer’s deposits and long-term loans which were financial liabilities carried at amortized cost. |
Fair Value Information
| a. | Financial instruments that are not measured at fair value |
Except for what disclosed in the following table, the fair values of financial instruments not measured at fair value are considered approximately to their carrying amounts or the fair values cannot be reliable estimated:
| June 30, 2014 | December 31, 2013 | June 30, 2013 | ||||||||||||||||||||||
| Carrying Amount | Fair Value | Carrying Amount | Fair Value | Carrying Amount | Fair Value | |||||||||||||||||||
Financial assets | ||||||||||||||||||||||||
Held-to-maturity investments | $ | 10,182,570 | $ | 10,227,685 | $ | 11,765,847 | $ | 11,807,972 | $ | 14,449,816 | $ | 14,518,726 | ||||||||||||
| b. | Financial instruments measured at fair value |
The following table provides an analysis of financial instruments that are measured subsequent to initial recognition at fair value, grouped into Levels 1 to 3 based on the degree to which the fair value is observable.
| 1) | Level 1 fair value measurements are those derived from quoted prices (unadjusted) in active markets for identical assets or liabilities. |
| 2) | Level 2 fair value measurements are those derived from inputs other than quoted prices included within Level 1 that are observable for the asset or liability, either directly (i.e. as prices) or indirectly (i.e. derived from prices). |
| 3) | Level 3 fair value measurements are those derived from valuation techniques that include inputs for the asset or liability that are not based on observable market data (unobservable inputs). |
June 30, 2014
| Level 1 | Level 2 | Level 3 | Total | |||||||||||||
Hedging derivative financial assets | ||||||||||||||||
Derivative financial assets | $ | — | $ | 24 | $ | — | $ | 24 | ||||||||
|
|
|
|
|
|
|
| |||||||||
Available-for-sale financial assets | ||||||||||||||||
Domestic listed securities shares | ||||||||||||||||
Equity investments | $ | 2,802,406 | $ | — | $ | — | $ | 2,802,406 | ||||||||
|
|
|
|
|
|
|
| |||||||||
(Continued)
- 51 -
| Level 1 | Level 2 | Level 3 | Total | |||||||||||||
Financial liabilities at FVTPL | ||||||||||||||||
Derivative financial liabilties | $ | — | $ | 456 | $ | — | $ | 456 | ||||||||
|
|
|
|
|
|
|
| |||||||||
Hedging derivative financial liabilities | ||||||||||||||||
Derivative financial liabilities | $ | — | $ | 287 | $ | — | $ | 287 | ||||||||
|
|
|
|
|
|
|
| |||||||||
(Concluded)
December 31, 2013
| Level 1 | Level 2 | Level 3 | Total | |||||||||||||
Financial assets at FVTPL | ||||||||||||||||
Derivative financial assets | $ | — | $ | 337 | $ | — | $ | 337 | ||||||||
|
|
|
|
|
|
|
| |||||||||
Available-for-sale financial assets | ||||||||||||||||
Domestic listed securities and emerging market shares | ||||||||||||||||
Equity investments | $ | 3,046,182 | $ | — | $ | — | $ | 3,046,182 | ||||||||
Foreign listed stocks | ||||||||||||||||
Equity investments | 24,267 | — | — | 24,267 | ||||||||||||
|
|
|
|
|
|
|
| |||||||||
| $ | 3,070,449 | $ | — | $ | — | $ | 3,070,449 | |||||||||
|
|
|
|
|
|
|
| |||||||||
Financial liabilities at FVTPL | ||||||||||||||||
Derivative financial liabilities | $ | — | $ | 246 | $ | — | $ | 246 | ||||||||
|
|
|
|
|
|
|
| |||||||||
June 30, 2013
| Level 1 | Level 2 | Level 3 | Total | |||||||||||||
Financial assets at FVTPL | ||||||||||||||||
Derivative financial assets | $ | — | $ | 944 | $ | — | $ | 944 | ||||||||
|
|
|
|
|
|
|
| |||||||||
Hedging derivative financial assets | ||||||||||||||||
Derivative financial assets | $ | — | $ | 193 | $ | — | $ | 193 | ||||||||
|
|
|
|
|
|
|
| |||||||||
Available-for-sale financial assets | ||||||||||||||||
Domestic listed securities and emerging market shares | ||||||||||||||||
Equity investments | $ | 3,074,721 | $ | — | $ | — | $ | 3,074,721 | ||||||||
Foreign listed stocks | ||||||||||||||||
Equity investments | 11,767 | — | — | 11,767 | ||||||||||||
Open-end mutual funds | 2,655,490 | — | — | 2,655,490 | ||||||||||||
|
|
|
|
|
|
|
| |||||||||
| $ | 5,741,978 | $ | — | $ | — | $ | 5,741,978 | |||||||||
|
|
|
|
|
|
|
| |||||||||
(Continued)
- 52 -
| Level 1 | Level 2 | Level 3 | Total | |||||||||||||
Financial liabilities at FVTPL | ||||||||||||||||
Derivative financial liabilities | $ | — | $ | 120 | $ | — | $ | 120 | ||||||||
|
|
|
|
|
|
|
| |||||||||
Hedging derivative financial liabilities | ||||||||||||||||
Derivative financial liabilities | $ | — | $ | 29,060 | $ | — | $ | 29,060 | ||||||||
|
|
|
|
|
|
|
| |||||||||
(Concluded)
There were no transfers between Levels 1 and 2 for the six months ended June 30, 2014 and 2013.
| c. | Valuation techniques and assumptions applied for the purposes of measuring fair value. |
The fair values of financial assets and financial liabilities are determined as follows:
| 1) | The fair values of financial assets and financial liabilities with standard terms and conditions and traded on active liquid markets are determined with reference to quoted market prices. |
| 2) | Forward exchange contracts and cross currency swap contracts are measured using quoted forward exchange rates and yield curves derived from quoted interest rates matching maturities of the contracts. Where such prices are not available, the value of the currency swap contracts and forward exchange contracts were calculated based on the forward exchange rate on the maturity date quoted by the financial institutions seperately. Estimates and assumptions used in valuation techniques are consistent with the information used by market participants in determining the prices of financial instruments. |
Financial Risk Management Objectives
The main financial instruments of the Company include equity and debt investments, accounts receivable, accounts payables and loans. The Company’s Finance Department provides services to its business units, co-ordinates access to domestic and international capital markets, monitors and manages the financial risks relating to the operations of the Company through internal risk reports which analyze exposures by degree and magnitude of risks. These risks include market risk (including currency risk, interest rate risk and other price risk), credit risk, and liquidity risk.
The Company seeks to minimize the effects of these risks by using derivative financial instruments to hedge risk exposures. The use of financial derivatives is governed by the Company’s policies approved by the board of directors. Those derivatives are used to hedge the risks of exchange rate and interest rate fluctuation arising from operating or investment activities. Compliance with policies and risk exposure limits is reviewed by the Company’s Finance Department on a continuous basis. The Company does not enter into or trade financial instruments, including derivative financial instruments, for speculative purposes.
The Company reports the significant risk exposures and related action plans timely and actively to the audit committee and if needed to the board of directors.
| a. | Market risk |
The Company is exposed to market risks of changes in foreign currency exchange rates and interest rates. The Company uses currency swap and forward exchange contracts to hedge the exchange rate risk arising from assets and liabilities denominated in foreign currencies.
- 53 -
There were no changes to the Company’s exposure to market risks or the manner in which these risks are managed and measured.
| 1) | Foreign currency risk management |
The carrying amounts of the Company’s foreign currency denominated monetary assets and monetary liabilities at the end of the reporting period are as follows:
| June 30, 2014 | December 31, 2013 | June 30, 2013 | ||||||||||
Assets | ||||||||||||
USD | $ | 4,537,837 | $ | 4,233,525 | $ | 4,146,504 | ||||||
EUR | 19,212 | 5,366 | 8,568 | |||||||||
JPY | 3,313 | 1,844 | 3,494 | |||||||||
SGD | 16,612 | 141,832 | 14,324 | |||||||||
Liabilities | ||||||||||||
USD | 4,202,074 | 3,612,179 | 4,278,765 | |||||||||
EUR | 1,244,222 | 1,297,617 | 1,197,993 | |||||||||
JPY | 7,183 | 11,286 | 9,873 | |||||||||
SGD | 585 | 519 | 34,908 | |||||||||
The carrying amount of the Company’s derivatives with exchange rate risk exposures at the end of the reporting period are as follows:
| June 30, 2014 | December 31, 2013 | June 30, 2013 | ||||||||||
Assets | ||||||||||||
USD | $ | — | $ | 337 | $ | 1,137 | ||||||
EUR | 24 | — | — | |||||||||
Liabilities | ||||||||||||
USD | 456 | 246 | 29,180 | |||||||||
EUR | 287 | — | — | |||||||||
Foreign currency sensitivity analysis
The Company is mainly exposed to the fluctuations of the currencies listed above.
The following table details the Company’s sensitivity to a 5% increase and decrease in the functional currency against the relevant foreign currencies. 5% is the sensitivity rate used when reporting foreign currency risk internally to key management personnel and represents management’s assessment of the reasonably possible changes in foreign exchange rates. The sensitivity analysis includes only outstanding foreign currency denominated monetary items, forward foreign exchange contracts and currency swap contracts. A positive number below indicates an increase in pre-tax profit or equity where the functional currency weakens 5% against the relevant currency.
| Six Months Ended June 30 | ||||||||
| 2014 | 2013 | |||||||
Profit or loss | ||||||||
Monetary assets and liabilities (a) | ||||||||
USD | $ | 16,788 | $ | (6,613 | ) | |||
EUR | (61,251 | ) | (59,471 | ) | ||||
JPY | (194 | ) | (319 | ) | ||||
SGD | 801 | (1,029 | ) | |||||
(Continued)
- 54 -
| Six Months Ended June 30 | ||||||||
| 2014 | 2013 | |||||||
Derivatives (b) | ||||||||
USD | $ | 6,122 | $ | 140,700 | ||||
Equity | ||||||||
Derivatives (c) | ||||||||
EUR | (218 | ) | — | |||||
(Concluded)
| a) | This is mainly attributable to the exposure to the outstanding foreign currency denominated receivables and payables of the Company at the end of the reporting period. |
| b) | This is mainly attributable to the currency swap contracts and forward foreign exchange contracts. |
| c) | This is mainly attributable to the changes in the fair value of derivatives that are designated as cash flow hedges. |
For a 5% strengthening of the functional currency against the relevant currency, there would be a comparable impact on the profit, and the balances above would be negative.
| 2) | Interest rate risk |
The carrying amount of the Company’s exposures to interest rates on financial assets and financial liabilities are as follows:
| June 30, 2014 | December 31, 2013 | June 30, 2013 | ||||||||||
Fair value interest rate risk | ||||||||||||
Financial assets | $ | 24,325,923 | $ | 5,682,095 | $ | 59,068,496 | ||||||
Financial liabilities | 990,000 | 224,357 | 190,865 | |||||||||
Cash flow interest rate risk | ||||||||||||
Financial assets | 5,554,651 | 10,609,392 | 5,125,359 | |||||||||
Financial liabilities | 2,143,000 | 1,730,000 | 1,704,000 | |||||||||
Interest rate sensitivity analysis
The sensitivity analyses below have been determined based on the exposure to interest rates for non-derivative instruments at the end of the reporting period. A 25 basis point increase or decrease is used when reporting interest rate risk internally to key management personnel and represents management’s assessment of the reasonably possible change in interest rates.
If interest rates had been 25 basis points higher/lower and all other variables were held constant, the Company’s profit before tax would increase/decrease by $8,529 thousand and $8,553 thousand for the six months ended June 30, 2014 and 2013, respectively. This is mainly attributable to the Company’s exposure to floating rates on its financial instruments and short-term and long-term loan.
| 3) | Other price risks |
The Company is exposed to equity price risks arising from equity investments. Equity investments are held for strategic rather than trading purposes. The management managed the risk through holding various risk portfolios. Further, the Company assigned finance and investment departments to monitor the price risk.
- 55 -
Equity price sensitivity analysis
The sensitivity analyses below have been determined based on the exposure to equity price risks at the end of the reporting period.
If equity prices of listed equity securities had been 5% higher/lower:
Other comprehensive income would increase/decrease by $140,120 thousand and $286,329 thousand as a result of the changes in fair value of available-for-sale assets for the six months ended June 30, 2014 and 2013, respectively.
| b. | Credit risk management |
Credit risk refers to the risk that a counterparty will default on its contractual obligations resulting in financial loss to the Company. The maximum credit exposure of the aforementioned financial instruments is equal to their carrying amounts recognized in consolidated balance sheet as of the balance sheet date.
The Company serves a large consumer base, and the concentration of credit risk was limited.
| c. | Liquidity risk management |
The Company manages and contains sufficient cash and cash equivalent position to support the operations and reduce the impact on fluctuation of cash flow.
| 1) | Liquidity and interest risk tables |
The following tables detailed the Company’s remaining contractual maturity for its non-derivative financial liabilities with agreed repayment periods. The tables have been drawn up based on the undiscounted cash flows of financial liabilities based on the earliest date on which the Company is required to pay.
Weighted Average Effective Interest | Less Than 1 Month | 1-3 Months | 3 Months to 1 Year | 1-5 Years | Total | |||||||||||||||||||
June 30, 2014 | ||||||||||||||||||||||||
Non-derivative financial liabilities | ||||||||||||||||||||||||
Non-interest bearing | — | $ | 35,311,055 | $ | 35,103,221 | $ | — | $ | — | $ | 70,414,276 | |||||||||||||
Floating interest rate instruments | 1.23 | % | 10,000 | 85,000 | 300,000 | 1,748,000 | 2,143,000 | |||||||||||||||||
Fixed interest rate instruments | 1.35 | % | 115,000 | 865,000 | 10,000 | — | 990,000 | |||||||||||||||||
|
|
|
|
|
|
|
|
|
| |||||||||||||||
| $ | 35,436,055 | $ | 36,053,221 | $ | 310,000 | $ | 1,748,000 | $ | 73,547,276 | |||||||||||||||
|
|
|
|
|
|
|
|
|
| |||||||||||||||
December 31, 2013 | ||||||||||||||||||||||||
Non-derivative financial liabilities | ||||||||||||||||||||||||
Non-interest bearing | — | $ | 41,957,323 | $ | — | $ | 980,363 | $ | — | $ | 42,937,686 | |||||||||||||
Floating interest rate instruments | 1.18 | % | — | 20,000 | 310,000 | 1,400,000 | 1,730,000 | |||||||||||||||||
Fixed interest rate instruments | 1.53 | % | 175,000 | 35,000 | 14,357 | — | 224,357 | |||||||||||||||||
|
|
|
|
|
|
|
|
|
| |||||||||||||||
| $ | 42,132,323 | $ | 55,000 | $ | 1,304,720 | $ | 1,400,000 | $ | 44,892,043 | |||||||||||||||
|
|
|
|
|
|
|
|
|
| |||||||||||||||
(Continued)
- 56 -
Weighted Average Effective Interest | Less Than 1 Month | 1-3 Months | 3 Months to 1 Year | 1-5 Years | Total | |||||||||||||||||||
June 30, 2013 | ||||||||||||||||||||||||
Non-derivative financial liabilities | ||||||||||||||||||||||||
Non-interest bearing | — | $ | 34,542,498 | $ | 41,502,339 | $ | — | $ | — | $ | 76,044,837 | |||||||||||||
Floating interest rate instruments | 1.17 | % | 4,000 | — | — | 1,700,000 | 1,704,000 | |||||||||||||||||
Fixed interest rate instruments | 1.55 | % | 20,000 | 120,000 | 50,865 | — | 190,865 | |||||||||||||||||
|
|
|
|
|
|
|
|
|
| |||||||||||||||
| $ | 34,566,498 | $ | 41,622,339 | $ | 50,865 | $ | 1,700,000 | $ | 77,939,702 | |||||||||||||||
|
|
|
|
|
|
|
|
|
| |||||||||||||||
(Concluded)
The following table detailed the Company’s liquidity analysis for its derivative financial instruments. The table has been drawn up based on the undiscounted contractual net cash inflows and outflows on derivative instruments that settle on a net basis and the undiscounted gross inflows and outflows on those derivatives that require gross settlement.
| Less Than 1 Month | 1-3 Months | 3 Months to 1 Year | 1-5 Years | Total | ||||||||||||||||
June 30, 2014 | ||||||||||||||||||||
Gross settled | ||||||||||||||||||||
Forward exchange contracts | ||||||||||||||||||||
Inflow | $ | 122,506 | $ | 177,936 | $ | — | $ | — | $ | 300,442 | ||||||||||
Outflow | 122,962 | 178,199 | — | — | 301,161 | |||||||||||||||
|
|
|
|
|
|
|
|
|
| |||||||||||
| $ | (456 | ) | $ | (263 | ) | $ | — | $ | — | $ | (719 | ) | ||||||||
|
|
|
|
|
|
|
|
|
| |||||||||||
December 31, 2013 | ||||||||||||||||||||
Gross settled | ||||||||||||||||||||
Forward exchange contracts | ||||||||||||||||||||
Inflow | $ | 90,183 | $ | — | $ | — | $ | — | $ | 90,183 | ||||||||||
Outflow | 90,092 | — | — | — | 90,092 | |||||||||||||||
|
|
|
|
|
|
|
|
|
| |||||||||||
| $ | 91 | $ | — | $ | — | $ | — | $ | 91 | |||||||||||
|
|
|
|
|
|
|
|
|
| |||||||||||
June 30, 2013 | ||||||||||||||||||||
Gross settled | ||||||||||||||||||||
Currency swap contracts | ||||||||||||||||||||
Inflow | $ | 934,378 | $ | 1,634,495 | $ | — | $ | — | $ | 2,568,873 | ||||||||||
Outflow | 947,057 | 1,650,683 | — | — | 2,597,740 | |||||||||||||||
|
|
|
|
|
|
|
|
|
| |||||||||||
| $ | (12,679 | ) | $ | (16,188 | ) | $ | — | $ | — | $ | (28,867 | ) | ||||||||
|
|
|
|
|
|
|
|
|
| |||||||||||
Forward exchange contracts | ||||||||||||||||||||
Inflow | $ | 219,503 | $ | — | $ | — | $ | — | $ | 219,503 | ||||||||||
Outflow | 218,679 | — | — | — | 218,679 | |||||||||||||||
|
|
|
|
|
|
|
|
|
| |||||||||||
| $ | 824 | $ | — | $ | — | $ | — | $ | 824 | |||||||||||
|
|
|
|
|
|
|
|
|
| |||||||||||
- 57 -
| 2) | Financing facilities |
| June 30, 2014 | December 31, 2013 | June 30, 2013 | ||||||||||
Unsecured bank loan facility | ||||||||||||
Amount used | $ | 1,085,000 | $ | 254,357 | $ | 194,865 | ||||||
Amount unused | 29,524,280 | 8,474,923 | 8,055,135 | |||||||||
|
|
|
|
|
| |||||||
| $ | 30,609,280 | $ | 8,729,280 | $ | 8,250,000 | |||||||
|
|
|
|
|
| |||||||
Secured bank loan facility | ||||||||||||
Amount used | $ | 2,048,000 | $ | 1,700,000 | $ | 1,700,000 | ||||||
Amount unused | 600,000 | 600,000 | 600,000 | |||||||||
|
|
|
|
|
| |||||||
| $ | 2,648,000 | $ | 2,300,000 | $ | 2,300,000 | |||||||
|
|
|
|
|
| |||||||
| 38. | RELATED PARTIES TRANSACTIONS |
The ROC Government, one of Chunghwa’s customers held significant equity interest in Chunghwa. Chunghwa provides fixed-line services, wireless services, Internet and data and other services to the various departments and institutions of the ROC Government and other state-owned enterprises in the normal course of business and at arm’s-length prices. The information on service revenues from government bodies and related organizations have not been provided because the ROC government has significant influence over Chunghwa. Chunghwa believes that all revenues and costs of doing business are reflected in the consolidated financial statements.
| a. | The Company engages in business transactions with the following related parties: |
Company | Relationship | |
Taiwan International Standard Electronics Co., Ltd. (“TISE”) | Associate | |
So-net Entertainment Taiwan Co., Ltd. (“So-net”) | Associate | |
Skysoft Co., Ltd. (“SKYSOFT”) | Associate | |
KingWaytek Technology Co., Ltd. (“KWT”) | Associate | |
Dian Zuan Integrating Marketing Co., Ltd. (“DZIM”) | Associate | |
Viettel-CHT Co., Ltd. (“Viettel”) | Associate | |
Huada Digital Corporation (“HDD”) | Jointly controlled entity | |
Chunghwa Benefit One Co., Ltd (“CBO”) | Jointly controlled entity | |
International Integrated System, Inc. (“IISI”) | Associate | |
Senao Networks, Inc. (“SNI”) | Associate | |
HopeTech Technologies Limited (“HopeTech”) | Associate | |
ST-2 Satellite Ventures Pte., Ltd. (“STS”) | Associate | |
Xiamen Sertec Business Technology Co., Ltd. (“Sertec”) | Associate | |
Other related parties | ||
Chunghwa Telecom Foundation (“CTF”) | A nonprofit organization of which the funds donated by Chunghwa exceeds one third of its total funds | |
Senao Technical and Cultural Foundation (“STCF”) | A nonprofit organization of which the funds donated by SENAO exceeds one third of its total funds | |
Sochamp Technology Co., Ltd. (“Sochamp”) | Investor of significant influence over CHST | |
(Continued)
- 58 -
Company | Relationship | |
United Daily News Co., Ltd. (“UDN) | Investor of significant influence over SFD | |
HTC Co., Ltd (“HTC”) | Investor of significant influence over HDD | |
E-Life Mall Co., Ltd. | One of the directors of E-Life Mall and a director of SENAO are members of an immediate family | |
Senao Shenzhen Ltd. | Investee of HopeTech |
(Concluded)
| b. | Term of the foregoing transactions with related parties were not significantly different from transactions with non-related parties. When no similar transactions with non-related parties can be referenced, terms were determined in accordance with mutual agreements. Details of transactions between the Company and related parties are disclosed below: |
| 1) | Operating transactions |
| Revenues | ||||||||||||||||
| Three Months Ended June 30 | Six Months Ended June 30 | |||||||||||||||
| 2014 | 2013 | 2014 | 2013 | |||||||||||||
Associates | $ | 84,045 | $ | 105,716 | $ | 168,154 | $ | 193,424 | ||||||||
|
|
|
|
|
|
|
| |||||||||
Jointly controlled entities | $ | 1,747 | $ | 1,016 | $ | 3,243 | $ | 1,992 | ||||||||
|
|
|
|
|
|
|
| |||||||||
Others | $ | 17,034 | $ | 9,775 | $ | 32,592 | $ | 11,104 | ||||||||
|
|
|
|
|
|
|
| |||||||||
| Purchases | ||||||||||||||||
| Three Months Ended June 30 | Six Months Ended June 30 | |||||||||||||||
| 2014 | 2013 | 2014 | 2013 | |||||||||||||
Associates | $ | 346,048 | $ | 333,690 | $ | 731,264 | $ | 672,008 | ||||||||
|
|
|
|
|
|
|
| |||||||||
Jointly controlled entities | $ | — | $ | — | $ | — | $ | 571 | ||||||||
|
|
|
|
|
|
|
| |||||||||
Others | $ | 16,581 | $ | 5,103 | $ | 69,638 | $ | 52,583 | ||||||||
|
|
|
|
|
|
|
| |||||||||
| 2) | Non-operating transactions |
| Three Months Ended June 30 | Six Months Ended June 30 | |||||||||||||||
| 2014 | 2013 | 2014 | 2013 | |||||||||||||
Associates | $ | 16,974 | $ | 8,062 | $ | 16,974 | $ | 16,130 | ||||||||
|
|
|
|
|
|
|
| |||||||||
Others | $ | — | $ | 105 | $ | — | $ | 105 | ||||||||
|
|
|
|
|
|
|
| |||||||||
| 3) | Receivables |
| June 30, 2014 | December 31, 2013 | June 30, 2013 | ||||||||||
Associates | $ | 55,905 | $ | 59,875 | $ | 42,851 | ||||||
Jointly controlled entities | 574 | 1 | 1 | |||||||||
Others | 13,201 | 9,428 | 8,586 | |||||||||
|
|
|
|
|
| |||||||
| $ | 69,680 | $ | 69,304 | $ | 51,438 | |||||||
|
|
|
|
|
| |||||||
- 59 -
| 4) | Payables |
| June 30, 2014 | December 31, 2013 | June 30, 2013 | ||||||||||
Associates | $ | 586,692 | $ | 549,012 | $ | 534,386 | ||||||
Jointly controlled entities | 36,263 | — | 2 | |||||||||
Others | 16,781 | 7,797 | 5,084 | |||||||||
|
|
|
|
|
| |||||||
| $ | 639,736 | $ | 556,809 | $ | 539,472 | |||||||
|
|
|
|
|
| |||||||
| 5) | Customers’ deposits |
| June 30, 2014 | December 31, 2013 | June 30, 2013 | ||||||||||
Associates | $ | 6,048 | $ | 994 | $ | 3,342 | ||||||
|
|
|
|
|
| |||||||
| 6) | Acquisition of property, plant and equipment |
| Three Months Ended June 30 | Six Months Ended June 30 | |||||||||||||||
| 2014 | 2013 | 2014 | 2013 | |||||||||||||
Associates | $ | 279,964 | $ | 259,106 | $ | 450,750 | $ | 769,844 | ||||||||
|
|
|
|
|
|
|
| |||||||||
The above amount is mainly attributable to telecommunications equipment bought from TISE.
| 7) | Prepayments |
Chunghwa entered into a contract with ST-2 Satellite Ventures Pte., Ltd. on March 12, 2010 to lease capacity on the ST-2 satellite. This lease term is for 15 years which should start from the official operation of ST-2 satellite and the total contract value is approximately $6,000,000 thousand (SG$260,723 thousand), including a prepayment of $3,067,711 thousand, and the rest of amount should be paid annually when ST-2 satellite starts its official operation. ST-2 satellite was launched in May 2011, and began its official operation in August 2011. The total rental expense for the three months ended June 30, 2014 was $102,942 thousand, which consisted of an offsetting credit of the prepayment of $51,096 thousand and an additional accrual of $51,846 thousand. The total rental expense for the six months ended June 30, 2014 was $207,970 thousand, which consisted of an offsetting credit of the prepayment of $96,960 thousand and an additional accrual of $111,010 thousand. The prepayment was $2,469,812 thousand (classified as prepaid rents-current $204,398 thousand, and prepaid rents—noncurrent $2,265,414 thousand) as of June 30, 2014.
| c | Compensation of key management personnel |
The remuneration of directors and members of key management personnel for the three months and six months ended June 30, 2014 and 2013 was as follows:
| Three Months Ended June 30 | Six Months Ended June 30 | |||||||||||||||
| 2014 | 2013 | 2014 | 2013 | |||||||||||||
Short-term benefits | $ | 52,237 | $ | 62,148 | $ | 125,989 | $ | 139,448 | ||||||||
Share-based payment | 2,444 | 1,356 | 4,888 | 1,356 | ||||||||||||
Post-employment benefits | 2,158 | 573 | 4,258 | 1,146 | ||||||||||||
|
|
|
|
|
|
|
| |||||||||
| $ | 56,839 | $ | 64,077 | $ | 135,135 | $ | 141,950 | |||||||||
|
|
|
|
|
|
|
| |||||||||
- 60 -
The remuneration of directors and key executives is determined by the compensation committee having regard to the performance of individual and market trends.
| 39. | PLEDGED ASSETS |
The following assets are pledged as collaterals for long-term bank loans and contract deposits.
| June 30, 2014 | December 31, 2013 | June 30, 2013 | ||||||||||
Property, plant and equipment, net | $ | 3,093,786 | $ | 2,668,409 | $ | 2,683,166 | ||||||
Land held under development and land held for development (included in inventories) | 1,998,733 | 1,998,733 | 1,998,733 | |||||||||
Restricted assets (included in other assets—others) | 1,041 | 10,541 | 10,000 | |||||||||
|
|
|
|
|
| |||||||
| $ | 5,093,560 | $ | 4,677,683 | $ | 4,691,899 | |||||||
|
|
|
|
|
| |||||||
| 40. | SIGNIFICANT CONTINGENT LIABILITIES AND UNRECOGNIZED COMMITMENTS |
At the balance sheet date, the Company’s remaining commitments under non-cancelable contracts with various parties, excluding those disclosed in other notes, were as follows:
| a. | Acquisitions of land and buildings of $3,230,437 thousand as of June 30, 2014. |
| b. | Acquisitions of telecommunications equipment were of $24,286,979 thousand as of June 30, 2014. |
| c. | Unused letters of credit were of $209,838 thousand as of June 30, 2014. |
| d. | A commitment to contribute $2,000,000 thousand to a Piping Fund administered by the Taipei City Government, of which $1,000,000 thousand was contributed by Chunghwa on August 15, 1996 (classified as other monetary assets—noncurrent). If the fund is not sufficient, Chunghwa will contribute the remaining $1,000,000 thousand upon notification from the Taipei City Government. |
| 41. | EXCHANGE RATE INFORMATION OF FOREIGN FINANCIAL ASSETS AND LIABILITIES |
The significant information of foreign-currency financial assets and liabilities as below:
| June 30, 2014 | ||||||||||||
| Foreign Currencies (Thousands) | Exchange Rate | New Taiwan Dollars (Thousands) | ||||||||||
Financial assets | ||||||||||||
Monetary items | ||||||||||||
Cash | ||||||||||||
USD | $ | 9,167 | 29.87 | $ | 273,764 | |||||||
EUR | 394 | 40.78 | 16,081 | |||||||||
JPY | 7,342 | 0.295 | 2,166 | |||||||||
SGD | 646 | 23.93 | 15,455 | |||||||||
(Continued)
- 61 -
| June 30, 2014 | ||||||||||||
| Foreign Currencies (Thousands) | Exchange Rate | New Taiwan Dollars (Thousands) | ||||||||||
Accounts receivable | ||||||||||||
USD | $ | 142,778 | 29.87 | $ | 4,264,073 | |||||||
EUR | 77 | 40.78 | 3,131 | |||||||||
JPY | 3,887 | 0.295 | 1,147 | |||||||||
SGD | 48 | 23.93 | 1,157 | |||||||||
Non-monetary items | ||||||||||||
Investments accounted for using equity method | ||||||||||||
USD | 929 | 29.87 | 27,749 | |||||||||
SGD | 24,198 | 23.93 | 579,064 | |||||||||
Financial liabilities | ||||||||||||
Monetary items | ||||||||||||
Accounts payable | ||||||||||||
USD | 140,702 | 29.87 | 4,202,074 | |||||||||
EUR | 30,511 | 40.78 | 1,244,222 | |||||||||
JPY | 24,348 | 0.295 | 7,183 | |||||||||
SGD | 24 | 23.93 | 585 | |||||||||
(Concluded)
| December 31, 2013 | ||||||||||||
| Foreign Currencies (Thousands) | Exchange Rate | New Taiwan Dollars (Thousands) | ||||||||||
Financial assets | ||||||||||||
Monetary items | ||||||||||||
Cash | ||||||||||||
USD | $ | 6,446 | 29.80 | $ | 192,118 | |||||||
EUR | 96 | 41.09 | 3,947 | |||||||||
JPY | 1,483 | 0.284 | 421 | |||||||||
SGD | 5,912 | 23.58 | 139,416 | |||||||||
Accounts receivable | ||||||||||||
USD | 135,595 | 29.80 | 4,041,407 | |||||||||
EUR | 35 | 41.09 | 1,419 | |||||||||
JPY | 5,012 | 0.284 | 1,423 | |||||||||
SGD | 102 | 23.58 | 2,416 | |||||||||
Non-monetary items | ||||||||||||
Available-for-sale financial assets | ||||||||||||
USD | 814 | 29.80 | 24,267 | |||||||||
Investments accounted for using equity method | ||||||||||||
USD | 854 | 29.80 | 25,564 | |||||||||
SGD | 22,046 | 23.58 | 519,839 | |||||||||
(Continued)
- 62 -
| December 31, 2013 | ||||||||||||
| Foreign Currencies (Thousands) | Exchange Rate | New Taiwan Dollars (Thousands) | ||||||||||
Financial liabilities | ||||||||||||
Monetary items | ||||||||||||
Accounts payable | ||||||||||||
USD | $ | 121,194 | 29.80 | $ | 3,612,179 | |||||||
EUR | 31,580 | 41.09 | 1,297,617 | |||||||||
JPY | 39,738 | 0.284 | 11,286 | |||||||||
SGD | 22 | 23.58 | 519 | |||||||||
(Concluded)
| June 30, 2013 | ||||||||||||
| Foreign Currencies (Thousands) | Exchange Rate | New Taiwan Dollars (Thousands) | ||||||||||
Financial assets | ||||||||||||
Monetary items | ||||||||||||
Cash | ||||||||||||
USD | $ | 12,627 | 30.00 | $ | 378,800 | |||||||
EUR | 121 | 39.15 | 4,748 | |||||||||
JPY | 9,910 | 0.30 | 3,009 | |||||||||
SGD | 462 | 23.76 | 10,967 | |||||||||
Accounts receivable | ||||||||||||
USD | 125,590 | 30.00 | 3,767,704 | |||||||||
EUR | 98 | 39.15 | 3,820 | |||||||||
JPY | 1,596 | 0.30 | 485 | |||||||||
SGD | 141 | 23.76 | 3,357 | |||||||||
Non-monetary items | ||||||||||||
Available-for-sale financial assets | ||||||||||||
USD | 88,516 | 30.00 | 2,655,490 | |||||||||
Investments accounted for using equity method | ||||||||||||
USD | 867 | 30.00 | 26,129 | |||||||||
SGD | 27,155 | 23.76 | 645,208 | |||||||||
Financial liabilities | ||||||||||||
Monetary items | ||||||||||||
Accounts payable | ||||||||||||
USD | 142,626 | 30.00 | 4,278,765 | |||||||||
EUR | 30,600 | 39.15 | 1,197,993 | |||||||||
JPY | 32,520 | 0.30 | 9,873 | |||||||||
SGD | 1,469 | 23.76 | 34,908 | |||||||||
- 63 -
42. ADDITIONAL DISCLOSURES
Following are the additional disclosures required by the SFC for Chunghwa and its investees:
| a. | Financing provided: None. |
| b. | Endorsement/guarantee provided: Please see Table 1. |
| c. | Marketable securities held (excluding investments in subsidiaries, associates and jointly controlled entity): Please see Table 2. |
| d. | Marketable securities acquired and disposed of at costs or prices at least $300 million or 20% of the paid-in capital: Please see Table 3. |
| e. | Acquisition of individual real estate at costs of at least $300 million or 20% of the paid-in capital: Please see Table 4. |
| f. | Disposal of individual real estate at prices of at least $300 million or 20% of the paid-in capital: None. |
| g. | Total purchases from or sales to related parties amounting to at least $100 million or 20% of the paid-in capital: Please see Table 5. |
| h. | Receivables from related parties amounting to $100 million or 20% of the paid-in capital: Please see Table 6. |
| i. | Names, locations, and other information of investees on which the Company exercises significant influence (excluding investment in Mainland China): Please see Table 7. |
| j. | Financial transactions: Please see Notes 7, 10 and 37. |
| k. | Investment in Mainland China: Please see Table 8. |
| l. | Intercompany relationships and significant intercompany transaction: Please see Table 9. |
43. SEGMENT INFORMATION
The Company has the following reportable segments that provide different products or services. Segment information is provided to CEO who allocates resources and assesses segment performance. The Company’s reportable segments are as follows:
| a. | Domestic fixed communications business—the provision of local telephone services, domestic long distance telephone services, broadband access, and related services; |
| b. | Mobile communications business—the provision of mobile services, sales of mobile handsets and data cards, and related services; |
| c. | Internet business—the provision of HiNet services and related services; |
| d. | International fixed communications business—the provision of international long distance telephone services and related services; |
| e. | Others—the provision of non-Telecom services and the corporate related items not allocated to reportable segments. |
- 64 -
Segment Revenue and Operating Results
Analysis by reportable segment of revenue and operating results of continuing operations are as follows:
Domestic Fixed cations | Mobile cations Business | Internet Business | International cations Business | Others | Total | |||||||||||||||||||
Three months ended June 30, 2014 | ||||||||||||||||||||||||
Revenue | ||||||||||||||||||||||||
From external customers | $ | 17,233,714 | $ | 27,779,522 | $ | 6,295,404 | $ | 3,929,697 | $ | 545,898 | $ | 55,784,235 | ||||||||||||
Intersegment revenues | 5,032,807 | 1,239,059 | 1,364,125 | 550,703 | 794,138 | 8,980,832 | ||||||||||||||||||
|
|
|
|
|
|
|
|
|
|
|
| |||||||||||||
Segment revenues | $ | 22,266,521 | $ | 29,018,581 | $ | 7,659,529 | $ | 4,480,400 | $ | 1,340,036 | 64,765,067 | |||||||||||||
|
|
|
|
|
|
|
|
|
| |||||||||||||||
Intersegment elimination | (8,980,832 | ) | ||||||||||||||||||||||
|
| |||||||||||||||||||||||
Consolidated revenues | $ | 55,784,235 | ||||||||||||||||||||||
|
| |||||||||||||||||||||||
Segment income before income tax | $ | 4,964,296 | $ | 5,632,115 | $ | 2,502,879 | $ | 140,816 | $ | (451,791 | ) | $ | 12,788,315 | |||||||||||
|
|
|
|
|
|
|
|
|
|
|
| |||||||||||||
Six months ended June 30, 2014 | ||||||||||||||||||||||||
Revenue | ||||||||||||||||||||||||
From external customers | $ | 34,384,448 | $ | 55,287,580 | $ | 12,429,451 | $ | 7,727,894 | $ | 1,004,774 | $ | 110,834,147 | ||||||||||||
Intersegment revenues | 10,065,512 | 2,733,810 | 2,560,939 | 1,037,470 | 967,512 | 17,365,243 | ||||||||||||||||||
|
|
|
|
|
|
|
|
|
|
|
| |||||||||||||
Segment revenues | $ | 44,449,960 | $ | 58,021,390 | $ | 14,990,390 | $ | 8,765,364 | $ | 1,972,286 | 128,199,390 | |||||||||||||
|
|
|
|
|
|
|
|
|
| |||||||||||||||
Intersegment elimination | (17,365,243 | ) | ||||||||||||||||||||||
|
| |||||||||||||||||||||||
Consolidated revenues | $ | 110,834,147 | ||||||||||||||||||||||
|
| |||||||||||||||||||||||
Segment income before income tax | $ | 10,207,084 | $ | 11,107,749 | $ | 4,777,972 | $ | 154,452 | $ | (1,117,240 | ) | $ | 25,130,017 | |||||||||||
|
|
|
|
|
|
|
|
|
|
|
| |||||||||||||
Three months ended June 30, 2013 | ||||||||||||||||||||||||
Revenue | ||||||||||||||||||||||||
From external customers | $ | 18,181,882 | $ | 26,874,183 | $ | 6,191,894 | $ | 4,024,452 | $ | 565,545 | $ | 55,837,956 | ||||||||||||
Intersegment revenues | 4,611,045 | 1,353,669 | 1,085,372 | 567,821 | 204,769 | 7,822,676 | ||||||||||||||||||
|
|
|
|
|
|
|
|
|
|
|
| |||||||||||||
Segment revenues | $ | 22,792,927 | $ | 28,227,852 | $ | 7,277,266 | $ | 4,592,273 | $ | 770,314 | 63,660,632 | |||||||||||||
|
|
|
|
|
|
|
|
|
| |||||||||||||||
Intersegment elimination | (7,822,676 | ) | ||||||||||||||||||||||
|
| |||||||||||||||||||||||
Consolidated revenues | $ | 55,837,956 | ||||||||||||||||||||||
|
| |||||||||||||||||||||||
Segment income before income tax | $ | 4,551,451 | $ | 6,473,529 | $ | 2,441,479 | $ | 168,801 | $ | (591,214 | ) | $ | 13,044,046 | |||||||||||
|
|
|
|
|
|
|
|
|
|
|
| |||||||||||||
Six months ended June 30, 2013 | ||||||||||||||||||||||||
Revenue | ||||||||||||||||||||||||
From external customers | $ | 36,234,279 | $ | 54,771,766 | $ | 12,209,370 | $ | 7,841,341 | $ | 1,398,193 | $ | 112,454,949 | ||||||||||||
Intersegment revenues | 9,292,465 | 2,797,441 | 1,947,768 | 983,267 | 393,359 | 15,414,300 | ||||||||||||||||||
|
|
|
|
|
|
|
|
|
|
|
| |||||||||||||
Segment revenues | $ | 45,526,744 | $ | 57,569,207 | $ | 14,157,138 | $ | 8,824,608 | $ | 1,791,552 | 127,869,249 | |||||||||||||
|
|
|
|
|
|
|
|
|
| |||||||||||||||
Intersegment elimination | (15,414,300 | ) | ||||||||||||||||||||||
|
| |||||||||||||||||||||||
Consolidated revenues | $ | 112,454,949 | ||||||||||||||||||||||
|
| |||||||||||||||||||||||
Segment income before income tax | $ | 9,319,811 | $ | 11,323,270 | $ | 4,604,960 | $ | 509,029 | $ | (1,154,200 | ) | $ | 24,602,870 | |||||||||||
|
|
|
|
|
|
|
|
|
|
|
| |||||||||||||
44. SIGNIFICANT SUBSEQUENT EVENTS
The board of directors of LED approved the disposal of investment properties on August 1, 2014. As of August 1, 2014, the cost and accumulated depreciation of such investment properties were $623,498 thousand and $13,244 thousand, respectively. The proceeds from disposal was $1,230,000 thousand. The transaction costs and gain from the disposal are expected to be $36,386 thousand and $583,360 thousand, respectively.
- 65 -
TABLE 1
CHUNGHWA TELECOM CO., LTD. AND SUBSIDIARIES
ENDORSEMENTS/GUARANTEES PROVIDED
SIX MONTHS ENDED JUNE 30, 2014
(In Thousands of New Taiwan Dollars, Unless Specified Otherwise)
No. | Endorsement/ | Guaranteed Party | Limits on Endorsement/ Guarantee Amount Provided to Each Guaranteed Party | Maximum Balance for the Period | Ending Balance | Actual Borrowing Amount | Amount of Endorsement/ Guarantee Collateralized by Properties | Ratio of Accumulated Endorsement/ Guarantee to Net Equity Per Latest Financial Statements | Maximum Endorsement/ Guarantee Amount Allowable | Endorsement/ Guarantee Given by Parent on Behalf of Subsidiaries | Endorsement/ Guarantee Given by Subsidiaries on Behalf of Parent | Endorsement/ Guarantee Given on Behalf of Companies in Mainland China | Note | |||||||||||||||||||||||||||||||||||||||
| Name | Nature of Relationship (Note 2) | |||||||||||||||||||||||||||||||||||||||||||||||||||
0 | Chunghwa Telecom Co., Ltd. | Donghwa Telecom Co., Ltd. | b | $ | 3,457,349 | $ | 1,371,150 | $ | 1,343,925 | $ | — | $ | — | 0.40 | % | $ | 13,829,396 | Yes | No | No | | Notes 3 and 4 | | |||||||||||||||||||||||||||||
25 | Yao Yong Real Property Co., Ltd. | Light Era Development Co., Ltd. | d | 3,674,330 | 3,300,000 | 3,300,000 | 1,650,000 | 3,300,000 | 0.89 | % | 3,674,330 | No | Yes | No | Note 5 | |||||||||||||||||||||||||||||||||||||
| Note 1: | Significant transactions between the Company and its subsidiaries or among subsidiaries are numbered as follows: |
| a. | “0” for the Company. |
| b. | Subsidiaries are numbered from “1”. |
| Note 2: | Relationships between the endorsement/guarantee provider and the guaranteed party: |
| a. | Trading partner. |
| b. | Majority owned subsidiary. |
| c. | The Company and subsidiary owns over 50% ownership of the investee company. |
| d. | A subsidiary jointly owned by the Company and the Company’s directly-owned subsidiary. |
| e. | Guaranteed by the Company according to the construction contract. |
| f. | An investee company. The guarantees were provided based on the Company’s proportionate share in the investee company. |
| Note 3: | The limits on endorsement or guarantee amount provided to each guaranteed party is up to 1% of the total equity attributable to stockholders of the parent of the latest financial statement of Chunghwa. |
| Note 4: | The total amount of endorsement or guarantee that the Company is allowed to provide shall not exceed 4% of the total equity attributable to stockholders of the parent of the latest financial statement of Chunghwa. |
| Note 5: | The maximum amount of endorsement or guarantee is up to 200% of the asset value of the latest financial statements of Yao Yong Real Property Co., Ltd. |
- 66 -
TABLE 2
CHUNGHWA TELECOM CO., LTD. AND SUBSIDIARIES
MARKETABLE SECURITIES HELD
JUNE 30, 2014
(Amounts in Thousands of New Taiwan Dollars, Unless Otherwise Specified)
No. | Held Company Name | Marketable Securities Type and Name | Relationship with the | Financial Statement Account | June 30, 2014 | Note | ||||||||||||||||||||
| Shares (Thousands/ Thousand Units) | Carrying Value (Note 1) | Percentage of Ownership | Market Value or Net Asset Value | |||||||||||||||||||||||
| 0 | Chunghwa Telecom Co., | Stocks | ||||||||||||||||||||||||
| Ltd. | Taipei Financial Center Corp. | — | Financial assets carried at cost - noncurrent | 172,927 | $ | 1,789,530 | 12 | $ | — | — | ||||||||||||||||
Industrial Bank of Taiwan II Venture Capital Co., Ltd. (IBT II) | — | Financial assets carried at cost - noncurrent | 11,826 | 118,260 | 17 | — | — | |||||||||||||||||||
Innovation Works Development Fund, L.P. | — | Financial assets carried at cost - noncurrent | — | �� | 189,958 | 4 | — | — | ||||||||||||||||||
Global Mobile Corp. | — | Financial assets carried at cost - noncurrent | 7,617 | 77,018 | 3 | — | — | |||||||||||||||||||
iD Branding Ventures | — | Financial assets carried at cost - noncurrent | 4,275 | 42,750 | 8 | — | — | |||||||||||||||||||
Innovation Works Limited | — | Financial assets carried at cost - noncurrent | 1,000 | 31,390 | 2 | — | — | |||||||||||||||||||
CQi Energy Infocom Inc. | — | Financial assets carried at cost - noncurrent | 2,000 | — | 18 | — | — | |||||||||||||||||||
RPTI Intergroup International Ltd. | — | Financial assets carried at cost - noncurrent | 4,765 | — | 10 | — | — | |||||||||||||||||||
Essence Technology Solution, Inc. | — | Financial assets carried at cost - noncurrent | 200 | — | 7 | — | — | |||||||||||||||||||
China Airlines Ltd. | — | Available-for-sale financial assets - noncurrent | 263,622 | 2,702,127 | 5 | 2,702,127 | Note 2 | |||||||||||||||||||
Bond | ||||||||||||||||||||||||||
Taiwan Power Co. 2nd Unsecured Bond-EB Issue in 2005 | — | Held-to-maturity financial assets | — | 301,558 | — | 301,424 | Note 3 | |||||||||||||||||||
Taiwan Power Co. 2nd Unsecured Bond-EB Issue in 2005 | — | Held-to-maturity financial assets | — | 200,949 | — | 200,949 | Note 3 | |||||||||||||||||||
Chinese Petroleum Corporation 1st Unsecured Corporate Bond-C Issue in 2006 | — | Held-to-maturity financial assets | — | 203,944 | — | 204,448 | Note 3 | |||||||||||||||||||
Chinese Petroleum Corporation 1st Unsecured Corporate Bond-C Issue in 2006 | — | Held-to-maturity financial assets | — | 101,934 | — | 102,224 | Note 3 | |||||||||||||||||||
Taiwan Power Co. 2nd Unsecured Corporate Bond-C Issue in 2006 | — | Held-to-maturity financial assets | — | 204,828 | — | 205,893 | Note 3 | |||||||||||||||||||
Taiwan Power Co. 3rd Unsecured Corporate Bond-C Issue in 2006 | — | Held-to-maturity financial assets | — | 205,629 | — | 204,938 | Note 3 | |||||||||||||||||||
China Steel Corporation 2nd Unsecured Corporate Bonds-B Issue in 2008 | — | Held-to-maturity financial assets | — | 201,762 | — | 203,241 | Note 3 | |||||||||||||||||||
China Steel Corporation 2nd Unsecured Corporate Bonds-B Issue in 2008 | — | Held-to-maturity financial assets | — | 303,106 | — | 304,862 | Note 3 | |||||||||||||||||||
(Continued)
- 67 -
No. | Held Company Name | Marketable Securities Type and Name | Relationship with the | Financial Statement Account | June 30, 2014 | Note | ||||||||||||||||||||
| Shares (Thousands/ Thousand Units) | Carrying Value (Note 1) | Percentage of Ownership | Market Value or Net Asset Value | |||||||||||||||||||||||
Chinese Petroleum Corporation 1st Unsecured Corporate Bond-A Issue in 2009 | — | Held-to-maturity financial assets | — | 200,089 | — | 200,599 | Note 3 | |||||||||||||||||||
FCFC 1st Unsecured Corporate Bonds Issue in 2009 | — | Held-to-maturity financial assets | — | 125,054 | — | 125,253 | Note 3 | |||||||||||||||||||
Taiwan Power Co. 2nd Secured Corporate Bond-B Issue in 2009 | — | Held-to-maturity financial assets | — | 50,012 | — | 50,076 | Note 3 | |||||||||||||||||||
Taiwan Power Company 4th Secured Corporate Bond-B Issue in 2009 | — | Held-to-maturity financial assets | — | $ | 174,922 | — | $ | 175,521 | Note 3 | |||||||||||||||||
Taiwan Power Company 5th Secured Corporate Bond-B Issue in 2009 | — | Held-to-maturity financial assets | — | 50,053 | — | 50,254 | Note 3 | |||||||||||||||||||
NAN YA Company 3rd Unsecured Corporate Bond-A Issue in 2009 | — | Held-to-maturity financial assets | — | 100,021 | — | 100,179 | Note 3 | |||||||||||||||||||
NAN YA Company 3rd Unsecured Corporate Bond-A Issue in 2009 | — | Held-to-maturity financial assets | — | 25,013 | — | 25,045 | Note 3 | |||||||||||||||||||
NAN YA Company 4th Unsecured Corporate Bond-A Issue in 2009 | — | Held-to-maturity financial assets | — | 99,974 | — | 100,407 | Note 3 | |||||||||||||||||||
NAN YA Company 4th Unsecured Corporate Bond-A Issue in 2009 | — | Held-to-maturity financial assets | — | 150,215 | — | 150,611 | Note 3 | |||||||||||||||||||
Hon Hai Precision Industry Co., Ltd. First Debenture Issuing of 2009 | — | Held-to-maturity financial assets | — | 50,057 | — | 50,138 | Note 3 | |||||||||||||||||||
Hon Hai Precision Industry Co., Ltd. First Debenture Issuing of 2009 | — | Held-to-maturity financial assets | — | 50,048 | — | 50,138 | Note 3 | |||||||||||||||||||
Hon Hai Precision Industry Co., Ltd. First Debenture Issuing of 2009 | — | Held-to-maturity financial assets | — | 87,596 | — | 87,742 | Note 3 | |||||||||||||||||||
FCFC 2nd Unsecured Corporate Bonds Issue in 2010 | — | Held-to-maturity financial assets | — | 200,193 | — | 201,067 | Note 3 | |||||||||||||||||||
FCFC 2nd Unsecured Corporate Bonds Issue in 2010 | — | Held-to-maturity financial assets | — | 100,068 | — | 100,533 | Note 3 | |||||||||||||||||||
TaipeiFubon Bank 5th Financial Debentures-A Issue in 2010 | — | Held-to-maturity financial assets | — | 200,436 | — | 200,815 | Note 3 | |||||||||||||||||||
TaipeiFubon Bank 5th Financial Debentures-A Issue in 2010 | — | Held-to-maturity financial assets | — | 300,918 | — | 301,222 | Note 3 | |||||||||||||||||||
TaipeiFubon Bank 5th Financial Debentures-A Issue in 2010 | — | Held-to-maturity financial assets | — | 100,174 | — | 100,407 | Note 3 | |||||||||||||||||||
Formosa Petrochemical Corporation 1st Unsecured Corporate Bonds Issue in 2010 | — | Held-to-maturity financial assets | — | 150,426 | — | 150,718 | Note 3 | |||||||||||||||||||
Formosa Petrochemical Corporation 1st Unsecured Corporate Bonds Issue in 2010 | — | Held-to-maturity financial assets | — | 50,072 | — | 50,240 | Note 3 | |||||||||||||||||||
Taiwan Power Co. 2nd Secured Corporate Bond-A Issue in 2010 | — | Held-to-maturity financial assets | — | 50,036 | — | 50,385 | Note 3 | |||||||||||||||||||
Taiwan Power Co. 3rd Secured Corporate Bond-A Issue in 2010 | — | Held-to-maturity financial assets | — | 200,264 | — | 200,923 | Note 3 | |||||||||||||||||||
(Continued)
- 68 -
No. | Held Company Name | Marketable Securities Type and Name | Relationship with the | Financial Statement Account | June 30, 2014 | Note | ||||||||||||||||||||
| Shares (Thousands/ Thousand Units) | Carrying Value (Note 1) | Percentage of Ownership | Market Value or Net Asset Value | |||||||||||||||||||||||
Taiwan Power Co. 4th Secured Corporate Bond-A Issue in 2010 | — | Held-to-maturity financial assets | — | 300,129 | — | 301,583 | Note 3 | |||||||||||||||||||
Taiwan Power Co. 4th Secured Corporate Bond-A Issue in 2010 | — | Held-to-maturity financial assets | — | 99,986 | — | 100,528 | Note 3 | |||||||||||||||||||
Taiwan Power Co. 4th Secured Corporate Bond-A Issue in 2010 | — | Held-to-maturity financial assets | — | 199,972 | — | 201,055 | Note 3 | |||||||||||||||||||
NAN YA Company 2nd Unsecured Corporate Bond-A Issue in 2010 | — | Held-to-maturity financial assets | — | 50,101 | — | 50,235 | Note 3 | |||||||||||||||||||
China Development Holding Corporation 1st Unsecured Corporate Bond-A Issue in 2010 | — | Held-to-maturity financial assets | — | 200,590 | — | 200,883 | Note 3 | |||||||||||||||||||
Formosa Petrochemical Corporation 3rd Unsecured Corporate Bonds Issue in 2010 | — | Held-to-maturity financial assets | — | $ | 299,935 | — | $ | 301,105 | Note 3 | |||||||||||||||||
China Steel Corporation 1st Unsecured Corporate Bonds-A Issue in 2011 | — | Held-to-maturity financial assets | — | 100,193 | — | 100,736 | Note 3 | |||||||||||||||||||
China Steel Corporation 1st Unsecured Corporate Bonds-A Issue in 2011 | — | Held-to-maturity financial assets | — | 301,113 | — | 302,209 | Note 3 | |||||||||||||||||||
FCFC 1st Unsecured Corporate Bonds Issue in 2011 | — | Held-to-maturity financial assets | — | 299,786 | — | 302,119 | Note 3 | |||||||||||||||||||
TSMC 1st Unsecured Corporate Bond-A Issue in 2011 | — | Held-to-maturity financial assets | — | 100,439 | — | 101,330 | Note 3 | |||||||||||||||||||
TSMC 1st Unsecured Corporate Bond-A Issue in 2011 | — | Held-to-maturity financial assets | — | 299,863 | — | 303,989 | Note 3 | |||||||||||||||||||
Fubon Financial Holding Co., Ltd. 1st Unsecured Corporate Bond issued in 2011 | — | Held-to-maturity financial assets | — | 301,042 | — | 304,825 | Note 3 | |||||||||||||||||||
Fubon Financial Holding Co., Ltd. 1st Unsecured Corporate Bond issued in 2011 | — | Held-to-maturity financial assets | — | 100,324 | — | 101,608 | Note 3 | |||||||||||||||||||
HSBC Bank (Taiwan) Limited 1st Financial Debenture-C Issue in 2011 | — | Held-to-maturity financial assets | — | 200,340 | — | 201,098 | Note 3 | |||||||||||||||||||
HSBC Bank (Taiwan) Limited 1st Financial Debenture-D Issue in 2011 | — | Held-to-maturity financial assets | — | 300,000 | — | 301,087 | Note 3 | |||||||||||||||||||
Formosa Petrochemical Corporation 1st Unsecured Corporate Bonds Issue in 2011 | — | Held-to-maturity financial assets | — | 149,901 | — | 150,639 | Note 3 | |||||||||||||||||||
Formosa Petrochemical Corporation 3rd Unsecured Corporate Bonds Issue in 2011 | — | Held-to-maturity financial assets | — | 199,844 | — | 201,173 | Note 3 | |||||||||||||||||||
Chinese Petroleum Corporation 2nd Unsecured Corporate Bond-A Issue in 2012 | — | Held-to-maturity financial assets | — | 199,872 | — | 201,150 | Note 3 | |||||||||||||||||||
Taiwan Power Co. 1st Unsecured Corporate Bond-A Issue in 2012 | — | Held-to-maturity financial assets | — | 99,944 | — | 99,430 | Note 3 | |||||||||||||||||||
Taiwan Power Co. 1st Unsecured Corporate Bond-A Issue in 2012 | — | Held-to-maturity financial assets | — | 39,978 | — | 39,772 | Note 3 | |||||||||||||||||||
(Continued)
- 69 -
No. | Held Company Name | Marketable Securities Type and Name | Relationship with the | Financial Statement Account | June 30, 2014 | Note | ||||||||||||||||||||
| Shares (Thousands/ Thousand Units) | Carrying Value (Note 1) | Percentage of Ownership | Market Value or Net Asset Value | |||||||||||||||||||||||
Taiwan Power Co. 2nd Unsecured Corporate Bond-A Issue in 2012 | — | Held-to-maturity financial assets | — | 99,942 | — | 100,419 | Note 3 | |||||||||||||||||||
TSMC 1st Unsecured Corporate Bond-A Issue in 2012 | — | Held-to-maturity financial assets | — | 199,897 | — | 201,208 | Note 3 | |||||||||||||||||||
TSMC 1st Unsecured Corporate Bond-A Issue in 2012 | — | Held-to-maturity financial assets | — | 99,948 | — | 100,604 | Note 3 | |||||||||||||||||||
TSMC 1st Unsecured Corporate Bond-A Issue in 2012 | — | Held-to-maturity financial assets | — | 200,194 | — | 201,208 | Note 3 | |||||||||||||||||||
TSMC 2nd Unsecured Corporate Bond-A Issue in 2012 | — | Held-to-maturity financial assets | — | 199,878 | — | 200,959 | Note 3 | |||||||||||||||||||
TSMC 3rd Unsecured Corporate Bond-A Issue in 2012 | — | Held-to-maturity financial assets | — | 199,871 | — | 201,583 | Note 3 | |||||||||||||||||||
KGI Securities Co., Ltd. 1st Unsecured Corporate Bonds in 2012 | — | Held-to-maturity financial assets | — | 300,000 | — | 300,911 | Note 3 | |||||||||||||||||||
Fubon Financial Holding Co., Ltd. 1st Unsecured Corporate Bond-A issued in 2012 | — | Held-to-maturity financial assets | — | 300,000 | — | 302,640 | Note 3 | |||||||||||||||||||
China Development Holding Corporation 1st Unsecured Corporate Bond-A Issue in 2012 | — | Held-to-maturity financial assets | — | $ | 100,050 | — | $ | 100,385 | Note 3 | |||||||||||||||||
China Development Holding Corporation 1st Unsecured Corporate Bond-A Issue in 2012 | — | Held-to-maturity financial assets | — | 150,036 | — | 150,578 | Note 3 | |||||||||||||||||||
China Development Holding Corporation 1st Unsecured Corporate Bond-A Issue in 2012 | — | Held-to-maturity financial assets | — | 100,051 | — | 100,385 | Note 3 | |||||||||||||||||||
Eximbank 19-2nd Unsecured Financial Debentures | — | Held-to-maturity financial assets | — | 150,000 | — | 149,999 | Note 3 | |||||||||||||||||||
| 1 | Senao International Co., Ltd. | Stocks | ||||||||||||||||||||||||
N.T.U. Innovation Incubation Corporation | — | Financial assets carried at cost—noncurrent | 1,200 | 12,000 | 9 | — | — | |||||||||||||||||||
| 2 | CHIEF Telecom Inc. | Stocks | ||||||||||||||||||||||||
3 Link Information Service Co., Ltd. | — | Financial assets carried at cost - noncurrent | 374 | 3,450 | 10 | — | — | |||||||||||||||||||
21Vianet Group. Inc. | — | Available-for-sale financial assets | — | — | — | — | Note 2 | |||||||||||||||||||
| 14 | Chunghwa Investment Co., Ltd. | Stocks | ||||||||||||||||||||||||
Tatung Technology Inc. | — | Financial assets carried at cost - noncurrent | 4,571 | 73,964 | 11 | — | — | |||||||||||||||||||
iD Branding Ventures | — | Financial assets carried at cost - noncurrent | 1,425 | 14,250 | 3 | — | — | |||||||||||||||||||
Uni Display Inc. | — | Financial assets carried at cost - noncurrent | 2,445 | 4,867 | 1 | — | — | |||||||||||||||||||
A2peak Power Co., Ltd. | — | Financial assets carried at cost - noncurrent | 990 | — | 3 | — | — | |||||||||||||||||||
VisEra Technologies Company Ltd. | — | Financial assets carried at cost - noncurrent | 649 | 29,371 | — | — | — | |||||||||||||||||||
Ultra Fine Optical Technology Co., Ltd. | — | Financial assets carried at cost - noncurrent | 1,800 | — | 8 | — | — | |||||||||||||||||||
Aide Energy (Cayman) Holding Co., Ltd. | — | Financial assets carried at cost - noncurrent | 800 | — | 1 | — | — | |||||||||||||||||||
(Continued)
- 70 -
No. | Held Company Name | Marketable Securities Type and Name | Relationship with the | Financial Statement Account | June 30, 2014 | Note | ||||||||||||||||||||
| Shares (Thousands/ Thousand Units) | Carrying Value (Note 1) | Percentage of Ownership | Market Value or Net Asset Value | |||||||||||||||||||||||
Mediapro Technology Ltd. | — | Financial assets carried at cost - noncurrent | 55 | 230 | — | — | — | |||||||||||||||||||
PChome Store Inc. | — | Available-for-sale financial assets - noncurrent | 259 | 59,472 | 2 | 59,472 | Note 2 | |||||||||||||||||||
Tons Lightology Inc. | — | Available-for-sale financial assets - noncurrent | 1,242 | 40,807 | 3 | 40,807 | Note 2 | |||||||||||||||||||
| 27 | Chunghwa Hsingta Co., Ltd. | Stocks | ||||||||||||||||||||||||
Cotech Engineering Fuzhou Corp. | — | Financial assets carried at cost - noncurrent | — | 25,914 | 5 | — | — | |||||||||||||||||||
| Note 1: | Showing at carrying amounts with adjustments for fair value and deducted accumulated impairment; otherwise, showing at their original carrying amounts on amortized cost deducted the accumulated amortization. |
| Note 2: | Market value was based on the closing price of June 30, 2014. |
| Note 3: | Market value of was based on the average trading price on June 30, 2014. |
(Concluded)
- 71 -
TABLE 3
CHUNGHWA TELECOM CO., LTD. AND SUBSIDIARIES
MARKETABLE SECURITIES ACQUIRED AND DISPOSED OF AT COSTS OR PRICES OF AT LEAST NT$300 MILLION OR 20% OF THE PAID-IN CAPITAL
SIX MONTHS ENDED JUNE 30, 2014
(Amounts in Thousands of New Taiwan Dollars, Unless Otherwise Specified)
No. | Company | Marketable | Financial | Counter- party | Nature of Relationship | Beginning Balance | Acquisition | Disposal | Ending Balance | |||||||||||||||||||||||||||||||||||||||||||||
| Shares (Thousands/ Thousand Units) | Amount (Note 1) | Shares (Thousands/ Thousand Units) | Amount | Shares (Thousands/ Thousand Units) | Amount | Carrying Value (Note 1) | Gain (Loss) on Disposal | Shares (Thousands/ Thousand Units) | Amount (Note 1) | |||||||||||||||||||||||||||||||||||||||||||||
| 0 | Chunghwa Telecom Co., Ltd. | Bonds | ||||||||||||||||||||||||||||||||||||||||||||||||||||
| NAN YA Company 1st Unsecured Corporate Bond-A Issue in 2009 | Held-to-maturity financial assets | — | — | — | $
| 300,000 (Note 2 | ) | — | $ | — | — | $ | — | $
| 300,000 (Note 2 | ) | $ | — | — | $ | — | |||||||||||||||||||||||||||||||||
| Formosa Petrochemical Corporation 1st Unsecured Corporate Bonds Issue in 2009 | Held-to-maturity financial assets | — | — | — |
| 350,000 (Note 2 | ) | — | — | — | — |
| 350,000 (Note 2 | ) | — | — | — | |||||||||||||||||||||||||||||||||||||
| Yuanta FHC 1st Unsecured Corporate Bonds-A Issue in 2011 | Held-to-maturity financial assets | — | — | — |
| 300,000 (Note 2 | ) |
| 300,000 (Note 2 | ) | ||||||||||||||||||||||||||||||||||||||||||||
| 1 | Senao International Co., Ltd. | Stocks | ||||||||||||||||||||||||||||||||||||||||||||||||||||
| Senao International (Samoa) Holding Ltd. | Investments accounted for using equity method | — | Subsidiary | 59,175 | (US$ | 1,750,220 59,175 | ) | 12,000 | (US$ | 362,183 12,000 | ) | — | — | — | — | 71,175 | (US$
| 2,112,403 71,175 (Note 3 | ) ) | |||||||||||||||||||||||||||||||||||
| 22 | Senao International (Samoa) Holding Ltd. | Stocks | ||||||||||||||||||||||||||||||||||||||||||||||||||||
| Senao International HK Limited | Investments accounted for using equity method | — | Subsidiary | 58,440 | (US$ | 1,727,221 58,440 | ) | 12,000 | (US$ | 362,183 12,000 | ) | — | — | — | — | 70,440 | (US$
| 2,089,404 70,440 (Note 3 | ) ) | |||||||||||||||||||||||||||||||||||
| Note 1: | Showing at their original carrying amounts without adjustments for fair values. |
| Note 2: | Stated at its nominal amounts. |
| Note 3: | The amount was eliminated upon consolidation. |
- 72 -
TABLE 4
CHUNGHWA TELECOM CO., LTD. AND SUBSIDIARIES
ACQUISITION OF INDIVIDUAL REAL ESTATE PROPERTIES AT COSTS OF AT LEAST NT$300 MILLION OR 20% OF THE PAID-IN CAPITAL
SIX MONTHS ENDED JUNE 30, 2014
(Amounts in Thousands of New Taiwan Dollars)
Company | Types of Property | Transaction Date | Transaction Amount | Payment | Counter- party | Nature of Relationships | Prior Transaction of Related Counterparty | Price Reference | Purpose of Acquisition | Other Terms | ||||||||||||||||||||||||||||||||
| Owner | Relationships | Transfer Date | Amount | |||||||||||||||||||||||||||||||||||||||
Chunghwa Precision Test Tech Co., Ltd. | Land and building | March 6, 2014 | $ | 435,000 | Based on the contract, the amount of which $435,000 thousand was paid in 2014. | Teamyoung Advance Ceramics Co., Ltd. | — | — | — | — | $ | — | In accordance with land appraisal report | Manufacturing purpose | None | |||||||||||||||||||||||||||
- 73 -
TABLE 5
CHUNGHWA TELECOM CO., LTD. AND SUBSIDIARIES
TOTAL PURCHASES FROM OR SALES TO RELATED PARTIES AMOUNTING TO AT LEAST NT$100 MILLION OR 20% OF THE PAID-IN CAPITAL
SIX MONTHS ENDED JUNE 30, 2014
(Amounts in Thousands of New Taiwan Dollars)
No. | Company Name | Related Party | Nature of Relationship | Transaction Details | Abnormal Transaction | Notes/Accounts Payable or Receivable | ||||||||||||||||||||||||||||||
| Purchase/Sale (Note 1) | Amount (Note 2) | % to Total | Payment Terms | Units Price | Payment Terms | Ending Balance (Note 3) | % to Total | |||||||||||||||||||||||||||||
| 0 | Chunghwa Telecom Co., Ltd. | Senao International Co., Ltd. | Subsidiary | Sales | $
| 336,648 (Note 5 | ) | — | 30 days | $ | — | — | $
| 20,518 (Note 5 | ) | — | ||||||||||||||||||||
| Purchase |
| 5,303,818 (Note 5 | ) | 10 | 30-90 days | — | — |
| (1,369,045 (Note 5 | ) ) | (11 | ) | ||||||||||||||||||||||||
Chunghwa System Integration Co., Ltd. | Subsidiary | Purchase |
| 285,569 (Note 5 | ) | 1 | 30 days | — | — |
| (204,288 (Note 5 | ) ) | (2 | ) | ||||||||||||||||||||||
Chunghwa Telecom Global, Inc. | Subsidiary | Purchase |
| 170,928 (Note 5 | ) | — | 90 days | — | — |
| (58,065 (Note 5 | ) ) | — | |||||||||||||||||||||||
CHIEF Telecom Inc. | Subsidiary | Sales |
| 129,168 (Note 5 | ) | — | 60 days | — | — |
| 24,123 (Note 5 | ) | — | |||||||||||||||||||||||
| Purchase |
| 160,597 (Note 5 | ) | — | 30 days | — | — |
| (42,204 (Note 5 | ) ) | — | |||||||||||||||||||||||||
Honghwa International Co. Ltd. | Subsidiary | Purchase |
| 634,785 (Note 5 | ) | 1 | 30 days | — | — |
| (313,665 (Note 5 | ) ) | (2 | ) | ||||||||||||||||||||||
Taiwan International Standard Electronics Co., Ltd. (“TISE”) | Equity-method investee | Purchase | 245,297 | — | 30-90 days | — | — | (412,308 | ) | (3 | ) | |||||||||||||||||||||||||
So-net Entertainment Taiwan Ltd (“So-net”) | Equity-method investee | Sales | 127,606 | — | 60 days | — | — | 19,938 | — | |||||||||||||||||||||||||||
ST-2 Satellite Ventures Pte. Ltd. | Equity-method investee | Purchase | 207,970 | — | 30 days | — | — | (50,886 | ) | — | ||||||||||||||||||||||||||
| 1 | Senao International Co., Ltd. | Chunghwa Telecom Co., Ltd. | Parent company | Sales |
| 5,319,942 (Note 5 | ) | 25 | 30-90 days | — | — |
| 1,373,316 (Note 5 | ) | 59 | |||||||||||||||||||||
| Purchase |
| 213,803 (Note 5 | ) | 1 | 30 days | — | — |
| (5,623 (Note 5 | ) ) | — | |||||||||||||||||||||||||
HopeTech Technologies Limited | Equity-method investee | Purchase | 193,525 | 1 | 30 days | — | — | (20,134 | ) | (1 | ) | |||||||||||||||||||||||||
| 2 | CHIEF Telecom Inc. | Chunghwa Telecom Co., Ltd. | Parent company | Sales |
| 160,597 (Note 5 | ) | 20 | 30 days | — | — |
| 42,204 (Note 5 | ) | 29 | |||||||||||||||||||||
| Purchase |
| 128,899 (Note 5 | ) | 23 | 60 days | — | — |
| (24,123 (Note 5 | ) ) | (26 | ) | ||||||||||||||||||||||||
(Continued)
- 74 -
No. | Company Name | Related Party | Nature of Relationship | Transaction Details | Abnormal Transaction | Notes/Accounts Payable or Receivable | ||||||||||||||||||||||||||||||
| Purchase/Sale (Note 1) | Amount (Note 2) | % to Total | Payment Terms | Units Price | Payment Terms | Ending Balance (Note 3) | % to Total | |||||||||||||||||||||||||||||
| 3 | Chunghwa System Integration Co., Ltd. | Chunghwa Telecom Co., Ltd. | Parent company | Sales | $
| 285,569 (Note 5 | ) | 78 | 30 days | $ | — | — | $
| 201,244 (Note 5 | ) | 68 | ||||||||||||||||||||
| 5 | Chunghwa Telecom Global, Inc. | Chunghwa Telecom Co., Ltd. | Parent company | Sales |
| 170,928 (Note 5 | ) | 67 | 90 days | — | — |
| 58,065 (Note 5 | ) | 77 | |||||||||||||||||||||
| 36 | Honghwa International Co., Ltd. | Chunghwa Telecom Co., Ltd. | Parent company | Sales |
| 669,989 (Note 5 | ) | 100 | 30 days | — | — |
| 313,389 (Note 5 | ) | 100 | |||||||||||||||||||||
| Note 1: | Purchase included acquisition of services cost. |
| Note 2: | The differences were because Chunghwa Telecom Co., Ltd. and subsidiaries classified the amount as inventories, property, plant and equipment, intangible assets, and operating expenses. |
| Note 3: | Notes and accounts receivable did not include the amount as amounts collected for others and other receivables. |
| Note 4: | Transaction terms with the related parties were determined in accordance with mutual agreements when there were no similar transactions with third parties. Other transactions with related parties were not significantly different from those with third parties. |
| Note 5: | The amount was eliminated upon consolidation. |
(Concluded)
- 75 -
TABLE 6
CHUNGHWA TELECOM CO., LTD. AND SUBSIDIARIES
RECEIVABLES FROM RELATED PARTIES AMOUNTING TO AT LEAST NT$100 MILLION OR 20% OF THE PAID-IN CAPITAL
JUNE 30, 2014
(Amounts in Thousands of New Taiwan Dollars)
No. | Company Name | Related Party | Nature of | Ending Balance | Turnover Rate (Note 1) | Overdue | Amounts Received in Subsequent Period | Allowance for Bad Debts | ||||||||||||||||||||||
| Amounts | Action Taken | |||||||||||||||||||||||||||||
| 0 | Chunghwa Telecom Co., Ltd. | Senao International Co., Ltd. | Subsidiary | $
| 224,714 (Note 2 | ) | 13.79 | $ | — | — | $ | 167,161 | $ | — | ||||||||||||||||
| 1 | Senao International Co., Ltd. | Chunghwa Telecom Co., Ltd. | Parent company |
| 1,947,510 (Note 2 | ) | 7.59 | — | — | 1,550,958 | — | |||||||||||||||||||
| 3 | Chunghwa System Integration Co., Ltd. | Chunghwa Telecom Co., Ltd. | Parent company |
| 204,288 (Note 2 | ) | 2.18 | — | — | 109,390 | — | |||||||||||||||||||
| 36 | Honghwa International Co., Ltd. | Chunghwa Telecom Co., Ltd. | Parent company |
| 313,389 (Note 2 | ) | 5.55 | — | — | 161,795 | — | |||||||||||||||||||
| Note 1: | Payments and receipts collected in trust for others are excluded from the accounts receivable for calculating the turnover rate. |
| Note 2: | The amount was eliminated upon consolidation. |
- 76 -
TABLE 7
CHUNGHWA TELECOM CO., LTD. AND SUBSIDIARIES
NAMES, LOCATIONS, AND OTHER INFORMATION OF INVESTEES IN WHICH THE COMPANY EXERCISES SIGNIFICANT INFLUENCE (EXCLUDING INVESTMENT IN MAINLAND CHINA)
SIX MONTHS ENDED JUNE 30, 2014
(Amounts in Thousands of New Taiwan Dollars, Unless Otherwise Specified)
Investor Company | Investee Company | Location | Main Businesses and | Original Investment Amount | Balance as of June 30, 2014 | Net Income (Loss) of the Investee | Recognized Gain (Loss) (Notes 1 and 2) | Note | ||||||||||||||||||||||||||||||
| June 30, 2014 | December 31, 2013 | Shares (Thousands) | Percentage of Ownership (%) | Carrying Value | ||||||||||||||||||||||||||||||||||
Chunghwa Telecom Co., Ltd. | Senao International Co., Ltd. | Taiwan | Selling and maintaining mobile phones and its peripheral products | $ | 1,065,813 | $ | 1,065,813 | 71,773 | 28 | $ | 1,552,418 | $ | 287,038 | $ | 76,862 |
| Subsidiary (Note 5 | ) | ||||||||||||||||||||
Light Era Development Co., Ltd. | Taiwan | Housing, office building development, rent and sale services | 3,000,000 | 3,000,000 | 300,000 | 100 | 3,792,028 | 4,683 | 4,872 |
| Subsidiary (Note 5 | ) | ||||||||||||||||||||||||||
Donghwa Telecom Co., Ltd. | Hong Kong | International telecommunications IP fictitious internet and internet transfer services | 1,567,453 | 1,567,453 | 402,590 | 100 | 1,504,054 | (40,504 | ) | (40,504 | ) |
| Subsidiary (Note 5 | ) | ||||||||||||||||||||||||
Chunghwa Telecom Singapore Pte., Ltd. | Singapore | International telecommunications IP fictitious internet and internet transfer services | 574,112 | 574,112 | 26,383 | 100 | 781,111 | 91,984 | 91,984 |
| Subsidiary (Note 5 | ) | ||||||||||||||||||||||||||
Chunghwa System Integration Co., Ltd. | Taiwan | Providing communication and information aggregative services | 838,506 | 838,506 | 60,000 | 100 | 680,204 | 5,586 | 21,911 |
| Subsidiary (Note 5 | ) | ||||||||||||||||||||||||||
CHIEF Telecom Inc. | Taiwan | Internet communication and internet data center (“IDC”) service | 482,165 | 482,165 | 37,942 | 69 | 582,935 | 109,940 | 77,539 |
| Subsidiary (Note 5 | ) | ||||||||||||||||||||||||||
Chunghwa Investment Co., Ltd. | Taiwan | Investment | 639,559 | 639,559 | 68,085 | 89 | 511,919 | 58,272 | 51,863 |
| Subsidiary (Note 5 | ) | ||||||||||||||||||||||||||
Prime Asia Investments Group Ltd. (B.V.I.) | British Virgin Islands | Investment | 375,273 | 348,089 | 1 | 100 | 280,668 | (14,095 | ) | (14,062 | ) |
| Subsidiary (Note 5 | ) | ||||||||||||||||||||||||
Honghwa International Co., Ltd. | Taiwan | Human resources service | 180,000 | 180,000 | 18,000 | 100 | 206,067 | 14,638 | 14,638 |
| Subsidiary (Note 5 | ) | ||||||||||||||||||||||||||
Chunghwa International Yellow Pages Co., Ltd. | Taiwan | Yellow pages sales and advertisement services | 150,000 | 150,000 | 15,000 | 100 | 172,233 | 8,000 | 8,000 |
| Subsidiary (Note 5 | ) | ||||||||||||||||||||||||||
Spring House Entertainment Tech. Inc. | Taiwan | Network services, producing digital entertainment contents and broadband visual sound terrace development | 62,209 | 62,209 | 7,015 | 56 | 133,049 | 9,977 | 6,301 |
| Subsidiary (Note 5 | ) | ||||||||||||||||||||||||||
Chunghwa Telecom Global, Inc. | United States | International data and internet services and long distance call wholesales to carriers | 70,429 | 70,429 | 6,000 | 100 | 122,645 | 6,291 | 7,418 |
| Subsidiary (Note 5 | ) | ||||||||||||||||||||||||||
Chunghwa Telecom Vietnam Co., Ltd. | Vietnam | Information and communications technology, international circuit, and intelligent energy network service | 148,275 | 103,027 | — | 100 | 127,069 | (453 | ) | (453 | ) |
| Subsidiary (Note 5 | ) | ||||||||||||||||||||||||
Smartfun Digital Co., Ltd. | Taiwan | Software retail | 65,000 | 65,000 | 6,500 | 65 | 53,733 | 5,175 | 3,397 |
| Subsidiary (Note 5 | ) | ||||||||||||||||||||||||||
Chunghwa Telecom Japan Co., Ltd. | Japan | International telecommunications IP fictitious internet and internet transfer services | 17,291 | 17,291 | 1 | 100 | 29,318 | 3,186 | 3,186 |
| Subsidiary (Note 5 | ) | ||||||||||||||||||||||||||
Chunghwa Sochamp Technology Inc. | Taiwan | License plate recognition system | 20,400 | 20,400 | 2,040 | 51 | 6,382 | (17,789 | ) | (7,938 | ) |
| Subsidiary (Note 5 | ) | ||||||||||||||||||||||||
New Prospect Investments Holdings Ltd. (B.V.I.) | British Virgin Islands | Investment | — | — | — | 100 | | Subsidiary (Notes 3 | | |||||||||||||||||||||||||||||
(Continued)
- 77 -
Investor Company | Investee Company | Location | Main Businesses and | Original Investment Amount | Balance as of June 30, 2014 | Net Income (Loss) of the Investee | Recognized Gain (Loss) (Notes 1 and 2) | Note | ||||||||||||||||||||||||||||||
| June 30, 2014 | December 31, 2013 | Shares (Thousands) | Percentage of Ownership (%) | Carrying Value | ||||||||||||||||||||||||||||||||||
International Integrated System, Inc. | Taiwan | IT solution provider, IT application consultation, system integration and package solution | 283,500 | 283,500 | 22,498 | 33 | 283,740 | 11,718 | 4,795 | Associate | ||||||||||||||||||||||||||||
Viettel-CHT Co., Ltd. | Vietnam | IDC services | 288,327 | 288,327 | — | 30 | 256,685 | 41,675 | 12,508 | Associate | ||||||||||||||||||||||||||||
Taiwan International Standard Electronics Co., Ltd. | Taiwan | Manufacturing, selling, designing, and maintaining of telecommunications systems and equipment | 164,000 | 164,000 | 1,760 | 40 | 62,258 | 538,175 | 183,149 | Associate | ||||||||||||||||||||||||||||
Skysoft Co., Ltd. | Taiwan | Providing of music on-line, software, electronic information, and advertisement services | 67,025 | 67,025 | 4,438 | 30 | 118,480 | 75,162 | 23,744 | Associate | ||||||||||||||||||||||||||||
So-net Entertainment Taiwan | Taiwan | Online service and sale of computer hardware | 120,008 | 120,008 | 9,429 | 30 | 97,524 | 17,329 | 5,199 | Associate | ||||||||||||||||||||||||||||
KingWay Technology Co., Ltd. | Taiwan | Publishing books, data processing and software services | 71,770 | 71,770 | 2,879 | 33 | 64,491 | (31,884 | ) | (10,347 | ) | Associate | ||||||||||||||||||||||||||
Alliance Digital Tech Co., Ltd. | Taiwan | Development of mobile payments and information processing service | 30,000 | 30,000 | 3,000 | 19 | 25,350 | (20,685 | ) | (3,757 | ) | Associate | ||||||||||||||||||||||||||
Dian Zuan Integrating Marketing Co., Ltd. | Taiwan | Information technology service and general advertisement service | $ | 97,598 | $ | 48,113 | 5,400 | 18 | $ | 47,940 | $ | (13,780 | ) | $ | (2,109 | ) | Associate | |||||||||||||||||||||
Huada Digital Corporation | Taiwan | Providing software service | 250,000 | 250,000 | 25,000 | 50 | 222,582 | (11,659 | ) | (4,922 | ) | | Jointly controlled entity | | ||||||||||||||||||||||||
Chunghwa Benefit One Co., Ltd. | Taiwan | E-commerce of employee benefits | 50,000 | — | 5,000 | 50 | 45,261 | (9,479 | ) | (4,739 | ) | | Jointly controlled entity | | ||||||||||||||||||||||||
Senao International Co., Ltd. | Senao Networks, Inc. | Taiwan | Telecommunication facilities manufactures and sales | 202,758 | 202,758 | 16,579 | 34 | 636,048 | 285,102 | 97,619 | Associate | |||||||||||||||||||||||||||
Senao International (Samoa) Holding Ltd. | Samoa Islands | International investment | 2,112,403 | 1,750,220 | 71,175 | 100 | 876,635 | (301.868 | ) | (301,427 | ) |
| Subsidiary (Note 5 | ) | ||||||||||||||||||||||||
Dian Zuan Integrating Marketing Co., Ltd. | Taiwan | Information technology service and general advertisement service | 24,000 | — | 2,400 | 8 | 23,756 | 13,780 | (244 | ) | Associate | |||||||||||||||||||||||||||
CHIEF Telecom Inc. | Unigate Telecom Inc. | Taiwan | Telecommunication and internet service. | 2,000 | 2,000 | 200 | 100 | 1,476 | (69 | ) | (69 | ) |
| Subsidiary (Note 5 | ) | |||||||||||||||||||||||
Chief International Corp. | Samoa Islands | Investment | 6,068 | 6,068 | 200 | 100 | 22,374 | 2,623 | 2,623 |
| Subsidiary (Note 5 | ) | ||||||||||||||||||||||||||
Chunghwa System Integrated Co., Ltd. | Concord Technology Co., Ltd. | Brunei | Investment | 47,321 | 47,321 | 1,500 | 100 | 19,072 | (407 | ) | (407 | ) |
| Subsidiary (Note 5 | ) | |||||||||||||||||||||||
Spring House Entertainment Tech. Inc. | Ceylon Innovation Co., Ltd. | Taiwan | International trading, general advertisement and book publishment service | 10,000 | 10,000 | — | 100 | 10,111 | 360 | 360 |
| Subsidiary (Note 5 | ) | |||||||||||||||||||||||||
Light Era Development Co., Ltd. | Yao Yong Real Property Co., Ltd. | Taiwan | Real estate trading and leasing business | 2,793,667 | 2,793,667 | 83,290 | 100 | 2,678,672 | 25,050 | 16,930 |
| Subsidiary (Note 5 | ) | |||||||||||||||||||||||||
Chunghwa Telecom Singapore Pte., Ltd. | ST-2 Satellite Ventures Pte., Ltd. | Singapore | Operation of ST-2 telecommunication satellite | 409,061 | 409,061 | 18,102 | 38 | 579,064 | 172,423 | 90,175 | Associate | |||||||||||||||||||||||||||
Chunghwa Investment Co., Ltd. | Chunghwa Precision Test Tech Co., Ltd. | Taiwan | Semiconductor testing components and printed circuit board industry production and marketing of electronic products | 91,875 | 91,875 | 10,936 | 51 | 169,728 | 47,132 | 23,901 |
| Subsidiary (Note 5 | ) | |||||||||||||||||||||||||
Chunghwa Investment Holding Co., Ltd. | Brunei | Investment | 46,035 | 46,035 | 1,432 | 100 | 15,502 | (1,037 | ) | (1,037 | ) |
| Subsidiary (Note 5 | ) | ||||||||||||||||||||||||
Panda Monium Company Ltd. | Cayman | The production of animation | 20,000 | 20,000 | 602 | 43 | — | — | — | Associate | ||||||||||||||||||||||||||||
CHIEF Telecom Inc. | Taiwan | Internet communication and internet data center (“IDC”) service | 20,000 | 20,000 | 2,000 | 4 | 27,516 | 109,940 | 4,206 |
| Associate (Note 5 | ) | ||||||||||||||||||||||||||
Senao International Co., Ltd. | Taiwan | Selling and maintaining mobile phones and its peripheral products | 49,731 | 49,731 | 1,001 | — | 33,855 | 287,038 | 667 |
| Associate (Note 5 | ) | ||||||||||||||||||||||||||
Chunghwa Precision Test Tech. Co., Ltd. | Chunghwa Precision Test Tech. USA Corporation | United States | Semiconductor testing components and printed circuit board industry production and marketing of electronic products | 12,504 | 12,504 | 400 | 100 | 8,682 | (3,954 | ) | (3,954 | ) |
| Subsidiary (Note 5 | ) | |||||||||||||||||||||||
(Continued)
- 78 -
Investor Company | Investee Company | Location | Main Businesses and | Original Investment Amount | Balance as of June 30, 2014 | Net Income (Loss) of the Investee | Recognized Gain (Loss) (Notes 1 and 2) | Note | ||||||||||||||||||||||||||||||
| June 30, 2014 | December 31, 2013 | Shares (Thousands) | Percentage of Ownership (%) | Carrying Value | ||||||||||||||||||||||||||||||||||
CHPT Japan Co., Ltd. | Japan | Sale and maintenance of electronic parts and machinery processed products, and design of printed circuit board | 2,008 | 2,008 | 600 | 100 | 1,865 | 57 | 57 |
| Subsidiary (Note 5 | ) | ||||||||||||||||||||||||||
Chunghwa Precision Test Tech. International, Ltd. | Samoa Islands | Electronic materials wholesale and retail and investments | 2,957 | 2,957 | 100 | 100 | 2,673 | (373 | ) | (373 | ) |
| Subsidiary (Note 5 | ) | ||||||||||||||||||||||||
Prime Asia Investments Group, | Chunghwa Hsingta Co., Ltd. | Hong Kong | Investment | 375,273 | 348,089 | 1 | 100 | 270,658 | (14,097 | ) | (14,097 | ) |
| Subsidiary (Note 5 | ) | |||||||||||||||||||||||
Ltd. (B.V.I.) | MeWorks LIMITED (HK) | Hong Kong | Investment | 10,000 | — | — | 20 | 10,029 | — | — | Associate | |||||||||||||||||||||||||||
Senao International (Samoa) Holding Ltd. | Senao International HK Limited | Hong Kong | International investment. | 2,089,405 | 1,727,221 | 70,440 | 100 | 847,313 | (303,638 | ) | (303,638 | ) |
| Subsidiary (Note 5 | ) | |||||||||||||||||||||||
HopeTech Technologies Limited | Hong Kong | Information technology and telecommunication products sales. | 21,177 | 21,177 | 5,240 | 45 | 29,762 | 3,966 | 1,785 | Associate | ||||||||||||||||||||||||||||
Chunghwa Investment Holding Co., Ltd. | CHI One Investment Co., Limited | Hong Kong | Investment | 26,035 | 26,035 | 6,520 | 100 | — | — | — |
| Subsidiary (Note 5 | ) | |||||||||||||||||||||||||
| Note 1: | The equity in net income (loss) of investees was based on reviewed financial statements. |
| Note 2: | The equity in net income (loss) of investees includes amortization of differences between the investment cost and net value and elimination of unrealized transactions. |
| Note 3: | New Prospect Investments Holdings Ltd. (B.V.I.) was incorporated in March 2006, but have not yet begun operation as of June 30, 2014. |
| Note 4: | Investment in mainland China is included in Table 8. |
| Note 5: | The amount was eliminated upon consolidation. |
(Concluded)
- 79 -
TABLE 8
CHUNGHWA TELECOM CO., LTD. AND SUBSIDIARIES
INVESTMENT IN MAINLAND CHINA
SIX MONTHS ENDED JUNE 30, 2014
(Amounts in Thousands of New Taiwan Dollars)
Investee | Main | Total Amount of Paid- in Capital | Investment Type (Note 1) | Accumulated Outflow of Investment from Taiwan as of January 1, 2014 | Investment Flows | Accumulated Outflow of Investment from Taiwan as of June 30, 2014 | Net Income (Loss) of the Investee | % Ownership of Direct or Indirect Investment | Investment Gain (Loss) (Note 2) | Carrying Value as of June 30, 2014 | Accumulated Inward Remittance of Earnings as of June 30, 2014 | Note | ||||||||||||||||||||||||||||||||||||||
| Outflow | Inflow | |||||||||||||||||||||||||||||||||||||||||||||||||
Glory Network System Service (Shanghai) Co., Ltd. | Providing advanced business solutions to telecommunications | $ | 47,321 | 2 | $ | 47,321 | $ | — | $ | — | $ | 47,321 | $ | (407 | ) | 100 | $ | (407 | ) | $ | 19,072 | $ | — | Note 6 | ||||||||||||||||||||||||||
Xiamen Sertec Business Technology Co., Ltd. | Customer services and platform rental activities | 51,552 | 2 | 25,414 | — | — | 25,414 | (3,212 | ) | 49 | (1,574 | ) | 5,064 | — | ||||||||||||||||||||||||||||||||||||
Senao Trading (Fujian) Co., Ltd. | Information technology services and sale of communication products | 951,262 | 2 | 709,528 | 241,734 | — | 951,262 | (136,793 | ) | 100 | (136,793 | ) | 425,972 | — | Note 6 | |||||||||||||||||||||||||||||||||||
Senao International Trading (Shanghai) Co., Ltd. | Information technology services and sale of communication products | 773,504 | 2 | 653,055 | 120,449 | — | 773,504 | (148,825 | ) | 100 | (148,825 | ) | 256,268 | — | Note 6 | |||||||||||||||||||||||||||||||||||
Information technology services and sale of communication products | 87,540 | 2 | 87,540 | — | — | 87,540 | (3,465 | ) | 100 | (3,465 | ) | 74,878 | — | Note 6 | ||||||||||||||||||||||||||||||||||||
Senao International Trading (Jiangsu) Co., Ltd. | Information technology services and sale of communication products | 263,736 | 2 | 263,736 | — | — | 263,736 | (14,549 | ) | 100 | (14,549 | ) | 86,869 | — | Note 6 | |||||||||||||||||||||||||||||||||||
Chunghwa Telecom (China) Co., Ltd. | Energy conserving and providing installation, design and maintenance services | 177,176 | 2 | 177,176 | — | — | 177,176 | (12,178 | ) | 100 | (12,178 | ) | 86,680 | — | Note 6 | |||||||||||||||||||||||||||||||||||
Jiangsu Zhenghua Information Technology Company, LLC | Intelligent energy serving and intelligent building services | 189,410 | 2 | 142,057 | — | — | 142,057 | (2,916 | ) | 75 | (2,188 | ) | 132,251 | — | Note 6 | |||||||||||||||||||||||||||||||||||
(Continued)
- 80 -
Investee | Main | Total Amount of Paid- in Capital | Investment Type (Note 1) | Accumulated Outflow of Investment from Taiwan as of January 1, 2014 | Investment Flows | Accumulated Outflow of Investment from Taiwan as of June 30, 2014 | Net Income (Loss) of the Investee | % Ownership of Direct or Indirect Investment | Investment Gain (Loss) (Note 2) | Carrying Value as of June 30, 2014 | Accumulated Inward Remittance of Earnings as of June 30, 2014 | Note | ||||||||||||||||||||||||||||||||||||||
| Outflow | Inflow | |||||||||||||||||||||||||||||||||||||||||||||||||
Hua-Xiong Information Technology Co., Ltd. | Intelligent system and energy saving system services in buildings | 56,386 | 2 | 28,855 | — | — | 28,855 | 528 | 51 | 269 | 25,813 | — | Note 6 | |||||||||||||||||||||||||||||||||||||
Shanghai Taihua Electronic Technology Limited (“STET”) | Design of printed circuit board and related consultation service | 2,970 | 2 | — | 2,970 | — | 2,970 | (367 | ) | 100 | (367 | ) | 2,674 | — | Note 6 | |||||||||||||||||||||||||||||||||||
(Continued)
- 81 -
Investee | Accumulated Investment in Mainland China as of June 30, 2014 | Investment Amounts Authorized by Investment Commission, MOEA | Upper Limit on Investment Stipulated by Investment Commission, MOEA | |||||||||
Glory Network System Service (Shanghai) Co., Ltd. (Note 3) | $ | 47,321 | $ | 47,321 | $ | 390,237 | ||||||
Xiamen Sertec Business Technology Co., Ltd. (Note 4) | 25,414 | 79,882 | 496,004 | |||||||||
SENAO and its subsidiaries (Note 5) | 2,076,042 | 2,796,994 | — | |||||||||
Chunghwa Telecom (China) Co., Ltd. (Note 5) | 177,176 | 177,176 | — | |||||||||
Jiangsu Zhenghua Information Technology Company, LLC (Note 5) | 142,057 | 142,057 | — | |||||||||
Hua-Xiong Information Technology Co., Ltd. (Note 5) | 28,855 | 44,653 | — | |||||||||
Shanghai Taihua Electronic Technology Limited (“STET”) (Note 4) | 2,970 | 2,970 | 496,004 | |||||||||
| Note 1: | Investments were through an holding company registered in a third region. |
| Note 2: | Recognition of investment gains (losses) was calculated based on the investee’s reviewed financial statements. |
| Note 3: | The amount was calculated based on the net assets value of Chunghwa System Integration Co., Ltd. |
| Note 4: | The amount was calculated based on the consolidated net assets value of Chunghwa Investment Co., Ltd. |
| Note 5: | Based on “Principle of investment or Technical Cooperation in Mainland China”, Chunghwa and Senao is not subjective to the limited amount due to the operating headquarters documents issued by Industrial Development Bureau. |
| Note 6: | The amount was eliminated upon consolidation. |
(Concluded)
- 82 -
TABLE 9
CHUNGHWA TELECOM CO., LTD. AND SUBSIDIARIES
INTERCOMPANY RELATIONSHIPS AND SIGNIFICANT TRANSACTIONS
SIX MONTHS ENDED JUNE 30, 2014
(Amounts in Thousands of New Taiwan Dollars)
Year | No. (Note 1) | Company Name | Related Party | Nature of Relationship (Note 2) | Transaction Details | |||||||||||||||||||||
Financial Statement Account | Amount (Note 5) | Payment Terms (Note 3) | % to Total Sales or Assets (Note 4) | |||||||||||||||||||||||
2014 | 0 | Chunghwa Telecom Co., Ltd. | Senao International Co., Ltd. | 1 | Accounts receivable | $ | 20,518 | — | �� | — | ||||||||||||||||
| Accrued custodial receipts | 204,196 | — | — | |||||||||||||||||||||||
| Accounts payable | 1,369,045 | — | — | |||||||||||||||||||||||
| Amounts collected for others | 578,696 | — | — | |||||||||||||||||||||||
| Revenues | 336,648 | — | — | |||||||||||||||||||||||
| Operating costs and expenses | 5,303,818 | — | — | |||||||||||||||||||||||
| Non-operating expense and losses | 53 | — | — | |||||||||||||||||||||||
| Customer’s deposits | 1,054 | — | — | |||||||||||||||||||||||
| CHIEF Telecom Inc. | 1 | Accounts receivable | 24,123 | — | — | |||||||||||||||||||||
| Accounts payable | 42,204 | — | — | |||||||||||||||||||||||
| Amounts collected for others | 2,958 | — | — | |||||||||||||||||||||||
| Revenues | 129,168 | — | — | |||||||||||||||||||||||
| Operating costs and expenses | 160,597 | — | — | |||||||||||||||||||||||
| Customer’s deposits | 177 | — | — | |||||||||||||||||||||||
| Chunghwa Precision Test Tech. Co., Ltd. | 1 | Accounts receivable | 20 | — | — | |||||||||||||||||||||
| Accounts payable | 1 | |||||||||||||||||||||||||
| Revenues | 1,239 | — | — | |||||||||||||||||||||||
| Operating costs and expenses | 40 | — | — | |||||||||||||||||||||||
| Chunghwa International Yellow Pages Co., Ltd. | 1 | Accounts receivable | 5,196 | — | — | |||||||||||||||||||||
| Accrued custodial receipts | 4,036 | — | — | |||||||||||||||||||||||
| Accounts payable | 8,221 | — | — | |||||||||||||||||||||||
| Amounts collected for others | 17,369 | — | — | |||||||||||||||||||||||
| Revenues | 12,418 | — | — | |||||||||||||||||||||||
| Operating costs and expenses | 23,778 | — | — | |||||||||||||||||||||||
| Chunghwa System Integration Co., Ltd. | 1 | Accounts receivable | 6,186 | — | — | |||||||||||||||||||||
| Accrued custodial receipts | 4,304 | — | — | |||||||||||||||||||||||
| Prepaid expenses | 11,710 | — | — | |||||||||||||||||||||||
| Accounts payable | 204,288 | — | — | |||||||||||||||||||||||
| Revenues | 6,126 | — | — | |||||||||||||||||||||||
| Non-operating income and gains | 1,058 | — | — | |||||||||||||||||||||||
| Operating costs and expenses | 285,569 | — | — | |||||||||||||||||||||||
| Work in process | 138,616 | — | — | |||||||||||||||||||||||
| Customer’s deposits | 7,706 | — | — | |||||||||||||||||||||||
| Chunghwa Telecom Global Inc. | 1 | Accounts receivable | 9,392 | — | — | |||||||||||||||||||||
| Accounts payable | 58,065 | — | — | |||||||||||||||||||||||
| Revenues | 21,371 | — | — | |||||||||||||||||||||||
| Operating costs and expenses | 170,928 | — | — | |||||||||||||||||||||||
| Customer’s deposits | 14,651 | — | — | |||||||||||||||||||||||
(Continued)
- 83 -
Year | No. (Note 1) | Company | Related Party | Nature of Relationship (Note 2) | Transaction Details | |||||||||||||||||||
Financial Statement Account | Amount (Note 5) | Payment Terms (Note 3) | % to Total Sales or Assets (Note 4) | |||||||||||||||||||||
| Donghwa Telecom Co., Ltd. | 1 | Accounts receivable | $ | 40,618 | — | — | ||||||||||||||||||
| Accounts payable | 56,470 | — | — | |||||||||||||||||||||
| Revenues | 74,442 | — | — | |||||||||||||||||||||
| Operating costs and expenses | 36,570 | — | — | |||||||||||||||||||||
| Spring House Entertainment Inc. | 1 | Accounts receivable | 4,070 | — | — | |||||||||||||||||||
| Accounts payable | 27,879 | — | — | |||||||||||||||||||||
| Amounts collected for others | 18,223 | — | — | |||||||||||||||||||||
| Revenues | 28,456 | — | — | |||||||||||||||||||||
| Operating costs and expenses | 37,071 | — | — | |||||||||||||||||||||
| Customer’s deposits | 5 | — | — | |||||||||||||||||||||
| Chunghwa Telecom Japan Co., Ltd | 1 | Accounts receivable | 3,015 | — | — | |||||||||||||||||||
| Accounts payable | 6,253 | — | — | |||||||||||||||||||||
| Revenues | 6,483 | — | — | |||||||||||||||||||||
| Operating costs and expenses | 35,984 | — | — | |||||||||||||||||||||
| Light Era Development Co., Ltd. | 1 | Accounts payable | 313 | — | — | |||||||||||||||||||
| Revenues | 1,603 | — | — | |||||||||||||||||||||
| Work in process | 9,036 | — | — | |||||||||||||||||||||
| Customer’s deposits | 80 | — | — | |||||||||||||||||||||
| Chunghwa Telecom Singapore Pte., Ltd. | 1 | Accounts receivable | 6,058 | — | — | |||||||||||||||||||
| Accounts payable | 6,074 | — | — | |||||||||||||||||||||
| Revenues | 34,843 | — | — | |||||||||||||||||||||
| Operating costs and expenses | 30,058 | — | — | |||||||||||||||||||||
| Chunghwa Investment Co., Ltd. | 1 | Revenues | 597 | — | — | |||||||||||||||||||
| Chunghwa Telecom (China) Co., Ltd. | 1 | Accounts payable | 721 | — | — | |||||||||||||||||||
| Operating costs and expenses | 4,243 | — | — | |||||||||||||||||||||
| Smartfun Digital Co., Ltd. | 1 | Accounts receivable | 1,194 | — | — | |||||||||||||||||||
| Amounts collected for others | 4,109 | — | — | |||||||||||||||||||||
| Revenues | 2,298 | — | — | |||||||||||||||||||||
| Non-operating income and gains | 56 | — | — | |||||||||||||||||||||
| Customer’s deposits | 20 | — | — | |||||||||||||||||||||
| Chunghwa Telecom Vietnam Co., Ltd. | 1 | Accounts receivable | 1 | — | — | |||||||||||||||||||
| Accounts payable | 3,244 | |||||||||||||||||||||||
| Revenues | 4 | — | — | |||||||||||||||||||||
| Operating costs and expenses | 3,986 | — | — | |||||||||||||||||||||
| Chunghwa Sochamp Technology Inc. | 1 | Accounts payable | 37,265 | — | — | |||||||||||||||||||
| Revenues | 174 | — | — | |||||||||||||||||||||
| Work in process | 23,811 | — | — | |||||||||||||||||||||
| Customer’s deposits | 95 | — | — | |||||||||||||||||||||
| Chief International Corp | 1 | Accounts receivable | 5,325 | — | — | |||||||||||||||||||
| Accounts payable | 3,493 | — | — | |||||||||||||||||||||
| Honghwa International Co., Ltd. | 1 | Accounts payable | 313,665 | — | — | |||||||||||||||||||
| Revenues | 2,155 | — | — | |||||||||||||||||||||
| Operating costs and expenses | 634,785 | — | — | |||||||||||||||||||||
| Customer’s deposits | 92 | |||||||||||||||||||||||
(Continued)
- 84 -
Year | No. (Note 1) | Company | Related Party | Nature of Relationship (Note 2) | Transaction Details | |||||||||||||||||||||
Financial Statement Account | Amount (Note 5) | Payment Terms (Note 3) | % to Total Sales or Assets (Note 4) | |||||||||||||||||||||||
| 1 | Senao International Co., Ltd. | Light Era Development Co., Ltd. | 3 | Revenues | $ | 40 | — | — | ||||||||||||||||||
| Spring House Entertainment Inc. | 3 | Revenues | 82 | — | — | |||||||||||||||||||||
| Smartfun Digital Co., Ltd. | 3 | Revenues | 19 | — | — | |||||||||||||||||||||
| Non-operating income and gains | 116 | |||||||||||||||||||||||||
| 2 | CHIEF Telecom Inc. | Chunghwa System Integration Co., Ltd. | 3 | Accounts receivable | 1 | — | — | |||||||||||||||||||
| Revenues | 8 | — | — | |||||||||||||||||||||||
| Chunghwa Telecom Singapore Pte., Ltd. | 3 | Accounts receivable | 1,486 | — | — | |||||||||||||||||||||
| Revenues | 3,752 | — | — | |||||||||||||||||||||||
| Spring House Entertainment Inc. | 3 | Accounts receivable | 15 | — | — | |||||||||||||||||||||
| Revenues | 1,077 | |||||||||||||||||||||||||
| Donghwa Telecom Co., Ltd. | 3 | Accounts receivable | 70 | — | — | |||||||||||||||||||||
| Revenues | 405 | |||||||||||||||||||||||||
| 3 | Chunghwa System Integration Co., Ltd. | Chunghwa Precision Test Tech. Co., Ltd. | 3 | Revenues | 119 | — | — | |||||||||||||||||||
| Chunghwa International Yellow Pages Co., Ltd. | 3 | Revenues | 118 | |||||||||||||||||||||||
| Light Era Development Co., Ltd. | 3 | Revenues | 119 | — | — | |||||||||||||||||||||
| Chunghwa Sochamp Technology Inc. | 3 | Revenues | 17 | |||||||||||||||||||||||
| Honghwa International Co., Ltd. | 3 | Revenues | 125 | — | ||||||||||||||||||||||
| 5 | Chunghwa Telecom Global, Inc. | CHIEF Telecom Inc. | 3 | Revenues | 5 | — | — | |||||||||||||||||||
| Donghwa Telecom Co., Ltd. | 3 | Accounts receivable | 294 | — | — | |||||||||||||||||||||
| Revenues | 1,732 | — | — | |||||||||||||||||||||||
| Chunghwa Telecom Singapore Pte., Ltd | 3 | Accounts receivable | 40,767 | — | — | |||||||||||||||||||||
| Revenues | 2,931 | — | — | |||||||||||||||||||||||
| Chunghwa Precision Test Tech. Co., Ltd. | 3 | Accounts receivable | 84 | — | — | |||||||||||||||||||||
| Non-operating income and gains | 197 | — | — | |||||||||||||||||||||||
| 6 | Donghwa Telecom Co., Ltd. | Chunghwa Telecom Singapore Pte., Ltd. | 3 | Prepaid expenses | 20,166 | — | — | |||||||||||||||||||
| 7 | Spring House Entertainment Inc. | Smartfun Digital Co., Ltd. | 3 | Prepaid expenses | 93 | — | — | |||||||||||||||||||
| 8 | Light Era Development Co., Ltd. | CHIEF Telecom Inc. | 3 | Revenues | 43,352 | — | — | |||||||||||||||||||
| Chunghwa Precision Test Tech. Co., Ltd. | 3 | Revenues | 476 | — | — | |||||||||||||||||||||
| 9 | Chunghwa Telecom Singapore Pte., Ltd. | CHIEF Telecom Inc. | 3 | Accounts receivable | 1,294 | — | — | |||||||||||||||||||
| Revenues | 4,244 | — | — | |||||||||||||||||||||||
| Chunghwa Telecom Global, Inc. | 3 | Accounts receivable | 40,283 | — | — | |||||||||||||||||||||
| Revenues | 10,622 | — | — | |||||||||||||||||||||||
| Chunghwa Telecom Japan Co., Ltd. | 3 | Revenues | 247 | — | — | |||||||||||||||||||||
| Donghwa Telecom Co., Ltd. | 3 | Accounts receivable | 742 | — | — | |||||||||||||||||||||
| Revenues | 6,363 | — | — | |||||||||||||||||||||||
| 31 | Smartfun Digital Co., Ltd. | Spring House Entertainment Inc. | 3 | Revenues | 2,223 | — | — | |||||||||||||||||||
(Continued)
- 85 -
| Note 1: | Significant transactions between the Company and its subsidiaries or among subsidiaries are numbered as follows: |
| a. | “0” for the Company. |
| b. | Subsidiaries are numbered from “1”. |
| Note 2: | Related party transactions are divided into three categories as follows: |
| 1. | The Company to subsidiaries. |
| 2. | Subsidiaries to the Company. |
| 3. | Subsidiaries to subsidiaries. |
| Note 3: | Transaction terms were determined in accordance with mutual agreements. |
| Note 4: | For assets and liabilities, amount is shown as a percentage to consolidated total assets as of June 30, 2014, while revenues, costs and expenses are shown as a percentage to consolidated total operating revenues for the six months ended June 30, 2014. |
| Note 5: | The amount was eliminated upon consolidation. |
(Concluded)
- 86 -