Exhibit 99.2
Chunghwa Telecom Co., Ltd. and
Subsidiaries
Consolidated Financial Statements for the
Six Months Ended June 30, 2016 and 2015 and
Independent Auditors’ Review Report
INDEPENDENT AUDITORS’ REVIEW REPORT
The Board of Directors and Stockholders
Chunghwa Telecom Co., Ltd.
We have reviewed the accompanying consolidated balance sheets of Chunghwa Telecom Co., Ltd. and subsidiaries (“the Company”) as of June 30, 2016 and 2015, and the related consolidated statements of comprehensive income for the three months ended June 30, 2016 and 2015, and for the six months ended June 30, 2016 and 2015, as well as the consolidated statements of changes in equity and cash flows for the six months ended June 30, 2016 and 2015. These consolidated financial statements are the responsibility of the Company’s management. Our responsibility is to issue a report on these consolidated financial statements based on our review.
We conducted our reviews in accordance with the Statement of Auditing Standards No. 36, “Review of Financial Statements”, issued by the Auditing Committee of the Accounting Research and Development Foundation of the Republic of China. A review consists principally of applying analytical procedures to financial data and making inquiries of persons responsible for financial and accounting matters. It is substantially less in scope than an audit conducted in accordance with auditing standards generally accepted in the Republic of China, the objective of which is the expression of an opinion regarding the financial statements taken as a whole. Accordingly, we do not express such an audit opinion.
Based on our reviews, we are not aware of any material modifications that should be made to the consolidated financial statements referred to above for them to be in conformity with the Regulations Governing the Preparation of Financial Reports by Securities Issuers and International Accounting Standard 34, “Interim Financial Reporting” endorsed by the Financial Supervisory Commission of the Republic of China.
/s/ DELOITTE & TOUCHE |
| Deloitte & Touche |
| Taipei, Taiwan |
| The Republic of China |
August 9, 2016
Notice to Readers
The accompanying consolidated financial statements are intended only to present the financial position, financial performance and cash flows in accordance with accounting principles and practices generally accepted in the Republic of China and not those of any other jurisdictions. The standards, procedures and practices to review such consolidated financial statements are those generally accepted and applied in the Republic of China.
For the convenience of readers, the auditors’ review report and the accompanying consolidated financial statements have been translated into English from the original Chinese version prepared and used in the Republic of China. If there is any conflict between the English version and the original Chinese version or any difference in the interpretation of the two versions, the Chinese-language auditors’ review report and consolidated financial statements shall prevail.
- 1 -
CHUNGHWA TELECOM CO., LTD. AND SUBSIDIARIES
CONSOLIDATED BALANCE SHEETS
(In Thousands of New Taiwan Dollars)
| June 30, 2016 (Reviewed) | December 31, 2015 (Audited) | June 30, 2015 (Reviewed) | ||||||||||||||||||||||
| Amount | % | Amount | % | Amount | % | |||||||||||||||||||
ASSETS | ||||||||||||||||||||||||
CURRENT ASSETS | ||||||||||||||||||||||||
Cash and cash equivalents (Note 6) | $ | 44,643,353 | 10 | $ | 30,271,423 | 7 | $ | 34,284,519 | 7 | |||||||||||||||
Financial assets at fair value through profit or loss (Note 7) | 52 | — | 163 | — | 1,216 | — | ||||||||||||||||||
Hedging derivative assets (Note 21) | — | — | 498 | — | — | — | ||||||||||||||||||
Available-for-sale financial assets (Note 8) | 29,927 | — | — | — | — | — | ||||||||||||||||||
Held-to-maturity financial assets (Note 9) | 2,892,164 | 1 | 1,880,739 | — | 2,903,450 | 1 | ||||||||||||||||||
Trade notes and accounts receivable, net (Note 10) | 29,837,792 | 6 | 26,926,050 | 6 | 27,551,809 | 6 | ||||||||||||||||||
Accounts receivable from related parties (Note 39) | 30,184 | — | 42,056 | — | 21,638 | — | ||||||||||||||||||
Inventories (Notes 11 and 40) | 6,912,878 | 1 | 8,780,190 | 2 | 6,712,831 | 1 | ||||||||||||||||||
Prepayments (Notes 12 and 39) | 6,275,098 | 1 | 2,669,021 | 1 | 5,791,572 | 1 | ||||||||||||||||||
Other current monetary assets (Note 13) | 4,785,275 | 1 | 3,300,783 | 1 | 14,879,526 | 3 | ||||||||||||||||||
Other current assets (Notes 20 and 40) | 3,100,229 | 1 | 2,335,921 | — | 2,493,865 | 1 | ||||||||||||||||||
|
|
|
|
|
|
|
|
|
|
|
| |||||||||||||
Total current assets | 98,506,952 | 21 | 76,206,844 | 17 | 94,640,426 | 20 | ||||||||||||||||||
|
|
|
|
|
|
|
|
|
|
|
| |||||||||||||
NONCURRENT ASSETS | ||||||||||||||||||||||||
Available-for-sale financial assets (Note 8) | 2,635,930 | 1 | 3,242,827 | 1 | 3,554,836 | 1 | ||||||||||||||||||
Held-to-maturity financial assets (Note 9) | 899,853 | — | 2,139,801 | — | 3,799,162 | 1 | ||||||||||||||||||
Financial assets carried at cost (Note 14) | 2,239,973 | — | 2,267,869 | 1 | 2,386,928 | — | ||||||||||||||||||
Investments accounted for using equity method (Note 16) | 2,699,129 | 1 | 3,145,004 | 1 | 2,862,920 | 1 | ||||||||||||||||||
Property, plant and equipment (Notes 17, 39 and 40) | 287,805,345 | 62 | 296,399,146 | 65 | 295,149,385 | 64 | ||||||||||||||||||
Investment properties (Note 18) | 7,893,036 | 2 | 7,902,405 | 2 | 7,665,842 | 2 | ||||||||||||||||||
Intangible assets (Note 19) | 48,862,820 | 10 | 50,446,778 | 11 | 41,411,701 | 9 | ||||||||||||||||||
Deferred income tax assets (Note 3) | 1,054,168 | — | 2,061,577 | — | 1,907,745 | — | ||||||||||||||||||
Net defined benefit assets (Notes 3 and 28) | 2,956,410 | 1 | 10,677 | — | 8,773 | — | ||||||||||||||||||
Prepayments (Notes 12 and 39) | 3,411,132 | 1 | 3,611,818 | 1 | 3,484,321 | 1 | ||||||||||||||||||
Other noncurrent assets (Notes 20 and 40) | 5,147,214 | 1 | 5,586,346 | 1 | 5,243,246 | 1 | ||||||||||||||||||
|
|
|
|
|
|
|
|
|
|
|
| |||||||||||||
Total noncurrent assets | 365,605,010 | 79 | 376,814,248 | 83 | 367,474,859 | 80 | ||||||||||||||||||
|
|
|
|
|
|
|
|
|
|
|
| |||||||||||||
TOTAL | $ | 464,111,962 | 100 | $ | 453,021,092 | 100 | $ | 462,115,285 | 100 | |||||||||||||||
|
|
|
|
|
|
|
|
|
|
|
| |||||||||||||
LIABILITIES AND EQUITY | ||||||||||||||||||||||||
CURRENT LIABILITIES | ||||||||||||||||||||||||
Short-term loans (Note 22) | $ | 60,000 | — | $ | 110,000 | — | $ | 860,000 | — | |||||||||||||||
Financial liabilities at fair value through profit or loss (Note 7) | 14,583 | — | — | — | 2,218 | — | ||||||||||||||||||
Hedging derivative liabilities (Note 21) | 3,430 | — | — | — | — | — | ||||||||||||||||||
Trade notes and accounts payable (Note 24) | 15,261,297 | 3 | 16,300,993 | 4 | 15,318,154 | 3 | ||||||||||||||||||
Payables to related parties (Note 39) | 444,002 | — | 611,100 | — | 431,842 | — | ||||||||||||||||||
Current tax liabilities (Note 3) | 3,188,613 | 1 | 4,751,181 | 1 | 4,419,564 | 1 | ||||||||||||||||||
Dividends payables (Note 29) | 42,551,146 | 9 | — | — | 37,673,263 | 8 | ||||||||||||||||||
Other payables (Note 25) | 22,470,290 | 5 | 25,486,966 | 6 | 20,181,807 | 5 | ||||||||||||||||||
Provisions (Note 26) | 118,160 | — | 189,746 | — | 253,430 | — | ||||||||||||||||||
Advance receipts (Note 27) | 9,029,223 | 2 | 9,567,140 | 2 | 9,616,451 | 2 | ||||||||||||||||||
Current portion of long-term loans (Notes 23 and 40) | — | — | 7,692 | — | 2,564 | — | ||||||||||||||||||
Other current liabilities | 1,363,414 | — | 1,501,269 | — | 1,488,911 | 1 | ||||||||||||||||||
|
|
|
|
|
|
|
|
|
|
|
| |||||||||||||
Total current liabilities | 94,504,158 | 20 | 58,526,087 | 13 | 90,248,204 | 20 | ||||||||||||||||||
|
|
|
|
|
|
|
|
|
|
|
| |||||||||||||
NONCURRENT LIABILITIES | ||||||||||||||||||||||||
Long-term loans (Notes 23 and 40) | 1,600,000 | — | 1,742,308 | — | 1,797,436 | — | ||||||||||||||||||
Deferred income tax liabilities (Note 3) | 665,505 | — | 147,975 | — | 108,050 | — | ||||||||||||||||||
Provisions (Note 26) | 58,630 | — | 58,158 | — | 49,175 | — | ||||||||||||||||||
Customers’ deposits (Note 39) | 4,560,724 | 1 | 4,725,826 | 1 | 4,654,717 | 1 | ||||||||||||||||||
Net defined benefit liabilities (Notes 3 and 28) | 1,373,219 | — | 7,098,510 | 2 | 6,671,082 | 2 | ||||||||||||||||||
Deferred revenue | 3,515,431 | 1 | 3,615,602 | 1 | 3,571,946 | 1 | ||||||||||||||||||
Other noncurrent liabilities | 3,276,955 | 1 | 3,097,623 | 1 | 1,981,341 | — | ||||||||||||||||||
|
|
|
|
|
|
|
|
|
|
|
| |||||||||||||
Total noncurrent liabilities | 15,050,464 | 3 | 20,486,002 | 5 | 18,833,747 | 4 | ||||||||||||||||||
|
|
|
|
|
|
|
|
|
|
|
| |||||||||||||
Total liabilities | 109,554,622 | 23 | 79,012,089 | 18 | 109,081,951 | 24 | ||||||||||||||||||
|
|
|
|
|
|
|
|
|
|
|
| |||||||||||||
EQUITY ATTRIBUTABLE TO STOCKHOLDERS OF THE PARENT (Notes 15 and 29) | ||||||||||||||||||||||||
Common stocks | 77,574,465 | 17 | 77,574,465 | 17 | 77,574,465 | 17 | ||||||||||||||||||
|
|
|
|
|
|
|
|
|
|
|
| |||||||||||||
Additional paid-in capital | 168,542,466 | 36 | 168,095,615 | 37 | 168,064,890 | 36 | ||||||||||||||||||
|
|
|
|
|
|
|
|
|
|
|
| |||||||||||||
Retained earnings | ||||||||||||||||||||||||
Legal reserve | 77,574,465 | 17 | 77,574,465 | 17 | 77,574,465 | 17 | ||||||||||||||||||
Special reserve | 2,675,419 | 1 | 2,675,419 | 1 | 2,675,419 | — | ||||||||||||||||||
Unappropriated earnings | 22,729,414 | 5 | 42,551,245 | 9 | 21,574,425 | 5 | ||||||||||||||||||
|
|
|
|
|
|
|
|
|
|
|
| |||||||||||||
Total retained earnings | 102,979,298 | 23 | 122,801,129 | 27 | 101,824,309 | 22 | ||||||||||||||||||
|
|
|
|
|
|
|
|
|
|
|
| |||||||||||||
Other equity interest | (409,488 | ) | — | 268,719 | — | 478,092 | — | |||||||||||||||||
|
|
|
|
|
|
|
|
|
|
|
| |||||||||||||
Total equity attributable to stockholders of the parent | 348,686,741 | 76 | 368,739,928 | 81 | 347,941,756 | 75 | ||||||||||||||||||
NONCONTROLLING INTERESTS (Notes 15 and 29) | 5,870,599 | 1 | 5,269,075 | 1 | 5,091,578 | 1 | ||||||||||||||||||
|
|
|
|
|
|
|
|
|
|
|
| |||||||||||||
Total equity | 354,557,340 | 77 | 374,009,003 | 82 | 353,033,334 | 76 | ||||||||||||||||||
|
|
|
|
|
|
|
|
|
|
|
| |||||||||||||
TOTAL | $ | 464,111,962 | 100 | $ | 453,021,092 | 100 | $ | 462,115,285 | 100 | |||||||||||||||
|
|
|
|
|
|
|
|
|
|
|
| |||||||||||||
The accompanying notes are an integral part of the consolidated financial statements.
- 2 -
CHUNGHWA TELECOM CO., LTD. AND SUBSIDIARIES
CONSOLIDATED STATEMENTS OF COMPREHENSIVE INCOME
(In Thousands of New Taiwan Dollars, Except Earnings Per Share)
(Reviewed, Not Audited)
| For the Three Months Ended June 30 | For the Six Months Ended June 30 | |||||||||||||||||||||||||||||||
| 2016 | 2015 | 2016 | 2015 | |||||||||||||||||||||||||||||
| Amount | % | Amount | % | Amount | % | Amount | % | |||||||||||||||||||||||||
REVENUES (Notes 30 and 39) | $ | 56,195,429 | 100 | $ | 56,920,593 | 100 | $ | 113,139,585 | 100 | $ | 113,393,400 | 100 | ||||||||||||||||||||
OPERATING COSTS (Notes 11, 28, 31 and 39) | 35,253,226 | 63 | 35,710,904 | 63 | 70,358,878 | 62 | 72,406,785 | 64 | ||||||||||||||||||||||||
|
|
|
|
|
|
|
|
|
|
|
|
|
|
|
| |||||||||||||||||
GROSS PROFIT | 20,942,203 | 37 | 21,209,689 | 37 | 42,780,707 | 38 | 40,986,615 | 36 | ||||||||||||||||||||||||
|
|
|
|
|
|
|
|
|
|
|
|
|
|
|
| |||||||||||||||||
OPERATING EXPENSES (Notes 28, 31 and 39) | ||||||||||||||||||||||||||||||||
Marketing | 6,008,327 | 11 | 6,026,364 | 11 | 12,004,520 | 11 | 12,008,969 | 11 | ||||||||||||||||||||||||
General and administrative | 1,103,703 | 2 | 1,104,653 | 2 | 2,254,274 | 2 | 2,249,777 | 2 | ||||||||||||||||||||||||
Research and development | 943,737 | 1 | 866,651 | 1 | 1,845,710 | 1 | 1,701,778 | 1 | ||||||||||||||||||||||||
|
|
|
|
|
|
|
|
|
|
|
|
|
|
|
| |||||||||||||||||
Total operating expenses | 8,055,767 | 14 | 7,997,668 | 14 | 16,104,504 | 14 | 15,960,524 | 14 | ||||||||||||||||||||||||
|
|
|
|
|
|
|
|
|
|
|
|
|
|
|
| |||||||||||||||||
OTHER INCOME AND EXPENSES (Note 31) | (10,692 | ) | — | (14,662 | ) | — | (17,042 | ) | — | (43,782 | ) | — | ||||||||||||||||||||
|
|
|
|
|
|
|
|
|
|
|
|
|
|
|
| |||||||||||||||||
INCOME FROM OPERATIONS | 12,875,744 | 23 | 13,197,359 | 23 | 26,659,161 | 24 | 24,982,309 | 22 | ||||||||||||||||||||||||
|
|
|
|
|
|
|
|
|
|
|
|
|
|
|
| |||||||||||||||||
NON-OPERATING INCOME AND EXPENSES | ||||||||||||||||||||||||||||||||
Interest income | 55,481 | — | 94,805 | — | 104,044 | — | 162,102 | — | ||||||||||||||||||||||||
Other income (Notes 31 and 39) | 404,996 | 1 | 270,707 | 1 | 770,651 | 1 | 523,391 | 1 | ||||||||||||||||||||||||
Other gains and losses (Notes 31 and 39) | 2,827 | — | (194,512 | ) | — | 7,002 | — | (68,254 | ) | — | ||||||||||||||||||||||
Interest expenses | (4,446 | ) | — | (6,845 | ) | — | (9,636 | ) | — | (15,502 | ) | — | ||||||||||||||||||||
Share of the profit of associates and joint ventures accounted for using equity method (Note 16) | 155,627 | — | 188,364 | — | 242,925 | — | 488,890 | — | ||||||||||||||||||||||||
|
|
|
|
|
|
|
|
|
|
|
|
|
|
|
| |||||||||||||||||
Total non-operating income and expenses | 614,485 | 1 | 352,519 | 1 | 1,114,986 | 1 | 1,090,627 | 1 | ||||||||||||||||||||||||
|
|
|
|
|
|
|
|
|
|
|
|
|
|
|
| |||||||||||||||||
INCOME BEFORE INCOME TAX | 13,490,229 | 24 | 13,549,878 | 24 | 27,774,147 | 25 | 26,072,936 | 23 | ||||||||||||||||||||||||
INCOME TAX EXPENSE (Notes 3 and 32) | 2,157,132 | 4 | 2,187,266 | 4 | 4,513,740 | 4 | 4,142,531 | 4 | ||||||||||||||||||||||||
|
|
|
|
|
|
|
|
|
|
|
|
|
|
|
| |||||||||||||||||
NET INCOME | 11,333,097 | 20 | 11,362,612 | 20 | 23,260,407 | 21 | 21,930,405 | 19 | ||||||||||||||||||||||||
|
|
|
|
|
|
|
|
|
|
|
|
|
|
|
| |||||||||||||||||
TOTAL OTHER COMPREHENSIVE INCOME (LOSS) | ||||||||||||||||||||||||||||||||
Items that will not be reclassified to profit or loss: | ||||||||||||||||||||||||||||||||
Share of remeasurements of defined benefit pension plans of associates and joint ventures (Note 16) | — | — | — | — | — | — | (265 | ) | — | |||||||||||||||||||||||
|
|
|
|
|
|
|
|
|
|
|
|
|
|
|
| |||||||||||||||||
Items that may be reclassified subsequently to profit or loss: | ||||||||||||||||||||||||||||||||
Exchange differences arising from the translation of the foreign operations | (6,116 | ) | — | (55,626 | ) | — | (89,198 | ) | — | (85,028 | ) | — | ||||||||||||||||||||
Unrealized loss on available-for-sale financial assets (Note 31) | (482,950 | ) | (1 | ) | (761,656 | ) | (1 | ) | (606,970 | ) | (1 | ) | (333,466 | ) | — | |||||||||||||||||
Cash flow hedges (Notes 21 and 31) | (5,148 | ) | — | — | — | (3,927 | ) | — | 283 | — | ||||||||||||||||||||||
(Continued)
- 3 -
CHUNGHWA TELECOM CO., LTD. AND SUBSIDIARIES
CONSOLIDATED STATEMENTS OF COMPREHENSIVE INCOME
(In Thousands of New Taiwan Dollars, Except Earnings Per Share)
(Reviewed, Not Audited)
| For the Three Months Ended June 30 | For the Six Months Ended June 30 | |||||||||||||||||||||||||||||||
| 2016 | 2015 | 2016 | 2015 | |||||||||||||||||||||||||||||
| Amount | % | Amount | % | Amount | % | Amount | % | |||||||||||||||||||||||||
Share of exchange differences arising from the translation of the foreign operations of associates and joint ventures (Note 16) | $ | 218 | — | $ | (426 | ) | — | $ | (1,374 | ) | — | $ | 449 | — | ||||||||||||||||||
Income tax benefit (expense) relating to items that may be reclassified subsequently (Note 32) | 972 | — | (484 | ) | — | (352 | ) | — | (3,812 | ) | — | |||||||||||||||||||||
|
|
|
|
|
|
|
|
|
|
|
|
|
|
|
| |||||||||||||||||
| (493,024 | ) | (1 | ) | (818,192 | ) | (1 | ) | (701,821 | ) | (1 | ) | (421,574 | ) | — | ||||||||||||||||||
|
|
|
|
|
|
|
|
|
|
|
|
|
|
|
| |||||||||||||||||
Total other comprehensive loss, net of income tax | (493,024 | ) | (1 | ) | (818,192 | ) | (1 | ) | (701,821 | ) | (1 | ) | (421,839 | ) | — | |||||||||||||||||
|
|
|
|
|
|
|
|
|
|
|
|
|
|
|
| |||||||||||||||||
TOTAL COMPREHENSIVE INCOME | $ | 10,840,073 | 19 | $ | 10,544,420 | 19 | $ | 22,558,586 | 20 | $ | 21,508,566 | 19 | ||||||||||||||||||||
|
|
|
|
|
|
|
|
|
|
|
|
|
|
|
| |||||||||||||||||
NET INCOME ATTRIBUTABLE TO | ||||||||||||||||||||||||||||||||
Stockholders of the parent | $ | 11,061,548 | 20 | $ | 11,133,809 | 20 | $ | 22,729,315 | 21 | $ | 21,552,234 | 19 | ||||||||||||||||||||
Noncontrolling interests | 271,549 | — | 228,803 | — | 531,092 | — | 378,171 | — | ||||||||||||||||||||||||
|
|
|
|
|
|
|
|
|
|
|
|
|
|
|
| |||||||||||||||||
| $ | 11,333,097 | 20 | $ | 11,362,612 | 20 | $ | 23,260,407 | 21 | $ | 21,930,405 | 19 | |||||||||||||||||||||
|
|
|
|
|
|
|
|
|
|
|
|
|
|
|
| |||||||||||||||||
COMPREHENSIVE INCOME ATTRIBUTABLE TO | ||||||||||||||||||||||||||||||||
Stockholders of the parent | $ | 10,582,673 | 19 | $ | 10,323,518 | 18 | $ | 22,051,108 | 20 | $ | 21,143,914 | 19 | ||||||||||||||||||||
Noncontrolling interests | 257,400 | — | 220,902 | 1 | 507,478 | — | 364,652 | — | ||||||||||||||||||||||||
|
|
|
|
|
|
|
|
|
|
|
|
|
|
|
| |||||||||||||||||
| $ | 10,840,073 | 19 | $ | 10,544,420 | 19 | $ | 22,558,586 | 20 | $ | 21,508,566 | 19 | |||||||||||||||||||||
|
|
|
|
|
|
|
|
|
|
|
|
|
|
|
| |||||||||||||||||
EARNINGS PER SHARE (Note 33) | ||||||||||||||||||||||||||||||||
Basic | $ | 1.43 | $ | 1.44 | $ | 2.93 | $ | 2.78 | ||||||||||||||||||||||||
|
|
|
|
|
|
|
| |||||||||||||||||||||||||
Diluted | $ | 1.43 | $ | 1.43 | $ | 2.93 | $ | 2.77 | ||||||||||||||||||||||||
|
|
|
|
|
|
|
| |||||||||||||||||||||||||
| The accompanying notes are an integral part of the consolidated financial statements. | (Concluded | ) |
- 4 -
CHUNGHWA TELECOM CO., LTD. AND SUBSIDIARIES
CONSOLIDATED STATEMENTS OF CHANGES IN EQUITY
(In Thousands of New Taiwan Dollars)
(Reviewed, Not Audited)
| Equity Attributable to Stockholders of the Parent (Notes 15, 21 and 29) | ||||||||||||||||||||||||||||||||||||||||||||
| Other Adjustments | ||||||||||||||||||||||||||||||||||||||||||||
Exchange Differences Translation of the | Unrealized Gain (Loss) on Available-for-sale | |||||||||||||||||||||||||||||||||||||||||||
| Retained Earnings | Noncontrolling Interests | |||||||||||||||||||||||||||||||||||||||||||
| Common Stock | Additional Paid-in Capital | Legal Reserve | Special Reserve | Unappropriated Earnings | Cash Flow Hedges | Total | Total Equity | |||||||||||||||||||||||||||||||||||||
BALANCE, JANUARY 1, 2015 | $ | 77,574,465 | $ | 168,047,935 | $ | 76,893,722 | $ | 2,819,899 | $ | 38,231,982 | $ | 146,442 | $ | 739,988 | $ | (283 | ) | $ | 364,454,150 | $ | 5,085,185 | $ | 369,539,335 | |||||||||||||||||||||
Appropriation of 2014 earnings | ||||||||||||||||||||||||||||||||||||||||||||
Legal reserve | — | — | 680,743 | — | (680,743 | ) | — | — | — | — | — | — | ||||||||||||||||||||||||||||||||
Special reserve | — | — | — | (144,005 | ) | 144,005 | — | — | — | — | — | — | ||||||||||||||||||||||||||||||||
Cash dividends distributed by Chunghwa | — | — | — | — | (37,673,263 | ) | — | — | — | (37,673,263 | ) | — | (37,673,263 | ) | ||||||||||||||||||||||||||||||
Cash dividends distributed by subsidiaries | — | — | — | — | — | — | — | — | — | (354,400 | ) | (354,400 | ) | |||||||||||||||||||||||||||||||
Reversal of special reserve recognized from land disposal | — | — | — | (475 | ) | 475 | — | — | — | — | — | — | ||||||||||||||||||||||||||||||||
Change in additional paid-in capital from investments in associates and joint ventures accounted for using equity method | — | (908 | ) | — | — | — | — | — | — | (908 | ) | (2,007 | ) | (2,915 | ) | |||||||||||||||||||||||||||||
Partial disposal of interests in subsidiaries | — | 26,644 | — | — | — | — | — | — | 26,644 | 18,484 | 45,128 | |||||||||||||||||||||||||||||||||
Net income for the six months ended June 30, 2015 | — | — | — | — | 21,552,234 | — | — | — | 21,552,234 | 378,171 | 21,930,405 | |||||||||||||||||||||||||||||||||
Other comprehensive income (loss) for the six months ended June 30, 2015 | — | — | — | — | (265 | ) | (69,012 | ) | (339,326 | ) | 283 | (408,320 | ) | (13,519 | ) | (421,839 | ) | |||||||||||||||||||||||||||
|
|
|
|
|
|
|
|
|
|
|
|
|
|
|
|
|
|
|
|
|
| |||||||||||||||||||||||
Total comprehensive income for the six months ended June 30, 2015 | — | — | — | — | 21,551,969 | (69,012 | ) | (339,326 | ) | 283 | 21,143,914 | 364,652 | 21,508,566 | |||||||||||||||||||||||||||||||
|
|
|
|
|
|
|
|
|
|
|
|
|
|
|
|
|
|
|
|
|
| |||||||||||||||||||||||
Compensation cost of employee stock option of a subsidiary | — | — | — | — | — | — | — | — | — | 28,962 | 28,962 | |||||||||||||||||||||||||||||||||
Subsidiary purchases its treasury stock | — | (8,781 | ) | — | — | — | — | — | — | (8,781 | ) | (49,298 | ) | (58,079 | ) | |||||||||||||||||||||||||||||
|
|
|
|
|
|
|
|
|
|
|
|
|
|
|
|
|
|
|
|
|
| |||||||||||||||||||||||
BALANCE, JUNE 30, 2015 | $ | 77,574,465 | $ | 168,064,890 | $ | 77,574,465 | $ | 2,675,419 | $ | 21,574,425 | $ | 77,430 | $ | 400,662 | $ | — | $ | 347,941,756 | $ | 5,091,578 | $ | 353,033,334 | ||||||||||||||||||||||
|
|
|
|
|
|
|
|
|
|
|
|
|
|
|
|
|
|
|
|
|
| |||||||||||||||||||||||
BALANCE, JANUARY 1, 2016 | $ | 77,574,465 | $ | 168,095,615 | $ | 77,574,465 | $ | 2,675,419 | $ | 42,551,245 | $ | 177,257 | $ | 90,964 | $ | 498 | $ | 368,739,928 | $ | 5,269,075 | $ | 374,009,003 | ||||||||||||||||||||||
Appropriation of 2015 earnings | ||||||||||||||||||||||||||||||||||||||||||||
Cash dividends distributed by Chunghwa | — | — | — | — | (42,551,146 | ) | — | — | — | (42,551,146 | ) | — | (42,551,146 | ) | ||||||||||||||||||||||||||||||
Cash dividends distributed by subsidiaries | — | — | — | — | — | — | — | — | — | (709,971 | ) | (709,971 | ) | |||||||||||||||||||||||||||||||
Change in additional paid-in capital from investments in associates and joint ventures accounted for using equity method | — | (1,101 | ) | — | — | — | — | — | — | (1,101 | ) | 718 | (383 | ) | ||||||||||||||||||||||||||||||
Partial disposal of interests in subsidiaries | — | 58,206 | — | — | — | — | — | — | 58,206 | 25,422 | 83,628 | |||||||||||||||||||||||||||||||||
Change in additional paid-in capital for not participating in the capital increase of a subsidiary | — | 389,740 | — | — | — | — | — | — | 389,740 | 785,769 | 1,175,509 | |||||||||||||||||||||||||||||||||
Net income for the six months ended June 30, 2016 | — | — | — | — | 22,729,315 | — | — | — | 22,729,315 | 531,092 | 23,260,407 | |||||||||||||||||||||||||||||||||
Other comprehensive income (loss) for the six months ended June 30, 2016 | — | — | — | — | — | (66,770 | ) | (607,510 | ) | (3,927 | ) | (678,207 | ) | (23,614 | ) | (701,821 | ) | |||||||||||||||||||||||||||
|
|
|
|
|
|
|
|
|
|
|
|
|
|
|
|
|
|
|
|
|
| |||||||||||||||||||||||
Total comprehensive income for the six months ended June 30, 2016 | — | — | — | — | 22,729,315 | (66,770 | ) | (607,510 | ) | (3,927 | ) | 22,051,108 | 507,478 | 22,558,586 | ||||||||||||||||||||||||||||||
|
|
|
|
|
|
|
|
|
|
|
|
|
|
|
|
|
|
|
|
|
| |||||||||||||||||||||||
Share-based payment transactions of subsidiaries | — | 6 | — | — | — | — | — | — | 6 | 11,311 | 11,317 | |||||||||||||||||||||||||||||||||
Decrease in noncontrolling interests | — | — | — | — | — | — | — | — | — | (19,203 | ) | (19,203 | ) | |||||||||||||||||||||||||||||||
|
|
|
|
|
|
|
|
|
|
|
|
|
|
|
|
|
|
|
|
|
| |||||||||||||||||||||||
BALANCE, JUNE 30, 2016 | $ | 77,574,465 | $ | 168,542,466 | $ | 77,574,465 | $ | 2,675,419 | $ | 22,729,414 | $ | 110,487 | $ | (516,546 | ) | $ | (3,429 | ) | $ | 348,686,741 | $ | 5,870,599 | $ | 354,557,340 | ||||||||||||||||||||
|
|
|
|
|
|
|
|
|
|
|
|
|
|
|
|
|
|
|
|
|
| |||||||||||||||||||||||
The accompanying notes are an integral part of the consolidated financial statements.
- 5 -
CHUNGHWA TELECOM CO., LTD. AND SUBSIDIARIES
CONSOLIDATED STATEMENTS OF CASH FLOWS
(In Thousands of New Taiwan Dollars)
(Reviewed, Not Audited)
| For The Six Months Ended June 30 | ||||||||
| 2016 | 2015 | |||||||
CASH FLOWS FROM OPERATING ACTIVITIES | ||||||||
Income before income tax | $ | 27,774,147 | $ | 26,072,936 | ||||
Adjustments to reconcile income before income tax to net cash provided by operating activities: | ||||||||
Depreciation | 14,600,295 | 15,414,664 | ||||||
Amortization | 1,652,029 | 1,539,430 | ||||||
Provision for doubtful accounts | 356,857 | 189,959 | ||||||
Interest expenses | 9,636 | 15,502 | ||||||
Interest income | (104,044 | ) | (162,102 | ) | ||||
Dividend income | (341,339 | ) | (218,172 | ) | ||||
Compensation cost of share-based payment transactions | 11,317 | 28,962 | ||||||
Share of the profit of associates and joint ventures accounted for using equity method | (242,925 | ) | (488,890 | ) | ||||
Gain on disposal of investments accounted for using equity method | — | (8,058 | ) | |||||
Impairment loss on available-for-sale financial assets | — | 25,910 | ||||||
Provision for inventory and obsolescence | 156,944 | 91,356 | ||||||
Loss (gain) on disposal of financial instruments | (19 | ) | 240 | |||||
Loss on disposal of property, plant and equipment | 17,042 | 43,762 | ||||||
Loss on disposal of intangible assets | — | 20 | ||||||
Valuation loss on financial assets and liabilities at fair value through profit or loss, net | 14,545 | 1,002 | ||||||
Gain on foreign exchange, net | (23,334 | ) | (5,874 | ) | ||||
Changes in operating assets and liabilities: | ||||||||
Decrease (increase) in: | ||||||||
Financial assets held for trading | 149 | 1,142 | ||||||
Trade notes and accounts receivable | (3,273,181 | ) | (1,494,289 | ) | ||||
Accounts receivable from related parties | 11,872 | 59,370 | ||||||
Inventories | 1,710,368 | 292,322 | ||||||
Prepayments | (3,405,391 | ) | (3,327,097 | ) | ||||
Other current monetary assets | (345,014 | ) | (254,280 | ) | ||||
Other current assets | (764,308 | ) | 725,534 | |||||
Increase (decrease) in: | ||||||||
Trade notes and accounts payable | (1,034,215 | ) | (3,191,146 | ) | ||||
Payables to related parties | (167,098 | ) | 23,877 | |||||
Other payables | (2,905,061 | ) | (2,233,733 | ) | ||||
Provisions | (71,114 | ) | 30,571 | |||||
Advance receipts | (405,721 | ) | (296,413 | ) | ||||
Other current liabilities | 1,923 | (125,674 | ) | |||||
Deferred revenue | (100,171 | ) | 173,859 | |||||
Net defined benefit plans | (8,671,024 | ) | 201,192 | |||||
|
|
|
| |||||
Cash generated from operations | 24,463,165 | 33,125,882 | ||||||
(Continued)
- 6 -
CHUNGHWA TELECOM CO., LTD. AND SUBSIDIARIES
CONSOLIDATED STATEMENTS OF CASH FLOWS
(In Thousands of New Taiwan Dollars)
(Reviewed, Not Audited)
| For The Six Months Ended June 30 | ||||||||
| 2016 | 2015 | |||||||
Interest paid | $ | (9,671 | ) | $ | (15,569 | ) | ||
Income tax paid | (4,551,720 | ) | (3,195,027 | ) | ||||
|
|
|
| |||||
Net cash provided by operating activities | 19,901,774 | 29,915,286 | ||||||
|
|
|
| |||||
CASH FLOWS FROM INVESTING ACTIVITIES | ||||||||
Acquisition of available-for-sale financial assets | (30,000 | ) | — | |||||
Acquisition of time deposits and negotiable certificate of deposits with maturities of more than three months | (1,600,000 | ) | (11,448,339 | ) | ||||
Proceeds from disposal of time deposits and negotiable certificate of deposits with maturities of more than three months | 1,489,458 | 553,677 | ||||||
Acquisition of held-to-maturity financial assets | — | (1,002,167 | ) | |||||
Proceeds from disposal of held-to-maturity financial assets | 225,000 | 1,775,000 | ||||||
Acquisition of financial assets carried at cost | (6,388 | ) | (22,338 | ) | ||||
Proceeds from disposal of financial assets carried at cost | 877 | 966 | ||||||
Proceeds from capital reduction of financial assets carried at cost | 32,667 | — | ||||||
Acquisition of investments accounted for using equity method | — | (5,607 | ) | |||||
Proceeds from disposal of investments accounted for using equity method | — | 10,847 | ||||||
Acquisition of property, plant and equipment | (6,820,968 | ) | (10,320,391 | ) | ||||
Proceeds from disposal of property, plant and equipment | 5,842 | 1,286 | ||||||
Acquisition of intangible assets | (66,760 | ) | (126,593 | ) | ||||
Decrease in other noncurrent assets | 422,042 | 361,789 | ||||||
Interest received | 95,939 | 138,565 | ||||||
Cash dividends received | — | 405,702 | ||||||
|
|
|
| |||||
Net cash used in investing activities | (6,252,291 | ) | (19,677,603 | ) | ||||
|
|
|
| |||||
CASH FLOWS FROM FINANCING ACTIVITIES | ||||||||
Proceeds from short-term loans | 10,000 | 2,750,000 | ||||||
Repayment of short-term loans | (60,000 | ) | (2,454,400 | ) | ||||
Repayment of long-term loans | (150,000 | ) | (100,000 | ) | ||||
Decrease in customers’ deposits | (304,880 | ) | (107,203 | ) | ||||
Increase in other noncurrent liabilities | 47,136 | 466,393 | ||||||
Partial disposal of interests in subsidiaries without losing control | 83,628 | 45,128 | ||||||
Cash dividends distributed to noncontrolling interests | (11,415 | ) | — | |||||
Change in other noncontrolling interests | 1,156,306 | (35,254 | ) | |||||
|
|
|
| |||||
Net cash provided by financing activities | 770,775 | 564,664 | ||||||
|
|
|
| |||||
EFFECT OF EXCHANGE RATE CHANGES ON CASH AND CASH EQUIVALENTS | (48,328 | ) | (77,431 | ) | ||||
|
|
|
| |||||
NET INCREASE IN CASH AND CASH EQUIVALENTS | 14,371,930 | 10,724,916 | ||||||
CASH AND CASH EQUIVALENTS, BEGINNING OF PERIOD | 30,271,423 | 23,559,603 | ||||||
|
|
|
| |||||
CASH AND CASH EQUIVALENTS, END OF PERIOD | $ | 44,643,353 | $ | 34,284,519 | ||||
|
|
|
| |||||
| The accompanying notes are an integral part of the consolidated financial statements. | (Concluded) |
- 7 -
CHUNGHWA TELECOM CO., LTD. AND SUBSIDIARIES
NOTES TO CONSOLIDATED FINANCIAL STATEMENTS
FOR THE SIX MONTHS ENDED JUNE 30, 2016 AND 2015
(In Thousands of New Taiwan Dollars, Unless Stated Otherwise)
(Reviewed, Not Audited)
| 1. | GENERAL |
Chunghwa Telecom Co., Ltd. (“Chunghwa”) was incorporated on July 1, 1996 in the Republic of China (“ROC”) pursuant to the Article 30 of the Telecommunications Act. Chunghwa is a company limited by shares and, prior to August 2000, was wholly owned by the Ministry of Transportation and Communications (“MOTC”). Prior to July 1, 1996, the current operations of Chunghwa were carried out under the Directorate General of Telecommunications (“DGT”). The DGT was established by the MOTC in June 1943 to take primary responsibility in the development of telecommunications infrastructure and to formulate policies related to telecommunications. On July 1, 1996, the telecom operations of the DGT were spun-off as Chunghwa which continues to carry out the business and the DGT continues to be the industry regulator.
As the dominant telecommunications service provider of domestic and international fixed-line, Global System for Mobile Communications (“GSM”), and Third Generation (“3G”) in the ROC, Chunghwa is subject to additional regulations imposed by the ROC.
Effective August 12, 2005, the MOTC completed the process of privatizing Chunghwa by reducing the government ownership to below 50% in various stages. In July 2000, Chunghwa received approval from the Securities and Futures Commission (the “SFC”) for a domestic initial public offering and its common stocks were listed and traded on the Taiwan Stock Exchange (the “TWSE”) on October 27, 2000. Certain of Chunghwa’s common stocks were sold, in connection with the foregoing privatization plan, in domestic public offerings at various dates from August 2000 to July 2003. Certain of Chunghwa’s common stocks were also sold in an international offering of securities in the form of American Depository Shares (“ADS”) on July 17, 2003 and were listed and traded on the New York Stock Exchange (the “NYSE”). The MOTC sold common stocks of Chunghwa by auction in the ROC on August 9, 2005 and completed the second international offering on August 10, 2005. Upon completion of the share transfers associated with these offerings on August 12, 2005, the MOTC owned less than 50% of the outstanding shares of Chunghwa and completed the privatization plan.
Chunghwa together with its subsidiaries are hereinafter referred to collectively as the “Company”.
The consolidated financial statements are presented in Chunghwa’s functional currency, New Taiwan dollars.
| 2. | APPROVAL OF FINANCIAL STATEMENTS |
The consolidated financial statements were approved and authorized for issue by the Board of Directors on August 9, 2016.
| 3. | SUMMARY OF SIGNIFICANT ACCOUNTING POLICIES |
Except for the following, the accounting policies applied in these consolidated financial statements are consistent with those applied in the consolidated financial statements for the year ended December 31, 2015. Please refer to the consolidated financial statements for the year ended December 31, 2015 for the details.
- 8 -
Statement of Compliance
The accompanying consolidated financial statements have been prepared in accordance with the Regulations Governing the Preparation of Financial Reports by Securities Issuers and International Auditing Standard 34 “Interim Financial Reporting” as endorsed by the Financial Supervisory Commission (the “FSC”). The consolidated financial statements do not present all the disclosures required for a complete set of annual consolidated financial statements.
Basis of Consolidation
The detail information of the subsidiaries at the end of reporting period was as follows:
| Percentage of Ownership | ||||||||||||
| Name of Investor | Name of Investee | Main Businesses and Products | June 30, 2016 | December 31, 2015 | June 30, 2015 | Note | ||||||
Chunghwa Telecom Co., Ltd. | Senao International Co., Ltd. (“SENAO”) | Handset and peripherals retailer; sales of CHT mobile phone plans as an agent | 29 | 29 | 28 | a. | ||||||
Light Era Development Co., Ltd. (“LED”) | Planning and development of real estate and intelligent buildings, and property management | 100 | 100 | 100 | ||||||||
Donghwa Telecom Co., Ltd. (“DHT”) | International private leased circuit, IP VPN service, and IP transit services | 100 | 100 | 100 | ||||||||
Chunghwa Telecom Singapore Pte., Ltd. (“CHTS”) | International private leased circuit, IP VPN service, and IP transit services | 100 | 100 | 100 | ||||||||
Chunghwa System Integration Co., Ltd. (“CHSI”) | Providing system integration services and telecommunication equipment | 100 | 100 | 100 | ||||||||
Chunghwa Investment Co., Ltd. (“CHI”) | Investment | 89 | 89 | 89 | ||||||||
CHIEF Telecom Inc. (“CHIEF”) | Network integration, internet data center (“IDC”), communications integration and cloud application services | 69 | 69 | 69 | ||||||||
Chunghwa International Yellow Pages Co., Ltd. (“CHYP”) | Digital information supply services and advertisement services | 100 | 100 | 100 | ||||||||
Prime Asia Investments Group Ltd. (B.V.I.) (“Prime Asia”) | Investment | 100 | 100 | 100 | ||||||||
Spring House Entertainment Tech. Inc. (“SHE”) | Digital entertainment contents production, animated character licensing and endorsement, and mobile digital platform construction | 56 | 56 | 56 | ||||||||
Chunghwa Telecom Global, Inc. (“CHTG”) | International private leased circuit, internet services, and transit services | 100 | 100 | 100 | ||||||||
Chunghwa Telecom Vietnam Co., Ltd. (“CHTV”) | Intelligent energy saving solutions, international circuit, and information and communication technology (“ICT”) services. | 100 | 100 | 100 | ||||||||
Smartfun Digital Co., Ltd. (“SFD”) | Providing diversified family education digital services | 65 | 65 | 65 | ||||||||
Chunghwa Telecom Japan Co., Ltd. (“CHTJ”) | International private leased circuit, IP VPN service, and IP transit services | 100 | 100 | 100 | ||||||||
Chunghwa Sochamp Technology Inc. (“CHST”) | Design, development and production of Automatic License Plate Recognition software and hardware | 51 | 51 | 51 | ||||||||
Honghwa International Co., Ltd. (“HHI”) | Telecommunication engineering, sales agent of mobile phone plan application and other business services | 100 | 100 | 100 | ||||||||
New Prospect Investments Holdings Ltd. (B.V.I.) (“New Prospect”) | Investment | 100 | 100 | 100 | ||||||||
Senao International Co., Ltd. | Senao International (Samoa) Holding Ltd. (“SIS”) | International investment | 100 | 100 | 100 | |||||||
Youth Co., Ltd. (“Youth”) | Sale of information and communication technologies products | 89 | 89 | — | b. | |||||||
Aval Technologies Co., Ltd. (“Aval”) | Sale of information and communication technologies products | 100 | 100 | — | c. | |||||||
Youth Co., Ltd. | ISPOT Co., Ltd. (“ISPOT”) | Sale of information and communication technologies products | 100 | 100 | — | b. | ||||||
Youyi Co., Ltd. (“Youyi”) | Maintenance of information and communication technologies products | 100 | 100 | — | b. | |||||||
CHIEF Telecom Inc. | Unigate Telecom Inc. (“Unigate”) | Telecommunication and internet service | 100 | 100 | 100 | |||||||
Chief International Corp. (“CIC”) | Telecommunication and internet service | 100 | 100 | 100 | ||||||||
Shanghai Chief Telecom Co., Ltd. (“SCT”) | Telecommunication and internet service | 49 | 49 | — | d. | |||||||
Chunghwa System Integrated Co., Ltd. | Concord Technology Co., Ltd. (“Concord”) | Investment | 100 | 100 | 100 | |||||||
Spring House Entertainment Tech. Inc. | Ceylon Innovation Co., Ltd. (“CEI”) | E-book publishing and copyright negotiation of digital music | 100 | 100 | 100 | e. | ||||||
Chunghwa Investment Co., Ltd. | Chunghwa Precision Test Tech. Co., Ltd. (“CHPT”) | Production and sale of semiconductor testing components and printed circuit board | 41 | 46 | 46 | f. | ||||||
Chunghwa Investment Holding Co., Ltd. (“CIHC”) | Investment | 100 | 100 | 100 | ||||||||
(Continued)
- 9 -
| Percentage of Ownership | ||||||||||||
| Name of Investor | Name of Investee | Main Businesses and Products | June 30, 2016 | December 31, 2015 | June 30, 2015 | Note | ||||||
Concord Technology Co., Ltd. | Glory Network System Service (Shanghai) Co., Ltd. (“GNSS (Shanghai)”) | Design, development and production of computer and internet software, installment, maintenance and consulting services of information system integration, and sales of self-production products | 100 | 100 | 100 | g. | ||||||
Chunghwa Precision Test Tech. Co., Ltd. | Chunghwa Precision Test Tech. USA Corporation (“CHPT (US)”) | Design and after-sale services of semiconductor testing components and printed circuit board | 100 | 100 | 100 | |||||||
CHPT Japan Co., Ltd. (“CHPT (JP)”) | Related services of electronic parts, machinery processed products and printed circuit board | 100 | 100 | 100 | ||||||||
Chunghwa Precision Test Tech. International, Ltd. (“CHPT (International)”) | Wholesale and retail of electronic materials, and investment | 100 | 100 | 100 | ||||||||
Senao International (Samoa) Holding Ltd. | Senao International HK Limited (“SIHK”) | International investment | 100 | 100 | 100 | |||||||
Chunghwa Investment Holding Co., Ltd. | CHI One Investment Co., Limited (“COI”) | Investment | 100 | 100 | 100 | h. | ||||||
Senao International HK Limited | Senao Trading (Fujian) Co., Ltd. (“STF”) | Sale of information and communication technologies products | 100 | 100 | 100 | |||||||
Senao International Trading (Shanghai) Co., Ltd. (“SITS”) | Sale of information and communication technologies products | 100 | 100 | 100 | ||||||||
Senao International Trading (Shanghai) Co., Ltd. (“SEITS”) | Maintenance of information and communication technologies products | 100 | 100 | 100 | ||||||||
Senao International Trading (Jiangsu) Co., Ltd. (“SITJ”) | Sale of information and communication technologies products | 100 | 100 | 100 | ||||||||
Prime Asia Investments Group Ltd. (B.V.I.) | Chunghwa Hsingta Co., Ltd. (“CHC”) | Investment | 100 | 100 | 100 | |||||||
Chunghwa Hsingta Co., Ltd. (“CHC”) | Chunghwa Telecom (China) Co., Ltd. (“CTC”) | Integrated information and communication solution services for enterprise clients, and intelligent energy network service | 100 | 100 | 100 | |||||||
Jiangsu Zhenhua Information Technology Company, LLC. (“JZIT”) | Providing intelligent energy saving solution and intelligent buildings services | 75 | 75 | 75 | i. | |||||||
Hua-Xiong Information Technology Co., Ltd. (“HXIT”) | Providing intelligent buildings and smart home services | — | 51 | 51 | j. | |||||||
Chunghwa Precision Test Tech. International, Ltd. | Shanghai Taihua Electronic Technology Limited (“STET”) | Design of printed circuit board and related consultation service | 100 | 100 | 100 | |||||||
(Concluded)
| a. | Chunghwa owns approximately 29% equity shares of SENAO and has four out of seven seats of the Board of Directors of SENAO through the support of large beneficial stockholders. In order to comply with the local regulations, SENAO increased two seats of independent directors in June 2016; therefore, total seats of its Board of Directors increased to nine. As Chunghwa continue to have control over SENAO’s relevant activities, the accounts of SENAO are included in the consolidated financial statements. The Company’s equity ownership of SENAO increased due to SENAO’s purchase of its treasury stock in June 2015 and July 2015. The Company owned 28.32%, 29.31% and 29.31% equity shares of SENAO as of June 30, 2015, December 31, 2015 and June 30, 2016, respectively. |
| b. | SENAO acquired 70% equity shares of Youth in September 2015. SENAO participated in Youth’s cash capital increase in December 2015; therefore, the ownership interests of Youth increased. SENAO owned 89.48% equity shares of Youth as of June 30, 2016. Youyi and ISPOT are 100% owned subsidiaries of Youth. |
| c. | SENAO established a 100% owned subsidiary of Aval in October 2015. Aval mainly engages in sale of information and communication technologies products. |
| d. | CHIEF invested 49% equity shares of SCT in August 2015. Based on the written agreement between the stockholders, CHIEF has two out of three seats of the Board of Directors of SCT. Therefore, CHIEF has control over SCT and the accounts of SCT are included in the consolidated financial statements. |
| e. | CEI’s dissolution was approved by local regulator in January 2016. SHE received the proceeds from the liquidation. The liquidation of CEI is still in progress. |
- 10 -
| f. | CHI disposed of some shares of CHPT in January 2015 and March 2016. Furthermore, CHI did not participate in the capital increase of CHPT in March 2016. Therefore, its ownership interest in CHPT decreased to 40.79%. However, considering the Company’s absolute size, the relative size and the dispersion of shares owned by the other stockholders, the management concluded that the Company has a sufficiently dominant voting interest to direct the relevant activities; hence, CHPT is deemed as a subsidiary of the Company. |
| g. | GNSS (Shanghai) was approved to end its business and dissolve. The liquidation of GNSS (Shanghai) is still in progress. |
| h. | COI completed its liquidation in July 2016. CIHC received the proceeds from the liquidation. |
| i. | JZIT was approved to end and dissolve its business in May 2016. The liquidation of JZIT is still in process. |
| j. | HXIT’s dissolution was approved by local regulator in March 2016. CHC received part of the proceeds from the liquidation in April 2016. HXIT completed its liquidation and annulled its company registration in May 2016. |
| K. | Chunghwa invested 75% equity shares of Chunghwa Leading Photonics Tech Co., Ltd. (“CLPT”) in July 2016. CLPT mainly engages in agency, production and sale of electronic components and finished products. The company registration of CLPT was completed on July 28, 2016. |
The following diagram presents information regarding the relationship and ownership percentages between Chunghwa and its subsidiaries as of June 30, 2016:
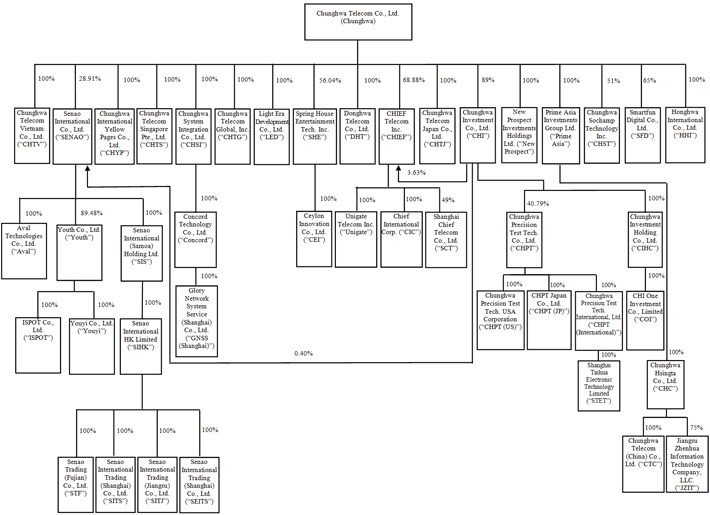
- 11 -
Other Significant Accounting Policies
| a. | Retirement benefits |
Pension cost for an interim period is calculated on a year-to-date basis by using the actuarially determined pension cost rate at the end of the prior financial year, adjusted for significant market fluctuations since that time and for other significant one-off events.
| b. | Taxation |
Income tax expense represents the sum of the tax currently payable and deferred tax. Interim period income taxes are assessed on an annual basis and calculated by applying to an interim period’s pre-tax income the tax rate that would be applicable to expected total annual earnings.
The measurement of deferred tax assets and liabilities reflects the tax consequences that would follow from the manner in which the Company expects, at the end of the reporting period, to recover or settle the carrying amount of its assets and liabilities.
| 4. | CRITICAL ACCOUNTING JUDGMENTS AND KEY SOURCES OF ESTIMATION UNCERTAINTY AND ASSUMPTION |
In the application of the Company’s accounting policies, the management is required to make judgments, estimates and assumptions which are based on historical experience and other factors that are not readily apparent from other sources. Actual results may differ from these estimates.
The estimates and underlying assumptions are reviewed by the management on an ongoing basis. Revisions to accounting estimates are recognized in the period in which the estimate is revised if the revision affects only that period or in the period of the revision and future periods if the revision affects both current and future periods.
For the critical accounting judgments and key sources of estimation uncertainty and assumption applied in these consolidated financial statements, please refer to the consolidated financial statements for the year ended December 31, 2015.
| 5. | APPLICATION OF NEW AND REVISED STANDARDS AND INTERPRETATIONS |
| a. | International Financial Reporting Standards (IFRS), International Accounting Standards (IAS), International Financial Reporting Interpretation Committee Interpretations (IFRIC), and Standing Interpretation Committee Interpretations (SIC) endorsed by the FSC will be adopted starting 2017 (collectively, “2017 Taiwan-IFRSs version”). |
The FSC issued Rule No. 1050026834 to endorse the following 2017 Taiwan-IFRSs version.
New, Revised or Amended Standards and Interpretations | Effective Date Issued by IASB (Note 1) | |||
Amendments to IFRSs | Annual Improvements to IFRSs 2010-2012 Cycle | July 1, 2014 (Note 2) | ||
Amendments to IFRSs | Annual Improvements to IFRSs 2011-2013 Cycle | July 1, 2014 | ||
(Continued)
- 12 -
New, Revised or Amended Standards and Interpretations | Effective Date Issued by IASB (Note 1) | |||
Amendments to IFRSs | Annual Improvements to IFRSs 2012-2014 Cycle | January 1, 2016 (Note 3) | ||
Amendments to IFRS 10, IFRS 12 and IAS 28 | Investment Entities: Applying the Consolidation Exception | January 1, 2016 | ||
Amendment to IFRS 11 | Acquisitions of Interests in Joint Operations | January 1, 2016 | ||
IFRS 14 | Regulatory Deferral Accounts | January 1, 2016 | ||
Amendment to IAS 1 | Disclosure Initiative | January 1, 2016 | ||
Amendments to IAS 16 and IAS 38 | Clarification of Acceptable Methods of Depreciation and Amortization | January 1, 2016 | ||
Amendments to IAS 16 and IAS 41 | Agriculture: Bearer Plants | January 1, 2016 | ||
Amendment to IAS 19 | Defined Benefit Plans: Employee Contributions | July 1, 2014 | ||
Amendment to IAS 36 | Impairment of Assets: Recoverable Amount Disclosures for Non-financial Assets | January 1, 2014 | ||
Amendment to IAS 39 | Novation of Derivatives and Continuation of Hedge Accounting | January 1, 2014 | ||
IFRIC 21 | Levies | January 1, 2014 | ||
(Concluded)
| Note 1: | Unless stated otherwise, the above amendments and interpretations are effective for annual periods beginning on or after their respective effective dates. |
| Note 2: | The amendment to IFRS 2 applies to share-based payment transactions with grant date on or after July 1, 2014; the amendment to IFRS 3 applies to business combinations with acquisition date on or after July 1, 2014; the amendment to IFRS 13 is effective immediately; the remaining amendments are effective for annual periods beginning on or after July 1, 2014. |
| Note 3: | The amendment to IFRS 5 is applied prospectively to changes in a method of disposal that occur in annual periods beginning on or after January 1, 2016; the remaining amendments are effective for annual periods beginning on or after January 1, 2016. |
The Company does not anticipate the adoption of the 2017 Taiwan-IFRSs version will have material impacts on the Company’s consolidated financial statements.
| b. | IFRSs issued by the International Accounting Standards Board (IASB) but not yet endorsed by the FSC. |
The Company has not applied the following IFRSs issued by the IASB but not yet endorsed by the FSC. In addition, the FSC announced that the public companies in Taiwan should apply IFRS 15 starting January 1, 2018. As of the date the consolidated financial statements were authorized for issue, the FSC has not announced the effective dates of other new, amended and revised standards and interpretations.
- 13 -
New, Revised or Amended Standards and Interpretations | Effective Date Issued by IASB (Note 1) | |||
Amendments to IFRS 2 | Classification and Measurement of Share-based Payment Transactions | January 1, 2018 | ||
IFRS 9 | Financial Instruments | January 1, 2018 | ||
Amendments to IFRS 9 and IFRS 7 | Mandatory Effective Date of IFRS 9 and Transition Disclosures | January 1, 2018 | ||
Amendments to IFRS 10 and IAS 28 | Sale or Contribution of Assets between an Investor and its Associate or Joint Venture | To be determined by IASB | ||
IFRS 15 | Revenue from Contracts with Customers | January 1, 2018 | ||
Amendments to IFRS 15 | Clarifications to IFRS 15 | January 1, 2018 | ||
IFRS 16 | Leases | January 1, 2019 | ||
Amendment to IAS 7 | Disclosure Initiative | January 1, 2017 | ||
Amendment to IAS 12 | Deferred Tax: Recovery of Underlying Assets | January 1, 2017 | ||
| Note 1: | Unless stated otherwise, the above amendments and interpretations are effective for annual periods beginning on or after their respective effective dates. |
Except for the following items, the application of the above new, revised or amended standards and interpretations will not have material impact on the Company’s consolidated financial statements:
| 1) | IFRS 15 “Revenue from Contracts with Customers” and related amendments |
IFRS 15 establishes principles for recognizing revenue that apply to all contracts with customers, and will supersedes IAS 18 “Revenue”, IAS 11 “Construction Contracts” and a number of revenue-related interpretations.
When applying IFRS 15, the Company shall recognize revenue by applying the following steps:
| a) | Identify the contract with the customer; |
| b) | Identify the performance obligations in the contract; |
| c) | Determine the transaction price; |
| d) | Allocate the transaction price to the performance obligations in the contracts; and |
| e) | Recognize revenue when the entity satisfies a performance obligation. |
Upon the application of IFRS 15, the Company will allocate the transaction price to each performance obligation identified in the contract on a relative stand-alone selling price basis.
Incremental costs of obtaining a contract will be recognized as an asset to the extent the Company expects to recover those costs. Such asset will be amortized on a basis that is consistent with the transfer to the customer of the goods or services to which the asset relates. This will lead to the later recognition of charges for certain customer-obtaining costs.
The amendments to IFRS 15 clarify how to (a) identify performance obligation; (b) determine whether a company is a principal or an agent; and (c) determine whether the revenue from granting a license should be recognized at a point in time or over time.
- 14 -
When IFRS 15 is effective, the Company may elect to apply this Standard and the related amendments either retrospectively to each prior reporting period presented or retrospectively with the cumulative effect of initially applying this Standard recognized at the date of initial application.
| 2) | IFRS 16 “Leases” |
IFRS 16 sets out the accounting standards for leases that will supersede IAS 17 and a number of related interpretations.
Under IFRS 16, if the Company is a lessee, it shall recognize right-of-use assets and lease liabilities for all leases on the consolidated balance sheets except for low-value and short-term leases. The Company may elect to apply the accounting method similar to the accounting for operating lease under IAS 17 to the low-value and short-term leases. On the consolidated statements of comprehensive income, the Company should present the depreciation expense charged on the right-of-use asset separately from interest expense accrued on the lease liability and discloses such amounts in the footnotes; interest is computed by using effective interest method. On the consolidated statements of cash flows, cash payments for the principal portion of the lease liability are classified within financing activities; cash payments for interest portion are classified within operating activities.
The application of IFRS 16 is not expected to have a material impact on the accounting of the Company as lessor.
When IFRS 16 becomes effective, the Company may elect to apply this Standard either retrospectively to each prior reporting period presented or retrospectively with the cumulative effect of the initial application of this Standard recognized at the date of initial application.
Except for the abovementioned impact, as of the date the consolidated financial statements were authorized for issue, the Company is continuously assessing the possible impact that the application of other standards and interpretations will have on the Company’s financial position and operating result, and will disclose the relevant impact when the assessment is completed.
| 6. | CASH AND CASH EQUIVALENTS |
June 30, 2016 | December 31, 2015 | June 30, 2015 | ||||||||||
Cash | ||||||||||||
Cash on hand | $ | 295,153 | $ | 333,544 | $ | 317,378 | ||||||
Bank deposits | 8,740,958 | 7,615,595 | 6,604,583 | |||||||||
|
|
|
|
|
| |||||||
| 9,036,111 | 7,949,139 | 6,921,961 | ||||||||||
|
|
|
|
|
| |||||||
Cash equivalents (investments with maturities of less than three months) | ||||||||||||
Commercial paper | 18,271,157 | 11,914,066 | 21,828,344 | |||||||||
Negotiable certificate of deposit | 16,000,000 | 7,600,000 | 4,500,000 | |||||||||
Time deposits | 1,336,085 | 2,808,218 | 1,034,214 | |||||||||
|
|
|
|
|
| |||||||
| 35,607,242 | 22,322,284 | 27,362,558 | ||||||||||
|
|
|
|
|
| |||||||
| $ | 44,643,353 | $ | 30,271,423 | $ | 34,284,519 | |||||||
|
|
|
|
|
| |||||||
- 15 -
The annual yield rates of bank deposits, commercial paper, negotiable certificate of deposit and time deposits were as follows:
June 30, 2016 | December 31, 2015 | June 30, 2015 | ||||
Bank deposits | 0.00%-1.10% | 0.00%-1.10% | 0.00%-0.95% | |||
Commercial paper | 0.30%-0.37% | 0.35%-0.41% | 0.53%-0.61% | |||
Negotiable certificate of deposit | 0.30%-0.35% | 0.36%-0.45% | 0.48%-0.58% | |||
Time deposits | 0.30%-2.50% | 0.55%-3.80% | 0.50%-5.30% |
| 7. | FINANCIAL INSTRUMENTS AT FAIR VALUE THROUGH PROFIT OR LOSS |
June 30, 2016 | December 31, 2015 | June 30, 2015 | ||||||||||
Financial assets held for trading | ||||||||||||
Derivatives (not designated for hedge) | ||||||||||||
Forward exchange contracts | $ | 52 | $ | 163 | $ | 1,216 | ||||||
|
|
|
|
|
| |||||||
Financial liabilities held for trading | ||||||||||||
Derivatives (not designated for hedge) | ||||||||||||
Forward exchange contracts | $ | 14,583 | $ | — | $ | 2,218 | ||||||
|
|
|
|
|
| |||||||
Outstanding forward exchange contracts not designated for hedge as of balance sheet dates were as follows:
| Contract Amount | ||||||||||||
| Currency | Maturity Period | (In Thousands) | ||||||||||
June 30, 2016 | ||||||||||||
Forward exchange contracts - buy | EUR/NT$ | 2016.09-12 | EUR16,709/NT$613,906 | |||||||||
Forward exchange contracts - buy | US$/NT$ | 2016.07 | US$13,750/NT$445,084 | |||||||||
December 31, 2015 | ||||||||||||
Forward exchange contracts - buy | EUR/NT$ | 2016.03-06 | EUR18,301/NT$658,545 | |||||||||
Forward exchange contracts - buy | US$/NT$ | 2016.01 | US$803/NT$26,403 | |||||||||
June 30, 2015 | ||||||||||||
Forward exchange contracts - buy | US$/NT$ | 2015.07 | US$11,399/NT$352,693 | |||||||||
Forward exchange contracts - buy | EUR/NT$ | 2015.09 | EUR5,387/NT$188,444 | |||||||||
The Company entered into the above forward exchange contracts to manage its exposure to foreign currency risk due to fluctuations in exchange rates. However, the aforementioned derivatives did not meet the criteria for hedge accounting.
- 16 -
| 8. | AVAILABLE-FOR-SALE FINANCIAL ASSETS |
June 30, 2016 | December 31, 2015 | June 30, 2015 | ||||||||||
Equity securities | ||||||||||||
Listed stocks | $ | 2,635,930 | $ | 3,242,827 | $ | 3,554,836 | ||||||
Fund | 29,927 | — | — | |||||||||
|
|
|
|
|
| |||||||
| $ | 2,665,857 | $ | 3,242,827 | $ | 3,554,836 | |||||||
|
|
|
|
|
| |||||||
Current | $ | 29,927 | $ | — | $ | — | ||||||
Noncurrent | 2,635,930 | 3,242,827 | 3,554,836 | |||||||||
|
|
|
|
|
| |||||||
| $ | 2,665,857 | $ | 3,242,827 | $ | 3,554,836 | |||||||
|
|
|
|
|
| |||||||
The Company evaluated and concluded that there was no indication that available-for-sale financial assets were impaired; therefore, no impairment loss was recognized for the six months ended June 30, 2016. CHI evaluated and concluded its available-for-sale financial assets were partially impaired and recorded an impairment loss of $25,910 thousand for the six months ended June 30, 2015.
| 9. | HELD-TO-MATURITY FINANCIAL ASSETS |
June 30, 2016 | December 31, 2015 | June 30, 2015 | ||||||||||
Corporate bonds | $ | 3,642,017 | $ | 3,870,540 | $ | 6,552,612 | ||||||
Bank debentures | 150,000 | 150,000 | 150,000 | |||||||||
|
|
|
|
|
| |||||||
| $ | 3,792,017 | $ | 4,020,540 | $ | 6,702,612 | |||||||
|
|
|
|
|
| |||||||
Current | $ | 2,892,164 | $ | 1,880,739 | $ | 2,903,450 | ||||||
Noncurrent | 899,853 | 2,139,801 | 3,799,162 | |||||||||
|
|
|
|
|
| |||||||
| $ | 3,792,017 | $ | 4,020,540 | $ | 6,702,612 | |||||||
|
|
|
|
|
| |||||||
The related information of corporate bonds and bank debentures as of balance sheet dates was as follows:
June 30, 2016 | December 31, 2015 | June 30, 2015 | ||||
Corporate bonds | ||||||
Par value | $3,640,000 | $3,865,000 | $6,540,000 | |||
|
|
| ||||
Nominal interest rate | 1.18%-2.49% | 1.18%-2.49% | 1.18%-2.49% | |||
Effective interest rate | 1.15%-1.54% | 1.15%-1.54% | 0.60%-1.58% | |||
Average remaining maturity life | 0.59 year | 1.04 years | 0.99 year | |||
Bank debentures | ||||||
Par value | $150,000 | $150,000 | $150,000 | |||
|
|
| ||||
Nominal interest rate | 1.25% | 1.25% | 1.25% | |||
Effective interest rate | 1.25% | 1.25% | 1.25% | |||
Average remaining maturity life | 0.92 year | 1.41 years | 1.92 years | |||
- 17 -
| 10. | TRADE NOTES AND ACCOUNTS RECEIVABLE, NET |
June 30, 2016 | December 31, 2015 | June 30, 2015 | ||||||||||
Trade notes and accounts receivable | $ | 31,419,226 | $ | 28,260,527 | $ | 28,684,835 | ||||||
Less: Allowance for doubtful accounts | (1,581,434 | ) | (1,334,477 | ) | (1,133,026 | ) | ||||||
|
|
|
|
|
| |||||||
| $ | 29,837,792 | $ | 26,926,050 | $ | 27,551,809 | |||||||
|
|
|
|
|
| |||||||
The average credit terms range from 30 to 90 days. In determining the recoverability of trade notes and accounts receivable, the Company considers significant change in the credit quality of the trade notes and accounts receivable from the date credit was initially granted up to the end of the reporting period. In general, with few exceptional cases, it is unlikely for the notes and accounts receivable due longer than 180 days to be collected, therefore the Company recognized 100% allowance of notes and accounts receivable overdue longer than 180 days. For the notes and accounts receivable less than 180 days, the allowance for doubtful accounts was estimated based on the Company’s historical recovery experience.
The Company serves a large consumer base; therefore, the concentration of credit risk is limited.
The aging analysis for trade notes and accounts receivable as of balance sheet dates were as follows:
June 30, 2016 | December 31, 2015 | June 30, 2015 | ||||||||||
Non-overdue | $ | 28,680,880 | $ | 25,707,830 | $ | 26,984,627 | ||||||
Less than 30 days | 708,589 | 732,711 | 960,556 | |||||||||
31-60 days | 394,831 | 346,275 | 271,928 | |||||||||
61-90 days | 316,014 | 241,097 | 98,768 | |||||||||
91-120 days | 59,743 | 192,601 | 191,285 | |||||||||
121-180 days | 172,429 | 121,705 | 117,320 | |||||||||
More than 181 days | 1,086,740 | 918,308 | 60,351 | |||||||||
|
|
|
|
|
| |||||||
| $ | 31,419,226 | $ | 28,260,527 | $ | 28,684,835 | |||||||
|
|
|
|
|
| |||||||
The above aging analysis was based on days overdue.
At balance sheet dates, the receivables that were past due but not impaired were considered recoverable by the management of the Company. The aging of these receivables as of balance sheet dates was as follows:
| June 30, 2016 | December 31, 2015 | June 30, 2015 | ||||||||||
Less than 30 days | $ | 95,261 | $ | 127,884 | $ | 347,008 | ||||||
31-60 days | 56,820 | 16,091 | 89,314 | |||||||||
61-90 days | 174,557 | 95,329 | 6,355 | |||||||||
91-120 days | 2,167 | 57,939 | 53,854 | |||||||||
121-180 days | 157 | 1,762 | 12,658 | |||||||||
More than 181 days | 12,670 | 19,823 | 24,452 | |||||||||
|
|
|
|
|
| |||||||
| $ | 341,632 | $ | 318,828 | $ | 533,641 | |||||||
|
|
|
|
|
| |||||||
The above aging analysis was based on days overdue.
- 18 -
Movements of the allowance for doubtful accounts were as follows:
Individually Assessed for Impairment | Collectively Assessed for Impairment | Total | ||||||||||
Balance on January 1, 2015 | $ | 276,659 | $ | 772,743 | $ | 1,049,402 | ||||||
Add: Provision for doubtful accounts | 10,962 | 162,574 | 173,536 | |||||||||
Deduct: Amounts written off | — | (89,912 | ) | (89,912 | ) | |||||||
|
|
|
|
|
| |||||||
Balance on June 30, 2015 | $ | 287,621 | $ | 845,405 | $ | 1,133,026 | ||||||
|
|
|
|
|
| |||||||
Balance on January 1, 2016 | $ | 364,841 | $ | 969,636 | $ | 1,334,477 | ||||||
Add: Provision for doubtful accounts | 76,436 | 281,726 | 358,162 | |||||||||
Deduct: Amounts written off | (562 | ) | (110,643 | ) | (111,205 | ) | ||||||
|
|
|
|
|
| |||||||
Balance on June 30, 2016 | $ | 440,715 | $ | 1,140,719 | $ | 1,581,434 | ||||||
|
|
|
|
|
| |||||||
| 11. | INVENTORIES |
June 30, 2016 | December 31, 2015 | June 30, 2015 | ||||||||||
Merchandise | $ | 3,628,918 | $ | 5,848,527 | $ | 3,744,099 | ||||||
Project in process | 982,766 | 697,181 | 819,638 | |||||||||
Work in process | 161,390 | 100,445 | 39,807 | |||||||||
Raw materials | 71,317 | 70,792 | 63,177 | |||||||||
|
|
|
|
|
| |||||||
| 4,844,391 | 6,716,945 | 4,666,721 | ||||||||||
Land held under development | 1,998,733 | 1,998,733 | 1,998,733 | |||||||||
Construction in progress | 69,754 | 64,512 | 47,377 | |||||||||
|
|
|
|
|
| |||||||
| $ | 6,912,878 | $ | 8,780,190 | $ | 6,712,831 | |||||||
|
|
|
|
|
| |||||||
The operating costs related to inventories were $12,047,975 thousand (including the valuation loss on inventories of $52,971 thousand) and $24,620,998 thousand (including the valuation loss on inventories of $156,944 thousand) for the three months and six months ended June 30, 2016, respectively. The operating costs related to inventories were $11,967,166 thousand (including the valuation loss on inventories of $37,970 thousand) and $24,999,182 thousand (including the valuation loss on inventories of $91,356 thousand) for the three months and six months ended June 30, 2015, respectively.
As of June 30, 2016, December 31, 2015 and June 30, 2015, inventories of $2,068,487 thousand, $2,063,245 thousand and $2,046,110 thousand, respectively, were expected to be recovered after more than twelve months. The aforementioned amount of inventories is related to property development owned by LED.
Land held under development and construction in progress on June 30, 2016, December 31, 2015 and June 30, 2015 was for Qingshan Sec., Dayuan Dist., Taoyuan City project.
- 19 -
| 12. | PREPAYMENTS |
June 30, 2016 | December 31, 2015 | June 30, 2015 | ||||||||||
Prepaid rents | $ | 3,244,068 | $ | 3,275,192 | $ | 3,248,086 | ||||||
Prepaid salary and bonus | 3,230,907 | 4,512 | 3,160,214 | |||||||||
Others | 3,211,255 | 3,001,135 | 2,867,593 | |||||||||
|
|
|
|
|
| |||||||
| $ | 9,686,230 | $ | 6,280,839 | $ | 9,275,893 | |||||||
|
|
|
|
|
| |||||||
Current | ||||||||||||
Prepaid salary and bonus | $ | 3,230,907 | $ | 4,512 | $ | 3,160,214 | ||||||
Prepaid rents | 1,106,060 | 1,032,869 | 1,123,722 | |||||||||
Others | 1,938,131 | 1,631,640 | 1,507,636 | |||||||||
|
|
|
|
|
| |||||||
| $ | 6,275,098 | $ | 2,669,021 | $ | 5,791,572 | |||||||
|
|
|
|
|
| |||||||
Noncurrent | ||||||||||||
Prepaid rents | $ | 2,138,008 | $ | 2,242,323 | $ | 2,124,364 | ||||||
Others | 1,273,124 | 1,369,495 | 1,359,957 | |||||||||
|
|
|
|
|
| |||||||
| $ | 3,411,132 | $ | 3,611,818 | $ | 3,484,321 | |||||||
|
|
|
|
|
| |||||||
| 13. | OTHER CURRENT MONETARY ASSETS |
June 30, 2016 | December 31, 2015 | June 30, 2015 | ||||||||||
Time deposits and negotiable certificate of deposit with maturities of more than three months | $ | 2,396,224 | $ | 2,285,682 | $ | 13,509,629 | ||||||
Others | 2,389,051 | 1,015,101 | 1,369,897 | |||||||||
|
|
|
|
|
| |||||||
| $ | 4,785,275 | $ | 3,300,783 | $ | 14,879,526 | |||||||
|
|
|
|
|
| |||||||
The annual yield rates of time deposits and negotiable certificates of deposit with maturities of more than three months were as follows:
June 30, 2016 | December 31, 2015 | June 30, 2015 | ||||
Time deposits and negotiable certificate of deposit with maturities of more than three months | 0.11%-2.25% | 0.11%-3.50% | 0.11%-3.30% |
- 20 -
| 14. | FINANCIAL ASSETS CARRIED AT COST |
June 30, 2016 | December 31, 2015 | June 30, 2015 | ||||||||||
Non-listed stocks | ||||||||||||
Domestic | $ | 1,956,597 | $ | 1,990,077 | $ | 2,116,029 | ||||||
Foreign | 283,376 | 277,792 | 270,899 | |||||||||
|
|
|
|
|
| |||||||
| $ | 2,239,973 | $ | 2,267,869 | $ | 2,386,928 | |||||||
|
|
|
|
|
| |||||||
The above non-listed stocks are classified as available-for-sale financial assets based on financial assets categories (see Note 38). Since the fair value cannot be reliably measured due to the range of reasonable fair value estimates was so significant, the above non-listed stocks investments owned by the Company were measured at costs less any impairment losses at the balance sheet dates.
CHI disposed financial assets carried at cost with carrying amounts of $858 thousand and $1,206 thousand and recognized the disposal gain of $19 thousand and disposal loss of $240 thousand for the six months ended June 30, 2016 and 2015, respectively.
The Company evaluated and concluded that there was no indication that financial assets carried at cost were impaired; therefore, no impairment loss was recognized for the six months ended June 30, 2016 and 2015.
| 15. | SUBSIDIARIES |
| a. | Information on significant noncontrolling interest subsidiary |
Principal Place of | Proportion of Ownership Interests and Voting Rights Held by Noncontrolling Interests | |||||||
| Subsidiaries | June 30, 2016 | December 31, 2015 | June 30, 2015 | |||||
SENAO | Taiwan | 71% | 71% | 72% | ||||
| Profit Allocated to Noncontrolling Interests | ||||||||||||||||
| For the Three Months Ended June 30 | For the Six Months Ended June 30 | |||||||||||||||
| 2016 | 2015 | 2016 | 2015 | |||||||||||||
SENAO | $ | 153,817 | $ | 168,923 | $ | 330,608 | $ | 274,956 | ||||||||
|
|
|
|
|
|
|
| |||||||||
| Accumulated Noncontrolling Interests | ||||||||||||
June 30, 2016 | December 31, 2015 | June 30, 2015 | ||||||||||
SENAO | $ | 3,897,616 | $ | 4,116,412 | $ | 4,126,743 | ||||||
Individually immaterial subsidiaries with noncontrolling interests | 1,972,983 | 1,152,663 | 964,835 | |||||||||
|
|
|
|
|
| |||||||
| $ | 5,870,599 | $ | 5,269,075 | $ | 5,091,578 | |||||||
|
|
|
|
|
| |||||||
- 21 -
Summarized financial information in respect of SENAO and its subsidiaries that has material noncontrolling interests is set out below. The summarized financial information below represents amounts before intracompany eliminations.
June 30, 2016 | December 31, 2015 | June 30, 2015 | ||||||||||
Current assets | $ | 7,926,193 | $ | 7,422,739 | $ | 8,551,422 | ||||||
Noncurrent assets | 2,597,323 | 2,783,123 | 2,369,198 | |||||||||
Current liabilities | (4,942,664 | ) | (4,324,620 | ) | (5,133,052 | ) | ||||||
Noncurrent liabilities | (134,461 | ) | (137,661 | ) | (90,931 | ) | ||||||
|
|
|
|
|
| |||||||
Equity | $ | 5,446,391 | $ | 5,743,581 | $ | 5,696,637 | ||||||
|
|
|
|
|
| |||||||
Equity attributable to the parent | $ | 1,548,775 | $ | 1,627,169 | $ | 1,569,894 | ||||||
Equity attributable to noncontrolling interests | 3,897,616 | 4,116,412 | 4,126,743 | |||||||||
|
|
|
|
|
| |||||||
| $ | 5,446,391 | $ | 5,743,581 | $ | 5,696,637 | |||||||
|
|
|
|
|
| |||||||
| For the Three Months Ended June 30 | For the Six Months Ended June 30 | |||||||||||||||
| 2016 | 2015 | 2016 | 2015 | |||||||||||||
Revenues and income | $ | 7,880,452 | $ | 9,187,840 | $ | 16,460,829 | $ | 18,407,946 | ||||||||
Costs and expenses | 7,662,502 | 8,953,698 | 15,992,829 | 18,026,672 | ||||||||||||
|
|
|
|
|
|
|
| |||||||||
Profit for the period | $ | 217,950 | $ | 234,142 | $ | 468,000 | $ | 381,274 | ||||||||
|
|
|
|
|
|
|
| |||||||||
Profit attributable to the parent | $ | 64,133 | $ | 65,219 | $ | 137,392 | $ | 106,318 | ||||||||
Profit attributable to the noncontrolling interests | 153,817 | 168,923 | 330,608 | 274,956 | ||||||||||||
|
|
|
|
|
|
|
| |||||||||
Profit for the period | $ | 217,950 | $ | 234,142 | $ | 468,000 | $ | 381,274 | ||||||||
|
|
|
|
|
|
|
| |||||||||
Other comprehensive loss attributable to the parent | $ | (4,771 | ) | $ | (2,607 | ) | $ | (8,623 | ) | $ | (5,054 | ) | ||||
Other comprehensive loss attributable to the noncontrolling interests | (11,732 | ) | (6,689 | ) | (21,205 | ) | (13,046 | ) | ||||||||
|
|
|
|
|
|
|
| |||||||||
| $ | (16,503 | ) | $ | (9,296 | ) | $ | (29,828 | ) | $ | (18,100 | ) | |||||
|
|
|
|
|
|
|
| |||||||||
Total comprehensive income attributable to the parent | $ | 59,362 | $ | 62,612 | $ | 128,769 | $ | 101,264 | ||||||||
Total comprehensive income attributable to the noncontrolling interests | 142,085 | 162,234 | 309,403 | 261,910 | ||||||||||||
|
|
|
|
|
|
|
| |||||||||
| $ | 201,447 | $ | 224,846 | $ | 438,172 | $ | 363,174 | |||||||||
|
|
|
|
|
|
|
| |||||||||
- 22 -
| For the Six Months Ended June 30 | ||||||||
| 2016 | 2015 | |||||||
Net cash flow from operating activities | $ | 452,867 | $ | 642,434 | ||||
Net cash flow from investing activities | (10,014 | ) | 12,035 | |||||
Net cash flow from financing activities | (748 | ) | 263,697 | |||||
Effect of exchange rate changes on cash and cash equivalents | (3,134 | ) | (3,815 | ) | ||||
|
|
|
| |||||
Net cash inflow | $ | 438,971 | $ | 914,351 | ||||
|
|
|
| |||||
Dividends paid to noncontrolling interests | $ | 526,436 | $ | 278,218 | ||||
|
|
|
| |||||
| b. | Equity transactions with noncontrolling interests |
SENAO purchased its treasury stock in June 2015 and the Company’s ownership interest in SENAO increased to 28.32%.
CHI disposed of some shares of CHPT in January 2015 and March 2016. Furthermore, CHI did not participate in the capital increase of CHPT in March 2016. Therefore, its ownership interest in CHPT decreased to 40.79%.
The above transactions were accounted for as equity transactions since the Company did not cease to have control over these subsidiaries.
| Six Months Ended June 30 | ||||||||||||||||
| 2016 | 2015 | |||||||||||||||
CHI Did Not Participate in the Capital Increase of CHPT | CHI Disposed Some Shares of | CHI Disposed Some Shares of | SENAO Purchased Its Treasury | |||||||||||||
Cash consideration received from (paid to) noncontrolling interests | $ | 1,175,509 | $ | 83,628 | $ | 45,128 | $ | (58,079 | ) | |||||||
The proportionate share of the carrying amount of the net assets of the subsidiary transferred (to) from noncontrolling interests | (785,769 | ) | (25,422 | ) | (18,484 | ) | 49,298 | |||||||||
|
|
|
|
|
|
|
| |||||||||
Differences arising from equity transactions | $ | 389,740 | $ | 58,206 | $ | 26,644 | $ | (8,781 | ) | |||||||
|
|
|
|
|
|
|
| |||||||||
(Continued)
- 23 -
| Six Months Ended June 30 | ||||||||||||||||
| 2016 | 2015 | |||||||||||||||
| CHI Did Not Participate in the Capital Increase of CHPT | CHI Disposed Some Shares of CHPT | CHI Disposed Some Shares of CHPT | SENAO Treasury | |||||||||||||
Line items for equity transactions adjustment | ||||||||||||||||
Additional paid-in capital - difference between consideration received or paid and the carrying amount of the subsidiaries’ net assets upon actual disposal or acquisition | $ | — | $ | 58,206 | $ | 26,644 | $ | — | ||||||||
|
|
|
|
|
|
|
| |||||||||
Additional paid-in capital - arising from changes in equities of subsidiaries | $ | 389,740 | $ | — | $ | — | $ | (8,781 | ) | |||||||
|
|
|
|
|
|
|
| |||||||||
(Concluded)
| 16. | INVESTMENTS ACCOUNTED FOR USING EQUITY METHOD |
| June 30, 2016 | December 31, 2015 | June 30, 2015 | ||||||||||
Investments in associates | $ | 2,495,918 | $ | 2,917,625 | $ | 2,624,892 | ||||||
Investments in joint ventures | 203,211 | 227,379 | 238,028 | |||||||||
|
|
|
|
|
| |||||||
| $ | 2,699,129 | $ | 3,145,004 | $ | 2,862,920 | |||||||
|
|
|
|
|
| |||||||
| a. | Investments in associates |
Investments in associates were as follows:
| Carrying Amount | ||||||||||||
| June 30, 2016 | December 31, 2015 | June 30, 2015 | ||||||||||
Listed | ||||||||||||
Senao Networks, Inc. (“SNI”) | $ | 756,753 | $ | 866,696 | $ | 718,510 | ||||||
Non-listed | ||||||||||||
ST-2 Satellite Ventures Pte., Ltd. (“STS”) | 559,038 | 494,727 | 585,525 | |||||||||
International Integrated System, Inc. (“IISI”) | 299,986 | 301,861 | 283,554 | |||||||||
Viettel-CHT Co., Ltd. (“Viettel-CHT”) | 242,650 | 315,762 | 288,223 | |||||||||
(Continued)
- 24 -
| Carrying Amount | ||||||||||||
| June 30, 2016 | December 31, 2015 | June 30, 2015 | ||||||||||
Skysoft Co., Ltd. (“SKYSOFT”) | $ | 138,019 | $ | 137,792 | $ | 134,003 | ||||||
So-net Entertainment Taiwan Limited (“So-net”) | 123,916 | 105,844 | 96,526 | |||||||||
KingwayTek Technology Co., Ltd. (“KWT”) | 114,540 | 119,419 | 71,656 | |||||||||
Taiwan International Standard Electronics Co., Ltd. (“TISE”) | 99,809 | 374,487 | 215,182 | |||||||||
Taiwan International Ports Logistics Corporation (“TIPL”) | 60,058 | 68,927 | 76,340 | |||||||||
Click Force Co., Ltd. (“CF”) | 37,287 | 38,914 | 41,938 | |||||||||
Dian Zuan Intergrating Marketing Co., Ltd. (“DZIM”) | 31,000 | 41,922 | 56,661 | |||||||||
HopeTech Technologies Limited (“HopeTech”) | 21,784 | 35,938 | 32,058 | |||||||||
Alliance Digital Tech Co., Ltd. (“ADT”) | 11,078 | 15,336 | 17,346 | |||||||||
MeWorks LIMITED (HK) (“MeWorks”) | — | — | 7,370 | |||||||||
Xiamen Sertec Business Technology Co., Ltd. (“Sertec”) | — | — | — | |||||||||
Panda Monium Company Ltd. | — | — | — | |||||||||
|
|
|
|
|
| |||||||
| $ | 2,495,918 | $ | 2,917,625 | $ | 2,624,892 | |||||||
|
|
|
|
|
| |||||||
(Concluded)
At the end of the reporting periods, the percentages of ownership and voting rights in associates held by the Company were as follows:
| % of Ownership and Voting Rights | ||||||
| June 30, 2016 | December 31, 2015 | June 30, 2015 | ||||
Senao Networks, Inc. (“SNI”) | 34 | 34 | 34 | |||
ST-2 Satellite Ventures Pte., Ltd. (“STS”) | 38 | 38 | 38 | |||
International Integrated System, Inc. (“IISI”) | 33 | 33 | 33 | |||
Viettel-CHT Co., Ltd. (“Viettel-CHT”) | 30 | 30 | 30 | |||
Skysoft Co., Ltd. (“SKYSOFT”) | 30 | 30 | 30 | |||
So-net Entertainment Taiwan Limited (“So-net”) | 30 | 30 | 30 | |||
KingwayTek Technology Co., Ltd. (“KWT”) | 26 | 26 | 26 | |||
Taiwan International Standard Electronics Co., Ltd. (“TISE”) | 40 | 40 | 40 | |||
Taiwan International Ports Logistics Corporation (“TIPL”) | 27 | 27 | 27 | |||
Click Force Co., Ltd. (“CF”) | 49 | 49 | 49 | |||
Dian Zuan Integrating Marketing Co., Ltd. (“DZIM”) | 26 | 26 | 26 | |||
HopeTech Technologies Limited (“HopeTech”) | 45 | 45 | 45 | |||
(Continued)
- 25 -
| % of Ownership and Voting Rights | ||||||
| June 30, 2016 | December 31, 2015 | June 30, 2015 | ||||
Alliance Digital Tech Co., Ltd. (“ADT”) | 13 | 13 | 13 | |||
MeWorks LIMITED (HK) (“MeWorks”) | 20 | 20 | 20 | |||
Xiamen Sertec Business Technology Co., Ltd. (“Sertec”) | — | — | — | |||
Panda Monium Company Ltd. | — | — | 43 | |||
(Concluded)
None of the above associates is considered individually material to the Company. Aggregate information of associates that are not individually material was as follows:
| For the Three Months Ended June 30 | For the Six Months Ended June 30 | |||||||||||||||
| 2016 | 2015 | 2016 | 2015 | |||||||||||||
The Company’s share of the profit | $ | 152,192 | $ | 198,252 | $ | 267,103 | $ | 507,528 | ||||||||
The Company’s share of other comprehensive income (loss) | 218 | (426 | ) | (1,374 | ) | 184 | ||||||||||
|
|
|
|
|
|
|
| |||||||||
The Company’s share of total comprehensive income | $ | 152,410 | $ | 197,826 | $ | 265,729 | $ | 507,712 | ||||||||
|
|
|
|
|
|
|
| |||||||||
The Level 1 fair values based on the closing market prices of SNI as of the balance sheet dates were as follows:
| June 30, 2016 | December 31, 2015 | June 30, 2015 | ||||||||||
SNI | $ | 2,636,066 | $ | 3,556,203 | $ | 4,534,366 | ||||||
|
|
|
|
|
| |||||||
Chunghwa sold its partial ownership interest in KWT in January 2015. The gain on disposal of KWT was $7,409 thousand.
Sertec completed its liquidation in June 2015. The gain on disposal of Sertec was $649 thousand. CHI received the proceeds from disposal in July 2015.
CHI disposed all ownership interest in Panda Monium Company Ltd. in September 2015.
The Company’s share of profit (loss) and other comprehensive income (loss) of associates was recognized based on the reviewed financial statements.
- 26 -
| b. | Investments in joint ventures |
Investments in joint ventures were as follows:
| Carrying Amount | % of Ownership and Voting Rights | |||||||||||||||||||||||
| June 30, 2016 | December 31, 2015 | June 30, 2015 | June 30, 2016 | December 31, 2015 | June 30, 2015 | |||||||||||||||||||
Non-listed | ||||||||||||||||||||||||
Huada Digital Corporation (“HDD”) | $ | 182,426 | $ | 206,737 | $ | 212,104 | 50 | 50 | 50 | |||||||||||||||
Chunghwa Benefit One Co., Ltd. (“CBO”) | 20,785 | 20,642 | 25,924 | 50 | 50 | 50 | ||||||||||||||||||
|
|
|
|
|
| |||||||||||||||||||
| $ | 203,211 | $ | 227,379 | $ | 238,028 | |||||||||||||||||||
|
|
|
|
|
| |||||||||||||||||||
In March 2016, the stockholders of HDD approved that HDD would start its dissolution from March 31, 2016. The liquidation of HDD is still in process.
None of the above joint ventures is considered individually material to the Company. Summarized financial information of joint ventures that was not material to the Company was as follows:
| For the Three Months Ended June 30 | For the Six Months Ended June 30 | |||||||||||||||
| 2016 | 2015 | 2016 | 2015 | |||||||||||||
The Company’s share of profit (loss) | $ | 3,435 | $ | (9,888 | ) | $ | (24,178 | ) | $ | (18,638 | ) | |||||
The Company’s share of other comprehensive income | — | — | — | — | ||||||||||||
|
|
|
|
|
|
|
| |||||||||
The Company’s share of total comprehensive income (loss) | $ | 3,435 | $ | (9,888 | ) | $ | (24,178 | ) | $ | (18,638 | ) | |||||
|
|
|
|
|
|
|
| |||||||||
The Company’s share of profit (loss) of joint ventures was recorded based on the reviewed financial statements.
| 17. | PROPERTY, PLANT AND EQUIPMENT |
| Land | Land Improvements | Buildings | Computer Equipment | Telecommuni- cations Equipment | Transportation Equipment | Miscellaneous Equipment | Construction in Progress and Advances Related to Acquisition of Equipment | Total | ||||||||||||||||||||||||||||
Cost | ||||||||||||||||||||||||||||||||||||
Balance on January 1, 2015 | $ | 102,773,786 | $ | 1,557,544 | $ | 67,600,416 | $ | 15,318,187 | $ | 695,075,672 | $ | 3,824,783 | $ | 8,643,904 | $ | 20,929,731 | $ | 915,724,023 | ||||||||||||||||||
Additions | — | — | 9,261 | 8,051 | 27,335 | — | 67,556 | 7,942,848 | 8,055,051 | |||||||||||||||||||||||||||
Disposal | — | — | — | (414,509 | ) | (7,045,085 | ) | (32,930 | ) | (186,881 | ) | — | (7,679,405 | ) | ||||||||||||||||||||||
Effect of foreign exchange differences | — | — | — | (1,106 | ) | (43,681 | ) | (47 | ) | (3,557 | ) | — | (48,391 | ) | ||||||||||||||||||||||
Others | 11,514 | 3,085 | 83,796 | 130,198 | 12,088,431 | 1,491 | 71,771 | (12,408,099 | ) | (17,813 | ) | |||||||||||||||||||||||||
|
|
|
|
|
|
|
|
|
|
|
|
|
|
|
|
|
| |||||||||||||||||||
Balance on June 30, 2015 | $ | 102,785,300 | $ | 1,560,629 | $ | 67,693,473 | $ | 15,040,821 | $ | 700,102,672 | $ | 3,793,297 | $ | 8,592,793 | $ | 16,464,480 | $ | 916,033,465 | ||||||||||||||||||
|
|
|
|
|
|
|
|
|
|
|
|
|
|
|
|
|
| |||||||||||||||||||
Accumulated depreciation and impairment | ||||||||||||||||||||||||||||||||||||
Balance on January 1, 2015 | $ | — | $ | (1,145,434 | ) | $ | (23,202,169 | ) | $ | (11,307,939 | ) | $ | (568,767,123 | ) | $ | (2,207,400 | ) | $ | (6,443,615 | ) | $ | — | $ | (613,073,680 | ) | |||||||||||
Depreciation Expenses | — | (26,866 | ) | (629,098 | ) | (741,223 | ) | (13,361,068 | ) | (302,573 | ) | (344,876 | ) | — | (15,405,704 | ) | ||||||||||||||||||||
Disposal | — | — | — | 410,441 | 7,034,988 | 32,885 | 156,043 | — | 7,634,357 | |||||||||||||||||||||||||||
Effect of foreign exchange differences | — | — | — | 673 | 7,810 | 39 | 1,808 | — | 10,330 | |||||||||||||||||||||||||||
Others | — | 2 | 7,686 | (437 | ) | (48,508 | ) | (6,663 | ) | (1,463 | ) | — | (49,383 | ) | ||||||||||||||||||||||
|
|
|
|
|
|
|
|
|
|
|
|
|
|
|
|
|
| |||||||||||||||||||
Balance on June 30, 2015 | $ | — | $ | (1,172,298 | ) | $ | (23,823,581 | ) | $ | (11,638,485 | ) | $ | (575,133,901 | ) | $ | (2,483,712 | ) | $ | (6,632,103 | ) | $ | — | $ | (620,884,080 | ) | |||||||||||
|
|
|
|
|
|
|
|
|
|
|
|
|
|
|
|
|
| |||||||||||||||||||
Balance on January 1, 2015, net | $ | 102,773,786 | $ | 412,110 | $ | 44,398,247 | $ | 4,010,248 | $ | 126,308,549 | $ | 1,617,383 | $ | 2,200,289 | $ | 20,929,731 | $ | 302,650,343 | ||||||||||||||||||
|
|
|
|
|
|
|
|
|
|
|
|
|
|
|
|
|
| |||||||||||||||||||
Balance on June 30, 2015, net | $ | 102,785,300 | $ | 388,331 | $ | 43,869,892 | $ | 3,402,336 | $ | 124,968,771 | $ | 1,309,585 | $ | 1,960,690 | $ | 16,464,480 | $ | 295,149,385 | ||||||||||||||||||
|
|
|
|
|
|
|
|
|
|
|
|
|
|
|
|
|
| |||||||||||||||||||
| (Continued) | ||||||||||||||||||||||||||||||||||||
- 27 -
| Land | Land Improvements | Buildings | Computer Equipment | Telecommuni- cations Equipment | Transportation Equipment | Miscellaneous Equipment | Construction in Progress and Advances Related to Acquisition of Equipment | Total | ||||||||||||||||||||||||||||
Cost | ||||||||||||||||||||||||||||||||||||
Balance on January 1, 2016 | $ | 102,747,140 | $ | 1,575,270 | $ | 67,789,742 | $ | 14,995,890 | $ | 705,371,587 | $ | 3,815,372 | $ | 8,736,898 | $ | 20,402,328 | $ | 925,434,227 | ||||||||||||||||||
Additions | — | — | 9,638 | 13,896 | 84,081 | — | 68,801 | 5,855,546 | 6,031,962 | |||||||||||||||||||||||||||
Disposal | (1,645 | ) | (6,290 | ) | (34,887 | ) | (891,707 | ) | (4,467,597 | ) | (18,224 | ) | (151,985 | ) | — | (5,572,335 | ) | |||||||||||||||||||
Effect of foreign exchange differences | — | — | — | (1,853 | ) | (34,982 | ) | 56 | (2,210 | ) | — | (38,989 | ) | |||||||||||||||||||||||
Others | — | 2,260 | (2,265 | ) | 210,804 | 8,204,766 | 6,336 | 136,829 | (8,521,643 | ) | 37,087 | |||||||||||||||||||||||||
|
|
|
|
|
|
|
|
|
|
|
|
|
|
|
|
|
| |||||||||||||||||||
Balance on June 30, 2016 | $ | 102,745,495 | $ | 1,571,240 | $ | 67,762,228 | $ | 14,327,030 | $ | 709,157,855 | $ | 3,803,540 | $ | 8,788,333 | $ | 17,736,231 | $ | 925,891,952 | ||||||||||||||||||
|
|
|
|
|
|
|
|
|
|
|
|
|
|
|
|
|
| |||||||||||||||||||
Accumulated depreciation and impairment | ||||||||||||||||||||||||||||||||||||
Balance on January 1, 2016 | $ | — | $ | (1,203,409 | ) | $ | (24,420,559 | ) | $ | (11,714,869 | ) | $ | (582,205,048 | ) | $ | (2,750,230 | ) | $ | (6,740,966 | ) | $ | — | $ | (629,035,081 | ) | |||||||||||
Depreciation expenses | — | (25,911 | ) | (635,760 | ) | (680,989 | ) | (12,657,265 | ) | (275,076 | ) | (315,925 | ) | — | (14,590,926 | ) | ||||||||||||||||||||
Disposal | — | 6,246 | 34,270 | 883,290 | 4,463,527 | 18,163 | 143,955 | — | 5,549,451 | |||||||||||||||||||||||||||
Effect of foreign exchange differences | — | — | — | 1,359 | 7,684 | (52 | ) | 2,138 | — | 11,129 | ||||||||||||||||||||||||||
Others | — | (160 | ) | 7,092 | (56,845 | ) | 46,392 | (6,596 | ) | (11,063 | ) | — | (21,180 | ) | ||||||||||||||||||||||
|
|
|
|
|
|
|
|
|
|
|
|
|
|
|
|
|
| |||||||||||||||||||
Balance on June 30, 2016 | $ | — | $ | (1,223,234 | ) | $ | (25,014,957 | ) | $ | (11,568,054 | ) | $ | (590,344,710 | ) | $ | (3,013,791 | ) | $ | (6,921,861 | ) | $ | — | $ | (638,086,607 | ) | |||||||||||
|
|
|
|
|
|
|
|
|
|
|
|
|
|
|
|
|
| |||||||||||||||||||
Balance on January 1, 2016, net | $ | 102,747,140 | $ | 371,861 | $ | 43,369,183 | $ | 3,281,021 | $ | 123,166,539 | $ | 1,065,142 | $ | 1,995,932 | $ | 20,402,328 | $ | 296,399,146 | ||||||||||||||||||
|
|
|
|
|
|
|
|
|
|
|
|
|
|
|
|
|
| |||||||||||||||||||
Balance on June 30, 2016, net | $ | 102,745,495 | $ | 348,006 | $ | 42,747,271 | $ | 2,758,976 | $ | 118,813,145 | $ | 789,749 | $ | 1,866,472 | $ | 17,736,231 | $ | 287,805,345 | ||||||||||||||||||
|
|
|
|
|
|
|
|
|
|
|
|
|
|
|
|
|
| |||||||||||||||||||
| (Concluded) |
| ||||||||||||||||||||||||||||||||||
There was no indication that property, plant and equipment was impaired so the Company did not recognize any impairment loss for the six months ended for June 30, 2016 and 2015.
Depreciation expense is computed using the straight-line method over the following estimated service lives:
Land improvements | 8-30 years | |
Buildings | ||
Main buildings | 35-60 years | |
Other building facilities | 2-20 years | |
Computer equipment | 2-8 years | |
Telecommunications equipment | ||
Telecommunication circuits | 2-30 years | |
Telecommunication machinery and antennas equipment | 2-30 years | |
Transportation equipment | 3-10 years | |
Miscellaneous equipment | ||
Leasehold improvements | 1-6 years | |
Mechanical and air conditioner equipment | 3-16 years | |
Others | 2-10 years |
- 28 -
| 18. | INVESTMENT PROPERTIES |
Cost | ||||
Balance on January 1, 2015 | $ | 8,883,051 | ||
Reclassification | 54,103 | |||
|
| |||
Balance on June 30, 2015 | $ | 8,937,154 | ||
|
| |||
Accumulated depreciation and impairment | ||||
Balance on January 1, 2015 | $ | (1,262,197 | ) | |
Depreciation expense | (8,960 | ) | ||
Reclassification | (155 | ) | ||
|
| |||
Balance on June 30, 2015 | $ | (1,271,312 | ) | |
|
| |||
Balance on January 1, 2015, net | $ | 7,620,854 | ||
|
| |||
Balance on June 30, 2015, net | $ | 7,665,842 | ||
|
| |||
Cost | ||||
Balance on January 1 and June 30, 2016 | $ | 9,057,992 | ||
|
| |||
Accumulated depreciation and impairment | ||||
Balance on January 1, 2016 | $ | (1,155,587 | ) | |
Depreciation expense | (9,369 | ) | ||
|
| |||
Balance on June 30, 2016 | $ | (1,164,956 | ) | |
|
| |||
Balance on January 1, 2016, net | $ | 7,902,405 | ||
|
| |||
Balance on June 30, 2016, net | $ | 7,893,036 | ||
|
| |||
Depreciation expense is computed using the straight-line method over the following estimated service lives:
Land improvements | 8-30 years | |
Buildings | ||
Main buildings | 35-60 years | |
Other building facilities | 4-10 years |
The fair value of the Company’s investment properties as of December 31, 2015 and 2014 was determined by Level 3 fair value measurements inputs based on the appraisal reports conducted by independent appraisers. The Company used the above mentioned appraisal reports as the basis to determine the fair value as of June 30, 2016 and 2015 because there was no material change in the economic environment and the market transaction price. Those appraisal reports are based on the comparison approach, income approach or cost approach. Key assumptions and the fair values were as follows:
June 30, 2016 | December 31, 2015 | June 30, 2015 | ||||||||||
Fair value | $ | 17,694,498 | $ | 17,694,498 | $ | 17,257,051 | ||||||
|
|
|
|
|
| |||||||
Overall capital interest rate | 1.49%-2.28% | 1.49%-2.28% | 1.54%-2.36% | |||||||||
Profit margin ratio | 10%-20% | 10%-20% | 10%-20% | |||||||||
Discount rate | 1.21%-1.28% | 1.21%-1.28% | 1.36% | |||||||||
Capitalization rate | 0.44%-1.73% | 0.44%-1.73% | 0.44%-1.65% | |||||||||
All of the Company’s investment properties are held under freehold interest.
- 29 -
| 19. | INTANGIBLE ASSETS |
| 3G and 4G Concession | Computer Software | Goodwill | Others | Total | ||||||||||||||||
Cost | ||||||||||||||||||||
Balance on January 1, 2015 | $ | 49,254,000 | $ | 3,192,652 | $ | 180,631 | $ | 150,565 | $ | 52,777,848 | ||||||||||
Additions-acquired separately | — | 125,877 | — | 716 | 126,593 | |||||||||||||||
Disposal | — | (308,770 | ) | — | — | (308,770 | ) | |||||||||||||
Effect of foreign exchange difference | — | (352 | ) | — | — | (352 | ) | |||||||||||||
|
|
|
|
|
|
|
|
|
| |||||||||||
Balance on June 30, 2015 | $ | 49,254,000 | $ | 3,009,407 | $ | 180,631 | $ | 151,281 | $ | 52,595,319 | ||||||||||
|
|
|
|
|
|
|
|
|
| |||||||||||
Accumulated amortization and impairment | ||||||||||||||||||||
Balance on January 1, 2015 | $ | (8,103,833 | ) | $ | (1,793,470 | ) | $ | (18,055 | ) | $ | (37,864 | ) | $ | (9,953,222 | ) | |||||
Amortization expenses | (1,251,983 | ) | (283,792 | ) | — | (3,655 | ) | (1,539,430 | ) | |||||||||||
Disposal | — | 308,750 | — | — | 308,750 | |||||||||||||||
Effect of foreign exchange difference | — | 284 | — | — | 284 | |||||||||||||||
|
|
|
|
|
|
|
|
|
| |||||||||||
Balance on June 30, 2015 | $ | (9,355,816 | ) | $ | (1,768,228 | ) | $ | (18,055 | ) | $ | (41,519 | ) | $ | (11,183,618 | ) | |||||
|
|
|
|
|
|
|
|
|
| |||||||||||
Balance on January 1, 2015, net | $ | 41,150,167 | $ | 1,399,182 | $ | 162,576 | $ | 112,701 | $ | 42,824,626 | ||||||||||
|
|
|
|
|
|
|
|
|
| |||||||||||
Balance on June 30, 2015, net | $ | 39,898,184 | $ | 1,241,179 | $ | 162,576 | $ | 109,762 | $ | 41,411,701 | ||||||||||
|
|
|
|
|
|
|
|
|
| |||||||||||
Cost | ||||||||||||||||||||
Balance on January 1, 2016 | $ | 59,209,000 | $ | 3,248,628 | $ | 236,200 | $ | 408,881 | $ | 63,102,709 | ||||||||||
Additions-acquired separately | — | 65,762 | — | 998 | 66,760 | |||||||||||||||
Disposal | — | (81,415 | ) | — | (33 | ) | (81,448 | ) | ||||||||||||
Effect of foreign exchange difference | — | 27 | — | — | 27 | |||||||||||||||
Others | — | 1,183 | — | — | 1,183 | |||||||||||||||
|
|
|
|
|
|
|
|
|
| |||||||||||
Balance on June 30, 2016 | $ | 59,209,000 | $ | 3,234,185 | $ | 236,200 | $ | 409,846 | $ | 63,089,231 | ||||||||||
|
|
|
|
|
|
|
|
|
| |||||||||||
Accumulated amortization and impairment | ||||||||||||||||||||
Balance on January 1, 2016 | $ | (10,607,800 | ) | $ | (1,982,992 | ) | $ | (18,055 | ) | $ | (47,084 | ) | $ | (12,655,931 | ) | |||||
Amortization expenses | (1,357,369 | ) | (283,251 | ) | — | (11,409 | ) | (1,652,029 | ) | |||||||||||
Disposal | — | 81,415 | — | 33 | 81,448 | |||||||||||||||
Effect of foreign exchange difference | — | 101 | — | — | 101 | |||||||||||||||
|
|
|
|
|
|
|
|
|
| |||||||||||
Balance on June 30, 2016 | $ | (11,965,169 | ) | $ | (2,184,727 | ) | $ | (18,055 | ) | $ | (58,460 | ) | $ | (14,226,411 | ) | |||||
|
|
|
|
|
|
|
|
|
| |||||||||||
Balance on January 1, 2016, net | $ | 48,601,200 | $ | 1,265,636 | $ | 218,145 | $ | 361,797 | $ | 50,446,778 | ||||||||||
|
|
|
|
|
|
|
|
|
| |||||||||||
Balance on June 30, 2016, net | $ | 47,243,831 | $ | 1,049,458 | $ | 218,145 | $ | 351,386 | $ | 48,862,820 | ||||||||||
|
|
|
|
|
|
|
|
|
| |||||||||||
For long-term business development, Chunghwa participated in mobile broadband license (4G license) in 2.5 and 2.6 GHz bands bidding process announced by NCC and obtained certain spectrums. Chunghwa paid the 4G concession fees amounting to $9,955,000 thousand in December 2015.
The concessions are granted and issued by the NCC. The concession fees are amortized using the straight-line method from the date operations commence through the date the license expires. The carrying amount of 3G concession fee will be fully amortized by December 2018, and 4G concession fees will be fully amortized by December 2030 and December 2033.
- 30 -
The computer software is amortized using the straight-line method over the estimated useful lives of 1 to 10 years. Other intangible assets are amortized using the straight-line method over the estimated useful lives of 3 to 20 years. Goodwill is not amortized.
| 20. | OTHER ASSETS |
| June 30, 2016 | December 31, 2015 | June 30, 2015 | ||||||||||
Spare parts | $ | 1,786,704 | $ | 1,875,759 | $ | 2,222,508 | ||||||
Refundable deposits | 1,999,865 | 2,198,378 | 2,371,254 | |||||||||
Other financial assets | 1,000,000 | 1,000,000 | 1,000,000 | |||||||||
Others | 3,460,874 | 2,848,130 | 2,143,349 | |||||||||
|
|
|
|
|
| |||||||
| $ | 8,247,443 | $ | 7,922,267 | $ | 7,737,111 | |||||||
|
|
|
|
|
| |||||||
Current | ||||||||||||
Spare parts | $ | 1,786,704 | $ | 1,875,759 | $ | 2,222,508 | ||||||
Others | 1,313,525 | 460,162 | 271,357 | |||||||||
|
|
|
|
|
| |||||||
| $ | 3,100,229 | $ | 2,335,921 | $ | 2,493,865 | |||||||
|
|
|
|
|
| |||||||
Noncurrent | ||||||||||||
Refundable deposits | $ | 1,999,865 | $ | 2,198,378 | $ | 2,371,254 | ||||||
Other financial assets | 1,000,000 | 1,000,000 | 1,000,000 | |||||||||
Others | 2,147,349 | 2,387,968 | 1,871,992 | |||||||||
|
|
|
|
|
| |||||||
| $ | 5,147,214 | $ | 5,586,346 | $ | 5,243,246 | |||||||
|
|
|
|
|
| |||||||
Other financial assets - noncurrent was Piping Fund. As part of the government’s effort to upgrade the existing telecommunications infrastructures, Chunghwa and other public utility companies were required by the ROC government to contribute to a Piping Fund administered by the Taipei City Government. This fund was used to finance various telecommunications infrastructure projects. Net assets of this fund will be returned proportionately after the project is completed.
| 21. | HEDGING DERIVATIVE INSTRUMENTS |
| June 30, 2016 | December 31, 2015 | June 30, 2015 | ||||||||||
Hedge on derivative financial assets | ||||||||||||
Cash flow hedge - forward exchange contracts | $ | — | $ | 498 | $ | — | ||||||
|
|
|
|
|
| |||||||
Hedge on derivative financial liabilities | ||||||||||||
Cash flow hedge - forward exchange contracts | $ | 3,430 | $ | — | $ | — | ||||||
|
|
|
|
|
| |||||||
Chunghwa’s hedge strategy is to enter forward exchange contracts - buy to avoid its foreign currency exposure to certain foreign currency denominated payments in the following six months. In addition, Chunghwa’s management considers the market condition to determine the hedge ratio, and enters into forward exchange contracts with the banks to avoid the foreign currency risk.
- 31 -
Chunghwa signed equipment purchase contracts with suppliers, and entered into forward exchange contracts to avoid foreign currency risk exposure to Euro-denominated purchase commitments. Those forward exchange contracts were designated as cash flow hedges. For the three months and six months ended June 30, 2016, loss arising from changes in fair value of the hedged items recognized in other comprehensive income was $5,148 thousand and $3,927 thousand, respectively. For the three months and six months ended June 30, 2015, gain arising from changes in fair value of the hedged items recognized in other comprehensive income was nil, and $283 thousand, respectively. Upon the completion of the purchase transaction, the amount deferred and recognized in equity initially will be reclassified into equipment as its carrying value.
For the three months and six months ended June 30, 2016, Chunghwa expected part of the equipment purchase transactions will not occur and reclassified the related net loss of $62 thousand and net gain of $696 thousand, respectively, arising from the forward exchange contracts of the aforementioned transactions from equity to profit or loss. No such situation occurred for the six months ended June 30, 2015.
The outstanding forward exchange contracts at the balance sheet dates were as follows:
| Contract Amount | ||||||||||||
| Currency | Maturity Period | (Thousands) | ||||||||||
June 30, 2016 | ||||||||||||
Forward exchange contracts - buy | EUR/NT$ | 2016.09 | EUR5,081/NT$185,977 | |||||||||
December 31, 2015 | ||||||||||||
Forward exchange contracts - buy | EUR/NT$ | 2016.03-06 | EUR8,532/NT$306,435 | |||||||||
As of June 30, 2015, Chunghwa had no outstanding forward exchange contracts applied for hedge accounting.
Loss (gain) arising from the hedging derivative instruments that have been reclassified from equity to initial cost of the property, plant and equipment were as follows:
| For the Three Months Ended June 30 | For the Six Months Ended June 30 | |||||||||||||||
| 2016 | 2015 | 2016 | 2015 | |||||||||||||
Construction in progress and advances related to acquisition of equipment | $ | 1,912 | $ | — | $ | (1,603 | ) | $ | 6,638 | |||||||
|
|
|
|
|
|
|
| |||||||||
| 22. | SHORT-TERM LOANS |
| June 30, 2016 | December 31, 2015 | June 30, 2015 | ||||
Unsecured loans | $60,000 | $110,000 | $860,000 | |||
|
|
| ||||
Annual interest rates | 2.15%-2.35% | 1.29%-2.40% | 1.20%-2.40% |
- 32 -
| 23. | LONG-TERM LOANS (INCLUDING LONG-TERM LOANS - CURRENT PORTION) |
| June 30, 2016 | December 31, 2015 | June 30, 2015 | ||||||||||
Secured loans (Note 40) | $ | 1,600,000 | $ | 1,750,000 | $ | 1,800,000 | ||||||
Less: Current portion of long-term loans | — | (7,692 | ) | (2,564 | ) | |||||||
|
|
|
|
|
| |||||||
| $ | 1,600,000 | $ | 1,742,308 | $ | 1,797,436 | |||||||
|
|
|
|
|
| |||||||
The annual interest rates of loans were as follows:
| June 30, 2016 | December 31, 2015 | June 30, 2015 | ||||
Secured loans | 0.98% | 1.11%-1.36% | 1.14%-1.50% |
LED obtained a secured loan from Chang Hwa Bank in September 2010. Interest is paid monthly. $300,000 thousand and $1,350,000 thousand were originally due in December 2014 and September 2015, respectively. In October 2014, the bank borrowing mentioned above was extended to September 2018 for one time repayment. LED has made an early repayment of $50,000 thousand in April 2015. LED obtained another secured loan from Chang Hwa Bank in December 2012 in the amount of $400,000 thousand which will be due in December 2017; LED has made early repayments of $350,000 thousand and $50,000 thousand in 2013 and January 2015, respectively.
CHPT entered into a secured loan contract of $348,000 thousand with Bank of Taiwan in April 2014, interest will be paid monthly, amortization of principle will begin in May 2016, and the contract will expire in April 2029. CHPT made early repayments of $148,000 thousand, $50,000 thousand and $150,000 thousand from September to December 2014, in November 2015, and from March to April 2016, respectively.
| 24. | TRADE NOTES AND ACCOUNTS PAYABLE |
June 30, 2016 | December 31, 2015 | June 30, 2015 | ||||||||||
Trade notes and accounts payable | $ | 15,261,297 | $ | 16,300,993 | $ | 15,318,154 | ||||||
|
|
|
|
|
| |||||||
Trade notes and accounts payable were attributable to operating activities and the trading conditions were agreed separately.
| 25. | OTHER PAYABLES |
| June 30, 2016 | December 31, 2015 | June 30, 2015 | ||||||||||
Accrued salary and compensation | $ | 6,063,668 | $ | 10,429,648 | $ | 5,928,006 | ||||||
Accrued remuneration to employees, directors and supervisors | 3,227,297 | 2,190,085 | 2,642,405 | |||||||||
Payables to equipment suppliers | 1,465,636 | 1,540,532 | 685,049 | |||||||||
Amounts collected for others | 1,415,072 | 1,406,000 | 1,151,659 | |||||||||
Accrued maintenance costs | 1,062,234 | 997,833 | 926,516 | |||||||||
(Continued)
- 33 -
June 30, 2016 | December 31, 2015 | June 30, 2015 | ||||||||||
Payables to contractors | $ | 757,723 | $ | 1,451,584 | $ | 780,418 | ||||||
Accrued franchise fees | 672,745 | 1,401,490 | 709,202 | |||||||||
Others | 7,805,915 | 6,069,794 | 7,358,552 | |||||||||
|
|
|
|
|
| |||||||
| $ | 22,470,290 | $ | 25,486,966 | $ | 20,181,807 | |||||||
|
|
|
|
|
| |||||||
(Concluded)
| 26. | PROVISIONS |
| June 30, 2016 | December 31, 2015 | June 30, 2015 | ||||||||||
Warranties | $ | 140,475 | $ | 213,114 | $ | 238,393 | ||||||
Employee benefits | 31,663 | 30,108 | 59,380 | |||||||||
Others | 4,652 | 4,682 | 4,832 | |||||||||
|
|
|
|
|
| |||||||
| $ | 176,790 | $ | 247,904 | $ | 302,605 | |||||||
|
|
|
|
|
| |||||||
Current | $ | 118,160 | $ | 189,746 | $ | 253,430 | ||||||
Noncurrent | 58,630 | 58,158 | 49,175 | |||||||||
|
|
|
|
|
| |||||||
| $ | 176,790 | $ | 247,904 | $ | 302,605 | |||||||
|
|
|
|
|
| |||||||
| Warranties | Employee Benefits | Others | Total | |||||||||||||
Balance on January 1, 2015 | $ | 211,633 | $ | 55,569 | $ | 4,832 | $ | 272,034 | ||||||||
Additional provisions recognized | 112,933 | 3,811 | — | 116,744 | ||||||||||||
Used during the period | (86,173 | ) | — | — | (86,173 | ) | ||||||||||
|
|
|
|
|
|
|
| |||||||||
Balance on June 30, 2015 | $ | 238,393 | $ | 59,380 | $ | 4,832 | $ | 302,605 | ||||||||
|
|
|
|
|
|
|
| |||||||||
Balance on January 1, 2016 | $ | 213,114 | $ | 30,108 | $ | 4,682 | $ | 247,904 | ||||||||
Additional provisions recognized | 31,849 | 2,173 | 30 | 34,052 | ||||||||||||
Used during the period | (104,488 | ) | (618 | ) | (60 | ) | (105,166 | ) | ||||||||
|
|
|
|
|
|
|
| |||||||||
Balance on June 30, 2016 | $ | 140,475 | $ | 31,663 | $ | 4,652 | $ | 176,790 | ||||||||
|
|
|
|
|
|
|
| |||||||||
| a. | The provision for warranties claims represents the present value of the management’s best estimate of the future outflow of economic benefits that will be required under the Company’s obligation for warranties in sales agreements. The estimate has been made based on the historical warranty experience. |
| b. | The provision for employee benefits represents vested long-term service compensation accrued. |
- 34 -
| 27. | ADVANCE RECEIPTS |
Advance receipts are mainly from advance telecommunication charges. In accordance with NCC’s regulation named “Mandatory and Prohibitory Provisions To Be Included In Standard Contracts for Telecommunication Goods (Services) Coupons”, the Company entered into a contract with Bank of Taiwan to provide a performance guarantee for advance receipts from selling prepaid cards amounting to $1,195,513 thousand as of June 30, 2016.
| 28. | RETIREMENT BENEFIT PLANS |
According to the Article 56 of the Labor Standards Law revised in February 2015, entities are required to contribute the difference in one appropriation to their pension funds before the end of next March when the balance of the Funds is insufficient to pay the eligible employees who meet the retirement criteria in the following year. Chunghwa contributed $8,842,925 thousand to its pension fund on March 31, 2016.
Relevant pension costs for defined benefit plans which were determined by the pension cost rates of actuarial valuation as of December 31, 2015 and 2014 were as follows:
| For the Three Months Ended June 30 | For the Six Months Ended June 30 | |||||||||||||||
| 2016 | 2015 | 2016 | 2015 | |||||||||||||
Operating costs | $ | 432,922 | $ | 448,163 | $ | 866,858 | $ | 897,053 | ||||||||
Marketing expenses | 209,652 | 214,383 | 418,012 | 426,710 | ||||||||||||
General and administrative expenses | 38,741 | 40,496 | 77,665 | 82,051 | ||||||||||||
Research and development expenses | 24,382 | 25,448 | 48,918 | 51,089 | ||||||||||||
|
|
|
|
|
|
|
| |||||||||
| $ | 705,697 | $ | 728,490 | $ | 1,411,453 | $ | 1,456,903 | |||||||||
|
|
|
|
|
|
|
| |||||||||
| 29. | EQUITY |
| a. | Share capital |
| 1) | Common stocks |
June 30, 2016 | December 31, 2015 | June 30, 2015 | ||||||||||
Number of authorized shares (thousand) | 12,000,000 | 12,000,000 | 12,000,000 | |||||||||
|
|
|
|
|
| |||||||
Authorized shares | $ | 120,000,000 | $ | 120,000,000 | $ | 120,000,000 | ||||||
|
|
|
|
|
| |||||||
Number of issued and paid shares (thousand) | 7,757,447 | 7,757,447 | 7,757,447 | |||||||||
|
|
|
|
|
| |||||||
Issued shares | $ | 77,574,465 | $ | 77,574,465 | $ | 77,574,465 | ||||||
|
|
|
|
|
| |||||||
The issued common stocks of a par value at $10 per share entitled the right to vote and receive dividends.
- 35 -
| 2) | Global depositary receipts |
For the purpose of privatizing Chunghwa, the MOTC sold 1,109,750 thousand common stocks of Chunghwa in an international offering of securities in the form of American Depositary Shares (“ADS”) amounting to 110,975 thousand units (one ADS represents 10 common stocks) on the New York Stock Exchange on July 17, 2003. Afterwards, the MOTC sold 1,350,682 thousand common stocks in the form of ADS amounting to 135,068 thousand units on August 10, 2005. Subsequently, the MOTC and Taiwan Mobile Co., Ltd. sold 505,389 thousand and 58,959 thousand common stocks of Chunghwa, respectively, in the form of ADS totally amounting to 56,435 thousand units on September 29, 2006. The MOTC and Taiwan Mobile Co., Ltd. have sold 3,024,780 thousand common stocks in the form of ADS amounting to 302,478 thousand units. As of June 30, 2016, the outstanding ADSs were 404,564 thousand common stocks, which equaled 40,456 thousand units and represented 5.21% of Chunghwa’s total outstanding common stocks.
The ADS holders generally have the same rights and obligations as other common stockholders, subject to the provision of relevant laws. The exercise of such rights and obligations shall comply with the related regulations and deposit agreement, which stipulate, among other things, that ADS holders are entitled to, through deposit agents:
| a) | Exercise their voting rights, |
| b) | Sell their ADSs, and |
| c) | Receive dividends declared and subscribe to the issuance of new shares. |
| b. | Additional paid-in capital |
The adjustment of additional paid-in capital for the six months ended June 30, 2016 and 2015 were as follows:
| Share Premium | Movements of Additional Paid-in Capital for Associates and Joint Ventures Accounted for Using Equity Method | Movements of Additional Paid-in Capital Arising from Changes in Equities of Subsidiaries | Difference between Consideration Received and Carrying Amount of the Subsidiaries’ Net Assets upon Disposal | Donated Capital | Stockholders’ Contribution Due to Privatization | Total | ||||||||||||||||||||||
Balance on January 1, 2015 | $ | 147,329,386 | $ | 43,648 | $ | 13,653 | $ | — | $ | 13,170 | $ | 20,648,078 | $ | 168,047,935 | ||||||||||||||
Change in additional paid-in capital from investments in associates and joint ventures accounted for using equity method | — | (908 | ) | — | — | — | — | (908 | ) | |||||||||||||||||||
Partial disposal of interests in subsidiaries | — | — | — | 26,644 | — | — | 26,644 | |||||||||||||||||||||
Subsidiary purchased its treasury stock | — | — | (8,781 | ) | — | — | — | (8,781 | ) | |||||||||||||||||||
|
|
|
|
|
|
|
|
|
|
|
|
|
| |||||||||||||||
Balance on June 30, 2015 | $ | 147,329,386 | $ | 42,740 | $ | 4,872 | $ | 26,644 | $ | 13,170 | $ | 20,648,078 | $ | 168,064,890 | ||||||||||||||
|
|
|
|
|
|
|
|
|
|
|
|
|
| |||||||||||||||
Balance on January 1, 2016 | $ | 147,329,386 | $ | 78,053 | $ | 284 | $ | 26,644 | $ | 13,170 | $ | 20,648,078 | $ | 168,095,615 | ||||||||||||||
Change in additional paid-in capital from investments in associates and joint ventures accounted for using equity method | — | (1,101 | ) | — | — | — | — | (1,101 | ) | |||||||||||||||||||
Partial disposal of interests in subsidiaries | — | — | — | 58,206 | — | — | 58,206 | |||||||||||||||||||||
Change in additional paid-in capital for not participating in the capital increase of a subsidiary | — | — | 389,740 | — | — | — | 389,740 | |||||||||||||||||||||
Share-based payment transactions of subsidiaries | — | — | 6 | — | — | — | 6 | |||||||||||||||||||||
|
|
|
|
|
|
|
|
|
|
|
|
|
| |||||||||||||||
Balance on June 30, 2016 | $ | 147,329,386 | $ | 76,952 | $ | 390,030 | $ | 84,850 | $ | 13,170 | $ | 20,648,078 | $ | 168,542,466 | ||||||||||||||
|
|
|
|
|
|
|
|
|
|
|
|
|
| |||||||||||||||
- 36 -
Additional paid-in capital may be utilized to offset deficits. However, the additional paid-in capital from share premium, donated capital and the difference between consideration received and the carrying amount of the subsidiaries’ net assets upon disposal may be distributed in cash or capitalized when a company has no deficit, which however is limited to a certain percentage of Chunghwa’s paid-in capital.
The additional paid-in capital from movements of paid-in capital arising from changes in equities of subsidiaries may only be utilized to offset deficits. Movements of additional paid-in capital from investments in associates and joint ventures accounted for using equity method may not be used for any purpose.
| c. | Retained earnings and dividends policy |
In accordance with the amendments to the Company Act of the ROC in May 2015, the recipients of dividends and bonuses are limited to stockholders and do not include employees. To comply with the above amendments to the Company Act of the ROC, amendments to the policy on dividend distribution and the addition of the policy on distribution of employees’ compensation in Chunghwa’s Articles of Incorporation were approved by the stockholders in their meeting on June 24, 2016.
Before distributing a dividend or making any other distribution to stockholders, Chunghwa must pay all outstanding taxes, offset deficits in prior years and set aside a legal reserve equal to 10% of its net income, except when the accumulated amount of such legal reserve equals to the Company’s total authorized capital, and depending on its business needs or requirements, may also set aside or reverse special reserves. In accordance with the amended Chunghwa’s Articles of Incorporation, no less than 50% of the remaining earnings comprising remaining balance of net income, if any, plus cumulative undistributed earnings shall be distributed as stockholders’ dividends, and cash dividends to be distributed shall not be less than 50% of the total amount of dividends to be distributed. If cash dividend to be distributed is less than $0.10 per share, such cash dividend shall be distributed in the form of common stocks.
Information on remuneration for the employees and directors accured based on the pre-amended and amended Chunghwa’s Articles of Incorporation, please refer to Note 31.a.7) - Employee benefit expenses.
The Company should appropriate or reverse a special reserve in accordance with Rule No. 1010012865 and Rule No. 1010047490 issued by the FSC and the directive entitled “Questions and Answers on Special Reserves Appropriated Following the Adoption of Taiwan-IFRSs”. Distributions can be made out of any subsequent reversal of the debit to other equity items.
The appropriation for legal reserve shall be made until the accumulated reserve equals the aggregate par value of the outstanding capital stock of Chunghwa. This reserve can only be used to offset a deficit, or, when the legal reserve has exceeded 25% of Chunghwa’s paid-in capital, the excess may be transferred to capital or distributed in cash.
Except for non-ROC resident stockholders, all stockholders receiving the dividends are entitled a tax credit equal to their proportionate share of the income tax paid by the Company.
The appropriations of the 2014 and 2015 earnings of Chunghwa approved by the stockholders in their meetings on June 26, 2015 and June 24, 2016 were as follows:
| Appropriation of Earnings | Dividends Per Share (NT$) | |||||||||||||||
| For Fiscal Year 2015 | For Fiscal Year 2014 | For Fiscal Year 2015 | For Fiscal Year 2014 | |||||||||||||
Legal reserve | $ | — | $ | 680,743 | ||||||||||||
Special reserve | — | (144,005 | ) | |||||||||||||
Cash dividends | 42,551,146 | 37,673,263 | $ | 5.49 | $ | 4.86 | ||||||||||
- 37 -
Information of the appropriation of Chunghwa’s earnings approved by the Board of Directors and stockholders is available on the Market Observation Post System website.
| d. | Other equity items |
| 1) | Exchange differences arising from the translation of the foreign operations |
The exchange differences arising from the translation of the foreign operations from their functional currency to New Taiwan dollars were recognized as exchange differences arising from the translation of the foreign operations in other comprehensive income.
| 2) | Unrealized gain (loss) on available-for-sale financial assets |
| For the Six Months Ended June 30 | ||||||||
| 2016 | 2015 | |||||||
Beginning balance | $ | 90,964 | $ | 739,988 | ||||
Unrealized gain (loss) on available-for-sale financial assets | (607,197 | ) | (358,993 | ) | ||||
Income tax relating to unrealized gain (loss) on available-for-sale financial assets | (313 | ) | (3,393 | ) | ||||
Amount reclassified from equity to profit or loss on impairment | — | 23,060 | ||||||
|
|
|
| |||||
Ending balance | $ | (516,546 | ) | $ | 400,662 | |||
|
|
|
| |||||
| e. | Noncontrolling interests |
| For the Six Months Ended June 30 | ||||||||
| 2016 | 2015 | |||||||
Beginning balance | $ | 5,269,075 | $ | 5,085,185 | ||||
Shares attributed to noncontrolling interests | ||||||||
Net income of current period | 531,092 | 378,171 | ||||||
Exchange differences arising from the translation of the net investment in foreign operations | (23,079 | ) | (14,037 | ) | ||||
Unrealized gain (loss) on available-for-sale financial assets | 227 | 2,467 | ||||||
Income tax relating to unrealized gain (loss) on available-for-sale financial assets | (39 | ) | (419 | ) | ||||
Share in other comprehensive income (loss) of associates accounted for using equity method | (723 | ) | (1,530 | ) | ||||
Cash dividends distributed by subsidiaries | (709,971 | ) | (354,400 | ) | ||||
Changes in additional paid-in capital from investments in associates and joint ventures accounted for using equity method | 718 | (2,007 | ) | |||||
Share-based payment transactions of subsidiaries | 11,311 | 28,962 | ||||||
Partial disposal of interests in subsidiaries | 25,422 | 18,484 | ||||||
Change in additional paid-in capital for not participating in the capital increase of a subsidiary | 785,769 | — | ||||||
Subsidiary purchased its treasury stock | — | (49,298 | ) | |||||
Decrease in noncontrolling interests | (19,203 | ) | — | |||||
|
|
|
| |||||
Ending balance | $ | 5,870,599 | $ | 5,091,578 | ||||
|
|
|
| |||||
- 38 -
| 30. | REVENUES |
The main source of revenue of the Company includes various telecommunications services in many different streams, please refer to Note 44.
| 31. | NET INCOME AND OTHER COMPREHENSIVE INCOME (LOSS) |
| a. | Net income |
| 1) | Other income and expenses |
| For the Three Months Ended June 30 | For the Six Months Ended June 30 | |||||||||||||||
| 2016 | 2015 | 2016 | 2015 | |||||||||||||
Loss on disposal of property, plant and equipment | $ | (10,692 | ) | $ | (14,662 | ) | $ | (17,042 | ) | $ | (43,762 | ) | ||||
Loss on disposal of intangible assets | — | — | — | (20 | ) | |||||||||||
|
|
|
|
|
|
|
| |||||||||
| $ | (10,692 | ) | $ | (14,662 | ) | $ | (17,042 | ) | $ | (43,782 | ) | |||||
|
|
|
|
|
|
|
| |||||||||
| 2) | Other income |
| For the Three Months Ended June 30 | For the Six Months Ended June 30 | |||||||||||||||
| 2016 | 2015 | 2016 | 2015 | |||||||||||||
Dividend income | $ | 341,339 | $ | 218,172 | $ | 341,339 | $ | 218,172 | ||||||||
Income from Piping Fund | — | — | 201,248 | 200,000 | ||||||||||||
Rental income | 11,641 | 11,199 | 20,086 | 21,016 | ||||||||||||
Others | 52,016 | 41,336 | 207,978 | 84,203 | ||||||||||||
|
|
|
|
|
|
|
| |||||||||
| $ | 404,996 | $ | 270,707 | $ | 770,651 | $ | 523,391 | |||||||||
|
|
|
|
|
|
|
| |||||||||
| 3) | Other gains and losses |
| For the Three Months Ended June 30 | For the Six Months Ended June 30 | |||||||||||||||
| 2016 | 2015 | 2016 | 2015 | |||||||||||||
Gain (loss) on disposal of financial instruments | $ | 19 | $ | — | $ | 19 | $ | (240 | ) | |||||||
Net foreign currency exchange gains (losses) | 36,418 | (59,196 | ) | 43,222 | 107,935 | |||||||||||
Gain on disposal of investments accounted for using equity method | — | 649 | — | 8,058 | ||||||||||||
(Continued)
- 39 -
| For the Three Months Ended June 30 | For the Six Months Ended June 30 | |||||||||||||||
| 2016 | 2015 | 2016 | 2015 | |||||||||||||
Impairment loss on available-for-sale financial assets | $ | — | $ | — | $ | — | $ | (25,910 | ) | |||||||
Valuation loss on financial assets and liabilities at fair value through profit or loss, net | (21,606 | ) | (714 | ) | (14,545 | ) | (1,002 | ) | ||||||||
Others | (12,004 | ) | (135,251 | ) | (21,694 | ) | (157,095 | ) | ||||||||
|
|
|
|
|
|
|
| |||||||||
| $ | 2,827 | $ | (194,512 | ) | $ | 7,002 | $ | (68,254 | ) | |||||||
|
|
|
|
|
|
|
| |||||||||
(Concluded)
| 4) | Impairment loss (reversal of impairment loss) on financial instruments |
| For the Three Months Ended June 30 | For the Six Months Ended June 30 | |||||||||||||||
| 2016 | 2015 | 2016 | 2015 | |||||||||||||
Notes and accounts receivable | $ | 242,315 | $ | 311 | $ | 358,162 | $ | 173,536 | ||||||||
|
|
|
|
|
|
|
| |||||||||
Other receivables | $ | (2,323 | ) | $ | 9,384 | $ | (1,305 | ) | $ | 16,423 | ||||||
|
|
|
|
|
|
|
| |||||||||
Available-for-sale financial assets | $ | — | $ | — | $ | — | $ | 25,910 | ||||||||
|
|
|
|
|
|
|
| |||||||||
| 5) | Impairment loss on non-financial assets |
| For the Three Months Ended June 30 | For the Six Months Ended June 30 | |||||||||||||||
| 2016 | 2015 | 2016 | 2015 | |||||||||||||
Inventories | $ | 52,971 | $ | 37,970 | $ | 156,944 | $ | 91,356 | ||||||||
|
|
|
|
|
|
|
| |||||||||
| 6) | Depreciation and amortization expenses |
| For the Three Months Ended June 30 | For the Six Months Ended June 30 | |||||||||||||||
| 2016 | 2015 | 2016 | 2015 | |||||||||||||
Property, plant and equipment | $ | 7,250,492 | $ | 7,626,646 | $ | 14,590,926 | $ | 15,405,704 | ||||||||
Investment property | 4,685 | 4,480 | 9,369 | 8,960 | ||||||||||||
Intangible assets | 870,085 | 769,135 | 1,652,029 | 1,539,430 | ||||||||||||
|
|
|
|
|
|
|
| |||||||||
Total depreciation and amortization expenses | $ | 8,125,262 | $ | 8,400,261 | $ | 16,252,324 | $ | 16,954,094 | ||||||||
|
|
|
|
|
|
|
| |||||||||
(Continued)
- 40 -
| For the Three Months Ended June 30 | For the Six Months Ended June 30 | |||||||||||||||
| 2016 | 2015 | 2016 | 2015 | |||||||||||||
Depreciation expenses summarized by functions | ||||||||||||||||
Operating costs | $ | 6,777,087 | $ | 7,106,763 | $ | 13,629,128 | $ | 14,356,459 | ||||||||
Operating expenses | 478,090 | 524,363 | 971,167 | 1,058,205 | ||||||||||||
|
|
|
|
|
|
|
| |||||||||
| $ | 7,255,177 | $ | 7,631,126 | $ | 14,600,295 | $ | 15,414,664 | |||||||||
|
|
|
|
|
|
|
| |||||||||
Amortization expenses summarized by functions | ||||||||||||||||
Operating costs | $ | 783,710 | $ | 685,640 | $ | 1,476,934 | $ | 1,372,132 | ||||||||
Marketing expenses | 43,528 | 44,629 | 90,138 | 89,500 | ||||||||||||
General and administrative expenses | 32,799 | 27,951 | 65,129 | 55,140 | ||||||||||||
Research and development expenses | 10,048 | 10,915 | 19,828 | 22,658 | ||||||||||||
|
|
|
|
|
|
|
| |||||||||
| $ | 870,085 | $ | 769,135 | $ | 1,652,029 | $ | 1,539,430 | |||||||||
|
|
|
|
|
|
|
| |||||||||
(Concluded)
| 7) | Employee benefit expenses |
| For the Three Months Ended June 30 | For the Six Months Ended June 30 | |||||||||||||||
| 2016 | 2015 | 2016 | 2015 | |||||||||||||
Post-employment benefit | ||||||||||||||||
Defined contribution plans | $ | 134,682 | $ | 119,921 | $ | 265,498 | $ | 238,259 | ||||||||
Defined benefit plans | 705,697 | 728,490 | 1,411,453 | 1,456,903 | ||||||||||||
|
|
|
|
|
|
|
| |||||||||
| 840,379 | 848,411 | 1,676,951 | 1,695,162 | |||||||||||||
|
|
|
|
|
|
|
| |||||||||
Share-based payment | ||||||||||||||||
Equity-settled share-based payment | 5,651 | 14,481 | 11,317 | 28,962 | ||||||||||||
|
|
|
|
|
|
|
| |||||||||
Other employee benefit | ||||||||||||||||
Salaries | 6,469,397 | 6,429,917 | 12,914,078 | 12,687,614 | ||||||||||||
Insurance | 644,610 | 656,945 | 1,319,271 | 1,309,599 | ||||||||||||
Others | 4,040,044 | 3,893,542 | 8,046,581 | 7,573,553 | ||||||||||||
|
|
|
|
|
|
|
| |||||||||
| 11,154,051 | 10,980,404 | 22,279,930 | 21,570,766 | |||||||||||||
|
|
|
|
|
|
|
| |||||||||
Total employee benefit expenses | $ | 12,000,081 | $ | 11,843,296 | $ | 23,968,198 | $ | 23,294,890 | ||||||||
|
|
|
|
|
|
|
| |||||||||
(Continued)
- 41 -
| For the Three Months Ended June 30 | For the Six Months Ended June 30 | |||||||||||||||
| 2016 | 2015 | 2016 | 2015 | |||||||||||||
Summary by functions | ||||||||||||||||
Operating costs | $ | 6,366,942 | $ | 5,928,137 | $ | 12,715,412 | $ | 12,520,634 | ||||||||
Operating expenses | 5,633,139 | 5,915,159 | 11,252,786 | 10,774,256 | ||||||||||||
|
|
|
|
|
|
|
| |||||||||
| $ | 12,000,081 | $ | 11,843,296 | $ | 23,968,198 | $ | 23,294,890 | |||||||||
|
|
|
|
|
|
|
| |||||||||
(Concluded)
In order to comply with the Company Act as amended in May 2015, the amendments to Chunghwa’s Articles of Incorporation was approved by the Chunghwa’s stockholders in their meeting on June 24, 2016 which stipulated to distribute employees’ compensation for the three months and six months ended June 30, 2016, at the rates from 1.7% to 4.3% and remuneration to directors for the three months and six months ended June 30, 2016, at the rate not higher than 0.17%, respectively, of pre-tax income. The compensation to the employees and remuneration to the directors for the three months and six months ended June 30, 2015 were accured based on the pre-amended Chunghwa’s Articles of Incorporation at the rate from 2% to 5% and not higher than 0.2% of distributed earnings.
If there is a change in the proposed amounts after the annual financial statements are authorized for issue, the differences are recorded as a change in accounting estimate.
The compensation to the employees and remuneration to the directors of 2015 and the bonus to the employees and remuneration to the directors of 2014 approved by the stockholders in their meeting on June 24, 2016 and June 26, 2015, respectively, were as follows. The compensation to the employees and remuneration to the directors of the 2015 were presented after the approval of amendments of Chunghwa’s Articles of Incorporation in stockholders’ meeting on June 24, 2016.
| 2015 | 2014 | |||||||
| Cash Compensation | Cash Bonus | |||||||
Compensation or bonus distributed to the employees | $ | 1,927,518 | $ | 1,510,068 | ||||
Remuneration paid to the directors | 44,852 | 39,223 | ||||||
There was no difference between the initial accrual amounts and the amounts approved in stockholders’ meeting in 2016 and 2015 of the aforementioned compensation, bonuses to employees and the remuneration to directors.
Information of the appropriation of Chunghwa’s employees compensation, bonuses and remuneration to directors and those approved by the Board of Directors and stockholders is available on the Market Observation Post System website.
- 42 -
| b. | Reclassification adjustments of other comprehensive income (loss) |
| For the Three Months Ended June 30 | For the Six Months Ended June 30 | |||||||||||||||
| 2016 | 2015 | 2016 | 2015 | |||||||||||||
Unrealized gain (loss) on available-for-sale financial assets | ||||||||||||||||
Arising during the current period | $ | (482,950 | ) | $ | (761,656 | ) | $ | (606,970 | ) | $ | (359,376 | ) | ||||
Reclassification adjustments | ||||||||||||||||
Upon impairment | — | — | — | 25,910 | ||||||||||||
|
|
|
|
|
|
|
| |||||||||
| $ | (482,950 | ) | $ | (761,656 | ) | $ | (606,970 | ) | $ | (333,466 | ) | |||||
|
|
|
|
|
|
|
| |||||||||
Cash flow hedges | ||||||||||||||||
Loss arising during the current period | $ | (7,122 | ) | $ | — | $ | (1,628 | ) | $ | (6,355 | ) | |||||
Reclassification adjustments included in profit or loss | 62 | — | (696 | ) | — | |||||||||||
Adjusted against the carrying amount of hedged items | 1,912 | — | (1,603 | ) | 6,638 | |||||||||||
|
|
|
|
|
|
|
| |||||||||
| $ | (5,148 | ) | $ | — | $ | (3,927 | ) | $ | 283 | |||||||
|
|
|
|
|
|
|
| |||||||||
| 32. | INCOME TAX |
| a. | Income tax recognized in profit or loss |
The major components of income tax expense were as follows:
| For the Three Months Ended June 30 | For the Six Months Ended June 30 | |||||||||||||||
| 2016 | 2015 | 2016 | 2015 | |||||||||||||
Current tax | ||||||||||||||||
Current tax expenses recognized for the current period | $ | 2,136,627 | $ | 2,236,882 | $ | 2,958,253 | $ | 4,313,463 | ||||||||
Income tax on unappropriated earnings | 19,230 | 21,627 | 19,230 | 21,627 | ||||||||||||
Income tax adjustments on prior years | 5,809 | (11,964 | ) | 4,462 | (84,374 | ) | ||||||||||
Others | 3,696 | 610 | 5,787 | 740 | ||||||||||||
|
|
|
|
|
|
|
| |||||||||
| 2,165,362 | 2,247,155 | 2,987,732 | 4,251,456 | |||||||||||||
(Continued)
- 43 -
| For the Three Months Ended June 30 | For the Six Months Ended June 30 | |||||||||||||||
| 2016 | 2015 | 2016 | 2015 | |||||||||||||
Deferred tax | ||||||||||||||||
Deferred tax expenses recognized for the current period | $ | (8,230 | ) | $ | (59,889 | ) | $ | 1,526,008 | $ | (108,925 | ) | |||||
|
|
|
|
|
|
|
| |||||||||
Income tax recognized in profit or loss | $ | 2,157,132 | $ | 2,187,266 | $ | 4,513,740 | $ | 4,142,531 | ||||||||
|
|
|
|
|
|
|
| |||||||||
(Concluded)
| b. | Income tax expense (benefit) recognized in other comprehensive income |
| For the Three Months Ended June 30 | For the Six Months Ended June 30 | |||||||||||||||
| 2016 | 2015 | 2016 | 2015 | |||||||||||||
Deferred tax | ||||||||||||||||
Unrealized (gain) loss on available-for-sale financial assets | $ | (972 | ) | $ | 484 | $ | 352 | $ | 3,812 | |||||||
|
|
|
|
|
|
|
| |||||||||
| c. | The related information under the Integrated Income Tax System was as follows: |
Unappropriated earnings information
As of June 30, 2016, December 31, 2015 and June 30, 2015, all Chunghwa’s unappropriated earnings are generated after the adoption of Integrated Income Tax System.
Imputation credit account
June 30, 2016 | December 31, 2015 | June 30, 2015 | ||||||||||
Balance of Imputation Credit Account (“ICA”) | $ | 11,843,019 | $ | 7,516,432 | $ | 11,432,417 | ||||||
|
|
|
|
|
| |||||||
The creditable ratios for distribution of earnings of 2015 and 2014 were 20.48%, respectively. Effective from January 1, 2015, the creditable ratio for individual stockholders residing in the Republic of China is half of the original creditable ratio according to the revised Article 66-6 of the Income Tax Law of the ROC.
| d. | Income tax examinations |
Income tax returns of Chunghwa have been examined by the tax authorities through 2012. Income tax returns of SENAO, CHIEF, CHSI, CHPT, LED and Youth have been examined by the tax authorities through 2013. Income tax returns of CHST, CHYP, Unigate, SFD, ISPOT, Youyi, SHE, CEI, CHI and HHI have been examined by the tax authorities through 2014. Income tax return of CHI’s 2014 current final report on total business income to liquidation date has been examined by the tax authorities.
- 44 -
| 33. | EARNINGS PER SHARE (“EPS”) |
Net income and weighted average number of common stocks used in the calculation of earnings per share were as follows:
Net Income
| For the Three Months Ended June 30 | For the Six Months Ended June 30 | |||||||||||||||
| 2016 | 2015 | 2016 | 2015 | |||||||||||||
Net income used to compute the basic earnings per share | ||||||||||||||||
Net income attributable to the parent | $ | 11,061,548 | $ | 11,133,809 | $ | 22,729,315 | $ | 21,552,234 | ||||||||
Assumed conversion of all dilutive potential common stocks | ||||||||||||||||
Employee stock options and employee compensation of subsidiaries | (180 | ) | (88 | ) | (266 | ) | (174 | ) | ||||||||
|
|
|
|
|
|
|
| |||||||||
Net income used to compute the diluted earnings per share | $ | 11,061,368 | $ | 11,133,721 | $ | 22,729,049 | $ | 21,552,060 | ||||||||
|
|
|
|
|
|
|
| |||||||||
Weighted Average Number of Common Stocks
(Thousand Shares)
| For the Three Months Ended June 30 | For the Six Months Ended June 30 | |||||||||||||||
| 2016 | 2015 | 2016 | 2015 | |||||||||||||
Weighted average number of common stocks used to compute the basic earnings per share | 7,757,447 | 7,757,447 | 7,757,447 | 7,757,447 | ||||||||||||
Assumed conversion of all dilutive potential common stocks | ||||||||||||||||
Employee compensation | 2,125 | 18,385 | 11,309 | 21,181 | ||||||||||||
|
|
|
|
|
|
|
| |||||||||
Weighted average number of common stocks used to compute the diluted earnings per share | 7,759,572 | 7,775,832 | 7,768,756 | 7,778,628 | ||||||||||||
|
|
|
|
|
|
|
| |||||||||
Because Chunghwa may settle the employee compensation in shares or cash, Chunghwa shall presume that it will be settled in shares and takes those shares into consideration when calculating the weighted average number of outstanding shares used in the calculation of diluted EPS if the shares have a dilutive effect. The dilutive effect of the shares needs to be considered until the approval of compensation to be distributed to employees in the following year.
- 45 -
| 34. | SHARE-BASED PAYMENT ARRANGEMENT |
| a. | SENAO share-based compensation plan (“SENAO Plan”) described as follows: |
Effective Date for Plan Registration | Resolution Date by SENAO’s Board of Directors | Stock Options Units (Thousand) | Exercise Price (NT$) | |||
| 2012.05.28 | 2013.04.29 | 10,000 | $81.40 (Original price $93.00) |
Each option is eligible to subscribe for one common share when exercisable. Under the terms of the SENAO Plan, the options are granted at an exercise price equal to the closing price of the SENAO’s common stocks listed on the TSE on the higher of closing price or par value. The SENAO Plan have exercise price adjustment formula upon the changes in common stocks equity (including cash capital increase, new share issue through capitalization of earnings and additional paid-in capital, merger, spin off and new share issue for Global Depositary Shares, and so on) or distribution of cash dividends. The options of SENAO Plan are valid for six years and the graded vesting schedule is that 50% of option granted will vest two years after the grant date, 75% of option granted will vest three years after the grant date and 100% of option granted will vest four years after the grant date.
Stock options granted on May 7, 2013 applied IFRS 2. The recognized compensation costs were $4,663 thousand and $9,326 thousand for the three months and six months ended June 30, 2016, respectively. The recognized compensation costs were $14,481 thousand and $28,962 thousand for the three months and six months ended June 30, 2015, respectively.
SENAO modified the plan terms of the outstanding stock options in July 2016, the exercise price changed from $81.40 to $76.10 per share. The modification did not cause any incremental fair value granted.
SENAO modified the plan terms of the outstanding stock options in August 2015, the exercise price changed from $84.30 to $81.40 per share. The modification did not cause any incremental fair value granted.
Information about SENAO’s outstanding stock options for the six months ended June 30, 2016 and 2015 were as follows:
| For the Six Months Ended June 30 | ||||||||||||||||
| 2016 | 2015 | |||||||||||||||
| Granted on May 7, 2013 | Granted on May 7, 2013 | |||||||||||||||
Number of Options (Thousand) | Weighted- average | Number of Options (Thousand) | Weighted- average (NT$) | |||||||||||||
Employee stock options | ||||||||||||||||
Options outstanding at beginning of the period | 7,787 | $ | 81.40 | 9,027 | $ | 84.30 | ||||||||||
Options exercised | — | — | — | — | ||||||||||||
Options forfeited | (610 | ) | — | (592 | ) | — | ||||||||||
|
|
|
| |||||||||||||
Options outstanding at end of the period | 7,177 | 81.40 | 8,435 | 84.30 | ||||||||||||
|
|
|
| |||||||||||||
Options exercisable at end of the period | 5,383 | 81.40 | 4,218 | 84.30 | ||||||||||||
|
|
|
| |||||||||||||
- 46 -
As of June 30, 2016, information about employee stock options outstanding was as follows:
Options Outstanding | Options Exercisable | |||||||||
Range of Exercise Price (NT$) | Number of (Thousand) | Weighted Average Remaining Contractual Life (Years) | Weighted Price (NT$) | Number of (Thousand) | Weighted Price (NT$) | |||||
| $81.40 | 7,177 | 2.85 | $81.40 | 5,383 | $81.40 | |||||
As of December 31, 2015, information about employee stock options outstanding was as follows:
Options Outstanding | Options Exercisable | |||||||||
Range of Exercise Price (NT$) | Number of (Thousand) | Weighted Average Remaining Contractual Life (Years) | Weighted Price (NT$) | Number of (Thousand) | Weighted Price (NT$) | |||||
| $81.40 | 7,787 | 3.35 | $81.40 | 4,049 | $81.40 | |||||
As of June 30, 2015, information about employee stock options outstanding was as follows:
Options Outstanding | Options Exercisable | |||||||||
Range of Exercise Price (NT$) | Number of (Thousand) | Weighted Average Remaining Contractual Life (Years) | Weighted Price (NT$) | Number of (Thousand) | Weighted Price (NT$) | |||||
| $84.30 | 8,435 | 3.85 | $84.30 | 4,218 | $84.30 | |||||
SENAO used the fair value method to evaluate the options using the Black-Scholes model and the related assumptions and the fair value of the options were as follows:
| Stock Options Granted on May 7, 2013 | ||||
Grant-date share price (NT$) | $ | 93.00 | ||
Dividends yield | — | |||
Risk-free interest rate | 0.91 | % | ||
Expected life | 4.375 years | |||
Expected volatility | 36.22 | % | ||
Weighted average fair value of grants (NT$) | $ | 28.72 | ||
Expected volatility was based on the historical share price volatility of SENAO over the period equal to the expected life of SENAO Plan.
- 47 -
| b. | CHIEF share-based compensation plan (“CHIEF Plan”) described as follows: |
Effective Date for Plan Registration | Resolution Date by CHIEF’s Board of Directors | Stock Options Units | Exercise Price (NT$) | |||
| 2015.10.22 | 2015.10.22 | 2,000 | $43.00 |
Each option is eligible to subscribe for one thousand common stocks when exercisable. Under the terms of the CHIEF Plan, the options are granted at an exercise price equal to $43.00. The options are granted to specific employees that meet the vesting conditions. The CHIEF Plan has exercise price adjustment formula upon the changes in common stocks or distribution of cash dividends. The options of CHIEF Plan are valid for five years and the graded vesting schedule will vest two years after the grant date.
Stock options granted on October 22, 2015 applied IFRS 2. The recognized compensation cost were $988 thousand and $1,975 thousand for the three months and six months ended June 30, 2016, respectively.
Information about CHIEF’s outstanding stock options for the six months ended June 30, 2016 was as follows:
| For the Six Months Ended June 30 | ||||||||
| Granted on October 22, 2015 | ||||||||
Number of Options | Weighted Price (NT$) | |||||||
Employee stock options | ||||||||
Options outstanding at beginning of the period | 2,000 | $ | 43.00 | |||||
Options forfeited | (40 | ) | — | |||||
|
| |||||||
Options outstanding at end of the period | 1,960 | 43.00 | ||||||
|
| |||||||
Option exercisable at end of the period | — | — | ||||||
|
| |||||||
As of June 30, 2016, information about employee stock options outstanding was as follows:
Options Outstanding | Options Exercisable | |||||||||
Range of Exercise Price (NT$) | Number of Options | Weighted Average Remaining Contractual Life (Years) | Weighted Average Exercise Price (NT$) | Number of Options | Weighted Price (NT$) | |||||
| $43.00 | 1,960 | 4.31 | $43.00 | — | $— | |||||
- 48 -
As of December 31, 2015, information about employee stock options outstanding was as follows:
Options Outstanding | Options Exercisable | |||||||||
Range of Exercise Price (NT$) | Number of Options | Weighted Average Remaining Contractual Life (Years) | Weighted Average Exercise Price (NT$) | Number of Options | Weighted Price (NT$) | |||||
| $43.00 | 2,000 | 4.81 | $43.00 | — | $— | |||||
CHIEF used the fair value method to evaluate the options using the binomial option pricing model and the related assumptions and the fair value of the options were as follows:
| Stock Options Granted on October 22, 2015 | ||||
Grant-date share price (NT$) | $ | 39.55 | ||
Dividends yield | — | |||
Risk-free interest rate | 0.86 | % | ||
Expected life | 5 years | |||
Expected volatility | 21.02 | % | ||
Weighted average fair value of grants (NT$) | $ | 4,863 | ||
Expected volatility was based on the average annualized historical share price volatility of CHIEF’s comparable companies before the grant date.
| c. | New shares reserved for subscription by employees under cash injection of CHPT |
On December 8, 2015, the Board of Directors of CHPT approved the cash injection to issue 2,787 thousand shares and simultaneously reserved 418 thousand shares for subscription by employees according to the Company Act of the ROC. Furthermore, when the employees do not subscribe some or all of the shares, the Board of Directors of CHPT authorizes the chairman of the Board of Directors to contact specific people or group to subscribe.
The aforementioned options granted to employees are accounted for and measured at fair value in accordance with IFRS 2. The recognized compensation cost was $16 thousand for the six months ended June 30, 2016.
CHPT used the fair value method to evaluate the options granted to employees on March 10, 2016 using the Black-Scholes model and the related assumptions and the fair value of the options were as follows:
| Stock Options Granted on March 10, 2016 | ||||
Grant-date share price (NT$) | $ | 302.46 | ||
Exercise price (NT$) | $ | 360.00 | ||
Dividends yield | — | |||
Risk-free interest rate | 0.37 | % | ||
Expected life | 12 days | |||
Expected volatility | 37.43 | % | ||
Weighted average fair value of grants (NT$) | $ | 0.04 | ||
- 49 -
Expected volatility was based on the average annualized historical share price volatility of CHPT’s comparable companies before the grant date.
| 35. | NON-CASH TRANSACTIONS |
For the six months ended June 30, 2016 and 2015, the Company entered into the following non-cash investing activities:
| For the Six Months Ended June 30 | ||||||||
| 2016 | 2015 | |||||||
Increase in property, plant and equipment | $ | 6,031,962 | $ | 8,055,051 | ||||
Movements on other payables | 789,006 | 2,265,340 | ||||||
|
|
|
| |||||
| $ | 6,820,968 | $ | 10,320,391 | |||||
|
|
|
| |||||
| 36. | OPERATING LEASE ARRANGEMENTS |
| a. | The Company as lessee |
Except for the ST-2 satellite referred in Note 39 to the consolidated financial statements, the Company entered into several lease agreements for base stations located all over in Taiwan. The future aggregate minimum lease payments under non-cancellable operating leases are as follows:
| June 30, 2016 | December 31, 2015 | June 30, 2015 | ||||||||||
Within one year | $ | 2,935,732 | $ | 3,172,484 | $ | 2,860,990 | ||||||
Longer than one year but within five years | 5,806,449 | 5,614,320 | 5,761,701 | |||||||||
Longer than five years | 1,142,867 | 1,185,763 | 1,334,333 | |||||||||
|
|
|
|
|
| |||||||
| $ | 9,885,048 | $ | 9,972,567 | $ | 9,957,024 | |||||||
|
|
|
|
|
| |||||||
| b. | The Company as lessor |
The Company leases out some land and buildings. The future aggregate minimum lease collection under non-cancellable operating leases are as follows:
| June 30, 2016 | December 31, 2015 | June 30, 2015 | ||||||||||
Within one year | $ | 459,049 | $ | 398,832 | $ | 384,347 | ||||||
Longer than one year but within five years | 626,870 | 526,686 | 549,066 | |||||||||
Longer than five years | 305,699 | 374,400 | 406,300 | |||||||||
|
|
|
|
|
| |||||||
| $ | 1,391,618 | $ | 1,299,918 | $ | 1,339,713 | |||||||
|
|
|
|
|
| |||||||
- 50 -
| 37. | CAPITAL MANAGEMENT |
The Company manages its capital to ensure that entities in the Company will be able to continue as going concerns while maximizing the return to stakeholders through the optimization of the debt and equity balance.
The capital structure of the Company consists of debt of the Company and the equity attributable to the parent.
The management reviews the capital structure of the Company as needed. As part of this review, the management considers the cost of capital and the risks associated with each class of capital.
According to the management’s suggestion, the Company maintains a balanced capital structure through paying cash dividends, increasing its share capital, purchasing treasury stock, and proceeds from new debt or repayment of debt.
| 38. | FINANCIAL INSTRUMENTS |
Fair Value Information
The fair value measurement guidance establishes a framework for measuring fair value and expands disclosure about fair value measurements. The standard describes a fair value hierarchy based on three levels of inputs that may be used to measure fair value. These levels are:
Level 1 fair value measurements: These measurements are those derived from quoted prices (unadjusted) in active markets for identical assets or liabilities.
Level 2 fair value measurements: These measurements are those derived from inputs other than quoted prices included within Level 1 that are observable for the asset or liability, either directly (i.e. as prices) or indirectly (i.e. derived from prices).
Level 3 fair value measurements: These measurements are those derived from valuation techniques that include inputs for the asset or liability that are not based on observable market data (unobservable inputs).
| a. | Financial instruments that are not measured at fair value but for which fair value is disclosed |
Except for what disclosed in the following table, the Company considers that the carrying amounts of financial assets and liabilities not measured at fair value approximate their fair values or the fair values cannot be reliable estimated:
June 30, 2016
Carrying Amount | Fair Value | |||||||||||||||
| Level 1 | Level 2 | Level 3 | ||||||||||||||
Held-to-maturity financial assets | ||||||||||||||||
Corporate bonds | $ | 3,642,017 | $ | — | $ | 3,656,907 | $ | — | ||||||||
Bank debentures | 150,000 | — | 151,079 | — | ||||||||||||
|
|
|
|
|
|
|
| |||||||||
| $ | 3,792,017 | $ | — | $ | 3,807,986 | $ | — | |||||||||
|
|
|
|
|
|
|
| |||||||||
- 51 -
December 31, 2015
Carrying Amount | Fair Value | |||||||||||||||
| Level 1 | Level 2 | Level 3 | ||||||||||||||
Held-to-maturity financial assets | ||||||||||||||||
Corporate bonds | $ | 3,870,540 | $ | — | $ | 3,890,730 | $ | — | ||||||||
Bank debentures | 150,000 | — | 149,997 | — | ||||||||||||
|
|
|
|
|
|
|
| |||||||||
| $ | 4,020,540 | $ | — | $ | 4,040,727 | $ | — | |||||||||
|
|
|
|
|
|
|
| |||||||||
June 30, 2015
Carrying Amount | Fair Value | |||||||||||||||
| Level 1 | Level 2 | Level 3 | ||||||||||||||
Held-to-maturity financial assets | ||||||||||||||||
Corporate bonds | $ | 6,552,612 | $ | — | $ | 6,573,187 | $ | — | ||||||||
Bank debentures | 150,000 | — | 150,000 | — | ||||||||||||
|
|
|
|
|
|
|
| |||||||||
| $ | 6,702,612 | $ | — | $ | 6,723,187 | $ | — | |||||||||
|
|
|
|
|
|
|
| |||||||||
The Level 2 fair values are estimated using discounted cash flow models. The models use market-based observable inputs including duration, yield rate and credit rating.
| b. | Financial instruments that are measured at fair values on a recurring basis |
June 30, 2016
| Level 1 | Level 2 | Level 3 | Total | |||||||||||||
Financial assets at fair value through profit or loss (FVTPL) | ||||||||||||||||
Derivative financial assets | $ | — | $ | 52 | $ | — | $ | 52 | ||||||||
|
|
|
|
|
|
|
| |||||||||
Available-for-sale financial assets | ||||||||||||||||
Listed securities and fund - equity investments | $ | 2,665,857 | $ | — | $ | — | $ | 2,665,857 | ||||||||
|
|
|
|
|
|
|
| |||||||||
Financial liabilities at FVTPL | ||||||||||||||||
Derivative financial liabilities | $ | — | $ | 14,583 | $ | — | $ | 14,583 | ||||||||
|
|
|
|
|
|
|
| |||||||||
Hedging derivative financial liabilities | $ | — | $ | 3,430 | $ | — | $ | 3,430 | ||||||||
|
|
|
|
|
|
|
| |||||||||
- 52 -
December 31, 2015
| Level 1 | Level 2 | Level 3 | Total | |||||||||||||
Financial assets at FVTPL | ||||||||||||||||
Derivative financial assets | $ | — | $ | 163 | $ | — | $ | 163 | ||||||||
|
|
|
|
|
|
|
| |||||||||
Hedging derivative financial assets | $ | — | $ | 498 | $ | — | $ | 498 | ||||||||
|
|
|
|
|
|
|
| |||||||||
Available-for-sale financial assets | ||||||||||||||||
Listed securities - equity investments | $ | 3,242,827 | $ | — | $ | — | $ | 3,242,827 | ||||||||
|
|
|
|
|
|
|
| |||||||||
June 30, 2015
| Level 1 | Level 2 | Level 3 | Total | |||||||||||||
Financial assets at FVTPL | ||||||||||||||||
Derivative financial assets | $ | — | $ | 1,216 | $ | — | $ | 1,216 | ||||||||
|
|
|
|
|
|
|
| |||||||||
Available-for-sale financial assets | ||||||||||||||||
Listed securities - equity investments | $ | 3,554,836 | $ | — | $ | — | $ | 3,554,836 | ||||||||
|
|
|
|
|
|
|
| |||||||||
Financial liabilities at FVTPL | ||||||||||||||||
Derivative financial liabilities | $ | — | $ | 2,218 | $ | — | $ | 2,218 | ||||||||
|
|
|
|
|
|
|
| |||||||||
There were no transfers between Levels 1 and 2 for the six months ended June 30, 2016 and 2015.
The fair values of financial assets and financial liabilities are determined as follows:
| 1) | The fair values of financial assets and financial liabilities with standard terms and conditions and traded in active markets are determined with reference to quoted market prices. |
| 2) | For derivative financial assets and liabilities of forward exchange contracts, fair values are estimated using discounted cash flow model. The model uses market-based observable inputs including foreign exchange rates, and forward and spot prices for currencies to project fair value. |
Categories of Financial Instruments
| June 30, 2016 | December 31, 2015 | June 30, 2015 | ||||||||||
Financial assets | ||||||||||||
Measured at FVTPL | ||||||||||||
Held for trading | $ | 52 | $ | 163 | $ | 1,216 | ||||||
Hedging derivatives financial assets | — | 498 | — | |||||||||
Held-to-maturity financial assets | 3,792,017 | 4,020,540 | 6,702,612 | |||||||||
(Continued)
- 53 -
June 30, 2016 | December 31, 2015 | June 30, 2015 | ||||||||||
Loans and receivables (Note a) | $ | 82,296,469 | $ | 63,738,690 | $ | 80,108,746 | ||||||
Available-for-sale financial assets (Note b) | 4,905,830 | 5,510,696 | 5,941,764 | |||||||||
Financial liabilities | ||||||||||||
Measured at FVTPL | ||||||||||||
Held for trading | 14,583 | — | 2,218 | |||||||||
Hedging derivative financial liabilities | 3,430 | — | — | |||||||||
Measured at amortized cost (Note c) | 77,656,494 | 36,365,152 | 72,349,372 | |||||||||
(Concluded)
| Note a: | The balances included cash and cash equivalents, trade notes and accounts receivable, accounts receivable from related parties, other current monetary assets, other financial assets and refundable deposits (classified as other noncurrent assets) which were loans and receivables. |
| Note b: | The balances included financial assets carried at cost which were classified as available-for-sale financial assets. |
| Note c: | The balances included short-term loans, trade notes and accounts payable, payables to related parties, dividends payables, partial other payables, customers’ deposits and long-term loans which were financial liabilities carried at amortized cost. |
Financial Risk Management Objectives
The main financial instruments of the Company include equity and debt investments, accounts receivable, accounts payable and loans. The Company’s Finance Department provides services to its business units, co-ordinates access to domestic and international capital markets, monitors and manages the financial risks relating to the operations of the Company through internal risk reports which analyze exposures by degree and magnitude of risks. These risks include market risk (including foreign currency risk, interest rate risk and other price risk), credit risk, and liquidity risk.
The Company seeks to minimize the effects of these risks by using derivative financial instruments to hedge risk exposures. The use of financial derivatives is governed by the Company’s policies approved by the Board of Directors. Those derivatives are used to hedge the risks of exchange rate fluctuation arising from operating or investment activities. Compliance with policies and risk exposure limits is audited by the Company’s Finance Department on a continuous basis. The Company does not enter into or trade financial instruments, including derivative financial instruments, for speculative purposes.
Chunghwa reports the significant risk exposures and related action plans timely and actively to the audit committee and to the Board of Directors if needed.
| a. | Market risk |
The Company is exposed to market risks of changes in foreign currency exchange rates and interest rates. The Company uses forward exchange contracts to hedge the exchange rate risk arising from assets and liabilities denominated in foreign currencies.
There were no changes to the Company’s exposure to market risks or the manner in which these risks are managed and measured.
- 54 -
| 1) | Foreign currency risk |
The carrying amounts of the Company’s foreign currency denominated monetary assets and monetary liabilities at the end of the reporting periods are as follows:
| June 30, 2016 | December 31, 2015 | June 30, 2015 | ||||||||||
Assets | ||||||||||||
USD | $ | 6,424,247 | $ | 4,596,220 | $ | 6,317,087 | ||||||
EUR | 26,101 | 47,066 | 18,637 | |||||||||
SGD | 9,419 | 109,520 | 7,786 | |||||||||
RMB | 35,259 | 40,689 | 227,868 | |||||||||
JPY | 64,150 | 245,289 | 181,863 | |||||||||
Liabilities | ||||||||||||
USD | 6,263,442 | 4,171,693 | 6,581,257 | |||||||||
EUR | 1,217,992 | 1,292,838 | 556,634 | |||||||||
SGD | 1,858 | 2,553 | 2,294 | |||||||||
RMB | 72 | 67 | — | |||||||||
JPY | 6,934 | 13,983 | 9,854 | |||||||||
The carrying amount of the Company’s derivatives with exchange rate risk exposures at the end of the reporting period are as follows:
June 30, 2016 | December 31, 2015 | June 30, 2015 | ||||||||||
Assets | ||||||||||||
USD | $ | 52 | $ | 149 | $ | 1,216 | ||||||
EUR | — | 512 | — | |||||||||
Liabilities | ||||||||||||
USD | 1,279 | — | 329 | |||||||||
EUR | 16,734 | — | 1,889 | |||||||||
Foreign currency sensitivity analysis
The Company is mainly exposed to the fluctuations of the currencies listed above.
The following table details the Company’s sensitivity to a 5% increase and decrease in the functional currency against the relevant foreign currencies. 5% is the sensitivity rate used when reporting foreign currency risk internally to key management personnel and represents management’s assessment of the reasonably possible changes in foreign exchange rates. The sensitivity analysis includes only outstanding foreign currency denominated monetary items and forward exchange contracts. A positive number below indicates an increase in pre-tax profit or equity where the functional currency weakens 5% against the relevant currency.
| For the Six Months Ended June 30 | ||||||||
| 2016 | 2015 | |||||||
Profit or loss | ||||||||
Monetary assets and liabilities (a) | ||||||||
USD | $ | 8,040 | $ | (13,209 | ) | |||
EUR | (59,595 | ) | (26,900 | ) | ||||
(Continued)
- 55 -
| For the Six Months Ended June 30 | ||||||||
| 2016 | 2015 | |||||||
SGD | $ | 378 | $ | 275 | ||||
RMB | 1,759 | 11,393 | ||||||
JPY | 2,861 | 8,600 | ||||||
Derivatives (b) | ||||||||
USD | (22,189 | ) | 17,588 | |||||
EUR | (29,984 | ) | (9,281 | ) | ||||
Equity | ||||||||
Derivatives (c) | ||||||||
EUR | (9,119 | ) | — | |||||
(Concluded)
| a) | This is mainly attributable to the exposure to foreign currency denominated receivables and payables of the Company outstanding at the end of the reporting period; |
| b) | This is mainly attributable to the forward exchange contracts; and |
| c) | This is mainly attributable to the changes in the fair value of derivatives that are designated as cash flow hedges. |
For a 5% strengthening of the functional currency against the relevant currencies, it would have the equal but opposite effect on the pre-tax profit for the amounts shown above.
| 2) | Interest rate risk |
The carrying amounts of the Company’s exposures to interest rates on financial assets and financial liabilities at balance sheet dates were as follows:
June 30, 2016 | December 31, 2015 | June 30, 2015 | ||||||||||
Fair value interest rate risk | ||||||||||||
Financial assets | $ | 39,482,863 | $ | 26,237,631 | $ | 42,097,596 | ||||||
Financial liabilities | 60,000 | 110,000 | 860,000 | |||||||||
Cash flow interest rate risk | ||||||||||||
Financial assets | 8,170,510 | 6,461,493 | 5,343,645 | |||||||||
Financial liabilities | 1,600,000 | 1,750,000 | 1,800,000 | |||||||||
Interest rate sensitivity analysis
The sensitivity analyses below have been determined based on the exposure to interest rates for non-derivative instruments at the end of the reporting period. A 25 basis point increase or decrease is used when reporting interest rate risk internally to key management personnel and represents management’s assessment of the reasonably possible change in interest rates.
If interest rates had been 25 basis points higher/lower and all other variables were held constant, the Company’s pre-tax income for the six months ended June 30, 2016 would increase/decrease by $16,426 thousand. This is mainly attributable to the Company’s exposure to floating rates on its financial assets and short-term and long-term loan.
- 56 -
If interest rates had been 25 basis points higher/lower and all other variables were held constant, the Company’s profit before tax for the six months ended June 30, 2015 would increase/decrease by $8,859 thousand. This is mainly attributable to the Company’s exposure to floating rates on its financial assets and short-term and long-term loans.
| 3) | Other price risk |
The Company is exposed to equity price risks arising from equity investments. Equity investments are held for strategic rather than trading purposes. The management managed the risk through holding various risk portfolios. Further, the Company assigned finance and investment departments to monitor the price risk.
Equity price sensitivity analysis
The sensitivity analyses below have been determined based on the exposure to equity price risks at the end of the reporting period.
If equity prices of listed equity securities had been 5% higher/lower:
Other comprehensive income would increase/decrease by $133,293 thousand as a result of the changes in fair value of available-for-sale financial assets for the six months ended June 30, 2016.
Other comprehensive income would increase/decrease by $177,742 thousand as a result of the changes in fair value of available-for-sale financial assets for the six months ended June 30, 2015.
| b. | Credit risk |
Credit risk refers to the risk that a counterparty would default on its contractual obligations resulting in financial loss to the Company. The maximum credit exposure of the aforementioned financial instruments is equal to their carrying amounts recognized in consolidated balance sheet as of the balance sheet date.
The Company has large trade receivables outstanding with its customers. A substantial majority of the Company’s outstanding trade receivables are not covered by collateral or credit insurance. The Company has implemented ongoing measures including enhancing credit assessments and strengthening overall risk management to reduce its credit risk. While the Company has procedures to monitor and limit exposure to credit risk on trade receivables, there can be no assurance such procedures will effectively limit its credit risk and avoid losses. This risk is heightened during periods when economic conditions worsen.
As the Company serves a large number of unrelated consumers, the concentration of credit risk was limited.
| c. | Liquidity risk |
The Company manages and contains sufficient cash and cash equivalent position to support the operations and reduce the impact on fluctuation of cash flow.
- 57 -
| 1) | Liquidity and interest risk tables |
The following tables detailed the Company’s remaining contractual maturity for its non-derivative financial liabilities with agreed repayment periods. The tables have been drawn up based on the undiscounted cash flows of financial liabilities based on the earliest date on which the Company is required to pay.
| Weighted Average Effective Interest Rate (%) | Less Than 1 Month | 1-3 Months | 3 Months to 1 Year | 1-5 Years | More Than 5 Years | Total | ||||||||||||||||||||||
June 30, 2016 | ||||||||||||||||||||||||||||
Non-derivative financial liabilities | ||||||||||||||||||||||||||||
Non-interest bearing | — | $ | 37,138,377 | $ | 42,551,146 | $ | 1,037,212 | $ | 4,560,724 | $ | — | $ | 85,287,459 | |||||||||||||||
Floating interest rate instruments | 0.98 | — | — | — | 1,600,000 | — | 1,600,000 | |||||||||||||||||||||
Fixed interest rate instruments | 2.28 | — | 20,000 | 40,000 | — | — | 60,000 | |||||||||||||||||||||
|
|
|
|
|
|
|
|
|
|
|
| |||||||||||||||||
| $ | 37,138,377 | $ | 42,571,146 | $ | 1,077,212 | $ | 6,160,724 | $ | — | $ | 86,947,459 | |||||||||||||||||
|
|
|
|
|
|
|
|
|
|
|
| |||||||||||||||||
December 31, 2015 | ||||||||||||||||||||||||||||
Non-derivative financial liabilities | ||||||||||||||||||||||||||||
Non-interest bearing | — | $ | 40,208,974 | $ | — | $ | 2,190,085 | $ | 4,725,826 | $ | — | $ | 47,124,885 | |||||||||||||||
Floating interest rate instruments | 1.13 | — | — | 7,692 | 1,646,154 | 96,154 | 1,750,000 | |||||||||||||||||||||
Fixed interest rate instruments | 1.82 | 50,000 | — | 60,000 | — | — | 110,000 | |||||||||||||||||||||
|
|
|
|
|
|
|
|
|
|
|
| |||||||||||||||||
| $ | 40,258,974 | $ | — | $ | 2,257,777 | $ | 6,371,980 | $ | 96,154 | $ | 48,984,885 | |||||||||||||||||
|
|
|
|
|
|
|
|
|
|
|
| |||||||||||||||||
June 30, 2015 | ||||||||||||||||||||||||||||
Non-derivative financial liabilities | ||||||||||||||||||||||||||||
Non-interest bearing | — | $ | 34,614,754 | $ | 38,027,663 | $ | 962,649 | $ | 4,654,717 | $ | — | $ | 78,259,783 | |||||||||||||||
Floating interest rate instruments | 1.18 | — | — | 2,564 | 1,652,564 | 144,872 | 1,800,000 | |||||||||||||||||||||
Fixed interest rate instruments | 1.27 | 800,000 | 30,000 | 30,000 | — | — | 860,000 | |||||||||||||||||||||
|
|
|
|
|
|
|
|
|
|
|
| |||||||||||||||||
| $ | 35,414,754 | $ | 38,057,663 | $ | 995,213 | $ | 6,307,281 | $ | 144,872 | $ | 80,919,783 | |||||||||||||||||
|
|
|
|
|
|
|
|
|
|
|
| |||||||||||||||||
The following table detailed the Company’s liquidity analysis for its derivative financial instruments. The table has been drawn up based on the undiscounted gross inflows and outflows on those derivatives that require gross settlement.
| Less Than 1 Month | 1-3 Months | 3 Months to 1 Year | 1-5 Years | Total | ||||||||||||||||
June 30, 2016 | ||||||||||||||||||||
Gross settled | ||||||||||||||||||||
Forward exchange contracts | ||||||||||||||||||||
Inflows | $ | 443,857 | $ | 500,521 | $ | 282,628 | $ | — | $ | 1,227,006 | ||||||||||
Outflows | 445,084 | 511,877 | 288,006 | — | 1,244,967 | |||||||||||||||
|
|
|
|
|
|
|
|
|
| |||||||||||
| $ | (1,227 | ) | $ | (11,356 | ) | $ | (5,378 | ) | $ | — | $ | (17,961 | ) | |||||||
|
|
|
|
|
|
|
|
|
| |||||||||||
December 31, 2015 | ||||||||||||||||||||
Gross settled | ||||||||||||||||||||
Forward exchange contracts | ||||||||||||||||||||
Inflows | $ | 26,552 | $ | 473,437 | $ | 492,056 | $ | — | $ | 992,045 | ||||||||||
Outflows | 26,403 | 476,337 | 488,644 | — | 991,384 | |||||||||||||||
|
|
|
|
|
|
|
|
|
| |||||||||||
| $ | 149 | $ | (2,900 | ) | $ | 3,412 | $ | — | $ | 661 | ||||||||||
|
|
|
|
|
|
|
|
|
| |||||||||||
June 30, 2015 | ||||||||||||||||||||
Gross settled | ||||||||||||||||||||
Forward exchange contracts | ||||||||||||||||||||
Inflows | $ | 353,580 | $ | 186,591 | $ | — | $ | — | $ | 540,171 | ||||||||||
Outflows | 352,693 | 188,480 | — | — | 541,173 | |||||||||||||||
|
|
|
|
|
|
|
|
|
| |||||||||||
| $ | 887 | $ | (1,889 | ) | $ | — | $ | — | $ | (1,002 | ) | |||||||||
|
|
|
|
|
|
|
|
|
| |||||||||||
- 58 -
| 2) | Financing facilities |
June 30, 2016 | December 31, 2015 | June 30, 2015 | ||||||||||
Unsecured bank loan facility | ||||||||||||
Amount used | $ | 60,000 | $ | 110,000 | $ | 860,000 | ||||||
Amount unused | 51,437,133 | 41,278,250 | 43,989,280 | |||||||||
|
|
|
|
|
| |||||||
| $ | 51,497,133 | $ | 41,388,250 | $ | 44,849,280 | |||||||
|
|
|
|
|
| |||||||
Secured bank loan facility | ||||||||||||
Amount used | $ | 1,600,000 | $ | 1,750,000 | $ | 1,800,000 | ||||||
Amount unused | 200,000 | 200,000 | 748,000 | |||||||||
|
|
|
|
|
| |||||||
| $ | 1,800,000 | $ | 1,950,000 | $ | 2,548,000 | |||||||
|
|
|
|
|
| |||||||
| 39. | RELATED PARTIES TRANSACTIONS |
The ROC Government, one of Chunghwa’s customers, has significant equity interest in Chunghwa. Chunghwa provides fixed-line services, wireless services, internet and data and other services to the various departments and institutions of the ROC Government in the normal course of business and at arm’s-length prices. The transactions with the ROC government bodies have not been disclosed because the transactions are not individually or collectively significant. However, the related revenues and operating costs have been appropriately recorded.
| a. | The Company engages in business transactions with the following related parties: |
Company | Relationship | |
Taiwan International Standard Electronics Co., Ltd. | Associate | |
So-net Entertainment Taiwan Limited | Associate | |
Skysoft Co., Ltd. | Associate | |
KingwayTek Technology Co., Ltd. | Associate | |
Dian Zuan Integrating Marketing Co., Ltd. | Associate | |
Taiwan International Ports Logistics Corporation | Associate | |
Huada Digital Corporation | Joint venture | |
Chunghwa Benefit One Co., Ltd. | Joint venture | |
International Integrated System, Inc. | Associate | |
Senao Networks, Inc. | Associate | |
HopeTech Technologies Limited | Associate | |
ST-2 Satellite Ventures Pte., Ltd. | Associate | |
Viettel-CHT Co., Ltd. | Associate | |
Xiamen Sertec Business Technology Co., Ltd. | Associate | |
Click Force Co., Ltd. | Associate | |
Other related parties | ||
Chunghwa Telecom Foundation | A nonprofit organization of which the funds donated by Chunghwa exceeds one third of its total funds | |
Senao Technical and Cultural Foundation | A nonprofit organization of which the funds donated by SENAO exceeds one third of its total funds | |
Sochamp Technology Co., Ltd. | Investor of significant influence over CHST |
(Continued)
- 59 -
Company | Relationship | |
E-Life Mall Co., Ltd. | One of the directors of E-Life Mall and a director of SENAO are members of an immediate family | |
United Daily News Co., Ltd. | Investor of significant influence over SFD |
(Concluded)
| b. | Balances and transactions between Chunghwa and its subsidiaries, which are related parties of Chunghwa, have been eliminated on consolidation and are not disclosed in this note. Terms of the foregoing transactions with related parties were not significantly different from transactions with non-related parties. When no similar transactions with non-related parties can be referenced, terms were determined in accordance with mutual agreements. Details of transactions between the Company and other related parties are disclosed below: |
| 1) | Operating transactions |
| Revenues | ||||||||||||||||
| For the Three Months Ended June 30 | For the Six Months Ended June 30 | |||||||||||||||
| 2016 | 2015 | 2016 | 2015 | |||||||||||||
Associates | $ | 74,100 | $ | 80,837 | $ | 166,558 | $ | 142,999 | ||||||||
Joint ventures | 1,674 | 2,061 | 4,597 | 3,822 | ||||||||||||
Others | 4,955 | 19,479 | 18,541 | 48,243 | ||||||||||||
|
|
|
|
|
|
|
| |||||||||
| $ | 80,729 | $ | 102,377 | $ | 189,696 | $ | 195,064 | |||||||||
|
|
|
|
|
|
|
| |||||||||
| Operating Costs and Expenses | ||||||||||||||||
| For the Three Months Ended June 30 | For the Six Months Ended June 30 | |||||||||||||||
| 2016 | 2015 | 2016 | 2015 | |||||||||||||
Associates | $ | 353,337 | $ | 303,649 | $ | 677,655 | $ | 582,821 | ||||||||
Joint ventures | 822 | 238 | 4,696 | 397 | ||||||||||||
Others | 3,808 | 4,471 | 55,956 | 53,913 | ||||||||||||
|
|
|
|
|
|
|
| |||||||||
| $ | 357,967 | $ | 308,358 | $ | 738,307 | $ | 637,131 | |||||||||
|
|
|
|
|
|
|
| |||||||||
| 2) | Non-operating transactions |
| Non-operating Income and Expenses | ||||||||||||||||
| For the Three Months Ended June 30 | For the Six Months Ended June 30 | |||||||||||||||
| 2016 | 2015 | 2016 | 2015 | |||||||||||||
Associates | $ | 8,516 | $ | 8,996 | $ | 17,233 | $ | 18,476 | ||||||||
Others | 8 | — | 16 | — | ||||||||||||
|
|
|
|
|
|
|
| |||||||||
| $ | 8,524 | $ | 8,996 | $ | 17,249 | $ | 18,476 | |||||||||
|
|
|
|
|
|
|
| |||||||||
- 60 -
| 3) | Receivables |
| June 30, 2016 | December 31, 2015 | June 30, 2015 | ||||||||||
Associates | $ | 26,759 | $ | 28,763 | $ | 13,606 | ||||||
Joint ventures | 74 | 542 | 177 | |||||||||
Others | 3,351 | 12,751 | 7,855 | |||||||||
|
|
|
|
|
| |||||||
| $ | 30,184 | $ | 42,056 | $ | 21,638 | |||||||
|
|
|
|
|
| |||||||
| 4) | Payables |
| June 30, 2016 | December 31, 2015 | June 30, 2015 | ||||||||||
Associates | $ | 439,157 | $ | 601,730 | $ | 417,881 | ||||||
Joint ventures | 1,046 | 4,849 | 9,486 | |||||||||
Others | 3,799 | 4,521 | 4,475 | |||||||||
|
|
|
|
|
| |||||||
| $ | 444,002 | $ | 611,100 | $ | 431,842 | |||||||
|
|
|
|
|
| |||||||
| 5) | Customers’ deposits |
| June 30, 2016 | December 31, 2015 | June 30, 2015 | ||||||||||
Associates | $ | 7,303 | $ | 10,965 | $ | 6,609 | ||||||
Joint ventures | 640 | — | — | |||||||||
|
|
|
|
|
| |||||||
| $ | 7,943 | $ | 10,965 | $ | 6,609 | |||||||
|
|
|
|
|
| |||||||
| 6) | Acquisition of property, plant and equipment |
| For the Three Months Ended June 30 | For the Six Months Ended June 30 | |||||||||||||||
| 2016 | 2015 | 2016 | 2015 | |||||||||||||
Associates | $ | — | $ | 158,723 | $ | — | $ | 158,723 | ||||||||
Joint ventures | — | 8,572 | 6,869 | 8,572 | ||||||||||||
|
|
|
|
|
|
|
| |||||||||
| $ | — | $ | 167,295 | $ | 6,869 | $ | 167,295 | |||||||||
|
|
|
|
|
|
|
| |||||||||
- 61 -
| 7) | Prepayments |
Chunghwa entered into a contract with ST-2 Satellite Ventures Pte., Ltd. on March 12, 2010 to lease capacity on the ST-2 satellite. This lease term is for 15 years which should start from the official operation of ST-2 satellite and the total contract value is approximately $6,000,000 thousand (SG$260,723 thousand), including a prepayment of $3,067,711 thousand, and the rest of amount should be paid annually when ST-2 satellite starts its official operation. ST-2 satellite was launched in May 2011, and began its official operation in August 2011. The total rental expense for the three months ended June 30, 2016 was $100,093 thousand, which consisted of an offsetting credit of the prepayment of $51,100 thousand and an additional accrual of $48,993 thousand. The total rental expense for the six months ended June 30, 2016 was $203,730 thousand, which consisted of an offsetting credit of the prepayment of $102,200 thousand and an additional accrual of $101,530 thousand. The prepaid rents (classified as prepayments) as of balance sheet dates were as follows:
| June 30, 2016 | December 31, 2015 | June 30, 2015 | ||||||||||
Prepaid rents - current | $ | 204,398 | $ | 204,398 | $ | 204,399 | ||||||
Prepaid rents - noncurrent | 1,856,617 | 1,958,817 | 2,061,015 | |||||||||
|
|
|
|
|
| |||||||
| $ | 2,061,015 | $ | 2,163,215 | $ | 2,265,414 | |||||||
|
|
|
|
|
| |||||||
| c. | Compensation of key management personnel |
The remuneration of directors and members of key management personnel were as follows:
| For the Three Months Ended June 30 | For the Six Months Ended June 30 | |||||||||||||||
| 2016 | 2015 | 2016 | 2015 | |||||||||||||
Short-term employee benefits | $ | 48,978 | $ | 42,735 | $ | 131,987 | $ | 113,899 | ||||||||
Post-employment benefits | 2,028 | 2,327 | 4,003 | 4,468 | ||||||||||||
Share-based payment | 445 | 1,332 | 891 | 2,664 | ||||||||||||
|
|
|
|
|
|
|
| |||||||||
| $ | 51,451 | $ | 46,394 | $ | 136,881 | $ | 121,031 | |||||||||
|
|
|
|
|
|
|
| |||||||||
The remuneration of directors and key executives is mainly determined by the compensation committee having regard to the performance of individual and market trends.
| 40. | PLEDGED ASSETS |
The following assets are pledged as collaterals for bank loans and custom duties of the imported materials.
| June 30, 2016 | December 31, 2015 | June 30, 2015 | ||||||||||
Property, plant and equipment | $ | 2,594,624 | $ | 3,101,079 | $ | 3,065,223 | ||||||
Land held under development (included in inventories) | 1,998,733 | 1,998,733 | 1,998,733 | |||||||||
Restricted assets (included in other assets - others) | 2,000 | 2,018 | 1,041 | |||||||||
|
|
|
|
|
| |||||||
| $ | 4,595,357 | $ | 5,101,830 | $ | 5,064,997 | |||||||
|
|
|
|
|
| |||||||
| 41. | SIGNIFICANT CONTINGENT LIABILITIES AND UNRECOGNIZED COMMITMENTS |
As of June 30, 2016, the Company’s remaining commitments under non-cancelable contracts with various parties, excluding those disclosed in other notes, were as follows:
| a. | Acquisitions of land and buildings of $605,452 thousand. |
| b. | Acquisitions of telecommunications equipment of $16,622,946 thousand. |
- 62 -
| c. | Unused letters of credit amounting to $50,000 thousand. |
| d. | A commitment to contribute $2,000,000 thousand to a Piping Fund administered by the Taipei City Government, of which $1,000,000 thousand was contributed by Chunghwa on August 15, 1996 (classified as other monetary assets - noncurrent). If the fund is not sufficient, Chunghwa will contribute the remaining $1,000,000 thousand upon notification from the Taipei City Government. |
| 42. | SIGNIFICANT INFORMATION OF FOREIGN ASSETS AND LIABILITIES |
The following information summarizes the disclosure of the currency which is other than functional currency of Chunghwa and its subsidiaries. The following exchange rates are the exchange rates used to translate to the presentation currency in the consolidated financial statements, which is NTD:
| June 30, 2016 | ||||||||||||
| Foreign Currencies (Thousands) | Exchange Rate | New Taiwan Dollars (Thousands) | ||||||||||
Foreign assets | ||||||||||||
Monetary items | ||||||||||||
Cash | ||||||||||||
USD | $ | 14,592 | 32.275 | $ | 470,950 | |||||||
EUR | 706 | 35.89 | 25,324 | |||||||||
SGD | 350 | 23.91 | 8,358 | |||||||||
RMB | 7,276 | 4.845 | 35,250 | |||||||||
JPY | 197,592 | 0.314 | 62,044 | |||||||||
Accounts receivable | ||||||||||||
USD | 184,455 | 32.275 | 5,953,297 | |||||||||
EUR | 22 | 35.89 | 777 | |||||||||
SGD | 44 | 23.91 | 1,061 | |||||||||
RMB | 2 | 4.845 | 9 | |||||||||
JPY | 6,706 | 0.314 | 2,106 | |||||||||
Non-monetary items | ||||||||||||
Investments accounted for using equity method | ||||||||||||
USD | 675 | 32.275 | 21,784 | |||||||||
SGD | 23,381 | 23.91 | 559,038 | |||||||||
VND | 182,443,609 | 0.00133 | 242,650 | |||||||||
Foreign liabilities | ||||||||||||
Monetary items | ||||||||||||
Accounts payable | ||||||||||||
USD | 194,065 | 32.275 | 6,263,442 | |||||||||
EUR | 33,937 | 35.89 | 1,217,992 | |||||||||
SGD | 78 | 23.91 | 1,858 | |||||||||
RMB | 15 | 4.845 | 72 | |||||||||
JPY | 22,083 | 0.314 | 6,934 | |||||||||
- 63 -
| December 31, 2015 | ||||||||||||
| Foreign Currencies (Thousands) | Exchange Rate | New Taiwan Dollars (Thousands) | ||||||||||
Foreign assets | ||||||||||||
Monetary items | ||||||||||||
Cash | ||||||||||||
USD | $ | 12,860 | 32.825 | $ | 422,132 | |||||||
EUR | 1,304 | 35.88 | 46,793 | |||||||||
SGD | 4,656 | 23.25 | 108,244 | |||||||||
RMB | 8,174 | 4.978 | 40,689 | |||||||||
JPY | 888,019 | 0.273 | 242,429 | |||||||||
Accounts receivable | ||||||||||||
USD | 127,162 | 32.825 | 4,174,088 | |||||||||
EUR | 8 | 35.88 | 273 | |||||||||
SGD | 55 | 23.25 | 1,276 | |||||||||
JPY | 10,477 | 0.273 | 2,860 | |||||||||
Non-monetary items | ||||||||||||
Investments accounted for using equity method | ||||||||||||
USD | 1,133 | 32.825 | 35,938 | |||||||||
SGD | 21,279 | 23.25 | 494,727 | |||||||||
VND | 223,944,681 | 0.00141 | 315,762 | |||||||||
Foreign liabilities | ||||||||||||
Monetary items | ||||||||||||
Accounts payable | ||||||||||||
USD | 127,089 | 32.825 | 4,171,693 | |||||||||
EUR | 36,032 | 35.88 | 1,292,838 | |||||||||
SGD | 110 | 23.25 | 2,553 | |||||||||
RMB | 14 | 4.978 | 67 | |||||||||
JPY | 51,219 | 0.273 | 13,983 | |||||||||
| June 30, 2015 | ||||||||||||
| Foreign Currencies (Thousands) | Exchange Rate | New Taiwan Dollars (Thousands) | ||||||||||
Financial assets | ||||||||||||
Monetary items | ||||||||||||
Cash | ||||||||||||
USD | $ | 6,240 | 30.86 | $ | 192,568 | |||||||
EUR | 443 | 34.46 | 15,276 | |||||||||
SGD | 272 | 22.96 | 6,255 | |||||||||
RMB | 45,821 | 4.97 | 227,868 | |||||||||
JPY | 713,562 | 0.252 | 179,818 | |||||||||
(Continued)
- 64 -
| June 30, 2015 | ||||||||||||
| Foreign Currencies (Thousands) | Exchange Rate | New Taiwan Dollars (Thousands) | ||||||||||
Accounts receivable | ||||||||||||
USD | $ | 198,461 | 30.86 | $ | 6,124,519 | |||||||
EUR | 98 | 34.46 | 3,361 | |||||||||
SGD | 67 | 22.96 | 1,531 | |||||||||
JPY | 8,115 | 0.252 | 2,045 | |||||||||
Non-monetary items | ||||||||||||
Investments accounted for using equity method | ||||||||||||
USD | 1,032 | 30.86 | 32,058 | |||||||||
SGD | 25,502 | 22.96 | 585,525 | |||||||||
Financial liabilities | ||||||||||||
Monetary items | ||||||||||||
Accounts payable | ||||||||||||
USD | 213,262 | 30.86 | 6,581,257 | |||||||||
EUR | 16,153 | 34.46 | 556,634 | |||||||||
SGD | 100 | 22.96 | 2,294 | |||||||||
JPY | 39,102 | 0.252 | 9,854 | |||||||||
(Concluded)
The unrealized foreign currency exchange gains and losses were gain of $19,371 thousand and loss of $78,057 thousand for the three months ended June 30, 2016 and 2015, respectively. The unrealized foreign currency exchange gains were $14,927 thousand and $36,316 thousand for the six months ended June 30, 2016 and 2015, respectively. Due to the various foreign currency transactions and the functional currency of each individual entity of the Company, foreign exchange gains and losses cannot be disclosed on the respective significant foreign currency.
| 43. | ADDITIONAL DISCLOSURES |
Following are the additional disclosures required by the FSC for the Company:
| a. | Financing provided: None. |
| b. | Endorsement/guarantee provided: Please see Table 1. |
| c. | Marketable securities held (excluding investments in subsidiaries and associates and joint ventures): Please see Table 2. |
| d. | Marketable securities acquired and disposed of at costs or prices at least $300 million or 20% of the paid-in capital: None. |
| e. | Acquisition of individual real estate at costs of at least $300 million or 20% of the paid-in capital: None. |
- 65 -
| f. | Disposal of individual real estate at prices of at least $300 million or 20% of the paid-in capital: None. |
| g. | Total purchases from or sales to related parties amounting to at least $100 million or 20% of the paid-in capital: Please see Table 3. |
| h. | Receivables from related parties amounting to $100 million or 20% of the paid-in capital: Please see Table 4. |
| i. | Names, locations, and other information of investees on which the Company exercises significant influence (excluding investment in Mainland China): Please see Table 5. |
| j. | Derivative financial instruments transactions: Please see Notes 7, 21 and 38. |
| k. | Investment in Mainland China: Please see Table 6. |
| l. | Intercompany relationships and significant intercompany transaction: Please see Table 7. |
| 44. | SEGMENT INFORMATION |
The Company has the following reportable segments that provide different products or services. The reportable segments are managed separately because each segment represents a strategic business unit that serves different markets. Segment information is provided to CEO who allocates resources and assesses segment performance. The Company’s measure of segment performance is mainly based on revenues and income before tax. The Company’s reportable segments are as follows:
| a. | Domestic fixed communications business - the provision of local telephone services, domestic long distance telephone services, broadband access, and related services; |
| b. | Mobile communications business - the provision of mobile services, sales of mobile handsets and data cards, and related services; |
| c. | Internet business - the provision of HiNet services and related services; |
| d. | International fixed communications business - the provision of international long distance telephone services and related services; |
| e. | Others - the provision of non-telecom services and the corporate related items not allocated to reportable segments. |
There was no material differences between the accounting policies of the operating segments and the accounting policies described in Note 3.
- 66 -
Segment Revenues and Operating Results
Analysis by reportable segment of revenue and operating results of continuing operations are as follows:
| Domestic Fixed Communi- cations Business | Mobile cations | Internet Business | International cations | Others | Total | |||||||||||||||||||
For the three months ended June 30, 2016 | ||||||||||||||||||||||||
Revenues | ||||||||||||||||||||||||
From external customers | $ | 18,411,413 | $ | 26,474,311 | $ | 6,827,203 | $ | 3,550,045 | $ | 932,457 | $ | 56,195,429 | ||||||||||||
Intersegment revenues | 5,653,201 | 577,020 | 1,183,396 | 764,148 | 929,225 | 9,106,990 | ||||||||||||||||||
|
|
|
|
|
|
|
|
|
|
|
| |||||||||||||
Segment revenues | $ | 24,064,614 | $ | 27,051,331 | $ | 8,010,599 | $ | 4,314,193 | $ | 1,861,682 | 65,302,419 | |||||||||||||
|
|
|
|
|
|
|
|
|
| |||||||||||||||
Intersegment elimination | (9,106,990 | ) | ||||||||||||||||||||||
|
| |||||||||||||||||||||||
Consolidated revenues | $ | 56,195,429 | ||||||||||||||||||||||
|
| |||||||||||||||||||||||
Segments operating costs and expenses | $ | 16,508,763 | $ | 17,486,430 | $ | 3,141,487 | $ | 3,688,316 | $ | 2,483,997 | $ | 43,308,993 | ||||||||||||
|
|
|
|
|
|
|
|
|
|
|
| |||||||||||||
Segment income before income tax | $ | 6,191,725 | $ | 4,825,947 | $ | 2,509,359 | $ | 186,687 | $ | (223,489 | ) | $ | 13,490,229 | |||||||||||
|
|
|
|
|
|
|
|
|
|
|
| |||||||||||||
For the six months ended June 30, 2016 | ||||||||||||||||||||||||
Revenues | ||||||||||||||||||||||||
From external customers | $ | 36,211,940 | $ | 54,635,614 | $ | 13,524,715 | $ | 7,034,953 | $ | 1,732,363 | $ | 113,139,585 | ||||||||||||
Intersegment revenues | 11,262,880 | 1,280,977 | 2,301,994 | 1,319,040 | 1,848,276 | 18,013,167 | ||||||||||||||||||
|
|
|
|
|
|
|
|
|
|
|
| |||||||||||||
Segment revenues | $ | 47,474,820 | $ | 55,916,591 | $ | 15,826,709 | $ | 8,353,993 | $ | 3,580,639 | 131,152,752 | |||||||||||||
|
|
|
|
|
|
|
|
|
| |||||||||||||||
Intersegment elimination | (18,013,167 | ) | ||||||||||||||||||||||
|
| |||||||||||||||||||||||
Consolidated revenues | $ | 113,139,585 | ||||||||||||||||||||||
|
| |||||||||||||||||||||||
Segments operating costs and expenses | $ | 31,905,601 | $ | 36,732,417 | $ | 6,211,040 | $ | 6,859,221 | $ | 4,755,103 | $ | 86,463,382 | ||||||||||||
|
|
|
|
|
|
|
|
|
|
|
| |||||||||||||
Segment income before income tax | $ | 13,039,616 | $ | 9,702,798 | $ | 5,130,047 | $ | 613,198 | $ | (711,512 | ) | $ | 27,774,147 | |||||||||||
|
|
|
|
|
|
|
|
|
|
|
| |||||||||||||
For the three months ended June 30, 2015 | ||||||||||||||||||||||||
Revenues | ||||||||||||||||||||||||
From external customers | $ | 17,761,244 | $ | 28,511,931 | $ | 6,323,423 | $ | 3,669,165 | $ | 654,830 | $ | 56,920,593 | ||||||||||||
Intersegment revenues | 5,381,749 | 793,160 | 1,200,834 | 514,832 | 790,500 | 8,681,075 | ||||||||||||||||||
|
|
|
|
|
|
|
|
|
|
|
| |||||||||||||
Segment revenues | $ | 23,142,993 | $ | 29,305,091 | $ | 7,524,257 | $ | 4,183,997 | $ | 1,445,330 | 65,601,668 | |||||||||||||
|
|
|
|
|
|
|
|
|
| |||||||||||||||
Intersegment elimination | (8,681,075 | ) | ||||||||||||||||||||||
|
| |||||||||||||||||||||||
Consolidated revenues | $ | 56,920,593 | ||||||||||||||||||||||
|
| |||||||||||||||||||||||
Segments operating costs and expenses | $ | 15,731,471 | $ | 19,664,391 | $ | 2,943,144 | $ | 3,393,255 | $ | 1,976,311 | $ | 43,708,572 | ||||||||||||
|
|
|
|
|
|
|
|
|
|
|
| |||||||||||||
Segment income before income tax | $ | 5,887,720 | $ | 5,173,750 | $ | 2,404,198 | $ | 297,373 | $ | (213,163 | ) | $ | 13,549,878 | |||||||||||
|
|
|
|
|
|
|
|
|
|
|
| |||||||||||||
For the six months ended June 30, 2015 | ||||||||||||||||||||||||
Revenues | ||||||||||||||||||||||||
From external customers | $ | 35,296,963 | $ | 56,510,079 | $ | 12,541,466 | $ | 7,728,675 | $ | 1,316,217 | $ | 113,393,400 | ||||||||||||
Intersegment revenues | 10,967,140 | 1,769,643 | 2,309,002 | 991,921 | 1,539,602 | 17,577,308 | ||||||||||||||||||
|
|
|
|
|
|
|
|
|
|
|
| |||||||||||||
Segment revenues | $ | 46,264,103 | $ | 58,279,722 | $ | 14,850,468 | $ | 8,720,596 | $ | 2,855,819 | 130,970,708 | |||||||||||||
|
|
|
|
|
|
|
|
|
| |||||||||||||||
Intersegment elimination | (17,577,308 | ) | ||||||||||||||||||||||
|
| |||||||||||||||||||||||
Consolidated revenues | $ | 113,393,400 | ||||||||||||||||||||||
|
| |||||||||||||||||||||||
Segments operating costs and expenses | $ | 31,288,179 | $ | 40,093,203 | $ | 5,778,579 | $ | 7,258,618 | $ | 3,948,730 | $ | 88,367,309 | ||||||||||||
|
|
|
|
|
|
|
|
|
|
|
| |||||||||||||
Segment income before income tax | $ | 12,127,815 | $ | 9,363,387 | $ | 4,703,518 | $ | 377,580 | $ | (499,364 | ) | $ | 26,072,936 | |||||||||||
|
|
|
|
|
|
|
|
|
|
|
| |||||||||||||
- 67 -
Main Products and Service Revenues:
| For the Three Months Ended June 30 | For the Six Months Ended June 30 | |||||||||||||||
| 2016 | 2015 | 2016 | 2015 | |||||||||||||
Mobile services revenue | $ | 19,785,270 | $ | 20,313,312 | $ | 39,740,318 | $ | 40,070,116 | ||||||||
Local telephone and domestic long distance telephone services revenue | 8,741,855 | 9,292,181 | 17,417,389 | 18,408,788 | ||||||||||||
Sales of products | 6,425,475 | 8,011,428 | 14,317,668 | 16,073,355 | ||||||||||||
Broadband access and domestic leased line services revenue | 5,774,227 | 5,884,236 | 11,661,960 | 11,882,697 | ||||||||||||
Internet services revenue | 5,212,095 | 4,924,699 | 10,404,105 | 9,821,127 | ||||||||||||
International network and leased telephone services revenue | 2,658,118 | 2,650,169 | 5,306,561 | 5,747,049 | ||||||||||||
Others | 7,598,389 | 5,844,568 | 14,291,584 | 11,390,268 | ||||||||||||
|
|
|
|
|
|
|
| |||||||||
| $ | 56,195,429 | $ | 56,920,593 | $ | 113,139,585 | $ | 113,393,400 | |||||||||
|
|
|
|
|
|
|
| |||||||||
- 68 -
TABLE 1
CHUNGHWA TELECOM CO., LTD. AND SUBSIDIARIES
ENDORSEMENTS/GUARANTEES PROVIDED
SIX MONTHS ENDED JUNE 30, 2016
(Amounts in Thousands of New Taiwan Dollars)
No. (Note 1) | Endorsement/ Guarantee Provider | Guaranteed Party | Limits on Endorsement/ Guarantee Amount Provided to Each Guaranteed Party | Maximum Balance for the Period | Ending Balance | Actual Borrowing Amount | Amount of Endorsement/ Guarantee Collateralized by Properties | Ratio of Accumulated Endorsement/ Guarantee to Net Equity Per Latest Financial Statements | Maximum Endorsement/ Guarantee Amount Allowable | Endorsement/ Guarantee Given by Parent on Behalf of Subsidiaries | Endorsement/ Guarantee Given by Subsidiaries on Behalf of Parent | Endorsement/ Guarantee Given on Behalf of Companies in Mainland China | Note | |||||||||||||||||||||||||||||||||||||||||
| Name | Nature of Relationship (Note 2) | |||||||||||||||||||||||||||||||||||||||||||||||||||||
1 | | Senao International Co., Ltd. | | Youth Co., Ltd. | b | $ | 543,018 | $ | 200,000 | $ | 200,000 | $ | — | $ | — | 3.68 | $ | 2,715,091 | Yes | No | No | Notes 3 and 4 | ||||||||||||||||||||||||||||||||
| ISPOT Co., Ltd. | c | 543,018 | 150,000 | 150,000 | 150,000 | — | 2.76 | 2,715,091 | Yes | No | No | Notes 3 and 4 | ||||||||||||||||||||||||||||||||||||||||||
| Aval Technologies Co., Ltd. | b | 543,018 | 300,000 | 300,000 | 300,000 | — | 5.52 | 2,715,091 | Yes | No | No | Notes 3 and 4 | ||||||||||||||||||||||||||||||||||||||||||
| Note 1: | Significant transactions between the Company and its subsidiaries or among subsidiaries are numbered as follows: |
| a. | “0” for the Company. |
| b. | Subsidiaries are numbered from “1”. |
| Note 2: | Relationships between the endorsement/guarantee provider and the guaranteed party: |
| a. | Trading partner. |
| b. | Majority owned subsidiary. |
| c. | The Company and subsidiary owns over 50% ownership of the investee company. |
| d. | A subsidiary jointly owned by the Company and the Company’s directly-owned subsidiary. |
| e. | Guaranteed by the Company according to the construction contract. |
| f. | An investee company. The guarantees were provided based on the Company’s proportionate share in the investee company. |
| Note 3: | The limits on endorsement or guarantee amount provided to each guaranteed party is up to 10% of the net assets value of the latest financial statements of Senao International Co., Ltd. |
| Note 4: | The total amount of endorsement or guarantee that the Company is allowed to provide is up to 50% of the net assets value of the latest financial statements of Senao International Co., Ltd. |
- 69 -
TABLE 2
CHUNGHWA TELECOM CO., LTD. AND SUBSIDIARIES
MARKETABLE SECURITIES HELD
JUNE 30, 2016
(Amounts in Thousands of New Taiwan Dollars)
Held Company Name | Marketable Securities Type and Name | Relationship with the Company | Financial Statement Account | June 30, 2016 | Note | |||||||||||||||||||||||
| Shares (Thousands/ Thousand Units) | Carrying Value (Note 1) | Percentage of Ownership | Fair Value | |||||||||||||||||||||||||
Chunghwa Telecom Co., Ltd. | Stocks | |||||||||||||||||||||||||||
Taipei Financial Center Corp. | — | Financial assets carried at cost | 172,927 | $ | 1,789,530 | 12 | $ | — | — | |||||||||||||||||||
Innovation Works Development Fund, L.P. | — | Financial assets carried at cost | — | 225,929 | 4 | — | — | |||||||||||||||||||||
Industrial Bank of Taiwan II Venture Capital Co., Ltd. (IBT II) | — | Financial assets carried at cost | 5,252 | 52,520 | 17 | — | — | |||||||||||||||||||||
Global Mobile Corp. | — | Financial assets carried at cost | 7,617 | — | 3 | — | — | |||||||||||||||||||||
iD Branding Ventures | — | Financial assets carried at cost | 38 | 375 | 8 | — | — | |||||||||||||||||||||
Innovation Works Limited | — | Financial assets carried at cost | 1,000 | 31,390 | 2 | — | — | |||||||||||||||||||||
RPTI Intergroup International Ltd. | — | Financial assets carried at cost | 4,765 | — | 10 | — | — | |||||||||||||||||||||
Essence Technology Solution, Inc. | — | Financial assets carried at cost | 200 | — | 7 | — | — | |||||||||||||||||||||
Taiwan mobile payment Co., Ltd. | — | Financial assets carried at cost | 1,200 | 12,000 | 2 | — | — | |||||||||||||||||||||
China Airlines Ltd. | — | Available-for-sale financial assets | 263,622 | 2,554,498 | 5 | 2,554,498 | Note 2 | |||||||||||||||||||||
Fund | ||||||||||||||||||||||||||||
Fuh Hwa Strategic High Income Fd of Fds | — | Available-for-sale financial assets | 2,200,506 | 29,927 | — | 29,927 | Note 3 | |||||||||||||||||||||
Bonds | ||||||||||||||||||||||||||||
China Petroleum Corporation 1st Unsecured Corporate Bond-C Issue in 2006 | — | Held-to-maturity financial assets | — | 50,210 | — | 50,361 | Note 4 | |||||||||||||||||||||
China Petroleum Corporation 1st Unsecured Corporate Bond-C Issue in 2006 | — | Held-to-maturity financial assets | — | 100,429 | — | 100,723 | Note 4 | |||||||||||||||||||||
Taiwan Power Co. 2nd Unsecured Corporate Bond-C Issue in 2006 | — | Held-to-maturity financial assets | — | 200,286 | — | 200,491 | Note 4 | |||||||||||||||||||||
Taiwan Power Co. 3rd Unsecured Corporate Bond-C Issue in 2006 | — | Held-to-maturity financial assets | — | 200,908 | — | 201,345 | Note 4 | |||||||||||||||||||||
China Steel Corporation 1st Unsecured Corporate Bonds-A Issue in 2011 | — | Held-to-maturity financial assets | — | 50,016 | — | 50,139 | Note 4 | |||||||||||||||||||||
China Steel Corporation 1st Unsecured Corporate Bonds-A Issue in 2011 | — | Held-to-maturity financial assets | — | 150,092 | — | 150,416 | Note 4 | |||||||||||||||||||||
TSMC 1st Unsecured Corporate Bond-A Issue in 2011 | — | Held-to-maturity financial assets | — | 299,980 | — | 300,707 | Note 4 | |||||||||||||||||||||
TSMC 1st Unsecured Corporate Bond-A Issue in 2011 | — | Held-to-maturity financial assets | — | 100,047 | — | 100,236 | Note 4 | |||||||||||||||||||||
Fubon Financial Holding Co., Ltd. 1st Unsecured Corporate Bond Issue in 2011 | — | Held-to-maturity financial assets | — | 300,162 | — | 301,081 | Note 4 | |||||||||||||||||||||
(Continued)
- 70 -
Held Company Name | Marketable Securities Type and Name | Relationship with the Company | Financial Statement Account | June 30, 2016 | Note | |||||||||||||||||||||||
| Shares (Thousands/ Thousand Units) | Carrying Value (Note 1) | Percentage of Ownership | Fair Value | |||||||||||||||||||||||||
Fubon Financial Holding Co., Ltd. 1st Unsecured Corporate Bond Issue in 2011 | — | Held-to-maturity financial assets | — | $ | 100,050 | — | $ | 100,360 | Note 4 | |||||||||||||||||||
Formosa Petrochemical Corporation 3rd Unsecured Corporate Bonds Issue in 2011 | — | Held-to-maturity financial assets | — | 99,995 | — | 100,080 | Note 4 | |||||||||||||||||||||
Chinese Petroleum Corporation 2nd unsecured Corporate Bonds-A Issue in 2012 | — | Held-to-maturity financial assets | �� | — | 199,949 | — | 201,626 | Note 4 | ||||||||||||||||||||
Taiwan Power Co. 1st Unsecured Corporate Bond-A Issue in 2012 | — | Held-to-maturity financial assets | — | 99,983 | — | 100,615 | Note 4 | |||||||||||||||||||||
Taiwan Power Co. 1st Unsecured Corporate Bond-A Issue in 2012 | — | Held-to-maturity financial assets | — | 39,993 | — | 40,246 | Note 4 | |||||||||||||||||||||
Taiwan Power Co. 2nd Unsecured Corporate Bond-A Issue in 2012 | — | Held-to-maturity financial assets | — | 99,981 | — | 100,773 | Note 4 | |||||||||||||||||||||
TSMC 1st Unsecured Corporate Bond-A Issue in 2012 | — | Held-to-maturity financial assets | — | 199,975 | — | 200,858 | Note 4 | |||||||||||||||||||||
TSMC 1st Unsecured Corporate Bond-A Issue in 2012 | — | Held-to-maturity financial assets | — | 99,987 | — | 100,429 | Note 4 | |||||||||||||||||||||
TSMC 1st Unsecured Corporate Bond-A Issue in 2012 | — | Held-to-maturity financial assets | — | 200,038 | — | 200,858 | Note 4 | |||||||||||||||||||||
TSMC 2nd Unsecured Corporate Bond-A Issue in 2012 | — | Held-to-maturity financial assets | — | 199,956 | — | 201,538 | Note 4 | |||||||||||||||||||||
TSMC 3rd Unsecured Corporate Bond-A Issue in 2012 | — | Held-to-maturity financial assets | — | 199,948 | — | 200,800 | Note 4 | |||||||||||||||||||||
Fubon Financial Holding Co., Ltd. 1st Unsecured Corporate Bond-A Issue in 2012 | — | Held-to-maturity financial assets | — | 300,000 | — | 301,268 | Note 4 | |||||||||||||||||||||
China Development Holding Corporation 1st Unsecured Corporate Bond-A Issue in 2012 | — | Held-to-maturity financial assets | — | 150,008 | — | 150,838 | Note 4 | |||||||||||||||||||||
China Development Holding Corporation 1st Unsecured Corporate Bond-A Issue in 2012 | — | Held-to-maturity financial assets | — | 100,012 | — | 100,560 | Note 4 | |||||||||||||||||||||
China Development Holding Corporation 1st Unsecured Corporate Bond-A Issue in 2012 | — | Held-to-maturity financial assets | — | 100,012 | — | 100,559 | Note 4 | |||||||||||||||||||||
Eximbank 19-2nd unsecured Financial Debenture | — | Held-to-maturity financial assets | — | 150,000 | — | 151,079 | Note 4 | |||||||||||||||||||||
Senao International Co., Ltd. | Stocks | |||||||||||||||||||||||||||
N.T.U. Innovation Incubation Corporation | — | Financial assets carried at cost | 1,200 | 12,000 | 9 | — | — | |||||||||||||||||||||
CHIEF Telecom Inc. | Stocks | |||||||||||||||||||||||||||
3 Link Information Service Co., Ltd. | — | Financial assets carried at cost | 374 | 3,450 | 10 | — | — | |||||||||||||||||||||
Chunghwa Investment Co., Ltd. | Stocks | |||||||||||||||||||||||||||
Tatung Technology Inc. | — | Financial assets carried at cost | 4,571 | 73,964 | 11 | — | — | |||||||||||||||||||||
iD Branding Ventures | — | Financial assets carried at cost | 13 | 125 | 3 | — | — | |||||||||||||||||||||
VisEra Technologies Company Ltd. | — | Financial assets carried at cost | 589 | 12,637 | — | — | — | |||||||||||||||||||||
PChome Store Inc. | — | Available-for-sale financial assets | 280 | 25,685 | 1 | 25,685 | Note 2 | |||||||||||||||||||||
Tons Lightology Inc. | — | Available-for-sale financial assets | 1,318 | 55,747 | 3 | 55,747 | Note 2 | |||||||||||||||||||||
(Continued)
- 71 -
Held Company Name | Marketable Securities Type and Name | Relationship with the Company | Financial Statement Account | June 30, 2016 | Note | |||||||||||||||||||||||
| Shares (Thousands/ Thousand Units) | Carrying Value (Note 1) | Percentage of Ownership | Fair Value | |||||||||||||||||||||||||
Chunghwa Hsingta Co., Ltd. | Stocks | |||||||||||||||||||||||||||
Cotech Engineering Fuzhou Corp. | — | Financial assets carried at cost | — | $26,057 | 5 | $— | — | |||||||||||||||||||||
| Note 1: | Showing at carrying amounts with adjustments for fair value and deducted accumulated impairment loss; otherwise, showing at their original carrying amounts on amortized cost deducted the accumulated impairment loss. |
| Note 2: | Fair value was based on the closing price on June 30, 2016. |
| Note 3: | Fair value was based on the net asset value on June 30, 2016. |
| Note 4: | Fair value was based on the average trading price on June 30, 2016. |
(Concluded)
- 72 -
TABLE 3
CHUNGHWA TELECOM CO., LTD. AND SUBSIDIARIES
TOTAL PURCHASES FROM OR SALES TO RELATED PARTIES AMOUNTING TO AT LEAST NT$100 MILLION OR 20% OF THE PAID-IN CAPITAL
SIX MONTHS ENDED JUNE 30, 2016
(Amounts in Thousands of New Taiwan Dollars)
Company Name | Related Party | Nature of Relationship | Transaction Details | Abnormal Transaction | Notes/Accounts Payable or Receivable | |||||||||||||||||||||||||||
Purchase/Sales (Note 1) | Amount (Notes 2 and 5) | % to Total | Payment Terms | Units Price | Payment Terms | Ending Balance (Notes 3 and 5) | % to Total | |||||||||||||||||||||||||
Chunghwa Telecom Co., Ltd. | Senao International Co., Ltd. | Subsidiary | Sales | $ | 325,381 | — | 30 days | $ | — | — | $ | 15,611 | — | |||||||||||||||||||
Purchase | 4,964,550 | 8 | 30-90 days | — | — | (1,364,437 | ) | (9 | ) | |||||||||||||||||||||||
CHIEF Telecom Inc. | Subsidiary | Sales | 181,960 | — | 30 days | — | — | 41,877 | — | |||||||||||||||||||||||
Purchase | 158,211 | — | 60 days | — | — | (57,868 | ) | — | ||||||||||||||||||||||||
Chunghwa System Integration Co., Ltd. | Subsidiary | Purchase | 406,543 | 1 | 30 days | — | — | (238,079 | ) | (2 | ) | |||||||||||||||||||||
Honghwa International Co., Ltd. | Subsidiary | Purchase | 2,124,260 | 4 | 30-60 days | — | — | (499,215 | ) | (3 | ) | |||||||||||||||||||||
Donghwa Telecom Co., Ltd. | Subsidiary | Purchase | 198,360 | — | 90 days | — | — | (60,649 | ) | — | ||||||||||||||||||||||
Chunghwa Telecom Global, Inc. | Subsidiary | Purchase | 176,495 | — | 90 days | — | — | (86,656 | ) | (1 | ) | |||||||||||||||||||||
ST-2 Satellite Ventures Pte. Ltd. | Associate | Purchase | 203,730 | — | 30 days | — | — | (50,765 | ) | — | ||||||||||||||||||||||
Taiwan International Standard Electronics Co., Ltd. | Associate | Purchase | 265,239 | — | 30-90 days | — | — | (205,695 | ) | (1 | ) | |||||||||||||||||||||
So-net Entertainment Taiwan Limited | Associate | Sales | 123,270 | — | 60 days | — | — | 16,171 | — | |||||||||||||||||||||||
Senao International Co., Ltd. | Chunghwa Telecom Co., Ltd. | Parent company | Sales | 5,067,563 | 31 | 30-90 days | — | — | 1,373,416 | 65 | ||||||||||||||||||||||
Purchase | 185,776 | 1 | 30 days | — | — | (10,043 | ) | — | ||||||||||||||||||||||||
HopeTech Technologies Limited | Associate | Purchase | 105,838 | 1 | 30 days | — | — | (28,622 | ) | 1 | ||||||||||||||||||||||
CHIEF Telecom Inc. | Chunghwa Telecom Co., Ltd. | Parent company | Sales | 158,211 | 17 | 60 days | — | — | 57,868 | 33 | ||||||||||||||||||||||
Purchase | 181,581 | 28 | 30 days | — | — | (41,572 | ) | (37 | ) | |||||||||||||||||||||||
Chunghwa System Integration Co., Ltd. | Chunghwa Telecom Co., Ltd. | Parent company | Sales | 482,966 | 85 | 30 days | — | — | 238,079 | 94 | ||||||||||||||||||||||
Honghwa International Co., Ltd. | Chunghwa Telecom Co., Ltd. | Parent company | Sales | 2,124,260 | 100 | 30-60 days | — | — | 499,215 | 100 | ||||||||||||||||||||||
Donghwa Telecom Co., Ltd. | Chunghwa Telecom Co., Ltd. | Parent company | Sales | 198,360 | 39 | 90 days | — | — | 60,649 | 76 | ||||||||||||||||||||||
Chunghwa Telecom Global, Inc. | Chunghwa Telecom Co., Ltd. | Parent company | Sales | 176,495 | 56 | 90 days | — | — | 86,656 | 82 | ||||||||||||||||||||||
| Note 1: | Purchase included acquisition of services costs. |
| Note 2: | The differences were because Chunghwa Telecom Co., Ltd. and subsidiaries classified the amount as inventories, property, plant and equipment, intangible assets, and operating expenses. |
| Note 3: | Notes and accounts receivable did not include the amount as amounts collected for others and other receivables. |
| Note 4: | Transaction terms with the related parties were determined in accordance with mutual agreements when there were no similar transactions with third parties. Other transactions with related parties were not significantly different from those with third parties. |
| Note 5: | All intra-company transactions, balances, income and expenses are eliminated upon consolidation. |
- 73 -
TABLE 4
CHUNGHWA TELECOM CO., LTD. AND SUBSIDIARIES
RECEIVABLES FROM RELATED PARTIES AMOUNTING TO AT LEAST NT$100 MILLION OR 20% OF THE PAID-IN CAPITAL
JUNE 30, 2016
(Amounts in Thousands of New Taiwan Dollars)
Company Name | Related Party | Nature of Relationship | Ending Balance | Turnover Rate (Note 1) | Overdue | Amounts Received in Subsequent Period | Allowance for Bad Debts | |||||||||||||||||||||
| Amounts | Action Taken | |||||||||||||||||||||||||||
Chunghwa Telecom Co., Ltd. | Senao International Co., Ltd. | Subsidiary | $
| 228,544 (Note 2 | ) | 11.19 | $ | — | — | $ | 228,037 | $ | — | |||||||||||||||
Senao International Co., Ltd. | Chunghwa Telecom Co., Ltd. | Parent company |
| 1,805,462 (Note 2 | ) | 8.10 | — | — | 1,220,181 | — | ||||||||||||||||||
Chunghwa System Integration Co., Ltd. | Chunghwa Telecom Co., Ltd. | Parent company |
| 238,079 (Note 2 | ) | 3.46 | — | — | 71,921 | — | ||||||||||||||||||
Honghwa International Co., Ltd. | Chunghwa Telecom Co., Ltd. | Parent company |
| 499,215 (Note 2 | ) | 7.04 | — | — | 292,100 | — | ||||||||||||||||||
| Note 1: | Payments and receipts collected in trust for others are excluded from the accounts receivable for calculating the turnover rate. |
| Note 2: | The amount was eliminated upon consolidation. |
- 74 -
TABLE 5
CHUNGHWA TELECOM CO., LTD. AND SUBSIDIARIES
NAMES, LOCATIONS, AND OTHER INFORMATION OF INVESTEES IN WHICH THE COMPANY EXERCISES SIGNIFICANT INFLUENCE (EXCLUDING INVESTMENT IN MAINLAND CHINA)
SIX MONTHS ENDED JUNE 30, 2016
(Amounts in Thousands of New Taiwan Dollars)
Investor | Investee Company | Location | Main Businesses and Products | Original Investment Amount | Balance as of June 30, 2016 | Net Income (Loss) of the Investee | Recognized Gain (Loss) (Notes 1 and 2) | Note | ||||||||||||||||||||||||||
| June 30, 2016 | December 31, 2015 | Shares (Thousands) | Percentage of Ownership (%) | Carrying Value | ||||||||||||||||||||||||||||||
Chunghwa Telecom Co., Ltd. | Senao International Co., Ltd. | Taiwan | Handset and peripherals retailer; sales of CHT mobile phone plans as an agent | $ | 1,065,813 | $ | 1,065,813 | 71,773 | 29 | $ | 1,577,009 | $ | 469,924 | $ | 132,951 | Subsidiary (Note 8) | ||||||||||||||||||
Light Era Development Co., Ltd. | Taiwan | Planning and development of real estate and intelligent buildings, and property management | 3,000,000 | 3,000,000 | 300,000 | 100 | 3,846,735 | 2,735 | 2,768 | Subsidiary (Note 8) | ||||||||||||||||||||||||
Donghwa Telecom Co., Ltd. | Hong Kong | International private leased circuit, IP VPN service, and IP transit services | 1,567,453 | 1,567,453 | 402,590 | 100 | 1,603,997 | 24,908 | 24,908 | Subsidiary (Note 8) | ||||||||||||||||||||||||
Chunghwa Telecom Singapore Pte., Ltd. | Singapore | International private leased circuit, IP VPN service, and IP transit services | 574,112 | 574,112 | 26,383 | 100 | 808,193 | 56,003 | 56,003 | Subsidiary (Note 8) | ||||||||||||||||||||||||
Chunghwa System Integration Co., Ltd. | Taiwan | Providing system integration services and telecommunication equipment | 838,506 | 838,506 | 60,000 | 100 | 683,613 | (7,536 | ) | 7,322 | Subsidiary (Note 8) | |||||||||||||||||||||||
CHIEF Telecom Inc. | Taiwan | Network integration, internet data center (“IDC”), communications integration and cloud application services | 482,165 | 482,165 | 41,357 | 69 | 693,984 | 157,296 | 109,595 | Subsidiary (Note 8) | ||||||||||||||||||||||||
Chunghwa Investment Co., Ltd. | Taiwan | Investment | 639,559 | 639,559 | 68,085 | 89 | 1,230,123 | 123,819 | 109,561 | Subsidiary (Note 8) | ||||||||||||||||||||||||
Prime Asia Investments Group Ltd. (B.V.I.) | British Virgin Islands | Investment | 385,274 | 385,274 | 1 | 100 | 240,412 | (3,126 | ) | (3,126 | ) | Subsidiary (Note 8) | ||||||||||||||||||||||
Honghwa International Co., Ltd. | Taiwan | Telecommunication engineering, sales agent of mobile phone plan application and other business services | 180,000 | 180,000 | 18,000 | 100 | 271,100 | 57,736 | 57,736 | Subsidiary (Note 8) | ||||||||||||||||||||||||
Chunghwa International Yellow Pages Co., Ltd. | Taiwan | Digital information supply services and advertisement services | 150,000 | 150,000 | 15,000 | 100 | 179,417 | 11,215 | 11,215 | Subsidiary (Note 8) | ||||||||||||||||||||||||
Chunghwa Telecom Vietnam Co., Ltd. | Vietnam | Intelligent energy saving solutions, international circuit, and information and communication technology (“ICT”) services. | 148,275 | 148,275 | — | 100 | 131,495 | (1,196 | ) | (1,196 | ) | Subsidiary (Note 8) | ||||||||||||||||||||||
Chunghwa Telecom Global, Inc. | United States | International private leased circuit, internet services, and transit services | 70,429 | 70,429 | 6,000 | 100 | 168,013 | 14,687 | 15,815 | Subsidiary (Note 8) | ||||||||||||||||||||||||
Spring House Entertainment Tech. Inc. | Taiwan | Digital entertainment contents production, animated character licensing and endorsement, and mobile digital platform construction | 62,209 | 62,209 | 10,277 | 56 | 93,137 | (3,411 | ) | (1,871 | ) | Subsidiary (Note 8) | ||||||||||||||||||||||
Smartfun Digital Co., Ltd. | Taiwan | Providing diversified family education digital services | 65,000 | 65,000 | 6,500 | 65 | 65,986 | 2,663 | 1,731 | Subsidiary (Note 8) | ||||||||||||||||||||||||
Chunghwa Telecom Japan Co., Ltd. | Japan | International private leased circuit, IP VPN service, and IP transit services | 17,291 | 17,291 | 1 | 100 | 46,337 | 1,677 | 1,677 | Subsidiary (Note 8) | ||||||||||||||||||||||||
Chunghwa Sochamp Technology Inc. | Taiwan | Design, development and production of Automatic License Plate Recognition software and hardware | 20,400 | 20,400 | 2,040 | 51 | (1,897 | ) | (8,352 | ) | (3,585 | ) | Subsidiary (Note 8) | |||||||||||||||||||||
New Prospect Investments Holdings Ltd. (B.V.I.) | British Virgin Islands | Investment | — | — | — | 100 | — | — | — | Subsidiary (Notes 3 and 8) | ||||||||||||||||||||||||
International Integrated System, Inc. | Taiwan | IT solution provider, IT application consultation, system integration and package solution | 283,500 | 283,500 | 22,498 | 33 | 299,986 | 40,735 | 14,025 | Associate | ||||||||||||||||||||||||
Viettel-CHT Co., Ltd. | Vietnam | IDC services | 288,327 | 288,327 | — | 30 | 242,650 | 64,367 | 19,319 | Associate | ||||||||||||||||||||||||
Taiwan International Standard Electronics Co., Ltd. | Taiwan | Manufacturing, selling, designing, and maintaining of telecommunications systems and equipment | 164,000 | 164,000 | 1,760 | 40 | 99,809 | 114,123 | 83,425 | Associate | ||||||||||||||||||||||||
(Continued)
- 75 -
Investor | Investee Company | Location | Main Businesses and Products | Original Investment Amount | Balance as of June 30, 2016 | Net Income (Loss) of the Investee | Recognized Gain (Loss) (Notes 1 and 2) | Note | ||||||||||||||||||||||||||
| June 30, 2016 | December 31, 2015 | Shares (Thousands) | Percentage of Ownership (%) | Carrying Value | ||||||||||||||||||||||||||||||
Skysoft Co., Ltd. | Taiwan | Providing of music on-line, software, electronic information, and advertisement services | $ | 67,025 | $ | 67,025 | 4,438 | 30 | $ | 138,019 | $ | 1,615 | $ | 923 | Associate | |||||||||||||||||||
So-net Entertainment Taiwan Limited | Taiwan | Online service and sale of computer hardware | 120,008 | 120,008 | 9,429 | 30 | 123,916 | 60,240 | 18,072 | Associate | ||||||||||||||||||||||||
KingwayTek Technology Co., Ltd. | Taiwan | Publishing books, data processing and software services | 69,013 | 69,013 | 4,256 | 26 | 114,540 | (17,521 | ) | (4,326 | ) | Associate | ||||||||||||||||||||||
Taiwan International Ports Logistics Corporation | Taiwan | Import and export storage, logistic warehouse, and ocean shipping service | 80,000 | 80,000 | 8,000 | 27 | 60,058 | (33,305 | ) | (8,870 | ) | Associate | ||||||||||||||||||||||
Dian Zuan Integrating Marketing Co., Ltd. | Taiwan | Information technology service and general advertisement service | 97,598 | 97,598 | 5,400 | 18 | 19,728 | (42,215 | ) | (7,599 | ) | Associate | ||||||||||||||||||||||
Alliance Digital Tech Co., Ltd. | Taiwan | Development of mobile payments and information processing service | 30,000 | 30,000 | 3,000 | 13 | 11,078 | (31,944 | ) | (4,258 | ) | Associate | ||||||||||||||||||||||
Huada Digital Corporation | Taiwan | Providing software service | 250,000 | 250,000 | 25,000 | 50 | 182,426 | (51,770 | ) | (24,311 | ) | Joint venture (Note 5) | ||||||||||||||||||||||
Chunghwa Benefit One Co., Ltd. | Taiwan | E-commerce of employee benefits | 50,000 | 50,000 | 5,000 | 50 | 20,785 | 265 | 133 | Joint venture | ||||||||||||||||||||||||
Senao International Co., Ltd. | Senao Networks, Inc. | Taiwan | Telecommunication facilities manufactures and sales | 202,758 | 202,758 | 16,579 | 34 | 756,753 | 315,243 | 106,529 | Associate | |||||||||||||||||||||||
Senao International (Samoa) Holding Ltd. | Samoa Islands | International investment | 2,416,645 | 2,416,645 | 81,175 | 100 | 599,643 | (25,921 | ) | (25,891 | ) | Subsidiary (Note 8) | ||||||||||||||||||||||
Dian Zuan Integrating Marketing Co., Ltd. | Taiwan | Information technology service and general advertisement service | 24,000 | 24,000 | 2,400 | 8 | 11,272 | (42,215 | ) | (3,323 | ) | Associate | ||||||||||||||||||||||
Youth Co., Ltd. | Taiwan | Sale of information and communication technologies products | 335,450 | 335,450 | 13,780 | 89 | 301,705 | (12,371 | ) | (16,365 | ) | Subsidiary (Note 8) | ||||||||||||||||||||||
Aval Technologies Co., Ltd. | Taiwan | Sale of information and communication technologies products | 60,000 | 60,000 | 6,000 | 100 | 57,366 | (1,838 | ) | (1,838 | ) | Subsidiary (Note 8) | ||||||||||||||||||||||
CHIEF Telecom Inc. | Unigate Telecom Inc. | Taiwan | Telecommunication and internet service | 2,000 | 2,000 | 200 | 100 | 1,219 | (82 | ) | (82 | ) | Subsidiary (Note 8) | |||||||||||||||||||||
Chief International Corp. | Samoa Islands | Telecommunication and internet service | 6,068 | 6,068 | 200 | 100 | 37,311 | 4,154 | 4,154 | Subsidiary (Note 8) | ||||||||||||||||||||||||
Chunghwa System Integrated Co., Ltd. | Concord Technology Co., Ltd. | Brunei | Investment | 47,321 | 47,321 | 1,500 | 100 | 18,781 | (88 | ) | (88 | ) | Subsidiary (Note 8) | |||||||||||||||||||||
Spring House Entertainment Tech. Inc. | Ceylon Innovation Co., Ltd. | Taiwan | E-book publishing and copyright negotiation of digital music | 10,000 | 10,000 | — | 100 | — | 118 | 118 | Subsidiary (Notes 6 and 8) | |||||||||||||||||||||||
Chunghwa Telecom Singapore Pte., Ltd. | ST-2 Satellite Ventures Pte., Ltd. | Singapore | Operation of ST-2 telecommunication satellite | 409,061 | 409,061 | 18,102 | 38 | 559,038 | 141,405 | 53,734 | Associate | |||||||||||||||||||||||
Chunghwa Investment Co., Ltd. | Chunghwa Precision Test Tech. Co., Ltd. | Taiwan | Production and sale of semiconductor testing components and printed circuit board | 199,736 | 203,443 | 12,558 | 41 | 969,371 | 263,187 | 113,170 | Subsidiary (Note 8) | |||||||||||||||||||||||
Chunghwa Investment Holding Co., Ltd. | Brunei | Investment | 46,035 | 46,035 | 1,432 | 100 | 14,451 | 3 | 3 | Subsidiary (Note 8) | ||||||||||||||||||||||||
CHIEF Telecom Inc. | Taiwan | Network integration, internet data center (“IDC”), communications integration and cloud application services | 20,000 | 20,000 | 2,180 | 4 | 33,288 | 157,296 | 5,710 | Associate (Note 8) | ||||||||||||||||||||||||
Senao International Co., Ltd. | Taiwan | Selling and maintaining mobile phones and its peripheral products | 49,731 | 49,731 | 1,001 | — | 42,584 | 469,924 | 1,531 | Associate (Note 8) | ||||||||||||||||||||||||
Chunghwa Precision Test Tech. Co., Ltd. | Chunghwa Precision Test Tech. USA Corporation | United States | Design and after-sale services of semiconductor testing components and printed circuit board | 12,636 | 12,636 | 400 | 100 | 20,104 | 4,773 | 4,773 | Subsidiary (Note 8) | |||||||||||||||||||||||
CHPT Japan Co., Ltd. | Japan | Related services of electronic parts, machinery processed products and printed circuit board | 2,008 | 2,008 | 1 | 100 | 2,183 | 69 | 69 | Subsidiary (Note 8) | ||||||||||||||||||||||||
Chunghwa Precision Test Tech. International, Ltd. | Samoa Islands | Wholesale and retail of electronic materials, and investment | 2,970 | 2,970 | 100 | 100 | 3,008 | 698 | 698 | Subsidiary (Note 8) | ||||||||||||||||||||||||
Prime Asia Investments Group, Ltd. (B.V.I.) | Chunghwa Hsingta Co., Ltd. | Hong Kong | Investment | 375,274 | 375,274 | 1 | 100 | 240,412 | (3,126 | ) | (3,126 | ) | Subsidiary (Note 8) | |||||||||||||||||||||
MeWorks Limited (HK) | Hong Kong | Investment | 10,000 | 10,000 | — | 20 | — | — | — | Associate | ||||||||||||||||||||||||
(Continued)
- 76 -
Investor Company | Investee Company | Location | Main Businesses and Products | Original Investment Amount | Balance as of June 30, 2016 | Net Income (Loss) of the Investee | Recognized Gain (Loss) (Notes 1 and 2) | Note | ||||||||||||||||||||||||||||
| June 30, 2016 | December 31, 2015 | Shares (Thousands) | Percentage of Ownership (%) | Carrying Value | ||||||||||||||||||||||||||||||||
Senao International (Samoa) Holding Ltd. | Senao International HK Limited | Hong Kong | International investment | $ | 2,393,646 | $ | 2,393,646 | 80,440 | 100 | $ | 562,026 | $ | (26,928 | ) | $ | (26,928 | ) | Subsidiary (Note 8) | ||||||||||||||||||
HopeTech Technologies Limited | Hong Kong | Information technology and telecommunication products sales | 21,177 | 21,177 | 5,240 | 45 | 23,005 | 2,233 | 1,005 | Associate | ||||||||||||||||||||||||||
Chunghwa Investment Holding Co., Ltd. | CHI One Investment Co., Limited | Hong Kong | Investment | — | — | — | 100 | — | — | — | Subsidiary (Notes 7 and 8) | |||||||||||||||||||||||||
Youth Co., Ltd. | ISPOT Co., Ltd. | Taiwan | Sale of information and communication technologies products | 23,021 | 23,021 | — | 100 | (19 | ) | (4,175 | ) | (4,410 | ) | Subsidiary (Note 8) | ||||||||||||||||||||||
Youyi Co., Ltd. | Taiwan | Maintenance of information and communication technologies products | 6,920 | 6,920 | — | 100 | 2,083 | (16 | ) | (118 | ) | Subsidiary (Note 8) | ||||||||||||||||||||||||
Chunghwa International Yellow Pages Co., Ltd. | Click Force Marketing Company | Taiwan | Advertising services | 44,607 | 44,607 | 1,078 | 49 | 37,287 | (1,400 | ) | (1,627 | ) | Associate | |||||||||||||||||||||||
| Note 1: | The amounts were based on reviewed financial statements. |
| Note 2: | Recognized gain (loss) of investees includes amortization of differences between the investment cost and net value and elimination of unrealized transactions. |
| Note 3: | New Prospect Investments Holdings Ltd. (B.V.I.) was incorporated in March 2006, but have not yet begun operation as of June 30, 2016. |
| Note 4: | Investment in mainland China is included in Table 6. |
| Note 5: | In March 2016, the stockholders of Huada Digital Corporation approved in their meeting that Huada Digital Corporation would start its dissolution from March 31, 2016. The liquidation of Huada Digital Corporation is still in process. |
| Note 6: | Ceylon Innovation Co., Ltd.’s dissolution has been approved by local regulator in January 2016. Spring House Entertainment Tech Inc. received the proceeds from the liquidation. The liquidation of Ceylon Innovation Co., Ltd. is still in process. |
| Note 7: | CHI One Investment Co., Limited completed its liquidation in July 2016. Chunghwa Investment Holding Co., Ltd. received the proceeds from the liquidation. |
| Note 8: | The amount was eliminated upon consolidation. |
(Concluded)
- 77 -
TABLE 6
CHUNGHWA TELECOM CO., LTD. AND SUBSIDIARIES
INVESTMENT IN MAINLAND CHINA
SIX MONTHS ENDED JUNE 30, 2016
(Amounts in Thousands of New Taiwan Dollars)
Investee | Main Businesses and Products | Total Amount of Paid-in Capital | Investment Type (Note 1) | Accumulated Outflow of Investment from Taiwan as of January 1, 2016 | Investment Flows | Accumulated Outflow of Investment from Taiwan as of June 30, 2016 | Net Income (Loss) of the Investee | % Ownership of Direct or Indirect Investment | Investment Gain (Loss) (Note 2) | Carrying Value as of June 30, 2016 | Accumulated Inward Remittance of Earnings as of June 30, 2016 | Note | ||||||||||||||||||||||||||||||||||||
| Outflow | Inflow | |||||||||||||||||||||||||||||||||||||||||||||||
Glory Network System Service (Shanghai) Co., Ltd. | Design, development and production of computer and internet software, installment, maintenance and consulting services of information system integration, and sales of self-production products | $ | 47,321 | 2 | $ | 47,321 | $ | — | $ | — | $ | 47,321 | $ | (88 | ) | 100 | $ | (88 | ) | $ | 18,781 | $ | — | | Notes 8 and 11 | | ||||||||||||||||||||||
Senao Trading (Fujian) Co., Ltd. | Sale of information and communication technologies products | 1,073,170 | 2 | 1,073,170 | — | — | 1,073,170 | (621 | ) | 100 | (621 | ) | 202,926 | — | Note 11 | |||||||||||||||||||||||||||||||||
Senao International Trading (Shanghai) Co., Ltd. | Sale of information and communication technologies products | 955,838 | 2 | 955,838 | — | — | 955,838 | (27,999 | ) | 100 | (27,999 | ) | 190,182 | — | Note 11 | |||||||||||||||||||||||||||||||||
Senao International Trading (Shanghai) Co., Ltd. (Note 7) | Maintenance of information and communication technologies products | 87,540 | 2 | 87,540 | — | — | 87,540 | 938 | 100 | 938 | 75,109 | — | Note 11 | |||||||||||||||||||||||||||||||||||
Senao International Trading (Jiangsu) Co., Ltd. | Sale of information and communication technologies products | 263,736 | 2 | 263,736 | — | — | 263,736 | 754 | 100 | 754 | 90,490 | — | Note 11 | |||||||||||||||||||||||||||||||||||
Chunghwa Telecom (China) Co., Ltd. | Integrated information and communication solution services for enterprise clients, and intelligent energy network service | 177,176 | 2 | 177,176 | — | — | 177,176 | 1,542 | 100 | 1,542 | 67,282 | — | Note 11 | |||||||||||||||||||||||||||||||||||
Jiangsu Zhenghua Information Technology Company, LLC | Providing intelligent energy saving solution and intelligent buildings services | 189,410 | 2 | 142,057 | — | — | 142,057 | (5,726 | ) | 75 | (4,294 | ) | 126,730 | — | | Notes 9 and 11 | | |||||||||||||||||||||||||||||||
Hua-Xiong Information Technology Co., Ltd. | Providing intelligent buildings and smart home services | 56,386 | 2 | 28,855 | — | 20,779 | — | (824 | ) | 51 | (420 | ) | — | — | | Notes 10 and 11 | | |||||||||||||||||||||||||||||||
Shanghai Taihua Electronic Technology Limited | Design of printed circuit board and related consultation service | 2,970 | 2 | 2,970 | — | — | 2,970 | 698 | 100 | 698 | 3,010 | — | Note 11 | |||||||||||||||||||||||||||||||||||
(Continued)
- 78 -
Investee | Main Businesses and Products | Total Amount of Paid-in Capital | Investment Type (Note 1) | Accumulated Outflow of Investment from Taiwan as of January 1, 2015 | Investment Flows | Accumulated Outflow of Investment from Taiwan as of June 30, 2016 | Net Income (Loss) of the Investee | % Ownership of Direct or Indirect Investment | Investment Gain (Loss) (Note 2) | Carrying Value as of June 30, 2016 | Accumulated Inward Remittance of Earnings as of June 30, 2016 | Note | ||||||||||||||||||||||||||||||||||||
| Outflow | Inflow | |||||||||||||||||||||||||||||||||||||||||||||||
Shanghai Chief Telecom Co., Ltd. | Telecommunication and internet service | $ | 10,150 | 1 | $ | 4,973 | $ | — | $ | — | $ | 4,973 | $ | (1,134 | ) | 49 | $ | (556 | ) | $ | 3,235 | $ | — | Note 11 | ||||||||||||||||||||||||
Investee | Accumulated Investment in Mainland China as of June 30, 2016 | Investment Amounts Authorized by Investment Commission, MOEA | Upper Limit on Investment Stipulated by Investment Commission, MOEA | |||||||||
Glory Network System Service (Shanghai) Co., Ltd. (Note 3) | $ | 47,321 | $ | 47,321 | $ | 356,148 | ||||||
SENAO and its subsidiaries (Note 6) | 2,380,284 | 2,380,284 | — | |||||||||
Chunghwa Telecom (China) Co., Ltd. (Note 6) | 177,176 | 177,176 | — | |||||||||
Jiangsu Zhenghua Information Technology Company, LLC (Note 6) | 142,057 | 142,057 | — | |||||||||
Hua-Xiong Information Technology Co., Ltd. (Note 10) | — | — | — | |||||||||
Shanghai Taihua Electronic Technology Limited (Note 4) | 2,970 | 2,970 | 1,725,280 | |||||||||
Shanghai Chief Telecom Co., Ltd. (Note 5) | 4,973 | 4,973 | 550,220 | |||||||||
| Note 1: | Investments are divided into three categories as follows: |
| a. | Direct investment. |
| b. | Investments through a holding company registered in a third region. |
| c. | Others. |
| Note 2: | The amounts were calculated based on the investee’s reviewed financial statements. |
| Note 3: | The amount was calculated based on the net assets value of Chunghwa System Integration Co., Ltd. |
| Note 4: | Shanghai Taihua Electronic Technology Limited was calculated based on the consolidated net assets value of Chunghwa Investment Co., Ltd. |
| Note 5: | Shanghai Chief Telecom Co., Ltd. was calculated based on the consolidated net assets value of CHIEF Telecom Inc. |
| Note 6: | Based on “Principle of investment or Technical Cooperation in Mainland China”, Chunghwa and SENAO are not subjective to the limited amount due to the operating headquarters documents issued by Industrial Development Bureau. |
| Note 7: | The English name is the same as the above entity; however the Chinese name included in the respective Articles of Incorporations is different from the above entity. |
| Note 8: | Glory Network System Service (Shanghai) Co., Ltd. was approved to end its business and dissolve. The liquidation of Glory Network System Service (Shanghai) Co., Ltd. is still in progress. |
| Note 9: | Jiangsu Zhenhua Information Technology Company, LLC. was approved to end its business and dissolve in May 2016. The liquidation of Jiangsu Zhenhua Information Technology Company, LLC. is still in process. |
| Note 10: | Hua-Xiong Information Technology Co., Ltd.’s dissolution was approved by local regulator in March 2016. Chunghwa Hsingta Co., Ltd. received part of the proceeds from the liquidation in April 2016. Hua-Xiong Information Technology Co., Ltd. completed its liquidation and annulled its company registration in May 2016. |
| Note 11: | The amount was eliminated upon consolidation. |
(Concluded)
- 79 -
TABLE 7
CHUNGHWA TELECOM CO., LTD. AND SUBSIDIARIES
INTERCOMPANY RELATIONSHIPS AND SIGNIFICANT TRANSACTIONS
SIX MONTHS ENDED JUNE 30, 2016
(Amounts in Thousands of New Taiwan Dollars)
Year | No. (Note 1) | Company Name | Related Party | Nature of (Note 2) | Transaction Details | |||||||||||||||||
Financial Statement Account | Amount (Note 5) | Payment Terms (Note 3) | % to Total Sales or Assets (Note 4) | |||||||||||||||||||
2016 | 0 | Chunghwa Telecom Co., Ltd. | Senao International Co., Ltd. | a | Accounts receivable | $ | 15,611 | — | — | |||||||||||||
| Accrued custodial receipts | 212,933 | — | — | |||||||||||||||||||
| Inventories | 11,249 | — | — | |||||||||||||||||||
| Accounts payable | 1,364,437 | — | — | |||||||||||||||||||
| Amounts collected for others | 441,256 | — | — | |||||||||||||||||||
| Revenues | 325,381 | — | — | |||||||||||||||||||
| Operating costs and expenses | 4,964,550 | — | 4 | |||||||||||||||||||
| CHIEF Telecom Inc. | a | Accounts receivable | 41,877 | — | — | |||||||||||||||||
| Accounts payable | 57,868 | — | — | |||||||||||||||||||
| Revenues | 181,960 | — | — | |||||||||||||||||||
| Operating costs and expenses | 158,211 | — | — | |||||||||||||||||||
| Chunghwa International Yellow Pages Co., Ltd. | a | Accounts payable | 27,314 | — | — | |||||||||||||||||
| Amounts collected for others | 26,307 | — | — | |||||||||||||||||||
| Revenues | 12,224 | — | — | |||||||||||||||||||
| Operating costs and expenses | 63,271 | — | — | |||||||||||||||||||
| Chunghwa System Integration Co., Ltd. | a | Accounts receivable | 14,642 | — | — | |||||||||||||||||
| Accounts payable | 238,079 | — | — | |||||||||||||||||||
| Operating costs and expenses | 406,543 | — | — | |||||||||||||||||||
| Property, plant and equipment | 41,424 | — | — | |||||||||||||||||||
| Intangible assets | 35,045 | — | — | |||||||||||||||||||
| Chunghwa Telecom Global Inc. | a | Accounts receivable | 15,943 | — | — | |||||||||||||||||
| Accounts payable | 86,656 | — | — | |||||||||||||||||||
| Revenues | 23,133 | — | — | |||||||||||||||||||
| Operating costs and expenses | 176,495 | — | — | |||||||||||||||||||
| Donghwa Telecom Co., Ltd. | a | Accounts receivable | 40,339 | — | — | |||||||||||||||||
| Accounts payable | 60,649 | — | — | |||||||||||||||||||
| Revenues | 56,689 | — | — | |||||||||||||||||||
| Operating costs and expenses | 198,360 | — | — | |||||||||||||||||||
| Spring House Entertainment Tech. Inc. | a | Accrued custodial receipts | 11,145 | — | — | |||||||||||||||||
| Chunghwa Telecom Japan Co., Ltd. | a | Accounts receivable | 20,329 | — | — | |||||||||||||||||
| Accounts payable | 21,679 | — | — | |||||||||||||||||||
| Revenues | 14,920 | — | — | |||||||||||||||||||
| Operating costs and expenses | 34,956 | — | — | |||||||||||||||||||
| Light Era Development Co., Ltd. | a | Inventories | 54,616 | — | — | |||||||||||||||||
| Accounts payable | 12,022 | — | — | |||||||||||||||||||
(Continued)
- 80 -
Year | No. (Note 1) | Company Name | Related Party | Nature of (Note 2) | Transaction Details | |||||||||||||||||
Financial Statement Account | Amount (Note 5) | Payment Terms (Note 3) | % to Total Sales or Assets (Note 4) | |||||||||||||||||||
| Chunghwa Telecom Singapore Pte., Ltd. | a | Accounts receivable | $ | 66,335 | — | — | ||||||||||||||||
| Accounts payable | 77,643 | — | — | |||||||||||||||||||
| Revenues | 82,019 | — | — | |||||||||||||||||||
| Operating costs and expenses | 75,157 | — | — | |||||||||||||||||||
| Chunghwa Sochamp Technology Inc. | a | Accounts payable | 22,234 | — | — | |||||||||||||||||
| Operating costs and expenses | 13,585 | — | — | |||||||||||||||||||
| Property, plant and equipment | 18,857 | — | — | |||||||||||||||||||
| Honghwa International Co., Ltd. | a | Accounts payable | 499,215 | — | — | |||||||||||||||||
| Revenues | 19,531 | — | — | |||||||||||||||||||
| Operating costs and expenses | 2,124,260 | — | 2 | |||||||||||||||||||
| 1 | Light Era Development Co., Ltd. | CHIEF Telecom Inc. | c | Revenues | 47,152 | — | — | |||||||||||||||
| 2 | Donghwa Telecom Co., Ltd. | Chunghwa Telecom Singapore Pte., Ltd. | c | Prepayments | 15,939 | — | — | |||||||||||||||
| Chunghwa Telecom Japan Co., Ltd. | c | Accounts receivable | 10,167 | — | — | |||||||||||||||||
| 3 | Chunghwa Telecom Singapore Pte., Ltd. | Donghwa Telecom Co., Ltd. | c | Prepayments | 22,943 | — | — | |||||||||||||||
| 4 | Chunghwa Telecom Japan Co., Ltd. | Donghwa Telecom Co., Ltd. | c | Prepayments | 10,049 | — | — | |||||||||||||||
| Note 1: | Significant transactions between the Company and its subsidiaries or among subsidiaries are numbered as follows: |
| a. | “0” for the Company. |
| b. | Subsidiaries are numbered from “1”. |
| Note 2: | Related party transactions are divided into three categories as follows: |
| a. | The Company to subsidiaries. |
| b. | Subsidiaries to the Company. |
| c. | Subsidiaries to subsidiaries. |
| Note 3: | Transaction terms with the related parties were determined in accordance with mutual agreements when there were no similar transactions with third parties. Other transactions with related parties were not significantly different from those with third parties. |
| Note 4: | For assets and liabilities, amount is shown as a percentage to consolidated total assets as of June 30, 2016, while revenues, costs and expenses are shown as a percentage to consolidated revenues for the six months ended June 30, 2016. |
| Note 5: | The amount was eliminated upon consolidation. |
(Concluded)
- 81 -