Exhibit 99.2
Chunghwa Telecom Co., Ltd. and Subsidiaries
Consolidated Financial Statements for the
Nine Months Ended September 30, 2018 and 2017 and
Independent Auditors’ Review Report
INDEPENDENT AUDITORS’ REVIEW REPORT
The Board of Directors and Stockholders
Chunghwa Telecom Co., Ltd.
Introduction
We have reviewed the accompanying consolidated balance sheets of Chunghwa Telecom Co., Ltd. and its subsidiaries (the “Company”) as of September 30, 2018 and 2017, the related consolidated statements of comprehensive income for the three months ended September 30, 2018 and 2017 and for the nine months ended September 30, 2018 and 2017, the consolidated statements of changes in equity and cash flows for the nine months then ended, and the related notes to the consolidated financial statements, including a summary of significant accounting policies (collectively referred to as the “consolidated financial statements”). Management is responsible for the preparation and fair presentation of the consolidated financial statements in accordance with the Regulations Governing the Preparation of Financial Reports by Securities Issuers and International Accounting Standard 34 “Interim Financial Reporting” endorsed and issued into effect by the Financial Supervisory Commission of the Republic of China. Our responsibility is to express a conclusion on the consolidated financial statements based on our reviews.
Scope of Review
We conducted our reviews in accordance with Statement of Auditing Standards No. 65 “Review of Financial Information Performed by the Independent Auditor of the Entity”. A review of consolidated financial statements consists of making inquiries, primarily of persons responsible for financial and accounting matters, and applying analytical and other review procedures. A review is substantially less in scope than an audit and consequently does not enable us to obtain assurance that we would become aware of all significant matters that might be identified in an audit. Accordingly, we do not express an audit opinion.
Conclusion
Based on our reviews, nothing has come to our attention that caused us to believe that the accompanying consolidated financial statements do not present fairly, in all material respects, the consolidated financial position of the Company as of September 30, 2018 and 2017, its consolidated financial performance for the three months ended September 30, 2018 and 2017, and its consolidated financial performance and its consolidated cash flows for the nine months ended September 30, 2018 and 2017 in accordance with the Regulations Governing the Preparation of Financial Reports by Securities Issuers, and International Accounting Standard 34 “Interim Financial Reporting” endorsed and issued into effect by the Financial Supervisory Commission of the Republic of China.
- 1 -
The engagement partners on the reviews resulting in this independent auditors’ review report are Mr. Hung Peng Lin and Mr. Ching Pin Shih.
/s/ DELOITTE & TOUCHE | ||||
| Deloitte & Touche | ||||
| Taipei, Taiwan | ||||
| Republic of China | ||||
| November 6, 2018 | ||||
Notice to Readers
The accompanying consolidated financial statements are intended only to present the consolidated financial position, financial performance and cash flows in accordance with accounting principles and practices generally accepted in the Republic of China and not those of any other jurisdictions. The standards, procedures and practices to review such consolidated financial statements are those generally applied in the Republic of China.
For the convenience of readers, the independent auditors’ review report and the accompanying consolidated financial statements have been translated into English from the original Chinese version prepared and used in the Republic of China. If there is any conflict between the English version and the original Chinese version or any difference in the interpretation of the two versions, the Chinese-language independent auditors’ review report and consolidated financial statements shall prevail.
- 2 -
CHUNGHWA TELECOM CO., LTD. AND SUBSIDIARIES
CONSOLIDATED BALANCE SHEETS
(In Thousands of New Taiwan Dollars)
| September 30, 2018 (Reviewed) | December 31, 2017 (Audited) | September 30, 2017 (Reviewed) | ||||||||||||||||||||||
ASSETS | Amount | % | Amount | % | Amount | % | ||||||||||||||||||
CURRENT ASSETS | ||||||||||||||||||||||||
Cash and cash equivalents (Note 6) | $ | 20,325,004 | 5 | $ | 28,824,935 | 7 | $ | 25,466,108 | 6 | |||||||||||||||
Financial assets at fair value through profit or loss (Notes 3, 5 and 7) | 195,682 | — | — | — | 1,878 | — | ||||||||||||||||||
Hedging derivative financial assets (Notes 3, 5 and 21) | — | — | — | — | 537 | — | ||||||||||||||||||
Hedging financial assets (Notes 3, 5 and 21) | 367 | — | — | — | — | — | ||||||||||||||||||
Contract assets (Notes 3, 5 and 30) | 5,078,820 | 1 | — | — | — | — | ||||||||||||||||||
Trade notes and accounts receivable, net (Notes 3, 4, 5, 10 and 30) | 29,221,409 | 6 | 31,941,094 | 7 | 29,833,115 | 7 | ||||||||||||||||||
Receivables from related parties (Note 39) | 31,067 | — | 49,367 | — | 41,012 | — | ||||||||||||||||||
Inventories (Notes 5, 11 and 40) | 14,012,185 | 3 | 8,839,615 | 2 | 9,041,373 | 2 | ||||||||||||||||||
Prepayments (Notes 5, 12 and 39) | 5,069,493 | 1 | 2,188,173 | — | 5,142,945 | 1 | ||||||||||||||||||
Other current monetary assets (Note 13) | 6,359,264 | 1 | 5,308,060 | 1 | 5,446,951 | 1 | ||||||||||||||||||
Other current assets (Notes 5, 20 and 40) | 3,055,785 | 1 | 2,182,758 | — | 2,744,782 | 1 | ||||||||||||||||||
|
|
|
|
|
|
|
|
|
|
|
| |||||||||||||
Total current assets | 83,349,076 | 18 | 79,334,002 | 17 | 77,718,701 | 18 | ||||||||||||||||||
|
|
|
|
|
|
|
|
|
|
|
| |||||||||||||
NONCURRENT ASSETS | ||||||||||||||||||||||||
Financial assets at fair value through other comprehensive income (Notes 3, 4, 5 and 8) | 6,999,165 | 1 | — | — | — | — | ||||||||||||||||||
Available-for-sale financial assets (Notes 3, 5 and 9) | — | — | 3,125,086 | 1 | 3,036,199 | 1 | ||||||||||||||||||
Financial assets carried at cost (Notes 3, 5 and 14) | — | — | 2,625,785 | 1 | 2,237,376 | — | ||||||||||||||||||
Investments accounted for using equity method (Note 16) | 2,660,106 | 1 | 2,546,374 | — | 2,553,947 | 1 | ||||||||||||||||||
Contract assets (Notes 3, 5 and 30) | 2,313,689 | 1 | — | — | — | — | ||||||||||||||||||
Property, plant and equipment (Notes 17, 39 and 40) | 286,885,678 | 63 | 288,707,910 | 64 | 283,501,050 | 65 | ||||||||||||||||||
Investment properties (Note 18) | 8,037,836 | 2 | 8,047,793 | 2 | 8,094,492 | 2 | ||||||||||||||||||
Intangible assets (Note 19) | 51,753,224 | 11 | 54,883,268 | 12 | 44,792,194 | 10 | ||||||||||||||||||
Deferred income tax assets (Note 3) | 3,284,365 | 1 | 2,730,093 | 1 | 2,373,000 | 1 | ||||||||||||||||||
Incremental costs of obtaining contracts (Notes 3, 5 and 30) | 1,587,709 | — | — | — | — | — | ||||||||||||||||||
Net defined benefit assets (Notes 3 and 28) | 1,069,336 | — | 12,979 | — | 958,400 | — | ||||||||||||||||||
Prepayments (Notes 12 and 39) | 3,286,667 | 1 | 3,573,345 | 1 | 3,614,264 | 1 | ||||||||||||||||||
Other noncurrent assets (Notes 20 and 40) | 5,234,262 | 1 | 5,536,487 | 1 | 6,047,244 | 1 | ||||||||||||||||||
|
|
|
|
|
|
|
|
|
|
|
| |||||||||||||
Total noncurrent assets | 373,112,037 | 82 | 371,789,120 | 83 | 357,208,166 | 82 | ||||||||||||||||||
|
|
|
|
|
|
|
|
|
|
|
| |||||||||||||
TOTAL | $ | 456,461,113 | 100 | $ | 451,123,122 | 100 | $ | 434,926,867 | 100 | |||||||||||||||
|
|
|
|
|
|
|
|
|
|
|
| |||||||||||||
LIABILITIES AND EQUITY | ||||||||||||||||||||||||
CURRENT LIABILITIES | ||||||||||||||||||||||||
Short-term loans (Notes 22 and 40) | $ | 120,000 | — | $ | 70,000 | — | $ | 423,000 | — | |||||||||||||||
Financial liabilities at fair value through profit or loss (Notes 3, 5 and 7) | 619 | — | 578 | — | — | — | ||||||||||||||||||
Hedging derivative financial liabilities (Notes 3, 5 and 21) | — | — | 850 | — | — | — | ||||||||||||||||||
Contract liabilities (Notes 3, 5, 27 and 30) | 10,392,850 | 2 | — | — | — | — | ||||||||||||||||||
Trade notes and accounts payable (Note 24) | 20,546,011 | 5 | 19,395,889 | 4 | 17,643,423 | 4 | ||||||||||||||||||
Payables to related parties (Note 39) | 543,919 | — | 684,185 | — | 586,248 | — | ||||||||||||||||||
Current tax liabilities (Notes 3 and 5) | 6,618,229 | 1 | 4,725,698 | 1 | 2,891,477 | 1 | ||||||||||||||||||
Other payables (Note 25) | 20,888,337 | 5 | 25,001,401 | 6 | 20,331,708 | 5 | ||||||||||||||||||
Provisions (Notes 5 and 26) | 104,880 | — | 188,744 | — | 146,151 | — | ||||||||||||||||||
Advance receipts (Notes 3, 5 and 27) | — | — | 8,841,858 | 2 | 9,171,362 | 2 | ||||||||||||||||||
Current portion of long-term loans (Notes 23 and 40) | — | — | — | — | 1,600,000 | — | ||||||||||||||||||
Other current liabilities (Note 5) | 1,321,764 | — | 1,081,156 | — | 1,213,486 | — | ||||||||||||||||||
|
|
|
|
|
|
|
|
|
|
|
| |||||||||||||
Total current liabilities | 60,536,609 | 13 | 59,990,359 | 13 | 54,006,855 | 12 | ||||||||||||||||||
|
|
|
|
|
|
|
|
|
|
|
| |||||||||||||
NONCURRENT LIABILITIES | ||||||||||||||||||||||||
Contract liabilities (Notes 3, 5, 27 and 30) | 2,559,789 | 1 | — | — | — | — | ||||||||||||||||||
Long-term loans (Notes 23 and 40) | 1,600,000 | — | 1,600,000 | — | — | — | ||||||||||||||||||
Deferred income tax liabilities (Notes 3 and 5) | 2,010,974 | — | 1,429,592 | — | 1,446,192 | — | ||||||||||||||||||
Provisions (Note 26) | 74,670 | — | 78,513 | — | 68,251 | — | ||||||||||||||||||
Customers’ deposits (Note 39) | 4,664,558 | 1 | 4,671,441 | 1 | 4,548,472 | 1 | ||||||||||||||||||
Net defined benefit liabilities (Notes 3 and 28) | 2,086,269 | 1 | 2,703,569 | 1 | 1,566,566 | — | ||||||||||||||||||
Deferred revenue (Notes 3 and 5) | — | — | 3,612,391 | 1 | 3,611,569 | 1 | ||||||||||||||||||
Other noncurrent liabilities (Note 5) | 4,538,863 | 1 | 3,457,677 | 1 | 3,547,716 | 1 | ||||||||||||||||||
|
|
|
|
|
|
|
|
|
|
|
| |||||||||||||
Total noncurrent liabilities | 17,535,123 | 4 | 17,553,183 | 4 | 14,788,766 | 3 | ||||||||||||||||||
|
|
|
|
|
|
|
|
|
|
|
| |||||||||||||
Total liabilities | 78,071,732 | 17 | 77,543,542 | 17 | 68,795,621 | 15 | ||||||||||||||||||
|
|
|
|
|
|
|
|
|
|
|
| |||||||||||||
EQUITY ATTRIBUTABLE TO STOCKHOLDERS OF THE PARENT (Notes 5, 15 and 29) | ||||||||||||||||||||||||
Common stocks | 77,574,465 | 17 | 77,574,465 | 17 | 77,574,465 | 18 | ||||||||||||||||||
|
|
|
|
|
|
|
|
|
|
|
| |||||||||||||
Additionalpaid-in capital | 171,138,234 | 37 | 169,466,883 | 38 | 169,446,456 | 39 | ||||||||||||||||||
|
|
|
|
|
|
|
|
|
|
|
| |||||||||||||
Retained earnings | ||||||||||||||||||||||||
Legal reserve | 77,574,465 | 17 | 77,574,465 | 17 | 77,574,465 | 18 | ||||||||||||||||||
Special reserve | 2,675,419 | 1 | 2,680,823 | 1 | 2,680,823 | 1 | ||||||||||||||||||
Unappropriated earnings | 39,695,528 | 9 | 37,202,683 | 8 | 30,192,271 | 7 | ||||||||||||||||||
|
|
|
|
|
|
|
|
|
|
|
| |||||||||||||
Total retained earnings | 119,945,412 | 27 | 117,457,971 | 26 | 110,447,559 | 26 | ||||||||||||||||||
|
|
|
|
|
|
|
|
|
|
|
| |||||||||||||
Other adjustments | (55,834 | ) | — | 382,666 | — | 350,310 | — | |||||||||||||||||
|
|
|
|
|
|
|
|
|
|
|
| |||||||||||||
Total equity attributable to stockholders of the parent | 368,602,277 | 81 | 364,881,985 | 81 | 357,818,790 | 83 | ||||||||||||||||||
NONCONTROLLING INTERESTS (Notes 5, 15 and 29) | 9,787,104 | 2 | 8,697,595 | 2 | 8,312,456 | 2 | ||||||||||||||||||
|
|
|
|
|
|
|
|
|
|
|
| |||||||||||||
Total equity | 378,389,381 | 83 | 373,579,580 | 83 | 366,131,246 | 85 | ||||||||||||||||||
|
|
|
|
|
|
|
|
|
|
|
| |||||||||||||
TOTAL | $ | 456,461,113 | 100 | $ | 451,123,122 | 100 | $ | 434,926,867 | 100 | |||||||||||||||
|
|
|
|
|
|
|
|
|
|
|
| |||||||||||||
The accompanying notes are an integral part of the consolidated financial statements.
- 3 -
CHUNGHWA TELECOM CO., LTD. AND SUBSIDIARIES
CONSOLIDATED STATEMENTS OF COMPREHENSIVE INCOME
(In Thousands of New Taiwan Dollars, Except Earnings Per Share)
(Reviewed, Not Audited)
| Three Months Ended September 30 | Nine Months Ended September 30 | |||||||||||||||||||||||||||||||
| 2018 | 2017 | 2018 | 2017 | |||||||||||||||||||||||||||||
| Amount | % | Amount | % | Amount | % | Amount | % | |||||||||||||||||||||||||
REVENUES (Notes 3, 5, 30, 39 and 44) | $ | 52,704,885 | 100 | $ | 56,424,903 | 100 | $ | 159,995,602 | 100 | $ | 166,629,444 | 100 | ||||||||||||||||||||
OPERATING COSTS (Notes 3, 5, 11, 28, 31, 39 and 44) | 34,431,469 | 65 | 35,655,368 | 63 | 102,074,274 | 64 | 105,354,095 | 63 | ||||||||||||||||||||||||
|
|
|
|
|
|
|
|
|
|
|
|
|
|
|
| |||||||||||||||||
GROSS PROFIT | 18,273,416 | 35 | 20,769,535 | 37 | 57,921,328 | 36 | 61,275,349 | 37 | ||||||||||||||||||||||||
|
|
|
|
|
|
|
|
|
|
|
|
|
|
|
| |||||||||||||||||
OPERATING EXPENSES (Notes 3, 5, 28, 31, 39 and 44) | ||||||||||||||||||||||||||||||||
Marketing | 5,652,316 | 11 | 6,269,260 | 11 | 17,260,741 | 11 | 18,704,753 | 11 | ||||||||||||||||||||||||
General and administrative | 1,088,377 | 2 | 1,121,105 | 2 | 3,447,813 | 2 | 3,442,742 | 2 | ||||||||||||||||||||||||
Research and development | 951,424 | 2 | 945,763 | 2 | 2,786,269 | 1 | 2,825,042 | 2 | ||||||||||||||||||||||||
Expected credit loss | 155,816 | — | — | — | 923,781 | 1 | — | — | ||||||||||||||||||||||||
|
|
|
|
|
|
|
|
|
|
|
|
|
|
|
| |||||||||||||||||
Total operating expenses | 7,847,933 | 15 | 8,336,128 | 15 | 24,418,604 | 15 | 24,972,537 | 15 | ||||||||||||||||||||||||
|
|
|
|
|
|
|
|
|
|
|
|
|
|
|
| |||||||||||||||||
OTHER INCOME AND EXPENSES (Notes 19 and 31) | (8,753 | ) | — | (16,875 | ) | — | (89,253 | ) | — | (33,620 | ) | — | ||||||||||||||||||||
|
|
|
|
|
|
|
|
|
|
|
|
|
|
|
| |||||||||||||||||
INCOME FROM OPERATIONS | 10,416,730 | 20 | 12,416,532 | 22 | 33,413,471 | 21 | 36,269,192 | 22 | ||||||||||||||||||||||||
|
|
|
|
|
|
|
|
|
|
|
|
|
|
|
| |||||||||||||||||
NON-OPERATING INCOME AND EXPENSES | ||||||||||||||||||||||||||||||||
Interest income | 46,722 | — | 51,692 | — | 144,378 | — | 158,658 | — | ||||||||||||||||||||||||
Other income (Notes 8, 31 and 39) | 267,542 | 1 | 130,052 | — | 625,170 | — | 634,303 | — | ||||||||||||||||||||||||
Other gains and losses (Notes 31 and 39) | (3,771 | ) | — | (84,962 | ) | — | (24,569 | ) | — | (84,984 | ) | — | ||||||||||||||||||||
Interest expenses | (4,508 | ) | — | (5,617 | ) | — | (13,212 | ) | — | (16,384 | ) | — | ||||||||||||||||||||
Share of profits of associates and joint ventures accounted for using | 137,856 | — | 74,687 | — | 329,528 | — | 294,307 | — | ||||||||||||||||||||||||
|
|
|
|
|
|
|
|
|
|
|
|
|
|
|
| |||||||||||||||||
Totalnon-operating income and expenses | 443,841 | 1 | 165,852 | — | 1,061,295 | — | 985,900 | — | ||||||||||||||||||||||||
|
|
|
|
|
|
|
|
|
|
|
|
|
|
|
| |||||||||||||||||
INCOME BEFORE INCOME TAX | 10,860,571 | 21 | 12,582,384 | 22 | 34,474,766 | 21 | 37,255,092 | 22 | ||||||||||||||||||||||||
INCOME TAX EXPENSE (Notes 3, 5 and 32) | 2,138,295 | 4 | 2,083,099 | 4 | 6,691,601 | 4 | 6,134,236 | 4 | ||||||||||||||||||||||||
|
|
|
|
|
|
|
|
|
|
|
|
|
|
|
| |||||||||||||||||
NET INCOME | 8,722,276 | 17 | 10,499,285 | 18 | 27,783,165 | 17 | 31,120,856 | 18 | ||||||||||||||||||||||||
|
|
|
|
|
|
|
|
|
|
|
|
|
|
|
| |||||||||||||||||
TOTAL OTHER COMPREHENSIVE INCOME (LOSS) | ||||||||||||||||||||||||||||||||
Items that will not be reclassified to profit or loss: | ||||||||||||||||||||||||||||||||
Unrealized gain or loss on investments in equity instruments at fair value through other comprehensive income (Note 3) | (137,447 | ) | — | — | — | (824,632 | ) | (1 | ) | — | — | |||||||||||||||||||||
(Continued)
- 4 -
CHUNGHWA TELECOM CO., LTD. AND SUBSIDIARIES
CONSOLIDATED STATEMENTS OF COMPREHENSIVE INCOME
(In Thousands of New Taiwan Dollars, Except Earnings Per Share)
(Reviewed, Not Audited)
| Three Months Ended September 30 | Nine Months Ended September 30 | |||||||||||||||||||||||||||||||
| 2018 | 2017 | 2018 | 2017 | |||||||||||||||||||||||||||||
| Amount | % | Amount | % | Amount | % | Amount | % | |||||||||||||||||||||||||
Gain or loss on hedging instruments subject to basis adjustment | $ | 667 | — | $ | — | — | $ | 1,217 | — | $ | — | — | ||||||||||||||||||||
Income tax benefit relating to items that will not be reclassified to profit or loss (Note 32) | — | — | — | — | 207,269 | — | — | — | ||||||||||||||||||||||||
|
|
|
|
|
|
|
|
|
|
|
|
|
|
|
| |||||||||||||||||
| (136,780 | ) | — | — | — | (616,146 | ) | (1 | ) | — | — | ||||||||||||||||||||||
|
|
|
|
|
|
|
|
|
|
|
|
|
|
|
| |||||||||||||||||
Items that may be reclassified subsequently to profit or loss: | ||||||||||||||||||||||||||||||||
Exchange differences arising from the translation of the foreign operations | (15,591 | ) | — | 9,810 | — | 50,761 | — | (175,207 | ) | — | ||||||||||||||||||||||
Unrealized gain or loss onavailable-for-sale financial assets (Note 31) | — | — | 544,383 | 1 | — | — | 515,172 | — | ||||||||||||||||||||||||
Cash flow hedges (Notes 21 and 31) | — | — | (521 | ) | — | — | — | 1,124 | — | |||||||||||||||||||||||
Share of exchange differences arising from the translation of the foreign operations of associates and joint ventures (Note 16) | 2,263 | — | (132 | ) | — | 4,522 | — | (3,175 | ) | — | ||||||||||||||||||||||
Income tax benefit relating to items that may be reclassified subsequently to profit or loss (Note 32) | — | — | 224 | — | — | — | 2,053 | — | ||||||||||||||||||||||||
|
|
|
|
|
|
|
|
|
|
|
|
|
|
|
| |||||||||||||||||
| (13,328 | ) | — | 553,764 | 1 | 55,283 | — | 339,967 | — | ||||||||||||||||||||||||
|
|
|
|
|
|
|
|
|
|
|
|
|
|
|
| |||||||||||||||||
Total other comprehensive income (loss), net of income tax | (150,108 | ) | — | 553,764 | 1 | (560,863 | ) | (1 | ) | 339,967 | — | |||||||||||||||||||||
|
|
|
|
|
|
|
|
|
|
|
|
|
|
|
| |||||||||||||||||
TOTAL COMPREHENSIVE INCOME | $ | 8,572,168 | 17 | $ | 11,053,049 | 19 | $ | 27,222,302 | 16 | $ | 31,460,823 | 18 | ||||||||||||||||||||
|
|
|
|
|
|
|
|
|
|
|
|
|
|
|
| |||||||||||||||||
NET INCOME ATTRIBUTABLE TO | ||||||||||||||||||||||||||||||||
Stockholders of the parent | $ | 8,504,207 | 17 | $ | 10,153,411 | 18 | $ | 27,093,228 | 17 | $ | 30,191,883 | 18 | ||||||||||||||||||||
Noncontrolling interests | 218,069 | — | 345,874 | — | 689,937 | — | 928,973 | — | ||||||||||||||||||||||||
|
|
|
|
|
|
|
|
|
|
|
|
|
|
|
| |||||||||||||||||
| $ | 8,722,276 | 17 | $ | 10,499,285 | 18 | $ | 27,783,165 | 17 | $ | 31,120,856 | 18 | |||||||||||||||||||||
|
|
|
|
|
|
|
|
|
|
|
|
|
|
|
| |||||||||||||||||
COMPREHENSIVE INCOME ATTRIBUTABLE TO | ||||||||||||||||||||||||||||||||
Stockholders of the parent | $ | 8,368,866 | 17 | $ | 10,701,734 | 19 | $ | 26,535,177 | 16 | $ | 30,547,597 | 18 | ||||||||||||||||||||
Noncontrolling interests | 203,302 | — | 351,315 | — | 687,125 | — | 913,226 | — | ||||||||||||||||||||||||
|
|
|
|
|
|
|
|
|
|
|
|
|
|
|
| |||||||||||||||||
| $ | 8,572,168 | 17 | $ | 11,053,049 | 19 | $ | 27,222,302 | 16 | $ | 31,460,823 | 18 | |||||||||||||||||||||
|
|
|
|
|
|
|
|
|
|
|
|
|
|
|
| |||||||||||||||||
EARNINGS PER SHARE (Notes 5 and 33) | ||||||||||||||||||||||||||||||||
Basic | $ | 1.10 | $ | 1.31 | $ | 3.49 | $ | 3.89 | ||||||||||||||||||||||||
|
|
|
|
|
|
|
| |||||||||||||||||||||||||
Diluted | $ | 1.10 | $ | 1.31 | $ | 3.49 | $ | 3.89 | ||||||||||||||||||||||||
|
|
|
|
|
|
|
| |||||||||||||||||||||||||
| The accompanying notes are an integral part of the consolidated financial statements. | (Concluded) |
- 5 -
CHUNGHWA TELECOM CO., LTD. AND SUBSIDIARIES
CONSOLIDATED STATEMENTS OF CHANGES IN EQUITY
(In Thousands of New Taiwan Dollars)
(Reviewed, Not Audited)
| Equity Attributable to Stockholders of the Parent (Notes 15, 21 and 29) | ||||||||||||||||||||||||||||||||||||||||||||||||||||
| Other Adjustments | ||||||||||||||||||||||||||||||||||||||||||||||||||||
| Retained Earnings | Exchange Differences Arising from the Translation | Unrealized Gain or Loss on Available- | Unrealized Gain or Loss on Financial Assets at Fair Value Through | Gain or | Noncontrolling | |||||||||||||||||||||||||||||||||||||||||||||||
| Common Stocks | Additional Paid-in Capital | Legal Reserve | Special Reserve | Unappropriated Earnings | of the Foreign Operations | for-sale Financial Assets | Other Comprehensive Income | Cash Flow Hedges | Loss on Hedging Instruments | Total | Interests (Notes 15 and 29) | Total Equity | ||||||||||||||||||||||||||||||||||||||||
BALANCE, JANUARY 1, 2017 | $ | 77,574,465 | $ | 168,542,486 | $ | 77,574,465 | $ | 2,675,419 | $ | 38,342,317 | $ | 46,068 | $ | (50,885 | ) | $ | — | $ | (587 | ) | $ | — | $ | 364,703,748 | $ | 6,495,922 | $ | 371,199,670 | ||||||||||||||||||||||||
Appropriation of 2016 earnings | ||||||||||||||||||||||||||||||||||||||||||||||||||||
Provision for special reserve | — | — | — | 5,404 | (5,404 | ) | — | — | — | — | — | — | — | — | ||||||||||||||||||||||||||||||||||||||
Cash dividends distributed by Chunghwa | — | — | — | — | (38,336,525 | ) | — | — | — | — | — | (38,336,525 | ) | — | (38,336,525 | ) | ||||||||||||||||||||||||||||||||||||
Cash dividends distributed by subsidiaries | — | — | — | — | — | — | — | — | — | — | — | (942,482 | ) | (942,482 | ) | |||||||||||||||||||||||||||||||||||||
Change in additionalpaid-in capital from investments in associates and joint ventures accounted for using equity method | — | 12,523 | — | — | — | — | — | — | — | — | 12,523 | 1,916 | 14,439 | |||||||||||||||||||||||||||||||||||||||
Partial disposal of interests in subsidiaries | — | 76,714 | — | — | — | — | — | — | — | — | 76,714 | 29,217 | 105,931 | |||||||||||||||||||||||||||||||||||||||
Change in additionalpaid-in capital for not participating in the capital increase of subsidiaries | — | 803,342 | — | — | — | — | — | — | — | — | 803,342 | 1,753,711 | 2,557,053 | |||||||||||||||||||||||||||||||||||||||
Net income for the nine months ended September 30, 2017 | — | — | — | — | 30,191,883 | — | — | — | — | — | 30,191,883 | 928,973 | 31,120,856 | |||||||||||||||||||||||||||||||||||||||
Other comprehensive income (loss) for the nine months ended September 30, 2017 | — | — | — | — | — | (163,736 | ) | 518,326 | — | 1,124 | — | 355,714 | (15,747 | ) | 339,967 | |||||||||||||||||||||||||||||||||||||
|
|
|
|
|
|
|
|
|
|
|
|
|
|
|
|
|
|
|
|
|
|
|
|
|
| |||||||||||||||||||||||||||
Total comprehensive income (loss) for the nine months ended September 30, 2017 | — | — | — | — | 30,191,883 | (163,736 | ) | 518,326 | — | 1,124 | — | 30,547,597 | 913,226 | 31,460,823 | ||||||||||||||||||||||||||||||||||||||
|
|
|
|
|
|
|
|
|
|
|
|
|
|
|
|
|
|
|
|
|
|
|
|
|
| |||||||||||||||||||||||||||
Share-based payment transactions of subsidiaries | — | 2,074 | — | — | — | — | — | — | — | — | 2,074 | 15,825 | 17,899 | |||||||||||||||||||||||||||||||||||||||
Net increase in noncontrolling interests | — | 9,317 | — | — | — | — | — | — | — | — | 9,317 | 45,121 | 54,438 | |||||||||||||||||||||||||||||||||||||||
|
|
|
|
|
|
|
|
|
|
|
|
|
|
|
|
|
|
|
|
|
|
|
|
|
| |||||||||||||||||||||||||||
BALANCE, SEPTEMBER 30, 2017 | $ | 77,574,465 | $ | 169,446,456 | $ | 77,574,465 | $ | 2,680,823 | $ | 30,192,271 | $ | (117,668 | ) | $ | 467,441 | $ | — | $ | 537 | $ | — | $ | 357,818,790 | $ | 8,312,456 | $ | 366,131,246 | |||||||||||||||||||||||||
|
|
|
|
|
|
|
|
|
|
|
|
|
|
|
|
|
|
|
|
|
|
|
|
|
| |||||||||||||||||||||||||||
BALANCE, JANUARY 1, 2018 | $ | 77,574,465 | $ | 169,466,883 | $ | 77,574,465 | $ | 2,680,823 | $ | 37,202,683 | $ | (174,593 | ) | $ | 558,109 | $ | — | $ | (850 | ) | $ | — | $ | 364,881,985 | $ | 8,697,595 | $ | 373,579,580 | ||||||||||||||||||||||||
Effect of retrospective application (Note 5) | — | — | — | — | 12,393,167 | — | (558,109 | ) | 883,420 | 850 | (850 | ) | 12,718,478 | (3,945 | ) | 12,714,533 | ||||||||||||||||||||||||||||||||||||
|
|
|
|
|
|
|
|
|
|
|
|
|
|
|
|
|
|
|
|
|
|
|
|
|
| |||||||||||||||||||||||||||
- 6 -
| Equity Attributable to Stockholders of the Parent (Notes 15, 21 and 29) | ||||||||||||||||||||||||||||||||||||||||||||||||||||
| Other Adjustments | ||||||||||||||||||||||||||||||||||||||||||||||||||||
| Retained Earnings | Exchange Differences Arising from the Translation | Unrealized Gain or Loss on Available- | Unrealized Gain or Loss on Financial Assets at Fair Value Through | Gain or | Noncontrolling | |||||||||||||||||||||||||||||||||||||||||||||||
| Common Stocks | Additional Paid-in Capital | Legal Reserve | Special Reserve | Unappropriated Earnings | of the Foreign Operations | for-sale Financial Assets | Other Comprehensive Income | Cash Flow Hedges | Loss on Hedging Instruments | Total | Interests (Notes 15 and 29) | Total Equity | ||||||||||||||||||||||||||||||||||||||||
BALANCE, JANUARY 1, 2018 AS ADJUSTED | 77,574,465 | 169,466,883 | 77,574,465 | 2,680,823 | 49,595,850 | (174,593 | ) | — | 883,420 | — | (850 | ) | 377,600,463 | 8,693,650 | 386,294,113 | |||||||||||||||||||||||||||||||||||||
Appropriation of 2017 earnings | ||||||||||||||||||||||||||||||||||||||||||||||||||||
Reversal of special reserve | — | — | — | (5,404 | ) | 5,404 | — | — | — | — | — | — | — | — | ||||||||||||||||||||||||||||||||||||||
Cash dividends distributed by Chunghwa | — | — | — | — | (37,204,714 | ) | — | — | — | — | — | (37,204,714 | ) | — | (37,204,714 | ) | ||||||||||||||||||||||||||||||||||||
Cash dividends distributed by subsidiaries | — | — | — | — | — | — | — | — | — | — | — | (958,446 | ) | (958,446 | ) | |||||||||||||||||||||||||||||||||||||
Unclaimed dividend | — | 2,481 | — | — | — | — | — | — | — | — | 2,481 | — | 2,481 | |||||||||||||||||||||||||||||||||||||||
Change in additionalpaid-in capital from investments in associates and joint ventures accounted for using equity method | — | 1 | — | — | — | — | — | — | — | — | 1 | 203 | 204 | |||||||||||||||||||||||||||||||||||||||
Partial disposal of interests in subsidiaries | — | 826,047 | — | — | — | — | — | — | — | — | 826,047 | 348,353 | 1,174,400 | |||||||||||||||||||||||||||||||||||||||
Change in additionalpaid-in capital for not participating in the capital increase of subsidiaries | — | 776,781 | — | — | — | — | — | — | — | — | 776,781 | 699,899 | 1,476,680 | |||||||||||||||||||||||||||||||||||||||
Net income for the nine months ended September 30, 2018 | — | — | — | — | 27,093,228 | — | — | — | — | — | 27,093,228 | 689,937 | 27,783,165 | |||||||||||||||||||||||||||||||||||||||
Other comprehensive income (loss) for the nine months ended September 30, 2018 | — | — | — | — | 205,760 | 61,411 | — | (826,439 | ) | — | 1,217 | (558,051 | ) | (2,812 | ) | (560,863 | ) | |||||||||||||||||||||||||||||||||||
|
|
|
|
|
|
|
|
|
|
|
|
|
|
|
|
|
|
|
|
|
|
|
|
|
| |||||||||||||||||||||||||||
Total comprehensive income (loss) for the nine months ended September 30, 2018 | — | — | — | — | 27,298,988 | 61,411 | — | (826,439 | ) | — | 1,217 | 26,535,177 | 687,125 | 27,222,302 | ||||||||||||||||||||||||||||||||||||||
|
|
|
|
|
|
|
|
|
|
|
|
|
|
|
|
|
|
|
|
|
|
|
|
|
| |||||||||||||||||||||||||||
Share-based payment transactions of subsidiaries | — | 12,119 | — | — | — | — | — | — | — | — | 12,119 | 38,120 | 50,239 | |||||||||||||||||||||||||||||||||||||||
Net increase in noncontrolling interests | — | 53,922 | — | — | — | — | — | — | — | — | 53,922 | 278,200 | 332,122 | |||||||||||||||||||||||||||||||||||||||
|
|
|
|
|
|
|
|
|
|
|
|
|
|
|
|
|
|
|
|
|
|
|
|
|
| |||||||||||||||||||||||||||
BALANCE, SEPTEMBER 30, 2018 | $ | 77,574,465 | $ | 171,138,234 | $ | 77,574,465 | $ | 2,675,419 | $ | 39,695,528 | $ | (113,182 | ) | $ | — | $ | 56,981 | $ | — | $ | 367 | $ | 368,602,277 | $ | 9,787,104 | $ | 378,389,381 | |||||||||||||||||||||||||
|
|
|
|
|
|
|
|
|
|
|
|
|
|
|
|
|
|
|
|
|
|
|
|
|
| |||||||||||||||||||||||||||
The accompanying notes are an integral part of the consolidated financial statements.
- 7 -
CHUNGHWA TELECOM CO., LTD. AND SUBSIDIARIES
CONSOLIDATED STATEMENTS OF CASH FLOWS
(In Thousands of New Taiwan Dollars)
(Reviewed, Not Audited)
| Nine Months Ended September 30 | ||||||||
| 2018 | 2017 | |||||||
CASH FLOWS FROM OPERATING ACTIVITIES | ||||||||
Income before income tax | $ | 34,474,766 | $ | 37,255,092 | ||||
Adjustments for: | ||||||||
Depreciation | 20,613,767 | 21,224,411 | ||||||
Amortization | 3,282,482 | 2,687,735 | ||||||
Amortization of incremental costs of obtaining contracts | 1,519,228 | — | ||||||
Expected credit loss | 923,781 | — | ||||||
Provision for doubtful accounts | — | 461,764 | ||||||
Interest expenses | 13,212 | 16,384 | ||||||
Interest income | (144,378 | ) | (158,658 | ) | ||||
Dividend income | (395,593 | ) | (327,861 | ) | ||||
Compensation cost of share-based payment transactions | 16,940 | 17,899 | ||||||
Share of profits of associates and joint ventures accounted for using equity method | (329,528 | ) | (294,307 | ) | ||||
Loss on disposal of property, plant and equipment | 38,503 | 33,620 | ||||||
Gain on disposal of financial instruments | (5,763 | ) | (2,705 | ) | ||||
Loss on disposal of investments accounted for using equity method | 125 | — | ||||||
Provision for inventory and obsolescence | 122,884 | 23,351 | ||||||
Impairment loss on intangible assets | 50,750 | — | ||||||
Valuation gain on financial assets and liabilities at fair value through profit or loss, net | (4,666 | ) | (3,234 | ) | ||||
Loss (gain) on foreign exchange, net | (3,700 | ) | 74,294 | |||||
Changes in operating assets and liabilities: | ||||||||
Decrease (increase) in: | ||||||||
Financial assets held for trading | — | 217 | ||||||
Financial assets mandatorily measured at fair value through profit or loss | (132,790 | ) | — | |||||
Contract assets | 2,570,131 | — | ||||||
Trade notes and accounts receivable | 1,944,866 | 1,004,382 | ||||||
Receivables from related parties | 18,300 | (27,213 | ) | |||||
Inventories | (5,427,540 | ) | (1,641,950 | ) | ||||
Prepayments | (2,602,270 | ) | (2,537,687 | ) | ||||
Other current monetary assets | (238,682 | ) | (394,463 | ) | ||||
Other current assets | (740,941 | ) | (623,005 | ) | ||||
Incremental cost of obtaining contracts | (632,794 | ) | — | |||||
Increase (decrease) in: | ||||||||
Contract liabilities | 2,322,465 | — | ||||||
Trade notes and accounts payable | 1,149,538 | (1,166,289 | ) | |||||
Payables to related parties | (140,266 | ) | (175,825 | ) | ||||
Other payables | (3,540,858 | ) | (3,420,268 | ) | ||||
Provisions | (135 | ) | 29,588 | |||||
Advance receipts | — | (309,884 | ) | |||||
(Continued)
- 8 -
CHUNGHWA TELECOM CO., LTD. AND SUBSIDIARIES
CONSOLIDATED STATEMENTS OF CASH FLOWS
(In Thousands of New Taiwan Dollars)
(Reviewed, Not Audited)
| Nine Months Ended September 30 | ||||||||
| 2018 | 2017 | |||||||
Other operating liabilities | $ | (37,764 | ) | $ | (77,837 | ) | ||
Deferred revenue | — | 65,377 | ||||||
Net defined benefit plans | (1,673,657 | ) | (10,012 | ) | ||||
|
|
|
| |||||
Cash generated from operations | 53,010,413 | 51,722,916 | ||||||
Interest paid | (13,212 | ) | (16,375 | ) | ||||
Income tax paid | (6,790,207 | ) | (5,777,058 | ) | ||||
|
|
|
| |||||
Net cash provided by operating activities | 46,206,994 | 45,929,483 | ||||||
|
|
|
| |||||
CASH FLOWS FROM INVESTING ACTIVITIES | ||||||||
Purchase of financial assets at fair value through other comprehensive income | (289,580 | ) | — | |||||
Proceeds from capital reduction of financial assets at fair value through other comprehensive income | 4,022 | — | ||||||
Acquisition of time deposits and negotiable certificates of deposit with maturities of more than three months | (6,020,219 | ) | (5,635,498 | ) | ||||
Proceeds from disposal of time deposits and negotiable certificates of deposit with maturities of more than three months | 5,262,202 | 5,333,570 | ||||||
Proceeds from disposal ofheld-to-maturity financial assets | — | 2,140,000 | ||||||
Proceeds from disposal of financial assets carried at cost | — | 7,292 | ||||||
Proceeds from capital reduction of financial assets carried at cost | — | 500 | ||||||
Proceeds from disposal of investments accounted for using equity method | 3,379 | — | ||||||
Proceeds from capital reduction of investments accounted for using equity method | 19,184 | — | ||||||
Acquisition of property, plant and equipment | (19,346,884 | ) | (16,591,455 | ) | ||||
Proceeds from disposal of property, plant and equipment | 32,661 | 148,771 | ||||||
Acquisition of intangible assets | (203,261 | ) | (126,611 | ) | ||||
Acquisition of investment properties | (5,627 | ) | — | |||||
Decrease (increase) in other noncurrent assets | 824 | (1,257,256 | ) | |||||
Interest received | 148,339 | 185,734 | ||||||
Cash dividends received | 599,621 | 625,559 | ||||||
|
|
|
| |||||
Net cash used in investing activities | (19,795,339 | ) | (15,169,394 | ) | ||||
|
|
|
| |||||
CASH FLOWS FROM FINANCING ACTIVITIES | ||||||||
Proceeds from short-term loans | 260,000 | 5,351,500 | ||||||
Repayment of short-term loans | (210,000 | ) | (5,066,500 | ) | ||||
Decrease in customers’ deposits | (8,400 | ) | (99,621 | ) | ||||
Increase (decrease) in other noncurrent liabilities | 216,958 | (34,851 | ) | |||||
Cash dividends | (37,204,714 | ) | (38,336,525 | ) | ||||
Partial disposal of interests in subsidiaries without losing control | 1,174,400 | 105,931 | ||||||
Cash dividends distributed to noncontrolling interests | (958,446 | ) | (942,482 | ) | ||||
(Continued)
- 9 -
CHUNGHWA TELECOM CO., LTD. AND SUBSIDIARIES
CONSOLIDATED STATEMENTS OF CASH FLOWS
(In Thousands of New Taiwan Dollars)
(Reviewed, Not Audited)
| Nine Months Ended September 30 | ||||||||
| 2018 | 2017 | |||||||
Change in other noncontrolling interests | $ | 1,842,101 | $ | 2,611,491 | ||||
Unclaimed dividend | 2,481 | — | ||||||
|
|
|
| |||||
Net cash used in financing activities | (34,885,620 | ) | (36,411,057 | ) | ||||
|
|
|
| |||||
EFFECT OF EXCHANGE RATE CHANGES ON CASH AND CASH EQUIVALENTS | (25,966 | ) | 16,734 | |||||
|
|
|
| |||||
NET DECREASE IN CASH AND CASH EQUIVALENTS | (8,499,931 | ) | (5,634,234 | ) | ||||
CASH AND CASH EQUIVALENTS, BEGINNING OF PERIOD | 28,824,935 | 31,100,342 | ||||||
|
|
|
| |||||
CASH AND CASH EQUIVALENTS, END OF PERIOD | $ | 20,325,004 | $ | 25,466,108 | ||||
|
|
|
| |||||
| The accompanying notes are an integral part of the consolidated financial statements. | (Concluded) |
- 10 -
CHUNGHWA TELECOM CO., LTD. AND SUBSIDIARIES
NOTES TO CONSOLIDATED FINANCIAL STATEMENTS
NINE MONTHS ENDED SEPTEMBER 30, 2018 AND 2017
(In Thousands of New Taiwan Dollars, Unless Stated Otherwise)
(Reviewed, Not Audited)
| 1. | GENERAL |
Chunghwa Telecom Co., Ltd. (“Chunghwa”) was incorporated on July 1, 1996 in the Republic of China (“ROC”) pursuant to the Article 30 of the Telecommunications Act. Chunghwa is a company limited by shares and, prior to August 2000, was wholly owned by the Ministry of Transportation and Communications (“MOTC”). Prior to July 1, 1996, the current operations of Chunghwa were carried out under the Directorate General of Telecommunications (“DGT”). The DGT was established by the MOTC in June 1943 to take primary responsibility in the development of telecommunications infrastructure and to formulate policies related to telecommunications. On July 1, 1996, the telecom operations of the DGT werespun-off as Chunghwa which continues to carry out the business and the DGT continues to be the industry regulator.
As the dominant telecommunications service provider of domestic and international fixed-line, Global System for Mobile Communications (“GSM”), and Third Generation (“3G”) in the ROC, Chunghwa is subject to additional regulations imposed by the ROC.
Effective August 12, 2005, the MOTC completed the process of privatizing Chunghwa by reducing the government ownership to below 50% in various stages. In July 2000, Chunghwa received approval from the Securities and Futures Commission (the “SFC”) for a domestic initial public offering and its common stocks were listed and traded on the Taiwan Stock Exchange (the “TWSE”) on October 27, 2000. Certain of Chunghwa’s common stocks were sold, in connection with the foregoing privatization plan, in domestic public offerings at various dates from August 2000 to July 2003. Certain of Chunghwa’s common stocks were also sold in an international offering of securities in the form of American Depository Shares (“ADS”) on July 17, 2003 and were listed and traded on the New York Stock Exchange (the “NYSE”). The MOTC sold common stocks of Chunghwa by auction in the ROC on August 9, 2005 and completed the second international offering on August 10, 2005. Upon completion of the share transfers associated with these offerings on August 12, 2005, the MOTC owned less than 50% of the outstanding shares of Chunghwa and completed the privatization plan.
Chunghwa together with its subsidiaries are hereinafter referred to collectively as the “Company”.
The consolidated financial statements are presented in Chunghwa’s functional currency, New Taiwan dollars.
| 2. | APPROVAL OF FINANCIAL STATEMENTS |
The consolidated financial statements were approved by the Board of Directors on November 6, 2018.
- 11 -
| 3. | SUMMARY OF SIGNIFICANT ACCOUNTING POLICIES |
Except for the following items, the accounting policies applied in these consolidated financial statements are consistent with those applied in the consolidated financial statements for the year ended December 31, 2017. Please refer to the consolidated financial statements for the year ended December 31, 2017 for the details.
Statement of Compliance
The accompanying consolidated financial statements have been prepared in conformity with the Regulations Governing the Preparation of Financial Reports by Securities Issuers and International Accounting Standard 34 “Interim Financial Reporting” endorsed and issued into effect by the Financial Supervisory Commission (the “FSC”). The consolidated financial statements do not present all the disclosures required for a complete set of annual consolidated financial statements as required by International Financial Reporting Standards (IFRS), International Accounting Standards (IAS), International Financing Reporting Interpretations Committee (IFRIC) and SIC Interpretation (SIC) (collectively, the “IFRSs”) endorsed and issued into effect by the FSC.
Basis of Consolidation
The detail information of the subsidiaries at the end of reporting period was as follows:
| Percentage of Ownership | ||||||||||||||||||||
| Name of Investor | Name of Investee | Main Businesses and Products | September 30, 2018 | December 31, 2017 | September 30, 2017 | Note | ||||||||||||||
Chunghwa Telecom Co., Ltd. | Senao International Co., Ltd. (“SENAO”) | Handset and peripherals retailer; sales of CHT mobile phone plans as an agent | 28 | 29 | 29 | a. | ||||||||||||||
Light Era Development Co., Ltd. (“LED”) | Planning and development of real estate and intelligent buildings, and property management | 100 | 100 | 100 | ||||||||||||||||
Donghwa Telecom Co., Ltd. (“DHT”) | International private leased circuit, IP VPN service, and IP transit services | 100 | 100 | 100 | ||||||||||||||||
Chunghwa Telecom Singapore Pte., Ltd. (“CHTS”) | International private leased circuit, IP VPN service, and IP transit services | 100 | 100 | 100 | ||||||||||||||||
Chunghwa System Integration Co., Ltd. (“CHSI”) | Providing system integration services and telecommunications equipment | 100 | 100 | 100 | ||||||||||||||||
Chunghwa Investment Co., Ltd. (“CHI”) | Investment | 89 | 89 | 89 | ||||||||||||||||
CHIEF Telecom Inc. (“CHIEF”) | Network integration, internet data center (“IDC”), communications integration and cloud application services | 57 | 67 | 67 | b. | |||||||||||||||
CHYP Multimedia Marketing & Communications Co., Ltd. (“CHYP”) | Digital information supply services and advertisement services | 100 | 100 | 100 | c. | |||||||||||||||
Prime Asia Investments Group Ltd. (B.V.I.) (“Prime Asia”) | Investment | 100 | 100 | 100 | ||||||||||||||||
Spring House Entertainment Tech. Inc. (“SHE”) | Software design services, internet contents production and play, and motion picture production and distribution | 56 | 56 | 56 | ||||||||||||||||
Chunghwa Telecom Global, Inc. (“CHTG”) | International private leased circuit, internet services, and transit services | 100 | 100 | 100 | ||||||||||||||||
Chunghwa Telecom Vietnam Co., Ltd. (“CHTV”) | Intelligent energy saving solutions, international circuit, and information and communication technology (“ICT”) services. | 100 | 100 | 100 | ||||||||||||||||
(Continued)
- 12 -
| Percentage of Ownership | ||||||||||||||||||||
| Name of Investor | Name of Investee | Main Businesses and Products | September 30, 2018 | December 31, 2017 | September 30, 2017 | Note | ||||||||||||||
Smartfun Digital Co., Ltd. (“SFD”) | Providing diversified family education digital services | 65 | 65 | 65 | ||||||||||||||||
Chunghwa Telecom Japan Co., Ltd. (“CHTJ”) | International private leased circuit, IP VPN service, and IP transit services | 100 | 100 | 100 | ||||||||||||||||
Chunghwa Sochamp Technology Inc. (“CHST”) | Design, development and production of Automatic License Plate Recognition software and hardware | 51 | 51 | 51 | ||||||||||||||||
Honghwa International Co., Ltd. (“HHI”) | Telecommunications engineering, sales agent of mobile phone plan application and other business services | 100 | 100 | 100 | ||||||||||||||||
Chunghwa Leading Photonics Tech Co., Ltd. (“CLPT”) | Production and sale of electronic components and finished products | 75 | 75 | 75 | ||||||||||||||||
Chunghwa Telecom (Thailand) Co., Ltd. (“CHTT”) | International private leased circuit, IP VPN service, ICT and cloud VAS services | 100 | 100 | 100 | d. | |||||||||||||||
CHT Security Co., Ltd. (“CHTSC”) | Computing equipment installation, wholesale of computing and business machinery equipment and software, management consulting services, data processing services, digital information supply services and internet identify services | 80 | 80 | — | e. | |||||||||||||||
New Prospect Investments Holdings Ltd. (B.V.I.) (“New Prospect”) | Investment | — | — | — | f. | |||||||||||||||
Senao International Co., Ltd. | Senao International (Samoa) Holding Ltd. (“SIS”) | International investment | 100 | 100 | 100 | |||||||||||||||
Youth Co., Ltd. (“Youth”) | Sale of information and communication technologies products | 89 | 89 | 89 | ||||||||||||||||
Aval Technologies Co., Ltd. (“Aval”) | Sale of information and communication technologies products | 100 | 100 | 100 | ||||||||||||||||
SENYOUNG Insurance Agent Co., Ltd. (“SENYOUNG”) | Property and liability insurance agency | 100 | 100 | — | g. | |||||||||||||||
Youth Co., Ltd. | ISPOT Co., Ltd. (“ISPOT”) | Sale of information and communication technologies products | 100 | 100 | 100 | |||||||||||||||
Youyi Co., Ltd. (“Youyi”) | Maintenance of information and communication technologies products | 100 | 100 | 100 | ||||||||||||||||
Light Era Development Co., Ltd. | Taoyuan Asia Silicon Valley Innovation Co., Ltd. (“TASVI”) | Development of real estate | 60 | — | — | h. | ||||||||||||||
CHIEF Telecom Inc. | Unigate Telecom Inc. (“Unigate”) | Telecommunications and internet service | 100 | 100 | 100 | |||||||||||||||
Chief International Corp. (“CIC”) | Telecommunications and internet service | 100 | 100 | 100 | ||||||||||||||||
Shanghai Chief Telecom Co., Ltd. (“SCT”) | Telecommunications and internet service | 49 | 49 | 49 | ||||||||||||||||
Chunghwa System Integration Co., Ltd. | Concord Technology Co., Ltd. (“Concord”) | Investment | — | 100 | 100 | i. | ||||||||||||||
Chunghwa Investment Co., Ltd. | Chunghwa Precision Test Tech. Co., Ltd. (“CHPT”) | Production and sale of semiconductor testing components and printed circuit board | 34 | 38 | 38 | j. | ||||||||||||||
(Continued)
- 13 -
| Percentage of Ownership | ||||||||||||||||||||
| Name of Investor | Name of Investee | Main Businesses and Products | September 30, 2018 | December 31, 2017 | September 30, 2017 | Note | ||||||||||||||
Concord Technology Co., Ltd. | Glory Network System Service (Shanghai) Co., Ltd. (“GNSS (Shanghai)”) | Design, development and production of computer and internet software, installment, maintenance and consulting services of information system integration, and sales of self-production products | — | — | — | k. | ||||||||||||||
Chunghwa Precision Test Tech. Co., Ltd. | Chunghwa Precision Test Tech. USA Corporation (“CHPT (US)”) | Design and after-sale services of semiconductor testing components and printed circuit board | 100 | 100 | 100 | |||||||||||||||
CHPT Japan Co., Ltd. (“CHPT (JP)”) | Related services of electronic parts, machinery processed products and printed circuit board | 100 | 100 | 100 | ||||||||||||||||
Chunghwa Precision Test Tech. International, Ltd. (“CHPT (International)”) | Wholesale and retail of electronic materials, and investment | 100 | 100 | 100 | ||||||||||||||||
Senao International (Samoa) Holding Ltd. | Senao International HK Limited (“SIHK”) | International investment | 100 | 100 | 100 | |||||||||||||||
Senao International HK Limited | Senao Trading (Fujian) Co., Ltd. (“STF”) | Sale of information and communication technologies products | 100 | 100 | 100 | l. | ||||||||||||||
Senao International Trading (Shanghai) Co., Ltd. (“SITS”) | Sale of information and communication technologies products | 100 | 100 | 100 | ||||||||||||||||
Senao International Trading (Shanghai) Co., Ltd. (“SEITS”) | Maintenance of information and communication technologies products | — | 100 | 100 | m. | |||||||||||||||
Senao International Trading (Jiangsu) Co., Ltd. (“SITJ”) | Sale of information and communication technologies products | 100 | 100 | 100 | n. | |||||||||||||||
Prime Asia Investments Group Ltd. (B.V.I.) | Chunghwa Hsingta Co., Ltd. (“CHC”) | Investment | 100 | 100 | 100 | |||||||||||||||
Chunghwa Hsingta Co., Ltd. (“CHC”) | Chunghwa Telecom (China) Co., Ltd. (“CTC”) | Integrated information and communication solution services for enterprise clients, and intelligent energy network service | 100 | 100 | 100 | |||||||||||||||
Jiangsu Zhenhua Information Technology Company, LLC. (“JZIT”) | Providing intelligent energy saving solution and intelligent buildings services | 75 | 75 | 75 | o. | |||||||||||||||
Chunghwa Precision Test Tech. International, Ltd. | Shanghai Taihua Electronic Technology Limited (“STET”) | Design of printed circuit board and related consultation service | 100 | 100 | 100 | |||||||||||||||
(Concluded)
| a. | SENAO transferred its treasury stock to employees in June 2018 and the Company’s ownership interest in SENAO decreased to 28.18% as of September 30, 2018. Chunghwa had originally four out of seven seats of the Board of Directors of SENAO through the support of large beneficial stockholders. In order to comply with the local regulations, SENAO increased two seats of independent directors in June 2016; therefore, total seats of its Board of Directors increased to nine and Chunghwa continues to hold four out of nine seats of the Board of Directors. As Chunghwa remains the control over SENAO’s relevant activities, the accounts of SENAO are included in the consolidated financial statements. |
- 14 -
| b. | Chunghwa and CHI disposed some shares of CHIEF in June 2017 before CHIEF traded its shares on the emerging stock market according to the local requirements. The Company’s equity ownership of CHIEF decreased to 70.43% as of September 30 and December 31, 2017. CHIEF issued new shares in March 2018 as its employees exercised their options. In addition, Chunghwa and CHI disposed some shares of CHIEF in May 2018 before CHIEF traded its shares on the General Stock Market of the Taipei Exchange according to the local requirements. Furthermore, Chunghwa and CHI did not participate in the capital increase of CHIEF in June 2018. Therefore, the Company’s equity ownership interest in CHIEF decreased to 60.28% as of September 30, 2018. |
| c. | Chunghwa International Yellow Pages Co., Ltd. changed its name to CHYP Multimedia Marketing & Communications Co., Ltd. starting from September 4, 2017. |
| d. | Chunghwa invested 100% equity shares of Chunghwa Telecom (Thailand) Co., Ltd. (“CHTT”) in March 2017. |
| e. | Chunghwa invested 80.27% equity shares of CHT Security Co., Ltd. (“CHTSC”) in December 2017. |
| f. | New Prospect was approved to dissolve its business in April 2017. The liquidation of New Prospect was completed in May 2017. |
| g. | SENAO invested 100% equity shares of SENYOUNG Insurance Agent Co., Ltd. (“SENYOUNG”) in November 2017. |
| h. | LED invested 60% equity shares of Taoyuan Asia Silicon Valley Innovation Co., Ltd. (“TASVI”) in March 2018. |
| i. | Concord was approved to end and dissolve its business in August 2017. The liquidation of Concord was completed in January 2018. |
| j. | CHI did not participate in the capital increase of CHPT in September 2017 and disposed some shares of CHPT from April to August 2018. Therefore, its ownership interest in CHPT decreased to 34.25% as of September 30, 2018. However, considering the absolute and relative size of ownership interest, and the dispersion of shares owned by the other stockholders, the management concluded that the Company has a sufficiently dominant voting interest to direct the relevant activities; hence, CHPT is deemed as a subsidiary of the Company. |
| k. | GNSS (Shanghai) completed its liquidation in August 2017 and Concord received the proceeds from the liquidation. |
| l. | STF was approved to end and dissolve its business in September 2018. The liquidation of STF is still in process. |
| m. | SEITS completed its liquidation in March 2018. |
| n. | SITJ was approved to end and dissolve its business in April 2018. The liquidation of SITJ is still in process. |
| o. | JZIT was approved to end and dissolve its business in May 2016. The liquidation of JZIT is still in process. |
- 15 -
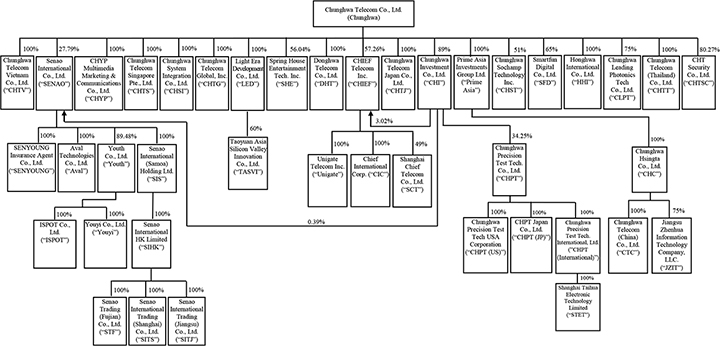
The following diagram presents information regarding the relationship and ownership percentages between Chunghwa and its subsidiaries as of September 30, 2018:
Other Significant Accounting Policies
The Company initial applied IFRS 9 “Financial Instruments’’ and IFRS 15 “Revenue from Contracts with Customers’’ on January 1, 2018, and elected not to restate the figures in comparative periods. Different accounting policies for each accounting periods as a result of the application of new accounting standards are listed by year separately.
| a. | Retirement benefits |
Pension cost for an interim period is calculated on ayear-to-date basis by using the actuarially determined pension cost rate at the end of the prior financial year, adjusted for significant market fluctuations since that time and for other significantone-off events.
| b. | Taxation |
Income tax expense represents the sum of the tax currently payable and deferred tax. Income taxes for interim period are assessed on an annual basis and calculated by applying to an interim period’spre-tax income the tax rate that would be applicable to expected total annual earnings. The effect of a change in tax rate resulting from a change in tax law is recognized in consistent with the accounting for the transaction itself for which the tax consequence arises from, and is recognized in profit or loss or other comprehensive income in full in the period in which the change in tax rate occurs.
The measurement of deferred tax assets and liabilities reflects the tax consequences that would follow from the manner in which the Company expects, at the end of the reporting period, to recover or settle the carrying amount of its assets and liabilities.
- 16 -
| c. | Financial instruments |
Financial assets and financial liabilities are recognized when the Company becomes a party to the contractual provisions of the instruments.
Financial assets and financial liabilities are initially measured at fair value. Transaction costs that are directly attributable to the acquisition of financial assets and financial liabilities (other than financial assets and financial liabilities at fair value through profit or loss) are added to the fair value of the financial assets or financial liabilities, as appropriate, on initial recognition. Transaction costs directly attributable to the acquisition of financial assets or financial liabilities at fair value through profit or loss are recognized immediately in profit or loss.
| 1) | Financial assets |
All regular way purchases or sales of financial assets are recognized and derecognized on a trade date basis.
| a) | Measurement category |
2018
| i. | Financial assets at fair value through profit and loss (FVTPL) |
Financial asset is classified as at FVTPL when the financial asset is mandatorily classified as at FVTPL. Financial assets mandatorily classified as at FVTPL include investments in equity instruments which are not designated as at fair value through other comprehensive income (FVOCI).
Financial assets at FVTPL are stated at fair value, with any gains or losses arising on remeasurement recognized in profit or loss. The net gain or loss recognized in profit or loss does not incorporate any dividend earned on the financial asset. Fair value is determined in the manner described in Note 38.
| ii. | Financial assets at amortized cost |
Financial assets that meet the following conditions are subsequently measured at amortized cost:
| a. | The financial asset is held within a business model whose objective is to hold financial assets in order to collect contractual cash flows; and |
| b. | The contractual terms of the financial asset give rise on specified dates to cash flows that are solely payments of principal and interest on the principal amount outstanding. |
Subsequent to initial recognition, financial assets at amortized cost are measured at amortized cost, which equals to gross carrying amount determined by the effective interest method less any impairment loss, except for short-term receivables as the effect of discounting is immaterial. Exchange differences are recognized in profit or loss.
| iii. | Investments in equity instruments at FVOCI |
On initial recognition, the Company may make an irrevocable election to designate investments in equity instruments as at FVOCI. Designation at FVOCI is not permitted if the equity investment is held for trading or if it is contingent consideration recognized by an acquirer in a business combination.
- 17 -
Investments in equity instruments at FVOCI are subsequently measured at fair value with gains and losses arising from changes in fair value recognized in other comprehensive income and accumulated in other equity. The cumulative gain or loss will not be reclassified to profit or loss on disposal of the equity investments. Instead, it will be transferred to retained earnings.
Dividends on these investments in equity instruments are recognized in profit or loss when the Company’s right to receive the dividends is established, unless the dividends clearly represent a recovery of part of the cost of the investment.
2017
| i. | Financial assets at fair value through profit and loss (FVTPL) |
Financial assets are classified as at FVTPL when the financial asset is held for trading.
Financial assets at FVTPL are stated at fair value, with any gains or losses arising on remeasurement recognized in profit or loss. The net gain or loss recognized in profit or loss does not incorporate any dividend or interest earned on the financial asset.
| ii. | Held-to-maturity financial assets |
The Company invests in bank debentures and corporate bonds with specific credit ratings and the Company has positive intent and ability to hold to maturity, are classified asheld-to-maturity investments.
Subsequent to initial recognition,held-to-maturity financial assets are measured at amortized cost using the effective interest method less any impairment loss.
| iii. | Available-for-sale financial assets (AFS financial assets) |
AFS financial assets arenon-derivatives that are either designated as AFS or are not classified as loans and receivables,held-to-maturity financial assets or financial assets at fair value through profit or loss.
The Company invests in listed stocks, emerging market stocks and non-listed stocks. Among these investments, those that have a quoted market price in an active market are classified as AFS and measured at fair value at the end of each reporting period; the others that do not have a quoted market price in an active market and whose fair value cannot be reliably measured are measured at cost less any identified impairment losses at the end of each reporting period by presenting in a separate line item as financial assets carried at cost. If, in a subsequent period, the fair value of the financial assets can be reliably measured, the financial assets are remeasured at fair value. The difference between the carrying amount and the fair value is recognized in other comprehensive income. Any impairment losses are recognized in profit or loss.
Changes in the carrying amount of AFS monetary financial assets relating to changes in foreign currency exchange rates, interest income calculated using the effective interest method and dividends on AFS equity investments are recognized in profit or loss. Other changes in the carrying amount of AFS financial assets are recognized in other comprehensive income and will be reclassified to profit or loss when the investment is disposed of or is determined to be impaired.
Dividends on AFS equity instruments are recognized in profit or loss when the Company’s right to receive the dividends is established.
- 18 -
| iv. | Loans and receivables |
Loans and receivables (including cash and cash equivalents, trade notes and accounts receivable, receivables from related parties, other financial assets and refundable deposits) are measured at amortized cost using the effective interest method, less any impairment loss, except for short-term receivables as the effect of discounting is immaterial.
| b) | Impairment of financial assets |
2018
The Company recognizes a loss allowance for expected credit losses on financial assets at amortized cost (including accounts receivable) and contract assets.
The Company recognizes lifetime Expected Credit Loss (ECL) for accounts receivable and contract assets. For all other financial instruments, the Company recognizes lifetime ECL when there has been a significant increase in credit risk since initial recognition. If, on the other hand, the credit risk on the financial instrument has not increased significantly since initial recognition, the Company measures the loss allowance for that financial instrument at an amount equal to12-month ECL.
Expected credit losses reflect the weighted average of credit losses with the respective risks of a default occurring as the weights. Lifetime ECL represents the expected credit losses that will result from all possible default events over the expected life of a financial instrument. In contrast,12-month ECL represents the portion of ECL that is expected to result from default events on a financial instrument that are possible within 12 months after the reporting date.
The Company recognizes an impairment loss for all financial instruments with a corresponding adjustment to their carrying amount through a loss allowance account.
2017
Financial assets, other than those at FVTPL, are assessed to determine whether there is objective evidence that an impairment loss has occurred at the end of each reporting period. Financial assets are considered to be impaired when there is objective evidence that, as a result of one or more events that occurred after the initial recognition of the financial asset, the estimated future cash flows of the investment have been affected.
For financial assets carried at amortized cost, such asheld-to-maturity financial assets and trade notes and accounts receivable, assets that are individually assessed and not impaired are, in addition, assessed for impairment on a collective basis.
For financial assets carried at amortized cost, the amount of the impairment loss recognized is mainly based on the difference between the asset’s carrying amount and the present value of estimated future cash flows, discounted at the financial asset’s original effective interest rate. However, since the discounted effect of short-term receivables is immaterial, the impairment loss is recognized on the difference between carrying amount and estimated future cash flow.
- 19 -
For financial assets measured at amortized cost, if, in a subsequent period, the amount of the impairment loss decreases and the decrease can be related objectively to an event occurring after the impairment was recognized, the previously recognized impairment loss is reversed through profit or loss to the extent that the carrying amount of the investment at the date the impairment is reversed does not exceed what the amortized cost would have been had the impairment not been recognized.
For AFS equity investments, a significant or prolonged decline in the fair value of the security below its cost is considered to be objective evidence of impairment.
When an AFS financial asset is considered to be impaired, cumulative gains or losses previously recognized in other comprehensive income are reclassified to profit or loss in the period.
In respect of AFS equity securities, impairment losses previously recognized in profit or loss are not reversed through profit or loss. Any increase in fair value subsequent to an impairment loss is recognized in other comprehensive income.
For financial assets that are carried at cost, the amount of the impairment loss is mainly measured as the difference between the asset’s carrying amount and the present value of the estimated future cash flows discounted at the current market rate of return for a similar financial asset. Such impairment loss is not reversed in subsequent periods.
The carrying amount of the financial asset is reduced by the impairment loss directly for all financial assets with the exception of trade notes and accounts receivable and other receivables, where the carrying amount is reduced through the use of an allowance account. When trade notes and accounts receivable and other receivables are considered uncollectible, it is written off against the allowance account. Subsequent recoveries of amounts previously written off are credited against the allowance account. Changes in the carrying amount of the allowance account are recognized in profit or loss except for uncollectible trade notes and accounts receivable and other receivables that are written off against the allowance account.
| c) | Derecognition of financial assets |
The Company derecognizes a financial asset only when the contractual rights to the cash flows from the asset expire, or when it transfers the financial asset and substantially all the risks and rewards of ownership of the asset to another entity.
2018
On derecognition of a financial asset measured at amortized cost in its entirely, the difference between the asset’s carrying amount and the sum of the consideration received and receivable is recognized in profit or loss.
On derecognition of investments in equity instruments at FVOCI in its entirely, the cumulative gain or loss is directly transferred to retained earnings, and it is not reclassified to profit or loss.
2017
On derecognition of a financial asset in its entirety, the difference between the asset’s carrying amount and the sum of the consideration received and receivable and the cumulative gain or loss that had been recognized in other comprehensive income is recognized in profit or loss.
- 20 -
| 2) | Financial liabilities |
| a) | Subsequent measurement |
Except for financial liabilities at FVTPL, all the financial liabilities are subsequently measured at amortized cost using the effective interest method.
| b) | Derecognition of financial liabilities |
The difference between the carrying amount of the financial liability derecognized and the consideration paid and payable, including anynon-cash assets transferred or liabilities assumed, is recognized in profit or loss.
| 3) | Derivative financial instruments |
The Company enters into a variety of derivative financial instruments to manage its exposure to foreign exchange rate risks, including forward exchange contracts.
Derivatives are initially measured at fair value at the date the derivative contracts are entered into and are subsequently remeasured to their fair value at the end of each reporting period. The resulting gain or loss is recognized in profit or loss immediately unless the derivative is designated and effective as a hedging instrument, in which event the timing of the recognition in profit or loss depends on the nature of the hedge relationship. When the fair value of derivative financial instruments is positive, the derivative is recognized as a financial asset; when the fair value of derivative financial instruments is negative, the derivative is recognized as a financial liability.
For derivatives embedded innon-derivative host contracts that are financial assets within the scope of IFRS 9, the whole hybrid contracts shall be measured as one and the classification is determined by the entire hybrid contract. For derivatives embedded innon-derivative host contracts that are not financial assets within the scope of IFRS 9 (e.g. financial liabilities), the embedded derivatives are separated from the host contract when (1) a separate instrument with the same terms as the embedded derivative would meet the definition of a derivative; (2) the risks and economic characteristics of the embedded derivatives are not closely related to those of the host contracts; and (3) the hybrid contracts are not measured at FVTPL.
| 4) | Hedge Accounting |
The Company designates some derivatives instruments as cash flow hedges. Hedges of foreign exchange risk on firm commitments are accounted for as cash flow hedges.
The effective portion of changes in the fair value of derivatives that are designated and qualify as cash flow hedges is recognized in other comprehensive income. The gain or loss relating to the ineffective portion is recognized immediately in profit or loss.
The associated gains or losses that were recognized in other comprehensive income are reclassified from equity to profit or loss as a reclassification adjustment in the line item relating to the hedged item in the same period when the hedged item affects profit or loss. If a hedge of a forecast transaction subsequently results in the recognition of anon-financial asset or anon-financial liability, the associated gains and losses that were recognized in other comprehensive income are removed from equity and are included in the initial cost of thenon-financial asset ornon-financial liability.
Before 2018, hedge accounting was discontinued prospectively when the Company revoked the designated hedging relationship; when the hedging instrument expired or was sold, terminated, or exercised; or when the hedging instrument no longer met the criteria for hedge accounting.
- 21 -
Starting from 2018, the Company discontinues hedge accounting only when the hedging relationship ceases to meet the qualifying criteria; for instance, when the hedging instrument expires or is sold, terminated or exercised. The cumulative gain or loss on the hedging instrument that has been previously recognized in other comprehensive income from the period when the hedge was effective remains separately in equity until the forecast transaction occurs. When a forecast transaction is no longer expected to occur, the gain or loss accumulated in equity is recognized immediately in profit or loss.
| d. | Revenue recognition of the contract with the customer |
2018
The Company identifies the performance obligations in the contract with the customers, allocates transaction price to each performance obligation and recognizes revenue when performance obligations are satisfied.
Sales of products are recognized as revenue when the Company delivers products and the customer accepts and controls the product. Except for the consumer electronic products such as mobile devices sold in channel stores which are usually in cash sale, the Company recognizes revenues for sale of other electronic devices and corresponding trade notes and accounts receivable.
Usage revenues from fixed-line services (including local, domestic long distance and international long distance telephone services), cellular services, Internet and data services, and interconnection and call transfer fees from other telecommunications companies and carriers are billed in arrears and are recognized based upon seconds or minutes of traffic processed when the services are provided in accordance with contract terms. The usage revenues and corresponding trade notes and accounts receivable are recognized monthly.
Other revenues are recognized as follows:(a) one-time subscriber connection fees (on fixed-line services) are first recognized as contract liabilities and revenues are recognized subsequently over the average expected customer service periods, (b) monthly fees (on fixed-line services, mobile, Internet and data services) and related receivables are accrued monthly, and (c) prepaid services (fixed-line, mobile, Internet and data services) are recognized as contract liabilities upon collection considerations from customers and are recognized as revenues subsequently based upon actual usage by customers.
Where the Company enters into transactions which involve both the provision of telecommunications service bundled with products such as handsets, total consideration received from products and telecommunications service in these arrangements are allocated based on their relative stand-alone selling price. The amount of sales revenue recognized for products is not limited to the amount paid by the customer for the products. When the amount of sales revenue recognized for products exceeded the amount paid by the customer for the products, the difference is recognized as contract assets. Contract assets are derecognized and accounts receivable is recognized when the amount become collectible from customers subsequently. When the amount of sales revenue recognized for products was less than the amount paid by the customer for the products, the difference is recognized as contract liabilities and revenues are recognized subsequently when the telecommunications service are provided.
For project business contracts, if a substantial part of the Company’s promise to customers is to manage and coordinate the various tasks and assume the risks of those tasks to ensure the individual goods or services are incorporated into the combined output, they are treated as a single performance obligation since the Company provides a significant integration service. The Company recognizes revenues and corresponding accounts receivable when the project business contract is completed and accepted by customers.
- 22 -
For service contracts such as maintenance and warranties, customers simultaneously receive and consume the benefits provided by the Company; thus revenues and corresponding accounts receivable of service contracts are recognized over the related service period.
When another party is involved in providing goods or services to a customer, the Company is acting as a principal if it controls the specified good or service before that good or service is transferred to a customer; otherwise, the Company is acting as an agent. When the Company is acting as a principal, gross inflow of economic benefits arising from transactions is recognized as revenue. When the Company is acting as an agent, revenue is recognized in the amount of commission.
2017
Revenue from the sale of goods is recognized when all the following conditions are satisfied:
| 1) | The Company has transferred to the buyer the significant risks and rewards of ownership of the goods; |
| 2) | The Company retains neither continuing managerial involvement to the degree usually associated with ownership nor effective control over the goods sold; |
| 3) | The amount of revenue can be measured reliably; |
| 4) | It is probable that the economic benefits associated with the transaction will flow to the Company; and |
| 5) | The costs incurred or to be incurred in respect of the transaction can be measured reliably. |
Revenue is measured at the fair value of the consideration received or receivable and represents amounts for goods sold in the normal course of business, net of sales discounts and volume rebates. For trade notes and accounts receivable due within one year from the balance sheet date, as the nominal value of the consideration to be received approximates its fair value and transactions are frequent, fair value of the consideration is not determined by discounting all future receipts using an imputed rate of interest.
Usage revenues from fixed-line services (including local, domestic long distance and international long distance telephone services), cellular services, Internet and data services, and interconnection and call transfer fees from other telecommunications companies and carriers are billed in arrears and are recognized based upon seconds or minutes of traffic processed when the services are provided in accordance with contract terms.
Other revenues are recognized as follows:(a) one-time subscriber connection fees (on fixed-line services) are deferred and recognized over the average expected customer service periods, (b) monthly fees (on fixed-line services, mobile, Internet and data services) are accrued every month, and (c) prepaid services (fixed-line, mobile, Internet and data services) are recognized as income based upon actual usage by customers.
Where the Company enters into transactions which involve both the provision of telecommunications service bundled with products such as handsets, total consideration received from products and telecommunications service in these arrangements are allocated and measured using units of accounting within the arrangement based on their relative fair values limited to the amount paid by the customer for the products.
Revenue from a contract to provide services is recognized by reference to the stage of completion of the contract.
- 23 -
When another party is involved in providing goods or services to a customer, the Company is acting as a principal when it has exposure to the significant risks and rewards associated with the sale of goods or the rendering of services; otherwise, the Company is acting as an agent. When the Company is acting as a principal, gross inflow of economic benefits arising from transactions is recognized as revenue. When the Company is acting as an agent, revenue is recognized in the amount of commission.
| e. | Incremental costs of obtaining contracts |
Commissions and equipment subsidy related to telecommunications service as a result of obtaining contracts are recognized as an asset under the incremental costs of obtaining contracts to the extent the costs are expected to be recovered, and are amortized over the contract period. However, the Company elects not to capitalize the incremental costs of obtaining contracts if the amortization period of the assets that the Company otherwise would have recognized is expected to be one year or less.
| 4. | CRITICAL ACCOUNTING JUDGMENTS AND KEY SOURCES OF ESTIMATION, UNCERTAINTY AND ASSUMPTION |
In the application of the Company’s accounting policies, the management is required to make judgments, estimates and assumptions which are based on historical experience and other factors that are not readily apparent from other sources. Actual results may differ from these estimates.
The estimates and underlying assumptions are reviewed by the management on an ongoing basis. Revisions to accounting estimates are recognized in the period in which the estimate is revised if the revision affects only that period or in the period of the revision and future periods if the revision affects both current and future periods.
Except for the following items, for the critical accounting judgments and key sources of estimation, uncertainty and assumption applied in these consolidated financial statements, please refer to the consolidated financial statements for the year ended December 31, 2017.
| a. | Impairment of trade notes and accounts receivable |
2018
The provision for impairment of trade notes and accounts receivable is based on assumptions about risk of default and expected loss rates. The Company uses judgment in making these assumptions and in selecting the inputs to the impairment calculation, based on the Company’s past experience, current market conditions as well as forward looking information at the end of each reporting period. For details of the key assumptions and inputs used, see Note 10. Where the actual future cash flows are less than expected, a material impairment loss may arise.
2017
When an indication of impairment is assessed with objective evidence, the Company considers whether the recoverable amount of an asset is less than its carrying amount and recognizes the impairment loss based on difference between the recoverable amount and its carrying amount. The estimate of recoverable amount would impact on the timing and the amount of impairment loss recognition.
- 24 -
| b. | Judgment of business model of the financial assets classification |
2018
The Company determines the business model at a level that reflects how groups of financial assets are managed together to achieve a particular business objective. This assessment includes judgments reflecting all relevant evidence including how the performance of the assets is evaluated and their performance measured, the risks that affect the performance of the assets. The Company monitors financial assets measured at amortized cost that are derecognized prior to their maturity to understand the reason for their disposal and whether the reasons are consistent with the objective of the business model for which the assets was held. If business model is changed, a prospective change to the classification of those financial assets is applied.
| 5. | APPLICATION OF NEW AND REVISED STANDARDS AND INTERPRETATIONS |
| a. | Initial application of the amendments to the Regulations Governing the Preparation of Financial Reports by Securities Issuers and the IFRSs endorsed and issued into effect by the FSC |
Except for the following, whenever applied, the initial application of the amendments to the Regulations Governing the Preparation of Financial Reports by Securities Issuers and the IFRSs issued by the International Accounting Standards Board and endorsed and issued into effect by the FSC (collectively, the “Taiwan-IFRSs”) does not have material impacts on the Company’s consolidated financial statements.
| 1) | IFRS 9 “Financial Instruments” and related amendment |
IFRS 9 supersedes IAS 39 “Financial Instruments: Recognition and Measurement”, with consequential amendments to IFRS 7 “Financial Instruments: Disclosures” and other standards. IFRS 9 sets out the requirements for classification, measurement and impairment of financial assets and hedge accounting. Refer to Note 3 for information relating to the relevant accounting policies.
The requirements for classification, measurement and impairment of financial assets have been applied retrospectively on January 1, 2018, and the requirements for hedge accounting have been applied prospectively. IFRS 9 is not applicable to items that have already been derecognized on or before December 31, 2017.
Classification, measurement and impairment of financial assets and liabilities
On the basis of the facts and circumstances that existed on January 1, 2018, the Company performed an assessment of the classifications of financial assets and liabilities and elected not to restate the comparative figures.
- 25 -
The following table shows the original measurement categories and carrying amounts under IAS 39 and the new measurement categories and carrying amounts under IFRS 9 for each class of the Company’s financial assets and financial liabilities as of January 1, 2018.
Measurement category | Carrying amount | |||||||||||||||
| IAS 39 | IFRS 9 | IAS 39 | IFRS 9 | Note | ||||||||||||
Financial Assets | ||||||||||||||||
Cash and cash equivalents | Loans and receivables | Amortized cost | $ | 28,824,935 | $ | 28,824,935 | a | ) | ||||||||
Equity securities | Available-for-sale | FVTPL | 53,888 | 53,888 | b | ) | ||||||||||
| Available-for-sale | FVOCI- equity investments | 5,696,983 | 7,538,848 | b | ) | |||||||||||
Trade notes and accounts receivable, receivables from related parties, other current monetary assets and refundable deposits | Loans and receivables | Amortized cost | 40,158,885 | 40,158,885 | a | ) | ||||||||||
Financial Liabilities | ||||||||||||||||
Short-term loans, trade notes and accounts payable, payables to related parties, partial other payables, customers’ deposit and loan-term loans | Amortized cost | Amortized cost | 39,725,662 | 39,725,662 | ||||||||||||
Derivatives | Held-for-trading | FVTPL | 578 | 578 | ||||||||||||
Hedging derivative financial liabilities | Hedging financial liabilities | 850 | 850 | c | ) | |||||||||||
| IAS 39 Carrying Amount January 1, 2018 | Reclassifi- cations | Remea- surements | IFRS 9 Carrying Amount January 1, 2018 | Retained Earnings effect on January 1, 2018 | Other adjustment effect on January 1, 2018 | Noncontrolling interests effect on January 1, 2018 | Note | |||||||||||||||||||||||||
Financial assets measured at FVTPL | $ | — | $ | — | $ | — | $ | — | $ | — | $ | — | $ | — | ||||||||||||||||||
Add: reclassification from available for sale (IAS 39)—mandatory reclassification | — | 53,888 | — | 53,888 | 6,149 | (6,149 | ) | — | b | ) | ||||||||||||||||||||||
|
|
|
|
|
|
|
|
|
|
|
|
|
| |||||||||||||||||||
| — | 53,888 | — | 53,888 | 6,149 | (6,149 | ) | — | |||||||||||||||||||||||||
|
|
|
|
|
|
|
|
|
|
|
|
|
| |||||||||||||||||||
Financial liabilities measured at FVTPL | (578 | ) | — | — | (578 | ) | — | — | — | |||||||||||||||||||||||
|
|
|
|
|
|
|
|
|
|
|
|
|
| |||||||||||||||||||
Financial assets measured at FVOCI—equity investments | — | — | — | — | — | — | — | |||||||||||||||||||||||||
Add: reclassification from available for sale (IAS 39)—designated at January 1, 2018 | — | 5,696,983 | 1,841,865 | 7,538,848 | 1,515,525 | 327,177 | (837 | ) | b | ) | ||||||||||||||||||||||
|
|
|
|
|
|
|
|
|
|
|
|
|
| |||||||||||||||||||
| — | 5,696,983 | 1,841,865 | 7,538,848 | 1,515,525 | 327,177 | (837 | ) | |||||||||||||||||||||||||
|
|
|
|
|
|
|
|
|
|
|
|
|
| |||||||||||||||||||
Financial assets measured at Amortized cost | — | — | — | — | — | — | — | |||||||||||||||||||||||||
Add: reclassification from loans and receivables (IAS 39) | — | 68,983,820 | — | 68,983,820 | — | — | — | a | ) | |||||||||||||||||||||||
|
|
|
|
|
|
|
|
|
|
|
|
|
| |||||||||||||||||||
| — | 68,983,820 | — | 68,983,820 | — | — | — | ||||||||||||||||||||||||||
|
|
|
|
|
|
|
|
|
|
|
|
|
| |||||||||||||||||||
- 26 -
| IAS 39 Carrying Amount January 1, 2018 | Reclassifi- cations | Remea- surements | IFRS 9 Carrying Amount January 1, 2018 | Retained Earnings effect on January 1, 2018 | Other adjustment effect on January 1, 2018 | Noncontrolling interests effect on January 1, 2018 | Note | |||||||||||||||||||||||||
Financial liabilities measured at amortized cost | — | — | — | — | — | — | — | |||||||||||||||||||||||||
Add: reclassification from amortized cost (IAS 39) | — | (39,725,662 | ) | — | (39,725,662 | ) | — | — | — | |||||||||||||||||||||||
|
|
|
|
|
|
|
|
|
|
|
|
|
| |||||||||||||||||||
| — | (39,725,662 | ) | — | (39,725,662 | ) | — | — | — | ||||||||||||||||||||||||
|
|
|
|
|
|
|
|
|
|
|
|
|
| |||||||||||||||||||
Hedging financial liabilities | — | — | — | — | — | — | — | |||||||||||||||||||||||||
Add: reclassification from Hedging derivative instrument (IAS 39) | — | (850 | ) | — | (850 | ) | — | — | — | c | ) | |||||||||||||||||||||
|
|
|
|
|
|
|
|
|
|
|
|
|
| |||||||||||||||||||
| — | (850 | ) | — | (850 | ) | — | — | — | ||||||||||||||||||||||||
|
|
|
|
|
|
|
|
|
|
|
|
|
| |||||||||||||||||||
Total | $ | (578 | ) | $ | 35,008,179 | $ | 1,841,865 | $ | 36,849,466 | $ | 1,521,674 | $ | 321,028 | $ | (837 | ) | ||||||||||||||||
|
|
|
|
|
|
|
|
|
|
|
|
|
| |||||||||||||||||||
| a) | Cash and cash equivalents, trade notes and accounts receivable, receivables from related parties, other current monetary assets and refundable deposit that were classified as loans and receivables under IAS 39 are now classified as financial assets measured at amortized cost with assessment of expected credit loss. |
- 27 -
| b) | The Company elected to reclassify equity securities originally classified asavailable-for-sale under IAS 39 to FVTPL and designated at FVOCI in accordance with IFRS 9. As a result, the related other equity—unrealized gain or loss onavailable-for-sale financial assets was reclassified $6,149 thousand to retained earnings and $556,243 thousand to other equity—unrealized gain or loss on financial assets at FVOCI. |
Equity investments innon-listed stocks previously carried at cost under IAS 39 are designated as FVOCI and remeasured at fair values. As a result, financial assets at FVOCI and other equity—unrealized gain or loss on financial assets at FVOCI were increased by $1,841,865 thousand and $1,842,702 thousand, respectively, and noncontrolling interests was decreased by $837 thousand.
The Company recognized impairment loss on certain investments in equity securities previously classified asavailable-for-sale and measured at cost and the loss was accumulated in retained earnings under IAS 39. Since those investments were designated as financial assets measured at FVOCI under IFRS 9 and no impairment assessment is required, an adjustment was made that resulted in a decrease of $1,515,525 thousand in other equity—unrealized gain or loss on financial assets at FVOCI and an increase of the $1,515,525 thousand in retained earnings on January 1, 2018.
| c) | Due to the amendments to the Regulations Governing the Preparation of Financial Reports by Securities Issuers, all derivative andnon-derivative financial assets and financial liabilities which were designated as hedging instruments are presented as hedging financial assets and hedging financial liabilities for starting from January 1, 2018. |
As the Company expects there is no tax obligation upon the disposal of theavailable-for-sale financial assets, the deferred income tax liabilities was decreased by $1,175 thousand, unrealized gain or loss onavailable-for-sale financial assets was increased by $4,283 thousand and noncontrolling interests was decreased by of $3,108 thousand, respectively.
| 2) | IFRS 15 “Revenue from Contracts with Customers” and related amendment |
IFRS 15 establishes principles for recognizing revenue that apply to all contracts with customers, and supersedes IAS 18 “Revenue”, IAS 11 “Construction Contracts” and a number of revenue-related interpretations. Please refer to Note 3 for related accounting policies.
When applying IFRS 15 and related amendments, the Company allocates the transaction price to each performance obligation identified in the contract on a relative stand-alone selling price basis.
Where the Company enters into transactions which involve both the provision of telecommunications service bundled with products such as handsets, total consideration received from products and telecommunications service in these arrangements is allocated based on each performance obligation’s relative stand-alone selling price. The amount of sales revenue recognized for products is no longer limited to the amount paid by the customer for the products. This will not change the total revenue recognized, but will change the timing of revenue recognition. The Company may recognize more revenue at the beginning of the contract period (i.e., at the time of sale of products), and revenue recognized for telecommunications service in the subsequent contract periods will decrease.
Incremental costs of obtaining contracts will be recognized as an asset to the extent the Company expects to recover those costs. Such asset will be amortized on a basis that is consistent with the transfer to the customer of the goods or services to which the asset relates. Before the application of IFRS 15, the relevant expenditures were recognized as expenses.
- 28 -
IFRS 15 and its related amendments require that when another party is involved in providing goods or services to a customer, the Company is a principal if it controls the specified good or service before that good or service is transferred to a customer. Before the application of IFRS 15, the Company determines whether it is a principal or an agent based on its exposure to the significant risks and rewards associated with the sale of goods or the rendering of services.
Under IFRS 15, the net effect of revenue recognizes, consideration received and receivable is recognized as a contract asset or a contract liability. Before the application of IFRS 15, receivable is recognized or advance receipts and deferred revenue was reduced when revenue was recognized for the contract under IAS 18.
Under IFRS 15, the Company recognized atrade-in liability (other current liabilities) and a right to recover a product (other current assets) when recognizing revenue for the sale with atrade-in right. Before the application of IFRS 15,trade-in right provisions and inventories were recognized when recognizing revenue.
The Company elected to retrospectively apply IFRS 15 to contracts that were not completed on January 1, 2018 and recognized the cumulative effect of the change in the retained earnings on January 1, 2018.
Impact on items of assets, liabilities and equity
| Carrying Amounts Before Retrospective Adjustments as of January 1, 2018 | Adjustments Arising from Initial Application | Carrying Amounts After Retrospective Adjustments as of January 1, 2018 | ||||||||||
Contract assets—current | $ | — | $ | 6,065,126 | $ | 6,065,126 | ||||||
|
|
|
| |||||||||
Trade notes and accounts receivable, net | $ | 31,941,094 | (117,911 | ) | $ | 31,823,183 | ||||||
|
|
|
| |||||||||
Inventories | $ | 8,839,615 | (132,086 | ) | $ | 8,707,529 | ||||||
|
|
|
| |||||||||
Prepayments- current | $ | 2,188,173 | (7,628 | ) | $ | 2,180,545 | ||||||
|
|
|
| |||||||||
Other current assets | $ | 2,182,758 | 132,086 | $ | 2,314,844 | |||||||
|
|
|
| |||||||||
Contract assets—noncurrent | $ | — | 3,916,924 | $ | 3,916,924 | |||||||
|
|
|
| |||||||||
Incremental costs of obtaining contracts | $ | — | 2,474,143 | $ | 2,474,143 | |||||||
|
|
|
|
|
| |||||||
Total effect on assets | $ | 12,330,654 | ||||||||||
|
| |||||||||||
Contract liabilities—current | $ | — | $ | 8,003,855 | $ | 8,003,855 | ||||||
|
|
|
| |||||||||
Current tax liabilities | $ | 4,725,698 | 2,226,691 | $ | 6,952,389 | |||||||
|
|
|
| |||||||||
Provisions—current | $ | 188,744 | (87,572 | ) | $ | 101,172 | ||||||
|
|
|
| |||||||||
Advance receipts | $ | 8,841,858 | (8,841,858 | ) | $ | — | ||||||
|
|
|
| |||||||||
Other current liabilities | $ | 1,081,156 | 71,690 | $ | 1,152,846 | |||||||
|
|
|
| |||||||||
Contract liabilities—noncurrent | $ | — | 2,626,319 | $ | 2,626,319 | |||||||
|
|
|
| |||||||||
Deferred revenue | $ | 3,612,391 | (3,612,391 | ) | $ | — | ||||||
|
|
|
| |||||||||
Other noncurrent liabilities | $ | 3,457,677 | 1,072,427 | $ | 4,530,104 | |||||||
|
|
|
|
|
| |||||||
Total effect on liabilities | $ | 1,459,161 | ||||||||||
|
| |||||||||||
Total effect on equity (unappropriated earnings) | $ | 37,202,683 | $ | 10,871,493 | $ | 48,074,176 | ||||||
|
|
|
|
|
| |||||||
- 29 -
The following table shows the increase (decrease) in assets, liabilities and equity resulting from the application of IFRS 15 on the balance sheet date.
| September 30, 2018 | ||||
Contract assets—current | $ | 5,078,820 | ||
Trade notes and accounts receivable, net | (110,153 | ) | ||
Inventories | (81,985 | ) | ||
Prepayments—current | (10,989 | ) | ||
Other current assets | 81,985 | |||
Contract assets—noncurrent | 2,313,689 | |||
Incremental costs of obtaining contracts | 1,587,709 | |||
|
| |||
Assets | $ | 8,859,076 | ||
|
| |||
Contract liabilities—current | $ | 10,392,850 | ||
Current tax liabilities | 1,481,885 | |||
Provisions—current | (53,952 | ) | ||
Advance receipts | (10,925,228 | ) | ||
Other current liabilities | 247,721 | |||
Contract liabilities—noncurrent | 2,559,789 | |||
Deferred revenue | (3,613,463 | ) | ||
Other noncurrent liabilities | 1,083,548 | |||
|
| |||
Liabilities | $ | 1,173,150 | ||
|
| |||
Equity (unappropriated earnings) | $ | 7,685,926 | ||
|
| |||
Impact on items of statement of comprehensive income for current period
The following table shows the increase (decrease) in net income resulting from the application of IFRS 15.
| Three Months Ended September 30, 2018 | Nine Months Ended September 30, 2018 | |||||||
Revenues | $ | (514,343 | ) | $ | (3,021,169 | ) | ||
Operating costs | 407,754 | 1,313,557 | ||||||
Operating expenses | (133,708 | ) | (404,353 | ) | ||||
|
|
|
| |||||
Income from operations | (788,389 | ) | (3,930,373 | ) | ||||
Income tax expense | (151,286 | ) | (744,806 | ) | ||||
|
|
|
| |||||
Net income | $ | (637,103 | ) | $ | (3,185,567 | ) | ||
|
|
|
| |||||
Decrease in net income attributable to: | ||||||||
Stockholders of the parent | $ | (637,103 | ) | $ | (3,185,567 | ) | ||
Noncontrolling interests | — | — | ||||||
|
|
|
| |||||
| $ | (637,103 | ) | $ | (3,185,567 | ) | |||
|
|
|
| |||||
Impact on earnings per share(NT$): | ||||||||
Basic earnings per share | $ | (0.08 | ) | $ | (0.41 | ) | ||
|
|
|
| |||||
Diluted earnings per share | $ | (0.08 | ) | $ | (0.41 | ) | ||
|
|
|
| |||||
- 30 -
| b. | Amendments to the Regulations Governing the Preparation of Financial Reports by Securities Issuers for application starting from 2019 and the IFRSs endorsed by the FSC |
New, Revised or Amended Standards and Interpretations | Effective Date Announced | |||
Amendments to IFRSs | Annual Improvements to IFRSs 2015-2017 Cycle | January 1, 2019 | ||
Amendments to IFRS 9 | Prepayment Features with Negative Compensation | January 1, 2019 (Note 2) | ||
IFRS 16 | Leases | January 1, 2019 | ||
Amendments to IAS 19 | Plan Amendment, Curtailment or Settlement | January 1, 2019 (Note 3) | ||
Amendments to IAS 28 | Long-term Interests in Associates and Joint Ventures | January 1, 2019 | ||
IFRIC 23 | Uncertainty over Income Tax Treatments | January 1, 2019 | ||
| Note 1: | Unless stated otherwise, the above new, amended or revised standards and interpretations are effective for annual periods beginning on or after their respective effective dates. |
| Note 2: | The FSC permits the election for early adoption of the amendments starting from 2018. |
| Note 3: | The Company shall apply these amendments to pension plan amendments, curtailments or settlements occurring on or after January 1, 2019. |
Except for the following items, the application of the above new, revised or amended standards and interpretations will not have material impact on the Company’s consolidated financial statements.
| IFRS | 16 “Leases” |
IFRS 16 sets out the accounting standards for leases that will supersede IAS 17 and a number of related interpretations.
Upon the initial application of IFRS 16, the Company anticipates reassessing whether a contract is, or contains, a lease in accordance with the definition of a lease under IFRS 16. Contracts that are reassessed as leases or containing a lease will be accounted for in accordance with the transitional provisions under IFRS 16.
Upon the initial application of IFRS 16, if the Company is a lessee, it shall recognizeright-of-use assets and lease liabilities for all leases on the consolidated balance sheets except for those whose payments underlow-value and short-term leases will be recognized as expenses on a straight-line basis. On the consolidated statements of comprehensive income, the Company will present the depreciation expense charged on theright-of-use asset separately from the interest expense accrued on lease liability using the effective interest method. On the consolidated statements of cash flows, cash payments for the principal portion of lease liability will be classified within financing activities; cash payments for interest portion will be classified within operating activities.
The Company will not make any adjustments for leases in which the Company is a lessor and will account for those leases with the application of IFRS 16 starting from January 1, 2019.
The Company anticipates applying IFRS 16 retrospectively with the cumulative effect of the initial application of IFRS 16 recognized in retained earnings on January 1, 2019. Comparative financial information will not be restated.
- 31 -
Except for the abovementioned impact, as of the date the consolidated financial statements were authorized for issue, the Company is continuously assessing the possible impact that the application of other standards and interpretations will have on the Company’s financial position and operating result, and will disclose the relevant impact when the assessment is completed.
| c. | IFRSs issued by the IASB but not yet endorsed and issued into effect by the FSC |
New, Revised or Amended Standards and Interpretations | Effective Date Announced by IASB (Note 1) | |||
Amendments to IFRS 3 | Definition of a Business | January 1, 2020 (Note 2) | ||
Amendments to IFRS 10 and IAS 28 | Sale or Contribution of Assets between An Investor and Its Associate or Joint Venture | To be determined by IASB | ||
Amendments to IAS 1 and IAS 8 | Definition of Material | January 1, 2020 (Note 3) | ||
| Note 1: | Unless stated otherwise, the above New IFRSs are effective for annual periods beginning on or after their respective effective dates. |
| Note 2: | The Company shall apply these amendments to business combinations for which the acquisition date is on or after the beginning of the first annual reporting period beginning on or after January 1, 2020 and to asset acquisitions that occur on or after the beginning of that period. |
| Note 3: | The Company shall apply these amendments prospectively in annual periods beginning on or after January 1, 2020. |
| 6. | CASH AND CASH EQUIVALENTS |
| September 30, 2018 | December 31, 2017 | September 30, 2017 | ||||||||||
Cash | ||||||||||||
Cash on hand | $ | 475,146 | $ | 382,694 | $ | 216,248 | ||||||
Bank deposits | 10,806,065 | 7,877,605 | 8,245,793 | |||||||||
|
|
|
|
|
| |||||||
| 11,281,211 | 8,260,299 | 8,462,041 | ||||||||||
|
|
|
|
|
| |||||||
Cash equivalents (investments with maturities of less than three months) | ||||||||||||
Commercial paper | 6,706,418 | 10,178,512 | 11,686,899 | |||||||||
Negotiable certificate of deposit | - | 7,950,000 | 4,150,000 | |||||||||
Time deposits | 2,337,375 | 2,436,124 | 1,167,168 | |||||||||
|
|
|
|
|
| |||||||
| 9,043,793 | 20,564,636 | 17,004,067 | ||||||||||
|
|
|
|
|
| |||||||
| $ | 20,325,004 | $ | 28,824,935 | $ | 25,466,108 | |||||||
|
|
|
|
|
| |||||||
The annual yield rates of bank deposits, commercial paper, negotiable certificate of deposit and time deposits as of balance sheet dates were as follows:
| September 30, 2018 | December 31, 2017 | September 30, 2017 | ||||||||||
Bank deposits | 0.00%-0.43% | 0.00%-0.70% | 0.00%-0.65% | |||||||||
Commercial paper | 0.36%-0.46% | 0.32%-0.40% | 0.32%-0.38% | |||||||||
Negotiable certificate of deposit | - | 0.40%-0.50% | 0.40%-0.50% | |||||||||
Time deposits | 0.40%-4.40% | 0.52%-4.40% | 0.13%-4.10% | |||||||||
- 32 -
| 7. | FINANCIAL INSTRUMENTS AT FAIR VALUE THROUGH PROFIT OR LOSS—CURRENT |
| September 30, 2018 | December 31, 2017 | September 30, 2017 | ||||||||||
Financial assets | ||||||||||||
Held for trading | ||||||||||||
Derivatives (not designated for hedge) | ||||||||||||
Forward exchange contracts | $ | — | $ | — | $ | 1,878 | ||||||
|
|
|
|
|
| |||||||
Mandatorily measured at FVTPL | ||||||||||||
Hybrid financial assets | ||||||||||||
Financial commodities | $ | 195,682 | $ | — | $ | — | ||||||
|
|
|
|
|
| |||||||
Financial liabilities | ||||||||||||
Held for trading | ||||||||||||
Derivatives (not designated for hedge) | ||||||||||||
Forward exchange contracts | $ | 619 | $ | 578 | $ | — | ||||||
|
|
|
|
|
| |||||||
Outstanding forward exchange contracts not designated for hedge as of balance sheet dates were as follows:
| Currency | Maturity Period | Contract Amount (Thousands) | ||||||||||
September 30, 2018 | ||||||||||||
Forward exchange contracts—buy | EUR/NT$ | 2018.12-2019.03 | EUR10,857/NT$386,578 | |||||||||
Forward exchange contracts—buy | US$/NT$ | 2018.10 | US$1,715/NT$52,765 | |||||||||
December 31, 2017 | ||||||||||||
Forward exchange contracts—buy | EUR/NT$ | 2018.03-06 | EUR1,942/NT$69,061 | |||||||||
Forward exchange contracts—buy | US$/NT$ | 2018.01 | US$4,190/NT$125,481 | |||||||||
September 30, 2017 | ||||||||||||
Forward exchange contracts—buy | EUR/NT$ | 2017.12 | EUR3,521/NT$124,570 | |||||||||
Forward exchange contracts—buy | US$/NT$ | 2017.10 | US$2,982/NT$89,845 | |||||||||
The Company entered into the above forward exchange contracts to manage its exposure to foreign currency risk due to fluctuations in exchange rates. However, the aforementioned derivatives did not meet the criteria for hedge accounting.
SENAO entered into financial commodities with a bank. As the contractual terms to cash flows that are not solely payments of principal and interest on the principal amount outstanding, the financial commodities are assessed and classified as mandatorily measured at FVTPL according to IFRS 9.
- 33 -
Outstanding financial commodities as of balance sheet dates were as follows:
| Currency | Maturity Period | Contract Amount (In Thousands) | ||||||||||
September 30, 2018 | ||||||||||||
Financial commodities | RMB | 2018.10 | RMB43,600 | |||||||||
| 8. | FINANCIAL ASSETS AT FAIR VALUE THROUGH OTHER COMPREHENSIVE INCOME—NONCURRENT—2018 |
| September 30, 2018 | ||||
Domestic investments | ||||
Listed stocks | $ | 2,438,505 | ||
Non-listed stocks | 4,158,471 | |||
Foreign investments | ||||
Non-listed stocks | 402,189 | |||
|
| |||
| $ | 6,999,165 | |||
|
| |||
The Company holds the above foreign and domestic stocks for medium to long-term strategic purposes and expects to profit from long-term investment. Accordingly, the management elected to designate these investments in equity instruments at FVOCI as they believe that recognizing short-term fair value fluctuations of these investments in profit or loss is not consistent with the Company’s strategy of holding these investments for long-term purposes. These investments in equity instruments were classified asavailable-for-sale financial assets under IAS 39. Refer to Notes 5, 9 and 14 for information relating to their reclassification and comparative information for 2017.
The Company recognized dividends of $164,154 thousand and $395,593 thousand from those investments held on September 30, 2018 for the three months and nine months ended September 30, 2018, respectively.
| 9. | AVAILABLE-FOR-SALE FINANCIAL ASSETS—NONCURRENT—2017 |
| December 31, 2017 | September 30, 2017 | |||||||
Equity securities | ||||||||
Listed stocks | $ | 3,125,086 | $ | 3,036,199 | ||||
|
|
|
| |||||
The Company evaluated and concluded that there was no indication thatavailable-for-sale financial assets were impaired; therefore, no impairment loss was recognized for the nine months ended September 30, 2017.
- 34 -
| 10. | TRADE NOTES AND ACCOUNTS RECEIVABLE, NET |
| September 30, 2018 | December 31, 2017 | September 30, 2017 | ||||||||||
Trade notes and accounts receivable | $ | 31,901,780 | $ | 34,058,443 | $ | 31,841,295 | ||||||
Less: Allowance doubtful account | (2,680,371 | ) | (2,117,349 | ) | (2,008,180 | ) | ||||||
|
|
|
|
|
| |||||||
| $ | 29,221,409 | $ | 31,941,094 | $ | 29,833,115 | |||||||
|
|
|
|
|
| |||||||
Nine months ended September 30, 2018
The average credit terms range from 30 to 90 days.
The Company serves a large consumer base for telecommunications business; therefore, the concentration of credit risk is limited. When having transactions with customers, the Company considers the record of arrears in the past. In addition, the Company may also collect some telecommunication charges in advance to reduce the payment arrears in subsequent periods.
The Company adopted a policy of dealing with counterparties with certain credit ratings for project business and to obtain collateral where necessary to mitigate the risk of loss arising from default. Credit rating information is provided by independent rating agencies where available and, if such credit rating information is not available, the Company uses other publicly available financial information and its own historical transaction experience to rate its major customers. The Company continues to monitor the credit exposure and credit ratings of its counterparties and spread the credit risk amongst qualified counterparties.
In order to mitigate credit risk, the management of the Company has delegated a team responsible for determining credit limits, credit approvals and other monitoring procedures to ensure the recoverability of receivables. In addition, the Company reviews the recoverable amount of receivables at balance sheet dates to ensure that adequate allowance is provided for possible irrecoverable amounts. In this regard, the management believes the Company’s credit risk could be reasonably reduced.
The Company applies the simplified approach to providing for expected credit losses prescribed by IFRS 9, which permits the use of lifetime expected loss provision for receivables. The expected credit losses on receivables are estimated using a provision matrix by reference to past default experience of the customers and an analysis of the customers’ current financial positions, as well as the forward-looking indicators such as macroeconomic business indicator.
When there are evidences indicating that the counterparty is in evasion, bankruptcy, deregistration of its company or the accounts receivable are over two years past due and the recoverable amount cannot be reasonable estimated, the Company writes off the trade notes and accounts receivable. For accounts receivable that have been written off, the Company continues to engage in enforcement activity to attempt to recover the receivables due. Where recoveries are made, these are recognized in profit or loss.
Except for receivables arising from telecommunications business and project business, the Company’s remaining accounts receivable are limited. Therefore, only Chunghwa’s provision matrix arising from telecommunications business and project business is disclosed below.
- 35 -
September 30, 2018
Not past | Past due Less than | Pass due 31 to 60 days | Pass due 61 to 90 days | Pass due 91 to 120 days | Pass due 121 | Pass due Over 181 days | Total | |||||||||||||||||||||||||
Telecommunicationsbusiness | ||||||||||||||||||||||||||||||||
Expected credit loss rate (Note a) | 0%-3% | 3%-31% | 7%-69% | 20%-82% | 34%-89% | 63%-95% | 100 | % | ||||||||||||||||||||||||
Gross carrying amount | $ | 24,156,803 | $ | 332,131 | $ | 90,556 | $ | 63,478 | $ | 42,188 | $ | 31,319 | $ | 408,482 | $ | 25,124,957 | ||||||||||||||||
Loss allowance (Lifetime ECL) | (63,567 | ) | (29,624 | ) | (28,488 | ) | (26,986 | ) | (25,471 | ) | (22,972 | ) | (408,482 | ) | (605,590 | ) | ||||||||||||||||
|
|
|
|
|
|
|
|
|
|
|
|
|
|
|
| |||||||||||||||||
Amortized cost | $ | 24,093,236 | $ | 302,507 | $ | 62,068 | $ | 36,492 | $ | 16,717 | $ | 8,347 | $ | — | $ | 24,519,367 | ||||||||||||||||
|
|
|
|
|
|
|
|
|
|
|
|
|
|
|
| |||||||||||||||||
Project business | ||||||||||||||||||||||||||||||||
Expected credit loss rate (Note b) | 0%-5% | 5 | % | 10 | % | 30 | % | 50 | % | 80 | % | 100 | % | |||||||||||||||||||
Gross carrying amount | $ | 3,018,692 | $ | 238,556 | $ | 168,881 | $ | 67,167 | $ | 44,985 | $ | 96,923 | $ | 1,653,639 | $ | 5,288,843 | ||||||||||||||||
Loss allowance (Lifetime ECL) | (173,801) | (74,098 | ) | (52,456 | ) | (20,863 | ) | (13,973 | ) | (30,105 | ) | (1,653,639 | ) | (2,018,935 | ) | |||||||||||||||||
|
|
|
|
|
|
|
|
|
|
|
|
|
|
|
| |||||||||||||||||
Amortized cost | $ | 2,844,891 | $ | 164,458 | $ | 116,425 | $ | 46,304 | $ | 31,012 | $ | 66,818 | $ | — | $ | 3,269,908 | ||||||||||||||||
|
|
|
|
|
|
|
|
|
|
|
|
|
|
|
| |||||||||||||||||
| Note a: | Please refer to Note 44 for the information of disaggregation of telecommunications service revenue. The expected credit loss rate applicable to different business revenue varies so as to reflect the risk level indicating by factors like historical experience. | |
| Note b: | The project business has different loss types according to the customer types. The expected credit loss rate listed above is for general customers. When customer is the government or its affiliates, it is expected that no credit loss will occur. For those who had bounced or exchanged checks as well as those accounts receivable were overdue more than six months that are classified as high risk customers, the expected credit loss of high risk customers is at least 50%, and the rate is increased when the overdue days increases. | |
Movements of the allowance for doubtful accounts were as follows:
| Nine Months Ended September 30, 2018 | ||||
Balance at January 1, 2018 | $ | 2,117,349 | ||
Add: Provision of impairment loss | 839,302 | |||
Less: Amounts written off | (276,280 | ) | ||
|
| |||
Balance at September 30, 2018 | $ | 2,680,371 | ||
|
| |||
Nine months ended September 30, 2017
The average credit terms range from 30 to 90 days. In determining the recoverability of trade notes and accounts receivable, the Company considers significant change in the credit quality of the trade notes and accounts receivable from the date credit was initially granted up to the end of the reporting period. In general, with few exceptional cases, it is unlikely for the notes and accounts receivable due longer than 180 days to be collected, therefore the Company recognized 100% allowance of notes and accounts receivable overdue longer than 180 days. For the notes and accounts receivable less than 180 days, the allowance for doubtful accounts was estimated based on the Company’s historical recovery experience.
The Company serves a large consumer base; therefore, the concentration of credit risk is limited.
- 36 -
The aging analysis for trade notes and accounts receivable as of balance sheet dates was as follows:
| December 31, 2017 | September 30, 2017 | |||||||
Non-overdue | $ | 30,031,885 | $ | 28,202,575 | ||||
Less than 30 days | 1,280,443 | 1,070,457 | ||||||
31-60 days | 484,795 | 392,168 | ||||||
61-90 days | 278,242 | 205,870 | ||||||
91-120 days | 253,318 | 220,896 | ||||||
121-180 days | 122,086 | 194,252 | ||||||
More than 181 days | 1,607,674 | 1,555,077 | ||||||
|
|
|
| |||||
| $ | 34,058,443 | $ | 31,841,295 | |||||
|
|
|
| |||||
The above aging analysis was based on days overdue.
At the balance sheet dates, the receivables that were past due but not impaired were considered recoverable by the management of the Company. The aging of these receivables as of balance sheet dates was as follows:
| December 31, 2017 | September 30, 2017 | |||||||
Less than 30 days | $ | 328,438 | $ | 197,209 | ||||
31-60 days | 36,253 | 32,691 | ||||||
61-90 days | 7,279 | 19,541 | ||||||
91-120 days | 69,486 | 88,741 | ||||||
121-180 days | 549 | 1,420 | ||||||
More than 181 days | 6,572 | 9,846 | ||||||
|
|
|
| |||||
| $ | 448,577 | $ | 349,448 | |||||
|
|
|
| |||||
The above aging analysis was based on days overdue.
Movements of the allowance for doubtful accounts were as follows:
| Individually Assessed for Impairment | Collectively Assessed for Impairment | Total | ||||||||||
Balance on January 1, 2017 | $ | 805,145 | $ | 967,880 | $ | 1,773,025 | ||||||
Add: Provision for (reversal of) doubtful accounts | 433,975 | (17,958 | ) | 416,017 | ||||||||
Deduct: Amounts written off | (5,544 | ) | (175,318 | ) | (180,862 | ) | ||||||
|
|
|
|
|
| |||||||
Balance on September 30, 2017 | $ | 1,233,576 | $ | 774,604 | $ | 2,008,180 | ||||||
|
|
|
|
|
| |||||||
- 37 -
| 11. | INVENTORIES |
| September 30, 2018 | December 31, 2017 | September 30, 2017 | ||||||||||
Merchandise | $ | 5,270,664 | $ | 5,133,528 | $ | 4,763,257 | ||||||
Project in process | 6,445,139 | 1,390,212 | 2,005,945 | |||||||||
Work in process | 107,311 | 151,804 | 105,670 | |||||||||
Raw materials | 113,726 | 88,726 | 91,156 | |||||||||
|
|
|
|
|
| |||||||
| 11,936,840 | 6,764,270 | 6,966,028 | ||||||||||
Land held under development | 1,998,733 | 1,998,733 | 1,998,733 | |||||||||
Construction in progress | 76,612 | 76,612 | 76,612 | |||||||||
|
|
|
|
|
| |||||||
| $ | 14,012,185 | $ | 8,839,615 | $ | 9,041,373 | |||||||
|
|
|
|
|
| |||||||
The operating costs related to inventories were $11,036,550 thousand (including the valuation loss on inventories of $86,723 thousand) and $33,648,752 thousand (including the valuation loss on inventories of $122,884 thousand) for the three months and nine months ended September 30, 2018, respectively. The operating costs related to inventories were $13,077,279 thousand (including the valuation loss on inventories of $5,072 thousand) and $38,010,811 thousand (including the valuation loss on inventories of $23,351 thousand) for the three months and nine months ended September 30, 2017, respectively.
As of September 30, 2018, December 31, 2017 and September 30, 2017, inventories of $2,075,345 thousand were expected to be recovered after more than twelve months. The aforementioned amount of inventories is related to property development owned by LED.
Land held under development and construction in progress on September 30, 2018, December 31, 2017 and September 30, 2017 was for Qingshan Sec., Dayuan Dist., Taoyuan City project developed by LED.
| 12. | PREPAYMENTS |
| September 30, 2018 | December 31, 2017 | September 30, 2017 | ||||||||||
Prepaid salary and bonus | $ | 2,668,146 | $ | — | $ | 2,651,586 | ||||||
Prepaid rents | 2,616,183 | 2,687,513 | 2,854,783 | |||||||||
Others | 3,071,831 | 3,074,005 | 3,250,840 | |||||||||
|
|
|
|
|
| |||||||
| $ | 8,356,160 | | $ | 5,761,518 | $ | 8,757,209 | ||||||
|
|
|
|
|
| |||||||
Current | ||||||||||||
Prepaid salary and bonus | $ | 2,668,146 | $ | — | $ | 2,651,586 | ||||||
Prepaid rents | 926,884 | 812,148 | 994,121 | |||||||||
Others | 1,474,463 | 1,376,025 | 1,497,238 | |||||||||
|
|
|
|
|
| |||||||
| $ | 5,069,493 | $ | 2,188,173 | $ | 5,142,945 | |||||||
|
|
|
|
|
| |||||||
Noncurrent | ||||||||||||
Prepaid rents | $ | 1,689,299 | $ | 1,875,365 | $ | 1,860,662 | ||||||
Others | 1,597,368 | 1,697,980 | 1,753,602 | |||||||||
|
|
|
|
|
| |||||||
| $ | 3,286,667 | $ | 3,573,345 | $ | 3,614,264 | |||||||
|
|
|
|
|
| |||||||
- 38 -
| 13. | OTHER CURRENT MONETARY ASSETS |
| September 30, 2018 | December 31, 2017 | September 30, 2017 | ||||||||||
Time deposits and negotiable certificates of deposit with maturities of more than three months | $ | 4,851,358 | $ | 4,053,637 | $ | 3,801,729 | ||||||
Others | 1,507,906 | 1,254,423 | 1,645,222 | |||||||||
|
|
|
|
|
| |||||||
| $ | 6,359,264 | $ | 5,308,060 | $ | 5,446,951 | |||||||
|
|
|
|
|
| |||||||
The annual yield rates of time deposits and negotiable certificates of deposit with maturities of more than three months were as follows:
| September 30, 2018 | December 31, 2017 | September 30, 2017 | ||||||||||
Time deposits and negotiable certificates of deposit with maturities of more than three months | 0.07%-2.83% | 0.06%-4.15% | 0.06%-1.95% | |||||||||
| 14. | FINANCIAL ASSETS CARRIED AT COST—2017 |
| December 31, 2017 | September 30, 2017 | |||||||
Non-listed stocks | ||||||||
Domestic | $ | 2,331,798 | $ | 1,943,465 | ||||
Foreign | 293,987 | 293,911 | ||||||
|
|
|
| |||||
| $ | 2,625,785 | $ | 2,237,376 | |||||
|
|
|
| |||||
Since the fair values of the abovenon-listed stocks investments cannot be reliably measured due to the range of reasonable fair value estimates was so significant, the abovenon-listed stocks investments owned by the Company were measured at costs less any impairment losses at the balance sheet dates.
The Company disposed financial assets carried at cost with carrying amount of $4,587 thousand and recognized the disposal gain of $2,705 thousand for the nine months ended September 30, 2017.
The Company evaluated and concluded that there was no indication that financial assets carried at cost were impaired; therefore, no impairment loss was recognized for the nine months ended September 30, 2017.
- 39 -
| 15. | SUBSIDIARIES |
| a. | Information on significant noncontrolling interest subsidiary |
| Principal Place of Business | Proportion of Ownership Interests and Voting Rights Held by Noncontrolling Interests | |||||||||||||||
| Subsidiaries | September 30, 2018 | December 31, 2017 | September 30, 2017 | |||||||||||||
SENAO | Taiwan | 72 | % | 71 | % | 71 | % | |||||||||
CHPT | Taiwan | 66 | % | 62 | % | 62 | % | |||||||||
| Profit Allocated to Noncontrolling Interests | ||||||||||||||||
| Three Months Ended September 30 | Nine Months Ended September 30 | |||||||||||||||
| 2018 | 2017 | 2018 | 2017 | |||||||||||||
SENAO | $ | 43,720 | $ | 163,229 | $ | 188,947 | $ | 444,634 | ||||||||
|
|
|
|
|
|
|
| |||||||||
CHPT | $ | 116,218 | $ | 137,477 | $ | 348,393 | $ | 369,575 | ||||||||
|
|
|
|
|
|
|
| |||||||||
| Accumulated Noncontrolling Interests | ||||||||||||
| September 30, 2018 | December 31, 2017 | September 30, 2017 | ||||||||||
SENAO | $ | 4,142,443 | $ | 4,257,408 | $ | 4,032,892 | ||||||
CHPT | 3,935,766 | 3,555,563 | 3,489,542 | |||||||||
Individually immaterial subsidiaries with noncontrolling interests | 1,708,895 | 884,624 | 790,022 | |||||||||
|
|
|
|
|
| |||||||
| $ | 9,787,104 | $ | 8,697,595 | $ | 8,312,456 | |||||||
|
|
|
|
|
| |||||||
Summarized financial information in respect of SENAO and its subsidiaries that has material noncontrolling interests is set out below. The summarized financial information below represents amounts before intercompany eliminations.
| September 30, 2018 | December 31, 2017 | September 30, 2017 | ||||||||||
Current assets | $ | 7,186,828 | $ | 7,584,225 | $ | 7,807,971 | ||||||
Noncurrent assets | 2,652,429 | 2,686,696 | 2,631,217 | |||||||||
Current liabilities | (3,994,879 | ) | (4,203,944 | ) | (4,678,326 | ) | ||||||
Noncurrent liabilities | (152,905 | ) | (160,366 | ) | (151,139 | ) | ||||||
|
|
|
|
|
| |||||||
Equity | $ | 5,691,473 | $ | 5,906,611 | $ | 5,609,723 | ||||||
|
|
|
|
|
| |||||||
Equity attributable to the parent | $ | 1,549,030 | $ | 1,649,203 | $ | 1,576,831 | ||||||
Equity attributable to noncontrolling interests | 4,142,443 | 4,257,408 | 4,032,892 | |||||||||
|
|
|
|
|
| |||||||
| $ | 5,691,473 | $ | 5,906,611 | $ | 5,609,723 | |||||||
|
|
|
|
|
| |||||||
- 40 -
| Three Months Ended September 30 | Nine Months Ended September 30 | |||||||||||||||
| 2018 | 2017 | 2018 | 2017 | |||||||||||||
Revenues and income | $ | 7,383,641 | $ | 9,100,307 | $ | 23,564,819 | $ | 26,785,736 | ||||||||
Costs and expenses | 7,322,687 | 8,870,603 | 23,297,577 | 26,157,510 | ||||||||||||
|
|
|
|
|
|
|
| |||||||||
Profit for the period | $ | 60,954 | $ | 229,704 | $ | 267,242 | $ | 628,226 | ||||||||
|
|
|
|
|
|
|
| |||||||||
Profit attributable to the parent | $ | 17,234 | $ | 66,475 | $ | 78,295 | $ | 183,592 | ||||||||
Profit attributable to noncontrolling interests | 43,720 | 163,229 | 188,947 | 444,634 | ||||||||||||
|
|
|
|
|
|
|
| |||||||||
Profit for the period | $ | 60,954 | $ | 229,704 | $ | 267,242 | $ | 628,226 | ||||||||
|
|
|
|
|
|
|
| |||||||||
Other comprehensive income (loss) attributable to the parent | $ | (3,802 | ) | $ | 1,911 | $ | 303 | $ | (4,608 | ) | ||||||
Other comprehensive income (loss) attributable to noncontrolling interests | (9,453 | ) | 4,727 | (5,318 | ) | (11,404 | ) | |||||||||
|
|
|
|
|
|
|
| |||||||||
| $ | (13,255 | ) | $ | 6,638 | $ | (5,015 | ) | $ | (16,012 | ) | ||||||
|
|
|
|
|
|
|
| |||||||||
Total comprehensive income attributable to the parent | $ | 13,432 | $ | 68,386 | $ | 78,598 | $ | 178,984 | ||||||||
Total comprehensive income attributable to noncontrolling interests | 34,267 | 167,956 | 183,629 | 433,230 | ||||||||||||
|
|
|
|
|
|
|
| |||||||||
| $ | 47,699 | $ | 236,342 | $ | 262,227 | $ | 612,214 | |||||||||
|
|
|
|
|
|
|
| |||||||||
| Nine Months Ended September 30 | ||||||||
| 2018 | 2017 | |||||||
Net cash flow from operating activities | $ | 610,363 | $ | 258,896 | ||||
Net cash flow from investing activities | (15,067 | ) | 74,396 | |||||
Net cash flow from financing activities | (470,555 | ) | (653,550 | ) | ||||
Effect of exchange rate changes on cash and cash equivalents | 299 | (2,337 | ) | |||||
|
|
|
| |||||
Net cash inflow (outflow) | $ | 125,040 | $ | (322,595 | ) | |||
|
|
|
| |||||
Dividends paid to noncontrolling interests | $ | 587,264 | $ | 703,207 | ||||
|
|
|
| |||||
- 41 -
Summarized financial information in respect of CHPT and its subsidiaries that has material noncontrolling interests is set out below. The summarized financial information below represents amounts before intercompany eliminations.
| September 30, 2018 | December 31, 2017 | September 30, 2017 | ||||||||||
Current assets | $ | 4,525,604 | $ | 4,495,601 | $ | 4,293,195 | ||||||
Noncurrent assets | 2,613,526 | 2,167,138 | 2,055,523 | |||||||||
Current liabilities | (1,152,002 | ) | (899,079 | ) | (691,749 | ) | ||||||
Noncurrent liabilities | (1,173 | ) | (997 | ) | (1,305 | ) | ||||||
|
|
|
|
|
| |||||||
Equity | $ | 5,985,955 | $ | 5,762,663 | $ | 5,655,664 | ||||||
|
|
|
|
|
| |||||||
Equity attributable to CHI | $ | 2,050,189 | $ | 2,207,100 | $ | 2,166,122 | ||||||
Equity attributable to noncontrolling interests | 3,935,766 | 3,555,563 | 3,489,542 | |||||||||
|
|
|
|
|
| |||||||
| $ | 5,985,955 | $ | 5,762,663 | �� | $ | 5,655,664 | ||||||
|
|
|
|
|
| |||||||
| Three Months Ended September 30 | Nine Months Ended September 30 | |||||||||||||||
| 2018 | 2017 | 2018 | 2017 | |||||||||||||
Revenues and income | $ | 930,947 | $ | 936,825 | $ | 2,569,646 | $ | 2,572,949 | ||||||||
Costs and expenses | 752,047 | 705,166 | 2,018,193 | 1,949,299 | ||||||||||||
|
|
|
|
|
|
|
| |||||||||
Profit for the period | $ | 178,900 | $ | 231,659 | $ | 551,453 | $ | 623,650 | ||||||||
|
|
|
|
|
|
|
| |||||||||
Profit attributable to CHI | $ | 62,682 | $ | 94,182 | $ | 203,060 | $ | 254,075 | ||||||||
Profit attributable to noncontrolling interests | 116,218 | 137,477 | 348,393 | 369,575 | ||||||||||||
|
|
|
|
|
|
|
| |||||||||
Profit for the period | $ | 178,900 | $ | 231,659 | $ | 551,453 | $ | 623,650 | ||||||||
|
|
|
|
|
|
|
| |||||||||
Other comprehensive income (loss) attributable to CHI | $ | (445 | ) | $ | 273 | $ | 35 | $ | (1,003 | ) | ||||||
Other comprehensive income (loss) attributable to noncontrolling interests | (959 | ) | 230 | (306 | ) | (1,623 | ) | |||||||||
|
|
|
|
|
|
|
| |||||||||
| $ | (1,404 | ) | $ | 503 | $ | (271 | ) | $ | (2,626 | ) | ||||||
|
|
|
|
|
|
|
| |||||||||
Total comprehensive income attributable to CHI | $ | 62,237 | $ | 94,455 | $ | 203,095 | $ | 253,072 | ||||||||
Total comprehensive income attributable to noncontrolling interests | 115,259 | 137,707 | 348,087 | 367,952 | ||||||||||||
|
|
|
|
|
|
|
| |||||||||
| $ | 177,496 | $ | 232,162 | $ | 551,182 | $ | 621,024 | |||||||||
|
|
|
|
|
|
|
| |||||||||
- 42 -
| Nine Months Ended September 30 | ||||||||
| 2018 | 2017 | |||||||
Net cash flow from operating activities | $ | 646,686 | $ | 801,716 | ||||
Net cash flow from investing activities | (510,256 | ) | (615,459 | ) | ||||
Net cash flow from financing activities | (327,890 | ) | 2,310,741 | |||||
Effect of exchange rate changes on cash and cash equivalents | 195 | (2,652 | ) | |||||
|
|
|
| |||||
Net cash inflow (outflow) | $ | (191,265 | ) | $ | 2,494,346 | |||
|
|
|
| |||||
Dividends paid to noncontrolling interests | $ | 209,711 | $ | 145,849 | ||||
|
|
|
| |||||
| b. | Equity transactions with noncontrolling interests |
SENAO transferred its treasury stock to employees in June 2017 and June 2018 and the Company’s ownership interest in SENAO decreased to 29.18% and 28.18% as of September 30, 2017 and 2018, respectively. See Note 34(b) for details.
CHI did not participate in the capital increase of CHPT in September 2017 and disposed some shares of CHPT from April to August 2018. Therefore, the Company’s ownership interest in CHPT decreased to 34.25% as of September 30, 2018. See Note 34(e) for details.
CHIEF issued new shares in March 2018 as its employees exercised their options. In addition, Chunghwa and CHI disposed some shares of CHIEF in May 2018 before CHIEF traded its shares on the General Stock Market of the Taipei Exchange according to the local requirements. Furthermore, Chunghwa and CHI did not participate in the capital increase of CHIEF in June 2018. Therefore, the Company’s equity ownership interest in CHIEF decreased to 60.28% as of September 30, 2018. See Note 34(c)(d) for details.
Chunghwa and CHI disposed some shares of CHIEF in June 2017 before CHIEF traded its shares on the emerging stock market according to the local requirements. The Company’s ownership interest in CHIEF decreased to 70.43% as of September 30, 2017.
The above transactions were accounted for as equity transactions since the Company did not cease to have control over these subsidiaries.
Information of the Company’s equity transactions with noncontrolling interests for the nine months ended September 30, 2018 and 2017 were as follows:
| Nine Months Ended September 30, 2018 | ||||||||||||||||||||
| SENAO Transferred its Treasury Stock | CHI Disposed Some Shares of CHPT | Chunghwa and CHI Did Not Participate in the Capital Increase of CHIEF | Chunghwa and CHI Disposed Some Shares of CHIEF | Share-Based Payment of CHIEF | ||||||||||||||||
Cash consideration received from noncontrolling interests | $ | 327,122 | $ | 1,041,689 | $ | 1,476,680 | $ | 132,711 | $ | 33,299 | ||||||||||
The proportionate share of the carrying amount of the net assets of the subsidiary transferred to noncontrolling interests | (273,200 | ) | (330,100 | ) | (699,899 | ) | (18,253 | ) | (21,180 | ) | ||||||||||
|
|
|
|
|
|
|
|
|
| |||||||||||
Differences arising from equity transactions | $ | 53,922 | $ | 711,589 | $ | 776,781 | $ | 114,458 | $ | 12,119 | ||||||||||
|
|
|
|
|
|
|
|
|
| |||||||||||
(Continued)
- 43 -
| Nine Months Ended September 30, 2018 | ||||||||||||||||||||
| SENAO Transferred its Treasury Stock | CHI Disposed Some Shares of CHPT | Chunghwa and CHI Did Not Participate in the Capital Increase of CHIEF | Chunghwa and CHI Disposed Some Shares of CHIEF | Share-Based Payment of CHIEF | ||||||||||||||||
Line items for equity transaction adjustments | ||||||||||||||||||||
Additionalpaid-in | $ | — | $ | 711,589 | $ | — | $ | 114,458 | $ | — | ||||||||||
|
|
|
|
|
|
|
|
|
| |||||||||||
Additionalpaid-in capital—arising from changes in equities of subsidiaries | $ | 53,922 | $ | — | $ | 776,781 | $ | — | $ | 12,119 | ||||||||||
|
|
|
|
|
|
|
|
|
| |||||||||||
(Concluded)
| Nine Months Ended September 30, 2017 | ||||||||||||
| CHI Did Not Participate in the Capital Increase of CHPT | Chunghwa and CHI Disposed Some Shares of CHIEF | SENAO Transfered its Treasury Stock | ||||||||||
Cash consideration received from noncontrolling interests | $ | 2,557,053 | $ | 105,931 | $ | 54,438 | ||||||
The proportionate share of the carrying amount of the net assets of the subsidiary transferred to noncontrolling interests | (1,753,711 | ) | (29,217 | ) | (45,121 | ) | ||||||
|
|
|
|
|
| |||||||
Differences arising from equity transactions | $ | 803,342 | $ | 76,714 | $ | 9,317 | ||||||
|
|
|
|
|
| |||||||
Line items for equity transaction adjustments | ||||||||||||
Additionalpaid-in capital—difference between consideration received or paid and the carrying amount of the subsidiaries’ net assets upon actual disposal or acquisition | $ | — | $ | 76,714 | $ | — | ||||||
|
|
|
|
|
| |||||||
Additionalpaid-in capital—arising from changes in equities of subsidiaries | $ | 803,342 | $ | — | $ | 9,317 | ||||||
|
|
|
|
|
| |||||||
- 44 -
| 16. | INVESTMENTS ACCOUNTED FOR USING EQUITY METHOD |
| September 30, 2018 | December 31, 2017 | September 30, 2017 | ||||||||||
Investments in associates | $ | 2,660,106 | $ | 2,546,374 | $ | 2,552,050 | ||||||
Investments in joint ventures | — | — | 1,897 | |||||||||
|
|
|
|
|
| |||||||
| $ | 2,660,106 | $ | 2,546,374 | $ | 2,553,947 | |||||||
|
|
|
|
|
| |||||||
| a. | Investments in associates |
Investments in associates were as follows:
| Carrying Amount | ||||||||||||
| September 30, 2018 | December 31, 2017 | September 30, 2017 | ||||||||||
Listed | ||||||||||||
Senao Networks, Inc. (“SNI”) | $ | 887,402 | $ | 862,116 | $ | 805,633 | ||||||
Non-listed | ||||||||||||
ST-2 Satellite Ventures Pte., Ltd. (“STS”) | 558,770 | 472,505 | 556,344 | |||||||||
International Integrated System, Inc. (“IISI”) | 315,475 | 296,333 | 288,283 | |||||||||
Viettel-CHT Co., Ltd.(“Viettel-CHT”) | 268,313 | 256,323 | 244,356 | |||||||||
Taiwan International Standard Electronics Co., Ltd. (“TISE”) | 149,674 | 136,885 | 121,013 | |||||||||
Skysoft Co., Ltd. (“SKYSOFT”) | 133,553 | 139,741 | 145,329 | |||||||||
KingwayTek Technology Co., Ltd. (“KWT”) | 129,449 | 128,269 | 117,464 | |||||||||
So-net Entertainment Taiwan Limited(“So-net”) | 105,820 | 104,171 | 109,526 | |||||||||
Taiwan International Ports Logistics Corporation (“TIPL”) | 47,958 | 49,631 | 50,462 | |||||||||
Click Force Co., Ltd. (“CF”) | 37,297 | 38,175 | 37,863 | |||||||||
Dian Zuan Integrating Marketing Co., Ltd. (“DZIM”) | 17,177 | 25,006 | 25,140 | |||||||||
Alliance Digital Tech Co., Ltd. (“ADT”) | 9,218 | 14,488 | 27,593 | |||||||||
HopeTech Technologies Limited (“HopeTech”) | — | 22,731 | 23,044 | |||||||||
MeWorks LIMITED (HK) (“MeWorks”) | — | — | — | |||||||||
|
|
|
|
|
| |||||||
| $ | 2,660,106 | $ | 2,546,374 | $ | 2,552,050 | |||||||
|
|
|
|
|
| |||||||
- 45 -
The percentages of ownership and voting rights in associates held by the Company as of balance sheet dates were as follows:
| % of Ownership and Voting Rights | ||||||||||||
| September 30, 2018 | December 31, 2017 | September 30, 2017 | ||||||||||
Senao Networks, Inc. (“SNI”) | 34 | 34 | 34 | |||||||||
ST-2 Satellite Ventures Pte., Ltd. (“STS”) | 38 | 38 | 38 | |||||||||
International Integrated System, Inc. (“IISI”) | 32 | 32 | 32 | |||||||||
Viettel-CHT Co., Ltd. (“Viettel-CHT”) | 30 | 30 | 30 | |||||||||
Taiwan International Standard Electronics Co., Ltd. (“TISE”) | 40 | 40 | 40 | |||||||||
Skysoft Co., Ltd. (“SKYSOFT”) | 30 | 30 | 30 | |||||||||
KingwayTek Technology Co., Ltd. (“KWT”) | 26 | 26 | 26 | |||||||||
So-net Entertainment Taiwan Limited(“So-net”) | 30 | 30 | 30 | |||||||||
Taiwan International Ports Logistics Corporation (“TIPL”) | 27 | 27 | 27 | |||||||||
Click Force Co., Ltd. (“CF”) | 49 | 49 | 49 | |||||||||
Dian Zuan Integrating Marketing Co., Ltd. (“DZIM”) | 22 | 22 | 22 | |||||||||
Alliance Digital Tech Co., Ltd. (“ADT”) | 14 | 14 | 14 | |||||||||
HopeTech Technologies Limited (“HopeTech”) | — | 45 | 45 | |||||||||
MeWorks LIMITED (HK) (“MeWorks”) | 20 | 20 | 20 | |||||||||
None of the above associates is considered individually material to the Company. Summarized financial information of associates that are not individually material was as follows:
| Three Months Ended September 30 | Nine Months Ended September 30 | |||||||||||||||
| 2018 | 2017 | 2018 | 2017 | |||||||||||||
The Company’s share of profits | $ | 137,856 | $ | 74,687 | $ | 329,528 | $ | 295,086 | ||||||||
The Company’s share of other comprehensive income (loss) | 2,263 | (132 | ) | 4,522 | (3,175 | ) | ||||||||||
|
|
|
|
|
|
|
| |||||||||
The Company’s share of total comprehensive income | $ | 140,119 | $ | 74,555 | $ | 334,050 | $ | 291,911 | ||||||||
|
|
|
|
|
|
|
| |||||||||
The Level 1 fair values based on the closing market prices of SNI as of the balance sheet dates were as follows:
| September 30, 2018 | December 31, 2017 | September 30, 2017 | ||||||||||
SNI | $ | 1,856,852 | $ | 2,130,406 | $ | 2,155,274 | ||||||
|
|
|
|
|
| |||||||
- 46 -
HopeTech returned the proceeds of $19,184 thousand as a result of capital reduction in January 2018. The Company received $3,379 thousand by disposing all shares of HopeTech in June 2018 and recognized disposal loss of $125 thousand. HopeTech engages mainly in sale of information and communication technologies products.
The Company did not participate in the capital increase of DZIM in April 2017 and the ownership interest of DZIM decreased from 26% to 22%. DZIM engages mainly in information technology service and general advertisement service.
The Company owns 14% equity shares of ADT. As the Company remains the seat in the Board of Directors of ADT and considers the relative size of ownership interest and the dispersion of shares owned by the other stockholders, the Company remains significant influence over ADT. In June 2018, the stockholders of ADT approved to dissolve. ADT engages mainly in the development of mobile payments and information processing service.
The Company’s share of profit and other comprehensive income (loss) of associates was recognized based on the reviewed financial statements.
| b. | Investments in joint ventures |
Investments in joint ventures were as follows:
| Carrying Amount | % of Ownership and Voting Rights | |||||||||||||||||||||||
| September 30, 2018 | December 31, 2017 | September 30, 2017 | September 30, 2018 | December 31, 2017 | September 30, 2017 | |||||||||||||||||||
Non-listed | ||||||||||||||||||||||||
Chunghwa Benefit One Co., Ltd. (“CBO”) | $ | — | $ | — | $ | 1,897 | — | — | 50 | |||||||||||||||
Huada Digital Corporation (“HDD”) | — | — | — | — | — | — | ||||||||||||||||||
|
|
|
|
|
| |||||||||||||||||||
| $ | — | $ | — | $ | 1,897 | |||||||||||||||||||
|
|
|
|
|
| |||||||||||||||||||
In December 2016, the stockholders of CBO approved that CBO should start its dissolution from December 31, 2016. CBO completed its liquidation in December 2017.
In March 2016, the stockholders of HDD approved that HDD should start its dissolution from March 31, 2016. HDD completed its liquidation in March 2017.
None of the above joint ventures is considered individually material to the Company. Summarized financial information of joint ventures that was not material to the Company was as follows:
| Three Months Ended September 30 | Nine Months Ended September 30 | |||||||||||||||
| 2018 | 2017 | 2018 | 2017 | |||||||||||||
The Company’s share of loss | $ | — | $ | — | $ | — | $ | (779 | ) | |||||||
The Company’s share of other comprehensive income | — | — | — | — | ||||||||||||
|
|
|
|
|
|
|
| |||||||||
The Company’s share of total comprehensive loss | $ | — | $ | — | $ | — | $ | (779 | ) | |||||||
|
|
|
|
|
|
|
| |||||||||
The Company’s share of loss of joint ventures was recorded based on the reviewed financial statements.
- 47 -
17. PROPERTY, PLANT AND EQUIPMENT
Land | Land Improvements | Buildings | Computer Equipment | Telecommuni- cations Equipment | Transportation Equipment | Miscellaneous Equipment | Construction in Progress and equipment to be accepted | Total | ||||||||||||||||||||||||||||
Cost | ||||||||||||||||||||||||||||||||||||
Balance on January 1, 2017 | $ | 103,872,069 | $ | 1,580,893 | $ | 67,737,813 | $ | 14,294,817 | $ | 715,692,476 | $ | 3,866,401 | $ | 8,942,936 | $ | 20,140,722 | $ | 936,128,127 | ||||||||||||||||||
Additions | — | — | 14,853 | 50,271 | 156,305 | 1,053 | 165,663 | 13,453,504 | 13,841,649 | |||||||||||||||||||||||||||
Disposal | (147,324 | ) | (4,701 | ) | (2,207 | ) | (685,784 | ) | (8,329,177 | ) | (39,813 | ) | (223,944 | ) | — | (9,432,950 | ) | |||||||||||||||||||
Effect of foreign exchange differences | — | — | — | (399 | ) | (139,209 | ) | (74 | ) | (3,083 | ) | (46 | ) | (142,811 | ) | |||||||||||||||||||||
Others | 312,565 | 3,107 | 4,030,646 | 246,848 | 12,845,112 | 22,974 | 480,800 | (18,068,451 | ) | (126,399 | ) | |||||||||||||||||||||||||
|
|
|
|
|
|
|
|
|
|
|
|
|
|
|
|
|
| |||||||||||||||||||
Balance on September 30, 2017 | $ | 104,037,310 | $ | 1,579,299 | $ | 71,781,105 | $ | 13,905,753 | $ | 720,225,507 | $ | 3,850,541 | $ | 9,362,372 | $ | 15,525,729 | $ | 940,267,616 | ||||||||||||||||||
|
|
|
|
|
|
|
|
|
|
|
|
|
|
|
|
|
| |||||||||||||||||||
Accumulated depreciation and impairment | ||||||||||||||||||||||||||||||||||||
Balance on January 1, 2017 | $ | — | $ | (1,248,614 | ) | $ | (25,591,288 | ) | $ | (11,581,679 | ) | $ | (596,497,180 | ) | $ | (3,237,064 | ) | $ | (6,802,542 | ) | $ | — | $ | (644,958,367 | ) | |||||||||||
Depreciation expenses | — | (37,507 | ) | (1,061,637 | ) | (905,422 | ) | (18,425,082 | ) | (268,719 | ) | (510,407 | ) | — | (21,208,774 | ) | ||||||||||||||||||||
Disposal | — | 4,688 | 2,207 | 680,581 | 8,307,862 | 39,783 | 215,438 | — | 9,250,559 | |||||||||||||||||||||||||||
Effect of foreign exchange differences | — | — | — | 180 | 35,436 | 64 | 1,387 | — | 37,067 | |||||||||||||||||||||||||||
Others | — | 1,082 | 139,329 | 11,865 | 79,217 | (7,026 | ) | (111,518 | ) | — | 112,949 | |||||||||||||||||||||||||
|
|
|
|
|
|
|
|
|
|
|
|
|
|
|
|
|
| |||||||||||||||||||
Balance on September 30, 2017 | $ | — | $ | (1,280,351 | ) | $ | (26,511,389 | ) | $ | (11,794,475 | ) | $ | (606,499,747 | ) | $ | (3,472,962 | ) | $ | (7,207,642 | ) | $ | — | $ | (656,766,566 | ) | |||||||||||
|
|
|
|
|
|
|
|
|
|
|
|
|
|
|
|
|
| |||||||||||||||||||
Balance on January 1, 2017, net | $ | 103,872,069 | $ | 332,279 | $ | 42,146,525 | $ | 2,713,138 | $ | 119,195,296 | $ | 629,337 | $ | 2,140,394 | $ | 20,140,722 | $ | 291,169,760 | ||||||||||||||||||
|
|
|
|
|
|
|
|
|
|
|
|
|
|
|
|
|
| |||||||||||||||||||
Balance on September 30, 2017, net | $ | 104,037,310 | $ | 298,948 | $ | 45,269,716 | $ | 2,111,278 | $ | 113,725,760 | $ | 377,579 | $ | 2,154,730 | $ | 15,525,729 | $ | 283,501,050 | ||||||||||||||||||
|
|
|
|
|
|
|
|
|
|
|
|
|
|
|
|
|
| |||||||||||||||||||
Cost | ||||||||||||||||||||||||||||||||||||
Balance on January 1, 2018 | $ | 104,079,190 | $ | 1,594,899 | $ | 72,694,050 | $ | 14,161,797 | $ | 722,054,435 | $ | 3,834,372 | $ | 9,514,875 | $ | 18,526,814 | $ | 946,460,432 | ||||||||||||||||||
Additions | — | — | 14,325 | 33,610 | 59,196 | 270 | 196,611 | 18,497,861 | 18,801,873 | |||||||||||||||||||||||||||
Disposal | (28,379 | ) | (337 | ) | (23 | ) | (455,245 | ) | (25,165,235 | ) | (21,047 | ) | (492,999 | ) | — | (26,163,265 | ) | |||||||||||||||||||
Effect of foreign exchange differences | — | — | — | (169 | ) | 48,787 | 37 | (809 | ) | 99 | 47,945 | |||||||||||||||||||||||||
Others | 10,488 | 3,607 | 114,883 | 218,095 | 16,366,803 | 26,787 | 415,193 | (17,151,377 | ) | 4,479 | ||||||||||||||||||||||||||
|
|
|
|
|
|
|
|
|
|
|
|
|
|
|
|
|
| |||||||||||||||||||
Balance on September 30, 2018 | $ | 104,061,299 | $ | 1,598,169 | $ | 72,823,235 | $ | 13,958,088 | $ | 713,363,986 | $ | 3,840,419 | $ | 9,632,871 | $ | 19,873,397 | $ | 939,151,464 | ||||||||||||||||||
|
|
|
|
|
|
|
|
|
|
|
|
|
|
|
|
|
| |||||||||||||||||||
Accumulated depreciation and impairment | ||||||||||||||||||||||||||||||||||||
Balance on January 1, 2018 | $ | — | $ | (1,292,527 | ) | $ | (26,798,694 | ) | $ | (11,787,847 | ) | $ | (607,154,914 | ) | $ | (3,513,529 | ) | $ | (7,205,011 | ) | $ | — | $ | (657,752,522 | ) | |||||||||||
Depreciation expenses | — | (34,760 | ) | (1,016,433 | ) | (756,705 | ) | (18,152,985 | ) | (130,657 | ) | (506,643 | ) | — | (20,598,183 | ) | ||||||||||||||||||||
Disposal | — | 337 | 23 | 444,637 | 25,139,451 | 21,013 | 486,640 | — | 26,092,101 | |||||||||||||||||||||||||||
Effect of foreign exchange differences | — | — | — | 97 | (16,907 | ) | (23 | ) | 504 | — | (16,329 | ) | ||||||||||||||||||||||||
Others | — | (18 | ) | 11,398 | (4,976 | ) | 24,402 | (4,087 | ) | (17,572 | ) | — | 9,147 | |||||||||||||||||||||||
|
|
|
|
|
|
|
|
|
|
|
|
|
|
|
|
|
| |||||||||||||||||||
Balance on September 30, 2018 | $ | — | $ | (1,326,968 | ) | $ | (27,803,706 | ) | $ | (12,104,794 | ) | $ | (600,160,953 | ) | $ | (3,627,283 | ) | $ | (7,242,082 | ) | $ | — | $ | (652,265,786 | ) | |||||||||||
|
|
|
|
|
|
|
|
|
|
|
|
|
|
|
|
|
| |||||||||||||||||||
Balance on January 1, 2018, net | $ | 104,079,190 | $ | 302,372 | $ | 45,895,356 | $ | 2,373,950 | $ | 114,899,521 | $ | 320,843 | $ | 2,309,864 | $ | 18,526,814 | $ | 288,707,910 | ||||||||||||||||||
|
|
|
|
|
|
|
|
|
|
|
|
|
|
|
|
|
| |||||||||||||||||||
Balance on September 30, 2018, net | $ | 104,061,299 | $ | 271,201 | $ | 45,019,529 | $ | 1,853,294 | $ | 113,203,033 | $ | 213,136 | $ | 2,390,789 | $ | 19,873,397 | $ | 286,885,678 | ||||||||||||||||||
|
|
|
|
|
|
|
|
|
|
|
|
|
|
|
|
|
| |||||||||||||||||||
There was no indication that property, plant and equipment was impaired so the Company did not recognize any impairment loss for the nine months ended September 30, 2018 and 2017.
Depreciation expense is computed using the straight-line method over the following estimated service lives:
Land improvements | 8-30 years | |
Buildings | ||
Main buildings | 35-60 years | |
Other building facilities | 3-20 years | |
Computer equipment | 2-8 years | |
Telecommunications equipment | ||
Telecommunication circuits | 2-30 years | |
Telecommunication machinery and antennas equipment | 2-30 years | |
Transportation equipment | 3-10 years | |
Miscellaneous equipment | ||
Leasehold improvements | 1-6 years | |
Mechanical and air conditioner equipment | 3-16 years | |
Others | 1-10 years |
- 48 -
| 18. | INVESTMENT PROPERTIES |
Cost | ||||
Balance on January 1, 2017 | $ | 9,194,652 | ||
Reclassification | (7,351 | ) | ||
|
| |||
Balance on September 30, 2017 | $ | 9,187,301 | ||
|
| |||
Accumulated depreciation and impairment | ||||
Balance on January 1, 2017 | $ | (1,080,119 | ) | |
Depreciation expense | (15,637 | ) | ||
Reclassification | 2,947 | |||
|
| |||
Balance on September 30, 2017 | $ | (1,092,809 | ) | |
|
| |||
Balance on January 1, 2017, net | $ | 8,114,533 | ||
|
| |||
Balance on September 30, 2017, net | $ | 8,094,492 | ||
|
| |||
Cost | ||||
Balance on January 1, 2018 | $ | 9,134,817 | ||
Additions | 5,627 | |||
|
| |||
Balance on September 30, 2018 | $ | 9,140,444 | ||
|
| |||
Accumulated depreciation and impairment | ||||
Balance on January 1, 2018 | $ | (1,087,024 | ) | |
Depreciation expense | (15,584 | ) | ||
|
| |||
Balance on September 30, 2018 | $ | (1,102,608 | ) | |
|
| |||
Balance on January 1, 2018, net | $ | 8,047,793 | ||
|
| |||
Balance on September 30, 2018, net | $ | 8,037,836 | ||
|
|
Depreciation expense is computed using the straight-line method over the following estimated service lives:
Land improvements | 8-30 years | |
Buildings | ||
Main buildings | 35-60 years | |
Other building facilities | 4-10 years |
The fair values of the Company’s investment properties as of December 31, 2017 and 2016 were determined by Level 3 fair value measurements inputs based on the appraisal reports conducted by independent appraisers. The Company used the aforementioned appraisal reports as the basis to determine the fair values as of September 30, 2018 and 2017 because there was no material change in the economic environment and the market transaction price. Those appraisal reports are based on the comparison approach, income approach or cost approach. Key assumptions and the fair values were as follows:
- 49 -
September 30, 2018 | December 31, 2017 | September 30, 2017 | ||||||||||
Fair value | $ | 17,728,012 | $ | 17,728,012 | $ | 17,778,228 | ||||||
|
|
|
|
|
| |||||||
Overall capital interest rate | 1.46%-2.20% | 1.46%-2.20% | 1.46%-2.20% | |||||||||
Profit margin ratio | 12%-20% | 12%-20% | 10%-20% | |||||||||
Discount rate | 1.04% | 1.04% | 1.04% | |||||||||
Capitalization rate | 0.47%-1.69% | 0.47%-1.69% | 0.43%-1.78% | |||||||||
All of the Company’s investment properties are held under freehold interest.
| 19. | INTANGIBLE ASSETS |
| 3G and 4G Concession | Computer Software | Goodwill | Others | Total | ||||||||||||||||
Cost | ||||||||||||||||||||
Balance on January 1, 2017 | $ | 59,209,000 | $ | 3,408,092 | $ | 236,200 | $ | 414,231 | $ | 63,267,523 | ||||||||||
Additions-acquired separately | — | 124,981 | — | 1,630 | 126,611 | |||||||||||||||
Disposal | — | (315,686 | ) | — | (18 | ) | (315,704 | ) | ||||||||||||
Effect of foreign exchange difference | — | (209 | ) | — | (65 | ) | (274 | ) | ||||||||||||
|
|
|
|
|
|
|
|
|
| |||||||||||
Balance on September 30, 2017 | $ | 59,209,000 | $ | 3,217,178 | $ | 236,200 | $ | 415,778 | $ | 63,078,156 | ||||||||||
|
|
|
|
|
|
|
|
|
| |||||||||||
Accumulated amortization and impairment | ||||||||||||||||||||
Balance on January 1, 2017 | $ | (13,412,712 | ) | $ | (2,413,337 | ) | $ | (18,055 | ) | $ | (69,995 | ) | $ | (15,914,099 | ) | |||||
Amortization expenses | (2,303,889 | ) | (366,218 | ) | — | (17,628 | ) | (2,687,735 | ) | |||||||||||
Disposal | — | 315,686 | — | 18 | 315,704 | |||||||||||||||
Effect of foreign exchange difference | — | 169 | — | (1 | ) | 168 | ||||||||||||||
|
|
|
|
|
|
|
|
|
| |||||||||||
Balance on September 30, 2017 | $ | (15,716,601 | ) | $ | (2,463,700 | ) | $ | (18,055 | ) | $ | (87,606 | ) | $ | (18,285,962 | ) | |||||
|
|
|
|
|
|
|
|
|
| |||||||||||
Balance on January 1, 2017, net | $ | 45,796,288 | $ | 994,755 | $ | 218,145 | $ | 344,236 | $ | 47,353,424 | ||||||||||
|
|
|
|
|
|
|
|
|
| |||||||||||
Balance on September 30, 2017, net | $ | 43,492,399 | $ | 753,478 | $ | 218,145 | $ | 328,172 | $ | 44,792,194 | ||||||||||
|
|
|
|
|
|
|
|
|
| |||||||||||
Cost | ||||||||||||||||||||
Balance on January 1, 2018 | $ | 70,144,000 | $ | 3,311,610 | $ | 236,200 | $ | 418,150 | $ | 74,109,960 | ||||||||||
Additions-acquired separately | — | 199,149 | — | 4,112 | 203,261 | |||||||||||||||
Disposal | — | (321,356 | ) | — | (58,009 | ) | (379,365 | ) | ||||||||||||
Effect of foreign exchange difference | — | 41 | — | (95 | ) | (54 | ) | |||||||||||||
|
|
|
|
|
|
|
|
|
| |||||||||||
Balance on September 30, 2018 | $ | 70,144,000 | $ | 3,189,444 | $ | 236,200 | $ | 364,158 | $ | 73,933,802 | ||||||||||
|
|
|
|
|
|
|
|
|
| |||||||||||
Accumulated amortization and impairment | ||||||||||||||||||||
Balance on January 1, 2018 | $ | (16,674,565 | ) | $ | (2,431,797 | ) | $ | (26,677 | ) | $ | (93,653 | ) | $ | (19,226,692 | ) | |||||
Amortization expenses | (2,955,280 | ) | (309,998 | ) | — | (17,204 | ) | (3,282,482 | ) | |||||||||||
Disposal | — | 321,356 | — | 58,009 | 379,365 | |||||||||||||||
Impairment losses | — | — | — | (50,750 | ) | (50,750 | ) | |||||||||||||
Effect of foreign exchange difference | — | (40 | ) | — | 21 | (19 | ) | |||||||||||||
|
|
|
|
|
|
|
|
|
| |||||||||||
Balance on September 30, 2018 | $ | (19,629,845 | ) | $ | (2,420,479 | ) | $ | (26,677 | ) | $ | (103,577 | ) | $ | (22,180,578 | ) | |||||
|
|
|
|
|
|
|
|
|
| |||||||||||
Balance on January 1, 2018, net | $ | 53,469,435 | $ | 879,813 | $ | 209,523 | $ | 324,497 | $ | 54,883,268 | ||||||||||
|
|
|
|
|
|
|
|
|
| |||||||||||
Balance on September 30, 2018, net | $ | 50,514,155 | $ | 768,965 | $ | 209,523 | $ | 260,581 | $ | 51,753,224 | ||||||||||
|
|
|
|
|
|
|
|
|
| |||||||||||
(Concluded)
- 50 -
For long-term business development, Chunghwa deposited $1,000,000 thousand as bid bond in August 2017. Chunghwa submitted an application to NCC for 4G mobile broadband license in 1.8 and 2.1 GHz frequency bands and obtained certain spectrums. Chunghwa paid the 4G concession fee amounting to $10,935,000 thousand in November 2017.
The concessions are granted and issued by the NCC. The concession fees are amortized using the straight-line method from the date operations commence through the date the license expires. The carrying amount of 3G concession fee will be fully amortized by December 2018, and 4G concession fees will be fully amortized by December 2030 and December 2033.
The computer software is amortized using the straight-line method over the estimated useful lives of 1 to 10 years. Other intangible assets are amortized using the straight-line method over the estimated useful lives of 3 to 20 years. Goodwill is not amortized.
SENAO evaluated and determined that the recoverable amount of certain licensed contract was nil and recognized the impairment loss of $50,750 thousand for the nine months ended September 30, 2018. The recoverable amount was based on the value in use. The aforementioned impairment loss was included in other income and expenses of statement of comprehensive income.
| 20. | OTHER ASSETS |
September 30, 2018 | December 31, 2017 | September 30, 2017 | ||||||||||
Spare parts | $ | 2,788,548 | $ | 2,058,769 | $ | 2,584,509 | ||||||
Refundable deposits | 1,824,679 | 1,860,364 | 1,664,858 | |||||||||
Other financial assets | 1,000,000 | 1,000,000 | 1,000,000 | |||||||||
Telecom license bid bond (Note 19) | — | — | 1,000,000 | |||||||||
Others | 2,676,820 | 2,800,112 | 2,542,659 | |||||||||
|
|
|
|
|
| |||||||
| $ | 8,290,047 | $ | 7,719,245 | $ | 8,792,026 | |||||||
|
|
|
|
|
| |||||||
Current | ||||||||||||
Spare parts | $ | 2,788,548 | $ | 2,058,769 | $ | 2,584,509 | ||||||
Others | 267,237 | 123,989 | 160,273 | |||||||||
|
|
|
|
|
| |||||||
| $ | 3,055,785 | $ | 2,182,758 | $ | 2,744,782 | |||||||
|
|
|
|
|
| |||||||
Noncurrent | ||||||||||||
Refundable deposits | $ | 1,824,679 | $ | 1,860,364 | $ | 1,664,858 | ||||||
Other financial assets | 1,000,000 | 1,000,000 | 1,000,000 | |||||||||
Telecom license bid bond | — | — | 1,000,000 | |||||||||
Others | 2,409,583 | 2,676,123 | 2,382,386 | |||||||||
|
|
|
|
|
| |||||||
| $ | 5,234,262 | $ | 5,536,487 | $ | 6,047,244 | |||||||
|
|
|
|
|
| |||||||
- 51 -
Other financial assets—noncurrent was Piping Fund. As part of the government’s effort to upgrade the existing telecommunications infrastructure, Chunghwa and other public utility companies were required by the ROC government to contribute to a Piping Fund administered by the Taipei City Government. This fund was used to finance various telecommunications infrastructure projects. Net assets of this fund will be returned proportionately after the project is completed.
| 21. | HEDGING DERIVATIVE FINANCIAL INSTRUMENTS |
2018
Chunghwa’s hedge strategy is to enter forward exchange contracts—buy to avoid its foreign currency exposure to certain foreign currency denominated equipment payments in the following six months. In addition, Chunghwa’s management considers the market condition to determine the hedge ratio and enters into forward exchange contracts with the banks to avoid the foreign currency risk.
Chunghwa signed equipment purchase contracts with suppliers and entered into forward exchange contracts to avoid foreign currency risk exposure to Euro-denominated purchase commitments. Those forward exchange contracts were designated as cash flow hedges. When forecast purchases actually take place, basis adjustments are made to the initial carrying amounts of hedged items.
For the hedges of highly probable forecast sales and purchases, as the critical terms (i.e. the notional amount, life and underlying) of the forward foreign exchange contracts and their corresponding hedged items are the same, the Company performs a qualitative assessment of effectiveness and it is expected that the value of the forward contracts and the value of the corresponding hedged items will systematically change in opposite direction in response to movements in the underlying exchange rates.
The main source of hedge ineffectiveness in these hedging relationships is the effect of credit risks of the Company and the counterparty on the fair value of the forward exchange contracts. Such credit risks does not impact the fair value of the hedged item attributable to changes in foreign exchange rates. No other sources of ineffectiveness emerged from these hedging relationships.
The following tables summarize the information relating to the hedges for foreign currency risk.
September 30, 2018
| Notional Amount | Forward | Line item in | Carrying amount | Change in fair values of hedging instruments used for calculating hedge | ||||||||||||||||||||||||||||
| Hedging instruments | Currency | (In Thousands) | Maturity | Rate | balance sheet | Asset | Liability | ineffectiveness | ||||||||||||||||||||||||
Cash flow hedge | ||||||||||||||||||||||||||||||||
Forecast purchases—forward exchange contracts | EUR/NT$ | | EUR2,500/ NT$88,583 | 2018.12 | $ | 35.43 | | Hedging financial assets (liabilities | ) | $ | 367 | $ | — | $ | 1,217 | |||||||||||||||||
Change in calculating | Accumulated gain or loss on hedging instruments in other equity | |||||||||||
| Hedged items | Continuing hedges | Hedge accounting no longer applied | ||||||||||
Cash flow hedge | ||||||||||||
Forecast equipment purchases | $ | (1,217 | ) | $ | 367 | $ | — | |||||
- 52 -
Nine months ended September 30, 2018
| Comprehensive income | ||||||||||||||||||||
| Reclassification from equity to profit or loss and the adjusted line item | ||||||||||||||||||||
| Hedge transaction | Hedging gain or loss recognized in OCI | Amount of hedge ineffectiveness recognized in profit or loss | Line item in included | Amount reclassified to P/L and the adjusted line item | Due to hedged expected to | |||||||||||||||
Cash flow hedge | ||||||||||||||||||||
Forecast equipment purchases | $ | 1,217 | $ | — | — | $ | (3,529 Construction | ) | $ | (297 Other gains and | ) | |||||||||
2017
The hedging policy of 2017 for foreign currency risk is the same as that in 2018. The hedging instrument was showed as follows:
| December 31, 2017 | September 30, 2017 | |||||||
Hedging derivative financial Assets | ||||||||
Cash flow hedge—forward exchange contracts | $ | — | $ | 537 | ||||
|
|
|
| |||||
Hedging derivative financial Liabilities | ||||||||
Cash flow hedge—forward exchange contracts | $ | 850 | $ | — | ||||
|
|
|
| |||||
For the three months and nine months ended September 30, 2017, changes in fair value of the hedged items recognized in other comprehensive income was loss of $521 thousand and gain of $1,124 thousand, respectively. Upon the completion of the purchase transaction, the amount deferred and recognized in equity initially will be reclassified into equipment as its carrying value.
No reclassification was made from equity to profit or loss for the nine months ended September 30, 2017.
The outstanding forward exchange contracts at the balance sheet dates were as follows:
| Currency | Maturity Period | Contract Amount (Thousands) | ||||||||||
December 31, 2017 | ||||||||||||
Forward exchange contracts—buy | EUR/NT$ | 2018.03-06 | EUR3,963/NT$ | 141,605 | ||||||||
September 30, 2017 | ||||||||||||
Forward exchange contracts—buy | EUR/NT$ | 2017.12-2018.03 | EUR6,741/NT$ | 240,803 | ||||||||
- 53 -
Gain (losses) arising from the hedging derivative financial instruments that have been reclassified from equity to initial cost of the property, plant and equipment were as follows:
| Three Months Ended September 30, 2017 | Nine Months Ended September 30, 2017 | |||||||
Construction in progress and equipment to be accepted | $ | 8,000 | $ | 3,584 | ||||
|
|
|
| |||||
| 22. | SHORT-TERM LOANS |
| September 30, 2018 | December 31, 2017 | September 30, 2017 | ||||||||||
Secured loans (Note 40) | $ | — | $ | — | $ | 33,000 | ||||||
Unsecured loans | 120,000 | 70,000 | 390,000 | |||||||||
|
|
|
|
|
| |||||||
| $ | 120,000 | $ | 70,000 | $ | 423,000 | |||||||
|
|
|
|
|
| |||||||
The annual interest rates of loans were as follows:
September 30, 2018 | December 31, 2017 | September 30, 2017 | ||||
Secured loans | — | — | 1.98%-2.28% | |||
Unsecured loans | 1.35%-2.35% | 2.15%-2.19% | 0.80%-2.19% |
| 23. | LONG-TERM LOANS (INCLUDING LONG-TERM LOANS—CURRENT PORTION) |
| September 30, 2018 | December 31, 2017 | September 30, 2017 | ||||||||||
Secured loans (Note 40) | $ | 1,600,000 | $ | 1,600,000 | $ | 1,600,000 | ||||||
Less: Current portion of long-term loans | — | — | (1,600,000 | ) | ||||||||
|
|
|
|
|
| |||||||
| $ | 1,600,000 | $ | 1,600,000 | $ | — | |||||||
|
|
|
|
|
| |||||||
The annual interest rates of loans were as follows:
| September 30, 2018 | December 31, 2017 | September 30, 2017 | ||||||||||
Secured loans | 0.92 | % | 0.91 | % | 0.91 | % | ||||||
LED obtained a secured loan from Chang Hwa Bank in September 2010. Interest is paid monthly. $300,000 thousand and $1,350,000 thousand were originally due in December 2014 and September 2015, respectively. In October 2014, the bank borrowing mentioned above was extended to September 2018 for one time repayment. LED made an early repayment of $50,000 thousand in April 2015. LED entered into a contract with Chang Hwa Bank to renew the contract upon the maturity of the aforementioned contract in December 2017 and the due date of the renew contract is September 2021.
- 54 -
| 24. | TRADE NOTES AND ACCOUNTS PAYABLE |
| September 30, 2018 | December 31, 2017 | September 30, 2017 | ||||||||||
Trade notes and accounts payable | $ | 20,546,011 | $ | 19,395,889 | $ | 17,643,423 | ||||||
|
|
|
|
|
| |||||||
Trade notes and accounts payable were attributable to operating activities and the trading conditions were agreed separately.
| 25. | OTHER PAYABLES |
September 30, 2018 | December 31, 2017 | September 30, 2017 | ||||||||||
Accrued salary and compensation | $ | 6,872,977 | $ | 9,748,433 | $ | 7,671,521 | ||||||
Payables to equipment suppliers | 1,818,405 | 1,689,685 | 839,758 | |||||||||
Accrued compensation to employees and remuneration to directors and supervisors | 1,405,065 | 1,948,821 | 1,525,561 | |||||||||
Payables to contractors | 1,384,653 | 2,057,651 | 912,217 | |||||||||
Amounts collected for others | 1,173,806 | 1,202,933 | 1,217,281 | |||||||||
Accrued maintenance costs | 1,020,974 | 1,081,473 | 995,299 | |||||||||
Accrued franchise fees | 871,167 | 1,248,010 | 944,173 | |||||||||
Others | 6,341,290 | 6,024,395 | 6,225,898 | |||||||||
|
|
|
|
|
| |||||||
| $ | 20,888,337 | $ | 25,001,401 | $ | 20,331,708 | |||||||
|
|
|
|
| �� | |||||||
| 26. | PROVISIONS |
September 30, 2018 | December 31, 2017 | September 30, 2017 | ||||||||||
Warranties | $ | 129,056 | $ | 131,789 | $ | 135,226 | ||||||
Employee benefits | 46,047 | 43,429 | 40,995 | |||||||||
Trade-in right | — | 87,572 | 33,764 | |||||||||
Others | 4,447 | 4,467 | 4,417 | |||||||||
|
|
|
|
|
| |||||||
| $ | 179,550 | $ | 267,257 | $ | 214,402 | |||||||
|
|
|
|
|
| |||||||
Current | $ | 104,880 | $ | 188,744 | $ | 146,151 | ||||||
Noncurrent | 74,670 | 78,513 | 68,251 | |||||||||
|
|
|
|
|
| |||||||
| $ | 179,550 | $ | 267,257 | $ | 214,402 | |||||||
|
|
|
|
|
| |||||||
- 55 -
| Warranties | Employee Benefits | Trade-in right | Others | Total | ||||||||||||||||
Balance on January 1, 2017 | $ | 110,975 | $ | 38,014 | $ | 31,378 | $ | 4,447 | $ | 184,814 | ||||||||||
Additional provisions recognized | 67,140 | 4,619 | 10,462 | — | 82,221 | |||||||||||||||
Used / forfeited during the period | (42,889 | ) | (1,638 | ) | (8,076 | ) | (30 | ) | (52,633 | ) | ||||||||||
|
|
|
|
|
|
|
|
|
| |||||||||||
Balance on September 30, 2017 | $ | 135,226 | $ | 40,995 | $ | 33,764 | $ | 4,417 | $ | 214,402 | ||||||||||
|
|
|
|
|
|
|
|
|
| |||||||||||
Balance on January 1, 2018 | $ | 131,789 | $ | 43,429 | $ | 87,572 | $ | 4,467 | $ | 267,257 | ||||||||||
Effect of retrospective application of IFRS 15 | — | — | (87,572 | ) | — | (87,572 | ) | |||||||||||||
|
|
|
|
|
|
|
|
|
| |||||||||||
Balance on January 1, 2018 as adjusted | 131,789 | 43,429 | — | 4,467 | 179,685 | |||||||||||||||
Additional provisions recognized | 135,558 | 3,834 | — | 80 | 139,472 | |||||||||||||||
Used / forfeited during the period | (138,291 | ) | (1,216 | ) | — | (100 | ) | (139,607 | ) | |||||||||||
|
|
|
|
|
|
|
|
|
| |||||||||||
Balance on September 30, 2018 | $ | 129,056 | $ | 46,047 | $ | — | $ | 4,447 | $ | 179,550 | ||||||||||
|
|
|
|
|
|
|
|
|
| |||||||||||
(Concluded)
| a. | The provision for warranties claims represents the present value of the management’s best estimate of the future outflow of economic benefits that will be required under the Company’s obligation for warranties in sales agreements. The estimate has been made based on the historical warranty experience. |
| b. | The provision for employee benefits represents vested long-term service compensation accrued. |
| c. | The provision fortrade-in right in 2017 was based on the management’s judgments to estimate thetrade-in right of products exercised by customers in the future. The provision was recognized as a reduction of revenue in the period in which the goods are sold. |
| 27. | ADVANCE RECEIPTS |
Advance receipts are mainly from advance telecommunication charges. For those obliged to transfer good and service in order to collect consideration from customer, they were retrospectively reclassified as contract liabilities starting from 2018. In accordance with NCC’s regulation named “Mandatory and Prohibitory Provisions To Be Included In Standard Contracts for Telecommunication Goods (Services) Coupons”, the Company entered into a contract with Bank of Taiwan to provide a performance guarantee for advance receipts from selling prepaid cards amounting to $624,373 thousand as of September 30, 2018.
| 28. | RETIREMENT BENEFIT PLANS |
According to the Article 56 of the Labor Standards Law revised in February 2015, entities are required to contribute the difference in one appropriation to their pension funds before the end of next March when the balance of the Funds is insufficient to pay the eligible employees who meet the retirement criteria in the following year. Chunghwa contributed $2,118,583 thousand and $337,686 thousand to its pension fund as of March 31, 2018 and 2017, respectively.
- 56 -
Relevant pension costs for defined benefit plans which were determined by the pension cost rates of actuarial valuation as of December 31, 2017 and 2016 were as follows:
| Three Months Ended September 30 | Nine Months Ended September 30 | |||||||||||||||
| 2018 | 2017 | 2018 | 2017 | |||||||||||||
Operating costs | $ | 448,462 | $ | 433,592 | $ | 1,346,614 | $ | 1,300,940 | ||||||||
Marketing expenses | 221,238 | 211,716 | 665,283 | 635,101 | ||||||||||||
General and administrative expenses | 41,375 | 38,968 | 122,639 | 116,623 | ||||||||||||
Research and development expenses | 27,064 | 24,191 | 80,466 | 72,766 | ||||||||||||
|
|
|
|
|
|
|
| |||||||||
| $ | 738,139 | $ | 708,467 | $ | 2,215,002 | $ | 2,125,430 | |||||||||
|
|
|
|
|
|
|
| |||||||||
| 29. | EQUITY |
| a. | Share capital |
| 1) | Common stocks |
September 30, 2018 | December 31, 2017 | September 30, 2017 | ||||||||||
Number of authorized shares (thousand) | 12,000,000 | 12,000,000 | 12,000,000 | |||||||||
|
|
|
|
|
| |||||||
Authorized shares | $ | 120,000,000 | $ | 120,000,000 | $ | 120,000,000 | ||||||
|
|
|
|
|
| |||||||
Number of issued and paid shares (thousand) | 7,757,447 | 7,757,447 | 7,757,447 | |||||||||
|
|
|
|
|
| |||||||
Issued shares | $ | 77,574,465 | $ | 77,574,465 | $ | 77,574,465 | ||||||
|
|
|
|
|
| |||||||
The issued common stocks of a par value at $10 per share entitled the right to vote and receive dividends.
| 2) | Global depositary receipts |
The MOTC and some stockholders sold some common stocks of Chunghwa in an international offering of securities in the form of American Depositary Shares (“ADS”) (one ADS represents 10 common stocks) in July 2003, August 2005, and September 2006. The ADSs were traded on the New York Stock Exchange since July 17, 2003. As of September 30, 2018, the outstanding ADSs were 234,085 thousand common stocks, which equaled 23,408 thousand units and represented 3.01% of Chunghwa’s total outstanding common stocks.
The ADS holders generally have the same rights and obligations as other common stockholders, subject to the provision of relevant laws. The exercise of such rights and obligations shall comply with the related regulations and deposit agreement, which stipulate, among other things, that ADS holders are entitled to, through deposit agents:
| a) | Exercise their voting rights, |
| b) | Sell their ADSs, and |
| c) | Receive dividends declared and subscribe to the issuance of new shares. |
- 57 -
| b. | Additionalpaid-in capital |
The adjustments of additionalpaid-in capital for the nine months ended September 30, 2018 and 2017 were as follows:
| Share Premium | Movements of Additional Paid-in Capital for Associates and Joint Ventures Accounted for Using Equity Method | Movements of Additional Paid-in Capital Arising from Changes in Equities of Subsidiaries | Difference between Consideration Received and Carrying Amount of the Subsidiaries’ Net Assets upon Disposal | Donated Capital | Stockholders’ Contribution Due to Privatization | Total | ||||||||||||||||||||||
Balance on January 1, 2017 | $ | 147,329,386 | $ | 76,972 | $ | 390,030 | $ | 84,850 | $ | 13,170 | $ | 20,648,078 | $ | 168,542,486 | ||||||||||||||
Change in additionalpaid-in capital from investments in associates and joint ventures accounted for using equity method | — | 12,523 | — | — | — | — | 12,523 | |||||||||||||||||||||
Partial disposal of interests in subsidiaries | — | — | — | 76,714 | — | — | 76,714 | |||||||||||||||||||||
Treasury stock transfer of subsidiaries | — | — | 9,317 | — | — | — | 9,317 | |||||||||||||||||||||
Change in additionalpaid-in capital for not participating in the capital increase of subsidiaries | — | — | 803,342 | — | — | — | 803,342 | |||||||||||||||||||||
Share-based payment transactions of subsidiaries | — | — | 2,074 | — | — | — | 2,074 | |||||||||||||||||||||
|
|
|
|
|
|
|
|
|
|
|
|
|
| |||||||||||||||
Balance on September 30, 2017 | $ | 147,329,386 | $ | 89,495 | $ | 1,204,763 | $ | 161,564 | $ | 13,170 | $ | 20,648,078 | $ | 169,446,456 | ||||||||||||||
|
|
|
|
|
|
|
|
|
|
|
|
|
| |||||||||||||||
Balance on January 1, 2018 | $ | 147,329,386 | $ | 90,937 | $ | 1,221,046 | $ | 161,243 | $ | 16,193 | $ | 20,648,078 | $ | 169,466,883 | ||||||||||||||
Unclaimed dividend | — | — | — | — | 2,481 | — | 2,481 | |||||||||||||||||||||
Change in additionalpaid-in capital from investments in associates and joint ventures accounted for using equity method | — | 1 | — | — | — | — | 1 | |||||||||||||||||||||
Partial disposal of interests in subsidiaries | — | — | — | 826,047 | — | — | 826,047 | |||||||||||||||||||||
Change in additionalpaid-in capital for not participating in the capital increase of subsidiaries | — | — | 776,781 | — | — | — | 776,781 | |||||||||||||||||||||
Share-based payment transactions of subsidiaries | — | — | 12,119 | — | — | — | 12,119 | |||||||||||||||||||||
Treasury stock transfer of subsidiaries | — | — | 53,922 | — | — | — | 53,922 | |||||||||||||||||||||
|
|
|
|
|
|
|
|
|
|
|
|
|
| |||||||||||||||
Balance on September 30, 2018 | $ | 147,329,386 | $ | 90,938 | $ | 2,063,868 | $ | 987,290 | $ | 18,674 | $ | 20,648,078 | $ | 171,138,234 | ||||||||||||||
|
|
|
|
|
|
|
|
|
|
|
|
|
| |||||||||||||||
Additionalpaid-in capital from share premium, donated capital and the difference between consideration received and the carrying amount of the subsidiaries’ net assets upon disposal may be utilized to offset deficits. Furthermore, when Chunghwa has no deficit, it may be distributed in cash or capitalized, which however is limited to a certain percentage of Chunghwa’spaid-in capital except the additionalpaid-in capital arising from claimed dividend can only be utilized to offset deficits.
The additionalpaid-in capital from movements ofpaid-in capital arising from changes in equities of subsidiaries may only be utilized to offset deficits.
Among additionalpaid-in capital from movements of investments in associates and joint ventures accounted for using equity method, the portion arising from the difference between consideration received and the carrying amount of the subsidiaries net assets upon disposal may be utilized to offset deficits; furthermore, when the Company has no deficit, it may be distributed in cash or capitalized. However, other additionalpaid-in capital recognized in proportion of share ownership may only be utilized to offset deficits.
- 58 -
| c. | Retained earnings and dividends policy |
In accordance with the Chunghwa’s Articles of Incorporation, Chunghwa must pay all outstanding taxes, offset deficits in prior years and set aside a legal reserve equal to 10% of its net income before distributing a dividend or making any other distribution to stockholders, except when the accumulated amount of such legal reserve equals to Chunghwa’s total issued capital, and depending on its business needs or requirements, may also set aside or reverse special reserves. No less than 50% of the remaining earnings comprising remaining balance of net income, if any, plus cumulative undistributed earnings shall be distributed as stockholders’ dividends, of which cash dividends to be distributed shall not be less than 50% of the total amount of dividends to be distributed. If cash dividend to be distributed is less than $0.10 per share, such cash dividend shall be distributed in the form of common stocks.
Chunghwa should appropriate or reverse a special reserve in accordance with Rule No. 1010012865 and Rule No. 1010047490 issued by the FSC and the directive entitled “Questions and Answers on Special Reserves Appropriated Following the Adoption of Taiwan-IFRSs”. Distributions can be made out of any subsequent reversal of the debit to other equity items.
The appropriation for legal reserve shall be made until the accumulated reserve equals the aggregate par value of the outstanding capital stock of Chunghwa. This reserve can only be used to offset a deficit, or, when the legal reserve has exceeded 25% of Chunghwa’spaid-in capital, the excess may be transferred to capital or distributed in cash.
The appropriations of the 2017 and 2016 earnings of Chunghwa approved by the stockholders in their meetings on June 15, 2018 and June 23, 2017 were as follows:
| Appropriation of Earnings | Dividends Per Share (NT$) | |||||||||||||||
| For Fiscal Year 2017 | For Fiscal Year 2016 | For Fiscal Year 2017 | For Fiscal Year 2016 | |||||||||||||
Provision for (reversal of) special reserve | $ | (5,404 | ) | $ | 5,404 | |||||||||||
Cash dividends | 37,204,714 | 38,336,525 | $ | 4.796 | $ | 4.9419 | ||||||||||
Information of the appropriation of Chunghwa’s earnings proposed by the Board of Directors and approved by the stockholders is available on the Market Observation Post System website.
| d. | Other adjustments |
| 1) | Exchange differences arising from the translation of the foreign operations |
The exchange differences arising from the translation of the foreign operations from their functional currency to New Taiwan dollars were recognized as exchange differences arising from the translation of the foreign operations in other comprehensive income.
| 2) | Unrealized gain or loss onavailable-for-sale financial assets |
Balance on January 1, 2017 | $ | (50,885 | ) | |
Unrealized gain or loss onavailable-for-sale financial assets | 516,499 | |||
Income tax relating to unrealized gain or loss on available-for-sale financial assets | 1,827 | |||
|
| |||
Balance on September 30, 2017 | $ | 467,441 | ||
|
| |||
Balance on January 1, 2018 under IAS 39 | $ | 558,109 | ||
Effect of retrospective application of IFRS 9 | (558,109 | ) | ||
|
| |||
Balance on January 1, 2018 under IFRS 9 | $ | — | ||
|
|
(Concluded)
- 59 -
| 3) | Unrealized gain or loss on financial assets at FVOCI |
| Nine Months Ended September 30 2018 | ||||
Balance on January 1, 2018 under IAS 39 | $ | — | ||
Effect of retrospective application of IFRS 9 | 883,420 | |||
|
| |||
Balance on January 1, 2018 under IFRS 9 | 883,420 | |||
Unrealized gain or loss for the period Equity instruments | (826,439 | ) | ||
|
| |||
Balance on September 30, 2018 | $ | 56,981 | ||
|
| |||
| e. | Noncontrolling interests |
| Nine Months Ended September 30 | ||||||||
| 2018 | 2017 | |||||||
Beginning balance | $ | 8,697,595 | $ | 6,495,922 | ||||
Effect of retrospective application | (3,945 | ) | — | |||||
|
|
|
| |||||
Beginning balance as adjusted | 8,693,650 | 6,495,922 | ||||||
Shares attributed to noncontrolling interests | ||||||||
Net incomme for the period | 689,937 | 928,973 | ||||||
Exchange differences arising from the translation of the foreign operations | (6,683 | ) | (12,951 | ) | ||||
Unrealized gain or loss on financial assets at FVOCI | 1,807 | — | ||||||
Unrealized gain (loss) onavailable-for-sale financial assets | — | (1,327 | ) | |||||
Income tax relating to unrealized gain or loss onavailable-for-sale financial assets | — | 226 | ||||||
Income tax relating to remeasurments of defined benefit pension plans | 1,509 | — | ||||||
Share of other comprehensive income (loss) of associates accounted for using equity method | 555 | (1,695 | ) | |||||
Cash dividends distributed by subsidiaries | (958,446 | ) | (942,482 | ) | ||||
Changes in additionalpaid-in capital from investments in associates and joint ventures accounted for using equity method | 203 | 1,916 | ||||||
Partial disposal of interests in subsidiaries | 348,353 | 29,217 | ||||||
Change in additionalpaid-in capital for not participating in the capital increase of subsidiaries | 699,899 | 1,753,711 | ||||||
Share-based payment transactions of subsidiaries | 38,120 | 15,825 | ||||||
Increase in noncontrolling interests | 278,200 | 45,121 | ||||||
|
|
|
| |||||
Ending balance | $ | 9,787,104 | $ | 8,312,456 | ||||
|
|
|
| |||||
- 60 -
| 30. | REVENUES |
| Three Months Ended September 30 | Nine Months Ended September 30 | |||||||||||||||
| 2018 | 2017 | 2018 | 2017 | |||||||||||||
Revenue from contracts with customers | $ | 52,410,781 | $ | 56,151,787 | $ | 159,309,639 | $ | 165,864,651 | ||||||||
|
|
|
|
|
|
|
| |||||||||
Other revenues | ||||||||||||||||
Rental income | 171,658 | 177,100 | 486,927 | 489,203 | ||||||||||||
Other | 122,446 | 96,016 | 199,036 | 275,590 | ||||||||||||
|
|
|
|
|
|
|
| |||||||||
| 294,104 | 273,116 | 685,963 | 764,793 | |||||||||||||
|
|
|
|
|
|
|
| |||||||||
| $ | 52,704,885 | $ | 56,424,903 | $ | 159,995,602 | $ | 166,629,444 | |||||||||
|
|
|
|
|
|
|
| |||||||||
The information of performance obligations in customer contracts, please refer to Note 3 Summary of Significant Accounting Policies for details.
| a. | Disaggregation of revenue |
The main source of revenue of the Company includes various telecommunications services in different streams, the information of disaggregation of revenue please refer to Note 44.
| b. | Contract balances |
| September 30, 2018 | ||||
Trade notes and accounts receivable (Note 10) | $ | 29,221,409 | ||
|
| |||
Contract assets | ||||
Sale of products | $ | 7,282,941 | ||
Other | 109,568 | |||
|
| |||
| $ | 7,392,509 | |||
|
| |||
Current | $ | 5,078,820 | ||
Non-current | 2,313,689 | |||
|
| |||
| $ | 7,392,509 | |||
|
| |||
Contract liabilities | ||||
Telecommunications business | $ | 8,614,160 | ||
Project business | 3,832,921 | |||
Other | 505,558 | |||
|
| |||
| $ | 12,952,639 | |||
|
| |||
Current | $ | 10,392,850 | ||
Non-current | 2,559,789 | |||
|
| |||
| $ | 12,952,639 | |||
|
| |||
The changes in the contract asset and the contract liability balances primarily result from the timing difference between the fulfillment of performance obligations and the payments collected from customers.
- 61 -
Revenue recognized for the period that was included in the contract liability at the beginning of the period was as follows:
| Nine Months Ended September 30, 2018 | ||||
Telecommunications business | $ | 3,614,478 | ||
Project business | 396,236 | |||
Other | 445,148 | |||
|
| |||
| $ | 4,455,862 | |||
|
| |||
| c. | Incremental costs of obtaining contracts |
| September 30, 2018 | ||||
Noncurrent | ||||
Incremental costs of obtaining contracts | $ | 1,587,709 | ||
|
| |||
The Company considered the past experience and the default clauses in the telecommunications service contract and believes the commissions and equipment subsidy paid for obtaining contracts are expected to be recoverable; therefore, incremental costs of obtaining contracts are recognized as an asset. Amortization recognized in the three months and nine months ended September 30, 2018 are $420,817 thousand and $1,519,228 thousand, respectively.
| 31. | NET INCOME AND OTHER COMPREHENSIVE INCOME (LOSS) |
| a. | Net income |
| 1) | Other income and expenses |
| Three Months Ended September 30 | Nine Months Ended September 30 | |||||||||||||||
| 2018 | 2017 | 2018 | 2017 | |||||||||||||
Loss on disposal of property, plant and equipment | $ | (8,753 | ) | $ | (16,875 | ) | $ | (38,503 | ) | $ | (33,620 | ) | ||||
Impairment loss on intangible assets | — | — | (50,750 | ) | — | |||||||||||
|
|
|
|
|
|
|
| |||||||||
| $ | (8,753 | ) | $ | (16,875 | ) | $ | (89,253 | ) | $ | (33,620 | ) | |||||
|
|
|
|
|
|
|
| |||||||||
- 62 -
| 2) | Other income |
| Three Months Ended September 30 | Nine Months Ended September 30 | |||||||||||||||
| 2018 | 2017 | 2018 | 2017 | |||||||||||||
Dividend income | $ | 164,154 | $ | 16,124 | $ | 395,593 | $ | 327,861 | ||||||||
Rental income | 14,610 | 14,502 | 49,218 | 40,067 | ||||||||||||
Others | 88,778 | 99,426 | 180,359 | 266,375 | ||||||||||||
|
|
|
|
|
|
|
| |||||||||
| $ | 267,542 | $ | 130,052 | $ | 625,170 | $ | 634,303 | |||||||||
|
|
|
|
|
|
|
| |||||||||
| 3) | Other gains and losses |
| Three Months Ended September 30 | Nine Months Ended September 30 | |||||||||||||||
| 2018 | 2017 | 2018 | 2017 | |||||||||||||
Net foreign currency exchange gains (losses) | $ | 2,191 | $ | (67,541 | ) | $ | 6,011 | $ | (58,933 | ) | ||||||
Gains on disposal of financial instruments | — | — | 5,763 | 2,705 | ||||||||||||
Valuation gains (losses) on financial assets and liabilities at fair value through profit or loss, net | 4,428 | (4,946 | ) | 4,666 | 3,234 | |||||||||||
Losses on disposal of investments accounted for using equity method | — | — | (125 | ) | — | |||||||||||
Others | (10,390 | ) | (12,475 | ) | (40,884 | ) | (31,990 | ) | ||||||||
|
|
|
|
|
|
|
| |||||||||
| $ | (3,771 | ) | $ | (84,962 | ) | $ | (24,569 | ) | $ | (84,984 | ) | |||||
|
|
|
|
|
|
|
| |||||||||
| 4) | Impairment loss |
| Three Months Ended September 30 | Nine Months Ended September 30 | |||||||||||||||
| 2018 | 2017 | 2018 | 2017 | |||||||||||||
Contract assets | $ | 19,410 | $ | — | $ | 19,410 | $ | — | ||||||||
|
|
|
|
|
|
|
| |||||||||
Trade notes and accounts receivable | $ | 106,266 | $ | 37,643 | $ | 839,302 | $ | 416,017 | ||||||||
|
|
|
|
|
|
|
| |||||||||
Other receivables | $ | 30,140 | $ | 33,173 | $ | 65,069 | $ | 45,747 | ||||||||
|
|
|
|
|
|
|
| |||||||||
Inventories | $ | 86,723 | $ | 5,072 | $ | 122,884 | $ | 23,351 | ||||||||
|
|
|
|
|
|
|
| |||||||||
Intangible assets | $ | — | $ | — | $ | 50,750 | $ | — | ||||||||
|
|
|
|
|
|
|
| |||||||||
- 63 -
| 5) | Depreciation and amortization expenses |
| Three Months Ended September 30 | Nine Months Ended September 30 | |||||||||||||||
| 2018 | 2017 | 2018 | 2017 | |||||||||||||
Property, plant and equipment | $ | 6,849,673 | $ | 6,914,720 | $ | 20,598,183 | $ | 21,208,774 | ||||||||
Investment properties | 5,194 | 5,194 | 15,584 | 15,637 | ||||||||||||
Intangible assets | 1,107,595 | 887,721 | 3,282,482 | 2,687,735 | ||||||||||||
Incremental costs of obtaining contracts | 420,817 | — | 1,519,228 | — | ||||||||||||
|
|
|
|
|
|
|
| |||||||||
Total depreciation and amortization expenses | $ | 8,383,279 | $ | 7,807,635 | $ | 25,415,477 | $ | 23,912,146 | ||||||||
|
|
|
|
|
|
|
| |||||||||
Depreciation expenses summarized by functions | ||||||||||||||||
Operating costs | $ | 6,493,284 | $ | 6,497,607 | $ | 19,474,658 | $ | 19,872,319 | ||||||||
Operating expenses | 361,583 | 422,307 | 1,139,109 | 1,352,092 | ||||||||||||
|
|
|
|
|
|
|
| |||||||||
| $ | 6,854,867 | $ | 6,919,914 | $ | 20,613,767 | $ | 21,224,411 | |||||||||
|
|
|
|
|
|
|
| |||||||||
Amortization expenses summarized by functions | ||||||||||||||||
Operating costs | $ | 1,470,665 | $ | 817,938 | $ | 4,612,851 | $ | 2,464,137 | ||||||||
Marketing expenses | 24,601 | 36,512 | 89,916 | 116,931 | ||||||||||||
General and administrative expenses | 23,551 | 24,763 | 71,730 | 79,852 | ||||||||||||
Research and development expenses | 9,595 | 8,508 | 27,213 | 26,815 | ||||||||||||
|
|
|
|
|
|
|
| |||||||||
| $ | 1,528,412 | $ | 887,721 | $ | 4,801,710 | $ | 2,687,735 | |||||||||
|
|
|
|
|
|
|
| |||||||||
| 6) | Employee benefit expenses |
| Three Months Ended September 30 | Nine Months Ended September 30 | |||||||||||||||
| 2018 | 2017 | 2018 | 2017 | |||||||||||||
Post-employment benefit | ||||||||||||||||
Defined contribution plans | $ | 162,010 | $ | 150,291 | $ | 473,853 | $ | 441,865 | ||||||||
Defined benefit plans | 738,139 | 708,467 | 2,215,002 | 2,125,430 | ||||||||||||
|
|
|
|
|
|
|
| |||||||||
| 900,149 | 858,758 | 2,688,855 | 2,567,295 | |||||||||||||
|
|
|
|
|
|
|
| |||||||||
Share-based payment | ||||||||||||||||
Equity-settled share—based payment | 483 | 7,072 | 16,940 | 17,899 | ||||||||||||
|
|
|
|
|
|
|
| |||||||||
(Continued)
- 64 -
| Three Months Ended September 30 | Nine Months Ended September 30 | |||||||||||||||
| 2018 | 2017 | 2018 | 2017 | |||||||||||||
Other employee benefit | ||||||||||||||||
Salaries | $ | 6,577,415 | $ | 6,544,408 | $ | 19,771,591 | $ | 19,583,911 | ||||||||
Insurance | 679,151 | 685,703 | 2,056,703 | 2,067,629 | ||||||||||||
Others | 3,320,037 | 3,748,387 | 10,629,343 | 11,349,909 | ||||||||||||
|
|
|
|
|
|
|
| |||||||||
| 10,576,603 | 10,978,498 | 32,457,637 | 33,001,449 | |||||||||||||
|
|
|
|
|
|
|
| |||||||||
Total employee benefit expenses | $ | 11,477,235 | $ | 11,844,328 | $ | 35,163,432 | $ | 35,586,643 | ||||||||
|
|
|
|
|
|
|
| |||||||||
Summary by functions | ||||||||||||||||
Operating costs | $ | 5,908,401 | $ | 6,182,186 | $ | 18,212,803 | $ | 18,602,057 | ||||||||
Operating expenses | 5,568,834 | 5,662,142 | 16,950,629 | 16,984,586 | ||||||||||||
|
|
|
|
|
|
|
| |||||||||
| $ | 11,477,235 | $ | 11,844,328 | $ | 35,163,432 | $ | 35,586,643 | |||||||||
|
|
|
|
|
|
|
| |||||||||
(Concluded)
Chunghwa distributes employees’ compensation at the rates from 1.7% to 4.3% and remuneration to directors not higher than 0.17%, respectively, ofpre-tax income.
If there is a change in the proposed amounts after the annual financial statements are authorized for issue, the differences are recorded as a change in accounting estimate.
The compensation to the employees and remuneration to the directors of 2017 and 2016 approved by the Board of Directors on March 13, 2018 and March 7, 2017, respectively, were as follows.
| Cash | ||||||||
| 2017 | 2016 | |||||||
Compensation distributed to the employees | $ | 1,596,012 | $ | 1,702,164 | ||||
Remuneration paid to the directors | 40,750 | 42,087 | ||||||
There was no difference between the initial accrual amounts and the amounts proposed in the Board of Directors in 2018 and 2017 of the aforementioned compensation to employees and the remuneration to directors.
Information of the appropriation of Chunghwa’s employees compensation and remuneration to directors and those approved by the Board of Directors is available on the Market Observation Post System website.
- 65 -
| b. | Reclassification adjustments of other comprehensive income (loss) |
Three Months Ended September 30, 2017 | Nine Months Ended September 30, 2017 | |||||||
Unrealized gain on available-for-sale financial assets Arising during the period | $ | 544,383 | $ | 515,172 | ||||
|
|
|
| |||||
Cash flow hedges | ||||||||
Loss arising during the period | $ | (6,642 | ) | $ | (581 | ) | ||
Reclassification adjustments included in profit or loss | (1,879 | ) | (1,879 | ) | ||||
Adjusted against the carrying amount of hedged items | 8,000 | 3,584 | ||||||
|
|
|
| |||||
| $ | (521 | ) | $ | 1,124 | ||||
|
|
|
| |||||
| 32. | INCOME TAX |
| a. | Income tax recognized in profit or loss |
The major components of income tax expense were as follows:
| Three Months Ended September 30 | Nine Months Ended September 30 | |||||||||||||||
| 2018 | 2017 | 2018 | 2017 | |||||||||||||
Current tax | ||||||||||||||||
Current tax expenses recognized for the period | $ | 2,152,686 | $ | 2,109,146 | $ | 6,378,976 | $ | 6,139,770 | ||||||||
Income tax on unappropriated earnings | — | 29 | 47,528 | 48,170 | ||||||||||||
Income tax adjustments on prior years | 24,476 | 4,287 | 22,828 | (1,991 | ) | |||||||||||
Others | 5,532 | 8,038 | 6,610 | 13,168 | ||||||||||||
|
|
|
|
|
|
|
| |||||||||
| 2,182,694 | 2,121,500 | 6,455,942 | 6,199,117 | |||||||||||||
|
|
|
|
|
|
|
| |||||||||
Deferred tax | ||||||||||||||||
Deferred tax expenses recognized for the period | (44,399 | ) | (38,401 | ) | 253,761 | (64,881 | ) | |||||||||
Income tax adjustments on prior years | — | — | 19,550 | — | ||||||||||||
Change in tax rate | — | — | (37,652 | ) | — | |||||||||||
|
|
|
|
|
|
|
| |||||||||
| (44,399 | ) | (38,401 | ) | 235,659 | (64,881 | ) | ||||||||||
|
|
|
|
|
|
|
| |||||||||
Income tax recognized in profit or loss | $ | 2,138,295 | $ | 2,083,099 | $ | 6,691,601 | $ | 6,134,236 | ||||||||
|
|
|
|
|
|
|
| |||||||||
In February 2018, the Income Tax Act in the ROC was amended, the corporate income tax rate is adjusted from 17% to 20%. Deferred income tax resulting from the change in tax rate that shall recognize in profit or loss is recognized in full in the period in which the change in tax rate occurs. In addition, the rate of the corporate surtax applicable to 2018 unappropriated earnings will be reduced from 10% to 5%.
- 66 -
| b. | Income tax benefit recognized in other comprehensive income |
| Three Months Ended September 30 | Nine Months Ended September 30 | |||||||||||||||
| 2018 | 2017 | 2018 | 2017 | |||||||||||||
Deferred tax benefit Change in tax rate | $ | — | $ | — | $ | (207,269 | ) | $ | — | |||||||
Unrealized gain or loss onavailable-for-sale financial assets | — | (224 | ) | — | (2,053 | ) | ||||||||||
|
|
|
|
|
|
|
| |||||||||
| $ | — | $ | (224 | ) | $ | (207,269 | ) | $ | (2,053 | ) | ||||||
|
|
|
|
|
|
|
| |||||||||
| c. | Income tax examinations |
Income tax returns of Chunghwa have been examined by the tax authorities through 2014. Income tax returns of CHPT have been examined by the tax authorities through 2015. Income tax returns of SENAO, CHSI, CHI, HHI, SFD, SHE, CHYP, LED, CHIEF, Unigate, CLPT, ISPOT, Youth, Youyi, Aval and CHST have been examined by the tax authorities through 2016.
| 33. | EARNINGS PER SHARE (“EPS”) |
Net income and weighted average number of common stocks used in the calculation of earnings per share were as follows:
Net Income
| Three Months Ended September 30 | Nine Months Ended September 30 | |||||||||||||||
| 2018 | 2017 | 2018 | 2017 | |||||||||||||
Net income used to compute the basic earnings per share | ||||||||||||||||
Net income attributable to the parent | $ | 8,504,207 | $ | 10,153,411 | $ | 27,093,228 | $ | 30,191,883 | ||||||||
Assumed conversion of all dilutive potential common stocks | ||||||||||||||||
Employee stock options and employee compensation of subsidiaries | (1,330 | ) | (86 | ) | (6,430 | ) | (395 | ) | ||||||||
|
|
|
|
|
|
|
| |||||||||
Net income used to compute the diluted earnings per share | $ | 8,502,877 | $ | 10,153,325 | $ | 27,086,798 | $ | 30,191,488 | ||||||||
|
|
|
|
|
|
|
| |||||||||
- 67 -
Weighted Average Number of Common Stocks
| (Thousand Shares) | ||||||||||||||||
| Three Months Ended September 30 | Nine Months Ended September 30 | |||||||||||||||
| 2018 | 2017 | 2018 | 2017 | |||||||||||||
Weighted average number of common stocks used to compute the basic earnings per share | 7,757,447 | 7,757,447 | 7,757,447 | 7,757,447 | ||||||||||||
Assumed conversion of all dilutive potential common stocks | ||||||||||||||||
Employee compensation | 1,379 | 1,907 | 9,011 | 9,936 | ||||||||||||
|
|
|
|
|
|
|
| |||||||||
Weighted average number of common stocks used to compute the diluted earnings per share | 7,758,826 | 7,759,354 | 7,766,458 | 7,767,383 | ||||||||||||
|
|
|
|
|
|
|
| |||||||||
Because Chunghwa may settle the employee compensation in shares or cash, Chunghwa shall presume that it will be settled in shares and takes those shares into consideration when calculating the weighted average number of outstanding shares used in the calculation of diluted EPS if the shares have a dilutive effect. The dilutive effect of the shares needs to be considered until the approval of the number of shares to be distributed to employees as compensation in the following year.
| 34. | SHARE-BASED PAYMENT ARRANGEMENT |
| a. | SENAO share-based compensation plan (“SENAO Plan”) described as follows: |
Effective Date for Plan Registration | Resolution Date by Directors | Stock Options Units (Thousand) | Exercise Price (NT$) | |||
2012.05.28 | 2013.04.29 | 10,000 | $66.20 (Original price $93.00 ) |
Each option is eligible to subscribe for one common share when exercisable. Under the terms of the SENAO Plan, the options are granted at an exercise price equal to the closing price of the SENAO’s common stocks listed on the TSE on the higher of closing price or par value. The SENAO Plan have exercise price adjustment formula upon the changes in common stocks equity (including cash capital increase, new share issue through capitalization of earnings and additionalpaid-in capital, merger, spin off and new share issue for Global Depositary Shares, and so on) or distribution of cash dividends. The options of SENAO Plan are valid for six years and the graded vesting schedule for which 50% of option granted will vest two years after the grant date and another two tranches of 25%, each will vest three and four years after the grant date respectively.
The recognized compensation cost of stcok options granted on May 7, 2013 was $4,059 thousand for the nine months ended September 30, 2017. No compensation cost was recognized for the nine months ended September 30, 2018 and three months ended September 30, 2017.
- 68 -
SENAO modified the plan terms of the outstanding stock options in July 2018 and the exercise price changed from $70.70 to $66.20 per share. The modification did not cause any incremental fair value granted.
SENAO modified the plan terms of the outstanding stock options in July 2017 and the exercise price changed from $76.10 to $70.70 per share. The modification did not cause any incremental fair value granted.
Information about SENAO’s outstanding stock options for the nine months ended September 30, 2018 and 2017 was as follows:
| Nine Months Ended September 30 | ||||||||||||||||
| 2018 | 2017 | |||||||||||||||
| Granted on May 7, 2013 | Granted on May 7, 2013 | |||||||||||||||
Number of Options (Thousand) | Weighted Average Exercise Price (NT$) | Number of Options (Thousand) | Weighted Average Exercise Price (NT$) | |||||||||||||
Employee stock options | ||||||||||||||||
Options outstanding at beginning of the period | 5,926 | $ | 70.70 | 6,587 | $ | 76.10 | ||||||||||
Options forfeited | (585 | ) | — | (506 | ) | — | ||||||||||
|
|
|
| |||||||||||||
Options outstanding at end of the period | 5,341 | 66.20 | 6,081 | 70.70 | ||||||||||||
|
|
|
| |||||||||||||
Options exercisable at end of the period | 5,341 | 66.20 | 6,081 | 70.70 | ||||||||||||
|
|
|
| |||||||||||||
As of September 30, 2018, information about employee stock options outstanding was as follows:
| Options Outstanding | Options Exercisable | |||||||||||||||||||
| Range of Exercise Price (NT$) | Number of (Thousand) | Weighted Average Remaining Contractual Life (Years) | Weighted Price (NT$) | Number of (Thousand) | Weighted Average Exercise Price (NT$) | |||||||||||||||
| $66.20 | 5,341 | 0.60 | $ | 66.20 | 5,341 | $ | 66.20 | |||||||||||||
As of December 31, 2017, information about employee stock options outstanding was as follows:
| Options Outstanding | Options Exercisable | |||||||||||||||||||
| Range of Exercise Price (NT$) | Number of (Thousand) | Weighted Average Remaining Contractual Life (Years) | Weighted Price (NT$) | Number of (Thousand) | Weighted Price (NT$) | |||||||||||||||
| $70.70 | 5,926 | 1.35 | $ | 70.70 | 5,926 | $ | 70.70 | |||||||||||||
- 69 -
As of September 30, 2017, information about employee stock options outstanding was as follows:
| Options Outstanding | Options Exercisable | |||||||||||||||||||
| Range of Exercise Price (NT$) | Number of (Thousand) | Weighted Average Remaining Contractual Life (Years) | Weighted Price (NT$) | Number of (Thousand) | Weighted Price (NT$) | |||||||||||||||
| $70.70 | 6,081 | 1.60 | $ | 70.70 | 6,081 | $ | 70.70 | |||||||||||||
SENAO used the fair value method to evaluate the options using the Black-Scholes model and the related assumptions and the fair value of the options were as follows:
| Stock Options Granted on May 7, 2013 | ||||
Grant-date share price (NT$) | $ | 93.00 | ||
Exercise price (NT$) | $ | 93.00 | ||
Dividends yield | — | |||
Risk-free interest rate | 0.91 | % | ||
Expected life | 4.375 years | |||
Expected volatility | 36.22 | % | ||
Weighted average fair value of grants (NT$) | $ | 28.72 | ||
Expected volatility was based on the historical share price volatility of SENAO over the period equal to the expected life of SENAO Plan.
| b. | SENAO transferred the treasury stock |
The Board of Directors of SENAO resolved to transfer treasury stock 6,658 thousand shares to specific employees in April 2018. The aforementioned treasury stock transferred to employees were measured at the fair value on the grant date. The compensation cost of $15,564 thousand was recognized for the nine months ended September 30, 2018.
The Board of Directors of SENAO resolved to transfer treasury stock 1,108 thousand shares to specific employees in May 2017. The aforementioned treasury stock transferred to employees were measured at the fair value of the grant date. The compensation cost of $4,793 thousand was recognized for the nine months ended September 30, 2017.
SENAO used the fair value method to evaluate share-based payment transaction using the Black-Scholes model and the related assumptions and the fair value of the option were as follows:
| Stock Options Granted on May 7, 2018 | Stock Options Granted on May 23, 2017 | |||||||
Grant-date share price (NT$) | $ | 51.60 | $ | 53.60 | ||||
Exercise price (NT$) | $ | 49.28 | $ | 49.28 | ||||
Dividends yield | — | — | ||||||
Risk-free interest rate | 0.59 | % | 0.59 | % | ||||
Expected life | 18 days | 9 days | ||||||
Expected volatility | 8.78 | % | 12.35 | % | ||||
Weighted average fair value of grants (NT$) | $ | 2.34 | $ | 4.33 | ||||
- 70 -
Expected volatility was based on the historical share price volatility of SENAO over three months before the grant date.
| c. | CHIEF share-based compensation plan (“CHIEF Plan”) described as follows: |
Effective Date for | Resolution Date by CHIEF’s Board of Directors | Stock Options Units | Exercise Price (NT$) | |||
2017.12.18 | 2017.12.19 | 950 | $140.60 (Original price $147.00 ) | |||
2015.11.17 | 2015.10.22 | 2,000 | $ 34.40 (Original price $43.00 ) |
Each option is eligible to subscribe for one thousand common stocks when exercisable. The options are granted to specific employees that meet the vesting conditions. The CHIEF Plan has exercise price adjustment formula upon the changes in common stocks or distribution of cash dividends. The options of CHIEF Plan are valid for five years and the graded vesting schedule will vest two years after the grant date.
The compensation costs of stock options granted on December 19, 2017 were $168 thousand and $430 thousand for the three months and nine months ended September 30, 2018, respectively.
The compensation costs of stock options granted on October 22, 2015 were $315 thousand and $946 thousand for the three months and nine months ended September 30, 2018, respectively. The compensation costs were $987 thousand and $2,962 thousand for the three months and nine months ended September 30, 2017, respectively.
CHIEF modified the plan terms of stock options granted on December 19, 2017 in June and August 2018 and the exercise price changed from $147.00 to $144.10 and $144.10 to $140.60 per share, respectively. The modification did not cause any incremental fair value granted.
Information about CHIEF’s outstanding stock options for the nine months ended September 30, 2018 and 2017 was as follows:
| Nine Months Ended September 30 | ||||||||||||||||||||||||
| 2018 | 2017 | |||||||||||||||||||||||
| Granted on December 19, 2017 | Granted on October 22, 2015 | Granted on October 22, 2015 | ||||||||||||||||||||||
Number Options | Weighted Average Exercise Price (NT$) | Number Options | Weighted Average Exercise Price (NT$) | Number Options | Weighted Average Exercise Price (NT$) | |||||||||||||||||||
Employee stock options | ||||||||||||||||||||||||
Options outstanding at beginning of the period | 950.0 | $ | 147.00 | 1,936.0 | $ | 34.40 | 1,948.0 | $ | 34.40 | |||||||||||||||
Options exercised | — | — | (968.0 | ) | 34.40 | — | — | |||||||||||||||||
Options forfeited | (16.0 | ) | — | (16.5 | ) | — | (12.0 | ) | — | |||||||||||||||
|
|
|
|
|
| |||||||||||||||||||
Options outstanding at end of the period | 934.0 | 140.60 | 951.5 | 34.40 | 1,936.0 | 34.40 | ||||||||||||||||||
|
|
|
|
|
| |||||||||||||||||||
Option exercisable at end of the period | — | — | — | — | — | — | ||||||||||||||||||
|
|
|
|
|
| |||||||||||||||||||
- 71 -
As of September 30, 2018, information about employee stock options outstanding was as follows:
Granted on December 19, 2017 | ||||||||||||||||||||
Options Outstanding | Options Exercisable | |||||||||||||||||||
Range of (NT$) | Number of Options | Weighted Average Remaining | Weighted Average Exercise Price (NT$) | Number of Options | Weighted Average Price (NT$) | |||||||||||||||
$140.60 | 934.0 | 4.22 | $ | 140.60 | — | $ | — | |||||||||||||
Granted on October 22, 2015 | ||||||||||||||||||||
Options Outstanding | Options Exercisable | |||||||||||||||||||
Range of Exercise Price (NT$) | Number of Options | Weighted Average | Weighted Average Exercise Price (NT$) | Number of Options | Weighted Average Exercise Price (NT$) | |||||||||||||||
$34.40 | 951.5 | 2.06 | $ | 34.40 | — | $ | — | |||||||||||||
As of December 31, 2017, information about employee stock options outstanding was as follows:
Granted on December 19, 2017 | ||||||||||||||||||||
Options Outstanding | Options Exercisable | |||||||||||||||||||
Range of Exercise Price (NT$) | Number of Options | Weighted Average | Weighted Average Exercise Price (NT$) | Number of Options | Weighted Average Exercise Price (NT$) | |||||||||||||||
$ 147.00 | 950.0 | 4.96 | $ | 147.00 | — | $ | — | |||||||||||||
Granted on October 22, 2015 | ||||||||||||||||||||
Options Outstanding | Options Exercisable | |||||||||||||||||||
Range of (NT$) | Number of Options | Weighted Average | Weighted Average Exercise Price (NT$) | Number of Options | Weighted Average Exercise Price (NT$) | |||||||||||||||
$ 34.40 | 1,936.0 | 2.81 | $ | 34.40 | 968.0 | $ | 34.40 | |||||||||||||
As of September 30, 2017, information about employee stock options outstanding was as follows:
Granted on October 22, 2015 | ||||||||||||||||||||
Options Outstanding | Options Exercisable | |||||||||||||||||||
| Range of Exercise Price (NT$) | Number of Options | Weighted Average Remaining Contractual Life (Years) | Weighted Average Exercise Price (NT$) | Number of Options | Weighted Average Exercise Price (NT$) | |||||||||||||||
$34.40 | 1,936.0 | 3.06 | $ | 34.40 | — | $ | — | |||||||||||||
- 72 -
CHIEF used the fair value method to evaluate the options using the Black-Scholes model and binomial option pricing model and the related assumptions and the fair value of the options were as follows:
| Stock Options Granted on December 19, 2017 | Stock Options Granted on October 22, 2015 | |||||||
Grant-date share price (NT$) | $ | 95.92 | $ | 39.55 | ||||
Exercise price (NT$) | $ | 147.00 | $ | 43.00 | ||||
Dividends yield | — | — | ||||||
Risk-free interest rate | 0.62 | % | 0.86 | % | ||||
Expected life | 5 years | 5 years | ||||||
Expected volatility | 17.35 | % | 21.02 | % | ||||
Weighted average fair value of grants (NT$) | $ | 2,318 | $ | 4,863 | ||||
Expected volatility was based on the average annualized historical share price volatility of CHIEF’s comparable companies before the grant date.
| d. | New shares reserved for subscription by employees under cash injection of CHIEF |
In March 2018, the Board of Directors of CHIEF approved the cash injection to issue 7,842 thousand shares and simultaneously reserved 1,176 thousand shares for subscription by employees according to the Company Act of the ROC. Furthermore, when the employees subscribed some shares or discarded their rights to subscribe shares, the Board of Directors of CHIEF authorized the chairman of the Board of Directors to contact specific people or group to subscribe.
The aforementioned options granted to employees are accounted for and measured at fair value of the grant date. No compensation cost was recognized for the nine months ended September 30, 2018.
CHIEF used the fair value method to evaluate the options granted to employees on May 22, 2018 using the Black-Scholes model and the related assumptions and the fair value of the options were as follows:
| Stock Options Granted on May 22, 2018 | ||||
Grant-date share price (NT$) | $ | 156.41 | ||
Exercise price (NT$) | $ | 170.00 | ||
Dividends yield | — | |||
Risk-free interest rate | 0.34 | % | ||
Expected life | 7 days | |||
Expected volatility | 14.33 | % | ||
Weighted average fair value of grants (NT$) | $ | — | ||
Expected volatility was based on the average annualized historical share price volatility of CHIEF’s comparable companies before the grant date.
- 73 -
| e. | New shares reserved for subscription by employees under cash injection of CHPT |
On February 8, 2017, the Board of Directors of CHPT approved the cash injection to issue 2,000 thousand shares and simultaneously reserved 300 thousand shares for subscription by employees according to the Company Act of the ROC. Furthermore, when the employees subscribed some shares or discarded their rights to subscribe shares, the Board of Directors of CHPT authorized the chairman of the Board of Directors to contact specific people or group to subscribe.
The aforementioned options granted to employees are accounted for and measured at fair value. The recognized compensation cost was $5,821 thousand for the year ended December 31, 2017.
CHPT used the fair value method to evaluate the options granted to employees on September 18, 2017 using the Black-Scholes model and the related assumptions and the fair value of the options were as follows:
| Stock Options Granted on September 18, 2017 | ||||
Grant-date share price (NT$) | $ | 1,295.00 | ||
Exercise price (NT$) | $ | 1,267.33 | ||
Dividends yield | — | |||
Risk-free interest rate | 0.35 | % | ||
Expected life | 4 days | |||
Expected volatility | 28.30 | % | ||
Weighted average fair value of grants (NT$) | $ | 31.60 | ||
Expected volatility was based on the historical share price volatility of CHPT over the period equal to the expected life.
| 35. | NON-CASH TRANSACTIONS |
For the nine months ended September 30, 2018 and 2017, the Company entered into the followingnon-cash investing activities:
| Nine Months Ended September 30 | ||||||||
| 2018 | 2017 | |||||||
Increase in property, plant and equipment | $ | 18,801,873 | $ | 13,841,649 | ||||
Changes in other payables | 545,011 | 2,749,806 | ||||||
|
|
|
| |||||
| $ | 19,346,884 | $ | 16,591,455 | |||||
|
|
|
| |||||
- 74 -
| 36. | OPERATING LEASE ARRANGEMENTS |
| a. | The Company as lessee |
Except for theST-2 satellite referred in Note 39 to the consolidated financial statements, the Company entered into several lease agreements for base stations located all over in Taiwan. The future aggregate minimum lease payments undernon-cancellable operating leases are as follows:
| September 30, 2018 | December 31, 2017 | September 30, 2017 | ||||||||||
Within one year | $ | 3,422,216 | $ | 2,918,651 | $ | 3,256,037 | ||||||
Longer than one year but within five years | 6,983,034 | 5,796,026 | 6,754,736 | |||||||||
Longer than five years | 932,348 | 778,808 | 885,271 | |||||||||
|
|
|
|
|
| |||||||
| $ | 11,337,598 | $ | 9,493,485 | $ | 10,896,044 | |||||||
|
|
|
|
|
| |||||||
| b. | The Company as lessor |
The Company leases out some land and buildings. The future aggregate minimum lease collection undernon-cancellable operating leases are as follows:
| September 30, 2018 | December 31, 2017 | September 30, 2017 | ||||||||||
Within one year | $ | 325,756 | $ | 353,023 | $ | 373,502 | ||||||
Longer than one year but within five years | 620,089 | 658,768 | 563,901 | |||||||||
Longer than five years | 195,371 | 242,799 | 302,892 | |||||||||
|
|
|
|
|
| |||||||
| $ | 1,141,216 | $ | 1,254,590 | $ | 1,240,295 | |||||||
|
|
|
|
|
| |||||||
| 37. | CAPITAL MANAGEMENT |
The Company manages its capital to ensure that entities in the Company will be able to continue as going concerns while maximizing the return to stakeholders through the optimization of the debt and equity balance.
The capital structure of the Company consists of debt of the Company and the equity attributable to the parent.
Some consolidated entities are required to maintain minimumpaid-in capital amount as prescribed by the applicable laws.
The management reviews the capital structure of the Company as needed. As part of this review, the management considers the cost of capital and the risks associated with each class of capital.
According to the management’s suggestion, the Company maintains a balanced capital structure through paying cash dividends, increasing its share capital, purchasing outstanding shares, and proceeds from new debt or repayment of debt.
- 75 -
| 38. | FINANCIAL INSTRUMENTS |
Fair Value Information
The fair value measurement guidance establishes a framework for measuring fair value and expands disclosure about fair value measurements. The standard describes a fair value hierarchy based on three levels of inputs that may be used to measure fair value. These levels are:
Level 1 fair value measurements: These measurements are those derived from quoted prices (unadjusted) in active markets for identical assets or liabilities.
Level 2 fair value measurements: These measurements are those derived from inputs other than quoted prices included within Level 1 that are observable for the asset or liability, either directly (i.e. as prices) or indirectly (i.e. derived from prices).
Level 3 fair value measurements: These measurements are those derived from valuation techniques that include inputs for the asset or liability that are not based on observable market data (unobservable inputs).
| a. | Financial instruments that are not measured at fair value but for which fair value is disclosed |
The Company considers that the carrying amounts of financial assets and liabilities not measured at fair value approximate their fair values or the fair values cannot be reliable estimated, no financial instruments need to be disclosed on balance sheet date.
| b. | Financial instruments that are measured at fair values on a recurring basis |
September 30, 2018
| Level 1 | Level 2 | Level 3 | Total | |||||||||||||
Financial assets at FVTPL | ||||||||||||||||
Hybrid financial assets | $ | — | $ | 195,682 | $ | — | $ | 195,682 | ||||||||
|
|
|
|
|
|
|
| |||||||||
Hedging financial assets | $ | — | $ | 367 | $ | — | $ | 367 | ||||||||
|
|
|
|
|
|
|
| |||||||||
Financial assets at FVOCI | ||||||||||||||||
Equity investment | $ | 2,438,505 | $ | — | $ | 4,560,660 | $ | 6,999,165 | ||||||||
|
|
|
|
|
|
|
| |||||||||
Financial liabilities at FVTPL | ||||||||||||||||
Derivatives | $ | — | $ | 619 | $ | — | $ | 619 | ||||||||
|
|
|
|
|
|
|
| |||||||||
December 31, 2017
| Level 1 | Level 2 | Level 3 | Total | |||||||||||||
Available-for-sale financial assets | ||||||||||||||||
Equity investments | $ | 3,125,086 | $ | — | $ | — | $ | 3,125,086 | ||||||||
|
|
|
|
|
|
|
| |||||||||
Financial liabilities at FVTPL | ||||||||||||||||
Derivatives | $ | — | $ | 578 | $ | — | $ | 578 | ||||||||
|
|
|
|
|
|
|
| |||||||||
Hedging derivative financial liabilities | $ | — | $ | 850 | $ | — | $ | 850 | ||||||||
|
|
|
|
|
|
|
| |||||||||
(Concluded)
- 76 -
September 30, 2017
| Level 1 | Level 2 | Level 3 | Total | |||||||||||||
Financial assets at FVTPL | ||||||||||||||||
Derivatives | $ | — | $ | 1,878 | $ | — | $ | 1,878 | ||||||||
|
|
|
|
|
|
|
| |||||||||
Hedging derivative financial assets | $ | — | $ | 537 | $ | — | $ | 537 | ||||||||
|
|
|
|
|
|
|
| |||||||||
Available-for-sale financial assets | ||||||||||||||||
Listed securities | ||||||||||||||||
Equity investments | $ | 3,036,199 | $ | — | $ | — | $ | 3,036,199 | ||||||||
|
|
|
|
|
|
|
| |||||||||
There were no transfers between Levels 1 and 2 for the nine months ended September 30, 2018 and 2017.
For financial assets measured at Level 3, there is no other reconciliation item except for the change in fair value that is recognized in other comprehensive income or loss.
The fair values of financial assets and financial liabilities of Level 2 are determined as follows:
| 1) | The fair values of financial assets and financial liabilities with standard terms and conditions and traded in active markets are determined with reference to quoted market prices. |
| 2) | For derivatives, fair values are estimated using discounted cash flow model. Future cash flows are estimated based on observable inputs including forward exchange rates at the end of the reporting periods and the forward and spot exchange rates stated in the contracts, discounted at a rate that reflects the credit risk of various counterparties. |
| 3) | For hybrid financial assets, fair values are estimated based on the related financial instrument information provided by financial institution. The valuation is measured at the principal of deposit and the yield rate of the embedded instrument. |
The fair values of non-listed domestic and foreign equity investments were Level 3 fair value assets, and determined using the market approach by reference thePrice-to-Book ratios (P/B ratios) of peer companies that traded in active market or using assets approach. The significant unobservable inputs used were listed in the table below. A decrease in discount for the lack of marketability or noncontrolling interests discount would result in increases in the fair values.
| September 30, 2018 | ||||
Discount for lack of marketability | 14.25%-20.00% | |||
Noncontrolling interests discount | 23.00%-24.40% | |||
- 77 -
If the inputs to the valuation model were changed to reflect reasonably possible alternative assumptions while all the other variables were held constant, the fair values of equity investments would increase as below table. When related discounts increase, the fair value of equity investments would be the negative amount of the same amount.
| September 30, 2018 | ||||
Discount for lack of market ability 5% decrease | $ | 248,513 | ||
|
| |||
Noncontrolling interests discount 5% decrease | $ | 19,948 | ||
|
| |||
Categories of Financial Instruments
| September 30, 2018 | December 31, 2017 | September 30, 2017 | ||||||||||
Financial assets | ||||||||||||
Measured at FVTPL | ||||||||||||
Held for trading | $ | — | $ | — | $ | 1,878 | ||||||
Mandatorily at FVTPL | 195,682 | — | — | |||||||||
Hedging financial assets | 367 | — | 537 | |||||||||
Loans and receivables (Note a) | — | 68,983,820 | 63,452,044 | |||||||||
Available-for-sale financial assets (Note b) | — | 5,750,871 | 5,273,575 | |||||||||
Financial assets at amortized cost (Note a) | 58,761,423 | — | — | |||||||||
Financial assets at FVOCI | 6,999,165 | — | — | |||||||||
Financial liabilities | ||||||||||||
Measured at FVTPL | ||||||||||||
Held for trading | 619 | 578 | — | |||||||||
Hedging financial liabilities | — | 850 | — | |||||||||
Measured at amortized cost (Note c) | 40,084,783 | 39,725,662 | 35,935,769 | |||||||||
| Note a: | The balances included cash and cash equivalents, trade notes and accounts receivable, receivables from related parties, other current monetary assets and refundable deposits (classified as other noncurrent assets) which were loans and receivables. Such amounts are reclassified as financial assets at amortized cost upon the application of IFRS 9 starting from 2018. |
| Note b: | The balances included financial assets carried at cost which were classified asavailable-for-sale financial assets. |
| Note c: | The balances included short-term loans, trade notes and accounts payable, payables to related parties, partial other payables, customers’ deposits and long-term loans which were financial liabilities carried at amortized cost. |
- 78 -
Financial Risk Management Objectives
The main financial instruments of the Company include equity and debt investments, accounts receivable, accounts payable and loans. The Company’s Finance Department provides services to its business units,co-ordinates access to domestic and international capital markets, monitors and manages the financial risks relating to the operations of the Company through internal risk reports which analyze exposures by degree and magnitude of risks. These risks include market risk (including foreign currency risk, interest rate risk and other price risk), credit risk, and liquidity risk.
The Company seeks to minimize the effects of these risks by using derivative financial instruments to hedge risk exposures. The use of financial derivatives is governed by the Company’s policies approved by the Board of Directors. Those derivatives are used to hedge the risks of exchange rate fluctuation arising from operating or investment activities. Compliance with policies and risk exposure limits is reviewed by the Company’s Finance Department on a continuous basis. The Company does not enter into or trade financial instruments, including derivative financial instruments, for speculative purposes.
Chunghwa reports the significant risk exposures and related action plans timely and actively to the audit committee and to the Board of Directors if needed.
| a. | Market risk |
The Company is exposed to market risks of changes in foreign currency exchange rates and interest rates. The Company uses forward exchange contracts to hedge the exchange rate risk arising from assets and liabilities denominated in foreign currencies.
There were no changes to the Company’s exposure to market risks or the manner in which these risks are managed and measured.
| 1) | Foreign currency risk |
The carrying amounts of the Company’s foreign currency denominated monetary assets and monetary liabilities at the balance sheet dates were as follows:
| September 30, 2018 | December 31, 2017 | September 30, 2017 | ||||||||||
Assets | ||||||||||||
USD | $ | 6,306,993 | $ | 5,584,064 | $ | 7,492,807 | ||||||
EUR | 20,253 | 28,492 | 23,287 | |||||||||
SGD | 94,354 | 62,909 | 5,810 | |||||||||
JPY | 16,781 | 36,248 | 48,295 | |||||||||
RMB | 932 | 2,986 | 3,279 | |||||||||
Liabilities | ||||||||||||
USD | 6,882,060 | 4,963,953 | 6,131,750 | |||||||||
EUR | 1,531,019 | 1,322,803 | 653,629 | |||||||||
SGD | 48,050 | 96,442 | 48,192 | |||||||||
JPY | 19,759 | 11,934 | 5,835 | |||||||||
RMB | — | 25 | 282 | |||||||||
- 79 -
The carrying amounts of the Company’s derivatives with exchange rate risk exposures at the balance sheet dates were as follows:
| September 30, 2018 | December 31, 2017 | September 30, 2017 | ||||||||||
Assets | ||||||||||||
USD | $ | — | $ | — | $ | 481 | ||||||
EUR | 367 | — | 1,934 | |||||||||
Liabilities | ||||||||||||
USD | 383 | 484 | — | |||||||||
EUR | 236 | 944 | — | |||||||||
Foreign currency sensitivity analysis
The Company is mainly exposed to the fluctuations of the currencies USD, EUR, SGD, JPY and RMB listed above.
The following table details the Company’s sensitivity to a 5% increase and decrease in the functional currency against the relevant foreign currencies. 5% is the sensitivity rate used when reporting foreign currency risk internally to key management personnel and represents management’s assessment of the reasonably possible changes in foreign exchange rates. The sensitivity analysis includes only outstanding foreign currency denominated monetary items and forward exchange contracts. A positive number below indicates an increase inpre-tax profit or equity where the functional currency weakens 5% against the relevant currency.
| Nine Months Ended September 30 | ||||||||
| 2018 | 2017 | |||||||
Profit or loss | ||||||||
Monetary assets and liabilities (a) | ||||||||
USD | $ | (28,753 | ) | $ | 68,053 | |||
EUR | (75,538 | ) | (31,517 | ) | ||||
SGD | 2,315 | (2,119 | ) | |||||
JPY | (149 | ) | 2,123 | |||||
RMB | 47 | 150 | ||||||
Derivatives (b) | ||||||||
USD | 2,618 | 4,511 | ||||||
EUR | 19,261 | 6,294 | ||||||
Equity | ||||||||
Derivatives (c) | ||||||||
EUR | 4,435 | 12,049 | ||||||
| a) | This is mainly attributable to the exposure to foreign currency denominated receivables and payables of the Company outstanding at the balance sheet dates. |
| b) | This is mainly attributable to the forward exchange contracts. |
| c) | This is mainly attributable to the changes in the fair value of derivatives that are designated as cash flow hedges. |
For a 5% strengthening of the functional currency against the relevant currencies, it would have the equal but opposite effect on thepre-tax profit or equity for the amounts shown above.
- 80 -
| 2) | Interest rate risk |
The carrying amounts of the Company’s exposures to interest rates on financial assets and financial liabilities at the balance sheet dates were as follows:
| September 30, 2018 | December 31, 2017 | September 30, 2017 | ||||||||||
Fair value interest rate risk | ||||||||||||
Financial assets | $ | 15,282,885 | $ | 25,911,422 | $ | 21,998,068 | ||||||
Financial liabilities | — | — | 300,000 | |||||||||
Cash flow interest rate risk | ||||||||||||
Financial assets | 10,213,768 | 6,714,639 | 7,270,885 | |||||||||
Financial liabilities | 1,720,000 | 1,670,000 | 1,723,000 | |||||||||
Interest rate sensitivity analysis
The sensitivity analyses below have been determined based on the exposure to interest rates fornon-derivative instruments at the end of the reporting period. A 25 basis point increase or decrease is used when reporting interest rate risk internally to key management personnel and represents management’s assessment of the reasonably possible change in interest rates.
If interest rates had been 25 basis points higher/lower and all other variables were held constant, the Company’spre-tax income would increase/decrease by $21,234 thousand and $13,870 thousand for the nine months ended September 30, 2018 and 2017, respectively. This is mainly attributable to the Company’s exposure to floating interest rates on its financial assets and short-term and long-term loan.
| 3) | Other price risk |
The Company is exposed to equity price risks arising from equity securities investments. Equity investments are held for strategic rather than trading purposes. The management managed the risk through holding various risk portfolios. Further, the Company assigned finance and investment departments to monitor the price risk.
Equity price sensitivity analysis
The sensitivity analyses below have been determined based on the exposure to equity price risks at the end of the reporting period.
If equity prices had been 5% higher/lower, pretax other comprehensive income would have increased/decreased by $349,958 thousand and $151,810 thousand as a result of the changes in fair value of financial assets at FVOCI for the nine months ended September 30, 2018 and 2017, respectively.
- 81 -
| b. | Credit risk |
Credit risk refers to the risk that a counterparty would default on its contractual obligations resulting in financial loss to the Company. The maximum credit exposure of the aforementioned financial instruments is equal to their carrying amounts recognized in consolidated balance sheet as of the balance sheet date.
The Company has large trade receivables outstanding with its customers. A substantial majority of the Company’s outstanding trade receivables are not covered by collateral or credit insurance. The Company has implemented ongoing measures including enhancing credit assessments and strengthening overall risk management to reduce its credit risk. While the Company has procedures to monitor and limit exposure to credit risk on trade receivables, there can be no assurance such procedures will effectively limit its credit risk and avoid losses. This risk is heightened during periods when economic conditions worsen.
As the Company serves a large number of unrelated consumers, the concentration of credit risk was limited.
| c. | Liquidity risk |
The Company manages and maintains sufficient cash and cash equivalent position to support the operations and reduce the impact on fluctuation of cash flow.
| 1) | Liquidity and interest risk tables |
The following tables detailed the Company’s remaining contractual maturity for itsnon-derivative financial liabilities with agreed repayment periods. The tables had been drawn up based on the undiscounted cash flows of financial liabilities based on the earliest date on which the Company is required to pay.
| Weighted Average Effective Interest Rate (%) | Less Than 1 Month | 1-3 Months | 3 Months to 1 Year | 1-5 Years | Add More than 5 Years | Total | ||||||||||||||||||||||
| September 30, 2018 | ||||||||||||||||||||||||||||
Non-derivative financial liabilities | ||||||||||||||||||||||||||||
Non-interest bearing | — | $ | 39,702,035 | $ | — | $ | 2,276,232 | $ | 4,664,558 | $ | — | $ | 46,642,825 | |||||||||||||||
Floating interest rate instruments | 0.99 | 20,000 | — | 100,000 | 1,600,000 | — | 1,720,000 | |||||||||||||||||||||
|
|
|
|
|
|
|
|
|
|
|
| |||||||||||||||||
| $ | 39,722,035 | $ | — | $ | 2,376,232 | $ | 6,264,558 | $ | — | $ | 48,362,825 | |||||||||||||||||
|
|
|
|
|
|
|
|
|
|
|
| |||||||||||||||||
December 31, 2017 | ||||||||||||||||||||||||||||
Non-derivative financial liabilities | ||||||||||||||||||||||||||||
Non-interest bearing | — | $ | 41,884,644 | $ | — | $ | 3,196,831 | $ | 4,671,441 | $ | — | $ | 49,752,916 | |||||||||||||||
Floating interest rate instruments | 0.97 | 50,000 | — | 20,000 | 1,600,000 | — | 1,670,000 | |||||||||||||||||||||
|
|
|
|
|
|
|
|
|
|
|
| |||||||||||||||||
| $ | 41,934,644 | $ | — | $ | 3,216,831 | $ | 6,271,441 | $ | — | $ | 51,422,916 | |||||||||||||||||
|
|
|
|
|
|
|
|
|
|
|
| |||||||||||||||||
September 30, 2017 | ||||||||||||||||||||||||||||
Non-derivative financial liabilities | ||||||||||||||||||||||||||||
Non-interest bearing | — | $ | 36,091,645 | $ | — | $ | 2,469,734 | $ | 4,548,472 | $ | — | $ | 43,109,851 | |||||||||||||||
Floating interest rate instruments | 1.00 | — | 25,000 | 1,698,000 | — | — | 1,723,000 | |||||||||||||||||||||
Fixed interest rate instruments | 0.80 | 300,000 | — | — | — | — | 300,000 | |||||||||||||||||||||
|
|
|
|
|
|
|
|
|
|
|
| |||||||||||||||||
| $ | 36,391,645 | $ | 25,000 | $ | 4,167,734 | $ | 4,548,472 | $ | — | $ | 45,132,851 | |||||||||||||||||
|
|
|
|
|
|
|
|
|
|
|
| |||||||||||||||||
- 82 -
The following table detailed the Company’s liquidity analysis for its derivative financial instruments. The table had been drawn up based on the undiscounted gross inflows and outflows on those derivatives that require gross settlement.
| Less Than 1 Month | 1-3 Months | 3 Months to 1 Year | 1-5 Years | Total | ||||||||||||||||
September 30, 2018 | ||||||||||||||||||||
Gross settled | ||||||||||||||||||||
Forward exchange contracts | ||||||||||||||||||||
Inflow | $ | 52,382 | $ | 422,080 | $ | 53,212 | $ | — | $ | 527,674 | ||||||||||
Outflow | 52,765 | 421,322 | 53,839 | — | 527,926 | |||||||||||||||
|
|
|
|
|
|
|
|
|
| |||||||||||
| $ | (383 | ) | $ | 758 | $ | (627 | ) | $ | — | $ | (252 | ) | ||||||||
|
|
|
|
|
|
|
|
|
| |||||||||||
December 31, 2017 | ||||||||||||||||||||
Gross settled | ||||||||||||||||||||
Forward exchange contracts | ||||||||||||||||||||
Inflows | $ | 124,997 | $ | 173,068 | $ | 36,654 | $ | — | $ | 334,719 | ||||||||||
Outflows | 125,481 | 174,021 | 36,645 | — | 336,147 | |||||||||||||||
|
|
|
|
|
|
|
|
|
| |||||||||||
| $ | (484 | ) | $ | (953 | ) | $ | 9 | $ | — | $ | (1,428 | ) | ||||||||
|
|
|
|
|
|
|
|
|
| |||||||||||
September 30, 2017 | ||||||||||||||||||||
Gross settled | ||||||||||||||||||||
Forward exchange contracts | ||||||||||||||||||||
Inflow | $ | 90,326 | $ | 327,536 | $ | 39,771 | $ | — | $ | 457,633 | ||||||||||
Outflow | 89,845 | 325,237 | 40,136 | — | 455,218 | |||||||||||||||
|
|
|
|
|
|
|
|
|
| |||||||||||
| $ | 481 | $ | 2,299 | $ | (365 | ) | $ | — | $ | 2,415 | ||||||||||
|
|
|
|
|
|
|
|
|
| |||||||||||
| 2) | Financing facilities |
| September 30, 2018 | December 31, 2017 | September 30, 2017 | ||||||||||
Unsecured bank loan facility | ||||||||||||
Amount used | $ | 133,385 | $ | 90,000 | $ | 390,000 | ||||||
Amount unused | 51,324,490 | 45,748,967 | 45,783,967 | |||||||||
|
|
|
|
|
| |||||||
| $ | 51,457,875 | $ | 45,838,967 | $ | 46,173,967 | |||||||
|
|
|
|
|
| |||||||
Secured bank loan facility | ||||||||||||
Amount used | $ | 1,600,000 | $ | 1,600,000 | $ | 1,633,000 | ||||||
Amount unused | 1,340,000 | 1,910,000 | 2,077,000 | |||||||||
|
|
|
|
|
| |||||||
| $ | 2,940,000 | $ | 3,510,000 | $ | 3,710,000 | |||||||
|
|
|
|
|
| |||||||
- 83 -
| 39. | RELATED PARTIES TRANSACTIONS |
The ROC Government, one of Chunghwa’s customers, has significant equity interest in Chunghwa. Chunghwa provides fixed-line services, wireless services, internet and data and other services to the various departments and institutions of the ROC Government in the normal course of business and atarm’s-length prices. The transactions with the ROC government bodies have not been disclosed because the transactions are not individually or collectively significant. However, the related revenues and operating costs have been appropriately recorded.
| a. | The Company engages in business transactions with the following related parties: |
Company | Relationship | |
Taiwan International Standard Electronics Co., Ltd. | Associate | |
So-net Entertainment Taiwan Limited | Associate | |
Skysoft Co., Ltd. | Associate | |
KingwayTek Technology Co., Ltd. | Associate | |
Dian Zuan Integrating Marketing Co., Ltd. | Associate | |
Taiwan International Ports Logistics Corporation | Associate | |
Huada Digital Corporation | Joint venture | |
Chunghwa Benefit One Co., Ltd. | Joint venture | |
International Integrated System, Inc. | Associate | |
Senao Networks, Inc. | Associate | |
EnGenius Tech. Co., Ltd. | Subsidiary of the Company’s associate, Senao Networks, Inc. | |
HopeTech Technologies Limited | Associate | |
ST-2 Satellite Ventures Pte., Ltd. | Associate | |
Viettel-CHT Co., Ltd. | Associate | |
Click Force Co., Ltd. | Associate | |
Alliance Digital Tech Co., Ltd. | Associate | |
MeWorks LIMITED(HK) | Associate | |
Other related parties | ||
Chunghwa Telecom Foundation | A nonprofit organization of which the funds donated by Chunghwa exceeds one third of its total funds | |
Senao Technical and Cultural Foundation | A nonprofit organization of which the funds donated by SENAO exceeds one third of its total funds | |
Sochamp Technology Co., Ltd. | Investor of significant influence over CHST | |
E-Life Mall Co., Ltd. | One of the directors ofE-Life Mall and a director of SENAO are members of an immediate family | |
Engenius Technologies Co., Ltd. | Chairman of Engenius Technologies Co., Ltd. is a member of SENAO’s management | |
United Daily News Co., Ltd. | Investor of significant influence over SFD | |
Shenzhen Century Communication Co., Ltd. | Investor of significant influence over SCT | |
Taoyuan Aerotropolis Co., Ltd. | Investor of significant influence over TASUI |
- 84 -
| b. | Balances and transactions between Chunghwa and its subsidiaries, which are related parties of Chunghwa, have been eliminated on consolidation and are not disclosed in this note. Terms of the foregoing transactions with related parties were not significantly different from transactions withnon-related parties. When no similar transactions withnon-related parties can be referenced, terms were determined in accordance with mutual agreements. Details of transactions between the Company and other related parties are disclosed below: |
| 1) | Operating transactions |
| Revenues | ||||||||||||||||
| Three Months Ended September 30 | Nine Months Ended September 30 | |||||||||||||||
| 2018 | 2017 | 2018 | 2017 | |||||||||||||
Associates | $ | 71,727 | $ | 99,406 | $ | 257,457 | $ | 246,035 | ||||||||
Joint ventures | — | — | — | 87 | ||||||||||||
Others | 27,829 | 13,690 | 64,741 | 43,807 | ||||||||||||
|
|
|
|
|
|
|
| |||||||||
| $ | 99,556 | $ | 113,096 | $ | 322,198 | $ | 289,929 | |||||||||
|
|
|
|
|
|
|
| |||||||||
| Operating Costs and Expenses | ||||||||||||||||
| Three Months Ended September 30 | Nine Months Ended September 30 | |||||||||||||||
| 2018 | 2017 | 2018 | 2017 | |||||||||||||
Associates | $ | 308,872 | $ | 366,074 | $ | 798,509 | $ | 961,684 | ||||||||
Joint ventures | — | — | — | 2,247 | ||||||||||||
Others | 4,099 | 5,343 | 70,876 | 66,543 | ||||||||||||
|
|
|
|
|
|
|
| |||||||||
| $ | 312,971 | $ | 371,417 | $ | 869,385 | $ | 1,030,474 | |||||||||
|
|
|
|
|
|
|
| |||||||||
| 2) | Non-operating transactions |
| Non-operating Income and Expenses | ||||||||||||||||
| Three Months Ended September 30 | Nine Months Ended September 30 | |||||||||||||||
| 2018 | 2017 | 2018 | 2017 | |||||||||||||
Associates | $ | 7,819 | $ | 7,803 | $ | 23,430 | $ | 23,688 | ||||||||
Others | 7 | 7 | 24 | 24 | ||||||||||||
|
|
|
|
|
|
|
| |||||||||
| $ | 7,826 | $ | 7,810 | $ | 23,454 | $ | 23,712 | |||||||||
|
|
|
|
|
|
|
| |||||||||
| 3) | Receivables |
| September 30, 2018 | December 31, 2017 | September 30, 2017 | ||||||||||
Associates | $ | 15,574 | $ | 43,302 | $ | 36,362 | ||||||
Others | 15,493 | 6,065 | 4,650 | |||||||||
|
|
|
|
|
| |||||||
| $ | 31,067 | $ | 49,367 | $ | 41,012 | |||||||
|
|
|
|
|
| |||||||
- 85 -
| 4) | Payables |
| September 30, 2018 | December 31, 2017 | September 30, 2017 | ||||||||||
Associates | $ | 540,449 | $ | 679,845 | $ | 581,419 | ||||||
Joint ventures | — | — | 476 | |||||||||
Others | 3,470 | 4,340 | 4,353 | |||||||||
|
|
|
|
|
| |||||||
| $ | 543,919 | $ | 684,185 | $ | 586,248 | |||||||
|
|
|
|
|
| |||||||
| 5) | Customers’ deposits |
| September 30, 2018 | December 31, 2017 | September 30, 2017 | ||||||||||
Associates | $ | 5,932 | $ | 5,700 | $ | 7,220 | ||||||
|
|
|
|
|
| |||||||
| 6) | Acquisition of property, plant and equipment |
| Three Months Ended September 30 | Nine Months Ended September 30 | |||||||||||||||
| 2018 | 2017 | 2018 | 2017 | |||||||||||||
Associates | $ | 39,711 | $ | 56,116 | $ | 39,711 | $ | 120,151 | ||||||||
Joint ventures | — | — | — | 46 | ||||||||||||
|
|
|
|
|
|
|
| |||||||||
| $ | 39,711 | $ | 56,116 | $ | 39,711 | $ | 120,197 | |||||||||
|
|
|
|
|
|
|
| |||||||||
| 7) | Prepayments |
Chunghwa entered into a contract withST-2 Satellite Ventures Pte., Ltd. on March 12, 2010 to lease capacity on theST-2 satellite. This lease term is for 15 years which should start from the official operation ofST-2 satellite and the total contract value is approximately $6,000,000 thousand (SG$260,723 thousand), including a prepayment of $3,067,711 thousand, and the rest of amount should be paid annually whenST-2 satellite starts its official operation.ST-2 satellite was launched in May 2011, and began its official operation in August 2011. The total rental expense for the three months ended September 30, 2018 was $98,694 thousand, which consisted of an offsetting credit of the prepayment of $51,100 thousand and an additional accrual of $47,594 thousand. The total rental expense for the nine months ended September 30, 2018 was $295,538 thousand, which consisted of an offsetting credit of the prepayment of $153,300 thousand and an additional accrual of $142,238 thousand. The total rental expense for the three months ended September 30, 2017 was $98,355 thousand, which consisted of an offsetting credit of the prepayment of $51,100 thousand and an additional accrual of $47,255 thousand. The total rental expense for the nine months ended September 30, 2017 was $293,366 thousand, which consisted of an offsetting credit of the prepayment of $153,300 thousand and an additional accrual of $140,066 thousand. The prepaid rents (classified as prepayments) as of September 30, 2018, December 31, 2017 and September 30, 2017, were as follows:
| September 30, 2018 | December 31, 2017 | September 30, 2017 | ||||||||||
Prepaid rents—current | $ | 204,398 | $ | 204,398 | $ | 204,398 | ||||||
Prepaid rents—noncurrent | 1,396,721 | 1,550,021 | 1,601,119 | |||||||||
|
|
|
|
|
| |||||||
| $ | 1,601,119 | $ | 1,754,419 | $ | 1,805,517 | |||||||
|
|
|
|
|
| |||||||
- 86 -
| c. | Compensation of key management personnel |
The compensation of directors and key management personnel was as follows:
| Three Months Ended September 30 | Nine Months Ended September 30 | |||||||||||||||
| 2018 | 2017 | 2018 | 2017 | |||||||||||||
Short-term employee benefits | $ | 67,504 | $ | 83,687 | $ | 216,768 | $ | 216,407 | ||||||||
Post-employment benefits | 2,299 | 2,314 | 6,983 | 6,628 | ||||||||||||
Share-based payment | 108 | 1,142 | 9,401 | 1,930 | ||||||||||||
|
|
|
|
|
|
|
| |||||||||
| $ | 69,911 | $ | 87,143 | $ | 233,152 | $ | 224,965 | |||||||||
|
|
|
|
|
|
|
| |||||||||
The compensation of directors and key management personnel was mainly determined by the compensation committee having regard to the performance of individual and market trends.
40. PLEDGED ASSETS
The following assets are pledged as collaterals for bank loans and custom duties of the imported materials.
| September 30, 2018 | December 31, 2017 | September 30, 2017 | ||||||||||
Property, plant and equipment | $ | 2,528,217 | $ | 2,550,352 | $ | 2,557,731 | ||||||
Land held under development (included in inventories) | 1,998,733 | 1,998,733 | 1,998,733 | |||||||||
Restricted assets (included in other assets - others) | 2,500 | 2,500 | 18,324 | |||||||||
|
|
|
|
|
| |||||||
| $ | 4,529,450 | $ | 4,551,585 | $ | 4,574,788 | |||||||
|
|
|
|
|
| |||||||
| 41. | SIGNIFICANT CONTINGENT LIABILITIES AND UNRECOGNIZED COMMITMENTS |
As of September 30, 2018, the Company’s significant commitments and contingent liabilities, excluding those disclosed in other notes, were as follows:
| a. | Acquisitions of land and buildings of $35,865 thousand. |
| b. | Acquisitions of telecommunications equipment of $20,009,805 thousand. |
| c. | Unused letters of credit amounting to $50,000 thousand. |
| d. | A commitment to contribute $2,000,000 thousand to a Piping Fund administered by the Taipei City Government, of which $1,000,000 thousand was contributed by Chunghwa on August 15, 1996 (classified as other monetary assets—noncurrent). If the fund is not sufficient, Chunghwa will contribute the remaining $1,000,000 thousand upon notification from the Taipei City Government. |
| e. | CHPT signed the contract for its headquarters construction amounted to $1,613,800 thousand in July, 2017. The payment of $234,234 thousand has been made as of September 30, 2018. |
- 87 -
| 42. | SIGNIFICANT ASSETS AND LIABILITIES DENOMINATED IN FOREIGN CURRENCIES |
The following information summarizes the disclosure of the currency which is other than functional currency of Chunghwa and its subsidiaries. The following exchange rates are the exchange rates used to translate to the presentation currency in the consolidated financial statements, which is NTD:
| September 30, 2018 | ||||||||||||
| Foreign Currencies (Thousands) | Exchange Rate | New Taiwan Dollars (Thousands) | ||||||||||
Assets denominated in foreign currencies | ||||||||||||
Monetary items | ||||||||||||
Cash | ||||||||||||
USD | $ | 26,177 | 30.53 | $ | 799,056 | |||||||
EUR | 548 | 35.48 | 19,437 | |||||||||
SGD | 4,081 | 22.33 | 91,123 | |||||||||
JPY | 60,347 | 0.269 | 16,246 | |||||||||
RMB | 210 | 4.436 | 932 | |||||||||
Accounts receivable | ||||||||||||
USD | 180,440 | 30.53 | 5,507,937 | |||||||||
EUR | 23 | 35.48 | 816 | |||||||||
SGD | 145 | 22.33 | 3,231 | |||||||||
JPY | 1,989 | 0.269 | 535 | |||||||||
Non-monetary items | ||||||||||||
Investments accounted for using equity method | ||||||||||||
SGD | 25,023 | 22.33 | 558,770 | |||||||||
VND | 227,383,898 | 0.00118 | 268,313 | |||||||||
Liabilities denominated in foreign currencies | ||||||||||||
Monetary items | ||||||||||||
Accounts payable | ||||||||||||
USD | 225,457 | 30.53 | 6,882,060 | |||||||||
EUR | 43,152 | 35.48 | 1,531,019 | |||||||||
SGD | 2,152 | 22.33 | 48,050 | |||||||||
JPY | 73,399 | 0.269 | 19,759 | |||||||||
| December 31, 2017 | ||||||||||||
| Foreign Currencies (Thousands) | Exchange Rate | New Taiwan Dollars (Thousands) | ||||||||||
Assets denominated in foreign currencies | ||||||||||||
Monetary items | ||||||||||||
Cash | ||||||||||||
USD | $ | 20,224 | 29.76 | $ | 601,877 | |||||||
EUR | 757 | 35.57 | 26,941 | |||||||||
SGD | 2,752 | 22.26 | 61,270 | |||||||||
JPY | 97,684 | 0.264 | 25,789 | |||||||||
RMB | 197 | 4.565 | 898 | |||||||||
(Continued)
- 88 -
| December 31, 2017 | ||||||||||||
| Foreign Currencies (Thousands) | Exchange Rate | New Taiwan Dollars (Thousands) | ||||||||||
Accounts receivable | ||||||||||||
USD | $ | 167,412 | 29.76 | $ | 4,982,187 | |||||||
EUR | 44 | 35.57 | 1,551 | |||||||||
SGD | 74 | 22.26 | 1,639 | |||||||||
JPY | 39,616 | 0.264 | 10,459 | |||||||||
RMB | 457 | 4.565 | 2,088 | |||||||||
Non-monetary items | ||||||||||||
Investments accounted for using equity method | ||||||||||||
USD | 762 | 29.76 | 22,731 | |||||||||
SGD | 21,227 | 22.26 | 472,505 | |||||||||
VND | 215,397,479 | 0.00119 | 256,323 | |||||||||
Liabilities denominated in foreign currencies | ||||||||||||
Monetary items | ||||||||||||
Accounts payable | ||||||||||||
USD | 166,800 | 29.76 | 4,963,953 | |||||||||
EUR | 37,189 | 35.57 | 1,322,803 | |||||||||
SGD | 4,333 | 22.26 | 96,442 | |||||||||
JPY | 45,203 | 0.264 | 11,934 | |||||||||
RMB | 5 | 4.565 | 25 | |||||||||
(Concluded)
|
| |||||||||||
| September 30, 2017 | ||||||||||||
| Foreign Currencies | Exchange Rate | New Taiwan Dollars | ||||||||||
Assets denominated in foreign currencies | ||||||||||||
Monetary items | ||||||||||||
Cash | ||||||||||||
USD | $ | 26,147 | 30.26 | $ | 791,198 | |||||||
EUR | 627 | 35.75 | 22,420 | |||||||||
SGD | 167 | 22.30 | 3,723 | |||||||||
JPY | 169,196 | 0.269 | 45,514 | |||||||||
RMB | 720 | 4.551 | 3,279 | |||||||||
Accounts receivable | ||||||||||||
USD | 221,468 | 30.26 | 6,701,609 | |||||||||
EUR | 24 | 35.75 | 867 | |||||||||
SGD | 94 | 22.30 | 2,087 | |||||||||
JPY | 10,338 | 0.269 | 2,781 | |||||||||
Non-monetary items | ||||||||||||
Investments accounted for using equity method | ||||||||||||
USD | 762 | 30.26 | 23,044 | |||||||||
SGD | 24,948 | 22.30 | 556,344 | |||||||||
VND | 201,947,107 | 0.00121 | 244,356 | |||||||||
(Continued) |
| |||||||||||
- 89 -
| September 30, 2017 | ||||||||||||
| Foreign Currencies | Exchange Rate | New Taiwan Dollars | ||||||||||
Liabilities denominated in foreign currencies | ||||||||||||
Monetary items | ||||||||||||
Accounts payable | ||||||||||||
USD | $ | 202,635 | 30.26 | $ | 6,131,750 | |||||||
EUR | 18,283 | 35.75 | 653,629 | |||||||||
SGD | 2,161 | 22.30 | 48,192 | |||||||||
JPY | 21,691 | 0.269 | 5,835 | |||||||||
RMB | 62 | 4.551 | 282 | |||||||||
(Concluded)
The unrealized foreign currency exchange losses and gains were loss of $38,860 thousand and gain of $25,319 thousand for the three months ended September 30, 2018 and 2017, respectively. The unrealized foreign currency exchange losses were of $8,994 thousand and $25,649 thousand for the nine months ended September 30, 2018 and 2017, respectively. Due to the various foreign currency transactions and the functional currency of each individual entity of the Company, foreign exchange gains and losses cannot be disclosed by the respective significant foreign currency.
| 43. | ADDITIONAL DISCLOSURES |
Following are the additional disclosures required by the FSC for the Company:
| a. | Financing provided: None. |
| b. | Endorsement/guarantee provided: Please see Table 1. |
| c. | Marketable securities held (excluding investments in subsidiaries, associates and joint ventures): Please see Table 2. |
| d. | Marketable securities acquired and disposed of at costs or prices at least $300 million or 20% of thepaid-in capital: Please see Table 3. |
| e. | Acquisition of individual real estate at costs of at least $300 million or 20% of thepaid-in capital: Please see Table 4. |
| f. | Disposal of individual real estate at prices of at least $300 million or 20% of thepaid-in capital: None. |
| g. | Total purchases from or sales to related parties amounting to at least $100 million or 20% of thepaid-in capital: Please see Table 5. |
| h. | Receivables from related parties amounting to $100 million or 20% of thepaid-in capital: Please see Table 6. |
| i. | Names, locations, and other information of investees on which the Company exercises significant influence (excluding investment in Mainland China): Please see Table 7. |
| j. | Derivative instruments transactions: Please see Notes 7, 21 and 38. |
- 90 -
| k. | Investment in Mainland China: Please see Table 8. |
| l. | Intercompany relationships and significant intercompany transaction: Please see Table 9. |
| 44. | SEGMENT INFORMATION |
The Company has the following reportable segments that provide different products or services. The reportable segments are managed separately because each segment represents a strategic business unit that serves different markets. Segment information is provided to CEO who allocates resources and assesses segment performance. The Company’s measure of segment performance is mainly based on revenues and income before income tax. The Company’s reportable segments are as follows:
| a. | Domestic fixed communications business—the provision of local telephone services, domestic long distance telephone services, broadband access, and related services; |
| b. | Mobile communications business—the provision of mobile services, sales of mobile handsets and data cards, and related services; |
| c. | Internet business—the provision of HiNet services and related services; |
| d. | International fixed communications business—the provision of international long distance telephone services and related services; |
| e. | Others—the provision of non-telecom services and the corporate related items not allocated to reportable segments. |
Some operating segments have been aggregated into a single operating segment taking into account the following factors: (a) similar economic characteristics such as long-term gross profit margins; (b) the nature of the telecommunications products and services are similar; (c) the nature of production processes of the telecommunications products and services are similar; (d) the type or class of customer for the telecommunications products and services are similar; and (e) the methods used to provide the services to the customers are similar.
There was no material differences between the accounting policies of the operating segments and the accounting policies described in Note 3.
Segment Revenues and Operating Results
Analysis by reportable segment of revenue and operating results of continuing operations are as follows:
| Domestic Fixed Communications Business | Mobile Communications Business | Internet Business | International Fixed Communications Business | Others | Total | |||||||||||||||||||
For the three months ended September 30, 2018 | ||||||||||||||||||||||||
Revenues | ||||||||||||||||||||||||
From external customers | $ | 16,496,740 | $ | 23,446,380 | $ | 7,188,615 | $ | 4,190,691 | $ | 1,382,459 | $ | 52,704,885 | ||||||||||||
Intersegment revenues | 4,101,647 | 412,040 | 1,095,076 | 471,890 | 1,196,291 | 7,276,944 | ||||||||||||||||||
|
|
|
|
|
|
|
|
|
|
|
| |||||||||||||
Segment revenues | $ | 20,598,387 | $ | 23,858,420 | $ | 8,283,691 | $ | 4,662,581 | $ | 2,578,750 | 59,981,829 | |||||||||||||
|
|
|
|
|
|
|
|
|
|
|
| |||||||||||||
Intersegment elimination | (7,276,944 | ) | ||||||||||||||||||||||
|
| |||||||||||||||||||||||
Consolidated revenues | $ | 52,704,885 | ||||||||||||||||||||||
|
| |||||||||||||||||||||||
Segments operating costs and expenses | $ | 14,610,433 | $ | 17,308,953 | $ | 3,289,216 | $ | 4,008,965 | $ | 3,061,835 | $ | 42,279,402 | ||||||||||||
|
|
|
|
|
|
|
|
|
|
|
| |||||||||||||
Segment income before income tax | $ | 4,523,392 | $ | 3,113,999 | $ | 3,179,749 | $ | 314,605 | $ | (271,174 | ) | $ | 10,860,571 | |||||||||||
|
|
|
|
|
|
|
|
|
|
|
| |||||||||||||
(Continued)
- 91 -
| Domestic Fixed Communications Business | Mobile Communications Business | Internet Business | International Fixed Communications Business | Others | Total | |||||||||||||||||||
For the nine months ended September 30, 2018 | ||||||||||||||||||||||||
Revenues | ||||||||||||||||||||||||
From external customers | $ | 48,735,029 | $ | 75,904,284 | $ | 21,316,442 | $ | 10,408,126 | $ | 3,631,721 | $ | 159,995,602 | ||||||||||||
Intersegment revenues | 12,997,387 | 1,290,565 | 2,906,366 | 1,686,202 | 3,500,178 | 22,380,698 | ||||||||||||||||||
|
|
|
|
|
|
|
|
|
|
|
| |||||||||||||
Segment revenues | $ | 61,732,416 | $ | 77,194,849 | $ | 24,222,808 | $ | 12,094,328 | $ | 7,131,899 | 182,376,300 | |||||||||||||
|
|
|
|
|
|
|
|
|
| |||||||||||||||
Intersegment elimination | (22,380,698 | ) | ||||||||||||||||||||||
|
| |||||||||||||||||||||||
Consolidated revenues | $ | 159,995,602 | ||||||||||||||||||||||
|
| |||||||||||||||||||||||
Segments operating costs and expenses | $ | 43,345,319 | $ | 54,754,504 | $ | 9,409,477 | $ | 10,327,998 | $ | 8,655,580 | $ | 126,492,878 | ||||||||||||
|
|
|
|
|
|
|
|
|
|
|
| |||||||||||||
Segment income before income tax | $ | 13,992,048 | $ | 12,201,127 | $ | 8,595,206 | $ | 698,715 | $ | (1,012,330 | ) | $ | 34,474,766 | |||||||||||
|
|
|
|
|
|
|
|
|
|
|
| |||||||||||||
For the three months ended September 30, 2017 | ||||||||||||||||||||||||
Revenues | ||||||||||||||||||||||||
From external customers | $ | 17,773,330 | $ | 26,962,640 | $ | 7,200,085 | $ | 3,165,655 | $ | 1,323,193 | $ | 56,424,903 | ||||||||||||
Intersegment revenues | 5,694,088 | 504,532 | 1,127,381 | 579,383 | 1,129,919 | 9,035,303 | ||||||||||||||||||
|
|
|
|
|
|
|
|
|
|
|
| |||||||||||||
Segment revenues | $ | 23,467,418 | $ | 27,467,172 | $ | 8,327,466 | $ | 3,745,038 | $ | 2,453,112 | 65,460,206 | |||||||||||||
|
|
|
|
|
|
|
|
|
| |||||||||||||||
Intersegment elimination | (9,035,303 | ) | ||||||||||||||||||||||
|
| |||||||||||||||||||||||
Consolidated revenues | $ | 56,424,903 | ||||||||||||||||||||||
|
| |||||||||||||||||||||||
Segments operating costs and expenses | $ | 15,532,978 | $ | 19,279,714 | $ | 3,186,733 | $ | 3,195,271 | $ | 2,796,800 | $ | 43,991,496 | ||||||||||||
|
|
|
|
|
|
|
|
|
|
|
| |||||||||||||
Segment income before income tax | $ | 6,425,112 | $ | 3,314,558 | $ | 2,984,266 | $ | 182,128 | $ | (323,680 | ) | $ | 12,582,384 | |||||||||||
|
|
|
|
|
|
|
|
|
|
|
| |||||||||||||
For the nine months ended September 30, 2017 | ||||||||||||||||||||||||
Revenues | ||||||||||||||||||||||||
From external customers | $ | 51,537,731 | $ | 80,408,472 | $ | 21,184,661 | $ | 10,003,288 | $ | 3,495,292 | $ | 166,629,444 | ||||||||||||
Intersegment revenues | 17,041,828 | 1,543,889 | 3,372,192 | 1,741,086 | 3,204,008 | 26,903,003 | ||||||||||||||||||
|
|
|
|
|
|
|
|
|
|
|
| |||||||||||||
Segment revenues | $ | 68,579,559 | $ | 81,952,361 | $ | 24,556,853 | $ | 11,744,374 | $ | 6,699,300 | 193,532,447 | |||||||||||||
|
|
|
|
|
|
|
|
|
| |||||||||||||||
Intersegment elimination | (26,903,003 | ) | ||||||||||||||||||||||
|
| |||||||||||||||||||||||
Consolidated revenues | $ | 166,629,444 | ||||||||||||||||||||||
|
| |||||||||||||||||||||||
Segments operating costs and expenses | $ | 45,530,847 | $ | 57,589,682 | $ | 9,555,353 | $ | 9,788,996 | $ | 7,861,754 | $ | 130,326,632 | ||||||||||||
|
|
|
|
|
|
|
|
|
|
|
| |||||||||||||
Segment income before income tax | $ | 18,762,371 | $ | 9,842,306 | $ | 8,553,050 | $ | 824,062 | $ | (726,697 | ) | $ | 37,255,092 | |||||||||||
|
|
|
|
|
|
|
|
|
|
|
| |||||||||||||
(Concluded)
Main Products and Service Revenues
| Three Months Ended September 30 | Nine Months Ended September 30 | |||||||||||||||
| 2018 | 2017 | 2018 | 2017 | |||||||||||||
Mobile services revenue | $ | 15,016,988 | $ | 19,006,767 | $ | 48,867,385 | $ | 57,261,226 | ||||||||
Sales of products | 9,727,746 | 9,202,867 | 30,442,949 | 26,442,315 | ||||||||||||
Local telephone and domestic long distance telephone services revenue | 7,498,097 | 8,255,374 | 22,678,369 | 24,390,648 | ||||||||||||
Broadband access and domestic leased line services revenue | 5,575,452 | 5,734,620 | 16,824,397 | 17,272,225 | ||||||||||||
Data Communications internet services revenue | 5,275,797 | 5,321,512 | 15,816,447 | 15,839,407 | ||||||||||||
International network and leased telephone services revenue | 2,945,898 | 2,130,070 | 7,046,828 | 7,003,858 | ||||||||||||
Others | 6,664,907 | 6,773,693 | 18,319,227 | 18,419,765 | ||||||||||||
|
|
|
|
|
|
|
| |||||||||
| $ | 52,704,885 | $ | 56,424,903 | $ | 159,995,602 | $ | 166,629,444 | |||||||||
|
|
|
|
|
|
|
| |||||||||
- 92 -
TABLE 1
CHUNGHWA TELECOM CO., LTD. AND SUBSIDIARIES
ENDORSEMENTS/GUARANTEES PROVIDED
NINE MONTHS ENDED SEPTEMBER 30, 2018
(Amounts in Thousands of New Taiwan Dollars)
No. (Note 1) | Endorsement/ Guarantee Provider | Guaranteed Party | Limits on Endorsement/ Guarantee Amount Provided to Each Guaranteed Party | Maximum Balance for the Period | Ending Balance | Actual Borrowing Amount | Amount of Endorsement/ Guarantee Collateralized by Properties | Ratio of Accumulated Endorsement/ Guarantee to Net Equity Per Latest Financial Statements | Maximum Endorsement/ Guarantee Amount Allowable | Endorsement/ Guarantee Given by Parent on Behalf of Subsidiaries | Endorsement/ Guarantee Given by Subsidiaries on Behalf of Parent | Endorsement/ Guarantee Given on Behalf of Companies in Mainland China | Note | |||||||||||||||||||||||||||||
| Name | Nature of Relationship (Note 2) | |||||||||||||||||||||||||||||||||||||||||
1 | Senao International Co., Ltd. | Youth Co., Ltd. ISPOT Co., Ltd. Aval Technologies | b b b | $ | 568,642 568,642 568,642 | | $ | 200,000 150,000 300,000 | | $ | — — | | $ | — — | | $ | — — — | | | — — 5.28 | | $ | 2,843,210 2,843,210 2,843,210 | | Yes Yes Yes | No No No | No No No | Notes 3, 4 and 5 Notes 3, 4 and 6 | ||||||||||||||
| Note 1: | Significant transactions between the Company and its subsidiaries or among subsidiaries are numbered as follows: |
| a. | “0” for the Company. |
| b. | Subsidiaries are numbered from “1”. |
| Note 2: | Relationships between the endorsement/guarantee provider and the guaranteed party: |
| a. | A company with which it does business. |
| b. | A company in which the Company directly and indirectly holds more than 50 percent of the voting shares. |
| c. | A company that directly and indirectly holds more than 50 percent of the voting shares in the Company. |
| d. | Companies in which the Company holds, directly or indirectly, 90% or more of the voting shares. |
| e. | The Company fulfills its contractual obligations by providing mutual endorsements/guarantees for another company in the same industry or for joint builders for purposes of undertaking a construction project. |
| f. | All capital contributing shareholders make endorsements/ guarantees for their jointly invested company in proportion to their shareholding percentages. |
| g. | Companies in the same industry provide among themselves joint and several security for a performance guarantee of a sales contract forpre-construction homes pursuant to the Consumer Protection Act for each other. |
| Note 3: | The limits on endorsement or guarantee amount provided to each guaranteed party is up to 10% of the net assets value of the latest financial statements of Senao International Co., Ltd. |
| Note 4: | The total amount of endorsement or guarantee that the Company is allowed to provide is up to 50% of the net assets value of the latest financial statements of Senao International Co., Ltd. |
| Note 5: | Senao International Co., Ltd. dissolved the endorsement or guarantee to Youth Co., Ltd. in August 2018. |
| Note 6: | Senao International Co., Ltd. retrieved the guarantee letter and dissolved the endorsement or guarantee to ISPOT Co., Ltd. in August 2018. |
- 93 -
TABLE 2
CHUNGHWA TELECOM CO., LTD. AND SUBSIDIARIES
MARKETABLE SECURITIES HELD
SEPTEMBER 30, 2018
(Amounts in Thousands of New Taiwan Dollars)
Held Company Name | Marketable Securities Type and Name | Relationship with the Company | Financial Statement Account | September 30, 2018 | Note | |||||||||||||||||||
| Shares (Thousands/ Thousand Units) | Carrying Value (Note 1) | Percentage of Ownership | Fair Value | |||||||||||||||||||||
Chunghwa Telecom Co., Ltd. | Stocks | |||||||||||||||||||||||
Taipei Financial Center Corp. | — | Financial assets at FVOCI | 172,927 | $ | 3,422,019 | 12 | $ | 3,422,019 | — | |||||||||||||||
Innovation Works Development Fund, L.P. | — | Financial assets at FVOCI | — | 272,240 | 4 | 272,240 | — | |||||||||||||||||
Industrial Bank of Taiwan II Venture Capital Co., Ltd. (IBT II) | — | Financial assets at FVOCI | 5,252 | 22,167 | 17 | 22,167 | — | |||||||||||||||||
Global Mobile Corp. | — | Financial assets at FVOCI | 7,617 | — | 3 | — | — | |||||||||||||||||
Innovation Works Limited | — | Financial assets at FVOCI | 1,000 | 1,298 | 2 | 1,298 | — | |||||||||||||||||
RPTI Intergroup International Ltd. | — | Financial assets at FVOCI | 4,765 | — | 10 | — | — | |||||||||||||||||
Taiwan mobile payment Co., Ltd. | — | Financial assets at FVOCI | 1,200 | 5,013 | 2 | 5,013 | — | |||||||||||||||||
Taiwania Capital Buffalo Fund Co., Ltd. | — | Financial assets at FVOCI | 300,000 | 292,910 | 13 | 292,910 | — | |||||||||||||||||
China Airlines Ltd. | — | Financial assets at FVOCI | 263,622 | 2,438,505 | 5 | 2,438,505 | Note 2 | |||||||||||||||||
4 Gamers Entertainment Inc. | — | Financial assets at FVOCI | 136 | 117,955 | 20 | 117,955 | — | |||||||||||||||||
Senao International Co., Ltd. | Stocks | |||||||||||||||||||||||
N.T.U. Innovation Incubation Corporation | — | Financial assets at FVOCI | 1,200 | 9,671 | 9 | 9,671 | — | |||||||||||||||||
CHIEF Telecom Inc. | Stocks | |||||||||||||||||||||||
3 Link Information Service Co., Ltd. | — | Financial assets at FVOCI | 374 | 920 | 10 | 920 | — | |||||||||||||||||
Chunghwa Investment Co., Ltd. | Stocks | |||||||||||||||||||||||
Tatung Technology Inc. | — | Financial assets at FVOCI | 4,571 | 114,285 | 11 | 114,285 | — | |||||||||||||||||
iSing99 Inc. | — | Financial assets at FVOCI | 10,000 | 52,574 | 7 | 52,574 | — | |||||||||||||||||
Powertec Energy Corp. | — | Financial assets at FVOCI | 20,000 | 238,912 | 2 | 238,912 | — | |||||||||||||||||
Chunghwa Hsingta Co., Ltd. | Stocks | |||||||||||||||||||||||
Cotech Engineering Fuzhou Corp. | — | Financial assets at FVOCI | — | 10,696 | 5 | 10,696 | — | |||||||||||||||||
| Note 1: | Showed at carrying amounts with fair value adjustments. |
| Note 2: | Fair value was based on the closing price on September 28, 2018. |
- 94 -
TABLE 3
CHUNGHWA TELECOM CO., LTD. AND SUBSIDIARIES
MARKETABLE SECURITIES ACQUIRED AND DISPOSED OF AT COSTS OR PRICES OF AT LEAST NT$300 MILLION OR 20% OF THEPAID-IN CAPITAL
NINE MONTHS ENDED SEPTEMBER 30, 2018
(Amounts in Thousands of New Taiwan Dollars)
Company | Marketable Securities | Financial Statement | Counter- party | Nature of Relationship | Beginning Balance | Acquisition | Disposal | Ending Balance | ||||||||||||||||||||||||||||||||||||||||||||
| Shares (Thousands/ Thousand Units) | Amount | Shares (Thousands/ Thousand Units) | Amount | Shares (Thousands/ Thousand Units) | Amount | Carrying Value | Gain (Loss) on Disposal | Shares (Thousands/ Thousand Units) | Amount | |||||||||||||||||||||||||||||||||||||||||||
Chunghwa Investment Co., Ltd. | Stocks | |||||||||||||||||||||||||||||||||||||||||||||||||||
| Chunghwa Precision Test Tech. Co., Ltd. | Investments accounted for using equity method | — | Subsidiary | 12,558 | $
| 2,207,100 (Note 1 | ) | — | $ | — | 1,328 | $ | 1,041,689 | $
| 240,953 (Note 1 | ) | $
| 800,736 (Note 2 | ) | 11,230 | $
| 2,050,190 (Note 1 | ) | |||||||||||||||||||||||||||||
| Note 1: | Including share of profit and other comprehensive income of associates accounted for using equity method. |
| Note 2: | Differences arising from equity transactions are included in additionalpaid-in capital. |
- 95 -
TABLE 4
CHUNGHWA TELECOM CO., LTD. AND SUBSIDIARIES
ACQUISITION OF INDIVIDUAL REAL ESTATE AT COSTS OF AT LEAST $300 MILLION OR 20% OF THEPAID-IN CAPITAL
NINE MONTHS ENDED SEPTEMBER 30, 2018
(Amounts in Thousands of New Taiwan Dollars)
Buyer | Property | Event Date | Transaction Amount | Payment Status | Counterparty | Relationship | Information on Previous Title Transfer If Counterparty is a Related Party | Pricing | Purpose of | Other Terms | ||||||||||||||||||||||||||||||
| Property Owner | Relationship | Transaction Date | Amount | |||||||||||||||||||||||||||||||||||||
Chunghwa Precision Test Tech. Co., Ltd. | Headquarters | 2017.7.29- 2018.9.26 | $ | 380,875 | Monthly settlement based on the construction progress and acceptance | Fu tsu Construction Co., Ltd. | — | Not applicable | Not applicable | Not applicable | Not applicable | Bidding, price comparison and price negotiation | Manufacturing purpose | None | ||||||||||||||||||||||||||
- 96 -
TABLE 5
CHUNGHWA TELECOM CO., LTD. AND SUBSIDIARIES
TOTAL PURCHASES FROM OR SALES TO RELATED PARTIES AMOUNTING TO AT LEAST NT$100 MILLION OR 20% OF THEPAID-IN CAPITAL
NINE MONTHS ENDED SEPTEMBER 30, 2018
(Amounts in Thousands of New Taiwan Dollars)
Company Name | Related Party | Nature of Relationship | Transaction Details | Abnormal Transaction | Notes / Accounts Payable or Receivable | |||||||||||||||||||||||||||
| Purchase/Sales (Note 1) | Amount (Notes 2 and 5) | % to Total | Payment Terms | Units Price | Payment Terms | Ending Balance (Notes 3 and 5) | % to Total | |||||||||||||||||||||||||
Chunghwa Telecom Co., Ltd. | Senao International Co., Ltd. | Subsidiary | Sales | $ | 1,392,313 | 1 | 30 days | $ | — | — | $ | 495,272 | 2 | |||||||||||||||||||
| Purchase | 1,112,120 | 1 | 30-90 days | — | — | (823,943 | ) | (5 | ) | |||||||||||||||||||||||
| CHIEF Telecom Inc. | Subsidiary | Sales | 243,790 | — | 30 days | — | — | 44,085 | — | |||||||||||||||||||||||
| Purchase | 217,182 | — | 60 days | — | — | (42,170 | ) | — | ||||||||||||||||||||||||
| Chunghwa System Integration Co., Ltd. | Subsidiary | Purchase | 615,577 | 1 | 30 days | — | — | (239,111 | ) | (1 | ) | |||||||||||||||||||||
| Honghwa International Co., Ltd. | Subsidiary | Purchase | 3,935,219 | 5 | 30-60 days | — | — | (809,565 | ) | (5 | ) | |||||||||||||||||||||
| Donghwa Telecom Co., Ltd. | Subsidiary | Sales | 160,699 | — | 30 days | — | — | 120,589 | — | |||||||||||||||||||||||
| Purchase | 382,157 | — | 90 days | — | — | (135,496 | ) | (1 | ) | |||||||||||||||||||||||
| Chunghwa Telecom Global, Inc. | Subsidiary | Purchase | 254,709 | — | 90 days | — | — | (56,476 | ) | — | ||||||||||||||||||||||
| Chunghwa Telecom Singapore Pte., Ltd. | Subsidiary | Sales | 114,212 | — | 30 days | — | — | 103,552 | — | |||||||||||||||||||||||
| Purchase | 140,318 | — | 90 days | — | — | (73,608 | ) | — | ||||||||||||||||||||||||
| CHT Security Co., Ltd. | Subsidiary | Purchase | 184,089 | — | 30 days | — | — | (43,149 | ) | — | ||||||||||||||||||||||
| ST-2 Satellite Ventures Pte. Ltd. | Associate | Purchase | 295,538 | — | 30 days | — | — | (47,411 | ) | — | ||||||||||||||||||||||
| Taiwan International Standard Electronics Co., Ltd. | Associate | Purchase | 396,949 | — | 30-90 days | — | — | (264,912 | ) | (2 | ) | |||||||||||||||||||||
| So-net Entertainment Taiwan Limited | Associate | Sales | 107,443 | — | 60 days | — | — | 8 | — | |||||||||||||||||||||||
Senao International Co., Ltd. | Chunghwa Telecom Co., Ltd. | Parent company | Sales | 4,932,109 | 21 | 30-90 days | — | — | 828,219 | 47 | ||||||||||||||||||||||
| Purchase | 1,254,209 | 6 | 30 days | — | — | (475,625 | ) | (17 | ) | |||||||||||||||||||||||
| Aval Technologies Co., Ltd. | Subsidiary | Purchase | 203,480 | 1 | 30 days | — | — | (9,428 | ) | — | ||||||||||||||||||||||
CHIEF Telecom Inc. | Chunghwa Telecom Co., Ltd. | Parent company | Sales | 217,182 | 13 | 60 days | — | — | 42,170 | 21 | ||||||||||||||||||||||
| Purchase | 243,388 | 25 | 30 days | — | — | (43,992 | ) | (36 | ) | |||||||||||||||||||||||
Chunghwa System Integration Co., Ltd. | Chunghwa Telecom Co., Ltd. | Parent company | Sales | 910,293 | 76 | 30 days | — | — | 237,836 | 68 | ||||||||||||||||||||||
Honghwa International Co., Ltd. | Chunghwa Telecom Co., Ltd. | Parent company | Sales | 3,935,219 | 97 | 30-60 days | — | — | 809,565 | 98 | ||||||||||||||||||||||
Donghwa Telecom Co., Ltd. | Chunghwa Telecom Co., Ltd. | Parent company | Sales | 382,157 | 43 | 90 days | — | — | 135,496 | 84 | ||||||||||||||||||||||
| Purchase | 160,699 | 19 | 30 days | — | — | (120,589 | ) | (70 | ) | |||||||||||||||||||||||
Chunghwa Telecom Global, Inc. | Chunghwa Telecom Co., Ltd. | Parent company | Sales | 254,709 | 57 | 90 days | — | — | 56,476 | 73 | ||||||||||||||||||||||
Chunghwa Telecom Singapore Pte., Ltd. | Chunghwa Telecom Co., Ltd. | Parent company | Sales | 140,318 | 15 | 90 days | — | — | 73,608 | 21 | ||||||||||||||||||||||
| Purchase | 114,212 | 13 | 30 days | — | — | (103,552 | ) | (38 | ) | |||||||||||||||||||||||
CHT Security Co., Ltd. | Chunghwa Telecom Co., Ltd. | Parent company | Sales | 184,089 | 89 | 30 days | — | — | 43,149 | 67 | ||||||||||||||||||||||
| Note 1: | Purchase included acquisition of services costs. |
| Note 2: | The differences were because Chunghwa Telecom Co., Ltd. and subsidiaries classified the amount as inventories, property, plant and equipment, intangible assets, and operating expenses. |
| Note 3: | Notes and accounts receivable did not include the amounts collected for others and other receivables. |
| Note 4: | Transaction terms with the related parties were determined in accordance with mutual agreements when there were no similar transactions with third parties. Other transactions with related parties were not significantly different from those with third parties. |
| Note 5: | All inter-company transactions, balances, income and expenses are eliminated upon consolidation. |
- 97 -
TABLE 6
CHUNGHWA TELECOM CO., LTD. AND SUBSIDIARIES
RECEIVABLES FROM RELATED PARTIES AMOUNTING TO AT LEAST NT$100 MILLION OR 20% OF THEPAID-IN CAPITAL
SEPTEMBER 30, 2018
(Amounts in Thousands of New Taiwan Dollars)
Company Name | Related Party | Nature of Relationship | Ending Balance | Turnover Rate (Note 1) | Overdue | Amounts Received in Subsequent Period | Allowance for Bad Debts | |||||||||||||||||||||
| Amounts | Action Taken | |||||||||||||||||||||||||||
Chunghwa Telecom Co., Ltd. | Senao International Co., Ltd. | Subsidiary | $
| 717,976 (Note 2 | ) | 11.55 | $ | — | — | $ | 702,047 | $ | — | |||||||||||||||
| Donghwa Telecom Co., Ltd. | Subsidiary | | 120,589 (Note 2 | ) | 2.42 | — | — | 17,238 | — | |||||||||||||||||||
| Chunghwa Telecom Singapore Pte., Ltd. | Subsidiary | | 103,552 (Note 2 | ) | 1.42 | — | — | 103,552 | — | |||||||||||||||||||
Senao International Co., Ltd. | Chunghwa Telecom Co., Ltd. | Parent company | | 1,082,326 (Note 2 | ) | 6.45 | — | — | 571,074 | — | ||||||||||||||||||
Chunghwa System Integration Co., Ltd. | Chunghwa Telecom Co., Ltd. | Parent company | | 237,836 (Note 2 | ) | 3.15 | — | — | 94,658 | — | ||||||||||||||||||
Honghwa International Co., Ltd. | Chunghwa Telecom Co., Ltd. | Parent company | | 817,808 (Note 2 | ) | 5.70 | — | — | 245,534 | — | ||||||||||||||||||
Donghwa Telecom Co., Ltd. | Chunghwa Telecom Co., Ltd. | Parent company | | 135,496 (Note 2 | ) | 10.69 | — | — | 57,388 | — | ||||||||||||||||||
| Note 1: | Payments and receipts collected in trust for others are excluded from the accounts receivable for calculating the turnover rate. |
| Note 2: | The amount was eliminated upon consolidation. |
- 98 -
TABLE 7
CHUNGHWA TELECOM CO., LTD. AND SUBSIDIARIES
NAMES, LOCATIONS, AND OTHER INFORMATION OF INVESTEES IN WHICH THE COMPANY EXERCISES SIGNIFICANT INFLUENCE (EXCLUDING INVESTMENT IN MAINLAND CHINA)
NINE MONTHS ENDED SEPTEMBER 30, 2018
(Amounts in Thousands of New Taiwan Dollars)
| Original Investment Amount | Balance as of September 30, 2018 | Net Income | Recognized | |||||||||||||||||||||||||||||||||
Investor Company | Investee Company | Location | Main Businesses and Products | September 30, 2018 | December 31, 2017 | Shares (Thousands) | Percentage of Ownership (%) | Carrying Value | (Loss) of the Investee | Gain (Loss) (Notes 1, 2 and 3) | Note | |||||||||||||||||||||||||
Chunghwa Telecom Co., Ltd. | Senao International Co., Ltd. | Taiwan | Handset and peripherals retailer; sales of CHT mobile phone plans as an agent | $ | 1,065,813 | $ | 1,065,813 | 71,773 | 28 | $ | 1,575,107 | $ | 274,310 | $ | 72,916 | Subsidiary (Notes 3 and 7) | ||||||||||||||||||||
Light Era Development Co., Ltd. | Taiwan | Planning and development of real estate and intelligent buildings, and property management | 3,000,000 | 3,000,000 | 300,000 | 100 | 3,853,585 | 7,811 | 7,811 | Subsidiary (Note 7) | ||||||||||||||||||||||||||
Donghwa Telecom Co., Ltd. | Hong Kong | International private leased circuit, IP VPN service, and IP transit services | 1,567,453 | 1,567,453 | 402,590 | 100 | 1,596,194 | 30,462 | 30,462 | Subsidiary (Note 7) | ||||||||||||||||||||||||||
Chunghwa Telecom Singapore Pte., Ltd. | Singapore | International private leased circuit, IP VPN service, and IP transit services | 574,112 | 574,112 | 26,383 | 100 | 956,951 | 94,613 | 94,613 | Subsidiary (Note 7) | ||||||||||||||||||||||||||
Chunghwa System Integration Co., Ltd. | Taiwan | Providing system integration services and telecommunications equipment | 838,506 | 838,506 | 60,000 | 100 | 732,816 | 4,172 | 16,272 | Subsidiary (Note 7) | ||||||||||||||||||||||||||
CHIEF Telecom Inc. | Taiwan | Network integration, internet data center (“IDC”), communications integration and cloud application services | 459,652 | 468,326 | 39,426 | 57 | 1,620,803 | 354,803 | 222,694 | Subsidiary (Note 7) | ||||||||||||||||||||||||||
Chunghwa Investment Co., Ltd. | Taiwan | Investment | 639,559 | 639,559 | 68,085 | 89 | 3,126,847 | 146,708 | 127,525 | Subsidiary (Note 7) | ||||||||||||||||||||||||||
Prime Asia Investments Group Ltd. (B.V.I.) | British Virgin Islands | Investment | 385,274 | 385,274 | 1 | 100 | 193,362 | 360 | 360 | Subsidiary (Note 7) | ||||||||||||||||||||||||||
Honghwa International Co., Ltd. | Taiwan | Telecommunication engineering, sales agent of mobile phone plan application and other business services | 180,000 | 180,000 | 18,000 | 100 | 371,619 | 119,580 | 117,715 | Subsidiary ((Notes 3 and 7) | ||||||||||||||||||||||||||
(Continued)
- 99 -
| Original Investment Amount | Balance as of September 30, 2018 | Net Income | Recognized | |||||||||||||||||||||||||||||||||
Investor Company | Investee Company | Location | Main Businesses and Products | September 30, 2018 | December 31, 2017 | Shares (Thousands) | Percentage of Ownership (%) | Carrying Value | (Loss) of the Investee | Gain (Loss) (Notes 1, 2 and 3) | Note | |||||||||||||||||||||||||
CHYP Multimedia Marketing & Communications Co., Ltd. | Taiwan | Digital information supply services and advertisement services | 150,000 | 150,000 | 15,000 | 100 | 189,278 | 16,600 | 16,600 | Subsidiary (Note 7) | ||||||||||||||||||||||||||
Chunghwa Telecom Vietnam Co., Ltd. | Vietnam | Intelligent energy saving solutions, international circuit, and information and communication technology (“ICT”) services. | 148,275 | 148,275 | — | 100 | 104,404 | (1,377 | ) | (1,377 | ) | Subsidiary (Note 7) | ||||||||||||||||||||||||
Chunghwa Telecom Global, Inc. | United States | International private leased circuit, internet services, and transit services | 70,429 | 70,429 | 6,000 | 100 | 271,880 | 44,723 | 46,414 | Subsidiary (Note 7) | ||||||||||||||||||||||||||
CHT Security Co., Ltd. | Taiwan | Computing equipment installation, wholesale of computing and business machinery equipment and software, management consulting services, data processing services, digital information supply services and internet identify services | 240,000 | 240,000 | 24,000 | 80 | 220,102 | (19,193 | ) | (19,904 | ) | Subsidiary (Note 7) | ||||||||||||||||||||||||
Chunghwa Telecom (Thailand) Co., Ltd. | Thailand | International private leased circuit, IP VPN service, ICT and cloud VAS services | 100,000 | 100,000 | 1,000 | 100 | 95,799 | (1,345 | ) | (1,345 | ) | Subsidiary (Note 7) | ||||||||||||||||||||||||
Spring House Entertainment Tech. Inc. | Taiwan | Software design services, internet contents production and play, and motion picture production and distribution | 62,209 | 62,209 | 10,277 | 56 | 97,956 | 7,158 | 4,011 | Subsidiary (Note 7) | ||||||||||||||||||||||||||
Chunghwa leading Photonics Tech Co., Ltd. | Taiwan | Production and sale of electronic components and finished products | 70,500 | 70,500 | 7,050 | 75 | 95,527 | 22,473 | 21,279 | Subsidiary (Note 7) | ||||||||||||||||||||||||||
Smartfun Digital Co., Ltd. | Taiwan | Providing diversified family education digital services | 65,000 | 65,000 | 6,500 | 65 | 70,118 | 5,605 | 6,301 | Subsidiary (Note 7) | ||||||||||||||||||||||||||
Chunghwa Telecom Japan Co., Ltd. | Japan | International private leased circuit, IP VPN service, and IP transit services | 17,291 | 17,291 | 1 | 100 | 57,053 | 7,499 | 7,499 | Subsidiary (Note 7) | ||||||||||||||||||||||||||
Chunghwa Sochamp Technology Inc. | Taiwan | Design, development and production of Automatic License Plate Recognition software and hardware | 20,400 | 20,400 | 2,040 | 51 | (7,902 | ) | 2,823 | 2,295 | Subsidiary (Note 7) | |||||||||||||||||||||||||
International Integrated System, Inc. | Taiwan | IT solution provider, IT application consultation, system integration and package solution | 283,500 | 283,500 | 22,498 | 32 | 315,475 | 78,889 | 24,699 | Associate | ||||||||||||||||||||||||||
(Continued)
- 100 -
| Original Investment Amount | Balance as of September 30, 2018 | Net Income | Recognized | |||||||||||||||||||||||||||||||||
Investor Company | Investee Company | Location | Main Businesses and Products | September 30, 2018 | December 31, 2017 | Shares (Thousands) | Percentage of Ownership (%) | Carrying Value | (Loss) of the Investee | Gain (Loss) (Notes 1, 2 and 3) | Note | |||||||||||||||||||||||||
Viettel-CHT Co., Ltd. | Vietnam | IDC services | $ | 288,327 | $ | 288,327 | — | 30 | $ | 268,313 | $ | 154,585 | $ | 46,397 | Associate | |||||||||||||||||||||
Taiwan International Standard Electronics Co., Ltd. | Taiwan | Manufacturing, selling, designing, and maintaining of telecommunications systems and equipment | 164,000 | 164,000 | 1,760 | 40 | 149,674 | 48,815 | 68,912 | Associate | ||||||||||||||||||||||||||
Skysoft Co., Ltd. | Taiwan | Providing of musicon-line, software, electronic information, and advertisement services | 67,025 | 67,025 | 4,438 | 30 | 133,553 | (23,567 | ) | (6,413 | ) | Associate | ||||||||||||||||||||||||
So-net Entertainment Taiwan Limited | Taiwan | Online service and sale of computer hardware | 120,008 | 120,008 | 9,429 | 30 | 105,820 | 5,176 | 1,553 | Associate | ||||||||||||||||||||||||||
KingwayTek Technology Co., Ltd. | Taiwan | Publishing books, data processing and software services | 69,013 | 69,013 | 6,993 | 26 | 129,449 | 8,116 | 1,951 | Associate | ||||||||||||||||||||||||||
Taiwan International Ports Logistics Corporation | Taiwan | Import and export storage, logistic warehouse, and ocean shipping service | 80,000 | 80,000 | 8,000 | 27 | 47,958 | (6,320 | ) | (1,673 | ) | Associate | ||||||||||||||||||||||||
Dian Zuan Integrating Marketing Co., Ltd. | Taiwan | Information technology service and general advertisement service | 97,598 | 97,598 | 5,400 | 15 | 11,799 | (36,032 | ) | (5,419 | ) | Associate | ||||||||||||||||||||||||
Alliance Digital Tech Co., Ltd. | Taiwan | Development of mobile payments and information processing service | 60,000 | 60,000 | 6,000 | 14 | 9,218 | (36,600 | ) | (5,270 | ) | Associate | ||||||||||||||||||||||||
Senao International Co., Ltd. | Senao Networks, Inc. | Taiwan | Telecommunication facilities manufactures and sales | 202,758 | 202,758 | 16,579 | 34 | 887,402 | 370,002 | 123,888 | Associate | |||||||||||||||||||||||||
Senao International (Samoa) Holding Ltd. | Samoa Islands | International investment | 2,416,645 | 2,416,645 | 81,175 | 100 | 477,815 | (20,545 | ) | (20,545 | ) | Subsidiary (Note 7) | ||||||||||||||||||||||||
Dian Zuan Integrating Marketing Co., Ltd. | Taiwan | Information technology service and general advertisement service | 24,000 | 24,000 | 2,400 | 7 | 5,378 | (36,032 | ) | (2,411 | ) | Associate | ||||||||||||||||||||||||
Youth Co., Ltd. | Taiwan | Sale of information and communication technologies products | 335,450 | 335,450 | 13,780 | 89 | 179,759 | (12,294 | ) | (60,110 | ) | Subsidiary (Note 7) | ||||||||||||||||||||||||
Aval Technologies Co., Ltd. | Taiwan | Sale of information and communication technologies products | 60,000 | 60,000 | 6,510 | 100 | 69,353 | 3,522 | 3,522 | Subsidiary (Note 7) | ||||||||||||||||||||||||||
SENYOUNG Insurance Agent Co., Ltd. | Taiwan | Property and liability insurance agency | 29,500 | 10,000 | 2,950 | 100 | 20,199 | (8,817 | ) | (8,817 | ) | Subsidiary (Note 7) | ||||||||||||||||||||||||
(Continued)
- 101 -
| Original Investment Amount | Balance as of September 30, 2018 | Net Income | Recognized | |||||||||||||||||||||||||||||||||
Investor Company | Investee Company | Location | Main Businesses and Products | September 30, 2018 | December 31, 2017 | Shares (Thousands) | Percentage of Ownership (%) | Carrying Value | (Loss) of the Investee | Gain (Loss) (Notes 1, 2 and 3) | Note | |||||||||||||||||||||||||
Light Era Development Co., Ltd. | Taoyuan Asia Silicon Valley Innovation Co., Ltd. | Taiwan | Development of real estate | 7,500 | — | 750 | 60 | 6,453 | (1,744 | ) | (1,047 | ) | Subsidiary (Note 7) | |||||||||||||||||||||||
CHIEF Telecom Inc. | Unigate Telecom Inc. | Taiwan | Telecommunications and internet service | 2,000 | 2,000 | 200 | 100 | 906 | (97 | ) | (97 | ) | Subsidiary (Note 7) | |||||||||||||||||||||||
Chief International Corp. | Samoa Islands | Telecommunications and internet service | 6,068 | 6,068 | 200 | 100 | 60,530 | 7,973 | 7,973 | Subsidiary (Note 7) | ||||||||||||||||||||||||||
Chunghwa System Integrated Co., Ltd. | Concord Technology Co., Ltd. | Brunei | Investment | — | 47,321 | — | — | — | — | — | Subsidiary (Notes 4 and 7) | |||||||||||||||||||||||||
Chunghwa Telecom Singapore Pte., Ltd. | ST-2 Satellite Ventures Pte., Ltd. | Singapore | Operation ofST-2 telecommunications satellite | 409,061 | 409,061 | 18,102 | 38 | 558,770 | 216,536 | 82,284 | Associate | |||||||||||||||||||||||||
Chunghwa Investment Co., Ltd. | Chunghwa Precision Test Tech. Co., Ltd. | Taiwan | Production and sale of semiconductor testing components and printed circuit board | 178,608 | 199,736 | 11,230 | 34 | 2,050,190 | 551,453 | 203,060 | Subsidiary (Note 7) | |||||||||||||||||||||||||
CHIEF Telecom Inc. | Taiwan | Network integration, internet data center (“IDC”), communications integration and cloud application services | 19,064 | 19,422 | 2,078 | 3 | 82,035 | 354,803 | 11,862 | Associate (Note 7) | ||||||||||||||||||||||||||
Senao International Co., Ltd. | Taiwan | Selling and maintaining mobile phones and its peripheral products | 49,731 | 49,731 | 1,001 | — | 42,804 | 274,310 | 1,004 | Associate (Note 7) | ||||||||||||||||||||||||||
Chunghwa Precision Test Tech. Co., Ltd. | Chunghwa Precision Test Tech USA Corporation | United States | Design and after-sale services of semiconductor testing components and printed circuit board | 12,636 | 12,636 | 400 | 100 | 23,916 | 792 | 792 | Subsidiary (Note 7) | |||||||||||||||||||||||||
CHPT Japan Co., Ltd. | Japan | Related services of electronic parts, machinery processed products and printed circuit board | 2,008 | 2,008 | 1 | 100 | 2,262 | 100 | 100 | Subsidiary (Note 7) | ||||||||||||||||||||||||||
Chunghwa Precision Test Tech. International, Ltd. | Samoa Islands | Wholesale and retail of electronic materials, and investment | 54,450 | 54,450 | 1,700 | 100 | 41,813 | (4,420 | ) | (4,420 | ) | Subsidiary (Note 7) | ||||||||||||||||||||||||
Prime Asia Investments Group, | Chunghwa Hsingta Co., Ltd. | Hong Kong | Investment | 375,274 | 375,274 | 1 | 100 | 206,602 | (358 | ) | (358 | ) | Subsidiary (Note 7) | |||||||||||||||||||||||
Ltd. (B.V.I.) | MeWorks Limited (HK) | Hong Kong | Investment | 10,000 | 10,000 | — | 20 | — | — | — | Associate | |||||||||||||||||||||||||
(Continued)
- 102 -
| Original Investment Amount | Balance as of September 30, 2018 | Net Income | Recognized | |||||||||||||||||||||||||||||||||
Investor Company | Investee Company | Location | Main Businesses and Products | September 30, 2018 | December 31, 2017 | Shares (Thousands) | Percentage of Ownership (%) | Carrying Value | (Loss) of the Investee | Gain (Loss) (Notes 1, 2 and 3) | Note | |||||||||||||||||||||||||
Senao International (Samoa) | Senao International HK Limited | Hong Kong | International investment | $ | 2,393,646 | $ | 2,393,646 | 80,440 | 100 | $ | 439,512 | $ | (20,452 | ) | $ | (20,452 | ) | Subsidiary (Note 7) | ||||||||||||||||||
Holding Ltd. | HopeTech Technologies Limited | Hong Kong | Information technology and telecommunications products sales | — | 21,177 | — | — | — | (330 | ) | (149 | ) | Associate (Note 5) | |||||||||||||||||||||||
Youth Co., Ltd. | ISPOT Co., Ltd. | Taiwan | Sale of information and communication technologies products | 53,021 | 53,021 | — | 100 | 9,152 | (5,259 | ) | (10,062 | ) | Subsidiary (Note 7) | |||||||||||||||||||||||
Youyi Co., Ltd. | Taiwan | Maintenance of information and communication technologies products | 21,354 | 21,354 | — | 100 | 17,011 | 1,539 | 1,267 | Subsidiary (Note 7) | ||||||||||||||||||||||||||
CHYP Multimedia Marketing & Communications Co., Ltd | Click Force Marketing Company | Taiwan | Advertisement services | 44,607 | 44,607 | 1,078 | 49 | 37,297 | 5,663 | 1,181 | Associate | |||||||||||||||||||||||||
| Note 1: | The amounts were based on reviewed financial statements. |
| Note 2: | Recognized gain (loss) of investees includes amortization of differences between the investment cost and net value and elimination of unrealized transactions. |
| Note 3: | Recognized gain (loss) and carrying value of the investees did not include the adjustment of the difference between the accounting treatment on standalone basis and consolidated basis as a result of the application of IFRS 15. |
| Note 4: | Concord Technology Co., Ltd. was approved to end and dissolve its business in August 2017. The liquidation of Concord was completed in January 2018. |
| Note 5: | Senao International (Samoa) Holding Ltd disposed all shares of HopeTech Technologies Limited in June 2018. |
| Note 6: | Investment in mainland China is included in Table 8. |
| Note 7: | The amount was eliminated upon consolidation. |
(Concluded)
- 103 -
TABLE 8
CHUNGHWA TELECOM CO., LTD. AND SUBSIDIARIES
INVESTMENT IN MAINLAND CHINA
NINE MONTHS ENDED SEPTEMBER 30, 2018
(Amounts in Thousands of New Taiwan Dollars)
Investee | Main Businesses and Products | Total Amount ofPaid-in Capital | Investment Type (Note 1) | Accumulated Outflow of Investment from Taiwan as of January 1, 2018 | Investment Flows | Accumulated Outflow of Investment from Taiwan as of September 30, 2018 | Net Income (Loss) of the Investee | % Ownership of Direct or Indirect Investment | Investment Gain (Loss) (Note 2) | Carrying Value as of September 30, 2018 | Accumulated Inward Remittance of Earnings as of September 30, 2018 | Note | ||||||||||||||||||||||||||||||||||||||
| Outflow | Inflow | |||||||||||||||||||||||||||||||||||||||||||||||||
Senao Trading (Fujian) Co., Ltd. | Sale of information and communication technologies products | $ | 1,073,170 | 2 | $ | 1,073,170 | $ | — | $ | — | $ | 1,073,170 | $ | 5,829 | 100 | $ | 5,829 | $ | 192,501 | $ | — | | Notes 7 and 11 | | ||||||||||||||||||||||||||
Senao International Trading (Shanghai) Co., Ltd. | Sale of information and communication technologies products | 955,838 | 2 | 955,838 | — | — | 955,838 | (26,295 | ) | 100 | (26,295 | ) | 87,610 | — | Note 11 | |||||||||||||||||||||||||||||||||||
Senao International Trading (Shanghai) Co., Ltd. (Note 11) | Maintenance of information and communication technologies products | 87,540 | 2 | 87,540 | — | — | 87,540 | (968 | ) | — | (968 | ) | — | — | | Notes 8 and 11 | | |||||||||||||||||||||||||||||||||
Senao International Trading (Jiangsu) Co., Ltd. | Sale of information and communication technologies products | 263,736 | 2 | 263,736 | — | — | 263,736 | 2,234 | 100 | 2,234 | 88,839 | — | | Notes 9 and 11 | | |||||||||||||||||||||||||||||||||||
Chunghwa Telecom (China) Co., Ltd. | Integrated information and communication solution services for enterprise clients, and intelligent energy network service | 177,176 | 2 | 177,176 | — | — | 177,176 | (418 | ) | 100 | (418 | ) | 52,318 | — | Note 11 | |||||||||||||||||||||||||||||||||||
Jiangsu Zhenghua Information Technology Company, LLC | Providing intelligent energy saving solution and intelligent buildings services | 189,410 | 2 | 142,057 | — | — | 142,057 | (551 | ) | 75 | (413 | ) | 109,995 | — | | Notes 10 and 11 | | |||||||||||||||||||||||||||||||||
Shanghai Taihua Electronic Technology Limited | Design of printed circuit board and related consultation service | 51,233 | 2 | 51,233 | — | — | 51,233 | (4,450 | ) | 100 | (4,450 | ) | 38,688 | — | Note 11 | |||||||||||||||||||||||||||||||||||
Shanghai Chief Telecom Co., Ltd. | Telecommunications and internet service | 10,150 | 1 | 4,973 | — | — | 4,973 | 2,963 | 49 | 1,452 | 7,273 | — | Note 11 | |||||||||||||||||||||||||||||||||||||
(Continued)
- 104 -
Investee | Accumulated Investment in Mainland China as of September 30, 2018 | Investment Amounts Authorized by Investment Commission, MOEA | Upper Limit on Investment Stipulated by Investment Commission, MOEA | |||||||||
SENAO and its subsidiaries (Note 3) | $ | 2,380,284 | $ | 2,380,284 | $ | 3,421,221 | ||||||
Chunghwa Telecom (China) Co., Ltd. (Note 4) | 177,176 | 177,176 | 227,033,629 | |||||||||
Jiangsu Zhenghua Information Technology Company, LLC (Note 4) | 142,057 | 142,057 | 227,033,629 | |||||||||
Shanghai Taihua Electronic Technology Limited (Note 5) | 51,233 | 97,965 | 3,591,573 | |||||||||
Shanghai Chief Telecom Co., Ltd. (Note 6) | 4,973 | 4,973 | 1,629,843 | |||||||||
| Note 1: | Investments are divided into three categories as follows: |
| a. | Direct investment. |
| b. | Investments through a holding company registered in a third region. |
| c. | Others. |
| Note 2: | The amounts were calculated based on the investee’s reviewed financial statements. |
| Note 3: | Senao International Co., Ltd. and its subsidiaries were calculated based on the consolidated net assets value of Senao International Co., Ltd. |
| Note 4: | Chunghwa Telecom (China) Co., Ltd. and Jiangsu Zhenghua Information Technology Company, LLC were calculated based on the consolidated net assets value of Chunghwa Telecom Co., Ltd. |
| Note 5: | Shanghai Taihua Electronic Technology Limited was calculated based on the consolidated net assets value of Chunghwa Precision Test Tech. Co., Ltd. |
| Note 6: | Shanghai Chief Telecom Co., Ltd. was calculated based on the consolidated net assets value of CHIEF Telecom Inc. |
| Note 7: | Senao Trading (Fujian) Co., Ltd. was approved to end its business and dissolve in September 2018. The liquidation of Senao Trading (Fujian) Co., Ltd. is still in process. |
| Note 8: | The liquidation of Senao International Trading (Shanghai) Co., Ltd. was completed in March 2018. |
| Note 9: | Senao International Trading (Jiangsu) Co., Ltd. was approved to end its business and dissolve in April 2018. The liquidation of Senao International Trading (Jiangsu) Co., Ltd. is still in process. |
| Note 10: | Jiangsu Zhenhua Information Technology Company, LLC. was approved to end its business and dissolve in May 2016. The liquidation of Jiangsu Zhenhua Information Technology Company, LLC. is still in process. |
| Note 11: | The amount was eliminated upon consolidation. |
| Note 12: | The English name is the same as the above entity; however the Chinese name included in the respective Articles of Incorporations is different from the above entity. |
(Concluded)
- 105 -
TABLE 9
CHUNGHWA TELECOM CO., LTD. AND SUBSIDIARIES
INTERCOMPANY RELATIONSHIPS AND SIGNIFICANT TRANSACTIONS
NINE MONTHS ENDED SEPTEMBER 30, 2018
(Amounts in Thousands of New Taiwan Dollars)
Year | No. (Note 1) | Company Name | Related Party | Nature of Relationship (Note 2) | Transaction Details | |||||||||||||||||||
Financial Statement Account | Amount (Note 5) | Payment Terms (Note 3) | % to Total Sales or Assets (Note 4) | |||||||||||||||||||||
2018 | 0 | Chunghwa Telecom Co., Ltd. | Senao International Co., Ltd. | a | Accounts receivable | $ | 495,272 | — | — | |||||||||||||||
| Accrued custodial receipts | 222,704 | — | — | |||||||||||||||||||||
| Inventories | 48,027 | — | — | |||||||||||||||||||||
| Accounts payable | 823,943 | — | — | |||||||||||||||||||||
| Amounts collected for others | 258,383 | — | — | |||||||||||||||||||||
| Revenues | 1,392,313 | — | 1 | |||||||||||||||||||||
| Operating costs and expenses | 1,064,093 | — | 1 | |||||||||||||||||||||
| CHIEF Telecom Inc. | a | Accounts receivable | 44,085 | — | — | |||||||||||||||||||
| Accounts payable | 42,170 | — | — | |||||||||||||||||||||
| Revenues | 243,790 | — | — | |||||||||||||||||||||
| Operating costs and expenses | 217,182 | — | — | |||||||||||||||||||||
| CHYP Multimedia Marketing & | a | Accounts payable | 35,038 | — | — | |||||||||||||||||||
| Communications Co., Ltd. | Amounts collected for others | 63,768 | — | — | ||||||||||||||||||||
| Revenues | 22,588 | — | — | |||||||||||||||||||||
| Operating costs and expenses | 86,896 | — | — | |||||||||||||||||||||
| Chunghwa System Integration Co., Ltd. | a | Accounts receivable | 28,137 | �� | — | |||||||||||||||||||
| Accounts payable | 239,111 | — | — | |||||||||||||||||||||
| Revenues | 14,154 | — | — | |||||||||||||||||||||
| Operating costs and expenses | 512,205 | — | — | |||||||||||||||||||||
| Inventories | 103,372 | — | — | |||||||||||||||||||||
| Prepayments | 98,392 | — | — | |||||||||||||||||||||
| Property, plant and equipment | 211,064 | — | — | |||||||||||||||||||||
| Intangible assets | 46,961 | — | — | |||||||||||||||||||||
| Chunghwa Telecom Global Inc. | a | Accounts receivable | 18,532 | — | — | |||||||||||||||||||
| Accounts payable | 56,476 | — | — | |||||||||||||||||||||
| Revenues | 41,564 | — | — | |||||||||||||||||||||
| Operating costs and expenses | 254,709 | — | — | |||||||||||||||||||||
| Donghwa Telecom Co., Ltd. | a | Accounts receivable | 120,589 | — | — | |||||||||||||||||||
| Accounts payable | 135,496 | — | — | |||||||||||||||||||||
| Revenues | 160,699 | — | — | |||||||||||||||||||||
| Operating costs and expenses | 382,157 | — | — | |||||||||||||||||||||
| Chunghwa Telecom Japan Co., Ltd. | a | Accounts receivable | 16,861 | — | — | |||||||||||||||||||
| Accounts payable | 16,959 | — | — | |||||||||||||||||||||
| Revenues | 10,292 | — | — | |||||||||||||||||||||
| Operating costs and expenses | 66,552 | — | — | |||||||||||||||||||||
| Light Era Development Co., Ltd. | a | Operating costs and expenses | 45,120 | — | — | |||||||||||||||||||
(Continued)
- 106 -
Year | No. (Note 1) | Company Name | Related Party | Nature of Relationship (Note 2) | Transaction Details | |||||||||||||||||||
Financial Statement Account | Amount (Note 5) | Payment Terms (Note 3) | % to Total Sales or Assets (Note 4) | |||||||||||||||||||||
| Chunghwa Telecom Singapore Pte., Ltd. | a | Accounts receivable | $ | 103,552 | — | — | ||||||||||||||||||
| Accounts payable | 73,608 | — | — | |||||||||||||||||||||
| Revenues | 114,212 | — | — | |||||||||||||||||||||
| Operating costs and expenses | 140,318 | — | — | |||||||||||||||||||||
| Chunghwa Sochamp Technology Inc. | a | Accounts payable | 27,219 | — | — | |||||||||||||||||||
| Operating costs and expenses | 16,558 | — | — | |||||||||||||||||||||
| Honghwa International Co., Ltd. | a | Accounts payable | 809,565 | — | — | |||||||||||||||||||
| Revenues | 14,842 | — | — | |||||||||||||||||||||
| Operating costs and expenses | 3,932,695 | — | 2 | |||||||||||||||||||||
| Property, plant and equipment | 35,682 | — | — | |||||||||||||||||||||
| Chunghwa Telecom (Thailand) Co., Ltd. | a | Operating costs and expenses | 18,659 | — | — | |||||||||||||||||||
| CHT Security Co., Ltd. | a | Accounts payable | 43,149 | — | — | |||||||||||||||||||
| Revenues | 14,916 | — | — | |||||||||||||||||||||
| Operating costs and expenses | 184,089 | — | — | |||||||||||||||||||||
| Aval Technologies Co., Ltd. | a | Operating costs and expenses | 41,838 | — | — | |||||||||||||||||||
| 1 | Light Era Development Co., Ltd. | CHIEF Telecom Inc. | c | Revenues | 71,390 | — | — | |||||||||||||||||
| 2 | Chunghwa Telecom Singapore Pte., Ltd. | Donghwa Telecom Co., Ltd. | c | Prepayments | 18,769 | — | — | |||||||||||||||||
| Note 1: | Significant transactions between the Company and its subsidiaries or among subsidiaries are numbered as follows: |
| a. | “0” for the Company. |
| b. | Subsidiaries are numbered from “1”. |
| Note 2: | Related party transactions are divided into three categories as follows: |
| a. | The Company to subsidiaries. |
| b. | Subsidiaries to the Company. |
| c. | Subsidiaries to subsidiaries. |
| Note 3: | Transaction terms with the related parties were determined in accordance with mutual agreements when there were no similar transactions with third parties. Other transactions with related parties were not significantly different from those with third parties. |
| Note 4: | For assets and liabilities, amount is shown as a percentage to consolidated total assets as of September 30, 2018, while revenues, costs and expenses are shown as a percentage to consolidated revenues for the nine months ended September 30, 2018. |
| Note 5: | The amount was eliminated upon consolidation. |
(Concluded)
- 107 -