Exhibit 99.2
REPRESENTATION LETTER
The entities that are required to be included in the consolidated financial statements of affiliates in accordance with the “Criteria Governing Preparation of Affiliation Reports, Consolidated Business Reports and Consolidated Financial Statements of Affiliated Enterprises” for the year ended December 31, 2019 are all the same as those included in the consolidated financial statements of Chunghwa Telecom Co., Ltd. and its subsidiaries prepared in conformity with the International Financial Reporting Standard 10 “Consolidated Financial Statements”. Relevant information that should be disclosed in the consolidated financial statements of affiliates is included in the consolidated financial statements of Chunghwa Telecom Co., Ltd. and its subsidiaries. Hence, we do not prepare a separate set of consolidated financial statements of affiliates.
Very truly yours,
CHUNGHWA TELECOM CO., LTD.
By
/s/Chi-Mau Sheih |
| Chi-Mau Sheih |
| Chairman |
February 26, 2020
- 1 -
INDEPENDENT AUDITORS’ REPORT
The Board of Directors and Stockholders
Chunghwa Telecom Co., Ltd.
Opinion
We have audited the accompanying consolidated financial statements of Chunghwa Telecom Co., Ltd. and its subsidiaries (the Company), which comprise the consolidated balance sheets as of December 31, 2019 and 2018, and the consolidated statements of comprehensive income, changes in equity and cash flows for the years then ended, and the related notes to the consolidated financial statements, including a summary of significant accounting policies.
In our opinion, the accompanying consolidated financial statements present fairly, in all material respects, the consolidated financial position of the Company as of December 31, 2019 and 2018, and its consolidated financial performance and its consolidated cash flows for the years then ended in accordance with the Regulations Governing the Preparation of Financial Reports by Securities Issuers and International Financial Reporting Standards (IFRS), International Accounting Standards (IAS), IFRIC Interpretations (IFRIC), and SIC Interpretations (SIC) endorsed and issued into effect by the Financial Supervisory Commission of the Republic of China.
Basis for Opinion
We conducted our audits in accordance with the Regulations Governing Auditing and Attestation of Financial Statements by Certified Public Accountants and auditing standards generally accepted in the Republic of China. Our responsibilities under those standards are further described in the Auditors’ Responsibilities for the Audit of the Consolidated Financial Statements section of our report. We are independent of the Company in accordance with The Norm of Professional Ethics for Certified Public Accountant of the Republic of China, and we have fulfilled our other ethical responsibilities in accordance with these requirements. We believe that the audit evidence we have obtained is sufficient and appropriate to provide a basis for our opinion.
Key Audit Matters
Key audit matters are those matters that, in our professional judgment, were of most significance in our audit of the consolidated financial statements for the year ended December 31, 2019. These matters were addressed in the context of our audit of the consolidated financial statements as a whole, and in forming our opinion thereon, and we do not provide a separate opinion on these matters.
- 2 -
The descriptions of the key audit matters of the consolidated financial statements for the year ended December 31, 2019 are as follows:
Revenue Recognition on Mobile Service
Key audit matter:
Refer to Notes 3 and 28 to the consolidated financial statements.
The Company’s mobile service revenue consists of subscriber-based charges made up of a significant volume oflow-dollar transactions. Because of the complexity and a variety of subscriber-based charges as well as a large number of transactions, the Company uses highly automated systems to process and record its revenue transactions.
Given the Company’s systems to process and record revenue are highly automated, auditing revenue was complex and challenging due to the extent of audit effort required and involvement of professionals with expertise in information technology (IT) necessary for us to identify, test, and evaluate the Company’s IT systems.
Corresponding audit procedures:
Our audit procedures related to the Company’s systems to process revenue transactions included the following, among others:
| • | With the assistance of our IT specialists, we: |
| • | Identified the significant systems used to process revenue transactions and tested the general IT controls over each of these systems, including testing of user access controls and change management controls. |
| • | Performed testing of system interface controls and automated controls within the relevant revenue streams, as well as the controls designed to ensure the accuracy and completeness of revenue. |
| • | We tested internal controls within the relevant revenue business processes, including those in place to reconcile the various systems to the Company’s accounting system. |
| • | We selected samples from mobile service revenue and agreed to customer contracts and records of cash receipts. |
Revenue Recognition on Project Business
Key audit matter:
Refer to Notes 3 and 4 to the consolidated financial statements.
The Company’s project business is highly customized and mainly provides customers with combinations of various equipment and/or services. Project business contracts may likely outsource partial or substantial part of the obligations or services to third parties. The accounting for these contracts requires judgement, particularly as it relates to the determination of the Company acting as a principal or an agent.
Given the judgments on whether the Company is acting as a principal or an agent is required in order to determine if revenue should be recognized gross as principal versus net as agent, auditing such revenue required extensive audit effort due to the volume of contracts and involved a high degree of judgment when performing audit procedures and evaluating the result of these procedures.
- 3 -
Corresponding audit procedures:
Our audit procedures related to management’s revenue recognition on project business included the following, among others:
| • | We tested the effectiveness of controls over project business revenue, including those over principal-versus-agent considerations and revenue recognition. |
| • | We performed the following audit procedures on a sample basis: |
| • | Obtained project business contracts and the evaluation documentation prepared by management and determined the reasonableness of management’s judgement on whether the Company is acting as a principal or an agent after considering whether the Company is the primary obligation provider, its exposures to inventory risks and the discretion in establishing the prices by reviewing the contractual terms, comparing to the business substance and evaluating if it is consistent with relevant accounting standards. |
| • | Performed detail transaction testing by agreeing the amounts recognized to source documents and testing the mathematical accuracy of the recorded revenue. |
| • | Confirmed project business contract terms with customers. |
Emphasis of Matter
As disclosed in Note 5 to the consolidated financial statements, the Company initially applied IFRS 16 “Leases” in 2019. Our audit opinion is not modified in respect of this matter.
Other Matter
We have also audited the parent company only financial statements of Chunghwa Telecom Co., Ltd. as of and for the years ended December 31, 2019 and 2018 on which we have issued an unmodified opinion with emphasis of matter.
Responsibilities of Management and Those Charged with Governance for the Consolidated Financial Statements
Management is responsible for the preparation and fair presentation of the consolidated financial statements in accordance with the Regulations Governing the Preparation of Financial Reports by Securities Issuers and IFRS, IAS, IFRIC, and SIC endorsed and issued into effect by the Financial Supervisory Commission of the Republic of China, and for such internal control as management determines is necessary to enable the preparation of the consolidated financial statements that are free from material misstatement, whether due to fraud or error.
In preparing the consolidated financial statements, management is responsible for assessing the Company’s ability to continue as a going concern, disclosing, as applicable, matters related to going concern and using the going concern basis of accounting unless management either intends to liquidate the Company or to cease operations, or has no realistic alternative but to do so.
Those charged with governance, including the audit committee, are responsible for overseeing the Company’s financial reporting process.
Auditors’ Responsibilities for the Audit of the Consolidated Financial Statements
Our objectives are to obtain reasonable assurance about whether the consolidated financial statements as a whole are free from material misstatement, whether due to fraud or error, and to issue an auditors’ report that includes our opinion. Reasonable assurance is a high level of assurance, but is not a guarantee that an audit conducted in accordance with the auditing standards generally accepted in the Republic of China will always detect a material misstatement when it exists. Misstatements can arise from fraud or error and are considered material if, individually or in the aggregate, they could reasonably be expected to influence the economic decisions of users taken on the basis of these consolidated financial statements.
- 4 -
As part of an audit in accordance with the auditing standards generally accepted in the Republic of China, we exercise professional judgment and maintain professional skepticism throughout the audit. We also:
| 1. | Identify and assess the risks of material misstatement of the consolidated financial statements, whether due to fraud or error, design and perform audit procedures responsive to those risks, and obtain audit evidence that is sufficient and appropriate to provide a basis for our opinion. The risk of not detecting a material misstatement resulting from fraud is higher than for one resulting from error, as fraud may involve collusion, forgery, intentional omissions, misrepresentations, or the override of internal control. |
| 2. | Obtain an understanding of internal control relevant to the audit in order to design audit procedures that are appropriate in the circumstances, but not for the purpose of expressing an opinion on the effectiveness of the Company’s internal control. |
| 3. | Evaluate the appropriateness of accounting policies used and the reasonableness of accounting estimates and related disclosures made by management. |
| 4. | Conclude on the appropriateness of management’s use of the going concern basis of accounting and, based on the audit evidence obtained, whether a material uncertainty exists related to events or conditions that may cast significant doubt on the Company’s ability to continue as a going concern. If we conclude that a material uncertainty exists, we are required to draw attention in our auditors’ report to the related disclosures in the consolidated financial statements or, if such disclosures are inadequate, to modify our opinion. Our conclusions are based on the audit evidence obtained up to the date of our auditors’ report. However, future events or conditions may cause the Company to cease to continue as a going concern. |
| 5. | Evaluate the overall presentation, structure and content of the consolidated financial statements, including the disclosures, and whether the consolidated financial statements represent the underlying transactions and events in a manner that achieves fair presentation. |
| 6. | Obtain sufficient appropriate audit evidence regarding the financial information of the entities or business activities within the Company to express an opinion on the consolidated financial statements. We are responsible for the direction, supervision, and performance of the group audit. We remain solely responsible for our audit opinion. |
We communicate with those charged with governance regarding, among other matters, the planned scope and timing of the audit and significant audit findings, including any significant deficiencies in internal control that we identify during our audit.
We also provide those charged with governance with a statement that we have complied with relevant ethical requirements regarding independence, and to communicate with them all relationships and other matters that may reasonably be thought to bear on our independence, and where applicable, related safeguards.
From the matters communicated with those charged with governance, we determine those matters that were of most significance in the audit of the consolidated financial statements for the year ended December 31, 2019 and are therefore the key audit matters. We describe these matters in our auditors’ report unless law or regulation precludes public disclosure about the matter or when, in extremely rare circumstances, we determine that a matter should not be communicated in our report because the adverse consequences of doing so would reasonably be expected to outweigh the public interest benefits of such communication.
- 5 -
The engagement partners on the audit resulting in this independent auditors’ report are Mr. Dien Sheng Chang and Mr. Ching Pin Shih.
/s/ Dien Sheng Chang | /s/ Ching Pin Shih | |||||
| Deloitte & Touche | ||||||
| Taipei, Taiwan | ||||||
| Republic of China | ||||||
February 26, 2020
Notice to Readers
The accompanying consolidated financial statements are intended only to present the consolidated financial position, financial performance and cash flows in accordance with accounting principles and practices generally accepted in the Republic of China and not those of any other jurisdictions. The standards, procedures and practices to audit such consolidated financial statements are those generally applied in the Republic of China.
For the convenience of readers, the independent auditors’ report and the accompanying consolidated financial statements have been translated into English from the original Chinese version prepared and used in the Republic of China. If there is any conflict between the English version and the original Chinese version or any difference in the interpretation of the two versions, the Chinese-language independent auditors’ report and consolidated financial statements shall prevail.
- 6 -
CHUNGHWA TELECOM CO., LTD. AND SUBSIDIARIES
CONSOLIDATED BALANCE SHEETS
DECEMBER 31, 2019 AND 2018
(In Thousands of New Taiwan Dollars)
| 2019 | 2018 | |||||||||||||||
| Amount | % | Amount | % | |||||||||||||
ASSETS | ||||||||||||||||
CURRENT ASSETS | ||||||||||||||||
Cash and cash equivalents (Notes 3 and 6) | $ | 34,049,643 | 7 | $ | 27,644,780 | 6 | ||||||||||
Financial assets at fair value through profit or loss (Notes 3, 4 and 7) | 516 | — | — | — | ||||||||||||
Hedging financial assets (Notes 3 and 20) | 327 | — | 1,069 | — | ||||||||||||
Contract assets (Notes 3 and 28) | 4,441,196 | 1 | 4,868,728 | 1 | ||||||||||||
Trade notes and accounts receivable, net (Notes 3, 4, 9 and 28) | 26,407,783 | 6 | 30,075,503 | 7 | ||||||||||||
Receivables from related parties (Note 36) | 16,834 | — | 24,270 | — | ||||||||||||
Inventories (Notes 3, 4, 10 and 37) | 17,344,276 | 4 | 15,120,715 | 3 | ||||||||||||
Prepayments (Notes 5, 11 and 36) | 1,883,259 | — | 1,872,984 | — | ||||||||||||
Other current monetary assets (Notes 12 and 26) | 7,498,564 | 2 | 9,504,203 | 2 | ||||||||||||
Other current assets (Notes 19, 30 and 37) | 2,429,664 | — | 2,576,084 | 1 | ||||||||||||
|
|
|
|
|
|
|
| |||||||||
Total current assets | 94,072,062 | 20 | 91,688,336 | 20 | ||||||||||||
|
|
|
|
|
|
|
| |||||||||
NONCURRENT ASSETS | ||||||||||||||||
Financial assets at fair value through profit or loss (Notes 3, 4 and 7) | 778,105 | — | 517,362 | — | ||||||||||||
Financial assets at fair value through other comprehensive income (Notes 3, 4 and 8) | 7,268,917 | 2 | 6,932,503 | 2 | ||||||||||||
Investments accounted for using equity method (Notes 3 and 14) | 7,354,226 | 2 | 2,944,890 | 1 | ||||||||||||
Contract assets (Notes 3 and 28) | 2,600,913 | — | 2,343,958 | — | ||||||||||||
Property, plant and equipment (Notes 3, 4, 5, 15, 36 and 37) | 283,694,215 | 59 | 288,914,228 | 61 | ||||||||||||
Right-of-use assets (Notes 3, 4, 5 and 16) | 11,364,249 | 2 | — | — | ||||||||||||
Investment properties (Notes 3, 4 and 17) | 8,169,393 | 2 | 8,287,212 | 2 | ||||||||||||
Intangible assets (Notes 3, 4 and 18) | 47,046,525 | 10 | 50,943,682 | 11 | ||||||||||||
Deferred income tax assets (Notes 3, 5 and 30) | 3,258,607 | 1 | 3,553,856 | 1 | ||||||||||||
Incremental costs of obtaining contracts (Notes 3 and 28) | 942,652 | — | 1,335,030 | — | ||||||||||||
Net defined benefit assets (Notes 3, 4 and 26) | 2,127,335 | — | 1,164,088 | — | ||||||||||||
Prepayments (Notes 5, 11 and 36) | 2,679,335 | 1 | 3,463,337 | 1 | ||||||||||||
Other noncurrent assets (Notes 19 and 37) | 6,101,704 | 1 | 5,180,222 | 1 | ||||||||||||
|
|
|
|
|
|
|
| |||||||||
Total noncurrent assets | 383,386,176 | 80 | 375,580,368 | 80 | ||||||||||||
|
|
|
|
|
|
|
| |||||||||
TOTAL | $ | 477,458,238 | 100 | $ | 467,268,704 | 100 | ||||||||||
|
|
|
|
|
|
|
| |||||||||
LIABILITIES AND EQUITY | ||||||||||||||||
CURRENT LIABILITIES | ||||||||||||||||
Short-term loans (Note 21) | $ | 90,000 | — | $ | 100,000 | — | ||||||||||
Financial liabilities at fair value through profit or loss (Notes 3, 4 and 7) | 239 | — | 1,114 | — | ||||||||||||
Contract liabilities (Notes 3, 5 and 28) | 16,839,830 | 4 | 10,687,772 | 2 | ||||||||||||
Trade notes and accounts payable (Note 23) | 15,312,274 | 3 | 20,464,792 | 5 | ||||||||||||
Payables to related parties (Note 36) | 653,983 | — | 917,951 | — | ||||||||||||
Current tax liabilities (Notes 3 and 30) | 4,020,670 | 1 | 4,390,203 | 1 | ||||||||||||
Lease liabilities (Notes 3, 4, 5, 16,33 and 36) | 3,291,330 | 1 | — | — | ||||||||||||
Other payables (Notes 5 and 24) | 22,952,488 | 5 | 23,315,383 | 5 | ||||||||||||
Provisions (Notes 3 and 25) | 206,942 | — | 128,200 | — | ||||||||||||
Other current liabilities (Note 5) | 983,789 | — | 1,381,606 | — | ||||||||||||
|
|
|
|
|
|
|
| |||||||||
Total current liabilities | 64,351,545 | 14 | 61,387,021 | 13 | ||||||||||||
|
|
|
|
|
|
|
| |||||||||
NONCURRENT LIABILITIES | ||||||||||||||||
Contract liabilities (Notes 3, 5 and 28) | 6,841,485 | 2 | 2,595,149 | 1 | ||||||||||||
Long-term loans (Notes 22 and 37) | 1,600,000 | — | 1,600,000 | — | ||||||||||||
Deferred income tax liabilities (Notes 3, 5 and 30) | 1,912,305 | — | 1,991,843 | — | ||||||||||||
Provisions (Notes 3 and 25) | 97,382 | — | 78,627 | — | ||||||||||||
Lease liabilities (Notes 3, 4, 5, 16, 33 and 36) | 6,466,808 | 1 | — | — | ||||||||||||
Customers’ deposits (Note 36) | 4,747,644 | 1 | 4,716,571 | 1 | ||||||||||||
Net defined benefit liabilities (Notes 3, 4 and 26) | 3,504,617 | 1 | 3,533,936 | 1 | ||||||||||||
Other noncurrent liabilities (Note 5) | 1,542,687 | — | 4,793,237 | 1 | ||||||||||||
|
|
|
|
|
|
|
| |||||||||
Total noncurrent liabilities | 26,712,928 | 5 | 19,309,363 | 4 | ||||||||||||
|
|
|
|
|
|
|
| |||||||||
Total liabilities | 91,064,473 | 19 | 80,696,384 | 17 | ||||||||||||
|
|
|
|
|
|
|
| |||||||||
EQUITY ATTRIBUTABLE TO STOCKHOLDERS OF THE PARENT (Notes 5, 13 and 27) | ||||||||||||||||
Common stocks | 77,574,465 | 16 | 77,574,465 | 17 | ||||||||||||
|
|
|
|
|
|
|
| |||||||||
Additionalpaid-in capital | 171,255,985 | 36 | 171,136,764 | 36 | ||||||||||||
|
|
|
|
|
|
|
| |||||||||
Retained earnings | ||||||||||||||||
Legal reserve | 77,574,465 | 16 | 77,574,465 | 17 | ||||||||||||
Special reserve | 2,675,419 | 1 | 2,675,419 | 1 | ||||||||||||
Unappropriated earnings | 46,341,361 | 10 | 47,141,345 | 10 | ||||||||||||
|
|
|
|
|
|
|
| |||||||||
Total retained earnings | 126,591,245 | 27 | 127,391,229 | 28 | ||||||||||||
|
|
|
|
|
|
|
| |||||||||
Other adjustments | 688,548 | — | 459,914 | — | ||||||||||||
|
|
|
|
|
|
|
| |||||||||
Total equity attributable to stockholders of the parent | 376,110,243 | 79 | 376,562,372 | 81 | ||||||||||||
NONCONTROLLING INTERESTS (Notes 5, 13 and 27) | 10,283,522 | 2 | 10,009,948 | 2 | ||||||||||||
|
|
|
|
|
|
|
| |||||||||
Total equity | 386,393,765 | 81 | 386,572,320 | 83 | ||||||||||||
|
|
|
|
|
|
|
| |||||||||
TOTAL | $ | 477,458,238 | 100 | $ | 467,268,704 | 100 | ||||||||||
|
|
|
|
|
|
|
| |||||||||
The accompanying notes are an integral part of the consolidated financial statements.
- 7 -
CHUNGHWA TELECOM CO., LTD. AND SUBSIDIARIES
CONSOLIDATED STATEMENTS OF COMPREHENSIVE INCOME
YEARS ENDED DECEMBER 31, 2019 AND 2018
(In Thousands of New Taiwan Dollars, Except Earnings Per Share)
| 2019 | 2018 | |||||||||||||||
| Amount | % | Amount | % | |||||||||||||
REVENUES (Notes 3, 28, 36 and 41) | $ | 207,520,061 | 100 | $ | 215,483,158 | 100 | ||||||||||
OPERATING COSTS (Notes 3, 10, 26, 28, 29, 36 and 41) | 135,952,540 | 65 | 139,545,457 | 65 | ||||||||||||
|
|
|
|
|
|
|
| |||||||||
GROSS PROFIT | 71,567,521 | 35 | 75,937,701 | 35 | ||||||||||||
|
|
|
|
|
|
|
| |||||||||
OPERATING EXPENSES (Notes 3, 9, 26, 29, 36 and 41) | ||||||||||||||||
Marketing | 22,219,688 | 11 | 23,170,024 | 11 | ||||||||||||
General and administrative | 4,758,340 | 2 | 4,589,488 | 2 | ||||||||||||
Research and development | 3,941,446 | 2 | 3,725,249 | 2 | ||||||||||||
Expected credit loss (reversal of credit loss) | (125,111 | ) | — | 919,732 | — | |||||||||||
|
|
|
|
|
|
|
| |||||||||
Total operating expenses | 30,794,363 | 15 | 32,404,493 | 15 | ||||||||||||
|
|
|
|
|
|
|
| |||||||||
OTHER INCOME AND EXPENSES (Notes 15, 17, 18, 29 and 41) | (127,304 | ) | — | 110,451 | — | |||||||||||
|
|
|
|
|
|
|
| |||||||||
INCOME FROM OPERATIONS | 40,645,854 | 20 | 43,643,659 | 20 | ||||||||||||
|
|
|
|
|
|
|
| |||||||||
NON-OPERATING INCOME AND EXPENSES | ||||||||||||||||
Interest income (Note 41) | 250,787 | — | 196,889 | — | ||||||||||||
Other income (Notes 8, 29 and 36) | 531,624 | — | 699,823 | — | ||||||||||||
Other gains and losses (Notes 14, 29, 35 and 36) | (36,471 | ) | — | (45,671 | ) | — | ||||||||||
Interest expenses (Notes 16, 29, 36 and 41) | (104,142 | ) | — | (17,596 | ) | — | ||||||||||
Share of profits of associates accounted for using equity method (Notes 14 and 41) | 462,140 | — | 501,600 | — | ||||||||||||
|
|
|
|
|
|
|
| |||||||||
Totalnon-operating income and expenses | 1,103,938 | — | 1,335,045 | — | ||||||||||||
|
|
|
|
|
|
|
| |||||||||
INCOME BEFORE INCOME TAX | 41,749,792 | 20 | 44,978,704 | 20 | ||||||||||||
INCOME TAX EXPENSE (Notes 3 and 30) | 7,985,849 | 4 | 8,522,533 | 4 | ||||||||||||
|
|
|
|
|
|
|
| |||||||||
NET INCOME | 33,763,943 | 16 | 36,456,171 | 16 | ||||||||||||
|
|
|
|
|
|
|
| |||||||||
TOTAL OTHER COMPREHENSIVE INCOME (LOSS) | ||||||||||||||||
Items that will not be reclassified to profit or loss: | ||||||||||||||||
Remeasurements of defined benefit pension plans (Note 26) | 1,526,353 | 1 | (1,214,552 | ) | — | |||||||||||
(Continued)
- 8 -
CHUNGHWA TELECOM CO., LTD. AND SUBSIDIARIES
CONSOLIDATED STATEMENTS OF COMPREHENSIVE INCOME
YEARS ENDED DECEMBER 31, 2019 AND 2018
(In Thousands of New Taiwan Dollars, Except Earnings Per Share)
| 2019 | 2018 | |||||||||||||||
| Amount | % | Amount | % | |||||||||||||
Unrealized gain or loss on investments in equity instruments at fair value through other comprehensive income (Notes 3 and 35) | $ | 286,408 | — | $ | (346,330 | ) | — | |||||||||
Gain or loss on hedging instruments subject to basis adjustment (Notes 3 and 20) | (742 | ) | — | 1,919 | — | |||||||||||
Share of remeasurements of defined benefit pension plans of associates (Note 14) | (2,335 | ) | — | 1,707 | — | |||||||||||
Income tax relating to items that will not be reclassified to profit or loss (Note 30) | (305,271 | ) | — | 450,166 | — | |||||||||||
|
|
|
|
|
|
|
| |||||||||
| 1,504,413 | 1 | (1,107,090 | ) | — | ||||||||||||
|
|
|
|
|
|
|
| |||||||||
Items that may be reclassified subsequently to profit or loss: | ||||||||||||||||
Exchange differences arising from the translation of the foreign operations | (61,207 | ) | — | 89,319 | — | |||||||||||
Share of exchange differences arising from the translation of the foreign operations of associates (Note 14) | (700 | ) | — | 3,318 | — | |||||||||||
|
|
|
|
|
|
|
| |||||||||
| (61,907 | ) | — | 92,637 | — | ||||||||||||
|
|
|
|
|
|
|
| |||||||||
Total other comprehensive income (loss), net of income tax | 1,442,506 | 1 | (1,014,453 | ) | — | |||||||||||
|
|
|
|
|
|
|
| |||||||||
TOTAL COMPREHENSIVE INCOME | $ | 35,206,449 | 17 | $ | 35,441,718 | 16 | ||||||||||
|
|
|
|
|
|
|
| |||||||||
NET INCOME ATTRIBUTABLE TO | ||||||||||||||||
Stockholders of the parent | $ | 32,788,546 | 16 | $ | 35,501,622 | 16 | ||||||||||
Noncontrolling interests | 975,397 | — | 954,549 | — | ||||||||||||
|
|
|
|
|
|
|
| |||||||||
| $ | 33,763,943 | 16 | $ | 36,456,171 | 16 | |||||||||||
|
|
|
|
|
|
|
| |||||||||
COMPREHENSIVE INCOME ATTRIBUTABLE TO | ||||||||||||||||
Stockholders of the parent | $ | 34,225,076 | 17 | $ | 34,496,742 | 16 | ||||||||||
Noncontrolling interests | 981,373 | — | 944,976 | — | ||||||||||||
|
|
|
|
|
|
|
| |||||||||
| $ | 35,206,449 | 17 | $ | 35,441,718 | 16 | |||||||||||
|
|
|
|
|
|
|
| |||||||||
EARNINGS PER SHARE (Note 31) | ||||||||||||||||
Basic | $ | 4.23 | $ | 4.58 | ||||||||||||
|
|
|
| |||||||||||||
Diluted | $ | 4.22 | $ | 4.57 | ||||||||||||
|
|
|
| |||||||||||||
The accompanying notes are an integral part of the consolidated financial statements.
| (Concluded) |
- 9 -
CHUNGHWA TELECOM CO., LTD. AND SUBSIDIARIES
CONSOLIDATED STATEMENTS OF CHANGES IN EQUITY
YEARS ENDED DECEMBER 31, 2019 AND 2018
(In Thousands of New Taiwan Dollars)
| Equity Attributable to Stockholders of the Parent (Notes 13, 20 and 27) | ||||||||||||||||||||||||||||||||||||||||||||
| Other Adjustments | ||||||||||||||||||||||||||||||||||||||||||||
Exchange Arising from the Translation of | Unrealized Gain Through Other Comprehensive | Gain or Loss on Hedging | Noncontrolling Interests | |||||||||||||||||||||||||||||||||||||||||
Additional | Retained Earnings | |||||||||||||||||||||||||||||||||||||||||||
| Common Stocks | Legal Reserve | Special Reserve | Unappropriated Earnings | Total | Total Equity | |||||||||||||||||||||||||||||||||||||||
BALANCE, JANUARY 1, 2018 | $ | 77,574,465 | $ | 169,466,883 | $ | 77,574,465 | $ | 2,680,823 | $ | 49,595,850 | $ | (174,593 | ) | $ | 883,420 | $ | (850 | ) | $ | 377,600,463 | $ | 8,693,650 | $ | 386,294,113 | ||||||||||||||||||||
Appropriation of 2017 earnings | ||||||||||||||||||||||||||||||||||||||||||||
Reversal of special reserve | — | — | — | (5,404 | ) | 5,404 | — | — | — | — | — | — | ||||||||||||||||||||||||||||||||
Cash dividends distributed by Chunghwa | — | — | — | — | (37,204,714 | ) | — | — | — | (37,204,714 | ) | — | (37,204,714 | ) | ||||||||||||||||||||||||||||||
Cash dividends distributed by subsidiaries | — | — | — | — | — | — | — | — | — | (958,446 | ) | (958,446 | ) | |||||||||||||||||||||||||||||||
Unclaimed dividend | — | 2,455 | — | — | — | — | — | — | 2,455 | — | 2,455 | |||||||||||||||||||||||||||||||||
Change in additionalpaid-in capital from investments in associates accounted for using equity method | — | (1,044 | ) | — | — | — | — | — | — | (1,044 | ) | 191 | (853 | ) | ||||||||||||||||||||||||||||||
Partial disposal of interests in subsidiaries | — | 826,047 | — | — | — | — | — | — | 826,047 | 348,353 | 1,174,400 | |||||||||||||||||||||||||||||||||
Change in additionalpaid-in capital for not participating proportionately in the capital increase of subsidiaries | — | 776,713 | — | — | — | — | — | — | 776,713 | 699,967 | 1,476,680 | |||||||||||||||||||||||||||||||||
Net income for the year ended December 31, 2018 | — | — | — | — | 35,501,622 | — | — | — | 35,501,622 | 954,549 | 36,456,171 | |||||||||||||||||||||||||||||||||
Other comprehensive income (loss) for the year ended December 31, 2018 | — | — | — | — | (756,817 | ) | 95,166 | (345,148 | ) | 1,919 | (1,004,880 | ) | (9,573 | ) | (1,014,453 | ) | ||||||||||||||||||||||||||||
|
|
|
|
|
|
|
|
|
|
|
|
|
|
|
|
|
|
|
|
|
| |||||||||||||||||||||||
Total comprehensive income (loss) for the year ended December 31, 2018 | — | — | — | — | 34,744,805 | 95,166 | (345,148 | ) | 1,919 | 34,496,742 | 944,976 | 35,441,718 | ||||||||||||||||||||||||||||||||
|
|
|
|
|
|
|
|
|
|
|
|
|
|
|
|
|
|
|
|
|
| |||||||||||||||||||||||
Share-based payment transactions of subsidiaries | — | 10,776 | — | — | — | — | — | — | 10,776 | 41,863 | 52,639 | |||||||||||||||||||||||||||||||||
Net increase in noncontrolling interests | — | 54,934 | — | — | — | — | — | — | 54,934 | 239,394 | 294,328 | |||||||||||||||||||||||||||||||||
|
|
|
|
|
|
|
|
|
|
|
|
|
|
|
|
|
|
|
|
|
| |||||||||||||||||||||||
BALANCE, DECEMBER 31, 2018 | 77,574,465 | 171,136,764 | 77,574,465 | 2,675,419 | 47,141,345 | (79,427 | ) | 538,272 | 1,069 | 376,562,372 | 10,009,948 | 386,572,320 | ||||||||||||||||||||||||||||||||
Effect of retrospective application (Note 5) | — | — | — | — | (50,823 | ) | — | — | — | (50,823 | ) | (19,603 | ) | (70,426 | ) | |||||||||||||||||||||||||||||
|
|
|
|
|
|
|
|
|
|
|
|
|
|
|
|
|
|
|
|
|
| |||||||||||||||||||||||
BALANCE, JANUARY 1, 2019 AS ADJUSTED | 77,574,465 | 171,136,764 | 77,574,465 | 2,675,419 | 47,090,522 | (79,427 | ) | 538,272 | 1,069 | 376,511,549 | 9,990,345 | 386,501,894 | ||||||||||||||||||||||||||||||||
Appropriation of 2018 earnings | ||||||||||||||||||||||||||||||||||||||||||||
Cash dividends distributed by Chunghwa | — | — | — | — | (34,745,603 | ) | — | — | — | (34,745,603 | ) | — | (34,745,603 | ) | ||||||||||||||||||||||||||||||
Cash dividends distributed by subsidiaries | — | — | — | — | — | — | — | — | — | (709,817 | ) | (709,817 | ) | |||||||||||||||||||||||||||||||
Unclaimed dividend | — | 1,266 | — | — | — | — | — | — | 1,266 | — | 1,266 | |||||||||||||||||||||||||||||||||
Change in additionalpaid-in capital from investments in associates accounted for using equity method | — | 118,853 | — | — | — | — | — | — | 118,853 | 1,064 | 119,917 | |||||||||||||||||||||||||||||||||
Net income for the year ended December 31, 2019 | — | — | — | — | 32,788,546 | — | — | — | 32,788,546 | 975,397 | 33,763,943 | |||||||||||||||||||||||||||||||||
Other comprehensive income (loss) for the year ended December 31, 2019 | — | — | — | — | 1,207,896 | (68,950 | ) | 298,326 | (742 | ) | 1,436,530 | 5,976 | 1,442,506 | |||||||||||||||||||||||||||||||
|
|
|
|
|
|
|
|
|
|
|
|
|
|
|
|
|
|
|
|
|
| |||||||||||||||||||||||
Total comprehensive income (loss) for the year ended December 31, 2019 | — | — | — | — | 33,996,442 | (68,950 | ) | 298,326 | (742 | ) | 34,225,076 | 981,373 | 35,206,449 | |||||||||||||||||||||||||||||||
|
|
|
|
|
|
|
|
|
|
|
|
|
|
|
|
|
|
|
|
|
| |||||||||||||||||||||||
Share-based payment transactions of subsidiaries | — | (898 | ) | — | — | — | — | — | — | (898 | ) | 21,320 | 20,422 | |||||||||||||||||||||||||||||||
Net decrease in noncontrolling interests | — | — | — | — | — | — | — | — | — | (763 | ) | (763 | ) | |||||||||||||||||||||||||||||||
|
|
|
|
|
|
|
|
|
|
|
|
|
|
|
|
|
|
|
|
|
| |||||||||||||||||||||||
BALANCE, DECEMBER 31, 2019 | $ | 77,574,465 | $ | 171,255,985 | $ | 77,574,465 | $ | 2,675,419 | $ | 46,341,361 | $ | (148,377 | ) | $ | 836,598 | $ | 327 | $ | 376,110,243 | $ | 10,283,522 | $ | 386,393,765 | |||||||||||||||||||||
|
|
|
|
|
|
|
|
|
|
|
|
|
|
|
|
|
|
|
|
|
| |||||||||||||||||||||||
The accompanying notes are an integral part of the consolidated financial statements.
- 10 -
CHUNGHWA TELECOM CO., LTD. AND SUBSIDIARIES
CONSOLIDATED STATEMENTS OF CASH FLOWS
YEARS ENDED DECEMBER 31, 2019 AND 2018
(In Thousands of New Taiwan Dollars)
| 2019 | 2018 | |||||||
CASH FLOWS FROM OPERATING ACTIVITIES | ||||||||
Income before income tax | $ | 41,749,792 | $ | 44,978,704 | ||||
Adjustments to reconcile income before income tax to net cash provided by operating activities: | ||||||||
Depreciation | 30,922,991 | 27,481,956 | ||||||
Amortization | 4,252,602 | 4,386,798 | ||||||
Amortization of incremental costs of obtaining contracts | 1,173,492 | 1,941,124 | ||||||
Expected credit loss (reversal of credit loss) | (125,111 | ) | 919,732 | |||||
Interest expenses | 104,142 | 17,596 | ||||||
Interest income | (250,787 | ) | (196,889 | ) | ||||
Dividend income | (296,360 | ) | (395,593 | ) | ||||
Compensation cost of share-based payment transactions | 1,597 | 17,302 | ||||||
Share of profits of associates accounted for using equity method | (462,140 | ) | (501,600 | ) | ||||
Loss (gain) on disposal of property, plant and equipment | 37,785 | (142,068 | ) | |||||
Loss on disposal of intangible assets | 146 | — | ||||||
Gain on disposal of financial instruments | (3,944 | ) | (5,763 | ) | ||||
Loss (gain) on disposal of investments accounted for using equity method | (30,152 | ) | 125 | |||||
Provision for inventory and obsolescence | 474,709 | 365,123 | ||||||
Impairment loss on property, plant and equipment | 93,073 | — | ||||||
Reversal of impairment loss on investment properties | (56,617 | ) | (19,133 | ) | ||||
Impairment loss on intangible assets | 8,946 | 50,750 | ||||||
Impairment loss on other assets | 43,971 | — | ||||||
Valuation loss on financial assets and liabilities at fair value through profit or loss, net | 38,314 | 20,763 | ||||||
Others | (26,524 | ) | (17,223 | ) | ||||
Changes in operating assets and liabilities: | ||||||||
Decrease (increase) in: | ||||||||
Financial assets mandatorily measured at fair value through profit or loss | — | 63,117 | ||||||
Contract assets | 172,489 | 2,750,594 | ||||||
Trade notes and accounts receivable | 4,038,731 | 1,353,807 | ||||||
Receivables from related parties | 7,436 | 25,097 | ||||||
Inventories | (2,698,270 | ) | (6,778,309 | ) | ||||
Prepayments | 114,991 | 417,569 | ||||||
Other current monetary assets | (154,780 | ) | (172,597 | ) | ||||
Other current assets | 146,420 | (261,240 | ) | |||||
Incremental cost of obtaining contracts | (781,114 | ) | (802,011 | ) | ||||
Increase (decrease) in: | ||||||||
Contract liabilities | 6,701,313 | 2,652,747 | ||||||
Trade notes and accounts payable | (5,151,740 | ) | 1,065,054 | |||||
Payables to related parties | (263,968 | ) | 233,766 | |||||
Other payables | 697,351 | (1,088,406 | ) | |||||
(Continued)
- 11 -
CHUNGHWA TELECOM CO., LTD. AND SUBSIDIARIES
CONSOLIDATED STATEMENTS OF CASH FLOWS
YEARS ENDED DECEMBER 31, 2019 AND 2018
(In Thousands of New Taiwan Dollars)
| 2019 | 2018 | |||||||
Provisions | $ | 97,497 | $ | 27,142 | ||||
Other operating liabilities | (159,881 | ) | 422,413 | |||||
Net defined benefit plans | 533,787 | (1,535,294 | ) | |||||
|
|
|
| |||||
Cash generated from operations | 80,950,187 | 77,275,153 | ||||||
Interest paid | (104,142 | ) | (17,524 | ) | ||||
Income tax paid | (8,419,360 | ) | (10,891,279 | ) | ||||
|
|
|
| |||||
Net cash provided by operating activities | 72,426,685 | 66,366,350 | ||||||
|
|
|
| |||||
CASH FLOWS FROM INVESTING ACTIVITIES | ||||||||
Acquisition of financial assets at fair value through other comprehensive income | (60,000 | ) | (289,580 | ) | ||||
Proceeds from return of financial assets at fair value through other comprehensive income | 9,167 | 6,690 | ||||||
Purchase of financial assets at fair value through profit or loss | (443,064 | ) | — | |||||
Proceeds from disposal of financial assets at fair value through profit or loss | 146,560 | — | ||||||
Acquisition of time deposits and negotiable certificates of deposit with maturities of more than three months | (14,381,653 | ) | (9,719,951 | ) | ||||
Acquisition of repurchase agreements collateralized by bonds with maturities of more than three months | (14,990 | ) | — | |||||
Proceeds from disposal of time deposits and negotiable certificates of deposit with maturities of more than three months | 16,519,781 | 5,654,941 | ||||||
Acquisition of investments accounted for using equity method | (4,190,000 | ) | (204,900 | ) | ||||
Proceeds from disposal of investments accounted for using equity method | 32,470 | 3,379 | ||||||
Proceeds from capital reduction of investments accounted for using equity method | — | 19,184 | ||||||
Acquisition of property, plant and equipment | (24,165,857 | ) | (28,549,929 | ) | ||||
Proceeds from disposal of property, plant and equipment | 48,157 | 264,446 | ||||||
Acquisition of intangible assets | (362,718 | ) | (498,005 | ) | ||||
Acquisition of investment properties | (523 | ) | (5,627 | ) | ||||
Increase in other noncurrent assets | (1,122,142 | ) | (80,640 | ) | ||||
Interest received | 256,432 | 186,617 | ||||||
Cash dividends received | 602,086 | 599,621 | ||||||
|
|
|
| |||||
Net cash used in investing activities | (27,126,294 | ) | (32,613,754 | ) | ||||
|
|
|
| |||||
CASH FLOWS FROM FINANCING ACTIVITIES | ||||||||
Proceeds from short-term loans | 575,000 | 360,000 | ||||||
Repayment of short-term loans | (585,000 | ) | (330,000 | ) | ||||
Increase in customers’ deposits | 7,311 | 30,997 | ||||||
Payment for the principal of lease liabilities | (3,727,792 | ) | — | |||||
Increase in other noncurrent liabilities | 232,357 | 83,613 | ||||||
(Continued)
- 12 -
CHUNGHWA TELECOM CO., LTD. AND SUBSIDIARIES
CONSOLIDATED STATEMENTS OF CASH FLOWS
YEARS ENDED DECEMBER 31, 2019 AND 2018
(In Thousands of New Taiwan Dollars)
| 2019 | 2018 | |||||||
Cash dividends | $ | (34,745,603 | ) | $ | (37,204,714 | ) | ||
Partial disposal of interests in subsidiaries without losing control | — | 1,174,400 | ||||||
Cash dividends distributed to noncontrolling interests | (709,817 | ) | (958,446 | ) | ||||
Change in other noncontrolling interests | 18,062 | 1,806,345 | ||||||
Unclaimed dividend | 1,266 | 2,455 | ||||||
|
|
|
| |||||
Net cash used in financing activities | (38,934,216 | ) | (35,035,350 | ) | ||||
|
|
|
| |||||
EFFECT OF EXCHANGE RATE CHANGES ON CASH AND CASH EQUIVALENTS | 38,688 | 102,599 | ||||||
|
|
|
| |||||
NET INCREASE (DECREASE) IN CASH AND CASH EQUIVALENTS | 6,404,863 | (1,180,155 | ) | |||||
CASH AND CASH EQUIVALENTS, BEGINNING OF THE YEAR | 27,644,780 | 28,824,935 | ||||||
|
|
|
| |||||
CASH AND CASH EQUIVALENTS, END OF THE YEAR | $ | 34,049,643 | $ | 27,644,780 | ||||
The accompanying notes are an integral part of the consolidated financial statements.
| (Concluded) |
- 13 -
CHUNGHWA TELECOM CO., LTD. AND SUBSIDIARIES
NOTES TO CONSOLIDATED FINANCIAL STATEMENTS
YEARS ENDED DECEMBER 31, 2019 AND 2018
(In Thousands of New Taiwan Dollars, Unless Stated Otherwise)
| 1. | GENERAL |
Chunghwa Telecom Co., Ltd. (“Chunghwa”) was incorporated on July 1, 1996 in the Republic of China (“ROC”) pursuant to the Article 30 of the Telecommunications Act. Chunghwa is a company limited by shares and, prior to August 2000, was wholly owned by the Ministry of Transportation and Communications (“MOTC”). Prior to July 1, 1996, the current operations of Chunghwa were carried out under the Directorate General of Telecommunications (“DGT”). The DGT was established by the MOTC in June 1943 to take primary responsibility in the development of telecommunications infrastructure and to formulate policies related to telecommunications. On July 1, 1996, the telecom operations of the DGT werespun-off as Chunghwa which continues to carry out the business and the DGT continues to be the industry regulator.
Effective August 12, 2005, the MOTC completed the process of privatizing Chunghwa by reducing the government ownership to below 50% in various stages. In July 2000, Chunghwa received approval from the Securities and Futures Commission (the “SFC”) for a domestic initial public offering and its common stocks were listed and traded on the Taiwan Stock Exchange (the “TWSE”) on October 27, 2000. Certain of Chunghwa’s common stocks were sold, in connection with the foregoing privatization plan, in domestic public offerings at various dates from August 2000 to July 2003. Certain of Chunghwa’s common stocks were also sold in an international offering of securities in the form of American Depository Shares (“ADS”) on July 17, 2003 and were listed and traded on the New York Stock Exchange (the “NYSE”). The MOTC sold common stocks of Chunghwa by auction in the ROC on August 9, 2005 and completed the second international offering on August 10, 2005. Upon completion of the share transfers associated with these offerings on August 12, 2005, the MOTC owned less than 50% of the outstanding shares of Chunghwa and completed the privatization plan.
Chunghwa together with its subsidiaries are hereinafter referred to collectively as the “Company”.
The consolidated financial statements are presented in Chunghwa’s functional currency, New Taiwan dollars.
| 2. | APPROVAL OF FINANCIAL STATEMENTS |
The consolidated financial statements were approved by the Board of Directors on February 26, 2020.
| 3. | SUMMARY OF SIGNIFICANT ACCOUNTING POLICIES |
The Company initial applied IFRS 16 “Leases” on January 1, 2019 and elected not to reflect the figures on a retrospective basis in comparative periods. Different accounting policies for each accounting period as a result of the application of new accounting standards are listed by year separately.
Statement of Compliance
The accompanying consolidated financial statements have been prepared in conformity with the Regulations Governing the Preparation of Financial Reports by Securities Issuers and the International Financial Reporting Standards (IFRS), International Accounting Standards (IAS), International Financial Reporting Interpretations Committee (IFRIC) and SIC Interpretations (SIC) endorsed and issued into effect by the Financial Supervisory Commission (FSC) (the “Taiwan-IFRS”).
- 14 -
Basis of Preparation
The consolidated financial statements have been prepared on the historical cost basis except for certain financial instruments that are measured at fair values and net defined benefit liabilities (assets) which are measured at the present value of the defined benefit obligation less the fair value of plan assets.
Current and Noncurrent Assets and Liabilities
Current assets include:
| a. | Assets held primarily for the purpose of trading; |
| b. | Assets expected to be realized within twelve months after the reporting period; and |
| c. | Cash and cash equivalents unless the asset is restricted from being exchanged or used to settle a liability for at least twelve months after the reporting period. |
Current liabilities include:
| a. | Liabilities held primarily for the purpose of trading; |
| b. | Liabilities due to be settled within twelve months after the reporting period; and |
| c. | Liabilities for which the Company does not have an unconditional right to defer settlement for at least twelve months after the reporting period. |
Assets and liabilities that are not classified as current are classified as noncurrent.
Light Era Development Co., Ltd. (LED) engages mainly in development of property for rent and sale. The assets and liabilities of LED related to property development within its operating cycle, which is over one year, are classified as current items.
Basis of Consolidation
| a. | Principles for preparing consolidated financial statements |
The consolidated financial statements incorporate the financial statements of Chunghwa and entities controlled by Chunghwa (its subsidiaries).
When necessary, adjustments are made to the financial statements of subsidiaries to bring their accounting policies in line with those used by the Company.
All inter-company transactions, balances, income and expenses are eliminated in full upon consolidation.
Attribution of total comprehensive income to noncontrolling interests
Total comprehensive income of subsidiaries is attributed to the stockholders of the parent and to the noncontrolling interests even if it results in the noncontrolling interests having a deficit balance.
Changes in the Company’s ownership interests in subsidiaries
Changes in the Company’s ownership interests in subsidiaries that do not result in the Company losing control over the subsidiaries are accounted for as equity transactions. The carrying amounts of the Company’s interests and the noncontrolling interests are adjusted to reflect the changes in their relative interests in the subsidiaries. Any difference between the amount by which the noncontrolling interests are adjusted and the fair value of the consideration paid or received is recognized directly in equity and attributed to stockholders of the parent.
- 15 -
| b. | The subsidiaries in the consolidated financial statements |
The detail information of the subsidiaries at the end of reporting period was as follows:
| Percentage of Ownership | ||||||||||||||||
| December 31 | ||||||||||||||||
| Name of Investor | Name of Investee | Main Businesses and Products | 2019 | 2018 | Note | |||||||||||
Chunghwa Telecom Co., Ltd. | Senao International Co., Ltd. (“SENAO”) | Handset and peripherals retailer, sales of CHT mobile phone plans as an agent | 28 | 28 | a | ) | ||||||||||
Light Era Development Co., Ltd. (“LED”) | Planning and development of real estate and intelligent buildings, and property management | 100 | 100 | |||||||||||||
Donghwa Telecom Co., Ltd. (“DHT”) | International private leased circuit, IP VPN service, and IP transit services | 100 | 100 | |||||||||||||
Chunghwa Telecom Singapore Pte., Ltd. (“CHTS”) | International private leased circuit, IP VPN service, and IP transit services | 100 | 100 | |||||||||||||
Chunghwa System Integration Co., Ltd. (“CHSI”) | Providing system integration services and telecommunications equipment | 100 | 100 | |||||||||||||
Chunghwa Investment Co., Ltd. (“CHI”) | Investment | 89 | 89 | |||||||||||||
CHIEF Telecom Inc. (“CHIEF”) | Network integration, internet data center (“IDC”), communications integration and cloud application services | 57 | 57 | b | ) | |||||||||||
CHYP Multimedia Marketing & Communications Co., Ltd. (“CHYP”) | Digital information supply services and advertisement services | 100 | 100 | |||||||||||||
Prime Asia Investments Group Ltd. (B.V.I.) (“Prime Asia”) | Investment | 100 | 100 | |||||||||||||
Spring House Entertainment Tech. Inc. (“SHE”) | Software design services, internet contents production and play, and motion picture production and distribution | 56 | 56 | c | ) | |||||||||||
Chunghwa Telecom Global, Inc. (“CHTG”) | International private leased circuit, internet services, and transit services | 100 | 100 | |||||||||||||
Chunghwa Telecom Vietnam Co., Ltd. (“CHTV”) | Intelligent energy saving solutions, international circuit, and information and communication technology (“ICT”) services | 100 | 100 | |||||||||||||
Smartfun Digital Co., Ltd. (“SFD”) | Providing diversified family education digital services | 65 | 65 | |||||||||||||
Chunghwa Telecom Japan Co., Ltd. (“CHTJ”) | International private leased circuit, IP VPN service, and IP transit services | 100 | 100 | |||||||||||||
Chunghwa Sochamp Technology Inc. (“CHST”) | Design, development and production of Automatic License Plate Recognition software and hardware | 51 | 51 | |||||||||||||
Honghwa International Co., Ltd. (“HHI”) | Telecommunications engineering, sales agent of mobile phone plan application and other business services, etc. | 100 | 100 | |||||||||||||
Chunghwa Leading Photonics Tech Co., Ltd. (“CLPT”) | Production and sale of electronic components and finished products | 75 | 75 | |||||||||||||
Chunghwa Telecom (Thailand) Co., Ltd. (“CHTT”) | International private leased circuit, IP VPN service, ICT and cloud VAS services | 100 | 100 | d | ) | |||||||||||
CHT Security Co., Ltd. (“CHTSC”) | Computing equipment installation, wholesale of computing and business machinery equipment and software, management consulting services, data processing services, digital information supply services and internet identify services | 80 | 80 | |||||||||||||
(Continued)
- 16 -
| �� | Percentage of Ownership | |||||||||||||||
| December 31 | ||||||||||||||||
| Name of Investor | Name of Investee | Main Businesses and Products | 2019 | 2018 | Note | |||||||||||
Senao International Co., Ltd. | Senao International (Samoa) Holding Ltd. (“SIS”) | International investment | 100 | 100 | ||||||||||||
Youth Co., Ltd. (“Youth”) | Sale of information and communication technologies products | 93 | 93 | e | ) | |||||||||||
Aval Technologies Co., Ltd. (“Aval”) | Sale of information and communication technologies products | 100 | 100 | |||||||||||||
Senyoung Insurance Agent Co., Ltd. (“SENYOUNG”) | Property and liability insurance agency | 100 | 100 | |||||||||||||
Youth Co., Ltd. | ISPOT Co., Ltd. (“ISPOT”) | Sale of information and communication technologies products | 100 | 100 | ||||||||||||
Youyi Co., Ltd. (“Youyi”) | Maintenance of information and communication technologies products | 100 | 100 | |||||||||||||
Aval Technologies Co., Ltd. | Wiin Technology Co., Ltd. (“Wiin”) | Sale of information and communication technologies products | 100 | — | f | ) | ||||||||||
Senyoung Insurance Agent Co., Ltd. | Seyoung Insurance Agent Co., Ltd. (“Seyoung”) | Life insurance services | 100 | — | g | ) | ||||||||||
Light Era Development Co., Ltd. | Taoyuan Asia Silicon Valley Innovation Co., Ltd. (“TASVI”) | Development of real estate | — | 60 | h | ) | ||||||||||
CHIEF Telecom Inc. | Unigate Telecom Inc. (“Unigate”) | Telecommunications and internet service | 100 | 100 | ||||||||||||
Chief International Corp. (“CIC”) | Telecommunications and internet service | 100 | 100 | |||||||||||||
Shanghai Chief Telecom Co., Ltd. (“SCT”) | Telecommunications and internet service | 49 | 49 | |||||||||||||
Chunghwa System Integration Co., Ltd. | Concord Technology Co., Ltd. (“Concord”) | Investment | — | — | i | ) | ||||||||||
Chunghwa Investment Co., Ltd. | Chunghwa Precision Test Tech. Co., Ltd. (“CHPT”) | Production and sale of semiconductor testing components and printed circuit board | 34 | 34 | j | ) | ||||||||||
Chunghwa Precision Test Tech. Co., Ltd. | Chunghwa Precision Test Tech. USA Corporation (“CHPT (US)”) | Design and after-sale services of semiconductor testing components and printed circuit board | 100 | 100 | ||||||||||||
CHPT Japan Co., Ltd. (“CHPT (JP)”) | Related services of electronic parts, machinery processed products and printed circuit board | 100 | 100 | |||||||||||||
Chunghwa Precision Test Tech. International, Ltd. (“CHPT (International)”) | Wholesale and retail of electronic materials, and investment | 100 | 100 | |||||||||||||
Senao International (Samoa) Holding Ltd. | Senao International HK Limited (“SIHK”) | International investment | 100 | 100 | ||||||||||||
Senao International HK Limited | Senao Trading (Fujian) Co., Ltd. (“STF”) | Sale of information and communication technologies products | — | 100 | k | ) | ||||||||||
Senao International Trading (Shanghai) Co., Ltd. (“SITS”) | Sale of information and communication technologies products | 100 | 100 | |||||||||||||
Senao International Trading (Shanghai) Co., Ltd. (“SEITS”) | Maintenance of information and communication technologies products | — | — | l | ) | |||||||||||
Senao International Trading (Jiangsu) Co., Ltd. (“SITJ”) | Sale of information and communication technologies products | — | 100 | m | ) | |||||||||||
Prime Asia Investments Group Ltd. (B.V.I.) | Chunghwa Hsingta Co., Ltd. (“CHC”) | Investment | 100 | 100 | ||||||||||||
Chunghwa Hsingta Co., Ltd. (“CHC”) | Chunghwa Telecom (China) Co., Ltd. (“CTC”) | Integrated information and communication solution services for enterprise clients, and intelligent energy network service | 100 | 100 | ||||||||||||
Jiangsu Zhenhua Information Technology Company, LLC. (“JZIT”) | Providing intelligent energy saving solution and intelligent buildings services | — | — | n | ) | |||||||||||
Chunghwa Precision Test Tech. International, Ltd. | Shanghai Taihua Electronic Technology Limited (“STET”) | Design of printed circuit board and related consultation service | 100 | 100 | ||||||||||||
Su Zhou Precision Test Tech. Ltd. (“SZPT”) | Assembly processed of circuit board, design of printed circuit board and related consultation service | 100 | — | o | ) | |||||||||||
(Concluded)
- 17 -
| a) | SENAO transferred its treasury stock to employees in June 2018 and the Company’s ownership interest in SENAO decreased to 28.18% as of December 31, 2018 and 2019. As Chunghwa continues to control over half of the seats of the Board of Directors of SENAO (six out of eleven seats as of December 31, 2019) through the support of large beneficial stockholders, the accounts of SENAO are included in the consolidated financial statements. |
| b) | CHIEF issued new shares in March and November 2019, March and November 2018 as its employees exercised their options. In addition, Chunghwa and CHI disposed some shares of CHIEF in May 2018 before CHIEF traded its shares on the General Stock Market of the Taipei Exchange according to the local requirements. Furthermore, Chunghwa and CHI did not participate in the capital increase of CHIEF in June 2018. Therefore, the Company’s ownership interest in CHIEF decreased to 60.23% and 59.75% as of December 31, 2018 and 2019, respectively. |
| c) | SHE reduced 19.72% of its capital to offset accumulated deficits in December 2019 and the Company’s ownership interest in SHE remained the same. |
| d) | The Company increased its investment in CHTT proportionally in October 2019 and the Company’s ownership interest in CHTT remained the same. |
| e) | SENAO subscribed for all the shares in the capital increase of Youth in December 2018. Therefore, the Company’s ownership interest in Youth increased from 89% to 93%. |
| f) | Aval invested 100% equity shares of Wiin Technology Co., Ltd. (“Wiin”) in September 2019. |
| g) | SENYOUNG invested 100% equity shares of Seyoung Insurance Agent Co., Ltd. (“Seyoung”) in November 2019. |
| h) | LED invested 60% equity shares of Taoyuan Asia Silicon Valley Innovation Co., Ltd. (“TASVI”) in March 2018. TASVI completed its liquidation in September 2019. |
| i) | Concord completed its liquidation in January 2018. |
| j) | CHI disposed some shares of CHPT from April to August 2018. Therefore, its ownership interest in CHPT decreased to 34.25% as of December 31, 2018 and 2019. However, considering the absolute and relative size of ownership interest, and the dispersion of shares owned by the other stockholders, the management concluded that the Company has a sufficiently dominant voting interest to direct the relevant activities; hence, CHPT is deemed as a subsidiary of the Company. |
| k) | STF completed its liquidation in May 2019. |
- 18 -
| l) | SEITS completed its liquidation in March 2018. |
| m) | SITJ completed its liquidation in March 2019. |
| n) | JZIT completed its liquidation in December 2018. |
| o) | CHPT (International) invested 100% equity shares of Su Zhou Precision Test Tech. Ltd. (“SZPT”) in October 2019. |
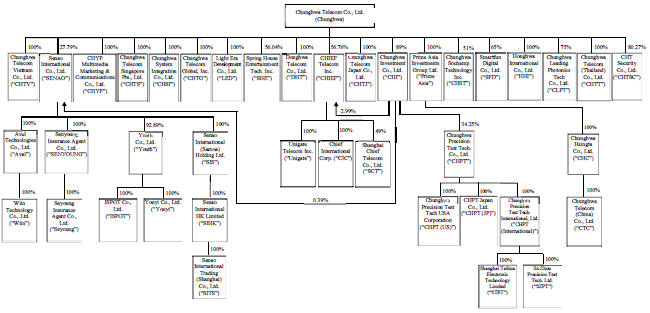
The following diagram presents information regarding the relationship and ownership percentages between Chunghwa and its subsidiaries as of December 31, 2019:
Foreign Currencies
In preparing the financial statements of each individual entity, transactions in currencies other than the entity’s functional currency (foreign currencies) are recognized at the rates of exchange prevailing at the dates of the transactions.
At the end of each reporting period, monetary items denominated in foreign currencies are retranslated at the rates prevailing at that date. Exchange differences on monetary items arising from settlement or translation are recognized in profit or loss in the period in which they arise.
Non-monetary items carried at fair value that are denominated in foreign currencies are retranslated at the rates prevailing at the date when the fair value was determined and related exchange differences are recognized in profit or loss. Conversely, when the fair value changes were recognized in other comprehensive income, related exchange difference shall be recognized in other comprehensive income.
Non-monetary items that are measured at historical cost in a foreign currency are not retranslated.
- 19 -
For the purposes of presenting consolidated financial statements, the assets and liabilities of the Company’s foreign operations (including of the subsidiaries and associates in other countries or currencies used different with Chunghwa) are translated into New Taiwan dollars using exchange rates prevailing at the end of each reporting period. Income and expense items are translated at the average exchange rates for the period. Exchange differences arising, if any, are recognized in other comprehensive income and attributed to stockholders of the parent and noncontrolling interests as appropriate.
Cash Equivalents
Cash equivalents include commercial paper, time deposits, negotiable certificates of deposit and repurchase agreements collateralized by bonds with original maturities within three months from the date of acquisition, highly liquid, readily convertible to a known amount of cash and are subject to an insignificant risk of changes in value. These cash equivalents are held for the purpose of meeting short-term cash commitments.
Inventories
Inventories are stated at the lower of cost or net realizable value item by item, except for those that may be appropriate to group items of similar or related inventories. Net realizable value is the estimated selling price of inventories less all estimated costs of completion and costs necessary to make the sale. The calculation of the cost of inventory is derived using the weighted-average method.
Buildings and Land Consigned to Construction Contractors
Inventories of LED are stated at the lower of cost or net realizable value item by item, except for those that may be appropriate to group as similar items or related inventories. Land acquired before construction is classified as land held for development, and then reclassified as land held under development after LED begins its construction project.
Upon the completion of the construction project, LED recognizes revenues in the amount of proceeds from customers for land and buildings and related costs when ownership is transferred to the customers. The unsold portion of the completed construction project is transferred to land and building held for sale.
Investments in Associates
An associate is an entity over which the Company has significant influence and that is neither a subsidiary nor an interest in a joint venture.
Investments accounted for using the equity method include investments in associates. Under the equity method, an investment in an associate is initially recognized at cost and adjusted thereafter to recognize the Company’s share of profit or loss and other comprehensive income of the associate as well as the distribution received. The Company also recognizes its share in changes in the associates.
When the Company subscribes for new shares of the associate at a percentage different from its existing ownership percentage, the resulting carrying amount of the investment differs from the amount of the Company’s proportionate interest in the associate. The Company records such a difference as an adjustment to investments with the corresponding amount charged or credited to additionalpaid-in capital. When the adjustment should be debited to additionalpaid-in capital but the additionalpaid-in capital recognized from investments accounted for using equity method is insufficient, the shortage is debited to retained earnings.
- 20 -
Any excess of the cost of acquisition over the Company’s share of the fair value of the identifiable net assets and liabilities of an associate at the date of acquisition is recognized as goodwill, which is included within the carrying amount of the investment and shall not be amortized. Any excess of the Company’s share of the net fair value of the identifiable assets and liabilities over the cost of acquisition is recognized immediately in profit or loss.
When necessary, the entire carrying amount of the investment (including goodwill) is tested for impairment as a single asset by comparing its recoverable amount with its carrying amount. Any impairment loss recognized is not allocated to any asset, including goodwill, that forms part of the carrying amount of the investment. Any reversal of that impairment loss is recognized to the extent that the recoverable amount of the investment subsequently increases.
When the Company transacts with its associate, profits and losses resulting from the transactions with the associate are recognized in the Company’s consolidated financial statements only to the extent of interests in the associate that are not related to the Company.
Property, Plant and Equipment
Property, plant and equipment are initially measured at cost and subsequently measured at cost less accumulated depreciation and accumulated impairment loss.
Property, plant and equipment in the course of construction are depreciated and classified to the appropriate categories of property, plant and equipment when completed and ready for their intended use.
Depreciation on property, plant and equipment is recognized using the straight-line method. Each significant part is depreciated separately. Freehold land is not depreciated. The estimated useful lives, residual values and depreciation method are reviewed at the end of each year, with the effect of any changes in estimate accounted for on a prospective basis.
On derecognition of an item of property, plant and equipment, the difference between the net disposal proceeds and the carrying amount of the asset is recognized in profit or loss in the period in which the property is derecognized.
Investment Properties
Investment properties are properties held to earn rentals and/or for capital appreciation. Investment properties also include land held for a currently undetermined future use.
Investment properties are measured initially at cost, including transaction costs. Subsequent to initial recognition, investment properties are measured at cost less accumulated depreciation and accumulated impairment loss. Depreciation is recognized using the straight-line method.
For a transfer from the investment properties to property, plant and equipment, the deemed cost of the property, plant and equipment for subsequent accounting is its carrying amount at the commencement of owner-occupation.
For a transfer from the property, plant and equipment to investment properties, the deemed cost of the investment properties for subsequent accounting is its carrying amount at the end of owner-occupation.
On derecognition of the investment properties, the difference between the net disposal proceeds and the carrying amount of the asset is recognized in profit or loss in the period in which the property is derecognized.
- 21 -
Goodwill
Goodwill arising from the acquisition of a business is carried at cost as established at the date of acquisition of the business less accumulated impairment loss.
For the purpose of impairment testing, goodwill is allocated to each of the Company’s cash-generating units or groups of cash-generating units (referred to as “cash-generating unit”) that are expected to benefit from the synergies of the business combination.
A cash-generating unit to which goodwill has been allocated is tested for impairment annually, or more frequently when there is an indication that the unit may be impaired, by comparing its carrying amount, including the attributable goodwill, with its recoverable amount. However, if the goodwill allocated to a cash-generating unit was acquired in a business combination during the current annual period, that unit shall be tested for impairment before the end of the current annual period. If the recoverable amount of the cash-generating unit is less than its carrying amount, the impairment loss is allocated first to reduce the carrying amount of any goodwill allocated to the unit and then to the other assets of the unit pro rata based on the carrying amount of each asset in the unit. Any impairment loss is recognized directly in profit or loss. An impairment loss recognized for goodwill is not reversed in subsequent periods.
Intangible Assets Other Than Goodwill
Intangible assets with finite useful lives that are acquired separately are initially measured at cost and subsequently measured at cost less accumulated amortization and accumulated impairment loss. Amortization is recognized on a straight-line basis. The estimated useful life, residual value, and amortization method are reviewed at the end of each reporting period, with the effect of any changes in estimate being accounted for on a prospective basis. The residual value of an intangible asset with a finite useful life shall be assumed to be zero unless the Company expects to dispose of the intangible asset before the end of its economic life.
Intangible assets acquired in a business combination and recognized separately from goodwill are initially recognized at their fair value at the acquisition date (which is regarded as their cost). Subsequent to initial recognition, they are measured on the same basis as intangible assets that are acquired separately.
Gains or losses arising from derecognition of an intangible asset, measured as the difference between the net disposal proceeds and the carrying amount of the asset, are recognized in profit or loss in the period in which the asset is derecognized.
Impairment of Tangible Assets, Intangible Assets Other Than Goodwill and Incremental Costs of Obtaining Contracts
At the end of each reporting period, the Company reviews the carrying amounts of its tangible and intangible assets, excluding goodwill, to determine whether there is any indication that those assets have suffered an impairment loss. If any such indication exists, the recoverable amount of the asset is estimated in order to determine the extent of the impairment loss. When it is not possible to estimate the recoverable amount of an individual asset, the Company estimates the recoverable amount of the cash-generating unit to which the asset belongs.
Intangible assets not yet available for use are tested for impairment at least annually, and whenever there is an indication that the asset may be impaired.
Recoverable amount is the higher of fair value less costs to sell and value in use. If the recoverable amount of an asset or cash-generating unit is estimated to be less than its carrying amount, the carrying amount of the asset or cash-generating unit is reduced to its recoverable amount, with the resulting impairment loss recognized in profit or loss.
- 22 -
Impairment loss from the assets related to incremental cost of obtaining contracts is recognized to the extent that the carrying amount of the assets exceeds the remaining amount of consideration that the Company expects to receive in exchange for related goods or services less the costs which relate directly to providing those goods or services.
When an impairment loss is subsequently reversed, the carrying amount of the asset or cash-generating unit is increased to the revised estimate of its recoverable amount, but only to the extent of the carrying amount that would have been determined had no impairment loss been recognized for the asset or cash-generating unit in prior years. A reversal of an impairment loss is recognized in profit or loss.
Financial Instruments
Financial assets and financial liabilities are recognized when the Company becomes a party to the contractual provisions of the instruments.
Financial assets and financial liabilities are initially measured at fair value. Transaction costs that are directly attributable to the acquisition of financial assets and financial liabilities (other than financial assets and financial liabilities at fair value through profit or loss) are added to the fair value of the financial assets or financial liabilities, as appropriate, on initial recognition. Transaction costs directly attributable to the acquisition of financial assets or financial liabilities at fair value through profit or loss are recognized immediately in profit or loss.
| a. | Financial assets |
All regular way purchases or sales of financial assets are recognized and derecognized on a trade date basis.
| 1) | Measurement category |
| a) | Financial assets at fair value through profit or loss (FVTPL) |
Financial asset is classified as at FVTPL when the financial asset is mandatorily classified as at FVTPL. Financial assets mandatorily classified as at FVTPL include investments in equity instruments which are not designated as at fair value through other comprehensive income (FVOCI).
Financial assets at FVTPL are stated at fair value, with any gains or losses arising on remeasurement recognized in profit or loss. The net gain or loss recognized in profit or loss does not incorporate any dividend earned on the financial asset. Fair value is determined in the manner described in Note 35.
| b) | Financial assets at amortized cost |
Financial assets that meet the following conditions are subsequently measured at amortized cost:
| i. | The financial asset is held within a business model whose objective is to hold financial assets in order to collect contractual cash flows; and |
| ii. | The contractual terms of the financial asset give rise on specified dates to cash flows that are solely payments of principal and interest on the principal amount outstanding. |
Subsequent to initial recognition, financial assets at amortized cost are measured at amortized cost, which equals to gross carrying amount determined by the effective interest method less any impairment loss, except for short-term receivables as the effect of discounting is immaterial. Exchange differences are recognized in profit or loss.
- 23 -
Interest income is calculated by applying the effective interest rate to the gross carrying amount of such financial assets.
| c) | Investments in equity instruments at FVOCI |
On initial recognition, the Company may make an irrevocable election to designate investments in equity instruments as at FVOCI. Designation at FVOCI is not permitted if the equity investment is held for trading or if it is contingent consideration recognized by an acquirer in a business combination.
Investments in equity instruments at FVOCI are subsequently measured at fair value with gains and losses arising from changes in fair value recognized in other comprehensive income and accumulated in other equity. The cumulative gain or loss will not be reclassified to profit or loss on disposal of the equity investments. Instead, it will be transferred to retained earnings.
Dividends on these investments in equity instruments are recognized in profit or loss when the Company’s right to receive the dividends is established, unless the dividends clearly represent a recovery of part of the cost of the investment.
| 2) | Impairment of financial assets and contract assets |
The Company recognizes a loss allowance for expected credit losses on financial assets at amortized cost (including accounts receivable) and contract assets.
The Company recognizes lifetime Expected Credit Loss (ECL) for accounts receivable and contract assets. For all other financial instruments, the Company recognizes lifetime ECL when there has been a significant increase in credit risk since initial recognition. If, on the other hand, the credit risk on the financial instrument has not increased significantly since initial recognition, the Company measures the loss allowance for that financial instrument at an amount equal to12-month ECL.
Expected credit losses reflect the weighted average of credit losses with the respective risks of a default occurring as the weights. Lifetime ECL represents the expected credit losses that will result from all possible default events over the expected life of a financial instrument. In contrast,12-month ECL represents the portion of ECL that is expected to result from default events on a financial instrument that are possible within 12 months after the reporting date.
The Company recognizes an impairment loss for all financial instruments with a corresponding adjustment to their carrying amount through a loss allowance account.
| 3) | Derecognition of financial assets |
The Company derecognizes a financial asset only when the contractual rights to the cash flows from the asset expire, or when it transfers the financial asset and substantially all the risks and rewards of ownership of the asset to another entity.
On derecognition of a financial asset measured at amortized cost in its entirety, the difference between the asset’s carrying amount and the sum of the consideration received and receivable is recognized in profit or loss.
On derecognition of investments in equity instruments at FVOCI in its entirety, the cumulative gain or loss is directly transferred to retained earnings, and it is not reclassified to profit or loss.
- 24 -
| b. | Financial liabilities |
| 1) | Subsequent measurement |
Except for financial liabilities at FVTPL, all the financial liabilities are subsequently measured at amortized cost using the effective interest method.
| 2) | Derecognition of financial liabilities |
The difference between the carrying amount of the financial liability derecognized and the consideration paid and payable, including anynon-cash assets transferred or liabilities assumed, is recognized in profit or loss.
| c. | Derivative financial instruments |
The Company enters into derivative financial instruments to manage its exposure to foreign exchange rate risks, including forward exchange contracts.
Derivatives are initially measured at fair value at the date the derivative contracts are entered into and are subsequently remeasured to their fair value at the end of each reporting period. The resulting gain or loss is recognized in profit or loss immediately unless the derivative is designated and effective as a hedging instrument, in which event the timing of the recognition in profit or loss depends on the nature of the hedge relationship. When the fair value of derivative financial instruments is positive, the derivative is recognized as a financial asset; when the fair value of derivative financial instruments is negative, the derivative is recognized as a financial liability.
Hedge Accounting
The Company designates some derivatives instruments as cash flow hedges. Hedges of foreign exchange risk on firm commitments are accounted for as cash flow hedges.
The effective portion of changes in the fair value of derivatives that are designated and qualify as cash flow hedges is recognized in other comprehensive income. The gain or loss relating to the ineffective portion is recognized immediately in profit or loss.
The associated gains or losses that were recognized in other comprehensive income are reclassified from equity to profit or loss as a reclassification adjustment in the line item relating to the hedged item in the same period when the hedged item affects profit or loss. If a hedge of a forecast transaction subsequently results in the recognition of anon-financial asset or anon-financial liability, the associated gains and losses that were recognized in other comprehensive income are removed from equity and are included in the initial cost of thenon-financial asset ornon-financial liability.
The Company discontinues hedge accounting only when the hedging relationship ceases to meet the qualifying criteria; for instance, when the hedging instrument expires or is sold, terminated or exercised. The cumulative gain or loss on the hedging instrument that has been previously recognized in other comprehensive income from the period when the hedge was effective remains separately in equity until the forecast transaction occurs. When a forecast transaction is no longer expected to occur, the gain or loss accumulated in equity is recognized immediately in profit or loss.
Provisions
Provisions are measured at the best estimate of the expenditure required to settle the Company’s obligation at the end of the reporting period, taking into account the risks and uncertainties surrounding the obligation. The provisions for warranties claims are made by management according to the sales agreements which represent the management’s best estimate of the future outflow of economic benefits. The provisions of warranties claims are recognized as operating cost in the period in which the goods are sold. The provision for onerous contracts represents the present obligation resulting from the measurement for the unavoidable costs of meeting the Company’s contractual obligations exceed the economic benefits expected to be received from the contracts.
- 25 -
Revenue Recognition
The Company identifies the performance obligations in the contract with the customers, allocates transaction price to each performance obligation and recognizes revenue when performance obligations are satisfied.
Sales of products are recognized as revenue when the Company delivers products and the customer accepts and controls the product. Except for the consumer electronic products such as mobile devices sold in channel stores which are usually in cash sale, the Company recognizes revenues for sale of other electronic devices and corresponding trade notes and accounts receivable.
Usage revenues from fixed-line services (including local, domestic long distance and international long distance telephone services), mobile services, internet and data services, and interconnection and call transfer fees from other telecommunications companies and carriers are billed in arrears and are recognized based upon seconds or minutes of traffic processed when the services are provided in accordance with contract terms. The usage revenues and corresponding trade notes and accounts receivable are recognized monthly.
Other revenues are recognized as follows:(a) one-time subscriber connection fees (on fixed-line services) are first recognized as contract liabilities and revenues are recognized subsequently over the average expected customer service periods, (b) monthly fees (on fixed-line services, mobile, internet and data services) and related receivables are accrued monthly, and (c) prepaid services (fixed-line, mobile, internet and data services) are recognized as contract liabilities upon collection considerations from customers and are recognized as revenues subsequently based upon actual usage by customers.
Where the Company enters into transactions which involve both the provision of telecommunications service bundled with products such as handsets, total consideration received from products and telecommunications service in these arrangements are allocated based on their relative stand-alone selling price. The amount of sales revenue recognized for products is not limited to the amount paid by the customer for the products. When the amount of sales revenue recognized for products exceeded the amount paid by the customer for the products, the difference is recognized as contract assets. Contract assets are reclassified to accounts receivable when the amounts become collectible from customers subsequently. When the amount of sales revenue recognized for products was less than the amount paid by the customer for the products, the difference is recognized as contract liabilities and revenues are recognized subsequently when the telecommunications service are provided.
For project business contracts, if a substantial part of the Company’s promise to customers is to manage and coordinate the various tasks and assume the risks of those tasks to ensure the individual goods or services are incorporated into the combined output, they are treated as a single performance obligation since the Company provides a significant integration service. The Company recognizes revenues and corresponding accounts receivable when the project business contract is completed and accepted by customers.
For service contracts such as maintenance and warranties, customers simultaneously receive and consume the benefits provided by the Company; thus revenues and corresponding accounts receivable of service contracts are recognized over the related service period.
When another party is involved in providing goods or services to a customer, the Company is acting as a principal if it controls the specified good or service before that good or service is transferred to a customer; otherwise, the Company is acting as an agent. When the Company is acting as a principal, gross inflow of economic benefits arising from transactions is recognized as revenue. When the Company is acting as an agent, revenue is recognized as its share of transaction.
- 26 -
Incremental Costs of Obtaining Contracts
Commissions and equipment subsidy related to telecommunications service as a result of obtaining contracts are recognized as an asset under the incremental costs of obtaining contracts to the extent the costs are expected to be recovered, and are amortized over the contract period. However, the Company elects not to capitalize the incremental costs of obtaining contracts if the amortization period of the assets that the Company otherwise would have recognized is expected to be one year or less.
Leasing
2019
At inception of a contract, the Company assesses whether the contract is, or contains, a lease.
| a. | The Company as lessor |
Rental income from operating leases is recognized on a straight-line basis over the term of the relevant lease.
| b. | The Company as lessee |
The Company recognizesright-of-use assets and lease liabilities for all leases at the commencement date of a lease, except for lease payments forlow-value assets are recognized as expenses on a straight-line basis over the lease terms accounted for applying recognition exemption.
Right-of-use assets are initially measured at cost, which comprises the initial measurement of lease liabilities and for lease payments made at or before the commencement date.Right-of-use assets are subsequently measured at cost less accumulated depreciation and accumulated impairment losses and adjusted for any remeasurement of the lease liabilities.Right-of-use assets are presented separately on the consolidated balance sheets.
Right-of-use assets are depreciated using the straight-line basis from the commencement dates to the earlier of the end of the useful lives of theright-of-use assets or the end of the lease terms.
Lease liabilities were initially measured at the present value of the lease payments, which comprise fixed payments,in-substance fixed payments, variable lease payments which depend on an index or a rate. The lease payments are discounted using the interest rate implicit in a lease, if that rate can be readily determined. If such rate cannot be readily determined, the lessee’s incremental borrowing rate is used.
Lease liabilities are subsequently measured at amortized cost using the effective interest method, with interest expense recognized over the lease terms. When there is a change in a lease term or a change in future lease payments resulting from a change in an index or a rate used to determine those payments, the Company remeasures the lease liabilities with a corresponding adjustment to theright-of-use-assets. However, if the carrying amount of theright-of-use assets is reduced to zero, any remaining amount of the remeasurement is recognized in profit or loss. Lease liabilities are presented separately on the consolidated balance sheets.
Variable lease payments not depending on an index or a rate are recognized as expenses in the periods in which they are incurred.
- 27 -
2018
| a. | The Company as lessor |
Rental income from operating leases is recognized on a straight-line basis over the term of the relevant lease.
| b. | The Company as lessee |
Operating lease payments are recognized as an expense on a straight-line basis over the lease term.
Borrowing Costs
Borrowing costs directly attributable to the acquisition, construction or production of qualifying assets, are added to the cost of those assets, until such time as the assets are substantially ready for their intended use or sale.
Other than stated above, all other borrowing costs are recognized in profit or loss in the period in which they are incurred.
Government Grants
Government grants are not recognized until there is reasonable assurance that the Company will comply with the conditions attached to government grants and that the grants will be received.
Government grants are recognized in profit or loss on a systematic basis over the periods in which the Company recognizes expenses of the related costs for which the grants are intended to compensate. Specifically, government grants whose primary condition is that the Company should construct noncurrent assets are recognized as deferred revenue and transferred to profit or loss on a systematic and rational basis over the useful lives of the related assets.
Employee Benefits
| a. | Short-term employee benefits |
Liabilities recognized in respect of short-term employee benefits are measured at the undiscounted amount of the benefits expected to be paid in exchange for the related service.
| b. | Retirement benefits |
Payments to defined contribution retirement benefit plans are recognized as an expense when employees have rendered service entitling them to the contributions.
Defined benefit costs (including service cost, net interest and remeasurement) under the defined benefit retirement benefit plans are determined using the projected unit credit method. Service cost (including current service cost and gains or losses on settlements) and net interest on the net defined benefit liability (asset) are recognized as employee benefits expense in the period they occur. Remeasurement, comprising (a) actuarial gains and losses; and (b) the return on plan assets, excluding amounts included in net interest on the net defined benefit liability (asset), is recognized in other comprehensive income in the period in which they occur. Remeasurement recognized in other comprehensive income is reflected immediately in retained earnings and will not be reclassified to profit or loss.
Net defined benefit liability (asset) represents the actual deficit (surplus) in the Company’s defined benefit plan. Any surplus resulting from this calculation is limited to the present value of any refunds from the plans or reductions in future contributions to the plans.
- 28 -
| c. | Other long-term employee benefits |
Other long-term employee benefits are accounted for in the same way as the accounting required for defined benefit plan except that remeasurement is recognized in profit or loss.
Share-based Payment Arrangements - Employee Stock Options
The fair value determined at the grant date of the employee share options is expensed on a straight-line basis over the vesting period, based on the Company’s estimate of employee stock options that are expected to ultimately vest, with a corresponding increase in additionalpaid-in capital—employee stock options. If the equity instruments granted vest immediately at the grant date, expenses are recognized in full in profit or loss.
At the end of each reporting period, the Company revises its estimate of the number of employee share options expected to vest. The impact of the revision of the original estimates, if any, is recognized in profit or loss such that the cumulative expense reflects the revised estimate, with a corresponding adjustment to additionalpaid-in capital—employee stock options.
Income Tax
Income tax expense represents the sum of the tax currently payable and deferred tax.
| a. | Current tax |
According to the Income Tax Act in the ROC, an additional tax of unappropriated earnings is provided for in the year the stockholders approve to retain the earnings.
Adjustments of prior years’ tax liabilities are added to or deducted from the current year’s tax provision.
| b. | Deferred tax |
Deferred tax is recognized on temporary differences between the carrying amounts of assets and liabilities in the consolidated financial statements and the corresponding tax bases used in the computation of taxable profit. If the temporary difference arises from the initial recognition (other than in a business combination) of assets and liabilities in a transaction that affects neither the taxable profit nor the accounting profit, the resulting deferred tax asset or liability is not recognized. In addition, a deferred tax liability is not recognized on taxable temporary difference arising from initial recognition of goodwill.
Deferred tax liabilities are generally recognized for all taxable temporary differences. Deferred tax assets are generally recognized for all deductible temporary differences, unused loss carry forward and unused tax credits from purchases of machinery, equipment and technology and research and development expenditures to the extent that it is probable that taxable profits will be available against which those deductible temporary differences can be utilized.
Deferred tax liabilities are recognized for taxable temporary differences associated with investments in subsidiaries and associates, except where the Company is able to control the reversal of the temporary difference and it is probable that the temporary difference will not reverse in the foreseeable future. Deferred tax assets arising from deductible temporary differences associated with such investments and interests are only recognized to the extent that it is probable that there will be sufficient taxable profits against which to utilize the benefits of the temporary differences and they are expected to reverse in the foreseeable future.
- 29 -
The carrying amount of deferred tax assets is reviewed at the end of each reporting period and reduced to the extent that it is no longer probable that sufficient taxable profits will be available to allow all or part of the asset to be recovered. A previously unrecognized deferred tax asset is also reviewed at the end of each reporting period and recognized to the extent that it has become probable that future taxable profit will allow the deferred tax asset to be recovered.
Deferred tax assets and liabilities are measured at the tax rates that are expected to apply in the period in which the liability is settled or the asset realized, based on tax rates (and tax laws) that have been enacted or substantively enacted by the end of the reporting period. The measurement of deferred tax assets and liabilities reflects the tax consequences that would follow from the manner in which the Company expects, at the end of the reporting period, to recover or settle the carrying amount of its assets and liabilities.
| c. | Current and deferred tax |
Current and deferred tax are recognized in profit or loss, except when they relate to items that are recognized in other comprehensive income, in which case, the current and deferred tax are also recognized in other comprehensive income.
Where current tax or deferred tax arises from the initial accounting for a business combination, the tax effect is included in the accounting for the business combination.
| 4. | CRITICAL ACCOUNTING JUDGMENTS AND KEY SOURCES OF ESTIMATION UNCERTAINTY AND ASSUMPTION |
In the application of the Company’s accounting policies, the management is required to make judgments, estimates and assumptions which are based on historical experience and other factors that are not readily apparent from other sources. Actual results may differ from these estimates.
The estimates and underlying assumptions are reviewed by the management on an ongoing basis. Revisions to accounting estimates are recognized in the period in which the estimate is revised if the revision affects only that period or in the period of the revision and future periods if the revision affects both current and future periods.
| a. | Critical accounting judgments |
| 1) | Revenue recognition |
The Company’s project agreements are mainly to provide one or more customized equipment or services to customers. In order to fulfill the agreements, another party may be involved in some agreements. The Company considers the following factors to determine whether the Company is a principal of the transaction: whether the Company is the primary obligation provider of the agreements, its exposures to inventory risks and the discretion in establishing prices, etc. The determination of whether the Company is a principal or an agent will affect the amount of revenue recognized by the Company. Only when the Company is acting as a principal, gross inflows of economic benefits arising from transactions is recognized as revenue.
| 2) | Control over subsidiaries |
As discussed in Note 3, some entities are subsidiaries of the Company although the Company only owns less than 50% ownership interests in these entities. After considering the Company’s absolute size of holding in the entity and the relative size of and the dispersion of shares owned by the other stockholders, and the contractual arrangements between the Company and other investors, potential voting interests and the written agreement between stockholders, the management concluded that the Company has a sufficiently dominant voting interest to direct the relevant activities of the entity and therefore the Company has control over these entities.
- 30 -
| b. | Key sources of estimation uncertainty and assumption |
The following are the key assumptions concerning the future, and other key sources of estimation uncertainty at the end of the reporting period. Actual results may differ from these estimates.
| 1) | Impairment of trade notes and accounts receivable |
The provision for impairment of trade notes and accounts receivable is based on assumptions about risk of default and expected loss rates. The Company uses judgment in making these assumptions and in selecting the inputs to the impairment calculation, based on the Company’s past experience, current market conditions as well as forward looking information at the end of each reporting period. For details of the key assumptions and inputs used, see Note 9. Where the actual future cash flows are less than expected, a material impairment loss may arise.
| 2) | Fair value measurements and valuation processes |
For the assets and liabilities measured at fair value without quoted prices in active markets, the Company’s management determines the appropriate valuation techniques for the fair value measurements and whether to engage third party qualified appraisers based on the related regulations and professional judgments.
Information about the valuation techniques and inputs used in determining the fair value of various assets and liabilities was disclosed in Note 35. If the actual changes of inputs in the future differ from expectation, the fair value may vary accordingly. The Company updates inputs periodically to monitor the appropriateness of the fair value measurement.
| 3) | Provision for inventory valuation and obsolescence |
Inventories are stated at the lower of cost or net realizable value. Net realizable value is calculated as the estimated selling price less the estimated selling costs. Comparison of net realizable value and cost is determined on an item by item basis, except for those similar items which could be categorized into the same groups. The Company uses the inventory holding period and turnover as the evaluation basis for inventory obsolescence losses.
| 4) | Impairment of tangible and intangible assets |
When an indication of impairment is assessed with objective evidence, the Company considers whether the recoverable amount of an asset is less than its carrying amount and recognizes the impairment loss based on difference between the recoverable amount and its carrying amount. The estimate of recoverable amount would impact on the timing and the amount of impairment loss recognition.
| 5) | Useful lives of property, plant and equipment |
As discussed in Note 3, “Summary of Significant Accounting Policies—Property, Plant and Equipment”, the Company reviews estimated useful lives of property, plant and equipment at the end of each year.
- 31 -
| 6) | Recognition and measurement of defined benefit plans |
Net defined benefit liabilities and the resulting pension expense under defined benefit pension plans are calculated using the Projected Unit Credit Method. Actuarial assumptions comprise the discount rate, employee turnover rate, average future salary increase and etc. Changes in economic circumstances and market conditions will affect these assumptions and may have a material impact on the amount of the expense and the liability.
| 7) | Lessees’ incremental borrowing rates |
2019
In determining a lessee’s incremental borrowing rate used in discounting lease payments, a risk-free rate for relevant duration and the same currency is selected as a reference rate. The lessee’s credit spread adjustments and lease specific adjustments are also taken into account.
| 5. | APPLICATION OF NEW AND REVISED STANDARDS AND INTERPRETATIONS |
| a. | Initial application of the amendments to the Regulations Governing the Preparation of Financial Reports by Securities Issuers and the IFRS, IAS, IFRIC and SIC endorsed and issued into effect by the FSC. |
Except for the following, whenever applied, the initial application of the amendments to the Regulations Governing the Preparation of Financial Reports by Securities Issuers and the IFRS, IAS, IFRIC and SIC issued by the International Accounting Standards Board and endorsed and issued into effect by the FSC does not have material impacts on the Company’s consolidated financial statements.
IFRS 16 “Leases”
IFRS 16 sets out the accounting standards for identifying leases and accounting treatments for lessors and lessees. It supersedes IAS 17, IFRIC 4 - Determining Whether an Arrangement Contains a Lease and a number of related interpretations. Refer to Note 3 for information relating to the relevant accounting policies.
The Company reassessed whether a contract is, or contains, a lease in accordance with the definition of a lease under IFRS 16. Some contracts previously identified as containing a lease under IAS 17 and IFRIC 4 do not meet the definition of a lease under IFRS 16 and are accounted for in accordance with other accounting standards because the Company does not have the right to direct the use of the identified assets. Contracts that are reassessed as leases or containing a lease are accounted for in accordance with the transitional provisions under IFRS 16.
If the Company is a lessee, it shall recognizeright-of-use assets and lease liabilities for all leases on the consolidated balance sheets except for those whose payments forlow-value assets are recognized as expenses on a straight-line basis. On the consolidated statements of comprehensive income, the Company presents the depreciation expense charged on theright-of-use asset separately from the interest expense accrued on lease liability using the effective interest method. On the consolidated statements of cash flows, cash payments for the principal portion of lease liability are classified within financing activities; cash payments for interest portion are classified within operating activities. Before the application of IFRS 16, payments under operating lease contracts were recognized as expenses on a straight-line basis. Prepaid lease payments for use rights of leased assets were recognized as prepaid rents. Cash flows for operating leases were classified within operating activities on the statements of cash flows.
- 32 -
The Company did not make any adjustments for leases in which the Company is a lessor and accounted for those leases with the application of IFRS 16 starting from January 1, 2019.
The Company applied IFRS 16 retrospectively with the cumulative effect of the initial application of IFRS 16 recognized in retained earnings on January 1, 2019. Comparative financial information is not restated.
Lease liabilities are recognized on January 1, 2019 for leases previously classified as operating leases under IAS 17 and measured at the present value of the remaining lease payments, discounted using the lessee’s incremental borrowing rate on January 1, 2019.Right-of-use assets are measured at the present value discounted using the aforementioned incremental borrowing rate as if IFRS 16 had been applied since the commencement date of leases. The Company applies IAS 36 for assessing impairment ofright-of-use assets.
The Company’s weighted average incremental borrowing rate applied to lease liabilities recognized on January 1, 2019 was 0.85%. The difference between the (1) lease liabilities recognized on January 1, 2019 and (2) future aggregate minimum lease payments ofnon-cancellable operating lease under IAS 17 on December 31, 2018 is explained as follows:
The future aggregate minimum lease payments ofnon-cancellable operating lease on December 31, 2018 | $ | 10,557,854 | ||
Less: Recognition exemption for leases oflow-value assets | (3,263 | ) | ||
|
| |||
Undiscounted amount on January 1, 2019 | $ | 10,554,591 | ||
|
| |||
Discounted lease liabilities using the incremental borrowing rate on January 1, 2019 | $ | 10,339,868 | ||
Add: Adjustments as a result of a different treatment of extension options | 189 | |||
|
| |||
Lease liabilities recognized on January 1, 2019 | $ | 10,340,057 | ||
|
|
The impact on assets, liabilities and equity as of January 1, 2019 from the initial application of IFRS 16 is set out as follows:
| Carrying Amount as of January 1, 2019 | Adjustments Arising from Initial Application of IFRS 16 | Adjusted Carrying Amount as of January 1, 2019 | ||||||||||
Prepayments - current | $ | 1,872,984 | $ | (245,215 | ) | $ | 1,627,769 | |||||
|
|
|
| |||||||||
Property, plant and equipment | $ | 288,914,228 | (1,308,990 | ) | $ | 287,605,238 | ||||||
|
|
|
| |||||||||
Right-of-use assets | $ | — | 12,163,063 | $ | 12,163,063 | |||||||
|
|
|
| |||||||||
Deferred income tax assets | $ | 3,553,856 | 25,588 | $ | 3,579,444 | |||||||
|
|
|
| |||||||||
Prepayments - noncurrent | $ | 3,463,337 | (413,521 | ) | $ | 3,049,816 | ||||||
|
|
|
|
|
| |||||||
Total effect on assets | $ | 10,220,925 | ||||||||||
|
| |||||||||||
Contract liabilities - current | $ | 10,687,772 | $ | 214,174 | $ | 10,901,946 | ||||||
|
|
|
| |||||||||
Lease liabilities - current | $ | — | 3,394,119 | $ | 3,394,119 | |||||||
|
|
|
| |||||||||
Other payables | $ | 23,315,383 | (48,712 | ) | $ | 23,266,671 | ||||||
|
|
|
| |||||||||
Other current liabilities | $ | 1,381,606 | (214,174 | ) | $ | 1,167,432 | ||||||
|
|
|
| |||||||||
Contract liabilities - noncurrent | $ | 2,595,149 | 3,482,907 | $ | 6,078,056 | |||||||
|
|
|
| |||||||||
Deferred income tax liabilities | $ | 1,991,843 | $ | 6 | $ | 1,991,849 | ||||||
|
|
|
| |||||||||
Lease liabilities - noncurrent | $ | — | 6,945,938 | $ | 6,945,938 | |||||||
|
|
|
| |||||||||
Other noncurrent liabilities | $ | 4,793,237 | (3,482,907 | ) | $ | 1,310,330 | ||||||
|
|
|
|
|
| |||||||
Total effect on liabilities | $ | 10,291,351 | ||||||||||
|
| |||||||||||
Unappropriated earnings | $ | 47,141,345 | $ | (50,823 | ) | $ | 47,090,522 | |||||
|
|
|
| |||||||||
Noncontrolling interests | $ | 10,009,948 | (19,603 | ) | $ | 9,990,345 | ||||||
|
|
|
|
|
| |||||||
Total effect on equity (unappropriated earnings) | $ | (70,426 | ) | |||||||||
|
| |||||||||||
- 33 -
| b. | Amendments to IFRSs endorsed by the FSC for application starting from January 1, 2020 |
New, Revised or Amended Standards and Interpretations | Effective Date Issued by IASB | |||
Amendments to IFRS 3 | Definition of a Business | January 1, 2020 (Note 1) | ||
Amendments to IFRS 9, IAS 39 and IFRS 7 | Interest Rate Benchmark Reform | January 1, 2020 (Note 2) | ||
Amendments to IAS 1 and IAS 8 | Definition of Materiality | January 1, 2020 (Note 3) | ||
| Note 1: | The Company shall apply these amendments to business combinations for which the acquisition date is on or after the beginning of the first annual reporting period beginning on or after January 1, 2020 and to asset acquisitions that occur on or after the beginning of that period. |
| Note 2: | The Company shall apply these amendments retrospectively in annual periods beginning on or after January 1, 2020. |
| Note 3: | The Company shall apply these amendments prospectively in annual periods beginning on or after January 1, 2020. |
The application of the above new, revised or amended standards and interpretations will not have material impact on the Company’s consolidated financial statements.
| c. | IFRSs issued by the IASB but not yet endorsed and issued into effect by the FSC |
New, Revised or Amended Standards and Interpretations | Effective Date Announced by IASB (Note) | |||
Amendments to IFRS 10 and IAS 28 | Sale or Contribution of Assets between An Investor and Its Associate or Joint Venture | To be determined by IASB | ||
Amendments to IAS 1 | Classification of liabilities as current or noncurrent | January 1, 2022 | ||
- 34 -
| Note: | Unless stated otherwise, the above New IFRSs are effective for annual periods beginning on or after their respective effective dates. |
As of the date the consolidated financial statements were authorized for issue, the Company is continuously assessing the possible impact that the application of above standards and interpretations will have on the Company’s financial position and operating result and will disclose the relevant impact when the assessment is completed.
| 6. | CASH AND CASH EQUIVALENTS |
| December 31 | ||||||||
| 2019 | 2018 | |||||||
Cash | ||||||||
Cash on hand | $ | 353,499 | $ | 462,719 | ||||
Bank deposits | 9,432,814 | 10,574,697 | ||||||
|
|
|
| |||||
| 9,786,313 | 11,037,416 | |||||||
|
|
|
| |||||
Cash equivalents (investments with maturities of less than three months) | ||||||||
Commercial paper | 20,109,823 | 6,143,672 | ||||||
Negotiable certificates of deposit | 1,700,000 | 7,600,000 | ||||||
Time deposits | 2,450,509 | 2,863,692 | ||||||
Repurchase agreements collateralized by bonds | 2,998 | — | ||||||
|
|
|
| |||||
| 24,263,330 | 16,607,364 | |||||||
|
|
|
| |||||
| $ | 34,049,643 | $ | 27,644,780 | |||||
|
|
|
| |||||
The annual yield rates of bank deposits, commercial paper, negotiable certificates of deposit, time deposits and repurchase agreements collateralized by bonds as of balance sheet dates were as follows:
| December 31 | ||||
| 2019 | 2018 | |||
Bank deposits | 0.00%-0.74% | 0.00%-0.50% | ||
Commercial paper | 0.47%-0.54% | 0.47%-0.57% | ||
Negotiable certificates of deposit | 0.58%-0.60% | 0.55%-0.60% | ||
Time deposits | 0.09%-4.40% | 0.09%-4.40% | ||
Repurchase agreements collateralized by bonds | 1.90% | — | ||
| 7. | FINANCIAL INSTRUMENTS AT FAIR VALUE THROUGH PROFIT OR LOSS |
| December 31 | ||||||||
| 2019 | 2018 | |||||||
Financial assets-current | ||||||||
Mandatorily measured at FVTPL | ||||||||
Derivatives (not designated for hedge) | ||||||||
Forward exchange contract | $ | 53 | $ | — | ||||
Non-derivatives | ||||||||
Listed stocks - domestic | 463 | — | ||||||
|
|
|
| |||||
| $ | 516 | $ | — | |||||
|
|
|
| |||||
Financial assets-noncurrent | ||||||||
Mandatorily measured at FVTPL | ||||||||
Non-derivatives | ||||||||
Non-listed stocks - domestic | $ | 510,801 | $ | 292,910 | ||||
Non-listed stocks - foreign | 267,304 | 224,452 | ||||||
|
|
|
| |||||
| $ | 778,105 | $ | 517,362 | |||||
|
|
|
| |||||
Financial liabilities-current | ||||||||
Held for trading | ||||||||
Derivatives (not designated for hedge) | ||||||||
Forward exchange contracts | $ | 239 | $ | 1,114 | ||||
|
|
|
| |||||
- 35 -
The Company increased its investment in Taiwania Capital Buffalo Fund Co., Ltd. proportionally for 300,000 thousand in October 2019 and the Company’s ownership interest in Taiwania Capital Buffalo Fund Co., Ltd. remained at 12.9%.
Outstanding forward exchange contracts not designated for hedge as of balance sheet dates were as follows:
| Currency | Maturity Period | Contract Amount (In Thousands) | ||||||||||
December 31, 2019 | ||||||||||||
Forward exchange contracts - buy | EUR/NT$ | 2020.03 | EUR1,500/NT$50,910 | |||||||||
Forward exchange contracts - buy | US$/NT$ | 2020.01 | US$850/NT$25,524 | |||||||||
December 31, 2018 | ||||||||||||
Forward exchange contracts - buy | EUR/NT$ | 2019.03-06 | EUR5,452/NT$192,734 | |||||||||
Forward exchange contracts - buy | US$/NT$ | 2019.01 | US$2,020/NT$62,252 | |||||||||
The Company entered into the above forward exchange contracts to manage its exposure to foreign currency risk due to fluctuations in exchange rates. However, the aforementioned derivatives did not meet the criteria for hedge accounting.
| 8. | FINANCIAL ASSETS AT FAIR VALUE THROUGH OTHER COMPREHENSIVE INCOME - NONCURRENT |
| December 31 | ||||||||
| 2019 | 2018 | |||||||
Domestic investments | ||||||||
Listed stocks | $ | 2,453,616 | $ | 2,899,843 | ||||
Non-listed stocks | 4,680,931 | 3,901,053 | ||||||
Foreign investments | ||||||||
Non-listed stocks | $ | 134,370 | $ | 131,607 | ||||
|
|
|
| |||||
| $ | 7,268,917 | $ | 6,932,503 | |||||
|
|
|
| |||||
- 36 -
The Company holds the above foreign and domestic stocks for medium to long-term strategic purposes and expects to profit from long-term investment. Accordingly, the management elected to designate these investments in equity instruments at FVOCI as they believe that recognizing short-term fair value fluctuations of these investments in profit or loss is not consistent with the Company’s strategy of holding these investments for long-term purposes.
The Company recognized dividend income of $296,360 thousand and $395,593 thousand for the years ended December 31, 2019 and 2018, respectively, from those investments still held on balance sheet dates.
| 9. | TRADE NOTES AND ACCOUNTS RECEIVABLE, NET |
| December 31 | ||||||||
| 2019 | 2018 | |||||||
Trade notes and accounts receivable | $ | 28,767,539 | $ | 32,677,558 | ||||
Less: Loss allowance | (2,359,756 | ) | (2,602,055 | ) | ||||
|
|
|
| |||||
| $ | 26,407,783 | $ | 30,075,503 | |||||
|
|
|
| |||||
The main credit terms range from 30 to 90 days.
The Company serves a large consumer base for telecommunications business; therefore, the concentration of credit risk is limited. When having transactions with customers, the Company considers the record of arrears in the past. In addition, the Company may also collect some telecommunication charges in advance to reduce the payment arrears in subsequent periods.
The Company adopted a policy of dealing with counterparties with certain credit ratings for project business and to obtain collateral where necessary to mitigate the risk of loss arising from default. Credit rating information is provided by independent rating agencies where available and, if such credit rating information is not available, the Company uses other publicly available financial information and its own historical transaction experience to rate its major customers. The Company continues to monitor the credit exposure and credit ratings of its counterparties and spread the credit risk amongst qualified counterparties.
In order to mitigate credit risk, the management of the Company has delegated a team responsible for determining credit limits, credit approvals and other monitoring procedures to ensure the recoverability of receivables. In addition, the Company reviews the recoverable amount of receivables at balance sheet dates to ensure that adequate allowance is provided for possible irrecoverable amounts. In this regard, the management believes the Company’s credit risk could be reasonably reduced.
The Company applies the simplified approach to providing for expected credit losses prescribed by IFRS 9, which permits the use of lifetime expected loss provision for receivables. The expected credit losses on receivables are estimated using a provision matrix by reference to past default experience of the customers and an analysis of the customers’ current financial positions, as well as the forward-looking indicators such as macroeconomic business indicator.
- 37 -
When there are evidences indicating that the counterparty is in evasion, bankruptcy, deregistration of its company or the accounts receivable are over two years past due and the recoverable amount cannot be reasonable estimated, the Company writes off the trade notes and accounts receivable. For accounts receivable that have been written off, the Company continues to engage in enforcement activity to attempt to recover the receivables due. Where recoveries are made, these are recognized in profit or loss.
Except for receivables arising from telecommunications business and project business, the Company’s remaining accounts receivable are limited. Therefore, only Chunghwa’s provision matrix arising from telecommunications business and project business is disclosed below:
December 31, 2019
| Not Past Due | Past Due Less than 30 Days | Pass Due 31 to 60 | Pass Due 61 to 90 | Pass Due 91 to 120 | Pass Due 121 to 180 | Pass Due over 180 Days | Total | |||||||||||||||||||||||||
Telecommunications business | ||||||||||||||||||||||||||||||||
Expected credit loss rate (Note a) | 0%- 2 | % | 0%-25 | % | 0%-68 | % | 0%-83 | % | 11%-90 | % | 17%-96 | % | 100 | % | ||||||||||||||||||
Gross carrying amount | $ | 19,020,326 | $ | 267,902 | $ | 74,775 | $ | 46,782 | $ | 40,771 | $ | 28,021 | $ | 600,985 | $ | 20,079,562 | ||||||||||||||||
Loss allowance (lifetime ECL) | (55,903 | ) | (25,517 | ) | (27,630 | ) | (34,624 | ) | (26,281 | ) | (27,366 | ) | (600,985 | ) | (798,306 | ) | ||||||||||||||||
|
|
|
|
|
|
|
|
|
|
|
|
|
|
|
| |||||||||||||||||
Amortized cost | $ | 18,964,423 | $ | 242,385 | $ | 47,145 | $ | 12,158 | $ | 14,490 | $ | 655 | $ | — | $ | 19,281,256 | ||||||||||||||||
|
|
|
|
|
|
|
|
|
|
|
|
|
|
|
| |||||||||||||||||
Project business | ||||||||||||||||||||||||||||||||
Expected credit loss rate (Note b) | 0%-5 | % | 5 | % | 10 | % | 30% | 50 | % | 80 | % | 100 | % | |||||||||||||||||||
Gross carrying amount | $ | 4,053,681 | $ | 78,147 | $ | 52,227 | $ | 29,527 | $ | 12,688 | $ | 1,040 | $ | 1,471,840 | $ | 5,699,150 | ||||||||||||||||
Loss allowance (lifetime ECL) | (2,637 | ) | (4,892 | ) | (5,223 | ) | (10,577 | ) | (6,344 | ) | (832 | ) | (1,471,840 | ) | (1,502,345 | ) | ||||||||||||||||
|
|
|
|
|
|
|
|
|
|
|
|
|
|
|
| |||||||||||||||||
Amortized cost | $ | 4,051,044 | $ | 73,255 | $ | 47,004 | $ | 18,950 | $ | 6,344 | $ | 208 | $ | — | $ | 4,196,805 | ||||||||||||||||
|
|
|
|
|
|
|
|
|
|
|
|
|
|
|
| |||||||||||||||||
December 31, 2018
| Not Past Due | Past Due Less than 30 Days | Pass Due 31 to 60 | Pass Due 61 to 90 | Pass Due 91 to 120 | Pass Due 121 to 180 | Pass Due over 180 Days | Total | |||||||||||||||||||||||||
Telecommunications business | ||||||||||||||||||||||||||||||||
Expected credit loss rate (Note a) | 0%- 3 | % | 3%-30 | % | 7%-69 | % | 19%-82 | % | 32%-90 | % | 61%-95 | % | 100 | % | ||||||||||||||||||
Gross carrying amount | $ | 23,307,276 | $ | 454,465 | $ | 94,715 | $ | 48,924 | $ | 37,640 | $ | 36,090 | $ | 418,101 | $ | 24,397,211 | ||||||||||||||||
Loss allowance (lifetime ECL) | (79,857 | ) | (26,872 | ) | (24,023 | ) | (28,432 | ) | (28,196 | ) | (25,618 | ) | (418,101 | ) | (631,099 | ) | ||||||||||||||||
|
|
|
|
|
|
|
|
|
|
|
|
|
|
|
| |||||||||||||||||
Amortized cost | $ | 23,227,419 | $ | 427,593 | $ | 70,692 | $ | 20,492 | $ | 9,444 | $ | 10,472 | $ | — | $ | 23,766,112 | ||||||||||||||||
|
|
|
|
|
|
|
|
|
|
|
|
|
|
|
| |||||||||||||||||
Project business | ||||||||||||||||||||||||||||||||
Expected credit loss rate (Note b) | 0%-5 | % | 5 | % | 10 | % | 30 | % | 50 | % | 80 | % | 100 | % | ||||||||||||||||||
Gross carrying amount | $ | 4,066,271 | $ | 88,384 | $ | 92,343 | $ | 8,248 | $ | 12,132 | $ | 6,809 | $ | 1,725,168 | $ | 5,999,355 | ||||||||||||||||
Loss allowance (lifetime ECL) | (152,624 | ) | (8,609 | ) | (10,142 | ) | (2,910 | ) | (8,492 | ) | (5,643 | ) | (1,725,168 | ) | (1,913,588 | ) | ||||||||||||||||
|
|
|
|
|
|
|
|
|
|
|
|
|
|
|
| |||||||||||||||||
Amortized cost | $ | 3,913,647 | $ | 79,775 | $ | 82,201 | $ | 5,338 | $ | 3,640 | $ | 1,166 | $ | — | $ | 4,085,767 | ||||||||||||||||
|
|
|
|
|
|
|
|
|
|
|
|
|
|
|
| |||||||||||||||||
| Note a: | Please refer to Notes 28 and 41 for the information of disaggregation of telecommunications service revenue. The expected credit loss rate applicable to different business revenue varies so as to reflect the risk level indicating by factors like historical experience. |
| Note b: | The project business has different loss types according to the customer types. The expected credit loss rate listed above is for general customers. When customer is the government or its affiliates, it is expected that no credit loss will occur. For those who had bounced or exchanged checks as well as those accounts receivable were overdue more than six months that are classified as high risk customers, the expected credit loss of high risk customers is at least 50%, and the rate is increased when the overdue days increases. |
- 38 -
Movements of loss allowance for trade notes and accounts receivable were as follows:
| Year Ended December 31 | ||||||||
| 2019 | 2018 | |||||||
Beginning balance | $ | 2,602,055 | $ | 2,117,349 | ||||
Add: Provision for (reversal of) credit loss | (53,952 | ) | 804,727 | |||||
Less: Amounts written off | (188,347 | ) | (320,021 | ) | ||||
|
|
|
| |||||
Ending balance | $ | 2,359,756 | $ | 2,602,055 | ||||
|
|
|
| |||||
| 10. | INVENTORIES |
| December 31 | ||||||||
| 2019 | 2018 | |||||||
Merchandise | $ | 3,858,034 | $ | 6,067,750 | ||||
Project in process | 11,113,286 | 6,756,486 | ||||||
Work in process | 141,417 | 109,191 | ||||||
Raw materials | 155,495 | 111,566 | ||||||
|
|
|
| |||||
| 15,268,232 | 13,044,993 | |||||||
Land held under development | 1,998,733 | 1,998,733 | ||||||
Construction in progress | 77,311 | 76,989 | ||||||
|
|
|
| |||||
| $ | 17,344,276 | $ | 15,120,715 | |||||
|
|
|
| |||||
The operating costs related to inventories were $49,258,066 thousand (including the valuation loss on inventories of $474,709 thousand) and $48,648,763 thousand (including the valuation loss on inventories of $365,123 thousand) for the years ended December 31, 2019 and 2018, respectively.
As of December 31, 2019 and 2018, inventories of $2,076,044 thousand and $2,075,722 thousand, respectively, were expected to be recovered for a time period longer than twelve months. The aforementioned amount of inventories is related to property development owned by LED.
Land held under development and construction in progress was developed by LED for Qingshan Sec., Dayuan Dist., Taoyuan City project.
| 11. | PREPAYMENTS |
| December 31 | ||||||||
| 2019 | 2018 | |||||||
Prepaid rents | $ | 3,382,560 | $ | 2,415,083 | ||||
Others | 1,180,034 | 2,921,238 | ||||||
|
|
|
| |||||
| $ | 4,562,594 | $ | 5,336,321 | |||||
|
|
|
| |||||
Current | ||||||||
Prepaid rents | $ | 704,607 | $ | 599,817 | ||||
Others | 1,178,652 | 1,273,167 | ||||||
|
|
|
| |||||
| $ | 1,883,259 | $ | 1,872,984 | |||||
|
|
|
| |||||
Noncurrent | ||||||||
Prepaid rents | $ | 2,677,953 | $ | 1,815,266 | ||||
Others | 1,382 | 1,648,071 | ||||||
|
|
|
| |||||
| $ | 2,679,335 | $ | 3,463,337 | |||||
|
|
|
| |||||
- 39 -
Prepaid rents in 2019 comprises the prepayments from the lease agreements applying the recognition exemption and the prepayments for leases that do not meet the definition of leases under IFRS 16.
| 12. | OTHER CURRENT MONETARY ASSETS |
| December 31 | ||||||||
| 2019 | 2018 | |||||||
Time deposits and negotiable certificates of deposit with maturities of more than three months | $ | 5,959,074 | $ | 8,156,647 | ||||
Repurchase agreements collateralized by bonds with maturities of more than three months | 14,990 | — | ||||||
Others | 1,524,500 | 1,347,556 | ||||||
|
|
|
| |||||
| $ | 7,498,564 | $ | 9,504,203 | |||||
|
|
|
| |||||
The annual yield rates of time deposits, negotiable certificates of deposit and repurchase agreements collateralized by bonds with maturities of more than three months at the balance sheet dates were as follows:
| December 31 | ||||
| 2019 | 2018 | |||
Time deposits and negotiable certificates of deposit with maturities of more than three months | 0.03%-2.73% | 0.03%-3.05% | ||
Repurchase agreements collateralized by bonds with maturities of more than three months | 2.50% | — | ||
| 13. | SUBSIDIARIES |
| a. | Information on significant noncontrolling interest subsidiary |
| Proportion of Ownership Interests and Voting Rights Held by Noncontrolling Interests | ||||||||||
| Principal Place | December 31 | |||||||||
| Subsidiaries | of Business | 2019 | 2018 | |||||||
SENAO | Taiwan | 72 | % | 72 | % | |||||
CHPT | Taiwan | 66 | % | 66 | % | |||||
- 40 -
| Profit Allocated to Noncontrolling Interests | Accumulated Noncontrolling Interests | |||||||||||||||
| Year Ended December 31 | December 31 | |||||||||||||||
| 2019 | 2018 | 2019 | 2018 | |||||||||||||
SENAO | $ | 292,776 | $ | 281,238 | $ | 4,267,547 | $ | 4,228,240 | ||||||||
|
|
|
| |||||||||||||
CHPT | $ | 411,049 | $ | 456,599 | 4,236,872 | 4,044,322 | ||||||||||
|
|
|
| |||||||||||||
Individually immaterial subsidiaries with noncontrolling interests | 1,779,103 | 1,737,386 | ||||||||||||||
|
|
|
| |||||||||||||
| $ | 10,283,522 | $ | 10,009,948 | |||||||||||||
|
|
|
| |||||||||||||
Summarized financial information in respect of SENAO and its subsidiaries that has material noncontrolling interests is set out below. The summarized financial information below represents amounts before intercompany eliminations.
| December 31 | ||||||||
| 2019 | 2018 | |||||||
Current assets | $ | 6,751,385 | $ | 7,041,416 | ||||
Noncurrent assets | 3,321,252 | 2,675,748 | ||||||
Current liabilities | (3,617,165 | ) | (3,740,162 | ) | ||||
Noncurrent liabilities | (589,882 | ) | (164,056 | ) | ||||
|
|
|
| |||||
Equity | $ | 5,865,590 | $ | 5,812,946 | ||||
|
|
|
| |||||
Equity attributable to the parent | $ | 1,598,043 | $ | 1,584,706 | ||||
Equity attributable to noncontrolling interests | 4,267,547 | 4,228,240 | ||||||
|
|
|
| |||||
| $ | 5,865,590 | $ | 5,812,946 | |||||
|
|
|
| |||||
| Year Ended December 31 | ||||||||
| 2019 | 2018 | |||||||
Revenues and income | $ | 29,130,695 | $ | 31,533,371 | ||||
Costs and expenses | 28,722,830 | 31,137,428 | ||||||
|
|
|
| |||||
Profit for the year | $ | 407,865 | $ | 395,943 | ||||
|
|
|
| |||||
Profit attributable to the parent | $ | 115,089 | $ | 114,705 | ||||
Profit attributable to noncontrolling interests | 292,776 | 281,238 | ||||||
|
|
|
| |||||
Profit for the year | $ | 407,865 | $ | 395,943 | ||||
|
|
|
| |||||
Other comprehensive loss attributable to the parent | $ | (7,164 | ) | $ | (1,818 | ) | ||
Other comprehensive income (loss) attributable to noncontrolling interests | 22,358 | (10,523 | ) | |||||
|
|
|
| |||||
| $ | 15,194 | $ | (12,341 | ) | ||||
|
|
|
| |||||
Total comprehensive income attributable to the parent | $ | 107,925 | $ | 112,887 | ||||
Total comprehensive income attributable to noncontrolling interests | 315,134 | 270,715 | ||||||
|
|
|
| |||||
| $ | 423,059 | $ | 383,602 | |||||
|
|
|
| |||||
Net cash flow from operating activities | $ | 537,965 | $ | 696,142 | ||||
Net cash flow from investing activities | 235,169 | (12,596 | ) | |||||
Net cash flow from financing activities | (717,602 | ) | (490,757 | ) | ||||
Effect of exchange rate changes on cash and cash equivalents | (193 | ) | 516 | |||||
|
|
|
| |||||
Net cash inflow | $ | 55,339 | $ | 193,305 | ||||
|
|
|
| |||||
Dividends paid to noncontrolling interests | $ | 268,944 | $ | 587,264 | ||||
|
|
|
| |||||
- 41 -
Summarized financial information in respect of CHPT and its subsidiaries that has material noncontrolling interests is set out below. The summarized financial information below represents amounts before intercompany eliminations.
| December 31 | ||||||||
| 2019 | 2018 | |||||||
Current assets | $ | 3,709,630 | $ | 4,416,910 | ||||
Noncurrent assets | 4,043,881 | 2,779,020 | ||||||
Current liabilities | (1,287,597 | ) | (1,044,054 | ) | ||||
Noncurrent liabilities | (22,003 | ) | (816 | ) | ||||
|
|
|
| |||||
Equity | $ | 6,443,911 | $ | 6,151,060 | ||||
|
|
|
| |||||
Equity attributable to CHI | $ | 2,207,039 | $ | 2,106,738 | ||||
Equity attributable to noncontrolling interests | 4,236,872 | 4,044,322 | ||||||
|
|
|
| |||||
| $ | 6,443,911 | $ | 6,151,060 | |||||
|
|
|
| |||||
| Year Ended December 31 | ||||||||
| 2019 | 2018 | |||||||
Revenues and income | $ | 3,404,570 | $ | 3,299,226 | ||||
Costs and expenses | 2,779,406 | 2,583,202 | ||||||
|
|
|
| |||||
Profit for the year | $ | 625,164 | $ | 716,024 | ||||
|
|
|
| |||||
Profit attributable to CHI | $ | 214,115 | $ | 259,425 | ||||
Profit attributable to noncontrolling interests | 411,049 | 456,599 | ||||||
|
|
|
| |||||
Profit for the year | $ | 625,164 | $ | 716,024 | ||||
|
|
|
| |||||
Other comprehensive income (loss) attributable to CHI | $ | (1,106 | ) | $ | 218 | |||
Other comprehensive income (loss) attributable to noncontrolling interests | (2,124 | ) | 45 | |||||
|
|
|
| |||||
| $ | (3,230 | ) | $ | 263 | ||||
|
|
|
| |||||
Total comprehensive income attributable to CHI | $ | 213,009 | $ | 259,643 | ||||
Total comprehensive income attributable to noncontrolling interests | 408,925 | 456,644 | ||||||
|
|
|
| |||||
| $ | 621,934 | $ | 716,287 | |||||
|
|
|
| |||||
Net cash flow from operating activities | $ | 507,144 | $ | 861,558 | ||||
Net cash flow from investing activities | (1,425,660 | ) | (733,108 | ) | ||||
Net cash flow from financing activities | (349,452 | ) | (327,890 | ) | ||||
Effect of exchange rate changes on cash and cash equivalents | (4,815 | ) | 1,337 | |||||
|
|
|
| |||||
Net cash outflow | $ | (1,272,783 | ) | $ | (198,103 | ) | ||
|
|
|
| |||||
Dividends paid to noncontrolling interests | $ | 215,591 | $ | 209,711 | ||||
|
|
|
| |||||
- 42 -
| b. | Equity transactions with noncontrolling interests |
CHIEF issued new shares in March and November 2019, March and November 2018 as its employees exercised their options. In addition, Chunghwa and CHI disposed some shares of CHIEF in May 2018 before CHIEF traded its shares on the General Stock Market of the Taipei Exchange according to the local requirements. Furthermore, Chunghwa and CHI did not participate in the capital increase of CHIEF in June 2018; therefore, the Company’s ownership interest in CHIEF decreased. See Note 32(c)(d) for details.
SENAO subscribed for all the shares in the capital increase of Youth in December 2018; therefore, the Company’s ownership interest in Youth increased.
SENAO transferred its treasury stock to employees in June 2018; therefore, the Company’s ownership interest in SENAO decreased. See Note 32(b) for details.
CHI disposed some shares of CHPT from April to August 2018; therefore, the Company’s ownership interest in CHPT decreased.
The above transactions were accounted for as equity transactions since the Company did not cease to have control over these subsidiaries.
- 43 -
Information of the Company’s equity transactions with noncontrolling interests for the years ended December 31, 2019 and 2018 was as follows:
| Year Ended December 31, 2019 | ||||
| CHIEF Share- Based Payment | ||||
Cash consideration received from noncontrolling interests | $ | 18,825 | ||
The proportionate share of the carrying amount of the net assets of the subsidiary transferred to noncontrolling interests | (19,723 | ) | ||
|
| |||
Differences arising from equity transactions | $ | (898 | ) | |
|
| |||
Line items for equity transaction adjustments | ||||
Additionalpaid-in capital - arising from changes in equities of subsidiaries | $ | (898 | ) | |
|
| |||
| Year Ended December 31, 2018 | ||||||||||||||||||||||||
| SENAO Not Proportionately Participating in the Capital Increase of Youth | SENAO Transferred its Treasury Stock | CHI Disposed Some Shares of CHPT | Chunghwa and CHI Did Not Participate in the Capital Increase of CHIEF | Chunghwa and CHI Disposed Some Shares of CHIEF | Share- based Payment of CHIEF | |||||||||||||||||||
Cash consideration received from noncontrolling interests | $ | — | $ | 327,122 | $ | 1,041,689 | $ | 1,476,680 | $ | 132,711 | $ | 35,337 | ||||||||||||
The proportionate share of the carrying amount of the net assets of the subsidiary transferred to noncontrolling interests | (68 | ) | (272,188 | ) | (330,100 | ) | (699,899 | ) | (18,253 | ) | (24,561 | ) | ||||||||||||
|
|
|
|
|
|
|
|
|
|
|
| |||||||||||||
Differences arising from equity transactions | $ | (68 | ) | $ | 54,934 | $ | 711,589 | $ | 776,781 | $ | 114,458 | $ | 10,776 | |||||||||||
|
|
|
|
|
|
|
|
|
|
|
| |||||||||||||
Line items for equity transaction adjustments | ||||||||||||||||||||||||
Additionalpaid-in capital-difference between consideration received or paid and the carrying amount of the subsidiaries’ net assets upon actual disposal or acquisition | $ | — | $ | — | $ | 711,589 | $ | — | $ | 114,458 | $ | — | ||||||||||||
|
|
|
|
|
|
|
|
|
|
|
| |||||||||||||
Additionalpaid-in capital—arising from changes in equities of subsidiaries | $ | (68 | ) | $ | 54,934 | $ | — | $ | 776,781 | $ | — | $ | 10,776 | |||||||||||
|
|
|
|
|
|
|
|
|
|
|
| |||||||||||||
- 44 -
| 14. | INVESTMENTS ACCOUNTED FOR USING EQUITY METHOD |
Investments in associates were as follows:
| Carrying Amount | ||||||||
| December 31 | ||||||||
| 2019 | 2018 | |||||||
Material associate | ||||||||
Next Commercial Bank Co., Ltd. (preparatory office) (“NCB”) | $ | 4,074,168 | $ | — | ||||
|
|
|
| |||||
Associates that are not individually material | ||||||||
Listed | ||||||||
Senao Networks, Inc. (“SNI”) | 953,685 | 919,841 | ||||||
KingwayTek Technology Co., Ltd. (“KWT”) | 253,021 | — | ||||||
Non-listed | ||||||||
ST-2 Satellite Ventures Pte., Ltd. (“STS”) | 500,930 | 496,033 | ||||||
International Integrated System, Inc. (“IISI”) | 340,240 | 310,842 | ||||||
Viettel-CHT Co., Ltd.(“Viettel-CHT”) | 316,535 | 286,510 | ||||||
Taiwan International Standard Electronics Co., Ltd. (“TISE”) | 272,166 | 216,439 | ||||||
Chunghwa PChome Fund I Co., Ltd. (“CPFI”) | 194,081 | 198,974 | ||||||
So-net Entertainment Taiwan Limited(“So-net”) | 189,396 | 119,956 | ||||||
KKBOX Taiwan Co., Ltd. (“KKBOXTW”, previously known as Skysoft Co., Ltd.) | 150,789 | 147,360 | ||||||
Taiwan International Ports Logistics Corporation (“TIPL”) | 50,979 | 49,650 | ||||||
Click Force Co., Ltd. (“CF”) | 37,120 | 37,876 | ||||||
UUPON Inc. (“UUPON”, previously known as Dian Zuan Integrating Marketing Co., Ltd.) | 10,529 | 16,647 | ||||||
Cornerstone Ventures Co., Ltd. (“CVC”) | 5,507 | 4,757 | ||||||
Alliance Digital Tech Co., Ltd. (“ADT”) | 5,080 | 5,080 | ||||||
KingwayTek Technology Co., Ltd. (“KWT”) | — | 134,925 | ||||||
MeWorks Limited (HK) (“MeWorks”) | — | — | ||||||
|
|
|
| |||||
| 3,280,058 | 2,944,890 | |||||||
|
|
|
| |||||
| $ | 7,354,226 | $ | 2,944,890 | |||||
|
|
|
| |||||
- 45 -
The percentages of ownership and voting rights in associates held by the Company as of balance sheet dates were as follows:
| % of Ownership and Voting Rights | ||||||||
| December 31 | ||||||||
| 2019 | 2018 | |||||||
Material associate | ||||||||
Next Commercial Bank Co., Ltd. (preparatory office) (“NCB”) | 42 | — | ||||||
Associates that are not individually material | ||||||||
Senao Networks, Inc. (“SNI”) | 34 | 34 | ||||||
KingwayTek Technology Co., Ltd. (“KWT”) | 23 | 26 | ||||||
ST-2 Satellite Ventures Pte., Ltd. (“STS”) | 38 | 38 | ||||||
International Integrated System, Inc. (“IISI”) | 31 | 32 | ||||||
Viettel-CHT Co., Ltd. (“Viettel-CHT”) | 30 | 30 | ||||||
Taiwan International Standard Electronics Co., Ltd. (“TISE”) | 40 | 40 | ||||||
Chunghwa PChome Fund I Co., Ltd. (“CPFI”) | 50 | 50 | ||||||
So-net Entertainment Taiwan Limited(“So-net”) | 30 | 30 | ||||||
KKBOX Taiwan Co., Ltd. (“KKBOXTW”) | 30 | 30 | ||||||
Taiwan International Ports Logistics Corporation (“TIPL”) | 27 | 27 | ||||||
Click Force Co., Ltd. (“CF”) | 49 | 49 | ||||||
UUpon Inc. (“UUPON”) | 22 | 22 | ||||||
Cornerstone Ventures Co., Ltd. (“CVC”) | 49 | 49 | ||||||
Alliance Digital Tech Co., Ltd. (“ADT”) | 14 | 14 | ||||||
MeWorks Limited (HK) (“MeWorks”) | 20 | 20 | ||||||
Summarized financial information of NCB (preparatory office) is set out below:
| December 31, 2019 | ||||
Current assets | $ | 10,000,028 | ||
Noncurrent assets | 451,897 | |||
Current liabilities | (291,399 | ) | ||
Noncurrent liabilities | (436,975 | ) | ||
|
| |||
Equity | $ | 9,723,551 | ||
|
| |||
The percentage of ownership held by the company | 41.9 | % | ||
Equity attributable to the Company and carrying amount of investment | $ | 4,074,168 | ||
|
| |||
| Period from the Beginning of Preparation to December 31, 2019 | ||||
Revenues | $ | — | ||
|
| |||
Net loss for the period | $ | (276,449 | ) | |
Other comprehensive income | — | |||
|
| |||
Total comprehensive loss for the year | $ | (276,449 | ) | |
|
| |||
- 46 -
Except for NCB (preparatory office), no associate is considered individually material to the Company. Summarized financial information of associates that are not individually material to the Company was as follows:
| Year Ended December 31 | ||||||||
| 2019 | 2018 | |||||||
The Company’s share of profits | $ | 577,972 | $ | 501,600 | ||||
The Company’s share of other comprehensive income (loss) | (3,035 | ) | 5,025 | |||||
|
|
|
| |||||
The Company’s share of total comprehensive income | $ | 574,937 | $ | 506,625 | ||||
|
|
|
| |||||
The Level 1 fair values based on the closing market prices of SNI and KWT as of the balance sheet dates were as follows:
| December 31 | ||||||||
| 2019 | 2018 | |||||||
SNI | $ | 2,014,353 | $ | 1,447,350 | ||||
|
|
|
| |||||
KWT | $ | 872,729 | $ | — | ||||
|
|
|
| |||||
The participation of establishing NCB was approved by Chunghwa’s Board of Directors in January 2019. The establishment of NCB was approved by the FSC in July 2019 and the incorporation of NCB was approved by the Ministry of Economic Affairs Department of Commerce in January 2020. Chunghwa prepaid investment funds to NCB in February and November 2019 amounted to $4,190,000 thousand, for ownership interest of 41.9%. Chunghwa obtained 6 out of 15 seats of the Board of Directors of NCB; therefore, Chunghwa does not have control over NCB and merely has significant influence over NCB and treats it as an associate. NCB mainly engages in online banking business, which located in Taiwan.
IISI issued new shares in March and September 2019 as its employees exercised their options; therefore, the Company’s ownership interest in IISI decreased to 31% as of December 31, 2019. The investment of 20.58% of ownership interest in IISI was approved by Chunghwa’s Board of Directors in January 2020. Upon the completion of the transaction, the Company’s ownership interest in IISI is expected to increase from 31% to 52%. Therefore, Chunghwa will gain control over IISI and treat it as a subsidiary.
The Company disposed some shares of KWT in April 2019 before KWT traded its shares on the General Stock Market of the Taipei Exchange according to the local requirements and recognized disposal gain of $30,152 thousand. In addition, the Company did not participate in the capital increase of KWT in May 2019 and KWT repurchased its stock in December 2019. Therefore, the Company’s ownership interest in KWT decreased to 23% as of December 31, 2019.
The Company invested 50% equity shares of CPFI in October 2018. The Company has only two out of five seats of the Board of Directors of CPFI, and has no control but significant influence over CPFI. Therefore, the Company recognized CPFI as investment in associate. CPFI engages mainly in investment business.
The Company invested 49% equity shares of CVC in October 2018. The Company has only two out of five seats of the Board of Directors of CVC, and has no control but significant influence over CVC. Therefore, the Company recognized CVC as investment in associate. CVC engages mainly in investment business.
HopeTech returned the proceeds of $19,184 thousand as a result of capital reduction in January 2018. The Company received $3,379 thousand by disposing all shares of HopeTech in June 2018 and recognized disposal loss of $125 thousand. HopeTech engages mainly in sale of information and communication technologies products.
- 47 -
The Company owns 14% equity shares of ADT. As the Company remains the seat in the Board of Directors of ADT and considers the relative size of ownership interest and the dispersion of shares owned by the other stockholders, the Company remains significant influence over ADT. In June 2018, the stockholders of ADT approved to dissolve. The liquidation of ADT is still in process.
The Company’s share of profits and other comprehensive income (loss) of associates was recognized based on the audited financial statements.
| 15. | PROPERTY, PLANT AND EQUIPMENT |
| December 31, 2019 | ||||
Assets used by the Company | $ | 276,370,003 | ||
Assets subject to operating leases | 7,324,212 | |||
|
| |||
| $ | 283,694,215 | |||
|
| |||
| a. | Assets used by the Company - 2019 |
| Land | Land Improvements | Buildings | Computer Equipment | Telecommuni- cations Equipment | Transportation Equipment | Miscellaneous Equipment | Construction in Progress and Equipment to be Accepted | Total | ||||||||||||||||||||||||||||
Cost | ||||||||||||||||||||||||||||||||||||
Balance on January 1, 2019 | $ | 103,972,052 | $ | 1,600,323 | $ | 72,911,010 | $ | 14,258,485 | $ | 715,748,118 | $ | 3,882,534 | $ | 9,873,589 | $ | 18,644,766 | $ | 940,890,877 | ||||||||||||||||||
Effect of retrospective application of IFRS 16 | (3,617,627 | ) | (689 | ) | (3,582,774 | ) | — | (3,884,421 | ) | — | — | — | (11,085,511 | ) | ||||||||||||||||||||||
|
|
|
|
|
|
|
|
|
|
|
|
|
|
|
|
|
| |||||||||||||||||||
Balance on January 1, 2019 as adjusted | 100,354,425 | 1,599,634 | 69,328,236 | 14,258,485 | 711,863,697 | 3,882,534 | 9,873,589 | 18,644,766 | 929,805,366 | |||||||||||||||||||||||||||
Additions | — | — | 1,220,691 | 56,699 | 120,559 | 1,122 | 148,949 | 21,611,786 | 23,159,806 | |||||||||||||||||||||||||||
Disposal | (37,951 | ) | (6,630 | ) | (3,101 | ) | (1,915,939 | ) | (30,417,855 | ) | (50,653 | ) | (404,834 | ) | — | (32,836,963 | ) | |||||||||||||||||||
Effect of foreign exchange differences | — | — | — | (74 | ) | (36,727 | ) | (18 | ) | (1,272 | ) | (5,816 | ) | (43,907 | ) | |||||||||||||||||||||
Others | (1,214,223 | ) | 25,477 | 454,957 | 605,656 | 24,502,774 | 79,313 | 473,738 | (26,498,539 | ) | (1,570,847 | ) | ||||||||||||||||||||||||
|
|
|
|
|
|
|
|
|
|
|
|
|
|
|
|
|
| |||||||||||||||||||
Balance on December 31, 2019 | $ | 99,102,251 | $ | 1,618,481 | $ | 71,000,783 | $ | 13,004,827 | $ | 706,032,448 | $ | 3,912,298 | $ | 10,090,170 | $ | 13,752,197 | $ | 918,513,455 | ||||||||||||||||||
|
|
|
|
|
|
|
|
|
|
|
|
|
|
|
|
|
| |||||||||||||||||||
Accumulated depreciation and impairment | ||||||||||||||||||||||||||||||||||||
Balance on January 1, 2019 | $ | — | $ | (1,337,704 | ) | $ | (28,126,983 | ) | $ | (12,143,307 | ) | $ | (599,425,774 | ) | $ | (3,651,139 | ) | $ | (7,291,742 | ) | $ | — | $ | (651,976,649 | ) | |||||||||||
Effect of retrospective application of IFRS 16 | — | 512 | 1,265,356 | — | 2,575,431 | — | — | — | 3,841,299 | |||||||||||||||||||||||||||
|
|
|
|
|
|
|
|
|
|
|
|
|
|
|
|
|
| |||||||||||||||||||
Balance on January 1, 2019 as adjusted | — | (1,337,192 | ) | (26,861,627 | ) | (12,143,307 | ) | (596,850,343 | ) | (3,651,139 | ) | (7,291,742 | ) | — | (648,135,350 | ) | ||||||||||||||||||||
Depreciation expenses | — | (43,481 | ) | (1,301,085 | ) | (826,745 | ) | (23,905,621 | ) | (90,939 | ) | (688,274 | ) | — | (26,856,145 | ) | ||||||||||||||||||||
Disposal | — | 6,630 | 3,101 | 1,908,324 | 30,380,684 | 50,627 | 401,655 | — | 32,751,021 | |||||||||||||||||||||||||||
Impairment losses | — | — | — | — | — | — | (63,715 | ) | (29,358 | ) | (93,073 | ) | ||||||||||||||||||||||||
Effect of foreign exchange differences | — | — | — | 73 | 15,682 | 28 | 962 | — | 16,745 | |||||||||||||||||||||||||||
Others | — | (559 | ) | 182,879 | (6,590 | ) | 21,707 | (2,902 | ) | (21,185 | ) | — | 173,350 | |||||||||||||||||||||||
|
|
|
|
|
|
|
|
|
|
|
|
|
|
|
|
|
| |||||||||||||||||||
Balance on December 31, 2019 | $ | — | $ | (1,374,602 | ) | $ | (27,976,732 | ) | $ | (11,068,245 | ) | $ | (590,337,891 | ) | $ | (3,694,325 | ) | $ | (7,662,299 | ) | $ | (29,358 | ) | $ | (642,143,452 | ) | ||||||||||
|
|
|
|
|
|
|
|
|
|
|
|
|
|
|
|
|
| |||||||||||||||||||
Balance on January 1, 2019, net | $ | 103,972,052 | $ | 262,619 | $ | 44,784,027 | $ | 2,115,178 | $ | 116,322,344 | $ | 231,395 | $ | 2,581,847 | $ | 18,644,766 | $ | 288,914,228 | ||||||||||||||||||
|
|
|
|
|
|
|
|
|
|
|
|
|
|
|
|
|
| |||||||||||||||||||
Balance on January 1, 2019 as adjusted | $ | 100,354,425 | $ | 262,442 | $ | 42,466,609 | $ | 2,115,178 | $ | 115,013,354 | $ | 231,395 | $ | 2,581,847 | $ | 18,644,766 | $ | 281,670,016 | ||||||||||||||||||
|
|
|
|
|
|
|
|
|
|
|
|
|
|
|
|
|
| |||||||||||||||||||
Balance on December 31, 2019, net | $ | 99,102,251 | $ | 243,879 | $ | 43,024,051 | $ | 1,936,582 | $ | 115,694,557 | $ | 217,973 | $ | 2,427,871 | $ | 13,722,839 | $ | 276,370,003 | ||||||||||||||||||
|
|
|
|
|
|
|
|
|
|
|
|
|
|
|
|
|
| |||||||||||||||||||
CHPT evaluated that certain miscellaneous equipment, construction in progress and equipment to be accepted used for manufacturing specific PCB will not be used in the future and there was no active market for sale; therefore, CHPT determined that the recoverable amount of such assets was nil and recognized impairment losses of $89,207 thousand for the year ended December 31, 2019. CHSI evaluated that certain miscellaneous equipment will not be used in the future and there was no active market for sale; therefore, CHSI determined that the recoverable amount of such assets was nil and recognized impairment losses of $3,866 thousand for the year ended December 31, 2019. The aforementioned impairment losses were included in other income and expenses of statement of comprehensive income.
- 48 -
Depreciation expense for assets used by the Company is computed using the straight-line method over the following estimated service lives:
| Land improvements | 10-30 years | |||
| Buildings | ||||
Main buildings | 20-60 years | |||
Other building facilities | 3-15 years | |||
| Computer equipment | 2-8 years | |||
| Telecommunications equipment | ||||
Telecommunication circuits | 2-30 years | |||
Telecommunication machinery and antennas equipment | 2-30 years | |||
| Transportation equipment | 3-10 years | |||
| Miscellaneous equipment | ||||
Leasehold improvements | 1-9 years | |||
Mechanical and air conditioner equipment | 3-16 years | |||
Others | 1-15 years |
| b. | Assets subject to operating leases - 2019 |
| Land | Land Improvements | Buildings | Total | |||||||||||||
Cost | ||||||||||||||||
Balance on January 1, 2019 | $ | — | $ | — | $ | — | $ | — | ||||||||
Effect of retrospective application of IFRS 16 | 3,617,627 | 689 | 3,582,774 | 7,201,090 | ||||||||||||
|
|
|
|
|
|
|
| |||||||||
Balance on January 1, 2019 as adjusted | 3,617,627 | 689 | 3,582,774 | 7,201,090 | ||||||||||||
Additions | — | — | 4,478 | 4,478 | ||||||||||||
Transferred from (to) assets used by the Company | 1,362,023 | (689 | ) | 254,308 | 1,615,642 | |||||||||||
|
|
|
|
|
|
|
| |||||||||
Balance on December 31, 2019 | $ | 4,979,650 | $ | — | $ | 3,841,560 | $ | 8,821,210 | ||||||||
|
|
|
|
|
|
|
| |||||||||
Accumulated depreciation and impairment | ||||||||||||||||
Balance on January 1, 2019 | $ | — | $ | — | $ | — | $ | — | ||||||||
Effect of retrospective application of IFRS 16 | — | (512 | ) | (1,265,356 | ) | (1,265,868 | ) | |||||||||
|
|
|
|
|
|
|
| |||||||||
Balance on January 1, 2019 as adjusted | — | (512 | ) | (1,265,356 | ) | (1,265,868 | ) | |||||||||
Depreciation expenses | — | (47 | ) | (73,996 | ) | (74,043 | ) | |||||||||
Transferred to (from) assets used by the company | — | 559 | (157,646 | ) | (157,087 | ) | ||||||||||
|
|
|
|
|
|
|
| |||||||||
Balance on December 31, 2019 | $ | — | $ | — | $ | (1,496,998 | ) | $ | (1,496,998 | ) | ||||||
|
|
|
|
|
|
|
| |||||||||
Balance on January 1, 2019 as adjusted, net | $ | 3,617,627 | $ | 177 | $ | 2,317,418 | $ | 5,935,222 | ||||||||
|
|
|
|
|
|
|
| |||||||||
Balance on December 31, 2019, net | $ | 4,979,650 | $ | — | $ | 2,344,562 | $ | 7,324,212 | ||||||||
|
|
|
|
|
|
|
| |||||||||
- 49 -
The Company leases out land and buildings with lease terms between 1 to 20 years. The lessees do not have bargain purchase options to acquire the assets at the expiry of the lease periods.
The future aggregate lease collection under operating lease for the freehold plant, property and equipment is as follows:
| December 31, 2019 | ||||
Year 1 | $ | 301,674 | ||
Year 2 | 272,899 | |||
Year 3 | 233,434 | |||
Year 4 | 191,128 | |||
Year 5 | 130,066 | |||
Onwards | 1,224,416 | |||
|
| |||
| $ | 2,353,617 | |||
|
| |||
The above items of property, plant and equipment subject to operating leases are depreciated on a straight-line basis over their estimated useful lives as follows:
| Land improvements | 10 years | |||
| Buildings | ||||
Main buildings | 35-60 years | |||
Other building facilities | 3-15 years |
| c. | Property, plant and equipment - 2018 |
| Land | Land Improvements | Buildings | Computer Equipment | Telecommuni- cations Equipment | Transportation Equipment | Miscellaneous Equipment | Construction in Progress and Equipment to be Accepted | Total | ||||||||||||||||||||||||||||
Cost | ||||||||||||||||||||||||||||||||||||
Balance on January 1, 2018 | $ | 104,079,190 | $ | 1,594,899 | $ | 72,694,050 | $ | 14,161,797 | $ | 722,054,435 | $ | 3,834,372 | $ | 9,514,875 | $ | 18,526,814 | $ | 946,460,432 | ||||||||||||||||||
Additions | — | — | 20,723 | 52,269 | 158,930 | 270 | 334,443 | 27,412,805 | 27,979,440 | |||||||||||||||||||||||||||
Disposal | (71,333 | ) | (337 | ) | (23 | ) | (643,192 | ) | (31,983,801 | ) | (29,250 | ) | (622,940 | ) | — | (33,350,876 | ) | |||||||||||||||||||
Effect of foreign exchange differences | — | — | — | (119 | ) | 60,483 | 69 | (343 | ) | 117 | 60,207 | |||||||||||||||||||||||||
Others | (35,805 | ) | 5,761 | 196,260 | 687,730 | 25,458,071 | 77,073 | 647,554 | (27,294,970 | ) | (258,326 | ) | ||||||||||||||||||||||||
|
|
|
|
|
|
|
|
|
|
|
|
|
|
|
|
|
| |||||||||||||||||||
Balance on December 31, 2018 | $ | 103,972,052 | $ | 1,600,323 | $ | 72,911,010 | $ | 14,258,485 | $ | 715,748,118 | $ | 3,882,534 | $ | 9,873,589 | $ | 18,644,766 | $ | 940,890,877 | ||||||||||||||||||
|
|
|
|
|
|
|
|
|
|
|
|
|
|
|
|
|
| |||||||||||||||||||
Accumulated depreciation and impairment | ||||||||||||||||||||||||||||||||||||
Balance on January 1, 2018 | $ | — | $ | (1,292,527 | ) | $ | (26,798,694 | ) | $ | (11,787,847 | ) | $ | (607,154,914 | ) | $ | (3,513,529 | ) | $ | (7,205,011 | ) | $ | — | $ | (657,752,522 | ) | |||||||||||
Depreciation expenses | — | (45,731 | ) | (1,356,765 | ) | (982,728 | ) | (24,235,603 | ) | (161,660 | ) | (678,692 | ) | — | (27,461,179 | ) | ||||||||||||||||||||
Disposal | — | 337 | 23 | 632,457 | 31,951,706 | 29,186 | 614,789 | — | 33,228,498 | |||||||||||||||||||||||||||
Effect of foreign exchange differences | — | — | — | 57 | (20,354 | ) | (40 | ) | 191 | — | (20,146 | ) | ||||||||||||||||||||||||
Others | — | 217 | 28,453 | (5,246 | ) | 33,391 | (5,096 | ) | (23,019 | ) | — | 28,700 | ||||||||||||||||||||||||
|
|
|
|
|
|
|
|
|
|
|
|
|
|
|
|
|
| |||||||||||||||||||
Balance on December 31, 2018 | $ | — | $ | (1,337,704 | ) | $ | (28,126,983 | ) | $ | (12,143,307 | ) | $ | (599,425,774 | ) | $ | (3,651,139 | ) | $ | (7,291,742 | ) | $ | — | $ | (651,976,649 | ) | |||||||||||
|
|
|
|
|
|
|
|
|
|
|
|
|
|
|
|
|
| |||||||||||||||||||
Balance on January 1, 2018, net | $ | 104,079,190 | $ | 302,372 | $ | 45,895,356 | $ | 2,373,950 | $ | 114,899,521 | $ | 320,843 | $ | 2,309,864 | $ | 18,526,814 | $ | 288,707,910 | ||||||||||||||||||
|
|
|
|
|
|
|
|
|
|
|
|
|
|
|
|
|
| |||||||||||||||||||
Balance on December 31, 2018, net | $ | 103,972,052 | $ | 262,619 | $ | 44,784,027 | $ | 2,115,178 | $ | 116,322,344 | $ | 231,395 | $ | 2,581,847 | $ | 18,644,766 | $ | 288,914,228 | ||||||||||||||||||
|
|
|
|
|
|
|
|
|
|
|
|
|
|
|
|
|
| |||||||||||||||||||
There was no indication that property, plant and equipment was impaired so the Company did not recognize any impairment loss for the year ended December 31, 2018.
- 50 -
Depreciation expense is computed using the straight-line method over the following estimated service lives:
| Land improvements | 8-30 years | |||
| Buildings | ||||
Main buildings | 35-60 years | |||
Other building facilities | 3-20 years | |||
| Computer equipment | 2-8 years | |||
| Telecommunications equipment | ||||
Telecommunication circuits | 2-30 years | |||
Telecommunication machinery and antennas equipment | 2-30 years | |||
| Transportation equipment | 3-10 years | |||
| Miscellaneous equipment | ||||
Leasehold improvements | 1-6 years | |||
Mechanical and air conditioner equipment | 3-16 years | |||
Others | 1-10 years |
| 16. | LEASE ARRANGEMENTS |
| a. | Right-of-use Assets - 2019 |
| December 31, 2019 | ||||
Land and buildings | ||||
Handsets base stations | $ | 6,844,687 | ||
Others | 1,916,835 | |||
Equipment | 2,602,727 | |||
|
| |||
| $ | 11,364,249 | |||
|
| |||
| Year Ended December 31, 2019 | ||||
Additions toright-of-use assets | $ | 3,803,042 | ||
|
| |||
Depreciation charge forright-of-use assets | ||||
Land and buildings | ||||
Handsets base stations | $ | 2,727,871 | ||
Others | 821,272 | |||
Equipment | 418,503 | |||
|
| |||
| $ | 3,967,646 | |||
|
| |||
| b. | Lease liabilities - 2019 |
| December 31, 2019 | ||||
Lease liabilities | ||||
Current | $ | 3,291,330 | ||
Non-current | 6,466,808 | |||
|
| |||
| $ | 9,758,138 | |||
|
| |||
- 51 -
Range of discount rate for lease liabilities is as follows:
| December 31, 2019 | ||||
Land and buildings | ||||
Handsets base stations | 0.58%-1.18% | |||
Others | 0.58%-9.00% | |||
Equipment | 0.58%-4.50% | |||
| c. | Importantlease-in activities and terms - 2019 |
The Company mainly enters intolease-in agreements of land and buildings for handsets base stations located all over Taiwan with lease terms from 1 to 20 years. There’s no clause for bargain purchase options to acquire the assets at the expiry of the lease periods in the agreement. In most lease-in agreements of handsets base station agreements, the Company is able to terminate the agreement prior to the maturity date provided that the premise the Company fails to meet the purpose to build telecommunication equipment due to legal restriction, controversial events, or other events.
The Company also leases land and buildings for the use of offices, server rooms, and stores with lease terms from 1 to 30 years. Most of the lease agreements for national land adjust the lease payment according to the changes of present values of land announced by the authority. At the expiry of the lease term, the Company does not have bargain purchase options to acquire the assets.
The lease agreements for equipment include a contract between Chunghwa andST-2 Satellite Ventures Pte., Ltd. to lease capacity on theST-2 satellite. The information of lease agreements with related parties, please refer to Note 36 to the consolidated financial statements for details.
| d. | Other lease information |
2019
| Year Ended December 31, 2019 | ||||
Expenses relating tolow-value asset leases | $ | 6,664 | ||
|
| |||
Expenses relating to variable lease payments not included in the measurement of lease liabilities | $ | 6,603 | ||
|
| |||
Total cash outflow for leases | $ | 3,825,977 | ||
|
| |||
The Company leases certain equipment which qualify aslow-value asset leases. The Company has elected to apply the recognition exemption and, thus, not to recognizeright-of-use assets and lease liabilities for these leases.
Lease-out arrangements under operating leases for freehold property, plant, and equipment and investment properties are set out in Notes 15 and 17 to the consolidated financial statements.
- 52 -
2018
The future aggregate minimum lease payments undernon-cancellable operating leases are as follows:
| December 31, 2018 | ||||
Within one year | $ | 3,439,259 | ||
Longer than one year but within five years | 6,375,101 | |||
Longer than five years | 743,494 | |||
|
| |||
| $ | 10,557,854 | |||
|
| |||
| 17. | INVESTMENT PROPERTIES |
Cost | ||||
Balance on January 1, 2018 | $ | 9,134,817 | ||
Additions | 5,627 | |||
Reclassification | 252,008 | |||
|
| |||
Balance on December 31, 2018 | $ | 9,392,452 | ||
|
| |||
Accumulated depreciation and impairment | ||||
Balance on January 1, 2018 | $ | (1,087,024 | ) | |
Depreciation expense | (20,777 | ) | ||
Reclassification | (16,572 | ) | ||
Reversal of impairment loss | 19,133 | |||
|
| |||
Balance on December 31, 2018 | $ | (1,105,240 | ) | |
|
| |||
Balance on January 1, 2018, net | $ | 8,047,793 | ||
|
| |||
Balance on December 31, 2018, net | $ | 8,287,212 | ||
|
| |||
Cost | ||||
Balance on January 1, 2019 | $ | 9,392,452 | ||
Additions | 523 | |||
Disposal | (5,831 | ) | ||
Reclassification | (173,165 | ) | ||
|
| |||
Balance on December 31, 2019 | $ | 9,213,979 | ||
|
| |||
Accumulated depreciation and impairment | ||||
Balance on January 1, 2019 | $ | (1,105,240 | ) | |
Depreciation expense | (25,157 | ) | ||
Disposal | 5,831 | |||
Reclassification | 23,363 | |||
Reversal of impairment loss | 56,617 | |||
|
| |||
Balance on December 31, 2019 | $ | (1,044,586 | ) | |
|
| |||
Balance on January 1, 2019, net | $ | 8,287,212 | ||
|
| |||
Balance on December 31, 2019, net | $ | 8,169,393 | ||
|
|
- 53 -
After the evaluation of land and buildings, the Company concluded the recoverable amount which represented the fair value less costs to sell of some land and buildings was higher than the carrying amount. Therefore, the Company recognized reversal of impairment losses of $56,617 thousand and $19,133 thousand for the years ended December 31, 2019 and 2018, respectively, and the amounts were recognized only to the extent of impairment losses that had been recognized in prior years. The reversal of impairment loss was included in other income and expenses in the statements of comprehensive income.
Depreciation expense is computed using the straight-line method over the following estimated service lives:
| Land improvements | 10-30 years | |||
| Buildings | ||||
Main buildings | 35-60 years | |||
Other building facilities | 4-10 years |
The fair values of the Company’s investment properties as of December 31, 2019 and 2018 were determined by Level 3 fair value measurements inputs based on the appraisal reports conducted by independent appraisers. Those appraisal reports are based on the comparison approach, income approach or cost approach. Key assumptions and the fair values were as follows:
| December 31 | ||||
| 2019 | 2018 | |||
Fair value | $18,701,398 | $18,514,801 | ||
Overall capital interest rate | 1.03%-4.04% | 1.02%-4.04% | ||
Profit margin ratio | 12%-20% | 12%-20% | ||
Discount rate | — | — | ||
Capitalization rate | 0.79%-1.74% | 0.79%-1.75% | ||
All of the Company’s investment properties are held under freehold interest.
2019
The future aggregate lease collection under operating lease for investment properties is as follows:
| December 31, 2019 | ||||
Year 1 | $ | 112,626 | ||
Year 2 | 90,701 | |||
Year 3 | 70,795 | |||
Year 4 | 61,115 | |||
Year 5 | 39,386 | |||
Onwards | 96,010 | |||
|
| |||
| $ | 470,633 | |||
|
| |||
- 54 -
2018
The future aggregate minimum lease collection undernon-cancellable operating leases is as follows:
| December 31, 2018 | ||||
Within one year | $ | 343,981 | ||
Longer than one year but within five years | 580,451 | |||
Longer than five years | 205,747 | |||
|
| |||
| $ | 1,130,179 | |||
|
| |||
| 18. | INTANGIBLE ASSETS |
| 3G and 4G Concession | Computer Software | Goodwill | Others | Total | ||||||||||||||||
Cost | ||||||||||||||||||||
Balance on January 1, 2018 | $ | 70,144,000 | $ | 3,311,610 | $ | 236,200 | $ | 418,150 | $ | 74,109,960 | ||||||||||
Additions-acquired separately | — | 484,864 | — | 13,141 | 498,005 | |||||||||||||||
Disposal | — | (370,657 | ) | — | (58,008 | ) | (428,665 | ) | ||||||||||||
Effect of foreign exchange difference | — | 152 | — | (80 | ) | 72 | ||||||||||||||
|
|
|
|
|
|
|
|
|
| |||||||||||
Balance on December 31, 2018 | $ | 70,144,000 | $ | 3,425,969 | $ | 236,200 | $ | 373,203 | $ | 74,179,372 | ||||||||||
|
|
|
|
|
|
|
|
|
| |||||||||||
Accumulated amortization and impairment | ||||||||||||||||||||
Balance on January 1, 2018 | $ | (16,674,565 | ) | $ | (2,431,797 | ) | $ | (26,677 | ) | $ | (93,653 | ) | $ | (19,226,692 | ) | |||||
Amortization expenses | (3,957,909 | ) | (405,898 | ) | — | (22,991 | ) | (4,386,798 | ) | |||||||||||
Disposal | — | 370,657 | — | 58,008 | 428,665 | |||||||||||||||
Impairment losses | — | — | — | (50,750 | ) | (50,750 | ) | |||||||||||||
Effect of foreign exchange difference | — | (132 | ) | — | 17 | (115 | ) | |||||||||||||
|
|
|
|
|
|
|
|
|
| |||||||||||
Balance on December 31, 2018 | $ | (20,632,474 | ) | $ | (2,467,170 | ) | $ | (26,677 | ) | $ | (109,369 | ) | $ | (23,235,690 | ) | |||||
|
|
|
|
|
|
|
|
|
| |||||||||||
Balance on January 1, 2018, net | $ | 53,469,435 | $ | 879,813 | $ | 209,523 | $ | 324,497 | $ | 54,883,268 | ||||||||||
|
|
|
|
|
|
|
|
|
| |||||||||||
Balance on December 31, 2018, net | $ | 49,511,526 | $ | 958,799 | $ | 209,523 | $ | 263,834 | $ | 50,943,682 | ||||||||||
|
|
|
|
|
|
|
|
|
| |||||||||||
Cost | ||||||||||||||||||||
Balance on January 1, 2019 | $ | 70,144,000 | $ | 3,425,969 | $ | 236,200 | $ | 373,203 | $ | 74,179,372 | ||||||||||
Additions-acquired separately | — | 357,605 | — | 5,113 | 362,718 | |||||||||||||||
Disposal | (10,179,000 | ) | (356,750 | ) | — | (157 | ) | (10,535,907 | ) | |||||||||||
Effect of foreign exchange difference | — | (117 | ) | — | (96 | ) | (213 | ) | ||||||||||||
Others | — | 1,902 | — | — | 1,902 | |||||||||||||||
|
|
|
|
|
|
|
|
|
| |||||||||||
Balance on December 31, 2019 | $ | 59,965,000 | $ | 3,428,609 | $ | 236,200 | $ | 378,063 | $ | 64,007,872 | ||||||||||
|
|
|
|
|
|
|
|
|
| |||||||||||
Accumulated amortization and impairment | ||||||||||||||||||||
Balance on January 1, 2019 | $ | (20,632,474 | ) | $ | (2,467,170 | ) | $ | (26,677 | ) | $ | (109,369 | ) | $ | (23,235,690 | ) | |||||
Amortization expenses | (3,839,572 | ) | (388,501 | ) | — | (24,529 | ) | (4,252,602 | ) | |||||||||||
Disposal | 10,179,000 | 356,750 | — | 11 | 10,535,761 | |||||||||||||||
Impairment losses | $ | — | $ | — | $ | (8,946 | ) | $ | — | $ | (8,946 | ) | ||||||||
Effect of foreign exchange difference | — | 96 | — | 34 | 130 | |||||||||||||||
|
|
|
|
|
|
|
|
|
| |||||||||||
Balance on December 31, 2019 | $ | (14,293,046 | ) | $ | (2,498,825 | ) | $ | (35,623 | ) | $ | (133,853 | ) | $ | (16,961,347 | ) | |||||
|
|
|
|
|
|
|
|
|
| |||||||||||
Balance on January 1, 2019, net | $ | 49,511,526 | $ | 958,799 | $ | 209,523 | $ | 263,834 | $ | 50,943,682 | ||||||||||
|
|
|
|
|
|
|
|
|
| |||||||||||
Balance on December 31, 2019, net | $ | 45,671,954 | $ | 929,784 | $ | 200,577 | $ | 244,210 | $ | 47,046,525 | ||||||||||
|
|
|
|
|
|
|
|
|
| |||||||||||
- 55 -
The concessions are granted and issued by the NCC. The concession fees are amortized using the straight-line method from the date operations commence through the date the license expires. The carrying amount of 3G concession fee was fully amortized in December 2018, and 4G concession fees will be fully amortized by December 2030 and December 2033.
The computer software is amortized using the straight-line method over the estimated useful lives of 1 to 10 years. Other intangible assets are amortized using the straight-line method over the estimated useful lives of 1 to 20 years. Goodwill is not amortized.
SENAO evaluated and determined that the recoverable amount of certain licensed contract was nil and recognized the impairment loss of $50,750 thousand for the year ended December 31, 2018. The recoverable amount was based on the value in use.
SENAO evaluated the goodwill that arose in the acquisition of Youth and its subsidiaries at the end of each year. SENAO determined the smallest identifiable group of assets that generates cash inflows as single cash generating units by business type, and evaluated the recoverable amount of those cash generating units by their value in use. The management of SENAO estimated the cash flow projections based on the financial budgets for the following five years. Discount rates were 12.3% and 13.7% as of December 31 2018 and 2019, respectively and were used to calculate the recoverable amount of related cash generating units by discounting aforementioned cash flows.
SENAO concluded the recoverable amount of the goodwill was lower than the carrying value and recognized impairment loss of $8,946 thousand for the year ended December 31, 2019. There was no impairment loss recognized for the year ended December 31, 2018.
The aforementioned impairment losses were included in other income and expenses of statement of comprehensive income.
| 19. | OTHER ASSETS |
| December 31 | ||||||||
| 2019 | 2018 | |||||||
Spare parts | $ | 2,336,082 | $ | 2,422,060 | ||||
Refundable deposits | 1,879,109 | 1,992,206 | ||||||
Other financial assets | 1,000,000 | 1,000,000 | ||||||
Deposit for mobile broadband license bidding | 1,000,000 | — | ||||||
Others | 2,316,177 | 2,342,040 | ||||||
|
|
|
| |||||
| $ | 8,531,368 | $ | 7,756,306 | |||||
|
|
|
| |||||
Current | ||||||||
Spare parts | $ | 2,336,082 | $ | 2,422,060 | ||||
Others | 93,582 | 154,024 | ||||||
|
|
|
| |||||
| $ | 2,429,664 | $ | 2,576,084 | |||||
|
|
|
| |||||
Noncurrent | ||||||||
Refundable deposits | $ | 1,879,109 | $ | 1,992,206 | ||||
Other financial assets | 1,000,000 | 1,000,000 | ||||||
Deposit for mobile broadband license bidding | 1,000,000 | — | ||||||
Others | 2,222,595 | 2,188,016 | ||||||
|
|
|
| |||||
| $ | 6,101,704 | $ | 5,180,222 | |||||
|
|
|
| |||||
- 56 -
For long-term business development, the Chunghwa participated in the first phase of 5G mobile broadband license bidding hosted by NCC and paid the deposit for 5G spectrum bidding amounting to $1,000,000 thousand in October 2019. Chunghwa obtained 90MHz in the 3.5GHz spectrum and 600MHz in the 28GHz spectrum for bid amounting to $46,293,000 thousand in January 2020. In addition, Chunghwa participated in the second phase of the aforementioned license bidding for location in February 2020 for the bid of $2,080,000 thousand. Therefore, the total bid amounted to $48,373,000 thousand.
Other financial assets - noncurrent was Piping Fund. As part of the government’s effort to upgrade the existing telecommunications infrastructure, Chunghwa and other public utility companies were required by the ROC government to contribute to a Piping Fund administered by the Taipei City Government. This fund was used to finance various telecommunications infrastructure projects. Net assets of this fund will be returned proportionately after the project is completed.
Chunghwa evaluated that certain other assets will not be used in the future and there was no active market for sale; therefore, the Company determined that the recoverable amount of such assets was nil and recognized impairment losses of $43,971 thousand for the year ended December 31, 2019. The aforementioned impairment loss was included in other income and expenses in the statements of comprehensive income.
| 20. | HEDGING FINANCIAL INSTRUMENTS |
Chunghwa’s hedge strategy is to enter forward exchange contracts - buy to avoid its foreign currency exposure to certain foreign currency denominated equipment payments in the following six months. In addition, Chunghwa’s management considers the market condition to determine the hedge ratio and enters into forward exchange contracts with the banks to avoid the foreign currency risk.
Chunghwa signed equipment purchase contracts with suppliers and entered into forward exchange contracts to avoid foreign currency risk exposure to Euro-denominated purchase commitments. Those forward exchange contracts were designated as cash flow hedges. When forecast purchases actually take place, basis adjustments are made to the initial carrying amounts of hedged items.
For the hedges of highly probable forecast sales and purchases, as the critical terms (i.e. the notional amount, life and underlying) of the forward foreign exchange contracts and their corresponding hedged items are the same, the Company performs a qualitative assessment of effectiveness and it is expected that the value of the forward contracts and the value of the corresponding hedged items will systematically change in opposite direction in response to movements in the underlying exchange rates.
- 57 -
The main source of hedge ineffectiveness in these hedging relationships is the effect of credit risks of the Company and the counterparty on the fair value of the forward exchange contracts. Such credit risks do not impact the fair value of the hedged item attributable to changes in foreign exchange rates. No other sources of ineffectiveness emerged from these hedging relationships.
The following tables summarized the information relating to the hedges for foreign currency risk.
December 31, 2019
| Notional Amount | Forward | Line Item in | Carrying Amount | Change in Fair Values of Hedging Instruments Used for Calculating Hedge | ||||||||||||||||||||||||||
| Hedging Instruments | Currency | (In Thousands) | Maturity | Rate | Balance Sheet | Asset | Liability | Ineffectiveness | ||||||||||||||||||||||
Cash flow hedge | ||||||||||||||||||||||||||||||
Forecast purchases - forward exchange contracts | EUR/NT$ | NT$ | EUR 2,498/ 84,066 |
| 2020.03 | $ | 33.66 | Hedging financial assets (liabilities) | $ | 327 | $ | — | $ | (742 | ) | |||||||||||||||
| Change in Value of Hedged Item Used for | Accumulated Gain or Loss on Hedging Instruments in Other Equity | |||||||||||
| Hedged Items | Calculating Hedge Ineffectiveness | Continuing Hedges | Hedge Accounting No Longer Applied | |||||||||
Cash flow hedge | ||||||||||||
Forecast equipment purchases | $ | 742 | $ | 327 | $ | — | ||||||
December 31, 2018
| Notional Amount | Forward | Line Item in | Carrying Amount | Change in Fair Values of Hedging Instruments Used for Calculating Hedge | ||||||||||||||||||||||||||
| Hedging Instruments | Currency | (In Thousands) | Maturity | Rate | Balance Sheet | Asset | Liability | Ineffectiveness | ||||||||||||||||||||||
Cash flow hedge | ||||||||||||||||||||||||||||||
Forecast purchases - forward exchange contracts | EUR/NT$ | NT$ | EUR 4,911/ 171,797 |
| 2019.03 | $ | 34.98 | Hedging financial assets (liabilities) | $ | 1,069 | $ | — | $ | 1,919 | ||||||||||||||||
| Change in Value of Hedged Item Used for | Accumulated Gain or Loss on Hedging Instruments in Other Equity | |||||||||||
| Hedged Items | Calculating Hedge Ineffectiveness | Continuing Hedges | Hedge Accounting No Longer Applied | |||||||||
Cash flow hedge | ||||||||||||
Forecast equipment purchases | $ | (1,919 | ) | $ | 1,069 | $ | — | |||||
- 58 -
2019
| Comprehensive Income | ||||||||||||||||||||
| Reclassification from Equity to Profit or Loss and the Adjusted Line Item | ||||||||||||||||||||
| Hedge Transaction | Hedging Gain or Loss Recognized in OCI | Amount of Hedge Ineffectiveness Recognized in Profit or Loss | Line Item in Included | Amount P/L and the | Due to Hedged Expected to | |||||||||||||||
Cash flow hedge | ||||||||||||||||||||
Forecast equipment purchases | $ | (742 | ) | $ | — | — | $ | (2,026 Construction in | ) | $ | — Other gains | | ||||||||
2018
| Comprehensive Income | ||||||||||||||||||||
| Reclassification from Equity to Profit or Loss and the Adjusted Line Item | ||||||||||||||||||||
| Hedge Transaction | Hedging Gain or Loss Recognized in OCI | Amount of Hedge Ineffectiveness Recognized in Profit or Loss | Line Item in Included | Amount P/L and the | Due to Hedged Expected to | |||||||||||||||
Cash flow hedge | ||||||||||||||||||||
Forecast equipment purchases | $ | 1,919 | $ | — | — | $ | (4,030 Construction in | ) | $ | (297 Other gains | ) | |||||||||
| 21. | SHORT-TERM LOANS |
| December 31 | ||||||||
| 2019 | 2018 | |||||||
Unsecured loans | $ | 90,000 | $ | 100,000 | ||||
|
|
|
| |||||
The annual interest rates of loans were as follows:
| December 31 | ||||||||
| 2019 | 2018 | |||||||
Unsecured loans | 1.20%-2.50% | 1.35%-2.35% | ||||||
- 59 -
22. LONG-TERM LOANS (INCLUDING LONG-TERM LOANS - CURRENT PORTION)
| December 31 | ||||||||
| 2019 | 2018 | |||||||
Secured loans (Note 37) | $ | 1,600,000 | $ | 1,600,000 | ||||
|
|
|
| |||||
The annual interest rates of loans were as follows:
| December 31 | ||||||||
| 2019 | 2018 | |||||||
Secured loans | 0.92 | % | 0.92 | % | ||||
LED obtained a secured loan from Chang Hwa Bank in September 2010. Interest is paid monthly. $300,000 thousand and $1,350,000 thousand were originally due in December 2014 and September 2015, respectively. In October 2014, the bank borrowing mentioned above was extended to September 2018 for one time repayment. LED made an early repayment of $50,000 thousand in April 2015. LED entered into a contract with Chang Hwa Bank to renew the contract upon the maturity of the aforementioned contract in December 2017 and the due date of the renew contract is September 2021.
| 23. | TRADE NOTES AND ACCOUNTS PAYABLE |
| December 31 | ||||||||
| 2019 | 2018 | |||||||
Trade notes and accounts payable | $ | 15,312,274 | $ | 20,464,792 | ||||
|
|
|
| |||||
Trade notes and accounts payable were attributable to operating activities and the trading conditions were agreed separately.
| 24. | OTHER PAYABLES |
| December 31 | ||||||||
| 2019 | 2018 | |||||||
Accrued salary and compensation | $ | 9,482,606 | $ | 9,040,692 | ||||
Payables to contractors | 1,892,188 | 1,709,778 | ||||||
Accrued compensation to employees and remuneration to directors and supervisors | 1,440,573 | 1,738,716 | ||||||
Amounts collected for others | 1,278,796 | 1,226,031 | ||||||
Accrued franchise fees | 1,091,148 | 1,151,084 | ||||||
Accrued maintenance costs | 954,761 | 1,049,849 | ||||||
Payables to equipment suppliers | 295,816 | 1,459,246 | ||||||
Others | 6,516,600 | 5,939,987 | ||||||
|
|
|
| |||||
| $ | 22,952,488 | $ | 23,315,383 | |||||
|
|
|
| |||||
- 60 -
| 25. | PROVISIONS |
| December 31 | ||||||||
| 2019 | 2018 | |||||||
Warranties | $ | 173,275 | $ | 131,664 | ||||
Onerous contracts | 66,907 | 19,323 | ||||||
Employee benefits | 59,745 | 51,393 | ||||||
Others | 4,397 | 4,447 | ||||||
|
|
|
| |||||
| $ | 304,324 | $ | 206,827 | |||||
|
|
|
| |||||
Current | $ | 206,942 | $ | 128,200 | ||||
Noncurrent | 97,382 | 78,627 | ||||||
|
|
|
| |||||
| $ | 304,324 | $ | 206,827 | |||||
|
|
|
| |||||
| Warranties | Onerous Contracts | Employee Benefits | Others | Total | ||||||||||||||||
Balance on January 1, 2018 | $ | 131,789 | $ | — | $ | 43,429 | $ | 4,467 | $ | 179,685 | ||||||||||
Additional provisions recognized | 163,901 | 19,323 | 9,180 | 80 | 192,484 | |||||||||||||||
Used / forfeited during the year | (164,026 | ) | — | (1,216 | ) | (100 | ) | (165,342 | ) | |||||||||||
|
|
|
|
|
|
|
|
|
| |||||||||||
Balance on December 31, 2018 | $ | 131,664 | $ | 19,323 | $ | 51,393 | $ | 4,447 | $ | 206,827 | ||||||||||
|
|
|
|
|
|
|
|
|
| |||||||||||
Balance on January 1, 2019 | $ | 131,664 | $ | 19,323 | $ | 51,393 | $ | 4,447 | $ | 206,827 | ||||||||||
Additional provisions recognized | 127,517 | 47,584 | 9,194 | — | 184,295 | |||||||||||||||
Used / forfeited during the year | (85,906 | ) | — | (842 | ) | (50 | ) | (86,798 | ) | |||||||||||
|
|
|
|
|
|
|
|
|
| |||||||||||
Balance on December 31, 2019 | $ | 173,275 | $ | 66,907 | $ | 59,745 | $ | 4,397 | $ | 304,324 | ||||||||||
|
|
|
|
|
|
|
|
|
| |||||||||||
| a. | The provision for warranties claims represents the present value of the management’s best estimate of the future outflow of economic benefits that will be required under the Company’s obligation for warranties in sales agreements. The estimate has been made based on the historical warranty experience. |
| b. | The provision for employee benefits represents vested long-term service compensation accrued. |
| c. | The provision for onerous contracts represents the present obligation resulting from the measurement for the unavoidable costs of meeting the Company’s contractual obligations exceed the economic benefits expected to be received from the contracts. |
| 26. | RETIREMENT BENEFIT PLANS |
| a. | Defined contribution plans |
The pension plan under the Labor Pension Act of ROC (the “LPA”) is considered as a defined contribution plan. Based on the LPA, Chunghwa and its domestic subsidiaries make monthly contributions to employees’ individual pension accounts at 6% of monthly salaries and wages. Its foreign subsidiaries would make monthly contributions based on the local pension requirements.
- 61 -
| b. | Defined benefit plans |
Chunghwa completed its privatization plans on August 12, 2005. Chunghwa is required to pay all accrued pension obligations including service clearance payment, lump sum payment under civil service plan, additional separation payments, etc. upon the completion of the privatization in accordance with the Statute Governing Privatization of Stated-owned Enterprises. After paying all pension obligations for privatization, the plan assets of Chunghwa should be transferred to the Fund for Privatization of Government-owned Enterprises (the “Privatization Fund”) under the Executive Yuan. On August 7, 2006, Chunghwa transferred the remaining balance of fund to the Privatization Fund. However, according to the instructions of MOTC, Chunghwa was requested to administer the distributions to employees for pension obligations including service clearance payment, lump sum payment under civil service plan, additional separation payments, etc. upon the completion of the privatization and recognized in other current monetary assets.
Chunghwa and its subsidiaries SENAO, CHIEF, CHSI, and SHE with the pension mechanism under the Labor Standards Law are considered as defined benefit plans. These pension plans provide benefits based on an employee’s length of service and averagesix-month salary prior to retirement. Chunghwa and its subsidiaries contribute an amount no more than 15% of salaries paid each month to their respective pension funds (the Funds), which are administered by the Labor Pension Fund Supervisory Committee (the Committee) and deposited in the names of the Committees in the Bank of Taiwan. The plan assets are held in a commingled fund which is operated and managed by the government’s designated authorities; as such, the Company does not have any right to intervene in the investments of the funds. According to the Article 56 of the Labor Standards Law in the ROC, entities are required to contribute the difference in one appropriation to the Funds before the end of next March when the balance of the Funds is insufficient to pay employees who will meet the retirement eligibility criteria within next year.
The amounts included in the consolidated balance sheets arising from the Company’s obligation in respect of its defined benefit plans were as follows:
| December 31 | ||||||||
| 2019 | 2018 | |||||||
Present value of funded defined benefit obligation | $ | 41,197,226 | $ | 41,396,992 | ||||
Fair value of plan assets | (39,819,944 | ) | (39,027,144 | ) | ||||
|
|
|
| |||||
Funded status - deficit | $ | 1,377,282 | $ | 2,369,848 | ||||
|
|
|
| |||||
Net defined benefit liabilities | $ | 3,504,617 | $ | 3,533,936 | ||||
Net defined benefit assets | (2,127,335 | ) | (1,164,088 | ) | ||||
|
|
|
| |||||
| $ | 1,377,282 | $ | 2,369,848 | |||||
|
|
|
| |||||
- 62 -
Movements in the defined benefit obligation and the fair value of plan assets were as follows:
| Present Value of Funded Defined Benefit Obligation | Fair Value of Plan Assets | Net Defined Benefit Liabilities (Assets) | ||||||||||
Balance on January 1, 2018 | $ | 37,662,966 | $ | 34,972,376 | $ | 2,690,590 | ||||||
Current service cost | 3,024,370 | — | 3,024,370 | |||||||||
Interest expense/interest income | 549,662 | 544,077 | 5,585 | |||||||||
|
|
|
|
|
| |||||||
Amounts recognized in profit or loss | 3,574,032 | 544,077 | 3,029,955 | |||||||||
|
|
|
|
|
| |||||||
Remeasurement on the net defined benefit liability | ||||||||||||
Return on plan assets (excluding amounts included in net interest) | $ | — | $ | 875,203 | $ | (875,203 | ) | |||||
Actuarial losses recognized from changes in demographic assumptions | 3,446 | — | 3,446 | |||||||||
Actuarial losses recognized from changes in financial assumptions | 1,273,122 | — | 1,273,122 | |||||||||
Actuarial losses recognized from experience adjustments | 813,187 | — | 813,187 | |||||||||
|
|
|
|
|
| |||||||
Amounts recognized in other comprehensive income | 2,089,755 | 875,203 | 1,214,552 | |||||||||
|
|
|
|
|
| |||||||
Contributions from employer | — | 4,373,688 | (4,373,688 | ) | ||||||||
Benefits paid | (1,738,200 | ) | (1,738,200 | ) | — | |||||||
Benefits paid directly by the Company | (191,561 | ) | — | (191,561 | ) | |||||||
|
|
|
|
|
| |||||||
Balance on December 31, 2018 | 41,396,992 | 39,027,144 | 2,369,848 | |||||||||
Current service cost | 2,927,021 | — | 2,927,021 | |||||||||
Interest expense/interest income | 400,314 | 390,272 | 10,042 | |||||||||
|
|
|
|
|
| |||||||
Amounts recognized in profit or loss | 3,327,335 | 390,272 | 2,937,063 | |||||||||
|
|
|
|
|
| |||||||
Remeasurement on the net defined benefit liability | ||||||||||||
Return on plan assets (excluding amounts included in net interest) | — | 1,337,771 | (1,337,771 | ) | ||||||||
Actuarial losses recognized from changes in demographic assumptions | 5,746 | — | 5,746 | |||||||||
Actuarial losses recognized from changes in financial assumptions | 647,236 | — | 647,236 | |||||||||
Actuarial gains recognized from experience adjustments | (841,564 | ) | — | (841,564 | ) | |||||||
|
|
|
|
|
| |||||||
Amounts recognized in other comprehensive income | (188,582 | ) | 1,337,771 | (1,526,353 | ) | |||||||
|
|
|
|
|
| |||||||
Contributions from employer | — | 2,098,912 | (2,098,912 | ) | ||||||||
Benefits paid | (3,034,155 | ) | (3,034,155 | ) | — | |||||||
Benefits paid directly by the Company | (304,364 | ) | — | (304,364 | ) | |||||||
|
|
|
|
|
| |||||||
Balance on December 31, 2019 | $ | 41,197,226 | $ | 39,819,944 | $ | 1,377,282 | ||||||
|
|
|
|
|
| |||||||
Relevant pension costs recognized in profit and loss for defined benefit plans were as follows:
| Year Ended December 31 | ||||||||
| 2019 | 2018 | |||||||
Operating costs | $ | 1,725,644 | $ | 1,795,526 | ||||
Marketing expenses | 866,412 | 885,684 | ||||||
General and administrative expenses | 164,255 | 164,252 | ||||||
Research and development expenses | 103,156 | 107,494 | ||||||
|
|
|
| |||||
| $ | 2,859,467 | $ | 2,952,956 | |||||
|
|
|
| |||||
- 63 -
The Company is exposed to following risks for the defined benefits plans under the Labor Standards Law:
| a. | Investment risk |
Under the Labor Standards Law, the rate of return on assets shall not be lower than the average interest rate on atwo-year time deposit published by the local banks and the government is responsible for any shortfall in the event that the rate of return is less than the required rate of return. The plan assets are held in a commingled fund mainly invested in foreign and domestic equity and debt securities and bank deposits which is operated and managed by the government’s designated authorities; as such, the Company does not have any right to intervene in the investments of the funds.
| b. | Interest rate risk |
The decline in government bond interest rate will increase the present value of the obligation on the defined benefit plan, while the return on plan assets will increase. The net effect on the present value of the obligation on defined benefit plan is partially offset by the return on plan assets.
| c. | Salary risk |
The calculation of the present value of defined benefit obligation is referred to the plan participants’ future salary. Hence, the increase in plan participants’ salary will increase the present value of the defined benefit obligation.
The most recent actuarial valuation of plan assets and the present value of the defined benefit obligation were carried out by the independent actuary.
The principal assumptions used for the purpose of the actuarial valuations were as follows:
| Measurement Date | ||||
| December 31 | ||||
| 2019 | 2018 | |||
Discount rates | 0.75% | 1.00% | ||
Expected rates of salary increase | 1.20%-2.00% | 1.20%-2.00% | ||
If reasonably possible changes of the respective significant actuarial assumptions occur at the end of reporting periods, while holding all other assumptions constant, the present value of the defined benefit obligation would increase (decrease) as follows:
| December 31 | ||||||||
| 2019 | 2018 | |||||||
Discount rates | ||||||||
0.5% increase | $ | (1,275,319 | ) | $ | (1,258,429 | ) | ||
|
|
|
| |||||
0.5% decrease | $ | 1,356,153 | $ | 1,338,402 | ||||
|
|
|
| |||||
Expected rates of salary increase | ||||||||
0.5% increase | $ | 1,448,264 | $ | 1,429,623 | ||||
|
|
|
| |||||
0.5% decrease | $ | (1,374,156 | ) | $ | (1,355,931 | ) | ||
|
|
|
| |||||
- 64 -
The sensitivity analysis presented above may not be representative of the actual change in the present value of the defined benefit obligation as it is unlikely that the change in assumptions would occur in isolation of one another as some of the assumptions may be correlated. There is no change in the methods and assumptions used in preparing the sensitivity analysis from the previous period.
| December 31 | ||||||||
| 2019 | 2018 | |||||||
The expected contributions to the plan for the next year | $ | 2,076,027 | $ | 2,236,871 | ||||
|
|
|
| |||||
The average duration of the defined benefit obligation | 6.5-14 years | 6.5-12.1 years | ||||||
As of December 31, 2019, the Company’s maturity analysis of the undiscounted benefit payments was as follows:
| Year | Amount | |||
2020 | $ | 2,956,110 | ||
2021 | 7,260,662 | |||
2022 | 11,006,630 | |||
2023 | 12,755,858 | |||
2024 and thereafter | 42,686,574 | |||
|
| |||
| $ | 76,665,834 | |||
|
| |||
| 27. | EQUITY |
| a. | Share capital |
| 1) | Common stocks |
| December 31 | ||||||||
| 2019 | 2018 | |||||||
Number of authorized shares (thousand) | 12,000,000 | 12,000,000 | ||||||
|
|
|
| |||||
Authorized shares | $ | 120,000,000 | $ | 120,000,000 | ||||
|
|
|
| |||||
Number of issued and paid shares (thousand) | 7,757,447 | 7,757,447 | ||||||
|
|
|
| |||||
Issued shares | $ | 77,574,465 | $ | 77,574,465 | ||||
|
|
|
| |||||
The issued common stocks of a par value at $10 per share entitled the right to vote and receive dividends.
| 2) | Global depositary receipts |
The MOTC and some stockholders sold some common stocks of Chunghwa in an international offering of securities in the form of American Depositary Shares (“ADS”) (one ADS represents 10 common stocks) in July 2003, August 2005, and September 2006. The ADSs were traded on the New York Stock Exchange since July 17, 2003. As of December 31, 2019, the outstanding ADSs were 229,597 thousand common stocks, which equaled 22,960 thousand units and represented 2.96% of Chunghwa’s total outstanding common stocks.
The ADS holders generally have the same rights and obligations as other common stockholders, subject to the provision of relevant laws. The exercise of such rights and obligations shall comply with the related regulations and deposit agreement, which stipulate, among other things, that ADS holders are entitled to, through deposit agents:
| a) | Exercise their voting rights, |
| b) | Sell their ADSs, and |
| c) | Receive dividends declared and subscribe to the issuance of new shares. |
- 65 -
| b. | Additionalpaid-in capital |
The adjustments of additionalpaid-in capital for the years ended December 31, 2019 and 2018 were as follows:
| Share Premium | Movements of Additional Paid-in Capital for Associates Accounted for Using Equity Method | Movements of Additional Paid-in Capital Arising from Changes in Equities of Subsidiaries | Difference between Consideration Received and Carrying Amount of the Subsidiaries’ Net Assets upon Disposal | Donated Capital | Stockholders’ Contribution due to Privatization | Total | ||||||||||||||||||||||
Balance on January 1, 2018 | $ | 147,329,386 | $ | 90,937 | $ | 1,220,725 | $ | 161,564 | $ | 16,193 | $ | 20,648,078 | $ | 169,466,883 | ||||||||||||||
Unclaimed dividend | — | — | — | — | 2,455 | — | 2,455 | |||||||||||||||||||||
Change in additionalpaid-in capital from investments in associates accounted for using equity method | — | (1,044 | ) | — | — | — | — | (1,044 | ) | |||||||||||||||||||
Partial disposal of interests in subsidiaries | — | — | — | 826,047 | — | — | 826,047 | |||||||||||||||||||||
Change in additionalpaid-in capital for not proportionately participating in the capital increase of subsidiaries | — | — | 776,713 | — | — | — | 776,713 | |||||||||||||||||||||
Share-based payment transactions of subsidiaries | — | — | 10,776 | — | — | — | 10,776 | |||||||||||||||||||||
Treasury stock transfer of subsidiaries | — | — | 54,934 | — | — | — | 54,934 | |||||||||||||||||||||
|
|
|
|
|
|
|
|
|
|
|
|
|
| |||||||||||||||
Balance on December 31, 2018 | 147,329,386 | 89,893 | 2,063,148 | 987,611 | 18,648 | �� | 20,648,078 | 171,136,764 | ||||||||||||||||||||
Unclaimed dividend | — | — | — | — | 1,266 | — | 1,266 | |||||||||||||||||||||
Change in additionalpaid-in capital from investments in associates accounted for using equity method | — | 118,853 | — | — | — | — | 118,853 | |||||||||||||||||||||
Share-based payment transactions of subsidiaries | — | — | (898 | ) | — | — | — | (898 | ) | |||||||||||||||||||
|
|
|
|
|
|
|
|
|
|
|
|
|
| |||||||||||||||
Balance on December 31, 2019 | $ | 147,329,386 | $ | 208,746 | $ | 2,062,250 | $ | 987,611 | $ | 19,914 | $ | 20,648,078 | $ | 171,255,985 | ||||||||||||||
|
|
|
|
|
|
|
|
|
|
|
|
|
| |||||||||||||||
Additionalpaid-in capital from share premium, donated capital and the difference between consideration received and the carrying amount of the subsidiaries’ net assets upon disposal may be utilized to offset deficits. Furthermore, when Chunghwa has no deficit, it may be distributed in cash or capitalized, which however is limited to a certain percentage of Chunghwa’spaid-in capital except the additionalpaid-in capital arising from unclaimed dividend can only be utilized to offset deficits.
The additionalpaid-in capital from movements ofpaid-in capital arising from changes in equities of subsidiaries may only be utilized to offset deficits.
Among additionalpaid-in capital from movements of investments in associates accounted for using equity method, the portion arising from the difference between consideration received and the carrying amount of the subsidiaries’ net assets upon disposal may be utilized to offset deficits; furthermore, when the Company has no deficit, it may be distributed in cash or capitalized. However, other additionalpaid-in capital recognized in proportion of share ownership may only be utilized to offset deficits.
- 66 -
| c. | Retained earnings and dividends policy |
In accordance with the Chunghwa’s Articles of Incorporation, Chunghwa must pay all outstanding taxes, offset deficits in prior years and set aside a legal reserve equal to 10% of its net income before distributing a dividend or making any other distribution to stockholders, except when the accumulated amount of such legal reserve equals to Chunghwa’s total issued capital, and depending on its business needs or requirements, may also set aside or reverse special reserves. No less than 50% of the remaining earnings comprising remaining balance of net income, if any, plus cumulative undistributed earnings shall be distributed as stockholders’ dividends, of which cash dividends to be distributed shall not be less than 50% of the total amount of dividends to be distributed. If cash dividend to be distributed is less than $0.10 per share, such cash dividend shall be distributed in the form of common stocks.
Chunghwa should appropriate or reverse a special reserve in accordance with Rule No. 1010012865 and Rule No. 1010047490 issued by the FSC and the directive entitled “Questions and Answers on Special Reserves Appropriated Following the Adoption of Taiwan-IFRSs”. Distributions can be made out of any subsequent reversal of the debit to other equity items.
The appropriation for legal reserve shall be made until the accumulated reserve equals the aggregate par value of the outstanding capital stock of Chunghwa. This reserve can only be used to offset a deficit, or when the legal reserve has exceeded 25% of Chunghwa’spaid-in capital, the excess may be transferred to capital or distributed in cash.
The appropriations of the 2018 and 2017 earnings of Chunghwa approved by the stockholders in their meetings on June 21, 2019 and June 15, 2018 were as follows:
| Appropriation of Earnings | Dividends Per Share (NT$) | |||||||||||||||
| For Fiscal Year 2018 | For Fiscal Year 2017 | For Fiscal Year 2018 | For Fiscal Year 2017 | |||||||||||||
Reversal of special reserve | $ | — | $ | 5,404 | ||||||||||||
Cash dividends | 34,745,603 | 37,204,714 | $ | 4.479 | $ | 4.796 | ||||||||||
The appropriations of earnings for 2019 had been proposed by Chunghwa’s Board of Directors on February 26, 2020. The appropriations and dividends per share were as follows:
| Appropriation of Earnings | Dividends Per Share (NT$) | |||||||
Cash dividends | $ | 32,782,969 | $ | 4.226 | ||||
The appropriations of earnings for 2019 are subject to the resolution of the stockholders’ meeting planned to be held on May 29, 2020. Information of the appropriation of the Chunghwa’s earnings proposed by the Board of Directors and approved by the stockholders is available on the Market Observation Post System website.
| d. | Other adjustments |
| 1) | Exchange differences arising from the translation of the foreign operations |
The exchange differences arising from the translation of the foreign operations from their functional currency to New Taiwan dollars were recognized as exchange differences arising from the translation of the foreign operations in other comprehensive income.
- 67 -
| 2) | Unrealized gain or loss on financial assets at FVOCI |
| Year Ended December 31 | ||||||||
| 2019 | 2018 | |||||||
Beginning balance | $ | 538,272 | $ | 883,420 | ||||
Unrealized gain (loss) for the year Equity instruments | 298,326 | (345,148 | ) | |||||
|
|
|
| |||||
Ending balance | $ | 836,598 | $ | 538,272 | ||||
|
|
|
| |||||
| e. | Noncontrolling interests |
| Year Ended December 31 | ||||||||
| 2019 | 2018 | |||||||
Beginning balance | $ | 10,009,948 | $ | 8,693,650 | ||||
Effect of retrospective application | (19,603 | ) | — | |||||
|
|
|
| |||||
Beginning balance as adjusted | 9,990,345 | 8,693,650 | ||||||
Shares attributed to noncontrolling interests | ||||||||
Net income for the year | 975,397 | 954,549 | ||||||
Exchange differences arising from the translation of the net investment in foreign operations | 7,753 | (3,177 | ) | |||||
Unrealized gain or loss on financial assets at FVOCI | (11,918 | ) | (1,182 | ) | ||||
Remeasurements of defined benefit pension plans | 14,340 | (9,306 | ) | |||||
Income tax relating to remeasurements of defined benefit pension plans | (2,874 | ) | 3,396 | |||||
Share of other comprehensive income (loss) of associates accounted for using equity method | (1,325 | ) | 696 | |||||
Cash dividends distributed by subsidiaries | (709,817 | ) | (958,446 | ) | ||||
Changes in additionalpaid-in capital from investments in associates accounted for using equity method | 1,064 | 191 | ||||||
Partial disposal of interests in subsidiaries | — | 348,353 | ||||||
Share-based payment transactions of subsidiaries | 21,320 | 41,863 | ||||||
Change in additionalpaid-in capital for not proportionately participating in the capital increase of subsidiaries | — | 699,967 | ||||||
Net increase (decrease) in noncontrolling interests | (763 | ) | 239,394 | |||||
|
|
|
| |||||
Ending balance | $ | 10,283,522 | $ | 10,009,948 | ||||
|
|
|
| |||||
| 28. | REVENUES |
| Year Ended December 31 | ||||||||
| 2019 | 2018 | |||||||
Revenue from contracts with customers | $ | 206,359,673 | $ | 214,460,894 | ||||
|
|
|
| |||||
Other revenues | ||||||||
Rental income | 817,553 | 640,312 | ||||||
Other | 342,835 | 381,952 | ||||||
|
|
|
| |||||
| 1,160,388 | 1,022,264 | |||||||
|
|
|
| |||||
| $ | 207,520,061 | $ | 215,483,158 | |||||
|
|
|
| |||||
The information of performance obligations in customer contracts, please refer to Note 3 Summary of Significant Accounting Policies for details.
- 68 -
| a. | Disaggregation of revenue |
2019
| Domestic Fixed Communications Business | Mobile Communications Business | Internet Business | International Fixed Communications Business | Others | Total | |||||||||||||||||||
Main Products and Service Revenues | ||||||||||||||||||||||||
Mobile services revenue | $ | — | $ | 58,703,003 | $ | — | $ | — | $ | — | $ | 58,703,003 | ||||||||||||
Sales of products | 1,957,460 | 35,545,256 | 40,873 | 264,949 | 3,784,586 | 41,593,124 | ||||||||||||||||||
Local telephone and domestic long distance telephone services revenue | 27,929,263 | — | — | — | — | 27,929,263 | ||||||||||||||||||
Broadband access and domestic leased line services revenue | 22,115,908 | — | — | — | — | 22,115,908 | ||||||||||||||||||
Data Communications internet services revenue | — | — | 21,002,699 | — | — | 21,002,699 | ||||||||||||||||||
International network and leased telephone services revenue | — | — | — | 7,066,361 | — | 7,066,361 | ||||||||||||||||||
Others | 13,063,469 | 1,141,584 | 8,789,794 | 4,143,885 | 810,583 | 27,949,315 | ||||||||||||||||||
|
|
|
|
|
|
|
|
|
|
|
| |||||||||||||
| $ | 65,066,100 | $ | 95,389,843 | $ | 29,833,366 | $ | 11,475,195 | $ | 4,595,169 | $ | 206,359,673 | |||||||||||||
|
|
|
|
|
|
|
|
|
|
|
| |||||||||||||
2018
| Domestic Fixed Communications Business | Mobile Communications Business | Internet Business | International Fixed Communications Business | Others | Total | |||||||||||||||||||
Main Products and Service Revenues | ||||||||||||||||||||||||
Mobile services revenue | $ | — | $ | 63,905,960 | $ | — | $ | — | $ | — | $ | 63,905,960 | ||||||||||||
Sales of products | 1,731,152 | 35,701,599 | 3,993 | 251,437 | 3,600,582 | 41,288,763 | ||||||||||||||||||
Local telephone and domestic long distance telephone services revenue | 29,995,695 | — | — | — | — | 29,995,695 | ||||||||||||||||||
Broadband access and domestic leased line services revenue | 22,453,133 | — | — | — | — | 22,453,133 | ||||||||||||||||||
Data Communications internet services revenue | — | — | 21,137,189 | — | — | 21,137,189 | ||||||||||||||||||
International network and leased telephone services revenue | — | — | — | 8,724,302 | — | 8,724,302 | ||||||||||||||||||
Others | 11,922,601 | 1,269,587 | 8,509,272 | 4,448,211 | 806,181 | 26,955,852 | ||||||||||||||||||
|
|
|
|
|
|
|
|
|
|
|
| |||||||||||||
| $ | 66,102,581 | $ | 100,877,146 | $ | 29,650,454 | $ | 13,423,950 | $ | 4,406,763 | $ | 214,460,894 | |||||||||||||
|
|
|
|
|
|
|
|
|
|
|
| |||||||||||||
| b. | Contract balances |
| December 31 | ||||||||
| 2019 | 2018 | |||||||
Trade notes and accounts receivable (Note 9) | $ | 26,407,783 | $ | 30,075,503 | ||||
|
|
|
| |||||
Contract assets | ||||||||
Products and service bundling | $ | 6,942,974 | $ | 7,122,875 | ||||
Other | 115,993 | 108,581 | ||||||
Less: Loss allowance | (16,858 | ) | (18,770 | ) | ||||
|
|
|
| |||||
| $ | 7,042,109 | $ | 7,212,686 | |||||
|
|
|
| |||||
Current | $ | 4,441,196 | $ | 4,868,728 | ||||
Noncurrent | 2,600,913 | 2,343,958 | ||||||
|
|
|
| |||||
| $ | 7,042,109 | $ | 7,212,686 | |||||
|
|
|
| |||||
(Continued)
- 69 -
| December 31 | ||||||||
| 2019 | 2018 | |||||||
Contract liabilities | ||||||||
Telecommunications business | $ | 12,771,621 | $ | 8,193,215 | ||||
Project business | 10,360,428 | 4,508,200 | ||||||
Products and service bundling | 38,570 | 105,559 | ||||||
Others | 510,696 | 475,947 | ||||||
|
|
|
| |||||
| $ | 23,681,315 | $ | 13,282,921 | |||||
|
|
|
| |||||
Current | $ | 16,839,830 | $ | 10,687,772 | ||||
Noncurrent | 6,841,485 | 2,595,149 | ||||||
|
|
|
| |||||
| $ | 23,681,315 | $ | 13,282,921 | |||||
|
|
|
| |||||
(Concluded)
The changes in the contract asset and the contract liability balances primarily result from the timing difference between the satisfaction of performance obligations and the payments collected from customers. Significant changes of contract assets and liabilities recognized resulting from product and service bundling were as follows:
| Year Ended December 31 | ||||||||
| 2019 | 2018 | |||||||
Contract assets | ||||||||
Net increase of customer contracts | $ | 6,066,406 | $ | 4,125,505 | ||||
Reclassified to trade receivables | (6,405,198 | ) | (7,531,886 | ) | ||||
|
|
|
| |||||
| $ | (338,792 | ) | $ | (3,406,381 | ) | |||
|
|
|
| |||||
Contract liabilities | ||||||||
Net increase of customer contracts | $ | 21,844 | $ | 16,243 | ||||
Recognized as revenues | (88,833 | ) | (194,384 | ) | ||||
|
|
|
| |||||
| $ | (66,989 | ) | $ | (178,141 | ) | |||
|
|
|
| |||||
The Company applies the simplified approach to providing for expected credit losses prescribed by IFRS 9, which permits the use of lifetime expected loss provision for receivables. Contract assets will be reclassified to trade receivables when the corresponding invoice is billed to the client. Contract assets have substantially the same risk characteristics as the trade receivables of the same types of contracts. Therefore, the Company concluded that the expected loss rates for trade receivables can be applied to the contract assets.
Revenue recognized for the period that was included in the contract liability at the beginning of the period was as follows:
| Year Ended December 31 | ||||||||
| 2019 | 2018 | |||||||
Telecommunications business | $ | 6,185,997 | $ | 7,156,712 | ||||
Project business | 3,973,559 | 626,860 | ||||||
Others | 403,921 | 324,892 | ||||||
|
|
|
| |||||
| $ | 10,563,477 | $ | 8,108,464 | |||||
|
|
|
| |||||
- 70 -
| c. | Incremental costs of obtaining contracts |
| December 31 | ||||||||
| 2019 | 2018 | |||||||
Noncurrent | ||||||||
Incremental costs of obtaining contracts | $ | 942,652 | $ | 1,335,030 | ||||
|
|
|
| |||||
The Company considered the past experience and the default clauses in the telecommunications service contract and believes the commissions and equipment subsidy paid for obtaining contracts are expected to be recoverable; therefore, incremental costs of obtaining contracts are recognized as an asset. Amortization expense of incremental costs of obtaining contracts for the years ended December 31, 2019 and 2018 were $1,173,492 thousand and $1,941,124 thousand, respectively.
| d. | Remaining Performance Obligations |
As of December 31, 2019, the aggregate amount of transaction price allocated to performance obligations fornon-cancellable telecommunications service contracts that are unsatisfied is $35,633,568 thousand. The Company recognizes revenue when service is provided over contract terms. The Company expects to recognize such revenue of $20,336,233 thousand, $11,970,383 thousand and $3,326,952 thousand in 2020, 2021 and 2022, respectively. The variable consideration collected from customers on nonrecurring basis resulting from exceeded usage from monthly fee and revenue recognized for contracts that the Company has a right to consideration from customers in the amount corresponding directly with the value to the customers of the Company’s performance completed to date have been excluded from the disclosure of remaining performance obligations.
As of December 31, 2019, the aggregate amount of transaction price allocated to performance obligations fornon-cancellable project business contracts that are unsatisfied is $23,158,615 thousand. The Company recognizes revenues when the project business contract is completed and accepted by customers. The Company expects to recognize such revenue of $14,182,796 thousand, $5,372,471 thousand and $3,603,348 thousand in 2020, 2021 and 2022, respectively. Project business contracts whose expected duration are less than a year have been excluded from the aforementioned disclosure.
| 29. | NET INCOME |
| a. | Other income and expenses |
| Year Ended December 31 | ||||||||
| 2019 | 2018 | |||||||
Gain (loss) on disposal of property, plant and equipment | $ | (37,785 | ) | $ | 142,068 | |||
Impairment loss on property, plant and equipment | (93,073 | ) | — | |||||
Reversal of impairment loss on investment properties | 56,617 | 19,133 | ||||||
Loss on disposal of intangible assets | (146 | ) | — | |||||
Impairment loss on intangible assets | (8,946 | ) | (50,750 | ) | ||||
Impairment loss on other assets | (43,971 | ) | — | |||||
|
|
|
| |||||
| $ | (127,304 | ) | $ | 110,451 | ||||
|
|
|
| |||||
- 71 -
| b. | Other income |
| Year Ended December 31 | ||||||||
| 2019 | 2018 | |||||||
Dividend income | $ | 296,360 | $ | 395,593 | ||||
Rental income | 84,870 | 70,142 | ||||||
Others | 150,394 | 234,088 | ||||||
|
|
|
| |||||
| $ | 531,624 | $ | 699,823 | |||||
|
|
|
| |||||
| c. | Other gains and losses |
| Year Ended December 31 | ||||||||
| 2019 | 2018 | |||||||
Foreign currency exchange gain, net | $ | 15,823 | $ | 37,348 | ||||
Gain (loss) on disposal of investments accounted for using equity method | 30,152 | (125 | ) | |||||
Gain on disposal of financial instruments | 3,944 | 5,763 | ||||||
Valuation loss on financial assets and liabilities at fair value through profit or loss, net | (38,314 | ) | (20,763 | ) | ||||
Others | (48,076 | ) | (67,894 | ) | ||||
|
|
|
| |||||
| $ | (36,471 | ) | $ | (45,671 | ) | |||
|
|
|
| |||||
| d. | Interest expenses |
| Year Ended December 31 | ||||||||
| 2019 | 2018 | |||||||
Interest on lease liabilities | $ | 84,918 | $ | — | ||||
Other interest expenses | 19,224 | 17,596 | ||||||
|
|
|
| |||||
| $ | 104,142 | $ | 17,596 | |||||
|
|
|
| |||||
| e. | Impairment loss (reversal of impairment loss) |
| Year Ended December 31 | ||||||||
| 2019 | 2018 | |||||||
Contract assets | $ | (1,912 | ) | $ | 18,770 | |||
|
|
|
| |||||
Trade notes and accounts receivable | $ | (53,952 | ) | $ | 804,727 | |||
|
|
|
| |||||
Other receivables | $ | (69,247 | ) | $ | 96,235 | |||
|
|
|
| |||||
Inventories | $ | 474,709 | $ | 365,123 | ||||
|
|
|
| |||||
Property, plant and equipment | $ | 93,073 | $ | — | ||||
|
|
|
| |||||
Investment properties | $ | (56,617 | ) | $ | (19,133 | ) | ||
|
|
|
| |||||
Intangible assets | $ | 8,946 | $ | 50,750 | ||||
|
|
|
| |||||
Other assets | $ | 43,971 | $ | — | ||||
|
|
|
| |||||
- 72 -
| f. | Depreciation and amortization expenses |
| Year Ended December 31 | ||||||||
| 2019 | 2018 | |||||||
Property, plant and equipment | $ | 26,930,188 | $ | 27,461,179 | ||||
Right-of-use assets | 3,967,646 | — | ||||||
Investment properties | 25,157 | 20,777 | ||||||
Intangible assets | 4,252,602 | 4,386,798 | ||||||
Incremental costs of obtaining contracts | 1,173,492 | 1,941,124 | ||||||
|
|
|
| |||||
Total depreciation and amortization expenses | $ | 36,349,085 | $ | 33,809,878 | ||||
|
|
|
| |||||
Depreciation expenses summarized by functions | ||||||||
Operating costs | $ | 28,956,751 | $ | 25,996,087 | ||||
Operating expenses | 1,966,240 | 1,485,869 | ||||||
|
|
|
| |||||
| $ | 30,922,991 | $ | 27,481,956 | |||||
|
|
|
| |||||
Amortization expenses summarized by functions | ||||||||
Operating costs | $ | 5,196,298 | $ | 6,085,039 | ||||
Marketing expenses | 96,477 | 113,253 | ||||||
General and administrative expenses | 94,487 | 93,239 | ||||||
Research and development expenses | 38,832 | 36,391 | ||||||
|
|
|
| |||||
| $ | 5,426,094 | $ | 6,327,922 | |||||
|
|
|
| |||||
| g. | Employee benefit expenses |
| Year Ended December 31 | ||||||||
| 2019 | 2018 | |||||||
Post-employment benefit | ||||||||
Defined contribution plans | $ | 654,449 | $ | 639,670 | ||||
Defined benefit plans | 2,859,467 | 2,952,956 | ||||||
|
|
|
| |||||
| 3,513,916 | 3,592,626 | |||||||
|
|
|
| |||||
Share-based payment | ||||||||
Equity-settled share-based payment | 1,597 | 17,302 | ||||||
|
|
|
| |||||
Other employee benefit | ||||||||
Salaries | 25,463,967 | 26,203,747 | ||||||
Insurance | 2,746,088 | 2,739,782 | ||||||
Others | 14,429,853 | 14,470,194 | ||||||
|
|
|
| |||||
| 42,639,908 | 43,413,723 | |||||||
|
|
|
| |||||
Total employee benefit expenses | $ | 46,155,421 | $ | 47,023,651 | ||||
|
|
|
| |||||
Summary by functions | ||||||||
Operating costs | $ | 23,586,735 | $ | 24,366,935 | ||||
Operating expenses | 22,568,686 | 22,656,716 | ||||||
|
|
|
| |||||
| $ | 46,155,421 | $ | 47,023,651 | |||||
|
|
|
| |||||
- 73 -
Chunghwa distributes employees’ compensation at the rates from 1.7% to 4.3% and remuneration to directors not higher than 0.17%, respectively, ofpre-tax income. As of December 31, 2019, the payables of the employees’ compensation and the remuneration to directors were $1,126,194 thousand and $35,210 thousand, respectively. Such amounts have been approved by the Chunghwa’s Board of Directors on February 26, 2020 and will be reported to the stockholders in their meeting planned to be held on May 29, 2020.
If there is a change in the proposed amounts after the annual financial statements are authorized for issue, the differences are recorded as a change in accounting estimate.
The compensation to the employees and remuneration to the directors of 2018 and 2017 approved by the Board of Directors on March 19, 2019 and March 13, 2018, respectively, were as follows:
| 2018 | 2017 | |||||||
| Cash | Cash | |||||||
Compensation distributed to the employees | $ | 1,404,264 | $ | 1,596,012 | ||||
Remuneration paid to the directors | 38,216 | 40,750 | ||||||
There was no difference between the initial accrual amounts and the amounts proposed in the Board of Directors in 2019 and 2018 of the aforementioned compensation to employees and the remuneration to directors.
Information of the appropriation of Chunghwa’s employees compensation and remuneration to directors and those approved by the Board of Directors is available on the Market Observation Post System website.
| 30. | INCOME TAX |
| a. | Income tax recognized in profit or loss |
The major components of income tax expense were as follows:
| Year Ended December 31 | ||||||||
| 2019 | 2018 | |||||||
Current tax | ||||||||
Current tax expenses recognized for the year | $ | 8,109,261 | $ | 8,271,026 | ||||
Income tax on unappropriated earnings | 19,523 | 47,528 | ||||||
Income tax adjustments on prior years | (90,531 | ) | 6,782 | |||||
Others | 11,574 | 7,368 | ||||||
|
|
|
| |||||
| 8,049,827 | 8,332,704 | |||||||
Deferred tax | ||||||||
Deferred tax expenses recognized for the year | (63,119 | ) | 208,252 | |||||
Income tax adjustments on prior years | (859 | ) | 19,229 | |||||
Change in tax rate | — | (37,652 | ) | |||||
|
|
|
| |||||
| (63,978 | ) | 189,829 | ||||||
|
|
|
| |||||
Income tax expense recognized in profit or loss | $ | 7,985,849 | $ | 8,522,533 | ||||
|
|
|
| |||||
- 74 -
Reconciliation of accounting profit and income tax expense was as follows:
| Year Ended December 31 | ||||||||
| 2019 | 2018 | |||||||
Income before income tax | $ | 41,749,792 | $ | 44,978,704 | ||||
|
|
|
| |||||
Income tax expense calculated at the statutory rate | $ | 8,349,958 | $ | 8,995,741 | ||||
Nondeductible income and expenses in determining taxable income | 17,616 | 226,727 | ||||||
Unrecognized deductible temporary differences | 3,243 | 755 | ||||||
Unrecognized loss carryforwards | 7,221 | 21,240 | ||||||
Tax-exempt income | (125,004 | ) | (578,412 | ) | ||||
Additional income tax under Alternative Minimum Tax Act | — | 45,827 | ||||||
Income tax on unappropriated earnings | 19,523 | 47,528 | ||||||
Investment credits | (202,921 | ) | (204,223 | ) | ||||
Change in tax rate | — | (37,652 | ) | |||||
Effect of different tax rates of group entities operating in other jurisdictions | (8,981 | ) | (14,967 | ) | ||||
Income tax adjustments on prior years | (91,390 | ) | 26,011 | |||||
Others | 16,584 | (6,042 | ) | |||||
|
|
|
| |||||
Income tax expense recognized in profit or loss | $ | 7,985,849 | $ | 8,522,533 | ||||
|
|
|
| |||||
Income Tax Act in the ROC was amended in February 2018 and the corporate income tax rate is adjusted from 17% to 20%. Such amendment is effective from 2018. In addition, the rate of the corporate surtax applicable to 2018 unappropriated earnings is reduced from 10% to 5%. The applicable tax rate used by subsidiaries in China is 25%, and tax rates used by other entities in the Company operating in other jurisdictions are based on the tax laws in those jurisdictions.
In July 2019, the President of the ROC announced of the amendments to Article23-3 of the Statute of Industrial Innovation, which stipulate that the unappropriated earnings in 2018 and thereafter that are reinvested in certain assets or technologies are allowed as deduction when computing the income tax on unappropriated earnings. Chunghwa has deducted the reinvested capital expenditure from the 2018 unappropriated earnings while calculating income tax on unappropriated earnings in 2019.
| b. | Income tax recognized in other comprehensive income |
| Year Ended December 31 | ||||||||
| 2019 | 2018 | |||||||
Deferred tax | ||||||||
Remeasurement on defined benefit plan | $ | 305,271 | $ | (242,911 | ) | |||
Change in tax rate | — | (207,255 | ) | |||||
|
|
|
| |||||
Total income tax expense (benefit) recognized in other comprehensive income | $ | 305,271 | $ | (450,166 | ) | |||
|
|
|
| |||||
- 75 -
| c. | Current tax assets and liabilities |
| December 31 | ||||||||
| 2019 | 2018 | |||||||
Current tax assets | ||||||||
Tax refund receivable (included in other current assets - other) | $ | 897 | $ | 466 | ||||
|
|
|
| |||||
Current tax liabilities | ||||||||
Income tax payable | $ | 4,020,670 | $ | 4,390,203 | ||||
|
|
|
| |||||
| d. | Deferred income tax assets and liabilities |
The movements of deferred income tax assets and liabilities were as follows:
For the year ended December 31, 2019
| January 1, 2019 | Adjustments Arising from Application of IFRS 16 | Recognized in Profit or Loss | Recognized in Other Comprehensive Income | December 31, 2019 | ||||||||||||||||
Deferred income tax assets | ||||||||||||||||||||
Temporary differences | ||||||||||||||||||||
Defined benefit obligation | $ | 2,307,057 | $ | — | $ | 32,475 | $ | (305,175 | ) | $ | 2,034,357 | |||||||||
Allowance for doubtful receivables over quota | 435,445 | — | (31,733 | ) | — | 403,712 | ||||||||||||||
Share of profit or loss of associates accounted for using equity method | 389,379 | — | 12,680 | — | 402,059 | |||||||||||||||
Valuation loss on inventory | 87,474 | — | 53,364 | — | 140,838 | |||||||||||||||
Deferred revenue | 110,929 | — | (13,472 | ) | — | 97,457 | ||||||||||||||
Estimated warranty liabilities | 25,989 | — | 8,472 | — | 34,461 | |||||||||||||||
Impairment loss on property, plant and equipment | 93,456 | — | (75,577 | ) | — | 17,879 | ||||||||||||||
Accrued award credits liabilities | 13,912 | — | 3,406 | — | 17,318 | |||||||||||||||
Unrealized foreign exchange loss, net | 430 | — | 2,593 | — | 3,023 | |||||||||||||||
Property, plant and equipment | 1,998 | — | (45 | ) | — | 1,953 | ||||||||||||||
Trade-in right | 10,335 | — | (9,693 | ) | — | 642 | ||||||||||||||
Others | 36,510 | 25,588 | 14,438 | 76,536 | ||||||||||||||||
|
|
|
|
|
|
|
|
|
| |||||||||||
| 3,512,914 | 25,588 | (3,092 | ) | (305,175 | ) | 3,230,235 | ||||||||||||||
Loss carryforwards | 40,942 | — | (12,570 | ) | — | 28,372 | ||||||||||||||
|
|
|
|
|
|
|
|
|
| |||||||||||
| $ | 3,553,856 | $ | 25,588 | $ | (15,662 | ) | $ | (305,175 | ) | $ | 3,258,607 | |||||||||
|
|
|
|
|
|
|
|
|
| |||||||||||
Deferred income tax liabilities | ||||||||||||||||||||
Temporary differences | ||||||||||||||||||||
Defined benefit obligation | $ | 1,832,669 | $ | — | $ | (74,634 | ) | $ | 96 | $ | 1,758,131 | |||||||||
Land value incremental tax | 94,986 | — | — | — | 94,986 | |||||||||||||||
Intangible assets | 32,028 | — | (2,515 | ) | — | 29,513 | ||||||||||||||
Deferred revenue for award credits | 30,690 | — | (2,147 | ) | — | 28,543 | ||||||||||||||
Unrealized foreign exchange gain, net | 599 | — | 480 | — | 1,079 | |||||||||||||||
Valuation gain or loss on financial instruments, net | 53 | — | (1 | ) | — | 52 | ||||||||||||||
Others | 818 | 6 | (823 | ) | — | 1 | ||||||||||||||
|
|
|
|
|
|
|
|
|
| |||||||||||
| $ | 1,991,843 | $ | 6 | $ | (79,640 | ) | $ | 96 | $ | 1,912,305 | ||||||||||
|
|
|
|
|
|
|
|
|
| |||||||||||
- 76 -
For the year ended December 31, 2018
| January 1, 2018 | Recognized in Profit or Loss | Recognized in Other Comprehensive Income | December 31, 2018 | |||||||||||||
Deferred income tax assets | ||||||||||||||||
Temporary differences | ||||||||||||||||
Defined benefit obligation | $ | 1,723,130 | $ | 133,748 | $ | 450,179 | $ | 2,307,057 | ||||||||
Allowance for doubtful receivables over quota | 289,043 | 146,402 | — | 435,445 | ||||||||||||
Share of profit or loss of associates accounted for using equity method | 330,705 | 58,674 | — | 389,379 | ||||||||||||
Valuation loss on inventory | 22,905 | 64,569 | — | 87,474 | ||||||||||||
Deferred revenue | 105,742 | 5,187 | — | 110,929 | ||||||||||||
Estimated warranty liabilities | 22,389 | 3,600 | — | 25,989 | ||||||||||||
Impairment loss on property, plant and equipment | 112,323 | (18,867 | ) | — | 93,456 | |||||||||||
Accrued award credits liabilities | 15,387 | (1,475 | ) | — | 13,912 | |||||||||||
Unrealized foreign exchange loss, net | 16,663 | (16,233 | ) | — | 430 | |||||||||||
Property, plant and equipment | 1,762 | 236 | — | 1,998 | ||||||||||||
Trade-in right | 14,887 | (4,552 | ) | — | 10,335 | |||||||||||
Others | 29,547 | 6,963 | — | 36,510 | ||||||||||||
|
|
|
|
|
|
|
| |||||||||
| 2,684,483 | 378,252 | 450,179 | 3,512,914 | |||||||||||||
Loss carryforwards | 45,610 | (4,668 | ) | — | 40,942 | |||||||||||
|
|
|
|
|
|
|
| |||||||||
| $ | 2,730,093 | $ | 373,584 | $ | 450,179 | $ | 3,553,856 | |||||||||
|
|
|
|
|
|
|
| |||||||||
Deferred income tax liabilities | ||||||||||||||||
Temporary differences | ||||||||||||||||
Defined benefit obligation | $ | 1,265,380 | $ | 567,276 | $ | 13 | $ | 1,832,669 | ||||||||
Land value incremental tax | 94,986 | — | — | 94,986 | ||||||||||||
Intangible assets | 38,111 | (6,083 | ) | — | 32,028 | |||||||||||
Deferred revenue for award credits | 28,810 | 1,880 | — | 30,690 | ||||||||||||
Unrealized foreign exchange gain, net | 134 | 465 | — | 599 | ||||||||||||
Valuation gain or loss on financial instruments, net | — | 53 | — | 53 | ||||||||||||
Others | 996 | (178 | ) | — | 818 | |||||||||||
|
|
|
|
|
|
|
| |||||||||
| $ | 1,428,417 | $ | 563,413 | $ | 13 | $ | 1,991,843 | |||||||||
|
|
|
|
|
|
|
| |||||||||
- 77 -
| e. | Deductible temporary differences and unused loss carryforwards for which no deferred tax assets have been recognized in the consolidated balance sheets |
| December 31 | ||||||||
| 2019 | 2018 | |||||||
Loss carryforwards | ||||||||
Expire in 2020 | $ | 22,515 | $ | 41,390 | ||||
Expire in 2021 | 12,406 | 11,836 | ||||||
Expire in 2022 | 10,264 | 10,264 | ||||||
Expire in 2023 | 8,251 | 8,459 | ||||||
Expire in 2024 | 8,189 | 1,631 | ||||||
Expire in 2025 | 15,438 | 15,438 | ||||||
Expire in 2026 | 8,423 | 8,423 | ||||||
Expire in 2027 | 2,585 | 2,585 | ||||||
Expire in 2028 | 930 | 614 | ||||||
Expire in 2029 | 293 | — | ||||||
|
|
|
| |||||
| $ | 89,294 | $ | 100,640 | |||||
|
|
|
| |||||
Deductible temporary differences | $ | 813 | $ | 1,369 | ||||
|
|
|
| |||||
| f. | Information about unused loss carryforwards |
As of December 31, 2019, information about loss carryforwards was as follows:
Remaining Creditable Amount | Expiry Year | |
$22,515 | 2020 | |
19,468 | 2021 | |
11,391 | 2022 | |
8,923 | 2023 | |
8,372 | 2024 | |
25,668 | 2025 | |
11,636 | 2026 | |
3,503 | 2027 | |
4,556 | 2028 | |
1,634 | 2029 | |
| ||
$117,666 | ||
|
| g. | Income tax examinations |
Income tax returns of Chunghwa, CHSI, CHST, SENAO, CHIEF, CHI, CHPT, LED, Unigate, CLPT, SFD, SHE, ISPOT, Youth, Youyi, SENYOUNG, Aval and HHI have been examined by the tax authorities through 2017. Income tax returns of CHYP and CHTSC have been examined by the tax authorities through 2018.
- 78 -
| 31. | EARNINGS PER SHARE (“EPS”) |
Net income and weighted average number of common stocks used in the calculation of earnings per share were as follows:
Net Income
| Year Ended December 31 | ||||||||
| 2019 | 2018 | |||||||
Net income used to compute the basic earnings per share | ||||||||
Net income attributable to the parent | $ | 32,788,546 | $ | 35,501,622 | ||||
Assumed conversion of all dilutive potential common stocks | ||||||||
Employee stock options and employee compensation of subsidiaries | (3,617 | ) | (6,333 | ) | ||||
|
|
|
| |||||
Net income used to compute the diluted earnings per share | $ | 32,784,929 | $ | 35,495,289 | ||||
|
|
|
| |||||
Weighted Average Number of Common Stocks
(Thousand Shares)
| Year Ended December 31 | ||||||||
| 2019 | 2018 | |||||||
Weighted average number of common stocks used to compute the basic earnings per share | 7,757,447 | 7,757,447 | ||||||
Assumed conversion of all dilutive potential common stocks Employee compensation | 7,862 | 9,062 | ||||||
|
|
|
| |||||
Weighted average number of common stocks used to compute the diluted earnings per share | 7,765,309 | 7,766,509 | ||||||
|
|
|
| |||||
Because Chunghwa may settle the employee compensation in shares or cash, Chunghwa shall presume that it will be settled in shares and takes those shares into consideration when calculating the weighted average number of outstanding shares used in the calculation of diluted EPS if the shares have a dilutive effect. The dilutive effect of the shares needs to be considered until the approval of the number of shares to be distributed to employees as compensation in the following year.
| 32. | SHARE-BASED PAYMENT ARRANGEMENT |
| a. | SENAO share-based compensation plan (“SENAO Plan”) described as follows: |
Effective Date for Plan Registration | Resolution Date by SENAO’s Board of Directors | Stock Options Units (Thousand) | Exercise Price (NT$) | |||||||||
2012.05.28 | 2013.04.29 | 10,000 | | $66.20 (Original price$93.00 | ) | |||||||
Each option is eligible to subscribe for one common share when exercisable. Under the terms of the SENAO Plan, the options are granted at an exercise price equal to the closing price of the SENAO’s common stocks listed on the TSE on the higher of closing price or par value. The SENAO Plan have exercise price adjustment formula upon the changes in common stocks equity (including cash capital increase, new share issue through capitalization of earnings and additionalpaid-in capital, merger, spin off and new share issue for Global Depositary Shares, and so on) or distribution of cash dividends. The options of SENAO Plan are valid for six years and the graded vesting schedule for which 50% of option granted will vest two years after the grant date and another two tranches of 25%, each will vest three and four years after the grant date respectively.
- 79 -
No compensation cost of stock options granted on May 7, 2013 was recognized for the year ended December 31, 2018 and 2019.
SENAO modified the plan terms of the outstanding stock options in July 2018 and the exercise price changed from $70.70 to $66.20 per share. The modification did not cause any incremental fair value granted.
Information about SENAO’s outstanding stock options for the years ended December 31, 2019 and 2018 was as follows:
| Year Ended December 31 | ||||||||||||||||
| 2019 | 2018 | |||||||||||||||
| Granted on May 7, 2013 | Granted on May 7, 2013 | |||||||||||||||
Number of Options (Thousand) | Weighted Average | Number of Options (Thousand) | Weighted Average | |||||||||||||
Employee stock options | ||||||||||||||||
Options outstanding at beginning of the year | 5,318 | $ | 66.20 | 5,926 | $ | 70.70 | ||||||||||
Options forfeited | (5,318 | ) | — | (608 | ) | — | ||||||||||
|
|
|
| |||||||||||||
Options outstanding at end of the year | — | — | 5,318 | 66.20 | ||||||||||||
|
|
|
| |||||||||||||
Options exercisable at end of the year | — | — | 5,318 | 66.20 | ||||||||||||
|
|
|
| |||||||||||||
As of December 31, 2019, there was no outstanding stock options.
As of December 31, 2018, information about employee stock options outstanding was as follows:
Options Outstanding | Options Exercisable | |||||||||
Range of Exercise Price (NT$) | Number of Options (Thousand) | Weighted Average Remaining Life (Years) | Weighted Average Exercise Price (NT$) | Number of Options (Thousand) | Weighted Average Exercise Price (NT$) | |||||
$66.20 | 5,318 | 0.35 | $66.20 | 5,318 | $66.20 | |||||
- 80 -
SENAO used the fair value method to evaluate the options using the Black-Scholes model and the related assumptions and the fair value of the options were as follows:
| Stock Options Granted on May 7, 2013 | ||||
Grant-date share price (NT$) | $93.00 | |||
Exercise price (NT$) | $93.00 | |||
Dividends yield | — | |||
Risk-free interest rate | 0.91 | % | ||
Expected life | 4.375 years | |||
Expected volatility | 36.22 | % | ||
Weighted average fair value of grants (NT$) | $28.72 | |||
Expected volatility was based on the historical share price volatility of SENAO over the period equal to the expected life of SENAO Plan.
| b. | SENAO transferred the treasury stock |
The Board of Directors of SENAO resolved to transfer treasury stock 6,658 thousand shares to specific employees in April 2018. The aforementioned treasury stock transferred to employees were measured at the fair value on the grant date. The compensation cost of $15,564 thousand was recognized for the year ended December 31, 2018.
SENAO used the fair value method to evaluate share-based payment transaction using the Black-Scholes model and the related assumptions and the fair value of the option were as follows:
| Stock Options Granted on May 7, 2018 | ||||
Grant-date share price (NT$) | $51.60 | |||
Exercise price (NT$) | $49.28 | |||
Dividends yield | — | |||
Risk-free interest rate | 0.59 | % | ||
Expected life | 18 days | |||
Expected volatility | 8.78 | % | ||
Weighted average fair value of grants (NT$) | $2.34 | |||
Expected volatility was based on the historical share price volatility of SENAO over three months before the grant date.
| c. | CHIEF share-based compensation plan (“CHIEF Plan”) described as follows: |
Effective Date for Plan Registration | Resolution Date by Directors | Stock Options Units | Exercise Price (NT$) | |||||||||
2017.12.18 | 2017.12.19 | 950.00 | | $135.60 (Original price$147.00) |
| |||||||
| 2018.10.31 | 50.00 | | $141.70 (Original price$147.00) |
| ||||||||
2015.11.17 | 2015.10.22 | 2,000.00 | | $34.40 (Original price$43.00) |
| |||||||
- 81 -
Each option is eligible to subscribe for one thousand common stocks when exercisable. The options are granted to specific employees that meet the vesting conditions. The CHIEF Plan has exercise price adjustment formula upon the changes in common stocks or distribution of cash dividends. The options of CHIEF Plan are valid for five years and the graded vesting schedule will vest two years after the grant date.
The compensation cost for stock options granted on October 31, 2018 were $552 thousand and $92 thousand for the years ended December 31, 2019 and 2018, respectively.
The compensation costs for stock options granted on December 19, 2017 were $582 thousand and $596 thousand for the years ended December 31, 2019 and 2018, respectively.
The compensation costs for stock options granted on October 22, 2015 were $272 thousand and $1,050 thousand for the years ended December 31, 2019 and 2018, respectively.
CHIEF modified the plan terms of stock options granted on October 31, 2018 in June 2019 and the exercise price changed from $147.00 to $141.70 per share. The modification did not cause any incremental fair value granted.
CHIEF modified the plan terms of stock options granted on December 19, 2017 in June 2019 and the exercise price changed from $140.60 to $135.60 per share. The modification did not cause any incremental fair value granted.
CHIEF modified the plan terms of stock options granted on December 19, 2017 in June and August 2018 and the exercise price changed from $147.00 to $144.10 and $140.60 per share, repectively. The modification did not cause any incremental fair value granted.
Information about CHIEF’s outstanding stock options for the years ended December 31, 2019 and 2018 was as follows:
| Year Ended December 31, 2019 | ||||||||||||||||||||||||
| Granted on October 31, 2018 | Granted on December 19, 2017 | Granted on October 22, 2015 | ||||||||||||||||||||||
Number of Options | Weighted Average Exercise Price (NT$) | Number of Options | Weighted Average Exercise Price (NT$) | Number of Options | Weighted Average Exercise Price (NT$) | |||||||||||||||||||
Employee stock options | ||||||||||||||||||||||||
Options outstanding at beginning of the year | 50.00 | $ | 147.00 | 925.00 | $ | 140.60 | 882.75 | $ | 34.40 | |||||||||||||||
Options exercised | — | — | — | — | (547.25 | ) | 34.40 | |||||||||||||||||
Options forfeited | (4.00 | ) | — | (28.00 | ) | — | (21.25 | ) | — | |||||||||||||||
|
|
|
|
|
| |||||||||||||||||||
Options outstanding at end of the year | 46.00 | 141.70 | 897.00 | 135.60 | 314.25 | 34.40 | ||||||||||||||||||
|
|
|
|
|
| |||||||||||||||||||
Options exercisable at end of the year | — | — | 448.50 | 135.60 | 314.25 | 34.40 | ||||||||||||||||||
|
|
|
|
|
| |||||||||||||||||||
- 82 -
| Year Ended December 31, 2018 | ||||||||||||||||||||||||
| Granted on October 31, 2018 | Granted on December 19, 2017 | Granted on October 22, 2015 | ||||||||||||||||||||||
Number of Options | Weighted Average Exercise Price (NT$) | Number of Options | Weighted Average Exercise Price (NT$) | Number of Options | Weighted Average Exercise Price (NT$) | |||||||||||||||||||
Employee stock options | ||||||||||||||||||||||||
Options outstanding at beginning of the year | — | $ | — | 950.00 | $ | 147.00 | 1,936.00 | $ | 34.40 | |||||||||||||||
Options granted | 50.00 | 147.00 | — | — | — | — | ||||||||||||||||||
Options exercised | — | — | — | — | (1,027.25 | ) | 34.40 | |||||||||||||||||
Options forfeited | — | — | (25.00 | ) | — | (26.00 | ) | — | ||||||||||||||||
|
|
|
|
|
| |||||||||||||||||||
Options outstanding at end of the year | 50.00 | 147.00 | 925.00 | 140.60 | 882.75 | 34.40 | ||||||||||||||||||
|
|
|
|
|
| |||||||||||||||||||
Options exercisable at end of the year | — | — | — | — | 416.50 | 34.40 | ||||||||||||||||||
|
|
|
|
|
| |||||||||||||||||||
As of December 31, 2019, information about employee stock options outstanding was as follows:
Granted on October 31, 2018 | ||||||||||
Options Outstanding | Options Exercisable | |||||||||
Range of Exercise Price (NT$) | Number of Options | Weighted Average Remaining Life (Years) | Weighted Average Exercise Price (NT$) | Number of Options | Weighted Average Exercise Price (NT$) | |||||
$141.70 | 46.00 | 3.83 | $141.70 | — | $— | |||||
Granted on December 19, 2017 | ||||||||||
Options Outstanding | Options Exercisable | |||||||||
Range of Exercise Price (NT$) | Number of Options | Weighted Average Remaining Life (Years) | Weighted Average Exercise Price (NT$) | Number of Options | Weighted Average Exercise Price (NT$) | |||||
$135.60 | 897.00 | 2.96 | $135.60 | 448.50 | $135.60 | |||||
Granted on October 22, 2015 | ||||||||||
Options Outstanding | Options Exercisable | |||||||||
Range of Exercise Price (NT$) | Number of Options | Weighted Average Remaining Life (Years) | Weighted Average Exercise Price (NT$) | Number of Options | Weighted Average Exercise Price (NT$) | |||||
$34.40 | 314.25 | 0.81 | $34.40 | 314.25 | $34.40 | |||||
- 83 -
As of December 31, 2018, information about employee stock options outstanding was as follows:
Granted on October 31, 2018 | ||||||||||
Options Outstanding | Options Exercisable | |||||||||
Range of Exercise Price (NT$) | Number of Options | Weighted Average Remaining Life (Years) | Weighted Average Exercise Price (NT$) | Number of Options | Weighted Average Exercise Price (NT$) | |||||
$147.00 | 50.00 | 4.83 | $147.00 | — | $— | |||||
Granted on December 19, 2017 | ||||||||||
Options Outstanding | Options Exercisable | |||||||||
Range of Exercise Price (NT$) | Number of Options | Weighted Average Remaining Life (Years) | Weighted Average Exercise Price (NT$) | Number of Options | Weighted Average Exercise Price (NT$) | |||||
| $140.60 | 925.00 | 3.96 | $140.60 | — | $— | |||||
Granted on October 22, 2015 | ||||||||||
Options Outstanding | Options Exercisable | |||||||||
Range of Exercise Price (NT$) | Number of Options | Weighted Average Remaining Life (Years) | Weighted Average Exercise Price (NT$) | Number of Options | Weighted Average Exercise Price (NT$) | |||||
| $34.40 | 882.75 | 1.81 | $34.40 | 416.50 | $34.40 | |||||
CHIEF used the fair value method to evaluate the options using the Black-Scholes model and binomial option pricing model and the related assumptions and the fair value of the options were as follows:
| Stock Options Granted on October 31, 2018 | Stock Options Granted on December 19, 2017 | Stock Options Granted on October 22, 2015 | ||||||||||
Grant-date share price (NT$) | $ | 166.00 | $ | 95.92 | $ | 39.55 | ||||||
Exercise price (NT$) | $ | 147.00 | $ | 147.00 | $ | 43.00 | ||||||
Dividends yield | — | — | — | |||||||||
Risk-free interest rate | 0.72 | % | 0.62 | % | 0.86 | % | ||||||
Expected life | 5 years | 5 years | 5 years | |||||||||
Expected volatility | 16.60 | % | 17.35 | % | 21.02 | % | ||||||
Weighted average fair value of grants (NT$) | $ | 33,540 | $ | 2,318 | $ | 4,863 | ||||||
Expected volatility was based on the average annualized historical share price volatility of CHIEF’s comparable companies before the grant date.
- 84 -
| d. | New shares reserved for subscription by employees under cash injection of CHIEF |
In March 2018, the Board of Directors of CHIEF approved the cash injection to issue 7,842 thousand shares and simultaneously reserved 1,176 thousand shares for subscription by employees according to the Company Act of the ROC. Furthermore, when the employees subscribed some shares or discarded their rights to subscribe shares, the Board of Directors of CHIEF authorized the chairman of the Board of Directors to contact specific people or group to subscribe.
The aforementioned options granted to employees are accounted for and measured at fair value of the grant date. No compensation cost was recognized for the year ended December 31, 2018.
CHIEF used the fair value method to evaluate the options granted to employees on May 22, 2018 using the Black-Scholes model and the related assumptions and the fair value of the options were as follows:
| Stock Options Granted on May 22, 2018 | ||||
Grant-date share price (NT$) | $ | 156.41 | ||
Exercise price (NT$) | $ | 170.00 | ||
Dividends yield | — | |||
Risk-free interest rate | 0.34 | % | ||
Expected life | 7 days | |||
Expected volatility | 14.33 | % | ||
Weighted average fair value of grants (NT$) | $ | — | ||
Expected volatility was based on the average annualized historical share price volatility of CHIEF’s comparable companies before the grant date.
| e. | CHTSC share-based compensation plan (“CHTSC Plan”) described as follows: |
The Board of Directors of CHTSC resolved to issue 4,500 options that are granted to specific employees that meet the vesting conditions on December 20, 2019. Each option is eligible to subscribe for one thousand common stocks when exercisable, and the exercisable price is $19.085. The CHTSC Plan has exercise price adjustment formula upon the changes in common stocks. The options of CHTSC Plan are valid for five years and the graded vesting schedule will vest one year after the grant date.
The compensation costs of stock options granted were $191 thousand for the year ended December 31, 2019.
- 85 -
Information about CHTSC’s outstanding stock options for the year ended December 31, 2019 was as follows:
| Year Ended December 31, 2019 | ||||||||
| Granted on December 20, 2019 | ||||||||
Number of Options | Weighted Average Exercise Price (NT$) | |||||||
Employee stock options | ||||||||
Options outstanding at beginning of the year | — | $ | — | |||||
Options granted | $ | 4,500 | 19.085 | |||||
|
| |||||||
Options outstanding at end of the year | 4,500 | 19.085 | ||||||
|
| |||||||
Options exercisable at end of the year | — | — | ||||||
|
| |||||||
As of December 31, 2019, information about employee stock options outstanding was as follows:
| Options Outstanding | Options Exercisable | |||||||||||||||||||
| Range of Exercise Price (NT$) | Number of Options | Weighted Average Remaining Contractual Life (Years) | Weighted Price | Number of Options | Weighted Price (NT$) | |||||||||||||||
| $19.085 | 4,500 | 4.97 | $ | 19.085 | — | $ | — | |||||||||||||
CHTSC used the fair value method to evaluate the options using the Black-Scholes model and the related assumptions and the fair value of the options were as follows:
| Stock Options Granted on December 20, 2019 | ||||
Grant-date share price (NT$) | $ | 20.17 | ||
Exercise price (NT$) | $ | 19.085 | ||
Dividends yield | 12.49 | % | ||
Risk-free interest rate | 0.54 | % | ||
Expected life | 5 years | |||
Expected volatility | 42.41 | % | ||
Weighted average fair value of grants (NT$) | $ | 2,470 | ||
Expected volatility was based on the average annualized historical share price volatility of CHTSC’s comparable companies before the grant date.
- 86 -
| 33. | CASH FLOW INFORMATION |
For the years ended December 31, 2019 and 2018, the Company entered into the followingnon-cash investing activities:
| Year Ended December 31 | ||||||||
| 2019 | 2018 | |||||||
Increase in property, plant and equipment | $ | 23,164,284 | $ | 27,979,440 | ||||
Changes in other payables | 1,001,573 | 570,489 | ||||||
|
|
|
| |||||
| $ | 24,165,857 | $ | 28,549,929 | |||||
|
|
|
| |||||
For the year ended December 31, 2019, changes in liabilities arising from financing activities, includingnon-cash transactions, were as follows:
Balance on January 1, | Cash Flows from | Changes inNon-Cash Transactions | Cash Flows from Operation | Balance on December | ||||||||||||||||||||
| 2019 | Activities | New Leases | Others | Paid | 31, 2019 | |||||||||||||||||||
Lease liabilities | $ | 10,340,057 | $ | (3,727,792 | ) | $ | 3,803,042 | $ | (572,251 | ) | $ | (84,918 | ) | $ | 9,758,138 | |||||||||
|
|
|
|
|
|
|
|
|
|
|
| |||||||||||||
| 34. | CAPITAL MANAGEMENT |
The Company manages its capital to ensure that entities in the Company will be able to continue as going concerns while maximizing the return to stakeholders through the optimization of the debt and equity balance.
The capital structure of the Company consists of debt of the Company and the equity attributable to the parent.
Some consolidated entities are required to maintain minimumpaid-in capital amount as prescribed by the applicable laws.
The management reviews the capital structure of the Company as needed. As part of this review, the management considers the cost of capital and the risks associated with each class of capital.
According to the management’s suggestion, the Company maintains a balanced capital structure through paying cash dividends, increasing its share capital, purchasing outstanding shares, and proceeds from new debt or repayment of debt.
| 35. | FINANCIAL INSTRUMENTS |
Fair Value Information
The fair value measurement guidance establishes a framework for measuring fair value and expands disclosure about fair value measurements. The standard describes a fair value hierarchy based on three levels of inputs that may be used to measure fair value. These levels are:
Level 1 fair value measurements: These measurements are those derived from quoted prices (unadjusted) in active markets for identical assets or liabilities.
- 87 -
Level 2 fair value measurements: These measurements are those derived from inputs other than quoted prices included within Level 1 that are observable for the asset or liability, either directly (i.e. as prices) or indirectly (i.e. derived from prices).
Level 3 fair value measurements: These measurements are those derived from valuation techniques that include inputs for the asset or liability that are not based on observable market data (unobservable inputs).
| a. | Financial instruments that are not measured at fair value but for which fair value is disclosed |
The Company considers that the carrying amounts of financial assets and liabilities not measured at fair value approximate their fair values or the fair values cannot be reliable estimated, no financial instruments need to be disclosed on balance sheet date.
| b. | Financial instruments that are measured at fair value on a recurring basis |
| December 31, 2019 | ||||||||||||||||
| Level 1 | Level 2 | Level 3 | Total | |||||||||||||
Financial assets at FVTPL | ||||||||||||||||
Derivatives | $ | — | $ | 53 | $ | — | $ | 53 | ||||||||
Listed stocks | 463 | — | — | 463 | ||||||||||||
Non-listed stocks | — | — | 778,105 | 778,105 | ||||||||||||
|
|
|
|
|
|
|
| |||||||||
| $ | 463 | $ | 53 | $ | 778,105 | $ | 778,621 | |||||||||
|
|
|
|
|
|
|
| |||||||||
Hedging financial assets | $ | — | $ | 327 | $ | — | $ | 327 | ||||||||
|
|
|
|
|
|
|
| |||||||||
Financial assets at FVOCI | ||||||||||||||||
Equity investment | $ | 2,453,616 | $ | — | $ | 4,815,301 | $ | 7,268,917 | ||||||||
|
|
|
|
|
|
|
| |||||||||
Financial liabilities at FVTPL | ||||||||||||||||
Derivatives | $ | — | $ | 239 | $ | — | $ | 239 | ||||||||
|
|
|
|
|
|
|
| |||||||||
| December 31, 2018 | ||||||||||||||||
| Level 1 | Level 2 | Level 3 | Total | |||||||||||||
Financial assets at FVTPL | ||||||||||||||||
Non-listed stocks | $ | — | $ | — | $ | 517,362 | $ | 517,362 | ||||||||
|
|
|
|
|
|
|
| |||||||||
Hedging financial assets | $ | — | $ | 1,069 | $ | — | $ | 1,069 | ||||||||
|
|
|
|
|
|
|
| |||||||||
Financial assets at FVOCI | ||||||||||||||||
Equity investment | $ | 2,899,843 | $ | — | $ | 4,032,660 | $ | 6,932,503 | ||||||||
|
|
|
|
|
|
|
| |||||||||
Financial liabilities at FVTPL | ||||||||||||||||
Derivatives | $ | — | $ | 1,114 | $ | — | $ | 1,114 | ||||||||
|
|
|
|
|
|
|
| |||||||||
There were no transfers between Levels 1 and 2 for the years ended December 31, 2019 and 2018.
- 88 -
The reconciliations for financial assets measured at Level 3 are listed below:
2019
| Financial Assets | Measured at Fair Value through Profit or Loss | Measured at Fair Value through Other Comprehensive Income | Total | |||||||||
Balance at January 1, 2019 | $ | 517,362 | $ | 4,032,660 | $ | 4,550,022 | ||||||
Acquisition | 300,000 | — | 300,000 | |||||||||
Recognized in profit or loss under “Other gains and losses” | (39,257 | ) | — | (39,257 | ) | |||||||
Recognized in other comprehensive income under “Unrealized gain or loss on investments in equity instruments at fair value through other comprehensive income” | — | 791,808 | 791,808 | |||||||||
Proceed from return of investments | — | (9,167 | ) | (9,167 | ) | |||||||
|
|
|
|
|
| |||||||
Balance at December 31, 2019 | $ | 778,105 | $ | 4,815,301 | $ | 5,593,406 | ||||||
|
|
|
|
|
| |||||||
Unrealized loss in 2019 | $ | (39,257 | ) | |||||||||
|
| |||||||||||
2018
| Financial Assets | Measured at Fair Value through Profit or Loss | Measured at Fair Value through Other Comprehensive Income | Total | |||||||||
Balance at January 1, 2018 | $ | 542,521 | $ | 3,925,129 | $ | 4,467,650 | ||||||
Acquisition | — | 289,580 | 289,580 | |||||||||
Recognized in profit or loss under “Other gains and losses” | (25,159 | ) | — | (25,159 | ) | |||||||
Recognized in other comprehensive income under “Unrealized gain or loss on investments in equity instruments at fair value through other comprehensive income” | — | (175,359 | ) | (175,359 | ) | |||||||
Proceed from return of investments | — | (6,690 | ) | (6,690 | ) | |||||||
|
|
|
|
|
| |||||||
Balance at December 31, 2018 | $ | 517,362 | $ | 4,032,660 | $ | 4,550,022 | ||||||
|
|
|
|
|
| |||||||
Unrealized loss in 2018 | $ | (25,159 | ) | |||||||||
|
| |||||||||||
The fair values of financial assets and financial liabilities of Level 2 are determined as follows:
| 1) | The fair values of financial assets and financial liabilities with standard terms and conditions and traded in active markets are determined with reference to quoted market prices. |
| 2) | For derivatives, fair values are estimated using discounted cash flow model. Future cash flows are estimated based on observable inputs including forward exchange rates at the end of the reporting periods and the forward and spot exchange rates stated in the contracts, discounted at a rate that reflects the credit risk of various counterparties. |
- 89 -
The fair values of non-listed domestic and foreign equity investments were Level 3 financial assets, and determined using the market approach by reference thePrice-to-Book ratios (P/B ratios) of peer companies that traded in active market or using assets approach. The significant unobservable inputs used were listed in the table below. A decrease in discount for the lack of marketability or noncontrolling interests discount would result in increases in the fair values.
December 31, 2019 | December 31, 2018 | |||||
Discount for lack of marketability | 13.73%-20.00 | % | 12.73%-20.00% | |||
Noncontrolling interests discount | 21.45%-25.00 | % | 24.41%-25.00% | |||
If the inputs to the valuation model were changed to reflect reasonably possible alternative assumptions while all the other variables were held constant, the fair values of equity investments would increase as below table. When related discounts increase, the fair value of equity investments would be the negative amount of the same amount.
| December 31, 2019 | December 31, 2018 | |||||||
Discount for lack of marketability | ||||||||
5% decrease | $ | 349,584 | $ | 268,085 | ||||
Noncontrolling interests discount | ||||||||
5% decrease | $ | 53,646 | $ | 36,527 | ||||
Categories of Financial Instruments
| December 31 | ||||||||
| 2019 | 2018 | |||||||
Financial assets | ||||||||
Measured at FVTPL | ||||||||
Mandatorily measured at FVTPL | $ | 778,621 | $ | 517,362 | ||||
Hedging financial assets | 327 | 1,069 | ||||||
Financial assets at amortized cost (Note a) | 71,851,933 | 70,240,962 | ||||||
Financial assets at FVOCI | 7,268,917 | 6,932,503 | ||||||
Financial liabilities | ||||||||
Measured at FVTPL | ||||||||
Held for trading | 239 | 1,114 | ||||||
Measured at amortized cost (Note b) | 34,433,210 | 40,335,289 | ||||||
| Note a: | The balances included cash and cash equivalents, trade notes and accounts receivable, receivables from related parties, other current monetary assets and refundable deposits (classified as other noncurrent assets), which were financial assets measured at amortized cost. |
| Note b: | The balances included short-term loans, trade notes and accounts payable, payables to related parties, partial other payables, customers’ deposits and long-term loans which were financial liabilities carried at amortized cost. |
- 90 -
Financial Risk Management Objectives
The main financial instruments of the Company include equity investments, trade notes and accounts receivable, trade notes and accounts payable, lease liabilities and loans. The Company’s Finance Department provides services to its business units,co-ordinates access to domestic and international capital markets, monitors and manages the financial risks relating to the operations of the Company through internal risk reports which analyze exposures by degree and magnitude of risks. These risks include market risk (including foreign currency risk, interest rate risk and other price risk), credit risk, and liquidity risk.
The Company seeks to minimize the effects of these risks by using derivative financial instruments to hedge risk exposures. The use of financial derivatives is governed by the Company’s policies approved by the Board of Directors. Those derivatives are used to hedge the risks of exchange rate fluctuation arising from operating or investment activities. Compliance with policies and risk exposure limits is reviewed by the Company’s Finance Department on a continuous basis. The Company does not enter into or trade financial instruments, including derivative financial instruments, for speculative purposes.
Chunghwa reports the significant risk exposures and related action plans timely and actively to the audit committee and if needed to the Board of Directors.
| a. | Market risk |
The Company is exposed to market risks of changes in foreign currency exchange rates and interest rates. The Company uses forward exchange contracts to hedge the exchange rate risk arising from assets and liabilities denominated in foreign currencies.
There were no changes to the Company’s exposure to market risks or the manner in which these risks are managed and measured.
| 1) | Foreign currency risk |
The carrying amounts of the Company’s foreign currency denominated monetary assets and monetary liabilities at the balance sheet dates were as follows:
| December 31 | ||||||||
| 2019 | 2018 | |||||||
Assets | ||||||||
USD | $ | 5,781,593 | $ | 5,903,025 | ||||
EUR | 11,792 | 34,059 | ||||||
SGD | 224,501 | 123,916 | ||||||
JPY | 17,092 | 16,689 | ||||||
RMB | 8,854 | 2,082 | ||||||
Liabilities | ||||||||
USD | 4,120,881 | 6,998,564 | ||||||
EUR | 206,447 | 1,216,812 | ||||||
SGD | 1,262,926 | 50,921 | ||||||
JPY | 14,206 | 13,968 | ||||||
RMB | 310 | — | ||||||
- 91 -
The carrying amounts of the Company’s derivatives with exchange rate risk exposures at the balance sheet dates were as follows:
| December 31 | ||||||||
| 2019 | 2018 | |||||||
Assets | ||||||||
USD | $ | 53 | $ | — | ||||
EUR | 327 | 1,069 | ||||||
Liabilities | ||||||||
USD | 11 | 217 | ||||||
EUR | 228 | 897 | ||||||
Foreign currency sensitivity analysis
The Company is mainly exposed to the fluctuations of the currencies USD, EUR, SGD, JPY and RMB as listed above.
The following table details the Company’s sensitivity to a 5% increase and decrease in the functional currency against the relevant foreign currencies. 5% is the sensitivity rate used when reporting foreign currency risk internally to key management personnel and represents management’s assessment of the reasonably possible changes in foreign exchange rates. The sensitivity analysis includes only outstanding foreign currency denominated monetary items and forward exchange contracts. A positive number below indicates an increase inpre-tax profit or equity where the functional currency weakens 5% against the relevant currency.
| Year Ended December 31 | ||||||||
| 2019 | 2018 | |||||||
Profit or loss | ||||||||
Monetary assets and liabilities (a) | ||||||||
USD | $ | 83,036 | $ | (54,777 | ) | |||
EUR | (9,733 | ) | (59,138 | ) | ||||
SGD | (51,921 | ) | 3,650 | |||||
JPY | 144 | 136 | ||||||
RMB | 427 | 104 | ||||||
Derivatives (b) | ||||||||
USD | 1,274 | 3,102 | ||||||
EUR | 2,519 | 9,595 | ||||||
Equity | ||||||||
Derivatives (c) | ||||||||
EUR | 4,195 | 8,644 | ||||||
| a) | This is mainly attributable to the exposure to foreign currency denominated receivables and payables of the Company outstanding at the balance sheet dates. |
| b) | This is mainly attributable to forward exchange contracts. |
| c) | This is mainly attributable to the changes in the fair value of derivatives that are designated as cash flow hedges. |
For a 5% strengthening of the functional currency against the relevant currencies, there would be an equal and opposite effect on thepre-tax profit or equity for the amounts shown above.
- 92 -
| 2) | Interest rate risk |
The carrying amounts of the Company’s exposures to interest rates on financial assets and financial liabilities at the balance sheet dates were as follows:
| Year Ended December 31 | ||||||||
| 2019 | 2018 | |||||||
Fair value interest rate risk | ||||||||
Financial assets | $ | 30,946,503 | $ | 25,821,638 | ||||
Financial liabilities | 9,758,138 | — | ||||||
Cash flow interest rate risk | ||||||||
Financial assets | 7,681,032 | 9,160,863 | ||||||
Financial liabilities | 1,690,000 | 1,700,000 | ||||||
Interest rate sensitivity analysis
The sensitivity analyses below have been determined based on the exposure to interest rates fornon-derivative instruments at the end of the reporting period. A 25 basis point increase or decrease is used when reporting interest rate risk internally to key management personnel and represents management’s assessment of the reasonably possible change in interest rates.
If interest rates had been 25 basis points higher/lower and all other variables were held constant, the Company’spre-tax income would increase/decrease by $14,978 thousand and $18,652 thousand for the years ended December 31, 2019 and 2018, respectively. This is mainly attributable to the Company’s exposure to floating interest rates on its financial assets and short-term and long-term loan.
| 3) | Other price risk |
The Company is exposed to equity price risks arising from holding other company’s equity. Equity investments are held for strategic rather than trading purposes. The management managed the risk through holding various risk portfolios. Further, the Company assigned finance and investment departments to monitor the price risk.
Equity price sensitivity analysis
The sensitivity analyses below have been determined based on the exposure to equity price risks at the end of the reporting period.
If equity prices had been 5% higher/lower,pre-tax profit andpre-tax other comprehensive income for the year ended December 31, 2019 would have increased/decreased by $38,928 thousand and $363,446 thousand as a result of the changes in fair value of financial assets at FVTPL and financial assets at FVTOCI, respectively. If equity prices had been 5% higher/lower,pre-tax profit andpre-tax other comprehensive income for the year ended December 31, 2018 would have increased/decreased by $25,868 thousand and $346,625 thousand as a result of the changes in fair value of financial assets at FVTPL and financial assets at FVTOCI, respectively.
| b. | Credit risk |
Credit risk refers to the risk that a counterparty would default on its contractual obligations resulting in financial loss to the Company. The maximum credit exposure of the aforementioned financial instruments is equal to their carrying amounts recognized in consolidated balance sheet as of the balance sheet date.
- 93 -
The Company has large trade receivables outstanding with its customers. A substantial majority of the Company’s outstanding trade receivables are not covered by collateral or credit insurance. The Company has implemented ongoing measures including enhancing credit assessments and strengthening overall risk management to reduce its credit risk. While the Company has procedures to monitor and limit exposure to credit risk on trade receivables, there can be no assurance such procedures will effectively limit its credit risk and avoid losses. This risk is heightened during periods when economic conditions worsen.
As the Company serves a large number of unrelated consumers, the concentration of credit risk was limited.
| c. | Liquidity risk |
The Company manages and maintains sufficient cash and cash equivalent position to support the operations and reduce the impact on fluctuation of cash flow.
| 1) | Liquidity and interest risk tables |
The following tables detailed the Company’s remaining contractual maturity for itsnon-derivative financial liabilities with agreed repayment periods. The tables had been drawn up based on the undiscounted cash flows of financial liabilities based on the earliest date on which the Company is required to pay.
December 31, 2019
Weighted | Less than 1 Month | 1-3 Months | 3 Months to 1 Year | 1-5 Years | Add More than 5 Years | Total | ||||||||||||||||||||||
December 31, 2019 | ||||||||||||||||||||||||||||
Non-derivative financial liabilities | ||||||||||||||||||||||||||||
Non-interest bearing | — | $ | 36,387,024 | $ | — | $ | 2,531,721 | $ | 4,747,644 | $ | — | $ | 43,666,389 | |||||||||||||||
Floating interest rate instruments | 0.98 | 50,000 | 10,000 | 30,000 | 1,600,000 | — | 1,690,000 | |||||||||||||||||||||
|
|
|
|
|
|
|
|
|
|
|
| |||||||||||||||||
| $ | 36,437,024 | $ | 10,000 | $ | 2,561,721 | $ | 6,347,644 | $ | — | $ | 45,356,389 | |||||||||||||||||
|
|
|
|
|
|
|
|
|
|
|
| |||||||||||||||||
Information about the maturity analysis for lease liabilities was as follows:
| Less than 1 Year | 1-3 Years | 3-5 Years | More than 5 Years | Total | ||||||||||||||||
Lease liabilities | $ | 3,309,578 | $ | 4,394,009 | $ | 1,581,034 | $ | 645,520 | $ | 9,930,141 | ||||||||||
|
|
|
|
|
|
|
|
|
| |||||||||||
December 31, 2018
Weighted | Less than 1 Month | 1-3 Months | 3 Months to 1 Year | 1-5 Years | Add More than 5 Years | Total | ||||||||||||||||||||||
December 31, 2018 | ||||||||||||||||||||||||||||
Non-derivative financial liabilities | ||||||||||||||||||||||||||||
Non-interest bearing | — | $ | 41,808,326 | $ | — | $ | 2,889,800 | $ | 4,716,571 | $ | — | $ | 49,414,697 | |||||||||||||||
Floating interest rate instruments | 0.98 | — | — | 100,000 | 1,600,000 | — | 1,700,000 | |||||||||||||||||||||
|
|
|
|
|
|
|
|
|
|
|
| |||||||||||||||||
| $ | 41,808,326 | $ | — | $ | 2,989,800 | $ | 6,316,571 | $ | — | $ | 51,114,697 | |||||||||||||||||
|
|
|
|
|
|
|
|
|
|
|
| |||||||||||||||||
- 94 -
The following table detailed the Company’s liquidity analysis for its derivative financial instruments. The table had been drawn up based on the undiscounted gross inflows and outflows on those derivatives that require gross settlement.
| Less than 1 Month | 1-3 Months | 3 Months to 1 Year | 1-5 Years | Total | ||||||||||||||||
December 31, 2019 | ||||||||||||||||||||
Gross settled | ||||||||||||||||||||
Forward exchange contracts | ||||||||||||||||||||
Inflow | $ | 25,566 | $ | 135,075 | $ | — | $ | — | $ | 160,641 | ||||||||||
Outflow | 25,524 | 134,976 | — | — | 160,500 | |||||||||||||||
|
|
|
|
|
|
|
|
|
| |||||||||||
| $ | 42 | $ | 99 | $ | — | $ | — | $ | 141 | |||||||||||
|
|
|
|
|
|
|
|
|
| |||||||||||
December 31, 2018 | ||||||||||||||||||||
Gross settled | ||||||||||||||||||||
Forward exchange contracts | ||||||||||||||||||||
Inflow | $ | 62,035 | $ | 238,302 | $ | 126,401 | $ | — | $ | 426,738 | ||||||||||
Outflow | 62,252 | 238,459 | 126,072 | — | 426,783 | |||||||||||||||
|
|
|
|
|
|
|
|
|
| |||||||||||
| $ | (217 | ) | $ | (157 | ) | $ | 329 | $ | — | $ | (45 | ) | ||||||||
|
|
|
|
|
|
|
|
|
| |||||||||||
| 2) | Financing facilities |
| December 31 | ||||||||
| 2019 | 2018 | |||||||
Unsecured bank loan facility | ||||||||
Amount used | $ | 120,681 | $ | 132,445 | ||||
Amount unused | 46,109,219 | 46,328,280 | ||||||
|
|
|
| |||||
| $ | 46,229,900 | $ | 46,460,725 | |||||
|
|
|
| |||||
Secured bank loan facility | ||||||||
Amount used | $ | 1,600,000 | $ | 1,600,000 | ||||
Amount unused | 1,340,000 | 1,340,000 | ||||||
|
|
|
| |||||
| $ | 2,940,000 | $ | 2,940,000 | |||||
|
|
|
| |||||
| 36. | RELATED PARTIES TRANSACTIONS |
The ROC Government, one of Chunghwa’s customers, has significant equity interest in Chunghwa. Chunghwa provides fixed-line services, wireless services, internet and data and other services to the various departments and institutions of the ROC Government in the normal course of business and atarm’s-length prices. The transactions with the ROC government bodies have not been disclosed because the transactions are not individually or collectively significant. However, the related revenues and operating costs have been appropriately recorded.
- 95 -
| a. | The Company engages in business transactions with the following related parties: |
Company | Relationship | |
Taiwan International Standard Electronics Co., Ltd. | Associate | |
So-net Entertainment Taiwan Limited | Associate | |
KKBOX Taiwan Co., Ltd. | Associate | |
KingwayTek Technology Co., Ltd. | Associate | |
UUPON Inc. | Associate | |
Taiwan International Ports Logistics Corporation | Associate | |
International Integrated System, Inc. | Associate | |
Senao Networks, Inc. | Associate | |
EnRack Technology Inc. | Subsidiary of the Company’s associate, Senao Networks, Inc. | |
Emplus Technologies, Inc. | Subsidiary of the Company’s associate, Senao Networks, Inc. | |
ST-2 Satellite Ventures Pte., Ltd. | Associate | |
| Viettel-CHT Co., Ltd. | Associate | |
Click Force Co., Ltd. | Associate | |
Alliance Digital Tech Co., Ltd. | Associate | |
MeWorks Limited (HK) | Associate | |
Chunghwa PChome Fund I Co., Ltd. (“CPFI”) | Associate | |
Cornerstone Ventures Co., Ltd. (“CVC”) | Associate | |
Next Commercial Bank Co., Ltd. (preparatory office) (“NCB”) | Associate | |
Other related parties | ||
Chunghwa Telecom Foundation | A nonprofit organization of which the funds donated by Chunghwa exceeds one third of its total funds | |
Senao Technical and Cultural Foundation | A nonprofit organization of which the funds donated by SENAO exceeds one third of its total funds | |
Sochamp Technology Co., Ltd. | Investor of significant influence over CHST | |
E-Life Mall Co., Ltd. | One of the directors ofE-Life Mall and a director of SENAO are members of an immediate family | |
Engenius Technologies Co., Ltd. | Chairman of Engenius Technologies Co., Ltd. is a member of SENAO’s management | |
Cheng Keng Investment Co., Ltd. | Chairman of Cheng Keng Investment Co., Ltd. and SENAO’s chief executive officer are members of an immediate family | |
Cheng Feng Investment Co., Ltd. | Chairman of Cheng Feng Investment Co., Ltd. and SENAO’s chief executive officer are members of an immediate family | |
All Oriented Investment Co., Ltd. | Chairman of All Oriented Investment Co., Ltd. and SENAO’s chief executive officer are members of an immediate family | |
Hwa Shun Investment Co., Ltd. | Chairman of Hwa Shun Investment Co., Ltd. and SENAO’s chief executive officer are members of an immediate family | |
Yu Yu Investment Co., Ltd. | Chairman of Yu Yu Investment Co., Ltd. and SENAO’s chief executive officer are members of an immediate family | |
United Daily News Co., Ltd. | Investor of significant influence over SFD | |
Shenzhen Century Communication Co., Ltd. | Investor of significant influence over SCT |
- 96 -
| b. | Balances and transactions between Chunghwa and its subsidiaries, which are related parties of Chunghwa, have been eliminated on consolidation and are not disclosed in this note. Terms of the foregoing transactions with related parties were not significantly different from transactions withnon-related parties. When no similar transactions withnon-related parties can be referenced, terms were determined in accordance with mutual agreements. Details of transactions between the Company and other related parties are disclosed below: |
| 1) | Operating transactions |
| Revenues | ||||||||
| Year Ended December 31 | ||||||||
| 2019 | 2018 | |||||||
Associates | $ | 273,892 | $ | 344,043 | ||||
Others | 76,559 | 94,227 | ||||||
|
|
|
| |||||
| $ | 350,451 | $ | 438,270 | |||||
|
|
|
| |||||
| Operating Costs and Expenses | ||||||||
| Year Ended December 31 | ||||||||
| 2019 | 2018 | |||||||
Associates | $ | 963,627 | $ | 1,304,008 | ||||
Others | 76,153 | 75,345 | ||||||
|
|
|
| |||||
| $ | 1,039,780 | $ | 1,379,353 | |||||
|
|
|
| |||||
| 2) | Non-operating transactions |
| Non-operating Income and Expenses | ||||||||
| Year Ended December 31 | ||||||||
| 2019 | 2018 | |||||||
Associates | $ | 41,373 | $ | 31,255 | ||||
Others | 3,470 | 32 | ||||||
|
|
|
| |||||
| $ | 44,843 | $ | 31,287 | |||||
|
|
|
| |||||
| 3) | Receivables |
| December 31 | ||||||||
| 2019 | 2018 | |||||||
Associates | $ | 10,356 | $ | 10,785 | ||||
Others | 6,478 | 13,485 | ||||||
|
|
|
| |||||
| $ | 16,834 | $ | 24,270 | |||||
|
|
|
| |||||
- 97 -
| 4) | Payables |
| December 31 | ||||||||
| 2019 | 2018 | |||||||
Associates | $ | 650,617 | $ | 914,177 | ||||
Others | 3,366 | 3,774 | ||||||
|
|
|
| |||||
| $ | 653,983 | $ | 917,951 | |||||
|
|
|
| |||||
| 5) | Customers’ deposits |
| December 31 | ||||||||
| 2019 | 2018 | |||||||
Associates | $ | 7,595 | $ | 5,925 | ||||
|
|
|
| |||||
| 6) | Acquisition of property, plant and equipment |
| Year Ended December 31 | ||||||||
| 2019 | 2018 | |||||||
Associates | $ | 241,626 | $ | 311,519 | ||||
Others | 182 | — | ||||||
|
|
|
| |||||
| $ | 241,808 | $ | 311,519 | |||||
|
|
|
| |||||
| 7) | Lease-in agreements |
Chunghwa entered into a contract withST-2 Satellite Ventures Pte., Ltd. on March 12, 2010 to lease capacity on theST-2 satellite. This lease term is for 15 years which should start from the official operation ofST-2 satellite and the total contract value is approximately $6,000,000 thousand (SG$260,723 thousand), including a prepayment of $3,067,711 thousand at the inception of the lease, and the rest of amount should be paid annually whenST-2 satellite starts its official operation.ST-2 satellite was launched in May 2011 and began its official operation in August 2011.
2019
The lease liabilities ofST-2 Satellite Ventures Pte., Ltd. as of December 31, 2019 was as follows:
| December 31, 2019 | ||||
Lease liabilities - current | $ | 188,271 | ||
Lease liabilities - noncurrent | 1,023,889 | |||
|
| |||
| $ | 1,212,160 | |||
|
| |||
The interest expense recognized for the aforementioned lease liabilities for the year ended December 31, 2019 was $10,887 thousand.
- 98 -
2018
The total rental expense for the year ended December 31, 2018 was $394,289 thousand, which consisted of an offsetting credit of the prepayment of $204,398 thousand and an additional accrual of $189,891 thousand. The prepaid rents (classified as prepayments) as of December 31, 2018, was as follows:
| December 31, 2018 | ||||
Prepaid rents - current | $ | 204,398 | ||
Prepaid rents - noncurrent | 1,345,623 | |||
|
| |||
| $ | 1,550,021 | |||
|
| |||
| c. | Compensation of key management personnel |
The compensation of directors and key management personnel was as follows:
| Year Ended December 31 | ||||||||
| 2019 | 2018 | |||||||
Short-term employee benefits | $ | 263,383 | $ | 281,981 | ||||
Post-employment benefits | 8,560 | 9,971 | ||||||
Share-based payment | 355 | 9,484 | ||||||
|
|
|
| |||||
| $ | 272,298 | $ | 301,436 | |||||
|
|
|
| |||||
The compensation of directors and key management personnel was mainly determined by the compensation committee having regard to the performance of individual and market trends.
| 37. | PLEDGED ASSETS |
The following assets are pledged as collaterals for bank loans and custom duties of the imported materials.
| December 31 | ||||||||
| 2019 | 2018 | |||||||
Property, plant and equipment | $ | 2,491,324 | $ | 2,520,838 | ||||
Land held under development (included in inventories) | 1,998,733 | 1,998,733 | ||||||
Restricted assets (included in other assets - others) | 2,500 | 2,500 | ||||||
|
|
|
| |||||
| $ | 4,492,557 | $ | 4,522,071 | |||||
|
|
|
| |||||
| 38. | SIGNIFICANT CONTINGENT LIABILITIES AND UNRECOGNIZED COMMITMENTS |
As of December 31, 2019, the Company’s significant commitments and contingent liabilities, excluding those disclosed in other notes, were as follows:
| a. | Acquisitions of land and buildings of $43,614 thousand. |
| b. | Acquisitions of telecommunications equipment of $17,876,961 thousand. |
- 99 -
| c. | Unused letters of credit amounting to $50,000 thousand. |
| d. | A commitment to contribute $2,000,000 thousand to a Piping Fund administered by the Taipei City Government, of which $1,000,000 thousand was contributed by Chunghwa on August 15, 1996 (classified as other monetary assets—noncurrent). If the fund is not sufficient, Chunghwa will contribute the remaining $1,000,000 thousand upon notification from the Taipei City Government. |
| e. | Chunghwa committed that when its ownership interest in NCB is greater than 25% and NCB encounters financial difficulty or capital adequacy ratio of NCB cannot meet the related regulation requirements, the Company will provide financial support to assist NCB maintain in healthy financial condition. |
| f. | CHPT signed the contract for its headquarters construction amounted to $1,613,800 thousand in July 2017. The payment of $1,525,227 thousand has been made as of December 31, 2019. |
| 39. | SIGNIFICANT ASSETS AND LIABILITIES DENOMINATED IN FOREIGN CURRENCIES |
The following information summarizes the disclosure of the currency which is other than functional currency of Chunghwa and its subsidiaries. The following exchange rates are the exchange rates used to translate to the presentation currency in the consolidated financial statements, which is NTD:
| December 31, 2019 | ||||||||||||
| Foreign Currencies (Thousands) | Exchange Rate | New Taiwan Dollars (Thousands) | ||||||||||
Assets denominated in foreign currencies | ||||||||||||
Monetary items | ||||||||||||
USD | $ | 192,849 | 29.98 | $ | 5,781,593 | |||||||
EUR | 351 | 33.59 | 11,792 | |||||||||
SGD | 10,076 | 22.28 | 224,501 | |||||||||
JPY | 61,929 | 0.276 | 17,092 | |||||||||
RMB | 2,057 | 4.305 | 8,854 | |||||||||
Non-monetary items | ||||||||||||
Investments accounted for using equity method | ||||||||||||
SGD | 22,483 | 22.28 | 500,930 | |||||||||
VND | 270,542,735 | 0.0012 | 316,535 | |||||||||
Liabilities denominated in foreign currencies | ||||||||||||
Monetary items | ||||||||||||
USD | 137,454 | 29.98 | 4,120,881 | |||||||||
EUR | 6,146 | 33.59 | 206,447 | |||||||||
SGD | 56,685 | 22.28 | 1,262,926 | |||||||||
JPY | 51,472 | 0.276 | 14,206 | |||||||||
RMB | 72 | 4.305 | 310 | |||||||||
- 100 -
| December 31, 2018 | ||||||||||||
| Foreign Currencies (Thousands) | Exchange Rate | New Taiwan Dollars (Thousands) | ||||||||||
Assets denominated in foreign currencies | ||||||||||||
Monetary items | ||||||||||||
USD | $ | 192,187 | 30.72 | $ | 5,903,025 | |||||||
EUR | 968 | 35.20 | 34,059 | |||||||||
SGD | 5,512 | 22.48 | 123,916 | |||||||||
JPY | 60,034 | 0.278 | 16,689 | |||||||||
RMB | 466 | 4.472 | 2,082 | |||||||||
Non-monetary items | ||||||||||||
Investments accounted for using equity method | ||||||||||||
SGD | 22,066 | 22.48 | 496,033 | |||||||||
VND | 238,757,968 | 0.0012 | 286,510 | |||||||||
Liabilities denominated in foreign currencies | ||||||||||||
Monetary items | ||||||||||||
USD | 227,855 | 30.72 | 6,998,564 | |||||||||
EUR | 34,569 | 35.20 | 1,216,812 | |||||||||
SGD | 2,265 | 22.48 | 50,921 | |||||||||
JPY | 50,243 | 0.278 | 13,968 | |||||||||
The unrealized foreign exchange losses were $9,938 thousand and $7,872 thousand for the years ended December 31, 2019 and 2018, respectively. Due to the various foreign currency transactions and the functional currency of each individual entity of the Company, foreign exchange gains and losses cannot be disclosed by the respective significant foreign currency.
| 40. | ADDITIONAL DISCLOSURES |
Following are the additional disclosures required by the FSC for the Company:
| a. | Financing provided: None. |
| b. | Endorsement/guarantee provided: Please see Table 1. |
| c. | Marketable securities held (excluding investments in subsidiaries and associates: Please see Table 2. |
| d. | Marketable securities acquired and disposed of at costs or prices at least $300 million or 20% of thepaid-in capital: Please see Table 3. |
| e. | Acquisition of individual real estate at costs of at least $300 million or 20% of thepaid-in capital: Please see Table 4. |
| f. | Disposal of individual real estate at prices of at least $300 million or 20% of thepaid-in capital: None. |
| g. | Total purchases from or sales to related parties amounting to at least $100 million or 20% of the paid-in capital: Please see Table 5. |
- 101 -
| h. | Receivables from related parties amounting to $100 million or 20% of thepaid-in capital: Please see Table 6. |
| i. | Names, locations, and other information of investees on which the Company exercises significant influence (excluding investees in Mainland China): Please see Table 7. |
| j. | Derivative instruments transactions: Please see Notes 7, 20 and 35. |
| k. | Investment in Mainland China: Please see Table 8. |
| l. | Intercompany relationships and significant intercompany transaction: Please see Table 9. |
| 41. | SEGMENT INFORMATION |
The Company has the following reportable segments that provide different products or services. The reportable segments are managed separately because each segment represents a strategic business unit that serves different markets. Segment information is provided to CEO who allocates resources and assesses segment performance. The Company’s measure of segment performance is mainly based on revenues and income before income tax. The Company’s reportable segments are as follows:
| a. | Domestic fixed communications business - the provision of local telephone services, domestic long distance telephone services, broadband access, and related services; |
| b. | Mobile communications business - the provision of mobile services, sales of mobile handsets and data cards, and related services; |
| c. | Internet business - the provision of HiNet services and related services; |
| d. | International fixed communications business - the provision of international long distance telephone services and related services; |
| e. | Others - the provision of non-telecom services and the corporate related items not allocated to reportable segments. |
Some operating segments have been aggregated into a single operating segment taking into account the following factors: (a) similar economic characteristics such as long-term gross profit margins; (b) the nature of the telecommunications products and services are similar; (c) the nature of production processes of the telecommunications products and services are similar; (d) the type or class of customer for the telecommunications products and services are similar; and (e) the methods used to provide the services to the customers are similar.
There was no material differences between the accounting policies of the operating segments and the accounting policies described in Note 3.
- 102 -
Segment Revenues and Operating Results
Analysis by reportable segment of revenues and operating results of continuing operations was as follows:
| Domestic Fixed Communications Business | Mobile Communications Business | Internet Business | International Fixed Communications Business | Others | Total | |||||||||||||||||||
Year ended December 31, 2019 | ||||||||||||||||||||||||
Revenues | ||||||||||||||||||||||||
From external customers | $ | 65,727,627 | $ | 95,469,002 | $ | 30,090,758 | $ | 11,485,197 | $ | 4,747,477 | $ | 207,520,061 | ||||||||||||
Intersegment revenues | 16,065,223 | 1,563,685 | 3,950,832 | 2,078,889 | 4,914,694 | 28,573,323 | ||||||||||||||||||
|
|
|
|
|
|
|
|
|
|
|
| |||||||||||||
Segment revenues | $ | 81,792,850 | $ | 97,032,687 | $ | 34,041,590 | $ | 13,564,086 | $ | 9,662,171 | 236,093,384 | |||||||||||||
|
|
|
|
|
|
|
|
|
| |||||||||||||||
Intersegment elimination | (28,573,323 | ) | ||||||||||||||||||||||
|
| |||||||||||||||||||||||
Consolidated revenues | $ | 207,520,061 | ||||||||||||||||||||||
|
| |||||||||||||||||||||||
Segments operating costs and expenses | $ | 56,268,655 | $ | 72,952,530 | $ | 13,849,557 | $ | 11,427,554 | $ | 12,248,607 | $ | 166,746,903 | ||||||||||||
|
|
|
|
|
|
|
|
|
|
|
| |||||||||||||
Segment income (loss) before income tax | $ | 19,536,966 | $ | 11,249,716 | $ | 12,514,656 | $ | 799,078 | $ | (2,350,624 | ) | $ | 41,749,792 | |||||||||||
|
|
|
|
|
|
|
|
|
|
|
| |||||||||||||
Year ended December 31, 2018 | ||||||||||||||||||||||||
Revenues | ||||||||||||||||||||||||
From external customers | $ | 66,753,094 | $ | 100,937,021 | $ | 29,813,239 | $ | 13,434,422 | $ | 4,545,382 | $ | 215,483,158 | ||||||||||||
Intersegment revenues | 17,125,311 | 1,701,768 | 4,038,032 | 2,234,202 | 5,007,565 | 30,106,878 | ||||||||||||||||||
|
|
|
|
|
|
|
|
|
|
|
| |||||||||||||
Segment revenues | $ | 83,878,405 | $ | 102,638,789 | $ | 33,851,271 | $ | 15,668,624 | $ | 9,552,947 | 245,590,036 | |||||||||||||
|
|
|
|
|
|
|
|
|
| |||||||||||||||
Intersegment elimination | (30,106,878 | ) | ||||||||||||||||||||||
|
| |||||||||||||||||||||||
Consolidated revenues | $ | 215,483,158 | ||||||||||||||||||||||
|
| |||||||||||||||||||||||
Segments operating costs and expenses | $ | 59,430,120 | $ | 73,901,350 | $ | 13,765,723 | $ | 13,279,413 | $ | 11,573,344 | $ | 171,949,950 | ||||||||||||
|
|
|
|
|
|
|
|
|
|
|
| |||||||||||||
Segment income (loss) before income tax | $ | 18,243,503 | $ | 15,327,824 | $ | 11,943,594 | $ | 1,023,831 | $ | (1,560,048 | ) | $ | 44,978,704 | |||||||||||
|
|
|
|
|
|
|
|
|
|
|
| |||||||||||||
Other Segment Information
Other information reviewed by the chief operating decision maker or regularly provided to the chief operating decision maker was as follows:
| Domestic Fixed Communications Business | Mobile Communications Business | Internet Business | International Fixed Communications Business | Others | Total | |||||||||||||||||||
Year ended December 31, 2019 | ||||||||||||||||||||||||
Share of profits of associates accounted for using equity method | $ | — | $ | — | $ | — | $ | — | $ | 462,140 | $ | 462,140 | ||||||||||||
|
|
|
|
|
|
|
|
|
|
|
| |||||||||||||
Interest income | $ | 15,156 | $ | 8,688 | $ | 20,160 | $ | 40,937 | $ | 165,846 | $ | 250,787 | ||||||||||||
|
|
|
|
|
|
|
|
|
|
|
| |||||||||||||
Interest expenses | $ | 5,076 | $ | 58,081 | $ | 696 | $ | 11,501 | $ | 28,788 | $ | 104,142 | ||||||||||||
|
|
|
|
|
|
|
|
|
|
|
| |||||||||||||
Depreciation and amortization | $ | 14,841,890 | $ | 16,253,558 | $ | 2,914,375 | $ | 1,547,334 | $ | 791,928 | $ | 36,349,085 | ||||||||||||
|
|
|
|
|
|
|
|
|
|
|
| |||||||||||||
Capital expenditure | $ | 12,070,922 | $ | 7,773,266 | $ | 1,424,601 | $ | 1,116,541 | $ | 1,780,527 | $ | 24,165,857 | ||||||||||||
|
|
|
|
|
|
|
|
|
|
|
| |||||||||||||
Impairment loss on property, plant and equipment | $ | — | $ | — | $ | — | $ | — | $ | 93,073 | $ | 93,073 | ||||||||||||
|
|
|
|
|
|
|
|
|
|
|
| |||||||||||||
Reversal of impairment loss on investment properties | $ | 56,617 | $ | — | $ | — | $ | — | $ | — | $ | 56,617 | ||||||||||||
|
|
|
|
|
|
|
|
|
|
|
| |||||||||||||
Impairment loss on intangible assets | $ | — | $ | 8,946 | $ | — | $ | — | $ | — | $ | 8,946 | ||||||||||||
|
|
|
|
|
|
|
|
|
|
|
| |||||||||||||
Impairment loss on other assets | $ | 13,191 | $ | — | $ | 13,191 | $ | — | $ | 17,589 | $ | 43,971 | ||||||||||||
|
|
|
|
|
|
|
|
|
|
|
| |||||||||||||
Year ended December 31, 2018 | ||||||||||||||||||||||||
Share of profits of associates accounted for using equity method | $ | — | $ | — | $ | — | $ | — | $ | 501,600 | $ | 501,600 | ||||||||||||
|
|
|
|
|
|
|
|
|
|
|
| |||||||||||||
Interest income | $ | 17,535 | $ | 12,159 | $ | 19,123 | $ | 27,903 | $ | 120,169 | $ | 196,889 | ||||||||||||
|
|
|
|
|
|
|
|
|
|
|
| |||||||||||||
Interest expenses | $ | — | $ | 181 | $ | 191 | $ | — | $ | 17,224 | $ | 17,596 | ||||||||||||
|
|
|
|
|
|
|
|
|
|
|
| |||||||||||||
Depreciation and amortization | $ | 15,027,196 | $ | 13,788,352 | $ | 3,120,942 | $ | 1,424,530 | $ | 448,858 | $ | 33,809,878 | ||||||||||||
|
|
|
|
|
|
|
|
|
|
|
| |||||||||||||
Capital expenditure | $ | 12,692,526 | $ | 10,663,759 | $ | 2,729,512 | $ | 1,347,874 | $ | 1,116,258 | $ | 28,549,929 | ||||||||||||
|
|
|
|
|
|
|
|
|
|
|
| |||||||||||||
Reversal of impairment loss on investment properties | $ | 19,133 | $ | — | $ | — | $ | — | $ | — | $ | 19,133 | ||||||||||||
|
|
|
|
|
|
|
|
|
|
|
| |||||||||||||
Impairment loss on intangible assets | $ | — | $ | 50,750 | $ | — | $ | — | $ | — | $ | 50,750 | ||||||||||||
|
|
|
|
|
|
|
|
|
|
|
| |||||||||||||
- 103 -
Main Products and Service Revenues
| Year Ended December 31 | ||||||||
| 2019 | 2018 | |||||||
Mobile services revenue | $ | 58,703,003 | $ | 63,905,960 | ||||
Sales of products | 41,593,124 | 41,288,763 | ||||||
Local telephone and domestic long distance telephone services revenue | 27,929,263 | 29,995,695 | ||||||
Broadband access and domestic leased line services revenue | 22,115,908 | 22,453,133 | ||||||
Data Communications internet services revenue | 21,002,699 | 21,137,189 | ||||||
International network and leased telephone services revenue | 7,066,361 | 8,724,302 | ||||||
Others | 29,109,703 | 27,978,116 | ||||||
|
|
|
| |||||
| $ | 207,520,061 | $ | 215,483,158 | |||||
|
|
|
| |||||
Geographic Information
The users of the Company’s services are mainly from Taiwan, ROC. The revenues it derived outside Taiwan are mainly revenues from international long distance telephone and leased line services. The geographic information for revenues was as follows:
| Year Ended December 31 | ||||||||
| 2019 | 2018 | |||||||
Taiwan, ROC | $ | 197,895,254 | $ | 205,695,525 | ||||
Overseas | 9,624,807 | 9,787,633 | ||||||
|
|
|
| |||||
| $ | 207,520,061 | $ | 215,483,158 | |||||
|
|
|
| |||||
The Company has long-lived assets in U.S., Singapore, Hong Kong, China, Vietnam, Japan and Thailand for $4,063,468 thousand and $4,324,172 thousand at December 31, 2019 and 2018, respectively, in the aforementioned areas, the other long-lived assets are located in Taiwan, ROC.
Major Customers
As of December 31, 2019 and 2018, the Company did not have any single customer whose revenue exceeded 10% of the total revenues.
- 104 -
TABLE 1
CHUNGHWA TELECOM CO., LTD. AND SUBSIDIARIES
ENDORSEMENTS/GUARANTEES PROVIDED
YEAR ENDED DECEMBER 31, 2019
(Amounts in Thousands of New Taiwan Dollars)
No. (Note 1) | Endorsement/ | Guaranteed Party | Limits on Guarantee | Amount of Endorsement/ | Ratio of Accumulated Endorsement/ Guarantee to Net Equity | Maximum Endorsement/ | Endorsement/ Guarantee | Endorsement/ Guarantee | Endorsement/ Guarantee | |||||||||||||||||||||||||||||||||||||||||||
Name | Nature of Relationship (Note 2) | Each Guaranteed Party | Maximum Balance for the Period | Ending Balance | Actual Borrowing Amount | Guarantee Collateralized by Properties | Per Latest Financial Statements | Guarantee Amount Allowable | Parent on Behalf of Subsidiaries | Subsidiaries on Behalf of Parent | Companies in Mainland China | Note | ||||||||||||||||||||||||||||||||||||||||
1 | Senao International Co., Ltd. | Aval Technologies Co., Ltd. | b | $ | 584,817 | $ | 300,000 | $ | 300,000 | $ | 300,000 | $ | — | 5.13 | $ | 2,924,089 | Yes | No | No | Notes 3 and 4 | ||||||||||||||||||||||||||||||||
Wiin Technology Co., Ltd. | b | 584,817 | 100,000 | 100,000 | 100,000 | — | 1.71 | 2,924,089 | Yes | No | No | Notes 3 and 4 | ||||||||||||||||||||||||||||||||||||||||
| Note 1: | Significant transactions between the Company and its subsidiaries or among subsidiaries are numbered as follows: |
| a. | “0” for the Company. |
| b. | Subsidiaries are numbered from “1”. |
| Note 2: | Relationships between the endorsement/guarantee provider and the guaranteed party: |
| a. | A company with which it does business. |
| b. | A company in which the Company directly and indirectly holds more than 50 percent of the voting shares. |
| c. | A company that directly and indirectly holds more than 50 percent of the voting shares in the Company. |
| d. | Companies in which the Company holds, directly or indirectly, 90% or more of the voting shares. |
| e. | The Company fulfills its contractual obligations by providing mutual endorsements/guarantees for another company in the same industry or for joint builders for purposes of undertaking a construction project. |
| f. | All capital contributing shareholders make endorsements/guarantees for their jointly invested company in proportion to their shareholding percentages. |
| g. | Companies in the same industry provide among themselves joint and several security for a performance guarantee of a sales contract forpre-construction homes pursuant to the Consumer Protection Act for each other. |
| Note 3: | The limits on endorsement or guarantee amount provided to each guaranteed party is up to 10% of the net assets value of the latest financial statements of Senao International Co., Ltd. |
| Note 4: | The total amount of endorsement or guarantee that the Company is allowed to provide is up to 50% of the net assets value of the latest financial statements of Senao International Co., Ltd. |
- 105 -
TABLE 2
CHUNGHWA TELECOM CO., LTD. AND SUBSIDIARIES
MARKETABLE SECURITIES HELD
DECEMBER 31, 2019
(Amounts in Thousands of New Taiwan Dollars)
Held Company Name | Marketable Securities Type and Name | Relationship with the Company | Financial Statement Account | December 31, 2019 | Note | |||||||||||||||||||||||
| Shares (Thousands/ Thousand Units) | Carrying Value (Note 1) | Percentage of Ownership | Fair Value | |||||||||||||||||||||||||
Chunghwa Telecom Co., Ltd. | Stocks | |||||||||||||||||||||||||||
Taipei Financial Center Corp. | — | Financial assets at FVOCI | 172,927 | $ | 4,388,984 | 12 | $ | 4,388,984 | — | |||||||||||||||||||
Innovation Works Development Fund, L.P. | — | Financial assets at FVTPL - noncurrent | — | 267,304 | 4 | 267,304 | — | |||||||||||||||||||||
Industrial Bank of Taiwan II Venture Capital Co., Ltd. (IBT II) | — | Financial assets at FVOCI | 5,252 | 17,084 | 17 | 17,084 | — | |||||||||||||||||||||
Global Mobile Corp. | — | Financial assets at FVOCI | 7,617 | — | 3 | — | — | |||||||||||||||||||||
Innovation Works Limited | — | Financial assets at FVOCI | 1,000 | 4,078 | 2 | 4,078 | — | |||||||||||||||||||||
RPTI Intergroup International Ltd. | — | Financial assets at FVOCI | 4,765 | — | 10 | — | — | |||||||||||||||||||||
Taiwan mobile payment Co., Ltd. | — | Financial assets at FVOCI | 1,200 | 4,510 | 2 | 4,510 | — | |||||||||||||||||||||
Taiwania Capital Buffalo Fund Co., Ltd. | — | Financial assets at FVTPL - noncurrent | 600,000 | 510,801 | 13 | 510,801 | — | |||||||||||||||||||||
China Airlines Ltd. | — | Financial assets at FVOCI | 263,622 | 2,388,416 | 5 | 2,388,416 | Note 2 | |||||||||||||||||||||
4 Gamers Entertainment Inc. | — | Financial assets at FVOCI | 136 | 120,243 | 19.9 | 120,243 | — | |||||||||||||||||||||
Senao International Co., Ltd. | Stocks | |||||||||||||||||||||||||||
N.T.U. Innovation Incubation Corporation | — | Financial assets at FVOCI | 1,200 | 10,648 | 9 | 10,648 | — | |||||||||||||||||||||
CHIEF Telecom Inc. | Stocks | |||||||||||||||||||||||||||
3 Link Information Service Co., Ltd. | — | Financial assets at FVOCI | 374 | 950 | 10 | 950 | — | |||||||||||||||||||||
WPG Holdings Limited | — | Financial assets at FVTPL - current | 9 | 463 | — | 463 | Note 2 | |||||||||||||||||||||
Chunghwa Investment Co., Ltd. | Stocks | |||||||||||||||||||||||||||
Tatung Technology Inc. | — | Financial assets at FVOCI | 4,571 | 144,277 | 11 | 144,277 | — | |||||||||||||||||||||
iSing99 Inc. | — | Financial assets at FVOCI | 10,000 | — | 7 | — | — | |||||||||||||||||||||
Powtec ElectroChemical Corporation | — | Financial assets at FVOCI | 20,000 | 114,478 | 2 | 114,478 | — | |||||||||||||||||||||
Bossdom Digiinnovation Co., Ltd. | — | Financial assets at FVOCI | 2,000 | 65,200 | 7 | 65,200 | Note 2 | |||||||||||||||||||||
Chunghwa Hsingta Co., Ltd. | Stocks | |||||||||||||||||||||||||||
Cotech Engineering Fuzhou Corp. | — | Financial assets at FVOCI | — | 10,049 | 5 | 10,049 | — | |||||||||||||||||||||
| Note 1: | Showed at carrying amounts with fair value adjustments. |
| Note 2: | Fair value was based on the closing price on December 31, 2019. |
- 106 -
TABLE 3
CHUNGHWA TELECOM CO., LTD. AND SUBSIDIARIES
MARKETABLE SECURITIES ACQUIRED AND DISPOSED OF AT COSTS OR PRICES OF AT LEAST NT$300 MILLION OR 20% OF THEPAID-IN CAPITAL
YEAR ENDED DECEMBER 31, 2019
(Amounts in Thousands of New Taiwan Dollars)
Company Name | Marketable Securities Type | Financial Statement | Counter- party | Nature of Relationship | Beginning Balance | Acquisition | Disposal | Ending Balance | ||||||||||||||||||||||||||||||||||||||||||||
| Shares (Thousands/ Thousand Units) | Amount | Shares (Thousands/ Thousand Units) | Amount | Shares (Thousands/ Thousand Units) | Amount | Carrying Value | Gain on Disposal | Shares (Thousands/ Thousand Units) | Amount | |||||||||||||||||||||||||||||||||||||||||||
Chunghwa Telecom Co., Ltd. | Stocks | |||||||||||||||||||||||||||||||||||||||||||||||||||
Taiwania Capital Buffalo Fund Co., Ltd. | Financial assets at FVTPL-noncurrent | — | — | 300,000 | $ | 300,000 (Note 1) | | 300,000 | $ | 300,000 | — | $ | — | $ | — | $ | — | 600,000 | $ | 600,000 (Note 1) | | |||||||||||||||||||||||||||||||
Next Commercial Bank Co., Ltd. (preparatory office) | Investments accounted for using equity method | — | Associate | — | — | 419,000 | 4,190,000 | — | — | — | — | 419,000 | | 4,190,000 (Note 2) |
| |||||||||||||||||||||||||||||||||||||
| Note 1: | Showing at their original investment amounts without adjustments for fair values. |
| Note 2: | The ending balance was based on the original investment amount without adjustments for share of the profit or loss of investments accounted for using equity method. |
- 107 -
TABLE 4
CHUNGHWA TELECOM CO., LTD. AND SUBSIDIARIES
ACQUISITION OF INDIVIDUAL REAL ESTATE AT COSTS OF AT LEAST $300 MILLION OR 20% OF THEPAID-IN CAPITAL
YEAR ENDED DECEMBER 31, 2019
(Amounts in Thousands of New Taiwan Dollars)
Buyer | Property | Event Date | Transaction Amount | Payment Status | Counterparty | Relationship | Information on Previous Title Transfer If Counterparty is a Related Party | Pricing Reference | Purpose of | Other Terms | ||||||||||||||||||||
| Property Owner | Relationship | Transaction Date | Amount | |||||||||||||||||||||||||||
Chunghwa Precision Test Tech. Co., Ltd. | Headquarters | 2017.07.29- 2019.12.25 | $ | 1,460,105 | Monthly settlement based on the construction progress and acceptance | Fu Tsu Construction Co., Ltd. | — | Not applicable | Not applicable | Not applicable | Not applicable | Bidding, price comparison and price negotiation | Manufacturing purpose | None | ||||||||||||||||
- 108 -
TABLE 5
CHUNGHWA TELECOM CO., LTD. AND SUBSIDIARIES
TOTAL PURCHASES FROM OR SALES TO RELATED PARTIES AMOUNTING TO AT LEAST NT$100 MILLION OR 20% OF THEPAID-IN CAPITAL
YEAR ENDED DECEMBER 31, 2019
(Amounts in Thousands of New Taiwan Dollars)
Company Name | Related Party | Nature of Relationship | Transaction Details | Abnormal Transaction | Notes / Accounts Payable or Receivable | |||||||||||||||||||||||||||
| Purchase/Sales (Note 1) | Amount (Notes 2 and 5) | % to Total | Payment Terms | Units Price | Payment Terms | Ending Balance (Notes 3 and 5) | % to Total | |||||||||||||||||||||||||
| Chunghwa Telecom Co., Ltd. | Senao International Co., Ltd. | Subsidiary | Sales | $ | 2,396,927 | 1 | 30 days | $ | — | — | $ | 285,563 | 1 | |||||||||||||||||||
| Purchase | 878,601 | 1 | 30-90 days | — | — | (787,371 | ) | (6 | ) | |||||||||||||||||||||||
| CHIEF Telecom Inc. | Subsidiary | Sales | 354,556 | — | 30 days | — | — | 48,736 | — | |||||||||||||||||||||||
| Purchase | 115,231 | — | 60 days | — | — | (23,165 | ) | — | ||||||||||||||||||||||||
| Chunghwa System Integration Co., Ltd. | Subsidiary | Purchase | 1,052,583 | 1 | 30 days | — | — | (659,866 | ) | (5 | ) | |||||||||||||||||||||
CHYP Multimedia Marketing & Communications Co., Ltd. | Subsidiary | Purchase | 107,346 | — | 30 days | — | — | �� | (33,217 | ) | — | |||||||||||||||||||||
| Honghwa International Co., Ltd. | Subsidiary | Sales | 109,606 | — | 30-60 days | — | — | 64,232 | — | |||||||||||||||||||||||
| Purchase | 5,347,566 | 5 | 30-60 days | — | — | (790,045 | ) | (6 | ) | |||||||||||||||||||||||
| Donghwa Telecom Co., Ltd. | Subsidiary | Sales | 198,226 | — | 30 days | — | — | 46,707 | — | |||||||||||||||||||||||
| Purchase | 606,424 | 1 | 90 days | — | — | (169,182 | ) | (1 | ) | |||||||||||||||||||||||
| Chunghwa Telecom Global, Inc. | Subsidiary | Purchase | 362,348 | — | 90 days | — | — | (38,134 | ) | — | ||||||||||||||||||||||
| Chunghwa Telecom Singapore Pte., Ltd. | Subsidiary | Sales | 275,094 | — | 30 days | — | — | 42,356 | — | |||||||||||||||||||||||
| Purchase | 353,121 | — | 90 days | — | — | (67,217 | ) | — | ||||||||||||||||||||||||
| CHT Security Co., Ltd. | Subsidiary | Purchase | 235,011 | — | 30 days | — | — | (57,268 | ) | — | ||||||||||||||||||||||
Taiwan International Standard Electronics Co., Ltd. | Associate | Purchase | 700,254 | 1 | 30-90 days | — | — | (432,307 | ) | (3 | ) | |||||||||||||||||||||
| So-net Entertainment Taiwan Limited | Associate | Sales | 143,772 | — | 60 days | — | — | 5 | — | |||||||||||||||||||||||
| International Integrated System, Inc. | Associate | Purchase | 151,034 | — | 30 days | — | — | (48,182 | ) | — | ||||||||||||||||||||||
| Senao International Co., Ltd. | Chunghwa Telecom Co., Ltd. | Parent company | Sales | 6,441,498 | 22 | 30-90 days | — | — | 797,620 | 47 | ||||||||||||||||||||||
| Purchase | 2,216,723 | 9 | 30 days | — | — | (261,139 | ) | (14 | ) | |||||||||||||||||||||||
| Aval Technologies Co., Ltd. | Subsidiary | Purchase | 602,456 | 2 | 30 days | — | — | (180 | ) | — | ||||||||||||||||||||||
Senyoung Insurance Agent Co., Ltd. | Subsidiary | Sales | 124,104 | — | 30 days | — | — | 44,441 | 3 | |||||||||||||||||||||||
| Aval Technologies Co., Ltd. | Youth Co., Ltd. | Fellow subsidiary | Sales | 174,216 | 1 | 30 days | — | — | 27,077 | 2 | ||||||||||||||||||||||
| CHIEF Telecom Inc. | Chunghwa Telecom Co., Ltd. | Parent company | Sales | 264,284 | 11 | 60 days | — | — | 34,123 | 16 | ||||||||||||||||||||||
| Purchase | 354,038 | 27 | 30 days | — | — | (48,736 | ) | (45 | ) | |||||||||||||||||||||||
Chunghwa System Integration Co., Ltd. | Chunghwa Telecom Co., Ltd. | Parent company | Sales | 1,965,251 | 85 | 30 days | — | — | 657,839 | 80 | ||||||||||||||||||||||
CHYP Multimedia Marketing & Communications Co., Ltd. | Chunghwa Telecom Co., Ltd. | Parent company | Sales | 107,346 | 27 | 30 days | — | — | 30,697 | 40 | ||||||||||||||||||||||
| Honghwa International Co., Ltd. | Chunghwa Telecom Co., Ltd. | Parent company | Sales | 5,318,598 | 96 | 30-60 days | — | — | 788,779 | 98 | ||||||||||||||||||||||
| Donghwa Telecom Co., Ltd. | Chunghwa Telecom Co., Ltd. | Parent company | Sales | 606,424 | 46 | 90 days | — | — | 169,182 | 78 | ||||||||||||||||||||||
| Purchase | 198,226 | 16 | 30 days | — | — | (46,707 | ) | (28 | ) | |||||||||||||||||||||||
| Chunghwa Telecom Global, Inc. | Chunghwa Telecom Co., Ltd. | Parent company | Sales | 362,348 | 59 | 90 days | — | — | 38,134 | 71 | ||||||||||||||||||||||
Chunghwa Telecom Singapore Pte., Ltd. | Chunghwa Telecom Co., Ltd. | Parent company | Sales | 353,121 | 31 | 90 days | — | — | 67,217 | 12 | ||||||||||||||||||||||
| Purchase | 275,094 | 26 | 30 days | — | — | (42,356 | ) | (7 | ) | |||||||||||||||||||||||
| CHT Security Co., Ltd. | Chunghwa Telecom Co., Ltd. | Parent company | Sales | 295,699 | 43 | 30 days | — | — | 136,450 | 78 | ||||||||||||||||||||||
| Note 1: | Purchase included acquisition of services costs. |
| Note 2: | The differences were because Chunghwa Telecom Co., Ltd. and subsidiaries classified the amount as incremental costs of obtaining contracts, inventories, property, plant and equipment, intangible assets, and operating expenses. |
| Note 3: | Notes and accounts receivable did not include the amounts collected for others and other receivables. |
| Note 4: | Transaction terms with the related parties were determined in accordance with mutual agreements when there were no similar transactions with third parties. Other transactions with related parties were not significantly different from those with third parties. |
| Note 5: | All inter-company transactions, balances, income and expenses are eliminated upon consolidation. |
- 109 -
TABLE 6
CHUNGHWA TELECOM CO., LTD. AND SUBSIDIARIES
RECEIVABLES FROM RELATED PARTIES AMOUNTING TO AT LEAST NT$100 MILLION OR 20% OF THEPAID-IN CAPITAL
DECEMBER 31, 2019
(Amounts in Thousands of New Taiwan Dollars)
| Turnover Rate (Note 1) | Overdue | Amounts Received in Subsequent Period | Allowance for Bad Debts | |||||||||||||||||||||||||
Company Name | Related Party | Nature of Relationship | Ending Balance | Amounts | Action Taken | |||||||||||||||||||||||
Chunghwa Telecom Co., Ltd. | Senao International Co., Ltd. | Subsidiary | $
| 464,647 (Note 2 | ) | 10.31 | $ | — | — | $ | 451,941 | $ | — | |||||||||||||||
Senao International Co., Ltd. | Chunghwa Telecom Co., Ltd. | Parent company | | 990,879 (Note 2 | ) | 7.48 | — | — | 123,369 | — | ||||||||||||||||||
Chunghwa System Integration Co., Ltd. | Chunghwa Telecom Co., Ltd. | Parent company | | 657,839 (Note 2 | ) | 3.06 | — | — | 482,712 | — | ||||||||||||||||||
Honghwa International Co., Ltd. | Chunghwa Telecom Co., Ltd. | Parent company | | 788,779 (Note 2 | ) | 5.76 | — | — | 171,232 | — | ||||||||||||||||||
Donghwa Telecom Co., Ltd. | Chunghwa Telecom Co., Ltd. | Parent company | | 169,182 (Note 2 | ) | 3.59 | — | — | 110,229 | — | ||||||||||||||||||
| Note 1: | Payments and receipts collected in trust for others are excluded from the accounts receivable for calculating the turnover rate. |
| Note 2: | The amount was eliminated upon consolidation. |
- 110 -
TABLE 7
CHUNGHWA TELECOM CO., LTD. AND SUBSIDIARIES
NAMES, LOCATIONS, AND OTHER INFORMATION OF INVESTEES IN WHICH THE COMPANY EXERCISES SIGNIFICANT INFLUENCE (EXCLUDING INVESTEES IN MAINLAND CHINA)
YEAR ENDED DECEMBER 31, 2019
(Amounts in Thousands of New Taiwan Dollars)
| Original Investment Amount | Balance as of December 31, 2019 | Recognized | ||||||||||||||||||||||||||||||||||
Investor Company | Investee Company | Location | Main Businesses and Products | December 31, 2019 | December 31, 2018 | Shares (Thousands) | Percentage of Ownership (%) | Carrying Value (Note 3) | Net Income (Loss) of the Investee | Gain (Loss) (Notes 1, 2 and 3) | Note | |||||||||||||||||||||||||
Chunghwa Telecom Co., Ltd. | Senao International Co., Ltd. | Taiwan | Handset and peripherals retailer; sales of CHT mobile phone plans as an agent | $ | 1,065,813 | $ | 1,065,813 | 71,773 | 28 | $ | 1,616,907 | $ | 409,348 | $ | 108,059 | Subsidiary (Note 6) | ||||||||||||||||||||
Light Era Development Co., Ltd. | Taiwan | Planning and development of real estate and intelligent buildings, and property management | 3,000,000 | 3,000,000 | 300,000 | 100 | 3,850,095 | 7,254 | 3,494 | Subsidiary (Note 6) | ||||||||||||||||||||||||||
Donghwa Telecom Co., Ltd. | Hong Kong | International private leased circuit, IP VPN service, and IP transit services | 1,567,453 | 1,567,453 | 402,590 | 100 | 1,627,491 | 39,268 | 39,268 | Subsidiary (Note 6) | ||||||||||||||||||||||||||
Chunghwa Telecom Singapore Pte., Ltd. | Singapore | International private leased circuit, IP VPN service, and IP transit services | 574,112 | 574,112 | 26,383 | 100 | 935,228 | 143,145 | 143,152 | Subsidiary (Note 6) | ||||||||||||||||||||||||||
Chunghwa System Integration Co., Ltd. | Taiwan | Providing system integration services and telecommunications equipment | 838,506 | 838,506 | 60,000 | 100 | 717,883 | 13,135 | (20,612 | ) | Subsidiary (Note 6) | |||||||||||||||||||||||||
CHIEF Telecom Inc. | Taiwan | Network integration, internet data center (“IDC”), communications integration and cloud application services | 459,652 | 459,652 | 39,426 | 57 | 1,729,189 | 542,508 | 313,931 | Subsidiary (Note 6) | ||||||||||||||||||||||||||
Chunghwa Investment Co., Ltd. | Taiwan | Investment | 639,559 | 639,559 | 68,085 | 89 | 3,130,389 | 207,988 | 185,348 | Subsidiary (Note 6) | ||||||||||||||||||||||||||
Prime Asia Investments Group Ltd. (B.V.I.) | British Virgin Islands | Investment | 385,274 | 385,274 | 1 | 100 | 182,989 | (2,462 | ) | (2,462 | ) | Subsidiary (Note 6) | ||||||||||||||||||||||||
Honghwa International Co., Ltd. | Taiwan | Telecommunication engineering, sales agent of mobile phone plan application and other business services | 180,000 | 180,000 | 18,000 | 100 | 422,269 | 171,509 | 165,011 | Subsidiary (Note 6) | ||||||||||||||||||||||||||
CHYP Multimedia Marketing & Communications Co., Ltd. | Taiwan | Digital information supply services and advertisement services | 150,000 | 150,000 | 15,000 | 100 | 190,972 | 15,375 | 15,733 | Subsidiary (Note 6) | ||||||||||||||||||||||||||
Chunghwa Telecom Vietnam Co., Ltd. | Vietnam | Intelligent energy saving solutions, international circuit, and information and communication technology (“ICT”) services. | 148,275 | 148,275 | — | 100 | 98,221 | (5,365 | ) | (5,365 | ) | Subsidiary (Note 6) | ||||||||||||||||||||||||
Chunghwa Telecom Global, Inc. | United States | International private leased circuit, internet services, and transit services | 70,429 | 70,429 | 6,000 | 100 | 347,380 | 66,530 | 68,770 | Subsidiary (Note 6) | ||||||||||||||||||||||||||
CHT Security Co., Ltd. | Taiwan | Computing equipment installation, wholesale of computing and business machinery equipment and software, management consulting services, data processing services, digital information supply services and internet identify services | 240,000 | 240,000 | 24,000 | 80 | 306,851 | 98,124 | 72,112 | Subsidiary (Note 6) | ||||||||||||||||||||||||||
Chunghwa Telecom (Thailand) Co., Ltd. | Thailand | International private leased circuit, IP VPN service, ICT and cloud VAS services | 119,624 | 100,000 | 1,300 | 100 | 114,231 | (3,595 | ) | (3,595 | ) | Subsidiary (Note 6) | ||||||||||||||||||||||||
Spring House Entertainment Tech. Inc. | Taiwan | Software design services, internet contents production and play, and motion picture production and distribution | 41,941 | 62,209 | 8,251 | 56 | 110,357 | 21,322 | 11,949 | Subsidiary (Note 6) | ||||||||||||||||||||||||||
Chunghwa leading Photonics Tech Co., Ltd. | Taiwan | Production and sale of electronic components and finished products | 70,500 | 70,500 | 7,050 | 75 | 111,680 | 10,464 | 13,050 | Subsidiary (Note 6) | ||||||||||||||||||||||||||
Smartfun Digital Co., Ltd. | Taiwan | Providing diversified family education digital services | 65,000 | 65,000 | 6,500 | 65 | 73,688 | 10,260 | 7,466 | Subsidiary (Note 6) | ||||||||||||||||||||||||||
Chunghwa Telecom Japan Co., Ltd. | Japan | International private leased circuit, IP VPN service, and IP transit services | 17,291 | 17,291 | 1 | 100 | 76,567 | 15,073 | 15,073 | Subsidiary (Note 6) | ||||||||||||||||||||||||||
Chunghwa Sochamp Technology Inc. | Taiwan | Design, development and production of Automatic License Plate Recognition software and hardware | 20,400 | 20,400 | 2,040 | 51 | (10,086 | ) | (2,232 | ) | (3,858 | ) | Subsidiary (Note 6) | |||||||||||||||||||||||
International Integrated System, Inc. | Taiwan | IT solution provider, IT application consultation, system integration and package solution | 283,500 | 283,500 | 22,498 | 31 | 340,240 | 129,400 | 41,699 | Associate | ||||||||||||||||||||||||||
- 111 -
CHUNGHWA TELECOM CO., LTD. AND SUBSIDIARIES
NAMES, LOCATIONS, AND OTHER INFORMATION OF INVESTEES IN WHICH THE COMPANY EXERCISES SIGNIFICANT INFLUENCE (EXCLUDING INVESTMENT IN MAINLAND CHINA)
YEAR ENDED DECEMBER 31, 2019
(Amounts in Thousands of New Taiwan Dollars)
| Original Investment Amount | Balance as of December 31, 2019 | Net Income | Recognized | |||||||||||||||||||||||||||||||||
Investor Company | Investee Company | Location | Main Businesses and Products | December 31, 2019 | December 31, 2018 | Shares (Thousands) | Percentage of Ownership (%) | Carrying Value (Note 3) | (Loss) of the Investee | Gain (Loss) (Notes 1, 2 and 3) | Note | |||||||||||||||||||||||||
Viettel-CHT Co., Ltd. | Vietnam | IDC services | $ | 288,327 | $ | 288,327 | — | 30 | $ | 316,535 | $ | 253,315 | $ | 76,008 | Associate | |||||||||||||||||||||
Taiwan International Standard Electronics Co., Ltd. | Taiwan | Manufacturing, selling, designing, and maintaining of telecommunications systems and equipment | 164,000 | 164,000 | 1,760 | 40 | 272,166 | 259,592 | 135,438 | Associate | ||||||||||||||||||||||||||
KKBOX Taiwan Co., Ltd. | Taiwan | Providing of musicon-line, software, electronic information, and advertisement services | 67,025 | 67,025 | 4,438 | 30 | 150,789 | 12,645 | 3,793 | Associate | ||||||||||||||||||||||||||
So-net Entertainment Taiwan Limited | Taiwan | Online service and sale of computer hardware | 120,008 | 120,008 | 9,429 | 30 | 189,396 | 230,376 | 69,113 | Associate | ||||||||||||||||||||||||||
KingwayTek Technology Co., Ltd. | Taiwan | Publishing books, data processing and software services | 66,684 | 69,013 | 7,898 | 23 | 253,021 | 2,692 | 1,723 | Associate | ||||||||||||||||||||||||||
Taiwan International Ports Logistics Corporation | Taiwan | Import and export storage, logistic warehouse, and ocean shipping service | 80,000 | 80,000 | 8,000 | 27 | 50,979 | 4,921 | 1,329 | Associate | ||||||||||||||||||||||||||
UUPON Inc. | Taiwan | Information technology service and general advertisement service | 97,598 | 97,598 | 5,400 | 15 | 7,199 | (28,150 | ) | (4,234 | ) | Associate | ||||||||||||||||||||||||
Alliance Digital Tech Co., Ltd. | Taiwan | Development of mobile payments and information processing service | 60,000 | 60,000 | 6,000 | 14 | 5,080 | — | — | Associate | ||||||||||||||||||||||||||
Chunghwa PChome Fund I Co., Ltd. | Taiwan | Investment, venture capital, investment advisor, management consultant and other consultancy service | 200,000 | 200,000 | 20,000 | 50 | 194,081 | (9,785 | ) | (4,893 | ) | Associate | ||||||||||||||||||||||||
Cornerstone Ventures Co., Ltd. | Taiwan | Investment, venture capital, investment advisor, management consultant and other consultancy service | 4,900 | 4,900 | 490 | 49 | 5,507 | 1,530 | 750 | Associate | ||||||||||||||||||||||||||
Next Commercial Bank Co., Ltd. (preparatory office) | Taiwan | Online banking business | 4,190,000 | — | 419,000 | 42 | 4,074,168 | (276,449 | ) | (115,832 | ) | Associate | ||||||||||||||||||||||||
Senao International Co., Ltd. | Senao Networks, Inc. | Taiwan | Telecommunication facilities manufactures and sales | 202,758 | 202,758 | 16,579 | 34 | 953,685 | 424,479 | 143,443 | Associate | |||||||||||||||||||||||||
Senao International (Samoa) Holding Ltd. | Samoa Islands | International investment | 2,333,620 | 2,416,645 | 77,775 | 100 | 352,254 | (50,646 | ) | (50,646 | ) | Subsidiary (Note 6) | ||||||||||||||||||||||||
UUPON Inc. | Taiwan | Information technology service and general advertisement service | 24,000 | 24,000 | 2,400 | 7 | 3,330 | (28,150 | ) | (1,883 | ) | Associate | ||||||||||||||||||||||||
Youth Co., Ltd. | Taiwan | Sale of information and communication technologies products | 364,950 | 364,950 | 8,462 | 93 | 185,858 | (3,130 | ) | (20,345 | ) | Subsidiary (Note 6) | ||||||||||||||||||||||||
Aval Technologies Co., Ltd. | Taiwan | Sale of information and communication technologies products | 89,550 | 60,000 | 9,843 | 100 | 101,850 | 2,363 | 2,367 | Subsidiary (Note 6) | ||||||||||||||||||||||||||
Senyoung Insurance Agent Co., Ltd. | Taiwan | Property and liability insurance agency | 59,000 | 59,000 | 5,900 | 100 | 75,728 | 25,036 | 25,044 | Subsidiary (Note 6) | ||||||||||||||||||||||||||
Light Era Development Co., Ltd. | Taoyuan Asia Silicon Valley Innovation Co., Ltd. | Taiwan | Development of real estate | — | 7,500 | 750 | 60 | — | (5,466 | ) | (3,280 | ) | Subsidiary (Notes 4 and 6) | |||||||||||||||||||||||
CHIEF Telecom Inc. | Unigate Telecom Inc. | Taiwan | Telecommunications and internet service | 2,000 | 2,000 | 200 | 100 | 886 | (1 | ) | (1 | ) | Subsidiary (Note 6) | |||||||||||||||||||||||
Chief International Corp. | Samoa Islands | Telecommunications and internet service | 6,068 | 6,068 | 200 | 100 | 73,369 | 10,894 | 10,894 | Subsidiary (Note 6) | ||||||||||||||||||||||||||
Chunghwa Telecom Singapore Pte., Ltd. | ST-2 Satellite Ventures Pte., Ltd. | Singapore | Operation ofST-2 telecommunications satellite | 409,061 | 409,061 | 18,102 | 38 | 500,930 | 306,425 | 116,442 | Associate | |||||||||||||||||||||||||
Chunghwa Investment Co., Ltd. | Chunghwa Precision Test Tech. Co., Ltd. | Taiwan | Production and sale of semiconductor testing components and printed circuit board | 178,608 | 178,608 | 11,230 | 34 | 2,207,040 | 625,164 | 214,115 | Subsidiary (Note 6) | |||||||||||||||||||||||||
CHIEF Telecom Inc. | Taiwan | Network integration, internet data center (“IDC”), communications integration and cloud application services | 19,064 | 19,064 | 2,078 | 3 | 85,381 | 542,508 | 16,275 | Associate (Note 6) | ||||||||||||||||||||||||||
Senao International Co., Ltd. | Taiwan | Selling and maintaining mobile phones and its peripheral products | 49,731 | 49,731 | 1,001 | — | 43,412 | 409,348 | 1,594 | Associate (Note 6) | ||||||||||||||||||||||||||
(Continued)
- 112 -
CHUNGHWA TELECOM CO., LTD. AND SUBSIDIARIES
NAMES, LOCATIONS, AND OTHER INFORMATION OF INVESTEES IN WHICH THE COMPANY EXERCISES SIGNIFICANT INFLUENCE (EXCLUDING INVESTMENT IN MAINLAND CHINA)
YEAR ENDED DECEMBER 31, 2019
(Amounts in Thousands of New Taiwan Dollars)
| Original Investment Amount | Balance as of December 31, 2019 | Net Income | Recognized | |||||||||||||||||||||||||||||||||
Investor Company | Investee Company | Location | Main Businesses and Products | December 31, 2019 | December 31, 2018 | Shares (Thousands) | Percentage of Ownership (%) | Carrying Value (Note 3) | (Loss) of the Investee | Gain (Loss) (Notes 1, 2 and 3) | Note | |||||||||||||||||||||||||
Chunghwa Precision Test Tech. Co., Ltd. | Chunghwa Precision Test Tech USA Corporation | United States | Design and after-sale services of semiconductor testing components and printed circuit board | $ | 12,636 | $ | 12,636 | 400 | 100 | $ | 24,337 | $ | 544 | $ | 544 | Subsidiary (Note 6) | ||||||||||||||||||||
CHPT Japan Co., Ltd. | Japan | Related services of electronic parts, machinery processed products and printed circuit board | 2,008 | 2,008 | 1 | 100 | 2,380 | 82 | 82 | Subsidiary (Note 6) | ||||||||||||||||||||||||||
Chunghwa Precision Test Tech. International, Ltd. | Samoa Islands | Wholesale and retail of electronic materials, and investment | 116,790 | 54,450 | 3,700 | 100 | 84,684 | (13,893 | ) | (17,461 | ) | Subsidiary (Note 6) | ||||||||||||||||||||||||
Prime Asia Investments Group, Ltd. (B.V.I.) | Chunghwa Hsingta Co., Ltd. | Hong Kong | Investment | 375,274 | 375,274 | 1 | 100 | 182,988 | (2,460 | ) | (2,460 | ) | Subsidiary (Note 6) | |||||||||||||||||||||||
MeWorks Limited (HK) | Hong Kong | Investment | 10,000 | 10,000 | — | 20 | — | — | — | Associate | ||||||||||||||||||||||||||
Senao International (Samoa) Holding Ltd. | Senao International HK Limited | Hong Kong | International investment | 2,328,754 | 2,393,646 | 80,440 | 100 | 332,131 | (50,952 | ) | (50,952 | ) | Subsidiary (Note 6) | |||||||||||||||||||||||
Youth Co., Ltd. | ISPOT Co., Ltd. | Taiwan | Sale of information and communication technologies products | 53,021 | 53,021 | — | 100 | 9,098 | (94 | ) | (286 | ) | Subsidiary (Note 6) | |||||||||||||||||||||||
Youyi Co., Ltd. | Taiwan | Maintenance of information and communication technologies products | 21,354 | 21,354 | — | 100 | 17,152 | 315 | 87 | Subsidiary (Note 6) | ||||||||||||||||||||||||||
Aval Technologies Co., Ltd. | Wiin Technology Co., Ltd. | Taiwan | Sale of information and communication technologies products | 29,550 | — | 2,955 | 100 | 29,781 | 231 | 231 | Subsidiary (Note 6) | |||||||||||||||||||||||||
Senyoung Insurance Agent Co., Ltd. | Seyoung Insurance Agent Co., Ltd. | Taiwan | Life insurance services | 29,500 | — | 2,950 | 100 | 29,220 | (280 | ) | (280 | ) | Subsidiary (Note 6) | |||||||||||||||||||||||
CHYP Multimedia Marketing & Communications Co., Ltd | Click Force Marketing Company | Taiwan | Advertisement services | 44,607 | 44,607 | 1,078 | 49 | 37,120 | 3,014 | (756 | ) | Associate | ||||||||||||||||||||||||
| Note 1: | The amounts were based on audited financial statements. |
| Note 2: | Recognized gain (loss) of investees includes amortization of differences between the investment cost and net value and elimination of unrealized transactions. |
| Note 3: | Recognized gain (loss) and carrying value of the investees did not include the adjustment of the difference between the accounting treatment on standalone basis and consolidated basis as a result of the application of IFRS 15. |
| Note 4: | The liquidation of Taoyuan Asia Silicon Valley Innovation Co., Ltd. was completed in September 2019. |
| Note 5: | Investment in mainland China is included in Table 8. |
| Note 6: | The amount was eliminated upon consolidation. |
(Concluded)
- 113 -
TABLE 8
CHUNGHWA TELECOM CO., LTD. AND SUBSIDIARIES
INVESTMENT IN MAINLAND CHINA
YEAR ENDED DECEMBER 31, 2019
(Amounts in Thousands of New Taiwan Dollars)
| Accumulated | Investment Flows | Accumulated | Accumulated | |||||||||||||||||||||||||||||||||||||||||||||||
Investee | Main Businesses and | Total Amount ofPaid-in Capital | Investment Type (Note 1) | Outflow of Investment from Taiwan as of January 1, 2019 | Outflow | Inflow | Outflow of Investment from Taiwan as of December 31, 2019 | Net Income (Loss) of the Investee | % Ownership of Direct or Indirect Investment | Investment Gain (Loss) (Note 2) | Carrying Value as of December 31, 2019 | Inward Remittance of Earnings as of December 31, 2019 | Note | |||||||||||||||||||||||||||||||||||||
Senao Trading (Fujian) Co., Ltd. | Sale of information and communication technologies products | $ | 1,073,170 | 2 | $ | 1,073,170 | $ | — | $ | — | $ | 1,073,170 | $ | 1,435 | 100 | $ | 1,435 | $ | — | $ | — | Notes 7 and 11 | ||||||||||||||||||||||||||||
Senao International Trading (Shanghai) Co., Ltd. | Sale of information and communication technologies products | 955,838 | 2 | 955,838 | — | — | 955,838 | (27,215 | ) | 100 | (27,215 | ) | 50,497 | — | Note 11 | |||||||||||||||||||||||||||||||||||
Senao International Trading (Shanghai) Co., Ltd. (Note 12) | Maintenance of information and communication technologies products | 26,053 | 2 | 87,540 | — | 61,487 | 26,053 | — | 100 | — | — | — | Notes 8 and 11 | |||||||||||||||||||||||||||||||||||||
Senao International Trading (Jiangsu) Co., Ltd. | Sale of information and communication technologies products | 263,736 | 2 | 263,736 | — | — | 263,736 | 310 | 100 | 310 | — | — | Notes 9 and 11 | |||||||||||||||||||||||||||||||||||||
Chunghwa Telecom (China) Co., Ltd. | Integrated information and communication solution services for enterprise clients, and intelligent energy network service | 177,176 | 2 | 177,176 | — | — | 177,176 | (6,069 | ) | 100 | (6,069 | ) | 44,475 | — | Note 11 | |||||||||||||||||||||||||||||||||||
Jiangsu Zhenghua Information Technology Company, LLC | Providing intelligent energy saving solution and intelligent buildings services | 189,410 | 2 | 142,057 | — | — | 142,057 | — | 75 | — | — | — | | Notes 10 and 11 | | |||||||||||||||||||||||||||||||||||
Shanghai Taihua Electronic Technology Limited | Design of printed circuit board and related consultation service | 51,233 | 2 | 51,233 | — | — | 51,233 | (12,279 | ) | 100 | (12,279 | ) | 25,943 | — | Note 11 | |||||||||||||||||||||||||||||||||||
Su Zhou Precision Test Tech. Ltd. | Assembly processed of circuit board, design of printed circuit board and related consultation service | 62,340 | 2 | — | 62,340 | — | 62,340 | (1,955 | ) | 100 | (1,955 | ) | 58,916 | — | Note 11 | |||||||||||||||||||||||||||||||||||
Shanghai Chief Telecom Co., Ltd. | Telecommunications and internet service | 10,150 | 1 | 4,973 | — | — | 4,973 | 6,822 | 49 | 3,343 | 10,852 | — | Note 11 | |||||||||||||||||||||||||||||||||||||
(Continued)
- 114 -
Investee | Accumulated Investment in Mainland China as of December 31, 2019 | Investment Amounts Authorized by Investment Commission, MOEA | Upper Limit on Investment Stipulated by Investment Commission, MOEA | |||||||||
SENAO and its subsidiaries (Note 3) | $ | 2,318,797 | $ | 2,318,797 | $ | 3,517,513 | ||||||
Chunghwa Telecom (China) Co., Ltd. (Note 4) | 177,176 | 177,176 | 231,836,259 | |||||||||
Jiangsu Zhenghua Information Technology Company, LLC (Note 4) | 142,057 | 142,057 | 231,836,259 | |||||||||
Chunghwa Precision Test Tech Co., Ltd and its subsidiaries (Note 5) | 113,573 | 159,725 | 3,866,346 | |||||||||
Shanghai Chief Telecom Co., Ltd. (Note 6) | 4,973 | 4,973 | 1,720,100 | |||||||||
| Note 1: | Investments are divided into three categories as follows: |
| a. | Direct investment. |
| b. | Investments through a holding company registered in a third region. |
| c. | Others. |
| Note 2: | The amounts were calculated based on the investee’s audited financial statements. |
| Note 3: | Senao International Co., Ltd. and its subsidiaries were calculated based on the consolidated net assets value of Senao International Co., Ltd. |
| Note 4: | Chunghwa Telecom (China) Co., Ltd. and Jiangsu Zhenghua Information Technology Company, LLC were calculated based on the consolidated net assets value of Chunghwa Telecom Co., Ltd. |
| Note 5: | Chunghwa Precision Test Tech. Co., Ltd. and its subsidiaries were calculated based on the consolidated net assets value of Chunghwa Precision Test Tech. Co., Ltd |
| Note 6: | Shanghai Chief Telecom Co., Ltd. was calculated based on the consolidated net assets value of CHIEF Telecom Inc. |
| Note 7: | The liquidation of Senao Trading (Fujian) Co., Ltd. was completed in May 2019. |
| Note 8: | The liquidation of Senao International Trading (Shanghai) Co., Ltd. was completed in March 2018. |
| Note 9: | The liquidation of Senao International Trading (Jiangsu) Co., Ltd. was completed in March 2019. |
| Note 10: | The liquidation of Jiangsu Zhenhua Information Technology Company, LLC. was completed in December 2018. |
| Note 11: | The amount was eliminated upon consolidation. |
| Note 12: | The English name is the same as the above entity; however the Chinese name included in the respective Articles of Incorporations is different from the above entity. |
(Concluded)
- 115 -
TABLE 9
CHUNGHWA TELECOM CO., LTD. AND SUBSIDIARIES
INTERCOMPANY RELATIONSHIPS AND SIGNIFICANT TRANSACTIONS
YEAR ENDED DECEMBER 31, 2019
(Amounts in Thousands of New Taiwan Dollars)
Year | No. (Note 1) | Company Name | Related Party | Nature of Relationship (Note 2) | Transaction Details | |||||||||||||||||||||
Financial Statement Account | Amount (Note 5) | Payment Terms (Note 3) | % to Total Sales or Assets (Note 4) | |||||||||||||||||||||||
2019 | 0 | Chunghwa Telecom Co., Ltd. | Senao International Co., Ltd. | a | Accounts receivable | $ | 285,563 | — | — | |||||||||||||||||
| Accrued custodial receipts | 179,084 | — | — | |||||||||||||||||||||||
| Accounts payable | 787,371 | — | — | |||||||||||||||||||||||
| Amounts collected for others | 203,740 | — | — | |||||||||||||||||||||||
| Revenues | 2,396,927 | — | 1 | |||||||||||||||||||||||
| Operating costs and expenses | 862,598 | — | — | |||||||||||||||||||||||
| Inventories | 16,003 | — | — | |||||||||||||||||||||||
| Property, plant and equipment | 14,513 | — | — | |||||||||||||||||||||||
| CHIEF Telecom Inc. | a | Accounts receivable | 48,736 | — | — | |||||||||||||||||||||
| Accounts payable | 23,165 | — | — | |||||||||||||||||||||||
| Revenues | 354,556 | — | — | |||||||||||||||||||||||
| Operating costs and expenses | 115,231 | — | — | |||||||||||||||||||||||
CHYP Multimedia Marketing & Communications Co., Ltd. | a | Accounts payable | 33,217 | — | — | |||||||||||||||||||||
| Amounts collected for others | 47,305 | — | — | |||||||||||||||||||||||
| Revenues | 33,394 | — | — | |||||||||||||||||||||||
| Operating costs and expenses | 107,346 | — | — | |||||||||||||||||||||||
| Chunghwa System Integration Co., Ltd. | a | Accounts receivable | 48,136 | — | — | |||||||||||||||||||||
| Accounts payable | 659,866 | — | — | |||||||||||||||||||||||
| Revenues | 11,578 | — | — | |||||||||||||||||||||||
| Operating costs and expenses | 873,838 | — | — | |||||||||||||||||||||||
| Inventories | 178,745 | — | — | |||||||||||||||||||||||
| Prepayments | 102,421 | — | — | |||||||||||||||||||||||
| Property, plant and equipment | 704,678 | — | — | |||||||||||||||||||||||
| Intangible assets | 121,357 | — | — | |||||||||||||||||||||||
| Chunghwa Telecom Global Inc. | a | Accounts receivable | 13,997 | — | — | |||||||||||||||||||||
| Accounts payable | 38,134 | — | — | |||||||||||||||||||||||
| Revenues | 82,684 | — | — | |||||||||||||||||||||||
| Operating costs and expenses | 362,348 | — | — | |||||||||||||||||||||||
| Donghwa Telecom Co., Ltd. | a | Accounts receivable | 46,707 | — | — | |||||||||||||||||||||
| Accounts payable | 169,182 | — | — | |||||||||||||||||||||||
| Revenues | 198,226 | — | — | |||||||||||||||||||||||
| Operating costs and expenses | 606,424 | — | — | |||||||||||||||||||||||
| Spring House Entertainment Tech. Inc. | a | Amounts collected for others | 17,092 | — | — | |||||||||||||||||||||
| Revenues | 17,896 | — | — | |||||||||||||||||||||||
(Continued)
- 116 -
CHUNGHWA TELECOM CO., LTD. AND SUBSIDIARIES
INTERCOMPANY RELATIONSHIPS AND SIGNIFICANT TRANSACTIONS
YEAR ENDED DECEMBER 31, 2019
(Amounts in Thousands of New Taiwan Dollars)
Year | No. (Note 1) | Company Name | Related Party | Nature of Relationship (Note 2) | Transaction Details | |||||||||||||||||||||
Financial Statement Account | Amount (Note 5) | Payment Terms (Note 3) | % to Total Sales or Assets (Note 4) | |||||||||||||||||||||||
| Chunghwa Telecom Japan Co., Ltd. | a | Revenues | $ | 27,989 | — | — | ||||||||||||||||||||
| Operating costs and expenses | 96,096 | — | — | |||||||||||||||||||||||
| Chunghwa Telecom Singapore Pte., Ltd. | a | Accounts receivable | 42,356 | — | — | |||||||||||||||||||||
| Accounts payable | 67,217 | — | — | |||||||||||||||||||||||
| Revenues | 275,094 | — | — | |||||||||||||||||||||||
| Operating costs and expenses | 353,121 | — | — | |||||||||||||||||||||||
| Chunghwa Sochamp Technology Inc. | a | Accounts payable | 32,986 | — | — | |||||||||||||||||||||
| Inventories | 13,557 | — | — | |||||||||||||||||||||||
| Honghwa International Co., Ltd. | a | Accounts receivable | 64,232 | — | — | |||||||||||||||||||||
| Accounts payable | 790,045 | — | — | |||||||||||||||||||||||
| Revenues | 109,606 | — | — | |||||||||||||||||||||||
| Operating costs and expenses | 5,318,598 | — | 3 | |||||||||||||||||||||||
| Inventories | 28,968 | — | — | |||||||||||||||||||||||
| Property, plant and equipment | 95,291 | — | — | |||||||||||||||||||||||
| Smartfun Digital Co., Ltd. | a | Accounts payable | 14,417 | — | — | |||||||||||||||||||||
| Operating costs and expenses | 29,515 | — | — | |||||||||||||||||||||||
| Chunghwa Telecom Thailand Co., Ltd. | a | Operating costs and expenses | 31,306 | — | — | |||||||||||||||||||||
| CHT Security Co., Ltd. | a | Accounts payable | 57,268 | — | — | |||||||||||||||||||||
| Revenues | 30,655 | — | — | |||||||||||||||||||||||
| Operating costs and expenses | 204,074 | — | — | |||||||||||||||||||||||
| Inventories | 30,937 | — | — | |||||||||||||||||||||||
| Property, plant and equipment | 19,943 | — | — | |||||||||||||||||||||||
| Intangible assets | 11,258 | — | — | |||||||||||||||||||||||
| Other noncurrent assets | 34,578 | — | — | |||||||||||||||||||||||
| Aval Technologies Co., Ltd. | a | Accounts payable | 15,438 | — | — | |||||||||||||||||||||
| Operating costs and expenses | 79,019 | — | — | |||||||||||||||||||||||
| Senyoung Insurance Agent Co., Ltd. | a | Accounts receivable | 28,273 | — | — | |||||||||||||||||||||
| Revenues | 34,670 | — | — | |||||||||||||||||||||||
| Light Era Development Co., Ltd. | a | Accounts payable | 47,371 | — | — | |||||||||||||||||||||
| Property, plant and equipment | 39,948 | — | — | |||||||||||||||||||||||
| 1 | Light Era Development Co., Ltd. | CHIEF Telecom Inc. | c | Revenues | 96,390 | — | — | |||||||||||||||||||
| 2 | Chunghwa Telecom Singapore Pte., Ltd. | Donghwa Telecom Co., Ltd. | c | Prepayments | 15,523 | — | — | |||||||||||||||||||
(Continued)
- 117 -
CHUNGHWA TELECOM CO., LTD. AND SUBSIDIARIES
INTERCOMPANY RELATIONSHIPS AND SIGNIFICANT TRANSACTIONS
YEAR ENDED DECEMBER 31, 2019
(Amounts in Thousands of New Taiwan Dollars)
Year | No. (Note 1) | Company Name | Related Party | Nature of Relationship (Note 2) | Transaction Details | |||||||||||||||||||||
Financial Statement Account | Amount (Note 5) | Payment Terms (Note 3) | % to Total Sales or Assets (Note 4) | |||||||||||||||||||||||
| 3 | CHIEF Telecom Inc. | Chunghwa Telecom Singapore Pte., Ltd. | c | Revenues | $ | 26,734 | — | — | |||||||||||||||||
| Operating costs and expenses | 22,059 | — | — | |||||||||||||||||||||||
| Note 1: | Significant transactions between the Company and its subsidiaries or among subsidiaries are numbered as follows: |
| a. | “0” for the Company. |
| b. | Subsidiaries are numbered from “1”. |
| Note 2: | Related party transactions are divided into three categories as follows: |
| a. | The Company to subsidiaries. |
| b. | Subsidiaries to the Company. |
| c. | Subsidiaries to subsidiaries. |
| Note 3: | Transaction terms with the related parties were determined in accordance with mutual agreements when there were no similar transactions with third parties. Other transactions with related parties were not significantly different from those with third parties. |
| Note 4: | For assets and liabilities, amount is shown as a percentage to consolidated total assets as of December 31, 2019, while revenues, costs and expenses are shown as a percentage to consolidated revenues for the year ended December 31, 2019. |
| Note 5: | The amount was eliminated upon consolidation. |
(Concluded)
- 118 -