Exhibit 99.2
Chunghwa Telecom Co., Ltd. and Subsidiaries
Consolidated Financial Statements for the
Three Months Ended March 31, 2024 and 2023 and
Independent Auditors’ Review Report
INDEPENDENT AUDITORS’ REVIEW REPORT
PWCR24000313
To the Board of Directors and Shareholders of Chunghwa Telecom Co., Ltd.
Introduction
We have reviewed the accompanying consolidated balance sheet of Chunghwa Telecom Co., Ltd. and its subsidiaries (the “Company”) as of March 31, 2024, and the related consolidated statements of comprehensive income, of changes in equity and of cash flows for the three-month period then ended, and notes to the consolidated financial statements, including a summary of material accounting policy information. Management is responsible for the preparation and fair presentation of the consolidated financial statements in accordance with the Regulations Governing the Preparation of Financial Reports by Securities Issuers and International Accounting Standard 34, “Interim Financial Reporting” that came into effect as endorsed by the Financial Supervisory Commission. Our responsibility is to express a conclusion on these consolidated financial statements based on our reviews.
Scope of Review
We conducted our reviews in accordance with the Standards on Review Engagements 2410, “Review of Interim Financial Information Performed by the Independent Auditor of the Entity” of the Republic of China. A review of consolidated financial statements consists of making inquiries, primarily of persons responsible for financial and accounting matters, and applying analytical and other review procedures. A review is substantially less in scope than an audit and consequently does not enable us to obtain assurance that we would become aware of all significant matters that might be identified in an audit. Accordingly, we do not express an audit opinion.
Conclusion
Based on our reviews, nothing has come to our attention that caused us to believe that the accompanying consolidated financial statements do not present fairly, in all material respects, the consolidated financial position of the Company as of March 31, 2024, and of its consolidated financial performance and its consolidated cash flows for the three-month period then ended in accordance with the Regulations Governing the Preparation of Financial Reports by Securities Issuers, and International Accounting Standard 34. “Interim Financial Reporting” that came into effect as endorsed by the Financial Supervisory Commission.
- 1 -
Other matter - Prior period financial statements reviewed by other independent auditors
The Company’s consolidated financial statements as of and for the three-month period ended March 31, 2023 were reviewed by other independent auditors, whose review report dated May 10, 2023, expressed an unmodified conclusion on those consolidated financial statements.
/s/ Huang, Shih-Chun | /s/ Hsu, Chien-Yeh |
For and on behalf of PricewaterhouseCoopers, Taiwan
May 10, 2024
Notice to Readers
The accompanying consolidated financial statements are not intended to present the financial position and results of operations and cash flows in accordance with accounting principles generally accepted in countries and jurisdictions other than the Republic of China. The standards, procedures and practices in the Republic of China governing the audit of such financial statements may differ from those generally accepted in countries and jurisdictions other than the Republic of China. Accordingly, the accompanying consolidated financial statements and independent auditors’ review report are not intended for use by those who are not informed about the accounting principles or auditing standards generally accepted in the Republic of China, and their applications in practice. As the financial statements are the responsibility of the management, PricewaterhouseCoopers cannot accept any liability for the use of, or reliance on, the English translation or for any errors or misunderstandings that may derive from the translation.
- 2 -
CHUNGHWA TELECOM CO., LTD. AND SUBSIDIARIES
CONSOLIDATED BALANCE SHEETS
(In Thousands of New Taiwan Dollars)
| March 31, 2024 | December 31, 2023 | March 31, 2023 | ||||||||||||||||||||||
| ASSETS | Amount | % | Amount | % | Amount | % | ||||||||||||||||||
CURRENT ASSETS | ||||||||||||||||||||||||
Cash and cash equivalents (Notes 6 and 37) | $ | 33,330,473 | 6 | $ | 33,823,884 | 6 | $ | 38,715,923 | 7 | |||||||||||||||
Financial assets at fair value through profit or loss (Note 7) | 1,507 | — | 904 | — | 4,293 | — | ||||||||||||||||||
Hedging financial assets (Note 20) | 29 | — | — | — | 1,196 | — | ||||||||||||||||||
Contract assets (Note 29) | 6,985,515 | 1 | 6,713,227 | 1 | 6,123,875 | 1 | ||||||||||||||||||
Trade notes and accounts receivable, net (Notes 9 and 29) | 22,623,592 | 4 | 24,841,995 | 5 | 20,990,008 | 4 | ||||||||||||||||||
Receivables from related parties (Note 37) | 76,646 | — | 78,089 | — | 48,058 | — | ||||||||||||||||||
Inventories (Note 10) | 11,113,440 | 2 | 11,520,765 | 2 | 12,024,091 | 2 | ||||||||||||||||||
Prepayments (Note 11) | 5,921,499 | 1 | 2,839,471 | 1 | 5,484,376 | 1 | ||||||||||||||||||
Other current monetary assets (Notes 12 and 37) | 27,794,732 | 6 | 20,352,050 | 4 | 19,980,438 | 4 | ||||||||||||||||||
Incremental costs of obtaining contracts (Note 29) | 271,077 | — | 210,923 | — | — | — | ||||||||||||||||||
Other current assets (Notes 19 and 38) | 3,120,896 | 1 | 2,822,259 | 1 | 3,841,419 | 1 | ||||||||||||||||||
|
|
|
|
|
|
|
|
|
|
|
| |||||||||||||
Total current assets | 111,239,406 | 21 | 103,203,567 | 20 | 107,213,677 | 20 | ||||||||||||||||||
|
|
|
|
|
|
|
|
|
|
|
| |||||||||||||
NONCURRENT ASSETS | ||||||||||||||||||||||||
Financial assets at fair value through profit or loss (Note 7) | 1,079,847 | — | 1,035,701 | — | 1,073,777 | — | ||||||||||||||||||
Financial assets at fair value through other comprehensive income (Note 8) | 5,068,811 | 1 | 4,412,343 | 1 | 4,040,213 | 1 | ||||||||||||||||||
Investments accounted for using equity method (Note 14) | 8,561,336 | 2 | 8,450,199 | 2 | 7,248,179 | 1 | ||||||||||||||||||
Contract assets (Note 29) | 4,017,392 | 1 | 3,768,645 | 1 | 3,344,517 | 1 | ||||||||||||||||||
Property, plant and equipment (Notes 15, 34, 37 and 38) | 287,065,209 | 55 | 292,337,742 | 56 | 289,265,406 | 56 | ||||||||||||||||||
Right-of-use assets (Notes 16 and 37) | 11,123,239 | 2 | 11,237,814 | 2 | 11,093,820 | 2 | ||||||||||||||||||
Investment properties (Note 17) | 11,516,870 | 2 | 9,805,463 | 2 | 8,993,035 | 2 | ||||||||||||||||||
Intangible assets (Notes 18 and 37) | 71,095,912 | 13 | 72,726,545 | 13 | 77,556,614 | 15 | ||||||||||||||||||
Deferred income tax assets (Note 3) | 2,076,300 | — | 2,099,439 | — | 2,154,497 | — | ||||||||||||||||||
Incremental costs of obtaining contracts (Note 29) | 975,660 | — | 939,409 | — | 954,772 | — | ||||||||||||||||||
Net defined benefit assets (Note 3) | 6,137,580 | 1 | 5,963,259 | 1 | 5,429,492 | 1 | ||||||||||||||||||
Prepayments (Notes 11 and 39) | 3,618,175 | 1 | 3,330,583 | 1 | 1,695,289 | — | ||||||||||||||||||
Other noncurrent assets (Notes 19, 38 and 39) | 4,802,621 | 1 | 4,628,692 | 1 | 4,472,162 | 1 | ||||||||||||||||||
|
|
|
|
|
|
|
|
|
|
|
| |||||||||||||
Total noncurrent assets | 417,138,952 | 79 | 420,735,834 | 80 | 417,321,773 | 80 | ||||||||||||||||||
|
|
|
|
|
|
|
|
|
|
|
| |||||||||||||
TOTAL | $ | 528,378,358 | 100 | $ | 523,939,401 | 100 | $ | 524,535,450 | 100 | |||||||||||||||
|
|
|
|
|
|
|
|
|
|
|
| |||||||||||||
LIABILITIES AND EQUITY | ||||||||||||||||||||||||
CURRENT LIABILITIES | ||||||||||||||||||||||||
Short-term loans (Note 21) | $ | 465,000 | — | $ | 585,000 | — | $ | 341,800 | — | |||||||||||||||
Financial liabilities at fair value through profit or loss (Note 7) | 200 | — | — | — | — | — | ||||||||||||||||||
Hedging financial liabilities (Note 20) | — | — | 44 | — | — | — | ||||||||||||||||||
Contract liabilities (Notes 29 and 39) | 14,293,408 | 3 | 14,088,416 | 3 | 12,898,161 | 2 | ||||||||||||||||||
Trade notes and accounts payable (Note 24) | 9,806,485 | 2 | 14,395,740 | 3 | 9,972,835 | 2 | ||||||||||||||||||
Payables to related parties (Note 37) | 185,951 | — | 385,089 | — | 277,579 | — | ||||||||||||||||||
Current tax liabilities (Note 3) | 6,895,807 | 1 | 4,626,265 | 1 | 7,245,762 | 1 | ||||||||||||||||||
Lease liabilities (Notes 16, 34 and 37) | 3,448,987 | 1 | 3,504,990 | 1 | 3,319,259 | 1 | ||||||||||||||||||
Other payables (Notes 25 and 34) | 22,936,744 | 5 | 25,256,926 | 5 | 21,964,773 | 5 | ||||||||||||||||||
Provisions (Note 26) | 316,748 | — | 337,406 | — | 222,990 | — | ||||||||||||||||||
Current portion of long-term loans (Notes 22 and 38) | 1,600,000 | — | 1,600,000 | — | — | — | ||||||||||||||||||
Other current liabilities | 982,041 | — | 983,339 | — | 974,018 | — | ||||||||||||||||||
|
|
|
|
|
|
|
|
|
|
|
| |||||||||||||
Total current liabilities | 60,931,371 | 12 | 65,763,215 | 13 | 57,217,177 | 11 | ||||||||||||||||||
|
|
|
|
|
|
|
|
|
|
|
| |||||||||||||
NONCURRENT LIABILITIES | ||||||||||||||||||||||||
Long-term loans (Notes 22 and 38) | — | — | — | — | 1,600,000 | — | ||||||||||||||||||
Bonds payable (Note 23) | 30,484,156 | 6 | 30,482,766 | 6 | 30,478,739 | 7 | ||||||||||||||||||
Contract liabilities (Note 29) | 7,559,425 | 2 | 7,560,352 | 2 | 7,665,182 | 2 | ||||||||||||||||||
Deferred income tax liabilities (Note 3) | 2,516,784 | — | 2,460,509 | — | 2,336,333 | — | ||||||||||||||||||
Provisions (Note 26) | 492,286 | — | 485,267 | — | 464,538 | — | ||||||||||||||||||
Lease liabilities (Notes 16, 34 and 37) | 7,398,566 | 1 | 7,470,191 | 2 | 7,243,867 | 1 | ||||||||||||||||||
Customers’ deposits (Note 37) | 5,105,091 | 1 | 5,309,097 | 1 | 5,012,177 | 1 | ||||||||||||||||||
Net defined benefit liabilities (Note 3) | 2,125,559 | — | 2,098,106 | — | 2,266,718 | — | ||||||||||||||||||
Other noncurrent liabilities | 7,125,182 | 1 | 7,405,558 | 1 | 6,759,255 | 1 | ||||||||||||||||||
|
|
|
|
|
|
|
|
|
|
|
| |||||||||||||
Total noncurrent liabilities | 62,807,049 | 11 | 63,271,846 | 12 | 63,826,809 | 12 | ||||||||||||||||||
|
|
|
|
|
|
|
|
|
|
|
| |||||||||||||
Total liabilities | 123,738,420 | 23 | 129,035,061 | 25 | 121,043,986 | 23 | ||||||||||||||||||
|
|
|
|
|
|
|
|
|
|
|
| |||||||||||||
EQUITY ATTRIBUTABLE TO STOCKHOLDERS OF THE PARENT (Notes 13 and 28) | ||||||||||||||||||||||||
Common stocks | 77,574,465 | 15 | 77,574,465 | 15 | 77,574,465 | 15 | ||||||||||||||||||
|
|
|
|
|
|
|
|
|
|
|
| |||||||||||||
Additional paid-in capital | 171,365,339 | 32 | 171,289,086 | 32 | 171,309,798 | 33 | ||||||||||||||||||
|
|
|
|
|
|
|
|
|
|
|
| |||||||||||||
Retained earnings | ||||||||||||||||||||||||
Legal reserve | 77,574,465 | 15 | 77,574,465 | 15 | 77,574,465 | 15 | ||||||||||||||||||
Special reserve | 2,898,503 | 1 | 2,898,503 | 1 | 3,083,569 | 1 | ||||||||||||||||||
Unappropriated earnings | 62,010,096 | 12 | 52,618,677 | 10 | 61,521,942 | 11 | ||||||||||||||||||
|
|
|
|
|
|
|
|
|
|
|
| |||||||||||||
Total retained earnings | 142,483,064 | 28 | 133,091,645 | 26 | 142,179,976 | 27 | ||||||||||||||||||
|
|
|
|
|
|
|
|
|
|
|
| |||||||||||||
Others | 1,080,707 | — | 352,892 | — | 266,822 | — | ||||||||||||||||||
|
|
|
|
|
|
|
|
|
|
|
| |||||||||||||
Total equity attributable to stockholders of the parent | 392,503,575 | 75 | 382,308,088 | 73 | 391,331,061 | 75 | ||||||||||||||||||
NONCONTROLLING INTERESTS (Notes 13 and 28) | 12,136,363 | 2 | 12,596,252 | 2 | 12,160,403 | 2 | ||||||||||||||||||
|
|
|
|
|
|
|
|
|
|
|
| |||||||||||||
Total equity | 404,639,938 | 77 | 394,904,340 | 75 | 403,491,464 | 77 | ||||||||||||||||||
|
|
|
|
|
|
|
|
|
|
|
| |||||||||||||
TOTAL | $ | 528,378,358 | 100 | $ | 523,939,401 | 100 | $ | 524,535,450 | 100 | |||||||||||||||
|
|
|
|
|
|
|
|
|
|
|
| |||||||||||||
The accompanying notes are an integral part of the consolidated financial statements.
- 3 -
CHUNGHWA TELECOM CO., LTD. AND SUBSIDIARIES
CONSOLIDATED STATEMENTS OF COMPREHENSIVE INCOME
(In Thousands of New Taiwan Dollars, Except Earnings Per Share)
| Three Months Ended March 31 | ||||||||||||||||
| 2024 | 2023 | |||||||||||||||
| Amount | % | Amount | % | |||||||||||||
REVENUES (Notes 29, 37 and 42) | $ | 54,943,471 | 100 | $ | 54,210,905 | 100 | ||||||||||
OPERATING COSTS (Notes 10, 27, 30 and 37) | 34,454,292 | 63 | 33,629,816 | 62 | ||||||||||||
|
|
|
|
|
|
|
| |||||||||
GROSS PROFIT | 20,489,179 | 37 | 20,581,089 | 38 | ||||||||||||
|
|
|
|
|
|
|
| |||||||||
OPERATING EXPENSES (Notes 9, 27, 30 and 37) | ||||||||||||||||
Marketing | 5,931,519 | 11 | 5,671,750 | 11 | ||||||||||||
General and administrative | 1,637,107 | 3 | 1,657,125 | 3 | ||||||||||||
Research and development | 943,067 | 1 | 978,038 | 2 | ||||||||||||
Expected credit loss | 55,786 | — | 100,368 | — | ||||||||||||
|
|
|
|
|
|
|
| |||||||||
Total operating expenses | 8,567,479 | 15 | 8,407,281 | 16 | ||||||||||||
|
|
|
|
|
|
|
| |||||||||
OTHER INCOME AND EXPENSES (Note 30) | 2,520 | — | (44 | ) | — | |||||||||||
|
|
|
|
|
|
|
| |||||||||
INCOME FROM OPERATIONS | 11,924,220 | 22 | 12,173,764 | 22 | ||||||||||||
|
|
|
|
|
|
|
| |||||||||
NON-OPERATING INCOME AND EXPENSES | ||||||||||||||||
Interest income (Note 37) | 155,800 | — | 117,711 | — | ||||||||||||
Other income (Notes 30 and 37) | 37,769 | — | 44,786 | — | ||||||||||||
Other gains and losses (Notes 30, 36 and 37) | (61,264 | ) | — | (103,964 | ) | — | ||||||||||
Interest expense (Notes 16, 30 and 37) | (83,287 | ) | — | (75,412 | ) | — | ||||||||||
Share of profits of associates and joint ventures accounted for using equity method (Note 14) | 14,502 | — | 103,108 | — | ||||||||||||
|
|
|
|
|
|
|
| |||||||||
Total non-operating income and expenses | 63,520 | — | 86,229 | — | ||||||||||||
|
|
|
|
|
|
|
| |||||||||
INCOME BEFORE INCOME TAX | 11,987,740 | 22 | 12,259,993 | 22 | ||||||||||||
INCOME TAX EXPENSE (Notes 3 and 31) | 2,383,557 | 4 | 2,386,947 | 4 | ||||||||||||
|
|
|
|
|
|
|
| |||||||||
NET INCOME | 9,604,183 | 18 | 9,873,046 | 18 | ||||||||||||
|
|
|
|
|
|
|
| |||||||||
TOTAL OTHER COMPREHENSIVE INCOME (LOSS) | ||||||||||||||||
Items that will not be reclassified to profit or loss: | ||||||||||||||||
Unrealized gain or loss on investments in equity instruments at fair value through other comprehensive income (Notes 28 and 36) | 626,468 | 1 | 548,832 | 1 | ||||||||||||
(Continued)
- 4 -
CHUNGHWA TELECOM CO., LTD. AND SUBSIDIARIES
CONSOLIDATED STATEMENTS OF COMPREHENSIVE INCOME
(In Thousands of New Taiwan Dollars, Except Earnings Per Share)
| Three Months Ended March 31 | ||||||||||||||||
| 2024 | 2023 | |||||||||||||||
| Amount | % | Amount | % | |||||||||||||
Gain or loss on hedging instruments subject to basis adjustment (Note 20) | $ | 73 | — | $ | (11,695 | ) | — | |||||||||
Share of other comprehensive income of associates and joint ventures (Note 14) | (124 | ) | — | 10,113 | — | |||||||||||
|
|
|
|
|
|
|
| |||||||||
| 626,417 | 1 | 547,250 | 1 | |||||||||||||
|
|
|
|
|
|
|
| |||||||||
Items that may be reclassified subsequently to profit or loss: | ||||||||||||||||
Exchange differences arising from the translation of the foreign operations | 103,779 | — | (47,223 | ) | — | |||||||||||
Share of other comprehensive loss of associates and joint ventures (Note 14) | 25,632 | — | (820 | ) | — | |||||||||||
|
|
|
|
|
|
|
| |||||||||
| 129,411 | — | (48,043 | ) | — | ||||||||||||
|
|
|
|
|
|
|
| |||||||||
Total other comprehensive income, net of income tax | 755,828 | 1 | 499,207 | 1 | ||||||||||||
|
|
|
|
|
|
|
| |||||||||
TOTAL COMPREHENSIVE INCOME | $ | 10,360,011 | 19 | $ | 10,372,253 | 19 | ||||||||||
|
|
|
|
|
|
|
| |||||||||
NET INCOME ATTRIBUTABLE TO | ||||||||||||||||
Stockholders of the parent | $ | 9,391,419 | 18 | $ | 9,643,255 | 18 | ||||||||||
Noncontrolling interests | 212,764 | — | 229,791 | — | ||||||||||||
|
|
|
|
|
|
|
| |||||||||
| $ | 9,604,183 | 18 | $ | 9,873,046 | 18 | |||||||||||
|
|
|
|
|
|
|
| |||||||||
COMPREHENSIVE INCOME ATTRIBUTABLE TO | ||||||||||||||||
Stockholders of the parent | $ | 10,119,234 | 19 | $ | 10,143,274 | 19 | ||||||||||
Noncontrolling interests | 240,777 | — | 228,979 | — | ||||||||||||
|
|
|
|
|
|
|
| |||||||||
| $ | 10,360,011 | 19 | $ | 10,372,253 | 19 | |||||||||||
|
|
|
|
|
|
|
| |||||||||
EARNINGS PER SHARE (Note 32) | ||||||||||||||||
Basic | $ | 1.21 | $ | 1.24 | ||||||||||||
|
|
|
| |||||||||||||
Diluted | $ | 1.21 | $ | 1.24 | ||||||||||||
|
|
|
| |||||||||||||
| The accompanying notes are an integral part of the consolidated financial statements. | (Concluded) |
- 5 -
CHUNGHWA TELECOM CO., LTD. AND SUBSIDIARIES
CONSOLIDATED STATEMENTS OF CHANGES IN EQUITY
(In Thousands of New Taiwan Dollars)
| Equity Attributable to Stockholders of the Parent (Notes 13, 20 and 28) | ||||||||||||||||||||||||||||||||||||||||||||
| Others | ||||||||||||||||||||||||||||||||||||||||||||
Unrealized Gain or Loss on Financial Assets at Fair Value Through Other Comprehensive | ||||||||||||||||||||||||||||||||||||||||||||
Exchange Differences Arising from the Translation the Foreign | ||||||||||||||||||||||||||||||||||||||||||||
| Retained Earnings | Gain or Loss on Hedging | Noncontrolling Interests and 28) | ||||||||||||||||||||||||||||||||||||||||||
| Common Stocks | Additional Paid-in Capital | Legal Reserve | Special Reserve | Unappropriated Earnings | Total | Total Equity | ||||||||||||||||||||||||||||||||||||||
BALANCE, JANUARY 1, 2023 | $ | 77,574,465 | $ | 171,300,898 | $ | 77,574,465 | $ | 3,083,569 | $ | 51,868,574 | $ | (111,213 | ) | $ | (124,762 | ) | $ | 12,891 | $ | 381,178,887 | $ | 12,599,541 | $ | 393,778,428 | ||||||||||||||||||||
Cash dividends by subsidiaries | — | — | — | — | — | — | — | — | — | (676,862 | ) | (676,862 | ) | |||||||||||||||||||||||||||||||
Net income for the three months ended March 31, 2023 | — | — | — | — | 9,643,255 | — | — | — | 9,643,255 | 229,791 | 9,873,046 | |||||||||||||||||||||||||||||||||
Other comprehensive income (loss) for the three months ended March 31, 2023 | — | — | — | — | 10,113 | (44,875 | ) | 546,476 | (11,695 | ) | 500,019 | (812 | ) | 499,207 | ||||||||||||||||||||||||||||||
|
|
|
|
|
|
|
|
|
|
|
|
|
|
|
|
|
|
|
|
|
| |||||||||||||||||||||||
Total comprehensive income (loss) for the three months ended March 31, 2023 | — | — | — | — | 9,653,368 | (44,875 | ) | 546,476 | (11,695 | ) | 10,143,274 | 228,979 | 10,372,253 | |||||||||||||||||||||||||||||||
|
|
|
|
|
|
|
|
|
|
|
|
|
|
|
|
|
|
|
|
|
| |||||||||||||||||||||||
Share-based payment transactions of subsidiaries | — | 8,900 | — | — | — | — | — | — | 8,900 | (6,428 | ) | 2,472 | ||||||||||||||||||||||||||||||||
Net increase in noncontrolling interests | — | — | — | — | — | — | — | — | — | 15,173 | 15,173 | |||||||||||||||||||||||||||||||||
|
|
|
|
|
|
|
|
|
|
|
|
|
|
|
|
|
|
|
|
|
| |||||||||||||||||||||||
BALANCE, MARCH 31, 2023 | $ | 77,574,465 | $ | 171,309,798 | $ | 77,574,465 | $ | 3,083,569 | $ | 61,521,942 | $ | (156,088 | ) | $ | 421,714 | $ | 1,196 | $ | 391,331,061 | $ | 12,160,403 | $ | 403,491,464 | |||||||||||||||||||||
|
|
|
|
|
|
|
|
|
|
|
|
|
|
|
|
|
|
|
|
|
| |||||||||||||||||||||||
BALANCE, JANUARY 1, 2024 | $ | 77,574,465 | $ | 171,289,086 | $ | 77,574,465 | $ | 2,898,503 | $ | 52,618,677 | $ | (167,812 | ) | $ | 520,748 | $ | (44 | ) | $ | 382,308,088 | $ | 12,596,252 | $ | 394,904,340 | ||||||||||||||||||||
Cash dividends by subsidiaries | — | — | — | — | — | — | — | — | — | (716,689 | ) | (716,689 | ) | |||||||||||||||||||||||||||||||
Change in additional paid-in capital from investments in associates and joint ventures accounted for using equity method | — | 76,658 | — | — | — | — | — | — | 76,658 | — | 76,658 | |||||||||||||||||||||||||||||||||
Net income for the three months ended March 31, 2024 | — | — | — | — | 9,391,419 | — | — | — | 9,391,419 | 212,764 | 9,604,183 | |||||||||||||||||||||||||||||||||
Other comprehensive income for the three months ended March 31, 2024 | — | — | — | — | — | 101,022 | 626,720 | 73 | 727,815 | 28,013 | 755,828 | |||||||||||||||||||||||||||||||||
|
|
|
|
|
|
|
|
|
|
|
|
|
|
|
|
|
|
|
|
|
| |||||||||||||||||||||||
Total comprehensive income for the three months ended March 31, 2024 | — | — | — | — | 9,391,419 | 101,022 | 626,720 | 73 | 10,119,234 | 240,777 | 10,360,011 | |||||||||||||||||||||||||||||||||
|
|
|
|
|
|
|
|
|
|
|
|
|
|
|
|
|
|
|
|
|
| |||||||||||||||||||||||
Share-based payment transactions of subsidiaries | — | (405 | ) | — | — | — | — | — | — | (405 | ) | 16,023 | 15,618 | |||||||||||||||||||||||||||||||
|
|
|
|
|
|
|
|
|
|
|
|
|
|
|
|
|
|
|
|
|
| |||||||||||||||||||||||
BALANCE, MARCH 31, 2024 | $ | 77,574,465 | $ | 171,365,339 | $ | 77,574,465 | $ | 2,898,503 | $ | 62,010,096 | $ | (66,790 | ) | $ | 1,147,468 | $ | 29 | $ | 392,503,575 | $ | 12,136,363 | $ | 404,639,938 | |||||||||||||||||||||
|
|
|
|
|
|
|
|
|
|
|
|
|
|
|
|
|
|
|
|
|
| |||||||||||||||||||||||
The accompanying notes are an integral part of the consolidated financial statements.
- 6 -
CHUNGHWA TELECOM CO., LTD. AND SUBSIDIARIES
CONSOLIDATED STATEMENTS OF CASH FLOWS
(In Thousands of New Taiwan Dollars)
| Three Months Ended March 31 | ||||||||
| 2024 | 2023 | |||||||
CASH FLOWS FROM OPERATING ACTIVITIES | ||||||||
Income before income tax | $ | 11,987,740 | $ | 12,259,993 | ||||
Adjustments for: | ||||||||
Depreciation | 8,236,489 | 8,203,942 | ||||||
Amortization | 1,672,272 | 1,677,506 | ||||||
Amortization of incremental costs of obtaining contracts | 214,720 | 214,202 | ||||||
Expected credit loss | 55,786 | 100,368 | ||||||
Interest expense | 83,287 | 75,412 | ||||||
Interest income | (155,800 | ) | (117,711 | ) | ||||
Compensation cost of share-based payment transactions | 2,373 | 2,472 | ||||||
Share of profits of associates and joint ventures accounted for using equity method | (14,502 | ) | (103,108 | ) | ||||
Loss (gain) on disposal of property, plant and equipment | (2,520 | ) | 44 | |||||
Gain on disposal of financial instruments | (1,073 | ) | — | |||||
Provision for impairment loss and obsolescence of inventory | 25,576 | 5,274 | ||||||
Valuation loss on financial assets and liabilities at fair value through profit or loss, net | 61,657 | 46,086 | ||||||
Others | 16,442 | 8,671 | ||||||
Changes in operating assets and liabilities: | ||||||||
Decrease (increase) in: | ||||||||
Contract assets | (522,119 | ) | (277,030 | ) | ||||
Trade notes and accounts receivable | 2,163,421 | 3,585,668 | ||||||
Receivables from related parties | 1,443 | 27,003 | ||||||
Inventories | 381,749 | (712,959 | ) | |||||
Prepayments | (3,028,232 | ) | (3,052,780 | ) | ||||
Other current monetary assets | 33,411 | (502,578 | ) | |||||
Other current assets | (298,637 | ) | (285,996 | ) | ||||
Incremental cost of obtaining contracts | (311,125 | ) | (189,060 | ) | ||||
Increase (decrease) in: | ||||||||
Contract liabilities | 204,065 | (501,191 | ) | |||||
Trade notes and accounts payable | (4,589,472 | ) | (6,455,842 | ) | ||||
Payables to related parties | (199,138 | ) | (261,615 | ) | ||||
Other payables | (1,628,332 | ) | (2,536,258 | ) | ||||
Provisions | (13,639 | ) | 288,476 | |||||
Other current liabilities | (506 | ) | (33,209 | ) | ||||
Net defined benefit plans | (146,868 | ) | (182,277 | ) | ||||
|
|
|
| |||||
Cash generated from operations | 14,228,468 | 11,283,503 | ||||||
Interests paid | (65,425 | ) | (57,461 | ) | ||||
Income taxes paid | (34,601 | ) | (20,014 | ) | ||||
|
|
|
| |||||
Net cash provided by operating activities | 14,128,442 | 11,206,028 | ||||||
|
|
|
| |||||
(Continued)
- 7 -
CHUNGHWA TELECOM CO., LTD. AND SUBSIDIARIES
CONSOLIDATED STATEMENTS OF CASH FLOWS
(In Thousands of New Taiwan Dollars)
| Three Months Ended March 31 | ||||||||
| 2024 | 2023 | |||||||
CASH FLOWS FROM INVESTING ACTIVITIES | ||||||||
Acquisition of financial assets at fair value through other comprehensive income | $ | (30,000 | ) | $ | — | |||
Proceeds from capital reduction of financial assets at fair value through other comprehensive income | 3,326 | — | ||||||
Acquisition of financial assets at fair value through profit or loss | (109,617 | ) | (100,000 | ) | ||||
Proceeds from disposal of financial assets at fair value through profit or loss | 4,468 | — | ||||||
Proceeds from capital reduction and profit distribution of financial assets at fair value through profit or loss | 16 | — | ||||||
Acquisition of time deposits, negotiable certificates of deposit and commercial paper with maturities of more than three months | (19,413,662 | ) | (16,105,875 | ) | ||||
Proceeds from disposal of time deposits, negotiable certificates of deposit and commercial paper with maturities of more than three months | 11,842,467 | 261,404 | ||||||
Acquisition of property, plant and equipment | (5,042,549 | ) | (5,418,138 | ) | ||||
Proceeds from disposal of property, plant and equipment | 4,914 | 3,469 | ||||||
Acquisition of intangible assets | (40,274 | ) | (46,118 | ) | ||||
Decrease (increase) in other noncurrent assets | (165,262 | ) | 211,373 | |||||
Increase in prepayments for leases | (341,388 | ) | — | |||||
Interests received | 149,223 | 99,089 | ||||||
Dividends received | 150,946 | — | ||||||
|
|
|
| |||||
Net cash used in investing activities | (12,987,392 | ) | (21,094,796 | ) | ||||
|
|
|
| |||||
CASH FLOWS FROM FINANCING ACTIVITIES | ||||||||
Proceeds from short-term loans | 265,000 | 855,800 | ||||||
Repayments of short-term loans | (385,000 | ) | (1,236,000 | ) | ||||
Decrease in customers’ deposits | (204,798 | ) | (153,475 | ) | ||||
Payments for the principal of lease liabilities | (1,055,215 | ) | (1,090,899 | ) | ||||
Increase (decrease) in other noncurrent liabilities | (280,376 | ) | 33,068 | |||||
Cash dividends distributed to noncontrolling interests | (4,283 | ) | (5,639 | ) | ||||
Change in other noncontrolling interests | 13,245 | 15,173 | ||||||
|
|
|
| |||||
Net cash used in financing activities | (1,651,427 | ) | (1,581,972 | ) | ||||
|
|
|
| |||||
EFFECT OF EXCHANGE RATE CHANGES ON CASH AND CASH EQUIVALENTS | 16,966 | (5,941 | ) | |||||
|
|
|
| |||||
NET DECREASE IN CASH AND CASH EQUIVALENTS | (493,411 | ) | (11,476,681 | ) | ||||
CASH AND CASH EQUIVALENTS, BEGINNING OF PERIOD | 33,823,884 | 50,192,604 | ||||||
|
|
|
| |||||
CASH AND CASH EQUIVALENTS, END OF PERIOD | $ | 33,330,473 | $ | 38,715,923 | ||||
|
|
|
| |||||
| The accompanying notes are an integral part of the consolidated financial statements. | (Concluded) |
- 8 -
CHUNGHWA TELECOM CO., LTD. AND SUBSIDIARIES
NOTES TO CONSOLIDATED FINANCIAL STATEMENTS
THREE MONTHS ENDED MARCH 31, 2024 AND 2023
(In Thousands of New Taiwan Dollars, Unless Stated Otherwise)
| 1. | GENERAL |
Chunghwa Telecom Co., Ltd. (“Chunghwa”; Chunghwa together with its subsidiaries are hereinafter referred to collectively as the “Company”.) was incorporated on July 1, 1996 in the Republic of China (“ROC”). Chunghwa is a company limited by shares and, prior to August 2000, was wholly owned by the Ministry of Transportation and Communications (“MOTC”). Prior to July 1, 1996, the current operations of Chunghwa were carried out under the Directorate General of Telecommunications (“DGT”). The DGT was established by the MOTC in June 1943 to take primary responsibility in the development of telecommunications infrastructure and to formulate policies related to telecommunications. On July 1, 1996, the telecom operations of the DGT were spun-off as Chunghwa which continues to carry out the business and the DGT continues to be the industry regulator.
Effective August 12, 2005, the MOTC completed the process of privatizing Chunghwa by reducing the government ownership to below 50% in various stages. In July 2000, Chunghwa received approval from the Securities and Futures Commission (the “SFC”) for a domestic initial public offering and its common stocks were listed and traded on the Taiwan Stock Exchange (the “TWSE”) on October 27, 2000. Certain of Chunghwa’s common stocks were sold, in connection with the foregoing privatization plan, in domestic public offerings at various dates from August 2000 to July 2003. Certain of Chunghwa’s common stocks were also sold in an international offering of securities in the form of American Depository Shares (“ADS”) on July 17, 2003 and were listed and traded on the New York Stock Exchange (the “NYSE”). The MOTC sold common stocks of Chunghwa by auction in the ROC on August 9, 2005 and completed the second international offering on August 10, 2005. Upon completion of the share transfers associated with these offerings on August 12, 2005, the MOTC owned less than 50% of the outstanding shares of Chunghwa and completed the privatization plan.
The consolidated financial statements are presented in Chunghwa’s functional currency, New Taiwan dollars.
| 2. | APPROVAL OF FINANCIAL STATEMENTS |
The consolidated financial statements were approved by the Board of Directors on May 10, 2024.
| 3. | SUMMARY OF MATERIAL ACCOUNTING POLICY INFORMATION |
Except for the following items, the accounting policies applied in these consolidated financial statements are consistent with those applied in the consolidated financial statements for the year ended December 31, 2023. Please refer to the consolidated financial statements for the year ended December 31, 2023 for the details.
Statement of Compliance
The accompanying consolidated financial statements have been prepared in conformity with the Regulations Governing the Preparation of Financial Reports by Securities Issuers and the International Accounting Standard 34 “Interim Financial Reporting” endorsed and issued into effect by the Financial Supervisory Commission (the “FSC”). The consolidated financial statements do not present all the disclosures required for a complete set of annual consolidated financial statements as required by International Financial Reporting Standards (IFRS), International Accounting Standards (IAS), International Financial Reporting Interpretations Committee (IFRIC) and SIC Interpretations (SIC) (collectively, the “IFRSs”) endorsed and issued into effect by the FSC.
- 9 -
Basis of Consolidation
The detail information of the subsidiaries at the end of reporting period was as follows:
| Percentage of Ownership Interests | ||||||||||||
| Name of Investor | Name of Investee | Main Businesses and Products | March 31, 2024 | December 31, 2023 | March 31, 2023 | Note | ||||||
Chunghwa Telecom Co., Ltd. | Senao International Co., Ltd. (“SENAO”) | Handset and peripherals retailer, sales of CHT mobile phone plans as an agent | 28 | 28 | 28 | a. | ||||||
Light Era Development Co., Ltd. (“LED”) | Planning and development of real estate and intelligent buildings, and property management | 100 | 100 | 100 | ||||||||
Donghwa Telecom Co., Ltd. (“DHT”) | International private leased circuit, IP VPN service, and IP transit services | 100 | 100 | 100 | ||||||||
Chunghwa Telecom Singapore Pte., Ltd. (“CHTS”) | International private leased circuit, IP VPN service, and IP transit services | 100 | 100 | 100 | ||||||||
Chunghwa System Integration Co., Ltd. (“CHSI”) | Providing system integration services and telecommunications equipment | 100 | 100 | 100 | ||||||||
Chunghwa Investment Co., Ltd. (“CHI”) | Investment | 89 | 89 | 89 | ||||||||
CHIEF Telecom Inc. (“CHIEF”) | Network integration, internet data center (“IDC”), communications integration and cloud application services | 56 | 56 | 56 | b. | |||||||
CHYP Multimedia Marketing & Communications Co., Ltd. (“CHYP”) | Digital information supply services and advertisement services | 100 | 100 | 100 | ||||||||
Prime Asia Investments Group Ltd. (“Prime Asia”) | Investment | 100 | 100 | 100 | ||||||||
Spring House Entertainment Tech. Inc. (“SHE”) | Software design services, internet contents production and play, and motion picture production and distribution | 56 | 56 | 56 | ||||||||
Chunghwa Telecom Global, Inc. (“CHTG”) | International private leased circuit, internet services, and transit services | 100 | 100 | 100 | ||||||||
Chunghwa Telecom Vietnam Co., Ltd. (“CHTV”) | Intelligent energy saving solutions, international circuit, and information and communication technology (“ICT”) services. | 100 | 100 | 100 | ||||||||
Smartfun Digital Co., Ltd. (“SFD”) | Providing diversified family education digital services | 65 | 65 | 65 | ||||||||
Chunghwa Telecom Japan Co., Ltd. (“CHTJ”) | International private leased circuit, IP VPN service, and IP transit services | 100 | 100 | 100 | ||||||||
Chunghwa Sochamp Technology Inc. (“CHST”) | Design, development and production of Automatic License Plate Recognition software and hardware | 37 | 37 | 37 | c. | |||||||
Honghwa International Co., Ltd. (“HHI”) | Telecommunications engineering, sales agent of mobile phone plan application and other business services, etc. | 100 | 100 | 100 | ||||||||
Chunghwa Leading Photonics Tech Co., Ltd. (“CLPT”) | Production and sale of electronic components and finished products | 75 | 75 | 75 | d. | |||||||
Chunghwa Telecom (Thailand) Co., Ltd. (“CHTT”) | International private leased circuit, IP VPN service, ICT and cloud VAS services | 100 | 100 | 100 | ||||||||
(Continued)
- 10 -
| Percentage of Ownership Interests | ||||||||||||
| Name of Investor | Name of Investee | Main Businesses and Products | March 31, 2024 | December 31, 2023 | March 31, 2023 | Note | ||||||
CHT Security Co., Ltd. (“CHTSC”) | Computing equipment installation, wholesale of computing and business machinery equipment and software, management consulting services, data processing services, digital information supply services and internet identity services | 66 | 69 | 71 | e. | |||||||
International Integrated Systems, Inc. (“IISI”) | IT solution provider, IT application consultation, system integration and package solution | 51 | 51 | 51 | ||||||||
Chunghwa Digital Cultural and Creative Capital Co., Ltd (“CDCC Capital”) | Investment and management consulting | 100 | — | — | f. | |||||||
Senao International Co., Ltd. | Senao International (Samoa) Holding Ltd. (“SIS”) | International investment | — | — | 100 | g. | ||||||
Youth Co., Ltd. (“Youth”) | Sale of information and communication technologies products | 96 | 96 | 96 | ||||||||
Aval Technologies Co., Ltd. (“Aval”) | Sale of information and communication technologies products | 100 | 100 | 100 | ||||||||
Senyoung Insurance Agent Co., Ltd. (“SENYOUNG”) | Property and liability insurance agency | 100 | 100 | 100 | ||||||||
Youth Co., Ltd. | ISPOT Co., Ltd. (“ISPOT”) | Sale of information and communication technologies products | 100 | 100 | 100 | |||||||
Youyi Co., Ltd. (“Youyi”) | Maintenance of information and communication technologies products | — | — | 100 | h. | |||||||
Aval Technologies Co., Ltd. | Wiin Technology Co., Ltd. (“Wiin”) | Sale of information and communication technologies products | 100 | 100 | 100 | |||||||
Senyoung Insurance Agent Co., Ltd. | Senaolife Insurance Agent Co., Ltd. (“Senaolife”) | Life insurance services | — | — | 100 | i. | ||||||
CHIEF Telecom Inc. | Unigate Telecom Inc. (“Unigate”) | Telecommunications and internet service | 100 | 100 | 100 | |||||||
Chief International Corp. (“CIC”) | Telecommunications and internet service | 100 | 100 | 100 | ||||||||
Shanghai Chief Telecom Co., Ltd. (“SCT”) | Telecommunications and internet service | 49 | 49 | 49 | j. | |||||||
Chunghwa Investment Co., Ltd. | Chunghwa Precision Test Tech. Co., Ltd. (“CHPT”) | Production and sale of semiconductor testing components and printed circuit board | 34 | 34 | 34 | k. | ||||||
Chunghwa Precision Test Tech. Co., Ltd. | Chunghwa Precision Test Tech. USA Corporation (“CHPT (US)”) | Design and after-sale services of semiconductor testing components and printed circuit board | 100 | 100 | 100 | |||||||
CHPT Japan Co., Ltd. (“CHPT (JP)”) | Related services of electronic parts, machinery processed products and printed circuit board | 100 | 100 | 100 | ||||||||
Chunghwa Precision Test Tech. International, Ltd. (“CHPT (International)”) | Wholesale and retail of electronic materials, and investment | 100 | 100 | 100 | ||||||||
TestPro Investment Co., Ltd. (“TestPro”) | Investment | 100 | 100 | 100 | ||||||||
(Continued)
- 11 -
| Percentage of Ownership Interests | ||||||||||||
| Name of Investor | Name of Investee | Main Businesses and Products | March 31, 2024 | December 31, 2023 | March 31, 2023 | Note | ||||||
TestPro Investment Co., Ltd. (“TestPro”) | NavCore Tech. Co., Ltd (“NavCore”) | Sale and manufacturing of smart equipment, smart factory software and hardware integration and technical consulting service | 54 | 54 | 54 | |||||||
Senao International (Samoa) Holding Ltd. | Senao International HK Limited (“SIHK”) | International investment | — | — | 100 | l. | ||||||
Prime Asia Investments Group Ltd. | Chunghwa Hsingta Co., Ltd. (“CHC”) | Investment | 100 | 100 | 100 | |||||||
Chunghwa Precision Test Tech. International, Ltd. | Shanghai Taihua Electronic Technology Limited (“STET”) | Design of printed circuit board and related consultation service | 100 | 100 | 100 | |||||||
Su Zhou Precision Test Tech. Ltd. (“SZPT”) | Assembly processed of circuit board, design of printed circuit board and related consultation service | 100 | 100 | 100 | ||||||||
International Integrated Systems, Inc. | Infoexplorer International Co., Ltd.(“IESA”) | Investment | — | — | 100 | m. | ||||||
Unitronics Technology Corp. (“UTC”) | Development and maintenance of information system | 100 | 100 | 99.96 | n. | |||||||
Infoexplorer International Co., Ltd. | International Integrated Systems (Hong Kong) Limited (“IEHK”) | Investment and technical consulting service | — | — | 100 | o. | ||||||
(Concluded)
| a. | Chunghwa continues to control more than half of seats of the Board of Directors of SENAO through the support of large beneficial stockholders. As a result, the Company treated SENAO as a subsidiary. |
| b. | CHIEF issued new shares in December 2023 as its employees exercised options. Therefore, the Company’s ownership interest in CHIEF decreased to 58.63% as of December 31, 2023. |
| c. | Chunghwa continues to control three out of five seats of the Board of Directors of CHST. As a result, the Company treated CHST as a subsidiary. |
| d. | CLPT issued new shares in May 2023 as its employees exercised options. Therefore, the Company’s ownership interest in CLPT decreased to 74.56% as of December 31, 2023. |
| e. | CHTSC issued new shares in February 2023, May 2023, January 2024 and March 2024 as its employees exercised options. Therefore, the Company’s ownership interest in CHTSC decreased to 70.91%, 69.28% and 66.08% as of March 31, 2023, December 31, 2023 and March 31, 2024, respectively. |
| f. | Chunghwa invested and established CDCC Capital in February 2024. Chunghwa obtained 100% ownership interest of CDCC Capital. |
| g. | SIS completed its liquidation in September 2023. |
| h. | Youyi completed its liquidation in November 2023. |
- 12 -
| i. | In order to coordinate with financial planning and adjustment of organizational resources, the Board of Directors of SENYOUNG approved the merger with Senaolife. SENYOUNG was the surviving company. The merger was completed on May 1, 2023. |
| j. | CHIEF has two out of three seats of the Board of Directors of SCT according to the mutual agreements among stockholders and gained control over SCT; hence, SCT is deemed as a subsidiary of the Company. |
| k. | Though the Company’s ownership interest in CHPT is less than 50%, the management considered the absolute and relative size of ownership interest, and the dispersion of shares owned by the other stockholders and concluded that the Company has a sufficiently dominant voting interest to direct the relevant activities; hence, CHPT is deemed as a subsidiary of the Company. |
| l. | SIHK completed its liquidation in July 2023. |
| m. | IESA completed its liquidation in September 2023. |
| n. | IISI purchased shares of UTC in August 2023. Therefore, the Company’s ownership interest in UTC increased to 100% as of December 31, 2023. |
| o. | IEHK completed its liquidation in June 2023. |
The following diagram presented information regarding the relationship and percentages of ownership interests between Chunghwa and its subsidiaries as of March 31, 2024.
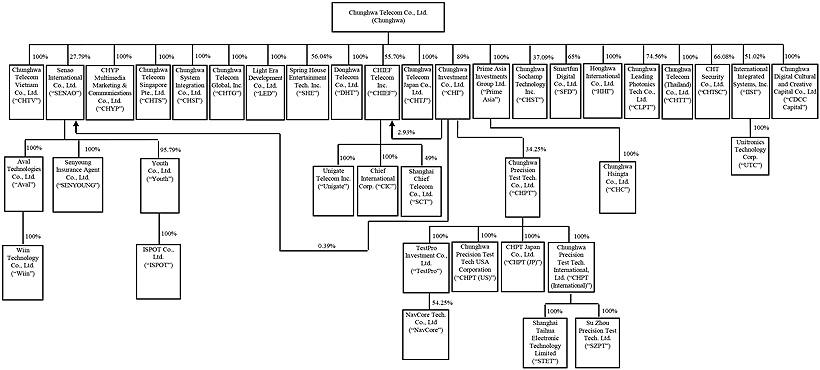
- 13 -
Other Material Accounting Policies
| a. | Defined benefit retirement benefits |
Pension cost for an interim period is calculated on a year-to-date basis by using the actuarially determined pension cost rate at the end of the prior financial year, adjusted for significant market fluctuations since that time and for other significant one-off events.
| b. | Taxation |
Income tax expense represents the sum of the tax currently payable and deferred tax. Income taxes for interim period are assessed on an annual basis and calculated by applying to an interim period’s pre-tax income the tax rate that would be applicable to expected total annual earnings.
The measurement of deferred tax assets and liabilities reflects the tax consequences that would follow from the manner in which the Company expects to recover or settle the carrying amount of its assets and liabilities at balance sheet date.
| 4. | MATERIAL ACCOUNTING JUDGMENTS AND KEY SOURCES OF ESTIMATION, UNCERTAINTY AND ASSUMPTION |
In the application of the Company’s accounting policies, the management is required to make judgments, estimates and assumptions which are based on historical experience and other factors that are not readily apparent from other sources. Actual results may differ from these estimates. The estimates and underlying assumptions are reviewed by the management on an ongoing basis.
For the material accounting judgments and key sources of estimation, uncertainty and assumption applied in these consolidated financial statements, please refer to the consolidated financial statements for the year ended December 31, 2023.
| 5. | APPLICATION OF NEW AND REVISED STANDARDS AND INTERPRETATIONS |
| a. | Initial application of the amendments to the IFRSs endorsed and issued into effect by the FSC |
The initial application of the amendments to the IFRSs issued by the International Accounting Standards Board and endorsed and issued into effect by the FSC does not have a material impact on the Company’s consolidated financial statements.
| b. | IFRSs issued by the IASB but not yet endorsed and issued into effect by the FSC |
New, Revised or Amended Standards and Interpretations | Effective Date Announced by IASB | |||
| Amendments to IFRS 10 and IAS 28 | Sale or Contribution of Assets between An Investor and Its Associate or Joint Venture | To be determined by IASB | ||
| IFRS 18 | Presentation and Disclosure in Financial Statements | January 1, 2027 | ||
| Amendments to IAS 21 | Lack of Exchangeability | January 1, 2025 | ||
As of the date the consolidated financial statements were authorized for issue, the Company is continuously assessing the possible impact that the application of above standards and interpretations will have on the Company’s financial position and operating result and will disclose the relevant impact when the assessment is completed.
- 14 -
| 6. | CASH AND CASH EQUIVALENTS |
| March 31, 2024 | December 31, 2023 | March 31, 2023 | ||||||||||
Cash | ||||||||||||
Cash on hand | $ | 437,166 | $ | 403,536 | $ | 392,266 | ||||||
Bank deposits | 10,089,820 | 9,522,341 | 9,970,391 | |||||||||
|
|
|
|
|
| |||||||
| 10,526,986 | 9,925,877 | 10,362,657 | ||||||||||
|
|
|
|
|
| |||||||
Cash equivalents (with maturities of less than three months) | ||||||||||||
Commercial paper | 11,213,868 | 14,496,056 | 17,123,316 | |||||||||
Negotiable certificates of deposit | 8,300,000 | 5,900,000 | 6,800,000 | |||||||||
Time deposits | 3,288,653 | 3,501,671 | 4,429,950 | |||||||||
Stimulus vouchers | 966 | 280 | — | |||||||||
|
|
|
|
|
| |||||||
| 22,803,487 | 23,898,007 | 28,353,266 | ||||||||||
|
|
|
|
|
| |||||||
| $ | 33,330,473 | $ | 33,823,884 | $ | 38,715,923 | |||||||
|
|
|
|
|
| |||||||
The annual yield rates of bank deposits, commercial paper, negotiable certificates of deposit and time deposits as of balance sheet dates were as follows:
| March 31, 2024 | December 31, 2023 | March 31, 2023 | ||||
Bank deposits | 0.00%~3.10% | 0.00%~3.10% | 0.00%~2.87% | |||
Commercial paper | 0.90%~1.44% | 0.72%~1.33% | 0.60%~1.30% | |||
Negotiable certificates of deposit | 1.38%~1.43% | 1.38% | 1.21%~1.35% | |||
Time deposits | 0.01%~5.50% | 0.01%~5.50% | 0.01%~4.48% |
| 7. | FINANCIAL INSTRUMENTS AT FAIR VALUE THROUGH PROFIT OR LOSS |
| March 31, 2024 | December 31, 2023 | March 31, 2023 | ||||||||||
Financial assets-current | ||||||||||||
Mandatorily measured at FVTPL | ||||||||||||
Derivatives (not designated for hedge) | ||||||||||||
Forward exchange contracts | $ | 1,086 | $ | 483 | $ | 3,851 | ||||||
Non-derivatives | ||||||||||||
Listed stocks - domestic | 421 | 421 | 442 | |||||||||
|
|
|
|
|
| |||||||
| $ | 1,507 | $ | 904 | $ | 4,293 | |||||||
|
|
|
|
|
| |||||||
Financial assets-noncurrent | ||||||||||||
Mandatorily measured at FVTPL | ||||||||||||
Non-derivatives | ||||||||||||
Non-listed stocks - domestic | $ | 648,456 | $ | 703,537 | $ | 724,596 | ||||||
Non-listed stocks - foreign | 85,287 | 88,827 | 97,677 | |||||||||
Limited partnership - domestic | 316,646 | 219,032 | 228,149 | |||||||||
Film and drama investing agreements | 29,458 | 24,305 | 23,355 | |||||||||
|
|
|
|
|
| |||||||
| $ | 1,079,847 | $ | 1,035,701 | $ | 1,073,777 | |||||||
|
|
|
|
|
| |||||||
(Continued)
- 15 -
| March 31, 2024 | December 31, 2023 | March 31, 2023 | ||||||||||
Financial liabilities-current | ||||||||||||
Mandatorily measured at FVTPL | ||||||||||||
Derivatives (not designated for hedge) | ||||||||||||
Forward exchange contracts | $ | 200 | $ | — | $ | — | ||||||
|
|
|
|
|
| |||||||
(Concluded)
Chunghwa’s Board of Directors approved an investment in Taiwania Capital Buffalo Fund VI, L.P. at the amount of $600,000 thousand in January 2022. As of March 31, 2024, Chunghwa invested $300,000 thousand.
Outstanding forward exchange contracts not designated for hedge as of balance sheet dates were as follows:
| Currency | Maturity Period | Contract Amount (In Thousands) | ||||||||||
March 31, 2024 | ||||||||||||
Forward exchange contracts - buy | NT$/EUR | April to June 2024 | NT$236,119/EUR6,900 | |||||||||
December 31, 2023 | ||||||||||||
Forward exchange contracts - buy | NT$/EUR | March 2024 | NT$144,936/EUR4,300 | |||||||||
March 31, 2023 | ||||||||||||
Forward exchange contracts - buy | NT$/EUR | June 2023 | NT$230,438/EUR7,100 | |||||||||
The Company entered into the above forward exchange contracts to manage its exposure to foreign currency risk due to fluctuations in exchange rates. However, the aforementioned derivatives did not meet the criteria for hedge accounting.
| 8. | FINANCIAL ASSETS AT FAIR VALUE THROUGH OTHER COMPREHENSIVE INCOME - NONCURRENT |
| March 31, 2024 | December 31, 2023 | March 31, 2023 | ||||||||||
Domestic investments | ||||||||||||
Listed stocks | $ | 217,220 | $ | 243,649 | $ | 292,006 | ||||||
Non-listed stocks | 4,407,720 | 3,733,782 | 3,590,949 | |||||||||
Foreign investments | ||||||||||||
Non-listed stocks | 443,871 | 434,912 | 157,258 | |||||||||
|
|
|
|
|
| |||||||
| $ | 5,068,811 | $ | 4,412,343 | $ | 4,040,213 | |||||||
|
|
|
|
|
| |||||||
- 16 -
The Company holds the above foreign and domestic stocks for medium to long-term strategic purposes and expects to profit from long-term investment. Accordingly, the management elected to designate these investments in equity instruments at FVOCI as they believe that recognizing short-term fair value fluctuations of these investments in profit or loss is not consistent with the Company’s strategy of holding these investments for long-term purposes.
| 9. | TRADE NOTES AND ACCOUNTS RECEIVABLE, NET |
| March 31, 2024 | December 31, 2023 | March 31, 2023 | ||||||||||
Trade notes and accounts receivable | $ | 23,743,073 | $ | 25,943,635 | $ | 22,190,404 | ||||||
Less: Loss allowance | (1,119,481 | ) | (1,101,640 | ) | (1,200,396 | ) | ||||||
|
|
|
|
|
| |||||||
| $ | 22,623,592 | $ | 24,841,995 | $ | 20,990,008 | |||||||
|
|
|
|
|
| |||||||
The main credit terms range from 30 to 90 days.
The Company serves a large consumer base for telecommunications business; therefore, the concentration of credit risk is limited. When having transactions with customers, the Company considers the record of arrears in the past. In addition, the Company may also collect some telecommunication charges in advance to reduce the payment arrears in subsequent periods.
The Company adopted a policy of dealing with counterparties with certain credit ratings for project business and to obtain collateral where necessary to mitigate the risk of loss arising from defaults. Credit rating information is provided by independent rating agencies where available and, if such credit rating information is not available, the Company uses other publicly available financial information and its own historical transaction experience to rate its major customers. The Company continues to monitor the credit exposure and credit ratings of its counterparties and spread the credit risk amongst qualified counterparties.
In order to mitigate credit risk, the management of the Company has delegated a team responsible for determining credit limits, credit approvals and other monitoring procedures to ensure the recoverability of receivables. In addition, the Company reviews the recoverable amount of receivables at balance sheet dates to ensure that adequate allowance is provided for possible irrecoverable amounts. In this regard, the management believes the Company’s credit risk could be reasonably reduced.
The Company applies the simplified approach to recognize expected credit losses prescribed by IFRS 9, which permits the use of lifetime expected loss provision for receivables. The expected credit losses on receivables are estimated using a provision matrix by reference to past default experience of the customers and an analysis of the customers’ current financial positions, as well as the forward-looking indicators such as macroeconomic business indicators.
When there is evidence indicating that the counterparty is in evasion, bankruptcy, deregistration or the accounts receivable are over two years past due and the recoverable amount cannot be reasonable estimated, the Company writes off the trade notes and accounts receivable. For accounts receivable that have been written off, the Company continues to engage in enforcement activity to attempt to recover the receivables due. Where recoveries are made, these are recognized in profit or loss.
- 17 -
Except for receivables arising from telecommunications business and project business, the Company’s remaining accounts receivable are insignificant. Therefore, only Chunghwa’s provision matrix arising from telecommunications business and project business is disclosed below:
March 31, 2024
Not Past Due | Past Due Less than 30 Days | Past Due 31 to 60 Days | Past Due 61 to 90 Days | Past Due 91 to 120 Days | Past Due 121 to 180 Days | Past Due over 180 Days | Total | |||||||||||||||||||||||||
Telecommunications business | ||||||||||||||||||||||||||||||||
Expected credit loss rate (Note a) | 0%~1% | 1%~20% | 3%~65% | 11%~82% | 25%~91% | 54%~96% | 100% | |||||||||||||||||||||||||
Gross carrying amount | $ | 16,965,432 | $ | 393,127 | $ | 141,699 | $ | 52,636 | $ | 32,285 | $ | 25,558 | $ | 575,024 | $ | 18,185,761 | ||||||||||||||||
Loss allowance (lifetime ECL) | (71,092 | ) | (34,375 | ) | (27,318 | ) | (27,742 | ) | (24,938 | ) | (23,189 | ) | (575,024 | ) | (783,678 | ) | ||||||||||||||||
|
|
|
|
|
|
|
|
|
|
|
|
|
|
|
| |||||||||||||||||
Amortized cost | $ | 16,894,340 | $ | 358,752 | $ | 114,381 | $ | 24,894 | $ | 7,347 | $ | 2,369 | $ | — | $ | 17,402,083 | ||||||||||||||||
|
|
|
|
|
|
|
|
|
|
|
|
|
|
|
| |||||||||||||||||
Project business | ||||||||||||||||||||||||||||||||
Expected credit loss rate (Note b) | 0%~5% | 5% | 10% | 30% | 50% | 80% | 100% | |||||||||||||||||||||||||
Gross carrying amount | $ | 2,377,209 | $ | 57,877 | $ | 33,335 | $ | 45,635 | $ | 74 | $ | — | $ | 285,726 | $ | 2,799,856 | ||||||||||||||||
Loss allowance (lifetime ECL) | (2,153 | ) | (2,894 | ) | (3,333 | ) | (13,690 | ) | (59 | ) | — | (285,726 | ) | (307,855 | ) | |||||||||||||||||
|
|
|
|
|
|
|
|
|
|
|
|
|
|
|
| |||||||||||||||||
Amortized cost | $ | 2,375,056 | $ | 54,983 | $ | 30,002 | $ | 31,945 | $ | 15 | $ | — | $ | — | $ | 2,492,001 | ||||||||||||||||
|
|
|
|
|
|
|
|
|
|
|
|
|
|
|
| |||||||||||||||||
December 31, 2023
| Not Past Due | Past Due Less than 30 Days | Past Due 31 to 60 Days | Past Due 61 to 90 Days | Past Due 91 to 120 Days | Past Due 121 to 180 Days | Past Due over 180 Days | Total | |||||||||||||||||||||||||
Telecommunications business | ||||||||||||||||||||||||||||||||
Expected credit loss rate (Note a) | 0%~1% | 1%~20% | 3%~65% | 12%~82% | 23%~91% | 40%~96% | 100% | |||||||||||||||||||||||||
Gross carrying amount | $ | 17,065,909 | $ | 346,172 | $ | 135,390 | $ | 69,909 | $ | 47,730 | $ | 48,827 | $ | 577,604 | $ | 18,291,541 | ||||||||||||||||
Loss allowance (lifetime ECL) | (49,828 | ) | (21,667 | ) | (28,978 | ) | (29,154 | ) | (35,221 | ) | (21,848 | ) | (577,604 | ) | (764,300 | ) | ||||||||||||||||
|
|
|
|
|
|
|
|
|
|
|
|
|
|
|
| |||||||||||||||||
Amortized cost | $ | 17,016,081 | $ | 324,505 | $ | 106,412 | $ | 40,755 | $ | 12,509 | $ | 26,979 | $ | — | $ | 17,527,241 | ||||||||||||||||
|
|
|
|
|
|
|
|
|
|
|
|
|
|
|
| |||||||||||||||||
Project business | ||||||||||||||||||||||||||||||||
Expected credit loss rate (Note b) | 0%~5% | 5% | 10% | 30% | 50% | 80% | 100% | |||||||||||||||||||||||||
Gross carrying amount | $ | 3,868,984 | $ | 101,408 | $ | 11,954 | $ | 17,535 | $ | 1,353 | $ | 613 | $ | 287,368 | $ | 4,289,215 | ||||||||||||||||
Loss allowance (lifetime ECL) | (2,812 | ) | (16,671 | ) | (1,195 | ) | (5,261 | ) | (676 | ) | (490 | ) | (287,368 | ) | (314,473 | ) | ||||||||||||||||
|
|
|
|
|
|
|
|
|
|
|
|
|
|
|
| |||||||||||||||||
Amortized cost | $ | 3,866,172 | $ | 84,737 | $ | 10,759 | $ | 12,274 | $ | 677 | $ | 123 | $ | — | $ | 3,974,742 | ||||||||||||||||
|
|
|
|
|
|
|
|
|
|
|
|
|
|
|
| |||||||||||||||||
March 31, 2023
| Not Past Due | Past Due Less than 30 Days | Past Due 31 to 60 Days | Past Due 61 to 90 Days | Past Due 91 to 120 Days | Past Due 121 to 180 Days | Past Due over 180 Days | Total | |||||||||||||||||||||||||
Telecommunications business | ||||||||||||||||||||||||||||||||
Expected credit loss rate (Note a) | 0%~1% | 1%~21% | 3%~64% | 11%~81% | 24%~90% | 48%~96% | 100% | |||||||||||||||||||||||||
Gross carrying amount | $ | 15,877,741 | $ | 360,047 | $ | 161,855 | $ | 130,047 | $ | 48,799 | $ | 37,404 | $ | 609,373 | $ | 17,225,266 | ||||||||||||||||
Loss allowance (lifetime ECL) | (58,227 | ) | (44,535 | ) | (53,277 | ) | (22,667 | ) | (22,249 | ) | (33,722 | ) | (609,373 | ) | (844,050 | ) | ||||||||||||||||
|
|
|
|
|
|
|
|
|
|
|
|
|
|
|
| |||||||||||||||||
Amortized cost | $ | 15,819,514 | $ | 315,512 | $ | 108,578 | $ | 107,380 | $ | 26,550 | $ | 3,682 | $ | — | $ | 16,381,216 | ||||||||||||||||
|
|
|
|
|
|
|
|
|
|
|
|
|
|
|
| |||||||||||||||||
Project business | ||||||||||||||||||||||||||||||||
Expected credit loss rate (Note b) | 0%~5% | 5% | 10% | 30% | 50% | 80% | 100% | |||||||||||||||||||||||||
Gross carrying amount | $ | 2,205,320 | $ | 49,109 | $ | 29,021 | $ | 19,307 | $ | 696 | $ | 623 | $ | 313,122 | $ | 2,617,198 | ||||||||||||||||
Loss allowance (lifetime ECL) | (2,026 | ) | (3,165 | ) | (2,902 | ) | (6,414 | ) | (348 | ) | (499 | ) | (313,122 | ) | (328,476 | ) | ||||||||||||||||
|
|
|
|
|
|
|
|
|
|
|
|
|
|
|
| |||||||||||||||||
Amortized cost | $ | 2,203,294 | $ | 45,944 | $ | 26,119 | $ | 12,893 | $ | 348 | $ | 124 | $ | — | $ | 2,288,722 | ||||||||||||||||
|
|
|
|
|
|
|
|
|
|
|
|
|
|
|
| |||||||||||||||||
| Note a: | Please refer to Note 42 for the information of disaggregation of telecommunications service revenue. The expected credit loss rate applicable to different business revenue varies so as to reflect the risk level indicating by factors like historical experience. |
| Note b: | The project business has different loss types according to the customer types. The expected credit loss rate listed above is for general customers. When the customer is a government-affiliated entity, it is anticipated that there will not be an instance of credit loss. Customers with past history of bounced checks or accounts receivable exceeding six months overdue are classified as high-risk customers, with an expected credit loss rate of 50%, increasing by period as the days overdue increase. |
- 18 -
Movements of loss allowance for trade notes and accounts receivable were as follows:
| Three Months Ended March 31 | ||||||||
| 2024 | 2023 | |||||||
Beginning balance | $ | 1,101,640 | $ | 1,365,222 | ||||
Add: Provision for credit loss | 56,172 | 100,286 | ||||||
Less: Amounts written off | (38,331 | ) | (265,112 | ) | ||||
|
|
|
| |||||
Ending balance | $ | 1,119,481 | $ | 1,200,396 | ||||
|
|
|
| |||||
| 10. | INVENTORIES |
| March 31, 2024 | December 31, 2023 | March 31, 2023 | ||||||||||
Merchandise | $ | 4,149,699 | $ | 4,340,001 | $ | 4,662,019 | ||||||
Project in process | 4,546,340 | 4,771,313 | 4,906,945 | |||||||||
Work in process | 69,276 | 73,622 | 86,418 | |||||||||
Raw materials | 232,380 | 221,314 | 266,899 | |||||||||
|
|
|
|
|
| |||||||
| 8,997,695 | 9,406,250 | 9,922,281 | ||||||||||
Land held under development | 1,998,733 | 1,998,733 | 1,998,733 | |||||||||
Construction in progress | 117,012 | 115,782 | 103,077 | |||||||||
|
|
|
|
|
| |||||||
| $ | 11,113,440 | $ | 11,520,765 | $ | 12,024,091 | |||||||
|
|
|
|
|
| |||||||
The operating costs related to inventories were $12,588,852 thousand (including the valuation loss on inventories of $25,576 thousand) and $12,500,866 thousand (including the valuation loss on inventories of $5,274 thousand) for the three months ended March 31, 2024 and 2023, respectively.
As of March 31, 2024, December 31, 2023 and March 31, 2023, inventories of $2,115,745 thousand, $2,114,515 thousand and $2,101,810 thousand, respectively, were expected to be realized from the sale after more than twelve months. The aforementioned amount of inventories is related to property development owned by LED.
Land held under development and construction in progress was mainly developed by LED for Qingshan Sec., Dayuan Dist., Taoyuan City project. The Board of Directors of LED resolved to sign a joint construction and separate sale contract with Farglory Land Development Co., Ltd. in June 2021. LED entrusts Land Bank of Taiwan to execute fund control and property right management for the land held under development.
| 11. | PREPAYMENTS |
| March 31, 2024 | December 31, 2023 | March 31, 2023 | ||||||||||
Prepaid salary and bonus | $ | 2,917,486 | $ | 4,736 | $ | 2,860,982 | ||||||
Prepaid rents | 2,077,928 | 2,143,336 | 2,261,838 | |||||||||
Prepayments for leases - satellite (Note 39) | 2,070,506 | 1,729,118 | — | |||||||||
Others | 2,473,754 | 2,292,864 | 2,056,845 | |||||||||
|
|
|
|
|
| |||||||
| $ | 9,539,674 | $ | 6,170,054 | $ | 7,179,665 | |||||||
|
|
|
|
|
| |||||||
(Continued)
- 19 -
| March 31, 2024 | December 31, 2023 | March 31, 2023 | ||||||||||
Current | ||||||||||||
Prepaid salary and bonus | $ | 2,917,486 | $ | 4,736 | $ | 2,860,982 | ||||||
Prepaid rents | 572,333 | 580,930 | 568,372 | |||||||||
Others | 2,431,680 | 2,253,805 | 2,055,022 | |||||||||
|
|
|
|
|
| |||||||
| $ | 5,921,499 | $ | 2,839,471 | $ | 5,484,376 | |||||||
|
|
|
|
|
| |||||||
Noncurrent | ||||||||||||
Prepaid rents | $ | 1,505,595 | $ | 1,562,406 | $ | 1,693,466 | ||||||
Prepayments for leases - satellite (Note 39) | 2,070,506 | 1,729,118 | — | |||||||||
Others | 42,074 | 39,059 | 1,823 | |||||||||
|
|
|
|
|
| |||||||
| $ | 3,618,175 | $ | 3,330,583 | $ | 1,695,289 | |||||||
|
|
|
|
|
| |||||||
(Concluded)
Prepaid rents comprised the prepayments from the lease agreements applying the recognition exemption and the prepayments for leases that do not meet the definition of leases under IFRS 16.
| 12. | OTHER CURRENT MONETARY ASSETS |
| March 31, 2024 | December 31, 2023 | March 31, 2023 | ||||||||||
Time deposits, negotiable certificates of deposit and commercial paper with maturities of more than three months | $ | 26,195,432 | $ | 18,572,579 | $ | 17,755,151 | ||||||
Accrued custodial receipts | 833,276 | 893,629 | 781,871 | |||||||||
Others | 766,024 | 885,842 | 1,443,416 | |||||||||
|
|
|
|
|
| |||||||
| $ | 27,794,732 | $ | 20,352,050 | $ | 19,980,438 | |||||||
|
|
|
|
|
| |||||||
The annual yield rates of time deposits, negotiable certificates of deposit and commercial paper with maturities of more than three months at the balance sheet dates were as follows:
| March 31, 2024 | December 31, 2023 | March 31, 2023 | ||||||||||
Time deposits, negotiable certificates of deposit and commercial paper with maturities of more than three months | 0.03%~5.00% | 0.03%~5.54% | 0.03%~4.36% | |||||||||
- 20 -
| 13. | SUBSIDIARIES |
| a. | Information on subsidiaries with material noncontrolling interests |
| Principal | Proportion of Ownership Interests and Voting Rights Held by Noncontrolling Interests | |||||||||||||||
| Subsidiaries | Place of Business | March 31, 2024 | December 31, 2023 | March 31, 2023 | ||||||||||||
SENAO | Taiwan | 72 | % | 72 | % | 72 | % | |||||||||
CHPT | Taiwan | 66 | % | 66 | % | 66 | % | |||||||||
| Profit Allocated to Noncontrolling Interests | Accumulated Noncontrolling Interests | |||||||||||||||||||
| Three Months Ended March 31 | March 31, | December 31, | March 31, | |||||||||||||||||
| 2024 | 2023 | 2024 | 2023 | 2023 | ||||||||||||||||
SENAO | $ | 96,826 | $ | 141,198 | $ | 4,412,858 | $ | 4,666,876 | $ | 4,322,953 | ||||||||||
|
|
|
| |||||||||||||||||
CHPT | $ | 2,385 | $ | (26,832 | ) | 5,004,863 | 4,995,300 | 5,230,536 | ||||||||||||
|
|
|
| |||||||||||||||||
Individually immaterial subsidiaries with noncontrolling interests | 2,718,642 | 2,934,076 | 2,606,914 | |||||||||||||||||
|
|
|
|
|
| |||||||||||||||
| $ | 12,136,363 | $ | 12,596,252 | $ | 12,160,403 | |||||||||||||||
|
|
|
|
|
| |||||||||||||||
Summarized financial information in respect of SENAO and its subsidiaries that has material noncontrolling interests is set out below. The summarized financial information below represented amounts before intercompany eliminations.
| March 31, 2024 | December 31, 2023 | March 31, 2023 | ||||||||||
Current assets | $ | 7,132,733 | $ | 6,539,760 | $ | 6,709,874 | ||||||
Noncurrent assets | 3,365,022 | 3,293,533 | 3,305,221 | |||||||||
Current liabilities | (3,938,838 | ) | (2,949,548 | ) | (3,597,049 | ) | ||||||
Noncurrent liabilities | (487,134 | ) | (458,543 | ) | (470,758 | ) | ||||||
|
|
|
|
|
| |||||||
Equity | $ | 6,071,783 | $ | 6,425,202 | $ | 5,947,288 | ||||||
|
|
|
|
|
| |||||||
Equity attributable to the parent | $ | 1,658,925 | $ | 1,758,326 | $ | 1,624,335 | ||||||
Equity attributable to noncontrolling interests | 4,412,858 | 4,666,876 | 4,322,953 | |||||||||
|
|
|
|
|
| |||||||
| $ | 6,071,783 | $ | 6,425,202 | $ | 5,947,288 | |||||||
|
|
|
|
|
| |||||||
| Three Months Ended March 31 | ||||||||
| 2024 | 2023 | |||||||
Revenues and income | $ | 8,171,181 | $ | 8,316,887 | ||||
Costs and expenses | 8,036,271 | 8,120,208 | ||||||
|
|
|
| |||||
Profit for the period | $ | 134,910 | $ | 196,679 | ||||
|
|
|
| |||||
Profit attributable to the parent | $ | 38,084 | $ | 55,481 | ||||
Profit attributable to noncontrolling interests | 96,826 | 141,198 | ||||||
|
|
|
| |||||
Profit for the period | $ | 134,910 | $ | 196,679 | ||||
|
|
|
| |||||
(Continued)
- 21 -
| Three Months Ended March 31 | ||||||||
| 2024 | 2023 | |||||||
Other comprehensive income (loss) attributable to the parent | $ | 7,940 | $ | (395 | ) | |||
Other comprehensive income (loss) attributable to noncontrolling interests | 20,236 | (1,007 | ) | |||||
|
|
|
| |||||
Other comprehensive income (loss) for the period | $ | 28,176 | $ | (1,402 | ) | |||
|
|
|
| |||||
Total comprehensive income attributable to the parent | $ | 46,024 | $ | 55,086 | ||||
Total comprehensive income attributable to noncontrolling interests | 117,062 | 140,191 | ||||||
|
|
|
| |||||
Total comprehensive income for the period | $ | 163,086 | $ | 195,277 | ||||
|
|
|
| |||||
Net cash flow from operating activities | $ | 327,163 | $ | (511,454 | ) | |||
Net cash flow from investing activities | (6,819 | ) | (9,715 | ) | ||||
Net cash flow from financing activities | (75,378 | ) | (76,457 | ) | ||||
Effect of exchange rate changes on cash and cash equivalents | 19 | 2 | ||||||
|
|
|
| |||||
Net cash inflow (outflow) | $ | 244,985 | $ | (597,624 | ) | |||
|
|
|
| |||||
(Concluded)
Summarized financial information in respect of CHPT and its subsidiaries that has material noncontrolling interests is set out below. The summarized financial information below represented amounts before intercompany eliminations.
| March 31, 2024 | December 31, 2023 | March 31, 2023 | ||||||||||
Current assets | $ | 3,788,825 | $ | 3,773,213 | $ | 4,023,108 | ||||||
Noncurrent assets | 4,416,004 | 4,499,182 | 4,611,346 | |||||||||
Current liabilities | (591,800 | ) | (675,326 | ) | (689,858 | ) | ||||||
Noncurrent liabilities | (21,410 | ) | (23,546 | ) | (22,745 | ) | ||||||
|
|
|
|
|
| |||||||
Equity | $ | 7,591,619 | $ | 7,573,523 | $ | 7,921,851 | ||||||
|
|
|
|
|
| |||||||
Equity attributable to CHI | $ | 2,586,756 | $ | 2,578,223 | $ | 2,691,315 | ||||||
Equity attributable to noncontrolling interests | 5,004,863 | 4,995,300 | 5,230,536 | |||||||||
|
|
|
|
|
| |||||||
| $ | 7,591,619 | $ | 7,573,523 | $ | 7,921,851 | |||||||
|
|
|
|
|
| |||||||
| Three Months Ended March 31 | ||||||||
| 2024 | 2023 | |||||||
Revenues and income | $ | 697,630 | $ | 706,859 | ||||
Costs and expenses | 690,450 | 744,236 | ||||||
|
|
|
| |||||
Profit (loss) for the period | $ | 7,180 | $ | (37,377 | ) | |||
|
|
|
| |||||
Profit (loss) attributable to CHI | $ | 4,795 | $ | (10,545 | ) | |||
Profit (loss) attributable to noncontrolling interests | 2,385 | (26,832 | ) | |||||
|
|
|
| |||||
Profit (loss) for the period | $ | 7,180 | $ | (37,377 | ) | |||
|
|
|
| |||||
(Continued)
- 22 -
| Three Months Ended March 31 | ||||||||
| 2024 | 2023 | |||||||
Other comprehensive income (loss) attributable to CHI | $ | 3,739 | $ | (25 | ) | |||
Other comprehensive income (loss) attributable to noncontrolling interests | 7,177 | (48 | ) | |||||
|
|
|
| |||||
Other comprehensive income (loss) for the period | $ | 10,916 | $ | (73 | ) | |||
|
|
|
| |||||
Total comprehensive income (loss) attributable to CHI | $ | 8,534 | $ | (10,570 | ) | |||
Total comprehensive income (loss) attributable to noncontrolling interests | 9,562 | (26,880 | ) | |||||
|
|
|
| |||||
Total comprehensive income (loss) for the period | $ | 18,096 | $ | (37,450 | ) | |||
|
|
|
| |||||
Net cash flow from operating activities | $ | (35,657 | ) | $ | 58,721 | |||
Net cash flow from investing activities | (34,200 | ) | (92,752 | ) | ||||
Net cash flow from financing activities | (6,605 | ) | (5,490 | ) | ||||
Effect of exchange rate changes on cash and cash equivalents | 13,187 | 2,021 | ||||||
|
|
|
| |||||
Net cash outflow | $ | (63,275 | ) | $ | (37,500 | ) | ||
|
|
|
| |||||
(Concluded)
| b. | Equity transactions with noncontrolling interests |
CHTSC issued new shares in February 2023, May 2023, January 2024 and March 2024 as its employees exercised options. Therefore, the Company’s ownership interest in CHTSC decreased. See Note 33(b) for details.
The above transactions were accounted for as equity transactions since the Company did not cease to have control over these subsidiaries.
Information of the Company’s equity transactions with noncontrolling interests for the three months ended March 31, 2024 and 2023 were as follows:
| Three Months Ended March 31, 2024 | Three Months Ended March 31, 2023 | |||||||
CHTSC Share-Based | CHTSC Share-Based | |||||||
Cash consideration received from noncontrolling interests (Note) | $ | 13,245 | $ | — | ||||
The proportionate share of the carrying amount of the net assets of the subsidiary transferred from (to) noncontrolling interests | (13,650 | ) | 8,900 | |||||
|
|
|
| |||||
Differences arising from equity transactions | $ | (405 | ) | $ | 8,900 | |||
|
|
|
| |||||
Line items for equity transaction adjustments | ||||||||
Additional paid-in capital - arising from changes in equities of subsidiaries | $ | (405 | ) | $ | 8,900 | |||
|
|
|
| |||||
| Note: | The proceeds from the new shares issued in January 2024 and February 2023 by CHTSC have been received in advance in December 2023 and December 2022, respectively. |
- 23 -
| 14. | INVESTMENTS ACCOUNTED FOR USING EQUITY METHOD |
| March 31, 2024 | December 31, 2023 | March 31, 2023 | ||||||||||
Investments in associates | $ | 8,551,936 | $ | 8,440,736 | $ | 7,238,577 | ||||||
Investment in joint venture | 9,400 | 9,463 | 9,602 | |||||||||
|
|
|
|
|
| |||||||
| $ | 8,561,336 | $ | 8,450,199 | $ | 7,248,179 | |||||||
|
|
|
|
|
| |||||||
| a. | Investments in associates |
Investments in associates were as follows:
| Carrying Amount | ||||||||||||
| March 31, 2024 | December 31, 2023 | March 31, 2023 | ||||||||||
Material associate | ||||||||||||
Non-listed | ||||||||||||
Next Commercial Bank Co., Ltd. (“NCB”) | $ | 4,207,893 | $ | 4,293,338 | $ | 3,077,942 | ||||||
|
|
|
|
|
| |||||||
Associates that are not individually material | ||||||||||||
Listed | ||||||||||||
Senao Networks, Inc. (“SNI”) | 1,608,490 | 1,564,311 | 1,480,401 | |||||||||
KingwayTek Technology Co., Ltd. (“KWT”) | 270,090 | 266,407 | 271,174 | |||||||||
Non-listed | ||||||||||||
Viettel-CHT Co., Ltd. (“Viettel-CHT”) | 567,596 | 542,178 | 587,080 | |||||||||
ST-2 Satellite Ventures Pte., Ltd. (“STS”) | 322,008 | 285,430 | 273,844 | |||||||||
Taiwan International Standard Electronics Co., Ltd. (“TISE”) | 312,238 | 312,800 | 347,207 | |||||||||
WiAdvance Technology Corporation (“WATC”) | 285,617 | 212,101 | 221,235 | |||||||||
Chunghwa PChome Fund I Co., Ltd. (“CPFI”) | 256,115 | 257,657 | 276,539 | |||||||||
So-net Entertainment Taiwan Limited (“So-net”) | 224,102 | 225,697 | 226,233 | |||||||||
KKBOX Taiwan Co., Ltd. (“KKBOXTW”) | 171,342 | 163,999 | 175,395 | |||||||||
Taiwan International Ports Logistics Corporation (“TIPL”) | 129,330 | 121,948 | 109,184 | |||||||||
CHT Infinity Singapore Pte. Ltd. (“CISG”) | 58,474 | 56,764 | 59,755 | |||||||||
Imedtac Co., Ltd. (“IME”) | 46,295 | 46,880 | 39,848 | |||||||||
Click Force Co., Ltd. (“CF”) | 44,828 | 42,637 | 41,509 | |||||||||
AgriTalk Technology Inc. (“ATT”) | 29,572 | 30,798 | 33,698 | |||||||||
Baohwa Trust Co., Ltd. (“BHT”) | 10,383 | 10,317 | 10,588 | |||||||||
Cornerstone Ventures Co., Ltd. (“CVC”) | 7,563 | 7,474 | 6,945 | |||||||||
|
|
|
|
|
| |||||||
| 4,344,043 | 4,147,398 | 4,160,635 | ||||||||||
|
|
|
|
|
| |||||||
| $ | 8,551,936 | $ | 8,440,736 | $ | 7,238,577 | |||||||
|
|
|
|
|
| |||||||
- 24 -
The percentages of ownership interests and voting rights in associates held by the Company as of balance sheet dates were as follows:
| % of Ownership Interests and Voting Rights | ||||||||||||
| March 31, 2024 | December 31, 2023 | March 31, 2023 | ||||||||||
Material associate | ||||||||||||
Non-listed | ||||||||||||
Next Commercial Bank Co., Ltd. (“NCB”) | 46 | 46 | 42 | |||||||||
Associates that are not individually material | ||||||||||||
Listed | ||||||||||||
Senao Networks, Inc. (“SNI”) | 34 | 34 | 34 | |||||||||
KingwayTek Technology Co., Ltd. (“KWT”) | 23 | 23 | 23 | |||||||||
Non-listed | ||||||||||||
Viettel-CHT Co., Ltd. (“Viettel-CHT”) | 30 | 30 | 30 | |||||||||
ST-2 Satellite Ventures Pte., Ltd. (“STS”) | 38 | 38 | 38 | |||||||||
Taiwan International Standard Electronics Co., Ltd. (“TISE”) | 40 | 40 | 40 | |||||||||
WiAdvance Technology Corporation (“WATC”) | 16 | 19 | 20 | |||||||||
Chunghwa PChome Fund I Co., Ltd. (“CPFI”) | 50 | 50 | 50 | |||||||||
So-net Entertainment Taiwan Limited (“So-net”) | 30 | 30 | 30 | |||||||||
KKBOX Taiwan Co., Ltd. (“KKBOXTW”) | 30 | 30 | 30 | |||||||||
Taiwan International Ports Logistics Corporation (“TIPL”) | 27 | 27 | 27 | |||||||||
CHT Infinity Singapore Pte. Ltd. (“CISG”) | 40 | 40 | 40 | |||||||||
Imedtac Co., Ltd. (“IME”) | 7 | 7 | 7 | |||||||||
Click Force Co., Ltd. (“CF”) | 49 | 49 | 49 | |||||||||
AgriTalk Technology Inc. (“ATT”) | 29 | 29 | 29 | |||||||||
Baohwa Trust Co., Ltd. (“BHT”) | 25 | 25 | 40 | |||||||||
Cornerstone Ventures Co., Ltd. (“CVC”) | 49 | 49 | 49 | |||||||||
-25 -
Summarized financial information of NCB was set out below:
| March 31, 2024 | December 31, 2023 | March 31, 2023 | ||||||||||
Assets | $ | 39,498,355 | $ | 37,431,036 | $ | 35,136,801 | ||||||
Liabilities | (30,339,323 | ) | (28,083,960 | ) | (27,709,767 | ) | ||||||
|
|
|
|
|
| |||||||
Equity | $ | 9,159,032 | $ | 9,347,076 | $ | 7,427,034 | ||||||
|
|
|
|
|
| |||||||
The percentage of ownership interest held by the Company | 46.26 | % | 46.26 | % | 41.90 | % | ||||||
Equity attributable to the Company | $ | 4,236,968 | $ | 4,323,958 | $ | 3,111,927 | ||||||
Unrealized gain or loss from downstream transactions | (29,075 | ) | (30,620 | ) | (33,985 | ) | ||||||
|
|
|
|
|
| |||||||
The carrying amount of investment | $ | 4,207,893 | $ | 4,293,338 | $ | 3,077,942 | ||||||
|
|
|
|
|
| |||||||
| Three Months Ended March 31 | ||||||||
| 2024 | 2023 | |||||||
Net revenues (losses) | $ | 68,964 | $ | (12,489 | ) | |||
|
|
|
| |||||
Net loss for the period | $ | (185,512 | ) | $ | (230,899 | ) | ||
Other comprehensive loss | (2,532 | ) | (394 | ) | ||||
|
|
|
| |||||
Total comprehensive loss for the period | $ | (188,044 | ) | $ | (231,293 | ) | ||
|
|
|
| |||||
Except for NCB, no associate is considered individually material to the Company. Summarized financial information of associates that are not individually material to the Company was as follows:
| Three Months Ended March 31 | ||||||||
| 2024 | 2023 | |||||||
The Company’s share of profits | $ | 98,838 | $ | 198,385 | ||||
The Company’s share of other comprehensive income | 26,679 | 9,458 | ||||||
|
|
|
| |||||
The Company’s share of total comprehensive income | $ | 125,517 | $ | 207,843 | ||||
|
|
|
| |||||
- 26 -
The Level 1 fair values of associates based on the closing market prices as of the balance sheet dates were as follows:
| March 31, 2024 | December 31, 2023 | March 31, 2023 | ||||||||||
SNI | $ | 3,556,203 | $ | 4,061,863 | $ | 5,670,029 | ||||||
|
|
|
|
|
| |||||||
KWT | $ | 896,169 | $ | 987,520 | $ | 880,926 | ||||||
|
|
|
|
|
| |||||||
The Company did not participate in the capital increase of WATC in January 2024. WATC issued new shares in April 2023, September 2023, December 2023 and March 2024 as its employees exercised option. Therefore, the Company’s ownership interest in WATC decreased to 19.22% and 16.35% as of December 31, 2023 and March 31, 2024, respectively. However, as the Company continues to control one out of three seats of the Board of Directors of WATC, the Company has significant influence over WATC. Therefore, the Company recognized WATC as an investment in associate.
The Company’s ownership interest in NCB was originally 41.90%. NCB reduced 26.43% of its capital to offset accumulated deficits and increased its capital in December 2023. The Company increased its investment in NCB in higher proportion to the original shareholder percentage. Therefore, the Company’s ownership interest in NCB increased to 46.26% as of December 31, 2023. Although Chunghwa is the single largest stockholder of NCB, it only obtained six out of fifteen seats of the Board of Directors of NCB. In addition, the management considered the size of ownership interest and the dispersion of shares owned by the other stockholders, other holdings are not extremely dispersed. Chunghwa is not able to direct its relevant activities. Therefore, Chunghwa does not have control over NCB and merely has significant influence over NCB and treats it as an associate.
The Company increased its investment in IME proportionally in December 2023, and the Company’s ownership interest in IME remained the same. The Company invested and obtained 6.74% ownership interest in IME. However, as the Company continues to control one out of five seats of the Board of Directors of IME, the Company has significant influence over IME. Therefore, the Company recognized IME as an investment in associate.
The Company did not participate in the capital increase of BHT in September 2023. Therefore, the Company’s ownership interest in BHT decreased to 25.00% as of December 31, 2023.
The Company invested and obtained 50% ownership interest in CPFI. However, as the Company has only two out of five seats of the Board of Directors of CPFI, the Company has no control but significant influence over CPFI. Therefore, the Company recognized CPFI as an investment in associate.
The Company invested and obtained 49% ownership interest in CVC. However, as the Company has only two out of five seats of the Board of Directors of CVC, the Company has no control but significant influence over CVC. Therefore, the Company recognized CVC as an investment in associate.
The Company’s share of profits and other comprehensive income (loss) of associates was recognized based on the reviewed financial statements.
- 27 -
| b. | Investment in joint venture |
Investment in joint venture was as follows:
| Carrying Amount | % of Ownership Interests and Voting Rights | |||||||||||||||||||||||
| Name of Joint Venture | March 31, 2024 | December 31, 2023 | March 31, 2023 | March 31, 2024 | December 31, 2023 | March 31, 2023 | ||||||||||||||||||
Non-listed | ||||||||||||||||||||||||
Chunghwa SEA Holdings (“CHT SEA”) | $ | 9,400 | $ | 9,463 | $ | 9,602 | 51 | % | 51 | % | 51 | % | ||||||||||||
|
|
|
|
|
| |||||||||||||||||||
The Company invested and established a joint venture, CHT SEA, with Delta Electronics, Inc. and Kwang Hsing Industrial Co., Ltd. and obtained 51% ownership interest of CHT SEA. However, according to the mutual agreements among stockholders, the Company does not individually direct CHT SEA’s relevant activities and has joint control with the other party; therefore, the Company treated CHT SEA as a joint venture.
The joint venture is not considered individually material to the Company. Summarized financial information of CHT SEA was set out below:
| Three Months Ended March 31 | ||||||||
| 2024 | 2023 | |||||||
The Company’s share of loss | $ | (63 | ) | $ | (75 | ) | ||
The Company’s share of other comprehensive income | — | — | ||||||
|
|
|
| |||||
The Company’s share of total comprehensive loss | $ | (63 | ) | $ | (75 | ) | ||
|
|
|
| |||||
The Company’s share of loss and other comprehensive income of the joint venture was recognized based on the reviewed financial statements.
| 15. | PROPERTY, PLANT AND EQUIPMENT |
| March 31, 2024 | December 31, 2023 | March 31, 2023 | ||||||||||
Assets used by the Company | $ | 280,840,400 | $ | 285,084,900 | $ | 281,457,364 | ||||||
Assets subject to operating leases | 6,224,809 | 7,252,842 | 7,808,042 | |||||||||
|
|
|
|
|
| |||||||
| $ | 287,065,209 | $ | 292,337,742 | $ | 289,265,406 | |||||||
|
|
|
|
|
| |||||||
- 28 -
| a. | Assets used by the Company |
| Land | Land Improvements | Buildings | Computer Equipment | Telecommuni- cations Equipment | Transportation Equipment | Miscellaneous Equipment | Construction in Progress and Equipment to be Accepted | Total | ||||||||||||||||||||||||||||
Cost | ||||||||||||||||||||||||||||||||||||
Balance on January 1, 2023 | $ | 103,663,528 | $ | 1,675,255 | $ | 72,529,774 | $ | 11,088,877 | $ | 720,068,323 | $ | 3,971,039 | $ | 11,467,527 | $ | 14,427,497 | $ | 938,891,820 | ||||||||||||||||||
Additions | 95,567 | — | 6,496 | 21,840 | 8,158 | 464 | 32,269 | 3,970,084 | 4,134,878 | |||||||||||||||||||||||||||
Disposal | (1,672 | ) | — | — | (315,873 | ) | (5,426,631 | ) | (39,700 | ) | (74,277 | ) | — | (5,858,153 | ) | |||||||||||||||||||||
Effect of foreign exchange differences | — | — | — | (13 | ) | (32,722 | ) | (21 | ) | 148 | (3,251 | ) | (35,859 | ) | ||||||||||||||||||||||
Others | (731,154 | ) | 6,101 | (92,843 | ) | 69,050 | 6,863,623 | 6,588 | 231,562 | (7,125,883 | ) | (772,956 | ) | |||||||||||||||||||||||
|
|
|
|
|
|
|
|
|
|
|
|
|
|
|
|
|
| |||||||||||||||||||
Balance on March 31, 2023 | $ | 103,026,269 | $ | 1,681,356 | $ | 72,443,427 | $ | 10,863,881 | $ | 721,480,751 | $ | 3,938,370 | $ | 11,657,229 | $ | 11,268,447 | $ | 936,359,730 | ||||||||||||||||||
|
|
|
|
|
|
|
|
|
|
|
|
|
|
|
|
|
| |||||||||||||||||||
Accumulated depreciation and impairment | ||||||||||||||||||||||||||||||||||||
Balance on January 1, 2023 | $ | — | $ | (1,474,085 | ) | $ | (32,263,200 | ) | $ | (9,553,580 | ) | $ | (597,957,285 | ) | $ | (3,672,728 | ) | $ | (8,642,023 | ) | $ | — | $ | (653,562,901 | ) | |||||||||||
Depreciation expenses | — | (8,513 | ) | (362,708 | ) | (168,062 | ) | (6,413,695 | ) | (22,637 | ) | (205,842 | ) | — | (7,181,457 | ) | ||||||||||||||||||||
Disposal | — | — | — | 315,851 | 5,424,939 | 39,700 | 74,150 | — | 5,854,640 | |||||||||||||||||||||||||||
Effect of foreign exchange differences | — | — | — | 242 | 17,778 | 14 | (125 | ) | — | 17,909 | ||||||||||||||||||||||||||
Others | — | — | (6,614 | ) | (19,024 | ) | (13,216 | ) | (150 | ) | 8,447 | — | (30,557 | ) | ||||||||||||||||||||||
|
|
|
|
|
|
|
|
|
|
|
|
|
|
|
|
|
| |||||||||||||||||||
Balance on March 31, 2023 | $ | — | $ | (1,482,598 | ) | $ | (32,632,522 | ) | $ | (9,424,573 | ) | $ | (598,941,479 | ) | $ | (3,655,801 | ) | $ | (8,765,393 | ) | $ | — | $ | (654,902,366 | ) | |||||||||||
|
|
|
|
|
|
|
|
|
|
|
|
|
|
|
|
|
| |||||||||||||||||||
Balance on January 1, 2023, net | $ | 103,663,528 | $ | 201,170 | $ | 40,266,574 | $ | 1,535,297 | $ | 122,111,038 | $ | 298,311 | $ | 2,825,504 | $ | 14,427,497 | $ | 285,328,919 | ||||||||||||||||||
|
|
|
|
|
|
|
|
|
|
|
|
|
|
|
|
|
| |||||||||||||||||||
Balance on March 31, 2023, net | $ | 103,026,269 | $ | 198,758 | $ | 39,810,905 | $ | 1,439,308 | $ | 122,539,272 | $ | 282,569 | $ | 2,891,836 | $ | 11,268,447 | $ | 281,457,364 | ||||||||||||||||||
|
|
|
|
|
|
|
|
|
|
|
|
|
|
|
|
|
| |||||||||||||||||||
Cost | ||||||||||||||||||||||||||||||||||||
Balance on January 1, 2024 | $ | 102,885,454 | $ | 1,709,236 | $ | 71,754,783 | $ | 11,044,831 | $ | 721,434,979 | $ | 4,049,661 | $ | 12,091,029 | $ | 15,937,187 | $ | 940,907,160 | ||||||||||||||||||
Additions | — | — | 5,242 | 18,379 | 23,002 | 2,839 | 14,608 | 3,550,693 | 3,614,763 | |||||||||||||||||||||||||||
Disposal | — | — | — | (249,084 | ) | (4,697,374 | ) | (59,735 | ) | (89,651 | ) | — | (5,095,844 | ) | ||||||||||||||||||||||
Effect of foreign exchange differences | — | — | — | 41 | 91,121 | 98 | 6,151 | 8,105 | 105,516 | |||||||||||||||||||||||||||
Others | (528,935 | ) | 1,652 | (301,140 | ) | 228,301 | 5,501,226 | 73 | 76,673 | (5,831,630 | ) | (853,780 | ) | |||||||||||||||||||||||
|
|
|
|
|
|
|
|
|
|
|
|
|
|
|
|
|
| |||||||||||||||||||
Balance on March 31, 2024 | $ | 102,356,519 | $ | 1,710,888 | $ | 71,458,885 | $ | 11,042,468 | $ | 722,352,954 | $ | 3,992,936 | $ | 12,098,810 | $ | 13,664,355 | $ | 938,677,815 | ||||||||||||||||||
|
|
|
|
|
|
|
|
|
|
|
|
|
|
|
|
|
| |||||||||||||||||||
Accumulated depreciation and impairment | ||||||||||||||||||||||||||||||||||||
Balance on January 1, 2024 | $ | — | $ | (1,507,932 | ) | $ | (33,283,812 | ) | $ | (9,221,060 | ) | $ | (599,131,991 | ) | $ | (3,654,724 | ) | $ | (9,022,741 | ) | $ | — | $ | (655,822,260 | ) | |||||||||||
Depreciation expenses | — | (8,344 | ) | (358,607 | ) | (182,451 | ) | (6,394,220 | ) | (29,325 | ) | (205,976 | ) | — | (7,178,923 | ) | ||||||||||||||||||||
Disposal | — | — | — | 248,665 | 4,695,821 | 59,735 | 89,229 | — | 5,093,450 | |||||||||||||||||||||||||||
Effect of foreign exchange differences | — | — | — | (39 | ) | (55,411 | ) | (14 | ) | (3,360 | ) | — | (58,824 | ) | ||||||||||||||||||||||
Others | — | — | 162,600 | (72 | ) | (29,857 | ) | (147 | ) | (3,382 | ) | — | 129,142 | |||||||||||||||||||||||
|
|
|
|
|
|
|
|
|
|
|
|
|
|
|
|
|
| |||||||||||||||||||
Balance on March 31, 2024 | $ | — | $ | (1,516,276 | ) | $ | (33,479,819 | ) | $ | (9,154,957 | ) | $ | (600,915,658 | ) | $ | (3,624,475 | ) | $ | (9,146,230 | ) | $ | — | $ | (657,837,415 | ) | |||||||||||
|
|
|
|
|
|
|
|
|
|
|
|
|
|
|
|
|
| |||||||||||||||||||
Balance on January 1, 2024, net | $ | 102,885,454 | $ | 201,304 | $ | 38,470,971 | $ | 1,823,771 | $ | 122,302,988 | $ | 394,937 | $ | 3,068,288 | $ | 15,937,187 | $ | 285,084,900 | ||||||||||||||||||
|
|
|
|
|
|
|
|
|
|
|
|
|
|
|
|
|
| |||||||||||||||||||
Balance on March 31, 2024, net | $ | 102,356,519 | $ | 194,612 | $ | 37,979,066 | $ | 1,887,511 | $ | 121,437,296 | $ | 368,461 | $ | 2,952,580 | $ | 13,664,355 | $ | 280,840,400 | ||||||||||||||||||
|
|
|
|
|
|
|
|
|
|
|
|
|
|
|
|
|
| |||||||||||||||||||
There was no indication that property, plant and equipment was impaired; therefore, the Company did not recognize any impairment loss for the three months ended March 31, 2024 and 2023.
Depreciation expense for assets used by the Company is computed using the straight-line method over the following estimated service lives:
| Land improvements | 10~30 years | |||
| Buildings | ||||
Main buildings | 20~60 years | |||
Other building facilities | 3~15 years | |||
| Computer equipment | 2~8 years | |||
| Telecommunications equipment | ||||
Telecommunication circuits | 2~30 years | |||
Telecommunication machinery and antennas equipment | 2~30 years | |||
| Transportation equipment | 2~10 years | |||
| Miscellaneous equipment | ||||
Leasehold improvements | 1~18 years | |||
Mechanical and air conditioner equipment | 3~16 years | |||
Others | 1~15 years |
- 29 -
| b. | Assets subject to operating leases |
| Land | Buildings | Total | ||||||||||
Cost | ||||||||||||
Balance on January 1, 2023 | $ | 4,376,196 | $ | 3,185,097 | $ | 7,561,293 | ||||||
Additions | — | 941 | 941 | |||||||||
Others | 1,530,987 | 61,479 | 1,592,466 | |||||||||
|
|
|
|
|
| |||||||
Balance on March 31, 2023 | $ | 5,907,183 | $ | 3,247,517 | $ | 9,154,700 | ||||||
|
|
|
|
|
| |||||||
Accumulated depreciation and impairment | ||||||||||||
Balance on January 1, 2023 | $ | — | $ | (1,362,302 | ) | $ | (1,362,302 | ) | ||||
Depreciation expenses | — | (14,029 | ) | (14,029 | ) | |||||||
Others | — | 29,673 | 29,673 | |||||||||
|
|
|
|
|
| |||||||
Balance on March 31, 2023 | $ | — | $ | (1,346,658 | ) | $ | (1,346,658 | ) | ||||
|
|
|
|
|
| |||||||
Balance on January 1, 2023, net | $ | 4,376,196 | $ | 1,822,795 | $ | 6,198,991 | ||||||
|
|
|
|
|
| |||||||
Balance on March 31, 2023, net | $ | 5,907,183 | $ | 1,900,859 | $ | 7,808,042 | ||||||
|
|
|
|
|
| |||||||
Cost | ||||||||||||
Balance on January 1, 2024 | $ | 4,924,387 | $ | 4,131,031 | $ | 9,055,418 | ||||||
Additions | — | 99 | 99 | |||||||||
Others | (1,181,880 | ) | 279,033 | (902,847 | ) | |||||||
|
|
|
|
|
| |||||||
Balance on March 31, 2024 | $ | 3,742,507 | $ | 4,410,163 | $ | 8,152,670 | ||||||
|
|
|
|
|
| |||||||
Accumulated depreciation and impairment | ||||||||||||
Balance on January 1, 2024 | $ | — | $ | (1,802,576 | ) | $ | (1,802,576 | ) | ||||
Depreciation expenses | — | (19,304 | ) | (19,304 | ) | |||||||
Others | — | (105,981 | ) | (105,981 | ) | |||||||
|
|
|
|
|
| |||||||
Balance on March 31, 2024 | $ | — | $ | (1,927,861 | ) | $ | (1,927,861 | ) | ||||
|
|
|
|
|
| |||||||
Balance on January 1, 2024, net | $ | 4,924,387 | $ | 2,328,455 | $ | 7,252,842 | ||||||
|
|
|
|
|
| |||||||
Balance on March 31, 2024, net | $ | 3,742,507 | $ | 2,482,302 | $ | 6,224,809 | ||||||
|
|
|
|
|
| |||||||
The Company leases out land and buildings with lease terms between 1 to 20 years. The lessees do not have bargain purchase options to acquire the assets at the expiry of the lease periods.
The future aggregate lease collection under operating lease for the freehold plant, property and equipment was as follows:
| March 31, 2024 | December 31, 2023 | March 31, 2023 | ||||||||||
Year 1 | $ | 287,684 | $ | 381,357 | $ | 415,209 | ||||||
Year 2 | 184,484 | 278,903 | 285,616 | |||||||||
Year 3 | 125,358 | 221,059 | 222,968 | |||||||||
Year 4 | 81,970 | 175,747 | 188,271 | |||||||||
Year 5 | 54,715 | 146,035 | 158,454 | |||||||||
Onwards | 122,943 | 1,025,127 | 1,133,154 | |||||||||
|
|
|
|
|
| |||||||
| $ | 857,154 | $ | 2,228,228 | $ | 2,403,672 | |||||||
|
|
|
|
|
| |||||||
- 30 -
The above items of property, plant and equipment subject to operating leases are depreciated on a straight-line basis over their estimated useful lives as follows:
Buildings | ||||
Main buildings | 35~60 years | |||
Other building facilities | 3~15 years |
| 16. | LEASE ARRANGEMENTS |
| a. | Right-of-use assets |
| March 31, 2024 | December 31, 2023 | March 31, 2023 | ||||||||||
Land and buildings | ||||||||||||
Handsets base stations | $ | 7,596,291 | $ | 7,576,685 | $ | 7,217,419 | ||||||
Others | 1,696,547 | 1,754,335 | 1,738,845 | |||||||||
Equipment | 1,830,401 | 1,906,794 | 2,137,556 | |||||||||
|
|
|
|
|
| |||||||
| $ | 11,123,239 | $ | 11,237,814 | $ | 11,093,820 | |||||||
|
|
|
|
|
| |||||||
| Three Months Ended March 31 | ||||||||
| 2024 | 2023 | |||||||
Additions to right-of-use assets | $ | 979,391 | $ | 1,221,805 | ||||
|
|
|
| |||||
Depreciation charge for right-of-use assets | ||||||||
Land and buildings | ||||||||
Handsets base stations | $ | 743,846 | $ | 725,128 | ||||
Others | 195,986 | 186,444 | ||||||
Equipment | 87,323 | 85,820 | ||||||
|
|
|
| |||||
| $ | 1,027,155 | $ | 997,392 | |||||
|
|
|
| |||||
The Company did not have significant sublease or impairment of right-of-use assets for the three months ended March 31, 2024 and 2023.
| b. | Lease liabilities |
| March 31, 2024 | December 31, 2023 | March 31, 2023 | ||||||||||
Lease liabilities | ||||||||||||
Current | $ | 3,448,987 | $ | 3,504,990 | $ | 3,319,259 | ||||||
Noncurrent | 7,398,566 | 7,470,191 | 7,243,867 | |||||||||
|
|
|
|
|
| |||||||
| $ | 10,847,553 | $ | 10,975,181 | $ | 10,563,126 | |||||||
|
|
|
|
|
| |||||||
- 31 -
Ranges of discount rates for lease liabilities were as follows:
| March 31, 2024 | December 31, 2023 | March 31, 2023 | ||||||||||
Land and buildings | ||||||||||||
Handsets base stations | 0.37%~1.78% | 0.37%~1.84% | 0.37%~1.84% | |||||||||
Others | 0.37%~9.00% | 0.37%~9.00% | 0.37%~9.00% | |||||||||
Equipment | 0.37%~3.50% | 0.37%~3.50% | 0.37%~2.87% | |||||||||
| c. | Important lease-in activities and terms |
The Company mainly enters into lease-in agreements of land and buildings for handsets base stations located throughout Taiwan with lease terms ranging from 1 to 20 years. The lease agreements do not contain bargain purchase options to acquire the assets at the expiration of the respective leases. For majority of the lease-in agreements on handsets base station, the Company has the right to terminate the agreement prior to the expiration date if the Company is unable to build the required telecommunication equipment, either due to legal restrictions, controversial events, or other events.
The Company also leases land and buildings for the use of offices, server rooms, and stores with lease terms from 1 to 30 years. Most of the lease agreements for national land adjust the lease payment according to the changes of the announced land values by the authority. At the expiry of the lease term, the Company does not have bargain purchase options to acquire the assets.
The lease agreements for equipment include a contract between Chunghwa and ST-2 Satellite Ventures Pte., Ltd. to lease capacity on the ST-2 satellite. For the information of lease agreements with related parties, please refer to Note 37 for details.
| d. | Other lease information |
| Three Months Ended March 31 | ||||||||
| 2024 | 2023 | |||||||
Expenses relating to low-value asset leases | $ | 2,063 | $ | 2,333 | ||||
|
|
|
| |||||
Expenses relating to variable lease payments not included in the measurement of lease liabilities | $ | 1,478 | $ | 1,699 | ||||
|
|
|
| |||||
Total cash outflow for leases | $ | 1,088,205 | $ | 1,118,164 | ||||
|
|
|
| |||||
The Company leases certain equipment which qualifies as low-value asset leases. The Company has elected to apply the recognition exemption and, thus, not to recognize right-of-use assets and lease liabilities for these leases.
Lease-out arrangements under operating leases for freehold property, plant, and equipment and investment properties were set out in Notes 15 and 17.
- 32 -
| 17. | INVESTMENT PROPERTIES |
Cost | ||||
Balance on January 1, 2023 | $ | 10,780,029 | ||
Reclassification | (799,762 | ) | ||
|
| |||
Balance on March 31, 2023 | $ | 9,980,267 | ||
|
| |||
Accumulated depreciation and impairment | ||||
Balance on January 1, 2023 | $ | (976,168 | ) | |
Depreciation expense | (11,064 | ) | ||
|
| |||
Balance on March 31, 2023 | $ | (987,232 | ) | |
|
| |||
Balance on January 1, 2023, net | $ | 9,803,861 | ||
|
| |||
Balance on March 31, 2023, net | $ | 8,993,035 | ||
|
| |||
Cost | ||||
Balance on January 1, 2024 | $ | 11,161,834 | ||
Reclassification | 1,747,177 | |||
|
| |||
Balance on March 31, 2024 | $ | 12,909,011 | ||
|
| |||
Accumulated depreciation and impairment | ||||
Balance on January 1, 2024 | $ | (1,356,371 | ) | |
Depreciation expense | (11,107 | ) | ||
Reclassification | (24,663 | ) | ||
|
| |||
Balance on March 31, 2024 | $ | (1,392,141 | ) | |
|
| |||
Balance on January 1, 2024, net | $ | 9,805,463 | ||
|
| |||
Balance on March 31, 2024, net | $ | 11,516,870 | ||
|
|
Depreciation expense is computed using the straight-line method over the following estimated service lives:
Land improvements | 10~30 years | |||
Buildings | ||||
Main buildings | 35~60 years | |||
Other building facilities | 4~10 years |
The fair values of the Company’s investment properties as of December 31, 2023 and 2022 were determined by Level 3 fair value measurements inputs based on the appraisal reports conducted by independent appraisers. The Company used the aforementioned appraisal reports as the basis to determine the fair values as of March 31, 2024 and 2023 because there was no material change in the economic environment or the market transaction price. Those appraisal reports are based on the comparison approach, income approach or cost approach. Key assumptions and the fair values were as follows:
| March 31, 2024 | December 31, 2023 | March 31, 2023 | ||||
Fair value | $35,336,628 | $24,236,751 | $23,829,552 | |||
|
|
| ||||
Overall capital interest rate | 1.43%~5.51% | 1.43%~5.51% | 1.31%~4.91% | |||
Profit margin ratio | 10%~20% | 10%~20% | 8%~20% | |||
Discount rate | — | — | — | |||
Capitalization rate | 0.23%~2.28% | 0.23%~2.28% | 0.23%~2.16% |
- 33 -
All of the Company’s investment properties are held under freehold interest.
The future aggregate lease collection under operating lease for investment properties is as follows:
| March 31, 2024 | December 31, 2023 | March 31, 2023 | ||||||||||
Year 1 | $ | 270,731 | $ | 168,384 | $ | 114,849 | ||||||
Year 2 | 249,088 | 156,821 | 98,762 | |||||||||
Year 3 | 224,283 | 134,231 | 84,896 | |||||||||
Year 4 | 192,871 | 104,567 | 63,667 | |||||||||
Year 5 | 172,931 | 82,732 | 39,621 | |||||||||
Onwards | 1,283,870 | 435,202 | 141,658 | |||||||||
|
|
|
|
|
| |||||||
| $ | 2,393,774 | $ | 1,081,937 | $ | 543,453 | |||||||
|
|
|
|
|
| |||||||
| 18. | INTANGIBLE ASSETS |
| Mobile Broadband Concession | Computer Software | Goodwill | Others | Total | ||||||||||||||||
Cost | ||||||||||||||||||||
Balance on January 1, 2023 | $ | 109,963,431 | $ | 2,797,835 | $ | 291,206 | $ | 421,813 | $ | 113,474,285 | ||||||||||
Additions-acquired separately | — | 45,686 | — | 432 | 46,118 | |||||||||||||||
Disposal | — | (58,190 | ) | — | (180 | ) | (58,370 | ) | ||||||||||||
Effect of foreign exchange differences | — | (42 | ) | — | 2 | (40 | ) | |||||||||||||
Others | — | 1,571 | — | — | 1,571 | |||||||||||||||
|
|
|
|
|
|
|
|
|
| |||||||||||
Balance on March 31, 2023 | $ | 109,963,431 | $ | 2,786,860 | $ | 291,206 | $ | 422,067 | $ | 113,463,564 | ||||||||||
|
|
|
|
|
|
|
|
|
| |||||||||||
Accumulated amortization and impairment | ||||||||||||||||||||
Balance on January 1, 2023 | $ | (31,812,278 | ) | $ | (2,176,234 | ) | $ | (73,624 | ) | $ | (225,062 | ) | $ | (34,287,198 | ) | |||||
Amortization expenses | (1,597,535 | ) | (71,186 | ) | — | (8,785 | ) | (1,677,506 | ) | |||||||||||
Disposal | — | 58,190 | — | 180 | 58,370 | |||||||||||||||
Effect of foreign exchange differences | — | (108 | ) | — | — | (108 | ) | |||||||||||||
Others | — | (508 | ) | — | — | (508 | ) | |||||||||||||
|
|
|
|
|
|
|
|
|
| |||||||||||
Balance on March 31, 2023 | $ | (33,409,813 | ) | $ | (2,189,846 | ) | $ | (73,624 | ) | $ | (233,667 | ) | $ | (35,906,950 | ) | |||||
|
|
|
|
|
|
|
|
|
| |||||||||||
Balance on January 1, 2023, net | $ | 78,151,153 | $ | 621,601 | $ | 217,582 | $ | 196,751 | $ | 79,187,087 | ||||||||||
|
|
|
|
|
|
|
|
|
| |||||||||||
Balance on March 31, 2023, net | $ | 76,553,618 | $ | 597,014 | $ | 217,582 | $ | 188,400 | $ | 77,556,614 | ||||||||||
|
|
|
|
|
|
|
|
|
| |||||||||||
Cost | ||||||||||||||||||||
Balance on January 1, 2024 | $ | 109,963,431 | $ | 2,532,249 | $ | 291,206 | $ | 421,835 | $ | 113,208,721 | ||||||||||
Additions-acquired separately | — | 38,579 | — | 1,695 | 40,274 | |||||||||||||||
Disposal | — | (103,569 | ) | — | (7,044 | ) | (110,613 | ) | ||||||||||||
Effect of foreign exchange differences | — | 170 | — | (10 | ) | 160 | ||||||||||||||
Others | — | 1,271 | — | — | 1,271 | |||||||||||||||
|
|
|
|
|
|
|
|
|
| |||||||||||
Balance on March 31, 2024 | $ | 109,963,431 | $ | 2,468,700 | $ | 291,206 | $ | 416,476 | $ | 113,139,813 | ||||||||||
|
|
|
|
|
|
|
|
|
| |||||||||||
(Continued)
- 34 -
| Mobile Broadband Concession | Computer Software | Goodwill | Others | Total | ||||||||||||||||
Accumulated amortization and impairment | ||||||||||||||||||||
Balance on January 1, 2024 | $ | (38,202,416 | ) | $ | (1,954,096 | ) | $ | (73,624 | ) | $ | (252,040 | ) | $ | (40,482,176 | ) | |||||
Amortization expenses | (1,597,535 | ) | (67,167 | ) | — | (7,570 | ) | (1,672,272 | ) | |||||||||||
Disposal | — | 103,569 | — | 7,044 | 110,613 | |||||||||||||||
Effect of foreign exchange differences | — | (71 | ) | — | 5 | (66 | ) | |||||||||||||
|
|
|
|
|
|
|
|
|
| |||||||||||
Balance on March 31, 2024 | $ | (39,799,951 | ) | $ | (1,917,765 | ) | $ | (73,624 | ) | $ | (252,561 | ) | $ | (42,043,901 | ) | |||||
|
|
|
|
|
|
|
|
|
| |||||||||||
Balance on January 1, 2024 net | $ | 71,761,015 | $ | 578,153 | $ | 217,582 | $ | 169,795 | $ | 72,726,545 | ||||||||||
|
|
|
|
|
|
|
|
|
| |||||||||||
Balance on March 31, 2024 net | $ | 70,163,480 | $ | 550,935 | $ | 217,582 | $ | 163,915 | $ | 71,095,912 | ||||||||||
|
|
|
|
|
|
|
|
|
| |||||||||||
(Concluded)
The concessions are granted and issued by the National Communications Commission (“NCC”). The concession fees are amortized using the straight-line method over the period from the date operations commence through the date the license expires or the useful life, whichever is shorter. The 4G concession fees will be fully amortized by December 2030 and December 2033 and 5G concession fees will be fully amortized by December 2040.
The computer software is amortized using the straight-line method over the estimated useful lives of 1 to 10 years. Other intangible assets, except for those assessed as having indefinite useful lives, are amortized using the straight-line method over the estimated useful lives of 3 to 20 years. Goodwill is not amortized.
| 19. | OTHER ASSETS |
| March 31, 2024 | December 31, 2023 | March 31, 2023 | ||||||||||
Spare parts | $ | 2,393,762 | $ | 2,232,800 | $ | 3,681,949 | ||||||
Refundable deposits | 1,942,580 | 1,994,503 | 1,854,044 | |||||||||
Other financial assets | 1,000,000 | 1,000,000 | 1,000,000 | |||||||||
Others | 2,587,175 | 2,223,648 | 1,777,588 | |||||||||
|
|
|
|
|
| |||||||
| $ | 7,923,517 | $ | 7,450,951 | $ | 8,313,581 | |||||||
|
|
|
|
|
| |||||||
Current | ||||||||||||
Spare parts | $ | 2,393,762 | $ | 2,232,800 | $ | 3,681,949 | ||||||
Others | 727,134 | 589,459 | 159,470 | |||||||||
|
|
|
|
|
| |||||||
| $ | 3,120,896 | $ | 2,822,259 | $ | 3,841,419 | |||||||
|
|
|
|
|
| |||||||
Noncurrent | ||||||||||||
Refundable deposits | $ | 1,942,580 | $ | 1,994,503 | $ | 1,854,044 | ||||||
Other financial assets | 1,000,000 | 1,000,000 | 1,000,000 | |||||||||
Others | 1,860,041 | 1,634,189 | 1,618,118 | |||||||||
|
|
|
|
|
| |||||||
| $ | 4,802,621 | $ | 4,628,692 | $ | 4,472,162 | |||||||
|
|
|
|
|
| |||||||
- 35 -
Other financial assets - noncurrent was Piping Fund. As part of the government’s effort to upgrade the existing telecommunications infrastructure, Chunghwa and other public utility companies were required by the ROC government to contribute to a Piping Fund administered by the Taipei City Government. This fund was used to finance various telecommunications infrastructure projects. Net assets of this fund will be returned proportionately after the project is completed.
| 20. | HEDGING FINANCIAL INSTRUMENTS |
Chunghwa’s hedge strategy is to enter into forward exchange contracts - buy to avoid its foreign currency exposure to certain foreign currency denominated equipment payments in the following six months. In addition, Chunghwa’s management considers the market condition to determine the hedge ratio and enters into forward exchange contracts with the banks to avoid the foreign currency risk.
Chunghwa signed equipment purchase contracts with suppliers and entered into forward exchange contracts to avoid foreign currency risk exposure to Euro-denominated purchase commitments. Those forward exchange contracts were designated as cash flow hedges. When forecast purchases actually take place, basis adjustments are made to the initial carrying amounts of hedged items.
For the hedges of highly probable forecast sales and purchases, as the critical terms (i.e. the notional amount, life and underlying) of the forward foreign exchange contracts and their corresponding hedged items are the same, the Company performs a qualitative assessment of effectiveness and it is expected that the value of the forward contracts and the value of the corresponding hedged items will systematically change in opposite direction in response to movements in the underlying exchange rates.
The main source of hedge ineffectiveness in these hedging relationships is the effect of credit risks of the Company and the counterparty on the fair value of the forward exchange contracts. Such credit risks do not impact the fair value of the hedged item attributable to changes in foreign exchange rates. No other sources of ineffectiveness emerged from these hedging relationships.
The following tables summarized the information relating to the hedges for foreign currency risk.
March 31, 2024
| Notional Amount | Forward Rate | Line Item in | Carrying Amount | Change in Fair Values of Hedging Instruments Used for Calculating | ||||||||||||||||||||||||||||
| Hedging Instruments | Currency | (In Thousands) | Maturity | (In Dollars) | Balance Sheet | Asset | Liability | Ineffectiveness | ||||||||||||||||||||||||
Cash flow hedge | ||||||||||||||||||||||||||||||||
Forecast purchases - forward exchange contracts | NT$ | /EUR | | NT$ 47,915 /EUR 1,400 |
| June 2024 | $ | 34.23 | | Hedging financial assets (liabilities) | | $ | 29 | $ | — | $ | 73 | |||||||||||||||
Change in Value of Hedged Item Used for Calculating Hedge Ineffectiveness | Accumulated Gain or Loss on Hedging Instruments in Other Equity | |||||||||||
| Hedged Items | Continuing Hedges | Hedge No Longer Applied | ||||||||||
Cash flow hedge | ||||||||||||
Forecast equipment purchases | $ | (73 | ) | $ | 29 | $ | — | |||||
- 36 -
December 31, 2023
| Notional Amount | Forward | Line Item in | Carrying Amount | Change in Fair Values of Hedging for Calculating Hedge | ||||||||||||||||||||||||||||
| Hedging Instruments | Currency | (In Thousands) | Maturity | Rate | Balance Sheet | Asset | Liability | Ineffectiveness | ||||||||||||||||||||||||
Cash flow hedge | ||||||||||||||||||||||||||||||||
Forecast purchases - forward exchange contracts | NT$ | /EUR | | NT$ 23,717 /EUR 700 |
| March 2024 | $ | 33.88 | | Hedging financial assets (liabilities) | | $ | — | $ | 44 | $ | (12,935 | ) | ||||||||||||||
Change in Value of Hedged Item Used for Calculating Hedge Ineffectiveness | Accumulated Gain or Loss on Hedging Instruments in Other Equity | |||||||||||
| Hedged Items | Continuing Hedges | Hedge No Longer Applied | ||||||||||
Cash flow hedge | ||||||||||||
Forecast equipment purchases | $ | 12,935 | $ | (44 | ) | $ | — | |||||
March 31, 2023
| Notional Amount | Forward | Line Item in | Carrying Amount | Change in Fair Values of Hedging Instruments Used for Calculating Hedge | ||||||||||||||||||||||||||||
| Hedging Instruments | Currency | (In Thousands) | Maturity | Rate | Balance Sheet | Asset | Liability | Ineffectiveness | ||||||||||||||||||||||||
Cash flow hedge | ||||||||||||||||||||||||||||||||
Forecast purchases - forward exchange contracts | NT$ | /EUR | | NT$ 72,481 /EUR 2,233 |
| June 2023 | $ | 32.46 | | Hedging financial assets (liabilities) | | $ | 1,196 | $ | — | $ | (11,695 | ) | ||||||||||||||
Change in Value of Hedged Item Used for Calculating Hedge Ineffectiveness | Accumulated Gain or Loss on Hedging Instruments in Other Equity | |||||||||||
| Hedged Items | Continuing Hedges | Hedge Longer Applied | ||||||||||
Cash flow hedge | ||||||||||||
Forecast equipment purchases | $ | 11,695 | $ | 1,196 | $ | — | ||||||
- 37 -
Three months ended March 31, 2024
| Comprehensive Income | Reclassification from Equity to Assets and the Adjusted Line Item | |||||||||||||||||||
| Hedge Transaction | Hedging Gain or in OCI | Amount of Hedge Ineffectiveness Recognized in Profit or Loss | Line Item in is Included | Amount Reclassified to Assets and the Adjusted Line Item | Due to Hedged Expected to | |||||||||||||||
Cash flow hedge | ||||||||||||||||||||
Forecast equipment purchases | $ | 73 | $ | — | — | $ | 1,551 | $ | — | |||||||||||
| | Construction in progress and equipment to be accepted | | | Other gains and losses | | |||||||||||||||
Three months ended March 31, 2023
| Comprehensive Income | Reclassification from Equity to Assets and the Adjusted Line Item | |||||||||||||||||||
| Hedge Transaction | Hedging Gain or in OCI | Amount of Hedge Ineffectiveness Recognized in Profit or Loss | Line Item in is Included | Amount Reclassified to Assets and the Adjusted Line Item | Due to Hedged Future Cash Flows No Longer Expected to Occur | |||||||||||||||
Cash flow hedge | ||||||||||||||||||||
Forecast equipment purchases | $ | (11,695 | ) | $ | — | — | $ | 14,855 | $ | — | ||||||||||
| | Construction in progress and equipment to be accepted | | | Other gains and losses | | |||||||||||||||
| 21. | SHORT-TERM LOANS |
| March 31, 2024 | December 31, 2023 | March 31, 2023 | ||||||||||
Unsecured bank loans | $ | 465,000 | $ | 585,000 | $ | 341,800 | ||||||
|
|
|
|
|
| |||||||
The annual interest rates of bank loans were as follows:
| March 31, 2024 | December 31, 2023 | March 31, 2023 | ||||||||||
Unsecured bank loans | 1.70%~3.49 | % | 2.16%~3.36 | % | 1.54%~3.19 | % | ||||||
- 38 -
| 22. | LONG-TERM LOANS |
| March 31, 2024 | December 31, 2023 | March 31, 2023 | ||||||||||
Secured bank loans (Note 38) | $ | 1,600,000 | $ | 1,600,000 | $ | 1,600,000 | ||||||
Less: Current portion | (1,600,000 | ) | (1,600,000 | ) | — | |||||||
|
|
|
|
|
| |||||||
| $ | — | $ | — | $ | 1,600,000 | |||||||
|
|
|
|
|
| |||||||
The annual interest rates of bank loans were as follows:
| March 31, 2024 | December 31, 2023 | March 31, 2023 | ||||||||||
Secured bank loans | 1.87 | % | 1.87 | % | 1.80 | % | ||||||
LED obtained a secured loan from Chang Hwa Bank with monthly interest payments. The contract will be due in September 2024.
| 23. | BONDS PAYABLE |
| March 31, 2024 | December 31, 2023 | March 31, 2023 | ||||||||||
Unsecured domestic bonds | $ | 30,500,000 | $ | 30,500,000 | $ | 30,500,000 | ||||||
Less: Discounts on bonds payable | (15,844 | ) | (17,234 | ) | (21,261 | ) | ||||||
|
|
|
|
|
| |||||||
| $ | 30,484,156 | $ | 30,482,766 | $ | 30,478,739 | |||||||
|
|
|
|
|
| |||||||
The major terms of unsecured domestic bonds issued by Chunghwa were as follows:
| Issuance | Tranche | Issuance Period | Total Amount | Coupon Rate | Repayment and Interest Payment | |||||||||
2020-1 | A | July 2020 to July 2025 | $ | 8,800,000 | 0.50 | % | One-time repayment upon maturity; interest payable annually | |||||||
| B | July 2020 to July 2027 | 7,500,000 | 0.54 | % | The same as above | |||||||||
| C | July 2020 to July 2030 | 3,700,000 | 0.59 | % | The same as above | |||||||||
2021-1 | A | April 2021 to April 2026 | 1,900,000 | 0.42 | % | The same as above | ||||||||
| B | April 2021 to April 2028 | 4,100,000 | 0.46 | % | The same as above | |||||||||
| C | April 2021 to April 2031 | 1,000,000 | 0.50 | % | The same as above | |||||||||
2022-1 (Sustainable Bond) | - | March 2022 to March 2027 | 3,500,000 | 0.69 | % | The same as above | ||||||||
| 24. | TRADE NOTES AND ACCOUNTS PAYABLE |
| March 31, 2024 | December 31, 2023 | March 31, 2023 | ||||||||||
Trade notes and accounts payable | $ | 9,806,485 | $ | 14,395,740 | $ | 9,972,835 | ||||||
|
|
|
|
|
| |||||||
Trade notes and accounts payable were attributable to operating activities and the trading conditions were agreed separately.
- 39 -
| 25. | OTHER PAYABLES |
| March 31, 2024 | December 31, 2023 | March 31, 2023 | ||||||||||
Accrued salary and compensation | $ | 7,774,277 | $ | 10,441,118 | $ | 7,401,186 | ||||||
Accrued compensation to employees and remuneration to directors and supervisors | 2,688,772 | 2,107,392 | 2,650,942 | |||||||||
Amounts collected for others | 1,623,358 | 1,543,596 | 1,836,117 | |||||||||
Payables to contractors | 1,167,660 | 1,990,007 | 1,289,069 | |||||||||
Accrued maintenance costs | 1,069,055 | 1,316,233 | 760,964 | |||||||||
Payables to equipment suppliers | 813,574 | 1,311,426 | 1,254,124 | |||||||||
Others | 7,800,048 | 6,547,154 | 6,772,371 | |||||||||
|
|
|
|
|
| |||||||
| $ | 22,936,744 | $ | 25,256,926 | $ | 21,964,773 | |||||||
|
|
|
|
|
| |||||||
| 26. | PROVISIONS |
| March 31, 2024 | December 31, 2023 | March 31, 2023 | ||||||||||
Employee benefits | $ | 391,808 | $ | 387,082 | $ | 363,554 | ||||||
Warranties | 238,655 | 237,873 | 228,206 | |||||||||
Onerous contracts | 175,504 | 194,651 | 92,001 | |||||||||
Others | 3,067 | 3,067 | 3,767 | |||||||||
|
|
|
|
|
| |||||||
| $ | 809,034 | $ | 822,673 | $ | 687,528 | |||||||
|
|
|
|
|
| |||||||
Current | $ | 316,748 | $ | 337,406 | $ | 222,990 | ||||||
Noncurrent | 492,286 | 485,267 | 464,538 | |||||||||
|
|
|
|
|
| |||||||
| $ | 809,034 | $ | 822,673 | $ | 687,528 | |||||||
|
|
|
|
|
| |||||||
| Employee Benefits | Warranties | Onerous Contracts | Others | Total | ||||||||||||||||
Balance on January 1, 2023 | $ | 64,776 | $ | 235,308 | $ | 95,201 | $ | 3,767 | $ | 399,052 | ||||||||||
Additional / (reversal of) provisions recognized | 299,224 | 12,201 | (3,200 | ) | — | 308,225 | ||||||||||||||
Used / forfeited during the period | (446 | ) | (19,306 | ) | — | — | (19,752 | ) | ||||||||||||
Effect of foreign exchange differences | — | 3 | — | — | 3 | |||||||||||||||
|
|
|
|
|
|
|
|
|
| |||||||||||
Balance on March 31, 2023 | $ | 363,554 | $ | 228,206 | $ | 92,001 | $ | 3,767 | $ | 687,528 | ||||||||||
|
|
|
|
|
|
|
|
|
| |||||||||||
Balance on January 1, 2024 | $ | 387,082 | $ | 237,873 | $ | 194,651 | $ | 3,067 | $ | 822,673 | ||||||||||
Additional / (reversal of) provisions recognized | 9,131 | 8,136 | (19,147 | ) | — | (1,880 | ) | |||||||||||||
Used / forfeited during the period | (4,405 | ) | (7,408 | ) | — | — | (11,813 | ) | ||||||||||||
Effect of foreign exchange differences | — | 54 | — | — | 54 | |||||||||||||||
|
|
|
|
|
|
|
|
|
| |||||||||||
Balance on March 31, 2024 | $ | 391,808 | $ | 238,655 | $ | 175,504 | $ | 3,067 | $ | 809,034 | ||||||||||
|
|
|
|
|
|
|
|
|
| |||||||||||
| a. | The provision for warranty claims represents the present value of the management’s best estimate of the future outflow of economic benefits that will be required under the Company’s obligation for warranties in sales agreements. The estimate has been made based on historical warranty experience. |
- 40 -
| b. | The provision for employee benefits represents vested long-term service compensation accrued. |
| c. | The provision for onerous contracts represents the present obligation resulting from the measurement for the unavoidable costs of meeting the Company’s contractual obligations exceed the economic benefits expected to be received from the contracts. |
| 27. | RETIREMENT BENEFIT PLANS |
Relevant pension costs for defined benefit plans which were determined by the pension cost rates of actuarial valuation as of December 31, 2023 and 2022 were as follows:
| Three Months Ended March 31 | ||||||||
| 2024 | 2023 | |||||||
Operating costs | $ | 104,906 | $ | 122,969 | ||||
Marketing expenses | 77,832 | 82,029 | ||||||
General and administrative expenses | 17,883 | 19,699 | ||||||
Research and development expenses | 8,012 | 8,813 | ||||||
|
|
|
| |||||
| $ | 208,633 | $ | 233,510 | |||||
|
|
|
| |||||
| 28. | EQUITY |
| a. | Share capital |
| 1) | Common stocks |
| March 31, 2024 | December 31, 2023 | March 31, 2023 | ||||||||||
Number of authorized shares (thousand) | 12,000,000 | 12,000,000 | 12,000,000 | |||||||||
|
|
|
|
|
| |||||||
Authorized shares | $ | 120,000,000 | $ | 120,000,000 | $ | 120,000,000 | ||||||
|
|
|
|
|
| |||||||
Number of issued and paid shares (thousand) | 7,757,447 | 7,757,447 | 7,757,447 | |||||||||
|
|
|
|
|
| |||||||
Issued shares | $ | 77,574,465 | $ | 77,574,465 | $ | 77,574,465 | ||||||
|
|
|
|
|
| |||||||
Each issued common stock with par value of $10 is entitled the right to vote and receive dividends.
| 2) | Global depositary receipts |
The MOTC and some stockholders sold some common stocks of Chunghwa in an international offering of securities in the form of American Depositary Shares (“ADS”) (one ADS represents 10 common stocks) in July 2003, August 2005, and September 2006. The ADSs were traded on the New York Stock Exchange since July 17, 2003. As of March 31, 2024, the outstanding ADSs were 183,555 thousand common stocks, which equaled 18,356 thousand units and represented 2.37% of Chunghwa’s total outstanding common stocks.
The ADS holders generally have the same rights and obligations as other common stockholders, subject to the provision of relevant laws. The exercise of such rights and obligations shall comply with the related regulations and deposit agreement, which stipulate, among other things, that ADS holders are entitled to, through deposit agents:
| a) | Exercise their voting rights, |
- 41 -
| b) | Sell their ADSs, and |
| c) | Receive dividends declared and subscribe to the issuance of new shares. |
| b. | Additional paid-in capital |
The adjustments of additional paid-in capital for the three months ended March 31, 2024 and 2023 were as follows:
| Share Premium | Movements of Additional Paid-in Capital for Associates and Joint Ventures Accounted for Using Equity Method | Movements of Additional Paid-in Capital Arising from Changes in Equities of Subsidiaries | Difference between Consideration Received or Paid and Carrying Amount of the Subsidiaries’ Net Assets during Actual Disposal or Acquisition | Donated Capital | Stockholders’ Contribution due to Privatization | Total | ||||||||||||||||||||||
Balance on January 1, 2023 | $ | 147,329,386 | $ | 173,672 | $ | 2,137,032 | $ | 987,611 | $ | 25,119 | $ | 20,648,078 | $ | 171,300,898 | ||||||||||||||
Share-based payment transactions of subsidiaries | — | — | 8,900 | — | — | — | 8,900 | |||||||||||||||||||||
|
|
|
|
|
|
|
|
|
|
|
|
|
| |||||||||||||||
Balance on March 31, 2023 | $ | 147,329,386 | $ | 173,672 | $ | 2,145,932 | $ | 987,611 | $ | 25,119 | $ | 20,648,078 | $ | 171,309,798 | ||||||||||||||
|
|
|
|
|
|
|
|
|
|
|
|
|
| |||||||||||||||
Balance on January 1, 2024 | $ | 147,329,386 | $ | 151,952 | $ | 2,144,727 | $ | 987,607 | $ | 27,336 | $ | 20,648,078 | $ | 171,289,086 | ||||||||||||||
Change in additional paid-in capital from investments in associates and joint ventures accounted for using equity method | — | 76,658 | — | — | — | — | 76,658 | |||||||||||||||||||||
Share-based payment transactions of subsidiaries | — | — | (405 | ) | — | — | — | (405 | ) | |||||||||||||||||||
|
|
|
|
|
|
|
|
|
|
|
|
|
| |||||||||||||||
Balance on March 31, 2024 | $ | 147,329,386 | $ | 228,610 | $ | 2,144,322 | $ | 987,607 | $ | 27,336 | $ | 20,648,078 | $ | 171,365,339 | ||||||||||||||
|
|
|
|
|
|
|
|
|
|
|
|
|
| |||||||||||||||
Additional paid-in capital from share premium, donated capital and the difference between the consideration received or paid and the carrying amount of the subsidiaries’ net assets during actual disposal or acquisition may be utilized to offset deficits. Furthermore, when Chunghwa has no deficit, it may be distributed in cash or capitalized, which however is limited to a certain percentage of Chunghwa’s paid-in capital except the additional paid-in capital arising from unclaimed dividend can only be utilized to offset deficits.
The additional paid-in capital from movements of paid-in capital arising from changes in equities of subsidiaries may only be utilized to offset deficits.
Among additional paid-in capital from movements of investments in associates and joint ventures accounted for using equity method, the portion arising from the difference between the consideration received or paid and the carrying amount of the subsidiaries net assets during actual disposal or acquisition may be utilized to offset deficits; furthermore, when the Company has no deficit, it may be distributed in cash or capitalized. However, other additional paid-in capital recognized in proportion of share ownership may only be utilized to offset deficits.
| c. | Retained earnings and dividends policy |
In accordance with the Chunghwa’s Articles of Incorporation, Chunghwa must pay all outstanding taxes, offset deficits in prior years and set aside a legal reserve equal to 10% of its net income before distributing a dividend or making any other distribution to stockholders, except when the accumulated amount of such legal reserve equals to Chunghwa’s total issued capital, and depending on its business needs or requirements, may also set aside or reverse special reserves. No less than 50% of the remaining earnings comprising remaining balance of net income, if any, plus cumulative undistributed earnings shall be distributed as stockholders’ dividends, of which cash dividends to be distributed shall not be less than 50% of the total amount of dividends to be distributed. If cash dividend to be distributed is less than $0.10 per share, such cash dividend shall be distributed in the form of common stocks.
- 42 -
The Company should appropriate a special reserve when the net amount of other equity items is negative at the end of reporting period upon the earnings distribution. Distributions can be made out of any subsequent reversal of the debit to other equity items.
The appropriation for legal reserve shall be made until the accumulated reserve equals the aggregate par value of the outstanding capital stock of Chunghwa. This reserve can only be used to offset a deficit, or, when the legal reserve has exceeded 25% of Chunghwa’s paid-in capital, the excess may be transferred to capital or distributed in cash.
The appropriations of the 2023 earnings of Chunghwa proposed by the Chunghwa’s Board of Directors on February 23, 2024 and the appropriations of the 2022 earnings of Chunghwa approved by the stockholders in their meetings on May 26, 2023 were as follows:
| Appropriation of Earnings | Dividends Per Share (NT$) | |||||||||||||||
| For Fiscal Year 2023 | For Fiscal Year 2022 | For Fiscal Year 2023 | For Fiscal Year 2022 | |||||||||||||
Reversal of special reserve | $ | (223,084 | ) | $ | (185,066 | ) | ||||||||||
Cash dividends | 36,909,931 | 36,475,514 | $ | 4.758 | $ | 4.702 | ||||||||||
The appropriations of earnings for 2023 are subject to the resolution of the stockholders’ meeting planned to be held on May 31, 2024. Information of the appropriation of Chunghwa’s earnings proposed by the Board of Directors and approved by the stockholders is available on the Market Observation Post System website.
| d. | Others |
| 1) | Exchange differences arising from the translation of the foreign operations |
The exchange differences arising from the translation of the foreign operations from their functional currency to New Taiwan dollars were recognized as exchange differences arising from the translation of the foreign operations in other comprehensive income.
| 2) | Unrealized gain or loss on financial assets at FVOCI |
| Three Months Ended March 31 | ||||||||
| 2024 | 2023 | |||||||
Beginning balance | $ | 520,748 | $ | (124,762 | ) | |||
Unrealized gain or loss for the period | ||||||||
Equity instruments | 628,015 | 546,641 | ||||||
Share of loss of associates and joint ventures accounted for using equity method | (1,295 | ) | (165 | ) | ||||
|
|
|
| |||||
Ending balance | $ | 1,147,468 | $ | 421,714 | ||||
|
|
|
| |||||
- 43 -
| e. | Noncontrolling interests |
| Three Months Ended March 31 | ||||||||
| 2024 | 2023 | |||||||
Beginning balance | $ | 12,596,252 | $ | 12,599,541 | ||||
Shares attributed to noncontrolling interests | ||||||||
Net income for the period | 212,764 | 229,791 | ||||||
Exchange differences arising from the translation of the foreign operations | 10,298 | (2,494 | ) | |||||
Unrealized gain or loss on financial assets at FVOCI | (1,547 | ) | 2,191 | |||||
Share of other comprehensive income (loss) of associates and joint ventures accounted for using equity method | 19,262 | (509 | ) | |||||
Cash dividends distributed by subsidiaries | (716,689 | ) | (676,862 | ) | ||||
Share-based payment transactions of subsidiaries | 16,023 | (6,428 | ) | |||||
Net increase in noncontrolling interests | — | 15,173 | ||||||
|
|
|
| |||||
Ending balance | $ | 12,136,363 | $ | 12,160,403 | ||||
|
|
|
| |||||
| 29. | REVENUES |
| Three Months Ended March 31 | ||||||||
| 2024 | 2023 | |||||||
Revenue from contracts with customers | $ | 54,329,761 | $ | 53,125,275 | ||||
|
|
|
| |||||
Other revenues | ||||||||
Rental income | 291,500 | 275,524 | ||||||
Government grants income | 274,352 | 763,227 | ||||||
Others | 47,858 | 46,879 | ||||||
|
|
|
| |||||
| 613,710 | 1,085,630 | |||||||
|
|
|
| |||||
| $ | 54,943,471 | $ | 54,210,905 | |||||
|
|
|
| |||||
For the information of performance obligations related to customer contracts, please refer to Note 3 Summary of Material Accounting Policy Information to the consolidated financial statements for the year ended December 31, 2023 for details.
| a. | Disaggregation of revenue |
Please refer to Note 42 Segment Information for details.
| b. | Contract balances |
March 31, 2024 | December 31, 2023 | March 31, 2023 | January 1, 2023 | |||||||||||||
Trade notes and accounts receivable (Note 9) | $ | 22,623,592 | $ | 24,841,995 | $ | 20,990,008 | $ | 24,672,473 | ||||||||
|
|
|
|
|
|
|
| |||||||||
Contract assets | ||||||||||||||||
Products and service bundling | $ | 9,679,196 | $ | 9,297,181 | $ | 8,322,556 | $ | 7,955,689 | ||||||||
Others | 1,346,077 | 1,205,973 | 1,165,747 | 1,255,584 | ||||||||||||
Less: Loss allowance | (22,366 | ) | (21,282 | ) | (19,911 | ) | (19,129 | ) | ||||||||
|
|
|
|
|
|
|
| |||||||||
| $ | 11,002,907 | $ | 10,481,872 | $ | 9,468,392 | $ | 9,192,144 | |||||||||
|
|
|
|
|
|
|
| |||||||||
(Continued)
- 44 -
March 31, 2024 | December 31, 2023 | March 31, 2023 | January 1, 2023 | |||||||||||||
Current | $ | 6,985,515 | $ | 6,713,227 | $ | 6,123,875 | $ | 6,055,343 | ||||||||
Noncurrent | 4,017,392 | 3,768,645 | 3,344,517 | 3,136,801 | ||||||||||||
|
|
|
|
|
|
|
| |||||||||
| $ | 11,002,907 | $ | 10,481,872 | $ | 9,468,392 | $ | 9,192,144 | |||||||||
|
|
|
|
|
|
|
| |||||||||
Contract liabilities | ||||||||||||||||
Telecommunications business | $ | 13,961,741 | $ | 14,015,949 | $ | 13,790,626 | $ | 14,081,316 | ||||||||
Project business | 6,637,247 | 6,654,364 | 6,102,454 | 6,586,384 | ||||||||||||
Advance land receipts (Note 39) | 576,826 | 459,697 | — | — | ||||||||||||
Others | 677,019 | 518,758 | 670,263 | 396,834 | ||||||||||||
|
|
|
|
|
|
|
| |||||||||
| $ | 21,852,833 | $ | 21,648,768 | $ | 20,563,343 | $ | 21,064,534 | |||||||||
|
|
|
|
|
|
|
| |||||||||
Current | $ | 14,293,408 | $ | 14,088,416 | $ | 12,898,161 | $ | 13,390,439 | ||||||||
Noncurrent | 7,559,425 | 7,560,352 | 7,665,182 | 7,674,095 | ||||||||||||
|
|
|
|
|
|
|
| |||||||||
| $ | 21,852,833 | $ | 21,648,768 | $ | 20,563,343 | $ | 21,064,534 | |||||||||
|
|
|
|
|
|
|
| |||||||||
(Concluded)
The changes in the contract asset and the contract liability balances primarily result from the timing difference between the satisfaction of performance obligations and the payments collected from customers.
The Company applies the simplified approach to recognize expected credit losses prescribed by IFRS 9, which permits the use of lifetime expected loss provision for receivables. Contract assets will be reclassified to trade receivables when the corresponding invoice is billed to the client. Contract assets have substantially the same risk characteristics as the trade receivables of the same types of contracts. Therefore, the Company concluded that the expected loss rates for trade receivables can be applied to the contract assets.
| c. | Incremental costs of obtaining contracts |
| March 31, 2024 | December 31, 2023 | March 31, 2023 | ||||||||||
Current | ||||||||||||
Incremental costs of obtaining contracts | $ | 271,077 | $ | 210,923 | $ | — | ||||||
|
|
|
|
|
| |||||||
Noncurrent | ||||||||||||
Incremental costs of obtaining contracts | $ | 975,660 | $ | 939,409 | $ | 954,772 | ||||||
|
|
|
|
|
| |||||||
The Company considered the past experience and the default clauses in the telecommunications service contracts and believes the commissions and equipment subsidies paid for obtaining such contracts are expected to be recoverable; therefore, such costs were capitalized. LED also believes the commissions paid for obtaining real estate sale contracts are expected to be recoverable; therefore, such costs were capitalized and classified as current by the operating cycle. Amortization expenses for the three months ended March 31, 2024 and 2023 are $214,720 thousand and $214,202 thousand, respectively.
- 45 -
| 30. | NET INCOME |
| a. | Other income and expenses |
| Three Months Ended March 31 | ||||||||
| 2024 | 2023 | |||||||
Gain (loss) on disposal of property, plant and equipment, net | $ | 2,520 | $ | (44 | ) | |||
|
|
|
| |||||
| b. | Other income |
| Three Months Ended March 31 | ||||||||
| 2024 | 2023 | |||||||
Rental income | $ | 17,487 | $ | 18,904 | ||||
Others | 20,282 | 25,882 | ||||||
|
|
|
| |||||
| $ | 37,769 | $ | 44,786 | |||||
|
|
|
| |||||
| c. | Other gains and losses |
| Three Months Ended March 31 | ||||||||
| 2024 | 2023 | |||||||
Valuation loss on financial assets and liabilities at fair value through profit or loss, net | $ | (61,657 | ) | $ | (46,086 | ) | ||
Foreign currency exchange loss, net | (6,644 | ) | (54,991 | ) | ||||
Gain on disposal of financial instruments, net | 1,073 | — | ||||||
Others | 5,964 | (2,887 | ) | |||||
|
|
|
| |||||
| $ | (61,264 | ) | $ | (103,964 | ) | |||
|
|
|
| |||||
| d. | Interest expenses |
| Three Months Ended March 31 | ||||||||
| 2024 | 2023 | |||||||
Interest on bonds payable | $ | 41,970 | $ | 41,963 | ||||
Interest on lease liabilities | 29,449 | 23,233 | ||||||
Interest paid to financial institutions | 11,199 | 10,212 | ||||||
Others | 669 | 4 | ||||||
|
|
|
| |||||
| $ | 83,287 | $ | 75,412 | |||||
|
|
|
| |||||
| e. | Impairment loss (reversal of impairment loss) |
| Three Months Ended March 31 | ||||||||
| 2024 | 2023 | |||||||
Contract assets | $ | 1,084 | $ | 782 | ||||
|
|
|
| |||||
Trade notes and accounts receivable | $ | 56,172 | $ | 100,286 | ||||
|
|
|
| |||||
Other receivables | $ | (1,470 | ) | $ | (700 | ) | ||
|
|
|
| |||||
Inventories | $ | 25,576 | $ | 5,274 | ||||
|
|
|
| |||||
- 46 -
| f. | Depreciation and amortization expenses |
| Three Months Ended March 31 | ||||||||
| 2024 | 2023 | |||||||
Property, plant and equipment | $ | 7,198,227 | $ | 7,195,486 | ||||
Right-of-use assets | 1,027,155 | 997,392 | ||||||
Investment properties | 11,107 | 11,064 | ||||||
Intangible assets | 1,672,272 | 1,677,506 | ||||||
Incremental costs of obtaining contracts | 214,720 | 214,202 | ||||||
|
|
|
| |||||
Total depreciation and amortization expenses | $ | 10,123,481 | $ | 10,095,650 | ||||
|
|
|
| |||||
Depreciation expenses summarized by functions | ||||||||
Operating costs | $ | 7,701,733 | $ | 7,656,051 | ||||
Operating expenses | 534,756 | 547,891 | ||||||
|
|
|
| |||||
| $ | 8,236,489 | $ | 8,203,942 | |||||
|
|
|
| |||||
Amortization expenses summarized by functions | ||||||||
Operating costs | $ | 1,838,789 | $ | 1,844,102 | ||||
Marketing expenses | 20,433 | 17,397 | ||||||
General and administrative expenses | 15,746 | 17,792 | ||||||
Research and development expenses | 12,024 | 12,417 | ||||||
|
|
|
| |||||
| $ | 1,886,992 | $ | 1,891,708 | |||||
|
|
|
| |||||
| g. | Employee benefit expenses |
| Three Months Ended March 31 | ||||||||
| 2024 | 2023 | |||||||
Post-employment benefit | ||||||||
Defined contribution plans | $ | 256,170 | $ | 231,703 | ||||
Defined benefit plans | 208,633 | 233,510 | ||||||
|
|
|
| |||||
| 464,803 | 465,213 | |||||||
|
|
|
| |||||
Share-based payment | ||||||||
Equity-settled share-based payment | 2,373 | 2,472 | ||||||
|
|
|
| |||||
Other employee benefit (Note) | 11,383,272 | 11,068,564 | ||||||
|
|
|
| |||||
Total employee benefit expenses | $ | 11,850,448 | $ | 11,536,249 | ||||
|
|
|
| |||||
Summary by functions | ||||||||
Operating costs | $ | 5,522,712 | $ | 5,486,895 | ||||
Operating expenses | 6,327,736 | 6,049,354 | ||||||
|
|
|
| |||||
| $ | 11,850,448 | $ | 11,536,249 | |||||
|
|
|
| |||||
Note: Other employee benefit mainly includes salaries, compensation and labor and health insurance expenses, etc.
Chunghwa distributes employees’ compensation at the rates from 1.7% to 4.3% and remuneration to directors not higher than 0.17%, respectively, of pre-tax income.
If there is a change in the proposed amounts after the annual consolidated financial statements are authorized for issue, the difference is recorded as a change in accounting estimate.
- 47 -
The compensation to the employees and remuneration to the directors of 2023 and 2022 approved by the Board of Directors on February 23, 2024 and February 24, 2023, respectively, were as follows. The compensation to the employees and remuneration to the directors of 2023 will be reported to the stockholders in their meeting planned to be held on May 31, 2024.
| Cash | ||||||||
| 2023 | 2022 | |||||||
Compensation distributed to the employees | $ | 1,522,481 | $ | 1,498,374 | ||||
Remuneration paid to the directors | 39,797 | 39,480 | ||||||
There was no difference between the initial accrued amounts recognized in 2023 and 2022 and the amounts approved by the Board of Directors in 2024 and 2023 of the aforementioned compensation to employees and the remuneration to directors.
Information of the appropriation of Chunghwa’s employees compensation and remuneration to directors and those approved by the Board of Directors is available on the Market Observation Post System website.
| 31. | INCOME TAX |
| a. | Income tax recognized in profit or loss |
The major components of income tax expense were as follows:
| Three Months Ended March 31 | ||||||||
| 2024 | 2023 | |||||||
Current tax | ||||||||
Current tax expenses recognized for the period | $ | 2,302,333 | $ | 2,337,295 | ||||
Income tax adjustments on prior years | 1,768 | (28,293 | ) | |||||
Others | 27 | 364 | ||||||
|
|
|
| |||||
| 2,304,128 | 2,309,366 | |||||||
|
|
|
| |||||
Deferred tax | ||||||||
Deferred tax expenses recognized for the period | 79,429 | 77,581 | ||||||
|
|
|
| |||||
Income tax recognized in profit or loss | $ | 2,383,557 | $ | 2,386,947 | ||||
|
|
|
| |||||
The applicable tax rate used by the entities subject to the Income Tax Act of the Republic of China is 20%, while the applicable tax rate used by subsidiaries in China is 25%. Tax rates used by other entities of the Company operating in other jurisdictions are based on the tax laws in those jurisdictions.
| b. | Income tax examinations |
Income tax returns of Chunghwa, SENAO, CHYP, CHSI, LED, SHE, CHIEF, Unigate, CHPT, SFD, CLPT, CHTSC, HHI, CHST, IISI have been examined by the tax authorities through 2021. Income tax returns of Youth, ISPOT, Aval, Wiin, SENYOUNG, CHI, and UTC have been examined by the tax authorities through 2022.
- 48 -
| c. | Pillar Two Model Rules |
The application of the Pillar Two rules does not have a material impact on the Company’s consolidated financial statements. The Company will continue to review the possible impact on the Company’s future financial performance.
| 32. | EARNINGS PER SHARE (“EPS”) |
Net income and weighted average number of common stocks used in the calculation of earnings per share were as follows:
Net Income
| Three Months Ended March 31 | ||||||||
| 2024 | 2023 | |||||||
Net income used to compute the basic earnings per share | ||||||||
Net income attributable to the parent | $ | 9,391,419 | $ | 9,643,255 | ||||
Assumed conversion of all dilutive potential common stocks | ||||||||
Employee stock options and employee compensation of subsidiaries | (546 | ) | (588 | ) | ||||
|
|
|
| |||||
Net income used to compute the diluted earnings per share | $ | 9,390,873 | $ | 9,642,667 | ||||
|
|
|
| |||||
Weighted Average Number of Common Stocks
(Thousand Shares)
| ||||||||
| Three Months Ended March 31 | ||||||||
| 2024 | 2023 | |||||||
Weighted average number of common stocks used to compute the basic earnings per share | 7,757,447 | 7,757,447 | ||||||
Assumed conversion of all dilutive potential common stocks | ||||||||
Employee compensation | 11,169 | 9,511 | ||||||
|
|
|
| |||||
Weighted average number of common stocks used to compute the diluted earnings per share | 7,768,616 | 7,766,958 | ||||||
|
|
|
| |||||
As Chunghwa may settle the employee compensation in shares or cash, Chunghwa shall presume that it will be settled in shares and take those shares into consideration when calculating the weighted average number of outstanding shares used in the calculation of diluted EPS if the shares have a dilutive effect. The dilutive effect of the shares needs to be considered until the approval of the number of shares to be distributed to employees as compensation in the following year.
| 33. | SHARE-BASED PAYMENT ARRANGEMENT |
| a. | CHIEF share-based compensation plan (“CHIEF Plan”) described as follows: |
The Board of Directors of CHIEF resolved to issue 200 stock options on November 13, 2020. Each option is eligible to subscribe for one thousand common stocks when exercisable and the exercise price is $206 per share. The options are granted to specific employees that meet the vesting conditions. The CHIEF Plan has an exercise price adjustment formula upon the changes in common stocks or distribution of cash dividends. The options of the CHIEF Plan are valid for five years and the graded vesting schedule will vest two years after the grant date.
- 49 -
The compensation costs for stock options for the three months ended March 31, 2024 and 2023 were $816 thousand and $1,395 thousand, respectively.
CHIEF modified the plan terms of stock options granted on November 13, 2020 in August 2023; therefore, the exercise price changed from $193.50 to $171.70 per share. The modification did not cause any incremental fair value granted.
Information about CHIEF’s outstanding stock options for the three months ended March 31, 2024 and 2023 was as follows:
| Three Months Ended March 31, 2024 | Three Months Ended March 31, 2023 | |||||||||||||||
| Granted on November 13, 2020 | Granted on November 13, 2020 | |||||||||||||||
Number of Options | Number of Options | Weighted Price (NT$) | Weighted Price (NT$) | |||||||||||||
Employee stock options | ||||||||||||||||
Options outstanding at beginning and end of the period | 93 | $ | 171.70 | 142.25 | $ | 193.50 | ||||||||||
|
|
|
| |||||||||||||
Options exercisable at end of the period | — | — | 0.50 | 193.50 | ||||||||||||
|
|
|
| |||||||||||||
Weighted average remaining contractual life (years) | 1.62 | 2.62 | ||||||||||||||
CHIEF used the fair value method to evaluate the options using the Black-Scholes model and binomial option pricing model and the related assumptions and the fair value of the options were as follows:
| Stock Options Granted on November 13, 2020 | ||||
Grant-date share price (NT$) | $ | 356.00 | ||
Exercise price (NT$) | $ | 206.00 | ||
Dividend yield | — | |||
Risk-free interest rate | 0.18 | % | ||
Expected life | 5 years | |||
Expected volatility | 34.61 | % | ||
Weighted average fair value of grants (NT$) | $ | 173,893 | ||
The expected volatility for the options granted in 2020 was based on CHIEF’s average annualized historical share price volatility from June 5, 2018, CHIEF’s listing date on Taipei Exchange, to the grant date.
- 50 -
| b. | CHTSC share-based compensation plan (“CHTSC Plan”) described as follows: |
The Board of Directors of CHTSC resolved to issue 4,500 and 3,500 stock options on December 20, 2019 and February 20, 2021, respectively. Each option is eligible to subscribe for one thousand common stocks when exercisable and the exercise prices are both $19.085 per share. The options are granted to specific employees that meet the vesting conditions. The CHTSC Plan has an exercise price adjustment formula upon the changes in common stocks. The options of the CHTSC Plan are valid for five years and the graded vesting schedule will vest one year after the grant date.
The compensation costs for stock options for the three months ended March 31, 2024 and 2023 were $194 thousand and $617 thousand, respectively.
Information about CHTSC’s outstanding stock options for the three months ended March 31, 2024 and 2023 were as follows:
| Three Months Ended March 31, 2024 | ||||||||||||||||
| Granted on February 20, 2021 | Granted on December 20, 2019 | |||||||||||||||
Number of Options | Weighted Average Exercise Price (NT$) | Number of Options | Weighted Average Exercise Price (NT$) | |||||||||||||
Employee stock options | ||||||||||||||||
Options outstanding at beginning of the period | 1,519 | $ | 19.085 | 40 | $ | 19.085 | ||||||||||
Options exercised | (689 | ) | 19.085 | (5 | ) | 19.085 | ||||||||||
Options forfeited | (11 | ) | — | — | — | |||||||||||
|
|
|
| |||||||||||||
Options outstanding at end of the period | 819 | 19.085 | 35 | 19.085 | ||||||||||||
|
|
|
| |||||||||||||
Options exercisable at end of the period | 10 | 19.085 | 35 | 19.085 | ||||||||||||
|
|
|
| |||||||||||||
Weighted average remaining contractual life (years) | 1.89 | 0.72 | ||||||||||||||
| Three Months Ended March 31, 2023 | ||||||||||||||||
| Granted on February 20, 2021 | Granted on December 20, 2019 | |||||||||||||||
Number of Options | Weighted Average Exercise Price (NT$) | Number of Options | Weighted Average Exercise Price (NT$) | |||||||||||||
Employee stock options | ||||||||||||||||
Options outstanding at beginning of the period | 2,343 | $ | 19.085 | 1,083 | $ | 19.085 | ||||||||||
Options exercised | (764 | ) | 19.085 | (31 | ) | 19.085 | ||||||||||
(Continued)
- 51 -
| Three Months Ended March 31, 2023 | ||||||||||||||||
| Granted on February 20, 2021 | Granted on December 20, 2019 | |||||||||||||||
Number of Options | Weighted Average Exercise Price (NT$) | Number of Options | Weighted Average Exercise Price (NT$) | |||||||||||||
Options forfeited | (14 | ) | $ | — | (21 | ) | $ | — | ||||||||
|
|
|
| |||||||||||||
Options outstanding at end of the period | 1,565 | 19.085 | 1,031 | 19.085 | ||||||||||||
|
|
|
| |||||||||||||
Options exercisable at end of the period | 14 | 19.085 | — | — | ||||||||||||
|
|
|
| |||||||||||||
Weighted average remaining contractual life (years) | 2.89 | 1.72 | ||||||||||||||
(Concluded)
CHTSC used the fair value method to evaluate the options using the Black-Scholes model and the related assumptions and the fair value of the options were as follows:
| Stock Options Granted on Ferbuary 20, 2021 | Stock Options Granted on December 20, 2019 | |||||||
Grant-date share price (NT$) | $ | 23.76 | $ | 20.17 | ||||
Exercise price (NT$) | $ | 19.085 | $ | 19.085 | ||||
Dividend yield | 15.18 | % | 12.49 | % | ||||
Risk-free interest rate | 0.25 | % | 0.54 | % | ||||
Expected life | 5 years | 5 years | ||||||
Expected volatility | 47.35 | % | 42.41 | % | ||||
Weighted average fair value of grants (NT$) | $ | 3,350 | $ | 2,470 | ||||
Expected volatility was based on the average annualized historical share price volatility of CHTSC’s comparable companies before the grant date.
| c. | CLPT share-based compensation plan (“CLPT Plan”) described as follows: |
The Board of Directors of CLPT resolved to issue 690, 600 and 755 stock options on February 26, 2021, May 31, 2022 and September 26, 2023, respectively. Each option is eligible to subscribe for one thousand common stocks when exercisable and the exercise prices are all $16.87 per share. The options are granted to specific employees that meet the vesting conditions. The CLPT Plan has an exercise price adjustment formula upon the changes in common stocks or distribution of cash dividends. The options of the CLPT Plan are valid for four years and the graded vesting schedule will vest two years after the grant date.
The compensation costs for stock options for the three months ended March 31, 2024 and 2023 were $1,363 thousand and $460 thousand, respectively.
- 52 -
CLPT modified the plan terms of stock options granted on September 26, 2023 in September 2023; therefore, the exercise price changed from $16.87 to $15.30 per share. The modification did not cause any incremental fair value granted.
CLPT modified the plan terms of stock options granted on May 31, 2022 in September 2023; therefore, the exercise price changed from $16.87 to $15.30 per share. The modification did not cause any incremental fair value granted.
CLPT modified the plan terms of stock options granted on February 26, 2021 in September 2023; therefore, the exercise price changed from $15.90 to $14.40 per share. The modification did not cause any incremental fair value granted.
Information about CLPT’s outstanding stock options for the three months ended March 31, 2024 and 2023 was as follows:
| Three Months Ended March 31, 2024 | ||||||||||||||||||||||||
| Granted on September 26, 2023 | Granted on May 31, 2022 | Granted on February 26, 2021 | ||||||||||||||||||||||
Number of Options | Weighted Average Exercise Price (NT$) | Number of Options | Weighted Average Exercise Price (NT$) | Number of Options | Weighted Average Exercise Price (NT$) | |||||||||||||||||||
Employee stock options | ||||||||||||||||||||||||
Options outstanding at beginning and end of the period | 755 | $ | 15.30 | 440 | $ | 15.30 | 440 | $ | 14.40 | |||||||||||||||
|
|
|
|
|
| |||||||||||||||||||
Options exercisable at end of the period | — | — | — | — | 440 | 14.40 | ||||||||||||||||||
|
|
|
|
|
| |||||||||||||||||||
Weighted average remaining contractual life (years) | 3.49 | 2.17 | 0.91 | |||||||||||||||||||||
| Three Months Ended March 31, 2023 | ||||||||||||||||
| Granted on May 31, 2022 | Granted on February 26, 2021 | |||||||||||||||
Number of Options | Weighted Average Exercise Price (NT$) | Number of Options | Weighted Average Exercise Price (NT$) | |||||||||||||
Employee stock options | ||||||||||||||||
Options outstanding at beginning and end of the period | 440 | $ | 16.87 | 510 | $ | 15.90 | ||||||||||
|
|
|
| |||||||||||||
Options exercisable at end of the period | — | — | 255 | 15.90 | ||||||||||||
|
|
|
| |||||||||||||
Weighted average remaining contractual life (years) | 3.17 | 1.91 | ||||||||||||||
- 53 -
CLPT used the fair value method to evaluate the options using the Black-Scholes model and the related assumptions and the fair value of the options were as follows:
| Stock Options Granted on September 26, 2023 | Stock Options 2022 | Stock Options Granted on February 26, 2021 | ||||||||||
Grant-date share price (NT$) | $ | 28.43 | $ | 18.66 | $ | 17.63 | ||||||
Exercise price (NT$) | $ | 16.87 | $ | 16.87 | $ | 16.87 | ||||||
Dividend yield | — | — | — | |||||||||
Risk-free interest rate | 1.10 | % | 0.98 | % | 0.31 | % | ||||||
Expected life | 4 years | 4 years | 4 years | |||||||||
Expected volatility | 31.99 | % | 35.76 | % | 35.22 | % | ||||||
Weighted average fair value of grants (NT$) | $ | 13,225 | $ | 5,665 | $ | 4,750 | ||||||
Expected volatility was based on the average annualized historical share price volatility of CLPT’s comparable companies before the grant date.
| 34 | CASH FLOW INFORMATION |
Except for those disclosed in other notes, the Company entered into the following non-cash investing and financing activities:
Investing activities | Three Months Ended March 31 | |||||||
| 2024 | 2023 | |||||||
Additions of property, plant and equipment | $ | 3,614,862 | $ | 4,135,819 | ||||
Changes in other payables | 1,427,687 | 1,282,319 | ||||||
|
|
|
| |||||
Payments for acquisition of property, plant and equipment | $ | 5,042,549 | $ | 5,418,138 | ||||
|
|
|
| |||||
Financing Activities
Balance on January 1, | Cash Flows From | Changes in Non-Cash Transactions | Cash Flows From Operation | Balance on March 31, | ||||||||||||||||||||
| 2024 | Activities | New Leases | Others | Interest Paid | 2024 | |||||||||||||||||||
Lease liabilities | $ | 10,975,181 | $ | (1,055,215 | ) | $ | 979,391 | $ | (22,355 | ) | $ | (29,449 | ) | $ | 10,847,553 | |||||||||
|
|
|
|
|
|
|
|
|
|
|
| |||||||||||||
Balance on January 1, | Cash Flows From | Changes in Non-Cash Transactions | Cash Flows From Operation | Balance on March 31, | ||||||||||||||||||||
| 2023 | Activities | New Leases | Others | Interest Paid | 2023 | |||||||||||||||||||
Lease liabilities | $ | 10,672,507 | $ | (1,090,899 | ) | $ | 1,221,805 | $ | (217,054 | ) | $ | (23,233 | ) | $ | 10,563,126 | |||||||||
|
|
|
|
|
|
|
|
|
|
|
| |||||||||||||
- 54 -
| 35. | CAPITAL MANAGEMENT |
The Company manages its capital to ensure that entities in the Company will be able to continue as going concerns while maximizing the return to stakeholders through the optimization of the debt and equity balance.
The capital structure of the Company consists of debt of the Company and the equity attributable to the parent.
Some consolidated entities are required to maintain minimum paid-in capital amount as prescribed by the applicable laws.
The management reviews the capital structure of the Company as needed. As part of this review, the management considers the cost of capital and the risks associated with each class of capital. According to the management’s suggestions, the Company maintains a balanced capital structure through paying cash dividends, increasing its share capital, purchasing outstanding shares, and issuing new debt or repaying debt.
| 36. | FINANCIAL INSTRUMENTS |
Fair Value Information
The fair value measurement guidance establishes a framework for measuring fair value and expands disclosure about fair value measurements. The standard describes a fair value hierarchy based on three levels of inputs that may be used to measure fair value. These levels are:
Level 1 fair value measurements: These measurements are those derived from quoted prices (unadjusted) in active markets for identical assets or liabilities.
Level 2 fair value measurements: These measurements are those derived from inputs other than quoted prices included within Level 1 that are observable for the asset or liability, either directly (i.e. as prices) or indirectly (i.e. derived from prices).
Level 3 fair value measurements: These measurements are those derived from valuation techniques that include inputs for the asset or liability that are not based on observable market data (unobservable inputs).
| a. | Financial instruments that are not measured at fair value but for which fair value is disclosed |
Except those listed in the table below, the Company considers that the carrying amounts of financial assets and liabilities not measured at fair value approximate their fair values or the fair values cannot be reliable estimated.
| March 31, 2024 | December 31, 2023 | March 31, 2023 | ||||||||||||||||||||||
| Carrying Value | Fair Value | Carrying Value | Fair Value | Carrying Value | Fair Value | |||||||||||||||||||
Financial liabilities | ||||||||||||||||||||||||
Financial liabilities measured at amortized cost | ||||||||||||||||||||||||
Bonds payable | $ | 30,484,156 | $ | 30,472,704 | $ | 30,482,766 | $ | 30,468,634 | $ | 30,478,739 | $ | 30,456,623 | ||||||||||||
|
|
|
|
|
|
|
|
|
|
|
| |||||||||||||
The fair value of bonds payable is measured using Level 2 inputs. The valuation of fair value is based on the quoted market prices provided by third party pricing services.
- 55 -
| b. | Financial instruments that are measured at fair value on a recurring basis |
March 31, 2024
| Level 1 | Level 2 | Level 3 | Total | |||||||||||||
Financial assets at FVTPL | ||||||||||||||||
Derivatives | $ | — | $ | 1,086 | $ | — | $ | 1,086 | ||||||||
Listed stocks | 421 | — | — | 421 | ||||||||||||
Non-listed stocks | — | — | 733,743 | 733,743 | ||||||||||||
Limited partnership | — | — | 316,646 | 316,646 | ||||||||||||
Film and drama investing agreements | — | — | 29,458 | 29,458 | ||||||||||||
|
|
|
|
|
|
|
| |||||||||
| $ | 421 | $ | 1,086 | $ | 1,079,847 | $ | 1,081,354 | |||||||||
|
|
|
|
|
|
|
| |||||||||
Hedging financial assets | $ | — | $ | 29 | $ | — | $ | 29 | ||||||||
|
|
|
|
|
|
|
| |||||||||
Financial assets at FVOCI | ||||||||||||||||
Listed stocks | $ | 217,220 | $ | — | $ | — | $ | 217,220 | ||||||||
Non-listed stocks | — | — | 4,851,591 | 4,851,591 | ||||||||||||
|
|
|
|
|
|
|
| |||||||||
| $ | 217,220 | $ | — | $ | 4,851,591 | $ | 5,068,811 | |||||||||
|
|
|
|
|
|
|
| |||||||||
Financial liabilities at FVTPL | ||||||||||||||||
Derivatives | $ | — | $ | 200 | $ | — | $ | 200 | ||||||||
|
|
|
|
|
|
|
| |||||||||
December 31, 2023
| Level 1 | Level 2 | Level 3 | Total | |||||||||||||
Financial assets at FVTPL | ||||||||||||||||
Derivatives | $ | — | $ | 483 | $ | — | $ | 483 | ||||||||
Listed stocks | 421 | — | — | 421 | ||||||||||||
Non-listed stocks | — | — | 792,364 | 792,364 | ||||||||||||
Limited partnership | — | — | 219,032 | 219,032 | ||||||||||||
Film and drama investing agreements | — | — | 24,305 | 24,305 | ||||||||||||
|
|
|
|
|
|
|
| |||||||||
| $ | 421 | $ | 483 | $ | 1,035,701 | $ | 1,036,605 | |||||||||
|
|
|
|
|
|
|
| |||||||||
Financial assets at FVOCI | ||||||||||||||||
Listed stocks | $ | 243,649 | $ | — | $ | — | $ | 243,649 | ||||||||
Non-listed stocks | — | — | 4,168,694 | 4,168,694 | ||||||||||||
|
|
|
|
|
|
|
| |||||||||
| $ | 243,649 | $ | — | $ | 4,168,694 | $ | 4,412,343 | |||||||||
|
|
|
|
|
|
|
| |||||||||
Hedging financial liabilities | $ | — | $ | 44 | $ | — | $ | 44 | ||||||||
|
|
|
|
|
|
|
| |||||||||
- 56 -
March 31, 2023
| Level 1 | Level 2 | Level 3 | Total | |||||||||||||
Financial assets at FVTPL | ||||||||||||||||
Derivatives | $ | — | $ | 3,851 | $ | — | $ | 3,851 | ||||||||
Listed stocks | 442 | — | — | 442 | ||||||||||||
Non-listed stocks | — | — | 822,273 | 822,273 | ||||||||||||
Limited partnership | — | — | 228,149 | 228,149 | ||||||||||||
Film and drama investing agreements | — | — | 23,355 | 23,355 | ||||||||||||
|
|
|
|
|
|
|
| |||||||||
| $ | 442 | $ | 3,851 | $ | 1,073,777 | $ | 1,078,070 | |||||||||
|
|
|
|
|
|
|
| |||||||||
Hedging financial assets | $ | — | $ | 1,196 | $ | — | $ | 1,196 | ||||||||
|
|
|
|
|
|
|
| |||||||||
Financial assets at FVOCI | ||||||||||||||||
Listed stocks | $ | 292,006 | $ | — | $ | — | $ | 292,006 | ||||||||
Non-listed stocks | — | — | 3,748,207 | 3,748,207 | ||||||||||||
|
|
|
|
|
|
|
| |||||||||
| $ | 292,006 | $ | — | $ | 3,748,207 | $ | 4,040,213 | |||||||||
|
|
|
|
|
|
|
| |||||||||
There were no transfers between Levels 1 and 2 for the three months ended March 31, 2024 and 2023.
The reconciliations for financial assets measured at Level 3 were listed below:
Three months ended March 31, 2024
| Financial Assets | Measured at Fair Value through Profit or Loss | Measured at Fair Value through Other Comprehensive Income | Total | |||||||||
Balance on January 1, 2024 | $ | 1,035,701 | $ | 4,168,694 | $ | 5,204,395 | ||||||
Acquisition | 106,222 | 30,000 | 136,222 | |||||||||
Recognized in profit or loss under “Other gains and losses” | (62,060 | ) | — | (62,060 | ) | |||||||
Recognized in other comprehensive income under “Unrealized gain or loss on financial assets at fair value through other comprehensive income” | — | 652,897 | 652,897 | |||||||||
Proceeds from profit distribution of the investees | (16 | ) | — | (16 | ) | |||||||
|
|
|
|
|
| |||||||
Balance on March 31, 2024 | $ | 1,079,847 | $ | 4,851,591 | $ | 5,931,438 | ||||||
|
|
|
|
|
| |||||||
Unrealized gain or loss for the three months ended March 31, 2024 | $ | (62,060 | ) | |||||||||
|
| |||||||||||
- 57 -
Three months ended March 31, 2023
| Financial Assets | Measured at Fair Value through Profit or Loss | Measured at Fair Value through Other Comprehensive Income | Total | |||||||||
Balance on January 1, 2023 | $ | 1,020,203 | $ | 3,218,579 | $ | 4,238,782 | ||||||
Acquisition | 100,000 | — | 100,000 | |||||||||
Recognized in profit or loss under “Other gains and losses” | (46,426 | ) | — | (46,426 | ) | |||||||
Recognized in other comprehensive income under “Unrealized gain or loss on financial assets at fair value through other comprehensive income” | — | 529,628 | 529,628 | |||||||||
|
|
|
|
|
| |||||||
Balance on March 31, 2023 | $ | 1,073,777 | $ | 3,748,207 | $ | 4,821,984 | ||||||
|
|
|
|
|
| |||||||
Unrealized gain or loss for the three months ended March 31, 2023 | $ | (46,426 | ) | |||||||||
|
| |||||||||||
The fair values of financial assets and financial liabilities of Level 2 are determined as follows:
| 1) | The fair values of financial assets and financial liabilities with standard terms and conditions and traded in active markets are determined with reference to quoted market prices. |
| 2) | For derivatives, fair values are estimated using discounted cash flow model. Future cash flows are estimated based on observable inputs including forward exchange rates at the end of the reporting periods and the forward and spot exchange rates stated in the contracts, discounted at a rate that reflects the credit risk of various counterparties. |
The fair values of non-listed domestic and foreign equity investments and film and drama investing agreements were Level 3 financial assets and determined using the market approach by reference the Price-to-Book ratios (P/B ratios) of peer companies that traded in active markets, using the income approach, in which the discounted cash flow is used to capture the present value of the expected future economic benefits to be derived from the investments, or using assets approach. The significant unobservable inputs used were listed in the below table. An increase in growth rate of long-term revenue, a decrease in discount for the lack of marketability or noncontrolling interests discount, or a decrease in the discount rate would result in increases in the fair values.
March 31, 2024 | December 31, 2023 | March 31, 2023 | ||||
Discount for lack of marketability | 4.91%~20.00% | 3.75%~20.00% | 14.09%~20.00% | |||
Noncontrolling interests discount | 17.01%~25.00% | 17.01%~25.00% | 17.29%~25.00% | |||
Growth rate of long-term revenue | 0.12% | 0.19% | 0.19% | |||
Discount rate | 7.08%~9.00% | 7.11%~8.20% | 7.26%~7.70% |
- 58 -
If the inputs to the valuation model were changed to reflect reasonably possible alternative assumptions while all the other variables were held constant, the fair values of Level 3 financial assets would increase (decrease) as below table.
March 31, 2024 | March 31, 2023 | |||||||
Discount for lack of marketability | ||||||||
5% increase | $ | (49,062 | ) | $ | (34,179 | ) | ||
|
|
|
| |||||
5% decrease | $ | 48,788 | $ | 34,179 | ||||
|
|
|
| |||||
Noncontrolling interests discount | ||||||||
5% increase | $ | (21,359 | ) | $ | (23,417 | ) | ||
|
|
|
| |||||
5% decrease | $ | 21,359 | $ | 23,417 | ||||
|
|
|
| |||||
Long-term revenue growth rates | ||||||||
0.1% increase | $ | 38,699 | $ | 32,416 | ||||
|
|
|
| |||||
0.1% decrease | $ | (37,978 | ) | $ | (31,805 | ) | ||
|
|
|
| |||||
Discount rate | ||||||||
1% increase | $ | (462,559 | ) | $ | (385,634 | ) | ||
|
|
|
| |||||
1% decrease | $ | 569,394 | $ | 475,487 | ||||
|
|
|
| |||||
Categories of Financial Instruments
March 31, 2024 | December 31, 2023 | March 31, 2023 | ||||||||||
Financial assets | ||||||||||||
Measured at FVTPL | ||||||||||||
Mandatorily measured at FVTPL | $ | 1,081,354 | $ | 1,036,605 | $ | 1,078,070 | ||||||
Hedging financial assets | 29 | — | 1,196 | |||||||||
Financial assets at amortized cost (Note a) | 86,768,023 | 82,090,521 | 82,588,471 | |||||||||
Financial assets at FVOCI | 5,068,811 | 4,412,343 | 4,040,213 | |||||||||
Financial liabilities | ||||||||||||
Measured at FVTPL | ||||||||||||
Mandatorily measured at FVTPL | 200 | — | — | |||||||||
Hedging financial liabilities | — | 44 | — | |||||||||
Measured at amortized cost (Note b) | 60,120,378 | 65,466,108 | 59,595,775 | |||||||||
| Note a: | The balances included cash and cash equivalents, trade notes and accounts receivable, receivables from related parties, other current monetary assets and refundable deposits (classified as other noncurrent assets), which were financial assets measured at amortized cost. | |
| Note b: | The balances included short-term loans, trade notes and accounts payable, payables to related parties, partial other payables, customers’ deposits, bonds payable and long-term loans (including the current portion) which were financial liabilities carried at amortized cost. | |
Financial Risk Management Objectives
The main financial instruments of the Company include equity investments, trade notes and accounts receivable, trade notes and accounts payable, lease liabilities, loans and bonds payable. The Company’s Finance Department provides services to its business units, co-ordinates access to domestic and international capital markets, monitors and manages the financial risks relating to the operations of the Company through internal risk reports which analyze exposures by degree and magnitude of risks.
- 59 -
These risks include market risk (including foreign currency risk, interest rate risk and other price risk), credit risk, and liquidity risk.
The Company seeks to minimize the effects of these risks by using derivative financial instruments to hedge risk exposures. The use of financial derivatives is governed by the Company’s policies approved by the Board of Directors. Those derivatives are used to hedge the risks of exchange rate fluctuation arising from operating or investment activities. Compliance with policies and risk exposure limits is reviewed by the Company’s Finance Department on a continuous basis. The Company does not enter into or trade financial instruments, including derivative financial instruments, for speculative purposes.
Chunghwa reports the significant risk exposures and related action plans timely and actively to the audit committee and if needed to the Board of Directors.
| a. | Market risk |
The Company is exposed to market risks of changes in foreign currency exchange rates and interest rates. The Company uses forward exchange contracts to hedge the exchange rate risk arising from assets and liabilities denominated in foreign currencies.
There were no changes to the Company’s exposure to market risks or the manner in which these risks are managed and measured.
| 1) | Foreign currency risk |
For details about the carrying amounts of the Company’s foreign currency denominated monetary assets and monetary liabilities at the balance sheet dates, please refer to Note 40 Significant Assets and Liabilities Denominated in Foreign Currencies.
The carrying amounts of the Company’s derivatives with exchange rate risk exposures at the balance sheet dates were as follows:
March 31, 2024 | December 31, 2023 | March 31, 2023 | ||||||||||
Assets | ||||||||||||
EUR | $ | 1,115 | $ | 483 | $ | 5,047 | ||||||
Liabilities | ||||||||||||
EUR | (200 | ) | (44 | ) | — | |||||||
Foreign currency sensitivity analysis
The Company is mainly exposed to the fluctuations of the currencies USD, EUR, SGD and RMB as listed in Note 40.
The following table details the Company’s sensitivity to a 5% increase and decrease in the functional currency against the relevant foreign currencies. 5% is the sensitivity rate used when reporting foreign currency risk internally to key management personnel and represents management’s assessment of the reasonably possible changes in foreign exchange rates. The sensitivity analysis includes only outstanding foreign currency denominated monetary items and forward exchange contracts. A positive number below indicates an increase in pre-tax profit or equity where the functional currency weakens 5% against the relevant currency.
- 60 -
| Three Months Ended March 31 | ||||||||
| 2024 | 2023 | |||||||
Profit or loss | ||||||||
Monetary assets and liabilities (a) | ||||||||
USD | $ | 31,943 | $ | 96,180 | ||||
EUR | (30,842 | ) | (47,658 | ) | ||||
SGD | (39,060 | ) | (66,966 | ) | ||||
RMB | 6,004 | (1,269 | ) | |||||
Derivatives (b) | ||||||||
EUR | (1,206 | ) | 11,768 | |||||
Equity | ||||||||
Derivatives (c) | ||||||||
EUR | 2,412 | 3,701 | ||||||
| a) | This is mainly attributable to the exposure to foreign currency denominated receivables and payables of the Company outstanding at the balance sheet dates. |
| b) | This is mainly attributable to forward exchange contracts. |
| c) | This is mainly attributable to the changes in the fair value of derivatives that are designated as cash flow hedges. |
For a 5% strengthening of the functional currency against the relevant currencies, there would be an equal and opposite effect on the pre-tax profit or equity for the amounts shown above.
| 2) | Interest rate risk |
The carrying amounts of the Company’s exposures to interest rates on financial assets and financial liabilities at the balance sheet dates were as follows:
March 31, 2024 | December 31, 2023 | March 31, 2023 | ||||||||||
Fair value interest rate risk | ||||||||||||
Financial assets | $ | 49,803,317 | $ | 43,156,022 | $ | 46,432,749 | ||||||
Financial liabilities | 41,581,709 | 41,457,947 | 41,041,865 | |||||||||
Cash flow interest rate risk | ||||||||||||
Financial assets | 9,740,595 | 9,136,207 | 9,481,370 | |||||||||
Financial liabilities | 1,815,000 | 2,185,000 | 1,941,800 | |||||||||
Interest rate sensitivity analysis
The sensitivity analyses below have been determined based on the exposure to interest rates for non-derivative instruments at the end of the reporting period. A 25 basis point increase or decrease is used when reporting interest rate risk internally to key management personnel and represents management’s assessment of the reasonably possible change in interest rates.
If interest rates had been 25 basis points higher/lower and all other variables were held constant, the Company’s pre-tax income would increase/decrease by $19,814 thousand and $18,849 thousand for the three months ended March 31, 2024 and 2023, respectively. This is mainly attributable to the Company’s exposure to floating interest rates on its financial assets, short-term and long-term loans.
- 61 -
| 3) | Other price risk |
The Company is exposed to equity price risks arising from holding other company’s equity. Equity investments are held for strategic rather than trading purposes. The management managed the risk through holding various risk portfolios. Further, the Company assigned finance and investment departments to monitor the price risk.
Equity price sensitivity analysis
The sensitivity analyses below have been determined based on the exposure to equity price risks at the end of the reporting period.
If equity prices had been 5% higher/lower, pre-tax profit and pre-tax other comprehensive income would have increased/decreased by $52,541 thousand and $253,441 thousand, respectively, as a result of the changes in fair value of financial assets at FVTPL and financial assets at FVOCI for the three months ended March 31, 2024. If equity prices had been 5% higher/lower, pre-tax profit and pre-tax other comprehensive income would have increased/decreased by $52,543 thousand and $202,011 thousand, respectively, as a result of the changes in fair value of financial assets at FVTPL and financial assets at FVOCI for the three months ended March 31, 2023.
| b. | Credit risk |
Credit risk refers to the risk that a counterparty would default on its contractual obligations resulting in financial loss to the Company. The maximum credit exposure of the aforementioned financial instruments is equal to their carrying amounts recognized in the consolidated balance sheet as of the balance sheet date.
The Company has large trade receivables outstanding with its customers. A substantial majority of the Company’s outstanding trade receivables are not covered by collateral or credit insurance. The Company has implemented ongoing measures including enhancing credit assessments and strengthening overall risk management to reduce its credit risk. While the Company has procedures to monitor and limit exposure to credit risk on trade receivables, there can be no assurance such procedures will effectively limit its credit risk and avoid losses. This risk is heightened during periods when economic conditions worsen.
As the Company serves a large number of unrelated consumers, the concentration of credit risk was limited.
| c. | Liquidity risk |
The Company manages and maintains sufficient cash and cash equivalent position to support the operations and reduce the impact on fluctuation of cash flow.
| 1) | Liquidity and interest risk tables |
The following tables detailed the Company’s remaining contractual maturity for its non-derivative financial liabilities with agreed repayment periods. The tables had been drawn up based on the undiscounted cash flows of financial liabilities based on the earliest date on which the Company is required to pay.
- 62 -
March 31, 2024
Weighted Average Effective Interest Rate (%) | Less than 1 Month | 1-3 Months | 3 Months to 1 Year | 1-5 Years | More than 5 Years | Total | ||||||||||||||||||||||
Non-derivative financial liabilities | ||||||||||||||||||||||||||||
Non-interest bearing | — | $ | 30,139,431 | $ | — | $ | 2,688,772 | $ | 5,105,091 | $ | — | $ | 37,933,294 | |||||||||||||||
Floating interest rate instruments | 1.95 | 3,646 | 220,445 | 1,604,989 | — | — | 1,829,080 | |||||||||||||||||||||
Fixed interest rate instruments | 0.54 | 163,877 | 56,523 | 293,616 | 26,120,293 | 4,737,287 | 31,371,596 | |||||||||||||||||||||
|
|
|
|
|
|
|
|
|
|
|
| |||||||||||||||||
| $ | 30,306,954 | $ | 276,968 | $ | 4,587,377 | $ | 31,225,384 | $ | 4,737,287 | $ | 71,133,970 | |||||||||||||||||
|
|
|
|
|
|
|
|
|
|
|
| |||||||||||||||||
Information about the maturity analysis for lease liabilities was as follows:
Less than 1 Year | 1-3 Years | 3-5 Years | More than 5 Years | Total | ||||||||||||||||
Lease liabilities | $ | 3,462,694 | $ | 4,871,329 | $ | 2,320,025 | $ | 413,018 | $ | 11,067,066 | ||||||||||
|
|
|
|
|
|
|
|
|
| |||||||||||
December 31, 2023
Weighted Average Effective Interest Rate (%) | Less than 1 Month | 1-3 Months | 3 Months to 1 Year | 1-5 Years | More than 5 Years | Total | ||||||||||||||||||||||
Non-derivative financial liabilities | ||||||||||||||||||||||||||||
Non-interest bearing | — | $ | 37,930,363 | $ | — | $ | 2,107,392 | $ | 5,309,097 | $ | — | $ | 45,346,852 | |||||||||||||||
Floating interest rate instruments | 1.99 | — | 15,000 | 2,170,000 | — | — | 2,185,000 | |||||||||||||||||||||
Fixed interest rate instruments | 0.53 | — | — | — | 25,800,000 | 4,700,000 | 30,500,000 | |||||||||||||||||||||
|
|
|
|
|
|
|
|
|
|
|
| |||||||||||||||||
| $ | 37,930,363 | $ | 15,000 | $ | 4,277,392 | $ | 31,109,097 | $ | 4,700,000 | $ | 78,031,852 | |||||||||||||||||
|
|
|
|
|
|
|
|
|
|
|
| |||||||||||||||||
Information about the maturity analysis for lease liabilities was as follows:
Less than 1 Year | 1-3 Years | 3-5 Years | More than 5 Years | Total | ||||||||||||||||
Lease liabilities | $ | 3,518,419 | $ | 4,819,030 | $ | 2,356,754 | $ | 518,335 | $ | 11,212,538 | ||||||||||
|
|
|
|
|
|
|
|
|
| |||||||||||
March 31, 2023
Weighted Average Effective Interest Rate (%) | Less than 1 Month | 1-3 Months | 3 Months to 1 Year | 1-5 Years | More than 5 Years | Total | ||||||||||||||||||||||
Non-derivative financial liabilities | ||||||||||||||||||||||||||||
Non-interest bearing | — | $ | 29,564,245 | $ | — | $ | 2,650,942 | $ | 5,012,177 | $ | — | $ | 37,227,364 | |||||||||||||||
Floating interest rate instruments | 1.87 | — | 231,800 | 110,000 | 1,600,000 | — | 1,941,800 | |||||||||||||||||||||
Fixed interest rate instruments | 0.53 | — | — | — | 21,700,000 | 8,800,000 | 30,500,000 | |||||||||||||||||||||
|
|
|
|
|
|
|
|
|
|
|
| |||||||||||||||||
| $ | 29,564,245 | $ | 231,800 | $ | 2,760,942 | $ | 28,312,177 | $ | 8,800,000 | $ | 69,669,164 | |||||||||||||||||
|
|
|
|
|
|
|
|
|
|
|
| |||||||||||||||||
Information about the maturity analysis for lease liabilities was as follows:
Less than 1 Year | 1-3 Years | 3-5 Years | More than 5 Years | Total | ||||||||||||||||
Lease liabilities | $ | 3,371,554 | $ | 4,383,718 | $ | 2,207,789 | $ | 793,490 | $ | 10,756,551 | ||||||||||
|
|
|
|
|
|
|
|
|
| |||||||||||
- 63 -
The following table detailed the Company’s liquidity analysis for its derivative financial instruments. The table had been drawn up based on the undiscounted gross inflows and outflows on those derivatives that require gross settlement.
Less than 1 Month | 1-3 Months | 3 Months to 1 Year | 1-5 Years | Total | ||||||||||||||||
March 31, 2024 | ||||||||||||||||||||
Gross settled | ||||||||||||||||||||
Forward exchange contracts | ||||||||||||||||||||
Inflow | $ | 130,824 | $ | 154,125 | $ | — | $ | — | $ | 284,949 | ||||||||||
Outflow | 131,024 | 153,010 | — | — | 284,034 | |||||||||||||||
|
|
|
|
|
|
|
|
|
| |||||||||||
| $ | (200 | ) | $ | 1,115 | $ | — | $ | — | $ | 915 | ||||||||||
|
|
|
|
|
|
|
|
|
| |||||||||||
December 31, 2023 | ||||||||||||||||||||
Gross settled | ||||||||||||||||||||
Forward exchange contracts | ||||||||||||||||||||
Inflow | $ | — | $ | 169,092 | $ | — | $ | — | $ | 169,092 | ||||||||||
Outflow | — | 168,653 | — | — | 168,653 | |||||||||||||||
|
|
|
|
|
|
|
|
|
| |||||||||||
| $ | — | $ | 439 | $ | — | $ | — | $ | 439 | |||||||||||
|
|
|
|
|
|
|
|
|
| |||||||||||
March 31, 2023 | ||||||||||||||||||||
Gross settled | ||||||||||||||||||||
Forward exchange contracts | ||||||||||||||||||||
Inflow | $ | — | $ | 307,966 | $ | — | $ | — | $ | 307,966 | ||||||||||
Outflow | — | 302,919 | — | — | 302,919 | |||||||||||||||
|
|
|
|
|
|
|
|
|
| |||||||||||
| $ | — | $ | 5,047 | $ | — | $ | — | $ | 5,047 | |||||||||||
|
|
|
|
|
|
|
|
|
| |||||||||||
| 2) | Financing facilities |
March 31, 2024 | December 31, 2023 | March 31, 2023 | ||||||||||
Unsecured bank loan facilities | ||||||||||||
Amount used | $ | 465,000 | $ | 585,000 | $ | 341,800 | ||||||
Amount unused | 57,588,866 | 56,191,331 | 55,814,293 | |||||||||
|
|
|
|
|
| |||||||
| $ | 58,053,866 | $ | 56,776,331 | $ | 56,156,093 | |||||||
|
|
|
|
|
| |||||||
Secured bank loan facilities | ||||||||||||
Amount used | $ | 1,600,000 | $ | 1,600,000 | $ | 1,600,000 | ||||||
Amount unused | 20,000 | 20,000 | — | |||||||||
|
|
|
|
|
| |||||||
| $ | 1,620,000 | $ | 1,620,000 | $ | 1,600,000 | |||||||
|
|
|
|
|
| |||||||
- 64 -
| 37. | RELATED PARTIES TRANSACTIONS |
The ROC Government has significant equity interest in Chunghwa. Chunghwa provides fixed-line services, mobile services, internet and data and other services to the various departments and institutions of the ROC Government in the normal course of business and at arm’s-length prices. Except for those disclosed in other notes or this note, the transactions with the ROC government bodies have not been disclosed because the transactions are not individually or collectively significant. However, the related revenues and operating costs have been appropriately recorded.
| a. | The Company engages in business transactions with the following related parties: |
Company | Relationship | |
Taiwan International Standard Electronics Co., Ltd. | Associate | |
So-net Entertainment Taiwan Limited | Associate | |
KKBOX Taiwan Co., Ltd. | Associate | |
KingwayTek Technology Co., Ltd. | Associate | |
Taiwan International Ports Logistics Corporation | Associate | |
Senao Networks, Inc. | Associate | |
EnGenius Networks Inc. | Subsidiary of the Company’s associate, Senao Networks, Inc. | |
EnRack Technology Inc. | Subsidiary of the Company’s associate, Senao Networks, Inc. | |
Emplus Technologies, Inc. | Subsidiary of the Company’s associate, Senao Networks, Inc. | |
ST-2 Satellite Ventures Pte., Ltd. | Associate | |
CHT Infinity Singapore Pte. Ltd. | Associate | |
Viettel-CHT Co., Ltd. | Associate | |
PT. CHT Infinity Indonesia | Subsidiary of the Company’s associate, CHT Infinity Singapore Pte. Ltd. | |
Click Force Co., Ltd. | Associate | |
Chunghwa PChome Fund I Co., Ltd. | Associate | |
Cornerstone Ventures Co., Ltd. | Associate | |
Next Commercial Bank Co., Ltd. | Associate | |
WiAdvance Technology Corporation | Associate | |
AgriTalk Technology Inc. | Associate | |
Imedtac Co., Ltd. | Associate | |
Baohwa Trust Co., Ltd. | Associate | |
Chunghwa SEA Holdings | Joint venture | |
Other related parties | ||
Chunghwa Telecom Foundation | A nonprofit organization of which the funds donated by Chunghwa exceeds one third of its total funds | |
Senao Technical and Cultural Foundation | A nonprofit organization of which the funds donated by SENAO exceeds one third of its total funds | |
Sochamp Technology Co., Ltd. | Investor of significant influence over CHST | |
Tsann Kuen Enterprise Co., Ltd. | Substantial related party of SENAO | |
E-Life Mall Co., Ltd. | Substantial related party of SENAO | |
Engenius Technologies Co., Ltd. | Substantial related party of SENAO | |
Cheng Keng Investment Co., Ltd. | Substantial related party of SENAO | |
Cheng Feng Investment Co., Ltd. | Substantial related party of SENAO | |
All Oriented Investment Co., Ltd. | Substantial related party of SENAO |
(Continued)
- 65 -
Company | Relationship | |
Hwa Shun Investment Co., Ltd. | Substantial related party of SENAO | |
Yu Yu Investment Co., Ltd. | Substantial related party of SENAO | |
Kangsin Co., Ltd. | Substantial related party of SENAO | |
United Daily News Co., Ltd. | Investor of significant influence over SFD | |
Shenzhen Century Communication Co., Ltd. | Investor of significant influence over SCT | |
Advantech Co., Ltd. | Investor of significant influence over IISI | |
Z-Com, Inc. | Investor of significant influence over CHST |
(Concluded)
| b. | Balances and transactions between Chunghwa and its subsidiaries, which are related parties of Chunghwa, have been eliminated on consolidation and are not disclosed in this note. Terms of the foregoing transactions with related parties were not significantly different from transactions with non-related parties. When no similar transactions with non-related parties can be referenced, terms were determined in accordance with mutual agreements. Details of transactions between the Company and other related parties are disclosed below: |
| 1) | Operating transactions |
| Revenues | ||||||||
| Three Months Ended March 31 | ||||||||
| 2024 | 2023 | |||||||
Associates | $ | 79,579 | $ | 77,604 | ||||
Others | 5,163 | 19,329 | ||||||
|
|
|
| |||||
| $ | 84,742 | $ | 96,933 | |||||
|
|
|
| |||||
| Operating Costs and Expenses | ||||||||
| Three Months Ended March 31 | ||||||||
| 2024 | 2023 | |||||||
Associates | $ | 217,009 | $ | 282,831 | ||||
Others | 70,428 | 56,379 | ||||||
|
|
|
| |||||
| $ | 287,437 | $ | 339,210 | |||||
|
|
|
| |||||
| 2) | Non-operating transactions |
| Non-operating Income and Expenses | ||||||||
| Three Months Ended March 31 | ||||||||
| 2024 | 2023 | |||||||
Associates | $ | 9,513 | $ | 9,426 | ||||
Others | 100 | 192 | ||||||
|
|
|
| |||||
| $ | 9,613 | $ | 9,618 | |||||
|
|
|
| |||||
- 66 -
| 3) | Receivables |
March 31, 2024 | December 31, 2023 | March 31, 2023 | ||||||||||
Associates | $ | 75,164 | $ | 75,994 | $ | 41,868 | ||||||
Others | 1,482 | 2,095 | 6,190 | |||||||||
|
|
|
|
|
| |||||||
| $ | 76,646 | $ | 78,089 | $ | 48,058 | |||||||
|
|
|
|
|
| |||||||
| 4) | Payables |
March 31, 2024 | December 31, 2023 | March 31, 2023 | ||||||||||
Associates | $ | 181,223 | $ | 380,663 | $ | 273,606 | ||||||
Others | 4,728 | 4,426 | 3,973 | |||||||||
|
|
|
|
|
| |||||||
| $ | 185,951 | $ | 385,089 | $ | 277,579 | |||||||
|
|
|
|
|
| |||||||
| 5) | Customers’ deposits |
March 31, 2024 | December 31, 2023 | March 31, 2023 | ||||||||||
Associates | $ | 19,399 | $ | 19,432 | $ | 30,215 | ||||||
Others | 284 | 284 | 284 | |||||||||
|
|
|
|
|
| |||||||
| $ | 19,683 | $ | 19,716 | $ | 30,499 | |||||||
|
|
|
|
|
| |||||||
| 6) | Acquisition of property, plant and equipment |
| Three Months Ended March 31 | ||||||||
| 2024 | 2023 | |||||||
Associates | $ | — | $ | 53,733 | ||||
|
|
|
| |||||
| 7) | Acquisition of intangible assets |
| Three Months Ended March 31 | ||||||||
| 2024 | 2023 | |||||||
Associates | $ | 429 | $ | — | ||||
|
|
|
| |||||
| 8) | Lease-in agreements |
Chunghwa entered into a contract with ST-2 Satellite Ventures Pte., Ltd. on March 12, 2010 to lease capacity on the ST-2 satellite. This lease term is for 15 years which should start from the official operation of ST-2 satellite and the total contract value is approximately $6,000,000 thousand (SGD 260,723 thousand), including a prepayment of $3,067,711 thousand at the inception of the lease, and the rest of amount should be paid annually when ST-2 satellite starts its official operation. ST-2 satellite was launched in May 2011 and began its official operation in August 2011. As ST-2 satellite is in good operating condition, the useful life is extended for another 3 years and 3 months after evaluation in 2021. The Board of Directors of Chunghwa approved to extend the lease period accordingly with the original contract terms in December 2021; therefore, Chunghwa acquired right-of-use asset of $1,124,780 thousand from the aforementioned lease extension.
- 67 -
The lease liabilities of ST-2 Satellite Ventures Pte., Ltd. as of balance sheet dates were as follows:
March 31, 2024 | December 31, 2023 | March 31, 2023 | ||||||||||
Lease liabilities - current | $ | 200,920 | $ | 197,278 | $ | 194,059 | ||||||
Lease liabilities - noncurrent | 1,583,785 | 1,602,633 | 1,716,537 | |||||||||
|
|
|
|
|
| |||||||
| $ | 1,784,705 | $ | 1,799,911 | $ | 1,910,596 | |||||||
|
|
|
|
|
| |||||||
The interest expense recognized for the aforementioned lease liabilities for the three months ended March 31, 2024 and 2023 were $1,898 thousand and $2,047 thousand, respectively.
| 9) | Others |
The bank deposits and other financial assets of NCB as of balance sheet dates were as follows:
March 31, 2024 | December 31, 2023 | March 31, 2023 | ||||||||||
Bank deposits and other financial assets | $ | 1,266,920 | $ | 1,132,008 | $ | — | ||||||
|
|
|
|
|
| |||||||
The interest income recognized for the aforementioned bank deposits and other financial assets was $3,856 thousand for the three months ended March 31, 2024.
| c. | Compensation of key management personnel |
The compensation of directors and key management personnel was as follows:
| Three Months Ended March 31 | ||||||||
| 2024 | 2023 | |||||||
Short-term employee benefits | $ | 101,443 | $ | 94,024 | ||||
Post-employment benefits | 2,298 | 2,213 | ||||||
Share-based payment | 324 | 235 | ||||||
|
|
|
| |||||
| $104,065 | $96,472 | |||||||
|
|
|
| |||||
The compensation of directors and key management personnel was mainly determined by the compensation committee having regard to the performances and market trends.
- 68 -
| 38. | PLEDGED ASSETS |
The following assets are pledged as collaterals for bank loans, customs duties of the imported materials, warranties of contract performance or the trust account LED entrusts to Land Bank of Taiwan for fund control and property rights management.
March 31, 2024 | December 31, 2023 | March 31, 2023 | ||||||||||
Property, plant and equipment | $ | 2,461,456 | $ | 2,468,835 | $ | 2,490,970 | ||||||
Restricted assets (included in other assets - others) | 665,077 | 546,022 | 101,079 | |||||||||
|
|
|
|
|
| |||||||
| $ | 3,126,533 | $ | 3,014,857 | $ | 2,592,049 | |||||||
|
|
|
|
|
| |||||||
| 39. | SIGNIFICANT CONTINGENT LIABILITIES AND UNRECOGNIZED COMMITMENTS |
Except for those disclosed in other notes, the Company’s significant commitments and contingent liabilities as of March 31, 2024 were as follows:
| a. | Acquisitions of land and buildings of $42,448 thousand. |
| b. | Acquisitions of telecommunications-related inventory and equipment of $17,877,931 thousand. |
| c. | Unused letters of credit amounting to $10,000 thousand. |
| d. | A commitment to contribute $2,000,000 thousand to a Piping Fund administered by the Taipei City Government, of which $1,000,000 thousand was contributed by Chunghwa on August 15, 1996 (classified as other financial assets - noncurrent). If the fund is not sufficient, Chunghwa will contribute the remaining $1,000,000 thousand upon notification from the Taipei City Government. |
| e. | Chunghwa committed that when its ownership interest in NCB is greater than 25% and NCB encounters financial difficulty or the capital adequacy ratio of NCB cannot meet the related regulation requirements, Chunghwa will provide financial support to assist NCB in maintaining a healthy financial condition. |
| f. | Chunghwa signed a contract, the ST-2 Satellite Succession Plan, with Singapore Telecommunications Limited, for a total transaction price of EUR 177,000 thousand and SGD 51,000 thousand. As of March 31, 2024, Chunghwa had paid the amount of EUR 60,180 thousand (classified as prepayments - noncurrent). |
| g. | LED has signed the land presale contracts amounting to $5,458,779 thousand and has received $576,826 thousand in accordance with the contracts (classified as contract liabilities - current). |
| h. | Chunghwa’s Board of Directors approved an investment in Cultural Content Industry Fund in February 2024. The investment amount is capped at $1,200,000 thousand. |
| i. | Chunghwa’s Board of Directors approved an investment in Taiwania Hive Technology Fund L.P. at the amount of USD $30,000 thousand in February 2024. |
- 69 -
| 40. | SIGNIFICANT ASSETS AND LIABILITIES DENOMINATED IN FOREIGN CURRENCIES |
The following information summarizes the disclosure of foreign currencies other than the functional currency of Chunghwa and its subsidiaries. The following exchange rates are the exchange rates used to translate to the presentation currency of the consolidated financial statements, which is the NTD:
| March 31, 2024 | ||||||||||||
| Foreign Currencies (Thousands) | Exchange Rate | New Taiwan Dollars (Thousands) | ||||||||||
Assets denominated in foreign currencies | ||||||||||||
Monetary items | ||||||||||||
USD | $ | 56,619 | 32.00 | $ | 1,811,804 | |||||||
EUR | 1,499 | 34.46 | 51,665 | |||||||||
SGD | 45,094 | 23.72 | 1,069,620 | |||||||||
RMB | 36,927 | 4.408 | 162,773 | |||||||||
Non-monetary items | ||||||||||||
Investments accounted for using equity method | ||||||||||||
SGD | 13,575 | 23.72 | 322,008 | |||||||||
VND | 446,926,254 | 0.0013 | 567,596 | |||||||||
Liabilities denominated in foreign currencies | ||||||||||||
Monetary items | ||||||||||||
USD | 36,655 | 32.00 | 1,172,953 | |||||||||
EUR | 19,399 | 34.46 | 668,501 | |||||||||
SGD | 78,027 | 23.72 | 1,850,812 | |||||||||
RMB | 9,686 | 4.408 | 42,697 | |||||||||
| December 31, 2023 | ||||||||||||
| Foreign Currencies (Thousands) | Exchange Rate | New Taiwan Dollars (Thousands) | ||||||||||
Assets denominated in foreign currencies | ||||||||||||
Monetary items | ||||||||||||
USD | $ | 66,564 | 30.71 | $ | 2,043,834 | |||||||
EUR | 1,999 | 33.98 | 67,919 | |||||||||
SGD | 39,515 | 23.29 | 920,308 | |||||||||
RMB | 35,777 | 4.327 | 154,806 | |||||||||
Non-monetary items | ||||||||||||
Investments accounted for using equity method | ||||||||||||
SGD | 12,255 | 23.29 | 285,430 | |||||||||
VND | 435,484,544 | 0.0012 | 542,178 | |||||||||
Liabilities denominated in foreign currencies | ||||||||||||
Monetary items | ||||||||||||
USD | 33,534 | 30.71 | 1,029,674 | |||||||||
EUR | 19,875 | 33.98 | 675,342 | |||||||||
SGD | 80,039 | 23.29 | 1,864,104 | |||||||||
RMB | 8,880 | 4.327 | 38,424 | |||||||||
- 70 -
| March 31, 2023 | ||||||||||||
| Foreign Currencies (Thousands) | Exchange Rate | New Taiwan Dollars (Thousands) | ||||||||||
Assets denominated in foreign currencies | ||||||||||||
Monetary items | ||||||||||||
USD | $ | 91,587 | 30.45 | $ | 2,788,829 | |||||||
EUR | 2,606 | 33.15 | 86,375 | |||||||||
SGD | 27,500 | 22.91 | 630,021 | |||||||||
RMB | 4,472 | 4.431 | 19,818 | |||||||||
Non-monetary items | ||||||||||||
Investments accounted for using equity method | ||||||||||||
SGD | 11,953 | 22.91 | 273,844 | |||||||||
VND | 460,454,796 | 0.0013 | 587,080 | |||||||||
Liabilities denominated in foreign currencies | ||||||||||||
Monetary items | ||||||||||||
USD | 28,415 | 30.45 | 865,225 | |||||||||
EUR | 31,358 | 33.15 | 1,039,525 | |||||||||
SGD | 85,960 | 22.91 | 1,969,338 | |||||||||
RMB | 10,201 | 4.431 | 45,202 | |||||||||
The unrealized foreign currency exchange gains and losses were gain of $5,185 thousand and loss of $3,814 thousand for the three months ended March 31, 2024 and 2023, respectively. Due to the various foreign currency transactions and the functional currency of each individual entity of the Company, foreign exchange gains and losses cannot be disclosed by the respective significant foreign currency.
| 41. | ADDITIONAL DISCLOSURES |
Following are the additional disclosures required by the FSC for the Company:
| a. | Financing provided: None. |
| b. | Endorsement/guarantee provided: Please see Table 1. |
| c. | Marketable securities held (excluding investments in subsidiaries, associates and joint ventures): Please see Table 2. |
| d. | Marketable securities acquired or disposed of at costs or prices at least $300 million or 20% of the paid-in capital: None. |
| e. | Acquisition of individual real estate at costs of at least $300 million or 20% of the paid-in capital: None. |
| f. | Disposal of individual real estate at prices of at least $300 million or 20% of the paid-in capital: None. |
| g. | Total purchases from or sales to related parties amounting to at least $100 million or 20% of the paid-in capital: Please see Table 3. |
- 71 -
| h. | Receivables from related parties amounting to $100 million or 20% of the paid-in capital: Please see Table 4. |
| i. | Names, locations, and other information of investees on which the Company exercises significant influence (excluding investments in Mainland China): Please see Table 5. |
| j. | Derivative instruments transactions: Please see Notes 7, 20 and 36. |
| k. | Investments in Mainland China: Please see Table 6. |
| l. | Intercompany relationships and significant intercompany transactions: Please see Table 7. |
| m. | Information of main stakeholders: Please see Table 8. |
| 42. | SEGMENT INFORMATION |
The Company’s reportable segments are “Consumer Business”, “Enterprise Business”, “International Business” and “Others”, which are managed separately because each segment represents a strategic business unit that serves different customers. Segment information is provided to the chief operating decision maker who allocates resources and assesses segment performance. The Company’s measure of segment performance is mainly based on revenues and income before income tax.
Some operating segments have been aggregated into a single operating segment taking into account the following factors: (a) the type or class of customer for the telecommunications products and services are similar; (b) the nature of the telecommunications products and services are similar; and (c) the methods used to provide the services to the customers are similar.
The accounting policies of the operating segments are the same as those described in Note 3.
Segment Revenues and Operating Results
Analysis by reportable segment of revenues and operating results of continuing operations are as follows:
| Consumer Business | Enterprise Business | International Business | Others | Total | ||||||||||||||||
Three months ended March 31, 2024 | ||||||||||||||||||||
Revenues | ||||||||||||||||||||
From external customers | $ | 34,624,542 | $ | 16,952,309 | $ | 2,413,413 | $ | 953,207 | $ | 54,943,471 | ||||||||||
Intersegment revenues | 587,834 | 176,059 | 239,926 | 90,976 | 1,094,795 | |||||||||||||||
|
|
|
|
|
|
|
|
|
| |||||||||||
Segment revenues | $ | 35,212,376 | $ | 17,128,368 | $ | 2,653,339 | $ | 1,044,183 | 56,038,266 | |||||||||||
|
|
|
|
|
|
|
| |||||||||||||
Intersegment elimination | (1,094,795 | ) | ||||||||||||||||||
|
| |||||||||||||||||||
Consolidated revenues | $ | 54,943,471 | ||||||||||||||||||
|
| |||||||||||||||||||
Segment income before income tax | $ | 7,743,505 | $ | 3,416,895 | $ | 622,617 | $ | 204,723 | $ | 11,987,740 | ||||||||||
|
|
|
|
|
|
|
|
|
| |||||||||||
Three months ended March 31, 2023 | ||||||||||||||||||||
Revenues | ||||||||||||||||||||
From external customers | $ | 34,054,760 | $ | 17,104,731 | $ | 2,129,931 | $ | 921,483 | $ | 54,210,905 | ||||||||||
Intersegment revenues | 646,099 | 207,185 | 221,559 | 66,352 | 1,141,195 | |||||||||||||||
|
|
|
|
|
|
|
|
|
| |||||||||||
Segment revenues | $ | 34,700,859 | $ | 17,311,916 | $ | 2,351,490 | $ | 987,835 | 55,352,100 | |||||||||||
|
|
|
|
|
|
|
| |||||||||||||
Intersegment elimination | (1,141,195 | ) | ||||||||||||||||||
|
| |||||||||||||||||||
Consolidated revenues | $ | 54,210,905 | ||||||||||||||||||
|
| |||||||||||||||||||
Segment income before income tax | $ | 7,470,862 | $ | 3,954,358 | $ | 512,773 | $ | 322,000 | $ | 12,259,993 | ||||||||||
|
|
|
|
|
|
|
|
|
| |||||||||||
- 72 -
Main Products and Service Revenues
| Three Months Ended March 31 | ||||||||
| 2024 | 2023 | |||||||
Consumer Business | ||||||||
Mobile services | $ | 14,092,595 | $ | 13,522,073 | ||||
Fixed-line services | 10,691,130 | 10,597,721 | ||||||
Sales | 9,244,106 | 9,381,786 | ||||||
Others | 596,711 | 553,180 | ||||||
|
|
|
| |||||
| 34,624,542 | 34,054,760 | |||||||
|
|
|
| |||||
Enterprise Business | ||||||||
Fixed-line services | 8,334,485 | 8,389,231 | ||||||
ICT business | 5,311,234 | 5,139,486 | ||||||
Mobile services | 2,252,916 | 2,172,944 | ||||||
Others | 1,053,674 | 1,403,070 | ||||||
|
|
|
| |||||
| 16,952,309 | 17,104,731 | |||||||
|
|
|
| |||||
International Business | ||||||||
Fixed-line services | 1,267,581 | 1,338,888 | ||||||
ICT business | 844,825 | 545,499 | ||||||
Others | 301,007 | 245,544 | ||||||
|
|
|
| |||||
| 2,413,413 | 2,129,931 | |||||||
|
|
|
| |||||
Others | ||||||||
Sales | 720,099 | 705,410 | ||||||
Others | 233,108 | 216,073 | ||||||
|
|
|
| |||||
| 953,207 | 921,483 | |||||||
|
|
|
| |||||
| $ | 54,943,471 | $ | 54,210,905 | |||||
|
|
|
| |||||
- 73 -
TABLE 1
CHUNGHWA TELECOM CO., LTD. AND SUBSIDIARIES
ENDORSEMENTS/GUARANTEES PROVIDED
THREE MONTHS ENDED MARCH 31, 2024
(Amounts in Thousands of New Taiwan Dollars)
No. (Note 1) | Endorsement/ Guarantee Provider | Guaranteed Party | Limits on Endorsement/ Guarantee Amount Provided to Each Guaranteed Party | Maximum Balance for the Period | Ending Balance | Actual Borrowing Amount | Amount of Endorsement/ Guarantee Collateralized by Properties | Ratio of Accumulated Endorsement/ Guarantee to Net Equity Per Latest Financial Statements | Maximum Endorsement/ Guarantee Amount Allowable | Endorsement/ Guarantee Given by Parent on Behalf of Subsidiaries | Endorsement/ Guarantee Given by Subsidiaries on Behalf of Parent | Endorsement/ Guarantee Given on Behalf of Companies in Mainland China | Note | |||||||||||||||||||||||||||||||||||||||||||
| Name | Nature of Relationship (Note 2) | |||||||||||||||||||||||||||||||||||||||||||||||||||||||
1 | | Senao International Co., Ltd. | | | Aval Technologies Co., Ltd. | | b | $ | 606,145 | $ | 300,000 | $ | 300,000 | $ | 300,000 | $ | — | 4.95 | $ | 3,030,726 | Yes | No | No | Notes 3 and 4 | ||||||||||||||||||||||||||||||||
| | Wiin Technology Co., Ltd. | | b | 606,145 | 200,000 | 200,000 | 200,000 | — | 3.30 | 3,030,726 | Yes | No | No | Notes 3 and 4 | ||||||||||||||||||||||||||||||||||||||||||
| Note 1: | Significant transactions between the Company and its subsidiaries or among subsidiaries are numbered as follows: |
| a. | “0” for the Company. |
| b. | Subsidiaries are numbered from “1”. |
| Note 2: | Relationships between the endorsement/guarantee provider and the guaranteed party: |
| a. | A company with which it does business. |
| b. | A company in which the Company directly and indirectly holds more than 50 percent of the voting shares. |
| c. | A company that directly and indirectly holds more than 50 percent of the voting shares in the Company. |
| d. | Companies in which the Company holds, directly or indirectly, 90% or more of the voting shares. |
| e. | The Company fulfills its contractual obligations by providing mutual endorsements/guarantees for another company in the same industry or for joint builders for purposes of undertaking a construction project. |
| f. | All capital contributing shareholders make endorsements/guarantees for their jointly invested company in proportion to their shareholding percentages. |
| g. | Companies in the same industry provide among themselves jointly and severally guarantee for a performance guarantee of a sales contract for pre-construction homes pursuant to the Consumer Protection Act for each other. |
| Note 3: | The limits on endorsement or guarantee amount provided to each guaranteed party is up to 10% of the net assets value of the latest financial statements of Senao International Co., Ltd. |
| Note 4: | The total amount of endorsement or guarantee that the Company is allowed to provide is up to 50% of the net assets value of the latest financial statements of Senao International Co., Ltd. |
- 74 -
TABLE 2
CHUNGHWA TELECOM CO., LTD. AND SUBSIDIARIES
MARKETABLE SECURITIES HELD
MARCH 31, 2024
(Amounts in Thousands of New Taiwan Dollars)
Held Company | Marketable Securities | Relationship with the Company | Financial Statement | March 31, 2024 | Note | |||||||||||||||||||||||
| Shares (Thousands/ Thousand Units) | Carrying Value (Note 1) | Percentage of Ownership | Fair Value | |||||||||||||||||||||||||
Chunghwa Telecom Co., Ltd. | Stocks | |||||||||||||||||||||||||||
| Taipei Financial Center Corp. | — | Financial assets at FVOCI | 172,927 | $ | 4,284,522 | 12 | $ | 4,284,522 | — | |||||||||||||||||||
| KKCompany Technologies Inc. | — | Financial assets at FVOCI | 2,762 | 288,893 | 2 | 288,893 | — | |||||||||||||||||||||
| 4 Gamers Entertainment Inc. | — | Financial assets at FVOCI | 136 | 149,594 | 19.9 | 149,594 | — | |||||||||||||||||||||
| Industrial Bank of Taiwan II Venture Capital Co., Ltd. (IBT II) | — | Financial assets at FVOCI | 5,252 | 17,098 | 17 | 17,098 | — | |||||||||||||||||||||
| Innovation Works Limited | — | Financial assets at FVOCI | 1,000 | 5,384 | 2 | 5,384 | — | |||||||||||||||||||||
| Taiwan mobile payment Co., Ltd. | — | Financial assets at FVOCI | 1,200 | 4,408 | 2 | 4,408 | — | |||||||||||||||||||||
| RPTI Intergroup International Ltd. | — | Financial assets at FVOCI | 4,765 | — | 10 | — | — | |||||||||||||||||||||
| Global Mobile Corp. | — | Financial assets at FVOCI | 7,617 | — | 3 | — | — | |||||||||||||||||||||
| Taiwania Capital Buffalo Fund Co., Ltd. | — | Financial assets at FVTPL - noncurrent | 555,600 | 461,276 | 13 | 461,276 | — | |||||||||||||||||||||
| TOP TAIWAN XIV VENTURE CAPITAL CO., LTD. | — | Financial assets at FVTPL - noncurrent | 20,000 | 187,180 | 9 | 187,180 | — | |||||||||||||||||||||
| Innovation Works Development Fund, L.P. | — | Financial assets at FVTPL - noncurrent | — | 69,739 | 4 | 69,739 | — | |||||||||||||||||||||
| Limited partnership | ||||||||||||||||||||||||||||
| Taiwania Capital Buffalo Fund VI, L.P. | — | Financial assets at FVTPL - noncurrent | — | 281,109 | 10 | 281,109 | — | |||||||||||||||||||||
Senao International Co., Ltd. | Stocks | |||||||||||||||||||||||||||
| N.T.U. Innovation Incubation Corporation | — | Financial assets at FVOCI | 1,200 | 11,341 | 9 | 11,341 | — | |||||||||||||||||||||
CHIEF Telecom Inc. | Stocks | |||||||||||||||||||||||||||
| WPG Holdings Limited | — | Financial assets at FVOCI | 2,102 | 98,899 | — | 98,899 | Note 2 | |||||||||||||||||||||
| WT Microelectronics Co., Ltd. | — | Financial assets at FVOCI | 361 | 16,967 | — | 16,967 | Note 2 | |||||||||||||||||||||
| 3 Link Information Service Co., Ltd. | — | Financial assets at FVOCI | 374 | 1,147 | 10 | 1,147 | — | |||||||||||||||||||||
| WPG Holdings Limited | — | Financial assets at FVTPL - current | 9 | 421 | — | 421 | Note 2 | |||||||||||||||||||||
Chunghwa Investment Co., Ltd. | Stocks | |||||||||||||||||||||||||||
| PChome Online Inc. | — | Financial assets at FVOCI | 1,875 | 62,447 | 1 | 62,447 | Note 2 | |||||||||||||||||||||
| Tatung Technology Inc. | — | Financial assets at FVOCI | 4,571 | 46,079 | 11 | 46,079 | — | |||||||||||||||||||||
| Bossdom Digiinnovation Co., Ltd. | — | Financial assets at FVOCI | 2,309 | 38,907 | 6 | 38,907 | Note 2 | |||||||||||||||||||||
| KEYXENTIC INC. | — | Financial assets at FVOCI | 600 | 30,000 | 11 | 30,000 | — | |||||||||||||||||||||
| ioNetworks Inc. | — | Financial assets at FVOCI | 107 | 13,125 | 2 | 13,125 | — | |||||||||||||||||||||
| iSing99 Inc. | — | Financial assets at FVOCI | 10,000 | — | 7 | — | — | |||||||||||||||||||||
| Powtec ElectroChemical Corporation | — | Financial assets at FVOCI | 20,000 | — | 2 | — | — | |||||||||||||||||||||
| Limited partnership | ||||||||||||||||||||||||||||
| Taiwania Capital Buffalo Fund V, L.P. | — | Financial assets at FVTPL - noncurrent | — | 35,537 | 3 | 35,537 | — | |||||||||||||||||||||
CHT Security Co., Ltd. | Stocks | |||||||||||||||||||||||||||
| TXOne Networks Inc. | — | Financial assets at FVTPL - noncurrent | 91 | 15,548 | — | 15,548 | — | |||||||||||||||||||||
Note 1: Showed at carrying amounts with fair value adjustments.
Note 2: Fair value was based on the closing price on the last trading day of the reporting period.
- 75 -
TABLE 3
CHUNGHWA TELECOM CO., LTD. AND SUBSIDIARIES
TOTAL PURCHASES FROM OR SALES TO RELATED PARTIES AMOUNTING TO AT LEAST NT$100 MILLION OR 20% OF THE PAID-IN CAPITAL
THREE MONTHS ENDED MARCH 31, 2024
(Amounts in Thousands of New Taiwan Dollars)
Company Name | Related Party | Nature of Relationship | Transaction Details | Abnormal Transaction | Notes / Accounts Payable or Receivable | |||||||||||||||||||||||||||
| Purchases/Sales (Note 1) | Amount (Note 4) | % to Total | Payment Terms | Unit Price | Payment Terms | Ending Balance (Notes 2 and 4) | % to Total | |||||||||||||||||||||||||
Chunghwa Telecom Co., Ltd. | Senao International Co., Ltd. | Subsidiary | Sales | $ | 1,140,509 | 2 | 30 days | $ | — | — | $ | 328,918 | 2 | |||||||||||||||||||
| Purchase | 435,829 | 2 | 30~90 days | — | — | (1,084,761 | ) | (11 | ) | |||||||||||||||||||||||
| CHIEF Telecom Inc. | Subsidiary | Sales | 120,991 | — | 30 days | — | — | 63,529 | — | |||||||||||||||||||||||
| Chunghwa System Integration Co., Ltd. | Subsidiary | Purchase | 258,209 | 1 | 30 days | — | — | (215,171 | ) | (2 | ) | |||||||||||||||||||||
| Honghwa International Co., Ltd. | Subsidiary | Purchase | 1,684,222 | 6 | 30~60 days | — | — | (1,085,050 | ) | (11 | ) | |||||||||||||||||||||
| Donghwa Telecom Co., Ltd. | Subsidiary | Purchase | 142,701 | — | 90 days | — | — | (120,951 | ) | (1 | ) | |||||||||||||||||||||
| CHT Security Co., Ltd. | Subsidiary | Purchase | 129,017 | — | 30 days | — | — | (56,042 | ) | (1 | ) | |||||||||||||||||||||
| International Integrated Systems, Inc. | Subsidiary | Purchase | 133,873 | — | 30 days | — | — | (52,610 | ) | (1 | ) | |||||||||||||||||||||
| Taiwan International Standard Electronics Co., Ltd. | Associate | Purchase | 150,957 | 1 | 30~90 days | — | — | (109,653 | ) | (1 | ) | |||||||||||||||||||||
Note 1: Purchases include costs to acquire services.
Note 2: Notes and accounts receivable did not include the amounts collected for others and other receivables.
Note 3: Transaction terms with related parties were determined in accordance with mutual agreements when there were no similar transactions with third parties. Other transactions with related parties were not significantly different from those with third parties.
Note 4: All intercompany transactions, balances, income and expenses are eliminated upon consolidation.
- 76 -
TABLE 4
CHUNGHWA TELECOM CO., LTD. AND SUBSIDIARIES
RECEIVABLES FROM RELATED PARTIES AMOUNTING TO AT LEAST NT$100 MILLION OR 20% OF THE PAID-IN CAPITAL
MARCH 31, 2024
(Amounts in Thousands of New Taiwan Dollars)
Company Name | Related Party | Nature of Relationship | Ending Balance | Turnover Rate (Note 1) | Overdue | Amounts Received in Subsequent Period | Allowance for Bad Debts | |||||||||||||||||||||
| Amounts | Action Taken | |||||||||||||||||||||||||||
Chunghwa Telecom Co., Ltd. | Senao International Co., Ltd. | Subsidiary | $
| 444,535 (Note 2 | ) | 10.69 | $ | — | — | $ | 71,760 | $ | — | |||||||||||||||
Senao International Co., Ltd. | Chunghwa Telecom Co., Ltd. | Parent company | | 1,238,700 (Note 2 | ) | 9.12 | — | — | 193,160 | — | ||||||||||||||||||
Chunghwa System Integration Co., Ltd. | Chunghwa Telecom Co., Ltd. | Parent company | | 215,171 (Note 2 | ) | 4.83 | — | — | 41,803 | — | ||||||||||||||||||
Honghwa International Co., Ltd. | Chunghwa Telecom Co., Ltd. | Parent company | | 1,097,576 (Note 2 | ) | 5.82 | — | — | 70,883 | — | ||||||||||||||||||
Donghwa Telecom Co., Ltd. | Chunghwa Telecom Co., Ltd. | Parent company | | 120,951 (Note 2 | ) | 7.31 | — | — | 73,008 | — | ||||||||||||||||||
Chunghwa Precision Test Tech. Co., Ltd. | Su Zhou Precision Test Tech. Ltd. | Subsidiary | | 78,202 (Note 2 | ) | 2.22 | — | — | 29,186 | — | ||||||||||||||||||
Note 1: Payments and receipts collected in trust for others are excluded from the accounts receivable in calculating the turnover rate.
Note 2: The amount was eliminated upon consolidation.
- 77 -
TABLE 5
CHUNGHWA TELECOM CO., LTD. AND SUBSIDIARIES
NAMES, LOCATIONS, AND OTHER INFORMATION OF INVESTEES IN WHICH THE COMPANY EXERCISES SIGNIFICANT INFLUENCE (EXCLUDING INVESTMENT IN MAINLAND CHINA)
THREE MONTHS ENDED MARCH 31, 2024
(Amounts in Thousands of New Taiwan Dollars)
Investor Company | Investee Company | Location | Main Businesses and Products | Original Investment Amount | Balance as of March 31, 2024 | Net Income (Loss) of the Investee | Recognized Gain (Loss) (Notes 1 and 2) | Note | ||||||||||||||||||||||||||||
| March 31, 2024 | December 31, 2023 | Shares (Thousands) | Percentage of Ownership (%) | Carrying Value | ||||||||||||||||||||||||||||||||
Chunghwa Telecom Co., Ltd. | Senao International Co., Ltd. | Taiwan | Handset and peripherals retailer; sales of CHT mobile phone plans as an agent | $ | 1,065,813 |
| $ | 1,065,813 |
|
| 71,773 |
|
| 28 |
| $ | 1,651,650 |
| $ | 135,148 |
| $ | 36,318 |
| Subsidiary | |||||||||||
Light Era Development Co., Ltd. | Taiwan | Planning and development of real estate and intelligent buildings, and property management |
| 3,000,000 |
|
| 3,000,000 |
|
| 300,000 |
|
| 100 |
|
| 3,835,977 |
|
| 3,047 |
|
| 4,081 |
| Subsidiary | ||||||||||||
Donghwa Telecom Co., Ltd. | Hong | International private leased circuit, IP VPN service, and IP transit services |
| 691,163 |
|
| 691,163 |
|
| 178,590 |
|
| 100 |
|
| 825,171 |
|
| 27,527 |
|
| 27,527 |
| Subsidiary | ||||||||||||
Chunghwa Telecom Singapore Pte., Ltd. | Singapore | International private leased circuit, IP VPN service, and IP transit services |
| 574,112 |
|
| 574,112 |
|
| 26,383 |
|
| 100 |
|
| 1,255,053 |
|
| 43,952 |
|
| 43,964 |
| Subsidiary | ||||||||||||
Chunghwa System Integration Co., Ltd. | Taiwan | Providing system integration services and telecommunications equipment |
| 838,506 |
|
| 838,506 |
|
| 60,000 |
|
| 100 |
|
| 696,397 |
|
| 21,426 |
|
| 2,151 |
| Subsidiary | ||||||||||||
CHIEF Telecom Inc. | Taiwan | Network integration, internet data center (“IDC”), communications integration and cloud application services |
| 459,652 |
|
| 459,652 |
|
| 43,368 |
|
| 56 |
|
| 1,844,430 |
|
| 242,032 |
|
| 139,938 |
| Subsidiary | ||||||||||||
Chunghwa Investment Co., Ltd. | Taiwan | Investment |
| 639,559 |
|
| 639,559 |
|
| 68,085 |
|
| 89 |
|
| 3,040,624 |
|
| 4,311 |
|
| 3,871 |
| Subsidiary | ||||||||||||
Prime Asia Investments Group Ltd. | British | Investment |
| 385,274 |
|
| 385,274 |
|
| 1 |
|
| 100 |
|
| 174,875 |
|
| 4,259 |
|
| 4,259 |
| Subsidiary | ||||||||||||
Honghwa International Co., Ltd. | Taiwan | Telecommunication engineering, sales agent of mobile phone plan application and other business services, etc. |
| 180,000 |
|
| 180,000 |
|
| 18,000 |
|
| 100 |
|
| 886,419 |
|
| 130,238 |
|
| 133,724 |
| Subsidiary | ||||||||||||
CHYP Multimedia Marketing & Communications Co., Ltd. | Taiwan | Digital information supply services and advertisement services |
| 150,000 |
|
| 150,000 |
|
| 15,000 |
|
| 100 |
|
| 211,822 |
|
| 3,985 |
|
| 4,024 |
| Subsidiary | ||||||||||||
Chunghwa Telecom Vietnam Co., Ltd. | Vietnam | Intelligent energy saving solutions, international circuit, and information and communication technology (“ICT”) services |
| 148,275 |
|
| 148,275 |
|
| — |
|
| 100 |
|
| 76,850 |
|
| 1,612 |
|
| 1,612 |
| Subsidiary | ||||||||||||
Chunghwa Telecom Global, Inc. | United | International private leased circuit, internet services, and transit services |
| 70,429 |
|
| 70,429 |
|
| 6,000 |
|
| 100 |
|
| 754,965 |
|
| 16,346 |
|
| 16,346 |
| Subsidiary | ||||||||||||
CHT Security Co., Ltd. | Taiwan | Computing equipment installation, wholesale of computing and business machinery equipment and software, management consulting services, data processing services, digital information supply services and internet identify services |
| 240,000 |
|
| 240,000 |
|
| 24,000 |
|
| 66 |
|
| 556,626 |
|
| 127,569 |
|
| 90,867 |
| Subsidiary | ||||||||||||
Chunghwa Telecom (Thailand) Co., Ltd. | Thailand | International private leased circuit, IP VPN service, ICT and cloud VAS services |
| 119,624 |
|
| 119,624 |
|
| 1,300 |
|
| 100 |
|
| 122,504 |
|
| 2,362 |
|
| 2,362 |
| Subsidiary | ||||||||||||
Spring House Entertainment Tech. Inc. | Taiwan | Software design services, internet contents production and play, and motion picture production and distribution |
| 62,209 |
|
| 62,209 |
|
| 8,251 |
|
| 56 |
|
| 170,997 |
|
| 11,071 |
|
| 6,204 |
| Subsidiary | ||||||||||||
Chunghwa leading Photonics Tech Co., Ltd. | Taiwan | Production and sale of electronic components and finished products |
| 70,500 |
|
| 70,500 |
|
| 7,050 |
|
| 75 |
|
| 180,497 |
|
| 17,259 |
|
| 12,869 |
| Subsidiary | ||||||||||||
Smartfun Digital Co., Ltd. | Taiwan | Providing diversified family education digital services |
| 65,000 |
|
| 65,000 |
|
| 6,500 |
|
| 65 |
|
| 83,797 |
|
| 2,375 |
|
| 1,483 |
| Subsidiary | ||||||||||||
Chunghwa Telecom Japan Co., Ltd. | Japan | International private leased circuit, IP VPN service, and IP transit services |
| 17,291 |
|
| 17,291 |
|
| 1 |
|
| 100 |
|
| 185,507 |
|
| 33,984 |
|
| 33,984 |
| Subsidiary | ||||||||||||
Chunghwa Sochamp Technology Inc. | Taiwan | Design, development and production of Automatic License Plate Recognition software and hardware |
| 20,400 |
|
| 20,400 |
|
| 2,040 |
|
| 37 |
|
| (8,879 | ) |
| (1,878 | ) |
| (1,157 | ) | Subsidiary | ||||||||||||
International Integrated Systems, Inc. | Taiwan | IT solution provider, IT application consultation, system integration and package solution |
| 517,423 |
|
| 517,423 |
|
| 37,211 |
|
| 51 |
|
| 627,844 |
|
| (71,408 | ) |
| (35,222 | ) | Subsidiary | ||||||||||||
Chunghwa Digital Cultural and Creative Capital Co., Ltd | Taiwan | Investment and management consulting |
| 50,000 |
|
| — |
|
| 5,000 |
|
| 100 |
|
| 49,865 |
|
| (296 | ) |
| (135 | ) | Subsidiary | ||||||||||||
Viettel-CHT Co., Ltd. | Vietnam | IDC services |
| 288,327 |
|
| 288,327 |
|
| — |
|
| 30 |
|
| 567,596 |
|
| 84,687 |
|
| 25,418 |
| Associate | ||||||||||||
(Continued)
- 78 -
CHUNGHWA TELECOM CO., LTD. AND SUBSIDIARIES
NAMES, LOCATIONS, AND OTHER INFORMATION OF INVESTEES IN WHICH THE COMPANY EXERCISES SIGNIFICANT INFLUENCE (EXCLUDING INVESTMENT IN MAINLAND CHINA)
THREE MONTHS ENDED MARCH 31, 2024
(Amounts in Thousands of New Taiwan Dollars)
Investor Company | Investee Company | Location | Main Businesses and Products | Original Investment Amount | Balance as of March 31, 2024 | Net Income (Loss) of the Investee | Recognized Gain (Loss) (Notes 1 and 2) | Note | ||||||||||||||||||||||||||||
| March 31, 2024 | December 31, 2023 | Shares (Thousands) | Percentage of Ownership (%) | Carrying Value | ||||||||||||||||||||||||||||||||
| Taiwan International Standard Electronics Co., Ltd. | Taiwan | Manufacturing, selling, designing, and maintaining of telecommunications systems and equipment | $ | 164,000 | $ | 164,000 | 1,760 | 40 | $ | 312,238 | $ | (8,578 | ) | $ | (562 | ) | Associate | |||||||||||||||||||
| KKBOX Taiwan Co., Ltd. | Taiwan | Providing of music on-line, software, electronic information, and advertisement services | 67,025 | 67,025 | 4,438 | 30 | 171,342 | 24,475 | 7,342 | Associate | ||||||||||||||||||||||||||
| So-net Entertainment Taiwan Limited | Taiwan | Online service and sale of computer hardware | 120,008 | 120,008 | 9,429 | 30 | 224,102 | (5,315 | ) | (1,594 | ) | Associate | ||||||||||||||||||||||||
| KingwayTek Technology Co., Ltd. | Taiwan | Design and sale of digital map, technical support for computer peripherals device, design and development of system programming projects | 66,684 | 66,684 | 11,563 | 23 | 270,090 | 16,754 | 3,807 | Associate | ||||||||||||||||||||||||||
| Taiwan International Ports Logistics Corporation | Taiwan | Import and export storage, logistic warehouse, and ocean shipping service | 80,000 | 80,000 | 8,000 | 27 | 129,330 | 27,680 | 7,382 | Associate | ||||||||||||||||||||||||||
| Chunghwa PChome Fund I Co., Ltd. | Taiwan | Investment, venture capital, investment advisor, management consultant and other consultancy service | 200,000 | 200,000 | 20,000 | 50 | 256,115 | (3,084 | ) | (1,542 | ) | Associate | ||||||||||||||||||||||||
| Cornerstone Ventures Co., Ltd. | Taiwan | Investment, venture capital, investment advisor, management consultant and other consultancy service | 4,900 | 4,900 | 490 | 49 | 7,563 | 182 | 89 | Associate | ||||||||||||||||||||||||||
| Next Commercial Bank Co., Ltd. | Taiwan | Online banking business | 5,733,847 | 5,733,847 | 462,643 | 46 | 4,207,893 | (185,512 | ) | (84,273 | ) | Associate | ||||||||||||||||||||||||
| Chunghwa SEA Holdings | Taiwan | Investment business | 10,200 | 10,200 | 1,020 | 51 | 9,400 | (124 | ) | (63 | ) | Joint venture | ||||||||||||||||||||||||
| WiAdvance Technology Corporation | Taiwan | Software solution integration | 273,800 | 273,800 | 3,700 | 16 | 285,617 | (10,728 | ) | (3,142 | ) | Associate | ||||||||||||||||||||||||
Senao International Co., Ltd. | Senao Networks, Inc. | Taiwan | Telecommunication facilities manufactures and sales | 202,758 | 202,758 | 16,579 | 34 | 1,608,490 | 51,416 | 17,375 | Associate | |||||||||||||||||||||||||
| Youth Co., Ltd. | Taiwan | Sale of information and communication technologies products | 427,850 | 427,850 | 14,752 | 96 | 167,377 | 17 | (2,013 | ) | Subsidiary (Note 5) | |||||||||||||||||||||||||
| Aval Technologies Co., Ltd. | Taiwan | Sale of information and communication technologies products | 89,550 | 89,550 | 12,555 | 100 | 138,018 | 556 | 555 | Subsidiary (Note 5) | ||||||||||||||||||||||||||
| Senyoung Insurance Agent Co., Ltd. | Taiwan | Property and liability insurance agency | 59,000 | 59,000 | 8,909 | 100 | 134,369 | 7,119 | 7,119 | Subsidiary (Note 5) | ||||||||||||||||||||||||||
CHIEF Telecom Inc. | Unigate Telecom Inc. | Taiwan | Telecommunications and internet service | 2,000 | 2,000 | 200 | 100 | 1,358 | 24 | 24 | Subsidiary (Note 5) | |||||||||||||||||||||||||
| Chief International Corp. | Samoa Islands | Telecommunications and internet service | 6,068 | 6,068 | 200 | 100 | 118,338 | 2,014 | 2,014 | Subsidiary (Note 5) | ||||||||||||||||||||||||||
Chunghwa Telecom Singapore Pte., Ltd. | ST-2 Satellite Ventures Pte., Ltd. | Singapore | Operation of ST-2 telecommunications satellite | 21,309 | 21,309 | 943 | 38 | 322,008 | 114,669 | 43,724 | Associate | |||||||||||||||||||||||||
| CHT Infinity Singapore Pte. Ltd. | Singapore | Investment business | 55,720 | 55,720 | 2,000 | 40 | 58,474 | 238 | 95 | Associate | ||||||||||||||||||||||||||
Chunghwa Investment Co., Ltd. | Chunghwa Precision Test Tech. Co., Ltd. | Taiwan | Production and sale of semiconductor testing components and printed circuit board | 178,608 | 178,608 | 11,230 | 34 | 2,586,756 | 14,001 | 4,795 | Subsidiary (Note 5) | |||||||||||||||||||||||||
| CHIEF Telecom Inc. | Taiwan | Network integration, internet data center (“IDC”), communications integration and cloud application services | 19,064 | 19,064 | 2,286 | 3 | 88,881 | 242,032 | 7,105 | Associate (Note 5) | ||||||||||||||||||||||||||
| Senao International Co., Ltd. | Taiwan | Selling and maintaining mobile phones and its peripheral products | 49,731 | 49,731 | 1,001 | — | 44,238 | 135,148 | 524 | Associate (Note 5) | ||||||||||||||||||||||||||
| AgriTalk Technology Inc. | Taiwan | Providing smart agricultural solutions, scientific agricultural product, biological inhibitor, and biochips | 65,175 | 65,175 | 3,300 | 29 | 29,572 | (4,516 | ) | (1,226 | ) | Associate | ||||||||||||||||||||||||
| Imedtac Co., Ltd. | Taiwan | Providing medical AIoT solution, biomedical engineering services, and sales of medical device as an agent | 59,467 | 59,467 | 1,189 | 7 | 46,295 | (4,451 | ) | (585 | ) | Associate | ||||||||||||||||||||||||
(Continued)
- 79 -
CHUNGHWA TELECOM CO., LTD. AND SUBSIDIARIES
NAMES, LOCATIONS, AND OTHER INFORMATION OF INVESTEES IN WHICH THE COMPANY EXERCISES SIGNIFICANT INFLUENCE (EXCLUDING INVESTMENT IN MAINLAND CHINA)
THREE MONTHS ENDED MARCH 31, 2024
(Amounts in Thousands of New Taiwan Dollars)
Investor Company | Investee Company | Location | Main Businesses and Products | Original Investment Amount | Balance as of March 31, 2024 | Net Income (Loss) of the Investee | Recognized Gain (Loss) (Notes 1 and 2) | Note | ||||||||||||||||||||||||||||
| March 31, 2024 | December 31, 2023 | Shares (Thousands) | Percentage of Ownership (%) | Carrying Value | ||||||||||||||||||||||||||||||||
Chunghwa Precision Test Tech. Co., Ltd. | Chunghwa Precision Test Tech USA Corporation | United States | Design and after-sale services of semiconductor testing components and printed circuit board | $ | 74,192 | $ | 74,192 | 2,600 | 100 | $ | 105,444 | $ | 131 | $ | (49 | ) | Subsidiary (Note 5) | |||||||||||||||||||
| CHPT Japan Co., Ltd. | Japan | Related services of electronic parts, machinery processed products and printed circuit board | 2,008 | 2,008 | 1 | 100 | 2,183 | 23 | 23 | Subsidiary (Note 5) | ||||||||||||||||||||||||||
| Chunghwa Precision Test Tech. International, Ltd. | Samoa Islands | Wholesale and retail of electronic materials, and investment | 173,649 | 173,649 | 5,700 | 100 | 157,672 | (16,089 | ) | (15,976 | ) | Subsidiary (Note 5) | ||||||||||||||||||||||||
| TestPro Investment Co., Ltd. | Taiwan | Investment | 135,000 | 135,000 | 13,500 | 100 | 56,222 | (8,199 | ) | (7,809 | ) | Subsidiary (Note 5) | ||||||||||||||||||||||||
TestPro Investment Co., Ltd. | NavCore Tech. Co., Ltd | Taiwan | Sale and manufacturing of smart equipment, smart factory software and hardware integration and technical consulting service | 108,500 | 108,500 | 10,850 | 54 | 49,405 | (15,119 | ) | (8,202 | ) | Subsidiary (Note 5) | |||||||||||||||||||||||
Prime Asia Investments Group, Ltd. | Chunghwa Hsingta Co., Ltd. | Hong Kong | Investment | 375,274 | 375,274 | 1 | 100 | 174,875 | 4,259 | 4,259 | Subsidiary (Note 5) | |||||||||||||||||||||||||
Youth Co., Ltd. | ISPOT Co., Ltd. | Taiwan | Sale of information and communication technologies products | 53,021 | 53,021 | — | 100 | 14,789 | 263 | 215 | Subsidiary (Note 5) | |||||||||||||||||||||||||
Aval Technologies Co., Ltd. | Wiin Technology Co., Ltd. | Taiwan | Sale of information and communication technologies products | 29,550 | 29,550 | 4,418 | 100 | 49,512 | 262 | 262 | Subsidiary (Note 5) | |||||||||||||||||||||||||
CHYP Multimedia Marketing & Communications Co., Ltd | Click Force Marketing Company | Taiwan | Advertisement services | 44,607 | 44,607 | 1,715 | 49 | 44,828 | 4,471 | 2,191 | Associate | |||||||||||||||||||||||||
International Integrated Systems, Inc. | Unitronics Technology Corp. | Taiwan | Development and maintenance of information system | 55,610 | 55,610 | 5,067 | 100 | 76,955 | 702 | 702 | Subsidiary (Note 5) | |||||||||||||||||||||||||
CHT Security Co., Ltd. | Baohwa Trust Co., Ltd. | Taiwan | VR integration and AIoT security services | 20,000 | 20,000 | 2,000 | 25 | 10,383 | 264 | 66 | Associate | |||||||||||||||||||||||||
| Note 1: | The amounts were based on reviewed financial statements. |
| Note 2: | Recognized gain (loss) of investees includes amortization of differences between the investment cost and net value and elimination of unrealized transactions. |
| Note 3: | Recognized gain (loss) and carrying value of the investees did not include the adjustment of the difference between the accounting treatment on standalone basis and consolidated basis as a result of the application of IFRS 15. |
| Note 4: | Investments in mainland China are included in Table 6. |
| Note 5: | The amount was eliminated upon consolidation. |
(Concluded)
- 80 -
TABLE 6
CHUNGHWA TELECOM CO., LTD. AND SUBSIDIARIES
INVESTMENTS IN MAINLAND CHINA
THREE MONTHS ENDED MARCH 31, 2024
(Amounts in Thousands of New Taiwan Dollars)
Investee | Main | Total Amount of Paid-in Capital | Investment Type (Note 1) | Accumulated Outflow of Investment from Taiwan as of January 1, 2024 | Investment Flows | Accumulated Outflow of Investment from Taiwan as of March 31, 2024 | Net Income (Loss) of the Investee | % Ownership of Direct or Indirect Investment | Investment Gain (Loss) (Note 2) | Carrying Value as of March 31, 2024 | Accumulated Inward Remittance of Earnings as of March 31, 2024 | Note | ||||||||||||||||||||||||||||||||||||||
| Outflow | Inflow | |||||||||||||||||||||||||||||||||||||||||||||||||
Chunghwa Telecom (China) Co., Ltd. | Integrated information and communication solution services for enterprise clients, and intelligent energy network service | $ | 177,176 | 2 | $ | 177,176 | $ | — | $ | — | $ | 177,176 | $ | — | 100 | $ | — | $ | — | $ | — | Notes 6 and 8 | ||||||||||||||||||||||||||||
Jiangsu Zhenghua Information Technology Company, LLC | Providing intelligent energy saving solution and intelligent buildings services | 189,410 | 2 | 142,057 | — | — | 142,057 | — | 75 | — | — | — | Notes 7 and 8 | |||||||||||||||||||||||||||||||||||||
Shanghai Taihua Electronic Technology Limited | Design of printed circuit board and related consultation service | 51,233 | 2 | 51,233 | — | — | 51,233 | 275 | 100 | 275 | 8,676 | — | Note 8 | |||||||||||||||||||||||||||||||||||||
Su Zhou Precision Test Tech. Ltd. | Assembly processed of circuit board, design of printed circuit board and related consultation service | 119,199 | 2 | 119,199 | — | — | 119,199 | (16,407 | ) | 100 | (16,407 | ) | 151,610 | — | Note 8 | |||||||||||||||||||||||||||||||||||
Shanghai Chief Telecom Co., Ltd. | Telecommunications and internet service | 10,150 | 1 | 4,973 | — | — | 4,973 | 327 | 49 | 160 | 5,581 | 9,533 | Note 8 | |||||||||||||||||||||||||||||||||||||
(Continued)
- 81 -
Investee | Accumulated Investment in Mainland China as of March 31, 2024 | Investment Amounts Authorized by Investment Commission, MOEA | Upper Limit on Investment Stipulated by Investment Commission, MOEA | |||||||||
Chunghwa Telecom Co., Ltd. (Note 3) | $ | 319,233 | $ | 319,233 | $ | 242,783,962 | ||||||
Chunghwa Precision Test Tech. Co., Ltd. and its subsidiaries (Note 4) | 170,432 | 216,185 | 4,554,971 | |||||||||
CHIEF Telecom Inc. and its subsidiaries (Note 5) | 4,973 | 4,973 | 1,820,620 | |||||||||
| Note 1: | Investments are divided into three categories as follows: |
| a. | Direct investment. |
| b. | Investments through a holding company registered in a third region. |
| c. | Others. |
| Note 2: | The amounts were calculated based on the investee’s reviewed financial statements. |
| Note 3: | Chunghwa Telecom Co., Ltd. was calculated based on the consolidated net assets value of Chunghwa Telecom Co., Ltd. |
| Note 4: | Chunghwa Precision Test Tech. Co., Ltd. and its subsidiaries were calculated based on the consolidated net assets value of Chunghwa Precision Test Tech. Co., Ltd. |
| Note 5: | CHIEF Telecom Inc. and its subsidiaries were calculated based on the consolidated net assets value of CHIEF Telecom Inc. |
| Note 6: | Chunghwa Telecom (China) Co., Ltd. completed its liquidation in October 2022. |
| Note 7: | Jiangsu Zhenhua Information Technology Company, LLC. completed its liquidation in December 2018. |
| Note 8: | The amount was eliminated upon consolidation. |
(Concluded)
- 82 -
TABLE 7
CHUNGHWA TELECOM CO., LTD. AND SUBSIDIARIES
INTERCOMPANY RELATIONSHIPS AND SIGNIFICANT TRANSACTIONS
THREE MONTHS ENDED MARCH 31, 2024
(Amounts in Thousands of New Taiwan Dollars)
Year | No. (Note 1) | Company Name | Related Party | Nature of Relationship (Note 2) | Transaction Details | |||||||||||||||||
Financial Statement Account | Amount (Note 5) | Payment Terms (Note 3) | % to Total Sales or Assets (Note 4) | |||||||||||||||||||
2024 | 0 | Chunghwa Telecom Co., Ltd. | Senao International Co., Ltd. | a | Accounts receivable | $ | 328,918 | — | — | |||||||||||||
| Accrued custodial receipts | 115,617 | — | — | |||||||||||||||||||
| Accounts payable | 1,084,761 | — | — | |||||||||||||||||||
| Amounts collected for others | 153,939 | — | — | |||||||||||||||||||
| Revenues | 1,140,509 | — | 2 | |||||||||||||||||||
| Operating costs and expenses | 435,829 | — | 1 | |||||||||||||||||||
| CHIEF Telecom Inc. | a | Revenues | 120,991 | — | — | |||||||||||||||||
| Chunghwa System Integration Co., Ltd. | a | Accounts payable | 215,171 | — | — | |||||||||||||||||
| Operating costs and expenses | 255,456 | — | — | |||||||||||||||||||
| Property, plant and equipment | 113,266 | — | — | |||||||||||||||||||
| Donghwa Telecom Co., Ltd. | a | Accounts payable | 120,951 | — | — | |||||||||||||||||
| Operating costs and expenses | 142,701 | — | — | |||||||||||||||||||
Honghwa International Co., Ltd. | a | Accounts payable | 1,085,050 | — | — | |||||||||||||||||
| Operating costs and expenses | 1,684,222 | — | 3 | |||||||||||||||||||
| International Integrated Systems, Inc. | a | Operating costs and expenses | 133,873 | — | — | |||||||||||||||||
| Note 1: | Significant transactions between the Company and its subsidiaries or among subsidiaries are numbered as follows: |
| a. | “0” for the Company. |
| b. | Subsidiaries are numbered from “1”. |
| Note 2: | Related party transactions are divided into three categories as follows: |
| a. | The Company to subsidiaries. |
| b. | Subsidiaries to the Company. |
| c. | Subsidiaries to subsidiaries. |
| Note 3: | Transaction terms with the related parties were determined in accordance with mutual agreements when there were no similar transactions with third parties. Other transactions with related parties were not significantly different from those with third parties. |
| Note 4: | For assets and liabilities, amount is shown as a percentage to consolidated total assets as of March 31, 2024, while revenues, costs and expenses are shown as a percentage to consolidated revenues for the three months ended March 31, 2024. |
| Note 5: | The amount was eliminated upon consolidation. |
- 83 -
TABLE 8
CHUNGHWA TELECOM CO., LTD.
INFORMATION OF MAJOR STOCKHOLDERS
MARCH 31, 2024
Name of Major Stockholders | Shares | |||||||
| Number of Shares | Percentage of Ownership (%) | |||||||
Ministry of Transportation and Communications | 2,737,718,976 | 35.29 | ||||||
| Note: | This table presents information provided by the Taiwan Depository & Clearing Corporation on stockholders holding greater than 5% of Chunghwa’s dematerialized securities that have completed the process of registration and delivery by book-entry transfer as of the last business day for the current quarter. |
- 84 -