Exhibit 99.1

Corporate Update
Forward Looking Statements
Certain statements in this presentation contain forward-looking statements. The forward-looking statements involve a number of risks and uncertainties. A number of factors could cause our actual results, performance, achievements or industry results to be materially different from any future results, performance or achievements expressed or implied by these forward-looking statements. Additional information concerning factors that could cause actual results to materially differ from those in the forward-looking statements is contained in the Securities and Exchange Commission filings of the Company.
This information constitutes the proprietary and confidential information of InPhonic, Inc. and is not be disclosed, used, copied or otherwise disseminated without the prior written consent of InPhonic.
Proprietary and Confidential Copyright InPhonic, Inc. 2005
1
David Steinberg
Chief Executive Officer
Investment Attributes
Leading online marketer and seller of wireless services in the United States
Proprietary e-commerce platform integrated with every major US wireless carriers
Increased penetration of large and growing online wireless activation market
Rapid revenue growth and increased operating leverage
Multi-faceted growth opportunities
Proprietary and Confidential Copyright InPhonic, Inc. 2005
3
US Leader in E-Commerce for Wireless Services
750,000 wireless devices activated in 2004
27% of US wireless activation market1
Increasing activation volumes leading to higher commissions rates from carriers
Continued strong revenue growth $118.82 million in 2003 to $204.2 million in 2004 $315—325 million guidance for 2005
Decreasing customer acquisition costs driven by higher conversion rates and InPhonic-direct sales
Operating leverage driven by substantial technology investments
1. Source: Compete, Inc. market estimates
2. Normalized for SAB 101 deferral revenue recognition of $17.3 million in Q4, 2003.
Proprietary and Confidential Copyright InPhonic, Inc. 2005
4
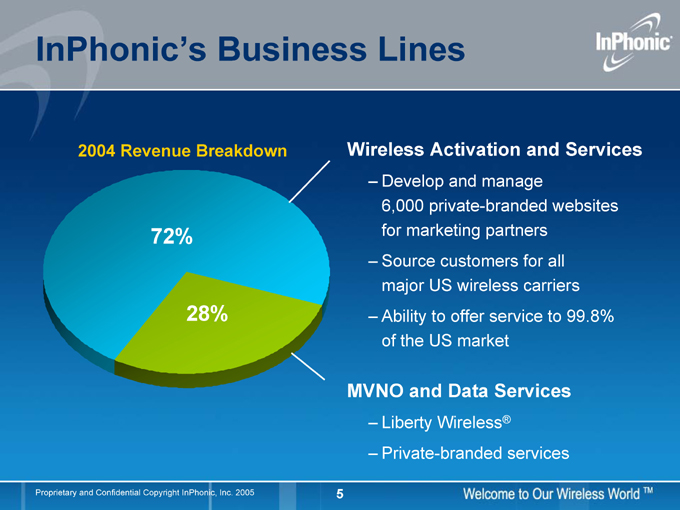
InPhonic’s Business Lines
2004 Revenue Breakdown
72%
28%
Wireless Activation and Services
Develop and manage
6,000 private-branded websites for marketing partners Source customers for all major US wireless carriers Ability to offer service to 99.8% of the US market
MVNO and Data Services
Liberty Wireless® Private-branded services
Proprietary and Confidential Copyright InPhonic, Inc. 2005
5
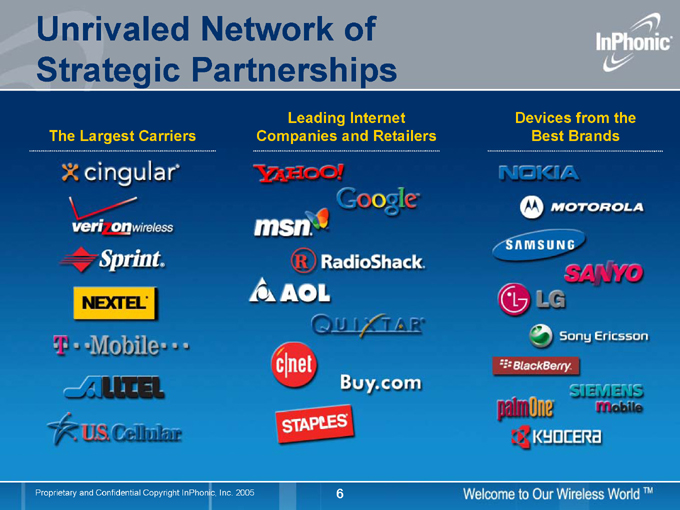
Unrivaled Network of Strategic Partnerships
The Largest Carriers
Leading Internet Companies and Retailers
Devices from the Best Brands
Proprietary and Confidential Copyright InPhonic, Inc. 2005
6
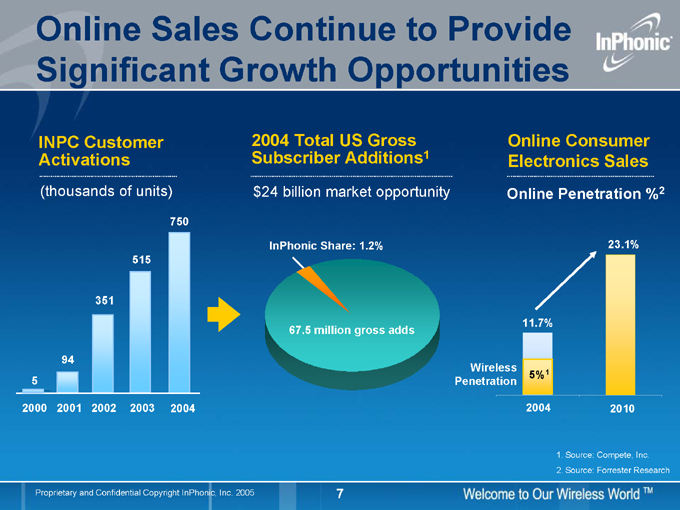
Online Sales Continue to Provide Significant Growth Opportunities
INPC Customer Activations
(thousands of units)
5
94
351
515
750
2000 2001 2002 2003 2004
2004 Total US Gross Subscriber Additions1 $24 billion market opportunity
InPhonic Share: 1.2%
67.5 million gross adds
Online Consumer Electronics Sales
Online Penetration %2
Wireless Penetration
5% 1
11.7%
23.1%
2004
2010
1. Source: Compete, Inc.
2. Source: Forrester Research
Proprietary and Confidential Copyright InPhonic, Inc. 2005
7
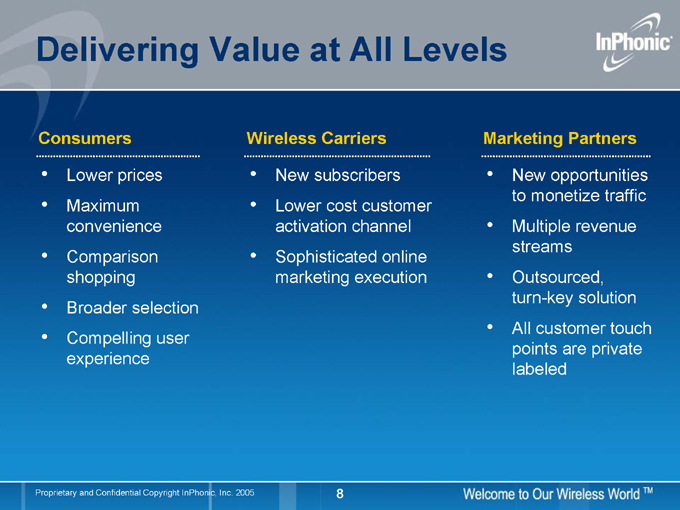
Delivering Value at All Levels
Consumers
Lower prices Maximum convenience Comparison shopping Broader selection Compelling user experience
Wireless Carriers
New subscribers Lower cost customer activation channel Sophisticated online marketing execution
Marketing Partners
New opportunities to monetize traffic Multiple revenue streams Outsourced, turn-key solution All customer touch points are private labeled
Proprietary and Confidential Copyright InPhonic, Inc. 2005
8
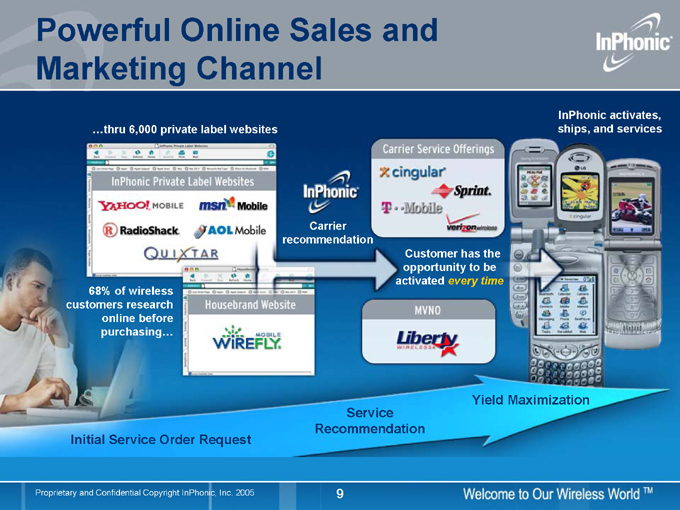
Powerful Online Sales and Marketing Channel
…thru 6,000 private label websites
68% of wireless customers research online before purchasing…
Carrier recommendation
Customer has the opportunity to be activated every time
InPhonic activates, ships, and services
Initial Service Order Request
Service Recommendation
Yield Maximization
Proprietary and Confidential Copyright InPhonic, Inc. 2005
9
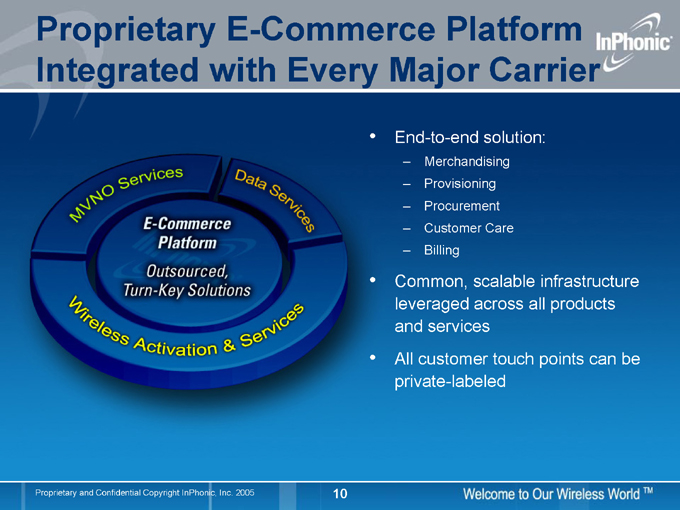
Proprietary E-Commerce Platform Integrated with Every Major Carrier
End-to-end solution:
Merchandising Provisioning Procurement Customer Care Billing
Common, scalable infrastructure leveraged across all products and services All customer touch points can be private-labeled
Proprietary and Confidential Copyright InPhonic, Inc. 2005
10
Growth Opportunities
Initiatives in Existing Business
Broaden base of private-label partners Expand and deepen carrier/OEM relationships Continue to enhance customer experience
New Strategic Initiatives
Cross-sell existing customers new products and services Enhance data services capability Explore international opportunities
Proprietary and Confidential Copyright InPhonic, Inc. 2005
11
Acquisition Strategy
Complementary and accretive opportunities
Increase margins/ expand subscriber base Broaden product portfolio Expand geographic reach
Proven track record of integrating operations A1 Wireless example
Acquired December 2004
2nd largest online seller of wireless services and devices in US Integrated operations into “best of breed” approach for servicing customers and carriers Deepened carrier relationships
Proprietary and Confidential Copyright InPhonic, Inc. 2005
12
Larry Winkler
Chief Financial Officer
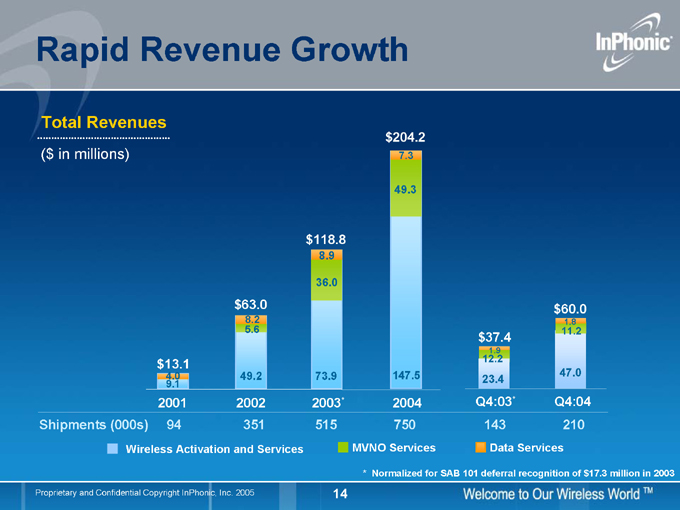
Rapid Revenue Growth
Total Revenues
($ in millions) $13.1
4.0 9.1 $63.0
8.2 5.6
49.2 $118.8
8.9
36.0
73.9 $204.2
7.3
49.3
147.5 $37.4
12.2 1.9
23.4 $60.0
1.8
11.2
47.0
2001 2002 2003* 2004 Q4:03* Q4:04
Shipments (000s) 94 351 515 750 143 210
Wireless Activation and Services
MVNO Services
Data Services
* Normalized for SAB 101 deferral recognition of $17.3 million in 2003
Proprietary and Confidential Copyright InPhonic, Inc. 2005
14
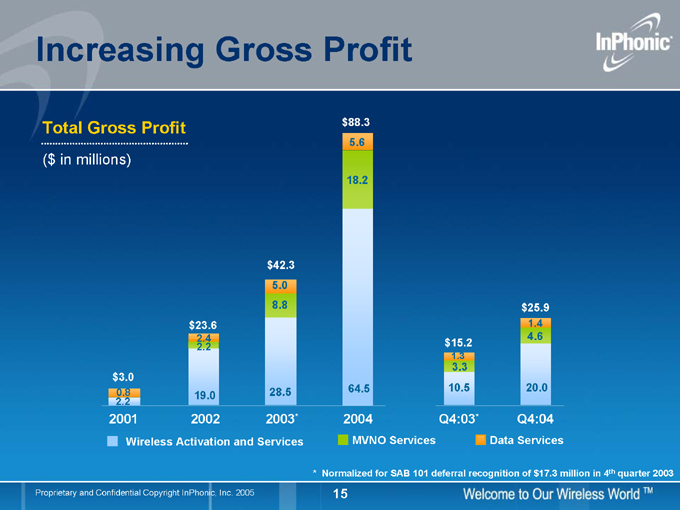
Increasing Gross Profit
Total Gross Profit
($ in millions) $3.0
2.2 0.8 $23.6
2.4 2.2
19.0 $42.3 5.0 8.8
28.5 $88.3 5.6
18.2
64.5
2001 2002 2003* 2004 $15.2
1.3
3.3 10.5 $25.9
1.4
4.6
20.0
Q4:03* Q4:04
Wireless Activation and Services
MVNO Services
Data Services
* Normalized for SAB 101 deferral recognition of $17.3 million in 4th quarter 2003
Proprietary and Confidential Copyright InPhonic, Inc. 2005
15
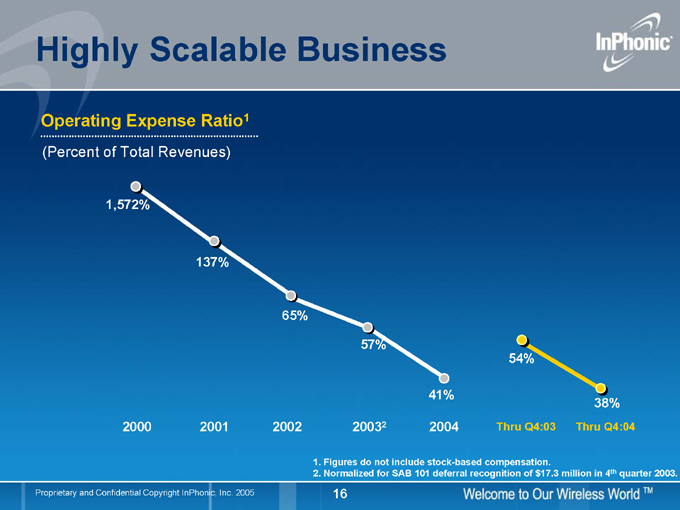
Highly Scalable Business
Operating Expense Ratio1
(Percent of Total Revenues)
1,572%
137%
65%
57%
41%
2000 2001 2002 20032 2004
54%
38%
Thru Q4:03 Thru Q4:04
1. Figures do not include stock-based compensation.
2. Normalized for SAB 101 deferral recognition of $17.3 million in 4th quarter 2003.
Proprietary and Confidential Copyright InPhonic, Inc. 2005
16

Strong Earnings Momentum
Quarterly EBITDA1
($ in millions)
Q1:03 Q2:03 Q3:03 Q4:032 Q1:04 Q2:04 Q3:04 Q4:04 $(2.5) $(8.4) $(9.0) $(5.0) $(2.8) $1.5 $2.3 $3.4
1. Figures do not include stock-based compensation.
2. Normalized for SAB 101 deferral recognition of $17.3 million in 2003
Proprietary and Confidential Copyright InPhonic, Inc. 2005
17

Improving Free Cash Flow
Quarterly FCF1
($ in millions)
Q1:03 Q2:03 Q3:03 Q4:032 Q1:04 Q2:04 Q3:04 Q4:04 $1.0 $(8.6) $(10.0) $(7.1) $(3.0) $1.2 $2.1 $3.2
1. Free Cash Flow= Net Income/(Loss) – Non Recurring Revenue Adjustments-Depreciation & Amortization – Stock-Based Compensation 2. Normalized for SAB 101 deferral recognition of $17.3 million in 2003
Proprietary and Confidential Copyright InPhonic, Inc. 2005
18
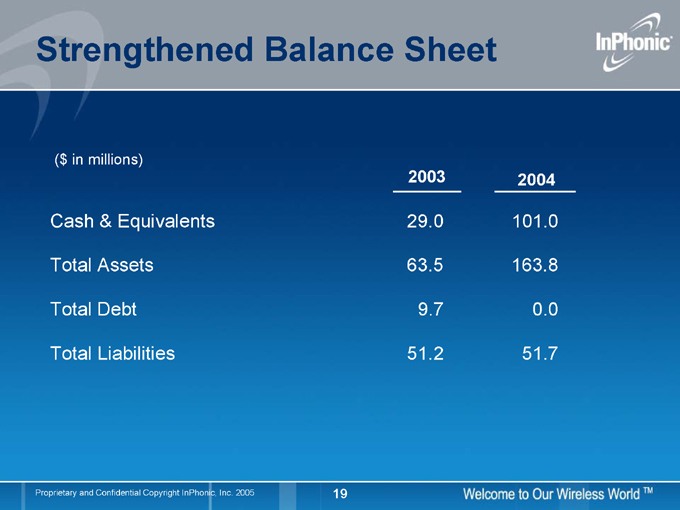
Strengthened Balance Sheet
($ in millions)
2003 2004
Cash & Equivalents 29.0 101.0
Total Assets 63.5 163.8
Total Debt 9.7 0.0
Total Liabilities 51.2 51.7
Proprietary and Confidential Copyright InPhonic, Inc. 2005
19
Questions & Answers