UNITED STATES
SECURITIES AND EXCHANGE COMMISSION
Washington, D.C. 20549
Form 10-K
(Mark One)
| x | ANNUAL REPORT PURSUANT TO SECTION 13 OR 15(d) OF THE SECURITIES EXCHANGE ACT OF 1934 |
For the fiscal year ended December 31, 2006
OR
| ¨ | TRANSITION REPORT PURSUANT TO SECTION 13 OR 15(d) OF THE SECURITIES EXCHANGE ACT OF 1934 |
For the transition period from to
Commission File Number: 000-51023
INPHONIC, INC.
(Exact name of Registrant as specified in its Charter)
| | |
| Delaware | | 52-2199384 |
(State or other jurisdiction of incorporation or organization) | | (I.R.S. employer identification number) |
| |
1010 Wisconsin Avenue, Suite 600 Washington, D.C. | | 20007 |
| (Address of principal executive offices) | | (Zip Code) |
(202) 333-0001
(Registrant’s telephone number, including area code)
Securities registered pursuant to Section 12(b) of the Act:
| | |
| Title of Each Class | | Name of Each Exchange on Which Registered |
| Common Stock, par value $0.01 per share | | NASDAQ Stock Market LLC |
Securities registered pursuant to Section 12(g) of the Act:
None
Indicate by check mark if the registrant is a well-known seasoned issuer, as defined in Rule 405 of the Securities Act. Yes ¨ Nox
Indicate by check mark if the registrant is not required to file reports pursuant to Section 13 or Section 15(d) of the Act. Yes ¨ No x
Indicate by check mark whether the registrant (1) has filed all reports required to be filed by Section 13 or 15(d) of the Securities Exchange Act of 1934 during the preceding 12 months (or for such shorter period that the registrant was required to file such reports), and (2) has been subject to such filing requirements for the past 90 days. Yes ¨ No x
Indicate by check mark if disclosure of delinquent filers pursuant to Item 405 of Regulation S-K is not contained herein and will not be contained, to the best of the registrant’s knowledge, in definitive proxy or information statements incorporated by reference in Part III of this Form 10-K or any amendment to this Form 10-K. ¨
Indicate by check mark whether the registrant is a large accelerated filer, an accelerated filer or a non-accelerated filer. See definition of “accelerated filer and large accelerated filer” in Rule 12b-2 of the Exchange Act. (Check one):
Large accelerated filer¨ Accelerated filer x Non-accelerated filer¨
Indicate by check mark whether the registrant is a shell company (as defined in Rule 12b-2 of the Act). Yes ¨ No x
As of June 30, 2006, the aggregate market value of the common stock held by non-affiliates of the registrant was approximately $117,332,977.
As of May 21, 2007, 36,964,003 shares of the registrant’s common stock were outstanding.
DOCUMENTS INCORPORATED BY REFERENCE
None.
INPHONIC, INC.
INDEX
FORM 10-K
2
PART I
This annual report on Form 10-K contains forward-looking statements, within the meaning of the Securities Exchange Act of 1934 and the Securities Act of 1933, that involve risks and uncertainties. In some cases, forward-looking statements are identified by words such as “believe,” “anticipate,” “expect,” “intend,” “plan,” “will,” “may” and similar expressions. You should not place undue reliance on these forward-looking statements, which speak only as of the date of this report. All of these forward-looking statements are based on information available to us at this time, and we assume no obligation to update any of these statements. Actual results could differ from those projected in these forward-looking statements as a result of many factors, including those identified in the section titled “Risk Factors,” “Management’s Discussion and Analysis of Financial Condition and Results of Operations” and elsewhere. We urge you to review and consider the various disclosures made by us in this report, and those detailed from time to time in our filings with the Securities and Exchange Commission, that attempt to advise you of the risks and factors that may affect our future results.
Overview
We are a leading online seller of wireless services in the United States, based upon the number of activations. For 2006, we reported revenue from continuing operations of $369.6 million and a loss from continuing operations of $63.5 million. Since we began operations in 1999, we have grown our business, expanded our services and broadened our customer base through internal growth and acquisitions. We operate our business through three business units: Wireless Activation and Services (“WAS”); Mobile Virtual Network Enabler (“MVNE”) Services; and Data Services.
WAS. We sell wireless service plans, devices and accessories and satellite television service plans through our own branded websites, which include Wirefly.com and VMCSatellite.com. We also sell services and devices to consumers through websites that we create and manage for third parties under their own brands. These third parties include online businesses, member-based organizations and associations and national retailers, whom we refer to collectively as marketers. We use our proprietary e-commerce information technology platform to activate, configure and ship wireless services and devices to customers. The WAS business unit accounted for $355.7 million or approximately 96% of our total revenue in 2006.
MVNE Services and Data Services. We offer marketers the ability to sell mobile virtual network operator (“MVNO”) services to their customers under their own brands using our e-commerce platform and operational infrastructure. Under MVNE agreements, we give marketers the ability to sell wireless voice and data services and devices. This service utilizes the same e-commerce platform, operational infrastructure and marketing relationships we have developed for our WAS segment to sell wireless services and devices, resulting in what we believe is a cost-effective means of acquiring customers. Our unified communications services, or “data services,” allow wireless carriers and us to provide customers with the ability to organize personal communications by providing access to e-mail, voicemail, faxes, contacts, scheduling, calendar and conference calling functionality through a website or telephone. The MVNE Services and Data Services business unit accounted for $13.9 million or 4% of our total revenue in 2006.
We believe our online business model connects wireless carriers, marketers and consumers of wireless services and devices more effectively and efficiently than traditional retail channels. Wireless carriers benefit from broader access to consumers who purchase wireless services and devices on the Internet, through our own branded websites, as well as through our marketing relationships with high-traffic websites. Marketers benefit by generating additional revenue from the marketing fees that we pay them for selling wireless services and devices through websites that we create and manage for them, using their brands. Marketers also benefit from our broad carrier relationships and selection of service plans and devices. Consumers benefit from competitive pricing, broad selection and the convenience of using the websites we create and manage, for purchasing wireless
3
services and devices. Through agreements we have with the five largest wireless carriers in the United States, Cingular, Sprint Nextel, T-Mobile, Verizon and Alltel, as well as with several regional wireless carriers and MVNOs, we offer consumers a selection of at least four carriers in each of the top 100 U.S. metropolitan markets. Collectively, these carriers’ networks cover 99.9% of the U.S. population.
Our proprietary e-commerce information technology platform integrates merchandising, provisioning, procurement, customer care and billing operations into a single system for the online sales of wireless services and devices. This platform, which includes a combination of internally developed and licensed technologies, has been designed to serve as a foundation for us to build upon, allowing us to offer additional products and services to maximize performance, scalability, reliability and security. For example, this platform supports both our own branded websites as well as the websites that we create and manage for third-party marketers. This allows us to manage the sale of wireless services and devices offered from wireless carriers as well as MVNO services offered by marketers under their own brands.
Industry Overview
The Internet and Online Commerce
Online shopping has grown substantially over recent years, providing businesses with a lower cost sales channel. This growth is primarily a result of the convenience, broader selection and breadth of product information available on the Internet. In addition, continued improvements in payment security and growing access to high-speed Internet connections have made online shopping increasingly efficient and attractive to consumers. According to Forrester Research, Inc., an independent research company, online retail sales will grow from $172 billion in 2005 to $329 billion in 2010, a compound annual growth rate of 14%.
Online businesses have a number of competitive advantages over traditional “bricks and mortar” businesses, including broader consumer reach, lower infrastructure costs and personalized, low-cost customer interaction. In addition, online businesses may quickly and efficiently adjust to changing consumer tastes and preferences by adjusting content, shopping interfaces, the product and service offerings and the prices of the offerings they feature on their websites. Furthermore, online businesses can more easily compile consumer data to increase opportunities for direct marketing and personalized services.
The Wireless Services Industry
Consumers increasingly understand that wireless communications provide enhanced convenience, mobility and personal safety. As a result of these factors, wireless services have achieved widespread adoption, aided in part by the increasing availability and affordability of mobile communications products. According to Ovum Limited (��Ovum”), an independent research company, the estimated number of wireless subscribers in the United States has more than doubled over the past five years, from 97.0 million subscribers in 2000 to 216.8 million in 2006, representing 77% of the U.S. population. Ovum expects that by 2010, there will be 256.0 million wireless subscribers in the U.S, representing additional growth opportunities going forward.
This future growth in wireless subscribers is expected to come from a mix of services, including traditional post-paid and pre-paid service plans and wireless subscribers who purchase handset upgrades from the same wireless carrier. Ovum expects the handset service upgrade market, which represents current wireless subscribers who commit to a new contract with their current wireless carrier instead of switching to a new carrier, to grow from 71.7 million units in 2006 to 98.8 million in 2010. According to Compete, Inc, an independent research company, these upgrade subscribers spend 27% more on their wireless devices than first-time purchasers. According to Ovum, total annual gross subscriber additions will decrease from 72.8 million in 2006 to 71.9 million in 2010. Combined, these opportunities represented 144.6 million transactions in 2006, and Ovum expects this to grow to 170.7 million transactions in 2010, a 4.3% compound annual growth rate.
4
The Opportunity
Increased competition has resulted in consolidation among wireless carriers. As a result, carriers are under pressure to reduce their costs while remaining competitive. To combat these challenges, the wireless carriers continue to turn to the Internet as a cost-effective channel for the acquisition of customers, allowing them to boost profitability and increase their return on investment. Additionally, in order to increase network utilization, carriers continue to seek out new subscribers through new product offerings, such as family shared plans and mobile content and through mobile virtual network operators.
Because of these trends, consumers are faced with an increasingly complex and constantly changing selection of wireless service plans and devices. As the number of service plans offered by wireless carriers has increased, traditional retail channels have been unable to adequately satisfy customers’ needs for real-time information regarding wireless services and devices. Retail stores typically feature wireless services and devices from only one or a limited number of wireless carriers, resulting in fewer options at any given store for consumers. As a result, consumers must either visit multiple stores or select from a limited choice of wireless offerings. In addition, traditional wireless retail stores typically offer higher wireless device prices to customers due to the costs of maintaining, managing and staffing a physical storefront. In contrast to the physical retail environment, the Internet offers consumers a number of advantages for purchasing wireless services and devices, including lower prices, broader service and device selection, convenience of comparison shopping and the ability to research available plans and devices. According to Compete, Inc., an independent research company, 80% of future wireless buyers indicated they will use the Internet to support their next wireless purchase. Almost 5 million of the prospective shoppers visiting the major carriers’ wireless retail stores every month conduct detailed research on wireless handsets or service plans.
Our Value Proposition
Value to Consumers
We offer consumers a superior shopping experience, competitive prices, broad selection and the convenience of comparing and purchasing wireless services and devices on the Internet. Key advantages for consumers include:
| | • | Superior Shopping Experience. Our websites provide consumers with access to an extensive amount of information on wireless services and devices. These websites contain user-friendly search functions and navigation tools to help consumers quickly and conveniently identify the wireless services and devices that match their selection criteria, such as monthly service cost, network coverage quality and device features. We also simplify the buying experience for consumers by allowing them to complete the transaction with an easy-to-use, one-page order form. We ship products directly to customers generally within 24 hours of order and credit approval and provide customers with updates throughout the provisioning and shipping processes. We also offer consumers the opportunity to order and test-drive their wireless phone, PDA/Smartphone or wireless PC card for 30 days, and, if they are not completely satisfied they can return the phone for another model or receive a refund. |
| | • | Competitive Pricing. We are able to offer consumers competitive pricing on wireless devices when they purchase a service plan due to the lower cost structure of our online business model. In addition, consumers also benefit from the ability to research and comparison shop for the best prices offered by the five largest wireless carriers in the U.S. and several regional carriers. |
| | • | Broad Selection. We are able to offer wireless service plans and equipment to consumers across the U.S. We have agreements with the five largest wireless carriers that provide service coverage to 99.9% of the U.S. population. In each of the top 100 U.S. metropolitan markets we offer service plans from at least four wireless carriers. Our websites also feature a broad selection of the latest wireless devices and accessories from the leading device manufacturers. |
5
| | • | Knowledgeable Customer Support. Customers can request assistance at any point in the purchase process from our customer service representatives. Our customer service representatives have access to information about the service plans offered through our carrier relationships. As a result, our customer service representatives are better able to suggest service plans that meet the customers’ requirements. |
Value to Marketers
We provide our marketers with websites, branded to their specifications, which allow them to sell wireless services and devices to consumers. Key advantages for marketers include:
| | • | Expanded Services. Our e-commerce platform enables marketers to focus on marketing and branding, while relieving them of the operational burden associated with merchandising, provisioning, procurement, customer care and billing of wireless services. |
| | • | Ability to Monetize Customers. Our online business model creates new opportunities for marketers to monetize their customers by generating revenue from the sale of wireless services and devices. Our broad selection of products and services also allows marketers to address multiple demographic segments within their customer base, thus increasing their revenue opportunities. |
Value to Wireless Carriers
We provide wireless carriers, as well as one of the leading providers of satellite television services, with new subscribers to their networks. Key advantages for these carriers include:
| | • | Growing Customer Acquisition Channel. The Internet is one of the fastest growing channels for selling wireless services and devices. We provide the wireless carriers and a satellite television provider with broader access to this channel through our own branded websites and through the private-labeled websites we create and manage for marketers. These providers also benefit from our ability to offer multiple service plan and device combinations on our websites and effectively implement marketing campaigns or special offers. |
| | • | Lower Customer Acquisition Cost. We believe that our online business model enables wireless carriers to acquire customers at a lower cost than they would incur using traditional retail channels. |
Our Strategy
Our objective is to become the leading online seller of wireless services and other communication services in the U.S. Key elements of our strategy to achieve this objective include:
Focus on the Customer Shopping Experience. We continue to refine our operations to provide a superior customer experience. We have enhanced navigation tools to help consumers quickly and conveniently identify the wireless services and devices that match their selection criteria, and have developed an online resource that gives consumers updates throughout the provisioning and shipping processes. The customer shopping experience is an important element in retaining customers and expanding the relationships we have developed with marketers who use their brands to market our products and services on their websites.
Transition to Residual Compensation Model. We continue to modify our agreements with the wireless carriers to enable us to be compensated based on the time period that a wireless subscriber remains a customer of the wireless carrier, which we refer to as residual compensation. Residual compensation agreements with the wireless carriers enable us to receive long-term recurring revenue associated with our wireless subscribers. Under these agreements with the wireless carriers, we generally receive a residual payment for each subscriber we activate for every month they pay their wireless bill. These residual payments continue for either the entire term of the subscriber’s agreement with the wireless carrier or some other pre-determined time period. As of December 31, 2006, we had residual compensation agreements with three of the five largest wireless carriers in the U.S. In early 2007, we added a fourth major wireless carrier. In addition, we have residual compensation agreements with two MVNOs and a satellite provider.
6
Increase Our Customer Base. We plan to target additional marketers in order to expand our sources of customers. We also plan to build consumer and market awareness by expanding the direct marketing of our wireless services and devices. Our plans include expanding our use of the “Powered by InPhonic” brand on the websites that we create and manage for marketers, purchasing online advertising to support our existing brands, such as Wirefly.com, VMCSatellite.com and mFly.com, and creating additional brands.
Enhance Our Wireless Carrier Relationships. As the wireless industry continues to consolidate, we continue to improve the automated interface between our e-commerce platform and the wireless carriers’ systems as well as cooperate further with wireless carriers on marketing efforts.
Sell Device Upgrades. As wireless subscribers increasingly choose to upgrade their existing devices with their current wireless service providers, we will market device upgrade services. Currently, we have agreements with two major wireless carriers to enable us to provide device upgrade services.
Cross-Sell Our Full Range of Products and Services to Existing Customers. Most of our customers initially purchase a single product or service. We increase our revenue opportunities by offering additional products and services, such as satellite television service through VMCSatellite.com, mobile content through mFly.com, wireless accessories, enhanced wireless content, device protection plans and other communications services, to these customers at the point of sale or through follow-up communications such as opt-in emails, outbound calls and direct mail.
Develop New Products and Services. We believe that much of the future subscriber growth within the wireless services industry will be driven by consumer demands that are not served by the products and services currently offered by the wireless carriers. We have begun to market new products and services, including mobile content, device protection, accessories and other add-on services to address additional consumer demand. In 2007, we plan to explore opportunities to develop and launch new products, services and marketing opportunities.
Our Services
Wireless Activation and Services
We offer customers the ability to purchase wireless services, including satellite television, and devices directly from websites that we operate under our own brands, such as Wirefly.com and VMCSatellite.com. We use our proprietary e-commerce platform to activate, configure and ship wireless services and devices to customers.
We also sell wireless service plans and devices through websites that we create and manage for marketers. These private-labeled websites allow marketers to leverage their brands to sell wireless products and services to their customers. For each marketer for which we create and manage a website, we use that marketer’s brand on the website and throughout the sales and customer support process. To acquire customers through marketer-branded websites, we leverage the same e-commerce platform, operational infrastructure and wireless carrier relationships that we use for our own branded websites.
MVNE Services and Data Services
We utilize our e-commerce platform and operational infrastructure to extend our MVNE capabilities to marketers who want to offer branded wireless services to their customers through an MVNO without having to own or operate a wireless network or operational infrastructure. The MVNE services we offer include:
| | • | merchandising, which includes creating, pricing and branding the voice and data service plans to be marketed to potential subscribers and the systems to support sales via e-commerce sites, call centers and retail stores; |
7
| | • | provisioning, which includes determining subscriber credit-worthiness and service activation for both data and voice services; |
| | • | procurement, which includes the purchasing, order processing, programming, packaging and delivery of wireless devices to subscribers and managing returns; |
| | • | customer care, which includes pre-sale and post-sale customer service using Internet and Interactive Voice Response (IVR) self-service technologies; |
| | • | billing for voice and data services, which may also include collections; and |
| | • | mobile data applications including Wireless Application Protocol (WAP) services, Short Message Service (SMS) and Multi-media Messaging Service (MMS) messaging, and Over the Air (OTA) data service activation and content delivery such as ring tones and graphics. |
Our unified communications service allows customers to organize and access email, voicemail, faxes, contacts, scheduling, calendar and conference calling functionality through both a website and a telephone.
Relationships with Wireless Carriers
We sell our customers wireless service plans of the five largest and several regional carriers in the U.S. Collectively, these carriers’ networks cover 99.9% of the U.S. population. Through our agreements with these carriers, we offer consumers a selection of wireless subscription plans from at least four carriers in each of the top 100 U.S. metropolitan markets. We also purchase wireless devices directly from these carriers and their designated distributors for sale to customers. We sell devices in conjunction with wireless service plans from the leading wireless device manufacturers including Audiovox, Kyocera, LG Electronics, Motorola, Nokia, palmOne, Research in Motion (RIM), Samsung, Sanyo and Sony Ericsson.
We provide wireless carriers with a cost-effective online channel to acquire subscribers for their service plans. The wireless carriers pay us commissions and bonuses for activating wireless subscribers onto their networks. We also receive additional financial benefits from the wireless carriers through market development funds and residual compensation generally paid on a monthly basis during the time period a subscriber remains a customer of the wireless carrier, wireless device discounts and other marketing incentives. For 2006, revenue from Cingular, T-Mobile and Sprint Nextel represented 36%, 17% and 15% of our total revenue, respectively. For 2004 and 2005, revenue from our top three wireless carriers represented 76% and 67% of our total revenue, respectively.
Marketing
We have developed a marketing strategy designed to use our own branded websites as well as to use our marketers’ brands to generate sales through their private-labeled websites that we create and manage. Our marketing and advertising efforts include online and offline initiatives, which primarily consist of the following:
| | • | Brand Development. We continue to invest in the brands we own, such as Wirefly.com, VMCSatellite.com and mFly.com, in order to build brand awareness and attract new and repeat customers. |
| | • | Online Search and Advertising. We utilize online search engine advertising and targeted online advertising on highly-trafficked websites to acquire customers. We also utilize online marketing partners to generate customer leads to our own branded websites and we pay these marketers fees for successful customer leads. |
| | • | Private-Labeled Websites. We create and manage websites for online businesses, member-based organizations and associations and national retailers to sell wireless products and services on their websites using their own brands. We either share a portion of revenue with marketers or pay these marketers fees for wireless service plans and devices sold on their websites. |
8
| | • | Direct Marketing. We utilize direct marketing programs to reach additional consumer segments for our products and services. These marketing programs include permission-based email and call transfer programs. |
| | • | Affiliate Program. We also acquire customers through an affiliate program that extends the reach of our advertising, drawing customers from a variety of websites. By joining our affiliate program, operators of other websites earn a fee for each wireless device and service plan sold through their website. We utilize a third-party vendor to manage the affiliate program. |
Operations and Technology
Our operations leverage a common, proprietary e-commerce information technology platform, which we have built using a combination of internally developed and licensed technologies. Our e-commerce platform integrates our merchandising, provisioning, procurement, customer care and billing operations into a single system for the online sale of wireless services and devices. Our e-commerce platform has been designed to serve as a foundation for us to build and offer additional products and services and to maximize performance, scalability, reliability and security.
Merchandising
We sell wireless services and devices through our own branded websites as well as through private-labeled websites that we create and manage for marketers. Since we manage all these websites using the same e-commerce platform, we can update device and service plan pricing information across all the websites in real time. Additionally, we can tailor the wireless service and device offerings presented on any particular website in order to better target each marketer’s customer base. The websites we create and manage contain user-friendly search functions and navigation tools to help customers quickly and conveniently identify the wireless service plans and devices that match their selection criteria.
Provisioning
We process orders using a combination of our own proprietary software and commercially available software that we license from third parties. We believe that one of our key competitive advantages is our automated order processing system. Orders from customers are delivered in a common data format that permits us to exchange data with wireless carriers through our automated credit risk assessment and activation interfaces. We have customized these interfaces to integrate with each of our wireless carriers’ networks for a fast, seamless exchange of data. Once the customer’s risk profile has been determined, the order status management process system either activates the customer on the wireless carrier of their choice or automatically suggests an alternative service plan from another wireless carrier for which the customer is eligible.
We have designed systems we believe to be secure to protect our corporate data and the information we collect from consumers. Our websites operate on hardware and software co-located at a Tier-1 hosting facility offering redundant and reliable network connections, power, security and other essential services. To minimize downtime, we manage and monitor our websites 24 hours a day. Our operations center located in our Largo, Maryland facility has back-up power, including batteries and diesel-fueled generators. We have a disaster recovery plan that documents the necessary steps to recover critical systems if a disaster were to occur.
Procurement
All customer orders are fulfilled at our operations center located in Largo, Maryland. When an order is approved for service by the wireless carrier, our automated order processing system assigns a wireless device to the order, activates the selected service plan and configures the device to the customer’s specifications. We ship orders generally within 24 hours of approval by the wireless carrier.
9
We track orders in real-time throughout the procurement process to enable us to maintain the appropriate levels of inventory. We use rigorous quality control processes and dedicated quality assurance personnel to minimize errors.
Customer Care and Billing
We are focused on providing a high quality customer shopping experience. As part of these efforts, we monitor and track interactions with each customer through our proprietary customer relationship management system. We deliver customer care through self-service websites, call center representatives, email correspondence and our interactive voice response system.
Our easy-to-navigate, self-service websites enable our customers to check order, rebate, return and exchange status in addition to reviewing service plan information. We operate call center facilities in Largo, Maryland and Reston, Virginia offering customer service, direct sales support and technical assistance by telephone or email. We have also entered into outsourcing agreements with vendors in India to provide additional support services. Using our call management system, our call center representatives can respond to inbound calls using scripts tailored to each marketer’s specifications. To further improve efficiency, we employ an integrated voice response system to provide self-service capabilities to consumers for pre-sale and post-sale activities.
Real-Time Measurement and Reporting Systems
We have developed software applications to monitor the effectiveness of our marketing campaigns on a real-time basis. These applications produce reports that we share with marketers. These reports provide us with the number of unique visitors to our marketers’ websites, numbers of orders taken, number of orders approved or pending approval and orders shipped. These reports allow us to measure the effectiveness of our marketing efforts and respond quickly to changes in market demand.
Competition
The wireless services industry continues to evolve rapidly and, despite consolidation among carriers, remains highly fragmented and competitive. We believe we compete on the basis of selection of wireless carriers; devices and service plans; convenience; price; customer service and experience; network coverage; and website features and functionality. We believe we compete favorably on all of these terms.
Companies that compete with our wireless activation and services business include:
| | • | wireless carriers, including those from which we procure services and devices, which sell their wireless services and devices to consumers through their own websites, traditional retail operations and direct sales forces; |
| | • | online distributors that sell wireless services and devices for a limited number of wireless carriers to consumers through their own websites, such as Amazon.com, Inc.; and |
| | • | mass market retailers that sell wireless services and devices to consumers from their retail store locations, such as Radio Shack, Best Buy, Circuit City and Wal-Mart. |
We believe we compete favorably against others in the wireless activation and services business because we have agreements with the major wireless carriers and device manufacturers. These agreements enable us to provide consumers with a comprehensive selection of wireless services and devices that our competitors do not provide.
Companies that currently or potentially compete with our private-labeled MVNE business include:
| | • | companies that provide billing and customer care for MVNO services that may potentially compete with us, if we begin to provide support for branded billing and customer call solutions for companies that sell private-labeled wireless services to their customer base, such as Amdocs, Comverse, Convergys, VeriSign and Visage; and |
| | • | back-office systems providers such as Accenture and IBM. |
10
We believe our ability to provide a single vendor solution for MVNE services that includes wireless carrier network integration, mobile data application billing, customer care and distribution services compares favorably to our competitors.
In our data services business, we compete against a variety of companies, including CallWave and j2 Global Communications and Parus Holdings. Our unified communications service bundles voicemail, email and fax services with additional services, including our wireless activation services. Our competitors provide voicemail, email and fax services, but we believe our ability to bundle these data services with additional services enables us to compete favorably because we can present an expanded service offering to potential customers.
Many of our existing and potential competitors have substantially greater financial, technical and marketing resources than we do. Additionally, many of these companies have greater name recognition and more established relationships in many of our market segments. These competitors may be able to adopt more aggressive pricing policies and offer customers more attractive terms than we can. We may face increasing price pressure from the wireless carriers. In addition, current and potential competitors have established or may establish cooperative relationships among themselves or with third parties to compete more effectively.
Intellectual Property Rights
Our ability to compete and continue to provide technological innovation is substantially dependent upon our technology. We rely on general intellectual property law and contractual restrictions and to a limited extent, copyrights and patents to protect our proprietary rights and technology. These contractual restrictions include confidentiality agreements, invention assignment agreements and nondisclosure agreements with employees, contractors, suppliers and marketers. In addition, we pursue the registration of our trademarks and service marks in the United States and certain other countries. In the United States, we have registered “InPhonic,” “Powered by InPhonic,” “Wirefly,” “Welcome to our Wireless World” and other service marks. We also have unregistered copyrights with respect to images and information set forth on our website and the computer code incorporated into our website. To date, we have obtained registration of four U.S. patents.
We cannot assure you that any of our service marks, patents or copyrights will not be challenged or invalidated. Despite the protection of general intellectual property law and our contractual restrictions, steps we have taken to protect our intellectual property may not prove sufficient to prevent misappropriation of our technology or to deter third-parties from copying or otherwise obtaining and using our intellectual property without our authorization.
Government Regulation
We are not currently subject to direct Federal, state or local government regulation, other than regulations that apply to businesses generally. The wireless network carriers we contract with are subject to regulation by the Federal Communications Commission, or FCC. Changes in FCC regulations could affect the availability of wireless coverage these wireless network carriers are willing or able to sell. Also, changes in these regulations could create uncertainty in the marketplace that could reduce demand for our services or increase the cost of doing business as a result of costs of litigation or increased service delivery cost or could in some other manner have a material adverse effect on our business, financial condition or results of operations.
Any new legislation or regulation, or the application of laws or regulations from jurisdictions whose laws do not currently apply to our business, could have an adverse effect on our business.
Employees
As of April 30, 2007, we had a total of 551 employees. None of our employees is covered by a collective bargaining agreement. We believe our relations with our employees are good.
11
ITEM 1A. RISK FACTORS
There are a number of important factors that could cause our actual results to differ materially from those that are indicated by forward-looking statements. These factors include, without limitation, those listed below and elsewhere in this Annual Report on Form 10-K.
Risks Related to Our Business
We have historically incurred significant losses and may not be profitable in the future.
We have experienced significant net losses each year since our inception in 1999. For the year ended December 31, 2006 we had net losses of $63.7 million. As of December 31, 2006, we had an accumulated deficit of $228.4 million. We may continue to incur net losses, and we cannot assure you that we will be profitable in future periods. We may not be able to adequately control costs and expenses or achieve or maintain adequate operating margins. Our financial results may also be impacted by stock-based compensation charges and possible limitations on the amount of net operating loss carryforwards that we can utilize annually in the future to offset any taxable income. Our ability to achieve and sustain profitability will depend on our ability to generate and sustain substantially higher revenue while maintaining reasonable cost and expense levels. If we fail to generate sufficient revenue or achieve profitability, we will continue to incur significant losses. We may then be forced to reduce operating expenses by taking actions not contemplated in our business plan, such as discontinuing sales of certain of our wireless services and devices, curtailing our marketing efforts or reducing the size of our workforce.
Many of our expenses, such as compensation for employees and lease payments for facilities and equipment, are relatively fixed. We base these expense levels, in part, on our expectations of future revenue. A softening in demand for our product and service offerings, whether caused by changes in consumer spending, consumer preferences, weakness in the U.S. or global economies or other factors, may result in decreased revenue, significant changes in our operating results from period to period and may cause our net losses to increase.
We expect our financial results to fluctuate, which may lead to volatility in our stock price.
Our revenue and operating results may vary significantly from period to period due to a number of factors, including:
| | • | the timing of introduction of popular devices by mobile phone manufacturers and our ability to accurately forecast and procure an adequate supply of such devices; |
| | • | timing of bonuses paid to us by wireless carriers; |
| | • | | collectibility of our accounts receivable; |
| | • | seasonal fluctuations in both Internet usage and purchases of wireless services and devices; |
| | • | our ability to attract visitors to our websites and our ability to convert those visitors into customers; |
| | • | economic conditions specific to online commerce and the wireless communications industry; |
| | • | our ability to retain existing customers; |
| | • | delays in market acceptance or adoption by consumers of our services, including our MVNE services; |
| | • | delays in our development and offering of new wireless services and devices; |
| | • | changes in our use of sales and distribution channels; |
| | • | our ability to obtain wireless devices at competitive prices; |
12
| | • | our ability to manage our activation, delivery and procurement operations and their related costs; |
| | • | the amount of our marketing and other advertising costs; |
| | • | our or our competitors’ pricing and marketing strategies; |
| | • | our competitors’ introduction of new or enhanced products and services; |
| | • | the extent to which overall Internet use is affected by spyware, viruses, and “phishing,” spoofing and other spam emails directed at Internet users, viruses and “denial of service” attacks directed at Internet companies and service providers, and other events; and |
| | • | the amount and timing of operating costs relating to expansion of our operations. |
If we are unable to maintain strong relationships with wireless carriers, our business would be adversely affected.
We depend upon a small number of wireless carriers for a substantial portion of our revenue and the loss of any one of these relationships could cause our revenue to decline substantially. In addition, the increasing consolidation in the wireless industry, as evidenced by Cingular’s acquisition of AT&T Wireless and Sprint’s merger with Nextel, has caused the number of wireless carriers to decline and could result in further revenue and pricing pressure. For fiscal years 2006 and 2005, revenue from Cingular, T-Mobile and Sprint Nextel each represented greater than 10% of our total revenue and an aggregate of 68% and 67%, respectively. Our wireless carriers could terminate their agreements with us without penalty and with little notice. Our agreements with these carriers are non-exclusive, and they have entered into similar agreements with our competitors, which may be on more favorable terms. Our revenue may decline if:
| | • | one or more of the wireless carriers terminates its agreement with us or we are unable to negotiate extensions of these agreements on acceptable terms; or |
| | • | there is a downturn in the business of any of these wireless carriers; or |
| | • | there is continued significant consolidation in the wireless services industry. |
In addition, if the wireless carriers were to discontinue allowing us to sell and activate wireless service plans on their networks and instead were to provide these activation services exclusively themselves, this would have a significant adverse effect on our revenue.
At December 31, 2006 and 2005, the three wireless carriers accounted for approximately 69% and 74% of our total accounts receivable, net of deactivation reserves. If we are unable to collect amounts due from these and the other wireless carriers, our business could be adversely affected. Collection of our accounts receivable is critical as such cash is a key source of our liquidity.
The restatements of our consolidated financial statements may subject us to actions or additional litigation which could have an adverse effect on our business, results of operations, financial condition and liquidity.
We have recently restated our unaudited financial statements for the quarterly periods ended March 31, 2006, June 30, 2006 and September 30, 2006 each as filed on Form 10-Q as well as the unaudited financial results for the quarter and year-ended December 31, 2006 included in the Company’s earnings release issued on February 22, 2007. These restatements may result in civil litigation or other actions which could require us to pay fines or other penalties or damages and could have an adverse effect on our business, results of operations, financial condition and liquidity. The restatements may also result in negative publicity and we may lose or fail to attract and retain key customers, employees and management personnel as a result of these matters.
13
Certain consequences of our late filing of our Annual Report on Form 10-K for the 2006 fiscal year and our Quarterly Report in Form 10-Q for the fiscal quarter-ended March 31, 2007 under the federal securities laws may adversely affect our financial condition and results of operations, including our ability to raise capital.
Our failure to file timely our Annual Report on Form 10-K for the 2006 fiscal year and our Quarterly Report on Form 10-Q for the fiscal quarter-ended March 31, 2007 may adversely affect our ability to access the capital markets. We are ineligible to use a “short-form” registration that allows us to incorporate by reference future reports on Form 10-K, Form 10-Q and other SEC reports into our registration statements, or shelf registration until we have filed all of our periodic reports in a timely manner for a period of twelve months. As a result, any attempt to access the capital markets could be more expensive or be subject to delays compared to if we were able to use a short-from registration.
Because of the delayed filing of our periodic reports, we face delisting from NASDAQ which would adversely affect the trading price of our common stock.
As a result of the restatement and the delayed filing of our periodic reports with the SEC, on May 14, 2007, we received a NASDAQ staff determination letter indicating that we had failed to comply with the filing requirement for continued listing set forth in NASDAQ Marketplace Rule 4310(c)(14) due to our failure to timely file our Form 10-Q for the period ended March 31, 2007, and that our securities are, therefore, subject to delisting from the Nasdaq Global Market. We previously received and announced a NASDAQ staff determination letter with respect to our failure to timely file this Form 10-K for the fiscal year ended December 31, 2006. We requested and subsequently attended a hearing before the NASDAQ Listing Qualifications Panel on May 24, 2007 to appeal both staff determinations and presented a plan to cure both filing deficiencies and regain compliance. The filing of this Annual Report on Form 10-K is part of that plan of compliance. Both Nasdaq delisting actions have been automatically stayed pending the Nasdaq Panel’s decision, and our stock will continue to be listed on the Nasdaq Global Market until the Panel issues its decision and during any extension that is allowed by the Panel.
If the Nasdaq Panel does not grant our request for an extension and continued listing, the extension is not for the duration we requested, or we are unable to fulfill the plan to regain compliance or otherwise meet or maintain compliance with all of the NASDAQ listing requirements, our securities will be delisted from the NASDAQ Global Market. If we are delisted, we may apply for listing on another exchange, however, there is no assurance that we will meet the requirements for initial listing or maintain compliance with the continued listing requirements of such an exchange. Delisting from the Nasdaq Global Market would adversely affect the trading price of our common stock, significantly limit the liquidity of our common stock and impair our ability to raise additional funds.
Our internal control and procedures for financial reporting may not ensure that our public filings include timely and reliable financial information.
As discussed in Item 9A, Controls and Procedures, we identified and reported to our Audit Committee and independent registered public accounting firm six material weaknesses in our internal control over financial reporting, as of December 31, 2006.
These material weaknesses included the following:
| | • | | We did not maintain sufficient staffing of operational and financial resources; |
| | • | | We did not always effectively communicate information to our finance department; |
| | • | | We did not maintain effective controls over the recordation, accuracy and completeness of activations and services revenue and related accounts receivable; |
| | • | | We did not maintain effective controls over the determination and accuracy of equipment revenue and related accounts receivable; |
14
| | • | | We did not maintain effective controls over the accuracy and completeness of consumer product rebate liabilities; and |
| | • | | We did not maintain effective controls over the accuracy and completeness of costs of goods sold and amounts due from vendors. |
As a result of these material weaknesses, we determined that our internal control over financial reporting was not effective as of December 31, 2006. These material weaknesses resulted in adjustments to our revenue, accounts receivable, inventories and cost of sales that cause us to restate our unaudited financial statements for the quarterly periods ended March 31, 2006, June 30, 2006 and September 30, 2006 each as filed on Form 10-Q as well as the unaudited financial results for the quarter and year-ended December 31, 2006 included in the Company’s earnings release issued on February 22, 2007.
The effectiveness of our controls and procedures could be limited by a variety of factors, and the remedial measures that we adopted in response to the weaknesses identified may not be successful to prevent similar events from recurring. These factors could include the following:
| | • | | Faulty human judgment and simple error, omission or mistake; |
| | • | | Fraudulent action of an individual or collusion of two or more people; |
| | • | | Inappropriate override of procedures; and |
| | • | | The possibility that our enhanced controls and procedures may still not be adequate to assure the timely and accurate preparation of information and the timely filing of our periodic reports with the SEC. |
A failure to successfully implement and maintain effective internal control over financial reporting, including any ineffectiveness of the remedial measures we have implemented to address the material weaknesses in internal control over financial reporting, could result in a material misstatement of our financial statements that would not be prevented or detected or otherwise cause us to fail to meet our financial reporting obligations. This, in turn, could result in a loss of investor confidence in the accuracy and completeness of our financial reports, which could have an adverse effect on our stock price.
Ongoing consolidation among wireless carriers could result in revenue and pricing pressure and adversely impact our results of operations.
In recent years, there has been a trend in the wireless industry toward consolidation of wireless carriers. Ongoing consolidation among the wireless carriers would reduce the number of companies whose wireless services we offer, which could adversely affect our results of operations. We rely on the leading wireless carriers for a substantial portion of our revenue, and we expect this to continue for the foreseeable future. We may be subject to pricing pressures that may result from a further consolidation among wireless carriers, which could have an adverse effect on our operations. If consolidation continues, the commissions and bonuses paid to us by wireless carriers could decrease or the prices charged to us for the supply of wireless devices could increase, resulting in a decrease in our gross margin.
A failure to continue to improve our customer experience could adversely affect our operating results.
We operate in a very competitive environment and we believe that maintaining high overall customer satisfaction is a critical part of our ongoing efforts to promote the use of our own branded websites, as well as the private-labeled websites that we create and manage for our marketers, and to improve our operating results. We have had certain problems with our customer support operations and in fulfillment of orders and experienced some customer satisfaction issues related to rebates. To date, these problems have resulted in several lawsuits and federal and state investigations. If the efforts we have undertaken to improve our customer experience are unsuccessful, we could be subject to additional customer complaints, litigation, and investigations by state and
15
federal regulatory authorities, which could be costly, could divert the attention of our management from our core business and could damage our reputation. If these issues are not resolved, our revenues and results of operations could be adversely affected.
In the event we do not meet our financial or affirmative covenants under our term loan, we cannot ensure the receipt of a waiver of or extension of time to comply with our covenants
We have recently had to request waivers and or extensions of time to comply with the financial and affirmative covenants under our term loan. In the event that we do not meet the covenants under our term loan, we cannot ensure that our lending group will provide additional waivers or extensions in the future.
A decrease in the growth rate of our wireless service activations could adversely affect our operating results.
A substantial portion of our revenue consists of commissions we earn from the wireless carriers for the activation of new customer accounts. We may also receive bonuses for meeting volume and other performance based targets. If the growth rate in the number of new activations declines or the customer churn rates increase, we may not earn these additional bonuses and our revenue could decline in the future.
We may require additional cash to upgrade and expand our operations, which may not be available on terms acceptable to us, or at all.
Since our inception, our operating and investing activities have used more cash than they have generated. We expect our uses of cash over the next 12 months to include funding our operations, expanding our customer base, maintaining and enhancing our e-commerce platform and focusing on customer service. As of December 31, 2006, we had cash and cash equivalents of $90.0 million, including borrowings under our term loan of $75.0 million. While we believe that our current cash and cash equivalents, short-term investments, and amounts available under our term loan and trade credit available from wireless carriers and handset manufacturers will be sufficient to fund our working capital and capital expenditures through the foreseeable future, our revenue may not meet our expectations, we may be unable to control costs or we may incur additional expenses, including capital expenditures. In addition, for the 2006 fiscal year we entered into multiple amendments of our credit facility to extend the required date of delivery of audited financial statements for the year-ended December 31, 2006 to May 31, 2007. These amendments when applicable, also extended the required date for the delivery of financial statements for the quarter-ended March 31, 2007 to June 15, 2007. Although we have been able to obtain an extension of the period for compliance with this covenant, there is no assurance that we will be in compliance with our covenants in the future, and if we are not in compliance, that our lenders will agree to amend them. To remain competitive, we must continue to use cash to enhance and improve the functionality and features of our e-commerce platform and the websites we create and manage. If competitors introduce new services embodying new technologies, or if new industry standards and practices emerge, we may have to spend resources on the purchase or development of new functionalities or technologies. If we incur additional expenses or experience a revenue shortfall, our current resources may not be sufficient. We may then find it necessary to obtain additional financing. In the event that additional financing is required, we may not be able to raise it on terms acceptable to us, if at all.
The market for our services is becoming increasingly competitive with the emergence of additional retail and online distributors of wireless services and devices, which could adversely affect our business.
We face substantial competition in the wireless services industry. We expect competition to intensify as a result of the entrance of new competitors and the development of new technologies, products and services. We compete with wireless carriers’ retail stores and online websites, as well as other retail stores and online businesses that provide similar products and services in competition with us. All of our agreements with wireless carriers and wireless device suppliers are non-exclusive, and these parties may provide the same or similar services and devices to our competitors on terms more favorable than ours. Due to the low barriers to entry in
16
this industry, with sufficient time and capital, it would be possible for additional competitors to replicate our services.
Many of our existing and potential competitors have substantially greater financial, technical and marketing resources than we do. Additionally, many of these companies have greater name recognition and more established relationships in many of our market segments. These competitors may be able to adopt more aggressive pricing policies and offer customers more attractive terms than we can. We may face increasing price pressure from the wireless carriers. In addition, current and potential competitors have established, or may establish, cooperative relationships among themselves or with third parties to compete more effectively.
Increasing costs of online advertising and or misjudgments in making advance commitments to purchase online advertising could have an adverse affect on our financial results.
Online advertising, the cost of which continues to increase, composes a significant portion of our marketing expenses. If the effectiveness of our online advertising does not keep pace with the increased costs, our financial results could be adversely affected. In addition, in order to secure more favorable terms or advertising placement, we sometimes make significant advanced financial commitments for advertising purchases based upon our anticipated needs. If our actual needs do not match such financial commitments, our results could be adversely affected.
We depend on Internet search engines to attract a substantial portion of the customers who use our websites, and losing these customers would adversely affect our revenue and financial results.
Many consumers access our services by clicking through on search results displayed by Internet search engines. Internet search engines typically provide two types of search results, algorithmic listings and purchased listings. Algorithmic listings cannot be purchased, and instead are determined and displayed solely by a set of formulas designed by the search engine. Purchased listings can be purchased by advertisers in order to attract users to their websites. We rely on both algorithmic and purchased listings to attract and direct consumers to our websites. Search engines revise their algorithms from time to time in an attempt to optimize their search results. If one or more search engines which we rely on for algorithmic listings modifies its algorithms, resulting in fewer consumers clicking through to our websites, we would need to increase our marketing expenditures or we would experience a reduction in our revenue, which would adversely affect our financial results. If one or more of the search engines which we rely on for purchased listings modifies or terminates its relationship with us, our expenses could rise and our financial results may suffer.
Any unanticipated increase in our rate of deactivation of active accounts could result in a decrease in our revenue.
Under our agreements with wireless carriers, commissions are not earned if the customer’s service is deactivated with the carrier before a pre-determined period of time, usually between 90 and 180 calendar days. We maintain a reserve to cover the commissions expected to be lost through deactivations based upon our historical experience. We monitor a number of factors in determining this reserve. For example, our experience has been that customers who participate in a promotion that allows them to obtain a phone and activate an account with no up-front payment have a higher deactivation rate than customers who pay amounts in advance. If the rate of our deactivations increases in excess of our historical experience, we would have to increase our deactivation reserve, which, in turn, would cause our revenue to decline. Further, if our estimates vary materially for a future period or periods in relation to revenue and/or net income so that we conclude that our method of determining estimates is not sufficiently accurate, we may be required to change our method of accounting for these estimates. While a change in accounting for deactivations would have no impact on our cash flow, any such change may negatively impact our net income for particular periods and cause a decline in stock price. An increase in our deactivation rate could also cause carriers to modify the commission terms with us or even terminate our agreements.
17
If we do not continue to attract customers through our existing online marketing programs, our revenue may be affected adversely and our marketing expenses may increase.
We obtain a large portion of our customers through incentive-based online marketing programs. We engage third parties to acquire customers through different marketing initiatives, including the use of websites that we create and manage under our marketers’ brands. We also use online advertising and other forms of direct marketing. Our marketers may not continue to participate in our marketing programs if the programs do not provide sufficient value, our competitors offer better terms, the third parties elect to provide these products and services directly or the market for incentive-based advertising decreases. If our marketers do not market our services to their customers, our revenues will not grow as anticipated and our marketing expenses may increase.
We face inventory risk.
We are exposed to inventory risks as a result of seasonality, new product launches by equipment manufacturers, rapid changes in product cycles and changes in consumer tastes with respect to wireless devices. In order to be successful, we must accurately predict these trends and avoid overstocking or under-stocking wireless devices. Demand for wireless devices, however, can change significantly between the time we order the wireless devices and the date we sell these to customers. As a result, we may have too many or too few of certain inventory items, which may affect our revenues and ability to meet customer demands.
The acquisition of certain types of inventory, or inventory from certain sources, may require significant lead-time and prepayment, and such inventory may not be returnable. We carry a broad selection of wireless devices and maintain significant inventory levels of certain popular devices and we may be unable to sell products in sufficient quantities or during the relevant selling seasons.
Any one of the inventory risk factors set forth above may adversely affect our operating results.
Announcements and delays relating to the release of new wireless devices could adversely affect our revenue.
From time to time, the wireless industry is significantly affected by the introduction of new wireless devices that quickly capture a large share of the market. Announcements of new devices can result in customers deferring purchase decisions until such devices are available. Likewise, our ability to have access to a sufficient supply of such devices when available is important in order for us to meet customer demand. If customers delay purchases due to the announcement of new products or if we do not have access to a sufficient supply of new products to meet demand, it could have an adverse effect on our revenues and results of operations.
An interruption in the supply of wireless devices could hinder our ability to fulfill customer orders and cause a decline in our revenue.
We rely on wireless carriers and wireless device suppliers in fulfilling customer orders for wireless devices. These suppliers may experience difficulty in providing us sufficient wireless devices to meet our needs or they may terminate or fail to renew contracts for supplying us these devices on terms we find acceptable. Our agreements with these suppliers are non-exclusive, and these suppliers have entered into similar agreements with our competitors, which may be on more favorable terms. From time to time, we may experience delays in receiving shipments of wireless devices from one or more of the wireless device suppliers, thereby preventing us from offering a wireless device until the shipment is received. Any significant interruption in the supply of any of these devices could hinder our ability to fulfill customer orders and result in the loss of customers, causing a decline in our revenues.
If our distribution operations are interrupted for any significant period of time, our business and results of operations would be substantially harmed.
Our success depends on our ability to successfully receive and fulfill orders and to promptly deliver our products to our customers. Our packaging, labeling and product return processes are performed both internally
18
through our own distribution operations and to a lesser extent, by a third party. Our distribution operations are located in a single facility that is susceptible to damage or interruption from human error, fire, flood, power loss, telecommunications failure, theft, terrorist attacks and similar events. In 2003, we experienced a one-day interruption in our distribution operations due to Hurricane Isabel. Any future interruptions in our distribution center operations for a significant period of time could damage our reputation and substantially harm our business and results of operations.
Interruptions or delays in service from third parties could impair our service offerings.
We rely on third parties for both our primary network operations hosting center and our back-up facility. Any disruption of our access to Internet service could result in delays in our ability to receive information or transact business. We also rely on third-party software, suppliers and wireless carriers to process applications for credit approval and to bill our customers. If we are unable to process credit applications in a timely manner or if our billing software fails and we are unable to bill customers on a timely basis, our business will be affected adversely. While we do have backup systems for certain aspects of our operations, our systems are not fully redundant and our disaster recovery planning may not be sufficient for all eventualities. From time to time we have experienced interruptions in these or other third-party services and if such disruptions were to occur in the future or their performances were to deteriorate, it could impair the quality of our services. If our arrangement with any of these third parties was terminated or if a third party ceased operations, discontinued business or altered the terms on which it does business with us, we might not be able to find an alternative provider on a timely basis or on reasonable terms, which would adversely affect our operating results.
We have grown rapidly, and we must manage additional growth and the demands on our resources and personnel in order to be successful.
We began operations in October 1999 and have grown rapidly since that time. Our growth has resulted, and any future growth will result, in increased responsibility for our management and increased demands on our resources. Our business strategy is based on the assumption that we will continue to retain qualified personnel who can expand our customer base and continue to develop and deliver innovative customer-driven solutions. We must continue to enhance and expand our business processes, information systems and operations to accommodate this growth. To manage future growth, we will need to:
| | • | implement additional and improved management information systems; |
| | • | retain qualified personnel to manage our operating, administrative, financial and accounting systems; |
| | • | maintain and expand our wireless service and device activation capacity; |
| | • | continue to train, motivate, manage and retain our existing employees and attract and integrate new employees; |
| | • | expand our sales force to sell our new and existing offerings; and |
| | • | maintain close coordination among our executive, information technology, accounting and finance, sales and operations organizations. |
If we are unable to manage future expansion, our ability to provide a high quality customer experience could be harmed, which would damage our reputation and substantially harm our business and results of operations.
If we do not adequately protect our intellectual property, others could copy aspects of our services and operational technology, which could force us to become involved in expensive and time-consuming litigation.
Our ability to compete and continue to provide technological innovation is substantially dependent upon our technology. We rely on a combination of intellectual property laws and confidentiality agreements to protect our technology. We generally enter into confidentiality and nondisclosure agreements with our employees, consultants and prospective and existing marketers. In addition, we seek to control access to our proprietary
19
information. Despite our efforts to protect our intellectual property, unauthorized parties may attempt to copy or otherwise obtain and use our services or technology. Although we are not aware of any unauthorized use of our intellectual property to date, effectively policing against the unauthorized use of our technology is time consuming and costly, and we cannot assure you that the steps taken by us will prevent misappropriation of our technology. Our failure to adequately protect our intellectual property rights could harm our business by making it easier for others to duplicate our services.
If we are unable to maintain the integration of our services with the wireless carriers’ existing credit and activation systems, we will be unable to process orders in a timely manner and our business may suffer.
To activate wireless services for customers, we rely on access to the wireless carriers’ proprietary credit and activation systems through direct data, online and telephone interfaces. If, as a result of technology enhancements or upgrades of these systems by the wireless carriers, we are unable to integrate our services with these systems, we could be required to redesign or upgrade our information systems or software which could be costly and negatively affect our operating results. If we are unable to gain access to these systems, we would be unable to process orders, the wireless carriers could terminate their underlying agreements with us, and our business may suffer.
Our failure to protect our customers’ confidential information and our network against security breaches could damage our reputation and substantially harm our business and results of operations.
A significant barrier to online commerce is concern regarding the secure transmission of confidential information over public networks. Currently, a majority of our wireless service activations and device sales are billed to our customers’ credit card accounts directly. We rely on encryption and authentication technology licensed from third parties to securely transmit confidential information, including credit card numbers. Advances in computing capabilities, new discoveries in the field of cryptography or other developments may result in a compromise or breach of the technology used by us to protect customer transaction data. Although we are not aware of any security breaches, any compromise of our security could damage our reputation and expose us to a risk of loss or litigation and possible liability which would substantially harm our business and results of operations. Although we carry general liability insurance, our insurance may not cover potential claims of this type or may not be adequate to cover all costs incurred in defense of potential claims or to indemnify us for all liability that may be imposed. In addition, anyone who is able to circumvent our security measures could misappropriate proprietary information or cause interruptions in our operations. We may need to expend significant resources to protect against security breaches or to address problems caused by breaches.
If the technology we use infringes upon the proprietary rights of others, we may be forced to seek expensive licenses, reengineer our services, engage in expensive and time-consuming litigation or stop selling our services.
If we were to discover that our services violated or potentially violated the proprietary rights of others, we might not be able to obtain licenses to continue offering those services without substantial reengineering. Any reengineering effort may not be successful, nor can we be certain that any licenses would be available on commercially reasonable terms. Although we have not been named a party in any litigation concerning the infringement of another party’s rights, a claim of infringement against us, with or without merit, could be time consuming and expensive to litigate or settle, and could divert management’s attention from executing our business plan. An adverse determination against us could prevent us from offering our services. From time to time, we receive notices from others claiming we have infringed upon their intellectual property rights. The number of these claims may increase. Responding to these claims may require us to seek expensive licenses, reengineer our services, engage in expensive and time-consuming litigation or stop selling our services.
If we are unable to attract and retain management and key personnel, we may not be able to implement our business plan.
We believe that the successful implementation of our business plan will depend on our management team, particularly the chairman of our board of directors and our chief executive officer, David A. Steinberg. Losing
20
the services of one or more members of our management team could adversely affect our business and our expansion efforts, and possibly prevent us from further improving our information management, financial and operational systems and controls. As we continue to grow, we may need to hire and retain qualified sales, marketing, administrative, operating and technical personnel with knowledge of the wireless services industry and online marketing, and to train and manage new personnel. We may not be able to identify and hire qualified personnel due to competition for such personnel. The failure to hire and retain these personnel would have an adverse effect on our business.
Our failure to identify and integrate successfully any businesses or technologies that we acquire may increase our costs and reduce our revenue.
As part of our business strategy, we continue to seek to expand our service offerings through investments in, or acquisitions of, other businesses or technologies that we believe are complementary to our business. Although we regularly engage in discussions relating to potential acquisitions, we may not be able to identify, negotiate or finance any future acquisitions. If we do identify acquisitions, it may be necessary for us to raise additional funds to finance those acquisitions. Additional funds may not be available on terms that are favorable to us, or at all. If we issue our stock as consideration, our stockholders would experience dilution of their percentage ownership in our stock. Upon completion of any acquisitions, we may be unsuccessful in integrating and operating such acquired businesses profitably or otherwise implementing our strategy successfully. If we are unable to integrate any newly-acquired entities or technologies effectively, our business and results of operations could suffer. The time and expense associated with finding suitable and compatible businesses, technologies or services could also disrupt our ongoing business and divert our management’s attention. In addition, we may be required to reduce the carrying amount on our balance sheet of any acquired intangible assets; this reduction would adversely affect our financial results in the period in which it occurs.
Vendors in India support our operating activities. Any difficulties experienced with these services could result in additional expense or loss of customers and revenue.
We have outsourcing agreements with vendors in India to provide additional activation and call center support. As a result, we rely on these vendors to provide customer service and interface with our customers. If these vendors are unable to perform satisfactory customer service, we could lose customers and would have to pursue alternative strategies to provide these services, which could result in delays, interruptions, additional expense and loss of customers. A variety of proposed federal and state legislation, if enacted, could restrict or discourage U.S. companies from outsourcing their services to companies outside the U.S. This legislation, if enacted, may impact our ability to use internationally outsourced services to support our call center activities.
Risks Related to Our Industry
If the online market for wireless services and devices does not gain widespread acceptance, our business would suffer.
Our success will depend in part on our ability to attract consumers who have historically purchased wireless services and devices through traditional retail stores. Furthermore, we may have to incur significantly higher and more sustained advertising and promotional expenditures or price our products more competitively than we currently anticipate in order to attract additional online consumers and sell wireless services and devices to more customers. Specific factors that could deter consumers from purchasing wireless services and devices from us include:
| | • | concerns about buying wireless devices without a face-to-face interaction with sales personnel and the ability to physically handle and examine the devices; |
| | • | pricing that does not meet their expectations; |
| | • | concerns about the security of online transactions and the privacy of personal information; |
21
| | • | delivery time associated with Internet orders; |
| | • | delayed shipments or shipments of incorrect or damaged products; |
| | • | inconvenience associated with returning or exchanging purchased items; |
| | • | inability to maintain good standing with business rating services; |
| | • | failure to provide a positive customer experience for consumers; and |
| | • | possible disruptions, computer viruses or other damage to the Internet servers or to the consumers’ computers. |
We may be exposed to risks associated with credit card fraud and identity theft that could cause us to incur unexpected expenditures and loss of revenue.
Under current credit card practices, a merchant is liable for fraudulent credit card transactions when, as is the case with the transactions we process, that merchant does not obtain a cardholder’s signature. Any failure to prevent fraudulent credit card transactions would adversely affect our business and our revenue. We do not currently carry insurance to protect us against this risk. We do not receive any revenue from fraudulently placed orders. We bear the risk of future losses as a result of orders placed with fraudulent credit card data or fraudulent identity information, even though the associated financial institution approved payment of the orders. In the event our credit card chargebacks from the processors exceed levels set by VISA, Mastercard or other credit card companies, we may lose our ability to process transactions which would have an adverse effect on our business.
Our net sales may be negatively affected if we are required to charge taxes on purchases.
We are not required to collect or are not subject to sales or other taxes related to the products we sell, except for certain corporate level taxes and sales taxes with respect to purchases by customers located in a limited number of states. However, one or more states or foreign countries may seek to impose sales or other tax collection obligations on us in the future. A successful assertion by one or more states or foreign countries that we should be collecting sales or other taxes on the sale of our products could result in substantial tax liabilities for past sales, discourage customers from purchasing products from us, decrease our ability to compete with traditional retailers or otherwise substantially harm our business and results of operations. Currently, decisions of the U.S. Supreme Court restrict the imposition of obligations to collect state and local sales and use taxes with respect to sales made over the Internet. However, a number of states, as well as the U.S. Congress, have been considering various initiatives that could limit or supersede the Supreme Court’s position regarding sales and use taxes on Internet sales. If any of these initiatives addressed the Supreme Court’s constitutional concerns and resulted in a reversal of its current position, we could be required to collect sales and use taxes in additional states. The imposition by state and local governments of various taxes upon Internet commerce could create administrative burdens for us, put us at a competitive disadvantage if they do not impose similar obligations on all of our online competitors and decrease our future sales.
Government regulation of the Internet and e-commerce is evolving and unfavorable changes could substantially harm our business and results of operations.
We are subject to general business regulations and laws as well as regulations and laws specifically governing the Internet and e-commerce. Existing and future laws and regulations may impede the growth of the Internet or other online services. These regulations and laws may cover taxation, restrictions on imports and exports, customs, tariffs, user privacy, data protection, pricing, content, copyrights, distribution, electronic contracts and other communications, consumer protection, the provision of online payment services, broadband residential Internet access and the characteristics and quality of products and services. It is not clear how existing laws governing issues such as property ownership, sales and other taxes, libel and personal privacy apply to the Internet and e-commerce. Laws or regulations may be enacted that prohibit use of mass emails or similar
22
marketing activities. We may not be able to support the marketing of our products and services by mass email or other online means if such activities are adverse to our business. Even if no relevant law or regulation is enacted, we may discontinue use or support of these activities if we become concerned that customers deem them intrusive or they otherwise adversely affect our goodwill. Unfavorable resolution of these issues may substantially harm our business and results of operations.
The wireless services industry may experience a decline in new subscriber growth rate.
The wireless services industry has faced an increasing number of challenges, including a slowdown in new subscriber growth. According to Ovum, total annual gross subscriber additions will decrease slightly, for example showing a decrease in gross additions from 72.8 million in 2006 to 71.9 million in 2010. If the wireless services industry experiences a decline in subscribers, our business may suffer.
We may be unable to effectively market our wireless services if wireless carriers do not deliver acceptable wireless networks and service plans, which would cause our revenue to decline.
The success of our business depends on the capacity, affordability and reliability of wireless voice and data access provided by wireless carriers. Growth in demand for wireless voice and data services may be limited if wireless carriers fail to maintain sufficient capacity to meet demand for these services, delay the expansion of their wireless networks and services, fail to offer and maintain reliable wireless network services or fail to market their services effectively. We also depend on wireless carriers to provide credit verification and approval to activate wireless service for customers. If wireless carriers are unable to verify credit information in a timely manner, we may lose marketers and customers.
Use of wireless devices may pose health risks or cause injuries, which could increase our exposure to litigation and result in increased operating expenses.
Radio frequency emissions from wireless devices may be linked to various health concerns, including cancer, and may interfere with various electronic medical devices, including hearing aids and pacemakers. In addition, there have been reports that people have been injured by explosions of refurbished batteries in wireless devices. The actual or perceived risk of radio frequency emissions from wireless devices or the potential for battery explosions or other injuries could adversely affect our business through a decline in sales of wireless services and increased exposure to potential litigation.
Other Risks
The market price of our common stock has been and will likely continue to be subject to fluctuation.
We have a rapidly evolving and unpredictable business model. The trading price of our common stock fluctuates significantly. Trading prices of our common stock may fluctuate in response to a number of events and factors, such as:
| | • | quarterly and seasonal variations in operating results; |
| | • | changes in financial estimates and ratings by securities analysts; |
| | • | announcements by us or our competitors of new product and service offerings, significant contracts, acquisitions or strategic relationships; |
| | • | publicity about our company, our products and services, our competitors or e-commerce in general; |
| | • | additions or departures of key personnel; |
| | • | any future sales of our common stock or other securities; and |
| | • | stock market price and fluctuations in trading volume of publicly-traded companies in general and Internet-related companies and specialty retailers in particular. |
23
The trading prices of Internet-related companies and e-commerce companies have been especially volatile. In the past, securities class action litigation has often been brought against a company following periods of volatility in the market price of its securities. We may be the target of similar litigation in the future. Securities litigation could result in significant costs and divert management’s attention and resources, which could substantially harm our business and results of operations.
If securities or industry analysts do not continue to publish research or reports about our business, our stock price and trading volume could decline.
The trading market for our common stock will depend in part on the research and reports that securities or industry analysts publish about us or our business. If one or more of the analysts who covers us downgrades our stock, our stock price would likely decline. If one or more of these analysts ceases coverage of our company or fails to regularly publish reports on us, interest in the purchase of our stock could decrease, which could cause our stock price or trading volume to decline.
Anti-takeover provisions and other restrictions in our certificate of incorporation, bylaws and applicable law might discourage, delay or prevent a change of control of our company or changes in our management that our stockholders might find desirable.
Our certificate of incorporation and bylaws provide for, among other things:
| | • | | a classified board of directors; |
| | • | | restrictions on the ability of our stockholders to call special meetings of stockholders; |
| | • | | restrictions on the ability of our stockholders to act by written consent; |
| | • | | restrictions on the ability of our stockholders to remove any director or the entire board of directors without cause; |
| | • | | restrictions on the ability of our stockholders to fill a vacancy on the board of directors; and |
| | • | | advance notice requirements for stockholder proposals. |
These provisions may have the effect of delaying or preventing an acquisition of us or changes in our management, even if stockholders of our company deem such changes to be advantageous. In addition, our board of directors is permitted to authorize the issuance of undesignated capital stock without any vote or further action by the stockholders. Because we are incorporated in Delaware, we are governed by the provisions of Section 203 of the Delaware General Corporation Law, which prohibits us from engaging in a business combination with an interested stockholder for a period of three years after the date of the transaction in which the person became an interested stockholder, unless the business combination is approved in a prescribed manner. These provisions and other provisions of the Delaware General Corporation Law applicable to us may restrain large stockholders, in particular those owning 15% or more of our outstanding voting stock, from consummating a merger or business combination with us without the approval of the board of directors, even if doing so would benefit our stockholders.
Our ability to utilize net operating loss carryforwards to offset future taxable income may be limited.
As of December 31, 2006, we had approximately $196.1 million of federal and state net operating loss carryforwards. Under the provisions of the Internal Revenue Code, substantial changes in our ownership may limit the amount of net operating loss carryforwards that can be utilized annually in the future to offset taxable income. If such a change in our ownership occurs, our ability to use our net operating loss carryforwards in any fiscal year may be significantly limited under these provisions.
24
ITEM 1B. UNRESOLVED STAFF COMMENTS
As part of a review by the Division of Corporation Finance of the Securities and Exchange Commission (“SEC”) of a Current Report on Form 8-K filed by the Company on April 3, 2007 and subsequently amended on May 4, 2007 (the “Form 8-K”), the Company received a number of comments regarding the Form 8-K and certain annual and quarterly reports filed in 2006. These comments include questions related to the Company’s accounting policy for revenue recognized related to equipment discount provision termination fees earned in 2006 that could impact disclosures included in certain of its Forms 10-Q filed in 2006. The Company is working to address the questions raised by the SEC. The SEC has also requested additional information from the Company related to the Form 8-K that, upon further review by the SEC, may result in additional comments from the SEC. Specifically, the SEC has requested information related to: (i) the error in recording accrued expenses and reserves for consumer product rebates; (ii) additional expenses for rebates paid to consumers as “goodwill” or “customer accommodations”; (iii) additional details related to accounting adjustments of approximately $3.0 million; and (iv) information regarding an error in marketing expenses of approximately $1.2 million that pertained to the fiscal year ended December 31, 2005.
ITEM 2. PROPERTIES
Our principal offices are located in Washington, D.C., where we lease 15,780 square feet of office space under a lease that expires in November 2008. Our technology and operations centers are located in Largo, Maryland, where we lease approximately 51,667 square feet under a lease that expires in September 2009. We have operations in Reston, Virginia, where we lease approximately 32,552 square feet under multiple operating leases that expire between June 2007 and January 2008; and in Great Falls, Virginia, where we lease approximately 4,150 square feet under a lease that expires in August 2007.
ITEM 3. LEGAL PROCEEDINGS
Legal Matters
On May 7 and 18, 2007, two putative federal securities law class actions were filed in the United States District Court for the District of Columbia on behalf of persons who purchased our common stock between August 2, 2006, and May 3, 2007. These substantially similar lawsuits assert claims pursuant to Sections 10(b) and 20(a) of the Securities Exchange Act of 1934, and Rule 10b-5 promulgated thereunder, against us, our chief executive officer and our chief financial officer. These claims are related to our April 3, 2007, and May 4, 2007 announcements concerning our restatement of certain previously issued financial statements. Potential plaintiffs have until July 6, 2007, to move the court for appointment as lead plaintiff. We have not yet responded to the complaints. We believe that the allegations contained within these class action lawsuits are without merit and intend to vigorously defend the litigation.
On August 5, 2004, Avesair, Inc., one of the companies the assets of which we acquired, filed suit against us demanding, among other matters, that we issue to Avesair shares of our common stock valued at approximately $4.0 million as of June 30, 2004. The stock demanded by Avesair represents the maximum value of shares that they could have earned for achieving certain performance-based targets under the asset purchase agreement. We believe the performance-based targets were not achieved and intend to vigorously contest this matter. However, any adverse resolution of this matter could have a material adverse impact on our financial results if we are required to issue additional shares and would result in dilution to our stockholders.
On May 3, 2007, the Federal Communications Commission (FCC) issued an Order of Forfeiture and Further Notice of Apparent Liability in which it imposed a forfeiture of $819,905 against us for being late in complying with certain regulatory obligations that arose in 2004 and 2005 from a business that we sold in December 2005. Those obligations included: registering with the FCC, filing certain reports, and paying certain Universal Service Fund fees. The FCC’s order also proposed imposing an additional fine of $100,000 for not having maintained in 2006 and 2007 a license necessary to conduct the business that was discontinued by us in 2005. As we did not
25
operate the business in 2006 and 2007 we will request that the proposed fine be dismissed. With regard to the forfeiture itself, we are evaluating our legal options, which include appealing the ruling in federal court and/or negotiating a different and possibly lesser forfeiture. This forfeiture issue was initially raised by the FCC in July 2005. We advised the FCC then, and believe now, that no fine is appropriate under the circumstances.
Fifteen related putative federal court class actions have been filed against us arising out of InPhonic-sponsored rebate offers for online purchases of wireless telephones. Several of these lawsuits also name either our current or former third-party rebate processor as a defendant. On October 25, 2006 we received a decision by the Judicial Panel on Multidistrict Litigation (“JPML”) granting our motion to consolidate the federal court actions in the United States District Court for the District of Columbia before the Honorable Ellen Segal Huvelle. The consolidated amended class action complaint alleges, among other things, that we and our current or former third-party rebate processor (depending on the particular claim) violated the consumer protection laws of various states, various D.C. state laws and the federal RICO (anti-racketeering) statute in connection with our disclosure and implementation of the terms and conditions of rebate offers. The class action plaintiffs seek compensatory damages and/or restitution, statutory penalties and treble damages under D.C. consumer protection laws and RICO, attorneys’ fees and punitive damages, as well as injunctions concerning the content of our websites. The federal lawsuit is in an early stage. We intend to vigorously defend that action but cannot predict its outcome.
On April 27, 2007 we and the Federal Trade Commission (FTC) announced that we had entered into a consent agreement with the FTC in which InPhonic agreed to clearly and prominently disclose certain information regarding its rebate offers, such as when consumers can expect to receive their rebates, any time period that consumers must wait before submitting a rebate request, and certain information that would disqualify a consumer from receiving a rebate. We also agreed to provide rebates within time frames and under terms and conditions reasonably specified by us in our communications with our customers. We also agreed to provide rebates to certain customers whom had previously been denied them. As required by its rules, the FTC has requested comment on the consent agreement and we expect that it will become effective shortly.
On February 15, 2007, we reached a final settlement with the District of Columbia Attorney General’s Office concerning our use of mail-in rebates.
From time to time we are party to other disputes or legal proceedings. We do not believe that any of the pending proceedings are likely to have a material adverse effect on our business.
ITEM 4. SUBMISSION OF MATTERS TO A VOTE OF SECURITY HOLDERS
No matters were submitted to a vote of our security holders during the fourth quarter of 2006.
26
PART II
ITEM 5. MARKET FOR REGISTRANT’S COMMON EQUITY, RELATED STOCKHOLDER MATTERS AND ISSUER PURCHASES OF EQUITY SECURITIES
Our common stock has been traded on The NASDAQ Global Market under the symbol “INPC” since November 16, 2004. Prior to that time, there was no public market for our common stock. The following table sets forth the high and low intraday sales prices for our common stock for the periods indicated as reported by the NASDAQ Global Market.
Because of the delayed filing of our periodic reports, we face delisting from NASDAQ which would adversely affect the trading price of our common stock. We requested and subsequently attended a hearing before the NASDAQ Listing Qualifications Panel on May 24, 2007 to appeal both staff determinations and presented a plan to cure both filing deficiencies and regain compliance. Both NASDAQ delisting actions have been automatically stayed pending the NASDAQ Panel’s decision, and our stock will continue to be listed on the NASDAQ Global Market until the Panel issues its decision and during any extension that is allowed by the Panel. If the Nasdaq Panel does not grant our request for an extension and continued listing, the extension is not for the duration we requested, or we are unable to fulfill the plan to regain compliance or otherwise meet or maintain compliance with all of the NASDAQ listing requirements, our securities will be delisted from the NASDAQ Global Market.
| | | | | | |
| | | Stock Price |
| | | High | | Low |
Year ended December 31, 2005 | | | | | | |
First Quarter | | $ | 28.29 | | $ | 19.13 |
Second Quarter | | | 23.98 | | | 12.21 |
Third Quarter | | | 18.20 | | | 12.43 |
Fourth Quarter | | | 15.84 | | | 8.45 |
Year ended December 31, 2006 | | | | | | |
First Quarter | | | 9.53 | | | 5.02 |
Second Quarter | | | 9.28 | | | 5.88 |
Third Quarter | | | 8.50 | | | 5.66 |
Fourth Quarter | | | 12.45 | | | 7.34 |
As of May 21, 2007, there were approximately 147 holders of record of our common stock. This figure does not represent the actual number of beneficial owners of our common shares because shares are frequently held in “street name” by securities dealers and others for the benefit of beneficial owners who may vote the shares.
We have never declared or paid cash dividends on our common stock. We currently intend to retain future earnings, if any, for use in the operation and expansion of our business and do not anticipate paying cash dividends in the foreseeable future. The declaration and payment of any dividends in the future will be determined by our board of directors, in its discretion, and will depend on a number of factors, including our earnings, capital requirements and overall financial condition. In addition, our ability to declare and pay dividends is substantially restricted under our secured credit facility.
During the quarter ended December 31, 2006, we issued the following shares of our equity securities that were not registered under the Securities Act of 1933:
| | (1) | Warrants to purchase an aggregate of 1,250,000 shares of our common stock at an exercise price of $0.01 per share to our secured lenders; |
| | (2) | 2,247 shares of our common stock pursuant to the net exercise of warrants at an exercise price of $2.49 per share that were issued prior to our initial public offering; and |
| | (3) | 14,080 shares of our common stock pursuant to the net exercise of warrants at an exercise price of $0.03 per share that were issued prior to our initial public offering. |
27
The above-described issuances were exempt from registration (1) pursuant to Section 4(2) of the Securities Act, or Regulation D or Rule 144A promulgated thereunder, as transactions not involving a public offering, (2) pursuant to Rule 701 promulgated under the Securities Act or (3) as transactions not involving a sale of securities. With respect to each transaction listed above, no general solicitation was made by either us or any person acting on our behalf, the securities sold are subject to transfer restrictions and the certificates for the equity securities contained an appropriate legend stating such securities have not been registered under the Securities Act and may not be offered or sold absent registration or pursuant to an exemption therefrom. No underwriters were involved in connection with the sales of securities referred to above.
The following table provides information about purchases we made during the fourth quarter of 2006 of our equity securities that are registered by us pursuant to Section 12 of the Exchange Act. We purchased our common stock pursuant to the stock repurchase plan we announced in November 2006 authorizing the purchase of up to $30.0 million of shares of our common stock.
| | | | | | | | | | |
Period | | Total Number of
Shares
Purchased | | Average
Price Paid
per Share | | Total Number of Shares Purchased as
Part of Publicly
Announced Plan | | Approximate Dollar
Value of Shares that May Yet Be
Purchased Under the Plan |
November 1, 2006 to November 30, 2006 | | 90,000 | | $ | 11.37 | | 90,000 | | $ | 28,976,273 |
December 1, 2006 to December 31, 2006 | | 197,500 | | | 11.20 | | 197,500 | | | 26,764,448 |
| | | | | | | | | | |
Fourth quarter 2006 totals | | 287,500 | | $ | 11.25 | | 287,500 | | $ | 26,764,448 |
| | | | | | | | | | |
Repurchases may take place in the open market or in privately negotiated transactions, including derivative transactions, and may be made under a Rule 10b5-1 plan. Outside of the stock repurchase program, we acquired 13,453 shares of our common stock during the fourth quarter of 2006 from certain of our employees in satisfaction of their payroll tax withholding obligations related to restricted stock awards that had lapsed during the period. The average market price per share acquired was $11.39.
28
STOCK PERFORMANCE GRAPH
This performance graph shall not be deemed “filed” for purposes of Section 18 of the Securities Exchange Act of 1934, as amended (the “Exchange Act”) or otherwise subject to the liabilities under that Section and shall not be deemed to be incorporated by reference into any filing of InPhonic under the Securities Act of 1933, as amended or the Exchange Act.
The following graph shows the cumulative total return resulting from a hypothetical $100 investment in the Company’s common stock on November 16, 2004, the date of its initial public offering, through December 31, 2006. Stock price performance over this period is compared to the same amount invested in the Nasdaq Composite Index and the Goldman Sachs Internet Index over the same period (in each case, assuming reinvestment of dividends). This graph is presented as required by SEC rules. Past performance might not be indicative of future results. While total stockholder return can be an important indicator of corporate performance, we believe it is not necessarily indicative of its degree of success in executing its business plan, particularly over short periods.
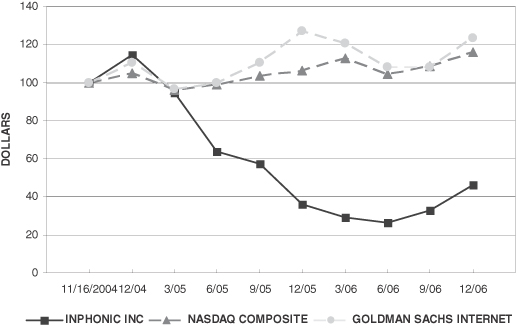
| | | | | | | | | | | | | | | | | | | | | | | | | | | | | | |
| | | Measurement Point |
| | | 11/16/04 | | 12/04 | | 3/05 | | 6/05 | | 9/05 | | 12/05 | | 3/06 | | 6/06 | | 9/06 | | 12/06 |
INPHONIC, INC. | | $ | 100.00 | | $ | 114.50 | | $ | 94.65 | | $ | 63.54 | | $ | 57.29 | | $ | 36.21 | | $ | 29.13 | | $ | 26.25 | | $ | 33.00 | | $ | 46.21 |
NASDAQ COMPOSITE | | | 100.00 | | | 104.66 | | | 96.18 | | | 98.96 | | | 103.52 | | | 106.10 | | | 112.56 | | | 104.50 | | | 108.65 | | | 116.20 |
GOLDMAN SACHS INTERNET | | | 100.00 | | | 110.23 | | | 96.40 | | | 99.69 | | | 110.34 | | | 126.85 | | | 120.44 | | | 108.34 | | | 108.15 | | | 123.49 |
29
ITEM 6. SELECTED FINANCIAL DATA
The following tables set forth certain of our historical consolidated financial data for the five years ended December 31, 2006. The Selected Financial Data should be read in conjunction with “Management’s Discussion and Analysis of Financial Condition and Results of Operations,” “Business,” and our consolidated financial statements, related notes thereto and other financial information included in the consolidated financial statements.
In December 2005, we sold the operating assets of our MVNO business. As a result and in accordance with Statement of Financial Accounting Standards No. 144,Accounting for the Impairment or Disposal of Long-Lived Assets (“SFAS No. 144”), we classified these operations as discontinued operations and, accordingly, have segregated the revenue and expenses of the discontinued operation in the selected consolidated statement of operations for all periods presented. Please refer to Note 4 of the notes to the consolidated financial statements included elsewhere in this annual report on Form 10-K. (In thousands except share and per share amounts).
| | | | | | | | | | | | | | | | | | | | |
| | | Years Ended December 31, | |
| | | 2002 | | | 2003 | | | 2004 | | | 2005 | | | 2006 | |
Revenue: | | | | | | | | | | | | | | | | | | | | |
Activations and services | | $ | 46,701 | | | $ | 86,825 | | | $ | 123,265 | | | $ | 233,730 | | | $ | 298,090 | |
Equipment | | | 10,604 | | | | 13,251 | | | | 31,603 | | | | 86,809 | | | | 71,484 | |
| | | | | | | | | | | | | | | | | | | | |
Total revenue | | | 57,305 | | | | 100,076 | | | | 154,868 | | | | 320,539 | | | | 369,574 | |
Cost of revenue, exclusive of depreciation and amortization: | | | | | | | | | | | | | | | | | | | | |
Activations and services | | | 5,609 | | | | 3,866 | | | | 1,752 | | | | 1,221 | | | | 2,653 | |
Equipment | | | 30,269 | | | | 45,426 | | | | 83,075 | | | | 190,509 | | | | 215,201 | |
| | | | | | | | | | | | | | | | | | | | |
Total cost of revenue | | | 35,878 | | | | 49,292 | | | | 84,827 | | | | 191,730 | | | | 217,854 | |
Operating expenses: | | | | | | | | | | | | | | | | | | | | |
Sales and marketing, exclusive of depreciation and amortization | | | 17,559 | | | | 26,398 | | | | 42,867 | | | | 93,726 | | | | 118,756 | |
General and administrative, exclusive of depreciation and amortization | | | 27,363 | | | | 31,422 | | | | 34,942 | | | | 63,131 | | | | 76,571 | |
Depreciation and amortization | | | 2,600 | | | | 5,434 | | | | 6,444 | | | | 9,840 | | | | 17,067 | |
Restructuring costs | | | — | | | | — | | | | — | | | | 847 | | | | 2,551 | |
Loss on investment | | | — | | | | — | | | | 150 | | | | 228 | | | | — | |
Impairment of goodwill and intangibles | | | 3,315 | | | | 2,431 | | | | — | | | | — | | | | — | |
| | | | | | | | | | | | | | | | | | | | |
Total operating expenses | | | 50,837 | | | | 65,685 | | | | 84,403 | | | | 167,772 | | | | 214,945 | |
| | | | | | | | | | | | | | | | | | | | |
Operating loss | | | (29,410 | ) | | | (14,901 | ) | | | (14,362 | ) | | | (38,963 | ) | | | (63,225 | ) |
Other income (expense): | | | | | | | | | | | | | | | | | | | | |
Interest income | | | 289 | | | | 287 | | | | 757 | | | | 2,167 | | | | 2,329 | |
Interest expense | | | (737 | ) | | | (1,252 | ) | | | (980 | ) | | | (970 | ) | | | (2,638 | ) |
| | | | | | | | | | | | | | | | | | | | |
Total other income (expense) | | | (448 | ) | | | (965 | ) | | | (223 | ) | | | 1,197 | | | | (309 | ) |
| | | | | | | | | | | | | | | | | | | | |
Loss from continuing operations | | | (29,858 | ) | | | (15,866 | ) | | | (14,585 | ) | | | (37,766 | ) | | | (63,534 | ) |
| | | | | | | | | | | | | | | | | | | | |
Discontinued operations: | | | | | | | | | | | | | | | | | | | | |
Income (loss) from discontinued operations | | | 849 | | | | (4,356 | ) | | | 4,346 | | | | (1,784 | ) | | | (193 | ) |
Gain on sale | | | — | | | | — | | | | — | | | | 1,355 | | | | — | |
| | | | | | | | | | | | | | | | | | | | |
Total income (loss) from discontinued operations | | | 849 | | | | (4,356 | ) | | | 4,346 | | | | (429 | ) | | | (193 | ) |
| | | | | | | | | | | | | | | | | | | | |
Net loss | | | (29,009 | ) | | | (20,222 | ) | | | (10,239 | ) | | | (38,195 | ) | | | (63,727 | ) |
Preferred stock dividends and accretion | | | (8,048 | ) | | | (7,309 | ) | | | (22,049 | ) | | | — | | | | — | |
| | | | | | | | | | | | | | | | | | | | |
Net loss attributable to common stockholders | | $ | (37,057 | ) | | $ | (27,531 | ) | | $ | (32,288 | ) | | $ | (38,195 | ) | | $ | (63,727 | ) |
| | | | | | | | | | | | | | | | | | | | |
Basic and diluted net loss per share: | | | | | | | | | | | | | | | | | | | | |
Net loss from continuing operations | | $ | (3.64 | ) | | $ | (2.07 | ) | | $ | (2.60 | ) | | $ | (1.10 | ) | | $ | (1.75 | ) |
Net gain (loss) from discontinued operations | | | 0.08 | | | | (0.39 | ) | | | 0.31 | | | | (0.01 | ) | | | — | |
| | | | | | | | | | | | | | | | | | | | |
Basic and diluted net loss per share | | $ | (3.56 | ) | | $ | (2.46 | ) | | $ | (2.29 | ) | | $ | (1.11 | ) | | $ | (1.75 | ) |
| | | | | | | | | | | | | | | | | | | | |
Basic and diluted weighted average shares outstanding | | | 10,406,584 | | | | 11,204,791 | | | | 14,074,505 | | | | 34,417,954 | | | | 36,312,970 | |
| | | | | | | | | | | | | | | | | | | | |
30
| | | | | | | | | | | | | | | | | |
| | | As of December 31, |
| | | 2002 | | | 2003 | | | 2004 | | 2005 | | 2006 |
Consolidated Balance Sheet Data | | | | | | | | | | | | | | | | | |
Cash and cash equivalents | | $ | 12,626 | | | $ | 29,048 | | | $ | 100,986 | | $ | 70,783 | | $ | 89,972 |
Working capital (deficit) (1) | | | (14,751 | ) | | | (2,425 | ) | | | 93,284 | | | 56,238 | | | 60,472 |
Total assets | | | 40,320 | | | | 63,540 | | | | 163,789 | | | 196,097 | | | 264,405 |
Long-term obligations, less current portion | | | 6,276 | | | | 2,804 | | | | 261 | | | 15,474 | | | 63,826 |
Redeemable preferred stock | | | 36,297 | | | | 67,794 | | | | — | | | — | | | — |
Non-redeemable preferred stock | | | 3,325 | | | | 5,209 | | | | — | | | — | | | — |
Total stockholders’ (deficit) equity | | | (40,006 | ) | | | (55,431 | ) | | | 112,102 | | | 99,850 | | | 73,597 |
| | (1) | Working capital (deficit) consists of total currents assets, including cash and equivalents, less current liabilities. |
31
ITEM 7. MANAGEMENT’S DISCUSSION AND ANALYSIS OF FINANCIAL CONDITION AND RESULTS OF OPERATIONS
The following discussion and analysis should be read in conjunction with the consolidated financial statements and related notes and the discussions under “Application of Critical Accounting Policies,” which describes key estimates and assumptions we make in the preparation of its financial statements, Item 1A “Risk Factors”, which describes key risks associated with our operations and industry, as well as our other filings with the Securities and Exchange Commission
Overview
We are a leading online seller of wireless services and devices based on the number of activations of wireless services sold online in the U.S. Through our wireless activation and services (“WAS”) business unit, we sell service plans, devices and accessories, including satellite television services through our own branded websites; including Wirefly.com and VMCsatellite.com. We offer marketers the ability to sell wireless voice and data services and devices, under mobile virtual network enabler (“MVNE”) agreements. This service utilizes the same e-commerce platform, operational infrastructure and marketing relationships that we use in our operations. We provide customers the ability to organize personal communications by providing real-time wireless access to e-mail, voicemail, faxes, contacts, scheduling, calendar and conference calling functionality through a website or telephone.
We measure our performance based on our financial results and various non-financial measures. Key financial factors that we focus on in evaluating our performance include revenue growth within a period, contribution margin (defined as revenue less cost of revenue and sales and marketing expenses), and operating income (defined as contribution margin less other operating expenses including general and administrative and depreciation and amortization expenses). Our financial results can, and do, vary significantly from quarter-to-quarter as a result of a number of factors which include economic conditions specific to online commerce and wireless communications industries, the timing of introduction of popular devices by mobile phone manufacturers, our ability to attract visitors to our websites, changes in wireless carrier commission and bonus structures, the timing of recognition of bonuses paid to us by wireless carriers and our competitors’ pricing and marketing strategies.
Key non-financial measures of our success are customer feedback and customer satisfaction ratings compiled by third parties. We believe that maintaining high overall customer satisfaction is critical to our ongoing efforts to promote the use of the private-labeled websites that we create and manage for our marketers, as well as our own branded websites, and to improve our operating results. We actively solicit customer feedback on our website functionality as well as the entire purchase experience. To maintain a high level of performance by our customer service representatives, we also undertake an ongoing customer feedback process. If we are unable to meet customer expectations with respect to price or do not successfully expand our product lines or otherwise fail to maintain high overall customer satisfaction, our business and results of operations would be harmed.
Our revenue includes commissions, bonuses and other payments we receive from wireless carriers, including a satellite television provider, in connection with the activation of customers on their networks, as well as payments from customers for wireless services and devices. Our revenue continues to increase as a result of internal growth and acquisitions. As further described below, total revenue and net loss from continuing operations for the year ended December 31, 2006 were $369.6 million and $63.5 million, respectively, compared to total revenue and net loss from continuing operations of $320.5 million and $37.8 million, respectively, for the year ended December 31, 2005. Revenue from our top three wireless carriers represented 68% and 67% of our total consolidated revenue for the year ended December 31, 2006 and 2005, respectively.
In 2007, we expect the commissions we earn from four of the five largest wireless carriers will include an increasing amount of residual-based compensation. In exchange for a recurring monthly residual commission,
32
these carriers will pay a lower up-front commission. Depending on the carrier, the monthly residual commission will be based on a percentage of the monthly recurring charges for authorized rate plans, authorized features and additional local airtime charges the carrier bills to the customer or a flat fixed fee per subscriber. Under these arrangements, we receive a monthly residual payment for as long as the activated subscriber remains a customer of that carrier under the original services contract, or a specified period of time, depending on the carrier. Accordingly, we expect that the amount of activations revenue recognized when a subscriber activates service will decrease, but expect that the decrease will be partially offset by the recurring monthly residual commission. In addition, based on a residual commission structure, the amount of total revenue we recognize on a subscriber activation over the life of the residual relationship may exceed the amount of revenue that would otherwise have been realized based on the full up-front commission.
In addition, future revenue and cash collections may be impacted by our ability to successfully resolve differences with wireless carriers between our sales information and subscriber activation data and similar information maintained in the respective carriers’ systems which they use to determine our commission and other amounts due us. Although in most instances our records match, differences do exist which may create delays in our collections of such differences. Although we believe we have adequate reserves in place for such differences and potential collection shortfalls based on our collection experience, as our business volume increases and commission and feature plans become more numerous or complex with each carrier, our automated systems may not be updated as quickly as required or our workforce trained as promptly as needed to investigate such differences. In the event that we are slow to research such amounts, our cash collections may be affected. In the last half of 2006, we experienced an increase in such matters requiring specific attention and increasing reserves of accounts receivable which caused our net loss to increase.
A major determinant of our revenue is the extent and success of our marketing efforts and expenditures. Our marketing efforts are conducted mainly through Internet search engines which display links to our websites based on search results and through third-party, incentive-based online marketing initiatives, including the use of websites that we create and manage under our marketers’ brands. We also use online advertising, search engines and third-party marketing partners based on orders and activations including Google, Yahoo, MSN and AOL. We incurred total advertising and other marketing costs of approximately $104.8 million and $80.3 million in 2006 and 2005, respectively. Online marketing initiatives are an important aspect of our business strategy because the underlying promotions attract consumers to our websites or our partners’ websites.
The nature of our sales promotions and extent of our marketing initiatives also have a correlation to the quality of customer we attract or activation we place with the carrier. For instance, subsidizing the equipment sale that may lead to higher deactivation experience than activations we provision through our own websites or more traditional marketing partners.
Since we began operations in 1999, we have incurred significant losses and had negative cash flow from operations. As of December 31, 2006, we had an accumulated deficit of $228.4 million and a total stockholders’ equity of $73.6 million. In order to achieve profitability in the future, we are depending upon our ability to continue to increase our revenue at levels that exceed the costs of that revenue plus operating expenses. There can be no assurances that we will operate profitably in the future.
In 2005, we acquired certain assets and assumed certain liabilities of A1 Wireless USA, Inc. (“A1 Wireless”); VMC Satellite, Inc. (“VMC”); and FONcentral.com, Inc. (“FC”). We accounted for these transactions using the purchase method of accounting in accordance with Statement of Financial Accounting Standards (“SFAS”) No. 141,Business Combinations. Accordingly our results of operations include the operating results of A1 Wireless effective January 1, 2005, VMC as of April 26, 2005 and FC as of May 26, 2005, their respective acquisition dates.
In 2005, we also sold the assets of our MVNO operations, which are reflected as discontinued operations in the accompanying financial statements. As a result of this sale, we operate primarily in one segment and we no
33
longer believe that segment information in accordance with SFAS No. 131,Disclosures About Segments of an Enterprise and Related Information, is applicable as our WAS business unit represented approximately 96% and 99% of our total revenue and cost of revenue for 2005. Our management’s discussion and analysis of results of operations will continue to provide a comparison of our revenue and cost of revenue of our wireless activation and services and other components of revenue and cost of revenue to the extent MVNE and data services fluctuations appear significant in explaining and describing such results of operations.
In 2006, we grew our wireless activations business, expanded our services and broadened our customer base primarily through internal growth. Five key goals for us in 2007 include (i) increased efforts to improve collections with the wireless carriers to generate cash; (ii) reduce operating and employee expense as well as capitalized expenditures in the near-term to improve cash flow; (iii) to continue to improve the customer experience platform that we utilize for order processing, customer service and rebate handling to refine existing automation and increase efficiency and effectiveness of our back-office systems, internal workforce and outsourced call center; (iv) to further balance spending on marketing initiatives with customer activation and revenue generation characteristics; and (v) to utilize our existing customer database, website traffic and online marketing capabilities to sell new products and services. We expect to continue our growth in 2007 through internal means. In addition, we may continue to be opportunistic in our acquisition of strategic assets as we seek to build our business. In evaluating potential acquisitions, we assess our expectations regarding the impact of a transaction on our cash flows, revenue and net income, among other factors. We cannot assure you that any acquisitions that we may complete in the future will have a positive impact on our revenue, net cash provided by operating activities, the valuation of our common stock or our efforts to attain and maintain profitability.
Restatement
As described in our Quarterly Reports on Forms 10-Q/A for the first, second and third quarters of 2006 and in this Annual Report on Form 10-K, we restated our financial statements for each of the quarters ended March 31, June 30, and September 30, 2006. The financial statements for the year ended December 31, 2006 included in this Form 10-K reflect the adjustments associated with this restatement. (See Note 13 to the Consolidated Financial Statements.)
Comparison of the Results of Operations for the years ended December 31, 2006 and 2005
| | | | | | | | | | | | | | | | | | | |
| | | Year Ended December 31, | | | Change Between
2005 and 2006 | |
| | | 2005 | | | 2006 | | |
| (amounts in thousands) | | Amount | | % of
Revenue | | | Amount | | % of
Revenue | | | Amount | | | % | |
Revenue: | | | | | | | | | | | | | | | | | | | |
Activation and services | | $ | 233,730 | | 73 | % | | $ | 298,090 | | 81 | % | | $ | 64,360 | | | 28 | % |
Equipment | | | 86,809 | | 27 | % | | | 71,484 | | 19 | % | | | (15,325 | ) | | -18 | % |
| | | | | | | | | | | | | | | | | | | |
Total revenue | | $ | 320,539 | | 100 | % | | $ | 369,574 | | 100 | % | | $ | 49,035 | | | 15 | % |
| | | | | | | | | | | | | | | | | | | |
Cost of revenue: | | | | | | | | | | | | | | | | | | | |
Activation and services | | $ | 1,221 | | 1 | % | | $ | 2,653 | | 1 | % | | $ | 1,432 | | | 117 | % |
Equipment | | | 190,509 | | 59 | % | | | 215,201 | | 57 | % | | | 24,692 | | | 13 | % |
| | | | | | | | | | | | | | | | | | | |
Total cost of revenue | | $ | 191,730 | | 60 | % | | $ | 217,854 | | 58 | % | | $ | 26,124 | | | 14 | % |
| | | | | | | | | | | | | | | | | | | |
Selected operating expenses: | | | | | | | | | | | | | | | | | | | |
Sales and marketing | | $ | 93,726 | | 29 | % | | $ | 118,756 | | 32 | % | | $ | 25,030 | | | 27 | % |
General and administrative | | | 63,131 | | 20 | % | | | 76,571 | | 21 | % | | | 13,440 | | | 21 | % |
Depreciation and amortization | | | 9,840 | | 3 | % | | | 17,067 | | 5 | % | | | 7,227 | | | 73 | % |
Restructuring | | | 847 | | 0 | % | | | 2,551 | | 1 | % | | | 1,704 | | | 201 | % |
34
REVENUE
Revenue
Revenue consists of activations and services revenue, and equipment revenue. Activations and services revenue consists of (i) revenue from commissions, bonuses and other payments for the activation of services of wireless carriers and a satellite television carrier through private-labeled websites that we create and manage for marketers as well as through our own branded websites; (ii) revenue from the provisioning of MVNE services which provide marketers the ability to sell MVNO services to their customers under their own brands using our e-commerce platform and operational infrastructure; and, (iii) revenue from data services under which we provide subscribers with real-time wireless access to work and personal information, including email, calendar, corporate directories, personal contacts and documents in addition to wireless entertainment and content. Equipment revenue consists mainly of revenue from the sale of wireless devices to our customers that subscribe to wireless services through our private-labeled websites or those websites that we manage for other marketers. The following further details the components of our revenue and a comparative discussion of performance:
| | | | | | | | | | | | | | | | | | | |
| | | Year Ended December 31, | | | Change Between 2005 and 2006 | |
| | | 2005 | | | 2006 | | |
| (amounts in thousands) | | Amount | | % of
Revenue | | | Amount | | % of
Revenue | | | Amount | | | % | |
Activations and services: | | | | | | | | | | | | | | | | | | | |
Wireless activation | | $ | 222,047 | | 69 | % | | $ | 284,208 | | 77 | % | | $ | 62,161 | | | 28 | % |
MVNE and data services | | | 11,683 | | 4 | % | | | 13,882 | | 4 | % | | | 2,199 | | | 19 | % |
| | | | | | | | | | | | | | | | | | | |
| | | 233,730 | | 73 | % | | | 298,090 | | 81 | % | | | 64,360 | | | 28 | % |
| | | | | | |
Equipment: | | | | | | | | | | | | | | | | | | | |
Wireless activation | | $ | 86,809 | | 27 | % | | $ | 71,484 | | 19 | % | | $ | (15,325 | ) | | -18 | % |
| | | | | | |
Total Revenue: | | | | | | | | | | | | | | | | | | | |
Wireless activation | | $ | 308,856 | | 96 | % | | $ | 355,692 | | 96 | % | | $ | 46,836 | | | 15 | % |
MVNE and data services | | | 11,683 | | 4 | % | | | 13,882 | | 4 | % | | | 2,199 | | | 19 | % |
| | | | | | | | | | | | | | | | | | | |
| | $ | 320,539 | | 100 | % | | $ | 369,574 | | 100 | % | | $ | 49,035 | | | 15 | % |
| | | | | | | | | | | | | | | | | | | |
Activations and Services
Activations and services revenue increased 28% to $298.1 million for the year ended December 31, 2006 from $233.7 million for the year ended December 31, 2005. The increase in activations and services revenue of $64.4 million was attributable to an increase in the number of wireless activations that we generated through marketing partners and increased advertising efforts compared to the prior period. Gross carrier commissions for activations subject to chargeback increased 22% to $331.0 million for the year ended December 31, 2006 from $270.6 million for the year ended December 31, 2005. Activations and services revenue of MVNE and data services increased $2.2 million to $13.9 million for the year ended December 31, 2006, primarily as a result of increased MVNE revenue resulting from additional recurring revenue transactions for back-office support and the completion of certain development work in 2006. Recurring revenue transactions increased due to increased subscribers and a strategic business partnership beginning in April 2006.
Equipment
Revenue from sales of equipment for the year ended December 31, 2006 decreased 18% to $71.5 million from $86.8 million for the year ended December 31, 2005. The decrease in equipment revenue of $15.3 million was attributable to lower average sales prices due to an increase in point-of-sale discounts and other incentives provided to customers as compared to the year ended December 31, 2005.
35
Total revenue
Total revenue increased 15% to $369.6 million for the year ended December 31, 2006 from $320.5 million for the year ended December 31, 2005. Revenue generated from the sale and activation of wireless devices and services accounted for approximately 96% of consolidated revenue for the years ended December 31, 2006 and 2005. Revenue from our top three wireless carriers represented 68% of consolidated revenue for the year ended December 31, 2006 compared to 67% for the comparable period of 2005. Wireless activations and services revenue and equipment sales revenue may vary from period to period based on our promotional efforts, which include subsidizing the costs of devices purchased by our customers. In 2006, total revenue was impacted by dollar increases in deactivation experience and carrier disputed amounts. We expect that such reserves will be significant in the future as our business grows. We expect that revenue from the sale and activation of wireless devices and services will continue to increase during 2007 compared to 2006 performance.
COST OF REVENUE
Cost of revenue consists mainly of the cost of wireless devices (equipment) sold to our wireless activations and services customers. Our cost of revenue related to wireless equipment sales increased to $215.2 million for the year ended December 31, 2006 as a result of a higher volume of devices sold during the period at a lower average cost compared to sales of such devices in the year ended December 31, 2005. Total cost of revenue increased 14% to $217.9 million for the year ended December 31, 2006 compared to $191.7 million for the year ended December 31, 2005. Cost of revenue from the sale of wireless devices accounted for approximately 99% of consolidated cost of revenue for the years ended December 31, 2006 and 2005. As a percentage of total revenue, cost of equipment revenue decreased to 57% of total revenue for the year ended December 31, 2006 compared to 59% for the year ended December 31, 2005.
OPERATING EXPENSES
Sales and Marketing
Sales and marketing expenses increased 27% to $118.8 million for the year ended December 31, 2006 from $93.7 million for the corresponding period of 2005. The increase of $25.0 million included a $25.3 million increase from the growth of existing marketing relationships and the addition of new marketing partner relationships since December 31, 2005. Our marketing expenses largely comprise payments to on-line advertisers, search engines and third-party marketing partners based on orders or activations. We incurred approximately $104.8 million of third-party marketing expenses in the year ended December 31, 2006. Such expenses were higher in the year ended December 31, 2006 than corresponding periods of 2005 due to increased wireless activation competition, and increased rates and volume of advertising, which caused our customer acquisition costs to increase. In addition, advertising placement and search costs also increased. We expect that marketing expenses will continue to represent a significant percentage of our revenue in future periods.
General and Administrative
General and administrative expenses increased 21% to $76.6 million for the year ended December 31, 2006 from $63.1 million for the corresponding period of 2005. General and administrative expenses increased $13.4 million for year ended December 31, 2006 mainly as a result of $11.2 million of costs incurred to evaluate, research and settle rebate matters associated with the District of Columbia attorney general’s action including$8.0 million paid to certain customers without regard to their eligibility to receive a rebate; a $4.3 million increase in employee related costs due to a larger workforce; a $3.7 million increase in costs incurred for other professional services; $1.7 million increase in stock-based compensation; and a $0.7 million increase for earn-out and settlement costs related to the A1 Wireless acquisition. These increases were partially offset by an $8.2 million decrease in severance costs.
36
Depreciation and Amortization
Depreciation and amortization expenses, which are amortized over periods ranging from 18 months to 7 years, increased 73% to $17.1 million for the year ended December 31, 2006 from $9.8 million for the year ended December 31, 2005. The increase was primarily due to the costs associated with developing new functionality related to our websites, product offerings, and normal fixed asset depreciation on an increased amount of capital expenditures as compared to the corresponding period of 2005. In addition, 2005 expenses were reduced by a $0.9 million adjustment to correct a computational error in the fixed asset system that caused depreciation expense to be overstated.
Restructuring
In 2005, we implemented a restructuring plan following the acquisition of A1 Wireless, to take advantage of synergies gained through the acquisition and to restructure our operations for efficiency purposes. For the year ended December 31, 2005, we recognized $0.8 million in restructuring costs which related to workforce reduction and excess facilities. All costs related to this plan were paid out in 2005. For the year ended December 31, 2006, we incurred $2.6 million of restructuring costs primarily due to severance costs and stock-based compensation for certain employees related to a plan completed in 2006.
Loss from Continuing Operations
Loss from continuing operations increased to $63.5 million for the year ended December 31, 2006 from $37.8 million for the year ended December 31, 2005 as a result of increasing revenue and decreasing cost of revenue and general operating expenses as a percentage of revenue.
Net Loss
Net loss increased to $63.7 million for the year ended December 31, 2006 from $38.2 million for the year ended December 31, 2005.
Comparison of the Results of Operations for the years ended December 31, 2005 and 2004
| | | | | | | | | | | | | | | | | | | |
| | | Year Ended December 31, | | | Change Between 2004 and 2005 | |
| | | 2004 | | | 2005 | | |
| (amounts in thousands) | | Amount | | % of
Revenue | | | Amount | | % of
Revenue | | | Amount | | | % | |
| | | | | | | | | | | | | | | | | | | |
Revenue: | | | | | | | | | | | | | | | | | | | |
Activation and services | | $ | 123,265 | | 80 | % | | $ | 233,730 | | 73 | % | | $ | 110,465 | | | 90 | % |
Equipment | | | 31,603 | | 20 | % | | | 86,809 | | 27 | % | | | 55,206 | | | 175 | % |
| | | | | | | | | | | | | | | | | | | |
Total revenue | | $ | 154,868 | | 100 | % | | $ | 320,539 | | 100 | % | | $ | 165,671 | | | 107 | % |
| | | | | | | | | | | | | | | | | | | |
Cost of revenue: | | | | | | | | | | | | | | | | | | | |
Activation and services | | $ | 1,752 | | 1 | % | | $ | 1,221 | | 0 | % | | $ | (531 | ) | | -30 | % |
Equipment | | | 83,075 | | 54 | % | | | 190,509 | | 59 | % | | | 107,434 | | | 129 | % |
| | | | | | | | | | | | | | | | | | | |
Total cost of revenue | | $ | 84,827 | | 55 | % | | $ | 191,730 | | 59 | % | | $ | 106,903 | | | 126 | % |
| | | | | | | | | | | | | | | | | | | |
Selected operating expenses: | | | | | | | | | | | | | | | | | | | |
Sales and marketing | | $ | 42,867 | | 28 | % | | $ | 93,726 | | 29 | % | | $ | 50,859 | | | 119 | % |
General and administrative | | | 34,942 | | 23 | % | | | 63,131 | | 20 | % | | | 28,189 | | | 81 | % |
Depreciation and amortization | | | 6,444 | | 4 | % | | | 9,840 | | 3 | % | | | 3,396 | | | 53 | % |
Restructuring | | | — | | 0 | % | | | 847 | | 0 | % | | | 847 | | | 100 | % |
37
REVENUE
| | | | | | | | | | | | | | | | | | |
| | | Year Ended December 31, | | | Change Between 2004 and 2005 | |
| | | 2004 | | | 2005 | | |
| (amounts in thousands) | | Amount | | % of
Revenue | | | Amount | | % of
Revenue | | | Amount | | % | |
Activations and services: | | | | | | | | | | | | | | | | | | |
Wireless activation | | $ | 115,924 | | 75 | % | | $ | 222,047 | | 69 | % | | $ | 106,123 | | 92 | % |
MVNE and data services | | | 7,341 | | 5 | % | | | 11,683 | | 4 | % | | | 4,342 | | 59 | % |
| | | | | | | | | | | | | | | | | | |
| | | 123,265 | | 80 | % | | | 233,730 | | 73 | % | | | 110,465 | | 90 | % |
| | | | | | |
Equipment: | | | | | | | | | | | | | | | | | | |
Wireless activation | | $ | 31,603 | | 20 | % | | $ | 86,809 | | 27 | % | | $ | 55,206 | | 175 | % |
| | | | | | |
Total Revenue: | | | | | | | | | | | | | | | | | | |
Wireless activation | | $ | 147,527 | | 95 | % | | $ | 308,856 | | 96 | % | | $ | 161,329 | | 109 | % |
MVNE and data services | | | 7,341 | | 5 | % | | | 11,683 | | 4 | % | | | 4,342 | | 59 | % |
| | | | | | | | | | | | | | | | | | |
| | $ | 154,868 | | 100 | % | | $ | 320,539 | | 100 | % | | $ | 165,671 | | 107 | % |
| | | | | | | | | | | | | | | | | | |
Activations and Services
Our activations and services revenue increased 90% to $233.7 million for 2005 from $123.3 million for 2004. The increase in activations and services revenue of $110.5 million was attributable to a $109.7 million increase in revenue from our WAS business unit, which was primarily grown through existing marketing partners and increased advertising efforts; $3.4 million of revenue from the provisioning of MVNE Services offset by a $2.7 million decrease in revenue from our Data Services business unit.
Equipment
Our revenue from sales of equipment increased 175% to $86.8 million for 2005 from $31.6 million for 2004. The increase in equipment revenue of $55.2 million was primarily attributable to an increase in revenue from equipment sales in connection with our WAS business unit due to an increase in the volume of activations.
Revenue
Total revenue increased 107% to $320.5 million for 2005 from $154.9 million for 2004. Approximately $165.0 million of the increase was attributable to increases in business volume, as a result of increased activations in our WAS segment which was primarily grown through existing marketing partners and increased advertising efforts. The remaining net increase was the result of revenue reductions from our Data Services business unit of $2.7 million offset by revenue generated from our MVNE Services business unit of $3.4 million.
COST OF REVENUE
Total cost of revenue increased 126% to $191.7 million for 2005 from $84.8 million for 2004. The increase in cost of revenue was attributable to a $107.4 million increase in cost of revenue in our WAS business unit due to increase in the number of devices sold and the average device cost, partially offset by a $0.5 million decrease in cost of activations and services revenue.
OPERATING EXPENSES
Sales and Marketing
Our sales and marketing expenses increased 119% to $93.7 million for 2005 from $42.9 million for 2004. This increase was comprised mainly of the following: $42.6 million from growth of existing marketing
38
relationships and adding new marketing partner relationships during 2005; $4.6 million from increased payroll related costs and benefits associated with a greater number of sales related positions in 2005 to support the WAS and MVNE Services business units. Sales and marketing expenses also included stock-based compensation expense of $2.2 million for 2005.
Our marketing expenses largely comprise payments to on-line advertisers, search engines and third-party marketing partners based on orders or activations. We incurred approximately $16.7 million of the increase in these third-party marketing expenses in the fourth quarter of 2005. Such expenses were higher in our fourth quarter as wireless activation competition with the wireless carriers, retail outlets and other e-commerce providers intensified, which caused our subscriber acquisition costs to increase from prior quarters in 2005. In addition, advertising placement and search costs also increased from comparable prior periods during the fourth quarter.
General and Administrative
Our general and administrative expenses increased 81% to $63.1 million for 2005 from $34.9 million for 2004. The expense increase of $28.2 million mainly comprised of the following: $10.5 million related to stock-based compensation expense primarily related to the modification of stock-based awards to certain employees; $4.2 million was the result of professional fees incurred related to our initial compliance efforts with Section 404 of the Sarbanes-Oxley Act of 2002; $3.9 million related to increased payroll related expenses from a larger workforce; $3.3 million from increased credit card processing fees and other costs associated with a higher volume of shipments and orders in 2005; $1.8 million related to increased facilities costs and telecommunication related expenses and $4.5 million related to other expenses. Stock-based compensation expense included in general and administrative expenses for 2005 was $15.6 million. Of the expense approximately $7.8 million related to stock-based compensation expense associated with the accelerated vesting of options and stock awards for certain employees that were terminated during 2005.
Depreciation and Amortization
Our depreciation and amortization expenses increased 53% to $9.8 million for 2005 from $6.4 million for 2004, which are amortized over a period ranging from 18 months to 7 years. The increase was due to the costs associated with developing new functionality related to our websites and product offerings, increased amortization related to intangible assets acquired during 2005 and partially offset by a $0.9 million adjustment to revise cumulative depreciation on various assets acquired over the past three years.
Restructuring Costs
In 2005, and subsequent to the acquisition of A1 Wireless, we entered into a restructuring plan to take advantage of synergies gained through the acquisition of A1 Wireless and to restructure other operating segments for efficiency purposes. We recognized $0.8 million in restructuring costs for 2005, which primarily related to workforce reduction. All such costs were incurred in 2005.
Loss from Continuing Operations
Loss from continuing operations increased to $37.8 million for 2005 from $14.6 million for 2004. The increase in the loss was the result of increases in our cost of revenue and operating expenses as a percentage of revenue. Although we experienced a significant growth in revenue for 2005, cost of revenue and operating expenses both increased as described above in order to support the revenue growth we experienced.
Net Loss
Net loss increased to $38.2 million for 2005 from $10.2 million for 2004.
39
Liquidity and Capital Resources
Overview
Since inception, we have funded our operations principally through the sale of equity securities and to a lesser extent, subordinated debt, credit facilities, capital leases and term loans. The significant components of our working capital are inventory and liquid assets such as cash and trade accounts receivable, reduced by accounts payable, accrued expenses and deferred revenue.
Our future capital and operating requirements will depend on many factors, including the level of our revenue, the expansion of our sales and marketing activities, the cost of our fulfillment operations, potential investments in businesses or technologies and continued market acceptance of our products. Additionally, poor financial results, unanticipated expenses, acquisitions of technologies or businesses or strategic investments could give rise to additional financing requirements sooner than we expect. In the event that cash on hand and borrowings on our term loan are not sufficient to fund working capital requirements that are not satisfied through net cash provided by operating activities or future cash requirements, we could be required, or could elect, to seek additional funding through a public or private equity or debt financing in the future. There can be no assurance that we would be able to secure additional funding in the future.
We analyze our working capital requirements very closely as nearly $43.8 million or 69% of our December 31, 2006 accounts receivable was generated from revenue earned from three wireless carriers. Generally, we collect our monthly commissionable and residual revenue from these carriers within 30 to 60 days of the month-end following a subscriber’s activation net of commission chargebacks that occurred during the period. The timing of our collections from the wireless carriers is also influenced by our ability to reconcile our billing records with that of the respective carrier. Our matching and resolution process is an iterative process and although the substantial majority of our sales information readily matches, some records may require additional research which may delay collection beyond a 30-60 day period of time. The timing of collection of our accounts receivable influences the timing of payment to our vendors.
Our major uses of cash consist of payments made for inventory, marketing and payroll expenses and capital expenditures. Costs incurred for marketing and advertising is generally paid on the date the advertising occurs or shortly thereafter. We have payment terms with most other vendors we deal with that generally extend up to 45-60-days from service provisioning. Payroll expenses are generally funded semi-monthly. As of December 31, 2006, we owed the three wireless carriers referred to above approximately $39.2 million for wireless devices and accessories we procured from them or their affiliates in the fourth quarter.
Given the timing and significance of payments for advertising costs incurred in promoting our websites compared to the timing of collection of our accounts receivable, we monitor cash balances very closely and may slow payment to certain vendors while awaiting collection of accounts receivable from carrier customers. In addition, to the extent we have difficulties collecting accounts receivable, we may have to defer advertising promotions, inventory purchases or other costs which could impact our ability to generate revenue.
Cash balances at December 31, 2006 were $90.0 million an increase of $19.2 million from December 31, 2005. Cash balances at March 31, 2007 were approximately $53.4 million. We have an additional $25 million of liquidity remaining to be borrowed under our term loan. The funds may be drawn prior to July 31, 2007.
40
Consolidated Cash Flows
| | | | | | | | | | | | |
| | | Year Ended December 31, | |
| | | 2004 | | | 2005 | | | 2006 | |
| | | (amounts in thousands) | |
Net cash used in operating activities | | $ | (6,590 | ) | | $ | (20,077 | ) | | $ | (15,008 | ) |
Net cash used in investing activities | | | (15,466 | ) | | | (23,141 | ) | | | (25,554 | ) |
Net cash provided by financing activities | | | 93,994 | | | | 13,015 | | | | 59,751 | |
| | | | | | | | | | | | |
Change in cash and cash equivalents | | $ | 71,938 | | | $ | (30,203 | ) | | $ | 19,189 | |
| | | | | | | | | | | | |
Net cash used in operating activities was $15.0 million, $20.1 million and $6.6 million in 2006, 2005 and 2004, respectively. For the year ended December 31, 2006, net loss after adjustments for items to reconcile net loss to net cash provided by operating activities was $23.7 million. Such items include depreciation and amortization, increase in our allowance for doubtful accounts, non-cash interest expense and other expenses and stock-based compensation.
Changes in operating assets and liabilities from December 31, 2005 decreased net cash used in operating activities by approximately $8.7 million. Changes in working capital balances included an increase of current assets of approximately $39.0 million, excluding cash and cash equivalents, short-term investments and cash collected from notes receivable related to discontinued operations. The increase in these current assets was primarily the result of increased accounts receivable balances from December 31, 2005. The accounts receivable increase at December 31, 2006 was primarily the result of higher commission balances owed to us by the carriers as a result of increased revenue and the timing of collections at the end of the month of December.
Current liabilities, excluding debt and capital lease balances and acquisition earn-out obligations accrued during the period increased $48.9 million from December 31,2005. The increase was mainly the result of an increase in accounts payable offset by decreases in accrued liabilities and deferred revenue. A significant portion of the company’s accounts payable represent payables for inventory with the wireless carriers, original equipment manufacturers and third party distributors. The increase in accounts payable reflects the growth in business expenses and increased inventory balances on hand at December 31, 2006 as a result of higher year-end accounts receivable balances and the timing of payments made on accounts payable.
Net cash used in investing activities was $25.6 million, $23.1 million and $15.5 million in 2006, 2005 and 2004, respectively. Net cash used in investing activities in 2006 consisted mainly of $22.2 million of capital expenditures and $4.7 million paid for contingent consideration as a result of minimum EBITDA benchmarks for prior year acquisitions. Capital expenditures for 2006 consisted of $16.4 million of capitalized software labor and web development costs incurred primarily associated with enhancing our e-commerce infrastructure; $4.9 million of computer and other equipment and software, and $0.9 million of other furniture, equipment and leasehold improvements. Cash paid in 2006 for asset acquisitions included $4.0 million and $0.7 million related to the purchases of VMC and A1 Wireless, respectively. In 2007, planned capital expenditures are expected to approximate 2006 levels.
Net cash provided by financing activities was $59.8 million, $13.0 million and $94.0 million in 2006, 2005 and 2004, respectively. Cash provided by financing activities in 2006 consisted mainly of borrowings under our term loan of $73.6 million net of fees paid and less a $19.9 million re-payment of our credit facilities; proceeds from the exercise of warrants and options of $5.3 million partially offset by cash payments used to repurchase shares of our common stock for $3.7 million.
Borrowings Under our Term Loan. As of December 31, 2006, we maintained a term loan with Goldman Sachs Credit Partners L.P., Citicorp North America, Inc. and AP InPhonic Holdings, LLC which allowed for aggregate borrowing of up to $100.0 million. During 2006, we borrowed an aggregate principal amount of $75.0 million under the agreement. As of December 31, 2006, we have the ability to borrow an additional $25.0 million. This facility is secured by a first priority lien on substantially all of our assets. Interest on borrowings
41
under the term loan is payable quarterly at a fixed rate of 9.0%. Interest expense during 2006 also included $0.5 million of amortization of the discount on the term loan resulting from the allocation of a portion of the $75.0 million proceeds to detachable warrants.
Under the provisions of the term loan and the executed amendments, we are required to maintain certain minimum levels of EBITDA on a quarterly basis beginning December 31, 2006, and maintain a minimum cash balance by July 31, 2007, of $25.0 million at an institution designated by the lenders. The Company may draw the remaining $25.0 million of funds under the credit agreement before July 31, 2007. We also received an extension of the financial statement delivery requirements for the full year 2006 audited financials and associated compliance certificates to May 31, 2007, and the first quarter 2007 financials to June 15, 2007.
Common Stock Repurchase Program. From time to time during 2006, we repurchased 350,261 shares of our common stock for approximately $3.7 million under two separate share repurchase programs authorized by our Board of Directors. As of December 31, 2006, we were authorized by the Board of Directors to repurchase up to an additional $26.8 million of our common stock through November 3, 2007. From January 1 through May 29, 2007, we repurchased an additional 1,021,074 shares for approximately $10.7 million. There can be no assurance that we will repurchase up to the full amount that we have been authorized by our Board of Directors over this time period.
In February 2007, outstanding warrants of 627,390 were exercised resulting in the issuance of 150,735 shares of our common stock.
Contractual Obligations
The following table summarizes our contractual obligations, including interest on operating leases, and the expected effect on liquidity and cash flows as of December 31, 2006.
| | | | | | | | | | | | | | | |
| | | Total | | Less than
1 year | | 1 -3 years | | 4 - 5 years | | Over 5 years |
| | | | | (amounts in thousands) | | |
Term loan including fixed interest costs (a) | | $ | 95,512 | | $ | 7,856 | | $ | 87,656 | | $ | — | | $ | — |
Capital leases | | | 574 | | | 301 | | | 248 | | | 25 | | | — |
Operating leases | | | 4,079 | | | 1,806 | | | 2,273 | | | — | | | — |
Obligation to purchase certain advertising (b) | | | 4,531 | | | 4,531 | | | — | | | — | | | — |
Obligations under VMC APA (c) | | | 1,300 | | | 1,300 | | | — | | | — | | | — |
| | | | | | | | | | | | | | | |
| | $ | 105,996 | | $ | 15,794 | | $ | 90,177 | | $ | 25 | | $ | — |
| | | | | | | | | | | | | | | |
| (a) | Under the term loan agreement, we may repay or the lender may require the repayment of the debt on the third anniversary of the agreement. For the purpose of this presentation, we have included the contractual obligation due on the third anniversary. If not prepaid, the debt matures in November 2011. The term loan incurs interest at 9.00% per annum. |
| (b) | We have a commitment to purchase a minimum level of advertising and media services from a vendor by March 31, 2007. Such commitment period may be extended at the option of the vendor. |
| (c) | Under the VMC Asset Purchase Agreement, as amended, we have agreed to pay shareholders of VMC an additional $1.3 million in cash to settle any remaining contingent consideration. Of the $1.3 million, $0.2 million represents legal fees incurred during the settlement. |
Inflation
We do not believe that inflation has materially affected our operations.
42
Recent Accounting Pronouncements
In June, 2006, the FASB issued FASB Interpretation No. 48,Accounting for Uncertainty in Income Taxes—an interpretation of FASB Statement No. 109 (“FIN 48”). FIN 48 clarifies the accounting for uncertainty in income taxes recognized in an enterprise’s financial statements in accordance with SFAS No. 109,Accounting for Income Taxes. FIN 48 prescribes a recognition threshold and measurement attribute for the financial statement recognition and measurement of a tax position taken or expected to be taken in a tax return. FIN 48 also provides guidance on de-recognition, classification, interest and penalties, accounting in interim periods, disclosure, and transition. FIN 48 will apply to fiscal years beginning after December 15, 2006, with earlier adoption permitted. We will adopt FIN 48 effective January 1, 2007. As prescribed in the interpretation, the cumulative effect of applying the provisions of FIN No. 48 should be reflected as an adjustment to the opening balance of Stockholders’ Equity. We do not believe the adoption of this pronouncement will have any material effects on our consolidated financial position, results of operations, or cash flows from operations.
In September 2006, the FASB issued SFAS No. 157,Fair Value Measurements (“SFAS No. 157”). SFAS 157 defines fair value, establishes a framework for measuring fair value under generally accepted accounting principles, and expands disclosures about fair value measurements. SFAS 157 emphasizes that fair value is a market-based measurement, not an entity-specific measurement, and states that a fair value measurement should be determined based on the assumptions that market participants would use in pricing the asset or liability. SFAS 157 will become effective for our fiscal year beginning January 1, 2008. We do not believe the adoption of this pronouncement will have any material effects on our consolidated financial position, results of operations, or cash flows.
In February 2007, the Financial Accounting Standards Board issued SFAS 159,The Fair Value Option for Financial Assets and Financial Liabilities—including an amendment of FASB Statement No. 115( “SFAS No. 159”),which allows measurement at fair value of eligible financialassets and liabilities that are not otherwise measured at fair value. If the fair value option for an eligible item is elected, unrealized gains and losses for that itemwill be reported in current earnings at each subsequent reporting date. SFAS 159 also establishes presentation and disclosure requirements designed to drawcomparison between the different measurement attributes the company elects for similar types of assets and liabilities. SFAS No. 159 is effective for fiscal yearsbeginning after November 15, 2007. Early adoption is permitted. We do not believe the adoption of this pronouncement will have any material effects on our consolidated financial position, results of operations, or cash flows.
In June 2006, the FASB ratified the EITF Issue No. 06-3,How Taxes Collected from Customers and Remitted to Governmental Authorities Should Be Presented in the Income Statement” (“EITF 06-3”).EITF No. 06-3 requires an entity to disclose transactional tax amounts assessed by government authorities that are considered significant. EITF No. 06-3 is effective for interim and annual reporting periods beginning after December 15, 2006. We have determined that the adoption of this pronouncement will have no material impact to our consolidated financial position, results of operations, or cash flows.
Application of Critical Accounting Policies and Estimates
Our discussion and analysis of our financial condition and results of operations are based upon our consolidated financial statements, which have been prepared in accordance with generally accepted accounting principles in the U.S. The preparation of these statements requires us to make estimates and judgments that affect the reported amount of assets, liabilities, revenues and expenses, and related disclosure of contingent assets and liabilities. We base our estimates on historical experience and on various other assumptions that are believed to be reasonable under the circumstances, the results of which form the basis for making the judgments about our revenues, cost of revenues and the carrying values of assets and liabilities that are not readily apparent from other sources. Because this can vary in each situation, actual results may differ from the estimates under different assumptions and conditions. The following is a summary of these critical estimates.
43
Revenue Recognition
Activation and Services—We generate revenue primarily from wireless carriers, as well as a satellite television carrier, who pay commissions and volume and performance-based bonuses, for activating wireless services and features on their networks. We recognize commissions from wireless carriers upon shipment of activated devices to the customer. In addition to activation commissions, under certain conditions, certain carriers pay us a monthly residual fee for as long as a customer we activate for the carrier continues to be its subscriber, or for a fixed period of time depending on the carrier. Revenue from satellite television customers includes commissions earned at the time of the satellite service activation, net of an estimate for deactivations, as we are acting as an agent in the transaction.
Our revenue is reduced for estimated deactivations of the wireless services by customers prior to the expiration of a time period that ranges 90 to 180 days from the date of activation, depending on the wireless carrier. We estimate deactivations based on historical experience, which we have developed based on our experience with carriers, customer behavior and sources of customers, among other factors, allowing us to accrue estimates with what we believe is a high degree of certainty. Our estimated deactivation rates for the year ended December 31, 2006 and 2005 were 23.5% and 22.2% of gross carrier commission revenue for the respective periods. Any increase or decrease in the deactivation amount will cause a corresponding dollar-for-dollar increase or decrease in revenue. As an example, the impact of a 1% change in the deactivation rate applied to the year ended December 31, 2006 would have an increase or decrease in revenue and the corresponding reserve of $3.3 million. Any decrease in revenue resulting from an increase in deactivations would also be offset, in part, by returns of wireless devices. Our reserve for deactivations is reflected as a component of deferred revenue on our balance sheet. If we determine that we cannot accurately predict future deactivation experience, we may be required to defer 100% of our carrier commission revenue until the expiration of the appropriate chargeback period. New channels for which we have insufficient historical data to adequately estimate deactivation experience will be deferred through the expiration period for a period of 24 months, until such time that we can accurately estimate the deactivation experience for the new channel.
In addition to receiving commissions for each wireless subscriber activated, we earn performance bonuses from the wireless carriers based on negotiated performance targets. The most significant bonuses we earn are the quarterly volume bonus, which we collect from our wireless carriers on a monthly basis, based on current month activations. We record these bonuses as deferred revenue at the time of billing until we achieve the quarterly targets. We earn other quarterly bonuses from certain carriers for maintaining low customer churn and signing up wireless customers for certain additional monthly “features” such as data service or text messaging. Wireless carriers also periodically offer bonuses for achieving monthly volume and other performance targets and also formerly provided some bonus compensation under annual volume based plans. We recognize these monthly bonuses as earned in accordance with the provisions of SAB No. 104,Revenue Recognition in Financial Statements (“SAB No. 104”). Revenue is recognized only when all of the following criteria are met: (1) persuasive evidence of an arrangement exists, (2) delivery has occurred or services have been rendered; (3) the seller’s price to the buyer is fixed or determinable, and (4) collectibility is reasonably assured. Amounts collected in cash prior to meeting the above criteria are recorded as deferred revenue. Through 2005, commission revenue earned from the activation of carrier features had been deferred until the contractual chargeback period had lapsed and we did not have adequate historical collection data to reasonably estimate an allowance for uncollectible amounts. Beginning in 2006, we began to estimate commission revenue earned from feature activations based on historical experience which we have developed based on our experience with carriers and customer behavior over a period of time in excess of 24 months. As of December 31, 2005, $1.4 million of feature activations revenue was deferred, which would have been accrued for less an estimated reserve for deactivations, in the event that we had the appropriate experience with carriers and customer behavior at December 31, 2005. As of December 31, 2006, our estimated reserve for deactivations of feature activations was $0.6 million.
In the ordinary course of recording and collecting commissions from our wireless carrier partners, we engage in an active matching and reconciling process (the “matching process”) between source information for
44
customer wireless carrier activations generated and maintained in our back-office sales information systems and each carrier’s billing system. Although the substantial majority of our sales information matches to that of the carriers, matching differences do arise. Examples of such differences include (i) instances in which an activation per our records does not correlate to a commission fee payment schedule submitted by the carrier; (ii) commission fee payment collected from the carrier that is different than the expected payment per our sales records; and (iii) a deactivation identified on a carrier statement that does not match the carrier’s original commission fee payment for such activation.
Data files supported by our billing records related to differences are submitted monthly to each carrier for resolution. Resolution of these differences is usually an iterative process and it can take up to 12 months or longer for final resolution of any difference. Information is exchanged between us and the carrier throughout this process. We recognize revenue based on the underlying data maintained in our back-office sales information systems unless the carrier provides us details that supersede our information. Given the nature of these differences and based on our experience in resolving such items with the carriers, we are also able to determine an appropriate reserve against revenue to reflect the likely success or failure of resolving these differences. In certain instances when a wireless carrier denies a claim we may file in resolving differences of this nature, we will write-off the related accounts receivable while pursuing further collection efforts and will record into income at a future date if collected. To the extent that we collect commission or other fee payments in excess of what we have recorded, we will record revenue in the period of receipt net of estimated chargeback requirements.
Equipment revenue—Revenue from the sale of wireless devices and accessories in a multiple-element arrangement with services is recognized at the time of sale in accordance withEITF No. 00-21,RevenueArrangements with Multiple Deliverables, when fair value of the services element exists. Customers have the right to return devices within a specific period of time or usage, whichever occurs first. We provide an allowance for estimated returns of devices based on historical experience. Return rights of indirect retailers for wireless devices are limited to warranty claims, which are generally covered by the device manufacturers’ original warranties. In accordance with the provisions of SAB No. 104, we determined we have sufficient operating history to estimate equipment returns. In connection with wireless activations, we sell the wireless device to the customer at a significant discount (“equipment discount provisions” or “EDP”).
In the event a customer terminates their wireless service with the carrier within six months of activation and opts not to return the wireless device to us within the time frames permitted within our return policy, in many instances our sales contracts with the customer permit us to charge the customer an EDP termination fee. During 2004 and 2005 and prior to the three months ended June 30, 2006, revenue recognition of such fee was deferred until such fee was collected from the customer pursuant to SAB 104 as we did not have adequate historical collection data to reasonably estimate the ultimate collectibility of the receivable. Beginning April 1, 2006, we began to estimate EDP termination fee revenue based on historical experience of customer collection behavior which we have developed over a time period of 24 months which provides the basis on which to accrue revenue with an appropriate assurance of collectibility pursuant to SAB 104. As of March 31, 2006, $0.3 million of such revenue was deferred, which would have been accrued for in the event that we had adequate customer collection history, less an estimated reserve for uncollectible amounts. As of December 31, 2006, we had accrued as accounts receivable approximately $1.7 million in such EDP fees.
During the most recent quarter ended December 31, 2006, our handset return rate was 15.1% of handset revenue. We have recorded handset return rates of 11.7% and 10.4% for the years ended December 31, 2006 and 2005, respectively. Any increase or decrease in the actual handset return experience will cause a corresponding dollar-for-dollar decrease or increase in revenue. The impact of a 1% change in the handset returns rate applied to the year ended December 31, 2006 would have resulted in an increase or decrease in revenue of approximately $0.5 million with a corresponding increase or decrease in our cost of revenue.
45
Under certain conditions, consumers purchasing wireless devices from us may be eligible for a product rebate depending on the wireless device purchased, service contract activated and the consumer maintaining their service with the wireless carrier for a period of up to six months. We estimate and record an accrued consumer liability and cost of revenue for such rebate at the time of sale based on the terms of the rebate and our rebate redemption experience over the most recent 18 months for which the contractual rebate redemption period has lapsed. Our rebate redemptions are processed by a third party vendor that validates the consumer’s rebate redemption materials to ensure that the redemption request satisfies all terms and conditions of the rebate program to be eligible for payment. Only consumers that satisfy the redemption requirements of the rebate program earn the rebate amount under our normal terms and conditions.
During the last six months of 2006, we incurred and paid $8.0 million of payments made to consumers outside our customary rebate redemption process to parties that we believed generally had not satisfied all the terms and conditions of the respective rebate redemption program. Such amounts were paid to satisfy customer complaints and are viewed by us as “customer accommodation credits” and reflected in general and administrative expenses.
Inventory Valuation
Our inventory consists of wireless devices and accessories. The carrying value of inventory is stated at the lower of its cost or market value. Cost is determined using a method which approximates the first-in-first-out accounting method. We write down inventory for estimated obsolescence or unmarketable inventory equal to the difference between the cost of inventory and the estimated market value or replacement cost based upon assumptions about future demand and market conditions. If actual market conditions are less favorable than those projected, additional inventory write-downs may be required. Historically, we have not experienced significant write-offs, with the exception of returned, unmarketable inventory. During the year ended December 31, 2006, we have written off or fully reserved for credits due for wireless devices returned to our equipment providers totaling $4.0 million for which credit has yet to be received.
Stock-based Compensation
We adopted SFAS No. 123(R) on January 1, 2006 using the modified prospective application (“MPA”) method. SFAS No. 123(R) established standards for the accounting for transactions in which an entity exchanges its equity instruments for goods or services. SFAS No. 123(R) requires us to measure the cost of employee services received in exchange for an award of equity instruments usually stock options or unvested (restricted) stock awards based on the grant date fair value of the award. That cost is recognized over the period during which an employee is required to provide service in exchange for the award—the requisite service period (usually the vesting period). The amount of compensation expense recognized using the fair value method requires us to exercise judgment and make assumptions relating to the factors that determine the fair value of our stock option grants.
Prior to the adoption of SFAS No. 123(R), we applied the intrinsic value method of accounting for employee stock-based compensation as prescribed by Accounting Principles Board (“APB”) Opinion No. 25,Accounting for Stock Issued to Employees, and related interpretations including FASB Interpretation (“FIN”) No. 44,Accounting for Certain Transactions involving Stock Compensation an Interpretation of APBOpinion No. 25, issued in March 2000, to account for the equity grants to employees. Under this method, compensation expense was recorded on the date of grant only if the current market price of the underlying stock exceeded the exercise price. SFAS No. 123,Accounting for Stock-Based Compensation (“SFAS No. 123”), established accounting and disclosure requirements using a fair value-based method of accounting for stock-based employee compensation plans. As permitted by SFAS No. 123, we elected to continue to apply the intrinsic value-based method of accounting described above, and adopted the disclosure requirements of SFAS No. 123. All equity-based awards granted to non-employees were accounted for at fair value in accordance with SFAS No. 123. We incurred stock-based compensation expenses from grants of stock options, warrants and restricted stock awards.
46
In 2004, we recorded approximately $2.0 million in compensation expense related to the cashless exercise of approximately 1,250,000 stock options by certain employees in connection with the sale of Series E preferred stock. At our discretion, the cashless exercise was permitted in this unique circumstance resulting in the application of variable accounting to the transaction in accordance with Financial Accounting Standards Board Interpretation No. 44 for the options being exercised.
Goodwill and Intangible Assets
Goodwill and other intangible assets with indefinite useful lives are not amortized and are evaluated for impairment at least annually, or when events or circumstances suggest a potential impairment may have occurred. In accordance with SFAS No. 142,Goodwill and Other Intangible Assets (“SFAS No. 142”), we have selected the fourth quarter to perform the annual impairment test. SFAS No. 142 requires us to compare the fair value of the reporting unit to its carrying amount on an annual basis to determine if there is a potential impairment. If the fair value of the reporting unit is less than its carrying value, an impairment loss is recorded to the extent that the fair value of the goodwill within the reporting unit is less than the carrying value. The fair value for goodwill and other intangible assets not subject to amortization is determined based on discounted cash flows, market multiples or other measures, as appropriate. Based on our assessment for the year ended December 31, 2006, no impairments of goodwill or other intangible assets were noted.
For the year ended December 31, 2005, we determined that a supplier relationship valued at $3.7 million had an indefinite useful life as of the April 26, 2005 acquisition date of VMC Satellite, Inc. During 2006, we determined that as of the acquisition date, the supplier relationship had a useful life of ten years in accordance with SFAS No. 142. During the fourth quarter of 2006, we recognized $0.3 million of amortization expense for the period from April 26, 2005 to December 31, 2005. We do not believe the impact of this adjustment in 2006 to be material to the fiscal year 2006 or 2005 as a result of this change.
Provision for Income Taxes
SFAS No. 109,Accounting for Income Taxes,establishes financial accounting and reporting standards for the effect of income taxes. During the years ended December 31, 2004, 2005 and 2006, we did not have any income tax expense or benefit because a full valuation allowance was provided against net deferred tax assets. Income taxes are accounted for under the asset and liability method. Deferred tax assets and liabilities are recognized for the future tax consequences attributable to differences between the financial statement carrying amounts of existing assets and liabilities and their respective tax bases and operating loss carryforwards. Deferred tax assets and liabilities are measured using enacted tax rates expected to apply to taxable income in the years in which those temporary differences are expected to be recovered or settled. The effect on deferred tax assets and liabilities of a change in tax rates is recognized as a component of net income in the period that includes the enactment date.
As of December 31, 2006, we had approximately $196.1 million of net operating loss carryforwards, which may be available to offset any future taxable income, subject to ownership change limitations. Net operating loss carryforwards may be used to offset up to 90% of our alternative minimum taxable income. Alternative minimum taxes are allowed as credit carryovers against regular tax in the future in the event that the regular tax exceeds alternative minimum tax expense. The net operating loss carryforwards will begin to expire in 2019. Certain of these net operating losses obtained through our acquisitions are not included in the components of the deferred tax assets, as the use of these losses will be significantly limited under Section 382 of the Internal Revenue Code.
ITEM 7A. QUANTITATIVE AND QUALITATIVE DISCLOSURES ABOUT MARKET RISK
We currently do not hedge interest rate exposures and have not used derivative financial instruments for speculation or trading purposes. At December 31, 2006, our debt financing consisted primarily of principal amounts outstanding under our fixed rate term loan. Our borrowings under the term loan are secured by substantially all of our assets.
47
ITEM 8. FINANCIAL STATEMENTS AND SUPPLEMENTARY DATA
The information required by this item is set forth on pages F-1 to F-31.
ITEM 9. CHANGES AND DISAGREEMENTS WITH ACCOUNTANTS ON ACCOUNTING AND FINANCIAL DISCLOSURE
On September 12, 2005, our Audit Committee of the Board of Directors (the “Audit Committee”) dismissed KPMG LLP (“KPMG”) as our independent registered public accounting firm.
The audit reports of KPMG on our consolidated financial statements as of and for the year ended December 31, 2004, did not contain an adverse opinion or a disclaimer of opinion and were not qualified or modified as to uncertainty, audit scope or accounting principles, except that the audit reports as of and for the year ended December 31, 2004, contained separate paragraphs stating that we adopted EITF 00-21,Revenue Arrangements with Multiple Deliverables,effective July 1, 2003.
During the two most recently completed fiscal years prior to their dismissal and through September 12, 2005, there were no disagreements with KPMG on any matter of accounting principles or practices, financial statement disclosure, or auditing scope or procedure, which disagreements, if not resolved to the satisfaction of KPMG, would have caused KPMG to make reference to the subject matter of the disagreement in connection with its reports on our financial statements for the past two fiscal years. In addition, there were no “reportable events” (as defined in Item 304(a)(1)(v) of Regulation S-K) during the two most recently completed fiscal years prior to their dismissal and through September 12, 2005.
We requested KPMG to furnish us with a letter addressed to the Securities and Exchange Commission stating whether or not it agreed with the above statements. A copy of that letter, dated September 20, 2005, was included with our current report on Form 8-K filed with the Securities and Exchange Commission on September 20, 2005.
On September 19, 2005, our Audit Committee engaged Grant Thornton LLP (“Grant Thornton”) as our independent registered public accounting firm to audit the financial statements and internal control over financial reporting for the year ended December 31, 2005.
ITEM 9A. CONTROLS AND PROCEDURES
Our management, including our principal executive and principal financial officer, has evaluated the effectiveness of our disclosure controls and procedures as of December 31, 2006. Our disclosure controls and procedures are designed to provide reasonable assurance that the information required to be disclosed in this annual report on Form 10-K has been appropriately recorded, processed, summarized and reported within the time periods specified in the Securities and Exchange Commission’s rules and forms, and that such information is accumulated and communicated to our management, including our principal executive and principal financial officers, to allow timely decisions regarding required disclosure. Based on that evaluation, our principal executive and principal financial officer have concluded that our disclosure controls and procedures are effective at the reasonable assurance level.
Management’s Annual Report on Internal Control over Financial Reporting
Our Management, including our principal executive and principal financial officer, has evaluated the effectiveness of the Company’s disclosure controls and procedures (as defined in Rules 13a-15(e) and 15d-15(e) under the Securities Exchange Act of 1934, as amended (the “Exchange Act”)), as of December 31, 2006. Our disclosure controls and procedures are designed to provide reasonable assurance that information required to be disclosed in the reports we file or submit under the Exchange Act is recorded, processed, summarized and reported within the time periods specified in the Securities and Exchange Commission’s rules and forms, and that such information is accumulated and communicated to our management, including our Chief Executive Officer
48
and Chief Financial Officer, to allow timely decisions regarding required disclosures. Based on the evaluation and the identification of the material weaknesses in internal control over financial reporting described below, as well as our inability to file this Annual Report on Form 10-K for the year ended December 31, 2006 (the “Form 10-K”) within the statutory time period, management concluded that our disclosure controls and procedures were not effective as of December 31, 2006.
The Company is in the process of implementing several improvements to remediate and remove the material weaknesses identified below. The Company will continue to strengthen its accounting resources, including the hiring of additional accounting personnel, the adoption of an internal audit department charter and improving general computer processes, procedures and controls.
Management is responsible for establishing and maintaining adequate internal control over financial reporting. Internal control over financial reporting is defined in Rule 13a-15(f) or 15d-15(f) promulgated under the Securities Exchange Act of 1934, as amended, as a process designed by, or under the supervision of, our principal executive and principal financial officers and effected by our board of directors, management and other personnel, to provide reasonable assurance regarding the reliability of financial reporting and the preparation of financial statements for external purposes in accordance with generally accepted accounting principles.
Management assessed the effectiveness of the internal control over financial reporting as of December 31, 2006 using the criteria established inInternal Control—Integrated Frameworkissued by the Committee of Sponsoring Organizations of the Treadway Commission (COSO). Because of its inherent limitations, internal control over financial reporting may not prevent or detect misstatements. Projections of any evaluation of effectiveness to future periods are subject to the risk that controls may become inadequate because of changes in conditions, or that the degree of compliance with the policies or procedures may deteriorate. All internal control systems, no matter how well designed, have inherent limitations. Therefore, even those systems determined to be effective can provide only reasonable assurance with respect to financial statement preparation and presentation.
A material weakness is a control deficiency, or combination of control deficiencies, that results in more than a remote likelihood that a material misstatement of the annual or interim financial statements will not be prevented or detected. Management identified material weaknesses in our internal controls including the following:
| | • | | We did not maintain sufficient staffing of operational and financial resources.We did not maintain staffing in operational and financial resources sufficient to provide the level of controls and analysis required on a timely basis in light of the increasing complexity and growth of our business. This resulted in certain accounting processes and controls not being performed on a timely basis and the inability to maintain an adequate control environment, resulting in numerous material adjusting entries being made after year end. This material weakness contributed to errors such as those relating to revenue recognition and accounts receivable, accrual of rebates and other liabilities and adjustments made to properly account for certain amounts due from our vendors described below. |
| | • | | We did not always effectively communicate information to our finance department. Specifically, we failed to maintain effective communication channels to adequately identify and record certain transactions during 2006. The failure to provide this communication contributed to errors relating to accounting and reporting of expenses and liabilities. This material weakness caused or contributed to, adjustments necessary to appropriately record amounts due to marketing partners, accounts receivable allowances and reserves for deactivations. |
| | • | | We did not maintain effective controls over the recordation, accuracy and completeness of activations and services revenue and related accounts receivable. |
We did not take steps to adequately identify and appropriately record certain commission and bonus revenue received during the year from various wireless carriers in a timely and accurate manner. Recording amounts received from carriers in the appropriate accounts in a timely and accurate manner is an important business process control that is essential to the correct reporting of amounts in the financial statements. This material weakness contributed to errors relating to accounting and reporting for revenue and accounts receivable.
49
We did not utilize an appropriate methodology during the year in recording receivables from wireless carriers associated with disputed deactivations, churn bonuses and other carrier related fees. We overstated accounts receivable by using a methodology that anticipated future improvements in collections beyond that supported by past experience, and which did not consider certain current factors and other information. As a result of this material weakness, an adjustment was necessary to properly record revenue and related receivables from these fees.
We recorded additional allowances for doubtful accounts receivable during our restatement process. The proper accounting for the allowance for doubtful accounts requires that estimates must be made on the future collectibility of receivables. Specifically after analysis we concluded that reserves were required for doubtful collections on disputed accounts receivable, an additional reserve was necessary to provide for disputed accounts receivable arising from the most recent month of carrier commissions arising from December activations. In addition, our estimating process failed to take into account all information from ongoing collections processes in order to properly state our reserves. An addition to our reserves was necessary as a result of this material weakness.
| | • | | We did not maintain effective controls over the determination and accuracy of equipment revenue and related accounts receivable. We did not utilize an appropriate methodology during the year in recording certain fees due from consumers when contracts are cancelled within specified time periods or the wireless device is not returned to us. Specifically, related accounts receivable were overstated to the extent that we used collection percentages which anticipated improvements in excess of past experience. As a result of this material weakness, an adjustment was necessary to properly record revenue and related receivables from these fees. |
| | • | | We did not maintain effective controls over the accuracy and completeness of consumer product rebate liabilities. Specifically we did not utilize an appropriate methodology during the year in recording rebates payable to eligible consumers. We understated the consumer product rebate liability by not considering the appropriate amount of open periods eligible for rebates and the backlog of possible eligible rebates that had been delivered to outsourced payment service providers. As a result of this material weakness, an adjustment was necessary to properly record product rebate expenses and related payables. |
| | • | | We did not maintain effective controls over the accuracy and completeness of costs of goods sold and amounts due from vendors. Specifically, we did not maintain adequate documentation to support the proper accounting for inventory movements related to support phone shipments for refitting and refurbishment. We overstated inventory or receivables in-kind by not maintaining adequate documentation of these phones provided to outside services providers. As a result of this material weakness, an adjustment was necessary to properly record costs of goods sold and amounts due from vendors. |
These material weaknesses resulted in adjustments to our revenue and accounts receivable and certain other financial statement line items as referred to above and resulted in the restatement of previously issued consolidated financial statements for the three, six and nine-month periods ended March 31, 2006, June 30, 2006 and September 30, 2006, respectively.
Based on the COSO criteria inInternal Control-Integrated Framework and because of these material weaknesses, we have concluded that as of December 31, 2006, internal control over financial reporting was not effective. As a result of this conclusion, management performed significant additional substantive review of those areas described above where it identified material weaknesses to gain assurance that the financial statements as included herein are fairly stated in all material respects.
Management’s assessment of the effectiveness of our internal control over financial reporting as of December 31, 2006 has been audited by Grant Thornton LLP, an independent registered public accounting firm, as stated in their Report which is included in Item 8 of this Annual Report on Form 10-K.
50
Remediation Efforts to Address Material Weaknesses
While we have taken and are in the process of taking appropriate actions with respect to our internal control over financial reporting, such deficiencies will not be considered remediated until the new internal controls operate for a period of time and are tested by both management and our independent registered public accounting firm such that we both can conclude these controls are operating effectively. In addition, we will continue to monitor the effectiveness and sustainability of new controls on an ongoing basis and seek to identify improvements to existing controls. Accordingly, we are in the process of implementing the following actions to remediate the material weaknesses identified in our “Management’s Annual Report on Internal Control over Financial Reporting”:
| | • | | Replacement of our chief financial officer; |
| | • | | Appointment of a chief accounting officer and refinement of the accounting function to improve execution and monitoring of accounting processes, review procedures, GAAP application and identified controls; |
| | • | | Hiring of a greater number of industry skilled and technically experienced employees in the accounting and finance organization to supplement existing employee base; |
| | • | | Development of a comprehensive training program to ensure all accounting employees receive periodic training and continuing education in requisite areas and generally accepted accounting principles; |
| | • | | Refinement of communications programs and contract review policies and procedures to ensure accounting department is timely and routinely informed of operating matters; |
| | • | | Continued enhancement of our general computer processes, procedures and controls; |
| | • | | Continued emphasis of the importance of establishing the appropriate environment in relation to accounting, financial reporting and internal control over financial reporting, and the importance of identifying areas of improvement; |
| | • | | Complementing resources of our internal audit department and taking steps to enhance the independence of internal audit by strengthening its reporting relationship to the Audit Committee; and |
| | • | | As approved by the Audit Committee, adoption of a charter setting forth the purpose, authority and responsibility of the internal audit activity. The charter defines the role of internal audit as providing independent, objective assurance and consulting services designed to add value and improve operations. The internal audit department (“Internal Audit”) will perform specific audits to assess whether objectives are being achieved in the areas of operations, financial reporting and compliance with applicable laws, regulations and policies. Internal Audit will report functionally to the Audit Committee and administratively to the chief executive officer. Internal Audit will have unrestricted access to our records, property and personnel and have full and free access to the Audit Committee. |
Our testing and evaluation of the operating effectiveness and sustainability of these changes to our internal control over financial reporting have not yet been completed as the above-referenced remediation actions are still in the implementation process. In addition, our efforts to remediate deficiencies surrounding the levels of our staffing and related levels of expertise may take some time to remediate over the next several quarters.
ITEM 9B. OTHER INFORMATION
None.
51
PART III
ITEM 10. DIRECTORS, EXECUTIVE OFFICERS AND CORPORATE GOVERNANCE
The Company’s executive officers, key employees and directors are as follows:
| | | | |
Name | | Age | | Position with the Company |
| Executive Officers: | | | | |
| David A. Steinberg (4) | | 37 | | Chairman of the Board and Chief Executive Officer |
| Andrew B. Zeinfeld | | 46 | | President, E-Commerce |
| Brian J. Curran | | 43 | | Chief Operating Officer |
| George Z. Moratis | | 41 | | Executive Vice President and Chief Accounting Officer |
| | |
| Non-Management Directors: | | | | |
| John Sculley (1)(2)(4) | | 68 | | Vice Chairman of the Board |
| Blake Bath (2)(3) | | 41 | | Director |
| Ira Brind (1)(2)(3) | | 66 | | Director |
| Laurence E. Harris (3) | | 71 | | Director |
| Jack F. Kemp (1) | | 71 | | Director |
| Key Employees: | | | | |
| Frank C. Bennett III | | 48 | | President, MVNE Services |
| Gregory S. Cole | | 37 | | Senior Vice President and Corporate Treasurer |
| Walter W. Leach III | | 44 | | General Counsel and Corporate Secretary |
| Gary J. Smith | | 40 | | Chief Information Officer |
| Michael E. Walden | | 37 | | President, 1010 Interactive LLC |
| Brian T. Westrick | | 38 | | President, Wireless Activation and Services |
| (1) | Member of the Compensation Committee. |
| (2) | Member of the Nominating and Governance Committee. |
| (3) | Member of the Audit Committee. |
| (4) | Member of the Mergers and Acquisitions Committee. |
Set forth below is certain information regarding the positions and business experience of each executive officer, director and key employee of the Company.
Executive Officers
David A. Steinberg, our founder, has served as our chairman of the board of directors and chief executive officer since our inception and served as president from August 2002 until March 2004. Prior to founding InPhonic, Mr. Steinberg was chairman, president and chief executive officer of Sterling Cellular, Inc., a distributor of wireless products that he founded in November 1993. In April 2004, Mr. Steinberg was appointed to the board of the United States Chamber of Commerce. In June 2002, Mr. Steinberg was named the Greater Washington Ernst & Young Entrepreneur of the Year in the communications category. Mr. Steinberg holds a B.A. from Washington & Jefferson College.
Andrew B. Zeinfeld has served as our President of E-Commerce since April 2006. Prior to joining us in April 2006, Mr. Zeinfeld served in a variety of management positions at RadioShack Corporation during a 28-year term that began in 1978, and served most recently as senior vice president and chief retail services officer of radioShack corporation.
Brian J. Curran has served as our chief operating officer since May 2006. From August 2000 to May 2006, Mr. Curran was the vice president of customer centricity of Best Buy Co., Inc. While at Best Buy, Mr. Curran was responsible for the fulfillment and customer service operations of the 100 million customer service phone
52
calls that Best Buy receives annually. Mr. Curran was also uniquely instrumental in managing the launch of BestBuy.com. Prior to joining Best Buy, Mr. Curran was employed by Comp USA Management Co. from December 1992 until August 2000 where he served in increasingly senior roles culminating in vice president of direct sales. Mr. Curran was employed by Checkered Flag, Inc. as the sales and finance manager from 1986 to 1992. Mr. Curran began his career with the United States Navy where he remained until 1986.
George Z. Moratis, has served as our senior vice president of financial reporting and analysis since October 2005 and chief accounting officer since May 2007. From November 2004 to June 2005, Mr. Moratis served as senior vice president and treasurer of USA Mobility, a provider of wireless communications solutions to the healthcare, government, large enterprise and emergency response sectors. From December 1998 to November 2004, Mr. Moratis served in several management positions and most recently was chief financial officer, treasurer and principal accounting officer of Metrocall Holdings, Inc., a provider of traditional paging and advanced wireless data and messaging services, until its acquisition by USA Mobility in November 2004. Prior to joining Metrocall, Mr. Moratis spent several years with MCI Communications Corporation, the U.S. Securities and Exchange Commission, and Deloitte & Touche in several different roles. Mr. Moratis holds a B.A. degree from the University of Pittsburgh and is a certified public accountant.
Non-Management Directors
John Sculley is vice chairman of our board of directors and has served on our board of directors since February 2000. Since June 1994 until 2004, Mr. Sculley served as a partner of Sculley Brothers LLC, a private investment and advisory services company. Since 2004, he has been Venture Partner at Rho Capital Partners. Prior to forming Sculley Brothers, Mr. Sculley was chief executive officer of Apple Computer, Inc. from 1983 until 1993. From 1967 to 1983, Mr. Sculley held marketing and management positions at the Pepsi-Cola Company, including serving as its president and chief executive officer from 1978 to 1983. Mr. Sculley serves on the board of directors of MetroPCS, Inc., Transforma Acquisition Group Inc. and several private companies. Mr. Sculley holds a B.A. from Brown University and an M.B.A. from The Wharton School of the University of Pennsylvania.
Blake Bath has served on our board since October 2006. Mr. Bath most recently served as managing director and senior equity research analyst for Lehman Brothers, a financial services firm, where he has covered wireline and wireless telecommunications services since January 1996. From September 1992 to September 2006, Mr. Bath held several equity research positions, including as the senior analyst for telecommunications at Lehman Brothers. Prior to joining Lehman Brothers as a senior analyst in January 1996, Mr. Bath was the primary telecommunications analyst at Sanford C. Bernstein & Co., LLC, an investment research firm, from 1992 to 1996. From 1989 to 1992, Mr. Bath served as an analyst in the strategic planning and corporate finance organizations at MCI Communications Corporation, a telecommunications carrier. Mr. Bath holds an M.B.A. from Columbia University and a B.S. degree from the University of Michigan.
Ira Brind has served on our board of directors since December 2000. Since May 1989, Mr. Brind has served as president and chief executive officer of Brind Investments, Inc. Mr. Brind was the president and co-founder of Brind-Lindsay & Co., Inc., a private equity and venture capital firm, from 1987 to December 2004. From 1967 until 1983, Mr. Brind was the chief executive officer of Brind Leasing Corporation, a full service truck leasing company, which he sold to McDonnell Douglas. He was chief executive officer and president of McDonnell Douglas Truck Services, a truck leasing company, from 1983 until 1987. Mr. Brind is currently the chairman emeritus of the board of trustees of Thomas Jefferson University Hospital, vice chairman of the Board of Trustees of University of the Arts, member of the Board of Trustees of the Wistar Institute, the Connelly Foundation, Thomas Jefferson University and the Jefferson Health System. Mr. Brind serves on the board of directors of several private companies. Mr. Brind holds a B.A. and a J.D. from the University of Pennsylvania.
Laurence E. Harris has served as a director since March 2006. He is “of counsel” at the law firm Patton Boggs LLP and was a partner with the firm from May 2001 until December 2004. From December 1996 to April 2001, Mr. Harris was senior vice president and general counsel of Teligent, Inc., an international
53
telecommunications company. Teligent, Inc. filed a voluntary petition for bankruptcy in May 2001. From 1992 to 1996, Mr. Harris served as senior vice president of law and public policy for MCI Communications Corporation. From 1982 to 1992, Mr. Harris was president and chief operating officer of Metromedia Telecommunications, Inc. and CRICO Communications, a privately-held paging company. Prior to Metromedia, Mr. Harris served as chief of the Federal Communication Commission’s Mass Media Bureau. From 1972 to 1982, Mr. Harris served as a vice president of law and public policy for MCI, managing corporate relations for the Federal Communications Commission (FCC) and the office of telecommunications policy at the White House. Mr. Harris was a lieutenant in the U.S. Navy, serving in the destroyer fleet. Mr. Harris serves on the board of directors of MCI, where he is a member of the risk and corporate governance committees. Mr. Harris also serves on the board of directors and is chairman of the audit committee for Sports Brands International, Inc. Mr. Harris holds a B.A. degree from Columbia College and J.D. from Georgetown University.
Jack F. Kemp has served on our board of directors since June 2002. Mr. Kemp is founder and chairman of Kemp Partners, a strategic consulting firm which seeks to provide clients with strategic counsel, relationship development, and marketing advice in helping them accomplish business and policy objectives. From January 1993 until July 2004, Mr. Kemp was co-director of Empower America, Inc., a Washington, D.C.-based public policy and advocacy organization he co-founded with William Bennett and Ambassador Jeane Kirkpatrick. In 1996, Mr. Kemp was the Republican Party candidate for Vice President. Prior to founding Empower America, Mr. Kemp served as U.S. Secretary of Housing and Urban Development from 1989 to 1992, and in the U.S. House of Representatives from 1971 to 1989. Mr. Kemp also serves as a director of Hawk Corporation, Oracle Corporation, Six Flags, Inc. and WorldSpace, Inc. Mr. Kemp holds a B.A. from Occidental College.
Key Employees
Frank C. Bennett III has served as our president of MVNE services since March 2004, and prior to that he served as our chief operating officer from April 2002. From August 2000 to August 2001, Mr. Bennett was the senior vice president and group operations officer for the retail group of Verizon. From October 1999 to August 2000, Mr. Bennett served as vice president, e-commerce and technology of Bell Atlantic Corporation (now part of Verizon). From February 1998 to October 1999, he was vice president, customer billing of Bell Atlantic. In addition, from July 1996 to December 1998, Mr. Bennett served as a founder and vice president, call center development of Bell Atlantic Plus, a provider of bundled wireline and wireless services. Mr. Bennett holds a B.A. from the University of Virginia and an M.B.A. from The Wharton School of the University of Pennsylvania.
Gregory S. Cole, our senior vice president and corporate treasurer joined us in May 2006. Prior to joining us, from September 1998 to August 2005, Mr. Cole served as vice president, treasurer for XM Satellite Radio Holdings Inc., a provider of satellite radio services. From September 1994 to September 1998, Mr. Cole was a member of the finance department and privatization team at USEC, Inc., an energy company. Mr. Cole began his career as a certified public accountant in 1991, working for both local and national accounting firms including Coopers and Lybrand LLC. Mr. Cole holds an M.B.A. from the University of Maryland and BBA from James Madison University in Virginia.
Walter W. Leach, III has served as our general counsel since January 2001. Mr. Leach served as corporate counsel of Snyder Communications, a marketing and communications solution provider from June 1997 to January 2001. From October 1992 to June 1997, Mr. Leach served as deputy corporate counsel for Inductotherm Industries, Inc., a privately held manufacturer. Mr. Leach holds a B.A. from Syracuse University and a J.D. from Vermont Law School.
Gary J. Smith has served as our chief information officer since July 2000. From July 1999 to July 2000, Mr. Smith served as chief information officer and vice president of technology of Varsity Group Inc., formerly known as VarsityBooks.com, LLC, an online retailer of textbooks. From September 1987 to July 1999,
54
Mr. Smith served in various technology management positions at Discovery Communications Inc., an international media company, including most recently vice president of technology. Mr. Smith holds a B.S. from the University of Maryland.
Michael E. Waldenhas served in various executive-level positions at our company since joining us in October 2000 and is currently the President of our subsidiary 1010 Interactive LLC. Mr. Walden previously served as our vice president and executive vice president of Corporate Development from October 2000 until January 2007. December 1999 to October 2000, Mr. Walden served as vice president of new media and entertainment at Etensity, Inc., an e-business consulting firm. From October 1998 to December 1999, Mr. Walden served as vice president of operations for Professional Resource Services, a technology consulting and recruiting firm, a spin-out of NDC Group, a technology consulting firm. From November 1995 to October 1998, Mr. Walden served as director of telecommunications services for NDC Group. From 1991 to 1994, Mr. Walden served on the Washington D.C. legislative staff of U.S. Senator Arlen Specter. Mr. Walden holds a B.S. in Business Administration from the University of Richmond.
Brian T. Westrick has served as president of our wireless activation and services division since July 2002 and has held various executive-level positions since joining us in June 2000. From December 1994 to June 2000, Mr. Westrick was vice president of sales and marketing for Universal Jet Trading. From July 1991 to December 1994, Mr. Westrick was marketing director for Lease Audit and Analysis Services, a real estate consulting company. From June 1990 to July 1991, Mr. Westrick was a marketing representative with Xerox Corporation. Mr. Westrick holds a B.S. from the Wallace E. Carroll School of Management at Boston College.
Information Regarding the Board of Directors and Certain Committees
Our board of directors currently consists of six members. Our board of directors is divided into three classes of directors who serve in staggered three-year terms, as follows:
| | • | | The Class I directors are Messrs. Steinberg and Harris, and their terms will expire at the annual meeting of stockholders to be held in 2008. |
| | • | | The Class II directors are Messrs. Brind and Bath, and their terms will expire at the annual meeting of stockholders to be held in 2009. |
| | • | | The Class III directors are Messrs. Kemp and Sculley, and their terms will expire at the annual meeting of stockholders to be held in 2007. |
The Board of Directors held 13 meetings during 2006. No director attended fewer than 75% of the total number of meetings of the Board of Directors and of the committees of which he was a member during 2006. It is our policy to have each director attend all meetings of stockholders. In 2006, two of our seven directors attended the annual meeting of stockholders. The Board of Directors has determined that each member of the Board of Directors, other than Mr. Steinberg, is independent in accordance with applicable rules of The Nasdaq Global Market and the rules and regulations of the Securities and Exchange Commission. The Board of Directors has an Audit Committee, a Compensation Committee, a Nominating and Governance Committee and a Mergers and Acquisitions Committee. The Board of Directors has adopted a charter for the Audit Committee, Compensation Committee and the Nominating and Governance Committee, copies of which are available on our website at http://investor.inphonic.com/corpgov/corpgov.cfm.
The Audit Committee consists of Messrs. Harris, Bath and Brind. The Board of Directors has determined that each of the members of the Audit Committee is independent in accordance with applicable rules of The NASDAQ Global Market and the rules and regulations of the Securities and Exchange Commission. The Board of Directors has determined that each of the members of the Audit Committee is an “audit committee financial expert” as that term is defined in Item 407 of Regulation S-K under the Securities Exchange Act of 1934. The
55
Audit Committee held 17 meetings during 2006. The Audit Committee oversees our corporate accounting and financial reporting process and the audits of our financial statements. Among other matters, the Audit Committee:
| | • | | is responsible for the appointment, compensation and retention of our Independent Registered Public Accounting Firm and reviews and evaluates the auditors’ qualifications, independence and performance; |
| | • | | oversees the Independent Registered Public Accounting Firm’s audit work and reviews and pre-approves all audit and non-audit services that may be performed by them; |
| | • | | reviews and approves the planned scope of our annual audit; |
| | • | | monitors the rotation of partners of the Independent Registered Public Accounting Firm on our engagement team as required by law; |
| | • | | reviews our consolidated financial statements and discusses with management and the Independent Registered Public Accounting Firm the results of the annual audit and the review of our unaudited quarterly financial statements; |
| | • | | reviews our critical accounting policies and estimates; |
| | • | | oversees the adequacy of our accounting and financial controls; |
| | • | | annually reviews the Audit Committee charter and the committee’s performance; |
| | • | | reviews and approves all related-party transactions; and |
| | • | | establishes and oversees procedures for the receipt, retention and treatment of complaints regarding accounting, internal controls or auditing matters and oversees enforcement, compliance and remedial measures under our code of conduct. |
The Compensation Committee consists of Messrs. Brind, Kemp and Sculley. The Board of Directors has determined that each of the members of the Compensation Committee is independent in accordance with applicable rules of The NASDAQ Global Market. The Compensation Committee held three meetings during 2006. The Compensation Committee approves, administers and interprets our compensation and benefit policies, and administers our stock option and benefit plans. The Compensation Committee:
| | • | | reviews and approves corporate goals and objectives relevant to compensation of the chief executive officer and the other executive officers; |
| | • | | evaluates the performance of the chief executive officer and the other executive officers in light of those goals and objectives; |
| | • | | sets compensation of the chief executive officer and the other executive officers; |
| | • | | approves all executive officer employment, severance, or change-in-control agreements, including all special or supplemental benefits, and all agreements to indemnify executive officers or directors; |
| | • | | administers the issuance of stock options and other awards to executive officers and directors under our stock plans; and |
| | • | | reviews and evaluates, annually, the performance of the Compensation Committee and its members. |
The Nominating and Governance Committee consists of Messrs. Brind, Bath and Sculley. The Board of Directors has determined that each of the members of the Nominating and Governance Committee is independent in accordance with applicable rules of The NASDAQ Global Market. The Nominating and Governance Committee was formed in May 2004 and held one meeting during 2006. The Nominating and Governance Committee:
| | • | | identifies individuals qualified to become directors; |
56
| | • | | recommends to the Board of Directors director nominees for each election of directors; |
| | • | | develops and recommends to the Board of Directors criteria for selecting qualified director candidates; |
| | • | | considers committee member qualifications, appointment and removal; |
| | • | | recommends corporate governance guidelines applicable to the Company; and |
| | • | | provides oversight in the evaluation of the Board of Directors and each committee. |
The Mergers and Acquisitions Committee consists of Messrs. Sculley and Steinberg. The Mergers and Acquisitions Committee held one meeting during 2006. The Mergers and Acquisitions Committee reviews, monitors and advises the Board of Directors in connection with potential mergers and acquisitions.
Director Nominations
Consistent with its charter, the Nominating and Governance Committee will evaluate and recommend to the Board of Directors director nominees for each election of directors.
In fulfilling its responsibilities, the Nominating and Governance Committee considers the following factors in reviewing possible candidates for nomination as director:
| | • | | the appropriate size of our Board of Directors and its committees; |
| | • | | the perceived needs of the Board of the Directors for particular skills, background and business experience; |
| | • | | the skills, background, reputation, and business experience of nominees compared to the skills, background, reputation, and business experience already possessed by other members of the Board of Directors; |
| | • | | nominees’ independence from management; |
| | • | | applicable regulatory and listing requirements, including independence requirements and legal considerations, such as antitrust compliance; |
| | • | | the benefits of a constructive working relationship among directors; and |
| | • | | the desire to balance the considerable benefit of continuity with the periodic injection of the fresh perspective provided by new members. |
The Nominating and Governance Committee’s goal is to assemble a Board of Directors that brings to the Company a variety of perspectives and skills derived from high quality business and professional experience. Directors should possess the highest personal and professional ethics, integrity and values, and be committed to representing the best interests of our stockholders. They must also have an inquisitive and objective perspective and mature judgment. Director candidates, in the judgment of the Nominating and Governance Committee, must have sufficient time available to perform all Board of Directors and committee responsibilities. Members of the Board of Directors are expected to prepare for, attend and participate in all meetings of the Board of Directors and applicable committee meetings.
Other than the foregoing, there are no stated minimum criteria for director nominees, although the Nominating and Governance Committee may also consider such other factors as it may deem, from time to time, to be in the best interests of the Company and its stockholders.
Identifying and Evaluating Candidates for Nomination as Director
The Nominating and Governance Committee annually evaluates the current members of the Board of Directors whose terms are expiring and who are willing to continue in service against the criteria set forth above
57
in determining whether to recommend these directors for election. The Nominating and Governance Committee regularly assesses the optimum size of the Board of Directors and its committees and the needs of the Board of Directors for various skills, background and business experience in determining whether it is advisable to consider additional candidates for nomination.
Candidates for nomination as director may come to the attention of the Nominating and Governance Committee from time to time through incumbent directors, management, stockholders or third parties. These candidates may be considered at meetings of the Nominating and Governance Committee at any point during the year. Such candidates are evaluated against the criteria set forth above. If the Nominating and Governance Committee believes at any time that it is desirable that the Board of Directors consider additional candidates for nomination, the committee may poll directors and management for suggestions or conduct research to identify possible candidates and may, if the Nominating and Governance Committee believes it is appropriate, engage a third party search firm to assist in identifying qualified candidates. In March 2006, the Nominating and Governance Committee nominated, and the Board of Directors appointed, Mr. Harris as a director and in October 2006, the Nominating and Governance Committee nominated, and the Board of Directors appointed, Mr. Bath as a director. Messrs. Harris and Bath were recommended as nominees by the Nominating and Governance Committee.
The Nominating and Governance Committee will evaluate any recommendation for director nominee proposed by a stockholder. In order to be evaluated in connection with the Nominating and Governance Committee’s established procedures for evaluating potential director nominees, any recommendation for director nominee submitted by a stockholder must be sent in writing to: InPhonic, Inc., Attention: Walter W. Leach III, Corporate Secretary, 1010 Wisconsin Avenue, Suite 600, Washington, DC 20007, at least 120 days prior to the anniversary of the date definitive proxy materials were mailed to stockholders in connection with the prior year’s annual meeting of stockholders and must contain the following information:
| | • | | the candidate’s name, age, contact information and present principal occupation or employment; and |
| | • | | a description of the candidate’s qualifications, skills, background, and business experience during, at a minimum, the last five years, including his/her principal occupation and employment and the name and principal business of any corporation or other organization in which the candidate was employed or served as a director. |
In addition, our by-laws permit stockholders to nominate directors for consideration at an annual meeting provided they notify us at least 120 days prior to the anniversary of the date when definitive proxy materials were mailed to stockholders in connection with the prior year’s annual meeting of stockholders.
All directors and director nominees must submit a completed form of directors’ and officers’ questionnaire as part of the nomination process. The evaluation process may also include interviews and additional background and reference checks for non-incumbent nominees, at the discretion of the Nominating and Governance Committee.
Stockholder Communications with the Board of Directors
Stockholders may communicate with directors of the Company by transmitting correspondence by mail or facsimile, addressed to the director or the full Board of Directors as follows:
Board of Directors
c/o Walter W. Leach III, General Counsel
InPhonic, Inc.
1010 Wisconsin Avenue
Suite 600
Washington, DC 20007
Fax: 202-333-8280
58
The Corporate Secretary will maintain a log of such communications and transmit as soon as practicable such communications to the identified director(s), except where security concerns militate against further transmission of the communication or the communication relates to commercial matters not related to the sender’s interest as a stockholder, as determined by the General Counsel, Walter W. Leach III. The Board of Directors or individual directors so addressed will be advised of any communication withheld for such reasons.
Code of Conduct
We have adopted a code of business conduct and ethics, and a policy providing for the reporting of potential violations of the code, for directors, officers (including our principal executive officer, principal financial officer and controller) and employees, known as the Code of Conduct and Policy Regarding Reporting of Possible Violations (the “Code of Conduct”). The Code of Conduct is available on our website at
http://investor.inphonic.com/profiles/investor Governance.
Additionally, stockholders may request a free copy of the Code of Conduct from:
InPhonic, Inc.
Attention: Investor Relations
1010 Wisconsin Avenue
Suite 600
Washington, DC 20007
(202) 333-0001
Compliance with Section 16(a) of the Exchange Act
Section 16(a) of the Exchange Act requires that the Company’s executive officers and directors, and persons who own more than ten percent of a registered class of the Company’s equity securities, file reports of ownership and changes in ownership with the SEC and provide the Company with copies of such reports. The Company has reviewed such reports received by it and written representations from its directors and executive officers. Based solely on such review, the Company believes that the following person did not make the following timely filings pursuant to Section 16(a) of the Exchange Act: Goldman Sachs Group Inc. filed a Form 4 November 20, 2006 with respect to multiple purchases of the Company’s common stock November 6, 2006.
ITEM 11. EXECUTIVE COMPENSATION
Compensation Committee Interlocks and Insider Participation
None of the members of our Compensation Committee has at any time been one of our officers or employees. None of our executive officers serves or in the past has served as a member of the board of directors or compensation committee of any entity that has one or more of its executive officers serving on our Board of Directors or our compensation committee. See “Certain Relationships and Related Transactions.”
COMPENSATION DISCUSSION AND ANALYSIS
Philosophy & Objectives
The primary goals of the compensation committee of our board of directors with respect to executive compensation are to attract and retain the most talented and dedicated executives possible, to tie annual and long-term cash and stock incentives to achievement of specified performance objectives, and to align executives’ incentives with stockholder value creation. To achieve these goals, the compensation committee has implemented a compensation plan that ties a significant portion of executives’ overall compensation to key strategic targets such as the number of new activations of wireless devices and services, a positive customer experience, establishing and maintaining key strategic relationships and our financial and operational
59
performance, as measured by metrics such as our revenue growth cash flow, pursuit of profitability, and operational and financial measures specific to our business divisions. The compensation committee evaluates individual executive performance with a goal of setting compensation at levels the committee believes are comparable with executives in other companies of similar size and stage of development operating in the communications industry, while taking into account our relative performance and our own strategic goals.
We have retained a compensation consultant to provide us a compensation survey for our use in creating our policies and procedures with respect to executive compensation. We conduct an annual benchmark review of the aggregate level of our executive compensation, as well as the mix of elements used to compensate our executive officers. This review is based on a summary of published survey data compiled by Watson Wyatt & Company for technology companies with annual revenues of approximately $300 million, as well as reports published by the Mercer Group International. Utilizing this information, we created salary and stock option grant ranges for certain executive-level positions, which were approved by the Compensation Committee and are updated annually. The mix of cash and equity incentive compensation for our chief executive officer and chief financial officer are based on separate analysis of the compensation surveys by the Compensation Committee.
Elements of Compensation
Executive compensation consists of following elements:
Base Salary. Base salaries for our executives are established based on the scope of their responsibilities, taking into account competitive market compensation paid by other companies for similar positions. Generally, we believe that executive base salaries should be targeted near the median of the range of salaries for executives in similar positions with similar responsibilities at comparable companies. Base salaries are reviewed annually, and adjusted from time to time to realign salaries with market levels after taking into account individual responsibilities, performance and experience. For 2007, this review has not yet occurred.
Discretionary Annual Bonus. The compensation committee has the authority to award discretionary, annual cash bonuses to our executive officers. These awards are intended to compensate officers for achieving financial and operational goals and for achieving individual annual performance objectives. These objectives vary depending on the individual executive, but relate generally to strategic factors such as the number of new activations of wireless devices and services, a positive customer experience, establishing and maintaining key strategic relationships and our financial and operational performance, as measured by metrics such as our revenue growth, pursuit of profitability, and operational and financial measures specific to our business divisions. Each fiscal year the compensation committee selects, in its discretion, our executive officers who are eligible to receive a discretionary bonus. The compensation committee will establish the terms and conditions applicable to any award granted under the plan and a participant will be eligible to receive an award under the plan in accordance with such terms and conditions. Awards will be paid in whole or in part in cash or restricted stock. Similar to bonuses paid in the past, the actual amount of discretionary bonus will be determined following a review of each executive’s individual performance and contribution to our strategic goals. The actual amount of discretionary bonus is determined following a review of each executive’s individual performance and contribution to our strategic goals conducted during the first quarter of each fiscal year. The compensation committee has not fixed a maximum payout for any officer’s annual discretionary bonus.
Based on the compensation committee’s review of individual and company performance in 2006, the compensation committee awarded two named executive officers, Michael Walden and Brian Westrick, cash bonuses in the amounts indicated in the table entitled “Summary Compensation Table.”
2004 Equity Incentive Plan. We believe that stock-based awards encourage our named executive officers to provide superior performance. We established our 2004 Equity Incentive Plan to provide certain of our employees, including our executive officers, with incentives to help align those employees’ interests with the interests of stockholders. The compensation committee believes that the use of stock-based awards offers the best
60
approach to achieving our compensation goals. Other than Mr. Steinberg’s stock that he acquired as founder of our company, our 2004 Equity Incentive Plan provides the principal method for our named executive officers to acquire equity or equity-linked interests in our company. We believe that the annual aggregate value of these awards should be set near competitive median levels for comparable companies. However, due to the relatively early stage of our business, we expect to provide a greater portion of total compensation to our executives through our stock compensation plans than through cash-based compensation. Periodic awards are made at the discretion of the compensation committee to eligible employees and, in appropriate circumstances, the compensation committee considers the recommendations of members of management.
StockOptions. Our 2004 Equity Incentive Plan authorizes us to grant options to purchase shares of common stock to our employees, directors and consultants. Our compensation committee is the administrator of the 2004 Equity Incentive Plan. Beginning January 1, 2006 due to our adoption of SFAS No. 123(R), which changed the accounting for stock option grants, we generally award executive-level employees restricted stock, rather than grant them stock options. We made this change in philosophy because under SFAS No. 123(R) both types of awards receive the same accounting treatment and thus we are able to give an amount of equity value while awarding fewer shares relative to a stock option grant that would require the executive to tender an exercise price. We continue to grant stock options to non-executive employees. Prior to January 1, 2006, stock options were granted to executive officers at the commencement of employment and, in connection with annual salary increases and bonuses. Stock options typically vest over a four-year period with 25% vesting on the first anniversary of the date of grant and the remainder in equal installments every 90 days thereafter over the remainder of the period, and generally expire ten years after the date of grant. Incentive stock options also include certain other terms necessary to assure compliance with the Internal Revenue Code of 1986, as amended.
Restricted StockAwards. Our compensation committee has and may in the future make grants of restricted stock to our named executive officers. The compensation committee reviewed and approved restricted stock awards to executive officers based upon a review of competitive compensation data, its assessment of individual performance, a review of each executive’s existing long-term incentives, and retention considerations. Restricted stock awards typically vest over a four-year period with 25% vesting on the first anniversary of the date of grant and the remainder in equal installments every 90 days thereafter over the remainder of the period.
2006 Awards. In 2006, certain named executive officers were awarded restricted stock in the amounts indicated in the section entitled “Grants of Plan Based Awards”. In connection with the negotiation and closing of the $100 million term loan with Goldman Sachs Credit Partners, L.P. and Citicorp North America, Inc. and to provide further incentive to attain the company’s strategic, financial and operational goals, the compensation committee made restricted stock awards to Messrs. Steinberg, Walden, Westrick, Winkler and Zeinfeld in the amounts indicated in the section entitled “Grants of Plan Based Awards”. These restricted stock awards vest over a four-year period with 25% vesting on the first anniversary of the date of grant and the remainder in equal installments every 90 days thereafter over the remainder of the period.
1999 Stock Incentive Plan. Our 1999 Stock Incentive Plan was terminated upon our adoption of our 2004 Equity Incentive Plan in connection with the closing of our initial public offering November 2004. The only equity incentive we issued under the 1999 Stock Incentive plan was stock options. The option exercise price and the term of each option were determined by the compensation committee. The compensation committee also determined at what time or times each option may be exercised and, the period of time, if any, after retirement, death, disability or termination of employment during which options may be exercised. Stock options granted under the 1999 Stock Incentive Plan typically vest over a four-year period with 25% vesting on the first anniversary of the date of grant and the remainder in equal installments every 90 days thereafter over the remainder of the period, and generally expire ten years after the date of grant. As of May 21, 2007, we had outstanding options to purchase 1,909,911 shares of our common stock under the 1999 Stock Incentive Plan.
Benefits.We provide additional benefits to our executive officers in order to remain competitive with compensation packages available in our industry generally and foster an attractive working environment. In
61
many cases, these benefits are identical or substantially identical to those provided to all employees at the same location. For named executive officers, we generally provide benefits such as life insurance, medical insurance, auto allowances, use of Company courier and driver services, use of executive assistants for personal errands, and payment of club membership and professional organization fees. In connection with the hiring of a new executive officer, we may also provide for reimbursement of relocation expenses. The payment of personal benefits to our named executive officers varies based on the executive level.
Tax and Accounting Implications
Compensation Deduction Limit. As part of its role, the Compensation Committee considers the deductibility of executive compensation under Section 162(m) of the Internal Revenue Code, which provides that we may not deduct compensation of more than $1,000,000 that is paid to certain individuals. The Compensation Committee has considered the $1 million limit for federal income tax purposes on deductible executive compensation that is not performance-based, and believes that the executive compensation paid in 2006 and prior years satisfied the requirements of federal tax law and thus the compensation should be fully deductible.
COMPENSATION COMMITTEE REPORT
The Compensation Committee has reviewed and discussed the Compensation Discussion and Analysis required by Item 402(b) of Regulation S-K with management and, based on such review and discussions, the Compensation Committee recommended to the Board that the Compensation Discussion and Analysis be included in this Annual Report.
Compensation Committee
Ira Brind, Chairman
Jack F. Kemp
John Sculley
62
SUMMARY COMPENSATION TABLE
The following table sets forth information concerning the compensation earned during the fiscal year ended December 31, 2006 by our Chief Executive Officer, former Chief Financial Officer, and our three other most highly-compensated executive officers:
| | | | | | | | | | | | | | | | | | |
Name and Principal Position | | Year | | Salary
($) | | Bonus
($) | | Stock
Awards
($)(2) | | Option
Awards
($)(3) | | Non-Equity
Incentive Plan
Compensation
($)(7) | | Change in
Pension Value
and
Nonqualified
Deferred
Compensation
Earnings ($) | | All Other
Compensation
($) | | Total ($) |
David A. Steinberg (1) | | 2006 | | 346,250 | | — | | 457,636 | | 1,130,269 | | — | | — | | 46,405 | | 1,980,560 |
Chairman of the Board and Chief Executive Officer | | | | | | | | | | | | | | | | | | |
| | | | | | | | | |
Lawrence S. Winkler (4) | | 2006 | | 300,000 | | — | | 1,122,097 | | 298,960 | | — | | — | | 13,278 | | 1,734,335 |
Former Chief Financial Officer, Executive Vice President and Treasurer | | | | | | | | | | | | | | | | | | |
| | | | | | | | | |
Brian Westrick (5) | | 2006 | | 237,000 | | 20,000 | | 170,165 | | 288,908 | | — | | — | | 6,709 | | 722,782 |
President, Wireless Activation & Services | | | | | | | | | | | | | | | | | | |
| | | | | | | | | |
Michael Walden | | 2006 | | 225,000 | | 20,175 | | 170,165 | | 203,936 | | 20,000 | | — | | — | | 639,276 |
Executive VP Corporate Development | | | | | | | | | | | | | | | | | | |
| | | | | | | | | |
Andrew Zeinfeld (6) | | 2006 | | 205,769 | | — | | 381,932 | | — | | — | | — | | 40,000 | | 627,701 |
President | | | | | | | | | | | | | | | | | | |
| (1) | Other Compensation includes the following: $18,851 for life insurance; $12,000 for courier and driver services; $8,000 for the use of an executive assistant for personal errands; $7,554 for the payment of club membership dues and professional membership fees. |
| (2) | Reflects the dollar amount recognized for financial reporting purposes in accordance with FAS 123(R) and thus may include amounts from awards granted in and prior to 2006. Assumptions used in the calculation of these amounts are included in Note (o) to our audited financial statements included in our Annual Report on Form 10-K. |
| (3) | Reflects the dollar amount recognized for financial reporting purposes in accordance with FAS 123(R) and thus includes amounts from awards granted in and prior to 2006. Assumptions used in the calculation of these amounts are included in Note (o) to our audited financial statements included in our Annual Report on Form 10-K. |
| (4) | Other Compensation includes $13,278 for medical insurance. Effective May 31, 2007, Mr. Winkler’s employment with us has terminated. |
| (5) | Other Compensation includes $6,709 auto allowance. |
| (6) | Other Compensation includes $40,000 relocation and legal expense reimbursement. |
| (7) | Commissions paid in 2006. |
63
GRANTS OF PLAN BASED AWARDS
The following table sets forth certain information with respect to option awards and other plan-based awards granted during the fiscal year ended December 31, 2006 to our named executive officers:
| | | | | | | | | |
Name | | Grant Date
($) | | All Other
Stock Awards: Number of
Shares of Stock
or Units (#) | | Exercise or
Base Price of
Option Awards
($) | | Grant Date
Fair Value of
Stock Awards
($) |
| | | | |
David A. Steinberg (1) | | 12/28/2006 | | 500,000 | | — | | $ | 11.11 |
| | | | |
Lawrence S. Winkler (2) | | 06/13/2006 | | 25,000 | | — | | $ | 6.51 |
| | 12/28/2006 | | 100,000 | | — | | $ | 11.11 |
| | | | |
Brian T. Westrick (3) | | 03/22/2006 | | 28,000 | | — | | $ | 6.46 |
| | 12/28/2006 | | 50,000 | | — | | $ | 11.11 |
| | | | |
Michael Walden (4) | | 03/22/2006 | | 28,000 | | — | | $ | 6.46 |
| | 12/28/2006 | | 50,000 | | — | | $ | 11.11 |
| | | | |
Andrew Zeinfeld (5) | | 06/13/2006 | | 350,000 | | — | | $ | 6.51 |
| | 12/28/2006 | | 50,000 | | — | | $ | 11.11 |
| (1) | Grant date fair value of 12/28/06 restricted stock grant as prescribed by FAS123(R) is $5,555,000. No option awards were granted. |
| (2) | Grant date fair value of 6/13/06 and 12/28/06 restricted stock grants as prescribed by FAS123(R) are $162,750 and $1,111,000, respectively. No option awards were granted. Effective May 31, 2007 Mr. Winkler’s employment with us has terminated. |
| (3) | Grant date fair value of 3/22/06 and 12/28/06 restricted stock grants as prescribed by FAS123(R) are $180,880 and $555,500, respectively. No option awards were granted. |
| (4) | Grant date fair value of 3/22/06 and 12/28/06 restricted stock grants as prescribed by FAS123(R) are $180,880 and $555,500, respectively. No option awards were granted. |
| (5) | Grant date fair value of 6/13/06 and 12/28/06 restricted stock grants as prescribed by FAS123(R) are $2,278,500 and $555,500, respectively. No option awards were granted. |
Employment Agreements
We have entered into employment agreements with our named executive officers. The following discussion provides an overview of these agreements; it is not a complete description of all terms of the agreements. For the location of the agreements discussed below in our public SEC filings, please refer to the exhibit index in our Form 10-K for the year ended December 31, 2006.
In February 2000, we entered into an employment agreement with Mr. Steinberg, which was subsequently amended in March and May 2004. The agreement provides that we will employ Mr. Steinberg as our chief executive officer until May 31, 2008. The terms can be extended if we and Mr. Steinberg agree to do so 30 days prior to the end of the current term. Under this agreement, Mr. Steinberg receives an annual base salary to be established from time to time by the board of directors, which shall not be less than $290,000 per year, and he is eligible for an annual bonus equal to 65% of his then current annual salary based on the attainment of reasonable performance objectives established by the Compensation Committee of the Board of Directors. Mr. Steinberg’s annual base salary is currently $320,000. Pursuant to the May 2004 amendment, Mr. Steinberg was granted options to purchase 666,667 shares of our Common Stock, at an exercise price of $5.88 per share, 25% of which vested on the first anniversary of the date of grant and the remainder vest in equal quarterly installments over the following three years.
64
Effective May 31, 2007, Mr. Winkler’s employment with us was terminated.
We entered into an employment agreement with Mr. Walden effective as of May 1, 2004. This employment agreement provided that we will employ Mr. Walden as Senior Vice President of Corporate Development. Under this agreement, Mr. Walden received an annual base salary of $150,000 to be reviewed annually, and is eligible for a bonus to be determined by the good faith discretion of the CEO based on Mr. Walden’s overall performance. Mr. Walden shall be eligible to participate in such profit-sharing, stock option, bonus, incentive and performance based award programs as are made available to any other executive employees of the Company. In 2006, Mr. Walden’s base salary was $225,000. Mr. Walden is currently President of InPhonic’s Subsidiary, 1010 Interactive LLC.
If Mr. Walden’s employment is terminated without cause, he would be entitled to three (3) month’s salary at the rate in effect at the time of termination either in one lump sum or three equal payments commencing as of the effective date of the termination.
During the term of his employment and for 12 months thereafter, Mr. Walden has agreed not to (i) render any service ( as an employee, officer, director, consultant or otherwise) to any unit or division of any entity involved directly in the Business (as defined in the Employment Agreement); (ii) make or hold any investment in any entity in the Business other than the ownership of not more than 5% of the listed stock of any publicly traded entity; or (iii) contact any customer or employee to request, induce or attempt to induce any such customer or employee to terminate its business relationship, agreement, or employment with the Company.”
We entered into an employment agreement with Mr. Zeinfeld on December 20, 2006. This agreement provides that we will employ Mr. Zeinfeld as President of E-Commerce. Under the agreement, Mr. Zeinfeld will receive an initial base salary of $300,000 per annum. In addition, Mr. Zeinfeld will have the opportunity to earn an annual bonus of $100,000 for on-target performance, as such terms shall be defined by the CEO and Mr. Zeinfeld. We also agreed to reimburse Mr. Zeinfeld for up to $15,000 of third party moving expenses incurred by Mr. Zeinfeld in connection with his relocation to the Washington, D.C. area and up to $20,000 for any interim housing expenses. In addition, we agreed to reimburse Mr. Zeinfeld for up to $5,000 in legal expenses incurred in negotiating the employment agreement. On June 13, 2006, pursuant to his employment, Mr. Zeinfeld received 350,000 shares of our restricted common stock. The shares will vest over a four-year period, such that 25% of the shares will vest on the first anniversary of May 1, 2006 (the vesting commencement date) and the remainder will vest ratably every 90 days over the remainder of the four-year period.
During the term of his employment and for 12 months thereafter, Mr. Zeinfeld has agreed not to (i) render any service (as an employee, officer, director, consultant or otherwise) to any unit or division of any entity involved directly in the Business (as defined in the employment agreement)); (ii) make or hold any investment in any entity in the Business other than the ownership of not more than 5% of the listed stock of any publicly traded entity; or (iii) contact any customer or employee of the Company to request, induce or attempt to induce such customer or employee to terminate any business relationship, agreement or employment with the Company, provided however, if Mr. Zeinfeld is terminated for Good Reason or without Cause, the 12 month period shall be reduced to six months.
We enter into agreements with substantially all of our employees containing confidentiality provisions. We enter into non-competition agreements with our executive officers and key employees. The non-competition agreements prohibit these employees from competing with us or disclosing confidential information about us for a period up to 12 months after their employment with our company ends.
65
OUTSTANDING EQUITY AWARDS AT FISCAL YEAR-END
The following table summarizes the outstanding option awards and other plan-based awards held by our named executive officers.
| | | | | | | | | | | | | | | | | | | | |
Name | | Option Awards | | Stock Awards |
| | Number of
Securities
Underlying
Unexercised
Options (#) Exercisable | | Number of
Securities
Underlying
Unexercised
Options (#) Unexercisable | | Equity
Incentive
Plan Awards: Number of
Securities
Underlying
Unexercised
Unearned
Options (#) | | Option
Exercise
Price ($) | | Option
Expiration
Date | | Number of
Shares or
Units of
Stock That
Have Not
Vested (#)(1) | | Market
Value of
Shares or
Units of
Stock That
Have Not
Vested ($) | | Equity
Incentive Plan Awards: Number of
Unearned
Shares, Units
or Other
Rights That
Have Not
Vested (#) | | Equity
Incentive Plan Awards:
Market or
Payout Value
of Unearned
Shares, Units
or Other
Rights That
Have Not
Vested |
David A. Steinberg | | 458,332 | | 208,335 | | — | | $ | 5.88 | | 5/13/2014 | | 500,000 | | $ | 5,545,000 | | — | | — |
| | | | | | | | | | | | | 56,241 | | $ | 623,713 | | — | | — |
| | | | | | | | | |
Lawrence S. Winkler(2) | | 133,334 | | — | | — | | $ | 5.88 | | 1/29/2014 | | 112,482 | | $ | 1,247,425 | | — | | — |
| | 95,833 | | 4,167 | | — | | $ | 5.88 | | 5/13/2014 | | 34,369 | | $ | 381,152 | | — | | — |
| | | | | | | | | | | | | 25,000 | | $ | 277,250 | | — | | — |
| | | | | | | | | | | | | 100,000 | | $ | 1,109,000 | | — | | — |
| | | | | | | | | |
Brian T. Westrick | | 2,709 | | — | | — | | $ | 7.80 | | 3/07/2012 | | 28,000 | | $ | 310,520 | | — | | — |
| | 2,606 | | 10,417 | | — | | $ | 5.88 | | 1/29/2014 | | 16,874 | | $ | 187,133 | | — | | — |
| | 5,031 | | 25,152 | | — | | $ | 5.88 | | 5/13/2014 | | 50,000 | | $ | 554,500 | | — | | |
| | 10,938 | | 15,315 | | — | | $ | 10.00 | | 10/26/2014 | | | | | | | | | |
| | 8,750 | | 11,250 | | — | | $ | 16.49 | | 7/25/2015 | | | | | | | | | |
| | | | | | | | | |
Michael Walden | | 2,605 | | 10,419 | | — | | $ | 5.88 | | 1/29/2014 | | 16,874 | | $ | 187,133 | | — | | — |
| | 1,835 | | 10,774 | | | | $ | 5.88 | | 5/13/2014 | | 28,000 | | $ | 310,520 | | — | | — |
| | — | | 17,500 | | — | | $ | 10.00 | | 10/26/2014 | | 50,000 | | $ | 554,500 | | — | | — |
| | 8,750 | | 11,250 | | — | | $ | 16.49 | | 7/25/2015 | | | | | | | | | |
| | | | | | | | | |
Andrew Zeinfeld | | — | | — | | — | | | — | | — | | 350,000 | | $ | 3,881,500 | | — | | — |
| | | | | | | | | | | | | 50,000 | | $ | 554,500 | | — | | — |
| (1) | Each restricted stock award vests over a 4 year period with 25% vesting at year one and the remainder vesting quarterly over the next 3 years. |
| (2) | Effective May 31, 2007, Mr. Winkler’s employment with us has terminated. |
66
OPTION EXERCISES AND STOCK VESTED
The following table sets forth certain information concerning option exercises by our named executive officers and vesting of our Common Stock held by them during the fiscal year ended December 31, 2006:
| | | | | | | | | | |
Name | | Option Awards | | Stock Awards |
| | Number of Shares Acquired on
Exercise (#) | | Value Realized on Exercise ($)(1) | | Number of Shares Acquired on
Vesting (#) | | Value Realized on Vesting ($)(2) |
David A. Steinberg | | — | | | — | | 6,248 | | $ | 71,977 |
| | | | | | | 6,248 | | | 38,488 |
| | | | | | | 6,248 | | | 51,858 |
| | | | | | | 25,015 | | | 144,837 |
| | | | | | | | | | |
| | | | | | | 43,759 | | $ | 307,160 |
| | | | |
Lawrence S. Winkler (3) | | 100,000 | | $ | 496,500 | | 50,000 | | $ | 289,674 |
| | | | | | | 12,496 | | | 103,717 |
| | | | | | | 12,496 | | | 76,975 |
| | | | | | | 12,507 | | | 141,204 |
| | | | | | | 12,496 | | | 143,954 |
| | | | | | | | | | |
| | | | | | | 100,025 | | $ | 755,524 |
| | | | |
Brian T. Westrick | | 975 | | $ | 5,762 | | 7,504 | | $ | 43,448 |
| | 2,604 | | | 15,429 | | 1,874 | | | 15,554 |
| | 7,812 | | | 45,432 | | 1,874 | | | 11,544 |
| | 19,145 | | | 107,960 | | 1,874 | | | 21,588 |
| | | | | | | | | | |
| | 30,536 | | $ | 174,583 | | 13,126 | | $ | 92,135 |
| | | | |
Michael Walden | | 5,114 | | $ | 11,064 | | 7,504 | | $ | 58,531 |
| | 1,250 | | | 3,763 | | 1,874 | | | 15,554 |
| | 2,196 | | | 10,852 | | 1,874 | | | 11,544 |
| | 3,780 | | | 18,680 | | 1,874 | | | 21,588 |
| | | | | | | | | | |
| | 8,750 | | | 7,192 | | 13,126 | | $ | 107,218 |
| | | | | | | | | | |
| | 2,526 | | | 12,455 | | | | | |
| | 5,615 | | | 27,686 | | | | | |
| | | | | | | | | | |
| | 29,231 | | $ | 91,693 | | | | | |
| | | | |
Andrew Zeinfeld | | — | | | — | | — | | | — |
| (1) | Based on the difference between the market price of our Common Stock on the date of exercise and the exercise price. |
| (2) | Based on the market price of our Common Stock on the vesting date. |
| (3) | Effective May 31, 2007, Mr. Winkler’s employment with us has terminated. |
67
POTENTIAL PAYMENTS UPON TERMINATION OR CHANGE OF CONTROL
If we terminate Mr. Steinberg’s employment without cause or Mr. Steinberg terminates his employment for good reason, Mr. Steinberg is entitled to continue to receive his base salary for one year. If Mr. Steinberg’s employment is terminated without cause within 180 days of a change of control, he is entitled to continue to receive his base salary for one year and 50% of his unvested options will immediately become vested and exercisable.
If Mr. Walden’s employment is terminated without cause, he would be entitled to three (3) month’s salary at the rate in effect at the time of termination provided that Mr. Walden does not obtain employment or a consulting engagement during such three (3) month period and any rights or benefits available under applicable employee benefit programs then in effect in which Mr. Walden participates.
If Mr. Zeinfeld’s employment is terminated coincident with or within 180 days of a Change in Control (as defined in the employment agreement), fifty percent (50%) of the unvested shares of Restricted Stock will vest immediately following the Change in Control.
The initial term of the employment agreement is four years, and shall renew upon mutual agreement of Mr. Zeinfeld and the Company within 30 days prior to expiration of the term. If we terminate Mr. Zeinfeld’s employment (i) without Cause, or (ii) if Mr. Zeinfeld resigns for Good Reason, Mr. Zeinfeld is entitled to receive (i) an amount equal to his base salary for a one-year period; (ii) the pro rata portion of any bonus in effect at the time of termination; (iii) any rights or benefits available under employee benefit plans then in effect, in which Mr. Zeinfeld participated; (iv) reimbursement of expenses in accordance with section 5.2 of the employment agreement; and (v) any vested stock options or restricted stock.
Termination Upon a Change in Control
| | | | | | | | | |
Name | | Cash Payment | | Equity Acceleration | | Benefits
and Perquisites |
David A. Steinberg | | $ | 320,000 | | $ | 3,627,069 | | $ | 15,000 |
Michael Walden | | $ | 56,250 | | | — | | | 15,000 |
Andrew Zeinfeld | | $ | 300,000 | | $ | 2,218,000 | | | — |
68
DIRECTOR COMPENSATION
The following table sets forth information concerning the compensation earned during the last fiscal year by each individual who served as a director at any time during the fiscal year:
| | | | | | | | | | | | | | | | | | |
Name | | Fees
Earned or
Paid in
Cash ($) | | Stock
Awards
($) | | Option
Awards
($) | | Non-Equity
Incentive Plan
Compensation
($) | | Change in
Pension Value
and
Nonqualified
Deferred
Compensation
Earnings ($) | | All Other
Compensation
($) | | Total ($) |
John Sculley | | $ | 89,583 | | $ | 115,366 | | $ | 9,167 | | — | | — | | — | | $ | 214,117 |
Blake Bath (1) | | $ | 15,000 | | $ | 8,796 | | | — | | — | | — | | — | | $ | 23,796 |
Ira Brind | | $ | 109,000 | | $ | 115,366 | | $ | 9,167 | | — | | — | | — | | $ | 233,534 |
Robert A. Fox (2) | | $ | 15,000 | | $ | 60,900 | | $ | 9,167 | | — | | — | | — | | $ | 85,067 |
Laurence E. Harris (3) | | $ | 94,000 | | $ | 54,466 | | | — | | — | | — | | — | | $ | 148,466 |
Jay C. Hoag (4) | | $ | 102,500 | | $ | 115,366 | | $ | 9,167 | | — | | — | | — | | $ | 227,034 |
Jack F. Kemp | | $ | 76,833 | | $ | 115,366 | | $ | 23,260 | | — | | — | | — | | $ | 215,459 |
Thomas E. Wheeler (5) | | $ | 20,000 | | $ | 153,063 | | $ | 29,230 | | — | | — | | — | | $ | 202,293 |
Mark Levine | | $ | 8,750 | | | — | | | — | | — | | — | | — | | $ | 8,750 |
| (1) | Mr. Bath was appointed our Board of Directors on October 13, 2006 and was granted 10,000 shares of restricted stock with 70% vesting at year 1 and 30% vesting at year 2. |
| (2) | Mr. Fox retired from the Board of Directors on March 22, 2006. |
| (3) | Mr. Harris was appointed our Board of Directors on March 22, 2006 and was granted 15,480 shares of restricted stock with 70% vesting at year 1 and 30% vesting at year 2. |
| (4) | Mr. Hoag retired from the Board of Directors on October 13, 2006. |
| (5) | Mr. Wheeler retired from the Board of Directors on June 22, 2006. |
In 2006, members of our Board of Directors received $10,000 in annual cash compensation for their service on the Board of Directors. In addition, members of the Board of Directors serving on the Compensation Committee, Nominating and Governance Committee or Mergers and Acquisitions Committee received annual cash compensation of $5,000 per committee. Members of the Audit Committee received $7,500 in annual cash compensation and the chairman of the Audit Committee received $10,000 in annual cash compensation. The employee member of our Board of our Directors received no additional compensation for his service on the Board. The members of our Board of Directors were reimbursed for travel, lodging and other reasonable expenses incurred in attending Board of Directors and committee meetings. Under our 2004 Equity Incentive Plan, non-employee directors received grants of options to purchase up to 30,000 shares of our Common Stock upon joining our Board of Directors, and awards of 7,000 shares of restricted stock and grants of options to purchase 3,000 shares of our Common Stock annually.
In March 2006, the Compensation Committee approved a new outside director compensation program for non-employee directors for the 2006 fiscal year. Pursuant to this program, directors who are not employees receive an annual cash retainer fee of $50,000 and a fee of $1,000 for participation in each meeting of the Board of Directors or meeting of a committee of the Board of Directors. For service on the Audit Committee, each regular member shall receive annual cash compensation of $10,000, while the chairman of the Audit Committee will receive $50,000 annual cash compensation, in recognition of the additional time commitment required of the chairman in reviewing the Company’s continuing compliance with Section 404 of the Sarbanes-Oxley Act of 2002. Non-employee directors will also receive annual restricted stock awards valued at approximately $100,000 on the date of approval of the award, which will be issued under the 2004 Equity Incentive Plan and will vest over a two-year period. For the 2006 fiscal year, members of the Board of Directors received an award of an aggregate of 15,480 shares of restricted stock, with 10,836 shares vesting on March 22, 2007 and the remainder vesting on March 22, 2008. Directors will also be reimbursed for travel, lodging and other reasonable expenses related to attendance at Board of Directors and committee meetings.
69
ITEM 12. SECURITY OWNERSHIP OF CERTAIN BENEFICIAL OWNERS AND MANAGEMENT AND RELATED STOCKHOLDER MATTERS
The following table sets forth information regarding the beneficial ownership of our Common Stock as of May 21, 2007, unless otherwise indicated, by (1) all stockholders known by us to beneficially own more than five percent of the outstanding Common Stock, (2) each of the directors, (3) each of our executive officers named in the Summary Compensation Table and (4) all of our directors and executive officers as a group. We have relied upon information provided to us by our directors and executive officers and copies of documents sent to us that have been filed with the Securities and Exchange Commission by others for purposes of determining the number of shares each person beneficially owns. Beneficial ownership is determined in accordance with the rules and regulations of the Securities and Exchange Commission and generally includes those persons who have voting or investment power with respect to the securities. Except as otherwise indicated, and subject to applicable community property laws, the persons named in the table have sole voting and investment power with respect to all shares of the Company’s Common Stock beneficially owned by them. Shares of our Common Stock subject to options or warrants that are exercisable within 60 days of May 21, 2007 are also deemed outstanding for purposes of calculating the percentage ownership of that person, and if applicable, the percentage ownership of executive officers and directors as a group, but are not treated as outstanding for the purpose of calculating the percentage ownership of any other person. Percentages of shares beneficially owned are based on 36,964,003 shares of our Common Stock outstanding as of May 21, 2007.
| | | | | |
Name and Address of Beneficial Owner (1) | | Number of
Shares
Owned | | Percent
Owned | |
Directors, Nominees and Executive Officers | | | | | |
David A. Steinberg (2) | | 4,973,575 | | 13.3 | % |
Brian T. Westrick (3) | | 137,867 | | * | |
Brian J. Curran (4) | | 257,797 | | * | |
Lawrence S. Winkler (5) | | 475,778 | | 1.3 | % |
Andrew B. Zeinfeld (6) | | 401,500 | | 1.1 | % |
Michael Walden (7) | | 106,841 | | * | |
Blake Bath (8) | | 20,000 | | * | |
Ira Brind (9) | | 139,288 | | * | |
Laurence E. Harris (10) | | 15,480 | | * | |
Jack F. Kemp (11) | | 69,731 | | * | |
John Sculley (12) | | 443,664 | | 1.2 | % |
Thomas Wheeler (13) | | 24,898 | | * | |
| | |
All directors and executive officers as a group (12 persons) (14) | | 7,066,419 | | 18.6 | % |
| | |
Five Percent Stockholders (15): | | | | | |
The Goldman Sachs Group, Inc. (16) | | 5,095,806 | | 13.8 | % |
FMR Corporation (17) | | 3,924,800 | | 10.6 | % |
Trafelet & Company, LLC (18) | | 2,561,100 | | 6.9 | % |
S.A.C. Capital Advisors. LLC (19) | | 1,904,346 | | 5.2 | % |
MSD Capital, LP (20) | | 1,864,700 | | 5.0 | % |
Vardon Capital, LLC (21) | | 1,852,225 | | 5.0 | % |
| (1) | Unless otherwise indicated, the address of each stockholder is c/o InPhonic, Inc., 1010 Wisconsin Avenue, Suite 600, Washington, DC 20007. |
| (2) | Includes (1) 296,817 shares beneficially owned by a trust created for the benefit of Mr. Steinberg’s children, (2) 50,000 shares held by a family-owned limited liability company created for estate planning purposes, (3) 541,665 shares issuable upon exercise of vested stock options and (4) 549,993 shares of restricted stock that are subject to vesting. Mr. Steinberg shares dispositive and voting control over these shares. Mr. Steinberg disclaims beneficial ownership of these shares except to the extent of his pecuniary interest. |
70
| (3) | Includes (a) 44,867 shares issuable upon exercise of vested stock options and (b) 93,000 shares of restricted stock that are subject to vesting. |
| (4) | Includes 250,000 shares of restricted stock that are subject to vesting. |
| (5) | Includes (a) 133,334 shares issuable upon exercise of vested stock options and (b) 259,355 shares of restricted stock that are subject to vesting. Effective May 31, 2007, Mr. Winkler’s employment with us has terminated. |
| (6) | Includes 400,000 shares of restricted stock that are subject to vesting. |
| (7) | Includes (a) 22,716 shares issuable upon exercise of vested stock options and (b) 84,125 shares of restricted stock that are subject to vesting. |
| (8) | Includes 10,000 shares of restricted stock that are subject to vesting. |
| (9) | Includes (a) 7,667 shares issuable upon exercise of vested options, (b) 17,480 shares of restricted stock that are subject to vesting, (c) 23,490 shares beneficially owned by Brind Investment Partners II, of which Mr. Brind is a partner, and as to which shares Mr. Brind shares dispositive and voting control. Mr. Brind disclaims beneficial ownership of these shares except to the extent of his pecuniary interest. The address of Mr. Brind is c/o Brind Investment Partners II, 1926 Arch Street, Philadelphia, PA 19103. |
| (10) | Includes 15,480 shares of restricted stock that are subject to vesting. |
| (11) | Includes (a) 11,455 shares of common stock beneficially owned by the Jack Kemp Family Trust, of which Mr. Kemp disclaims beneficial ownership of these shares except to the extent of his pecuniary interest, (b) 52,251 shares issuable upon exercise of vested options, and (c) 17,480 shares of restricted stock that are subject to vesting . |
| (12) | Includes (a) 130,002 shares issuable upon exercise of vested options and (b) 17,480 shares of restricted stock subject to vesting. Also includes (c) 2,292 shares owned by John Sculley Irrevocable Trust Udt 12/30/97 FBO Oliver Allnatt, and (d) 2,292 shares owned by John Sculley Irrevocable Trust Udt 12/30/97 FBO Madeline Allnatt of which Mr. Sculley disclaims beneficial ownership of these shares except to the extent of his pecuniary interest. The address of Mr. Sculley is 152 West 57th Street, 23rd floor, New York, New York 10019. |
| (13) | Includes (a) 9,750 shares issuable upon exercise of vested options and (b) 15,148 shares of restricted stock that are subject to vesting. |
| (14) | Includes (a) 943,252 shares issuable upon exercise of vested options and (b) 1,729,541 shares of restricted stock that are subject to vesting. |
| (15) | Mr. Steinberg is also a holder of greater than 5% of our Common Stock. |
| (16) | As reported on Form 4 filed on April 5, 2007 by The Goldman Sachs Group, Inc. (“GS Group”) and Goldman, Sachs & Co. (“Goldman Sachs” and together with GS Group, the “Reporting Persons”). Goldman Sachs is a wholly-owned subsidiary of GS Group. The shares reported herein may be deemed to be beneficially owned indirectly by GS Group by reason of the direct ownership of such securities by Goldman Sachs or another wholly-owned subsidiary of GS Group (collectively, “Goldman”). The “Reporting Persons” have shared voting and dispositive power. The address is 85 Broad Street, New York, New York 10004. |
| (17) | As reported on a Schedule 13G filed on March 12, 2007 by FMR Corp. (“FMR”) and Edward C. Johnson 3d, Chairman and principal shareholder of FMR (“Mr. Johnson”), the shares are beneficially owned by Fidelity Management & Research Company (“Fidelity Research”) as an investment adviser to various investment companies (the “Funds”), with Mr. Johnson, FMR and the Funds each having the sole power to dispose of such shares and the Funds’ Boards of Trustees having the sole power to vote or direct the vote of such shares. The address is 82 Devonshire Street, Boston, Massachusetts 02109. |
| (18) | As reported on a Schedule 13G filed on February 14, 007 by Trafelet & Company, LLC, and Remy W. Trafelet, its managing member. Represents shares as to which Trafelet has shared voting and dispositive power. The address is 900 Third Avenue, 5 th Floor, New York, NY 10022. |
| (19) | As reported on a Schedule 13G filed on March 7, 2007 by: (i) S.A.C. Capital Advisors, LLC, (“SAC Capital Advisors”) with respect to shares of Common Stock, beneficially owned by S.A.C. Capital Associates, LLC (“SAC Capital Associates”) and S.A.C. MultiQuant Fund, LLC (“SAC MultiQuant”); (ii) S.A.C. Capital Management, LLC, (“SAC Capital Management”) with respect to shares beneficially owned by SAC Capital Associates and SAC MultiQuant; (iii) CR Intrinsic Investors, LLC (“CR Intrinsic Investors”) with respect to shares beneficially owned by CR Intrinsic Investments, LLC (“CR Intrinsic Investments”); and |
71
| | (iv) Steven A. Cohen with respect to shares beneficially owned by SAC Capital Advisors, SAC Capital Management, SAC Capital Associates, SAC MultiQuant, CR Intrinsic Investors and CR Intrinsic Investments. The address of the principal business office of (i) SAC Capital Advisors, CR Intrinsic Investors and Mr. Cohen is 72 Cummings Point Road, Stamford, Connecticut 06902 and (ii) SAC Capital Management is 540 Madison Avenue, New York, New York 10022. |
| (20) | As reported on a Schedule 13G filed on May 7, 2007 by MSD Capital, LP and PT Investments I, LP. Represents shares as to which MSD Capital, LP and PT Investments I, LP have shared voting and dispositive power. The address of both is 645 Fifth Avenue, 21st Floor, New York, NY 10022. |
| (21) | As reported on a Schedule 13G filed on February 14, 2007 by (i) Vardon Partners, L.P., a Delaware limited partnership; (ii) Vardon Partners II, L.P., a Delaware limited partnership; (iii) Vardon Focus Fund, L.P., a Delaware limited partnership; (iv) Vardon Focus Fund II, L.P., a Delaware limited partnership; (v) Vardon Continuum Fund, L.P. (formerly known as Vardon Hybrid Fund, L.P.), a Delaware limited partnership (together the “Domestic Funds”); (vi) Vardon International, Ltd., a Cayman Islands exempted company; (vii) Vardon International BP, Ltd., a Cayman Islands exempted company; (viii) Vardon Focus Fund International, Ltd., a Cayman Islands exempted company; (ix) Vardon Focus International BP, Ltd., a Cayman Islands exempted company (together the “Offshore Funds”); (x) Vardon Capital, L.L.C., a Delaware limited liability company (“VC”), with respect to shares of Common Stock held in the Domestic Funds; (xi) Vardon Capital Management, L.L.C., a Delaware limited liability company an SEC registered Investment Adviser (“VCM”), with respect to shares of Common Stock held in the accounts of the Domestic Funds, Offshore Funds and certain other separate account clients managed by VCM (the “Managed Accounts”, and together with the Domestic Funds and Offshore Funds, the “Advisory Clients”) for which VCM serves as the investment manager and (xii) Richard W. Shea, Jr. (“Mr. Shea”), the sole managing member of VC and VCM, with respect to shares of Common Stock deemed to be beneficially owned by VC and VCM. The address of the Domestic Funds, is 120 West 45th Street, 17th Floor, New York, NY 10036, and the address of the Offshore Funds, is Admiral Financial Center, P.O. Box 32021 SMB, 90 Fort Street, Grand Cayman, Cayman Islands, B.W.I. |
EQUITY COMPENSATION PLAN INFORMATION
The following table provides information with respect to the equity securities that are authorized for issuance under our equity compensation plans as of December 31, 2006:
| | | | | | | |
Plan Category | | Number of securities
to be issued upon
exercise of outstanding
options, warrants and
rights | | Weighted-average
exercise price of
outstanding options,
warrants and rights | | Number of securities
remaining available for
future issuance under equity
compensation plans
(excluding securities
reflected in first column) |
Equity compensation plans approved by security holders | | 7,007,752 | | $ | 5.20 | | 434,272 |
| | | |
Equity compensation plans not approved by security holders | | — | | | — | | — |
| | | | | | | |
Total | | 7,007,752 | | $ | 5.20 | | 434,272 |
ITEM 13. CERTAIN RELATIONSHIPS AND RELATED TRANSACTIONS, AND DIRECTOR INDEPENDENCE
Policy Statement
We have a policy whereby all transactions between us and our officers, directors and affiliates will be on terms no less favorable to us than could be obtained from unrelated third parties. These transactions must be approved by the Audit Committee of our Board of Directors. The transactions set forth below were conducted
72
under application of this policy and we believe were no less favorable to us than we would have obtained in an arms length transaction with an unaffiliated third party.
Issuance of Options and Restricted Stock
In March 2006, we awarded each of Messrs. Brind, Hoag, Kemp, Sculley, Wheeler and Harris 15,480 shares of restricted stock.
In November 2006, we awarded Mr. Wheeler, a former director, 8,504 shares of restricted stock for serving as chair of our advisory committee and Mr. Bath was awarded 10,000 shares of restricted stock.
Law Firm “Of Counsel” Serving on Board of Directors
Mr. Laurence E. Harris, a director of the Company since March 2006, is“of counsel” in the law firm of Patton Boggs LLP (“Patton Boggs”). The total cost of various legal services provided by Patton Boggs in 2006 was $2,219,315. Mr. Harris does not share in any of the fees received by Patton Boggs from the Company.
Investments by Executive Officers
Mr. Steinberg is a trustee of the KKS DAS DES TRUST, which is a limited partner of TCV V, L.P. and TCV VI, L.P. Mr. Hoag, one of our former directors, is a member of Technology Crossover Management V, L.L.C., (“TCM”). TCM is the general partner of TCV V, L.P. and TCV VI, L.P. The KKS DAS DES TRUST’s investment comprises less than 0.1% of the capital under management of TCV V, L.P. and TCV VI, L.P., respectively. Neither TCV V, L.P. nor TCV VI, L.P. owns shares of our common stock.
Sale of Stock by Executive Officers to our Lending Group
Concurrent with our entering into our term loan in November 2006, affiliates of Mr. Steinberg established for trusts and estates purposes and Mr. Winkler sold an aggregate of 450,000 and 100,000 shares of common stock to our lending group, respectively.
Director Independence
The Board of Directors has determined that each member of the Board of Directors, other than Mr. Steinberg, is independent in accordance with applicable rules of The NASDAQ Global Market and the rules and regulations of the Securities and Exchange Commission and have made such determination based on the fact that none of such persons have had, or currently have, any relationship with the Company or its affiliates or any executive officer of the Company or his or her affiliates, that would currently impair their independence, including, without limitation, any commercial, industrial, banking, consulting, legal, accounting, charitable or familial relationship. The Board of Directors has an Audit Committee, a Compensation Committee, a Nominating and Governance Committee and a Mergers and Acquisitions Committee. Each member of the Audit Committee, Compensation Committee and the Nominating and Governance Committee is independent as defined under current NASDAQ listing standards.
ITEM 14. PRINCIPAL ACCOUNTING FEES AND SERVICES
Independent Registered Public Accounting Firm
The Audit Committee has selected the firm of Grant Thornton LLP (“Grant Thornton”) to serve as the Independent Registered Public Accounting Firm for the fiscal year ending December 31, 2007, subject to the ratification by our stockholders. Grant Thornton currently serves as the Company’s Independent Registered Public Accounting Firm.
73
On September 12, 2005, the Audit Committee of the Board of Directors dismissed KPMG LLP (“KPMG”) as our Independent Registered Public Accounting Firm, effective immediately.
The audit reports of KPMG on our consolidated financial statements as of and for the years ended December 31, 2004 and 2003, did not contain an adverse opinion or disclaimer of opinion and were not qualified or modified as to uncertainty, audit scope or accounting principles, except that the audit reports as of and for the years ended December 31, 2004 and 2003, contained separate paragraphs stating that we adopted EITF 00-21, Revenue Arrangements with Multiple Deliverables, effective July 1, 2003.
During the two most recently completed fiscal years prior to KPMG’s dismissal and through September 12, 2005, there were no disagreements with KPMG on any matter of accounting principles or practices, financial statement disclosure, or auditing scope or procedure, which disagreements, if not resolved to the satisfaction of KPMG, would have caused KPMG to make reference to the subject matter of the disagreement in connection with its reports on our financial statements for the fiscal years ended December 31, 2004 and 2003. In addition, there were no “reportable events” (as defined in Item 304(a)(1)(v) of Regulation S-K) during the two most recently completed fiscal years prior to KPMG’s dismissal and through September 12, 2005.
We provided KPMG with a copy of the disclosures above and requested that KPMG furnish us with a letter addressed to the SEC stating whether or not it agreed with the above statements. A copy of that letter, dated September 20, 2005, was filed as Exhibit 16.1 to our report on Form 8-K filed with the SEC on September 20, 2005.
On September 19, 2005, our Audit Committee engaged Grant Thornton as our Independent Registered Public Accounting Firm to audit our financial statements and internal controls over financial reporting for the year ending December 31, 2005.
Prior to engaging Grant Thornton, we did not consult with Grant Thornton during the two most recently completed fiscal years prior to KPMG’s dismissal and through September 19, 2005 regarding (i) either the application of accounting principles to a specified transaction, either completed or proposed, or the type of audit opinion that might be rendered on our financial statements, and neither was a written report nor oral advice provided to us that Grant Thornton concluded was an important factor considered by us in reaching a decision as to the accounting, auditing or financial reporting; or (ii) any matter which was the subject of either a “disagreement” or a “reportable event” (as each is defined in Items 304(a)(1)(iv) and (v) of Regulation S-K, respectively).
Fees and Services
The following table summarizes fees billed to the Company by Grant Thornton for the fiscal year 2006 and the fees billed to the Company by Grant Thornton and KPMG for audit and other work performed in fiscal year 2005 ($’s in thousands):
| | | | | | | | | | | | |
| | | 2006 | | 2005 |
Services | | Grant
Thornton | | KPMG | | Grant
Thornton | | KPMG |
Audit Fees (a) | | $ | 2,136 | | $ | — | | $ | 1,437 | | $ | 1,381 |
Audit-Related Fees (b) | | | — | | | — | | | 62 | | | — |
Tax Fees (c) | | | — | | | — | | | — | | | 101 |
All Other Fees (d) | | | — | | | — | | | — | | | — |
| | | | | | | | | | | | |
Total Fees | | $ | 2,136 | | $ | | | $ | 1,499 | | $ | 1,482 |
| | | | | | | | | | | | |
| (a) | The audit fees for the years ended December 31, 2006 and 2005 were for professional services rendered during the audits of the Company’s consolidated financial statements and its controls over financial |
74
| | reporting, for reviews of the Company’s consolidated financial statements included in the Company’s quarterly reports on Form 10-Q and for reviews of other filings made by the Company with the Securities and Exchange Commission (“SEC”). |
| (b) | Audit-related fees consist of fees for assurance and related services that are reasonably related to the performance of the audit and the review of our financial statements and which are not reported under “Audit Fees.” These services relate to due diligence and accounting advice related to mergers and acquisitions and other accounting-related matters. |
| (c) | Tax fees consist of fees for tax compliance, tax advice and tax planning services. |
| (d) | All other fees consist of fees for products and services other than the services reported above. |
Pre-Approval of Non-Audit Services
Our Audit Committee has established a policy governing our use of Grant Thornton for non-audit services. Under the policy, management may use Grant Thornton for non-audit services that are permitted under SEC rules and regulations, provided that management obtains the Audit Committee’s approval before such services are rendered. In fiscal years 2006 and 2005, all audit, audit related, and tax fees were pre-approved by the Audit Committee. Under SEC rules, subject to certain permitted de minimis criteria, pre-approval is required for all professional services rendered by our principal accountant for all services rendered on or after May 6, 2003. We are in compliance with these SEC rules.
75
PART IV
ITEM 15. EXHIBITS AND FINANCIAL STATEMENT SCHEDULES
The following documents are filed as part of this Annual Report:
| | (1) | Index to Financial Statements |
| | |
| | | Page Number |
Report of Grant Thornton LLP, Independent Registered Public Accounting Firm | | F-2 |
Report of KPMG, LLP, Independent Registered Public Accounting Firm | | F-4 |
Consolidated Balance Sheets as of December 31, 2005 and 2006 | | F-5 |
Consolidated Statements of Operations for the years ended December 31, 2004, 2005 and 2006 | | F-6 |
Consolidated Statements of Stockholders’ Equity for the years ended December 31, 2004, 2005 and 2006 | | F-7 |
Consolidated Statements of Cash Flows for the years ended December 31, 2004, 2005 and 2006 | | F-8 |
Notes to Consolidated Financial Statements | | F-9 |
| | (2) | Financial Statement Schedules |
The following consolidated financial statement schedule of InPhonic, Inc. and subsidiaries is filed herewith:
All other schedules have been omitted because the information required to be shown in the schedules is not applicable or is included elsewhere in our financial statements or the notes thereto.
| | |
| Exhibit No. | | Description |
| |
| 2.1(c)(d) | | Asset Purchase Agreement dated as of December 17, 2004, between A1 Wireless USA, Inc. and CAIS Acquisition LLC |
| |
| 2.2(d) | | First Amendment to the Asset Purchase Agreement dated as of December 17, 2004, between A1 Wireless USA, Inc., CAIS Acquisition LLC and InPhonic, Inc. |
| |
| 2.3(c)(e) | | Asset Purchase Agreement dated as of April 26, 2005, between VMC Satellite, Inc., InPhonic, Inc. and CAIS Acquisition II, LLC |
| |
| 2.4(f)(g) | | First Amendment to the Asset Purchase Agreement dated as of September 1, 2005, by and among CAIS Acquisition II, LLC, InPhonic, Inc., RR Holding, Inc. (formerly known as VMC Satellite, Inc.) and Rick Rahim |
| |
| 3.1(a) | | Eleventh Amended and Restated Certificate of Incorporation of InPhonic, Inc. |
| |
| 3.2(a) | | Third Amended and Restated Bylaws of InPhonic, Inc. |
76
| | |
| Exhibit No. | | Description |
| 4.1(a) | | Specimen stock certificate for shares of common stock of InPhonic, Inc. |
| |
| 10.1(a) | | Seventh Amended and Restated Investor Rights Agreement dated as of June 12, 2003 by and among InPhonic, Inc. and the Purchasers listed therein |
| |
| 10.2 | | Credit Agreement dated as of November 7, 2006 among InPhonic, Inc., The lenders from time to time, Goldman Sachs Credit Partners L.P., and Citicorp North America Inc, as Administrative Agent. |
| |
| 10.3 | | Amendment No. 1 dated February 6, 2007 to Credit Agreement dated as of November 7, 2006 among InPhonic, Inc., the lenders from time to time, Goldman Sachs Credit Partners, L.P. and Citicorp North America Inc., as Administrative Agent. |
| |
| 10.4(c) | | Amendment No. 2 to Credit Agreement dated as of March 30, 2007, to the Credit Agreement dated as of November 7, 2006 among InPhonic, Inc. the lenders from time to the and Citicorp North America, Inc. as Administrative Agent. |
| |
| 10.5 | | Amendment No. 3 to Credit Agreement dated as of April 9, 2007, to the Credit Agreement dated as of November 7, 2006, as amended, among InPhonic, Inc. the lenders from time to the and Citicorp North America, Inc. as Administrative Agent. |
| |
| 10.6 | | Amendment No. 4 to Credit Agreement dated as of April 23, 2007, to the Credit Agreement dated as of November 7, 2006, as amended, among InPhonic, Inc. the lenders from time to the and Citicorp North America, Inc. as Administrative Agent. |
| |
| 10.7 | | Amendment No. 5 to Credit Agreement dated as of May 1, 2007, to the Credit Agreement dated as of November 7, 2006, as amended, among InPhonic, Inc. the lenders from time to the and Citicorp North America, Inc. as Administrative Agent. |
| |
| 10.8 | | Warrant Agreement dated as of November 7, 2006 by and between InPhonic, Inc., Goldman, Sachs & Co., Citicorp North America, Inc. and AP InPhonic Holdings, LLC |
| |
| 10.9(a) | | Form of Assignment of Invention, Nondisclosure and Noncompetition Agreement |
| |
| 10.10(a) | | Employment Agreement dated as of February 4, 2000 by and between InPhonic, Inc. and David A. Steinberg, as amended by Amendment No. 1 dated March 1, 2004 and Amendment No. 2 dated May 14, 2004 |
| |
| 10.11(k) | | Employment Agreement between InPhonic, Inc. and Lawrence S. Winkler, entered into on July 25, 2005 and effective as of January 19, 2004 |
| |
| 10.12(n) | | Employment Agreement between InPhonic, Inc. and Andrew B. Zeinfeld, entered into on December 20, 2006 |
| |
| 10.13(n) | | Employment Agreement between InPhonic, Inc. and Brian J. Curran, entered into on December 20, 2006 |
| |
| 10.14(a) | | Employment Agreement effective April 2, 2002, by and between InPhonic, Inc. and Frank C. Bennett, III |
| |
| 10.15(a) | | Lease dated as of February 26, 2001 by and between Rouse Commercial Properties, LLC, Rouse Office Management, LLC and InPhonic, Inc., as amended by First Amendment to Lease, dated May 29, 2002 |
| |
| 10.16(l) | | Second Amendment to Lease dated September 23, 2004 by and between Inglewood Business Park III, LLC and Inglewood Business Park IV, LLC (assignees of Rouse Commercial Properties, LLC), by MTM Builder/Developer, Inc. and InPhonic, Inc., as amended by Third Amendment to Lease made and entered into as of July 19, 2005 |
| |
| 10.17(a) | | Lease Agreement dated April 29, 2003 by and between Waterfront Center Limited Partnership and InPhonic, Inc., as amended by Addendum No. 1, dated September 9, 2003 and Addendum No. 2, dated May 14, 2004 |
77
| | |
| Exhibit No. | | Description |
| 10.18(l) | | Deed of Lease by and between Parkridge Phase Two Associates Limited Partnership and InPhonic, Inc. dated July 27, 2005 |
| |
| 10.19(m) | | First Amendment to Lease by and between Parkridge Phase Two Associates Limited Partnership and InPhonic, Inc. dated November 8, 2005 |
| |
| 10.20(h) | | Sublease dated November 17, 2004, by and between CareerBuilder, LLC and InPhonic, Inc. |
| |
| 10.21(a)(b) | | Premier I-Dealer Agreement dated March 1, 2001 by and between T-Mobile USA, Inc., and its subsidiaries and affiliates and InPhonic, Inc. and its affiliates and related entities, as amended |
| |
| 10.22(o)(r) | | Cingular Wireless Non-Exclusive Dealer Agreement and Cingular Wireless Internet Dealer and Master Dealer Addendum (“the Agreements”) with Cingular Wireless II, LLC (“Cingular”), effective October 1, 2006 |
| |
| 10.23(c)(j) | | Asset Purchase Agreement dated as of May 26, 2005, between FONcentral.com, Inc. and FON Acquisition, LLC |
| |
| 10.24(a) | | 1999 Amended and Restated Stock Incentive Plan |
| |
| 10.25(h) | | 2004 Equity Incentive Plan |
| |
| 10.26(k) | | Form of Stock Option Agreement for options granted under the 2004 Equity Incentive Plan |
| |
| 10.27(k) | | Form of Restricted Stock Agreement for awards granted under the 2004 Equity Incentive Plan |
| |
| 10.28(q) | | Outside Director Compensation Summary |
| |
| 10.29(p) | | First Amendment to Employment Agreement effective March 16, 2006 by and between InPhonic, Inc. and Lawrence S. Winkler |
| |
| 10.30 | | Employment Agreement effective May 1, 2004 by and between InPhonic, Inc. and Michael Walden. |
| |
| 16.1(n) | | Letter from KPMG LLP to the Securities and Exchange Commission dated September 20, 2005 |
| |
| 21.1 | | Subsidiaries of InPhonic, Inc. |
| |
| 23.1 | | Consent of Grant Thornton LLP, Independent Registered Public Accounting Firm |
| |
| 23.2 (s) | | Consent of KPMG LLP, Independent Registered Public Accounting Firm |
| |
| 31.1 | | Rule 13a-14(a) Certification of Principal Executive Officer. |
| |
| 31.2 | | Rule 13a-14(a) Certification of Principal Financial Officer. |
| |
| 32.1 | | Section 1350 Certification of Principal Executive Officer. |
| |
| 32.2 | | Section 1350 Certification of Principal Financial and Accounting Officer. |
| (a) | Incorporated by reference to our Registration Statement on Form S-1 (File No. 333-116420). |
| (b) | Confidential treatment granted for certain portions of this Exhibit pursuant to Rule 406 under the Securities Act of 1933, as amended which portions are omitted and filed separately with the Securities and Exchange Commission. |
| (c) | Confidential treatment granted for certain portions of this Exhibit pursuant to Rule 24b-2 under the Securities Exchange Act of 1934, as amended, which portions are omitted and filed separately with the Securities and Exchange Commission. |
| (d) | Incorporated by reference to our Current Report on Form 8-K filed on January 10, 2005. |
| (e) | Incorporated by reference to our Current Report on Form 8-K/A filed on December 22, 2006. |
| (f) | Appendix 1 to this First Amendment to Asset Purchase Agreement has been omitted in reliance upon the rules of the Securities and Exchange Commission. A copy will be delivered to the Securities and Exchange Commission upon request. |
78
| (g) | Incorporated by reference to our Current Report on Form 8-K/A filed on December 22, 2006. |
| (h) | Incorporated by reference to our Annual Report on Form 10-K for the year ended December 31, 2004. |
| (i) | Incorporated by reference to our Quarterly Report on Form 10-Q for the three months ended March 31, 2005. |
| (j) | Incorporated by reference to our Current Report on Form 8-K filed on June 3, 2005. |
| (k) | Incorporated by reference to our Current Report on Form 8-K filed on July 29, 2005. |
| (l) | Incorporated by reference to our Quarterly Report on Form 10-Q for the three months ended June 30, 2005. |
| (m) | Incorporated by reference to our Quarterly Report on Form 10-Q for the three months ended September 30, 2005. |
| (n) | Incorporated by reference to our Current Report on Form 8-K filed on December 22, 2006 |
| (o) | Incorporated by reference to our Quarterly Report on Form 10-Q for the three months ended September 30, 2006 |
| (p) | Incorporated by reference to our Annual Report on Form 10-K for the year ended December 31, 2005. |
| (q) | Incorporated by reference to our Current Report on Form 8-K filed on March 24, 2006. |
| (r) | Confidential treatment requested for certain portions of this Exhibit pursuant to Rule 24b-2 under the Securities Exchange Act of 1939, as amended which portions are omitted and filed separately with the Securities and Exchange Commission. |
| (s) | To be filed by amendment. |
79
SIGNATURES
Pursuant to the requirements of Section 13 or 15(d) of the Securities Exchange Act of 1934, the registrant has duly caused this report to be signed on its behalf by the undersigned thereunto duly authorized.
| | |
INPHONIC, INC. |
| |
| By: | | /S/ DAVID A. STEINBERG |
| | David A. Steinberg Chairman of the Board and Chief Executive Officer |
Dated: May 31, 2007
Pursuant to the requirements of the Securities Exchange Act of 1934, this report has been signed below by the following persons on behalf of the registrant and in the capacities and the dates indicated:
| | | | |
Signature | | Title | | Date |
| | |
/S/ DAVID A. STEINBERG David A. Steinberg | | Chairman of the Board and Chief Executive Officer (Principal Executive Officer) | | May 31, 2007 |
| | |
/S/ GEORGE Z. MORATIS George Z. Moratis | | Principal Financial and Accounting Officer | | May 31, 2007 |
| | |
/S/ JOHN SCULLEY John Sculley | | Vice Chairman of the Board | | May 31, 2007 |
| | |
/S/ BLAKE BATH Blake Bath | | Director | | May 31, 2007 |
| | |
/S/ IRA BRIND Ira Brind | | Director | | May 31, 2007 |
| | |
/S/ LAURENCE E. HARRIS Laurence E. Harris | | Director | | May 31, 2007 |
| | |
/S/ JACK F. KEMP Jack F. Kemp | | Director | | May 31, 2007 |
80
INDEX TO CONSOLIDATED FINANCIAL STATEMENTS
F-1
REPORT OF INDEPENDENT REGISTERED PUBLIC ACCOUNTING FIRM
Board of Directors and shareholders
Inphonic, Inc.
We have audited the accompanying consolidated balance sheets of Inphonic, Inc. and subsidiaries (the Company) as of December 31, 2006 and 2005, and the related consolidated statements of operations, common stockholders’ equity, and cash flows for each of the two years in the period ended December 31, 2006. These financial statements are the responsibility of the Company’s management. Our responsibility is to express an opinion on these financial statements based on our audit.
We conducted our audits in accordance with the standards of the Public Company Accounting Oversight Board (United States). Those standards require that we plan and perform the audit to obtain reasonable assurance about whether the financial statements are free of material misstatement. An audit includes examining, on a test basis, evidence supporting the amounts and disclosures in the financial statements. An audit also includes assessing the accounting principles used and significant estimates made by management, as well as evaluating the overall financial statement presentation. We believe that our audits provide a reasonable basis for our opinion.
In our opinion, the consolidated financial statements referred to above present fairly, in all material respects, the financial position of the Company as of December 31, 2006 and 2005, and the results of its operations and its cash flows for each of the two years in the period ended December 31, 2006 in conformity with accounting principles generally accepted in the United States of America.
Our audits were conducted for the purpose of forming an opinion on the basic consolidated financial statements taken as a whole. Schedule II is presented for the purpose of additional analysis and is not a required part of the basic consolidated financial statements. This schedule has been subjected to the auditing procedures applied in the audit of the basic consolidated financial statements and, in our opinion, is fairly stated in all material respects in relation to the basic consolidated financial statements taken as a whole.
As discussed in Note 2 to the Notes to Consolidated Financial Statements, the Company adopted SFAS No. 123R, “Share-Based Payment,” effective January 1, 2006.
We also have audited, in accordance with the standards of the Public Company Accounting Oversight Board (United States), the effectiveness of the Company’s internal control over financial reporting as of December 31, 2006, based on criteria established in Internal Control—Integrated Framework issued by the Committee of Sponsoring Organizations of the Treadway Commission (COSO) and our report dated May 31, 2007 expressed an unqualified opinion on management’s assessment of the effectiveness of the Company’s internal control over financial reporting and an adverse opinion on the effectiveness of the Company’s internal control over financial reporting.
/s/ Grant Thornton LLP
McLean, Virginia
May 31, 2007
F-2
REPORT OF INDEPENDENT REGISTERED PUBLIC ACCOUNTING FIRM
Board of Directors and Shareholders
Inphonic, Inc.
We have audited management’s assessment, included in the accompanying Management’s Report on Internal Control Over Financial Reporting, that Inphonic, Inc. (a Delaware Corporation) and subsidiaries did not maintain effective internal control over financial reporting as of December 31, 2006, because of the effect of material weaknesses in the lack of the appropriate level of financial and operational support or adequate internal communications to process internal controls, the revenue recognition of carrier commissions, bonuses and related allowances, revenue recognition of consumer cancellation fees and accounting for certain inventories based on criteria establishedin Internal Control—Integrated Framework issued by the Committee of Sponsoring Organizations of the Treadway Commission (COSO). Inphonic’s management is responsible for maintaining effective internal control over financial reporting and for its assessment of the effectiveness of internal control over financial reporting. Our responsibility is to express an opinion on management’s assessment and an opinion on the effectiveness of the company’s internal control over financial reporting based on our audit.
We conducted our audit in accordance with the standards of the Public Company Accounting Oversight Board (United States). Those standards require that we plan and perform the audit to obtain reasonable assurance about whether effective internal control over financial reporting was maintained in all material respects. Our audit included obtaining an understanding of internal control over financial reporting, evaluating management’s assessment, testing and evaluating the design and operating effectiveness of internal control, and performing such other procedures as we considered necessary in the circumstances. We believe that our audit provides a reasonable basis for our opinions.
A company’s internal control over financial reporting is a process designed to provide reasonable assurance regarding the reliability of financial reporting and the preparation of financial statements for external purposes in accordance with generally accepted accounting principles. A company’s internal control over financial reporting includes those policies and procedures that (1) pertain to the maintenance of records that, in reasonable detail, accurately and fairly reflect the transactions and dispositions of the assets of the company; (2) provide reasonable assurance that transactions are recorded as necessary to permit preparation of financial statements in accordance with generally accepted accounting principles, and that receipts and expenditures of the company are being made only in accordance with authorizations of management and directors of the company; and (3) provide reasonable assurance regarding prevention or timely detection of unauthorized acquisition, use, or disposition of the company’s assets that could have a material effect on the financial statements.
Because of its inherent limitations, internal control over financial reporting may not prevent or detect misstatements. Also, projections of any evaluation of effectiveness to future periods are subject to the risk that controls may become inadequate because of changes in conditions, or that the degree of compliance with the policies or procedures may deteriorate.
A material weakness is a control deficiency, or combination of control deficiencies, that results in more than a remote likelihood that a material misstatement of the annual or interim financial statements will not be prevented or detected. The following material weaknesses have been identified and included in management’s assessment:
| | • | | The Company did not maintain an appropriate level of staffing in operational and financial resources to provide the level of controls and analysis required on a timely basis. The failure to provide an adequate level of staffing resulted in certain accounting processes not being performed on a timely basis and the inability to maintain an adequate control environment. Maintaining appropriate levels of staffing is an important entity level control that is essential to maintaining the operating effectiveness of the underlying process level controls. This material weakness contributed to errors such as those relating to proper revenue recognition. |
F-3
| | • | | The Company failed to establish effective communication channels between operations and finance to adequately identify and record certain transactions during 2006. The failure to provide this communication manifested itself in situations such as 1) a 2005 liability not being recorded on a timely basis, and 2) accounts receivable reserves not being appropriately stated based on the status of collection efforts involving operational personnel and 3) the deactivation reserve being understated due to the fact that certain consumer focused marketing programs impacting the customer deactivation behavior not being properly reflected in the underlying data and the deactivation reserve model. Establishing effective communication between the Finance Department and operational departments will allow the company to reflect any necessary commitments in the financial statements. This material weakness contributed to errors relating to accounting and reporting of revenue, expenses and liabilities. |
| | • | | The Company did not utilize an appropriate methodology during the year in recording receivables from carriers associated with disputed deactivations, churn bonuses and other carrier related fees. Similar to other newly disputed amounts with carriers, revenue should not be recorded until the carrier agrees to pay the amount or collection is probable. The Company overstated accounts receivable by using a methodology that could not be supported by past experience and failed to include current results and other information received from the carriers. |
In addition, the Company did not take steps to adequately identify and appropriately record certain commission and bonus revenues received during the year from various carriers in a timely and accurate manner. Recording amounts received from carriers in the appropriate accounts in a timely and accurate manner is an important business process control that is essential to the correct reporting of amounts in the financial statements. This material weakness contributed to errors relating to accounting and reporting for revenue and accounts receivable. This material weakness contributed to errors relating to accounting and reporting of revenues.
| | • | | The Company did not utilize an appropriate methodology during the year in recording certain Equipment Discount Provision fees due from consumers when contracts are cancelled within specified time periods and the wireless device is not returned to the Company. Specifically, the Company overstated revenue and account receivable by using collection percentages in excess of that which could be supported by past collection experience. As a result of this material weakness, an adjustment was necessary to properly record revenue and related receivables from these fees. |
| | • | | The Company did not utilize an appropriate methodology during the year in recording rebates payable to eligible consumers. The Company understated the product rebate liability by not considering the appropriate amount of open periods eligible for rebates and the backlog of possible eligible rebates that had been delivered to outsourced payment service providers. Additionally, the Company failed to reflect actual rebate payments made to customers in its calculation of accrued product rebate liability. As a result of this material weakness, an adjustment was necessary to properly record product rebate expense and the related liability. |
| | • | | The Company did not maintain adequate documentation to support the proper accounting for inventory movements related to phone shipments for refitting and refurbishment. Consequently, the Company overstated inventory or receivables by not maintaining adequate documentation of track phones provided to outside services providers. As a result of this material weakness, an adjustment was necessary to properly record costs of goods sold and amounts due from vendors. |
| | • | | The Company did not consider all of the factors in determining its estimate of allowance for doubtful accounts. The proper accounting for the allowance for doubtful accounts requires that estimates must be made on the future collectibility of receivables. In the course of concluding on its analysis of reserves necessary related to accounts receivable, the Company concluded that an additional reserve was necessary for current receivables which based on historical experience will not be paid in the initial carrier payment. Receivables not paid in initial carrier payments are reclassified to disputed receivables and the related collection efforts are addressed through a specific process. We recommend that in future periods, management consider in its reserve an estimate of current |
F-4
receivables expected to be reclassified as disputed receivables and the related collection experience. As a result of this material weakness, an adjustment was necessary to properly record the allowance for doubtful accounts and bad debt expense.
These material weaknesses were considered in determining the nature, timing, and extent of audit tests applied in our audit of the 2006 financial statements, and this report does not affect our report dated May 31, 2007, which expressed an unqualified opinion on those financial statements.
In our opinion, management’s assessment that Inphonic, Inc. and Subsidiaries did not maintain effective internal control over financial reporting as of December 31, 2006, is fairly stated, in all material respects, based onInternal Control—Integrated Framework issued by the Committee of Sponsoring Organizations of the Treadway Commission (COSO). Also in our opinion, because of the effect of the material weaknesses described above on the achievement of the objectives of the control criteria, Inphonic, Inc. and Subsidiaries has not maintained effective internal control over financial reporting as of December 31, 2006, based onInternal Control—Integrated Framework issued by the Committee of Sponsoring Organizations of the Treadway Commission (COSO).
/s/ Grant Thornton LLP
McLean, Virginia
May 31, 2007
F-5
REPORT OF INDEPENDENT REGISTERED PUBLIC ACCOUNTING FIRM
Report of Independent Registered Public Accounting Firm
The Board of Directors and Stockholders
InPhonic, Inc. and subsidiaries:
We have audited the accompanying consolidated statement of operations, stockholders’ equity (deficit), and cash flows of InPhonic, Inc. and subsidiaries for the year ended December 31, 2004. These consolidated financial statements are the responsibility of the Company’s management. Our responsibility is to express an opinion on these consolidated financial statements based on our audit.
We conducted our audit in accordance with the standards of the Public Company Accounting Oversight Board (United States). Those standards require that we plan and perform the audit to obtain reasonable assurance about whether the financial statements are free of material misstatement. An audit includes examining, on a test basis, evidence supporting the amounts and disclosures in the financial statements. An audit also includes assessing the accounting principles used and significant estimates made by management, as well as evaluating the overall financial statement presentation. We believe that our audit provides a reasonable basis for our opinion.
In our opinion, the consolidated financial statements referred to above present fairly, in all material respects, the results of operations and the cash flows of InPhonic, Inc. and subsidiaries for the year ended December 31, 2004, in conformity with U.S. generally accepted accounting principles.
KPMG LLP
McLean, Virginia
March 8, 2005, except
as to note 1(c) and note 4,
which are as of March 16, 2006
F-6
INPHONIC, INC. & SUBSIDIARIES
Consolidated Balance Sheets
As of December 31, 2005 and 2006
(in thousands, except per share and share amounts)
| | | | | | | | |
| | | 2005 | | | 2006 | |
| Assets | | | | | | | | |
Current assets: | | | | | | | | |
Cash and cash equivalents | | $ | 70,783 | | | $ | 89,972 | |
Accounts receivable (net of allowance of $2,042 and $9,749, respectively) | | | 34,606 | | | | 63,820 | |
Inventory, net | | | 19,680 | | | | 23,164 | |
Prepaid expenses | | | 2,405 | | | | 6,507 | |
Deferred costs and other current assets | | | 6,823 | | | | 3,122 | |
Current assets of discontinued operations | | | 2,430 | | | | 391 | |
| | | | | | | | |
Total current assets | | | 136,727 | | | | 186,976 | |
Restricted cash and cash equivalents | | | 400 | | | | 38 | |
Property and equipment, net | | | 12,121 | | | | 22,746 | |
Goodwill | | | 31,140 | | | | 38,223 | |
Intangible assets, net | | | 12,651 | | | | 8,092 | |
Deposits and other assets | | | 3,058 | | | | 8,330 | |
| | | | | | | | |
Total assets | | $ | 196,097 | | | $ | 264,405 | |
| | | | | | | | |
| | |
| Liabilities and Stockholders’ Equity | | | | | | | | |
Current liabilities: | | | | | | | | |
Accounts payable | | $ | 31,543 | | | $ | 85,975 | |
Accrued expenses and other current liabilities | | | 31,588 | | | | 22,521 | |
Current portion of deferred revenue | | | 13,851 | | | | 16,604 | |
Current maturities of capital leases | | | 377 | | | | 301 | |
Current liabilities of discontinued operations | | | 3,130 | | | | 1,103 | |
| | | | | | | | |
Total current liabilities | | | 80,489 | | | | 126,504 | |
Long-term debt and capital lease obligations, net of current maturities | | | 15,474 | | | | 63,826 | |
Deferred revenue, net of current portion | | | 284 | | | | 478 | |
| | | | | | | | |
Total liabilities | | | 96,247 | | | | 190,808 | |
| | | | | | | | |
Commitments and Contingencies | | | — | | | | — | |
Stockholders’ equity: | | | | | | | | |
Common stock, $0.01 par value | | | | | | | | |
Authorized 200,000,000 shares at December 31, 2005 and 2006; issued and outstanding 35,232,869 and 37,138,480 shares at December 31, 2005 and 2006, respectively | | | 353 | | | | 371 | |
Additional paid-in capital | | | 264,155 | | | | 301,611 | |
Accumulated deficit | | | (164,658 | ) | | | (228,385 | ) |
| | | | | | | | |
Total stockholders’ equity | | | 99,850 | | | | 73,597 | |
| | | | | | | | |
Total liabilities and stockholders’ equity | | $ | 196,097 | | | $ | 264,405 | |
| | | | | | | | |
See accompanying notes to consolidated financial statements
F-7
INPHONIC, INC. & SUBSIDIARIES
Consolidated Statements of Operations
Years Ended December 31, 2004, 2005 and 2006
(in thousands, except per share and share amounts)
| | | | | | | | | | | | |
| | | 2004 | | | 2005 | | | 2006 | |
Revenue: | | | | | | | | | | | | |
Activations and services | | $ | 123,265 | | | $ | 233,730 | | | $ | 298,090 | |
Equipment | | | 31,603 | | | | 86,809 | | | | 71,484 | |
| | | | | | | | | | | | |
Total revenue | | | 154,868 | | | | 320,539 | | | | 369,574 | |
Cost of revenue, exclusive of depreciation and amortization: | | | | | | | | | | | | |
Activations and services | | | 1,752 | | | | 1,221 | | | | 2,653 | |
Equipment | | | 83,075 | | | | 190,509 | | | | 215,201 | |
| | | | | | | | | | | | |
Total cost of revenue | | | 84,827 | | | | 191,730 | | | | 217,854 | |
Operating expenses: | | | | | | | | | | | | |
Sales and marketing, exclusive of depreciation and amortization | | | 42,867 | | | | 93,726 | | | | 118,756 | |
General and administrative, exclusive of depreciation and amortization | | | 34,942 | | | | 63,131 | | | | 76,571 | |
Depreciation and amortization | | | 6,444 | | | | 9,840 | | | | 17,067 | |
Restructuring costs | | | — | | | | 847 | | | | 2,551 | |
Loss on investment | | | 150 | | | | 228 | | | | — | |
| | | | | | | | | | | | |
Total operating expenses | | | 84,403 | | | | 167,772 | | | | 214,945 | |
| | | | | | | | | | | | |
Operating loss | | | (14,362 | ) | | | (38,963 | ) | | | (63,225 | ) |
| | | | | | | | | | | | |
Other income (expense): | | | | | | | | | | | | |
Interest income | | | 757 | | | | 2,167 | | | | 2,329 | |
Interest expense | | | (980 | ) | | | (970 | ) | | | (2,638 | ) |
| | | | | | | | | | | | |
Total other income (expense) | | | (223 | ) | | | 1,197 | | | | (309 | ) |
| | | | | | | | | | | | |
Loss from continuing operations | | | (14,585 | ) | | | (37,766 | ) | | | (63,534 | ) |
| | | | | | | | | | | | |
Discontinued operations: | | | | | | | | | | | | |
Income (loss) from discontinued operations | | | 4,346 | | | | (1,784 | ) | | | (193 | ) |
Gain on sale | | | — | | | | 1,355 | | | | — | |
| | | | | | | | | | | | |
Total income (loss) from discontinued operations | | | 4,346 | | | | (429 | ) | | | (193 | ) |
| | | | | | | | | | | | |
Net loss | | | (10,239 | ) | | | (38,195 | ) | | | (63,727 | ) |
Preferred stock dividends and accretion | | | (22,049 | ) | | | — | | | | — | |
| | | | | | | | | | | | |
Net loss attributable to common stockholders | | $ | (32,288 | ) | | $ | (38,195 | ) | | $ | (63,727 | ) |
| | | | | | | | | | | | |
Basic and diluted net loss per share: | | | | | | | | | | | | |
Net loss from continuing operations | | $ | (2.60 | ) | | $ | (1.10 | ) | | $ | (1.75 | ) |
Net income (loss) from discontinued operations | | | 0.31 | | | | (0.01 | ) | | | — | |
| | | | | | | | | | | | |
Basic and diluted net loss per share | | $ | (2.29 | ) | | $ | (1.11 | ) | | $ | (1.75 | ) |
| | | | | | | | | | | | |
Basic and diluted weighted average shares outstanding | | | 14,074,505 | | | | 34,417,954 | | | | 36,312,970 | |
| | | | | | | | | | | | |
See accompanying notes to consolidated financial statements
F-8
INPHONIC, INC. & SUBSIDIARIES
Consolidated Statements of Stockholders’ Equity
Years Ended December 31, 2004, 2005 and 2006
(in thousands, except share amounts)
| | | | | | | | | | | | | | | | | | | | | | | | | | | | | | | | | | | | | | | | | | | | | | | | | | | |
| | | Series D-5 convertible preferred stock | | | Series D-3 convertible preferred stock | | | Series D-2 convertible preferred stock | | | Series A convertible preferred stock | | | Common stock | | | Additional paid-in capital | | | Note receivable from stockholder | | | Accumulated deficit | | | Total | |
| | | | | | | | | |
| | | Shares | | | Amount | | | Shares | | | Amount | | | Shares | | | Amount | | | Shares | | | Amount | | | Shares | | | Amount | | | | | |
Balance, January 1, 2004 | | 672,389 | | | $ | 1,884 | | | 792,775 | | | $ | 2,137 | | | 416,667 | | | $ | 688 | | | 668,782 | | | $ | 500 | | | 11,547,514 | | | $ | 115 | | | $ | 34,540 | | | $ | (1,120 | ) | | $ | (94,175 | ) | | $ | (55,431 | ) |
Issuance of common stock | | — | | | | — | | | — | | | | — | | | — | | | | — | | | — | | | | — | | | 8,504 | | | | 1 | | | | 49 | | | | — | | | | — | | | | 50 | |
Warrants issued in connection with long-term debt | | — | | | | — | | | — | | | | — | | | — | | | | — | | | — | | | | — | | | — | | | | — | | | | 817 | | | | — | | | | — | | | | 817 | |
Stock-based compensation expense | | — | | | | — | | | — | | | | — | | | — | | | | — | | | — | | | | — | | | — | | | | — | | | | 7,381 | | | | — | | | | — | | | | 7,381 | |
Proceeds of initial public offering, net of costs | | — | | | | — | | | — | | | | — | | | — | | | | — | | | — | | | | — | | | 6,500,000 | | | | 65 | | | | 110,773 | | | | — | | | | — | | | | 110,838 | |
Conversion of preferred stock upon initial public offering | | (672,389 | ) | | | (1,884 | ) | | (792,775 | ) | | | (2,137 | ) | | (416,667 | ) | | | (688 | ) | | (668,782 | ) | | | (500 | ) | | 13,619,536 | | | | 136 | | | | 92,172 | | | | — | | | | — | | | | 87,099 | |
Conversion of preferred stock to common stock warrants | | — | | | | — | | | — | | | | — | | | — | | | | — | | | — | | | | — | | | — | | | | — | | | | 2,744 | | | | — | | | | — | | | | 2,744 | |
Note receivable from stockholder | | — | | | | — | | | — | | | | — | | | — | | | | — | | | — | | | | — | | | — | | | | — | | | | — | | | | 1,120 | | | | — | | | | 1,120 | |
Dividends and accretion on redeemable preferred stock | | — | | | | — | | | — | | | | — | | | — | | | | — | | | — | | | | — | | | — | | | | — | | | | — | | | | — | | | | (22,049 | ) | | | (22,049 | ) |
Preferred stock dividends declared | | — | | | | — | | | — | | | | — | | | — | | | | — | | | — | | | | — | | | — | | | | — | | | | (10,306 | ) | | | — | | | | — | | | | (10,306 | ) |
Exercise of common stock warrants and options | | — | | | | — | | | — | | | | — | | | — | | | | — | | | — | | | | — | | | 577,019 | | | | 7 | | | | 71 | | | | — | | | | — | | | | 78 | |
Net loss | | — | | | | — | | | — | | | | — | | | — | | | | — | | | — | | | | — | | | — | | | | — | | | | — | | | | — | | | | (10,239 | ) | | | (10,239 | ) |
| | | | | | | | | | | | | | | | | | | | | | | | | | | | | | | | | | | | | | | | | | | | | | | | | | | |
Balance, December 31, 2004 | | — | | | | — | | | — | | | | — | | | — | | | | — | | | — | | | | — | | | 32,252,573 | | | | 324 | | | | 238,241 | | | | — | | | | (126,463 | ) | | | 112,102 | |
Issuance of common stock in connection with the acquisition of: | | | | | | | | | | | | | | | | | | | | | | | | | | | | | | | | | | | | | | | | | | | | | | | | | | | |
A1 Wireless, Inc. | | — | | | | — | | | — | | | | — | | | — | | | | — | | | — | | | | — | | | 236,526 | | | | 2 | | | | 4,907 | | | | — | | | | — | | | | 4,909 | |
VMC Satellite, Inc. | | — | | | | — | | | — | | | | — | | | — | | | | — | | | — | | | | — | | | 257,215 | | | | 3 | | | | 3,297 | | | | — | | | | — | | | | 3,300 | |
FONcentral.com, Inc. | | — | | | | — | | | — | | | | — | | | — | | | | — | | | — | | | | — | | | 131,876 | | | | 1 | | | | 1,548 | | | | — | | | | — | | | | 1,549 | |
Costs related to initial public offering | | — | | | | — | | | — | | | | — | | | — | | | | — | | | — | | | | — | | | — | | | | — | | | | (292 | ) | | | — | | | | — | | | | (292 | ) |
Stock-based compensation expense | | — | | | | — | | | — | | | | — | | | — | | | | — | | | — | | | | — | | | — | | | | — | | | | 17,886 | | | | — | | | | — | | | | 17,886 | |
Repurchase and retirement of common stock | | — | | | | — | | | — | | | | — | | | — | | | | — | | | — | | | | — | | | (1,081,487 | ) | | | (11 | ) | | | (13,077 | ) | | | — | | | | — | | | | (13,088 | ) |
Exercise of common stock warrants, options, restricted stock awards and other | | — | | | | — | | | — | | | | — | | | — | | | | — | | | — | | | | — | | | 3,436,166 | | | | 34 | | | | 11,645 | | | | — | | | | — | | | | 11,679 | |
Net loss | | — | | | | — | | | — | | | | — | | | — | | | | — | | | — | | | | — | | | — | | | | — | | | | — | | | | — | | | | (38,195 | ) | | | (38,195 | ) |
| | | | | | | | | | | | | | | | | | | | | | | | | | | | | | | | | | | | | | | | | | | | | | | | | | | |
Balance, December 31, 2005 | | — | | | | — | | | — | | | | — | | | — | | | | — | | | — | | | | — | | | 35,232,869 | | | | 353 | | | | 264,155 | | | | — | | | | (164,658 | ) | | | 99,850 | |
Issuance of common stock in connection with the acquisition of: | | | | | | | | | | | | | | | | | | | | | | | | | | | | | | | | | | | | | | | | | | | | | | | | | | | |
A1 Wireless, Inc. | | — | | | | — | | | — | | | | — | | | — | | | | — | | | — | | | | — | | | 15,408 | | | | — | | | | 235 | | | | — | | | | — | | | | 235 | |
VMC Satellite, Inc. | | — | | | | — | | | — | | | | — | | | — | | | | — | | | — | | | | — | | | 697,045 | | | | 7 | | | | 4,960 | | | | — | | | | — | | | | 4,967 | |
Issuance of common stock warrant | | — | | | | — | | | — | | | | — | | | — | | | | — | | | — | | | | — | | | — | | | | — | | | | 15,173 | | | | — | | | | — | | | | 15,173 | |
Stock-based compensation expense | | — | | | | — | | | — | | | | — | | | — | | | | — | | | — | | | | — | | | — | | | | — | | | | 15,551 | | | | — | | | | — | | | | 15,551 | |
Repurchase and retirement of common stock | | — | | | | — | | | — | | | | — | | | — | | | | — | | | — | | | | — | | | (350,261 | ) | | | (4 | ) | | | (3,734 | ) | | | — | | | | — | | | | (3,738 | ) |
Exercise of common stock warrants, options, restricted stock awards and other | | — | | | | — | | | — | | | | — | | | — | | | | — | | | — | | | | — | | | 1,543,419 | | | | 15 | | | | 5,271 | | | | — | | | | — | | | | 5,286 | |
Net loss | | — | | | | — | | | — | | | | — | | | — | | | | — | | | — | | | | — | | | — | | | | — | | | | — | | | | — | | | | (63,727 | ) | | | (63,727 | ) |
| | | | | | | | | | | | | | | | | | | | | | | | | | | | | | | | | | | | | | | | | | | | | | | | | | | |
Balance, December 31, 2006 | | — | | | $ | — | | | — | | | $ | — | | | — | | | $ | — | | | — | | | $ | — | | | 37,138,480 | | | $ | 371 | | | $ | 301,611 | | | $ | — | | | $ | (228,385 | ) | | $ | 73,597 | |
| | | | | | | | | | | | | | | | | | | | | | | | | | | | | | | | | | | | | | | | | | | | | | | | | | | |
See accompanying notes to consolidated financial statements
F-9
INPHONIC, INC. & SUBSIDIARIES
Consolidated Statements of Cash Flows
Years Ended December 31, 2004, 2005 and 2006
(in thousands)
| | | | | | | | | | | | |
| | | 2004 | | | 2005 | | | 2006 | |
Cash flows from operating activities: | | | | | | | | | | | | |
Net loss | | $ | (10,239 | ) | | $ | (38,195 | ) | | $ | (63,727 | ) |
Adjustments to reconcile net loss to net cash used in operating activities: | | | | | | | | | | | | |
Depreciation and amortization | | | 6,444 | | | | 9,840 | | | | 17,067 | |
Non-cash interest expense, sales and marketing expense and other | | | 306 | | | | 594 | | | | 954 | |
Stock-based compensation | | | 7,381 | | | | 18,618 | | | | 14,274 | |
Increase in allowance for doubtful accounts | | | — | | | | — | | | | 7.707 | |
Gain from the sale of Liberty Wireless | | | — | | | | (1,355 | ) | | | — | |
Write off of investment | | | 150 | | | | 228 | | | | — | |
Changes in operating assets and liabilities, net of assets and liabilities received from business acquisition: | | | | | | | | | | | | |
Accounts receivable | | | (8,428 | ) | | | (15,916 | ) | | | (36,575 | ) |
Inventory | | | (7,255 | ) | | | (7,540 | ) | | | (1,167 | ) |
Prepaid expenses | | | (321 | ) | | | (1,721 | ) | | | (5,577 | ) |
Deferred costs and other current assets | | | (120 | ) | | | (4,152 | ) | | | 4,276 | |
Deposits and other assets | | | 167 | | | | (2,595 | ) | | | (1,167 | ) |
Accounts payable | | | 3,217 | | | | 8,956 | | | | 53,236 | |
Accrued expenses and other liabilities | | | 4,143 | | | | 8,973 | | | | (7,297 | ) |
Deferred revenue | | | (2,035 | ) | | | 4,188 | | | | 2,947 | |
| | | | | | | | | | | | |
Net cash used in operating activities | | | (6,590 | ) | | | (20,077 | ) | | | (15,008 | ) |
Cash flows from investing activities: | | | | | | | | | | | | |
Capitalized expenditures, including internal capitalized labor | | | (5,544 | ) | | | (11,836 | ) | | | (22,172 | ) |
Cash paid for acquisitions | | | (11,142 | ) | | | (8,781 | ) | | | (4,662 | ) |
Cash paid for purchase of intangible assets | | | — | | | | (2,725 | ) | | | (193 | ) |
Purchase of short-term investments | | | — | | | | — | | | | (5,000 | ) |
Proceeds from the maturity of short-term investments | | | — | | | | — | | | | 5,000 | |
Proceeds from the sale of assets | | | — | | | | 101 | | | | 1,111 | |
Note receivable from stockholder | | | 1,120 | | | | — | | | | — | |
Reduction in restricted cash and cash equivalent | | | 100 | | | | 100 | | | | 362 | |
| | | | | | | | | | | | |
Net cash used in investing activities | | | (15,466 | ) | | | (23,141 | ) | | | (25,554 | ) |
Cash flows from financing activities: | | | | | | | | | | | | |
Principal repayments on long-term debt and capital leases | | | (11,046 | ) | | | (284 | ) | | | (21,784 | ) |
Borrowings on line of credit | | | — | | | | 15,000 | | | | 6,355 | |
Proceeds from term loan and other debt, net of fees | | | 3,976 | | | | — | | | | 73,632 | |
Cash paid for repurchase of common stock | | | — | | | | (13,088 | ) | | | (3,738 | ) |
Proceeds from exercise of warrants and options | | | 91 | | | | 11,679 | | | | 5,286 | |
Net proceeds (costs) of initial public offering, net of costs | | | 110,838 | | | | (292 | ) | | | — | |
Preferred stock dividend payments | | | (9,865 | ) | | | — | | | | — | |
| | | | | | | | | | | | |
Net cash provided by financing activities | | | 93,994 | | | | 13,015 | | | | 59,751 | |
| | | | | | | | | | | | |
Net increase (decrease) in cash and cash equivalents | | | 71,938 | | | | (30,203 | ) | | | 19,189 | |
Cash and cash equivalents, beginning of year | | | 29,048 | | | | 100,986 | | | | 70,783 | |
| | | | | | | | | | | | |
Cash and cash equivalents, end of year | | $ | 100,986 | | | $ | 70,783 | | | $ | 89,972 | |
| | | | | | | | | | | | |
Supplemental disclosure of cash flows information: | | | | | | | | | | | | |
Cash paid during the period for: | | | | | | | | | | | | |
Interest | | $ | 849 | | | $ | 253 | | | $ | 917 | |
Income taxes | | | — | | | | — | | | | — | |
Supplemental disclosure of non-cash activities: | | | | | | | | | | | | |
Issuance of warrants to purchase common stock with debt | | $ | 817 | | | $ | — | | | $ | 11,945 | |
Issuance of warrant to purchase common stock to vendor | | | — | | | | — | | | | 3,228 | |
Inventory exchanged for advertising credits | | | — | | | | — | | | | 2,323 | |
Stock-based compensation capitalized as website and internal use software costs | | | — | | | | — | | | | 616 | |
Issuance of common stock in business acquisitions | | | — | | | | 8,209 | | | | 5,202 | |
Issuance of common stock in intangible asset purchase | | | — | | | | 1,549 | | | | — | |
Issuance of common stock to settle a liability | | | 50 | | | | — | | | | — | |
Equipment purchase on capital lease | | | 635 | | | | 595 | | | | 152 | |
Release of funds in escrow related to acquisitions | | | — | | | | 10,700 | | | | — | |
Purchase consideration included in accrued liabilities | | | — | | | | 3,000 | | | | 1,120 | |
Preferred stock dividends and accretion to redemption value | | | 22,049 | | | | — | | | | — | |
Conversion of preferred stock, total preferred shares converted into 13,619,536 shares of common stock | | | 92,308 | | | | — | | | | — | |
See accompanying notes to consolidated financial statements
F-10
INPHONIC, INC. & SUBSIDIARIES
NOTES TO CONSOLIDATED FINANCIAL STATEMENTS
(in thousands, except per share and share amounts)
We are a leading online seller of wireless services and devices based on the number of activations of wireless services sold online in the United States. We are headquartered in Washington D.C. and maintain our technology and operations centers in Largo, Maryland and Reston and Great Falls, Virginia. We sell wireless service plans, including satellite television services through our branded websites; including Wirefly.com, A1 Wireless.com, and VMCsatellite.com and through websites that we create and manage for third parties. We offer marketers the ability to sell wireless voice and data services and devices under mobile virtual network enabler (“MVNE”) agreements. We provide customers the ability to organize personal communication by providing real time wireless access to e-mail, voicemail, faxes, contacts, scheduling, calendar and conference calling functionality through a website or telephone.
| | (b) | Risk and Uncertainties |
Our operations are subject to certain risks and uncertainties including, among others, actual and potential competition by entities with greater financial resources, rapid technological changes, the need to retain key personnel and protect intellectual property and the availability of additional capital financing on terms acceptable to us.
Since inception, we have incurred net losses attributable to common stockholders of approximately $228,385. To date, management has relied on debt and equity financings to fund our operating deficit. We had $89,972 of cash and cash equivalents on hand at December 31, 2006. We may require additional financing to fund future operations.
| | (c) | Discontinued Operations |
On December 31, 2005, we sold the operating assets of our mobile virtual network operator (“MVNO”) Liberty Wireless (“Liberty”) to Teleplus Wireless Corp., a subsidiary of Teleplus Enterprises, Inc. The sale of Liberty has enabled us to streamline and focus our resources on our other operations including the growth of our MVNE business. The sale of Liberty was recorded as a discontinued operation in the financial statements pursuant to Statement of Financial Accounting Standards (“SFAS”) No. 144,Accounting for the Impairment or Disposal of Long-Lived Assets (“SFAS No. 144”). We have classified these operations as discontinued operations and, accordingly, have segregated assets and liabilities of the discontinued operations in the accompanying Consolidated Balance Sheets as of December 31, 2005 and 2006 and the revenue and expenses of the discontinued operation in the accompanying Consolidated Statements of Operations for each of the three years ended December 31, 2006. Cash flows pertaining to discontinued operations were not disclosed separately in the Consolidated Statements of Cash Flows.
| (2) | Summary of Significant Accounting Policies |
| | (a) | Principles of Consolidation and Basis of Presentation |
The consolidated financial statements include the accounts of InPhonic, Inc. and its subsidiaries. All significant intercompany accounts and transactions are eliminated upon consolidation.
F-11
INPHONIC, INC. & SUBSIDIARIES
NOTES TO CONSOLIDATED FINANCIAL STATEMENTS—(Continued)
(in thousands, except per share and share amounts)
The preparation of consolidated financial statements in conformity with generally accepted accounting principles in the United States requires management to make estimates and assumptions that affect the reported amounts of certain assets and liabilities, revenue and expenses, and the related disclosure of contingent assets and liabilities in the consolidated financial statements and accompanying notes. The most significant of such estimates include our reserve for future deactivations, allowance for rebates, allowance for uncollectible accounts receivable, valuation of inventory, estimated useful life of assets, impairment of long-lived assets and goodwill, valuation of deferred tax assets and reserves for contingent tax liabilities. Actual results could differ from those estimates.
In preparation of the accompanying financial statements for the year ended December 31, 2005, we recorded an adjustment to reduce depreciation and amortization expense by $891. These adjustments to depreciation were made to correct a computational error in the fixed asset subledger that caused depreciation expense to be overstated in each prior period between fiscal years 2001 and 2005. We do not believe the impact of the adjustment was material to fiscal year 2005 or any period prior.
| | (c) | Cash and Cash Equivalents |
We consider all highly liquid investments with an original maturity of three months or less to be cash equivalents.
Fair Value of Financial Instruments
Our financial instruments, as defined under SFAS No. 107,Disclosures about Fair Value of Financial Instruments, include our cash, accounts receivable, accounts payable, borrowings under our line of credit with Comerica and our term loan. The fair value of cash, accounts receivable, and accounts payable were equal to their respective carrying values at December 31, 2005 and 2006. At December 31, 2005, the borrowings outstanding under our line of credit were equal to the respective carrying value. We retired our line of credit in November 2006. We hold cash and cash equivalents primarily in four financial institutions, which often exceed FDIC insured limits. Historically, we have not experienced any losses due to such concentration of credit risk.
As of December 31, 2006, the carrying value of the term loan was $63.6 million and the fair value of the debt approximated $72.4 million. The carrying value of the debt was recorded at a discount primarily as the result of a portion of the proceeds allocated to the fair value of detachable warrants issued with the debt. See Note 6 for further discussion.
Concentration Risk
Financial instruments that potentially subject us to a concentration risk consist principally of accounts receivable and accounts payable. We extend credit to wireless network carriers (“carriers”) on an unsecured basis in the normal course of business. Three carriers accounted for approximately 74% and 69% of accounts receivable, net of the deactivation reserve, as of December 31, 2005 and 2006, respectively.
F-12
INPHONIC, INC. & SUBSIDIARIES
NOTES TO CONSOLIDATED FINANCIAL STATEMENTS—(Continued)
(in thousands, except per share and share amounts)
For each of the years ended December 31, 2004, 2005 and 2006, revenue from three carriers exceeded 10% of the total revenue. Revenue as a percentage of total revenues for these carriers was as follows:
| | | | | | |
| | | 2004 | | 2005 | | 2006 |
Carrier A | | 22% | | 30% | | 36% |
Carrier B | | 28% | | 16% | | 17% |
Carrier C | | 26% | | 21% | | 15% |
| | | | | | |
Total | | 76% | | 67% | | 68% |
| | | | | | |
We are extended credit from wireless carriers at up to 60 day trade payable terms in the normal course of business to purchase certain handset equipment. The three carriers described above accounted for approximately 31% and 46% of accounts payable as of December 31, 2005 and 2006, respectively.
We depend primarily on our carriers to supply cellular phones and accessories in a timely manner in adequate quantities and consistent quality. If we are unable to obtain cellular phones in adequate quantities, we may incur delays in shipment or be unable to meet demand for our products. At December 31, 2005 and 2006, one carrier accounted for approximately 32% and 25% of our total purchases of cellular phones.
| | (e) | Allowance for Doubtful Accounts |
We maintain allowances for doubtful accounts for estimated losses resulting from the inability of customers to pay. The amount of the allowance is based on a combination of factors including the status of collection efforts with the respective wireless carriers on balances in which additional source information or other transaction details continue to be exchanged between us and the carrier. Our allowance for receivables due from carriers is estimated based on previous experience with collection efforts of similar nature. If the financial condition of any of the larger carrier customers we do business with were to deteriorate, resulting in an impairment of their ability to make payments, additional allowances may be required.
Inventory consists primarily of wireless devices. The carrying value of inventory is stated at the lower of its cost or market value. Cost is determined using a consistent method which approximates the first-in-first-out method. We write down inventory for estimated obsolescence or unmarketable inventory equal to the difference between the cost of inventory and the estimated market value or replacement cost based upon assumptions about future demand and market conditions. If actual market conditions are less favorable than those projected, additional inventory write-downs may be required. During the years ended December 31, 2004, 2005, and 2006, we wrote down inventory approximately $423, $506, and $179, respectively, in order to record certain inventory to a fair market value, which was lower than our cost. In addition during the year ended December 31, 2006, we have written-off or fully reserved for amounts due from equipment vendors for wireless devices returned to them totaling $3,990 for which credit has yet to be received.
Effective January 1, 2006, we adopted SFAS No. 151,Inventory Costs that is an amendment to ARB No. 43, Chapter 4 (“SFAS No. 151”), amends chapter 4 “Inventory Pricing” of ARB No. 43 and paragraph A3 of SFAS No. 144. Previously, ARB 43 did not define the term “so abnormal” which could lead to unnecessary incomparable financial reporting. SFAS No. 151 clarifies that abnormal costs related to idle facility expense, freight, handling costs, and wasted materials (spoilage) should be recognized as period costs. There was no material effect on our consolidated financial position, result of operations or cash flows as a result of this adoption.
F-13
INPHONIC, INC. & SUBSIDIARIES
NOTES TO CONSOLIDATED FINANCIAL STATEMENTS—(Continued)
(in thousands, except per share and share amounts)
Property and Equipment
Property and equipment is recorded at cost or at fair value if it is acquired in a business acquisition. Replacements and improvements that extend the useful life of property and equipment are capitalized. Property and equipment is depreciated over the following useful lives. Leasehold improvements are depreciated over the stated useful life or the contractually stated period of the underlying lease.
| | |
| | | Estimated useful
life (in years) |
Computer and equipment | | 3 |
Software | | 3 |
Furniture and fixtures | | 7 |
Leasehold improvements | | 3 |
Website development | | 1.5 |
Internal software development | | 2 |
We account for the costs relating to the development of our e-commerce platform for internal use based on AICPA Statement of Position (“SOP”) No. 98-1,Accounting for the Costs of ComputerSoftware Developed or Obtained for Internal Use, and the Emerging Issues Task Force (“EITF”) No. 00-02,Accounting for Web Site Development Costs. Website development costs consist of internal and external costs incurred to purchase and implement the web software and enhancements to the functionality of the web software, used in our business.
In accordance with SFAS No. 144, we are required to evaluate the carrying value of long-lived assets and certain intangible assets. SFAS No. 144 first requires an assessment of whether circumstances currently exist which suggest the carrying value of long-lived assets may not be recoverable. At December 31, 2005 and 2006, we did not believe any such conditions existed. Had these conditions existed, we would have assessed the recoverability of the carrying value of our long-lived assets and amortizable intangible assets based on estimated undiscounted cash flows to be generated from such assets. In assessing the recoverability of these assets, we would have projected estimated cash flows based on various operating assumptions such as average revenue per activation, deactivation rates, and sales and workforce productivity ratios. If the projection of undiscounted cash flows did not exceed the carrying value of the long-lived assets, we would have been required to record an impairment charge to the extent the carrying value exceeded the fair value of such assets.
Goodwill and Intangible Assets
Goodwill and intangible assets with indefinite useful lives are not amortized and are evaluated for impairment at least annually, or when events or circumstances suggest a potential impairment may have occurred. In accordance with SFAS No. 142,Goodwill and Other Intangible Assets (“SFAS No. 142”), we have selected the fourth quarter to perform the annual impairment test. SFAS No. 142 requires us to compare the fair value of the reporting unit to its carrying amount on an annual basis to determine if there is a potential impairment. If the fair value of the reporting unit is less than its carrying value, an impairment loss is recorded to the extent that the fair value of the goodwill within the reporting unit is less than the carrying value. The fair value for goodwill and other intangible assets not subject to amortization is determined based on discounted cash flows, market multiples or other measures, as appropriate. Based on our assessment for the year ended December 31, 2006, no impairments of goodwill or other intangible assets were noted.
F-14
INPHONIC, INC. & SUBSIDIARIES
NOTES TO CONSOLIDATED FINANCIAL STATEMENTS—(Continued)
(in thousands, except per share and share amounts)
For the year ended December 31, 2005, we originally determined that a supplier relationship valued at $3,730 had an indefinite useful life as of the April 26, 2005 acquisition date of VMC Satellite, Inc. During 2006, we determined that as of the acquisition date, the supplier relationship had a useful life of ten years in accordance with SFAS No. 142. During the fourth quarter of 2006, we recognized $255 of amortization expense for the period from April 26, 2005 to December 31, 2005. We do not believe the impact of this adjustment in 2006 to be material to the fiscal year 2006 or 2005 as a result of this change.
Intangible assets with determinable useful lives, which primarily consist of software and technology, customer contracts, affiliate relationships, a supplier relationship and a non-compete agreement, were recorded at fair value at the date of acquisition and amortized over the following economic lives:
| | |
| | | Estimated economic
life (in years) |
Software and technology | | 1.5 to 5 |
Customer contracts | | 1.5 to 3 |
Affiliate relationships | | 5 |
Non-compete agreement | | 2 to 5 |
Supplier relationship | | 10 |
Other | | 1.5 to 5 |
Intangible assets not subject to amortization include trade names.
Activations and Services Revenue
We recognize revenue from the sale of wireless services and the provisioning of MVNE and data services.
Wireless Services:We generate revenue from wireless carriers, including a satellite television carrier, who pay commissions and volume and performance-based bonuses, for activating wireless services and features on their networks. We recognize commissions from wireless carriers upon shipment of activated devices to the customer. In addition to activation commissions, certain carriers pay us a monthly residual fee either for as long as a customer who we activate for that carrier continues to be its subscriber, or for a fixed period of time depending on the carrier. Within our Satellite Television business unit, we receive satellite activation certificates evidencing activation rights in advance of their resale to customers. Revenue from satellite television customers includes commissions earned at the time of the satellite service activation, net of an estimate for deactivations, as we are acting as an agent in the transaction. Revenue is reduced for estimated deactivations of its wireless services by customers prior to the expiration of a time period that ranges 90 to 180 days from the date of activation, depending on the wireless carrier. We estimate deactivations based on historical experience, which we developed based on our experience with carriers, customer behavior and sources of customers, among other factors, allowing us to accrue estimates with what we believe is a high degree of certainty. If we determine that we cannot accurately predict future deactivation experience, we may be required to defer 100% of our carrier commissions revenue until the expiration of the appropriate chargeback period. Our reserves for deactivations are included in accounts receivable and deferred revenue on the accompanying balance sheets. Accounts receivable at December 31, 2005 and 2006 included reserve for deactivations of $7,540 and $7,639, respectively. Deferred revenue at December 31, 2005 and 2006 included reserve for deactivations of $10,796 and $14,546, respectively.
F-15
INPHONIC, INC. & SUBSIDIARIES
NOTES TO CONSOLIDATED FINANCIAL STATEMENTS—(Continued)
(in thousands, except per share and share amounts)
In addition to receiving commissions for each wireless subscriber activated, we earn performance bonuses from the wireless carriers based on negotiated performance targets. The most significant bonuses we earn are the quarterly volume bonuses, which we collect from wireless carriers on a monthly basis, based on current month activations. We record these bonuses as deferred revenue at the time of billing until we achieve the quarterly targets. We also earn other quarterly bonuses from certain carriers for maintaining low customer churn and signing up wireless customers for certain additional monthly “features” such as data service or text messaging. Wireless carriers also periodically offer bonuses for achieving monthly volume and other performance targets. We recognize these monthly bonuses as earned in accordance with the provisions of the Securities and Exchange Commission’s (“SEC”) Staff Accounting Bulletin (“SAB”) No. 104,Revenue Recognition in Financial Statements (“SAB No. 104”). Revenue is recognized only when all of the following criteria are met: (1) persuasive evidence of an arrangement exists, (2) delivery has occurred or services have been rendered, (3) the seller’s price to the buyer is fixed or determinable, and (4) collectibility is reasonably assured. Amounts collected in cash prior to meeting the above criteria are recorded as deferred revenue. Through 2005, commission revenue earned from the activation of carrier features had been deferred until the contractual chargeback period had lapsed as we did not have adequate historical information to estimate a reserve. Beginning in 2006, we began to estimate commission revenue earned from feature activations based on historical experience which we have developed based on our experience with carriers and customer behavior over a period of time in excess of 24 months. As of December 31, 2005, $1,383 of feature activations revenue was deferred, which would have been accrued for less an estimated reserve for deactivations, in the event that we had the appropriate experience with carriers and customer behavior at December 31, 2005. As of December 31, 2006, our estimated reserve for deactivations of feature activations was $629.
In the ordinary course of recording and collecting commissions from our wireless carrier partners, we engage in a matching and reconciling process (the “matching process”) between source information for customer wireless carrier activations generated and maintained in our back-office sales information systems and each carrier’s billing system. Although the substantial majority of our sales information matches to that of the carriers, matching differences do arise. Examples of such differences include (i) instances in which an activation per our records does not correlate to a commission fee payment schedule submitted by the carrier; (ii) commission fee payment collected from the carrier that is less than the expected payment per our sales records; (iii) a deactivation identified on a carrier statement that does not match the carrier’s original commission fee payment for such activation and (iv) commission or other fee payment we collect that is in excess of expected payment per our sales records.
Data files supported by our billing records related to differences are submitted monthly to each carrier for resolution. Resolution of these differences is usually an iterative process and it can take up to 12 months or longer for final resolution of any difference. Information is exchanged between us and the carrier throughout this process. We recognize revenue based on the underlying data maintained in our back-office sales information systems unless the carrier provides us details that supersedes our information. Given the nature of these differences and based on our experience in resolving such items with the carriers, we are also able to determine an appropriate reserve against revenue to reflect the likely success or failure of resolving these differences. In certain instances when a wireless carrier denies a claim we may file in resolving differences of this nature, we will write-off the related accounts receivable while pursuing further collection efforts and will record into income at a future date if collected. To the extent that we collect commission or other fee payments in excess of expectations, we will record revenue in the period of receipt net of estimated chargeback requirements.
F-16
INPHONIC, INC. & SUBSIDIARIES
NOTES TO CONSOLIDATED FINANCIAL STATEMENTS—(Continued)
(in thousands, except per share and share amounts)
MVNE Services:
We offer marketers the ability to sell wireless services to their customers under their own brands using our e-commerce platform and operational infrastructure through MVNE contracts. We receive fees for development of the network platform, as well as for operational support services. We defer the fees attributable to the production of the network platform and recognize these fees and costs over the expected life of the agreement (typically 12 to 48 months). Fees received for custom functional enhancements to the network platform and for operational services are deferred until all revenue criteria have been satisfied. Deferred revenue from MVNE contracts as of December 31, 2005 and 2006 included $1,852 and $1,195, respectively.
Other Revenue:
We sell data services, including a service that allows customers to access email, voicemail, facsimiles, contacts and personal calendar information through a website or a telephone. We bill customers monthly and revenue is recognized monthly, as the services are performed.
Equipment Revenue:
Revenue from the sale of wireless devices and accessories in a multiple-element arrangement with services is recognized at the time of sale in accordance withEITF No. 00-21,Revenue Arrangements with Multiple Deliverables, when fair value of the services element exists. Customers have the right to return devices within a specific period of time or usage, whichever occurs first. We provide an allowance for estimated returns of devices based on historical experience. Return rights of indirect retailers for wireless devices are limited to warranty claims, which are generally covered by the device manufacturers’ original warranties. In accordance with the provisions of SAB No. 104, we determined we have sufficient operating history to estimate equipment returns. In connection with wireless activations, we sell the wireless device to the customer at a significant discount, which is generally in the form of a rebate (“equipment discount provisions” or “EDP”). Rebates are recorded as a reduction of revenue. We recognize equipment revenue net of rebate costs based on historical experience of rebates claimed. Future experience could vary based upon rates of consumers redeeming rebates.
In the event a customer terminates their wireless service with the carrier within six months of activation and opts not to return the wireless device to us within the time frames permitted within our return policy, in many instances our sales contracts with the customer permit us to charge the customer an EDP termination fee for each unreturned device. Prior to the three months ended June 30, 2006, revenue recognition of such fee was deferred until such fee was collected from the customer pursuant to SAB 104 as we did not have adequate historical collection data to reasonably estimate the ultimate collectibility of the receivable. Beginning April 1, 2006, we began to estimate EDP termination fee revenue based on historical experience of customer collection behavior which we have developed over a time period of 24 months which provides the basis on which to accrue revenue with an appropriate assurance of collectibility pursuant to SAB 104. As of March 31, 2006, $293 of such revenue was deferred, which would have been accrued for in the event that we had adequate customer collection history, less an estimated reserve for uncollectible amounts. As of December 31, 2006, we had accrued as accounts receivable approximately $1,686 in such EDP fees.
The major components of cost of revenue, exclusive of depreciation and amortization, are:
Activations and services. Cost of activations and services revenue includes costs incurred from providers of telecommunications and data center services.
F-17
INPHONIC, INC. & SUBSIDIARIES
NOTES TO CONSOLIDATED FINANCIAL STATEMENTS—(Continued)
(in thousands, except per share and share amounts)
Equipment. We purchase wireless devices and accessories from wireless carriers, device manufacturers and third-party vendors to sell to customers and indirect retailers in the WAS business unit. We sell these wireless devices and accessories at a price below cost to encourage the sale and use of the services. We do not manufacture any of this equipment. Costs from the sale of wireless devices and accessories sold directly to customers are recognized at the time of sale. From time to time, we receive price protection credits on equipment purchased from certain vendors. We recognize price protection credits received for equipment that has been sold and shipped as a reduction of cost of revenue. Cost of revenue included shipping expenses of $4,677, $8,575 and $11,385 for the years ended December 31, 2004, 2005 and 2006, respectively.
We expense advertising and other marketing costs as incurred and principally include amounts paid to marketing partners based on the delivery of customers to our websites for wireless activation and services. Advertising and other marketing costs for the years ended December 31, 2004, 2005 and 2006 were $36,185, $79,078 and $104,351, respectively.
Beginning in 2007, we expect to begin capitalizing and amortizing a portion of our advertising costs (as direct response advertising) associated with activity pursuant to an agreement with a vendor.
| | (k) | Accrued Consumer Liabilities |
Under certain conditions, consumers’ purchasing wireless devices from us may be eligible for a product rebate depending on the wireless device purchased, service contract activated and the consumer maintaining their service with the wireless carrier for a period of up to six months. We estimate and record an accrued consumer liability and cost of revenue for such rebate at the time of sale based on the terms of the rebate and our rebate redemption experience over the most recent 18 months following the lapse of the contractual rebate redemption period. Our rebate redemptions are generally processed by a third party vendor that validates the consumer’s rebate redemption materials to ensure that the redemption request satisfies all terms and conditions of the rebate program to be eligible for payment. Only consumers that satisfy the redemption requirements of the rebate program receive the rebate amount.
During the last six months of 2006, we incurred and paid $7,950 of payments made to consumers outside our customary rebate redemption process to parties that we believed generally had not satisfied all the terms and conditions of the respective rebate redemption program. Such amounts were paid to satisfy customer complaints and are viewed by us as “customer credits” and reflected in general and administrative expenses.
Accounts payable at December 31, 2005 and 2006 consisted of:
| | | | | | |
| | | 2005 | | 2006 |
Trade payables for inventory | | $ | 14,353 | | $ | 50,989 |
Other accounts payable | | | 17,190 | | | 34,986 |
| | | | | | |
| | $ | 31,543 | | $ | 85,975 |
| | | | | | |
F-18
INPHONIC, INC. & SUBSIDIARIES
NOTES TO CONSOLIDATED FINANCIAL STATEMENTS—(Continued)
(in thousands, except per share and share amounts)
| | (m) | Accrued Expenses and Other Current Liabilities |
Accrued expenses and other liabilities at December 31, 2005 and 2006 consisted of:
| | | | | | |
| | | 2005 | | 2006 |
Accrued consumer liabilities, including accrued rebates | | $ | 18,289 | | $ | 8,203 |
Accrued payroll and related expenses | | | 1,452 | | | 1,685 |
Accrued acquisition costs and severance costs | | | 5,063 | | | 1,674 |
Accrued sales taxes payable | | | 593 | | | 443 |
Accrued interest | | | 83 | | | 995 |
Accrued product costs | | | 697 | | | 2,245 |
Other | | | 5,411 | | | 7,276 |
| | | | | | |
| | $ | 31,588 | | $ | 22,521 |
| | | | | | |
In the first quarter of 2005, we implemented a restructuring plan to take advantage of synergies gained through the acquisition of A1 Wireless and to restructure other operating segments. During the year ended December 31, 2005, we recognized $847 in restructuring costs, $811 of which related to workforce reduction and $36 related to exited facilities and contracts. We paid all restructuring costs related to this plan by December 31, 2005.
During 2006, we implemented a restructuring plan related to changes in our management and operations structure. We recognized $2,551 related to the termination of our former president and chief operating officer and thirty-four other senior executives and employees. Of this amount, $1,017 related to severance benefits that will be paid out in cash to the recipients on a monthly or semi-monthly basis over the terms of their respective severance agreements, $1,513 related to expenses incurred as a result of the modification of stock-based compensation awards under which vesting of 50% of unvested restricted share and option awards was accelerated for three of the former employees, and $21 related to other costs. As of December 31, 2006, we have $303 included in accrued expenses and other current liabilities for these expenses which have not yet been paid. We expect all remaining costs will be paid by June 30, 2007.
SFAS No. 109,Accounting for Income Taxes (“SFAS No. 109”), establishes financial accounting and reporting standards for the effect of income taxes. During the years ended December 31, 2004, 2005 and 2006, we did not have any income tax expense or benefit because a full valuation allowance was provided against our net deferred tax assets. Income taxes are accounted for under the asset and liability method. Deferred tax assets and liabilities are recognized for the future tax consequences attributable to differences between the financial statement carrying amounts of existing assets and liabilities and their respective tax bases and operating loss and tax credit carryforwards. Deferred tax assets and liabilities are measured using enacted tax rates expected to apply to taxable income in the years in which those temporary differences are expected to be recovered or settled. The effect on deferred tax assets and liabilities of a change in tax rates is recognized as a component of net income in the period that includes the enactment date.
| | (p) | Stock-Based Compensation |
We adopted SFAS No. 123 (revised 2004),Share Based Payment (“SFAS No. 123(R)”) on January 1, 2006 using the modified prospective application method (“MPA”). SFAS No. 123(R)
F-19
INPHONIC, INC. & SUBSIDIARIES
NOTES TO CONSOLIDATED FINANCIAL STATEMENTS—(Continued)
(in thousands, except per share and share amounts)
established standards for the accounting for transactions in which an entity exchanges its equity instruments for goods or services. SFAS No. 123(R) requires us to measure the cost of employee services received in exchange for an award of equity instruments (usually stock options or unvested (restricted) stock awards based on the grant-date fair value of the award. That cost is recognized over the period during which an employee is required to provide service in exchange for the award—the requisite service period (usually the vesting period). In March 2005, the SEC issued SAB No. 107,Valuation of Share-Based Payment Arrangements for Public Companies (“SAB 107”) relating to the interaction of the adoption of SFAS No. 123(R) and the SEC rules and regulations. We have applied the provisions of SAB 107 in our adoption of SFAS 123(R).
Prior to our adoption of SFAS No. 123(R), we applied the intrinsic value method of accounting for employee stock-based compensation as prescribed by Accounting Principles Board (“APB”) Opinion No. 25,Accounting for Stock Issued to Employees, and related interpretations including FASB Interpretation (“FIN”) No. 44,Accounting for Certain Transactions involving Stock Compensation an Interpretation of APB Opinion No. 25, to account for our stock option grants to employees. Under this method, compensation expense was recorded on the date of the grant only if the current market price of the underlying stock exceeded the exercise price. SFAS No. 123,Accounting for Stock-Based Compensation(“SFAS No. 123”), established accounting and disclosure requirements using a fair value-based method of accounting for stock-based employee compensation plans. As permitted by SFAS No. 123, we have elected to continue to apply the intrinsic value-based method of accounting described above, and had adopted the disclosure requirements of SFAS No. 123. All shares of restricted stock awarded to employees were accounted for at fair value in accordance with SFAS No. 123.
Under the MPA method, compensation cost for all share-based payments granted prior to, but not vested as of December 31, 2005, is based on the grant date fair value estimated in accordance with the pro forma provisions of SFAS No. 123, and compensation cost for all share based payments granted or modified subsequent to December 31, 2005, will be based on the grant date fair value estimated in accordance with the provisions of SFAS No. 123(R). Results for prior periods have not been restated. We use the ratable method of attributing the value of stock-based compensation to expense. SFAS No. 123(R) requires forfeitures to be estimated at the time of grant and revised, if necessary, in subsequent periods if actual forfeitures differ from those estimates. In our pro forma information required under SFAS No. 123 for the periods prior to January 1, 2006, we accounted for forfeitures as they occurred. The fair value of each option granted is estimated on the grant date using the Black-Scholes option pricing model which takes into account as of the grant date the exercise price and expected life of the option, the current price of the underlying stock and its expected volatility, expected dividends on the stock and the risk-free interest rate for the term of the option.
For the year ended December 31, 2006 as a result of our adoption of SFAS No. 123(R), we recognized stock-based compensation expense related to employee options granted prior to January 1, 2006 of $6,260, of which $405 was capitalized in accordance with our compensation policies and SFAS No. 123(R).
F-20
INPHONIC, INC. & SUBSIDIARIES
NOTES TO CONSOLIDATED FINANCIAL STATEMENTS—(Continued)
(in thousands, except per share and share amounts)
In addition, we granted options to certain of our employees to purchase 1,012,200 shares of our common stock during the year ended December 31, 2006. The options granted were granted at a weighted average exercise price of $7.14. The grant date fair value of employee share options was estimated using the Black-Scholes option-pricing model with the following assumptions:
| | | | | | | | | |
| | | 2004 | | | 2005 | | | 2006 | |
Expected volatility | | 70.00 | % | | 70.00 | % | | 72.00 | % |
Risk free interest rate | | 3.12 | % | | 3.82 | % | | 4.72 | % |
Expected dividend rate | | 0.00 | % | | 0.00 | % | | 0.00 | % |
Expected life (in years) | | 4.0 | | | 4.0 | | | 5.6 | |
The weighted average fair value per share of options granted using these assumptions was $4.65. Compensation cost of the grant was reduced by an estimated forfeiture amount based on an annual experience rate of 9.93%. As of the date of grants, total compensation cost related to the grants including estimated forfeitures was approximately $4,705 for the stock options granted during the year ended December 31, 2006. Stock-based compensation expense for these grants for the year ended December 31, 2006 was $670.
The impact of adopting SFAS No. 123(R) increased stock-based compensation expense included in our operating expenses and increased net loss from continuing operations by approximately $2,464 for the year ended December 31, 2006 or $0.07 per basic and diluted share. There was no impact from the adoption on cash flow from operations or cash flows from financing activities.
Our pro forma net loss applicable to common shareholders, and pro forma net loss per common share, basic and diluted, for periods prior to our adoption of SFAS No. 123(R) was as follows.
| | | | | | | | |
| | | For the year ended | |
| | | 2004 | | | 2005 | |
Net loss attributable to common stockholders, as reported | | $ | (32,288 | ) | | $ | (38,195 | ) |
Add: Stock-based compensation expense included in net loss attributable to common stockholders, as reported | | | 5,289 | | | | 17,482 | |
Less: Total stock-based compensation expense determined under fair value based methods for all stock awards, net of related tax effects | | | (6,472 | ) | | | (15,599 | ) |
| | | | | | | | |
Pro forma net loss attributable to common stockholders | | $ | (33,471 | ) | | $ | (36,312 | ) |
| | | | | | | | |
Net loss per common share, basic and diluted, as reported | | $ | (2.29 | ) | | $ | (1.11 | ) |
Net loss per common share, basic and diluted, pro forma | | $ | (2.38 | ) | | $ | (1.06 | ) |
We account for equity grants issued to non-employees at fair value, in accordance with the provisions of SFAS No. 123 and EITF No. 96-16,Accounting for Equity Instruments That Are Issued to Other Than Employees for Acquiring, or in Conjunction with Selling, Goods or Services. We use a Black-Scholes model to estimate the fair value of such awards and compensation expense relating to such equity issuances is recognized over the applicable vesting period of the options, warrants, or stock, in accordance with the method prescribed by FIN No. 28,Accounting for Stock Appreciation Rights and Other Variable Stock Option of Award Plans.
F-21
INPHONIC, INC. & SUBSIDIARIES
NOTES TO CONSOLIDATED FINANCIAL STATEMENTS—(Continued)
(in thousands, except per share and share amounts)
Stock-based compensation, which includes compensation recognized on stock option grants and restricted stock awards for employees and non-employees was included in the following line items on the accompanying financial statements. We have capitalized $616 of stock-based compensation as internally developed software for the year ended December 31, 2006. No such costs were capitalized in 2005. There were no tax benefits recognized in the statements of operations for stock based awards in any periods:
Balance Sheets:
Statements of operations:
| | | | | | | | | |
| | | For the year ended December 31, |
| | | 2004 | | 2005 | | 2006 |
Sales and marketing | | $ | 2,111 | | $ | 2,201 | | $ | 2,891 |
General and administrative | | | 5,096 | | | 15,585 | | | 9,860 |
Restructuring costs | | | — | | | — | | | 1,513 |
Income (loss) from discontinued operations | | | 174 | | | 832 | | | 112 |
| | | | | | | | | |
| | $ | 7,381 | | $ | 18,618 | | $ | 14,376 |
| | | | | | | | | |
Stock-based compensation from continuing operations in 2005 included $7,851 related to the modification of the terms of original restricted stock awards or option grants related to six employees that were terminated in 2005. Stock based compensation from continuing operations in 2006 included $1,370 related to the modification of stock-based awards for five employees. Such modifications accelerated the vesting of 81,035 shares of restricted stock and options underlying 122,258 shares of our common stock. Unrecognized compensation cost for all unvested options and restricted stock awards was $36,459 as of December 31, 2006 which will be recognized over a weighted average period of 1.5 years.
| | (q) | Net Loss Per Common Share |
We calculate net loss per common share in accordance with SFAS No. 128,Earnings Per Share(“SFAS No. 128”). Basic net loss per common share excludes any dilutive effects of options, warrants, restricted stock awards and convertible securities and is calculated by dividing net loss attributable to common stockholders by the weighted average number of common shares outstanding for the period. Diluted net loss per common share equals basic net loss per common share as the effects of options, warrants, restricted stock awards and convertible securities would have been anti-dilutive.
F-22
INPHONIC, INC. & SUBSIDIARIES
NOTES TO CONSOLIDATED FINANCIAL STATEMENTS—(Continued)
(in thousands, except per share and share amounts)
The following table reconciles net loss attributable to common stockholders and basic and diluted weighted average common shares outstanding to the historical or pro forma net loss attributable to common stockholders and the historical or pro forma basic and diluted weighted average common shares outstanding for the years ended December 31, 2004, 2005 and 2006. Information presented for 2004 has been prepared on a pro forma basis assuming outstanding preferred stock was converted into common stock at the beginning of the period in connection with our initial public offering. Weighted average shares outstanding presented for 2006 includes the effect 1,250,000 shares representing detachable warrants issued with the term loan on November 7, 2006, as described in Note 6. These warrants are exercisable at $0.01 per share.
| | | | | | | | | | | | |
| | | 2004 | | | 2005 | | | 2006 | |
Numerator: | | | | | | | | | | | | |
Net loss from continuing operations | | $ | (14,585 | ) | | $ | (37,766 | ) | | $ | (63,534 | ) |
Preferred stock dividends and accretion | | | (22,049 | ) | | | — | | | | — | |
| | | | | | | | | | | | |
Net loss from continuing operations attributable to common stockholders | | | (36,634 | ) | | | (37,766 | ) | | | (63,534 | ) |
Income (loss) from discontinued operations | | | 4,346 | | | | (429 | ) | | | (193 | ) |
| | | | | | | | | | | | |
Net loss attributed to common stockholders | | $ | (32,288 | ) | | $ | (38,195 | ) | | $ | (63,727 | ) |
| | | | | | | | | | | | |
Denominator: | | | | | | | | | | | | |
Weighted average shares outstanding | | | 14,074,505 | | | | 34,417,954 | | | | 36,312,970 | |
Basic and diluted net gain (loss) per share: | | | | | | | | | | | | |
Net loss from continuing operations attributable to common stockholders | | $ | (2.60 | ) | | $ | (1.10 | ) | | $ | (1.75 | ) |
Net income (loss) from discontinued operations | | | 0.31 | | | | (0.01 | ) | | | — | |
| | | | | | | | | | | | |
Basic and diluted earnings per share: | | $ | (2.29 | ) | | $ | (1.11 | ) | | $ | (1.75 | ) |
| | | | | | | | | | | | |
For the years ended December 31, 2004, 2005 and 2006, we incurred a net loss. If our outstanding common stock equivalents were exercised or converted into common stock, the result would have been anti-dilutive and, accordingly, basic and diluted net loss attributable to common stockholders per share are identical for all periods presented in the accompanying condensed consolidated statements of operations. The following summarizes our potential outstanding common stock equivalents as of the end of each period.
| | | | | | |
| | | December 31, |
| | | 2004 | | 2005 | | 2006 |
Options to purchase common stock | | 6,629,469 | | 5,115,969 | | 4,043,103 |
Restricted stock awards | | — | | 1,137,878 | | 2,964,649 |
Warrants to purchase common stock | | 1,780,923 | | 787,863 | | 2,754,740 |
| | | | | | |
Total common stock equivalents convertible into common stock | | 8,410,392 | | 7,041,710 | | 9,762,492 |
| | | | | | |
F-23
INPHONIC, INC. & SUBSIDIARIES
NOTES TO CONSOLIDATED FINANCIAL STATEMENTS—(Continued)
(in thousands, except per share and share amounts)
In September 2006, the SEC released Staff Accounting Bulletin No. 108,Considering the Effects of Prior Year Misstatements When Quantifying Misstatements in Current Year Financial Statements(“SAB 108”). SAB 108 provides guidance on how the effects of the carryover or reversal of prior year financial statement misstatements should be considered in quantifying a current year misstatement. Prior practice allowed the evaluation of materiality on the basis of (1) the error quantified as the amount by which the current year income statement was misstated (rollover method) or (2) the cumulative error quantified as the cumulative amount by which the current year balance sheet was misstated (iron curtain method). SAB 108 is effective for fiscal years ending after November 15, 2006. SAB 108 requires a dual approach that consists of both the rollover and iron curtain methods. We adopted SAB 108 effective in the fourth quarter ended December 31, 2006. There was no material effect on our financial position, results of operations or cash flows as a result of this adoption.
| | (s) | Recent Accounting Pronouncements |
In May 2005, the Financial Accounting Standards Board (“FASB”) FASB issued SFAS No. 154,Accounting Changes and Error Corrections (“SFAS No. 154”), a replacement of APB Opinion No. 20,Accounting Changes, and SFAS No. 3,Reporting Accounting Changes in Interim Financial Statements. SFAS No. 154 changes the requirements for the accounting for, and reporting of, a change in accounting principle. Previously, voluntary changes in accounting principles were generally required to be recognized by way of a cumulative effect adjustment within net income during the period of the change. SFAS No. 154 requires retrospective application to prior periods’ financial statements of changes in accounting principles, unless it is impracticable to determine either the period-specific effects or the cumulative effect of the change. SFAS No. 154 is effective for accounting changes made in fiscal years beginning after December 15, 2005; however, the statement does not change the transition provisions of any existing accounting pronouncements. We adopted the pronouncement effective January 1, 2006. There was no material effect on our financial position, results of operations or cash flows as a result of this adoption.
In June 2006, the FASB ratified the EITF Issue No. 06-3,How Taxes Collected from Customers and Remitted to Governmental Authorities Should Be Presented in the Income Statement” (“EITF 06-3”).EITF No. 06-3 requires an entity to disclose transactional tax amounts assess by government authorities that are considered significant. EITF No. 06-3 is effective for interim and annual reporting periods beginning after December 15, 2006. We have determined that the adoption of this pronouncement will have no material impact to our consolidated financial position, results of operations, or cash flows.
In June, 2006, the FASB issued FASB Interpretation No. 48,Accounting for Uncertainty in Income Taxes—an interpretation of FASB Statement No. 109 (“FIN 48”). FIN 48 clarifies the accounting for uncertainty in income taxes recognized in an enterprise’s financial statements in accordance with SFAS No. 109. FIN 48 prescribes a recognition threshold and measurement attribute for the financial statement recognition and measurement of a tax position taken or expected to be taken in a tax return. FIN 48 also provides guidance on de-recognition, classification, interest and penalties, accounting in interim periods, disclosure, and transition. FIN 48 will apply to fiscal years beginning after December 15, 2006, with earlier adoption permitted. We will adopt FIN 48 effective January 1, 2007. As prescribed in the interpretation, the cumulative effect of applying the provisions of FIN No. 48 should be reflected as an adjustment to the opening balance of Stockholders' Equity. We do not believe the adoption of this pronouncement will have any material effects on our consolidated financial position, results of operations, or cash flows.
F-24
INPHONIC, INC. & SUBSIDIARIES
NOTES TO CONSOLIDATED FINANCIAL STATEMENTS—(Continued)
(in thousands, except per share and share amounts)
In September 2006, the FASB issued SFAS No. 157,Fair Value Measurements (“SFAS No. 157”). SFAS 157 defines fair value, establishes a framework for measuring fair value under generally accepted accounting principles, and expands disclosures about fair value measurements. SFAS 157 emphasizes that fair value is a market-based measurement, not an entity-specific measurement, and states that a fair value measurement should be determined based on the assumptions that market participants would use in pricing the asset or liability. SFAS 157 will become effective for our fiscal year beginning January 1, 2008. We do not believe the adoption of this pronouncement will have any material effects on our consolidated financial position, results of operations, or cash flows.
In February 2007, the Financial Accounting Standards Board issued SFAS 159,The Fair Value Option for Financial Assets and Financial Liabilities—including an amendment of FASB Statement No. 115( “SFAS No. 159”),which allows measurement at fair value of eligible financialassets and liabilities that are not otherwise measured at fair value. If the fair value option for an eligible item is elected, unrealized gains and losses for that itemwill be reported in current earnings at each subsequent reporting date. SFAS 159 also establishes presentation and disclosure requirements designed to drawcomparison between the different measurement attributes the company elects for similar types of assets and liabilities. SFAS No. 159 is effective for fiscal yearsbeginning after November 15, 2007. Early adoption is permitted. We do not believe the adoption of this pronouncement will have any material effects on our consolidated financial position, results of operations, or cash flows.
| | (a) | Acquisition of A1 Wireless |
On January 4, 2005, we acquired certain assets and assumed certain obligations of A1 Wireless, Inc. in a transaction accounted for using the purchase method of accounting in accordance with SFAS No. 141,Business Combinations (“SFAS No. 141”). A1 Wireless activated and sold wireless services and devices to consumers through their own branded websites, branded partner websites, that it created and managed, and through sophisticated online search advertising campaigns. This acquisition enhanced our existing distribution channels in the WAS business unit. The results of A1 Wireless’ operations were included in our financial statements beginning January 1, 2005, and are reported in the WAS business unit.
Purchase consideration consisted of cash and shares of common stock for an aggregate purchase price of $24,582, including acquisition costs of $2,148 and contingent consideration of $5,173. At the closing, we paid approximately $10,700 in cash, which was held by an escrow agent as of December 31, 2004 and issued 160,226 shares of common stock with a fair value of $3,736. The contingent consideration included cash of $4,000 and 76,300 shares of our common stock with a fair value of $1,173.
| | (b) | Acquisition of VMC Satellite, Inc. |
On April 26, 2005, we completed the acquisition of certain assets and liabilities of VMC Satellite, Inc., (“VMC”) in a transaction accounted for using the purchase method of accounting in accordance with SFAS No. 141. VMC is a marketer of digital broadcast satellite services. This acquisition has enabled us to expand our service offerings, creating additional revenue opportunities from consumers that visit its portfolio of websites and marketing partners each month. The results of VMC’s operations were included in our financial statements beginning April 26, 2005, and are reported in the WAS business unit.
F-25
INPHONIC, INC. & SUBSIDIARIES
NOTES TO CONSOLIDATED FINANCIAL STATEMENTS—(Continued)
(in thousands, except per share and share amounts)
The aggregate consideration for the net assets acquired was approximately $10,979 which consisted of $4,679 in cash paid and includes acquisition costs of approximately $725 and shares of our common stock, with a fair value of $6,300, issuable in two tranches. The first tranche of stock consideration was distributed in July and September 2005 and included a total of 257,215 shares of our common stock with a fair value of approximately $3,300. Pursuant to the asset purchase agreement, as amended, the second tranche of stock consideration was to be distributed by us no later than April 26, 2006, and required us to issue common stock or cash with a fair value of $3,000 on the distribution date. We recorded the second tranche of stock consideration in accrued liabilities as of December 31, 2005 and reclassified the amount to additional paid in capital when the distribution was made in April 2006.
In addition, we agreed to pay up to an aggregate of $5,050 in cash plus 334,288 shares of our common stock upon the acquired operations attaining certain EBITDA (earnings before interest, tax, depreciation and amortization) benchmarks between April 26, 2005 and April 30, 2007. For the year ended December 31, 2006, certain EBITDA benchmarks were met and $5,116 of cash (of which $1,120 was accrued as of December 31, 2006) and shares of common stock with a fair value of $1,967 were issued as a result of VMC attaining certain EBITDA targets. This contingent consideration increased the carrying value of goodwill by $7,083. The goodwill recorded in connection with the transaction is deductible for tax purposes.
| (4) | Discontinued Operations |
On December 31, 2005, we completed the sale of substantially all of the operating assets of our Liberty Wireless business for approximately $2,318 including consideration payable in cash of up to $1,491 and notes receivable of approximately $755, net of $35 discount. Of the consideration payable at closing in cash, approximately $784 was received in January 2006 and $707 was offset against service liabilities assumed by the buyer in the transaction. We recorded a net gain on the sale of $1,355. In connection with this gain recognition on the sale, we considered the guidance of SAB Topic 5:E,Accounting for a Divesture Of A Subsidiary or Other Business Operation.
Under the terms of the notes receivable, we received proceeds due in installments through 2006. Although the notes do not bear interest, we have recorded the notes at a discount and accreted interest income over their outstanding terms. Between January 1, 2006 and December 31, 2006, we received scheduled principal repayments of $1,111 on the notes receivable, and have offset certain payables in amounts of $130 regarding collection of the notes receivable. As of December, 31, 2006, $250 of receivables have not yet been collected. However, we believe these amounts are fully collectible.
Summary operating results for the discontinued operating segment were as follows:
| | | | | | | | | | | |
| | | For the Year Ended December 31, | |
| | | 2004 | | 2005 | | | 2006 | |
Revenue | | $ | 49,332 | | $ | 23,221 | | | $ | — | |
Costs and expenses | | | 44,986 | | | 23,650 | | | | 193 | |
| | | | | | | | | | | |
Income (loss) from discontinued operations | | $ | 4,346 | | $ | (429 | ) | | $ | (193 | ) |
| | | | | | | | | | | |
F-26
INPHONIC, INC. & SUBSIDIARIES
NOTES TO CONSOLIDATED FINANCIAL STATEMENTS—(Continued)
(in thousands, except per share and share amounts)
Balance sheet data included:
| | | | | | |
| | | As of December 31, |
| | | 2005 | | 2006 |
Accounts and notes receivable, net | | $ | 1,848 | | $ | 391 |
Other current assets | | | 4 | | | — |
Other non-current assets | | | 578 | | | — |
| | | | | | |
Assets of discontinued operations | | $ | 2,430 | | $ | 391 |
| | | | | | |
Accounts payable | | $ | 931 | | $ | — |
Other accrued expenses | | | 2,199 | | | 1,103 |
| | | | | | |
Liabilities of discontinued operations | | $ | 3,130 | | $ | 1,103 |
| | | | | | |
Property and Equipment
Property and equipment, stated net of accumulated depreciation and amortization, consisted of the following as of December 31, 2005 and 2006:
| | | | | | | | |
| | | 2005 | | | 2006 | |
Computer and equipment | | $ | 7,117 | | | $ | 10,187 | |
Software | | | 5,117 | | | | 6,367 | |
Furniture and fixtures | | | 834 | | | | 785 | |
Leasehold improvements | | | 1,675 | | | | 2,039 | |
Other equipment | | | — | | | | 554 | |
Capitalized leases | | | 1,243 | | | | 1,397 | |
Less: Accumulated depreciation and amortization | | | (9,504 | ) | | | (13,101 | ) |
| | | | | | | | |
| | | 6,482 | | | | 8,228 | |
| | | | | | | | |
Website and internal software development costs | | | 14,162 | | | | 31,169 | |
Less: Accumulated depreciation and amortization | | | (8,523 | ) | | | (16,651 | ) |
| | | | | | | | |
Website and internal software development costs, net | | | 5,639 | | | | 14,518 | |
| | | | | | | | |
Total property and equipment, net | | $ | 12,121 | | | $ | 22,746 | |
| | | | | | | | |
Depreciation expense for the years ended December 31, 2004, 2005 and 2006 was $5,373, $6,702 and $12,315, respectively. The cost of property and equipment under capital leases was $1,243 and $1,397 at December 31, 2005 and 2006, respectively. Accumulated depreciation for assets under capital leases was $278 and $751 at December 31, 2005 and 2006, respectively.
Website and internal software development costs
We capitalized a total of approximately $253, $647 and $1,385 during 2004, 2005 and 2006, respectively, relating to the development of the e-commerce platform. In addition, we capitalized costs incurred to develop certain internal use software of approximately $3,008, $6,729 and $15,622 in 2004, 2005 and 2006, respectively. We are amortizing the web development costs over a period of 18 months and internal use software costs over a period of 24 months. These costs are included in depreciation and amortization in the accompanying consolidated statements of operations. Amortization expense on
F-27
INPHONIC, INC. & SUBSIDIARIES
NOTES TO CONSOLIDATED FINANCIAL STATEMENTS—(Continued)
(in thousands, except per share and share amounts)
the e-commerce platform and other internal use software development costs was approximately $2,784, $3,749, and $8,127 during 2004, 2005 and 2006, respectively.
Goodwill and intangible assets
Amortizable intangible assets were comprised of the following:
| | | | | | | | | |
| | | December 31, 2005 |
| | | Gross Carrying
Amount | | Accumulated
Amortization | | Net Carrying
Amount |
Software and technology | | $ | 1,123 | | $ | 1,045 | | $ | 78 |
Customer contracts | | | 885 | | | 885 | | | ��� |
Affiliate and carrier relationships | | | 3,960 | | | 676 | | | 3,284 |
Non-compete agreement (a) | | | 5,049 | | | 1,431 | | | 3,618 |
Other | | | 1,935 | | | 1,104 | | | 831 |
| | | | | | | | | |
Total | | $ | 12,952 | | $ | 5,141 | | $ | 7,811 |
| | | | | | | | | |
| | (a) | On May 27, 2005, we completed the purchase of certain intangible assets of FONcentral.com, Inc. The aggregate consideration for the assets acquired was approximately $4,139 which consisted of $2,590 in cash, which included acquisition costs and accrued expenses of $151, plus 131,876 shares of common stock with a fair value equal to approximately $1,549. |
| | | | | | | | | |
| | | December 31, 2006 |
| | | Gross Carrying
Amount | | Accumulated
Amortization | | Net Carrying
Amount |
Software and technology | | $ | 90 | | $ | 31 | | $ | 59 |
Affiliate and carrier relationships | | | 3,960 | | | 1,496 | | | 2,464 |
Non-compete agreement | | | 5,049 | | | 3,788 | | | 1,261 |
Supplier relationships | | | 3,730 | | | 628 | | | 3,102 |
Other | | | 2,128 | | | 2,032 | | | 96 |
| | | | | | | | | |
Total | | $ | 14,957 | | $ | 7,975 | | $ | 6,982 |
| | | | | | | | | |
Aggregate amortization expense for intangible assets subject to amortization was approximately $3,138 in 2005 and $4,752 in 2006. Estimated amortization expense based on current intangible balances is $2,301, $1,303, $1,303, $465, and $373 for the years ended December 31, 2007, 2008, 2009, 2010 and 2011, respectively.
The carrying value of intangible assets with indefinite lives was $4,840 and $1,110 for December 31, 2005 and 2006, respectively. Intangible assets with indefinite lives consisted of trade names. For the year ended December 31, 2005, we originally determined that a supplier relationship valued at $3,730 had an indefinite life as of the acquisition date. During 2006, we determined that as of the acquisition date, the supplier relationship had a useful life of ten years in accordance with SFAS No. 142. During the fourth quarter of 2006, we recognized $255 of amortization expense for the period from April 26, 2005 to December 31, 2005. We do not believe the impact of this adjustment in 2006 to be material to fiscal year 2006 or 2005 as a result of this change.
F-28
INPHONIC, INC. & SUBSIDIARIES
NOTES TO CONSOLIDATED FINANCIAL STATEMENTS—(Continued)
(in thousands, except per share and share amounts)
The following table reflects the changes to goodwill for the years ended December 31, 2005 and 2006:
| | | | | | | | | | | |
| | | WAS Segment | | Data
Services
Segment | | | Total | |
Balance as of January 1, 2005 | | $ | 9,258 | | $ | 221 | | | $ | 9,479 | |
Goodwill arising from the A1 Wireless acquisition | | | 17,988 | | | — | | | | 17,988 | |
Goodwill arising from the VMC acquisition | | | 3,894 | | | — | | | | 3,894 | |
Sale of Data Services software assets | | | — | | | (221 | ) | | | (221 | ) |
| | | | | | | | | | | |
Balance as of December 31, 2005 | | | 31,140 | | | — | | | | 31,140 | |
Goodwill arising from the VMC acquisition | | | 7,083 | | | — | | | | 7,083 | |
| | | | | | | | | | | |
Balance as of December 31, 2006 | | $ | 38,223 | | $ | — | | | $ | 38,223 | |
| | | | | | | | | | | |
Debt consisted of the following:
| | | | | | | | |
| | | December 31, | |
| | | 2005 | | | 2006 | |
Borrowings under credit facility | | $ | 15,000 | | | $ | — | |
Borrowings under term loan | | | — | | | | 75,000 | |
Capital leases | | | 851 | | | | 574 | |
| | | | | | | | |
| | | 15,851 | | | | 75,574 | |
Less discount from warrant issuance | | | — | | | | (11,447 | ) |
Less current maturities | | | (377 | ) | | | (301 | ) |
| | | | | | | | |
Long-term debt | | $ | 15,474 | | | $ | 63,826 | |
| | | | | | | | |
| | (a) | $100 million term loan |
On November 7, 2006, we executed a $100,000 aggregate principal amount senior secured term loan with Goldman Sachs Credit Partners, L.P., Citicorp North America, Inc. and AP Inphonic Holdings Inc. bearing a fixed rate of interest of nine percent per annum and secured by substantially all our assets. As of November 7, 2006, the Goldman Sachs Group, Inc., an affiliate of Goldman Sachs Credit Partners, L.P., beneficially-owned approximately 15.5% of our common stock. This term loan matures in November 2011. Beginning in November 2009, we have the ability to repay principal on the loan without penalty and conversely, the lenders have the right to call the remaining outstanding principal of the debt without penalty. As additional consideration, we also granted the lenders warrants to purchase 1,250,000 shares of our common stock at an exercise price of $0.01 per share. We received proceeds of $75,000 aggregate principal amount of the term loan proceeds on November 7, 2006, and have the option to draw-down the remaining amount at a later date. Proceeds from the term loan will be used to repay all indebtedness under the existing credit facility, fund share repurchases of our common stock, and for general corporate and working capital needs. In conjunction with the loan transaction above, we terminated our credit facility with Comerica Bank and used proceeds from the term loan to repay the outstanding principal obligation of $19,924 plus accrued interest. For the period November 7, 2006 to December 31, 2006, we accrued $994 of interest on the term loan, which was included as accrued expenses and other current liabilities on the accompanying balance sheet at December 31, 2006.
F-29
INPHONIC, INC. & SUBSIDIARIES
NOTES TO CONSOLIDATED FINANCIAL STATEMENTS—(Continued)
(in thousands, except per share and share amounts)
Under the terms of the term loan, we are required to maintain certain minimum levels of EBITDA on a quarterly basis beginning December 31, 2006, maintain a minimum $25,000 cash balance at a certain financial institution beginning July 31, 2007, maintain a maximum level of capitalized expenditures and maintain certain other financial and non-financial covenants, including our delivery of our audited financial statements with the opinion of our independent registered public accounting firm within 90 days of our year-end in accordance with the financial statement delivery requirements under the term loan agreement. On May 1, 2007, we amended the term loan agreement to extend the draw date for an additional $25 million of borrowings to July 31, 2007. Additionally, we received an extension of time to satisfy the delivery requirements of our annual 2006 and first quarter 2007 financial statements and related certificates under the term loan agreement to May 31, 2007 and June 15, 2007, respectively. We were in compliance with the covenants under the term loan agreement.
The warrants to purchase 1,250,000 shares of common stock at $0.01 per share were valued at $13,715 using a Black-Scholes model. Assumptions used in the model included a five year term based on the contractual life, 72% volatility and a risk free rate of 4.6%. We estimated the fair value of our long-term fixed rate term loan using a discounted cash flow analysis based on a current borrowing rate of companies with a similar debt rating. We assumed a life of the debt equal to the earliest period in which we can repay or refinance the debt. The estimated fair value of the term loan with a fixed interest rate at 9.00% was $72,400. In accordance with APB No. 14,Accounting for Convertible Debt and Debt Issued with Stock Purchase Warrants,we allocated the $75,000 proceeds to the term loan and detachable warrants based on the relative fair value of each on a standalone basis. As such, $63,055 and $11,945 of the $75,000 proceeds were allocated to the term loan and the detachable warrants, respectively. The amount of proceeds allocated to the fair value of the detachable warrants has resulted in a discount of $11,945 on the term loan as of November 7, 2006. For the year ended December 31, 2006, $498 of this discount has been amortized using the effective interest method and reflected in interest expense. As of December 31, 2006, the remaining unamortized discount on the debt was $11,447.
As a result of the completion of the financing transaction, we incurred $1,368 of financing costs. For the period of November 7, 2006 to December 31, 2006, we have amortized $76 of these costs, which was reflected as interest expense. As of December 31, 2006, $495 and $797 of these costs are deferred and included in deferred costs and other current assets and deposits and other assets, respectively, on the accompanying balance sheet. Additionally, we are required to pay a $75 management fee on an annual basis. This fee is amortized over the annual period and included in interest expense on the accompanying consolidated statements of operations.
| | (b) | $25 million Credit Facility |
As of December 31, 2005, we maintained a revolving operating line of credit with Comerica Bank, (“Comerica”), which allowed for aggregate borrowing of up to $25,000 subject to certain limits based on accounts receivable and inventory levels and secured by substantially all our assets. At December 31, 2005, we had $15,000 outstanding the revolving line of credit and we had an additional $1,700 of availability under the line of credit based on the limits described above. Borrowings outstanding under the revolving line of credit accrued interest at the bank’s LIBOR rate plus a margin of 2%. Interest payments were made on the last business day of each month. We were assessed a line of credit commitment fee quarterly by Comerica, based on the availability under the line of credit. We paid commitment fees of $25 during 2005. The revolving line of credit was repaid on November 7, 2006. At that time, the agreement with Comerica was terminated.
F-30
INPHONIC, INC. & SUBSIDIARIES
NOTES TO CONSOLIDATED FINANCIAL STATEMENTS—(Continued)
(in thousands, except per share and share amounts)
| | (c) | Standby Letters of Credit |
At December 31, 2005 and 2006, we had approximately $400 and $38, respectively, of standby letters of credit in connection with vendor obligations.
In 2004, 2005 and 2006, we entered into capital leases for the purchase of $635, $595 and $152 of leased computer equipment, respectively. Capital lease obligations totaled $851 as of December 31, 2005 and $574 as of December 31, 2006.
| | (d) | Maturities of Long-Term Debt |
The aggregate maturities of long-term debt which included amounts outstanding under the term loan and capital lease obligations, at December 31, 2006, approximate the following: $301 in 2007; $216 in 2008; $75,031 in 2009 and $25 in 2010. Under the term loan agreement, we may repay or the lender may require the repayment of the debt on the third anniversary of the agreement. For the purpose of this presentation, we have included the contractual obligation due on the third anniversary. If not prepaid, the debt matures in November 2011.
As of December 31, 2006, we had 200,000,000 and 10,000,000 authorized shares of common and preferred stock, respectively. At December 31, 2005 and 2006, there were 35,232,869 and 37,138,480 shares of common stock issued and outstanding, respectively. There were no shares of preferred stock outstanding as of December 31, 2005 and 2006.
During the year ended December 31, 2006, we issued 712,453 shares of our common stock related to contingent consideration related to business acquisitions in prior years as described in Notes 3 and 5; repurchased 350,261 shares under a stock repurchase program; issued 998,389 and 539,564 shares in connection with stock option exercises and lapses of restrictions on common stock, respectively; and 33,597 shares were issued in exercise of warrants and other events.
During the year ended December 31, 2005, we issued 625,617 shares of our common stock related to business and intangible asset acquisitions during 2005 as described in Notes 3 and 5; repurchased 1,081,487 shares under a stock repurchase program; issued 2,450,495 and 75,226 shares in connection with stock option exercises and lapses of restrictions on common stock, respectively; and 910,418 shares were issued in exercise of warrants and other events.
On November 19, 2004, we issued 6,500,000 additional shares of our common stock in an initial public offering, at a price of $19.00 per share for proceeds of $110,838 net of issuance costs of $4,017. In connection with this offering, we also issued 13,619,536 shares of common stock in exchange for all outstanding preferred stock.
In November 2004, upon the closing of the initial public offering, all issued and outstanding shares of our redeemable convertible preferred stock were automatically converted into approximately 13.6 million shares of common stock. Each share of Series A and B preferred stock outstanding was converted into common stock at an exchange ratio of 0.83 shares of common stock for 1 share of preferred stock. Each share of Series C, D, and D-1 preferred stock outstanding was converted into
F-31
INPHONIC, INC. & SUBSIDIARIES
NOTES TO CONSOLIDATED FINANCIAL STATEMENTS—(Continued)
(in thousands, except per share and share amounts)
common stock at an exchange ratio of 0.42 shares of common stock for 1 share of preferred stock. All other shares of preferred stock outstanding were converted into common stock at an exchange ratio of 0.33 shares of common stock for 1 share of preferred stock, as follows:
| | |
| | | Shares of
common
stock issued |
Series A | | 557,320 |
Series B | | 1,902,239 |
Series C | | 2,808,696 |
Series D and D-1 | | 4,412,779 |
Series D-2 | | 138,892 |
Series D-3 | | 264,261 |
Series D-4 | | — |
Series D-5 | | 224,132 |
Series E | | 3,311,217 |
| | |
Shares of common stock issued for preferred stock | | 13,619,536 |
| | |
Holders of shares of common stock are entitled to one vote per common share held on all matters voted on by the stockholders. Dividends may be declared and paid on common stock shares at the discretion of our board of directors and are subject to any preferential dividend rights of any outstanding preferred stockholders. No dividends on shares of common stock have been declared or paid through December 31, 2006.
| | (c) | Repurchase of Common Stock |
In 2005 and 2006, our board had authorized us to repurchase shares of our common stock. For the period August 17, 2005 to December 31, 2005, we repurchased 1,018,487 shares of our common stock at an average price of $12.10 per share for approximately $13,088. In 2006, through August 6, 2006, we purchased an additional 62,761 shares of common stock at an average price of $8.01 per share for approximately $502.
On November 3, 2006, our board of directors authorized the repurchase of up to an additional $30,000 of our common stock through November 2007. The shares may be repurchased from time to time at prevailing market prices. The timing and amount of any shares repurchased will be based on market conditions and other factors. Repurchases may also occur under a Rule 10b5-1 plan, which permit shares to be repurchased when we may otherwise be precluded from doing so by laws prohibiting insider trading or by self imposed trading black out periods. There is no guarantee as to the exact number of shares that will be repurchased under the stock repurchase program, and we may discontinue purchases at any time. We intend to fund the share repurchases with cash on hand, proceeds from the term loan and cash generated from future operations. Between November 3, 2006 and December 31, 2006, we repurchased 287,500 shares of common stock at an average price of $11.25 per share for approximately $3,236.
| | (d) | Stock-Based Benefit Plans |
1999 Stock Incentive Plan
Our 1999 Stock Incentive Plan (the “1999 Plan”), which was adopted by the board of directors in December 1999, provided for grants of stock-based awards from time to time to our employees,
F-32
INPHONIC, INC. & SUBSIDIARIES
NOTES TO CONSOLIDATED FINANCIAL STATEMENTS—(Continued)
(in thousands, except per share and share amounts)
officers, directors and consultants at exercise prices determined by the board of directors. Options granted under the 1999 Plan generally vest over a four-year period and expire ten years from the grant date. As of November 19, 2004, no additional options were available for grant under the 1999 Plan due to the adoption of the 2004 Equity Incentive Plan (the “2004 Plan”).
2004 Equity Incentive Plan
The 2004 Plan, which was adopted by the board of directors and approved by the stockholders in September 2004, allows for grants of stock-based awards from time to time to our employees, officers, directors and consultants at exercise prices determined by the board of directors. Options to purchase a total of 3,000,000 shares of common stock were originally authorized for issuance under the 2004 Plan, which number was increased by up to an additional 3,987,853 as of December 31, 2006 from the following sources: (1) shares subject to options or other awards outstanding under the 1999 Plan as of the date of its termination which expire or otherwise terminate for any reason, without having been exercised or settled in full and (2) shares acquired under the 1999 Plan forfeited to us on or after the date of its termination.
For incentive stock options, the exercise price must be at least equal to fair market value at the date of grant. For nonqualified stock options, the option may be granted with an exercise price less than fair market value. Options granted under the 2004 Plan generally vest over a period to be determined by the administrator and expire ten years from the grant date. As of December 31, 2006, 434,272 options were available for future grant under the 2004 Plan.
During 2004, 2005 and 2006, we granted to non-employees options to purchase 86,600, 18,000 and 51,000, respectively, shares or our common stock, pursuant to the Plans. The estimated fair value of the options was determined using the Black-Scholes Model (see note 2(n)). The 51,000 options issued in 2006 only had a contractually stated life of 5 months. We recorded compensation expense relating to the options of approximately $1,232, $243 and $229, respectively, for the years ended December 31, 2004, 2005 and 2006.
The following table summarizes the activity for stock options granted to employees and non-employees for the year ended December 31, 2006. The intrinsic value of options exercised for the years ended December 31, 2005 and 2006 was $24,462 and $4,156, respectively.
| | | | | | | | | | | | | | |
| | | Number of
options | | | Weighted
average
exercise price | | Range of
exercise | | Weighted
average
contractual
term (years) | | Aggregate
intrinsic value |
Balance January 1, 2006 | | 5,115,969 | | | | 9.47 | | $ | 0.60 – 25.36 | | | | | |
Granted | | 1,063,200 | | | | 7.36 | | | 6.46 – 11.76 | | | | | |
Exercised | | (998,389 | ) | | | 5.74 | | | 0.60 – 10.07 | | | | | |
Forfeited | | (1,137,677 | ) | | | 12.44 | | | 1.80 – 25.36 | | | | | |
| | | | | | | | | | | | | | |
Balance December 31, 2006 | | 4,043,103 | | | $ | 9.01 | | $ | 0.60 –25.36 | | 7.67 | | $ | 14,673 |
| | | | | | | | | | | | | | |
Ending vested & expected to vest | | 3,830,535 | | | $ | 8.97 | | | | | 7.62 | | $ | 14,021 |
| | | | | | | | | | | | | | |
Exercisable at December 31, 2006 | | 2,164,739 | | | $ | 8.63 | | | | | 6.95 | | $ | 8,405 |
| | | | | | | | | | | | | | |
F-33
INPHONIC, INC. & SUBSIDIARIES
NOTES TO CONSOLIDATED FINANCIAL STATEMENTS—(Continued)
(in thousands, except per share and share amounts)
Weighted average grant date fair value per share was $12.36, $10.26 and $4.65 as of December 31, 2004, 2005 and 2006, respectively.
Information regarding options outstanding at December 31, 2006 was as follows:
| | | | | | | | | |
| | | Options Outstanding | | Options Exercisable |
Range of exercise price | | Number of
options | | Weight average
remaining
contractual life
(in years) | | Number of
options | | Weighted
average
exercise
price |
$ 0.60 – $3.90 | | 289,290 | | 6.0 | | 209,751 | | $ | 2.26 |
$ 5.88 – $ 5.88 | | 1,459,157 | | 7.3 | | 1,005,660 | | | 5.88 |
$ 6.46 – $ 6.46 | | 504,200 | | 9.2 | | 3,000 | | | 6.46 |
$ 6.51 – $ 7.80 | | 545,688 | | 6.6 | | 377,188 | | | 7.80 |
$ 10.00 – $ 14.04 | | 463,938 | | 8.5 | | 197,678 | | | 12.13 |
$ 15.25 – $ 15.28 | | 303,410 | | 8.5 | | 122,139 | | | 15.26 |
$ 15.60 – $ 15.60 | | 19,168 | | 5.7 | | 19,168 | | | 15.60 |
$ 16.00 – $ 16.00 | | 98,512 | | 7.8 | | 55,467 | | | 16.00 |
$ 16.49 – $ 16.49 | | 128,500 | | 8.6 | | 62,250 | | | 16.49 |
$ 25.36 – $ 25.36 | | 231,200 | | 8.1 | | 112,438 | | | 25.36 |
| | | | | | | | | |
| | 4,043,103 | | 7.7 | | 2,164,739 | | $ | 8.63 |
| | | | | | | | | |
As of December 31, 2005 and 2006, the weighted average remaining contractual life of the options outstanding was approximately 8.2, and 7.7 years, respectively. Options to purchase 2,146,924 and 2,164,739 shares of common stock with a weighted average exercise price of $7.74 and $8.63 were exercisable at December 31, 2005 and 2006, respectively.
Restricted Common Stock
During the twelve months ended December 31, 2006, we granted 2,643,048 shares of restricted common stock to certain of our key employees. The restrictions on this common stock lapse and the stock vests over periods ranging up to 4 years from the grant date. The weighted average grant date fair value for such awards was $15.70 and $9.16 for 2005 and 2006, respectively. The following table summarizes the activity for restricted stock awards granted in 2006:
| | | | | | |
| | | Number of Restricted
Stock Awards | | | Weighted-average
grant date fair value |
Non-vested at January 1, 2006 | | 1,137,878 | | | $ | 15.58 |
Granted | | 2,643,048 | | | | 9.16 |
Vested | | (539,564 | ) | | | 14.38 |
Surrendered for taxes | | (51,221 | ) | | | 15.19 |
Forfeited | | (225,492 | ) | | | 14.02 |
| | | | | | |
Non-vested at December��31, 2006 | | 2,964,649 | | | $ | 10.20 |
| | | | | | |
At December 31, 2005 and 2006 shares that have vested were included as outstanding shares in the calculations of basic and diluted weighted average shares.
F-34
INPHONIC, INC. & SUBSIDIARIES
NOTES TO CONSOLIDATED FINANCIAL STATEMENTS—(Continued)
(in thousands, except per share and share amounts)
Stock Purchase Warrants
Warrants to purchase shares of common stock were granted with exercise prices ranging between $0.01 and $15.60, and terms ranging between 5 and 9 years. The estimated fair value of the warrants granted was determined using the Black-Scholes Model. Weighted average grant date fair value per share of warrants granted in 2004 and 2006 were $11.44 and $8.36, respectively. There were no warrants granted in 2005.
The following table summarizes the activity for warrants to purchase common stock, including warrants granted in connection with long-term debt (see Note 6) in 2006:
| | | | | | | | | |
| | | Number of
warrants | | | Weighted
average
exercise
price | | Range of
exercise |
Balance January 1, 2006 | | 787,863 | | | | 8.44 | | $ | 0.03 - 24.00 |
Granted | | 1,816,324 | | | | 2.30 | | | 0.01 - 7.35 |
Exercised | | (33,597 | ) | | | 0.29 | | | 0.03 - 2.49 |
Surrendered for cashless exercise | | (1,291 | ) | | | 2.30 | | | 0.03 - 2.49 |
Forfeited | | (3,334 | ) | | | 24.00 | | | 24.00 |
| | | | | | | | | |
Balance December 31, 2006 | | 2,565,965 | | | $ | 4.48 | | $ | 0.01 - 15.60 |
| | | | | | | | | |
In April 2006, we issued an additional warrant to purchase 188,775 shares of our common stock to a vendor that is exercisable upon certain minimum performance conditions. The exercise price of the warrant will be based on the trading price of our common stock at the time the performance conditions are met by the vendor. Once it is probable that the vendor will achieve the performance conditions set forth under the terms of the warrant, the fair value of the warrant will be amortized to sales and marketing expense over the remaining contractual term of the vendor commitment. This warrant is excluded from the table above.
Pursuant to SFAS No. 128, warrants to purchase 1,250,000 shares of our common stock at $0.01 issued in connection with our term loan in November 2006 were included in the calculation of our basic weighted average shares outstanding for the purposes of calculating earnings per share as these warrants were exercisable for little cash consideration.
F-35
INPHONIC, INC. & SUBSIDIARIES
NOTES TO CONSOLIDATED FINANCIAL STATEMENTS—(Continued)
(in thousands, except per share and share amounts)
(8) Income Taxes
SFAS No. 109 establishes financial accounting and reporting standards for the effects of income taxes. During the years ended December 31, 2004, 2005 and 2006, we did not have any income tax expense or benefit because a full valuation allowance was provided against our net deferred tax assets. As of December 31, 2005 and 2006, the components of the net deferred tax asset were as follows:
| | | | | | | | |
| | | 2005 | | | 2006 | |
Deferred tax assets: | | | | | | | | |
Accrued compensation | | $ | 2,482 | | | $ | 7,953 | |
Capitalized costs & other items | | | 2,931 | | | | 2,666 | |
Net operating loss carryforwards | | | 50,353 | | | | 75,019 | |
| | | | | | | | |
Total deferred tax assets | | | 55,766 | | | | 85,638 | |
Deferred tax liabilities: | | | | | | | | |
Depreciation | | | (2,003 | ) | | | (5,379 | ) |
Acquired intangibles | | | (340 | ) | | | (631 | ) |
Other | | | (1,916 | ) | | | (645 | ) |
| | | | | | | | |
Total deferred tax liabilities | | | (4,259 | ) | | | (6,655 | ) |
| | | | | | | | |
Net deferred tax assets | | | 51,507 | | | | 78,982 | |
Less: Valuation allowance | | | (51,507 | ) | | | (78,982 | ) |
| | | | | | | | |
| | $ | — | | | $ | — | |
| | | | | | | | |
SFAS No. 109 requires us to evaluate the recoverability of our deferred tax assets on an ongoing basis. The assessment is required to consider all available positive and negative evidence to determine whether, based on such evidence, it is more likely than not that some portion or all of our net deferred assets will be realized in future periods. The ultimate recoverability of deferred tax assets is dependent upon the generation of future taxable income during the periods in which those temporary differences become deductible. Management considers the scheduled reversal of deferred tax liabilities, projected future taxable income, and tax planning strategies in making this assessment. Based upon such factors as the lack of a significant history of material profits, possible increases in expense levels to support growth, the fact that the market in which we compete is intensely competitive and characterized by rapidly changing technology, the lack of carryback capacity to realize the deferred tax assets, and the uncertainty regarding the market acceptance of new product offerings, management does not at this time believe it is more likely than not that we will realize the benefits of these net deferred tax assets. Therefore, a full valuation allowance against the net deferred tax assets has been provided as of December 31, 2005 and 2006.
The net changes in the total valuation allowance, for the years ended December 31, 2005 and 2006 were an increase of $12,962 and $27,475, respectively. Approximately $5,465 of the valuation allowance relates to acquired deferred tax assets, and pursuant to the requirements of FAS 109 any subsequent recognition of these deferred tax assets will be applied to reduce goodwill and other intangibles.
As of December 31, 2006, we had approximately $196,128 of available net operating loss (NOL) carryforwards. Due to ownership changes, certain of these NOL carryforwards are subject to limitations under Section 382 of the Internal Revenue Code. Generally, these limitations restrict the availability of NOL carryforwards on an annual basis. The net operating loss carryforwards will begin to expire in 2019.
F-36
INPHONIC, INC. & SUBSIDIARIES
NOTES TO CONSOLIDATED FINANCIAL STATEMENTS—(Continued)
(in thousands, except per share and share amounts)
We did not have any income tax expense or benefit nor make any cash payments for income taxes for the years ended December 31, 2004, 2005 and 2006. The difference between the expected income tax benefit for the years ended December 31, 2004, 2005 and 2006, computed by applying the U.S. federal income tax rate of 35%, and actual income tax benefit, was as follows:
| | | | | | | | | | | | |
| | | 2004 | | | 2005 | | | 2006 | |
Expected Federal income tax benefit | | $ | (3,584 | ) | | $ | (13,368 | ) | | $ | (22,305 | ) |
Permanent differences | | | 45 | | | | 76 | | | | (25 | ) |
State income taxes, net of Federal benefit | | | (505 | ) | | | (1,234 | ) | | | (2,073 | ) |
Change in valuation allowance | | | 4,044 | | | | 12,962 | | | | 27,475 | |
Change in provisional rate/other | | | — | | | | 1,564 | | | | (3,072 | ) |
| | | | | | | | | | | | |
Income tax expense | | $ | — | | | $ | — | | | $ | — | |
| | | | | | | | | | | | |
(9) Segment Information
As a result of the sale of our MVNO operations on December 31, 2005, we believe we no longer have reportable segments as MVNE and Data Service Segments are immaterial to the consolidated entity.
(10) Commitments and Contingencies
We lease office and warehouse space under various operating leases through 2009. Rent expense was approximately $1,088, $1,760, and $1,923 for the years ended December 31, 2004, 2005 and 2006, respectively. Minimum future lease payments under these operating leases as of December 31, 2006 approximate the following: $1,806 for 2007; $1,272 for 2008; and $1,001 for 2009.
On May 7 and 18, 2007, two putative federal securities law class actions were filed in the United States District Court for the District of Columbia on behalf of persons who purchased our common stock between August 2, 2006, and May 3, 2007. These substantially similar lawsuits assert claims pursuant to Sections 10(b) and 20(a) of the Securities Exchange Act of 1934, and Rule 10b-5 promulgated thereunder, against us, our chief executive officer and our chief financial officer. These claims are related to our April 3, 2007, and May 4, 2007 announcements concerning our restatement of certain previously issued financial statements. Potential plaintiffs have until July 6, 2007, to move the court for appointment as lead plaintiff. We have not yet responded to the complaints. We are unable to estimate the amount of any potential claim arising from these matters at this time. We believe that the allegations contained within these class action lawsuits are without merit and intend to vigorously defend the litigation.
On August 5, 2004, Avesair, Inc., one of the companies the assets of which we acquired, filed suit against us demanding, among other matters, that we issue to Avesair shares of our common stock valued at approximately $4.0 million as of June 30, 2004. The stock demanded by Avesair represents the maximum value of shares that they could have earned for achieving certain performance-based targets under the asset purchase agreement. We believe the performance-based targets were not achieved and intend to vigorously contest this matter. However, any adverse resolution of this matter could have a material adverse impact on our financial results if we are required to issue additional shares and would result in dilution to our stockholders.
F-37
INPHONIC, INC. & SUBSIDIARIES
NOTES TO CONSOLIDATED FINANCIAL STATEMENTS—(Continued)
(in thousands, except per share and share amounts)
On May 3, 2007, the Federal Communications Commission (FCC) issued an Order of Forfeiture and Further Notice of Apparent Liability in which it imposed a forfeiture of $819,905 against us for being late in complying with certain regulatory obligations that arose in 2004 and 2005 from a business that we sold in December 2005. Those obligations included: registering with the FCC, filing certain reports, and paying certain Universal Service Fund fees. The FCC’s order also proposed imposing an additional fine of $100,000 for not having maintained in 2006 and 2007 a license necessary to conduct the business that was discontinued by us in 2005. As we did not operate the business in 2006 and 2007 we will request that the proposed fine be dismissed. With regard to the forfeiture itself, we are evaluating our legal options, which include appealing the ruling in federal court and/or negotiating a different and possibly lesser forfeiture. This forfeiture issue was initially raised by the FCC in July 2005. We advised the FCC then, and believe now, that no fine is appropriate under the circumstances.
Fifteen related putative federal court class actions have been filed against us arising out of InPhonic-sponsored rebate offers for online purchases of wireless telephones. Several of these lawsuits also name either our current or former third-party rebate processor as a defendant. On October 25, 2006 we received a decision by the Judicial Panel on Multidistrict Litigation (“JPML”) granting our motion to consolidate the federal court actions in the United States District Court for the District of Columbia before the Honorable Ellen Segal Huvelle. The consolidated amended class action complaint alleges, among other things, that we and our current or former third-party rebate processor (depending on the particular claim) violated the consumer protection laws of various States, various D.C. state laws and the federal RICO (anti-racketeering) statute in connection with our disclosure and implementation of the terms and conditions of rebate offers. The class action plaintiffs seek compensatory damages and/or restitution, statutory penalties and treble damages under D.C. consumer protection laws and RICO, attorneys’ fees and punitive damages, as well as injunctions concerning the content of our websites. The federal lawsuit is in an early stage. We intend to vigorously defend that action but cannot predict its outcome.
On April 27, 2007 we and the Federal Trade Commission (FTC) announced that we had entered into a consent agreement with the FTC in which InPhonic agreed to clearly and prominently disclose certain information regarding its rebate offers, such as when consumers can expect to receive their rebates, any time period that consumers must wait before submitting a rebate request, and certain information that would disqualify a consumer from receiving a rebate. We also agreed to provide rebates within time frames and under terms and conditions reasonably specified by us in our communications with our customers. We also agreed to provide rebates to certain customers whom had previously been denied them. As required by its rules, the FTC has requested comment on the consent agreement and we expect that it will become effective shortly. We have accrued an estimate of our liability associated with this consent agreement in the accompanying financial statements.
On February 15, 2007, we reached a final settlement with the District of Columbia Attorney General's Office concerning our use of mail-in rebates. We have accrued for the settlement and estimated costs of compliance in the accompanying financial statements at December 31, 2006.
From time to time we are party to other disputes or legal proceedings. We do not believe that any of the pending proceedings are likely to have a material adverse effect on our business.
(11) Related-Party Transactions
Goldman Sachs Credit Partners, L.P., Citicorp North America Inc. and AP InPhonic Holdings, LLC hold shares of our common stock and are the lending agents with regards to our term loan. See Note 6.
F-38
INPHONIC, INC. & SUBSIDIARIES
NOTES TO CONSOLIDATED FINANCIAL STATEMENTS—(Continued)
(in thousands, except per share and share amounts)
Mr. Laurence E. Harris, a member of our board of directors since March 2006, is “of counsel” in the law firm of Patton Boggs LLP (“Patton Boggs”). The total cost of various legal services provided to us by Patton Boggs in 2006 was approximately $2,219. Mr. Harris does not share in any profits of Patton Boggs or any of the fees paid by us to Patton Boggs.
(12) InPhonic, Inc., 401(k) Plan
Our 401(k) Plan provides retirement and incidental benefits for its employees. As allowed under Section 401(k) of the Internal Revenue Code, the 401(k) plan provides tax-deferred salary deductions of up to 15% of compensation for eligible employees. Employees are eligible to participate beginning the first day of the quarter subsequent to their start of employment. We may make discretionary matching contributions to the 401(k) plan. We did not make any discretionary matching contributions during 2004, 2005 and 2006.
(13) Quarterly Results (unaudited)
The following sets forth unaudited selected financial data on a quarterly basis for the years ended December 31, 2005 and 2006.
| | | | | | | | | | | | | | | | |
| | | Quarters Ended 2005 | |
| | | March 31 | | | June 30 | | | September 30 | | | December 31 | |
Revenue | | $ | 68,151 | | | $ | 75,226 | | | $ | 91,960 | | | $ | 85,202 | |
Cost of revenue | | | 40,123 | | | | 42,004 | | | | 53,753 | | | | 55,850 | |
Loss from continuing operations | | | (7,418 | ) | | | (1,162 | ) | | | (4,366 | ) | | | (24,820 | ) |
Income (loss) from discontinued operations | | | 424 | | | | (490 | ) | | | (587 | ) | | | (1,131 | ) |
Net loss | | | (6,994 | ) | | | (1,652 | ) | | | (4,953 | ) | | | (24,596 | ) |
Basic and diluted loss per share: | | | | | | | | | | | | | | | | |
Net loss from continuing operations | | $ | (0.22 | ) | | $ | (0.04 | ) | | $ | (0.12 | ) | | $ | (0.70 | ) |
Net gain (loss) from discontinued operations | | | 0.01 | | | | (0.01 | ) | | | (0.02 | ) | | | 0.01 | |
| | | | | | | | | | | | | | | | |
Basic and diluted net loss per share | | $ | (0.21 | ) | | $ | (0.05 | ) | | $ | (0.14 | ) | | $ | (0.69 | ) |
| | | | | | | | | | | | | | | | |
Basic and diluted weighted average shares | | | 32,901,398 | | | | 33,847,007 | | | | 35,515,210 | | | | 35,463,559 | |
F-39
INPHONIC, INC. & SUBSIDIARIES
NOTES TO CONSOLIDATED FINANCIAL STATEMENTS—(Continued)
(in thousands, except per share and share amounts)
| | | | | | | | | | | | | | | | |
| | | Quarters Ended 2006 | |
| | | March 31 | | | June 30 | | | September 30 | | | December 31 | |
Revenue | | $ | 86,978 | | | $ | 92,128 | | | $ | 95,103 | | | $ | 95,365 | |
Cost of revenue | | | 48,181 | | | | 51,575 | | | | 53,521 | | | | 64,577 | |
Loss from continuing operations | | | (4,348 | ) | | | (9,370 | ) | | | (15,591 | ) | | | (34,225 | ) |
Income (loss) from discontinued operations | | | 35 | | | | (206 | ) | | | 72 | | | | (94 | ) |
Net loss | | | (4,313 | ) | | | (9,576 | ) | | | (15,519 | ) | | | (34,319 | ) |
Basic and diluted loss per share: | | | | | | | | | | | | | | | | |
Net loss from continuing operations | | $ | (0.12 | ) | | $ | (0.26 | ) | | $ | (0.43 | ) | | $ | (0.91 | ) |
Net gain (loss) from discontinued operations | | | 0.00 | | | | (0.01 | ) | | | 0.00 | | | | 0.00 | |
| | | | | | | | | | | | | | | | |
Basic and diluted net loss per share | | $ | (0.12 | ) | | $ | (0.27 | ) | | $ | (0.43 | ) | | $ | (0.91 | ) |
| | | | | | | | | | | | | | | | |
Basic and diluted weighted average shares | | | 35,348,335 | | | | 35,856,253 | | | | 36,304,160 | | | | 37,688,951 | |
Restatement
The unaudited selected financial data for the quarters ended March 31, June 30, and September 30, 2006 have been adjusted to reflect corrections of accounting errors that occurred in the respective periods from amounts originally reported in our Forms 10-Q for those periods as filed with the SEC. The following provides a summary of the corrections within each quarterly reporting period. We have amended our quarterly reports on Forms 10-Q for these periods to reflect these corrections:
Quarter ended March 31, 2006 — During the three months ended March 31, 2006, we had recorded revenue for certain of our features activations and services commissions in which it was subsequently determined that collectibility was not reasonably assured pursuant to SAB 104. As a result we reduced our revenue and accounts receivable by approximately $393 for this adjustment. The impact on the unaudited selected financial data for the quarter ended March 31, 2006 was as follows:
| | | | | | | | | | | | |
| | | Quarter Ended March 31, 2006 | |
| | | Reported | | | Adjustment | | | Restated | |
Revenue | | $ | 87,371 | | | $ | (393 | ) | | $ | 86,978 | |
Loss from continued operations | | | (3,955 | ) | | | (393 | ) | | | (4,348 | ) |
Net loss | | | (3,920 | ) | | | (393 | ) | | | (4,313 | ) |
Net loss from continuing operations per basic and diluted share | | | (0.11 | ) | | | (0.01 | ) | | | (0.12 | ) |
Net loss per basic and diluted share | | | (0.11 | ) | | | (0.01 | ) | | | (0.12 | ) |
Quarter ended June 30, 2006 — During the three months ended June 30, 2006, we had recorded activations and services revenue net of related reserves as a change in estimate of certain carrier commissions in dispute which we had previously deemed as collectible. Upon further evaluation, we believe that it was inappropriate to have recorded revenue associated with this matter until such commissions are collected from the carrier. In addition, we identified other errors related to the recording of activations and services revenue of approximately $923 as it was subsequently determined
F-40
INPHONIC, INC. & SUBSIDIARIES
NOTES TO CONSOLIDATED FINANCIAL STATEMENTS—(Continued)
(in thousands, except per share and share amounts)
that collectibility of these amounts was not reasonably assured based on our collection experience. Accordingly, we reduced our revenue and accounts receivable by approximately $3,674 for this matter.
In addition, we identified errors that occurred in the recordation of cost of revenue and accounts receivable in the amount of $627 that have been corrected in the accompanying financial statements. The impact on the unaudited selected financial data for the quarter ended June 30, 2006 was as follows:
| | | | | | | | | | | | |
| | | Quarter Ended June 30, 2006 | |
| | | Reported | | | Adjustment | | | Restated | |
Revenue | | $ | 95,802 | | | $ | (3,674 | ) | | $ | 92,128 | |
Loss from continued operations | | | (5,069 | ) | | | (4,301 | ) | | | (9,370 | ) |
Net loss | | | (5,275 | ) | | | (4,301 | ) | | | (9,576 | ) |
Net loss from continuing operations per basic and diluted share | | | (0.14 | ) | | | (0.12 | ) | | | (0.26 | ) |
Net loss per basic and diluted share | | | (0.15 | ) | | | (0.12 | ) | | | (0.27 | ) |
Quarter ended September 30, 2006 — During the three months ended September 30, 2006, we identified errors in accounting for our activations and services revenue, equipment revenue and rebates and amounts paid to consumers as “customer accommodation credits” prior to our settlement with the Attorney General of the District of Columbia.
Activations and services revenue — We had recorded revenue for certain types of residual and churn bonuses due from wireless carriers for activations which occurred during the quarter. Upon further evaluation, we subsequently determined revenue recognition was in error as collectibility of such amounts was not reasonably assured pursuant to SAB 104 based on the nature of the amounts due and our lack of collection experience of similar items. Accordingly, we reduced revenue and accounts receivable by $2,916 and will not record revenue on such amounts until collections are received.
In addition, upon further evaluation of carrier commission receivable balances, we identified several receivable balances that the respective carriers were disputing. Based on correspondence and other information received from the carrier during the three months ended September 30, 2006, although we may continue our collection pursuits, we now believe that based on the nature of the carrier response we should have written off these balances during our third quarter. Accordingly we have reduced activation and services revenue and accounts receivable by $1,551 and will not record revenue on such items until collections are received.
Equipment revenue — We identified a deficiency in our process for recording certain fees due from consumers when they cancel their wireless service contract within specified time periods or the wireless device is not returned to us as is required under the contract with the customer. Specifically, in the third quarter we accrued revenue using estimated collection rates which were higher than our prior historical experience, in part because we were implementing new collection processes. As a result of this deficiency we reduced equipment revenue and accounts receivable $1,961 during the quarter.
Consumer product rebates and rebates paid to consumers as “customer accommodation credits” — We identified an error in accounting for accrued expenses and reserves for consumer product rebates (“accrued consumer liabilities”) totaling $3,950 for the quarter. Of this amount, we determined that our reserve for such liabilities was understated $3,297 from payments made to consumers during the three month period which were outside our customary rebate validation process (“customer accommodation credits”) which erroneously reduced accrued consumer liabilities when
F-41
INPHONIC, INC. & SUBSIDIARIES
NOTES TO CONSOLIDATED FINANCIAL STATEMENTS—(Continued)
(in thousands, except per share and share amounts)
paid rather than expensing such amounts. Accordingly, we increased general and administrative expenses and accrued consumer liabilities by $3,297 as of September 30, 2006. In addition, we identified that we underestimated our accrued consumer liability reserve requirements $653 as a result of misestimating the number of periods that continued to be subject to consumer rebate eligibility. Accordingly, we decreased equipment revenue and increased our reserve for accrued consumer liabilities for this amount.
Other — We identified of errors that occurred in the recordation of selling and marketing and general and administrative expenses cost of revenue and accounts receivable in the amount of $325 that also have been corrected in the accompanying financial statements. The impact on the unaudited selected financial data for the quarter ended September 30, 2006 was as follows:
| | | | | | | | | | | | |
| | | Quarter Ended September 30, 2006 | |
| | | Reported | | | Adjustment | | | Restated | |
Revenue | | $ | 102,184 | | | $ | (7,081 | ) | | $ | 95,103 | |
Loss from continued operations | | | (4,888 | ) | | | (10,703 | ) | | | (15,591 | ) |
Net loss | | | (4,816 | ) | | | (10,703 | ) | | | (15,519 | ) |
Net loss from continuing operations per basic and diluted share | | | (0.13 | ) | | | (0.29 | ) | | | (0.43 | ) |
Net loss per basic and diluted share | | | (0.13 | ) | | | (0.29 | ) | | | (0.43 | ) |
F-42
See report of Grant Thornton LLP, Independent Registered Public Accounting Firm on page F-2.
S-1
REPORT OF INDEPENDENT REGISTERED PUBLIC ACCOUNTING FIRM
The Board of Directors and Stockholders
InPhonic, Inc. and subsidiaries:
Under date of March 8, 2005, except as to note 1(c) and note 4, which are as of March 16, 2006, we reported on the consolidated statements of operations, stockholders’ equity (deficit), and cash flows for the year ended December 31, 2004, as contained in the 2006 annual report on Form 10-K. In connection with our audit of the aforementioned consolidated financial statements, we also audited the related consolidated financial statement schedule. This financial statement schedule is the responsibility of the Company’s management. Our responsibility is to express an opinion on this financial statement schedule based on our audit.
In our opinion, such financial statement schedule, when considered in relation to the basic consolidated financial statements taken as a whole, present fairly, in all material respects, the information set forth therein.
KPMG LLP
McLean, Virginia
March 8, 2005, except
as to note 1(c) and note 4,
which are as of March 16, 2006
S-2
INPHONIC, INC. & SUBSIDIARIES
SCHEDULE II—VALUATION AND QUALIFYING ACCOUNTS
| | | | | | | | | | | | | | | | |
| | | | | Additions | | | | | |
Description | | Balance at
beginning
of period | | Charged to
costs and
expenses | | Charged
to other
accounts | | | Deductions | | Balance at
end of
period |
| | | | | (in thousands) | | |
Year ended December 31, 2004 | | | | | | | | | | | | | | | | |
Deferred tax asset valuation allowance | | $ | 33,626 | | $ | 4,919 | | $ | — | | | $ | — | | $ | 38,545 |
Reserve for doubtful accounts | | | 246 | | | 706 | | | — | | | | — | | | 952 |
| | | | | |
Year ended December 31, 2005 | | | | | | | | | | | | | | | | |
Deferred tax asset valuation allowance | | | 38,545 | | | 12,962 | | | — | | | | — | | | 51,507 |
Reserve for doubtful accounts | | | 952 | | | 1,702 | | | (612 | )(a) | | | — | | | 2,042 |
| | | | | |
Year ended December 31, 2006 | | | | | | | | | | | | | | | | |
Deferred tax asset valuation allowance | | | 51,507 | | | 27,475 | | | — | | | | — | | | 78,982 |
Reserve for doubtful accounts | | | 2,042 | | | 7,707 | | | — | | | | — | | | 9,749 |
| (a) | Represents amount included in discontinued operations due to the sale of Liberty Wireless in December 2005. |
S-3