| August 2011 Summary Report On The Livengood Project, Tolovana District, Alaska |
![]()
August 2011
SUMMARY REPORT ON THE
LIVENGOOD PROJECT,
TOLOVANA DISTRICT,
ALASKA
| Prepared by: | |
| Carl E. Brechtel, PE | Timothy J. Carew, P.Geo. |
| Mining Engineer | Geologist |
| Russell Myers, CPG | William Pennstrom Jr., M.A. |
| Geologist | Metallurgical Engineer |
| Chris Puchner, CPG | Scott Wilson, CPG |
| Geologist | Geologist |
For:
International Tower Hill Mines Ltd.
| 1 |
| August 2011 Summary Report On The Livengood Project, Tolovana District, Alaska |
| August 25, 2011 |
| List of Authors |
| Carl E. Brechtel |
| International Tower Hill Mines, Ltd. |
| 9137 Ridgeline Blvd., Ste 250 |
| Highlands Ranch, CO 80129 USA |
| (303) 470-8700 |
| cbrechtel@ithmines.com |
| Timothy J. Carew |
| Reserva International LLC |
| P.O. Box 19848 |
| Reno, NV 89511 USA |
| (775) 853-2227 |
| timc@reservainternational.com |
| Russell Myers |
| Corvus Gold Ltd. |
| 9137 Ridgeline Blvd., Ste 250 |
| Highlands Ranch, CO 80129 USA |
| (303) 470-8700 |
| rmyers@corvusgold.com |
| William Pennstrom, Jr. |
| Pennstrom Consulting Inc. |
| 2728 Southshire Rd. |
| Highlands Ranch, CO 80126 |
| (303) 748-5174 |
| Bill@Pennstrom.com |
| Chris Puchner, CPG |
| Talon Gold Alaska, Inc. |
| 506 Gaffney Road, Ste 200 |
| Fairbanks, AK 99701 USA |
| (907) 328-2800 |
| cpuchner@ithmines.com |
| Scott Wilson, CPG |
| Scott Wilson Consulting, Inc. |
| 9137 Ridgeline Blvd, Ste 140 |
| Highlands Ranch, CO 80129 |
| (720) 348-1646 |
| scott@wilsonmining.com |
Cover Image:Geo-referenced surface photograph of the Livengood area showing the potential surface mine optimized at US $1,100 per Au ounce and grade shells at 0.2 g/t and 0.5 g/t from the August 2011 mineral resource model.
| 2 |
| August 2011 Summary Report On The Livengood Project, Tolovana District, Alaska |
Date and Signature Page
The effective date of this technical report, entitled “August 2011 Summary Report on the Livengood Project, Tolovana District, Alaska” is August 22, 2011.
| Dated: August 25, 2011 | |
| (signed)Carl Brechtel | [Sealed] |
| Carl Brechtel, PE | |
| (signed)Tim Carew | [Sealed] |
| Timothy J. Carew, P.Geo. | |
| (signed)Russell Myers | |
| Russell Myers, CPG 11433 | |
| (signed)William Pennstrom, Jr. | |
| William Pennstrom, Jr. M.A., QP-MMSA | |
| (signed)Chris Puchner | |
| Chris Puchner, CPG 07048 | |
| (signed)Scott Wilson | |
| Scott Wilson, Registered Member SME |
| 3 |
| August 2011 Summary Report On The Livengood Project, Tolovana District, Alaska |
Certificates of Authors
CERTIFICATE OF CARL BRECHTEL
I, Carl Brechtel, do hereby certify that:
| 1. | I am the President of : |
| International Tower Hill Mines, Ltd. | |
| 9137 Ridgeline Blvd., Ste 250 | |
| Highlands Ranch, CO 8019 USA |
| 2. | I have graduated from the University of Utah with degrees as follows: |
| a. | BS Geological Engineering 1973 | |
| b. | MS Mining Engineering 1978 |
| 3. | I am a Professional Engineer - Mining (Colorado PE 23212 and Nevada PE 8744) and a Registered Member of the Society for Mining, Metallurgy and Exploration (SME). | |
| 4. | I have worked in resource and mining engineering for over 35 years since my graduation from the University of Utah. | |
| 5. | I have read the definition of “Qualified Person” set out in National Instrument 43-101 (“NI 43- 101”) and certify that by reason of my education, Professional Engineering license, affiliation with SME and past relevant work, which includes 16 years of direct experience in gold mining operations and gold mine design in North America, South America, Africa and Australia for Anglogold Ashanti and for International Tower Hill Mines Ltd., I fulfill the requirements to be a “Qualified Person” for the purposes of NI 43-101. | |
| 6. | I am responsible for the preparation of Sections 2.0, 3.0, 15.0, 18.0, 19.0, 20.0, 21.0, 24.0, 26.0 and 27.0, and the corresponding portions of Section 1.0 and 25.0 of the technical report titled “August 2011 Summary Report on the Livengood Project, Tolovana District, Alaska”and dated August 25, 2011 (the “Technical Report”) relating to the Livengood property. I have visited the Livengood property on numerous occasions, the most recent being from August 22- 25, 2011. | |
| 7. | Prior to February 2010 I have not had any involvement with the property which is the subject of the Technical Report. I have been involved in the exploration and development of the Livengood Project from February 2010, as President and Chief Operating Officer of International Tower Hill Mines Ltd. | |
| 8. | As at the effective date of the Technical Report, to the best of my knowledge, information and belief, the portions of the Technical Report for which I am responsible contain all scientific and technical information that is required to be disclosed to make the portions of the Technical Report for which I am responsible not misleading. |
| 4 |
| August 2011 Summary Report On The Livengood Project, Tolovana District, Alaska |
| 9. | I am not independent of the issuer applying all of the tests in section 1.5 of NI 43-101 as I am President and Chief Operating Officer of International Tower Hill Mines Ltd. and hold incentive stock options. | |
| 10. | I have read NI 43-101 and Form 43-101F1, and the portions of the Technical Report for which I am responsible have been prepared in compliance with that instrument and form. |
| Dated this 25thday of August, 2011. | |
| (signed)Carl Brechtel | [Sealed] |
| Signature of Qualified Person | |
| Carl Brechtel, PE, SME | |
| Print name of Qualified Person |
| 5 |
| August 2011 Summary Report On The Livengood Project, Tolovana District, Alaska |
CERTIFICATE OF TIMOTHY J. CAREW
I, Timothy J. Carew, P. Geo., do hereby certify that:
| 1. | I am the Principal of : |
| Reserva International LLC | |
| P.O. Box 19848 | |
| Reno, NV 89511 USA |
| 2. | I have graduated from the following Universities with degrees as follows: |
| a. | University of Rhodesia, | B.Sc. Geology | 1973 | |
| b. | University of Rhodesia, | B.Sc. (Hons) Geology | 1976 | |
| c. | University of London (RSM) | M.Sc. Mineral Prod. Management | 1982 |
| 3. | I am a member in good standing of the following professional associations: |
| a. | Association of Professional Engineers and Geoscientists of British Columbia (Professional Geoscientist 19706) | |
| b. | Institute of Mining, Metallurgy and Materials (Professional Member 46233) |
| 4. | I have worked in mining geology and engineering for over 35 years since my graduation from the University of Rhodesia. | |
| 5. | I have read the definition of “Qualified Person” set out in National Instrument 43-101 (“NI 43- 101”) and certify that by reason of my education, affiliation with professional associations and past relevant work experience, including geologic experience in similar lithotechtonic terranes (Cassiar, northern British Columbia) and with vein and disseminated type gold deposits in the U.S. (Florida Canyon, Nevada), South America (Nassau, Suriname), and Asia (Boroo, Mongolia), I fulfill the requirements to be a “Qualified Person” for the purposes of NI 43-101. | |
| 6. | I am responsible for the preparation of Section 14.0 and the corresponding portions of Sections 1.0 and 25.0 of the technical report titled “August 2011 Summary Report on the Livengood Project, Tolovana District, Alaska”and dated August 25, 2011 (the “Technical Report”) relating to the Livengood Project. I have visited the Livengood property on four occasions for a total of thirty days, the most recent being from October 24 - 27, 2010. | |
| 7. | Prior to being retained by International Tower Hill Mines Ltd. in 2009, I have not had prior involvement with the property that is the subject of the Technical Report. | |
| 8. | As at the effective date of the Technical Report, to the best of my knowledge, information and belief, the portions of the Technical Report for which I am responsible contain all scientific and technical information that is required to be disclosed to make the portions of the Technical Report for which I am responsible not misleading. | |
| 9. | I am independent of the issuer applying all of the tests in section 1.5 of NI 43-101. |
| 6 |
| August 2011 Summary Report On The Livengood Project, Tolovana District, Alaska |
| 10. | I have read NI 43-101 and Form 43-101F1, and the portions of the Technical Report for which I am responsible have been prepared in compliance with that instrument and form. |
| Dated this 25thday of August, 2011. | |
| (signed)Tim Carew | [Sealed] |
| Signature of Qualified Person | |
| Timothy J. Carew, P.Geo., MIMMM | |
| Print name of Qualified Person |
| 7 |
| August 2011 Summary Report On The Livengood Project, Tolovana District, Alaska |
CERTIFICATE OF WILLIAM J. PENNSTROM, JR.
I, William J. Pennstrom, Jr., do hereby certify that:
| 1. | I am self employed as a Consulting Process Engineer and President of: | |
Pennstrom Consulting Inc. | ||
| 2. | I graduated in 1983 with a Bachelors of Science degree in Metallurgical Engineering from the University of Missouri - Rolla, Rolla, Missouri and in May of 2001 with a Master of Arts degree in Management from Webster University, St. Louis, Missouri. | |
| 3. | I am a recognized Qualified Professional (QP) Member with expertise in Metallurgy of the Mining and Metallurgical Society of America (MMSA Member No. 01313QP). I am also a Registered Member of the Society of Mining, Metallurgy and Exploration (SME Member No. 2503900). | |
| 4. | I have worked in the Mineral Processing Industry for a total of 29 years since before, during, and after my attending the University of Missouri. I have held several operating positions from Plant Metallurgist to Mill Manager for companies including Kennecott (Ozark Lead Company and Ridgeway Mining Company), Santa Fe Pacific Gold Corporation (Mule Canyon and Corporate Metallurgist), and Goldfields Operating Company (Ortiz and Mesquite Mines). I have also been employed as a consultant for Kilborn Engineering and Knight Piesold LLC. I have been an independent process/metallurgical consultant for the last nine (9) years for the mining industry. | |
| 5. | I have read the definition of “qualified person” set out in National Instrument 43-101 (“NI 43- 101”) and certify that, by reason of my education, affiliation with a professional association, and past relevant work experience with gold deposits requiring heap leach and mill recovery methods, including operations in Alaska, I fulfill the requirements to be a “qualified person” for the purpose of NI 43-101. | |
| 6. | I am responsible for the preparation of Sections 13.0, 17.0 and 22.0 and the corresponding portions in Sections 1.0 and 25.0 of the technical report titled “August 2011 Summary Report on the Livengood Project, Tolovana District, Alaska”and dated August 25, 2011 (the “Technical Report”) relating to the Livengood Project. I have visited the Livengood Project site on August 2ndof 2011 and previously for two days during May of 2009. | |
| 7. | Prior to being retained by International Tower Hill Mines Ltd. in May, 2009, I have not had prior involvement with the property that is the subject of the Technical Report. | |
| 8. | As at the effective date of the Technical Report, to the best of my knowledge, information and belief, the portions of the Technical Report for which I am responsible contain all scientific and technical information that is required to be disclosed to make the portions of the Technical Report for which I am responsible not misleading. |
| 8 |
| August 2011 Summary Report On The Livengood Project, Tolovana District, Alaska |
| 9. | I am independent of the issuer applying all of the tests in section 1.5 of NI 43-101. | |
| 10. | I have read National Instrument 43-101 and Form 43-101F1 and the portions of the Technical Report for which I am responsible have been prepared in compliance with that instrument and form. |
| Dated this 25thday of August, 2011. | |
| (signed)William J. Pennstrom, Jr. | |
| Signature of Qualified Person | |
| William J. Pennstrom Jr., QPMMSA, SME | |
| Print name of Qualified Person |
| 9 |
| August 2011 Summary Report On The Livengood Project, Tolovana District, Alaska |
CERTIFICATE OF CHRIS PUCHNER
I, Chris Puchner, do hereby certify that:
| 1. | I am the Chief Geologist of: | |
International Tower Hill Mines Ltd. | ||
506 Gaffney Road, Ste 200 | ||
Fairbanks, AK 99701 USA | ||
| 2. | I graduated from the following University with a degree as follows: Dartmouth College, BA, Geology. | |
| 3. | I am a Certified Professional Geologist (CPG 07048) by the American Institute of Professional Geologists. | |
| 4. | I have worked on gold and other mineral exploration and mining projects for 33 years since my graduation from Dartmouth College. | |
| 5. | I have read the definition of “Qualified Person” set out in National Instrument 43-101 (“NI 43- 101”) and certify that, by reason of my education, affiliation with a professional association and past relevant work experience, which includes 8 years managing the exploration and development of the Nixon Fork Mine (copper-gold skarn) and 8 years managing the exploration of the Livengood Gold Deposit, I fulfill the requirements to be a “Qualified Person” for the purposes of NI 43-101. | |
| 6. | I am responsible for the preparation of Sections 4.0, 5.0, 6.0, 7.0, 8.0, 9.0, 10.0, 11.1 to 11.5 and 23.0 and corresponding portions of Sections 1.0 and 25.0 of the technical report titled “August2011 Summary Report on the Livengood Project, Tolovana District, Alaska”and dated August 25, 2011 (the “Technical Report”) relating to the Livengood Project. I have worked at the Livengood Project site for more than 750 days, from May 15, 2004 through August 25, 2011. | |
| 7. | I have been involved in exploration activities at the Livengood Project for the period May, 2004 to the present, initially with AngloGold Ashanti (USA) Exploration Inc. to December, 2006 and thereafter for International Tower Hill Mines Ltd. as its Chief Geologist responsible for the Livengood Project. | |
| 8. | As at the effective date of the Technical Report, to the best of my knowledge, information and belief, the portions of the Technical Report for which I am responsible contain all scientific and technical information that is required to be disclosed to make the portions of the Technical Report for which I am responsible not misleading. | |
| 9. | I am not independent of the issuer applying all of the tests in section 1.5 of NI 43-101, as I am an employee and hold stock and incentive stock options in International Tower Hill Mines Ltd. |
| 10 |
| August 2011 Summary Report On The Livengood Project, Tolovana District, Alaska |
| 10. | I have read NI 43-101 and Form 43-101F1, and the portions of the Technical Report for which I am responsible have been prepared in compliance with that instrument and form. |
| Dated this 25thday of August, 2011. | |
| (signed)Chris Puchner | |
| Signature of Qualified Person | |
| Chris Puchner, CPG | |
| Print name of Qualified Person |
| 11 |
| August 2011 Summary Report On The Livengood Project, Tolovana District, Alaska |
CERTIFICATE OF RUSSELL MYERS
I, Russell Myers, do hereby certify that:
| 1. | I am the President of: |
| Corvus Gold Inc. | |
| 9137 Ridgeline Blvd. Suite 250 | |
| Highlands Ranch, CO 80129 USA |
| 2. | I have graduated from the following Universities with degrees as follows: University of Missouri-Rolla, BSc (Geology and Geophysics) Summa cum Laude, 1981; University of the Witwatersrand, PhD (Geology), 1990. | |
| 3. | I have worked on gold and other mineral exploration and mining projects for 25 of the 30 years since my graduation from the University of Missouri, including managing surface exploration and drilling programs in Nicaragua, South Africa, Australia, Zimbabwe, Kenya and the United States. I have been involved in regional target generation in South Africa, Australia, South America, and North America. | |
| 4. | I am a Certified Professional Geologist of the Association of Professional Geologists (CPG 11433). | |
| 5. | I have read the definition of “Qualified Person” set out in National Instrument 43-101 (“NI 43- 101”) and certify that, by reason of my education, affiliation with a professional association and past relevant work experience, which includes acting as the Operations Manager for RENAUSTRA SA in Nicaragua from 1994-1999, as an Exploration Consultant for AngloGold Ashanti from 2000-2006 and as Vice President of Exploration for International Tower Hill Mines Ltd. from 2006-2010, I fulfill the requirements to be a “Qualified Person” for the purposes of NI 43-101. | |
| 6. | I am responsible for the preparation of Sections 11.6 and 12.0, and the corresponding portions of Sections 1.0 and 25.0 of the technical report titled “August 2011 Summary Report on the Livengood Project, Tolovana District, Alaska”and dated August 25, 2011 (the “Technical Report”) relating to the Livengood Project. . I have worked at Livengood Project site for more than 200 days between May 15, 2004 and July 30, 2011. | |
| 7. | I have been involved in exploration activities at the Livengood Property from May of 2004 to the present period, initially with AngloGold Ashanti (USA) Exploration Inc. to August, 2006 and thereafter for International Tower Hill Mines Ltd. as its Vice-President, Exploration to May 31, 2011, and thereafter as a consultant. Initially I worked in initial target generation and concept development, later logging core and supervising geological operations. Throughout that time I have been responsible for sampling procedures, geological interpretation of the deposit and analysis of geological data to determine ore controls as well as larger regional target generation. I have been responsible for coordination of resource estimation between 2007 and 2009, and have been involved in the design of metallurgical testing and the selection of sample materials for testing since 2006. |
| 12 |
| August 2011 Summary Report On The Livengood Project, Tolovana District, Alaska |
| 8. | As at the effective date of the Technical Report, to the best of my knowledge, information and belief, the portions of the Technical Report for which I am responsible contain all scientific and technical information that is required to be disclosed to make the portions of the Technical Report for which I am responsible not misleading. | |
| 9. | I am not independent of the issuer applying all of the tests in section 1.5 of NI 43-101, as I hold stock and incentive stock options in International Tower Hill Mines Ltd. | |
| 10. | I have read NI 43-101 and Form 43-101F1, and the portions of the Technical Report for which I am responsible have been prepared in compliance with that instrument and form. |
| Dated this 25thday of August, 2011. | |
| (signed)Russell Myers | |
| Signature of Qualified Person | |
| Russell Myers, CPG | |
| Print name of Qualified Person |
| 13 |
| August 2011 Summary Report On The Livengood Project, Tolovana District, Alaska |
CERTIFICATE OF SCOTT WILSON
I, Scott Wilson, do hereby certify that:
| 1. | I am the President of Scott E. Wilson Consulting, Inc.: |
| 9137 Ridgeline Blvd | |
| Suite 140 | |
| Highlands Ranch, CO 80129 USA |
| 2. | I have graduated from the following Universities with degrees as follows: B.A. Geology, California State University, Sacramento, 1989. | |
| 3. | I am a Registered Member of the Society of Mining, Metallurgy and Exploration (SME, # 4025107RM). | |
| 4. | I have worked on gold and other mineral exploration and mining projects for 22 years since my graduation from California State University, Sacramento. I have been continuously employed in mining during this period. | |
| 5. | I have read the definition of “Qualified Person” set out in National Instrument 43-101 (“NI 43- 101”) and certify that, by reason of my education, affiliation with a professional association and past relevant work experience, which includes acting as a Long Range Planning Engineer at Round Mountain, Nevada from 1994 through 1998 as well as numerous roles in equipment sizing studies as a consultant for U.S. Borax, Allied Nevada Gold Corporation and Placer Dome’s Bald Mountain Mine, I fulfill the requirements to be a “Qualified Person” for the purposes of NI 43-101. | |
| 6. | I am responsible for the preparation of Section 16 and corresponding portions of Sections 1.0 and 25.0 of the technical report titled “August 2011 Summary Report on the Livengood Project, Tolovana District, Alaska”and dated August 25, 2011 (the “Technical Report”) relating to the Livengood Project. I have visited the Livengood Project on August 2, 2011. | |
| 7. | Prior to being retained by International Tower Hill Mines Ltd. in June 2011, I have not had prior involvement with the property that is the subject of the Technical Report. | |
| 8. | As at the effective date of the Technical Report, to the best of my knowledge, information and belief, the portions of the Technical Report for which I am responsible contain all scientific and technical information that is required to be disclosed to make the portions of the Technical Report for which I am responsible not misleading. | |
| 9. | I am independent of the issuer applying all of the tests per Section 1.5 of NI 43-101. |
| 14 |
| August 2011 Summary Report On The Livengood Project, Tolovana District, Alaska |
| 10. | I have read NI 43-101 and Form 43-101F1, and the portions of the Technical Report for which I am responsible have been prepared in compliance with that instrument and form. |
| Dated this 25thday of August, 2011. | |
| (signed)Scott Wilson | |
| Signature of Qualified Person | |
| Scott Wilson, CPG | |
| Print name of Qualified Person |
| 15 |
| August 2011 Summary Report On The Livengood Project, Tolovana District, Alaska |
Table of Contents
| 16 |
| August 2011 Summary Report On The Livengood Project, Tolovana District, Alaska |
| 17 |
| August 2011 Summary Report On The Livengood Project, Tolovana District, Alaska |
| 18 |
| August 2011 Summary Report On The Livengood Project, Tolovana District, Alaska |
| 19 |
| August 2011 Summary Report On The Livengood Project, Tolovana District, Alaska |
| 20 |
| August 2011 Summary Report On The Livengood Project, Tolovana District, Alaska |
| 21 |
| August 2011 Summary Report On The Livengood Project, Tolovana District, Alaska |
| 22 |
| August 2011 Summary Report On The Livengood Project, Tolovana District, Alaska |
List of Figures
| 23 |
| August 2011 Summary Report On The Livengood Project, Tolovana District, Alaska |
FIGURE 16.1 SURFACE MINE SLOPE ANALYSIS BY SEGMENT - SRK (2010) | 187 |
FIGURE 16.2 LIVENGOOD SURFACE MINE DESIGN | 190 |
FIGURE 17.1 PROPOSED LIVENGOOD PROCESS BLOCK FLOW DIAGRAM | 193 |
FIGURE 18.1 MAP OF ALASKA – LIVENGOOD LOCATION & TRANSPORTATION CORRIDOR IN CENTRAL ALASKA | 197 |
FIGURE 22.1 SENSITIVITY GRAPH – IRR, GOLD PRICE, GOLD RECOVERY, AND COST (RANGE 85-115% OF THE BASE ASSUMPTIONS) | 221 |
| 24 |
| August 2011 Summary Report On The Livengood Project, Tolovana District, Alaska |
List of Tables
TABLE 1.1 GLOBAL RESOURCE ESTIMATION SUMMARY - AUGUST 2011 | 35 |
TABLE 1.2 SURFACE MINE MINERAL RESOURCE DEFINED AT US $1,400 PER AU OUNCE. | 36 |
TABLE 1.3 OPERATING COST ASSUMPTIONS | 40 |
TABLE 2.1 QUALIFIED PERSONS – SECTIONS OF RESPONSIBILITY | 47 |
TABLE 4.1 SUMMARY OF CLAIM HOLDINGS AND ANNUAL OBLIGATIONS | 57 |
TABLE 6.1 EXPLORATION HISTORY | 66 |
TABLE 10.1 SUMMARY OF AGA AND ITH RESOURCE DRILLING AT LIVENGOOD | 93 |
TABLE 11.1 COMPARISON OF MEAN GRADES FOR DIFFERENT GRADE RANGES – STANDARD FIRE ASSAYS AND METALLIC SCREEN ASSAYS FOR 2096 LIVENGOOD SAMPLES | 108 |
TABLE 11.2 ANALYSIS OF MONOTONIC GRADE DECREASES | 110 |
TABLE 11.3 COMPARISON OF THE FREQUENCY OF RC-CORE SAMPLES PAIRS WITH RC>CORE AND RC<CORE (ABOVE AND BELOW THE WATER TABLE) | 115 |
TABLE 13.1 SUMMARY OF METALLUGICAL RESULTS, COLUMN PERCOLATION LEACH TESTS, LIVENGOOD DRILL CORE COMPOSITES, 80% - 12.5 MM FEED SIZE | 125 |
TABLE 13.2 GOLD RECOVERY FROM 2007 CYANIDE EXTRACTION TESTS | 132 |
TABLE 13.3 GOLD RECOVERY FROM 2008 HAZEN CYANIDE EXTRACTION TESTS (-10 MESH) | 133 |
TABLE 13.4 GOLD RECOVERY RESULTS FROM KAPPES CASSIDAY CYANIDE EXTRACTION TESTS (-200 MESH) . | 134 |
TABLE 13.5 CYANIDE SHAKE LEACH TEST PROCEDURE PARAMETERS | 137 |
TABLE 13.6 MAIN ZONE SUMMARY OF CYANIDE SHAKE TESTS (5 GPL NACN) | 137 |
TABLE 13.7 SUNSHINE ZONE SUMMARY OF CYANIDE SHAKE TESTS (5 GPL NACN) | 139 |
TABLE 13.8 MAIN ZONE BOND BALL MILL WORK INDEX TEST RESULTS | 139 |
TABLE 13.9 SUNSHINE ZONE BOND BALL MILL WORK INDEX TEST RESULTS | 140 |
TABLE 13.10 SUMMARY OF RESULTS – ABRASION TEST – PHILLIPS REPORT 093029_15 OCTOBER 2009 | 141 |
TABLE 13.11 PROCEDURES FOR KNELSON CONCENTRATOR TESTWORK | 142 |
TABLE 13.12 MAIN ZONE KNELSON CONCENTRATOR – GRAVITY RECOVERABLE SUMMARY | 142 |
TABLE 13.13 SUNSHINE ZONE KNELSON CONCENTRATOR – GRAVITY RECOVERABLE SUMMARY | 144 |
TABLE 13.14 SUMMARY OF CYANIDE BOTTLE ROLL TEST RESULTS | 144 |
TABLE 13.15 MAIN ZONE SUMMARY OF CIL CYANIDE BOTTLE ROLL TESTS | 147 |
TABLE 13.16 SUNSHINE ZONE SUMMARY OF CIL CYANIDE BOTTLE ROLL TESTS | 148 |
TABLE 13.17 SUMMARY OF BATCH FLOTATION TEST RESULTS – MARCH 2010 | 148 |
TABLE 13.18 RESULTS OF CIL BOTTLE ROLL TESTS IN GRAVITY CONCENTRATION – MARCH 2010 | 150 |
TABLE 13.19 RDI PHASE I FLOTATION AND GRAVITY TEST RESULTS – JUNE 2010 | 152 |
| 25 |
| August 2011 Summary Report On The Livengood Project, Tolovana District, Alaska |
TABLE 13.20 RDI PHASE II FLOTATION TEST RESULTS – AUGUST 2010 | 154 |
TABLE 13.21 RDI PHASE III GRAVITY TEST RESULTS – JANUARY 2011 | 156 |
TABLE 13.22 RDI PHASE III GRAVITY MIDDLINGS LEACH TEST RESULTS – JANUARY 2011 | 157 |
TABLE 13.23 RDI PHASE III FLOTATION TEST RESULTS – JANUARY 2011 | 158 |
TABLE 13.24 RDI PHASE III FLOTATION CONC. LEACH TEST RESULTS – JANUARY 2011 | 159 |
TABLE 13.25 ESTIMATE OF OVERALL GOLD RECOVERY -RDI FLOTATION TESTWORK | 160 |
TABLE 14.1 SUMMARY GLOBAL IN-SITU MINERAL RESOURCE | 163 |
TABLE 14.2 OPTIMIZATION PARAMETERS ASSUMED FOR DEFINITION OF MONEY KNOB SURFACE MINE MINERAL RESOURCE | 164 |
TABLE 14.3 MONEY KNOB SURFACE MINE MINERAL RESOURCE | 164 |
TABLE 14.4 HISTORICAL DRILLING AND SAMPLING | 166 |
TABLE 14.5 ITH DRILLING AND SAMPLING | 166 |
TABLE 14.6 DENSITY DETERMINATIONS | 167 |
TABLE 14.7 STATISTICAL SUMMARY OF ASSAY DATA | 167 |
TABLE 14.8 GOLD COMPOSITE STATISTICS | 169 |
TABLE 14.9 GOLD INDICATOR STATISTICS | 169 |
TABLE 14.10 AVERAGE GOLD INDICATOR VARIOGRAMS | 172 |
TABLE 14.11 OXIDE INDICATOR VARIOGRAMS | 173 |
TABLE 14.12 KINT DIKE VARIOGRAMS | 174 |
TABLE 14.13 LOWER SANDS & MONEY KNOB SEQ. VARIOGRAMS | 174 |
TABLE 14.14 MODEL EXTENTS | 175 |
TABLE 14.15 GOLD KRIGING PLAN | 175 |
TABLE 14.16 OXIDIZED KRIGING PLAN | 177 |
TABLE 14.17 TRACE OXIDIZED KRIGING PLAN | 177 |
TABLE 14.18 KINT DIKE INDICATOR KRIGING PLAN – SOUTHERN DOMAIN | 178 |
TABLE 14.19 KINT DIKE INDICATOR KRIGING PLAN - NORTHERN DOMAIN | 178 |
TABLE 14.20 LOWER SANDS & MONEY KNOB SEQ. INDICATOR KRIGING PLAN | 179 |
TABLE 16.1 MINE PRODUCTION SCHEDULE | 186 |
TABLE 16.2 MINING EQUIPMENT LIST (000'$) | 187 |
TABLE 16.3 WHITTLE INPUTS USED IN SURFACE MINE PLAN | 188 |
TABLE 16.4 PROCESSING COSTS BY ROCK TYPE (WEIGHTED AVG COST ) | 188 |
TABLE 16.5 SURFACE MINE DESIGN PARAMETERS | 189 |
TABLE 17.1 GOLD RECOVERY ASSUMPTIONS BY MINERALIZED MATERIAL TYPE (WEIGHTED AVG RECOVERY) | 194 |
| 26 |
| August 2011 Summary Report On The Livengood Project, Tolovana District, Alaska |
TABLE 17.2 PROCESS OPERATING COST ESTIMATE BY MINERALIZED MATERIAL TYPE (WEIGHTED AVG COSTS) | 195 |
TABLE 20.1 PROJECT PERMIT REQUIREMENTS | 205 |
TABLE 21.1 SUMMARY OF INITIAL CAPITAL COSTS | 211 |
TABLE 22.1 TECHNICAL ASSUMPTIONS USED IN THE ECONOMIC ANALYSIS | 217 |
TABLE 22.2 PROJECTED PRODUCTION AND CASH FLOW SCHEDULE ($ US) | 219 |
TABLE 22.3 PROJECTED KEY ECONOMIC PARAMETERS (PRE-TAX, 100% EQUITY) | 220 |
TABLE 22.4 VARIATION OF PROJECTED LIVENGOOD PROJECT IRR AND NPV (000’ US $) FOR A GOLD PRICE RANGE OF US $800-$1,700 (PRE-TAX, 100% EQUITY) | 222 |
TABLE 22.5 VARIATION OF PROJECTED LIVENGOOD PROJECT IRR AND NPV (000’ US $) FOR A PROCESS RECOVERY CHANGES OF 5% BETWEEN 85-115% OF THE BASE ASSUMPTION (81.6%) -PRE-TAX, 100% EQUITY | 222 |
TABLE 22.6 VARIATION OF PROJECTED LIVENGOOD PROJECT IRR AND NPV (000’ US $) FOR 5% CHANGES IN OPEX ASSUMPTIONS BETWEEN 85% AND 115% - PRE-TAX, 100% EQUITY | 222 |
TABLE 22.7 VARIATION OF PROJECTED LIVENGOOD PROJECT IRR AND NPV (‘000 US $) FOR 5% CHANGES IN CAPEX ASSUMPTIONS BETWEEN 85% AND 115% | 223 |
TABLE 25.1 LIVENGOOD GLOBAL MINERAL RESOURCE AT 0.2 G/T CUT-OFF GRADE | 229 |
TABLE 25.2 LIVENGOOD SURFACE MINE RESOURCE DEFINED AT 0.22 G/T CUT-OFF GRADE AND A LONG TERM GOLD PRICE OF US $ 1,400 PER OUNCE. | 229 |
TABLE 26.1 FISCAL YEAR (ENDING MAY 31, 2012) PROJECT BUDGET | 233 |
| 27 |
| August 2011 Summary Report On The Livengood Project, Tolovana District, Alaska |
| 1.0 | Summary |
| 1.1 | Introduction |
This Technical Report has been prepared to update the mining configuration and Preliminary Economic Assessment for the Livengood Project to reflect recent information developed as part of the ongoing Pre-feasibility Studies (PFS). The Livengood project is currently performing exploration, resource definition and technical studies as part of the PFS which is scheduled for completion in Q4 of 2011. A Preliminary Economic Assessment (PEA) was performed previously to evaluate preliminary project concepts including possible mineralization processing methods, estimates of capital and operating costs, and preliminary surface mine design scenarios in November 2010 (Carew, et al., 2010). This update of the November 2010 technical report is based on the resource estimate updated August 22, 2011, prepared from data to May 31, 2011 and based on other PFS technical information as of August 22, 2011.
Individual sections of this report have been prepared by Qualified Persons representing different technical specialties who are both ITH staff members and independent consultants. Mr. Carl Brechtel PE, President and COO of ITH, was responsible for the overall compilation and certain specific sections of the report. Mr. Chris Puchner of ITH and Dr. Russell Myers of Corvus Gold, Inc. were responsible for updating the site description, geologic and data quality sections of the report. Mr. Timothy Carew (P.Geo) of Reserva International, LLC of Reno, NV was responsible for the resource evaluation. William Pennstrom, Jr. (Metallurgical Engineer) of Pennstrom Consulting Inc. of Denver, Colorado was responsible for the metallurgical and recovery method sections of the report and for the financial analysis. Scott Wilson of Scott Wilson Consulting, Inc., of Highlands Ranch, CO, was responsible for surface mine optimization and production scheduling. This report also relies on information produced by other relevant experts who are acknowledged in section 3.0.
Field investigations at the Livengood property are ongoing, with a total of 9 drilling rigs working at the site during the Summer 2011 program. Ongoing field data collection includes environmental baseline data collection (water quality sampling, wildlife studies, air quality) and meteorological sampling, geotechnical data collection for mine design, site evaluation and geotechnical data collection for project infrastructure location, groundwater hydrogeological testing, and rock geochemical characterization. Drilling activities have been expanded to include district exploration and site condemnation, as well as continuing the resource definition and infill drilling at Money Knob. A 3D IP geophysical program to survey the Livengood District will be completed in Q3 2011. The geologic database supporting this report is the 648 diamond and reverse circulation holes that had been drilled on the property to May 31, 2011, and provided the basis for reporting an update of the in-situ gold resource estimate.
This Technical Report is the twelfth in the series of technical reports and the eleventh that supports resource estimates which have been regularly updated as new drill information has become available. This Technical Report describes the pre-feasibility concept based on a gravity-flotation-CIL recovery method processing mineralized material recovered by surface mining. Estimates of capital and operating cost, and a preliminary surface mine design are included, along with the geological and resource estimation procedures that have been undertaken by ITH. The updated mineral resource estimate includes material in the measured, indicated and inferred classification based on borehole data up to May 31, 2011. It does not include drill results from ITH’s 2011 Summer drill program which is currently in progress.
| 28 |
| August 2011 Summary Report On The Livengood Project, Tolovana District, Alaska |
All costs in this report are reported in US Dollars. The current conversion factor of 1 CAD = 1.01 USD indicates virtual parity.
| 1.2 | Description and Location |
The Livengood property is located approximately 115 km northwest of Fairbanks, Alaska in the Tolovana Mining District within the Tintina Gold Belt. The project area is centered on Money Knob, a local topographic high point. This feature and the adjoining ridge lines are the probable lode gold source for the Livengood placer deposits which lie in the adjacent valleys which have been actively mined since 1914 and have produced more than 500,000 ounces of gold.
ITH controls 100% of its ~125 square kilometre Livengood land package, which is made up of 115 Alaska State mining claims, fee simple land leased from the Alaska Mental Health Land Trust, and four leases with holders of state and federal patented and unpatented mining and placer claims.
| 1.3 | Accessibility, Climate, Local Resources, Infrastructure and Physiography |
Livengood is located approximately 115 km north of Fairbanks, Alaska next to the Elliot Highway, a paved, all weather road linking the north slope oil fields at Prudhoe Bay to southern Alaska. It is also adjacent to the Alyeska Pipeline corridor, which transports crude oil from Prudhoe Bay south and contains the fiber optic communications cable utilized at the Livengood site.
Topography at the site is eroded hills and valleys with generally 200 m elevation difference. The valleys generally contain active streams draining into the Tolovana River system to the west.
The site is approximately 65 km south of the Arctic Circle, and has a subarctic climate with long, cold winters and short, warm summers. Annual precipitation is roughly 41 cm. Average low temperatures in winter are -21 to -28 degrees C, with records reaching as low as -55 degrees C.
The Fairbanks metropolitan area has a population of approximately 98,000 people, and comprises the regional center with hospitals, government offices, businesses and the University of Alaska, Fairbanks. The city is linked to southern Alaska along a north-south transportation and utility corridor that includes 2 paved highways, a railroad, an interlinked electrical grid, and communications infrastructure. The city has a regional airport serviced by up to 3 major airlines.
| 1.4 | History |
The property has been prospected and explored by several companies and private individuals since the 1970’s. Geochemical surveys by Cambior in 2000 and AngloGold Ashanti (U.S.A.) Exploration Inc. (“AGA”) in 2003 and 2004 outlined a 1.6 x 0.8 km area with anomalous gold in soil. Scattered anomalous samples continue along strike for an additional 5 km to the northeast and 1.6 km to the southwest. Eight reverse circulation holes were drilled by AGA in 2003 and a further 4 diamond core holes were drilled in 2004 to evaluate this anomaly. Favourable results from these holes revealed wide intervals of gold mineralization (BAF-7: 138.7m @ 1.07 g/t Au; MK-04-03: 55.3m @ 0.51 g/t Au) along with lesser intervals over a broad area. Over the past 5 years, exploration by ITH through its wholly owned Alaskan subsidiary, Talon Gold Alaska, Inc., has evaluated this mineralization utilizing both RC drilling and core drilling.
| 29 |
| August 2011 Summary Report On The Livengood Project, Tolovana District, Alaska |
Beginning in 2009, technical studies have been performed to generate metallurgical data for process definition, to generate preliminary surface mine designs, and to develop pre-conceptual information on the location and capacities of potential tailings management, overburden management, water reservoir, and mill process facilities. Conceptual project configurations have been generated from these studies which have been used as the basis for projected operating and capital cost estimation. A PEA for a large surface mining and mill processing facility was generated to update ITH information being developed for the current Pre-feasibility Study.
| 1.5 | Geologic Setting and Mineralization |
Rocks at Livengood are part of the Livengood Terrane, an east–west belt, approximately 240 km long, consisting of tectonically interleaved assemblages of various ages. These assemblages include the Amy Creek Assemblage, a sequence of latest Proterozoic and/or early Paleozoic basalt, mudstone, chert, dolomite, and limestone. An early Cambrian ophiolite sequence of mafic and ultramafic sea floor rocks was thrust over the Amy Creek Assemblage and was, in turn, overthrust by a sequence of Devonian shale, siltstone, conglomerate, volcanic, and volcaniclastic rocks, which are the dominant host to the mineralization currently under exploration at Livengood. The Devonian assemblage was overthrust by a second klippe of Cambrian ophiolite rocks. All of these rocks are intruded by Cretaceous multiphase monzonitic and syenitic dikes and sills. Gold mineralization is spatially and temporally associated with these intrusive rocks.
Gold mineralization occurs in association with disseminated arsenopyrite and pyrite in volcanic, sedimentary, and intrusive rocks, and in quartz veins cutting the more competent lithologies, primarily volcanic rocks, sandstones, and, to a lesser degree, ultramafic rocks. Three principal stages of alteration are currently recognized, an early biotite stage, followed by albite-quartz, and a late sericite-quartz assemblage. Carbonate appears to have been introduced with and subsequent to these stages. Arsenopyrite and pyrite were introduced primarily during the albite-quartz and sericite-quartz stages. Gold correlates strongly with arsenic and occurs primarily within and on the margins of arsenopyrite and pyrite.
Mineralization is interpreted as intrusion-related, consistent with other gold deposits of the Tintina Gold Belt, and has a similar As-Sb geochemical association. Mineralization is controlled partly by lithologic units, but thrust-fold architecture was key to providing pathways for intrusive and associated hydrothermal fluids.
Local fault and contact limits to mineralization have been identified, but overall the deposit has not been closed off in any direction. The current resource and area drilled covers the most significant portion of the area with anomalous gold in surface soil samples, but still represents only about 25% of the total gold-anomalous area.
| 30 |
| August 2011 Summary Report On The Livengood Project, Tolovana District, Alaska |
| 1.6 | Deposit Type |
Among deposits of the Tintina Gold Belt, Livengood mineralization is most similar to the dike and sill-hosted mineralization at the Donlin Creek deposit, where gold occurs in narrow quartz veins associated with dikes and sills of similar composition (Ebert, et al., 2000). The age of the intrusions and the genetic link between the mineralization and intrusive rocks are typical of those of other nearby gold deposits of the Tintina Gold Belt, which have been characterized as intrusion-related gold systems (IRGS; Newberry and others, 1995; McCoy and others, 1997) and for these reasons Livengood is best classified with them.
| 1.7 | Exploration |
Prior to ITH, several companies have explored the Livengood area and identified a sizeable area of anomalous gold in soil samples, and intervals of anomalous gold mineralization in drill holes. ITH advanced the soil sampling coverage and undertook to drill surface geochemical anomalies beginning in 2006. ITH has continued its exploration with step-out drilling on a 75 m grid, and infilling the 75 m pattern in the core of the mineralized areas. Infill and step out drilling in the resource area has continued in the Summer 2011 drill program.
ITH has also implemented a district exploration program, which includes core drilling in geochemical anomalies distal to the resource area and condemnation drilling in potential infrastructure locations. A 3D IP survey has also been conducted during the Summer of 2011 to generate targets over much of the district.
| 1.8 | Drilling |
ITH has conducted drilling campaigns on the Livengood property since 2006. These programs initially identified mineralization in the Core Zone and then identified the Northeast, Sunshine, and Southwest zones through step out drilling and drill testing of areas with anomalous values in surface soil samples.
Nearly all drill holes at Money Knob have been drilled in a northerly direction at an inclination of -50-(RC) and -60- (core) in order to best intercept the south dipping structures and mineralized zones as close to perpendicular as possible. A few holes have been drilled in other directions to test other features and aspects of mineralization. Most holes have been spaced at 75m along lines 75m apart, subsequent infill drilling in the center of 75m squares brings the nominal drill spacing to 50m for a significant portion of the deposit.
Diamond core holes represent 16% of the total number of holes drilled. Core is recovered using triple tube techniques to ensure good recovery (>95%) and confidence in core orientation. The core is oriented using either the ACTTM or the EZ MarkTM tools.
Reverse circulation holes are bored and cased for the upper 0-30m to prevent down hole contamination and to help keep the hole open for ease of drilling at greater depths. Recovery of sample material from RC holes is done via a cyclone and dry or wet splitter, according to conditions. Drill cuttings are collected over the course of each 1.5 m (five-foot) interval and captured for a primary sample, an equivalent secondary sample (“Met” sample) and a third batch of chips for logging purposes.
| 31 |
| August 2011 Summary Report On The Livengood Project, Tolovana District, Alaska |
In the deposit drill hole locations are determined by sub-meter differential GPS surveys at the drill collar. The initial azimuth of drill hole collars is measured using a tripod mounted transit compass in conjunction with a laser alignment device mounted on the hole collar. Down hole surveys of core and RC drill holes are completed using a Gyro-Shot survey instrument manufactured by Icefield Tools Corporation. Results of surveys and duplicate tests show normal minor deviation in azimuth and inclination for drill holes.
All RC samples are “logged in” on site, analyzed with a field portable Thermo Fisher Scientific NITONTM XRF before being sealed in super sacks and delivered to ALS Chemex in Fairbanks for preparation. Detail logging and mark-up of core is done at the Livengood camp. Core is sawed in half and bagged according to geologic intervals up to 1.5m and sealed in super sacks for delivery to ALS Chemex in Fairbanks.
Samples are analyzed by standard 50g fire assay for the gold determinations. All core samples and select RC drilling samples are also submitted for multi-element ICP-MS analyses using a 4 acid digestion technique. All RC samples are analyzed on site for trace elements using a Thermo Fisher Scientific NITONTM portable XRF before shipment to the laboratory.
| 1.9 | Sample Preparation, Analyses and Security |
ITH samples all holes from surface to total depth, using defined procedures. For RC samples, pulverized material is passed through a cyclone to separate solids from drilling fluids, then over a spinning conical splitter. The splitter is set to collect two identical splits of sample weighing 2-5 kg each. Representative coarse material is collected and saved in chip trays for geological description. Samples are put in pre-numbered, bar-coded bags by the drill site crew. One sample is submitted for analysis, and one sample is kept for reference. Samples are secured on site, and transported to a sample preparation facility operated by ALS Chemex in Faribanks.
Core materials are collected at the drill site and placed in core boxes. Run blocks, orientation blocks and depths are placed in the boxes at site. The core is transported to a sample management facility at Livengood, where it is described, then sawn in half. Half of the core is collected for assaying and half remains for reference. Core samples are weighed before shipping.
The QA/QC program implemented by ITH meets or exceeds industry standards. A QA/QC program includes insertion of blanks and standards (1/10 samples) and duplicates (1/20 samples). Blanks help assess the presence of any contamination introduced during sample preparation and help calibrate the low end of the assay detection limits. Commercial standards are used to assess the accuracy of the analyses. Duplicates help assess the homogeneity of the sample material and the overall sample variance. ITH has undertaken rigorous protocols to assure accurate and precise results. Among other methods, weights are tracked throughout the various steps performed in the laboratory to minimize and track errors. A group of 2096 metallic screen fire assays performed in 2011 did not indicate any bias in the matching fire assays.
Data entry and database validation procedures have been checked and found to conform to industry practices. Procedures are in place to minimize data entry errors. These include pre-numbered, pre-tagged, bar-coded bags, and bar-coded data entry methods which relate all information to sample and drill interval information. Likewise, data validation checks are run on all information used in the geologic modeling and resource estimation process. Database entries for a random sample (10%) of drill holes used for the resource estimate were checked against the original Assay Certificates by Mr. Carew and the error rate was found to be within acceptable limits.
| 32 |
| August 2011 Summary Report On The Livengood Project, Tolovana District, Alaska |
Analysis of assay data from core and RC sampling has been performed to check for downhole contamination of RC and to compare the data distributions produced by the two methods. Analysis of RC data has not indicated cyclic down hole contamination. Decay analysis conducted on both core drilling and RC drilling indicates similar patterns of monotonic grade increase or decrease. Comparison of the grade distributions between core and RC data were conducted using Quantile-Quantile plots, and simulation of population means for different numbers of samples. The comparison indicated that the mean of all core data was 4% lower than RC data. Comparison of core and RC data below the water table showed similar population means suggesting that down hole contamination was not occurring.
| 1.10 | Data Verification |
Core and RC check samples have been collected during each drilling campaign by independent third parties. Results from these samples, as well as blanks and standards included, are consistent with ITH’s initial results. This includes a similar increase in variance for samples at higher grades, a pattern consistent with nugget effect. No systematic high or low bias has been observed.
The Summer 2011 drilling includes three separate programs to develop data on grade continuity at reduced drill spacing, and on precision of grade estimation using both core and RC data. Two cross patterns are being drilled with spacing reduced to 15 m along the primary grid axes to evaluate grade continuity between holes. A block of approximately 9 million tonnes is being drilled with equal numbers of RC and core holes, drilled with 2 different orientations. This block will allow the evaluation of the precision of resource modeling at different data densities and with different types of sampling.
| 1.11 | Mineral Processing and Metallurgical Testing |
ITH has undertaken metallurgical and processing test work to determine optimal recoveries using numerous conventional flow sheets: including milling with gravity, flotation, and Carbon in Leach (CIL) or gravity and CIL of the gravity tails, and heap leaching. Current test work focuses on determining the best means of optimizing these combined recovery methods. This work involves studies that evaluate how gold mineralization occurs and how the mineralized materials vary in their physical and metallurgical response to process treatment parameters according to the various lithologic units that host mineralization. The characteristics under review include grindability, abrasiveness, optimal particle size for downstream treatment, and response to leach, flotation, or gravity unit operations as a function of oxidation and lithology.
Specific metallurgical characteristics, identified in the testing programs to date, have shaped the processing strategies used as the basis for this PEA and assumed project configuration. These important metallurgical findings are:
| 33 |
| August 2011 Summary Report On The Livengood Project, Tolovana District, Alaska |
| 1) | variable metallurgy (chemical and physical properties), depending upon mineralization type, degree of oxidation, amount of organic carbon, etc.; | |
| 2) | identification of mineralization types that are amenable to simple cyanide leaching process techniques such as heap leaching in conjunction with a carbon in column adsorption plant (CIC), particularly oxidized and partially oxidized mineralization; | |
| 3) | identification of sediment-hosted mineralization that contains organic “preg-robbing” carbon that will require CIL process techniques; | |
| 4) | higher recoveries for most mineralization types using gravity separation in combination with downstream CIL and/or flotation separation techniques; and | |
| 5) | lower recoveries for mineralization types with arsenic association. |
Specific observations about metallurgical performance are listed in the following:
- Most Livengood mineralization could be considered moderately soft to medium hard in hardness with an average Bond Ball Work index of 15.8. The mineralization varied significantly in hardness, with Bond Ball Work indices varying from a minimum of 11.1 to a maximum of 19.1.
- The majority of the mineralization would be considered non-abrasive, with an average Abrasion Index of 0.0809. The mineralization type abrasion characteristics varied significantly from 0.0023 to 0.2872.
- All of the Livengood mineralization types respond to cyanide leaching to some degree.
- Some of the unoxidized mineralization with organic carbon has “active” or “preg- robbing” carbon.
- The effect of leach times on gold recovery and gravity concentration results indicate some of the mineralization contains coarse gold.
- Gold recovery at 10 mesh particle size on some of the mineralization types exceeded 90 percent.
- Gold recovery on some of the mineralization types, but not all, is improved with finer grinding. A grind size where 80 percent (p80) of the particles are smaller than 200 mesh (74 microns) has been tested to date.
- The leaching of flotation concentrates, in preliminary tests, shows variable results depending on the mineralization type and the amount of arsenopyrite present.
- Fine grinding of flotation concentrates to less than 20 microns, in preliminary tests, does not significantly improve CIL gold recovery from this material.
- Initial flotation and gravity concentration tests indicate the combined processes exceed 90% gold recovery to the concentrates.
- The degree of oxidation of the mineralization, as observed by the geologists, has a marginal impact on the gold recovery.
- Differences in gold recovery between cyanide shake leach tests, bottle roll leach tests, and Carbon-in-Leach tests suggest organic carbon in the mineralization is active to varying degrees in some of the mineralization types, particularly the un-oxidized portions of those mineralization types.
- The gold is often associated with sulfides, but this mineralization would not be classified as a sulfide refractory type.
| 34 |
| August 2011 Summary Report On The Livengood Project, Tolovana District, Alaska |
| 1.12 | Resource Estimation |
This report presents a global mineral resource estimate updated from the April 2011 estimate. The resource model was constructed using Gemcom GEMS® and the Stanford GSLIB (Geostatistical Software Library) MIK post processing routine. The resource was estimated using Multiple Indicator Kriging techniques.
Model parameters include, among others, two oxidation indicators and a single lithology indicator for each minor lithology. A three-dimensionally defined lithology model, based on interpretations by ITH geologists, was used to code the rock type block model. A three-dimensionally defined probability grade shell (0.1 g/t) was used to constrain the gold estimation. Gold contained within each block was estimated using nine indicator thresholds. The block model was tagged with the geologic model using a block majority coding method. Because there are significant grade discontinuities at lithologic contacts, hard boundaries were used between each of the lithologic units so that data for each lithology was used only for that unit.
A summary of the estimated global (in-situ) mineral resource is presented below for cutoff grades of 0.2, 0.3, 0.5, and 0.7 g/t gold.
Model validation checks include global bias check, visual validation, and swath plots. In all cases, the model appears to be unbiased and fairly represent the drilling data.
Table 1.1 Global Resource Estimation Summary - August 2011
| Classification | Au Cutoff (g/t) | Tonnes (millions) | Au (g/t) | Million Ounces Au |
| Measured | 0.20 | 742 | 0.54 | 12.8 |
| Indicated | 0.20 | 322 | 0.47 | 4.8 |
| Inferred | 0.20 | 447 | 0.42 | 6.1 |
| Measured | 0.30 | 562 | 0.63 | 11.4 |
| Indicated | 0.30 | 216 | 0.58 | 4.0 |
| Inferred | 0.30 | 279 | 0.53 | 4.8 |
| Measured | 0.50 | 298 | 0.84 | 8.0 |
| Indicated | 0.50 | 96 | 0.81 | 2.5 |
| Inferred | 0.50 | 102 | 0.79 | 2.6 |
| Measured | 0.70 | 149 | 1.09 | 5.2 |
| Indicated | 0.70 | 42 | 1.10 | 1.5 |
| Inferred | 0.70 | 39 | 1.10 | 1.4 |
Economic testing of the global mineral resource has been performed using Whittle mine optimization to generate a surface mining shell defined at a long term gold price of $US 1,400 per ounce. Based on this mine optimization, the surface mining mineral resource at the Money Knob deposit is listed in Table 1.2.
| 35 |
| August 2011 Summary Report On The Livengood Project, Tolovana District, Alaska |
Table 1.2 Surface Mine Mineral Resource defined at US $1,400 per Au ounce.
| Classification | Au Cutoff (g/t) | Tonnes (millions) | Au (g/t) | Million Ounces Au |
| Measured | 0.22* | 676 | 0.56 | 12.2 |
| Indicated | 0.22* | 257 | 0.52 | 4.3 |
| M&I | 0.22* | 933 | 0.55 | 16.5 |
| Inferred | 0.22* | 257 | 0.50 | 4.1 |
*- Cutoff grade* is average for variable processing costs and recoveries. |
|
Based on the study herein reported, delineated mineralization of theLivengood Deposit is classified as a resource according to the followingdefinitions from National Instrument 43-101 and from CIM (2005): |
|
“In this Instrument, the terms "mineral resource", "inferred mineralresource", "indicated mineral resource" and "measured mineral resource"have the meanings ascribed to those terms by the Canadian Institute of Mining,Metallurgy and Petroleum, as the CIM Definition Standards on MineralResources and Mineral Reserves adopted by CIM Council, as those definitionsmay be amended.” |
|
Due to the uncertainty that may be attached to Inferred Mineral Resources, itcannot be assumed that all or any part of an Inferred Mineral Resource will beupgraded to an Indicated or Measured Mineral Resource as a result ofcontinued exploration. Confidence in the estimate is insufficient to allow themeaningful application of technical and economic parameters or to enable anevaluation of economic viability worthy of public disclosure. Inferred MineralResources must be excluded from estimates forming the basis of feasibility orother economic studies. |
|
Mineralization may be classified as an Indicated Mineral Resource by theQualified Person when the nature, quality, quantity and distribution of data aresuch as to allow confident interpretation of the geological framework and toreasonably assume the continuity of mineralization. The Qualified Person mustrecognize the importance of the Indicated Mineral Resource category to theadvancement of the feasibility of the project. An Indicated Mineral Resourceestimate is of sufficient quality to support a Preliminary Feasibility Study whichcan serve as the basis for major development decisions. |
|
Mineralization or other natural material of economic interest may be classifiedas a Measured Mineral Resource by the Qualified Person when the nature,quality, quantity and distribution of data are such that the tonnage and grade ofmineralization can be estimated to within close limits and that variation fromthe estimate would not significantly affect potential economic viability. Thiscategory requires a high level of confidence in, and understanding of thegeology and controls of the mineral deposit. |
| 36 |
| August 2011 Summary Report On The Livengood Project, Tolovana District, Alaska |
The current basis of project information is not sufficient to convert the in-situmineral resources to mineral reserves, and mineral resources that are notmineral reserves do not have demonstrated economic viability. |
| 1.13 | Mineral Reserve Estimates |
Mineral reserves have not been estimated for Livengood, because the project does not currently meet the minimum requirement of a completed PFS.
| 1.14 | Mining Methods |
The project configuration assumes a large scale surface mining operation using drill-blast-load-haul mining techniques. Major material handling was assumed to be based on hydraulic excavators with 34 cubic meter buckets and 220 tonne capacity haul trucks. Peak mining rates are 75 million tonnes of material, to sustain an annual throughput of 33.2 million tonnes of mineralized material at the processing plant. The total production rates in early years allow stockpiling of lower grade mineralized material to allow streaming of higher grade materials to the process plant.
The mine life is projected to be 23 years to support a mill throughput of 91,000 tonnes per day. Total mine production of mineralized material is projected to be 750 Mt with 892 Mt of overburden material. The strip ratio would be 1.19 overburden material to mineralized material. The mineralized material would be comprised of measured, indicated and inferred classifications in the proportions of 60%, 24%, and 16%, respectively.
Initial pioneering for the surface mine is assumed to start with the initiation of construction at the site to provide borrow material for construction of the tail dam. Minor production of mineralized material would begin in the second year of construction, and then ramp up to deliver 22.5 Mtpa, 31.6 Mtpa and 32.6 Mtpa in production years 1, 2 and 3, respectively. Full capacity would be achieved in year 4.
| 1.15 | Recovery Methods |
Preliminary processing assumptions are based on a flow sheet that assumes a gravity gold circuit, followed by flotation to produce a concentrate. Gold would be recovered from the concentrate using carbon-in-leach cyanide leaching.
A single train plant is assumed with run-of-mine (ROM) mineralized material delivered to a primary gyratory crusher, which would feed a coarse stockpile. Coarse mineralized material would be reclaimed by apron feeders discharging onto a SAG mill feed conveyor. A grinding circuit would include a single SAG mill feeding two ball mills in parallel.
The ground, mineralized material would be routed through a gravity circuit producing a rougher concentrate, which would be cleaned to produce a gravity concentrate and gravity middlings. The gravity cleaner concentrate would be processed in a gold refinery to produce dore'. Gravity rougher tail would be returned to the grinding circuit, after a cyclone separation of the fine fraction which would go to flotation directly.
| 37 |
| August 2011 Summary Report On The Livengood Project, Tolovana District, Alaska |
Ground mineralized material, after removal of the gravity recoverable gold, would go to a flotation cell where a rougher concentrate would be created, which combined with the gravity middlings would be reground and then leached in a CIL circuit to recover the contained gold. The CIL circuit would produce a loaded carbon which would be acid washed, stripped of gold and then reactivated for reuse. The refinery would use electrowinning to recover the gold, which would then be refined to produce a dore'.
The plant throughput would be controlled by the SAG milling capacity. Estimated gold recoveries have been based on the existing test work and industry experience, and varies between 58 -94 % for the different lithologies and oxidations.
Projected metallurgical recoveries for each lithologic unit have been estimated from the currently existing metallurgical test data. These estimates have been used as the basis of the mine optimization work, but have been increased by an additional 4 percentage points in the economic analysis to account for anticipated improvements that may be possible with further process optimization. Average recovery in the mine optimization output was 77.6%, but has been increased to 81.6% in the economic analysis. This projected improvement in recovery is based on previous experience of the Qualified Person in process testing and plant optimization.
| 1.16 | Project Infrastructure |
Alaska infrastructure has been developed in a north-south corridor between ports on the south coast (Anchorage, Valdez and others) and Fairbanks in the center of the State. This includes communications, paved highways, railroad, railbelt electrical grid, and major airports. The metropolitan area around Fairbanks has a population of approximately 98,000 people.
The paved, all weather Elliot Highway runs north from Fairbanks to the North Slope oilfields at Prudhoe Bay, and passes within several kilometers of the Money Knob deposit. Communications infrastructure (fibreoptic) has been extended to the North Slope along the Alyeska Pipeline, which parallels the Elliot Highway and passes just west of Livengood.
In preliminary, nonbinding discussions, the local utility in Fairbanks (Golden Valley Electrical Association) has indicated that 80-100 MW of power could be available to the Livengood Project. Livengood would be connected to the local grid by building a 64 km 230- kVA line along the pipeline corridor. Environmental baseline studies required for the electrical line construction were begun in 2011.
The development of site layout plans is underway as part of the PFS. Primary infrastructure requiring construction at Livengood would be the process plant, tail pipeline, electrical line, mine shops and buildings, and site roads. Alternative sites have been investigated along the northern side of the ridge containing the Money Knob deposit for the process plant, overburden management facility and tail storage facility. A historical dam site, used to store water for placer mining operations, is being investigated for water storage.
| 38 |
| August 2011 Summary Report On The Livengood Project, Tolovana District, Alaska |
| 1.17 | Market Studies and Contracts |
The market for gold is global in nature and is unlikely to be unaffected by production from the Livengood Project. There are several large third party gold refineries with well established industry relationships in North America. Among the more notable ones are:
- Metalor; North Attleboro, Massachusetts
- Johnson Matthey; Salt Lake City, Utah
- Canadian Mint; Ottawa, Ontario
ITH has not contacted any of the aforementioned companies for competitive treatment bids, rather utilizing industry averages for this stage of development.
| 1.18 | Environmental Studies, Permitting and Social and Community Impacts |
Based on review of the studies completed to date, there are no known environmental issues that are anticipated to materially impact the Project’s ability to extract the gold resource. ITH has been conducting environmental baseline studies at the Livengood Project since 2008. The environmental baseline programs conducted or currently underway at Livengood include:
- surface water quality and hydrology;
- groundwater hydrogeology;
- wetlands extent and characteristics;
- meteorology and air quality;
- aquatic life and resources;
- wildlife;
- cultural resources;
- and, rock geochemical characteristics.
A site-specific monitoring plan and water management plan for both operations and post mine closure will be developed in the future in conjunction with detailed engineering and Project permit planning. Since development of the Project will require a number of Federal permits, the National Environmental Policy Act (NEPA) and Council of Environmental Quality (CEQ) Regulations 40 CFR parts 1500-1508 will govern the federal permitting portion of the Project. In fulfillment of the NEPA requirements, the project will be required to prepare an Environmental Impact Statement (EIS). Although at this time it is unknown which department will become the lead federal agency, the State of Alaska is expected to take a cooperating role to coordinate the NEPA review with the State permit process.
Actual permitting timelines are controlled by the Federal NEPA review and Federal and State agency decisions.
The Project is located 115 km northwest of Fairbanks, Alaska and approximately 65 km north of the boundary of the Fairbanks North Star Borough,in an unincorporated area of the State and encompasses a combination of State of Alaska mining claims, State of Alaska Mental Health Trust lands, private lands, and federal mining claims. While the old mining town of Livengood no longer has year round residents or an organized government, there are approximately 15 residents living on remote homesteads on the road system within a 15 km radius of the Project. The nearest community is the village of Minto, a town of 200 located approximately 65 km southwest by road from the Project. Thus, while the local residents and the community of Minto are important stakeholders in the region and to the Project, there are no municipal or community agreements required for the Project.
| 39 |
| August 2011 Summary Report On The Livengood Project, Tolovana District, Alaska |
| 1.19 | Capital and Operating Costs |
Capital cost estimates have been developed from evaluation of the project configuration based on surface mining with a 91,000 tonne/day processing plant. International Tower Hill Mines Ltd. engaged MTB Project Management Professionals, Inc. to review capital cost that had been prepared in previous PEA estimates (Carew et al, 2010), make appropriate adjustments, prepare capital estimates, develop a work breakdown structure (WBS) for the capital cost, and develop an execution schedule for the capital expenditures, based on the scope of work as defined as of July 2011. Also, a sustaining capital cost estimate was to be prepared.
The capital cost scope was developed to a WBS. This WBS was developed from several historical projects of similar scope. The capital components of the estimate were allocated into two major groupings:
- Initial capital
- Sustaining capital cost for both incremental capital and replacement capital.
Costs were defined by the preproduction milestone schedule, with an approved feasibility study initiating the start of the capital cost being incurred; costs prior to the approved feasibility study were considered to be “sunk” costs. Initial capital cost was defined as all cost incurred before startup, which is when the first mineralized material is discharged into the primary crusher. Production year +1 begins at startup and defines operating cost.
| The capital cost summary is as follows: | |||
| Initial Capital Cost | $ | 1,614 million | |
| LOM Sustaining Capital Cost | $ | 585 million | |
| Contingency included in initial capital cost | $ | 323 million |
Project operating costs are based on comparison to similar mining operations in Alaska and the USA. Table 1.3 lists the operating cost assumptions used in the economic analysis.
Table 1.3 Operating Cost Assumptions
| Operating area | $/tonne processed | $/tonne mined | $/oz |
| Mining | $ 3.87 | $ 1.77 | $ 218 |
| Processing | $ 6.81 | - | $ 395 |
| Administration | $ 0.81 | - | $ 47 |
| Refining and Transportation | $ 0.08 | - | $4.73 |
| Reclamation | $ 0.07 | - | $ 4.16 |
| Royalty @ 2.5% | $0.47 | $27.50 | |
| Total | $ 12.12 | -- | $ 696 |
| 40 |
| August 2011 Summary Report On The Livengood Project, Tolovana District, Alaska |
| 1.20 | Economic Analyses |
A pre-tax, 100% equity economic analysis has been performed based on the following assumptions:
- Long term gold price of $1,100 per ounce in constant US dollars;
- US dollar terms (Exchange rate of US $1.00 = CAD $1.01)
- No cost escalation or inflation has been provided for
- Annual discount rate of 5%, as well as undiscounted cash flow and alternative annual discount rates of 7.5% and 10.0%.
- All cost prior to construction engineering, long lead item ordering and construction start up are considered sunk costs.
Under these assumptions, the Livengood Project is projected to have an Internal Rate of Return (IRR) of 14.1%, an undiscounted cash flow of US $3.41 B, and an NPV @ 5% of $1.24 B. Key economic performance parameters are listed in Table 1.4.
Table 1.4 Projected Key economic performance parameters at a long term gold price of US $1,100 per ounce.
| Economics | ||||||
| IRR | 14.14% | |||||
| NPV* | 0.00% | $ | 3,109,058 | |||
| NPV* | 5.00% | $ | 1,241,153 | |||
| NPV* | 7.50% | $ | 734,472 | |||
| NPV* | 10.00% | $ | 380,496 | |||
| Summary Statistics | ||||||
| Initial Capex | $ | 1,613,805 | ||||
| Sustaining Capex | $ | 584,658 | ||||
| Gold recovered-oz | 12,924,668 | |||||
| Cash operating cost/oz | $ | 696 | ||||
| Total cost/oz** | $ | 859 | ||||
| Stripping ratio | 1.19 | |||||
| LOM mill Au recovery | 81.6% |
* - 000' $ US
**- includes recovery of working capital and assumed salvage
Projected annual gold production and annual cash cost per Au ounce are shown graphically in Figure 1.1 for the life-of-mine (LOM). Sensitivities to gold price, recovery, opex and capes variations are listed in Tables 1.5, 1.6, 1.7 and 1.8, respectively.
| 41 |
| August 2011 Summary Report On The Livengood Project, Tolovana District, Alaska |
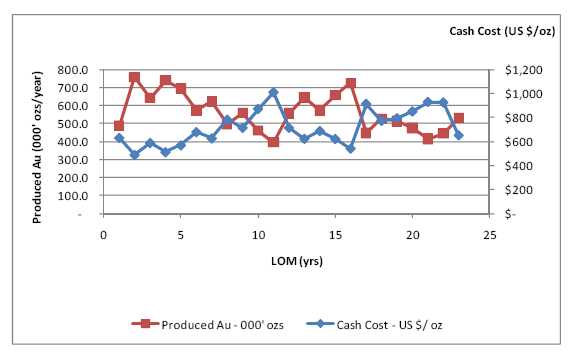
Figure 1.1 Projected annual gold production and annual cash cost per produced Au ounce for the
LOM.
Table 1.5 Variation of Projected Livengood Project IRR and NPV (000' US $) for a gold price range of US $800 -$1,700.
Gold Price
| Change | IRR | NPV 0% | NPV 5% | NPV 7.5% | NPV 10% |
| 800 | -6.7% | $(654,735) | $(816,710) | $(857,480) | $(882,725) |
| 900 | 3.7% | $599,863 | $(130,756) | $(326,829) | $(461,652) |
| 1000 | 9.5% | $1,854,461 | $555,198 | $203,821 | $(40,578) |
| 1100 | 14.1% | $3,109,058 | $1,241,153 | $734,472 | $380,496 |
| 1200 | 18.2% | $4,363,656 | $1,927,107 | $1,265,123 | $801,570 |
| 1300 | 22.0% | $5,618,253 | $2,613,061 | $1,795,774 | $1,222,644 |
| 1400 | 25.5% | $6,872,851 | $3,299,016 | $2,326,425 | $1,643,718 |
| 1500 | 28.8% | $8,127,448 | $3,984,970 | $2,857,075 | $2,064,791 |
| 1600 | 32.0% | $9,382,046 | $4,670,924 | $3,387,726 | $2,485,865 |
| 1700 | 35.1% | $10,636,643 | $5,356,879 | $3,918,377 | $2,906,939 |
| 42 |
| August 2011 Summary Report On The Livengood Project, Tolovana District, Alaska |
Table 1.6 Variation of Projected Livengood Project IRR and NPV (000' US $) for process recovery change of 85-115% of the base assumption (81.6%) .
Process recovery
| Change | IRR | NPV 0% | NPV 5% | NPV 7.5% | NPV 10% |
| 15% | 20.7% | $5,179,144 | $2,372,977 | $1,610,046 | $1,075,268 |
| 10% | 18.6% | $4,489,115 | $1,995,703 | $1,318,188 | $843,677 |
| 5% | 16.4% | $3,799,087 | $1,618,428 | $1,026,330 | $612,087 |
| 0% | 14.1% | $3,109,058 | $1,241,153 | $734,472 | $380,496 |
| -5% | 11.7% | $2,419,029 | $863,878 | $442,614 | $148,905 |
| -10% | 9.0% | $1,729,001 | $486,603 | $150,756 | $(82,685) |
| -15% | 6.0% | $1,038,972 | $109,328 | $(141,102) | $(314,276) |
Table 1.7 Variation of Projected Livengood Project IRR and NPV (000' US $) for change in opex of 85-115% of the base assumption.
Opex
| Change | IRR | NPV 0% | NPV 5% | NPV 7.5% | NPV 10% |
| 15% | 9.6% | $1,815,100 | $554,864 | $210,542 | $(30,494) |
| 10% | 11.2% | $2,246,419 | $783,627 | $385,186 | $106,503 |
| 5% | 12.7% | $2,677,739 | $1,012,390 | $559,829 | $243,499 |
| 0% | 14.1% | $3,109,058 | $1,241,153 | $734,472 | $380,496 |
| -5% | 15.5% | $3,540,377 | $1,469,916 | $909,115 | $517,493 |
| -10% | 16.8% | $3,971,697 | $1,698,679 | $1,083,759 | $654,490 |
| -15% | 18.0% | $4,403,016 | $1,927,442 | $1,258,402 | $791,486 |
Table 1.8 Variation of Projected Livengood Project IRR and NPV (000' US $) for change in capex of 85-115% of the base assumption (81.6%) ..
Capex
| Change | IRR | NPV 0% | NPV 5% | NPV 7.5% | NPV 10% |
| 15% | 11.5% | $2,804,541 | $983,139 | $493,698 | $154,157 |
| 10% | 12.3% | $2,906,047 | $1,069,143 | $573,956 | $229,603 |
| 5% | 13.2% | $3,007,553 | $1,155,148 | $654,214 | $305,050 |
| 0% | 14.1% | $3,109,058 | $1,241,153 | $734,472 | $380,496 |
| -5% | 15.2% | $3,210,564 | $1,327,157 | $814,730 | $455,943 |
| -10% | 16.3% | $3,312,069 | $1,413,162 | $894,988 | $531,389 |
| -15% | 17.5% | $3,413,575 | $1,499,167 | $975,246 | $606,836 |
| 43 |
| August 2011 Summary Report On The Livengood Project, Tolovana District, Alaska |
| 1.21 | Other Relevant Data and Information |
No additional information or explanation is known by the authors to be necessary to make the technical report understandable and not misleading.
| 1.22 | Interpretation and Conclusions |
A Pre-feasibility Study for the Livengood mineral resource is currently underway. This report provides an update of the anticipated project configuration, and an overview of the geological, exploration, metallurgical test work, process plant and infrastructure engineering, and surface mine planning work that has been completed to date. A preliminary economic assessment (PEA) of the updated configuration has been developed which is based on a surface mining operation supplying mineralized material to a processing plant with average throughput of 91,000 tonnes per day. The processing plant would produce gravity and flotation concentrates with gold recovered by Carbon-in-Leach processing of the concentrates. ThePEA addresses the basic framework of how gold mineralization will be mined, mineralized material processed, and recovery achieved.
The interpretation and conclusions supplied here are preliminary and are provided for the purposes of updating information about ITH’s progress in the PFS since the issuance of the November 2010 technical report (Carew, et al, 2010). The information is subject to revision prior to its incorporation into the final PFS document
| 1.23 | Recommendations |
ITH will continue its investigations and studies at Livengood with a projected FY 2011-2012 budget of $ 68.1 M USD ($ 67 M CND). The continuing PFS work accounts for approximately 75% of the expenditure, with the remaining 25% allocated to start up of the preparations for permit submittal and start up of feasibility engineering.
During the Summer 2011 field program, completion of several studies to demonstrate grade continuity and confirm precision of modeling with increased drill density will provide important verification of the resource estimation.
The PEA is preliminary in nature, and is based on forward looking technicaland economic assumptions which will be evaluated in the Pre-feasibility Study.The PEA is based on the Livengood in-situ resource model (August 2011)which consists of material in the measured, indicated and inferredclassification. Inferred mineral resources are considered too speculativegeologically to have technical and economic considerations applied to them.The current basis of project information is not sufficient to convert the in-situmineral resources to mineral reserves, and mineral resources that are notmineral reserves do not have demonstrated economic viability. Accordingly,there can be no certainty that the results estimated in the PEA will be realized. |
| 44 |
| August 2011 Summary Report On The Livengood Project, Tolovana District, Alaska |
The PEA results are only intended as an initial, first-passreviewofthepotential project economics based on preliminary information. |
| 45 |
| August 2011 Summary Report On The Livengood Project, Tolovana District, Alaska |
| 2.0 | Introduction and Terms of Reference |
| 2.1 | Introduction |
This technical report presents an update of the Livengood mineral resource estimate and of technical studies being performed as part of the Livengood PFS during 2010 and 2011. It also contains an updated Preliminary Economic Assessment (PEA) that reflects the anticipated configuration of the potential mining project. The Livengood property is currently being explored and undergoing Pre-feasibility Study by International Tower Hill Mines, Ltd. (ITH) through its wholly-owned subsidiary, Talon Gold Alaska, Inc. (“TGA”). The report has been developed by ITH staff and consultants and has therefore not been independently prepared.
In November 2010, Reserva International LLC (“RI”), Pennstrom Consulting Inc. (“PCI”), Cube Consulting Pty. Ltd. (“Cube”) and MTB Project Management Professionals, Inc. (“MTB”) provided International Tower Hill Mines Ltd. (“ITH”) with an independent technical report on the Livengood gold project in the Tolovana Mining District of Interior Alaska. This report, November 2010 Summary Report on the Livengood Project, Tolovana District, Alaska, is available on SEDAR.
In this August 2011 update of the technical report, further metallurgical data has been used to define the processing alternative and develop process recovery estimates by PCI. A project configuration has been defined around a milling operation using a gravity-flotation-CIL process flow sheet, surface mining design based on mine optimization and production scheduling by Scott Wilson Consulting, Inc., process capital and operating cost estimates by PCI and project capital cost review and scheduling by MTB. A Preliminary Economic Assessment has been generated for a single configuration based on a financial model developed by PCI.
| 2.2 | Terms of Reference |
This Technical Report presents an update of the mineral resource estimate and summarizes technical work currently ongoing in the Livengood PFS, which is scheduled for completion in Q4 of 2011. The effective date of the mineral resource estimate is August 22, 2011.
The authors of the report consist of both ITH staff members and independent consultants. Each author is a Qualified Person and is responsible for various sections of this report according to their expertise and contribution. Mr. Carl Brechtel is responsible for the overall compilation and certain specific sections of this report, and was assisted by other ITH staff members, and specialized consultants, who are listed in Table 2.1 along with sections of the report for which they are responsible. Mr. Timothy Carew was responsible for developing the resource modeling so that it incorporated the geologic interpretation and allowed the consideration of the metallurgical impacts on potential production plans. Mr. Scott Wilson was responsible for the mining studies in section 16. Mr. William Pennstrom Jr. is solely responsible for sections 13 and 17, and assisted in preparation of the economic analysis in section 22.
Each author has contributed figures, tables, and portions of Sections 1.0 and 25.0 based on their respective contributions to this report.
| 46 |
| August 2011 Summary Report On The Livengood Project, Tolovana District, Alaska |
Table 2.1 Qualified Persons – Sections of Responsibility
| Section | Title of Section | Qualified Person |
| 1.0 | Summary | All |
| 2.0 | Introduction | Carl Brechtel |
| 3.0 | Reliance on Other Experts | Carl Brechtel |
| 4.0 | Property Description and Location | Chris Puchner |
| 5.0 | Accessibility, Climate, Local Resources, Infrastructure and Physiography | Chris Puchner |
| 6.0 | History | Chris Puchner |
| 7.0 | Geologic Setting and Mineralization | Chris Puchner |
| 8.0 | Deposit Types | Chris Puchner |
| 9.0 | Exploration | Chris Puchner |
| 10.0 | Drilling | Chris Puchner |
| 11.0 | Sample Preparation, Analyses and Security | Chris Puchner, Russell Myers |
| 12.0 | Data Verification | Russell Myers |
| 13.0 | Mineral Processing and Metallurgical Testing | William Pennstrom |
| 14.0 | Mineral Resource Estimate | Timothy Carew |
| 15.0 | Mineral Reserve Estimate | Carl Brechtel |
| 16.0 | Mining Method | Scott Wilson |
| 17.0 | Recovery Methods | William Pennstrom |
| 18.0 | Project Infrastructure | Carl Brechtel |
| 19.0 | Market Studies and Contracts | Carl Brechtel |
| 20.0 | Environmental Studies, Permitting and Social and Community Impact | Carl Brechtel |
| 21.0 | Capital and Operating Costs | Carl Brechtel |
| 22.0 | Economic Analyses | William Pennstrom |
| 23.0 | Adjacent Properties | Chris Puchner |
| 24.0 | Other Relevant Data and Information | Carl Brechtel |
| 25.0 | Interpretation and Conclusions | All |
| 26.0 | Recommendations | Carl Brechtel |
| 27.0 | References | Carl Brechtel |
The work presented here builds on and revises previous geologic, metallurgical and resource information reported in nine previous technical reports for the project (Klipfel, 2006; Klipfel and Giroux, 2008a; Klipfel, Giroux and Puchner, 2008; Klipfel and Giroux, 2008b; Klipfel and Giroux, 2009; Klipfel, et al., 2009a; Klipfel, et al., 2009b; Klipfel, et al., 2010a; Klipfel, et al, 2010b, Klipfel, 2010c, Carew, et al, 2010). Gold assays and analyses of other elements along with geological, structural, engineering, and metallurgical data is from 648 holes drilled by ITH and previous explorers, including 50 RC holes and 5 diamond core holes drilled so far in 2011 as well as data from previous drilling programs. The effective date of this report is August 22, 2011.
Information presented in this report is based on technical data provided to RI, PCI, Scott Wilson Consulting, Inc. and MTB by ITH as of August 22, 2011. Data on drill results from the currently ongoing Livengood Summer 2011 drill program, released to the public on June 9, 2011, have not been utilized in this report. Data generated prior to 2006 was provided to ITH by AngloGold Ashanti (U.S.A.) Exploration Inc. (“AGA”). This report also relies on personal observations made by:
| 47 |
| August 2011 Summary Report On The Livengood Project, Tolovana District, Alaska |
- Timothy Carew in the course of four site visits and generation of modelling data from primary data provided by ITH.
- Bill Pennstrom, who has made two site visits to Livengood and one visit to a local operating mine to identify operating costs at that mine, and has assembled the process capital estimates and the financial models.
- Scott Wilson, who has made one site visit to Livengood, and who supervised and reviewed the pit optimization, production scheduling and mine equipment costing work.
The report also uses general geologic information available to the public through peer review journals as well as publications by the U.S. Geological Survey and agencies of the State of Alaska.
Mr. Brechtel and Mr. Puchner are ITH staff members and are Qualified Persons (QP) for the purposes of this report as defined by Canadian Securities Administrators National Instrument 43-101 (“NI 43-101”). Mr. Myers is a consultant and the former Vice-President, Exploration, of ITH and is a Qualified Person (QP) for the purposes of this report as defined by NI 43-101. They are not independent as defined by NI 43-101.
Mr. Carew, Mr. Pennstrom, and Mr. Wilson are Qualified Persons (QP) for the purposes of this report as defined by NI 43-101. They are each independent as defined by NI 43-101.
| 2.3 | Glossary of Key Abbreviations |
| ADEC | Alaska Department of Environmental Conservation |
| ADFG | Alaska Department of Fish and Game |
| ADNR | Alaska Department of Natural Resources |
| AGA | AngloGold Ashanti (U.S.A.) Exploration Inc. |
| AMHLT | Alaska State Mental Health Land Trust |
| BES | Barnes Engineering Services, Inc |
| BLM | U.S. Bureau of Land Management |
| CPM | Critical Path Method |
| g/t | grams/tonne |
| IRGS | Intrusion Related Gold System |
| ITH | International Tower Hill Mines Ltd. |
| KWh/T | kilowatt-hours per Ton |
| LOM | Life of Mine |
| M | million |
| my | million years (age dates) |
| MRS | Mineral Resource Services Inc. |
| Mtpa | million tonnes per annum |
| MW | megawatts |
| Opt | troy ounces per Ton |
| oz(s) | troy ounce(s) |
| PA | Preliminary Assessment |
| 48 |
| August 2011 Summary Report On The Livengood Project, Tolovana District, Alaska |
| PCI | Pennstrom Consulting Inc. |
| QA/QC | Quality Assurance/Quality Control |
| QP | qualified person |
| ROM | run of mine |
| SHPO | State Historic Preservation Office |
| t | tonne |
| TGA | Talon Gold Alaska, Inc. |
| tpa | tonnes per annum |
| tpd | tonnes per day |
| ktpd | thousand tonnes per day |
| Mtpa | million tonnes per annum |
| tph | tonnes per hour |
| USACE | US Army Corps of Engineers |
| $ or USD | United States dollars |
| WBS | Work Breakdown Structure |
| 2.4 | Purpose of Report |
The purpose of this report is to provide a technical update of the Livengood project, its exploration history, in-situ resource and mine development potential based on exploration work, metallurgical evaluation and engineering scenarios through August 22, 2011, a resource assessment based on that data, the discovery opportunity and development prognosis based on known geology current exploration results, and cost, engineering design, and metallurgical recovery models to provide recommendations for future work. This report conforms to the guidelines set out in NI 43-101.
| 2.5 | Sources of Information |
Information for this report was provided to the authors by ITH and consists of data generated by ongoing exploration by ITH and initial data from 2004 and earlier which was provided to ITH by AGA. In addition, Mr. Carew has spent an aggregate of 30 days on the site during four visits, including discussions with on-site geologic staff and review of various aspects of the program. Data provided by ITH has included reports developed by Dr. Paul Klipfel (CPG). Dr Klipfel has spent an aggregate of thirty days on the site during eight visits reviewing core, examining outcrop, and discussing the project with on-site geologic staff and with Mr. Jeffrey Pontius, CEO of ITH, and Mr. Carl Brechtel, President and COO of ITH. In addition, Dr. Klipfel has undertaken independent petrographic evaluation of samples from the project.
Drilling, sampling, QA/QC, logging and sampling, and other exploration activities have been performed by contract geologic staff under the direction of Dr. Russell Myers, Ph.D. (formerly ITH VP Exploration), Mr. Karl Hanneman, Livengood Project Manager, and Mr. Chris Puchner (ITH Chief Geologist; AIPG CPG 07048). Mr. Puchner is a Qualified Person as per guidelines set out in NI 43-101. Support for logistics, surveying, camp management, and digital modeling have been provided by Northern Associates of Alaska Inc. and their geologic, survey, and IT staff. External consultants and engineering firms have been contracted for numerous functions including Giroux Consultants Ltd. of Vancouver, B.C., (previous resource evaluations), Barnes Engineering Services (previous resource evaluation), Mineral Resource Services, Inc. (petrographic evaluation), Three Parameters Plus, Inc. (environmental studies), Northern Land Use Research Inc. (archaeological surveys), ABR Inc. (environmental studies), HDR Inc. (environmental studies), SLR Inc. (hydrology studies), Kappes Cassiday and Associates, (metallurgical test work), McClelland Laboratories Inc. (metallurgical test work), Hazen Research Inc. (metallurgical test work), Resource Development Inc. (metallurgical test work). AMTEL Ltd. have performed gold deportment studies. FLSmidth have performed metallurgical process studies and process engineering design work. SRK are performing hydrologic investigations, rock geochemical studies, and surface mine slope stability analysis. Knight Piesold Consulting has performed evaluations for tailing management facilities, overburden storage facilities, water storage reservoirs and heap leaching facilities. Cube Consulting Pty. Ltd. has performed surface mine optimization and production scheduling studies for the pre-conceptual mining, and Scott Wilson Consulting, Inc. has performed mine engineering studies. MTB Project Management Professionals, Inc. have reviewed the capital and operating cost assumptions, assembled capital expenditure schedules and assisted with Project Management systems development.
| 49 |
| August 2011 Summary Report On The Livengood Project, Tolovana District, Alaska |
Gold assay and multi-element ICP data from drill hole samples used in the resource evaluation are from ALS Minerals (ALS; formerly known as ALS-Chemex). ALS operates to international quality standards including compliance with ISO 17025 (www.ALSglobal.com). The ALS analyses have been validated annually through cross-lab checks using SGS, ACT Labs, and Alaska Assay Laboratories. Florin Analytical Services LLC has provided analytical services for test work done by Kappes Cassiday and Resource Development, Inc.
| 2.6 | Field Examination |
Mr. Carew has visited Livengood for a total of 30 days on four separate trips in 2009 and 2010, with the most recent visit from October 24-27, 2010. During the course of these visits, modelling work was conducted collaboratively with ITH geologic staff, database information and contained data were reviewed and validated. Visits also included review of the geologic and tectonic setting of the property, surface and down-hole survey procedures as well as examination of outcrop and drill core. Independent check samples were collected during the last visit in October 2010, the results of which are presented in section 12.0 of this report.
Dr. Klipfel visited the property eight times, with the most recent visit from August 21-26, 2010. These visits included sequential updating of data, exploration activities, review of geologic sections, and interpretations of geologic staff. Visits also included review of the physiographic, geologic and tectonic setting of the property, drill hole collar locations, surface and down-hole survey procedures and core orientation procedures as well as detailed examination of outcrop, drill core and RC chips.
More recently, with the shift to engineering and metallurgical evaluation, and involvement of other specialists, field examinations are giving way to engineering review and evaluation by numerous independent parties.
Mr. Pennstrom visited the Livengood project for 3 days in August of 2011, and previously spent two days on site in May of 2009. Site characteristics were reviewed with ITH staff, and Mr. Pennstrom participated in a PFS contractor team technical review meeting, and a PFS infrastructure review meeting.
| 50 |
| August 2011 Summary Report On The Livengood Project, Tolovana District, Alaska |
Mr. Wilson visited the Livengood project for 2 days in August of 2011. Site geologic information and topography were reviewed with ITH staff. Mr. Wilson also attended a PFS contractor team technical review meeting, and a PFS infrastructure review meeting.
| 51 |
| August 2011 Summary Report On The Livengood Project, Tolovana District, Alaska |
| 3.0 | Reliance on Other Experts |
The preparation of this report has relied upon public and private information gathered independently by the authors and data provided by ITH and AGA regarding the property. In addition, numerous studies have been undertaken by ITH staff members and by independent third party specialists whose results are incorporated into the current PEA. Other technical specialists, none of whom are QP’s as defined by NI 43-101 who have contributed to this report are:
Mr. Al Thabit, Jade Diamond Consulting, Inc.
Mr. Thabit, President of Jade Diamond Consulting, Inc. has 38 years experience and specializes in construction, maintenance and management consulting for mining project construction. With Newmont Gold, he was responsible for maintenance activities at the Gold Quarry mine processing plant and also participated in start up of four new processing facilities. He was also responsible for engineering design and construction of the new refractory gold ore treatment plant and mine dewatering projects. Mr. Thabit has assisted in the development of the construction capital cost estimate for the mill process facility in the PEA.
Mr. John Bell, MTB Project Management Professionals, Inc
Mr. Bell, Vice President, has over 44 years of experience in cost estimation, project controls and construction management with working experience in North and South America, Europe, Australia and Asia. He has developed detailed project cost estimates and construction schedules on numerous mine and mineral processing facilities, including the Magistral copper-molybdenum Project in Peru, the Pebble copper-gold project in Alaska, the Questa molybdenum mine in New Mexico and the White Pine copper mine in Michigan. He has assisted in the compilations of the Livengood project capital cost estimate in this technical report.
Mr. Karl Hanneman, International Tower Hill Mines Ltd.
Mr. Hanneman is the Livengood Project Manager, and is responsible for development of the Environmental Studies, Permitting and Social or Community Impact studies at the project. Mr. Hanneman has extensive project development and permitting experience in Alaska, developed from 1998 to 2004 while he served as Alaska Regional Manager, and Director Corporate Affairs for Teck Resources Ltd. He managed the permitting process for the Pogo Gold Mine and more recently served as the senior corporate representative in Alaska for Teck, providing strategic guidance on governmental, regulatory, permitting, and community issues related to the Red Dog Mine. Mr. Hanneman has led or participated in a number of industries and State of Alaska sponsored organizations, including: Alaska Minerals Commission, Council of Alaska Producers, Resource Development Council and the Alaska Miners Association. Mr. Hanneman holds a BSc. (Honours) degree in Mining Engineering from the University of Alaska.
| 52 |
| August 2011 Summary Report On The Livengood Project, Tolovana District, Alaska |
Ms. Denise Herzog, International Tower Hill Mines. Ltd.
Ms. Herzog is the Livengood Environmental Manager, and is responsible for direction and management of baseline studies at the project. She has 20 years of wide-ranging experience in mining and environmental engineering in Alaska. She worked as an Environmental Engineer for the Teck Pogo Project from 1998-2004, during project feasibility and construction. More recently, she has worked as a consultant, providing services in environmental studies and permitting to the Pogo Mine, Donlin Creek Project, the Pebble Project and the Nixon Fork Mine, all in Alaska. Ms. Herzog has an MS and BS degree in Geological Engineering from the University of Alaska, Fairbanks.
Dr. Peter D. Duryea, Ph.D, PE
Dr. Duryea currently serves as a senior project manager and geotechnical engineer with the Denver office of Knight Piésold and Co. His career in civil and geotechnical engineering has included nearly twenty years in engineering consulting as well as four years experience as a research associate with a major “Research One” university. During that time, he has worked on a variety of diverse projects including geotechnical analysis and design for plant site, heap leach, and tailing storage facilities for the mining industry. His other experience includes storm water hydrology, highway engineering, and research regarding unsaturated soils, groundwater recharge and the consolidation behavior of infiltration pond sediments. Dr. Duryea is a licensed professional engineer in Alaska (12766), Arizona (26604), California (C47241), and Colorado (28561). He holds a B.S. degree in civil engineering from the Colorado School of Mines (1987), and M.S.E. and Ph.D. degrees in geotechnical engineering from Arizona State University (1993 and 1996).
The authors assume and believe that the information provided and relied upon for preparation of this report is accurate and that interpretations and opinions expressed in them are reasonable and based on current understanding of mineralization processes and the host geologic setting. The authors have used this information to develop their own opinions and interpretations along with external and independent understanding of geologic, metallurgical processing, and resource evaluation concepts and best practices. The authors have endeavoured to be diligent in their examination of the data provided by ITH and independent contractors and the conclusions derived from review of that information or generated using that information.
| 53 |
| August 2011 Summary Report On The Livengood Project, Tolovana District, Alaska |
| 4.0 | Property Description and Location |
| 4.1 | Area and Location |
The Livengood project is located approximately 115 km by road (85 km by air) northwest of Fairbanks in the northern part of the Tintina Gold Belt (Figure 4.1). At this location, the property straddles, but lies predominantly to the north of, the Elliott Highway, the main road connecting Fairbanks with the Alaskan far north. The property lies in numerous sections of Fairbanks Meridian Township 8N and Ranges 4W and 5W. Money Knob, the principal geographic feature within the area being explored, lies near the center of the land holding and is located at 65o30’52’’N, 148o27’50’’W (UTM 6W 429600, 7265520; WGS84).
The explored area and current resource footprint reported here lies on the northwest flank of Money Knob and adjacent ridge lines and slopes, the extent of which remains to be determined. This area lies within, and to the south of, a 1.6 x 0.8 km northeast-trending soil sample anomaly that was the initial target of interest for drill assessment. The surface geochemical anomaly is situated within in a broader area of less pronounced anomalism that extends a further 5 km to the northeast and 1.6 km to the southwest. This zone is described further in section 9.0. Continued drilling success has lead to several rounds of resource evaluation, the latest of which is the subject of this report. At this time, mineralization continues to be identified as the area drilled expands outwards from an initial core zone centered over the geochemical soil anomaly. Identified mineralization has local boundaries such as faults or contacts, but overall, the limits of this mineralized system have not been identified with mineralization effectively open in all directions. The area with anomalous gold in soil samples has only been partially tested.
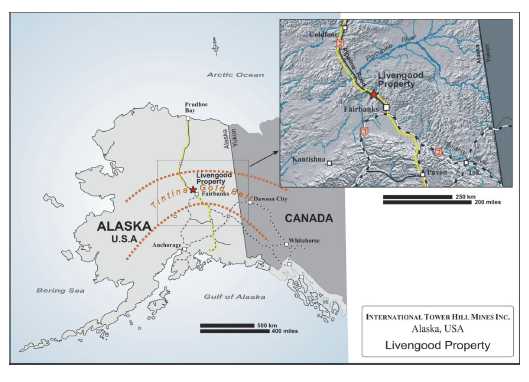
Figure 4.1 Location Map – Livengood Project and Tinta Gold Belt
| 54 |
| August 2011 Summary Report On The Livengood Project, Tolovana District, Alaska |
| 4.2 | Claims and Agreements |
The Livengood Property (Figure 4.2) consists of an aggregate area of approximately 12,499 ha (30,939 acres) controlled through agreements between TGA and the State of Alaska as well as between TGA and various private individuals who hold state and federal patented and unpatented mining and placer claims. All property and claims controlled through agreements are summarized inTable 4.1 and listed inAppendix 1. These agreements are with the AMHLT, Richard Hudson and Richard Geraghty, the estate of Ron Tucker, the Griffin heirs, and Karl Hanneman and the Bergelin Family Trust. The AMHLT Trust Land Office manages approximately 1 million acres of Alaska land through the Department of Natural Resources (www.mhtrust.org) and generates revenue for the AMHLT through land leasing and fees for a range of resources.
In February 2010, TGA increased its land position through the addition of AMHLT leased ground and Alaska State claims. The AMHLT lease (#9400248), signed July 1, 2004 by AGA and assigned to TGA on August 4, 2006, includes advance royalty payments of $5/acre/year which escalates to $15/acre in years 4-6 and $25/acre in years 7-9. The lease has a work commitment of $10/acre in years 1-3, $20/acre in years 4-6, and $30/acre in years 7-9. The lease carries a sliding scale production royalty of 2.5% @ $300 gold up to 5% for a gold price more than $500. In addition, an NSR production royalty of 1% is payable to AMHLT with respect to the unpatented federal mining claims subject to the Hudson & Geraghty and the Hanneman and Bergelin Family Trust lease. AMHLT owns both the surface and subsurface rights to the land under lease to TGA.
The Hudson and Geraghty lease, signed April 21, 2003 by AGA and assigned to TGA on August 4, 2006, has a term of 10 years and for so long thereafter as exploration and mining operations continue. TGA is required to make advance royalty payments of $50,000 per year, which are credited to production royalties. Production royalties vary from 2% to 3%, depending upon the price of gold. TGA has the option to buy down 1% of the royalty for $1 million. The 20 claims under this lease are unpatented federal lode mining claims that have no expiry but require a claim maintenance fee of $140/claim/year to keep them in good standing.
The Tucker mining lease of two unpatented federal lode mining and four federal unpatented placer claims has an initial term of ten years, commencing on March 28, 2007 and for so long thereafter as mining related activities are carried out. The lease requires payment of advance royalties of $5,000 on or before March 28, 2009, $10,000 on or before March 28, 2010 and an additional $15,000 on or before each subsequent March 28 thereafter during the initial term (all of which minimum royalties are recoverable from production royalties). ITH is required to pay the lessor the sum of $250,000 upon making a positive production decision. An NSR production royalty of 2% is payable to the lessor. ITH may purchase all interest of the lessor in the lease property (including the production royalty) for $1million. The 6 leased claims are federal claims without expiry. A fee of $140/claim/year or $140 worth of work/claim/year is required to maintain the claims in good standing.
| 55 |
| August 2011 Summary Report On The Livengood Project, Tolovana District, Alaska |

Figure 4.2 Livengood Land Holding Map
| 56 |
| August 2011 Summary Report On The Livengood Project, Tolovana District, Alaska |
Table 4.1 Summary of Claim Holdings and Annual Obligations
| Holder | Type of Holding | Current Year | 2010 Holding Obligation |
| AMHLT | State Mining Lease | 8 | $249,250 advance royalty; no work expenditure owing as ITH has banked work commitments to 2013 |
| Hudson and Geraghty, | 20 Fed. unpatented lode claims | 9 | $50K advance royalty payment |
| Ron Tucker (estate) | 2 Fed. unpatented lode claims | 5 | $5K |
| 4 Fed. unpatented placer claims | 5 | ||
| Griffin heirs | 3 patented Fed. claims | 5 | $15K |
| Karl Hanneman and the Bergelin Family Trust | 169 Alaska State mining claims | 6 | $50K + $200k work expenditure and claim rental fees of $28,730 |
| Alaska State Lands | 115 Alaska State mining claims | 3 | $17,920 claim rental paid with recording; $44,800 work commitment due by Sep. 1, 2010. |
The Griffin lease of three patented federal claims is for an initial term of ten years (commencing January 18, 2007), and for so long thereafter as the Company pays the lessors the minimum royalties required under the lease. The lease requires minimum royalty payment of $10,000 on or before January 18, 2009, $15,000 on or before January 18, 2010, an additional $20,000 on or before each of January 18, 2011 through January 18 2016 and an additional $25,000 on each subsequent January 18 thereafter during the term (all of which minimum royalties are recoverable from production royalties). An NSR production royalty of 3% is payable to the lessors. ITH may purchase all interest of the lessors in the leased property (including production royalty) for $1 million (less all minimum and production royalties paid to the date of purchase), of which $500,000 is payable in cash over 4 years following the closing of the purchase and the balance of the $500,000 is payable by way of the 3% NSR production royalty.
The Hanneman/Bergelin Family Trust ground is held via a Lease with Option to Purchase Agreement with an effective date of September 1, 2006. The lease of 169 Alaska State mining claims is for an initial term of ten years, commencing on September 11, 2006. The lease requires payments of $50,000 in each of years 2-5 and $100,000 in each of years 6-10 and work expenditures of $100,000 in year 1, $200,000 in each of years 2-5, and $300,000 in each of years 6-10. An NSR production royalty of 2% and 5% is payable to the lessors (depending upon the price of gold). ITH may buy all interest in the property subject to the lease (including the retained royalty) for $10 million.
| 57 |
| August 2011 Summary Report On The Livengood Project, Tolovana District, Alaska |
On Alaska State lands, the state holds both the surface and the subsurface rights. State of Alaska 40-acre mining claims require an annual rental payment of $35/claim to be paid to the state (by November 20), for the first five years, $70 per year for the second five years, and $170 per year thereafter. As a consequence, all Alaska State Mining Claims have an expiry date of November 30 each year. In addition, there is a minimum annual work expenditure requirement of $100 per 40 acre claim (due on or before noon on September 1 in each year) or cash-in-lieu, and an affidavit evidencing that such work has been performed is required to be filed on or before November 30 in each year. Excess work can be carried forward for up to four years. If such requirements are met, the claims can be held indefinitely. The work completed by ITH during the 2008 field season was filed as assessment work, and the value of that work was sufficient to meet the assessment work requirements through September 1, 2012 on all unpatented Alaska State mining claims held under lease. Work completed in 2009 has been filed and the expenditure is sufficient to carry forward through 2013 for claims held prior to 2010. Claims staked in 2010 will be subject to new work commitments.
Holders of Alaska State mining locations are required to pay a production royalty on all revenue received from minerals produced on state land. The production royalty requirement applies to all revenues received from minerals produced from a state mining claim or mining lease during each calendar year. Payment of royalty is in exchange for and to preserve the right to extract and process the minerals produced. The current rate is three (3%) percent of net income.
All of the foregoing agreements and the claims under them are in good standing and are transferable. Except for the patented claims, none of the properties have been surveyed.
Holders of Federal and Alaska State unpatented mining claims have the right to use the land or water included within mining claims only when necessary for mineral prospecting, development, extraction, or basic processing, or for storage of mining equipment. However, the exercise of such rights is subject to the appropriate permits being obtained.
| 4.3 | Permits and Environmental Requirements |
The Project exploration require permits from State and Federal Agencies including the United States Bureau of Land Management (BLM), United States Army Corp of Engineers (USACE), Alaska Department of Natural Resources (ADNR), Alaska Department of Fish and Game (ADFG), Alaska Department of Environmental Conservation (ADEC), and the State Historic Preservation Office (SHPO).
ITH staff and their subcontractors are conscientious in their care and diligence concerning historic features, flora and fauna, water quality, and general good stewardship toward the environment in their exploration activities. This includes proper and environmentally conscientious protection of operational areas against spills, capture and disposal of any potentially hazardous materials including fuel, drill fluids, and other materials used by equipment that are part of the drilling and exploration process. Reclamation of disturbed ground and removal of all refuse is part of normal operations.
Exploration activities which cause surface disturbance, such as drilling, are subject to approval and receipt of permits from the ADNR and the BLM. Two multi-year ADNR permits have been issued for the Project. MLUP #9748 was re-issued on February 3, 2011 and is valid for calendar years 2011-2015.
| 58 |
| August 2011 Summary Report On The Livengood Project, Tolovana District, Alaska |
This permit pertains to continuing exploration activity in the Money Knob resource area. MLUP #2138 was issued on August 18, 2010 and is valid for calendar years 2010 thru 2014. MLUP #2318 includes locations which require investigation as possible sites for project infrastructure. Exploration activities on Federal ground is permitted by the BLM under a Plan of Operations covered by EA-AK-024-08-010 (File FF095365) and is effective, without expiration, up until commencement of development.
One of the USACE permitting requirements is that road-accessed wetland sites be drilled in winter to minimize surface impact to vegetation and soil. It also requires that all roads and pads in wetlands be fully reclaimed prior to April 15th. Some slopes are covered in a patchwork of vegetation consistent with a wetlands designation. These areas have been mapped by Three Parameters Plus, Inc., a natural resource consulting firm (Figure 4.3). In early 2010, a new USACE Preliminary Juridictional Determination (PJD) was approved by the Corps of Engineers based on 2009 wetlands mapping in the resource area. This PJD provided documentation for a modification to the existing USACE Individual Permit issued on March 15, 2010 for winter drilling and trail construction on wetland areas within the resource area. In support of this amended permit, the Alaska Department of Environmental Conservation (ADEC) issued, on March 5, 2010, their Certificate of Reasonable Assurance for mineral exploration by ITH near Livengood. These permits remain in effect until 2015 and require ITH to comply with all Federal and State regulations that apply to these areas, including the requirement that all winter pads and roads be reclaimed prior to April 15thof the year that they are constructed.
In order to minimize wetlands disturbance to areas outside MLUP #9748, ITH operates under a USACE Nationwide Permit #6. In these areas, drill pads are constructed by hand and supported by helicopter in the summer and Nodwell track-vehicles in the winter months. Reclamation of these pads is completed when the drill is moved from the pad.
There are no known issues at this time that would hinder acquisition or renewal of any necessary exploration permits.
There are no known issues concerning surface waters beyond normal operational obligations which fall under operating permits issued by the state as outlined above.
There are no known native rights issues concerning the project area.
With over 90 years of placer mining activity and sporadic prospecting and exploration in the region, there is moderate to considerable historic disturbance. Some of the historic placer workings are now overgrown with willow and alder. The old mining town of Livengood is now abandoned except for more modern road maintenance buildings at the town site. ITH does not anticipate any obligations for recovery and reclamation of historic disturbance. There are no known existing environmental liabilities.
ITH commissioned Northern Land Use Research, Inc. (NLUR) to complete a cultural resource survey in 2008 (Figure 4.3). An initial report was submitted to ITH in January, 2009 (Northern Land Use Research, Inc., 2009). This Level 1 or Identification Phase survey was commissioned by ITH to locate and document historic sites, cultural features, or artefacts in the deposit area. Twelve previously undocumented historic sites or artefacts were identified in 2008. No prehistoric artfacts and no previously unknown prehistoric cultural resources were located in the 2008 exploration area.
| 59 |
| August 2011 Summary Report On The Livengood Project, Tolovana District, Alaska |
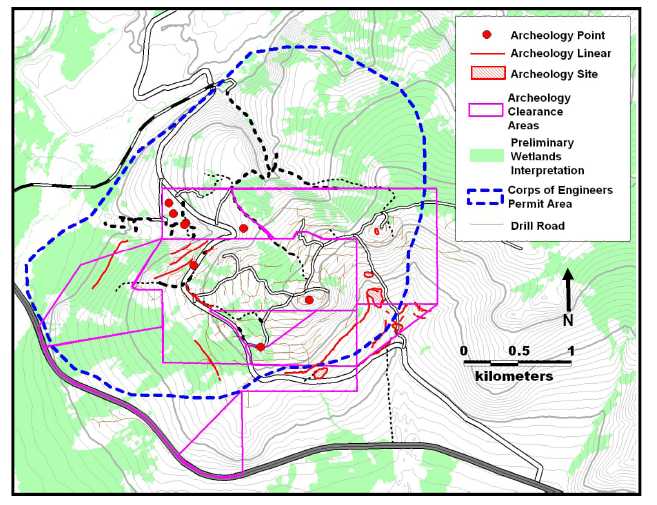
Figure 4.3 Map of Money Knob Area - Archaeological Study Area
A second cultural resource survey was conducted by NLUR during the summer of 2009 to cover a larger, expanded exploration area. The survey documented historic (i.e. archaeological) mining equipment, buildings and linear ditch features, and relocated a previously known prehistoric site within the expanded coverage area (Figure 4.3). Also, 12 select areas identified during the 2008 and 2009 programs were reviewed at a Phase II level (site documentation). NLUR has provided recommendations which include a policy of feature avoidance to prevent damage to the condition or integrity of identified features. All recommendations made by NLUR need to be made official by SHPO who will determine if any identified cultural resources require further action or isolation from disturbance.
Total disturbance associated with ITH’s exploration consists of drill pad access roads and drill pads. However, as the number of drill holes increases, the local impact does as well. An ongoing program of reclamation of pads and roads reduces the impacted area to the minimum possible at any given time. For much of the exploration area, disturbance involves areas covered by secondary growth of alder, willow, and spruce and consequently, the impact is largely not visible from the Elliott Highway or the road into the Livengood town-site. Visual impact is minimal. The highest ground is naturally bare broken rock or sparsely covered in small shrubs and mosses.
| 60 |
| August 2011 Summary Report On The Livengood Project, Tolovana District, Alaska |
Three Parameters Plus, Inc. of Fairbanks, AK, has been retained by ITH to: 1) conduct an initial baseline surface water sampling program to evaluate metal and organic content of streams that drain the project area as well as regional streams up-gradient from the project area; and 2) complete a wetlands inventory on and around ITH’s land position.
Water samples have been collected from 14 sites on a near monthly basis from March through October. A 2009 report indicates apparent local and seasonal spikes among some analytes (Three Parameters Plus, Inc. 2009). These are deemed to be mostly natural and, in part, a reflection of past placer mining activity. Sampling will continue in order to develop base line trends for each sample location. One well has been established to monitor the static water table fluctuations on Money Knob and water table measurements are taken on each drill hole upon completion.
ABR Inc. of Anchorage, AK conducted a survey in 2009 to assess quality and biodiversity of fish, benthic invertebrate, and periphyton populations in the streams that drain and are adjacent to the project area. Surveys of this type are conducted at this early stage to determine the current conditions against which environmental quality metrics can be established should a mine be constructed. Two separate attempts to identify fish populations that might be suitable for environmental monitoring, including both minnow traps and electrofishing, encountered only grayling, which are unsuitable for monitoring because of their migratory habits. No other species were identified.
Wildlife in the area consists of moose, bear, and various small mammals. None were observed in the course of the site visits although moose and bear have been seen in the vicinity. Hunters can be active in the region and local trap lines may be present. There are no known wildlife issues.
There are no known existing environmental liabilities.
| 61 |
| August 2011 Summary Report On The Livengood Project, Tolovana District, Alaska |
| 5.0 | Access, Climate, Local Resources, Infrastructure and Physiography |
| 5.1 | Access |
The Livengood Project area is located approximately 115 km northwest of Fairbanks on the Elliott Highway, which provides paved, year-round access to the area. At present there are no full time residents in the former mining town of Livengood. A number of unpaved roads have been developed in the area providing excellent access. A 1400-foot runway is located 6 km to the southwest near the former Alyeska Pipeline Company Livengood Camp and is suitable for light aircraft.
| 5.2 | Climate |
The climate in this part of Alaska is continental with temperate and mild conditions in summer with average lows and highs in the range of 7 to 22oC. Winter is cold with average lows and highs for December through March in the range of -27 to -5oC. Annual precipitation is on the order of 41 cm. Winter snow accumulation ranges up to 66 cm (http://www.wrcc.dri.edu/cgi-bin/cliMAIN.pl?ak5534).
| 5.3 | Local Resources |
The project is serviced from Fairbanks, population 98,000. As Interior Alaska’s principal center of commerce it is home to many government offices including the Alaska Division of Geological and Geophysical Surveys and the U.S. Geological Survey, as well as the University of Alaska Fairbanks. The town is serviced by major airlines with numerous daily flights to and from Anchorage and other locations. Helicopters and fixed wing aircraft are readily available. Virtually all supplies necessary for the project can be obtained in Fairbanks.
On-site operations are conducted from a refurbished portion of the former Livengood Camp which was built to support construction of the Trans Alaska Pipeline. Current camp facilities can accommodate up to 160 people, sufficient to meet the needs of the on-going exploration program.
| 5.4 | Infrastructure and Physiography |
The project is situated in forested hilly countryside with mature, subdued topography partly owing to widespread deposition of Pleistocene loess and gravel in valleys (Figure 5.1). Elevation ranges from about 150m (~500’) in valley bottoms to 700m (2317’) at Amy Dome along the east side of the property. Streams meander through wide, flat-bottomed, alluvial-filled valleys. Ridge lines are generally barren with sparse vegetation. Hillsides with a dominantly southern aspect are typically forested by a mixture of birch, aspen, and white spruce; black spruce is the dominant species on hillside with more northerly exposure, reflecting near surface permafrost.
| 62 |
| August 2011 Summary Report On The Livengood Project, Tolovana District, Alaska |
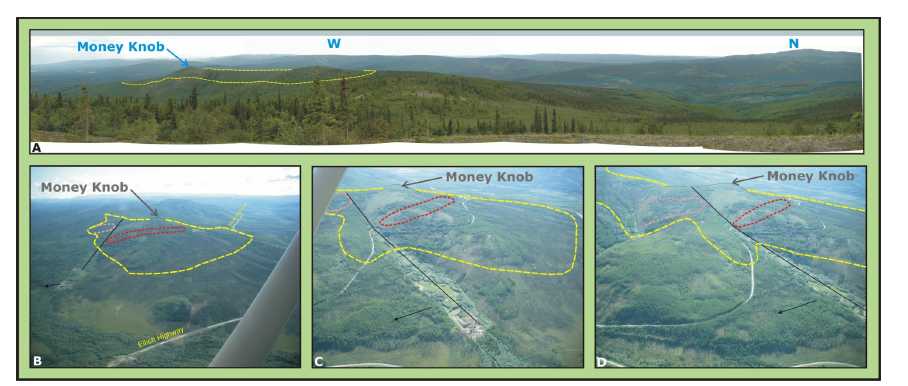
Figure 5.1 Photos of Money Knob and Project Area
A) Panoramic view looking west and north toward Money Knob. Dashed yellow line outlines the perimeter of the area under investigation by drilling. Blue lines to the right outline placer workings to the north in Livengood Creek.B - D) Aerial view of Money Knob from the west and northwest showing the Lillian Fault (black line), and area under investigation by drilling (yellow dashed line). The “Core Zone” is outlined with a dotted red line. The Sunshine Zone is outlined with a pink dotted line. Arrow indicates north.
| 63 |
| August 2011 Summary Report On The Livengood Project, Tolovana District, Alaska |
The area is drained by Livengood Creek which flows to the southwest into the Tolovana River which then joins the Tanana River and ultimately the Yukon River approximately 190 km to the west.
Existing infrastructure includes a paved highway (the Elliott Highway) which passes through the property and within ~ 1.6 km of Money Knob. Lesser unpaved roads are developed throughout the property. A repeater tower has been built on Tower Hill approximately 1.6 km east of Money Knob.
Self-generated power currently exists at the Livengood camp. The nearest grid power is approximately 67 km (40 miles) away at its closet point to the Livengood property. A power line will need to be constructed for power supply to the proposed Livengood facility for operational demands.
| 64 |
| August 2011 Summary Report On The Livengood Project, Tolovana District, Alaska |
| 6.0 | History |
Gold was first discovered in the gravels of Livengood Creek in 1914 (Brooks, 1916). Subsequently, over 500,000 ounces of placer gold were produced and the small town of Livengood was established. From 1914 through the 1970’s, the primary focus of prospecting activity was placer deposits. Historically, prospectors considered Money Knob and the associated ridgeline the source of the placer gold. Prospecting, in the form of dozer trenches, was carried out for lode type mineralization in the vicinity of Money Knob primarily in the 1950’s. However, to date no significant production has been derived from lode gold sources.
The geology and mineral potential of the Livengood District have been investigated by state and federal agencies and explored by several companies over the past 40+ years. Modern mapping and sampling investigations were initially carried out by the U.S. Geological Survey in 1967 as part of a heavy metal assessment program (Foster, 1968). Mapping completed in the course of this program recognized the essential rock relations, thrust faulting, and mineralization associated with Devonian clastic rocks, the thrust system and intrusive rocks. These relations are summarized in the following insightful comment from the report summary.
“The small lode deposits in the upper plate rocks may represent leakageanomalies above economically significant metal deposits in rocks in orbelow the thrust fault zones.” |
Since then, the Livengood placer deposits and the surrounding geology have featured in numerous investigations and mapping programs at various scales by the U.S. Geological Survey and the Alaska State Division of Geological and Geophysical Surveys. Principal among these are: Chapman, Weber, and Taylor, 1971; Chapman and Weber, 1972; Cobb, 1972; Albanese, 1983; Robinson, 1983; Smith, 1983; Waythomas, and others, 1984; Arbogast, 1991; Athey and Craw, 2004; and Athey and others, 2004.
In 2003, as part of a larger state-wide program, the Alaska Division of Geological and Geophysical Surveys undertook a district-scale program of mapping and geochemical sampling in support of the mapping. They report “one highly anomalous sample that yielded slightly over one ounce per ton gold” (Athey and Craw, 2004).
In addition to individuals prospecting the area, corporate explorers have investigated the potential for lode gold mineralization beneath the Livengood placers and on the adjacent hillsides, including at Money Knob. A summary of these programs is shown inTable 6.1. Placer Dome’s work appears to have been the most extensive, but it was focused largely on the northern flank of Money Knob and the valley of Livengood Creek.
The most recent round of exploration of the Money Knob area began when AGA acquired the property in 2003 and undertook an 8-hole RC program on the Hudson-Geraghty lease. The results from this program were encouraging and were followed up with an expanded soil geochemical survey which identified gold-anomalous zones over Money Knob and to the east. Based on the results of this and prior (Cambior) soil surveys, 4 diamond core holes were drilled in late 2004. Results from these two AGA drill programs were deemed favourable but no further work was executed due to financial constraints and a shift in corporate strategy.
| 65 |
| August 2011 Summary Report On The Livengood Project, Tolovana District, Alaska |
Table 6.1 Exploration History
| Company / Year | Major Activity | Results | Comment |
Homestake / 1976 | Geochemistry & 7 boreholes | Significant soil anomaly, low grade gold in drill holes and auger samples | Management decided on other priorities. |
| Occidental Petroleum / 1981 | 6 boreholes | Low-grade gold encountered in several holes | Other priorities. |
Alaska Placer Development 1981 - 1984 | Extensive soil and rock sampling together with mapping, magnetic surveys, EM surveys, trenching and auger drilling. | Defined soil and rock anomalies | Mostly on flanks of Money Knob. Changed focus to placer deposits. |
Amax / 1990 | 3 RC holes, surface geochemistry, and auger drilling | Good geological mapping, lots of rock sampling, moderate grade gold in drill holes. | Other priorities. |
Placer Dome / 1995 - 97 | Surface exploration, geophysics, & 9 core holes | Intersected low grade gold mineralization. | Work focused north of Money Knob. Limited land position. |
Cambior 1999 | Geochemistry | First to identify the areal extent of gold in soils around Money Knob. | Corporate restructuring – no follow-up. |
| AGA / 2003- 2005 | Geochemistry, trenching, geophysics, 4 core and 8 RC drill holes | Geochemical anomaly, numerous drill intersections | Intersected gold- bearing intervals. |
ITH 2006- 2007 | Surface geochemical sampling; drilling 22 core holes | First intersection of extensive zones of > 1g/t Au. | Intersected more gold-bearing intervals; initial resource estimates. |
ITH 2008- May 2011 | 550 RC and 72 core holes,. | Infill and step-out grid drilling of mineralization, geotechnical drilling, metallurgical testing, environmental baseline data collection | Expanded resource estimates, preliminary economic evaluation of the deposit. |
| 66 |
| August 2011 Summary Report On The Livengood Project, Tolovana District, Alaska |
In 2006, Livengood and other properties now part of the ITH portfolio were sold to ITH by AGA. In the same year, ITH drilled a 1227 m, 7-hole program. The success of this program led to the drilling of an additional 4400 m in 15 diamond core holes in 2007 to test surface anomalies, expand the area of previously intersected mineralization, and advance geologic and structural understanding of subsurface architecture. Subsequent programs have continued to expand the resource, leading to consideration of development of the deposit and concomitant geotechnical and metallurgical test work, and the collection of environmental baseline data.
Geophysical work in the vicinity includes an airborne magnetic survey by Placer Dome in 1995. This data has not been recovered. They also conducted VLF surveys in the northern part of the district in 1996 with only limited success due to mixed frozen and thawed ground; this data is only partially preserved. The State of Alaska flew a 400 meter line spaced DIGHEM survey (an aerial, multi-channelelectromagnetic technique) over the Livengood District in 1998 (Burns and Liss, 1999; Rudd, 1999). AGA ran a series of Controlled-Source Audio-frequency Magneto-Telluric (CSAMT) lines across Money Knob in 2004. This CSAMT survey was undertaken to find intrusive bodies in the subsurface. It appeared to map the main thrust zone but did not delineate hidden intrusive bodies.
| 67 |
| August 2011 Summary Report On The Livengood Project, Tolovana District, Alaska |
| 7.0 | Geological Setting and Mineralization |
| 7.1 | Regional Geology |
The Livengood ‘district’ is a portion of the broader Tolovana Mining District. Mineralization is hosted by rocks of the Livengood Terrane (Figure 7.1), a sequence of complexly deformed and faulted, but only weakly metamorphosed, sequence of rocks dissimilar to those of the surrounding terranes. The terrane lies in an east–west-trending belt, approximately 240 kilometres long, bounded on the north by splays of the dextral Tintina-Kaltag strike-slip fault system and on the south by metamorphic rocks of the Yukon-Tanana Terrane (Silberling and others, 1994; Goldfarb, 1997).
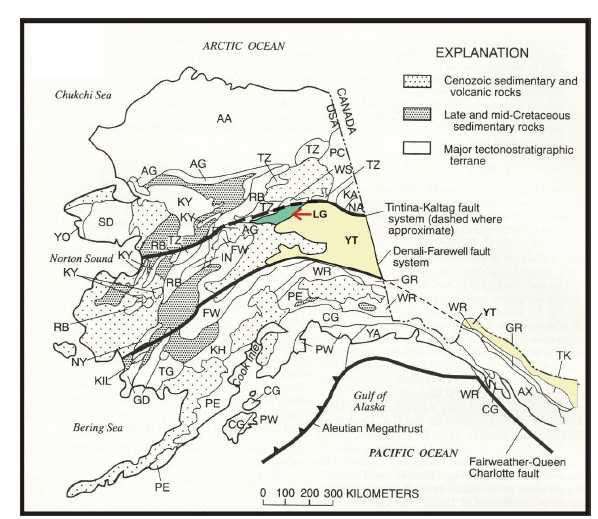
Figure7.1 Terrane Map of Alaska - Livengood Terrane (LG; red arrow)is the Tintina Fault. The heavy black line to the south of the Livengood and Yukon – Tanana Terrane (YT) is the Denali Fault. The Tintina Gold Belt lies between these two faults. After Goldfarb, 1997.
Throughout the Livengood Terrane, individual assemblages of various ages are tectonically interleaved. These assemblages and, locally the stratigraphy within them, are bounded by both low angle thrust faults and steep faults, of which at least some of which are splays of the Tintina Fault system. Rocks of the Livengood Terrane are generally highly deformed, but weakly metamorphosed Neoproterozoic to Paleozoic marine sedimentary rocks, Cambrian ophiolite, Ordovician Livengood Dome chert, overlying dolomite, volcanic rocks, terrigenous clastic rocks, and minor Devonian limestone (Silberling, et al., 1994; Athey et al., 2004).
| 68 |
| August 2011 Summary Report On The Livengood Project, Tolovana District, Alaska |
The Livengood Terrane is overprinted by later Mesozoic intrusions believed to have originated in the back-arc position above subducting oceanic crust. These intrusions are quartz monzonite to diorite to syenite in composition, some of which have been linked to the genesis of the gold deposits of the Tintina Gold Belt (McCoy, et al., 1997; Goldfarb, et al., 2000), an arcuate belt of gold mineralization that extends from the Yukon to south-western Alaska and hosts numerous gold deposits, including Fort Knox and other deposits of the Fairbanks District, Livengood, and Donlin Creek in the Kuskokwim region (Smith, 2000).
| 7.2 | Local Geology |
In the vicinity of the Livengood project, the oldest rocks are Neoproterozoic to early Paleozoic basalt, mudstone, chert, dolomite, and limestone of the Amy Creek Assemblage (IPzZ units on Livengood geology map; Athey et al., 2004) (Figures 7.2 and 7.3). These units are interpreted as ocean floor basalt and associated sedimentary rocks in an incipient continental rift system. Their origin and age are poorly constrained but fossil evidence suggests a depositional age between Neoproterozoic and Silurian time.
An early Cambrian ophiolite sequence (Plafker and Berg, 1994), consisting of structurally interleaved greenstone, pyroxenite, metagabbro, layered metagabbro, ultramafic rocks and serpentinite derived from them (Figures 7.2and 7.3) structurally overlies the Amy Creek Assemblage. Metamorphic ages suggest these rocks were tectonically emplaced over the Amy Creek Assemblage by north-directed thrusting during Permian time (Athey and Craw, 2004).
The Cambrian ophiolite sequence is, in turn, overthrust by Devonian rocks which include shale, siltstone, conglomerate, and volcanic and volcaniclastic rocks (Figures 7.3 - 7.6). This sequence is the principal host for gold mineralization. These rocks have been subdivided into “Upper” and “Lower” sedimentary units with volcanic rocks (“Main Volcanics”) separating them (Figure 7.3). The Upper Sediments consist of siltstone, sandstone, conglomerate, shale, and minor limestone and dolomite. The Lower Sediments unit is dominantly shale in the northern portion of the property but includes sandy siltstones and fine sandstones to the south. Use of trace element ratios has helped discriminate these units from one another. The volcanics consist of flows and pyroclastic rocks. Some of these volcanic rocks were previously mapped as Cretaceous intrusive rocks (Athey et al., 2004). However, geologic observations in drill core and the use of trace element ratios indicate that most of the rocks mapped as the “Ruth Creek” and “Olive Creek” plutons are volcanic rocks and part of the Devonian stratigraphy.
| 69 |
| August 2011 Summary Report On The Livengood Project, Tolovana District, Alaska |
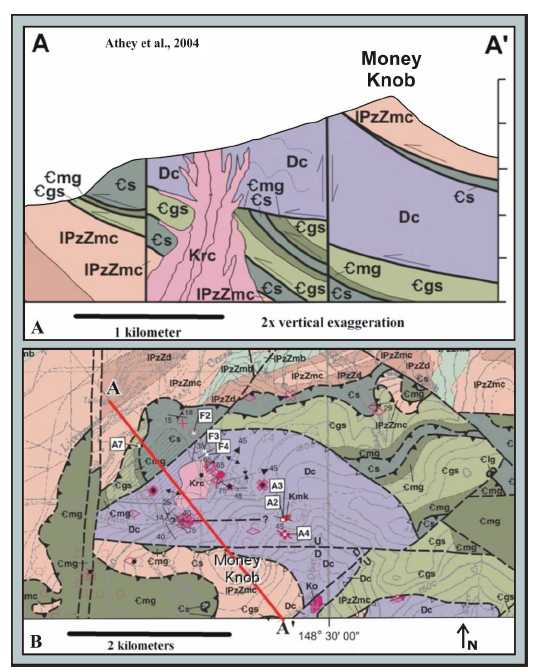
Figure 7.2 Geologic Cross Section and Map – Livengood Project Area (Athey, et al., 2004)
A) Cross section through Money Knob illustrating the geological components of the Livengood District. lPzZmc, lPzZd, and LPzZmb are mudstone and chert, dolomite, and basaltic units of the Amy Creek Assemblage. Cs, Cgs and Cmg are Cambrian mafic and ultramafic volcanics and intrusive rocks of oceanic ophiolitic affinity. Dc represents Devonian siliciclastic sediments. Pink and red units (Krc and Ko) represent rocks mapped intrusive but now known to be Devonian volcanic rocks.The thrust imbrication may reflect two deformation events, one in the Permian and one in the Middle Cretaceous. The thrust package has been intruded by a numerous Cretaceous felsic dikes. B) Geologic map showing the location of the cross section ‘A-A’.
| 70 |
| August 2011 Summary Report On The Livengood Project, Tolovana District, Alaska |
![]()
Figure 7.3 Diagrammatic Lithologic/Structural Column – Tectonic Stacking – Livengood Area
Structurally above the Devonian assemblage is a klippe of the Cambrian ophiolitic mafic and ultramafic rocks with tectonically interleaved wedges of cherty sedimentary rock (Figures 7.3 and 7.4). The emplacement of this klippe may have taken place in Cretaceous time during closure of the Manley Basin south of the project area.
Low angle fault contacts between the various rock units indicates extensive thrust stacking and interleaving of the different assemblages as well as possible local interleaving of some units within the assemblages.
| 71 |
| August 2011 Summary Report On The Livengood Project, Tolovana District, Alaska |
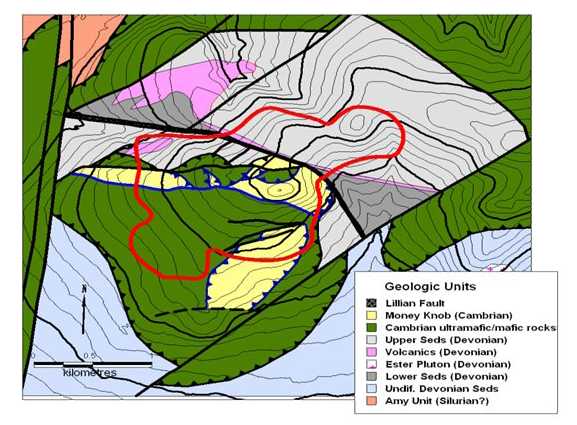
Figure 7.4 Generalized geologic map of the Money Knob area based on geologic work by ITH. Red
outline is the area of grid drilling defining the resource.
Rocks in each of these assemblages have been folded, but overall, they strike east-west to northwest-southeast and dip shallowly to moderately south, consistent with postulated north-directed thrust transport.
Drill intercept patterns and foliation-bedding relations observed in core (Figures 7.5 d and e) indicate that these rocks define a principal recumbent fold and possible parasitic folds segmented by south-dipping thrust and normal faults. Later Cretaceous dikes and sills intrude the sequence, some of which are believed to intrude along these faults.
The structural/stratigraphic sequence described above is intruded by back-arc Cretaceous (91.7 – 93.2 my, Athey and Craw, 2004) multiphase monzonite, diorite, and syenite dikes and sills with equigranular to porphyritic textures. Athey et al. (2004) concluded that the intrusive rocks were the primary host to the gold mineralization. However, subsequent exploration has shown that these rocks are, in part, Devonian volcanics which have undergone extensive alteration along with introduction of mineralization and associated quartz and quartz-carbonate veins. Narrow (<1 m), possibly late stage, dikes are composed of feldspar porphyry, and aplitic felsic rocks without biotite (Figure 7.5). Thicker dikes are biotite monzonite. Mineralization is, at least partially, associated spatially and probably genetically with the dikes.
| 72 |
| August 2011 Summary Report On The Livengood Project, Tolovana District, Alaska |
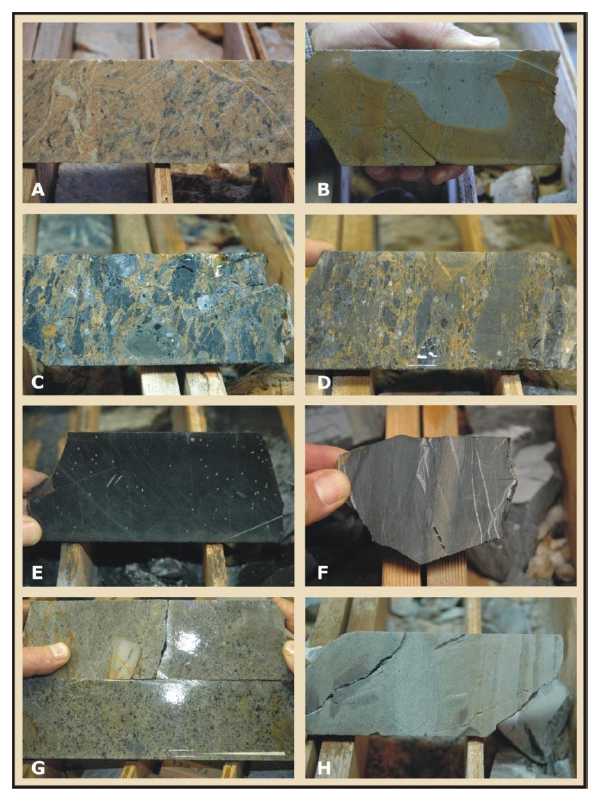
Figure 7.5 Photographs of Key Rock Types at Livengood ProjectA)Ultramafic rock with carbonate alteration (yellow-brown); MK7-20, 13.5 m; B) siltstone with carbonate and pyrite knots. Brown color is oxidation. MK 07-18, 8.5 m C) sedimentary conglomerate; at least some clasts appear to be rip-upclasts of similar sedimentary rocks; brown color is after introduced carbonate; MK07-18, 41.2 m; D) sedimentary conglomerate with rip-up clasts of similar sedimentary rocks; brown color is after introduced carbonate; MK07-18, 57.7 m; E) argillite with pyrite; MK07-20, 222 m; F) argillite with siltstone band; MK07-18, 280 ; G) tuff showing lithic fragments; MK07-18, 190 m, 0.23 – 0.75 g/t Au; H) fine-grained tuffaceous sediment; MK07-20, 151.5 m.
| 73 |
| August 2011 Summary Report On The Livengood Project, Tolovana District, Alaska |
The structural architecture of the project area is characterized by fold-thrust patterning, apparently overprinted by local, minor normal offset along primary normal faults or reactivated thrust faults (Figure 7.7) and a possible second fold event. Apparent upright open folds have axes that strike NW and plunge gently in that direction. Later faults include the Lillian and the Myrtle Creek.
Thrust faults appear to lie in two principle dip orientations; subhorizontal and low to moderately south-dipping. Undulatory subhorizontal thrust faults appear to define the primary thrust surface separating the Cambrian ophiolite sequence from underlying Devonian sedimentary and volcanic sequence. These rocks and their low angle thrust contact appear to be segmented and offset by low to moderately south-dipping thrust faults. In some instances, these south-dipping structures display apparent normal offset. Details of this patterning are currently being evaluated but possible interpretations include: 1) post-thrusting tectonic relaxation resulting in minor normal offset on reactivated thrust surfaces; 2) the existence of a late-stage extensional tectonic event; or 3) some, as yet, poorly understood complex relation between faults. Correlation of particular faults from one drill hole to another is subject to different possible interpretations. Key points that need to be resolved, if possible, relate to distinguishing low angle and south-dipping structures and the relative timing of these features.
The Lillian Fault is a northwest trending, steeply south-dipping fault that is characterized by a wide zone of sheared sedimentary and dike rocks that separates the property into two domains. To the south, the structural and stratigraphic sequence is well-defined consisting of gently south-dipping sedimentary and volcanic stratigraphy and thrust faults. These rocks host the Core Zone and surrounding mineralization.
To the north of the Lillian Fault, the upper Cambrian ophiolite sheet is not preserved and the upper sedimentary sequence is much thicker than the sequence preserved south of the Lillian Fault. Immediately to the north of the Lillian fault the stratigraphy dips very steeply to the north and strikes parallel to the Lillian Fault suggesting that movement on the fault was reverse at some time. The mineralized area north of the Lillian fault is known as the Sunshine Zone, where mineralization is related to a dike swarm in the steeply dipping sedimentary and volcanic rocks.
Immediately south of the fault, the axis of a north-vergent, major recumbent fold is subparallel to the strike of the Lillian Fault. This implies that, during the early history of the fault, there may have been steep reverse movement followed by later collapse and normal offset with down drop to the south. At present, subhorizontal lineations are common on faults in and around the Lillian Fault suggesting possible late strike-slip movement. Regional Mesozoic to Cenozoic dextral slip on the Tintina-Kaltag Fault system to the north of Livengood may support an interpretation of late dextral motion on the Lillian Fault.
| 74 |
| August 2011 Summary Report On The Livengood Project, Tolovana District, Alaska |
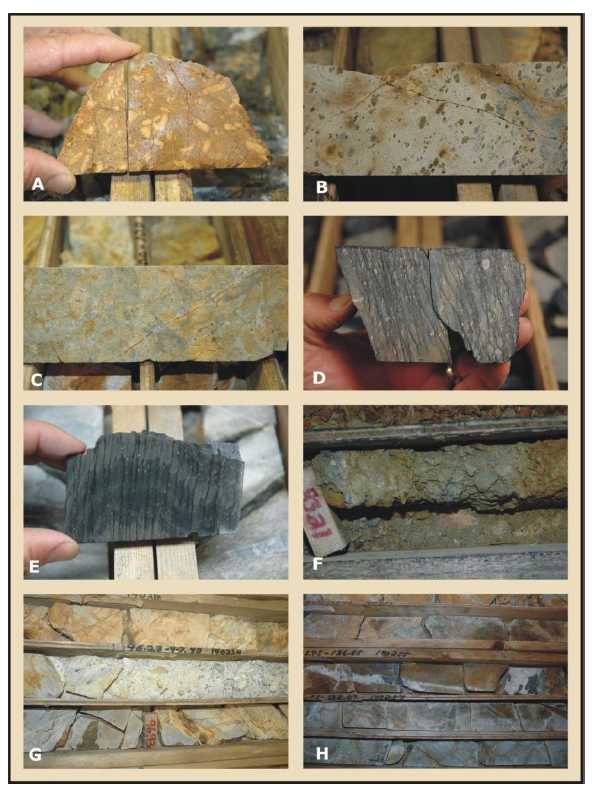
Figure 7.6 Photographs of Key Rock Types and Mineralization Features
A) Porphyry dike; MK07-18, 41.2 m; 1.01 g/t Au.B) amygdaloidal volcanic, presumably a flow, with possible Na alteration; MK07-18, 152-189 m.C)silicified volcanic breccia; MK07-18.D) argillitewith more silty band and coral hash; note the shearing which is approximately 30oto bedding; MK07-18, 288.4 m.E)axial planar cleavage on fold nose in interlayered argillite – silty argillite; MK07-18,296.11 m.This type of feature supports the fold-thrust interpretations of the cross section shown inFigure 10.F)fault; broken siltstone fragments in clay gouge/shear zone; this is part of an ~8m intervalwhich contains 2 – 22.4 g/t Au; MK07-18, 77.9 – 86.08 m.G)broken rock in shear zone withinmineralized interval. The material in the photo includes portions of sample intervals that contain 15-16.2 g/t Au; MK 07-18, 96.93 m.H)narrow mineralized quartz-arsenopyrite vein in silicified volcanic,contains 13 g/t Au and 35,900 ppm As; MK07-18, 136.5m.
| 75 |
| August 2011 Summary Report On The Livengood Project, Tolovana District, Alaska |
To the west of the deposit, the approximately north-south Myrtle Creek Fault (Figure 7.2) is mapped as having strike-slip offset by early workers and west-side-down, normal offset by Athey and Craw (2004) who postulate that offset along this fault influenced the paleo-drainage system of the area. Based on a number of lines of evidence, they propose that Livengood Creek used to flow to the northeast. Capture of the stream by the Tolovana River, and reversal of flow could have been related, in part, to movement along the Myrtle Creek Fault (Karl, et al., 1987; Athey and Craw, 2004). The origin and relationship of this fault to other structural elements in the area is not understood. It lies in an anomalous direction, but also extends for several 10s of kilometres to the south and a lesser distance to the north. This fault is not known to affect mineralization and is peripheral to the area of interest at Money Knob.
Immediately to the south of Livengood, the early to middle Cretaceous Manley Basin is preserved as a fold thrust sequence. Asymmetric overturned folds indicate a northern vergence direction to this deformation event. The precise age of the deformation is not well constrained but the youngest fossils in the basin are Aptian (125 – 112 my) and the sequence was folded and thrusted prior to the emplacement of the 90Ma monzonitic intrusions (Reifenstuhl et al., 1997). Because rocks of the Livengood Terrane at Livengood lack structural markers, it is not possible to determine if the fold-thrust deformation and closure of the Manley Basin impacted the older Livengood sequence. However, given the close spatial proximity of the two sequences and the fact that they are in thrust contact elsewhere, it seems likely that the Cretaceous deformation event affected the Livengood area. The extent to which thrust deformation at Livengood is Cretaceous or earlier (Permian), and which rocks were affected at which time is currently being evaluated by ITH geologic staff. In addition, there is the possibility that multiple thrust events are overprinted by one or, possibly more, extensional events. As the Livengood project advances, structural interpretations will continue to mature and some structural interpretations may change as more information becomes available.
| 7.3 | Geological Interpretation |
Geologic interpretation at Livengood depends on surface information gained through mapping and examination of outcrops, exposures in road cuts, and trenches and subsurface data from diamond drill core and RC drill chips. Drill core provides clear macroscopic visual information on rock type and structural features. RC chips also provide visual information on rock type, but no structural information. In core, the orientation of structural elements (joints, faults, veins, contacts, etc) are measured and used to help understand the relative relations of structural components. Visual examination of core is used to assess rock type and alteration. Petrographic examination of select samples has helped determine alteration mineralogy and relative timing of successive alteration events.
| 76 |
| August 2011 Summary Report On The Livengood Project, Tolovana District, Alaska |

Figure 7.7 Interpretive Sequence of North-South Sections – Structural Relations at Surface and
Drill Core
The details and sequence of the events shown here are partly the interpretations of Klipfel (Klipfel, et al., 2010b). ITH staff geologists are currently developing new hypotheses concerning the relative sequence and suggest that normal faulting has played a role in development of the structural architecture. One possibility is that the Cambrian ophiolite sequence was thrust in the Cretaceous, possibly contemporaneous with the closure of the Manley Basin to the south of Livengood.
| A) | Devonian volcano-sedimentary sequence is deposited. Pink – volcanics; light gray – upper sediments; dark gray – lower sediments; blue-green – other sediments likely to be present in the Devonian sequence, but not yet identified in outcrop or drill holes. | |
| B) | A compressional event (heavy black arrows) causes initial asymmetric folding typical of early stages in the development of a fold-thrust belt. Dashed line shows where incipient thrust truncation will develop. | |
| C) | Cambrian ophiolitic basalt, ultramafic rocks (serpentinite), and gabbro (green) along with tectonic thrust wedges of chert (Money Knob) and other sediments (pale yellow) are thrust over the folded Devonian volcano-sedimentary sequence. The thrust surface is undulatory but overall is subhorizontal in orientation. ITH geologic staff is currently attempting to establish if this event happened in the Cretaceous as part of the deformation event that impacted the Manley Basin to the south or if it is the product of an earlier, possibly Permian deformation event. Dashed lines show where the next stage of faulting occurs. | |
| D) | Possible continued thrusting causes thrust stacking along structures that dip 30-45 degrees. Earlier folds and the Cambrian-Devonian thrust surface are segmented with reverse offset. |
| 77 |
| August 2011 Summary Report On The Livengood Project, Tolovana District, Alaska |
| E) | Tectonic relaxation after thrusting or a tectonic extensional event following fold-thrust compression allows for normal offset, particularly along some pre-existing faults, particularly the most recent thrust faults shown in D. | |
| F) | Cretaceous dikes (red) of various composition and crystalline character infiltrate the region, particularly along pre-existing faults that dip 30-45 degrees. Dikes intrude all rock types and generally do not occur along the earliest thrust surface that separates the Cambrian ophiolite sequence from the Devonian volcano-sedimentary sequence. | |
| G) | Erosion to the current topography removes much of the over-thrust Cambrian ophiolitic sequence. Also, other faults such as the Lillian Fault (steep fault at far right) may have formed during or after extensional tectonism. This fault separates like rocks but with different orientations. |
In addition, rock composition is determined for RC and core samples through use of a portable XRF device (Thermo Fisher Scientific NitonTMXLT3) and multi-element ICP analysis, respectively, which provide a quantitative measure of select elements. Analysis of these data utilizing the relative abundance and ratios of various immobile elements enables discrimination of Devonian volcanic from Cretaceous intrusive rocks as well as the Upper and Lower sedimentary assemblages. Procedures used by ITH for rock type discrimination rely on consistency between visual and chemical assessment of rock type. These procedures are described more fully in section 13.2.
At the district scale, thrust stacking of rock assemblages (Amy Creek, Cambrian ophiolite, Devonian sedimentary and volcanic rocks) is reasonably well understood. Drilling reveals that there are numerous local fold and thrust complications which are only partially delineated at this stage. Faults and fractures produced during fold-thrust deformation, along with possible overprinting extensional deformation, localized dikes and channelled auriferous hydrothermal fluids. Gold mineralization largely appears to be controlled by, and is spatially related to, this fault architecture. The broad envelope of gold mineralization encloses and lies parallel to axial planes of thrust-related recumbent folds suggesting that mineralization occupies a broad ‘damage zone’ related to the fold-thrust architecture. Patterning in the resource block model is consistent with this interpretation.
In detail disseminated mineralization appears to be controlled by proximity to dikes and host lithology. Mineralization spatially associated with dikes appears to occur within ‘damage zones’ related to the south-dipping faults Structural measurements in core indicate that dominant orientation of dikes and faults is east-west with dips 30-50 degrees to the south. Many of the dikes are in faults or are bounded by faults suggesting that they, at least partially, follow the faults. This pattern of partial coincidence between dikes, faults, and mineralization envelopes reinforces the interpretation that the dikes and faults are important controls for mineralization. Host rock plays an equally important role in localizing mineralization; in addition to dikes, the Upper Sediments and Main Volcanics are preferentially mineralized; in the case of the Upper Sediments possibly due to greater permeability of the sandstone-dominated section. The dikes, Upper Sediments and Main Volcanics are generally competent lithologies that underwent brittle failure during deformation, enhancing both permeability and the formation of quartz-carbonate veining, which carries higher grade mineralization.
| 78 |
| August 2011 Summary Report On The Livengood Project, Tolovana District, Alaska |
Sections 428625, 428850, 428925, and 429675 illustrate the control of mineralization by both host rock and the combination of moderately south dipping dikes and faults (Figures 7.8 – 7.12). Although it is not possible to reliably correlate individual dikes between the drill holes on these sections, it is clear that the 30-50 degree southerly dip of the dikes and associated structures is compatible with the southerly dipping zones of mineralization. Figures 7.7 illustrates the complexities of thrust and normal fault interpretation and shows the southerly dip of higher grade zones in yellow and red. Figure 7.8 illustrates both the southerly dip of the overall mineralized envelope, and the preferential mineralization of the Upper Sediments and the Main Volcanics, especially the latter unit.
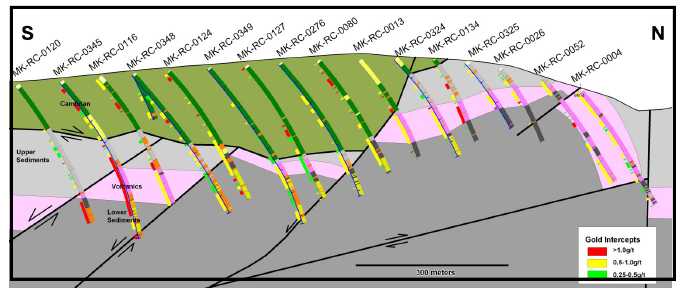
Figure 7.8 N-S Section 428625E
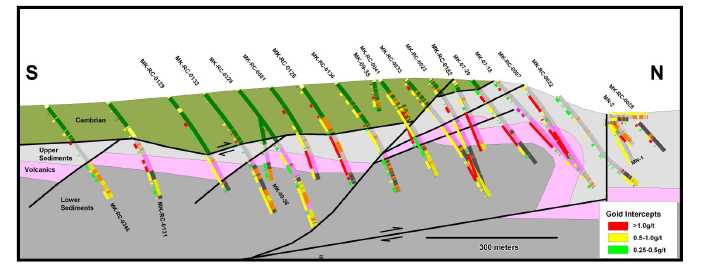
Figure 7.9 N-S Section 428850
| 79 |
| August 2011 Summary Report On The Livengood Project, Tolovana District, Alaska |
Figure 7.9illustrates the general southerly dip of mineralization and how it lies along both the stratigraphic and structural grain.
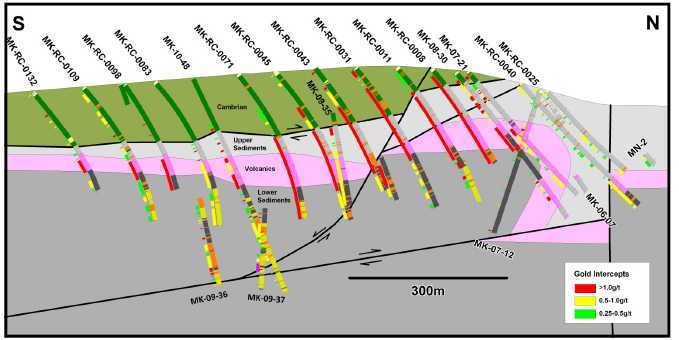
Figure 7.10 N-S Section 428925
Figure 7.10 illustrates the pattern of mineralization reflecting structural and stratigraphic controls.
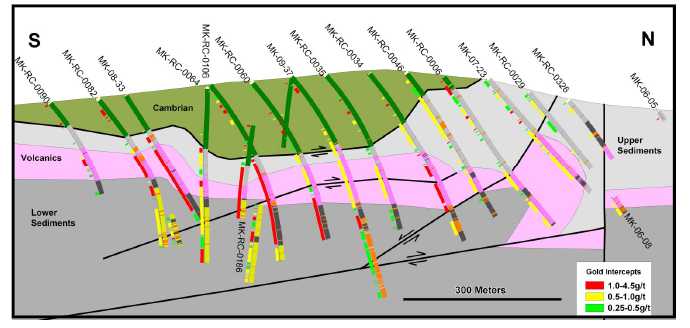
Figure 7.11 N-S Section 429075
| 80 |
| August 2011 Summary Report On The Livengood Project, Tolovana District, Alaska |
![]()
Figure 7.12 N-S Section 429675
Figure 7.12illustrates the pattern of mineralization reflecting south-dipping structural and stratigraphic controls south of the Lillian Fault (left half of section). In the Sunshine Zone (right half of section) the mineralization in the Upper Sediments follows the moderately south dipping attitude of the dikes (orange on drill hole traces) and is nearly perpendicular to bedding.
| 7.4 | Mineralization |
Historically, the Livengood district has been known for its >500,000 ounce placer gold production; many of the drainages which fed the placer gravels are sourced from Money Knob and the associated ridgeline. Historic to near recent prospecting in this area revealed gold-bearing quartz veins, generally associated with dikes and sills of monzonitic and syenitic composition. These intrusive rocks, with their reduced magma type and porphyritic to brecciated textures, as well as common arsenopyrite, are characteristics similar to those of deposits elsewhere in the Tintina Gold Belt (e.g. Brewery Creek and Donlin Creek; McCoy, et al., 1997; Smith, 2000). However, no lode production has taken place at Money Knob.
Over the past 35 years, exploration of the area by various companies has included soil surveys by Alaska Placer Development, Cambior, AGA and ITH, and revealed a 6 x 2 km northeast-trending anomalous area in which a 2.2 x 1.5 km area (~25% of the anomaly area) forms the locus of current exploration interest (Figure 7.12). Despite drilling of 680 exploration holes to April 16, 2011, this area has been only partially drill tested. At this time, the mineralization shows local fault and contact boundaries such as the Lillian Fault, but overall remains at least locally open in all directions, especially to the southwest and at depth.
| 81 |
| August 2011 Summary Report On The Livengood Project, Tolovana District, Alaska |
Drilling since 2003 by AGA and ITH has resulted in identification of an indicated and inferred gold resource interpreted to be part of a large IRGS deposit, the details of which are discussed further in section 14.
Disseminated gold mineralization occurs throughout altered rock associated with introduced arsenopyrite and Fe-sulfides. Locally in the more competent sandstone and volcanic lithologies gold also occurs locally in multi-stage quartz, quartz-carbonate, and quartz-carbonate-sulfide veins and veinlets. Four contiguous principle zones of mineralization have been identified: the Core Zone, Sunshine Zone, Tower Zone, and Southwest Zone (Figure 7.13). Gold mineralization in the Core and Southwest Zone preferentially occurs in the Devonian volcanics, Cretaceous dikes, and Upper Sediments but also occurs in the Lower Sediments as well as locally in the overthrust ultramafic rocks, primarily where dikes are present. Overall, the broad envelope of mineralization dips south along with the dikes and faults.
Better gold values (>1 g/t) tend to be associated with the Devonian volcanics, Cretaceous dikes, dike margins and in broad zones within adjacent volcanic and sedimentary or mafic-ultramafic rocks where quartz-carbonate veining is present. Visible gold occurs locally, particularly in quartz veins and with isolated coarse blebs of arsenopyrite and/or stibnite.
In contrast to the Core Zone, mineralization north of the Lillian Fault within the Sunshine and Tower Zones is hosted dominantly in Upper Sediments. In this zone, mineralization is related spatially to swarms of dikes which appear to dip moderately to the south in a package of sediments that dips steeply to the north. Disseminated sulphides occur in the Sunshine Zone as in the Core Zone, but two things distinguish it from other parts of the deposit. The first is the presence of more abundant thin quartz veins (0.5 to 40 mm) with visible gold and distinct sodium enrichment, most likely the product of widespread albite alteration.
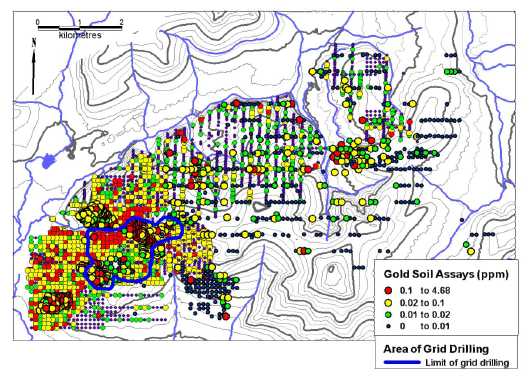
Figure 7.13 Plot of Gold Values in Soil Samples
| 82 |
| August 2011 Summary Report On The Livengood Project, Tolovana District, Alaska |
In the deposit as a whole gold is strongly associated with arsenic and, locally, antimony. Gold grains typically occur within and on the margins of arsenopyrite and pyrite, and locally with stibnite. Other metallic minerals present in minor amounts include pyrrhotite, and marcasite. Trace amounts of chalcopyrite and sphalerite are observed in thin section and locally in core. Molybdenite has been reported by previous workers.
Mineralization appears to be contiguous over a map area approximately 2.5 km2 and the 0.1 g/t grade shell averages 280m thick and ranges up to 510m thick. On the south side of the Lillian Fault, individual mineralized envelopes are tabular and follow lithologic units, particularly the volcanics, or lie in envelopes that dip up to 45 degrees to the south and follow the structural architecture and dikes. On the north side of the Lillian fault mineralization is similar in style and orientation, but more widespread hosted in steeply dipping Upper Sediments. Interestingly, visible gold has been noted more often in Sunshine Zone mineralization north of the Lillian Fault.
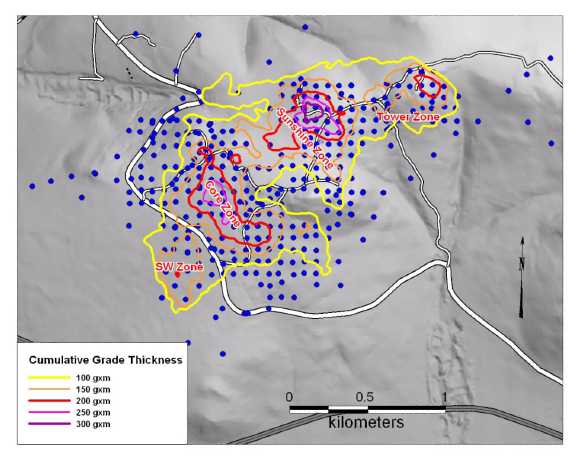
Figure 7.4 Cumulative Gold Grade Thickness for Block Model – Money Knob
| 83 |
| August 2011 Summary Report On The Livengood Project, Tolovana District, Alaska |
| 7.5 | Alteration |
Rocks of Livengood have undergone multiple stages and styles of alteration. As increased drilling reveals a wider range of subsurface material, complex overprinting and spatial relations for different stages of alteration are becoming apparent. The three principle alteration styles, identified by each stage’s principal alteration mineral, are biotite, albite, and sericite. Local smectite-illite alteration widespread carbonate is also present. Biotite alteration is early and overprinted by albite alteration, which is, in turn, overprinted by sericite alteration (see Fig. 7.15 A).
Biotite alteration consists of fine-grained remnant patches of secondary biotite in sedimentary, volcanic, and dike rocks or as phlogopite (phlogopitic biotite?) in mafic and ultramafic rocks (Figures 7.14 and 7.15). Pyrrhotite and quartz accompany the biotite. Arsenopyrite is present in rocks with this type of alteration, but timing of the arsenopyrite relative to the alteration is not clear. Macroscopically, the secondary biotite renders a weak to dark brown hue to the rock or margin to some veinlets. All rock types have been affected by this stage of alteration, however, secondary biotite and accompanying pyrrhotite are observed only as remnant patches in local intervals in some drill holes where subsequent alteration stages have not obliterated it.
Albite alteration occurs locally in volcanic, sedimentary, and dike rocks south of the Lillian Fault and is widespread in the Upper Sediments in the Sunshine Zone north of the Lillian. Albite alteration overprints biotite alteration. Secondary albite occurs as intergrown radiating plumose to acicular sheaves and rosettes that locally replace all previous rock textures (Figures 7.14 and 7.15). Albite is accompanied by intergrown fine-grained dark gray to black patches and grains of quartz. This quartz is cryptocrystalline with an almost cherty character. The dark color may be from included carbonaceous material (Sillitoe, 2009). Albite alteration is accompanied by disseminated arsenopyrite and pyrite mineralization.
Sericite alteration consists of pervasive sericitization, sericite veins, and quartz-sericite envelopes around quartz±sulfide veins in all rock types. Sericite cross-cuts and/or replaces all previous alteration minerals, and locally appears to be developed from destruction of secondary biotite. Pyrite and arsenopyrite accompany this stage, some of which may result from pyritization of biotite-stage pyrrhotite. In mafic and ultramafic rocks, tremolite and local fuchsite are the dominant sericite-stage phyllosilicates. In addition to the silica accompanying albite alteration, fine-grained quartz is widespread associated with sericite . This form of silica is rarely observed macroscopically due to other more readily apparent alteration minerals. Sericite-stage silica also occurs as the inner zone of centimetre-scale alteration selvages around narrow fractures.
Smectite-illite alteration has been observed in a number of locations, generally in and around brittle fault zones, but is not as widespread as the albite and sericite alteration stages. It is characterized by bleaching of the affected rocks and strong swelling and consequent disintegration of core samples from these zones. The alteration has been observed most commonly in sedimentary rocks and dikes. Pyrite and arsenopyrite are disseminated through the alteration and gold grades of several hundreds of ppb are common.
| 84 |
| August 2011 Summary Report On The Livengood Project, Tolovana District, Alaska |
Carbonate alteration consists of at least three styles of introduced carbonate: 1) clear but fine-grained scaly patches and flakes throughout the rocks; 2) fine-grained cloudy carbonate patches; and 3) clean large euhedral rhombs and clusters of rhombs in and adjacent to carbonate-quartz-sulfide veins. Some very fine carbonate is brown in color. It is not clear whether this is a natural color or a product of oxidation or overgrowth and incorporation of very fine secondary biotite. Macroscopically, some brown carbonate has been mistaken for secondary biotite. A fourth style of carbonate consists of very late calcite veinlets which crosscut all features. These could be the product of late-stage cool hydrothermal alteration or supergene. The vast majority of carbonate appears to postdate biotite, albite, and sericite alteration. Carbonate abundance ranges from scattered flakes to complete replacement, particularly in the mafic and ultramafic rocks. In the sedimentary rocks, it is difficult to determine if some carbonate is redistributed primary carbonate or introduced hydrothermal carbonate. Local marl and limey beds occur in the Devonian sediments. Carbonate apparently consists of dolomite and other Fe- Mg species of carbonate such as siderite and ankerite. Arsenopyrite and pyrite are common in carbonate-quartz veins and veinlets.
| 85 |
| August 2011 Summary Report On The Livengood Project, Tolovana District, Alaska |
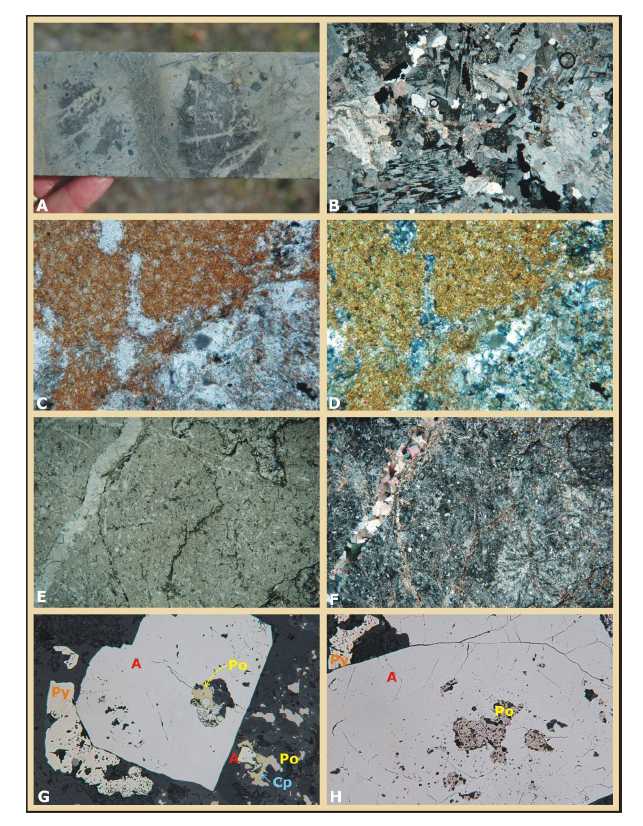
Figure 7.15 Photomicrographs of characteristic alteration among rocks at Money Knob
| 86 |
| August 2011 Summary Report On The Livengood Project, Tolovana District, Alaska |
A)View of core showing relict patches of secondary biotite (dark color) cut by and overprinted by albite(creamy color) and then sericite alteration (gray/green color). 08-33, 190.25.B)rare, relatively weaklyaltered Cretaceous intrusive dike with abundant interlocking plagioclase laths and blocks; Weak sericiteand carbonate alteration are present. Some of the plagioclase may be in the early stages of beingaltered to secondary albite. 09-34, 252.76.C and D)plane and polarized light examples of a patch ofsecondary biotite in Devonian volcanics; sericite and carbonate are also present in the lower rightportion of the photo; 200x; 8-33; 190.25.E and F)A quartz-carbonate veinlet crosscuts albitizedvolcanic rock (MK07-18, 247.5m).G)Large arsenopyrite grain (A) with an inclusion of pyrrhotite (po),and adjacent to pyrite (py). Minor chalcopyrite (cp) occurs in the lower right. 200x, 08-33, 230.55.H)Arsenopyrite grain with contained blebs of pyrrhotite (po) and adjacent pyrite (py). |
| 7.6 | Synthesis of Mineralization and Alteration |
The types of alteration stages and their sequence are consistent with other IRGS deposits and prospects of the Tintina Gold Belt (Newberry and others, 1995; McCoy and others, 1997), strongly supporting the interpretation of Livengood as an intrusion-related system. Although it is possible that each alteration stage is the product of independent hydrothermal events, the mineralogy of each alteration type suggests that the various stages formed as part of an evolving, cooling system with an initial higher temperature biotite and pyrrhotite assemblage overprinted by subsequent lower temperature assemblages. This patterning can also be interpreted as consistent with the chemical evolution of hydrothermal fluids emanating from an intrusive source.
Gold shows a very strong association with arsenic (correlation coefficient of 0.8) . As arsenopyrite is the only arsenic bearing mineral of any significance and it is present, and apparently stable, within the biotite, albite, sericite, and carbonate alteration assemblages, it follows that gold mineralization likely occurred contemporaneously with the formation of the alteration minerals.
| 87 |
| August 2011 Summary Report On The Livengood Project, Tolovana District, Alaska |
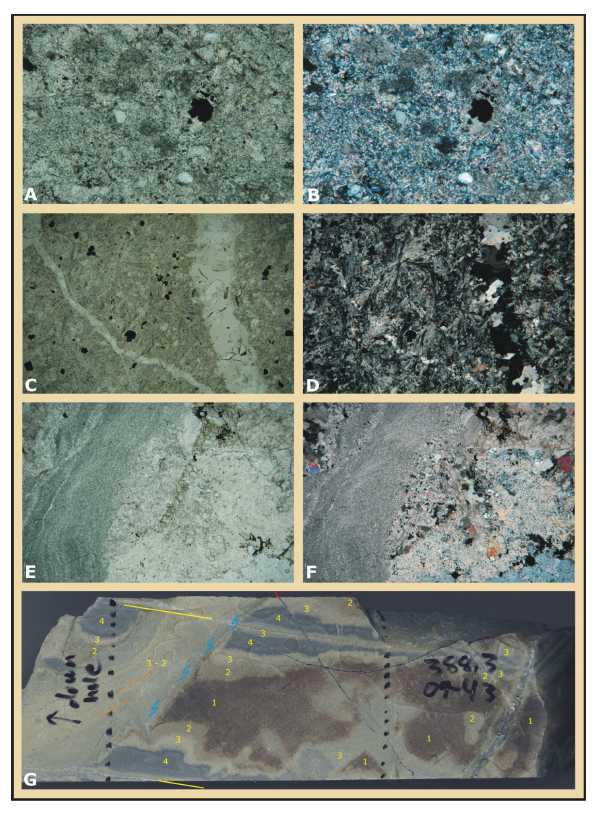
Figure 7.16 Photomicrographs of Characteristic Alteration – Money Knob
| 88 |
| August 2011 Summary Report On The Livengood Project, Tolovana District, Alaska |
A and B)Sericite and carbonate replace a silty phyllite (MK07-18, 76.0m).C and D)A quartz-carbonate veinlet crosscuts albitized volcanic rock (MK07-18, 247.5m).E and F)Carbonate (upper left2/3rds of section) and tremolite (lower right 1/3 of section) replace mafic rock. 25x; 02-21, 19.35.G)Core showing a complex sequence of alteration types which generally mimic the larger scale assessmentof alteration styles. Zone 1 = secondary biotite-carbonate±sericite. Zone 2 = Carbonate-sericite withdarker color possibly owing to overprinted secondary biotite. Zone 3 = carbonate-sericite. Zone 4 =sulfide-rich sericite-carbonate. Blue symbol = shear. Orange dashed lines = bedding. The yellow linesindicate quartz-carbonate±sulfides veinlets. Red line indicates quartz-feldspar±carbonate veinlet.From MK09-43, 388.3. |
| 89 |
| August 2011 Summary Report On The Livengood Project, Tolovana District, Alaska |
| 8.0 | Deposit Types |
As described above, gold mineralization at Livengood is spatially linked to diking from the scale of individual dikes to the overall mineralized envelope. Athey, Layer, and Drake (2004) dated both these dikes (91.7 ± 0.4 my) and sericite alteration associated with the gold mineralization (88.9 ± 0.3 my). The proximity of these dates strongly suggests a genetic link, in additional to the spatial coincidence, between the dikes and the gold mineralization. The age of the intrusions and the genetic link between the mineralization and intrusive rocks are typical of those of other nearby gold deposits of the Tintina Gold Belt, which have been characterized as intrusion-related gold systems (IRGS; Newberry and others, 1995; McCoy and others, 1997) and for these reasons Livengood is best classified with them. Among deposits of the Tintina Gold Belt, Livengood mineralization is most similar to the dike and sill-hosted mineralization at Donlin Creek deposit where gold occurs in narrow quartz veins associated with dikes and sills of similar composition (Ebert, et al., 2000).
The gold-arsenopyrite-stibnite metal association hosted, in part, by sedimentary rocks with dikes associated with a thrust fault system is also reminiscent of sediment-hosted disseminated deposits (SHD) of the Great Basin (aka Carlin type deposits). Foster (1968) initially proposed this potential similarity of mineralization types and Poulsen (1996) speculates on the potential for this type of deposit in the Canadian Cordillera, which overlaps the northern portion of the Tintina Gold Belt. While there are similarities, Livengood lacks prolific decalcification, jasperoid, and a moderate to strong Hg association which are important characteristics of SHD-type deposits
| 90 |
| August 2011 Summary Report On The Livengood Project, Tolovana District, Alaska |
| 9.0 | Exploration |
| 9.1 | Past Exploration |
Several companies have explored the Livengood area as outlined in Section 6 (History). That work identified a sizeable area of anomalous gold in soil samples and intervals of anomalous gold mineralization in drill holes (described in previous sections).
ITH advanced the soil sampling coverage in 2006, 2007, 2009 and 2010 by collecting an additional 843 samples. These samples helped improve definition of anomalous gold in soil on the southwest side of Money Knob and to the northeast from Money Knob.
ITH undertook drilling of the surface geochemical anomalies in 2006 with favourable results. In 2007, the area was drilled sufficiently to produce a resource evaluation (Giroux, 2007; Klipfel and Giroux, 2008a) and a program for 2008 was planned that would further that evaluation. Drill results through September 27, 2008 were used as part of a revised resource evaluation in October, 2008 (Giroux, 2008; Klipfel and Giroux, 2008b). Geochemical results received and drilling completed after that date were used for a subsequent resource update (Giroux, 2009; Klipfel and Giroux, 2009). The 34 reverse circulation holes drilled in the winter of 2009 were primarily infill holes. Data from these holes were applied to a new resource estimate which also incorporated advancements in modeling the deposit (indicator kriging) and resulted in upgrading and enlarging the resource estimate to 4.04Moz and 3.6Moz (0.5 g/t gold cutoff) in the indicated and inferred categories, respectively (Klipfel, et al., 2009a). A recent estimate (ITH news release dated April 11, 2011) which included all drilling completed through the end of 2010 stated resources of 4.3Moz measured, 3.2Moz indicated, and 2.7Moz in the inferred category (at 0.5 g/t gold cutoff). Drilling completed in the first half of 2011 (to May 31, 2011) is included in a new resource update and reported in this document.
| 9.2 | Current Exploration |
ITH has continued step-out and infill drilling on a 75m grid pattern, and infill drilling on a 50m grid pattern in the core of the deposit through first half of 2011. This report includes all results for 2011 drilling as received through May 31, 2011. This data does not include results from the current summer drill program. This data has been used in a resource estimate reported in Section 14, and includes further advances in metallurgical understanding and improved cost estimates which have been incorporated into the estimation process. These results are presented in section 13 and 21.
ITH is currently completing an IP/Resistivity survey covering the deposit and gold-anomalous soil geochemistry to the northeast (Fig.7-13), where loess and frozen ground have prevented complete geochemical coverage. The objective of the survey is to establish the geophysical signature of the deposit and identify similar signatures elsewhere in the district to prioritize exploration drilling.
| 91 |
| August 2011 Summary Report On The Livengood Project, Tolovana District, Alaska |
| 10.0 | Drilling |
| 10.1 | Past Drilling |
All of the companies that have explored at Livengood in the past, except Cambior, have undertaken drill programs to evaluate the district. AGA initially, and ITH later, focussed drilling on possible mineralization beneath and down dip from the surface soil anomaly area (Figure 11.1).
Drilling since 2003 by AGA and ITH is summarized inTable 10.1. Drilling in 2003 by AGA consisted of 1,514 m of vertical and angled reverse circulation (RC) drilling in eight holes. It identified broad zones of gold mineralization. Drilling in 2004 by AGA consisted of 654m of HQ coring in 4 diamond drill holes designed to test for gold beneath the thrust fault at the base of the Cambrian rocks. These holes were up to 1.7 km to the west of 2003 drill holes. They identified thick zones of gold mineralization in Devonian rocks beneath relatively barren, thrust-emplaced Cambrian ophilite (MK-04-03;96m at >0.5 g/t in 2 intersections). These results highlighted the fact that significant mineralization could exist beyond the limits of the main soil anomaly, particularly in blind locations beneath thrust faults.
No drilling took place in 2005.
In 2006, ITH drilled 1,230m of core (HQ) in 8 holes and continued to demonstrate the presence of mineralization over a broader area. The 2007 campaign consisted of 15 diamond drill holes for a total of 4,411m (Table 10.1) . These holes focused on extending and defining the volcanic-hosted mineralization first recognized in MK-04-03. However, as drilling progressed, it became clear that although mineralization is strongest in the volcanic rocks, it occurs in all rock types at Money Knob (Figure 10.2).
Based on favourable results in 2007, the 2008 program consisted of 29,150m of RC and 2,187m core drilling in 109 and 9 holes, respectively. The drill program was designed to improve definition and expand the resource calculated early in 2008 based on 2007 drill data. The 2008 drill program did not identify limits to mineralization in any direction. Instead, a thicker mineralized zone was identified (up to 200m) In addition, this campaign highlighted the fact that mineralization occurs in all rock types, not just in Devonian volcanic rocks, indicating potential more widespread mineralization than envisioned prior to the 2008 drill program.
The 2009 and 2010 programs: 1) helped fill in gaps within the drilling grid and enabled increased continuity of information for improved resource estimation, and 2) discovered and delineated the Sunshine and Tower Zones. Most of the deposit has been drilled on a nominal 75m grid spacing; beginning in 2010 infill drilling in the center of 75m grid squares brings the nominal spacing down to 50m for most of the Core and Sunshine Zones, moving a significant portion of the deposit to measured resources..
| 92 |
| August 2011 Summary Report On The Livengood Project, Tolovana District, Alaska |
| 10.2 | Current Drilling |
The resource estimate presented in this report is based on drilling completed by ITH through May 31, 2011. Further drilling that has been completed this year is not incorporated in to the resource estimate or the PA.
Table 10.1 Summary of AGA and ITH Resource Drilling at Livengood
Year | DDH Holes | m | RC Holes | m | Results |
| 2003 | - | - | 8 | 1,514 | Broad zones of Au mineralization |
| 2004 | 4 | 762 | - | - | Discovered Devonian volcanics as preferential host rock |
| 2005 | - | - | - | - | No drilling |
| 2006 | 7 | 1227 | - | - | Drilled first >100gram meter intersection in Devonian volcanics |
| 2007 | 15 | 4,411 | - | - | Defined continuity of volcanics and mineralization. Discovered first sediment-hosted mineralization |
| 2008 | 9 | 2,187 | 109 | 29,150 | Discovered Core Zone where sericite alteration mineralizes all rock types. Delineated 6.8M oz indicated and inferred resource |
| 2009 | 12 | 4,573 | 195 | 59,814 | Expanded the extent of the mineralization to include the new Sunshine and Tower |
| 2010 | 40 | 13,631 | 198 | 56,550 | Filled in between the Core and Sunshine zones, expanded SW Zone, infill (50m) of Core and Sunshine Zones |
| Winter 2011 | 11 | 3,162 | 48 | 15,162 | Infill and stepout (75m) SW Zone, infill (50m) Core and Sunshine Zones |
| 93 |
| August 2011 Summary Report On The Livengood Project, Tolovana District, Alaska |
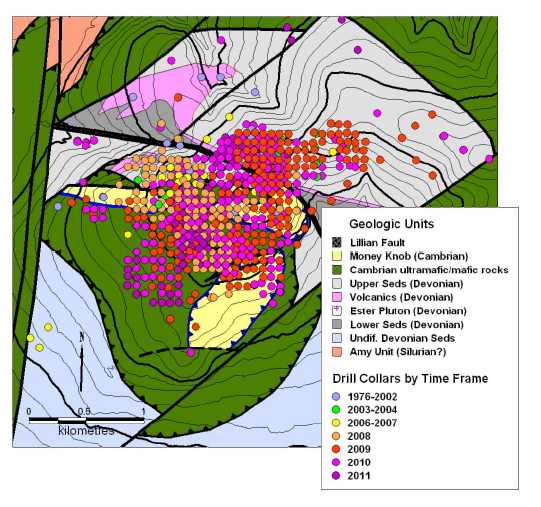
Figure 10.1 Distribution of Drilling in Money Knob Area (by time and company)
| 10.3 | Drill Procedures |
To date, virtually all drill holes at Money Knob have been drilled in a northerly direction at an inclination of -50 degrees for RC holes and -60 degrees for core holes in order to best intercept the dominantly south dipping dikes, faults, veins, and the mineralized zones as close to perpendicular as possible. A few holes have been drilled in other directions as described above. Most holes have been spaced at 75m along lines 75m apart. A few holes are more closely spaced. Surveys of the holes show that with depth, RC holes steepen 10-20 degrees depending upon the length. Most holes have been drilled to depths of 250-350m.
Diamond drill core is recovered using triple tubes to ensure good recovery and confidence in core orientation. Recovery is excellent being greater than 95% over the course of the entire program. The core is oriented using either ACTTM or EZ MarkTM tools. Core is marked so that a continuous line is located along the keel of the core as long as core pieces can be matched continuously from orientation marks. Oriented core yields fault, vein, and contact orientations which permits the definition of these features in two and three dimensional space.
| 94 |
| August 2011 Summary Report On The Livengood Project, Tolovana District, Alaska |
Currently, core oriented with the ACTTM system is reviewed, marked for orientation, and ‘quick-logged’ at the drill rig then boxed prior to transporting it to ITH’s core shed for detailed logging and sampling. This is a relatively new procedure and has been in place since August, 2009. In the past, core was marked for orientation and the entire run placed in split PVC pipe for transport to ITH’s core shed. This custom procedure was implemented to assure minimal breakage or crumbling of core between retrieval from the hole and transfer to boxes by the logging geologist. OriblocksTMare used by the driller to preserve to orientation of core drilled with the EZTMorientation tool. In the core shed core is cleaned, measured, marked for sampling, labelled, and logged, by contract geologists from Northern Associates, Inc.
Reverse circulation holes are bored and cased for the upper 0-30m to prevent down hole contamination and to help keep the hole open for ease of drilling at greater depths. Recovery of sample material from RC holes is done via a cyclone and a dry or wet splitter according to conditions. Three samples are collected at the splitter, (Figure 10.2): one is the interval sample, the second is an equivalent split “met” sample, and a third smaller split of washed chips for logging purposes, which are placed in standard chip trays. Samples are collected in porous polybags that allow retention of sample material and evaporative seepage of water from the sample. The bags are pre-labeled with a unique bar code, the hole number, and depth interval down to 1100 feet (335.28m); below that dept bar coded bags with unique samples numbers are assigned depth and hole number as appropriate.
Drill hole locations are determined by sub-meter differential GPS surveys at the drill collar. Initial azimuth of drill hole collars are measured using a tripod mounted transit compass in conjunction with a laser alignment device mounted on the hole collar (Figure 10.2).
Down hole surveys of road-accessible core and reverse circulation drill holes are completed using the Gyro-ShotTM survey instrument manufactured by Icefield Tools Corporation. Precision and accuracy of this method was assessed in 2008 through a series of duplicate surveys using this instrument and by comparison in holes surveyed by the EZ-ShotTM (magnetic) borehole surveying device. Results of surveys and duplicate tests show normal minor deviation in azimuth and inclination with reproducibility within a close margin of error. In 2009, a duplicate survey performed by the Gyro-Shot instrument measuring the same hole twice (MK-RC-0195 to 985 feet) and a tandem survey performed by running two Gyro-Shot instruments simultaneously on the same probe assembly (MK-RC-0178 to 900 feet), demonstrated close replication and agreement between the surveys. The 3-D coordinates at the maximum depth of the paired surveys plot to within 1% of the coordinates in the corresponding survey relative to length of hole surveyed. Mr. Carew has reviewed the data, methodology and results of this analysis and concurs with these conclusions (Carew, et al., 2010). Drill hole surveys were completed by Northern Associates, Inc. and were observed in the field by a Qualified Person (Klipfel, et al., 2010b). Down hole surveys of core holes accessed by helicopter are competed using an EZ-ShotTM or equivalent down hole magnetic/inclinometer survey tool.
The RC drilling in 2003 was conducted by Layne Christiansen Company using an MPD 1500 Track RC drill. Drilling in 2004 was also by Layne using a CS1000 core drill. No drilling took place in 2005. From 2006 through June 2011, diamond core drilling was conducted by AK Drilling Inc, Frontier Exploration, Inc. and Layne Christensen and RC drilling was by AK Drilling, Inc., Layne Christensen, and T and J Enterprises.
| 95 |
| August 2011 Summary Report On The Livengood Project, Tolovana District, Alaska |
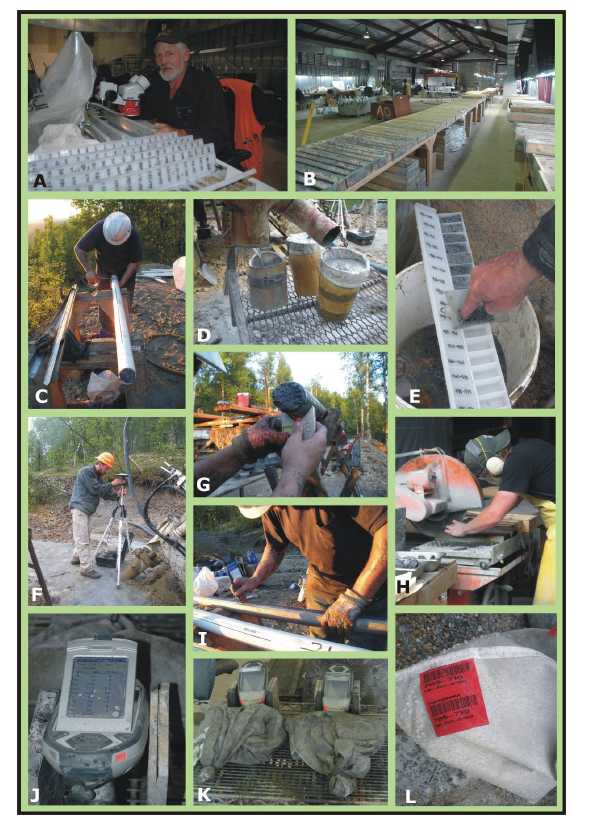
Figure 10.2 Photos - Various Exploration Functions
| 96 |
| August 2011 Summary Report On The Livengood Project, Tolovana District, Alaska |
| A) | ITH geologist logging RC chips with a binocular microscope. |
| B) | View of ITH’S core shed and core boxes in the foreground. |
| C) | Driller taping core securely in PVC holder/carrier. Core barrel parts are on the left. |
| D) | RC drilling chips are split into 3 collection points, the sample (foreground bucket), the met sample(background bucket), and the visual chip sieve for logging purposes (left). |
| E) | A representative sample of RC chips is retained in chip trays with individual compartments for each5’ interval. |
| F) | Drill hole collars are surveyed with a differential GPS instrument. |
| G) | A drill helper marks the core to indicate its oriented position. |
| H) | Drill core is sawn in half with a diamond saw at the core shed. |
| I) | A driller marks a line along the base of the core to indicate its oriented position. |
| J) | NITONTMportable XRF instrument records trace-element abundances prior to shipment of RC samples to thelab. |
| K) | Trace elements are measured by two NITONTMportable XRF instruments for all RC samples prior toshipment to the lab for assay and multi-element ICP analyses. |
| L) | Example of porous polybag which allows the escape of water, but not sample material. Pre-printedlabels indicate drill hole, depth interval, sample number, and bar-coded sample ID information. |
| 97 |
| August 2011 Summary Report On The Livengood Project, Tolovana District, Alaska |
| 11.0 | Sample Preparation, Analyses and Security |
| 11.1 | Past Sampling |
The sampling procedures of previous companies are not known but the major companies that did the work are known for their conscientious QA/QC protocols. Sample data from past programs are consistent with more recent data generated by AGA and ITH. On this basis, there is no reason to doubt the validity or credibility of samples from Occidental, AMAX, Homestake, or Placer Dome. The similarity of results for each program suggests that sample collection and analytical procedures are sufficiently similar to allow use of their data by ITH in current exploration efforts.
For samples collected by AGA, all soil, stream sediment, rock, and drill sampling was done according to AGA in-house protocols for geochemical sampling. These protocols specified technical procedures for collection and documentation of samples. In general, -80 and -200 mesh material was analyzed for soils and stream sediment respectively. These protocols were reviewed in 2006 as well as AGA’s security procedures and verified that they met or exceeded standard industry practices (Klipfel, et al., 2010b). Sampling procedures remained the same through the course of the 2003 and 2004 exploration programs.
All AGA geochemical samples were secured and shipped to Fairbanks according to AGA protocols for sample preparation (drying, crushing, sieving, and pulverizing) at ALS-Chemex in 2003 and Alaska Assay in 2004. Sample splits (300-500g for rock material; -80 mesh for soil samples) were sent to ALS Chemex in Vancouver for analysis. Analytical methods used were standard 50g fire assay with AA finish and four-acid digestion, multi-element ICP-MS. These are standard analytical packages for the exploration industry and are performed to a high standard. Analytical accuracy and precision were monitored by the analysis of reagent blanks, reference material and replicate samples. Quality control was further assured by the use of international and in-house standards. ALS Chemex is accredited by the Standards Council of Canada, NATA (Australia) and also has ISO 17025 and 9001 accreditation.
AGA reverse circulation drill samples were collected at 1.5m (five-foot) intervals as measured by the driller. Pulverized material from the hole was passed though a cyclone to separate the solids from the drilling fluid and then over a spinning conical splitter. The splitter was set to collect two identical splits each of which weighed 2-5 kg. Representative coarser material was also collected and saved in chip trays for later visual inspection. The split material was put into pre-numbered bags by the drillers’ helpers on site. One of the splits was sent for analysis while the other was retained for future reference. Samples were secured and transported to the sample preparation facility of ALS Chemex in Fairbanks for drying, crushing, pulverization, and splitting. One hundred and twenty gram (120 gram) splits were sent to Vancouver for analysis by standard 50 gm fire assay with AA finish and multi-element ICP-MS for select intervals. The RC chips were logged by project geologists by recording basic information on the lithology, alteration, and mineralization for each sample interval.
AGA’s core material was collected at the drill site and placed in core boxes under the supervision of an experienced geologist and Qualified Person for the purposes of NI 43-101. It was logged for rock type, alteration, and structure with detailed descriptions. Examination of the core logs and core from the four 2004 holes verified the reliability of the logging (Klipfel, et al., 2010b). Sample intervals were determined on the basis of the distribution of veining and alteration with a minimum sample width of 30 cm and the maximum width of 1.52m. Samples were collected to isolate different components of the alteration and mineralization in order to characterize them.
| 98 |
| August 2011 Summary Report On The Livengood Project, Tolovana District, Alaska |
After the samples were marked, the core was sawed in half, and one half sent for analysis. The other half was either kept on site or at AGA’s core storage facility in Fairbanks. The average recovery in the core program was in excess of 90% and there is no indication that poor recovery is an issue in the interpretation of the assay data. Sampling was selective but barren samples were always collected to bracket zones of mineralization so that reliable boundaries could be defined in the intercepts. This core was examined by a QP (Dr. Paul Klipfel) in the course of site visits.
| 11.2 | Current Sampling |
ITH has adopted and continued the sampling protocols used by AGA and described in the previous section, with the exception that all drill holes are sampled from surface to total depth. In addition, ITH has implemented a number of customized steps in their procedures to minimize errors and assure the integrity of sample material. This assures a high level of reliability in the sample data set and assures continuity of methodology, laboratory standards and conventions as well as confidence in the data generated. All core samples are weighed prior to shipping to the ALS-Chemex facility in Fairbanks. These weights are compared to the laboratory received weights to confirm that the samples were logged in correctly. RC samples are collected in pre-numbered, bar-coded bags (Figure 10.2). They are logged-in on-site by ITH using the barcodes to prepare the shipments and ALS Chemex uses the same barcodes to log the samples into their system. The sample weights are recorded at various stages in the preparation process. These procedures minimize labelling and other potential errors and add an extra level of assurance that the sample is tracked correctly and matched with the data generated by that sample.
Since June of 2009, core oriented with the ACTTM tollis examined by a geologist in the original split tube at the drill, the soft structures are documented, then the core is boxed and transported to the core shed for detailed logging, mark-up and sampling. For the 2008 program, core was slid from the core barrel into a half-section of PVC pipe, covered with the other half of PVC pipe, and sealed for transport to the logging shed at ITH’s camp (Figure 10.2). This procedure was effective and minimized disturbance to the core, prevented unnecessary breakage, and minimized crumbling of core prior to logging by a geologist. Core oriented using OriblocksTMand the EzyMarkTMtool is boxed on site by the drill crews and transported for the core shed for detailed logging, mark-up and sampling. Core is sampled by sawing the core in half along the down hole axis of the core with one half sent for analysis.
| 99 |
| August 2011 Summary Report On The Livengood Project, Tolovana District, Alaska |
| 11.3 | Past Procedures |
Soil and drill samples obtained in 2003 and 2004 exploration programs were subject to AGA’s in-house methodology and Quality Assurance/Quality Control (QA/QC) protocols. Samples were analyzed by various methods by different laboratories.
The QA/QC program implemented by AGA met or exceeded industry standards. The program involved analysis of blanks, standards and duplicates. Blanks help assess the presence of any contamination that might be introduced by analytical equipment. Standards are used to assess the accuracy of the analyses, and duplicates help assess the reproducibility or precision of the analytical methods and equipment used.
All sampling campaigns were subject to insertion of blanks and standards at a rate of 1 blank and 1 standard for every 23 samples (total = 2QA/QC samples per 25 submitted samples). Blank samples consist of material known to contain below detection amounts of the metal for which the sample is being tested. Standards consist of sealed sachets of material with a certified abundance of the metal for which the sample is being tested. Standards were purchased from RockLabs and GeoStats.
Duplicate core and rock samples were run from pulp and coarse reject splits along with sample repeats approximately every 20 samples. Duplicate samples were also collected at the drill rig for 2003 RC drilling. Results of AGA’s QA/QC program were reviewed by Dr. Klipfel in 2006 and in his subsequent visits and reports. Overall, the QA/QC samples indicate that sampling and analytical work is accurate and reliable. In 2004, there were two instances of issues with blanks and standards out of compliance with AGA protocols, but these were satisfactorily resolved by AGA. The sample database did not appear to be compromised.
| 11.4 | Current Procedures |
ITH has continued with the QA/QC protocol of AGA as described above and increased the number of control samples (blanks and standards) to 1 in 10. A duplicate split of drill samples are prepared for one in every 20 samples. ITH has undertaken rigorous protocols to assure accurate and precise results. Among other efforts, weights are tracked throughout the various steps performed in the laboratory to assure accurate assignment of results to the appropriate sample (Figure 11.1). ITH weighs all core samples before shipping. They are then reweighed by the laboratory when received and logged in. RC samples are dried and then weighed at the laboratory. Sample reject material is weighed again by the laboratory after the sample aliquot has been removed for pulverization. This tracking of sample weights enables constant verification of quality throughout the preparation process. Key results of this protocol include minimization of sample switches and transcription errors.
All core and RC samples are taken from the drill rig directly to ITH’s core shed. RC and core samples are placed in super sacks, sealed, and palleted for shipment to ALS Minerals’ preparation facility in Fairbanks.
Samples are analyzed by standard 50g fire assay for the gold determinations. All core samples and select RC drilling samples are also submitted for multi-element ICP-MS analyses using a 4 acid digestion technique. All RC samples are analyzed on site for trace elements using a Thermo Fisher Scientific NITON™ portable XRF before shipment to the laboratory (Figure 10.2).
| 100 |
| August 2011 Summary Report On The Livengood Project, Tolovana District, Alaska |
ITH geologic staff has developed a set of decision criteria that compare the NITON™-measured abundance of Cr, Ni, Th, Zr, Mo, and V for discrimination of ultramafic, volcanic, Cretaceous intrusive (dikes), Upper Sediment, and Lower Sediment rocks. These results are cross checked with visual logging and ICP data before a final lithologic determination is entered in the database. The advantage of this type of procedure is that rock types can be more readily and more consistently identified in spite of significant alteration and replacement of original rock textures and minerals. Also, because arsenic correlates strongly with gold, an XRF determination of arsenic abundance has helped ITH anticipate gold-bearing zones before assays are returned. This information has proved constructive for drill planning and execution.
| 11.5 | Data Handling |
Two master project databases are maintained in Microsoft™ Access by ITH, one contains drill hole location, survey, logging, and sample interval data and the second contains all assay information for the samples. As drill holes are completed, data is entered either manually, or through data downloads directly from instruments to the database. Assay information is received electronically from the laboratory and downloaded into the database. Subroutines check for errors and data format consistency.
The creation of sample data for RC drilling begins with pre-numbered sample bags that have drill hole number, sample interval, and sample number printed and bar-coded on a label attached to the bag (Figure 10.2). These bags are used at the drill rig for collection of RC chips into a primary sample, a secondary duplicate sample, and a chip sample for logging purposes (Figure 10.2). Drill core is sawed in half with a diamond saw with half the core going in a sample bag together with a tear off sample ticket preprinted with the sample number, and the other half retained in core boxes and stored on site.
A bar code reader slaved to the NITON™ XRF collects and codes the analytical data by sample number so that data transferred from the NITON™ “gun” to the database remains matched with the sample number. Chip loggers similarly enter information into the logging database while reviewing chips under a binocular microscope with all intervals keyed to the sample interval and sample number (Figure 10.2). These are checked regularly by loggers and rechecked by the senior geologist. Database check and validation tools are also used to detect errors. Core logs are created manually and then the information is entered into a digital format for the database.
Results of technical studies being performed at Livengood, and which will form the basis of the pre-feasibility studies are maintained in a data hierarchy on ITH servers located in the Denver and Fairbanks offices. Tape backup of the data is conducted nightly, with rotation of tapes into offsite storage.
The independent author, Mr. Carew, has reviewed these procedures and observed the data entry process at various steps during site visits. He is satisfied that ITH is diligent in their data management procedures and have check procedures in place that should identify any issues. He has not completed a thorough check or validation of the master project database but is not aware of any issues. Mr. Carew has, however, conducted a data validation check on a random sample (10%) of the subset of drill hole data provided for resource modeling, as described in Section 14.1
| 101 |
| August 2011 Summary Report On The Livengood Project, Tolovana District, Alaska |
![]()
Figure 11.1 RC Flowchart - Samples from Drill Rig to Analytical Results
| 102 |
| August 2011 Summary Report On The Livengood Project, Tolovana District, Alaska |
| 11.6 | Quality Assurance and Quality Control |
Quality assurance and control procedures have been implemented in Livengood resource and exploration drilling programs. These procedures have evolved historically, to assure data quality in the sampling and assaying areas. Beginning in 2010, more detailed quality assurance has been perfumed to examine the relative predictions by RC and core data. Section 11.6.1 presents an update of the results of sampling and assay quality assurance. Work on the comparisons of RC and core data is presented in section 11.6.2.
| 11.6.1 | Sampling and Laboratory Quality Assurance and Control |
The QA/QC data from ITH sampling program has been reviewed in 2011 by Mr. Carew. Analyses of blanks and standards that fall outside of an acceptable range, such as 3x detection limits for blanks or 10% for standards, are flagged for investigation. Unless a suitable explanation, such as a sample switch, can be found, the error is reported to the laboratory and the sample intervals around the questionable sample are rerun. A new certificate is issued by the lab for the reanalysis if the correct values for the standards and blanks are determined. Errors are generally attributable to sample switches, weighing errors and contamination of the first sample in a batch. Multi-element QA/QC is monitored using the compositions of the blank and standard materials.
Duplicate samples are used to assess reproducibility of the laboratory procedures and to ensure that the sampling procedure is representative. Field duplicates (378 from 2007 to 2011) represent equivalent samples collected at the drill rig during the original sampling process and are performed to confirm that the sampling process is representative.Figure 11.2a presents a graphical comparison of the field duplicate data..
Prep duplicates (5173 from 2007 to 2011) are prepared by splitting the whole sample in half at the laboratory, and then subjecting each half to the full sample preparation routine and subsequent analysis These duplicates assess sample homogeneity and confirm that no bias is created during the sample preparation process (Figure 11.2b) compares the prep duplicate results graphically.
Pulp duplicates (5466 from 2003 to 2011) represent multiple assays of the same pulverized sample material to demonstrate that the laboratory procedures are precise and that the pulp material is uniform with errors of mostly less than 10% (Figure 11.2c). Errors greater than 10% are believed to be due to normal nugget effect typical of gold deposits.
As the number of samples has increased with each drilling campaign, it appears that there are local variations in the scale of nugget effect. The result is that some duplicates at higher values of gold (e.g. >3 g/t Au) show higher variance in reproducibility. This issue has been evaluated carefully and it is believed to be the result of normal nugget effect where a grain of relatively coarse gold ends up in one split and not the other, thus producing a high value in one run and a lower value in another. This can be tested by comparing the blanks and standards for that range of samples to verify that these values are accurate and precise (Figure 11.3). Also, reproducibility tends to improve as gold values decrease except as the detection limit is approached (e.g. 0.005 vs. 0.01 g/t = 100% error, but is at the detection limit and normal error envelope). This is most likely due to more even distribution of smaller gold grains so that an equal number of fine grains end up in each sample split. This level of variation due to nugget effect is deemed unlikely to impact the data set or the resource evaluation, because for each instance of a value in one sample being higher than in its paired duplicate, there should be an equal number of lower values recorded which missed the higher value split.
| 103 |
| August 2011 Summary Report On The Livengood Project, Tolovana District, Alaska |
Prep duplicates (5173 from 2007 to 2010), created by splitting either core samples after coarse crushing or splitting raw RC chips, show a somewhat higher degree of variability than the precision bounds but demonstrate no bias to either high or low grade (r=0.92, Mean original samples = 0.43g/t, Mean of duplicates=0.45g/t) . The reproducibility of most pulp duplicates also indicates that most of the gold is not so coarse that it causes major nugget effects. The variability in the coarse duplicates indicates that gold grains are not uniformly distributed within the sample material. This is consistent with the interpretation that gold is, at least partially, hosted in narrow veins and veinlets, which when crushed produce a small number of gold-bearing fragments in the overall sample, thereby causing nugget effect during the coarse sample splitting. In recognition of this effect sample preparation procedures were modified in 2009 so that 1kg of sample material is now pulverized rather than 350g aliquot previously used. Mr. Carew considers these results to be appropriate for Livengood mineralization and indicative of sound QA/QC procedures.
![]()
Figure 11.2 Scattergrams – Sample Duplicates v. Original Sample Results
A diagonal line with a slope of 1 would indicate perfect duplication, and confidence intervals for 10% and 50% are plotted as green and yellow bands respectively. Variation and scatter is interpreted to be the product of normal nugget effect.A) 2007-2011 field duplicate vs. original samples; n= 378. The envelope of points flares with increasing grade. This is typical of nugget effect which becomes more pronounced at higher grades.B)2007-2011 prep duplicates compared to original sample values. The scatter indicates no particular bias with a good overall correlation between the two sets. The scatter is believed to reflect normal nugget effect in thesesamples.C)2007-2011 pulp duplicates vs. original sample. Scatter is similar to that in B. D) 2007-2011 inter-laboratory check assays indicate generally similar scatter to the duplicates data.
| 104 |
| August 2011 Summary Report On The Livengood Project, Tolovana District, Alaska |
![]()
Figure 11.3 Assay Results of Blind Certified Reference Materials v. Standard Value
| 105 |
| August 2011 Summary Report On The Livengood Project, Tolovana District, Alaska |
![]()
| Figure 11.4 X-Y Scattergrams for 2007-2010 |
Top)values of preparation blanks are plotted with respect to timeBottom)values of referencestandards are plotted as a function of time to check for drift in results. The horizontal nature of the lotsin the middle and bottom for each standard value indicates that drift is minimal. |
| 106 |
| August 2011 Summary Report On The Livengood Project, Tolovana District, Alaska |
Mr. Carew has visited the ALS Minerals preparation facility in Fairbanks to verify sample handling procedures and concludes that the lab follows sound log-in, weighing, drying, and splitting procedures. Sample crushing, splitting, and pulverization is done by modern equipment with diligent air cleaning between samples and cleaning with blank material between runs and at the beginning of the day.
Handling techniques demonstrate care in assuring that bags and samples are not mixed up. All pulps are sealed in paper envelopes and placed in boxes, packaged and sealed for transport to the Vancouver or Reno labs for analysis.
| 11.6.2 | Comparison of Metallic Screen and Fire Assay Results |
Analysis of 2096 samples to compare the standard 50 g fire assay to 1 kg metallic screen fire assays was conducted to investigate the potential for bias in Livengood resource data due to the coarse gold content of the mineralization. The samples were selected to represent all of the different stratagraphic units and geographical sectors of the Money Knob resource. The results of the comparison are shown inFigure 11.5,which is a quantile-quantile plot of the two data sets. The figure shows that the two data sets are similar over most of the grade range in the resource.
![]()
Figure 11.5 Comparison of Fire Assay v. Metallic Screen Assay Results for 2096 Livengood Samples
| 107 |
| August 2011 Summary Report On The Livengood Project, Tolovana District, Alaska |
Further comparison is accomplished by examination of the mean grade of samples in the two data sets for different ranges of grade.Table 11.1 lists the different grade bins with the mean grades for each data set, and the difference in the mean values. The table indicates that the fire assay may underestimate the grade or give similar grades for grades up to 9 g/t. High grades may be overestimated, but do not represent a substantial portion of the gold occurrence in the resource. The mean grade for all of the samples is very similar for both data sets, with the mean values differing by 0.1% .
Table 11.1 Comparison of Mean Grades for Different Grade Ranges – Standard Fire Assays and
Metallic Screen Assays for 2096 Livengood Samples
| Grade Range | No. of Samples | Mean Fire Assay (g/t) | Mean Metallic Screen Fire Assay (g/t) | Variance % of Fire Assay | Variance % of Metallic Screen Assay |
| <=0.11 | 186 | 0.09 | 0.12 | 26.7% | -23.5% |
| 0.11-0.35 | 843 | 0.21 | 0.25 | 13.5% | -12.7% |
| 0.35-0.90 | 643 | 0.56 | 0.60 | 6.6% | -6.4% |
| 0.90-3.0 | 350 | 1.49 | 1.49 | 0.3% | 0.3% |
| 3.0-6.0 | 47 | 4.18 | 4.04 | 3.3% | 3.3% |
| 6.0-9.0 | 17 | 6.83 | 6.80 | 0.5% | 0.5% |
| >9.0 | 10 | 13.59 | 8.80 | 42.8% | 54.4% |
| All samples | 2096 | 0.729 | 0.728 | 0.1% | 0.1% |
| 11.6.3 | Evaluation of Core versus RC Results |
The use of Reverse Circulation (RC) drilling at Livengood began in 2003, and has made the rapid definition of the resource possible. Overall, the ratio of RC drilling to Core drilling is 8:1, and as the quantity of Core data has grown, comparison of the two groups of data has been undertaken as part of the projects overall quality assurance. A variety of techniques have been employed in the comparison, including both cyclicity analysis and decay analysis to test for down hole contamination, and comparison of core and RC data distributions to detect the potential for bias. The use of RC drilling in geologic settings where a portion of the drilling is below the water table has resulted in down hole contamination in other projects. RC drilling is used for resource evaluation at the Ft. Knox deposit near Fairbanks, AK, which has similar free gold occurrence.
| 11.6.3.1 | Cyclicity Analysis |
Analysis of cyclicity in the RC data indicated potential problems in only 7 holes. In these holes, intervals with indicated cyclicity were removed from the database. In one instance, an entire hole was removed.
Cyclicity analysis tests the data for potential contamination associated with the patterned sequence of drill rod additions. Cyclic contamination can occur if drillers fail to clean the hole properly during the addition of drill rods, and this type of contamination may be indicated by a spike in grade that correlate with the rod changes. RC data were analyzed by an algorithm the divided the hole into 4 sample (6m, 20 foot) intervals, and identified where the maximum grade occurred in the interval. Intervals where sequences of 4 or more grade maxima occurred at the same position, or where >36% of the maxima were at the same position were marked as suspect.
| 108 |
| August 2011 Summary Report On The Livengood Project, Tolovana District, Alaska |
Figure 11.6 shows an example of graphical output from the analysis of hole MK-RC-0407 showing 33% position 2 maxima and a very, non-random distribution. Hole depth is plotted on the horizontal axis with a sine wave plotted to indicate the location of each sample and assay grade (g/t) is plotted on the vertical axis. In this hole, the grade maxima shift between position 1 and position 2 and indicated cyclic contamination. The entire hole was removed from the database.
![]()
Figure 11.6 Plot of Cyclicity Output for RC-MK-0407
The following string represents the locations of maximum values in each 20 foot interval:
1023431422222334211432122342222114331311101111403113331414141422221434
| 11.6.3.2 | Decay Analysis |
Decay analysis was applied to both RC and Core data at Livengood, and showed that the probability for a monotonic grade decrease in sequences of 3 and 4 samples, and after high grade intersections was equal for both types of data. Since this type of contamination cannot occur in core, the analysis indicated that down hole smearing is not an issue in Livengood RC data.
Migration of mineralized material down hole, when drilling below the water table, can occur after a high grade (>5 g/t Au) intersection. This can produce a pattern of monotonic grade decrease as the high grade material is smeared down the hole. At Livengood, mineralization is generally disseminated and associated with broad zones of alteration. However, there are areas of higher-grade veining that have the potential to smear down the hole. Decay analysis of RC and Core data is summarized inTable 11.2, where the proportion of intervals showing a monotonic decrease or increase, below and above high grade intervals is listed for the entire data set. The table indicates similar probabilities for both data sets.
| 109 |
| August 2011 Summary Report On The Livengood Project, Tolovana District, Alaska |
| 11.6.3.3 | Comparison of Core and RC data distributions |
The use of Quantile-Quantile plots to compare the distribution of RC and Core data has been utilized by Prenn (1992) to identify contamination or bias. This analysis approach has been employed for the evaluation of Livengood data. In this approach, the cumulative distribution curves for the RC data and Core data are plotted to identify differences. Plots have been produced for all Livengood data, and for data separated by individual lithologic units both above and below the water table.Figure 11.7compares the quantile-quantile plots for all data, for the main volcanics unit (predominantly below the water table), and for the Sunshine Zone Upper Sediments unit both above and below the water table. The plots of the different lithologic units have different shapes, but within each data groupings the shapes of both RC and Core data distributions are similar. This indicates that the grade distribution in each rock type is reliably reflected in both the core and RC data.
Table 11.2 Analysis of Monotonic Grade Decreases
Samples | High Grade Samples | 4 Sample Monotonic Decrease Below High Grade | 3 Sample Monotonic Decrease Below High Grade | 4 Sample Monotonic Increase to High Grade | 3 Sample Monotonic Increase to High Grade | |
| Core | 22915 | 217 | 24 | 50 | 2 | 3 |
| 0.9% | 11% | 23% | 0.01% | 0.01% | ||
| RC | 95929 | 451 | 42 | 72 | 11 | 11 |
| 0.5% | 9% | 16% | 0.01% | 0.01% |
The distributions of core and RC data for individual lithologic units have been examined to generate estimates of potential for bias in the data sets. Direct statistical testing, for example Analysis of Variance (ANOVA), has been investigated; however, its application is limited by complexity of the data distributions, magnitude of the scatter in duplicate assays and spatial clustering of the data. A simulation approach has therefore been employed to test the significance and estimate the magnitude in difference of the population mean values. In this process, both the data scatter and population mean values are examined graphically. The process is illustrated inFigure 11.8 A, where the confidence intervals at 1 standard deviation and 2 standard deviations are plotted as the green and yellow area, symmetrically distributed around the population mean for gold content in the RC data for Kint (Cretaceous Intrusive). Simulations of the population mean value are created by randomly selecting different combinations of data points with different numbers of samples and plotting their scatter on the same diagram.Figure 11.8 A shows the Kint RC simulations plotted against the confidence interval for the Kint RC data. Note that the scatter of the RC simulations at different numbers of samples conforms to the confidence intervals, as would be expected. Figure11.8 B shows the same graph comparing the simulated means for the Kint Core data. In this case, the difference in mean values of the core and RC data is 6%, but the scatter of Core means plot within the confidence interval of the RC data. The power of this test is that it allows the comparison of data sets with vastly different numbers of samples (e.g. 6000 RC samples to 900 core samples in the Kint example).
| 110 |
| August 2011 Summary Report On The Livengood Project, Tolovana District, Alaska |
Similar comparisons are shown for the All Data, the Cambrian, Main Volcanics and Upper Sediments (both above and below the water table) inFigure 11.9.
![]()
Figure 11.7 Comparison of Quantile-Quantile Plots of RC and Core Data Distributions for
Different Lithologic Units in Livengood Data (Core - red, RC-blue)
| 111 |
| August 2011 Summary Report On The Livengood Project, Tolovana District, Alaska |
![]()
Figure 11.8 Models of the Mean and Standard Deviation - Sample Size
| 112 |
| August 2011 Summary Report On The Livengood Project, Tolovana District, Alaska |
![]()
Figure 11.9 Models of the Mean and Standard Deviation - Sample Size
| 113 |
| August 2011 Summary Report On The Livengood Project, Tolovana District, Alaska |
In general, the scatter in the simulated mean values for the Core data for each of the graphs inFigures 11.8 and 11.9 are within the confidence interval for the RC data. The Sunshine Zone Upper Sediments above the water table is the exception. The comparison of the mean values of the Core and RC data for the different lithologic units indicates a difference of (negative value Core mean < RC mean):
| Kint -6% | |
| Cambrian -3% | |
| Main Volcanics -3% | |
| Sunshine Zone Upper Sediments above water table -20% | |
| Sunshine Zone Upper Sediments below water table +6% | |
| All Data -4% |
In order to examine the potential origins of the Core bias toward the low Au content a data subset was extracted which contains pairs of 1.5 m (5 foot) RC and Core sample composites that occur within 15 meters of each. These pairs are graphed inFigure 11.10, which indicates a bias with a 1.6 probability that the RC will be higher than the core. Evaluation of the data is listed inTable 11.3, and also shows that above the water table the RC is more than 200% more likely to be higher than the Core while below the water table the probability is only 30-40%.
![]()
Figure 11.10 Core v. RC Gold Content for Composite Pairs
| 114 |
| August 2011 Summary Report On The Livengood Project, Tolovana District, Alaska |
Table 11.3 Comparison of the Frequency of RC-Core Samples Pairs with RC>Core and RC<Core (above and below the water table)
RC>Core | Core>RC | RC>Core/ Core>RC | |
| Above Water Core Zone | 42 | 17 | 2.5 |
| Above Water Sunshine Zone | 57 | 27 | 2.1 |
| Below Water Core Zone | 47 | 37 | 1.3 |
| Below Water Sunshine Zone | 70 | 49 | 1.4 |
This comparison suggests that there is a severe bias toward lower core grades above the water table and a lesser bias below the water table
If the bias above the water table were caused by down hole contamination of the RC samples during drilling there is no reason that the contamination would stop at the water table. It fact it would be expected to become more severe. Instead, the bias above the water table may indicate that gold is being lost from the core during drilling and handling. This might be expected because of the friable nature of the gold-hosting iron oxides which form during the oxidation of the mineralized rock. The loss of coarse gold may actually be reflected in the low variability of the mean estimates for the Sunshine Upper Sediment core dataset above the water table compared to the samples below the water table as shown byFigures 11.9 D and E.
It is not clear whether the continued but less frequent bias towards low Core below the water table reflects the same loss of gold from the core or if it is due to contamination of RC samples below the water table. Still another possible explanation for the low Core bias is that the sample volume changes the probability of encountering gold mineralization. An RC hole is 12.7cm (5”) in diameter which means the 1.52 meter (5’) sample length tests a volume of 19.3 liters. In contrast, HQ3 core is 6.1cm in diameter and while the core volume in 1.52m is 4.5 liters the core is sawn in half giving a final sample volume of 2.2 liters. This means the RC samples 8.6 times the volume of the core sample. Given the erratic nature of veining and alteration at Livengood this could account for the difference in the probability of getting higher grades in the RC sample compared to the core. Whatever the process, it is clear that it is not universal as indicated by the Sunshine Zone data below the water table.
| 115 |
| August 2011 Summary Report On The Livengood Project, Tolovana District., Alaska |
| 12.0 | Data Verification |
| 12.1 | Third Party Confirmation |
Field and drill core observations made by Mr. Carew (Carew et al., 2010) during site visits are consistent with the style of mineralization and alteration interpreted and reported in ITH documents. Outcrop exposures in road cuts were examined and found to be consistent with existing geological maps.
Drill logs, sections and maps were reviewed and are to a high quality. Provided information is consistent with observations of core and surface exposures.
In 2006, Dr. Paul Klipfel collected a single sample along 3 m of a trench face where intrusive material with quartz veins is exposed (Klipfel, 2006). This sample was crushed, split, pulverized and assayed with a 50 g fire-assay AA finish method by ALS Chemex in Reno, Nevada. The sample contains 1.31 g/t Au, a value consistent with results from AGA sampling and expectations for material of that type and location. In addition, Dr. Klipfel witnessed the sluicing and panning of concentrated “clean up” material shovelled from a trench face. The material contained a significant amount of fine colors as seen in the panning dish verifying the presence of free gold at a range of sizes in that part of the trench face, (Klipfel, et al., 2010b).
In 2007, Dr. Klipfel collected seven samples from portions of two different drill holes, MK-07-18 and MK-07-20, from the remaining half of drill core previously sampled by ITH (Klipfel and Giroux, 2007a).. Samples were selected for a range of gold content and rock type. The range of gold content in these samples is from below detection to 16.8 g/t Au. The core was quartered for the same sample interval as previously collected by ITH. Core material was bagged, labelled and information recorded by Dr. Klipfel and by ITH staff. Sample bags were sealed and transported to the ALS-Chemex laboratory in Fairbanks for sample preparation. Pulverized material was split into 300 gram master pulps and 120 gram analytical pulps before being sent to ALS Chemex in Vancouver for analysis. All samples except one returned results reasonably consistent with results from the ITH original sampling. The single sample that is different contains 0.61 g/t Au compared to 6.92 g/t Au in the original ITH analysis. This discrepancy is similar to the few discrepancies that occur in ITH’s QA/QC sample duplication procedures. For this reason, the discrepancy is interpreted to reflect normal variation attributable to nugget effect as described in section 13.2. To the extent that this type of error is throughout the database, it is equally likely that a corresponding number of samples report low when the other half of core might report higher (Klipfel, et al., 2010b).
In 2008, 31 samples (26 RC and 5 core) were collected by Dr. Klipfel for verification analyses (Klipfel, and Giroux, 2009). These samples came from 5 different RC holes and 1 core hole. Samples were selected at random and specifically for a range of gold content from near detection limits (0.005 g/t Au) to high grade (20.9 g/t Au). Half-core that remains after a first sample was quartered and analyzed. Two standard and two duplicate samples demonstrated good reproducibility. RC samples demonstrated reasonable reproducibility, and core samples showed a range. No systematic bias was observed. Dr. Klipfel interprets these results to show normal scatter and nugget effect typical of mineralization at Livengood and for gold in general (Klipfel, et al., 2010b).
| 116 |
| August 2011 Summary Report On The Livengood Project, Tolovana District., Alaska |
As a check of the data generated during 2009, Dr. Klipfel selected two batches of samples (Klipfel, Carew, and Pennstrom, 2009b). The first batch consisted of 28 samples selected from the duplicates collected by ITH from the winter program. The second batch consists of 13 duplicate RC chip samples randomly selected at each of the three RC drill rigs. Samples of the first batch were selected to be representative of a range of rock type and gold values from different holes.
Results for the first batch show very good accuracy and precision for the standard and blank samples included with the sample set. The duplicate sample shows variation (2.13 vs. 2.89) of about 25%. Five other samples within this batch show significant variation between the original and duplicate analysis. For this reason, both the original and duplicate samples were re-analyzed. The values from these four runs show consistent variation among samples with higher gold values (e.g. 1 or more runs with higher values) for at least one run out of the four runs (Figure 12.1). It also shows minimal variation among samples with very low gold content. Importantly, samples with minimal or no gold (≤0.1 g/t Au) show consistency and repeatability. When plotted in log-log format, the envelope of variation becomes smooth, again suggesting a natural nugget effect. This assumes that the gold at Money Knob is consistent with the concept that natural systems follow logarithmic abundance patterns (Levinson, 1974; Rose and others, 1979).
Results for the second batch show good correlation and do not display any discernible bias (Figure 12.2). Deviation from an ideal 1:1 correlation is consistent with past sampling and the degree of nugget effect observed throughout the course of ITH’s drilling program.
Mr. Carew has reviewed the results of the 2009 verification sampling and agrees with the conclusions regarding accuracy, precision and lack of bias. Mr. Carew also collected a batch of samples from the later 2010 drilling for verification purposes during his site visit from October 24-27, 2010. These duplicates, shown graphically inFigure 12.3, show a good overall correlation with the results reported by ITH, with precision similar to or better than the duplicates reported by ITH, reflecting the nugget effect caused by coarse gold in the Livengood mineralization. Mr. Carew has not verified all sample types or material reported. To the best of his knowledge, ITH has been diligent in their sampling procedures and efforts to maintain accurate and reliable results.
| 12.2 | Grade Confidence and Continuity |
During the Summer 2011 drill program, three components of the drilling activities are designed increase confidence in the precision of grade predictions and continuity of mineralization. The programs include two areas (Core Zone and Sunshine Zone), where the spacing between drill holes will be reduced to 15 m along the two primary directions in the existing drilling grid. A third area, designated Area 50, in the Sunshine Zone will test modeling precision at different densities and types of drilling data.
| 12.2.1 | Grade Continuity |
Two separate areas are being drilled at higher density along the primary grid directions. In each of the Core Zone and Sunshine Zone, a total of 9 holes will be drilled long the Northing gridline and 9 holes drilled along the Easting grid line. These directions correspond approximately to the directions of anisotripy in the variography. RC drilling is being used.
| 117 |
| August 2011 Summary Report On The Livengood Project, Tolovana District., Alaska |
| 12.2.2 | Grade Confidence |
Area 50 in the Sunshine Zone is a block with nominal dimensions of 150m x 150 m by 150 m along the inclined drill hole dimension. The volume of the block is approximately 3.4 million cubic meters or 9.1 million tonnes. A total of 50 holes will be drilled in the volume, 25 RC and 25 core. Holes will be drilled in two different directions to test for any potential bias from interaction of the general stratigraphic orientations and vein structures. An equal number of holes and types will be drilled at each orientation.
Resource models will be constructed using different combinations of the drill holes, and at different densities of data. This will allow a direct comparison of resource predication using all RC, all core and mixed data.
| 118 |
| August 2011 Summary Report On The Livengood Project, Tolovana District., Alaska |
![]()
Figure 12.1 X-Y Scatterplots of 2008-2009 Original and Duplicate Sample Data for Check Samples
The diagrams on the left are plotted with numeric scales. The diagrams on the right are plotted with log-log scales. The scatter increases with grade on diagrams with numeric scales while the envelope of points remains approximately parallel to the “unity” line. This is consistent with data followinglognormal abundance pattern typical of natural elemental abundance patterns.A and B)original vs.“met” splits.C and D)original vs. duplicate original splits.E and F)original vs. duplicate “met”sample.G and H)met and duplicate met samples. These diagrams collectively indicate a lack ofconsistent bias and show that different splits show variation consistent with nugget effect at all grades,but more pronounced at higher grades.
| 119 |
| August 2011 Summary Report On The Livengood Project, Tolovana District., Alaska |
![]()
Figure 12.2 X-Y Scatterplot of Original and Check Samples for June 2009 RC Drilling
The correlation line shows a slope of 1. Samples with identical results will plot on the line. Deviation of results from the line is interpreted to be the result of normal variation and nugget effect.
| 120 |
| August 2011 Summary Report On The Livengood Project, Tolovana District., Alaska |
![]()
Figure 12.3 Comparison of Original Results Reported by ITH with 50 Field Duplicates (collected
and analysed independently by Tim Carew in October 2010)
| 121 |
| August 2011 Summary Report On The Livengood Project, Tolovana District., Alaska |
| 13.0 | Mineral Processing and Metallurgical Testing |
| 13.1 | Introduction |
ITH has undertaken metallurgical and processing test work to determine optimal recoveries using numerous conventional flow sheets: milling with gravity, flotation, and Carbon in Leach (CIL) or gravity and CIL of the gravity tails, and heap leaching. Current test work focuses on determining the best means of optimizing these combined recovery methods. This work involves studies that evaluate how gold mineralization occurs and how the mineralized materials vary in their physical and metallurgical response to process treatment parameters according to the various lithologic units that host mineralization. The characteristics under review include grindability, abrasiveness, optimal particle size for downstream treatment, and response to leach, flotation, or gravity unit operations as a function of oxidation and lithology.
The information presented herein derives from past and on-going studies which are in progress. In the previous PEA developed in November, 2010 (Carew, et al., 2010), results from metallurgical tests were applied to mineralization that is amenable to heap leach processing as well as milling followed by CIL. Those results have been updated with results of column leach tests received in 2010 and 2011. Although ITH has envisioned that gold could be recovered through a combination of processes, preliminary test work for a mill with gravity and CIL or gravity and flotation techniques have been completed with confirmatory test work continuing at this time. These preliminary metallurgical results have been utilized to forecast gold recoveries in the current Whittle mine estimations.
Specific metallurgical characteristics, identified in the testing programs to date, have shaped the processing strategies used as the basis for this PEA and assumed project configurations. These important metallurgical findings are:
- variable metallurgy (chemical and physical properties), depending upon mineralization type; degree of oxidation, amount of organic carbon, etc.;
- identification of mineralization types that are amenable to simple cyanide leaching process techniques such as heap leaching in conjunction with a carbon in column adsorption plant (CIC), particularly oxidized and partially oxidized mineralization;
- identification of sediment-hosted mineralization that contains organic “preg- robbing” carbon that will require CIL process techniques;
- higher recoveries for most mineralization types using gravity separation in combination with downstream CIL and/or flotation separation techniques; and
- lower recoveries for mineralization types with arsenic association.
Test work completed or currently in progress includes grind ability, abrasiveness, optimal particle size determination, and response to gravity followed by CIL or flotation followed by cyanide leaching of the concentrates as a function of oxidation and lithology. Metallurgical parameters necessary to define unit operating costs have been developed from test work data for the various mineralization types.
| 122 |
| August 2011 Summary Report On The Livengood Project, Tolovana District., Alaska |
| 13.2 | Metallurgical Summary |
Metallurgical test work programs on the Livengood mineralization began in 2004 and continue as of the preparation of this report. Test work has been performed at Kappes Cassiday and Associates in Reno, NV, McClelland Labs Inc. in Sparks, NV, and at Resource Development Inc. in Wheat Ridge, CO. The mineralization types at Livengood are variable in their chemistry, in their physical properties, and in their metallurgical characteristics. The following statements best describe the observed results of the test work performed to date:
- Most Livengood mineralization could be considered moderately soft to medium hard in hardness with an average Bond Ball Mill Work index of 15.8. The mineralization varied significantly in hardness, with Bond Ball Mill Work indices varying from a minimum of 11.1 to a maximum of 19.1 kW-hr/Mt.
- The majority of the mineralization would be considered non-abrasive, with an average Abrasion Index of 0.0809. The mineralization type abrasion characteristics varied significantly from 0.0023 to 0.2872.
- All of the Livengood mineralization types respond to cyanide leaching to some degree.
- Some of the unoxidized mineralization with organic carbon has “active” or “preg- robbing” carbon.
- The effect of leach times on gold recovery and gravity concentration results indicate some of the mineralization contains coarse gold.
- Gold recovery at 10 mesh particle size on some of the mineralization types exceeded 90 percent.
- Gold recovery on some of the mineralization types, but not all, is improved with finer grinding. A grind size where 80 percent (p80) of the particles are smaller than 200 mesh (74 microns) has been tested to date.
- The leaching of flotation concentrates, in preliminary tests, shows variable results depending on the mineralization type and the amount of arsenopyrite present.
- Fine grinding of flotation concentrates to less than 20 microns, in preliminary tests, does not significantly improve CIL gold recovery from this material.
- Initial flotation and gravity concentration tests indicate the combined processes exceed 90% gold recovery to the concentrates.
- The degree of oxidation of the mineralization, as observed by the geologists, has a marginal impact on the gold recovery.
- Differences in gold recovery between cyanide shake leach tests, bottle roll leach tests, and Carbon-in-Leach tests suggest organic carbon in the mineralization is active to varying degrees in some of the mineralization types, particularly the un-oxidized portions of those mineralization types.
- The gold is often associated with sulfides, but this mineralization would not be classified as a sulfide refractory type.
These results indicate that some of the mineralization types are very amenable to conventional gravity and CIL leaching recovery processes, while other mineralized materials require an intermediate flotation step followed by a more aggressive regrinding/leaching of the flotation concentrate.
| 123 |
| August 2011 Summary Report On The Livengood Project, Tolovana District., Alaska |
The most significant metallurgical parameter for Livengood un-oxidized mineralization is the presence of organic carbon and the indication that some, but not all, of the organic carbon is “active” or “preg-robbing” in nature. Metallurgical test work began to focus on process methods that could be used to counter the preg-robbing effects of the mineralization. The simplest of these methods, the Carbon-in-Leach (CIL) process, has been the focus of test work since October 2009, and is currently being used in preliminary test work performed to date. The CIL test work, continues to show positive results in counteracting the effects of preg-robbing carbon, providing an average increase of gold recovery compared to standard cyanide leaching for all mineralization types of approximately 18 percentage points and as high as a 49.5 percentage point increase in gold recovery for the more difficult un-oxidized mineralization.
Gravity concentration testing of the Livengood mineralization continues to show encouraging results with a maximum of 58% of the gold reporting to all gravity concentration products. The results show a 69:1 concentration ratio (gravity concentrate weight percent of 1.43%) provides an average concentrate grade of 46.1 g/t Au. Additional gravity test work shows that in a cleaned gravity concentrate, approximately 40% of the gold reports to a gravity concentrate having a final weight pull of 0.12% and grading 310 g/t Au.
Current data indicates the oxide and partially oxidized mineralization types will respond well to a CIL leaching process. Ongoing test work indicates higher gold recoveries can be obtained from all mineralization types and particularly the weakly to un-oxidized types with the use of standard milling that utilizes an initial gravity circuit followed by a CIL process for the gravity circuit tails. Investigations into a process scenario of gravity, flotation, and CIL of the concentrates initially indicates that this process scenario delivers greater than 90% of the gold to the concentrates, which can then be treated effectively in higher intensity recovery circuit. This ability to increase recoveries from the higher grade mineralized zones as well as effectively process the weakly-oxidized to un-oxidized mineralization has the potential to significantly improve the Livengood project in both its size and economic performance.
Metallurgical test work currently underway and / or planned and scheduled for the future will continue to focus on utilizing gravity, flotation, and CIL as the primary metallurgical processes. Enhancing the CIL test work with tests that attempt to render preg-robbing organic carbon inactive will also be performed.
Preliminary batch flotation test work has been performed to determine the potential for concentrating the gold and depressing gold preg-robbing constituents prior to downstream cyanidation. In these tests, flotation was followed by gravity recoverable gold tests. The test results indicated that flotation would recover between 57.7% and 97.9% of the total gold, and that gravity recovery on the flotation tails would recover an additional 7.5% -93.3% of the gold reporting to the gravity circuit. Total gold recovery to the combined concentrates was relatively high and ranged between 76.4% -99.9% with an overall average of 90.1% .
A second series of tests were performed which subjected the mineralized material to gravity concentration followed by flotation. This set of tests showed that, using this process scenario, on average 92% of the gold reported to concentrates. Preliminary tests performed on flotation concentrate leaching showed a wide variance in leach performance, from a high of 94.3% gold recovery to a low of 38.9% gold recovery. Further testing is ongoing to evaluate and enhance the flotation concentrate CIL recovery from both the flotation and gravity concentrates.
| 124 |
| August 2011 Summary Report On The Livengood Project, Tolovana District., Alaska |
Column leach test work was performed by McClelland Laboratories of Reno Nevada in 2010 and 2011, on a variety of crush sizes from ½ inch to run of mine (>6 inch material). Samples were blended by material type and by degree of preg- robbing tendency to establish the effectiveness of heap leaching as a process option.Table 13.1 provides the results of these tests.
Table 13.1 Summary of Metallugical Results, Column Percolation Leach Tests, Livengood Drill Core Composites, 80% - 12.5 mm feed size
| ML1 Composite | Test No. | Leach/Rinse Time, days | Au Rec. % | Tail Screen Assay | Calc'd. Head | Average Head | NaCN Consumed, kg/mt feed | Lime Added kg/mt feed |
| Comp #1 Cambrian-Partial Ox | P1 | 114 | 79.1 | 0.39 | 1.87 | 1.98 | 4.52 | 3 |
| Comp #1 Cambrian-Partial Ox | P2 | 114 | 96.8 | 0.06 | 1.87 | 1.98 | 5.16 | 3 |
| Comp #2 Cambrian-Trace Ox | P3 | 114 | 50.4 | 0.58 | 1.17 | 1.99 | 3.42 | 1.5 |
| Comp #2 Cambrian-Trace Ox | P4 | 111 | 40.4 | 0.81 | 1.36 | 1.99 | 3.96 | 1.5 |
| Comp #3 Cambrian-No Ox | P5 | 81 | 42.4 | 0.34 | 0.59 | 0.64 | 2.52 | 3.5 |
| Comp #3 Cambrian-No Ox | P6 | 80 | 60.6 | 0.13 | 0.33 | 0.64 | 2.38 | 3.5 |
| Comp #4 Upper Seds-Partial Ox | P7 | 116 | 72.3 | 0.13 | 0.47 | 0.4 | 3.25 | 2 |
| Comp #4 Upper Seds-Partial Ox | P8 | 116 | 81.1 | 0.1 | 0.53 | 0.4 | 3.1 | 2 |
| Comp #5 Upper Seds-Trace Ox | P9 | 139 | 58.7 | 0.43 | 1.04 | 1.14 | 2.74 | 3 |
| Comp #5 Upper Seds-Trace Ox | P10 | 116 | 58.6 | 0.53 | 1.28 | 1.14 | 3.49 | 3 |
| Comp #6 Upper Seds-No Ox | P11 | 116 | 56.3 | 0.45 | 1.03 | 1.08 | 3.28 | 2 |
| Comp #6 Upper Seds-No Ox | P12 | 113 | 50 | 0.57 | 1.14 | 1.08 | 2.99 | 2 |
| Comp #7 Main Volcanics-Partial Ox | P13 | 113 | 44.2 | 0.48 | 0.86 | 0.86 | 3.92 | 5 |
| 125 |
| August 2011 Summary Report On The Livengood Project, Tolovana District., Alaska |
| ML1 Composite | Test No. | Leach/Rinse Time, days | Au Rec. % | Tail Screen Assay | Calc'd. Head | Average Head | NaCN Consumed, kg/mt feed | Lime Added kg/mt feed |
| Comp #7 Main Volcanics-Partial Ox | P14 | 113 | 44.8 | 0.48 | 0.87 | 0.86 | 3.8 | 5 |
| Comp #8 Main Volcanics-Trace Ox | P15 | 112 | 33.3 | 0.8 | 1.2 | 1.3 | 3.52 | 1.5 |
| Comp #8 Main Volcanics-Trace Ox | P16 | 113 | 31.9 | 0.79 | 1.16 | 1.3 | 2.84 | 1.5 |
| Comp #9 Main Volcanics-No Ox | P17 | 112 | 28.8 | 0.57 | 0.8 | 1.36 | 3.75 | 3.5 |
| Comp #9 Main Volcanics-No Ox | P18 | 112 | 19.8 | 0.69 | 0.86 | 1.36 | 4.05 | 3.5 |
| 13.3 | Gold Characterization |
Hazen Research, Inc.
Hazen Research, Inc. performed gold characterization work on products they prepared from a heavy liquid separation test program performed on Livengood samples during late 2006 and early 2007 (Hazen Research Inc. letter report dated February 7, 2007, Subject: Characterization of Livengood Gold Ore, Hazen Project 10504).
The samples were ground to minus 35 mesh for gravity separation. The minus 35 mesh material was first wet-screened at 500 mesh (25 um). The minus 35 plus 500 mesh product was split in half and each half subjected to heavy liquid separation at a density of 2.96 to upgrade both the gold and heavy minerals to enhance gold assay detection. The float (tailing), sink (concentrate), and the unseparated minus 500-mesh slimes from one set of heavy-liquid separation were fire assayed for gold and silver.Products from the other set were used for the mineralogical examination. To concentrate the gold even further, the sink product and the minus 500-mesh slimes were panned.
The test showed 4% to 10% of the sample mass reported to the heavy mineral concentrate which contained between 44% and 77% of the gold. Another 13% to 33% of the gold reported to the minus 500 mesh slime fraction with the balance reporting to the +35 mesh float fraction. Silver values in the mineralization were essentially negligible and the silver did not report to the heavy mineral concentrate with the gold. Microprobe analysis of one gold grain indicated that the silver content was 7.4% . The balance of the silver was probably held in other sulphide phases.
The main sulphide minerals in the heavy mineral concentrates were pyrite and arsenopyrite in ratios ranging from 2:1 to 6:1. Pyrrhotite and chalcopyrite were commonly observed as inclusions in both pyrite and arsenopyrite. Pyrite may be euhedral or anhedral and was frequently porous, enclosing abundant inclusions of gangue and rutile. Sphalerite tended to occur as liberated grains or intergrowths with pyrite and arsenopyrite rather than as inclusions. Trace amounts of several other sulphide minerals and gold were also present. Hematite was observed in the only partially oxidized sample examined.
| 126 |
| August 2011 Summary Report On The Livengood Project, Tolovana District., Alaska |
Marcasite was reported in some samples and in one of these it occurred as distinct clusters of acicular crystals and was possibly a product of oxidation.
Gold occurrences were scarce. The size of the gold varied between less than 5 to 23 um. The particles observed were mostly associated with arsenopyrite as small attachments or inclusions; one liberated particle was found in the minus 500-mesh product of the partially oxidized volcanic-hosted sample.
Advanced Mineral Technology Laboratory Ltd. (AMTEL)
The deportment of gold was established in five feed samples representing different ‘oxide’ mineralized material from the Livengood deposit (labeled PQ3, 9, 12, 13, 22). The principal aim of this study (AMTEL 2011) was to establish the forms and carriers of Au, on a size-by-size basis, to allow prediction of metallurgical behavior in a combination of gravity, flotation and cyanidation process flow sheet. This study was performed to assist in process selection and optimization.
The deportment of gold was established using AMTEL’s standard procedure for the analysis of feed samples. The study protocol is routinely adapted for each project to account for various factors, such as sample mineralogy, grind and grade. The study determined the forms and carriers of Au, which were identified and independently quantified using combined assaying, microscopy and micro-beam techniques.
Particular emphasis was placed on quantifying gold that is carried in exposed leachable gold grains. Additionally, the submicroscopic gold content of sulphides (which is refractory to direct cyanidation) was established. The accuracy of gold assaying for each batch of samples was determined by random submission of known gold standards.
The sample’s response to metallurgical processing is related to grind fineness for which the target P80 was 500µm (all samples were milled at AMTEL).
- The essential rock mineralogy is similar for all samples, but the proportions vary considerably between ores. Quartz content generally increases from PQ3 (13%) to PQ22 (39%), at the expense of hornblende (14% to 2%) and carbonates (38% to 8%). The principal carbonate has a composition lying between ankerite and ferroan-dolomite, except in PQ3 where ferroan-magnesite is abundant and dominant. PQ3 also has a considerably more Mg-rich phylosilicates assemblage, with talc and chlorite being abundant: Illite is the dominant clay in all other samples, ranging from 10% to 35%.
- Despite the designation as ‘oxide’ mineralized material the samples do not contain significant quantities of oxide minerals, although some alteration was observed around sulphide grains in all samples. Sample PQ12 had the greatest goethite content, however this never exceeded 0.2% in any sample.
- There was no carbonaceous matter in any of these samples. The TOC content was less than 0.03w/o.
- The sulphide mineralogy is dominated by pyrite and arsenopyrite in all samples. The ratio of arsenopyrite:pyrite varies from sample to sample. Sample PQ12 has the greatest sulphide mineral content and also has the greatest abundance of trace sulphide minerals, such as boulangerite, galena, and sphalerite.
| 127 |
| August 2011 Summary Report On The Livengood Project, Tolovana District., Alaska |
- Gold is found in the following forms: (i) gold minerals (native gold and rarely electrum) and (ii) submicroscopic Au in sulphides and oxides. Gold mineral grains were overwhelmingly of a native gold composition (average Au 93.5%) that was similar in all mineralized materials except for PQ12, where the grains had more Ag and rarely electrum was recorded. Submicroscopic Au may itself be in the form of solid solution Au in the crystal structure of minerals, and as colloidal-size (<0.5 micron) micro-inclusions. Submicroscopic Au is primarily carried by arsenopyrite and pyrite.
Cambrian - Partial Complete Oxide [PQ3; 0.70g/t]
- The mineralogically accounted gold came to within 3% of the average of two 1kg metal screen assays.
- The principal carrier of Au in this sample is sulphide-rock composite particles, which carry 39% of the grade. A significant proportion of the Au associated with these composites is exposed and leachable by cyanide, however these particles will be less easily recovered by flotation. Approximately one quarter of the Au in the composites is in the coarsest (>500 micron) particles.
- Free gold grains account for 36% of the grade. These will be easily recovered by cyanidation, although less readily recovered by flotation and gravity processing, because of the large proportion of Au that is carried by grains <10µm. The observed average gold grain size was ~21µm, with the maximum grain diameter of 150µm. A total of 495 gold grains were observed and sized.
- Free sulphide grains carry ~22% of the PQ3 gold, of which approximately 7% is in the form of associated (exposed and enclosed) gold grains.
- Submicroscopic Au is primarily carried by arsenopyrite, and to a lesser degree pyrite. Goethite and marcasite are much less significant Au carriers. In total, refractory Au accounts for 22% of the PQ3 grade.
- ‘Clean’ rock particles, essentially devoid of sulphide associations, are insignificant to the overall gold balance, carrying less than 3% of the sample Au.
- At a P80 of 500µm, the predicted Au recovery is 19% by gravity; 55% by flotation, and 71% by direct cyanidation.
Sunshine Upper Seds – Trace Oxide [PQ9; 0.85g/t]
- The mineralogically accounted gold came to within 1% of the average metal screen assay.
- Gold is roughly equally carried by free gold grains, sulphide particles, and rock-sulphide particles.
- Free sulphide particles in total contribute 33% (~0.29g/t) of the accounted grade. The majority of this gold is carried by particles >40µm in size, that are recoverable by flotation. Within free sulphide particles, as a whole, 0.11g/t is as submicroscopic Au that is refractory to cyanidation regardless of sample grind.
| 128 |
| August 2011 Summary Report On The Livengood Project, Tolovana District., Alaska |
- Free gold grains contribute 32% of the Au balance. The average size of observed free+exposed gold grains was 23µm, with a coarsest grain of 240µm diameter. A total of 496 gold grains were observed and sized.
- Sulphide-rock composite particles account for a further 28% of the sample grade: The overwhelming majority of this Au is carried by associated gold mineral grains (approximately 2/3rds exposed and 1/3rd enclosed).
- Clean rock particles carry 6% of the PQ9 gold. These particles are essentially unrecoverable by gravity or flotation.
- At a grind fineness of 80% passing 500µm, the predicted recovery by gravity is 23%, by flotation 61%, and direct cyanidation 66%.
Main Volcanic - Partial Complete Oxide [PQ12; 0.77g/t]
- The mineralogically accounted gold came to within 3% of a single metal screen assay.
- Free sulphide particles are the principal carrier of Au in this sample, accounting for 51% of the grade. The importance of free sulphides in this mineralized material is due to their increased abundance relative to other samples.
- Free gold grains account for 22% of the Au. The Au is roughly equally carried by grains ±10µm, which implies significantly lower recovery by gravity.
- Rock-sulphide binary grains are responsible for 18% of the sample grade. The associated gold is in large part (2/3rds) present as exposed gold grains.
- Rock particles in this mineralized material contain the greatest quantity of Au, compared to other Livengood mineralized material, and account for 7% of the sample grade. This is still only a minor carrier.
- At 80% passing 500µm, the predicted recovery by gravity is 10% compared to 56% by flotation and 64% by direct cyanidation.
Sunshine Upper Seds – Partial Complete Oxide [PQ13; 1.24g/t]
- The mineralogically accounted gold came to within 6% of a single metal screen analysis.
- Free sulphide particles are the principal carrier of Au in this sample, contributing 43% of the accounted grade. The grade of the free sulphide fraction is greatest in this mineralized material (~40g/t) due to a high abundance ofarsenopyrite and a high concentration of solid solution Au associated with the arsenopyrite. However,submicroscopic Au in the free grains only accounts for 0.13g/t (11%), therefore associated gold grainsare the primary Au contributor. The overwhelming majority of sulphide particles are of readily floatable sizes.
| 129 |
| August 2011 Summary Report On The Livengood Project, Tolovana District., Alaska |
- Free gold grains contribute 36% to the Au balance.
- At 80% passing 500µm the predicted recovery by gravity is 27%, compared to 72% by flotation and 70% by leaching.
Core Upper Seds - Partial Complete Oxide [PQ22; 1.18g/t]
- The mineralogically accounted gold came to within 9% of a single metal screen assay.
- Free gold grains are the principal carrier of Au, accounting for 71% of the grade. This is the greatest contribution for this carrier in any of the Livengood mineralized materials. A significant proportion of this Au comes from very coarse gold grains >100µm, which explains the considerable variation found in assayed grade for this sample.
- Sulphide-rock composites are the second-most important Au carrier, contributing 16% to the Au balance.
- Free sulphide grains contribute 11% to the accounted grade. This sample contains the lowest abundance of arsenopyrite, and the observed preferred association of gold grains (for all samples) was with arsenopyrite.
- Clean rock particles are insignificant Au carriers (2% of accounted Au).
- At 80% passing 500µm the predicted recovery by gravity is 54%, compared to 76% by flotation and 85% by leaching.
Conclusions:
Liberation of associated gold suggests a primary grind (P80) of 400µm and a regrind of floated middlings of 80µm.
The presence/absence of coarse (>75µm) liberated gold grains has a major impact on head grade, and consequently on recovery by gravity separation. However, the average size, the size range, and grain shape does not vary significantly between mineralized materials.
The shape of approximately 100 gold grains, above 40µm in size, was analysed from each mineralized material. The grains show limited signs of flakiness (large x, y axes, small z), indicating no inherent flakiness in the mineralized material and no imparted flattening during milling to 80% passing 500µm. A high degree of flattening will reduce recovery by gravity.
The average composition of gold grains is 95%Au and 5%Ag, therefore Ag should not retard gold extraction from a leach feed with no coarse gold left behind.
The absolute quantity of Au carried by free grains <10µm is similar in all samples (~0.09g/t).
| 130 |
| August 2011 Summary Report On The Livengood Project, Tolovana District., Alaska |
The variability in the abundance of sulphide particles, and their Au concentration, also has a big impact on the grade of Livengood mineralized materials.
Tarnished sulphide grain surfaces and microscopically visible coatings indicate that sulphidisation and regrind of a pre-concentrate will be necessary to optimize sulphide mineral and associated gold recovery.
The ratio of submicroscopic to enclosed gold being on average greater than 2:1 limits a significant increase in gold extraction by regrinding a sulphide concentrate.
At a first glance gold deportment analysis indicates that the preferred process option for the gravity tails is equivalent between flotation and cyanide leaching, especially after taking into consideration that flotation will yield lower global recoveries due to the significant refractory gold component in all mineralized material types.
However, size by size gold deportments indicates that flotation of a bulk (py-apy) concentrate, that encompasses also the Au-bearing sulphide-rock composite particles, is the preferred option as it allows for re-grind to recover enclosed cyanide leachable gold. The estimated mass pulls (allowing for 20% entrainment) are in the 5-12% range with concentrate grades of 7-9gAu/t with the exception of PQ13 (18gAu/t).
| 13.4 | Historical Test Work Programs |
In 2004, AGA attempted to test the cyanide solubility of gold in drill sample material by analyzing samples containing more than 200 ppb Au. Samples were sent to ALS Chemex for a 30g cold cyanide leach assay (Au-AA24). A total of 198 samples were analyzed in this manner and they showed consistent CN soluble assays, on average about 60% of the fire assay value. The significance of this result was unclear at the time because there were many variables which could affect this outcome. These included small sample size, nugget effect, host rock type, sulphide content, other mineral content, encapsulation, and possible inappropriate testing method. Of these, nugget effect is expected when there is coarse free gold which was witnessed by Dr. Klipfel in the sluice sample of trench face material and has been seen in drill core. Sulphide and organic carbon are present and also could be significant factors. In an effort to determine which minerals might impact the cyanide test, scientists used principle component analysis for four sets of ‘factors’. They concluded that As and Sb had little impact, but that sulphide content and coarse gold were the leading contenders for lowering recovery in the CN leach samples.
Overall this test work was deemed inconclusive due to small sample size and nugget effect. However, it should be an indicator of processing and recovery possibilities and issues. It also showed that gold and sulphide characterization studies are needed for metallurgical and process planning. Any such study was to address sample size, coarse free gold content, distribution and location of gold in host rock, material type (shale, volcanic, intrusive), sulphide species, and organic carbon content. At this stage, the results were only considered as a preliminary indicator of potential issues for a cyanide leach process.
| 131 |
| August 2011 Summary Report On The Livengood Project, Tolovana District., Alaska |
| 13.4.1 | Hazen Research Test Work |
In 2006, ITH submitted a single sample of unoxidized vein-related mineralization to Hazen Research for a gold characterization study. The sample showed that the bulk of the gold occurs as micron-scale native gold grains in and adjacent to pyrite and arsenopyrite grains with a smaller number of grains associated with silicate gangue. Cyanide recovery in a bottle roll test was 61% (Table 13.2, Sample 1A).
In 2007 six more samples were submitted to Hazen Research for additional gold characterization studies. These samples represented both high and low grade mineralization from oxidized, partially oxidized and unoxidized material. Cyanidation of the samples shows that the cyanide extraction of gold is very high on the oxide and partially oxidized samples (Table 13.2) and somewhat less in the sulphide material. Two of the sulphide samples (Table 13.2, samples 3 and 1A) were from rock with albitic alteration and they each returned 60% cyanide recovery. The 3rd sulphide sample (Table 13.2, sample 5) came from rock with sericite alteration and had only a 42% recovery.
Table 13.2 Gold Recovery from 2007 Cyanide Extraction Tests
| Sample # | Mineralization Type | Average Grade (g/t) | % Cyanide Extraction* |
| 1 | Oxide Sediments | 1.52 | 99.9% |
| 2 | Oxide Sediments High-grade | 10.80 | 96.9% |
| 3 | Un-Oxidized Volcanic | 1.52 | 59.7% |
| 4 | Oxide Sediments | 1.39 | 99.9% |
| 5 | Un-Oxidized Volcanic | 1.38 | 42.3% |
| 6 | Weakly Oxidized Volcanic | 1.06 | 90.2% |
| 1A | Volcanic Un-Oxidized | 2.30 | 60.9% |
* Samples were 300 gram bottle rolls with sample material crushed to ~200 mesh and
sampled every 8-10 hours for a total of 48 hours.
A very important result of this work is the observation that, for all the samples tested in 2007, the bulk of the gold recovered by cyanide extraction is released in the first 16 hours. This implies that the gold is readily available to the cyanide solution. Further studies will address the cyanide extraction on both fine and coarse material as a first step in the determination of the optimal recovery process.
In 2008 an additional 24 samples were submitted to Hazen Research for bottle roll testing on coarse material from a variety of lithologies and oxidation states (Table 13.3). This was undertaken as a separate study from a previous one with ALS Chemex. Results indicate that overall average cyanide extraction was approximately 70% with 15 of the 24 samples showing greater than 70% recovery. Interestingly many of the unoxidized samples showed better recovery than some of the partially oxidized samples. These data also show that the majority of the gold is released to solution within the first 16 hours. The same sample materials were submitted to Kappes Cassiday in Reno for fine grinding and tests of gravity recovery and cyanide extraction at a -200 mesh grind. The results are presented inTable 13.4.
| 132 |
| August 2011 Summary Report On The Livengood Project, Tolovana District., Alaska |
Table 13.3 Gold Recovery from 2008 Hazen Cyanide Extraction Tests (-10 Mesh)
| Sample ID | Mineralization Type | Hazen Head Au g/t | Chemex Head Au g/t | Calculated Head Au g/t | Residue Assay Au g/t | Hazen Gold Extraction | Chemex Gold Extraction | Calculated Head Extraction |
100112113 | Partial Oxide Um | 0.48 | 1.26 | 0.81 | 0.17 | 64% | 87% | 79% |
| 100123124 | Trace Oxide Um | 0.83 | 0.83 | 0.81 | 0.33 | 60% | 60% | 59% |
100588589 | Partial Oxide Um | 0.88 | 1.03 | 1.13 | 0.47 | 47% | 54% | 58% |
| 100772773 | Partial Oxide Intr | 0.77 | 0.74 | 0.96 | 0.23 | 70% | 69% | 76% |
100829830 | Unoxidized Lower Seds | 1.18 | 1.04 | 1.33 | 0.31 | 74% | 70% | 77% |
| 101024026 | Unox Volc | 1.30 | 0.85 | 1.04 | 0.31 | 76% | 64% | 70% |
| 101273274 | Unox Volc | 1.00 | 0.92 | 1.11 | 0.25 | 75% | 73% | 78% |
101291292 | Partial Oxide Volc | 1.24 | 0.71 | 1.51 | 0.21 | 83% | 70% | 86% |
101437438 | Partial Oxide Volc | 0.60 | 1.44 | 1.12 | 0.46 | 23% | 68% | 59% |
101548549 | Partial Oxide Volc | 2.47 | 1.17 | 3.22 | 0.16 | 94% | 86% | 95% |
101604605 | Partial Oxide Volc | 1.70 | 0.80 | 1.36 | 0.35 | 79% | 56% | 74% |
101618619 | Partial Oxide Volc | 1.15 | 0.96 | 1.14 | 0.47 | 59% | 51% | 59% |
101774775 | Partial Oxide Volc | 1.13 | 0.82 | 1.06 | 0.16 | 86% | 80% | 85% |
101827829 | Partial Oxide Volc | 0.72 | 0.84 | 0.59 | 0.12 | 83% | 86% | 80% |
101847849 | Partial Oxide Volc | 0.80 | 0.81 | 1.05 | 0.44 | 45% | 46% | 58% |
101896897 | Partial Oxide Volc | 3.36 | 1.16 | 1.17 | 0.89 | 74% | 23% | 24% |
102070071 | Trace Oxide Volc | 0.44 | 0.49 | 0.74 | 0.06 | 86% | 88% | 92% |
102096097 | Trace Oxide Volc | 1.35 | 1.03 | 0.94 | 0.28 | 79% | 73% | 70% |
102536537 | Comp Ox Upper Seds | 1.67 | 1.09 | 0.69 | 0.07 | 96% | 94% | 90% |
102575576 | Part Oxide Upper Seds | 0.77 | 1.96 | 1.16 | 0.05 | 94% | 97% | 96% |
102642643 | Part Oxide Upper Seds | 0.58 | 0.71 | 0.81 | 0.25 | 57% | 65% | 69% |
102886887 | Part Oxide Upper Seds | 0.96 | 0.95 | 1.05 | 0.69 | 28% | 27% | 34% |
102925926 | Part Oxide Upper Seds | 1.46 | 1.16 | 1.49 | 0.77 | 47% | 34% | 48% |
| 133 |
| August 2011 Summary Report On The Livengood Project, Tolovana District., Alaska |
| Sample ID | Mineralization Type | Hazen Head Au g/t | Chemex Head Au g/t | Calculated Head Au g/t | Residue Assay Au g/t | Hazen Gold Extraction | Chemex Gold Extraction | Calculated Head Extraction |
103110111 | Part Oxide Upper Seds | 0.63 | 0.91 | 0.87 | 0.22 | 65% | 76% | 75% |
*Samples were 1400 gram bottle rolls with sample material crushed to -10 mesh and sampled in multiples of 4 hours for a total of 72 hours.
Table 13.4 Gold Recovery Results from Kappes Cassiday Cyanide Extraction Tests (-200 Mesh)
| Sample ID | Calculated Head, Au g/t | Extracted, Au g/t | Avg. Tails, Au g/t | Au Extracted, % | Leach Time, days | Consumption on NaCN, kg/t | Addition Ca(OH)2, kg/t |
| 100112113 | 0.459 | 0.39 | 0.073 | 84.10% | 3 | 1.1 | 2.75 |
| 100123124 | 0.609 | 0.47 | 0.144 | 76.40% | 3 | 0.45 | 1 |
| 100588589 | 1.686 | 1.23 | 0.461 | 72.70% | 3 | 0.53 | 2 |
| 100772773 | 0.728 | 0.51 | 0.221 | 69.60% | 3 | 2.01 | 2.75 |
| 100829830 | 1.278 | 1.06 | 0.221 | 82.70% | 3 | 0.55 | 2.5 |
| 101024026 | 0.62 | 0.54 | 0.077 | 87.60% | 3 | 0.66 | 2.25 |
| 101273274 | 0.787 | 0.68 | 0.105 | 86.70% | 3 | 0.51 | 1.5 |
| 101291292 | 1.333 | 1.21 | 0.125 | 90.60% | 3 | 0.81 | 1 |
| 101437438 | 0.819 | 0.57 | 0.247 | 69.80% | 3 | 0.48 | 1.5 |
| 101548549 | 2.67 | 2.51 | 0.162 | 93.90% | 3 | 0.22 | 1.5 |
| 101604605 | 0.992 | 0.83 | 0.166 | 83.20% | 3 | 0.37 | 1.5 |
| 101618619 | 1.434 | 1.15 | 0.28 | 80.50% | 3 | 0.82 | 2.5 |
| 101774775 | 1.069 | 1 | 0.068 | 93.70% | 3 | 0.56 | 1.5 |
| 101827829 | 2.733 | 2.67 | 0.063 | 97.70% | 3 | 0.66 | 1.5 |
| 101847849 | 1.279 | 0.75 | 0.525 | 59.00% | 3 | 0.48 | 1.5 |
| 101896897 | 1.269 | 0.52 | 0.747 | 41.10% | 3 | 0.79 | 1.5 |
| 101925926 | 1.552 | 1 | 0.555 | 64.20% | 3 | 0.12 | 1.5 |
| 102070071 | 0.594 | 0.52 | 0.077 | 87.00% | 3 | 0.72 | 2 |
| 102096097 | 1.074 | 0.96 | 0.117 | 89.10% | 3 | 0.57 | 1.5 |
| 102536537 | 0.875 | 0.84 | 0.034 | 96.10% | 3 | 0.69 | 2 |
| 102575576 | 0.927 | 0.87 | 0.053 | 94.30% | 3 | 0.71 | 1.5 |
| 102642643 | 0.596 | 0.48 | 0.12 | 79.90% | 3 | 2.49 | 4 |
| 102886887 | 0.873 | 0.36 | 0.51 | 41.60% | 3 | 1.28 | 4 |
| 103110111 | 0.711 | 0.6 | 0.11 | 84.60% | 3 | 0.94 | 2.5 |
| Average | 1.124 | 0.9 | 0.219 | 79.40% | -- | 0.77 | 1.99 |
*Samples were 1000 gram bottle rolls with sample material crushed to-200 mesh and sampled in multiples of 4 hours for a total of 72 hours.
| 134 |
| August 2011 Summary Report On The Livengood Project, Tolovana District., Alaska |
| 13.4.2 | Kappes Cassiday and Associates (KCA) Test Work |
Comparing the results of the two test series, indications were that finer grinding improved the overall gold recovery, in some cases as much as 18 percentage points. These results indicated that the gold was not refractory, but is tightly held in the mineralization matrix. The gold recovery averaged 79.4 percent on an average head grade of 1.12 g/t. Lime and cyanide consumption data were also gathered during this series of tests and are presented inTable 13.4.
A test work program (February 2010) was performed at KCA on Livengood mineralized samples. KCA also contracted with ALS Minerals to perform ICP analyses of the composites, and Phillips Enterprises LLC to perform grinding and abrasion studies. Results from this program have been compiled and summarized as follows.
Test work was completed on thirty five composites made up of 1195 individual samples from the Livengood drilling campaign. The composites were of eight different stratigraphic units further delineated by the degree of oxidation and gold grade. The test work was performed to further investigate chemical and physical characteristics of the mineralization, and the effectiveness of gravity and cyanidation for gold recovery.
Initially, thirty-five test composites were sorted and provided to the laboratory for testing. The samples represented eight different stratigraphic units with distinct silicate mineral assemblages. Samples from each stratigraphic unit were selected to represent variations in grade and degree of surficial oxidation. Samples that made up the composites were sorted on site into 35 bins with an average weight of 200 kilograms. These bins were shipped directly to the KCA laboratory in Reno, NV.
An additional 8 composites were sorted from drilling of the Sunshine Zone. These composites were similar to two of the stratigraphic units previously supplied to KCA, Upper Sediments and Kint.
When the samples arrived at the lab, they were identified by composite, logged in, and weighed. The lab blended the samples to insure the composites were thoroughly mixed and homogenous prior to removing any sample splits. Samples were handled and stored in a manner which prevented the possibility of cross contamination with other clients’ samples and other Livengood composites.
The primary focus of the test work campaign was to identify the chemistry of each of the composites, identify the potential for utilizing gravity separation and cyanidation as a metallurgical processes for gold extraction, and establishing preliminary grinding parameters for the various Livengood mineralization types. The lab conducted grind studies to develop laboratory stage ball mill grind times and developed Bond Ball Work indices. Gravity concentration test work has been performed in a stage grinding test that identified the total gravity recoverable gold (GRG). Cyanide shake leach tests and cyanidation bottle roll tests were performed in duplicate and at a target 80% passing 10 mesh, 100 mesh, and 200 mesh grind sizes.
The Livengood Samples were initially separated by the following Stratigraphic Units
- Overburden
- Upper Sediments
- Main Volcanics
| 135 |
| August 2011 Summary Report On The Livengood Project, Tolovana District., Alaska |
- Lower Sediments
- Lower Sands
- Kint
- Cambrian
- Amy Sequence
Each Stratigraphic Unit was then separated by degree of Oxidation
- None
- Trace
- Partial and Complete
Each Stratigraphic Unit by degree of Oxidation was composited by grade
- 0.5 ppm Au to 1.0 ppm
- >1.0 ppm to 5.0 ppm
Using this methodology the total number of composite samples came to 54. However, some of the composites selected were volumetrically insignificant in the deposit and therefore the total number of composites submitted totaled 41.
The composites were blended in order to ensure each composite was homogeneous prior to removing any sample splits. Most of the composites weighed approximately 200 kg each, with 5 composites weighing about 40 to 50 kg.
Each composite had a multi-element analysis performed by ALS Minerals (4-acid digest ICP-MS method ME-MS61m). Gold was determined by triplicate 1 kg screen fire assays and silver was determined by triplicate fire assays with an AA finish. Composites were also analyzed for sulfate, sulfide and total sulfur, as well as carbonate, organic carbon and total carbon.
All of the composites had a comparative cyanide leach assay using a hot cyanide leach and a cold cyanide leach. The tests were performed under conditions listed inTable 13.5.
After leaching the samples were then centrifuged and the solution removed for Au assay by atomic absorption spectrometry. Assays were performed in triplicate.
As indicated by the test results, (Table 13.6 and 13.7)the response of the Livengood mineralization to the CN shake leach test procedure for determining gold leachability was poor. The poor results were later found to be linked to “active” organic carbon in some of the mineralization, slow leaching gold mineralization, and large gold particle sizes.
| 13.4.2.1 | Grind Studies and Ball Mill Bond Work Indices Tests |
Grind studies were performed on each of the composites to establish grind time versus grind size relationships. This information was used to prepare samples for future studies at varying grind sizes.
| 136 |
| August 2011 Summary Report On The Livengood Project, Tolovana District., Alaska |
In addition to the above grinding tests, Bond Ball Work Index tests were performed. The results of these tests will be used to obtain preliminary grinding operating costs and to perform preliminary mill sizing calculations.
Table 13.5 Cyanide Shake Leach Test Procedure Parameters
| Procedure | Sample wt. | Soln. Temp. | Soln. NaCN Conc. | Soln. Amount | Leach Time |
| Hot Cyanide Leach | 30 g | 60°C | 0.50 % | 60 mL | 1 hour |
| Cold Cyanide Leach | 30 g | Ambient | 0.50 % | 60 mL | 1 hour |
Table 13.6 Main Zone Summary of Cyanide Shake Tests (5 GPL NACN)
| Description | Average Head Assay, Au g/t | Average Met Screen, Au g/t | Overall Average Head, Au g/t | Avg. Cyanide Sol.(22 °C), Au g/t | Avg. Cyanide Sol.(60 °C), Au g/t |
| Overburden: Partial Ox (L) | 0.82 | 0.59 | 0.71 | 0.27 | 0.3 |
| Cambrian: Partial Ox (L) | 0.28 | 1.21 | 0.75 | 0.19 | 0.21 |
| Cambrian: Partial Ox (H) | 2.17 | 1.78 | 1.97 | 0.21 | 0.21 |
| Cambrian: Trace Ox (L) | 0.69 | 0.66 | 0.67 | 0.15 | 0.15 |
| Cambrian: Trace Ox (H) | 1.79 | 1.79 | 1.79 | 0.23 | 0.36 |
| Kint: Partial Ox (L) | 0.8 | 0.72 | 0.76 | 0.21 | 0.25 |
| Kint: Partial Ox (H) | 0.68 | 2.18 | 1.43 | 0.41 | 0.47 |
| Kint: Trace Ox (L) | 0.73 | 0.76 | 0.75 | 0.02 | 0.02 |
| Kint: Trace Ox (H) | 0.68 | 1.43 | 1.06 | 0.01 | 0.03 |
| Kint: No Ox (L) | 0.66 | 0.89 | 0.77 | 0.02 | 0.01 |
| Kint: No Ox (H) | 0.93 | 0.95 | 0.94 | 0.01 | 0.05 |
| Lower Seds: Trace Ox (L) | 0.74 | 1 | 0.87 | 0.01 | 0.01 |
| Lower Seds: Trace Ox (H) | 1.81 | 0.85 | 1.33 | 0.01 | 0.02 |
| Lower Seds: No Ox (L) | 0.54 | 0.73 | 0.63 | 0.01 | 0.02 |
| Lower Seds: No Ox (H) | 0.78 | 1.1 | 0.94 | 0.01 | 0.02 |
| Main Volcanics: Partial Ox (L) | 0.53 | 0.77 | 0.65 | 0.16 | 0.25 |
| Main Volcanics: Partial Ox (H) | 1.79 | 1.75 | 1.77 | 0.19 | 0.39 |
| Main Volcanics: Trace Ox (L) | 0.73 | 0.74 | 0.73 | 0.03 | 0.1 |
| 137 |
| August 2011 Summary Report On The Livengood Project, Tolovana District., Alaska |
| Description | Average Head Assay, Au g/t | Average Met Screen, Au g/t | Overall Average Head, Au g/t | Avg. Cyanide Sol.(22 °C), Au g/t | Avg. Cyanide Sol.(60 °C), Au g/t |
| Main Volcanics: Trace Ox (H) | 1.12 | 1.55 | 1.33 | 0.05 | 0.07 |
| Main Volcanics: No Ox (L) | 0.96 | 1.02 | 0.99 | 0.05 | 0.08 |
| Main Volcanics: No Ox (H) | 3.01 | 1.88 | 2.45 | 0.03 | 0.06 |
| Upper Seds: Partial Ox (L) | 1.84 | 0.89 | 1.36 | 0.23 | 0.2 |
| Upper Seds: Partial Ox (H) | 1.3 | 1.4 | 1.35 | 0.38 | 0.41 |
| Upper Seds: Trace Ox (L) | 1.25 | 1.11 | 1.18 | 0.06 | 0.03 |
| Upper Seds: Trace Ox (H) | 0.94 | 1.53 | 1.24 | 0.09 | 0.08 |
| Upper Seds: No Ox (L) | 0.77 | 1.14 | 0.95 | 0.05 | 0.01 |
| Upper Seds: No Ox (H) | 2.77 | 0.99 | 1.88 | 0.06 | 0.03 |
| Lower Sand: Partial Ox (L) | 0.8 | 0.98 | 0.89 | 0.01 | 0.03 |
| Lower Sand: Partial Ox (H) | 1.52 | 2.01 | 1.76 | 0.04 | 0.05 |
| Lower Sand: Trace Ox (L) | 1.29 | 0.7 | 0.99 | 0.02 | 0.01 |
| Lower Sand: Trace Ox (H) | 0.82 | 1.33 | 1.08 | 0.03 | 0.01 |
| Lower Sand: No Ox (L) | 1.05 | 0.59 | 0.82 | 0.03 | 0.06 |
| Lower Sand: No Ox (H) | 0.75 | 1.25 | 1 | 0.05 | 0.02 |
| Amy Sequence: Partial Ox (L) | 1.34 | 0.29 | 0.81 | 0.09 | 0.09 |
| Amy Sequence: No Ox (L) | 0.49 | 0.44 | 0.46 | 0.03 | 0.06 |
| Average | 1.12 | 0.1 | 0.12 | ||
Descriptions from documentation provided by Talon Gold: (L) - 0.5 ≤ Au g/t ≤ 1.0; (H) - 1.0 ≤ Au g/t ≤ 5.0
| 138 |
| August 2011 Summary Report On The Livengood Project, Tolovana District., Alaska |
Table 13.7 Sunshine Zone Summary of Cyanide Shake Tests (5 GPL NACN)
| Description | Average Head Assay, Au g/t | Average Met Screen, Au g/t | Overall Average Head, Au g/t | Average Cyanide Sol. (22 °C), Au g/t | Average Cyanide Sol. (60 °C), Au g/t |
| Kint: Ox_high | 2.25 | 1.51 | 1.88 | 0.35 | 0.51 |
| Kint: Ox_Low | 0.59 | 1.03 | 0.81 | 0.17 | 0.27 |
| Kint:TraceOx_High | 1.34 | 1.44 | 1.39 | 0.22 | 0.21 |
| Kint: TraceOx_Low | 1.24 | 0.81 | 1.02 | 0.13 | 0.22 |
| Upper Seds: Ox_High | 0.77 | 1.50 | 1.13 | 0.24 | 0.41 |
| Upper Seds: Ox_Low | 2.38 | 0.99 | 1.68 | 0.15 | 0.25 |
| Upper Seds: Trace_High | 1.32 | 1.60 | 1.46 | 0.18 | 0.25 |
| Upper Seds: Trace_Low | 0.63 | 0.84 | 0.74 | 0.09 | 0.19 |
| Average | 1.26 | 0.19 | 0.29 | ||
A total of 43 composites were tested to achieve a work index for each of the mineralization types.Tables 13.8 and 13.9provide the results of the Bond Ball Work Index tests for rock from the Main Zone and the Sunshine Zone respectively. Since the samples used for performing the tests were finer than typically received for bond testing, a conservative factor of 1.2 has been applied to the test work results.
Table 13.8 Main Zone Bond Ball Mill Work Index Test Results
| Description | BWI kW-hr/st | BWI kW-hr/MT | BWI x 1.2 kW- hr/st | bwi x 1.2 kW-hr/MT |
| Overburden: Partial Ox (L) | 9.81 | 10.82 | 11.78 | 12.98 |
| Cambrian: Partial Ox (L) | 11.21 | 12.36 | 13.45 | 14.83 |
| Cambrian: Partial Ox (H) | 9.76 | 10.76 | 11.71 | 12.91 |
| Cambrian: Trace Ox (L) | 12.66 | 13.96 | 15.19 | 16.75 |
| Cambrian: Trace Ox (H) | 11 | 12.12 | 13.2 | 14.55 |
| Kint: Partial Ox (L) | 11.25 | 12.41 | 13.5 | 14.89 |
| Kint: Partial Ox (H) | 11.8 | 13.01 | 14.16 | 15.61 |
| Kint: Trace Ox (L) | 13.2 | 14.55 | 15.83 | 17.46 |
| Kint: Trace Ox (H) | 13.06 | 14.4 | 15.67 | 17.28 |
| Kint: No Ox (L) | 13.44 | 14.82 | 16.13 | 17.78 |
| Kint: No Ox (H) | 13.16 | 14.51 | 15.79 | 17.41 |
| Lower Seds: Trace Ox (L) | 13.33 | 14.7 | 16 | 17.64 |
| Lower Seds: Trace Ox (H) | 13.09 | 14.43 | 15.7 | 17.31 |
| Lower Seds: No Ox (L) | 13.26 | 14.62 | 15.92 | 17.55 |
| Lower Seds: No Ox (H) | 13.55 | 14.94 | 16.26 | 17.93 |
| Main Volcanics: Partial Ox (L) | 13.07 | 14.41 | 15.68 | 17.29 |
| Main Volcanics: Partial Ox (H) | 12.75 | 14.06 | 15.31 | 16.87 |
| Main Volcanics: Trace Ox (L) | 14.81 | 16.32 | 17.77 | 19.59 |
| Main Volcanics: Trace Ox (H) | 13.26 | 14.61 | 15.91 | 17.54 |
| Main Volcanics: No Ox (L) | 13.65 | 15.05 | 16.38 | 18.06 |
| Main Volcanics: No Ox (H) | 13.49 | 14.87 | 16.18 | 17.84 |
| Upper Seds: Partial Ox (L) | 13.53 | 14.91 | 16.23 | 17.89 |
| 139 |
| August 2011 Summary Report On The Livengood Project, Tolovana District., Alaska |
| Description | BWI kW-hr/st | BWI kW-hr/MT | BWI x 1.2 kW- hr/st | bwi x 1.2 kW-hr/MT |
| Upper Seds: Partial Ox (H) | 13.2 | 14.56 | 15.84 | 17.47 |
| Upper Seds: Trace Ox (L) | 13.21 | 14.57 | 15.85 | 17.48 |
| Upper Seds: Trace Ox (H) | 13.29 | 14.66 | 15.95 | 17.59 |
| Upper Seds: No Ox (L) | 13.69 | 15.09 | 16.42 | 18.11 |
| Upper Seds: No Ox (H) | 14.18 | 15.63 | 17.02 | 18.76 |
| Lower Sand: Partial Ox (L) | 15.36 | 16.93 | 18.43 | 20.32 |
| Lower Sand: Partial Ox (H) | 15.53 | 17.12 | 18.63 | 20.54 |
| Lower Sand: Trace Ox (L) | 15.92 | 17.55 | 19.11 | 21.06 |
| Lower Sand: Trace Ox (H) | 15.23 | 16.79 | 18.27 | 20.14 |
| Lower Sand: No Ox (L) | 15.18 | 16.73 | 18.21 | 20.08 |
| Lower Sand: No Ox (H) | 15.36 | 16.93 | 18.43 | 20.32 |
| Amy Sequence: Partial Ox (L) | 12.51 | 13.8 | 15.02 | 16.56 |
| Amy Sequence: No Ox (L) | 9.23 | 10.18 | 11.08 | 12.21 |
| Average | 13.14 | 14.49 | 15.77 | 17.39 |
Table 13.9 Sunshine Zone Bond Ball Mill Work Index Test Results
| Description | BWI kW-hr/st | BWI kW- hr/MT | BWI x 1.2 kW-hr/st | BWI x 1.2 kW- hr/MT |
| Kint_Ox_high | 11.89 | 13.11 | 14.26 | 15.73 |
| Kint_Ox_Low | 12.12 | 13.36 | 14.54 | 16.03 |
| Kint_TraceOx_High | 12.92 | 14.24 | 15.50 | 17.09 |
| Kint_TraceOx_Low | 12.69 | 13.99 | 15.23 | 16.79 |
| US_Ox_High | 12.05 | 13.28 | 14.46 | 15.94 |
| US_Ox_Low | 12.67 | 13.97 | 15.20 | 16.76 |
| US_Trace_High | 12.96 | 14.29 | 15.55 | 17.15 |
| US_Trace_Low | 13.00 | 14.33 | 15.59 | 17.19 |
| Average | 12.54 | 13.82 | 15.04 | 16.59 |
Fifteen core samples from the Livengood property were obtained for abrasion tests. The results are shown inTable 13.10.The abrasion data indicates that the Livengood mineralized material varies from being medium abrasive (Ai of 0.30) to relatively non-abrasive (Ai less than 0.10) .
| 140 |
| August 2011 Summary Report On The Livengood Project, Tolovana District., Alaska |
Table 13.10 Summary of Results – Abrasion Test – Phillips Report 093029_15 October 2009
| Description | Rock Type | Alteration Type | Ai |
| Upper Seds: Partial Ox | Siltstone | Sericite | 0.0023 |
| Upper Seds: No Ox | Siltstone | Sericite | 0.1497 |
| Upper Seds: Partial Ox | Sandstone | Sericite | 0.012 |
| Upper Seds: Partial Ox | Shale | Albite Mica | 0.0848 |
| Lower Seds: No Ox | Shale | Sericite | 0.0189 |
| Main Volcanics: No Ox | Andesite | Mixed Albite Mica Kspar | 0.0391 |
| Main Volcanics: Partial Ox | Volcanic Breccia | Albite | 0.2872 |
| Main Volcanics: Partial Ox | Volcanic Breccia | Clay Mica | 0.1151 |
| Main Volcanics: Partial Ox | Tuff | Sericite | 0.1627 |
| Main Volcanics: Partial Ox | Tuff | Albite Mica | 0.0643 |
| Amy Sequence: Trace Ox | Chert | Albite Mica | 0.204 |
| Cambrian: Partial Ox | Serpentinite | No K or Na | 0.0111 |
| Cambrian: Partial Ox | Listwanite | Dolomite Clay Mica | 0.0161 |
| Cambrian: Trace Ox | Serpentinite | No K or Na | 0.0343 |
| Cambrian: Trace Ox | Gabbro | Clay Mica | 0.0118 |
| 13.4.2.2 | Gravity Centrifugal Concentration Evaluation |
The Knelson® Gravity Recoverable Gold (GRG) tests were performed. The test consists of three sequential liberation and recovery stages. The progressive grinding was necessary to obtain an accurate GRG value, an indication of the size distribution of the GRG and a measure of progressive liberation. It also limits any smearing of coarse gold particles that may be present in the as-crushed sample.
The GRG test is based on the treatment of a sample mass of typically 20 kg using a laboratory Knelson Concentrator (KC-MD3).Table 13.11summarizes the test procedure.
Stage recoveries were based on the concentrate and tail assay of each stage. However, overall recovery is based on the assays of the three concentrates produced and the tails product of the third recovery stage, whose assays are more reliable than those of the first two, which still contain some of the GRG. Gold assays on the products are by fire assay and in duplicate when sufficient sample exists.
Results from this test work for the Main and Sunshine Zones is shown inTable 13.12 and13.13respectively. The gold in the Livengood mineralization appears to respond well to gravity separation.
| 13.4.2.3 | Bottle Roll Leach Tests |
Composite samples were be used to run 72 hour bottle roll tests. For those composites with adequate amount of sample, bottle roll tests were run at 10 mesh, 100 mesh, and 200 mesh grinds. Each bottle roll test had solution removed for Au assay at 2, 4, 8, 12, 24, 36, 48, and 72 hour intervals. Cyanide and pH levels were also checked as often as necessary to maintain reagents at adequate leach conditions. Reagent consumptions were monitored and lime and cyanide consumptions were calculated. Composites with insufficient amounts had only 72 hour bottle rolls run on them at the -200 mesh grind size. Results from this test work for the Main and Sunshine Zones is shown inTable 13.12 and13.13respectively. The gold in the Livengood mineralization appears to respond well to gravity separation.
| 141 |
| August 2011 Summary Report On The Livengood Project, Tolovana District., Alaska |
Table 13.11 Procedures for Knelson Concentrator Testwork
| SampleRequire-ments | 30 Kg of sample is required to perform a standard GRG test. 20 Kg of sample isrequired for the GRG test and the other 10 Kg sample is used for a grinding testprior to running the GRG. | ||
| Particle Size Requirements | Operating Variables | Sample collection | |
Stage 1 | 90 - 100% -850 µm | Feed Rate: 800-1000 g/min Fluid’n Water (FW): 3.5 l/min | º Total Knelson concentrate for fire assay to extinction* º 300 gr. tail sample for fire assay º Bulk tails to stage 2 |
Stage 2 | 45 - 60% -75 µm | Feed Rate: 600-900 g/min F.W: 3.5 l/min | º Total Knelson concentrate for fire assay to extinction* º 300 gr. tails sample for fire assay º Bulk tails to stage 3 |
Stage 3 | 75 - 80% -75 µm | Feed Rate: 400-800 g/min F.W: 3.5 l/min | º Total Knelson concentrate for fire assay to extinction* º 300 gr. of tails for fire assay |
| * | the concentrate can be panned for a visual observation of the concentrate - the panned products should then be assayed to extinction. |
Table 13.12 Main Zone Knelson Concentrator – Gravity Recoverable Summary
| Description | Calculated Head, Au g/t | Conc + Mid Wt. % | Conc + Mid Assay, Au g/t | Conc + Mid Rec % Au | Conc + Mid Assay, Au g/t | Conc + Mid Rec % Ag |
| Overburden: Partial Ox (L) | 0.55 | 1.30% | 20.79 | 49.60% | 14.3 | 7.30% |
| Cambrian: Partial Ox (L) | 0.62 | 1.50% | 28.16 | 66.40% | 13.8 | 9.10% |
| Cambrian: Partial Ox (H) | 1.34 | 1.30% | 76.95 | 76.20% | 15.6 | 10.90% |
| Cambrian: Trace Ox (L) | 0.63 | 1.50% | 29.88 | 69.80% | 9.1 | 6.20% |
| Cambrian: Trace Ox (H) | 1.59 | 1.50% | 89.01 | 82.00% | 13.8 | 10.70% |
| Kint: Partial Ox (L) | 0.8 | 1.50% | 19.07 | 35.60% | 5.5 | 3.40% |
| Kint: Partial Ox (H) | 1.67 | 1.50% | 36.9 | 33.10% | 10.2 | 5.40% |
| Kint: Trace Ox (L) | 0.96 | 1.50% | 25.72 | 40.60% | 7.6 | 4.10% |
| Kint: Trace Ox (H) | 1.41 | 1.50% | 41.93 | 45.10% | 7.2 | 5.10% |
| Kint: No Ox (L) | 0.77 | 1.50% | 15.77 | 31.10% | 4.5 | 2.80% |
| Kint: No Ox (H) | 1.4 | 1.50% | 37.31 | 40.90% | 5.6 | 2.80% |
| 142 |
| August 2011 Summary Report On The Livengood Project, Tolovana District., Alaska |
| Description | Calculated Head, Au g/t | Conc + Mid Wt. % | Conc + Mid Assay, Au g/t | Conc + Mid Rec % Au | Conc + Mid Assay, Au g/t | Conc + Mid Rec % Ag |
| Lower Seds: Trace Ox (L) | 1.12 | 1.50% | 38.88 | 52.30% | 5.8 | 3.20% |
| Lower Seds: Trace Ox (H) | 1.21 | 1.50% | 40.88 | 51.70% | 12 | 8.30% |
| Lower Seds: No Ox (L) | 0.75 | 1.50% | 32.79 | 63.90% | 6.3 | 4.40% |
| Lower Seds: No Ox (H) | 1.21 | 1.50% | 55.36 | 67.20% | 9.5 | 6.50% |
| Main Volcanics: Partial Ox (L) | 0.79 | 1.40% | 22.37 | 40.10% | 7.2 | 4.80% |
| Main Volcanics: Partial Ox (H) | 1.8 | 1.40% | 87.75 | 70.20% | 12.9 | 9.90% |
| Main Volcanics: Trace Ox (L) | 0.9 | 1.50% | 23.83 | 38.70% | 5.5 | 2.90% |
| Main Volcanics: Trace Ox (H) | 1.65 | 1.50% | 54.1 | 48.30% | 7.9 | 4.20% |
| Main Volcanics: No Ox (L) | 0.86 | 1.50% | 23.2 | 40.10% | 4.1 | 3.00% |
| Main Volcanics: No Ox (H) | 1.84 | 1.50% | 52.81 | 43.50% | 6.2 | 3.40% |
| Upper Seds: Partial Ox (L) | 0.84 | 1.40% | 30.7 | 50.40% | 6.6 | 6.30% |
| Upper Seds: Partial Ox (H) | 1.42 | 1.40% | 57.79 | 58.90% | 8.9 | 7.00% |
| Upper Seds: Trace Ox (L) | 0.8 | 1.40% | 36.33 | 63.50% | 8.2 | 4.60% |
| Upper Seds: Trace Ox (H) | 1.42 | 1.40% | 73.57 | 72.90% | 10.1 | 6.60% |
| Upper Seds: No Ox (L) | 0.84 | 1.40% | 39.56 | 65.30% | 8.3 | 4.70% |
| Upper Seds: No Ox (H) | 1.11 | 1.40% | 58.55 | 73.80% | 8.1 | 5.30% |
| Lower Sand: Partial Ox (L) | 1.09 | 1.50% | 42.34 | 57.60% | 8 | 6.60% |
| Lower Sand: Partial Ox (H) | 1.42 | 1.40% | 63.66 | 65.00% | 11.8 | 6.00% |
| Lower Sand: Trace Ox (L) | 0.99 | 1.40% | 44.22 | 63.70% | 9.2 | 5.30% |
| Lower Sand: Trace Ox (H) | 1.34 | 1.50% | 58.08 | 64.60% | 9.4 | 7.60% |
| Lower Sand: No Ox (L) | 0.72 | 1.40% | 28.13 | 56.50% | 6 | 3.10% |
| Lower Sand: No Ox (H) | 1.48 | 1.40% | 74.67 | 71.80% | 11.5 | 5.80% |
| Amy Sequence: Partial Ox (L) | 0.4 | 1.30% | 15 | 49.30% | 4.2 | 2.60% |
| Amy Sequence: No Ox (L) | 0.57 | 1.40% | 24.19 | 60.20% | 7.1 | 3.60% |
| Averages | 1.45% | 42.9 | 56.00% | 8.6 | 5.50% | |
(L) - 0.5 ≤ Au g/t ≤ 1.0; (H) - 1.0 ≤ Au g/t ≤ 5.0
| 143 |
| August 2011 Summary Report On The Livengood Project, Tolovana District., Alaska |
Table 13.13 Sunshine Zone Knelson Concentrator – Gravity Recoverable Summary
| Description | Calculated Head, Au g/t | Conc + Mid Wt. % | Conc + Mid Assay, Au g/t | Conc + Mid Rec % Au | Conc + Mid Assay, Ag g/t | Conc + Mid Rec % Ag |
| Kint: Partial Ox (L) | 1.87 | 1.27% | 92.21 | 62.70% | 8.3 | 5.90% |
| Kint: Partial Ox (H) | 0.94 | 1.37% | 39.2 | 57.50% | 6.7 | 5.10% |
| Kint: Trace Ox (L) | 1.43 | 1.27% | 79.5 | 70.90% | 14.5 | 8.30% |
| Kint: Trace Ox (H) | 0.96 | 1.41% | 43.32 | 63.50% | 8.7 | 5.70% |
| Upper Seds: Partial Ox (L) | 1.07 | 1.37% | 57.54 | 73.60% | 8.1 | 6.10% |
| Upper Seds: Partial Ox (H) | 0.84 | 1.34% | 42.32 | 67.60% | 7.8 | 7.00% |
| Upper Seds: Trace Ox (L) | 1.72 | 1.45% | 95.31 | 80.50% | 10.9 | 7.80% |
| Upper Seds: Trace Ox (H) | 0.69 | 1.39% | 34.94 | 70.60% | 6.1 | 4.40% |
| Averages | 1.36% | 60.54 | 68.40% | 8.9 | 6.30% | |
(L) - 0.5 ≤ Au g/t ≤ 1.0; (H) - 1.0 ≤ Au g/t ≤ 5.0
Table 13.14 provides a summary of the bottle roll test results. They indicate that most of the Livengood mineralized materials respond positively to cyanide leaching. The bottle roll results were considerably better than the cyanide shake leach results. However, gold leach recoveries appear to be highly variable by mineralization type. The degree of oxidation also appears to have an effect on the gold cyanide leachability.
Table 13.14 Summary of Cyanide Bottle Roll Test Results
| Description | Calculated Head, Au g/t | Overall Average Assay, Au g/t | Au Extracted, % | Consumption NaCN, kg/t | Addition Ca(OH)2, kg/t |
| Overburden: Partial Ox (L) | 0.63 | 0.66 | 87% | 0.43 | 2.8 |
| Cambrian: Partial Ox (L) | 0.8 | 0.75 | 80% | 0.26 | 3 |
| Cambrian: Partial Ox (H) | 1.35 | 1.82 | 83% | 0.35 | 2.08 |
| Cambrian: Trace Ox (L) | 0.61 | 0.66 | 87% | 0.32 | 2 |
| Cambrian: Trace Ox (H) | 1.48 | 1.82 | 90% | 0.33 | 2.5 |
| Kint: Partial Ox (L) | 0.69 | 0.73 | 54% | 0.51 | 4.5 |
| Kint: Partial Ox (H) | 1.67 | 1.55 | 60% | 0.99 | 3.33 |
| Kint: Trace Ox (L) | 0.82 | 0.76 | 24% | 0.38 | 2.5 |
| Kint: Trace Ox (H) | 1.24 | 1.23 | 22% | 0.41 | 2.5 |
| Kint: No Ox (L) | 0.84 | 0.76 | 32% | 0.29 | 2.8 |
| Kint: No Ox (H) | 2.42 | 1.51 | 32% | 0.81 | 3 |
| Lower Seds: Trace Ox (L) | 1.05 | 0.88 | 0% | 0.28 | 2.33 |
| Lower Seds: Trace Ox (H) | 1.2 | 1.36 | 1% | 0.38 | 2 |
| Lower Seds: No Ox (L) | 0.62 | 0.65 | 0% | 1.78 | 2 |
| Lower Seds: No Ox (H) | 1.36 | 1.28 | 0% | 0.35 | 2 |
| 144 |
| August 2011 Summary Report On The Livengood Project, Tolovana District., Alaska |
| Description | Calculated Head, Au g/t | Overall Average Assay, Au g/t | Au Extracted, % | Consumption NaCN, kg/t | Addition Ca(OH)2, kg/t |
| Main Volcanics: Partial Ox (L) | 0.75 | 0.68 | 56% | 0.3 | 2.67 |
| Main Volcanics: Partial Ox (H) | 1.43 | 1.68 | 77% | 0.36 | 3.17 |
| Main Volcanics: Trace Ox (L) | 0.82 | 0.75 | 36% | 0.51 | 2 |
| Main Volcanics: Trace Ox (H) | 1.45 | 1.42 | 42% | 2.21 | 2 |
| Main Volcanics: No Ox (L) | 0.97 | 0.91 | 49% | 0.2 | 2 |
| Main Volcanics: No Ox (H) | 1.66 | 2.1 | 39% | 2.13 | 2 |
| Upper Seds: Partial Ox (L) | 0.71 | 1.05 | 64% | 0.35 | 2 |
| Upper Seds: Partial Ox (H) | 1.45 | 1.5 | 80% | 0.37 | 2 |
| Upper Seds: Trace Ox (L) | 0.89 | 0.97 | 37% | 0.22 | 2 |
| Upper Seds: Trace Ox (H) | 1.67 | 1.58 | 73% | 0.42 | 2 |
| Upper Seds: No Ox (L) | 0.76 | 0.85 | 26% | 0.31 | 2 |
| Upper Seds: No Ox (H) | 1.28 | 1.68 | 55% | 0.32 | 2 |
| Lower Sand: Partial Ox (L) | 0.91 | 0.86 | 49% | 1.98 | 2 |
| Lower Sand: Partial Ox (H) | 1.1 | 1.52 | 61% | 0.63 | 2 |
| Lower Sand: Trace Ox (L) | 1.09 | 0.94 | 48% | 0.39 | 2.5 |
| Lower Sand: Trace Ox (H) | 1.35 | 1.32 | 67% | 0.4 | 2.33 |
| Lower Sand: No Ox (L) | 0.68 | 0.75 | 21% | 0.45 | 2 |
| Lower Sand: No Ox (H) | 1.32 | 1.28 | 55% | 0.55 | 2.33 |
| Amy Sequence: Partial Ox (L) | 0.39 | 0.7 | 49% | 0.24 | 2.6 |
| Amy Sequence: No Ox (L) | 0.52 | 0.51 | 4% | 0.22 | 2.5 |
| Average | 1.09 | 1.13 | 47% | 0.59 | 2.38 |
| 13.4.2.4 | Bottle Roll CIL Tests |
After reviewing the data from the bottle roll leach tests and the cyanide shake leach tests, it was determined that bottle roll CIL tests should be performed to establish if the poor response to cyanide leaching by some of the mineralized material types was due to “preg-robbing” issues. Thus, the same composite samples were used to run 92 hour bottle roll CIL tests. All of the bottle roll CIL tests were run at 200 mesh grinds. Cyanide and pH levels were checked as often as necessary to maintain reagents at adequate leach conditions. Reagent consumptions were monitored and lime and cyanide consumptions were calculated.
Recoveries improved significantly, with some mineralization types showing as high as a 49.5% increase in overall gold recovery, with the addition of carbon in the cyanide leach process. It appears that some of the mineralization types have “preg- robbing” characteristics, which explain the poor response observed in the cyanide shake leach tests. Fortunately, the presence of activated carbon offsets, to a major degree, the “preg-robbing” nature of the mineralization.
Similar tests were run on Sunshine Zone mineralized materials.Tables 13.15 and13.16illustrate the results of these tests from the Main and Sunshine Zone respectively.
| 145 |
| August 2011 Summary Report On The Livengood Project, Tolovana District., Alaska |
| 13.4.2.5 | Flotation Concentration Tests |
To understand how Livengood mineralization responds to sulfide flotation, a test program was developed for KCA to perform on their existing Livengood mineralized material composites. Knowing that the Livengood mineralization has a substantial amount of coarse gold, a test protocol was developed that would first subject the material to sulfide flotation followed by performing a GRG test on the flotation tailing. From this test scenario, a better understanding is gained of the ability to float the coarse gold while understanding the ability to collect gold in a pre- or post-flotation gravity circuit.
Batch flotation tests were performed by Kappes, Cassidy and Associates on samples drawn for the composites prepared for metallurgical testing from the reverse circulation drilling samples as described earlier in this report (Section 13.5). Duplicate tests were conducted for each of the samples, with the sample material being ground to nominally 80% passing 0.075 mm. The samples were then conditioned for 5 minutes with 5 g/t of CuSO4 and 25 g/t of PAX. A float concentrate was then produced in 20 minutes with rougher flotation parameters of 25% solids and AF 70-20 g/t. The flotation tails were then run through a Knelson Concentrator to collect the remaining gravity recoverable gold. The middlings portion was recovered by hand panning the gravity concentrate. All concentrate fractions and the gravity tails were assayed for gold and silver.
Results of the duplicate tests have been averaged and the proportion of total gold recovered by flotation and gravity are listed inTable 13.17.
| 13.4.2.6 | CIL Recovery on Gravity Concentrates |
Carbon in Leach (CIL) bottle roll tests (BRT) were performed on samples used to produce a gravity recoverable gold concentrate. Twenty kilogram (20 kg) samples were split from the composites
| 146 |
| August 2011 Summary Report On The Livengood Project, Tolovana District, Alaska |
Table 13.15 Main Zone Summary of CIL Cyanide Bottle Roll Tests
Description | Calculated Head, | Overall Average Assay, | CIL Au Rec, % | BRT Au Rec, % | Difference between CIL and BRT Au Rec, % |
Overburden: Partial Ox (L) | 0.63 | 0.66 | 86.7% | 87.2% | -0.5% |
Cambrian: Partial Ox (L) | 0.44 | 0.44 | 89.0% | 80.0% | 9.0% |
Cambrian: Partial Ox (H) | 1.33 | 1.33 | 94.0% | 83.3% | 10.7% |
Cambrian: Trace Ox (L) | 0.58 | 0.58 | 95.0% | 87.0% | 8.0% |
Cambrian: Trace Ox (H) | 1.64 | 1.64 | 95.0% | 89.8% | 5.2% |
Kint: Partial Ox (L) | 0.68 | 0.68 | 59.0% | 54.0% | 5.0% |
Kint: Partial Ox (H) | 1.52 | 1.52 | 59.0% | 60.3% | -1.3% |
Kint: Trace Ox (L) | 0.78 | 0.78 | 42.0% | 24.0% | 18.0% |
Kint: Trace Ox (H) | 1.33 | 1.33 | 40.0% | 21.5% | 18.5% |
Kint: No Ox (L) | 0.76 | 0.76 | 49.0% | 31.6% | 17.4% |
Kint: No Ox (H) | 1.21 | 1.21 | 43.0% | 32.2% | 10.8% |
Lower Seds: Trace Ox (L) | 0.84 | 0.84 | 40.0% | 0.0% | 40.0% |
Lower Seds: Trace Ox (H) | 5.18 | 5.18 | 79.0% | 0.5% | 78.5% |
Lower Seds: No Ox (L) | 0.51 | 0.51 | 41.0% | 0.0% | 41.0% |
Lower Seds: No Ox (H) | 1.20 | 1.20 | 63.0% | 0.0% | 63.0% |
Main Volcanics: Partial Ox (L) | 0.76 | 0.76 | 71.0% | 55.7% | 15.3% |
Main Volcanics: Partial Ox (H) | 2.14 | 2.14 | 85.0% | 76.7% | 8.3% |
Main Volcanics: Trace Ox (L) | 0.92 | 0.92 | 63.0% | 36.2% | 26.8% |
Main Volcanics: Trace Ox (H) | 1.24 | 1.24 | 39.0% | 41.7% | -2.7% |
Main Volcanics: No Ox (L) | 1.11 | 1.11 | 65.0% | 49.0% | 16.0% |
Main Volcanics: No Ox (H) | 2.31 | 2.31 | 23.0% | 38.7% | -15.7% |
Upper Seds: Partial Ox (L) | 0.74 | 0.74 | 72.0% | 64.0% | 8.0% |
Upper Seds: Partial Ox (H) | 1.37 | 1.37 | 87.0% | 80.3% | 6.7% |
Upper Seds: Trace Ox (L) | 0.63 | 0.63 | 67.0% | 36.5% | 30.5% |
Upper Seds: Trace Ox (H) | 1.46 | 1.46 | 83.0% | 73.0% | 10.0% |
Upper Seds: No Ox (L) | 0.78 | 0.78 | 73.0% | 26.2% | 46.8% |
Upper Seds: No Ox (H) | 1.25 | 1.25 | 82.0% | 54.8% | 27.2% |
Lower Sand: Partial Ox (L) | 0.93 | 0.93 | 57.0% | 49.2% | 7.8% |
Lower Sand: Partial Ox (H) | 1.99 | 1.99 | 53.0% | 61.4% | -8.4% |
Lower Sand: Trace Ox (L) | 1.01 | 1.01 | 60.0% | 47.7% | 12.3% |
Lower Sand: Trace Ox (H) | 1.32 | 1.32 | 62.0% | 66.5% | -4.5% |
Lower Sand: No Ox (L) | 0.80 | 0.80 | 70.0% | 20.5% | 49.5% |
Lower Sand: No Ox (H) | 1.03 | 1.03 | 76.0% | 54.5% | 21.5% |
Amy Sequence: Partial Ox (L) | 0.47 | 0.47 | 79.0% | 48.8% | 30.2% |
Overall Average | 1.20 | 1.20 | 65.9% | 48.0% | 17.9% |
| 147 |
| August 2011 Summary Report On The Livengood Project, Tolovana District, Alaska |
Table 13.16 Sunshine Zone Summary of CIL Cyanide Bottle Roll Tests
| Description | Calculated Head, Au g/t | Overall Average Assay, Au g/t | CIL Au Rec, % |
| Kint_Ox_(H) | 1.97 | 2.25 | 86.50% |
| Kint_Ox_(L) | 0.69 | 0.59 | 73.00% |
| Kint_TraceOx_(H) | 0.87 | 1.34 | 79.10% |
| Kint_TraceOx_(L) | 0.73 | 1.24 | 72.40% |
| Upper Seds_Ox_(H) | 0.98 | 0.77 | 90.90% |
| Upper Seds_Ox_(L) | 1.02 | 2.38 | 94.50% |
| Upper Seds_Trace_(H) | 1.72 | 1.32 | 87.60% |
| Upper Seds_Trace_(L) | 0.54 | 0.63 | 88.60% |
| Averages | 1.31 | 84.10% | |
Table 13.17 Summary of Batch Flotation Test Results – March 2010
| Test Sample | % Gold Recovered by Flotation | % Gold Recovered by Gravity from Flotation Tails | Total Gold Recovered (%) |
| Volcanics, Partial Ox - Low Grade | 76% | 8% | 84% |
| Volcanics, Partial Ox - High Grade | 72% | 15% | 87% |
| Volcanics, Trace Ox - Low Grade | 47% | 49% | 96% |
| Volcanics, Trace Ox - High Grade | 66% | 25% | 91% |
| Volcanics, No Ox - Low Grade | 79% | 8% | 87% |
| Volcanics, No Ox - High Grade | 74% | 20% | 94% |
| Average | 69% | 21% | 90% |
| Upper Seds, Core Z, Part Ox - Low Grade | 78% | 4% | 82% |
| Upper Seds, Core Z, Part Ox - High Grade | 63% | 19% | 81% |
| Upper Seds, Core Z, Trace Ox - Low Grade | 39% | 39% | 78% |
| Upper Seds, Core Z, Trace Ox - High Grade | 27% | 69% | 96% |
| Upper Seds, Core Z, No Ox - Low Grade | 49% | 32% | 81% |
| Upper Seds, Core Z, No Ox - High Grade | 53% | 42% | 95% |
| Upper Seds, Sunshine, Part Ox - Low Grade | 61% | 26% | 87% |
| Upper Seds, Sunshine, Trace Ox - High Grade | 73% | 15% | 88% |
| Upper Seds, Sunshine, Partial Ox - High Grade | 69% | 21% | 90% |
| Upper Seds, Sunshine, Trace Ox - Low Grade | 84% | 7% | 91% |
| Average | 60% | 27% | 87% |
| Lower Seds, Trace Ox - Low Grade | 34% | 57% | 91% |
| Lower Seds, Trace Ox - High Grade | 24% | 59% | 83% |
| Lower Seds, No Ox - Low Grade | 23% | 54% | 77% |
| Lower Seds, No Ox - High Grade | 19% | 66% | 85% |
| Average | 25% | 59% | 84% |
| Cambrian, Partial Ox - Low Grade | 54% | 35% | 90% |
| 148 |
| August 2011 Summary Report On The Livengood Project, Tolovana District, Alaska |
| Test Sample | % Gold Recovered by Flotation | % Gold Recovered by Gravity from Flotation Tails | Total Gold Recovered (%) |
| Cambrian, Partial Ox - High Grade | 41% | 51% | 92% |
| Cambrian, Trace Ox - Low Grade | 74% | 22% | 95% |
| Cambrian, Trace Ox - High Grade | 52% | 44% | 96% |
| Average | 55% | 38% | 93% |
| Lower Sand, Partial Ox - Low Grade | 78% | 14% | 93% |
| Lower Sand, Partial Ox - High Grade | 80% | 14% | 94% |
| Lower Sand, Trace Ox - Low Grade | 83% | 11% | 93% |
| Lower Sand, Trace Ox - High Grade | 69% | 26% | 95% |
| Lower Sand, No Ox - Low Grade | 73% | 14% | 86% |
| Lower Sand, No Ox - High Grade | 61% | 35% | 95% |
| Average | 74% | 19% | 93% |
| Kint, Partial Ox - Low Grade | 74% | 4% | 79% |
| Kint, Partial Ox - High Grade | 59% | 21% | 80% |
| Kint, Trace Ox - Low Grade | 64% | 27% | 91% |
| Kint, Trace Ox - High Grade | 72% | 17% | 89% |
| Kint, No Ox - Low Grade | 78% | 9% | 87% |
| Kint, No Ox - High Grade | 76% | 20% | 96% |
| Kint, Trace Ox - Low Grade | 66% | 22% | 88% |
| Kint, No Ox - Low Grade | 91% | 3% | 93% |
| Average | 73% | 15% | 88% |
| Amy Sequence, Partial Ox - Low Grade | 52% | 30% | 83% |
| Average | 52% | 30% | 83% |
discussed earlier in this section of the report, and then ground to 90% passing 0.85 mm. The material was slurried in water and then fed into a Knelson Concentrator in 3 stages:
- Stage 1: A gravity concentrate and tails was produced for the 90% passing 0.85 mm;
- Stage 2: The tails from Stage 1 were milled to 50% passing 0.075mm and fed into the Knelson Concentrator, producing a Stage 2 concentrate and Stage 2 tails; and
- Stage 3: the tails from Stage 2 were milled to 80% passing 0.075mm and fed into the Knelson Concentrator, producing a Stage 3 concentrate and Stage 3 tails.
At each of the three stages, middlings were separated by hand panning the concentrate. The middlings products and concentrate products were combined for each of the 3 stages, and CIL bottle roll tests were performed for the Stage 3 tails, the combined middlings, and combined concentrates.
The results of the CIL bottle roll tests on gravity recoverable gold concentrates and tails are summarized inTable 13.18.
| 149 |
| August 2011 Summary Report On The Livengood Project, Tolovana District, Alaska |
Table 13.18 Results of CIL Bottle Roll Tests in Gravity Concentration – March 2010
| Description | Product | % Gold Recovery in Product | % Total Gold Recovered | NaCN Consumption, (kg/MT) | Ca(OH)2 Addition, (kg/MT) |
| Cambrian: Partial Ox (L) | Con | 97% | 58% | 9.04 | 2.54 |
| Mid | 91% | 4% | 6.08 | 0.72 | |
| Tail | 77% | 26% | 2.21 | 0.50 | |
| Overall | 90% | 89% | 2.27 | 0.51 | |
| Cambrian: Trace Ox (H) | Con | 97% | 67% | 9.78 | 2.10 |
| Mid | 93% | 6% | 7.18 | 0.72 | |
| Tail | 82% | 19% | 1.96 | 0.50 | |
| Overall | 93% | 92% | 2.05 | 0.51 | |
| Kint: Partial Ox (H) | Con | 89% | 31% | 9.33 | 0.88 |
| Mid | 76% | 1% | 7.86 | 0.79 | |
| Tail | 48% | 29% | 2.21 | 0.50 | |
| Overall | 63% | 62% | 2.31 | 0.51 | |
| Kint: No Ox (H) | Con | 92% | 45% | 7.81 | 0.86 |
| Mid | 81% | 1% | 5.79 | 0.79 | |
| Tail | 26% | 12% | 2.23 | 0.50 | |
| Overall | 59% | 59% | 2.30 | 0.51 | |
| Main Volcanics: Partial Ox (H) | Con | 98% | 71% | 13.12 | 0.95 |
| Mid | 95% | 2% | 7.05 | 0.74 | |
| Tail | 68% | 16% | 2.38 | 0.50 | |
| Overall | 90% | 89% | 2.49 | 0.51 | |
| Upper Seds: Trace Ox (L) | Con | 78% | 50% | 12.34 | 1.97 |
| Mid | 71% | 2% | 6.30 | 0.75 | |
| Tail | 36% | 11% | 1.82 | 0.50 | |
| Overall | 64% | 63% | 1.90 | 0.51 | |
| Upper Seds: Trace Ox (H) | Con | 96% | 74% | 9.63 | 0.95 |
| Mid | 88% | 3% | 7.03 | 0.81 | |
| Tail | 48% | 9% | 1.80 | 0.50 | |
| Overall | 87% | 86% | 1.89 | 0.51 | |
| Lower Sand: No Ox (H) | Con | 95% | 71% | 5.85 | 1.43 |
| Mid | 87% | 2% | 6.91 | 0.80 | |
| Tail | 44% | 10% | 2.10 | 0.50 | |
| Overall | 83% | 83% | 2.17 | 0.51 | |
| Kint_Ox_high | Con | 97% | 66% | 9.32 | 1.43 |
| Mid | 93% | 2% | 7.47 | 0.81 | |
| Tail | 59% | 17% | 2.36 | 0.50 | |
| 150 |
| August 2011 Summary Report On The Livengood Project, Tolovana District, Alaska |
| Description | Product | % Gold Recovery in Product | % Total Gold Recovered | NaCN Consumption, (kg/MT) | Ca(OH)2 Addition, (kg/MT) |
| Overall | 86% | 85% | 2.45 | 0.51 | |
| Kint_TraceOx_High | Con | 97% | 68% | 15.13 | 1.47 |
| Mid | 64% | 2% | 6.15 | 0.77 | |
| Tail | 54% | 14% | 1.98 | 0.50 | |
| Overall | 84% | 84% | 2.09 | 0.51 | |
| US_Ox_Low-Sunshine | Con | 96% | 61% | 17.21 | 2.01 |
| Mid | 92% | 4% | 8.33 | 0.77 | |
| Tail | 69% | 21% | 2.04 | 0.50 | |
| Overall | 87% | 86% | 2.16 | 0.51 | |
| US_Trace_Low – Sunshine | Con | 96% | 70% | 12.31 | 1.72 |
| Mid | 93% | 4% | 7.90 | 0.78 | |
| Tail | 69% | 16% | 1.86 | 0.50 | |
| Overall | 90% | 89% | 1.96 | 0.51 | |
13.4.3 Resource Development Inc. (RDi) Test Work
A program was developed and awarded to Resource Development Inc. (RDI) in Wheat Ridge, Colorado, in February 2010, (RDi 2010a, RDi 2010b, and RDi 2010c) The test work focused on potential concentration methods prior to cyanide leaching. The methods include both flotation and gravity as well as a combination of both. The initial flotation test work was performed on a unit flotation cell (1 cubic foot) utilizing 10 kg of mineralized material as feed. These larger scale tests provided more material for both concentrate leaching tests and for gravity separation tests. Initial test work indicated that on average more than 90 percent of the gold will report to the concentrates in a combined gravity/flotation concentrating scenario.Table 13.19 provides the results from the initial, RDi Phase I, flotation and gravity test work.
Test work was also performed to investigate cyanide leaching of the concentrates such that a doré product could be produced directly from the concentrates. Leach tests varied, but on average greater than 81% of the gold can be leached from the combined concentrates. Table 13.19 shows these test results. Leach recoveries on the Main Volcanic and Lower Sed units, which are important components of the potential mill feed, required further work to improve the leach recovery of gold from the concentrate. Leaching parameters are being optimized, and it is very likely that higher leach recoveries on the concentrates will be attainable.
| 151 |
| August 2011 Summary Report On The Livengood Project, Tolovana District, Alaska |
Table 13.19 RDI Phase I Flotation and Gravity Test Results – June 2010
| Sample Description | Assay Head, Au gm/t | Calc Head, Au gm/t | Flotation Recovery | Gravity Recovery | Au Recovery Reporting to Flotation Conc. and Gravity Conc. | Flotation ConcentrateAu Leach Recovery (%) | ||
| Livengood Main Volcanics | Partial Oxide - High Grade | Comp 1 | 0.7 | 0.6 | 74.00% | 9.40% | 76.40% | 74.3 |
| Comp 1 | 0.8 | 0.58 | 74.00% | 17.90% | 78.70% | 90.1 | ||
| Livengood Main Volcanics | Partial Oxide - High Grade | Comp 1 | 0.7 | 0.6 | 74.00% | 9.40% | 76.40% | 71.1 |
| Comp 1 | 0.8 | 0.58 | 74.00% | 17.90% | 78.70% | 67.3 | ||
| Livengood Main Volcanics | No Oxide - High Grade | Comp 3 | 2.26 | 2.23 | 95.40% | 7.50% | 95.70% | 56.1 |
| Comp 3 | 1.1 | 3.16 | 97.10% | 67.60% | 99.10% | 63.5 | ||
| Livengood Upper Seds | Partial Oxide - High Grade | Comp 4 | 1.56 | 0.89 | 68.70% | 9.20% | 71.60% | 59.3 |
| Comp 4 | 2.21 | 0.72 | 65.30% | 44.50% | 80.70% | 84.3 | ||
| Livengood Upper Seds | Trace Oxide - High Grade | Comp 5 | 1.57 | 1.06 | 92.60% | 42.80% | 95.80% | 85.7 |
| Comp 5 | 0.75 | 0.51 | 81.80% | 66.30% | 93.90% | 83.1 | ||
| Livengood Upper Seds | No Oxide - High Grade | Comp 14 | 0.59 | 0.66 | 91.10% | 89.70% | 99.10% | 82.9 |
| Comp 14 | 0.47 | 0.5 | 91.90% | 68.00% | 97.40% | 80.9 | ||
| Livengood Lower Seds | Trace Oxide - High Grade | Comp 6 | 0.7 | 0.86 | 74.40% | 40.30% | 84.70% | 90.6 |
| Comp 6 | 0.76 | 0.71 | 57.70% | 52.60% | 79.90% | 69.2 | ||
| Livengood Lower Seds | No Oxide - High Grade | Comp 7 | 2.04 | 0.35 | 70.90% | 59.10% | 88.10% | 62.2 |
| Comp 7 | 0.49 | 2.22 | 95.70% | 17.90% | 96.50% | 79.1 | ||
| Livengood Cambrian | Partial Oxide - High Grade | Comp 8 | 0.96 | 0.63 | 80.10% | 71.60% | 94.30% | 97.0 |
| Comp 8 | 0.65 | 0.81 | 87.70% | 10.10% | 88.90% | 97.1 | ||
| Livengood Cambrian | Trace Oxide - High Grade | Comp 9 | 1.09 | 1.52 | 78.30% | 92.60% | 98.40% | 89.0 |
| Comp 9 | 5.91 | 2.78 | 97.90% | 93.30% | 99.90% | 98.3 | ||
| Sunshine Upper Seds | Partial Oxide - High Grade | Comp 10 | 0.49 | 0.59 | 76.80% | 11.10% | 79.40% | 93.5 |
| Comp 10 | 0.58 | 1.05 | 88.00% | 35.00% | 92.20% | 91.6 | ||
| Sunshine Upper Seds | Trace Oxide - High Grade | Comp 11 | 0.64 | 1.01 | 91.40% | 20.50% | 93.20% | 89.0 |
| Comp 11 | 0.47 | 1.59 | 96.60% | 18.90% | 97.20% | 84.0 | ||
| Livengood Lower Sand | Partial Oxide - | Comp 12 | 0.94 | 1.43 | 93.40% | 18.10% | 94.60% | 81.1 |
| 152 |
| August 2011 Summary Report On The Livengood Project, Tolovana District, Alaska |
| Sample Description | Assay Head, Au gm/t | Calc Head, Au gm/t | Flotation Recovery | Gravity Recovery | Au Recovery Reporting to Flotation Conc. and Gravity Conc. | Flotation Concentrate Au Leach Recovery (%) | ||
| High Grade | Comp 12 | 1.07 | 1.02 | 94.30% | 12.40% | 95.00% | 75.8 | |
| Livengood Lower Sand | Trace Oxide - High Grade | Comp 13 | 0.66 | 0.72 | 87.40% | 46.80% | 93.30% | 81.0 |
| Comp 13 | 0.97 | 0.37 | 79.40% | 18.70% | 83.30% | 81.5 | ||
| Average | 1.16 | 1.12 | 84.60% | 39.20% | 90.60% | 80.3 | ||
RDi reviewed the results from the Phase I test work and began test work on a second phase of work. This work focused on improving the flotation and leach recoveries of the poorer performing mineralized material types. Six composite samples were selected for the flotation study and five composite samples were selected for the leaching study. The six samples selected for improvement of the gold recovery in the flotation process were Composite No. 1, 4, 6, 8, 10 and 12. Most of these samples were partially oxidized. The composites selected for improvements in the leach extraction from the flotation concentrate were Composites 1 to 4 and 7. These composites were all sulfides.
A total of five bench-scale flotation tests were performed on each composite sample with the primary objective of improving the gold recovery in the flotation process. The variables investigated in these tests were primary grind size (P80 of 100 and 150 mesh), reagent type (AP3477, AP404 and AP400) and sulfidization of the mineralized material in the mill using Na2S. The flotation tests were run at natural pH and the flotation time was kept constant at 9 minutes.
The test data are are summarized in Table 13.20. The one-cubic-foot flotation test data are also presented in the table for comparative purposes. The test results indicate the following:
- The calculated head assays for gold varied significantly between the tests for the same composite (i.e., Composite No. 1 was 0.58 g/t to 1.51 g/t Au). These results indicate that a significant amount of gold may be free milling and some of the gold may be coarse.
- There is an indication that a finer grind (P80 of 150 versus 100 mesh) results in lower flotation tailing assay and hence higher recovery.
- The effect of collector type was masked by the variation in the feed grade.
- Sulfidization of the feed did not appear to help most of the composites but may be beneficial for some composites. For example, Composite 8 (partial oxide Livengood Cambrian) and 12 (partial oxide Livengood lower sand) had lower flotation tailing assays as compared to tests without sulfidization.
| 153 |
| August 2011 Summary Report On The Livengood Project, Tolovana District, Alaska |
Table 13.20 RDI Phase II Flotation Test Results – August 2010
| TestNo. | Grind P80, Mesh | Collector(Aeropromotor) | Sulfidization | Wt.% Recovery | Au% Recovery | Conc. Grade g/t Au | Tailing g/t Au | Calc. |
| COMPOSITE No. 1 (Livengood Main Volcanics, Partial Oxide) | ||||||||
| CFT1 | 150 | AP404 | No | 12.3% | 74.0% | 3.62 | 0.18 | 0.60 |
| CFT2 | 150 | AP404 | No | 11.4% | 74.0% | 3.79 | 0.17 | 0.58 |
| LFT1 | 100 | AP404 | No | 11.6% | 84.0% | 10.94 | 0.27 | 1.51 |
| LFT2 | 150 | AP404 | No | 12.1% | 82.6% | 7.53 | 0.22 | 1.10 |
| LFT3 | 150 | AP3477 | No | 13.2% | 88.9% | 9.34 | 0.18 | 1.39 |
| LFT4 | 150 | AP400 | No | 16.1% | 85.0% | 6.27 | 0.21 | 1.19 |
| LFT5 | 150 | AP404 | Yes | 11.0% | 82.6% | 10.50 | 0.27 | 1.40 |
| COMPOSITE NO. 4 (Livengood Upper Seds, Partial Oxide) | ||||||||
| CFT7 | 150 | AP404 | No | 10.1% | 68.7% | 6.03 | 0.31 | 0.89 |
| CFT8 | 150 | AP404 | No | 10.1% | 65.3% | 4.64 | 0.28 | 0.72 |
| LFT6 | 100 | AP404 | No | 8.8% | 68.7% | 8.40 | 0.37 | 1.08 |
| LFT7 | 150 | AP404 | No | 10.2% | 76.0% | 10.66 | 0.38 | 1.44 |
| LFT8 | 150 | AP3477 | No | 11.2% | 34.9% | 3.92 | 0.92 | 1.25 |
| LFT9 | 150 | AP400 | No | 13.1% | 84.8% | 10.65 | 0.29 | 1.64 |
| LFT10 | 150 | AP404 | Yes | 8.8% | 73.6% | 10.67 | 0.37 | 1.28 |
| COMPOSITE NO. 6 (Livengood Lower Seds, Trace Oxide) | ||||||||
| CFT11 | 150 | AP404 | No | 16.2% | 74.4% | 3.96 | 0.26 | 0.86 |
| CFT12 | 150 | AP404 | No | 16.0% | 57.7% | 2.55 | 0.36 | 0.71 |
| LFT11 | 100 | AP404 | No | 11.3% | 72.5% | 5.83 | 0.28 | 0.91 |
| LFT12 | 150 | AP404 | No | 16.0% | 83.9% | 6.56 | 0.24 | 1.25 |
| LFT13 | 150 | AP3477 | No | 14.9% | 76.5% | 4.74 | 0.25 | 0.92 |
| LFT14 | 150 | AP400 | No | 17.7% | 76.6% | 5.10 | 0.34 | 1.18 |
| LFT15 | 150 | AP404 | Yes | 14.6% | 77.6% | 8.51 | 0.42 | 1.60 |
| COMPOSITE NO. 8 (Livengood Cambrian, Partial Oxide) | ||||||||
| 154 |
| August 2011 Summary Report On The Livengood Project, Tolovana District, Alaska |
| CFT15 | 150 | AP404 | No | 42.1% | 80.1% | 1.20 | 0.22 | 0.63 |
| CFT16 | 150 | AP404 | No | 45.9% | 87.7% | 1.55 | 0.19 | 0.81 |
| LFT16 | 100 | AP404 | No | 43.8% | 84.9% | 2.53 | 0.35 | 1.30 |
| LFT17 | 150 | AP404 | No | 43.5% | 47.9% | 2.49 | 2.09 | 2.26 |
| LFT18 | 150 | AP3477 | No | 51.3% | 83.3% | 1.73 | 0.36 | 1.06 |
| LFT19 | 150 | AP400 | No | 42.7% | 77.9% | 1.69 | 0.36 | 0.93 |
| LFT20 | 150 | AP404 | Yes | 44.5% | 90.4% | 3.06 | 0.26 | 1.51 |
| COMPOSITE NO. 10 (Sunshine Upper Seds, Partial Oxide) | ||||||||
| CFT19 | 150 | AP404 | No | 9.0% | 76.8% | 5.08 | 0.15 | 0.59 |
| CFT20 | 150 | AP404 | No | 13.0% | 88.0% | 7.06 | 0.14 | 1.05 |
| LFT21 | 100 | AP404 | No | 8.6% | 87.8% | 14.17 | 0.19 | 1.39 |
| LFT22 | 150 | AP404 | No | 10.6% | 90.1% | 12.68 | 0.17 | 1.49 |
| LFT23 | 150 | AP3477 | No | 8.8% | 81.5% | 8.71 | 0.19 | 0.95 |
| LFT24 | 150 | AP400 | No | 12.5% | 82.6% | 7.32 | 0.22 | 1.10 |
| LFT25 | 150 | AP404 | Yes | 10.4% | 87.3% | 12.99 | 0.22 | 1.55 |
| COMPOSITE NO. 12 (Livengood Lower Sand, Partial Oxide) | ||||||||
| CFT23 | 150 | AP404 | No | 14.0% | 93.4% | 9.54 | 0.11 | 1.43 |
| CFT24 | 150 | AP404 | No | 15.2% | 94.3% | 6.30 | 0.07 | 1.02 |
| LFT26 | 100 | AP404 | No | 10.8% | 63.6% | 6.50 | 0.45 | 1.11 |
| LFT27 | 150 | AP404 | No | 11.8% | 88.1% | 7.21 | 0.13 | 0.97 |
| LFT28 | 150 | AP3477 | No | 13.9% | 83.3% | 4.63 | 0.15 | 0.78 |
| LFT29 | 150 | AP400 | No | 13.0% | 86.6% | 7.85 | 0.18 | 1.18 |
| LFT30 | 150 | AP404 | Yes | 13.3% | 88.4% | 4.77 | 0.10 | 0.72 |
Note:LFT: Laboratory Flotation Test, CFT: Cubic-Foot Flotation Test
Based on these results, Phase III of the test program was undertaken with the primary objective of generating data for the flowsheet that was being evaluated in a prefeasibility study. Since the Main Volcanics constitute a fair portion of the mineral resources, RDi was tasked to run duplicate tests on Composites 1 to 3 and one test each on the remaining Composites 4 to 14.
A 10-kg charge of each composite was ground to P80 of 150 mesh and processed on a quarter deck Diester table. Two products were collected, namely gravity concentrate and gravity tailings.
| 155 |
| August 2011 Summary Report On The Livengood Project, Tolovana District, Alaska |
The gravity concentrate was reprocessed on the Gemeni table and a cleaner gravity concentrate and Gemeni tailing products were collected. The Gemeni concentrate was assayed for gold and total sulfur and Gemeni tailings were ground and leached.
The gravity concentration process data are summarized inTable 13.21. The test results indicate the following:
- The Diester table recovered 1.5% to 8.5% of the feed and 50.3% to 84.4% of the gold. The concentrate assayed 4.37 g/t to 36.43 g/t Au.
- The Gemeni concentrate recovered 0.1% to 0.7% of the weight and 10.7% to 68.2% of the gold at a concentrate grade of 19.4 g/t to 506.9 g/t Au.
Table 13.21 RDI Phase III Gravity Test Results – January 2011
| Gemeni Concentrate | Gemeni Tails | Deister Concentrate | ||||||||
| Recovery % | Grade g/t Au | Recovery % | Grade g/t Au | Recovery % | Grade g/t Au | |||||
| Sample | Test # | Wt. | Au | Wt. | Au | Wt. | Au | |||
| Comp 1 | G29 | 0.5% | 52.7% | 185.6 | 8.1% | 23.9% | 4.79 | 8.5% | 76.6% | 14.53 |
| Comp 1 | G43 | 0.3% | 48.0% | 216.2 | 4.7% | 12.4% | 3.18 | 5.0% | 60.4% | 14.64 |
| Comp 2 | G30 | 0.4% | 36.1% | 140.6 | 4.6% | 36.5% | 11.41 | 4.9% | 72.6% | 21.02 |
| Comp 2 | G44 | 0.5% | 42.6% | 131.8 | 3.9% | 21.6% | 8.78 | 4.4% | 64.1% | 23.09 |
| Comp 3 | G31 | 0.3% | 10.7% | 37.0 | 5.9% | 48.6% | 8.96 | 6.2% | 59.3% | 10.38 |
| Comp 3 | G45 | 0.5% | 34.3% | 118.4 | 4.5% | 27.0% | 10.05 | 5.0% | 61.3% | 20.60 |
| Comp 4 | G32 | 0.3% | 28.9% | 100.9 | 5.0% | 23.5% | 4.46 | 5.2% | 52.4% | 9.44 |
| Comp 5 | G33 | 0.3% | 41.4% | 105.2 | 4.1% | 30.0% | 5.21 | 4.4% | 71.4% | 11.61 |
| Comp 6 | G34 | 0.3% | 55.6% | 201.0 | 6.0% | 28.8% | 5.39 | 6.3% | 84.4% | 15.01 |
| Comp 7 | G35 | 0.4% | 15.2% | 19.4 | 6.3% | 48.4% | 3.52 | 6.6% | 63.5% | 4.37 |
| Comp 8 | G36 | 0.1% | 35.2% | 194.8 | 4.0% | 15.1% | 2.63 | 4.2% | 50.3% | 8.51 |
| Comp 9 | G37 | 0.1% | 38.0% | 242.1 | 2.3% | 18.4% | 7.60 | 2.5% | 56.4% | 21.89 |
| Comp 10 | G38 | 0.1% | 55.5% | 506.9 | 1.4% | 15.5% | 15.02 | 1.5% | 71.0% | 62.14 |
| Comp 11 | G39 | 0.5% | 58.6% | 203.7 | 1.8% | 11.5% | 10.97 | 2.4% | 70.1% | 52.62 |
| Comp 12 | G40 | 0.7% | 66.0% | 147.5 | 5.5% | 10.3% | 3.01 | 6.2% | 76.4% | 19.69 |
| Comp 13 | G41 | 0.7% | 68.2% | 174.2 | 3.0% | 12.1% | 6.68 | 3.7% | 80.3% | 36.43 |
| Comp 14 | G42 | 0.5% | 45.3% | 72.8 | 1.5% | 12.5% | 6.95 | 2.0% | 57.8% | 23.84 |
| 156 |
| August 2011 Summary Report On The Livengood Project, Tolovana District, Alaska |
These results indicate that 30% to 50% of the gold can be recovered by gravity. The cleaner gravity tail can be combined with flotation concentrate, reground and leached.
The Gemeni tailing (500 grams) were reground in a pebble mill for one hour, and preaerated for 8 hours at pH 11. After 7 hours of pre-aeration, 200 g/t of lead nitrate was added to the slurry. Following pre-aeration, the ground concentrate was leached at 30% solids for 72 hours with 2 g/l NaCN which was maintained during the test. Carbon was added to the leach test at 20 g/l to run CIL test.
The test data are summarized inTable 13.22.
The test results Indicates the following:
- The cleaner gravity tailing were ground to P80 of 8 to 22.8 microns.
- The gold extraction ranged from 38.8% to 92.9%.
- The NaCN consumption was reasonable and ranged from 3 to 6.6 kg/t of concentrate.
- Since the concentrate weight was 1.5% to 8% of the feed, the NaCN consumption based on plant feed would be 0.1 to 0.5 kg/t.
- The lime consumption would generally be 25% of the lime added to the circuit. Again based on plant feed, it should be less than 1 kg/t.
Table 13.22 RDI Phase III Gravity Middlings Leach Test Results – January 2011
| Grind Size | Au Grade g/t | Reagent Consumption kg/t | |||||
| Sample | Test # | P80 Microns | Calc Head | Tail | Au % Recovery | NaCN | Lime |
| Comp 1 | TGFC59 | 14.77 | 4.79 | 0.81 | 83.1% | 3.191 | 17.0 |
| Comp 1 | TGFC73 | 18.50 | 3.18 | 1.25 | 60.7% | 4.189 | 19.9 |
| Comp 2 | TGFC60 | 17.31 | 11.41 | 4.18 | 63.3% | 5.763 | 14.9 |
| Comp 2 | TGFC74 | 15.23 | 8.78 | 3.95 | 55.0% | 5.136 | 19.5 |
| Comp 3 | TGFC61 | 17.23 | 8.96 | 4.88 | 45.5% | 6.63 | 15.8 |
| Comp 3 | TGFC75 | 16.83 | 10.05 | 4.79 | 52.4% | 5.906 | 15.5 |
| Comp 4 | TGFC62 | 16.05 | 4.46 | 1.06 | 76.3% | 3.682 | 13.1 |
| Comp 5 | TGFC63 | 16.50 | 5.21 | 1.38 | 73.5% | 4.138 | 14.5 |
| Comp 6 | TGFC64 | 16.94 | 5.39 | 3.3 | 38.8% | 5.286 | 16.3 |
| Comp 7 | TGFC65 | 17.50 | 3.52 | 1.32 | 62.6% | 5.648 | 16.1 |
| Comp 8 | TGFC66 | 22.81 | 2.63 | 0.25 | 90.3% | 2.968 | 13.7 |
| Comp 9 | TGFC67 | 13.21 | 7.6 | 0.52 | 93.1% | 6.765 | 26.7 |
| Comp 10 | TGFC68 | 8.28 | 15.02 | 1.07 | 92.9% | 5.054 | 37.8 |
| Comp 11 | TGFC69 | 9.48 | 10.97 | 1.56 | 85.7% | 5.28 | 25.3 |
| Comp 12 | TGFC70 | 17.18 | 3.01 | 1.16 | 61.5% | 3.554 | 16.9 |
| Comp 13 | TGFC71 | 12.52 | 6.68 | 1.53 | 77.1% | 5.058 | 16.6 |
| Comp 14 | TGFC72 | 8.50 | 6.95 | 1.28 | 74.5% | 6.668 | 33.1 |
| 157 |
| August 2011 Summary Report On The Livengood Project, Tolovana District, Alaska |
The Diester table tailing were decanted and subjected to flotation in a one-cubic-foot flotation cell using potassium amyl xanthate (PAX), Aeropromotor 404 and methyl isobutyl carbinol (MIBC) as reagents. The concentrate was collected for leaching tests.
The flotation feed and tailing samples were also collected to calculate the flotation recovery. The feed and tailings were assayed for gold (2-assay ton) and total sulfur. The size distribution of the flotation feed was also determined. The test data are summarized inTable 13.23.
Table 13.23 RDI Phase III Flotation Test Results – January 2011
| Flotation Concentrate | Tailing Grade | Calc. Feed Grade | |||||
| Grind Size | Recovery % | Grade | |||||
| Sample | Test # | P80 Microns | Wt. | Au | g/t Au | g/t Au | g/t Au |
| Comp 1 | FT31 | 79 | 15.5% | 66.5% | 1.33 | 0.12 | 0.31 |
| Comp 1 | FT45 | 91 | 11.1% | 65.4% | 2.28 | 0.15 | 0.39 |
| Comp 2 | FT32 | 86 | 19.6% | 82.1% | 1.39 | 0.07 | 0.33 |
| Comp 2 | FT46 | 89 | 15.6% | 86.9% | 3.29 | 0.09 | 0.59 |
| Comp 3 | FT33 | 81 | 18.5% | 82.0% | 1.73 | 0.09 | 0.39 |
| Comp 3 | FT47 | 89 | 14.3% | 82.8% | 3.53 | 0.12 | 0.61 |
| Comp 4 | FT34 | 81 | 12.4% | 53.0% | 1.79 | 0.23 | 0.42 |
| Comp 5 | FT35 | 82 | 14.9% | 81.5% | 2.04 | 0.08 | 0.37 |
| Comp 6 | FT36 | 80 | 16.8% | 65.8% | 0.93 | 0.10 | 0.24 |
| Comp 7 | FT37 | 85 | 16.8% | 66.6% | 0.68 | 0.07 | 0.17 |
| Comp 8 | FT38 | 70 | 41.6% | 70.7% | 0.44 | 0.13 | 0.26 |
| Comp 9 | FT39 | 72 | 32.4% | 88.1% | 0.89 | 0.06 | 0.33 |
| Comp 10 | FT40 | 75 | 12.8% | 84.1% | 4.88 | 0.14 | 0.74 |
| Comp 11 | FT41 | 89 | 11.9% | 83.5% | 3.01 | 0.08 | 0.43 |
| Comp 12 | FT42 | 72 | 15.1% | 81.7% | 1.64 | 0.07 | 0.30 |
| Comp 13 | FT43 | 80 | 13.8% | 77.9% | 1.81 | 0.08 | 0.32 |
| Comp 14 | FT44 | 75 | 14.1% | 82.6% | 1.65 | 0.06 | 0.28 |
The test results indicate the following:
- The primary grind size for feed to flotation was 80% passing 70 to 91 microns. It was slightly finer than P80 of 104 microns because coarser material (2% to 8%) was removed in the gravity concentration process.
- The flotation process floated 11% to 20% of the weight and 53% to 88% of the gold remaining in the gravity tailing. The flotation recoveries are low because the feed to the flotation process assayed 0.17 g/t to 0.74 g/t Au. The flotation tailing were generally less than 0.1 g/t Au. The flotation feed was low in gold because majority of the gold was recovered in the gravity circuit.
- The concentrate assayed 0.4 to 4.8 g/t Au, 0.2% to 0.6% organic carbon and 0.15% to 14.9% total sulphur.
The flotation concentrates were then subjected to cyanide leach tests. Approximately 500 grams of flotation concentrate was reground in a pebble mill for one hour at 40% solids. Two tests were run where the concentrate was ground for 6 hours. The material was transferred to a rolling bottle and pulp density adjusted to 30% solids and slurry pH 11 with lime. The slurry was pre-aerated at pH 11 for 7 hours and 200 g/t of lead nitrate was added at that time. The material was then allowed to aerate forone more hour and sodium cyanide was added to a calculated level of
| 158 |
| August 2011 Summary Report On The Livengood Project, Tolovana District, Alaska |
2g/l. In addition, carbon was added at a calculated level of 20 g/l. The test was run for 72 hours and cyanide and lime determined at 4, 23, and 47 hours and adjusted to 2 g/l and pH 11 respectively. After 72 hours, the pH and free cyanide were measured and a solution sample collected for gold analyses. The carbon was separated from the slurry and the leach residue was filtered, washed, dried and a representative sample was pulverized for gold analyses. The leach residue was also submitted for sub-sieve size analyses.
The test data are summarized inTable 13.24.
Table 13.24 RDI Phase III Flotation Conc. Leach Test Results – January 2011
| Grind Size | Extraction | Carbon | Leach Residue | Calc. Feed | Reagent Consumption kg/t | |||
| Sample | Test # | P80 Microns | % Au | g/t Au | g/t Au | g/t Au | NaCN | Lime |
| Comp 1 | TGFC76 | 10.19 | 82.9% | 42.89 | 0.38 | 2.25 | 3.414 | 17.74 |
| Comp 1 | TGFC90 | 9.95 | 90.8% | 130.49 | 0.58 | 6.32 | 4.934 | 17.45 |
| Comp 2 | TGFC77 | 11.89 | 50.8% | 23.60 | 0.98 | 1.99 | 4.792 | 14.87 |
| Comp 2 | TGFC91 | 8.53 | 59.5% | 45.50 | 1.31 | 3.23 | 13.566 | 21.87 |
| Comp 3 | TGFC78 | 13.47 | 38.9% | 21.20 | 1.46 | 2.39 | 4.901 | 14.78 |
| Comp 3 | TGFC92 | 7.80 | 50.5% | 48.90 | 2.00 | 4.05 | 13.212 | 20.49 |
| Comp 4 | TGFC79 | 9.69 | 77.8% | 35.19 | 0.44 | 1.98 | 2.936 | 16.69 |
| Comp 5 | TGFC80 | 9.24 | 75.4% | 24.69 | 0.36 | 1.45 | 3.107 | 13.26 |
| Comp 6 | TGFC81 | 12.43 | 60.6% | 24.39 | 0.68 | 1.72 | 3.963 | 13.38 |
| Comp 7 | TGFC82 | 10.82 | 61.4% | 15.40 | 0.43 | 1.1 | 3.853 | 12.34 |
| Comp 8 | TGFC83 | 25.20 | 90.8% | 10.80 | 0.05 | 0.52 | 1.539 | 13.67 |
| Comp 9 | TGFC84 | 19.59 | 94.2% | 27.10 | 0.08 | 1.29 | 2.768 | 12.81 |
| Comp 10 | TGFC85 | 10.18 | 94.3% | 100.28 | 0.28 | 4.69 | 4.552 | 13.47 |
| Comp 11 | TGFC86 | 10.17 | 76.3% | 44.70 | 0.60 | 2.54 | 5.699 | 11.79 |
| Comp 12 | TGFC87 | 10.90 | 60.0% | 23.80 | 0.70 | 1.75 | 5.114 | 14.83 |
| Comp 13 | TGFC88 | 11.69 | 64.0% | 24.70 | 0.62 | 1.71 | 4.215 | 14.38 |
| Comp 14 | TGFC89 | 10.29 | 65.5% | 21.40 | 0.50 | 1.45 | 3.883 | 12.47 |
The test results indicate the following:
- The gold extraction ranged from 38.9% to 94.3%.
- The gold extractions were poor (<75%) for Composites No. 3 (No oxide, high grade), No. 2(trace oxide, high grade), No. 4(partial oxide, high grade), No. 6(trace oxide, high grade) and No. 7(no oxide, high grade). All these composites are sulfide bearing mineralized material composites.
- The NaCN consumptions were reasonable and ranged from1.5 to 5.7 kg/t except for Composites 2 and 3 where the composition was ± 13 kg/t. When the NaCN consumption is calculated based on plant feed, it is between 0.15 and 1.6 kg/t.
The overall gold recovery for each composite of mineralized material when processed in the conceptual process flowsheet was estimated and reported inTable 13.25.
| 159 |
| August 2011 Summary Report On The Livengood Project, Tolovana District, Alaska |
Table 13.25 Estimate of Overall Gold Recovery -RDi Flotation Testwork
| Sample Description | Au Grade (g/mt) Calc Head | Gravity Rougher Recovery | Gravity Cleaner Recovery | Gravity Cleaner Tail Leach Recovery | Flotation Recovery | Flotation Concentrate Leach Recovery | Overall Recovery | Gold Recovery Reporting to Flotation Conc. and Gravity Conc. | ||
| Livengood Main Volcanics | Partial Oxide - High Grade | Comp 1 | 1.61 | 76.6% | 52.7% | 83.1% | 66.5% | 82.9% | 85.5% | 92.2% |
| Comp 1 | 1.20 | 60.4% | 48.0% | 60.7% | 65.4% | 90.8% | 79.0% | 86.3% | ||
| Trace Oxide - High Grade | Comp 2 | 1.43 | 72.6% | 36.1% | 63.3% | 82.1% | 50.8% | 70.6% | 95.1% | |
| Comp 2 | 1.60 | 64.2% | 42.6% | 55.0% | 86.9% | 59.5% | 73.0% | 95.3% | ||
| No Oxide - High Grade | Comp 3 | 1.09 | 59.3% | 10.7% | 45.5% | 82.0% | 38.9% | 45.8% | 92.7% | |
| Comp 3 | 1.67 | 61.3% | 34.3% | 52.4% | 82.8% | 50.5% | 64.6% | 93.3% | ||
| Livengood Upper Seds | Partial Oxide - High Grade | Comp 4 | 0.94 | 52.4% | 28.9% | 76.3% | 53.0% | 77.8% | 66.5% | 77.6% |
| Trace Oxide - High Grade | Comp 5 | 0.71 | 71.4% | 41.4% | 73.5% | 81.5% | 75.4% | 81.0% | 94.7% | |
| No Oxide - High Grade | Comp 14 | 0.84 | 57.8% | 45.3% | 74.5% | 82.6% | 65.5% | 77.4% | 92.7% | |
| Livengood Lower Seds | Trace Oxide - High Grade | Comp 6 | 1.11 | 84.4% | 55.6% | 38.8% | 65.8% | 60.6% | 73.0% | 94.7% |
| No Oxide - High Grade | Comp 7 | 0.46 | 63.6% | 15.2% | 62.6% | 66.6% | 61.4% | 60.4% | 87.8% | |
| Livengood Cambrian | Partial Oxide - High Grade | Comp 8 | 0.70 | 50.3% | 35.2% | 90.3% | 70.7% | 90.8% | 80.7% | 85.4% |
| Trace Oxide - High Grade | Comp 9 | 0.95 | 56.4% | 38.0% | 93.1% | 88.1% | 94.2% | 91.3% | 94.8% | |
| Sunshine Upper Seds | Partial Oxide - High Grade | Comp 10 | 1.35 | 71.0% | 55.5% | 92.9% | 84.1% | 94.3% | 92.9% | 95.4% |
| Trace Oxide - High Grade | Comp 11 | 1.77 | 70.1% | 58.6% | 85.7% | 83.5% | 76.3% | 87.5% | 95.1% | |
| Livengood Lower Sand | Partial Oxide - High Grade | Comp 12 | 1.59 | 76.3% | 66.0% | 61.5% | 81.7% | 60.0% | 84.0% | 95.7% |
| Trace Oxide - High Grade | Comp 13 | 1.66 | 80.3% | 68.2% | 77.1% | 77.9% | 64.0% | 87.4% | 95.6% | |
| Average | 66.4% | 43.1% | 69.8% | 76.5% | 70.2% | 76.5% | 92.0% | |||
| 160 |
| August 2011 Summary Report On The Livengood Project, Tolovana District, Alaska |
The overall gold recovery ranged from a low 55.2% for Composite No. 3 (Average of two tests) to a high of 92.9% for Composite No. 10. The arithmetic average of recoveries for all composites indicated 76.5% . Based on gold recoveries of each composite and the proportion of resource for each composite, one could calculate the gold extraction for the total resource. The overall gold recovery was the sum of the gold in the gravity cleaner concentrate and the leach extraction of gold from the cleaner gravity tails and the flotation concentrate.
A review of the test data for the different sections of the process flowsheet indicated the following:
- The overall gold recovery of less than 70% was obtained for Composites 3, 4, and 7 which has partial or no oxidation. Additional test work to improve flotation recovery of these samples is needed.
- The gold recovery in the combined gravity and flotation circuits was generally over 90% for most of the composites. Composite 4 had less than 80% gold recovery.
- Poor leach extractions (<60%) were obtained for the gravity cleaner tailing and flotation concentrate for Composite 2 and 3 which are sulfide-bearing samples.
13.4.4 Preg-Rob Impacts on Metallurgical Performance
ITH has performed AuAA31 measurements of preg-rob potential for all assay intervals in the resource database. AuAA31 measures the relative strength of preg-robbing materials (0 - 100%), by measuring the samples ability to absorb gold from a cyanide solution. This relative Preg-rob strength index has been introduced into the resource modeling so that each block in the resource model has an associated Preg-rob Level parameter.
Evaluation of the surface mine design, described in section 16.0, indicates that the weighted average preg-rob level for all mineralized material scheduled to the process plant would be 25%.
Cynaide and CIL bottle roll testing of Upper Sediment samples where different proportions of material with different preg-rob strength were blended into the samples, was performed to characterize impacts on metallurgical recovery. These tests indicated that CIL leaching was not impacted by the preg-rob levels characteristic of most of the deposit (0-25%). The use of gravity and flotation concentration is projected to reduce the potential impact of any preg-rob material, since most of the rock material is removed prior to CIL leach.
13.5 Current Test Work Programs
At present there are three laboratories performing test work on Livengood mineralized materials, which are McClelland Labs Inc., Resource Development Inc., and FL Smidth (Dawson Labs). All of these test work programs are scheduled for completion during the third quarter of 2011.
McClelland is currently running a series of column tests on Livengood “oxide” mineralized material types. Tests are being run on ROM material from a surface outcrop at Livengood, and on HQ and PQ core samples at various crush sizes.
| 161 |
| August 2011 Summary Report On The Livengood Project, Tolovana District, Alaska |
RDi is running Phase V tests on oxide material. The Phase V test work program includes further defining the process parameters for gravity, flotation, and concentrate leaching.
FLS is running grindability tests for sizing a 91,000 mtpd SAG mill / ball mill grinding circuit.
13.5.1 Ongoing Flotation and Gravity Concentration Tests
Test work on flotation and gravity concentration on the Livengood mineralization types is ongoing. Phase V and VI test work programs are underway at RDi. The focus of these tests are to further refine the gravity, flotation, and leaching parameters for the major Livengood mineralized material types. The tests are focusing on a gravity / CIL and a gravity / flotation / concentrate CIL flow sheets. Metallurgical parameters that are being tested include the following:
Gravity Tests
- Grind Size Effects
- Gravity Concentrate Fine Grind and Cyanidation Tests
- Gravity Tails Leach and CIL Tests
CIL Tests
- Grind Size Effects
- Leach Time Effects
- Pre-aeration Effects
Flotation Tests
- Collector and Depressant Tests
- Grind Size Effects
- Flotation Time Effects
- Additional Flotation Concentrate and Tails Leach Tests
Gravity and Flotation Concentrate Tests
- Additional Fine Grinding
- Pre-aeration
- Chemical Oxidation
- Additional High Intensity Cyanide Leach Tests
Column Tests
- Crush Size Effects
- Leach Time Effects
- Cyanide Strength Tests
| 162 |
| August 2011 Summary Report On The Livengood Project, Tolovana District, Alaska |
14.0 Mineral Resource Estimates
14.1 Global Mineral Resource Estimate
The November 2010 global mineral resource estimate for the Livengood deposit was updated using information available through June 30th, 2010. The drill data was maintained in a Gemcom® GEMS database, and the basic statistical and geostatistical analysis was performed using SAGE2001® and WinGSLib®. The resource model was constructed using Gemcom GEMS® and the Stanford GSLIB (Geostatistical Software Library) MIK post processing routine. The global mineral resource model was estimated using multiple indicator kriging (MIK) for gold. Two oxidation indicators were used to estimate the oxidation and a single indicator was used to estimate the distribution of Kint dikes, Lower Sands, and Money Knob (formerly Amy) Sequence A three-dimensionally defined lithology model, based on interpretations by ITH geologists, was used to code the rock type block model. A three-dimensionally defined probability grade shell (0.1 g/t) was used to constrain the gold estimation. A summary of the global mineral resource at cutoff grades of 0.2, 0.3, 0.5, and 0.7 g/t gold is shown inTable 14.1.The results are presented as in-situ.
Table 14.1 Summary Global In-Situ Mineral Resource
| Classification | Au Cutoff (g/t) | Tonnes (millions) | Au (g/t) | Million Ounces Au |
| Measured | 0.20 | 742 | 0.54 | 12.8 |
| Indicated | 0.20 | 322 | 0.47 | 4.8 |
| Total M & I | 0.20 | 1,064 | 0.51 | 17.6 |
| Inferred | 0.20 | 447 | 0.42 | 6.1 |
| Measured | 0.30 | 562 | 0.63 | 11.4 |
| Indicated | 0.30 | 216 | 0.58 | 4.0 |
| Total M & I | 0.30 | 778 | 0.62 | 15.4 |
| Inferred | 0.30 | 279 | 0.53 | 4.8 |
| Measured | 0.50 | 298 | 0.84 | 8.0 |
| Indicated | 0.50 | 96 | 0.81 | 2.5 |
| Total M & I | 0.50 | 394 | 0.83 | 10.5 |
| Inferred | 0.50 | 102 | 0.79 | 2.6 |
| Measured | 0.70 | 149 | 1.09 | 5.2 |
| Indicated | 0.70 | 42 | 1.10 | 1.5 |
| Total M & I | 0.70 | 191 | 1.09 | 6.7 |
| Inferred | 0.70 | 39 | 1.10 | 1.4 |
Compared to the November 2010 global resource estimate, the total ounces estimated has decreased 2% for cutoff grades of 0.30g/t Au. The global resource estimate was updated in April 2011, at which time a substantial portion of the Indicated material was converted to the Measured classification. The Measured proportion has continued to increase in the August 2011
| 163 |
| August 2011 Summary Report On The Livengood Project, Tolovana District, Alaska |
global resource model, increasing to 56% from the April 2011 estimate of 51% of the total resource at 0.3 g/t cut off. Other model validation activities are discussed in Section 14.7, including external review of the estimation methodology used for the Livengood resource.
14.2 Mineral Resource Defined by Surface Mine Optimization
An economic surface mine was generated using Whittle mine optimization software to define the Mineral Resources, assuming a long term gold price of $1400/oz for resource definition and assuming a Gravity/Flotation/CIL processing method. The optimization parameters are similar to those defined in section 16.0 for the mining method analysis, and are tabulated inTable 14.2below:
Table 14.2 Optimization Parameters Assumed for Definition of Money Knob Surface Mine Mineral Resource
| Parameter | Gravity/Flotation/CIL 91 Ktpd Circuit | |
| Long Term Gold Price | $US/oz | 1400 |
| Mining Cost | $US/tonne | 1.80 |
| Processing Cost | $US/tonne | Variable: 6.31 – 7.23 |
| G&A Cost | $US/tonne | 0.81 |
| Recovery | % | Variable: 58.4 – 94.0 |
| Royalty | % | 2.5% of Gold Price |
| Transport/Refining | US$/0z | 4.75 |
| Mine Slopes | Deg | 45 |
Note: Processing cost and recovery vary by rock type and oxidation code.
The Mineral Resources defined by this economic mining shell are tabulated inTable 14.3: The classification of the Resources was based on the geostatistical analysis of gold grades and the drillhole spacing in the deposit.
Table 14.3 Money Knob Surface Mine Mineral Resource
| Classification | Au Cutoff (g/t) | Tonnes (millions) | Au (g/t) | Million Ounces Au |
| Measured | 0.22* | 676 | 0.56 | 12.2 |
| Indicated | 0.22* | 257 | 0.52 | 4.3 |
| M&I | 0.22* | 933 | 0.55 | 16.5 |
| Inferred | 0.22* | 257 | 0.50 | 4.1 |
Notes: Cutoff grade* is average for variable processing costs and recoveries. Average recovery is 79%
Based on the study herein reported, delineated mineralization of the Livengood Deposit is classified as a resource according to the following definitions from National Instrument 43-101 and from CIM (2005):
“In this Instrument, the terms "mineral resource", "inferred mineral resource", "indicated mineral resource" and "measured mineral resource"
| 164 |
| August 2011 Summary Report On The Livengood Project, Tolovana District, Alaska |
have the meanings ascribed to those terms by the Canadian Institute of Mining, Metallurgy and Petroleum, as the CIM Definition Standards on Mineral Resources and Mineral Reserves adopted by CIM Council, as those definitions may be amended.” Due to the uncertainty that may be attached to Inferred Mineral Resources, it cannot be assumed that all or any part of an Inferred Mineral Resource will be upgraded to an Indicated or Measured Mineral Resource as a result of continued exploration. Confidence in the estimate is insufficient to allow the meaningful application of technical and economic parameters or to enable an evaluation of economic viability worthy of public disclosure. Inferred Mineral Resources must be excluded from estimates forming the basis of feasibility or other economic studies.
Mineralization may be classified as an Indicated Mineral Resource by the Qualified Person when the nature, quality, quantity and distribution of data are such as to allow confident interpretation of the geological framework and to reasonably assume the continuity of mineralization. The Qualified Person must recognize the importance of the Indicated Mineral Resource category to the advancement of the feasibility of the project. An Indicated Mineral Resource estimate is of sufficient quality to support a Preliminary Feasibility Study which can serve as the basis for major development decisions.
14.3 Data Used
14.3.1 Sample Data
The data available for this model comprised 189,848 meters of core and RC drilling, plus trench data. Historical drilling and sampling is shown inTable 14.3. Drilling performed by TGA is shown inTable 14.4. It can be seen that the historical data represents about 4% of the total information used. The use of historic data is based on its statistical consistency with current data and the small portion of the total data represented as shown in past technical reports (Klipfel and Giroux, 2008a and b, 2009; Klipfel et al., 2009, and 2009a). For data validation purposes, Mr. Carew checked the assay data for a sample of drill holes (10%) used for the resource estimate in GEMS against the original assay certificates (Secure PDF). The error rate of less than 1% is well within acceptable standards. These minor errors arose exclusively from mismatches with samples re-assayed for QA/QC purposes, and were corrected by revising the GEMS database update procedure.
14.3.2 Other Data
Topography
The topographic surface used is based on a 4m DEM derived from 2008 aerial photography.
Density
Densities used in the resource are based on 98 determinations from core and RC chip samples and are shown inTable 14.5.
| 165 |
| August 2011 Summary Report On The Livengood Project, Tolovana District, Alaska |
Table 14.4 Historical Drilling and Sampling
| Year | Company | Drill Type | Number of Holes | Meters |
| 1976 | Homestake | Percussion | 4 | 153 |
| 1981 | Occidental | Percussion | 6 | 310 |
| 1989 | AMAX | Trench | 2 | 160 |
| 1990 | AMAX | RC | 3 | 320 |
| 1997 | Placer Dome | Core | 9 | 1,100 |
| 2003 | AngloGold | RC | 8 | 1,514 |
| 2004 | AngloGold | Trench | 8 | 276 |
| 2004 | AngloGold | Core | 4 | 762 |
| Total | 47 | 4,746 | ||
Table 14.5 ITH Drilling and Sampling
| Year | Drill Type | Number of Holes | Meters |
| 2006 | Core | 7 | 1,227 |
| 2007 | Core | 15 | 4,411 |
| 2008 | Core | 9 | 2,187 |
| 2008 | Trench | 4 | 80 |
| 2008 | RC | 109 | 29,150 |
| 2009 | Core | 12 | 4,573 |
| 2009 | RC | 195 | 59,815 |
| 2010 | Core | 40 | 13,631 |
| 2010 | RC | 198 | 56,550 |
| 2011* | RC | 48 | 15,162 |
| 2011* | Core | 11 | 3,162 |
| Total | 648 | 189,948 | |
2011* YTD – Excludes geotechnical holes
| 166 |
| August 2011 Summary Report On The Livengood Project, Tolovana District, Alaska |
Table 14.6 Density Determinations
| Lithology Unit | N | Mean | StdDev | Max | Min |
| Amy Sequence | 4 | 2.67 | 0.04 | 2.72 | 2.65 |
| Cambrian | 12 | 2.82 | 0.07 | 2.95 | 2.69 |
| Combined Cambrian-Amy | 2.78 | ||||
| Kint | 3 | 2.56 | 0.18 | 2.76 | 2.44 |
| Lower Sediments | 21 | 2.74 | 0.05 | 2.84 | 2.62 |
| Main Volcanics | 36 | 2.72 | 0.13 | 2.86 | 2.11 |
| Upper Sediments | 22 | 2.68 | 0.13 | 2.79 | 2.23 |
| Average of all readings | 98 | 2.72 |
14.4 Data Analysis
Multi-element assay information is available for nearly 50% of the samples. A statistical summary of this data from a previous report (July 09) is shown inTable 14.7. The only element of economic significance is gold, which was the only element modeled in the resource model. No significant correlations were found between the various elements. There were numerous weak to moderate correlations, but nothing that could be exploited to improve the gold estimate. Based on the lack of significant correlations previously determined, the exercise was not updated for this estimate
Table 14.7 Statistical Summary of Assay Data
| Element | Units | N | Mean | Maximum | Std.Dev. | C.V. |
| Au | ppm | 34786 | 0.40 | 56.2 | 1.22 | 3.0 |
| Ag | ppm | 12969 | 0.41 | 440 | 4.07 | 10.0 |
| Cu | ppm | 12969 | 42 | 1120 | 34 | 0.8 |
| Pb | ppm | 12969 | 19 | 9240 | 128 | 6.7 |
| As | ppm | 12971 | 2169 | 137000 | 4181 | 1.9 |
| Sb | ppm | 12969 | 221 | 138000 | 2394 | 10.8 |
| Zn | ppm | 12969 | 186 | 3440 | 221 | 1.2 |
| Fe | % | 12708 | 4.3 | 21.3 | 1.4 | 0.3 |
| Mo | ppm | 12969 | 5.5 | 74.0 | 6.9 | 1.3 |
| S | % | 12081 | 1.4 | 18.4 | 1.4 | 1.0 |
| Te | ppm | 12063 | 0.16 | 25.1 | 0.5 | 3.0 |
Each of the assay intervals were also logged for lithology, alteration and mineralization. Of all of the available qualitative data, the lithology appears to exert the most influence on the gold mineralization (Figure 14.1). It is still a matter of geological debate as to exactly why this is so,
| 167 |
| August 2011 Summary Report On The Livengood Project, Tolovana District, Alaska |
but the volcanic unit is preferentially mineralized relative to the units above and below it. Also, the Kint dikes, which appear to be the conduits for much of the mineralization, are also well mineralized. Not only are the volcanics and Kint dikes higher grade, they are uniformly well mineralized as shown by the relatively low coefficient of variation (C.V.) of each unit.
![]()
Figure 14.1 Gold Distribution by Lithology Unit
14.5 Geologic Model
ITH geologists provided sectional interpretations of the major lithologic units – these were used to generate a three dimensional wire framed geological model of these units and major fault structures. South of the Lillian Fault, the rock units modeled were the Cambrian, Upper Sediments, Main Volcanics, and the Lower Sediments. A new chert unit known as the Money Knob Sequence within the Cambrian has been defined, and is modeled by an additional wireframe model. North of the Lillian fault most of the material is undifferentiated Upper Sediments, with a small amount of Volcanics and Lower Sediments modeled. These represent the major lithologic units that host the mineralization. No other geologic features with possible controls were modeled.
14.6 Composite Statistics
All of the available drilling was composited into fixed length 10m composites. Composite residuals <4m in length were added to the previous composite. These composites were back-tagged with the lithology using the rock type block model developed from the defined geological three-dimensional wire frames.
| 168 |
| August 2011 Summary Report On The Livengood Project, Tolovana District, Alaska |
The composite data was declustered by estimating a nearest-neighbor value into each block. The declustered composite statistics are tabulated below, (Table 14.8).
Table 14.8 Gold Composite Statistics
| Mean: | 0.36 |
| Variance: | 0.32 |
| C. of V.: | 1.57 |
| Min: | 0.00 |
| Q1: | 0.06 |
| Median: | 0.20 |
| Q3: | 0.46 |
| Max: | 20.69 |
14.6.1 Gold Indicator Statistics
The composite data was used to set the gold indicator thresholds. Since the coefficient of variation of the composite data is relatively low, only nine indicator thresholds were needed to fully define the gold distributions. The indicator thresholds were chosen at the low end to have approximately 20% of the data per class and at the high end to have 10 to 11% of the metal per class (Table 14.9). With MIK, top cutting of the assays is not necessary. In this case all composite values greater than 2.0 g/t Au (the highest threshold) are treated the same as “high grade”.
Table 14.9 Gold Indicator Statistics
| Data | Metal | |||||
| Threshold | % | Cum% | % | Cum% | Median | |
| 1 | 0.08 | 18.9 | 20.8 | 2.5 | 2.5 | 0.05 |
| 2 | 0.18 | 24.2 | 43.0 | 7.8.8 | 11.3 | 0.13 |
| 3 | 0.33 | 22.6 | 65.6 | 16.1 | 27.4 | 0.25 |
| 4 | 0.45 | 10.4 | 76.0 | 11.5 | 38.8 | 0.39 |
| 5 | 0.60 | 8.5 | 84.5 | 12.5 | 51.4 | 0.51 |
| 6 | 0.72 | 4.6 | 89.1 | 8.5 | 59.9 | 0.65 |
| 7 | 0.90 | 3.8 | 92.9 | 8.8 | 68.7 | 0.80 |
| 8 | 1.20 | 3.4 | 96.3 | 10.1 | 78.9 | 1.04 |
| 9 | 2.00 | 2.7 | 98.9 | 11.2 | 90.0 | 1.43 |
| Max | 20.69 | 1.1 | 100.0 | 10.0 | 100.0 | 2.74 |
| 169 |
| August 2011 Summary Report On The Livengood Project, Tolovana District, Alaska |
14.6.2 Contact Analysis
Because significant grade contrasts were noted between the different rock types from the assay statistics, contact analysis was performed in the previous study (October 2009) using the composite data to evaluate grade discontinuities at the lithology contacts. Wherever a contact was crossed with a drill hole, the grade profile was examined on either side of the contact. Contacts were evaluated from the Cambrian to the Upper Sediments, from the Upper Sediments into the Main Volcanics, and from the Main Volcanics into the Lower Sediments.
Between the Cambrian and Upper Sediments the grade contrast is fairly significant. In the vicinity of the contact, the average grade of the Cambrian is 0.30 g/t Au while the Upper Sediments is 0.45 g/t Au (Figure 14.2).
Between the Upper Sediments and the Main Volcanics the grade contrast is also fairly significant. The contact between the Main Volcanics and the Lower Sediments is the most significant with the grade in the Main Volcanics being 0.63 g/t Au and the Lower Sediments 0.43 g/t Au. The additional data available for this update did not appear to alter these relationships, and the contact analysis was not repeated.
| 170 |
| August 2011 Summary Report On The Livengood Project, Tolovana District, Alaska |
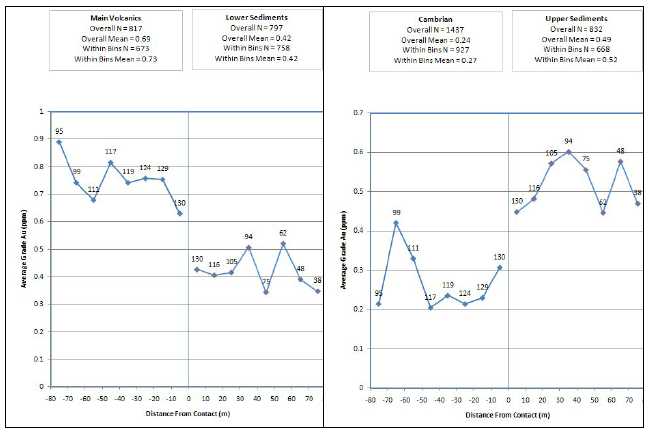
Figure 14.2 Contact Plots
Because of the sharp contrasts in gold grade between the different units, it was decided to treat the boundaries between the different units as hard boundaries. That is, the blocks of a given unit were estimated using only the composite data that fell within the same unit. This is geologically reasonable since many of the contacts are associated with thrust faulting. But it is not known if there has been any post-mineralization movement of these faults. The Main Volcanics are significantly more mineralized than the surrounding units. The reason for this is not fully understood. With this, it is not geologically unreasonable to see grade discontinuities at the contacts for this reason either.
The use of hard boundaries will have an impact on the local estimates because the data has been partitioned. Overall, whether hard boundaries or soft boundaries are used or not would have a minimal effect on the global estimate. The issue as to whether hard or soft boundaries are more appropriate should be resolved as more drilling is done and additional information is gathered.
14.7 Spatial Statistics
Analysis of the additional data available for the update indicated that there were no significant changes in the spatial statistics, and the variography from the November 2010 update was therefore retained for gold, oxidation, and the minor rock types.
| 171 |
| August 2011 Summary Report On The Livengood Project, Tolovana District, Alaska |
14.7.1 Gold Indicator Variograms
Indicator variograms were calculated for each of the indicator thresholds within each of the lithologic domains. Variogram models were fitted for each. Because the data was so heavily partitioned the results from the individual domains were generally unsatisfactory. Many of the areas are relatively thin, especially in the Main Volcanics, making it very difficult to infer a model of vertical continuity. For this reason, the use of the partitioned data for variogram calculations was abandoned and all of the data was used to calculate a set of average indicator variograms that were used over all domains. The average indicator variograms that were used for estimation of the gold indicators in all domains are shown inTable 14.10.
14.7.2 Oxide Indicator Variograms
The oxidation model was estimated using two oxide indicators, one for oxidized and one for trace (Table 14.11). Both the oxidized indicator variogram and the trace indicator variogram are essentially horizontal.
14.7.3 KINT Dike Variograms
A continuous dike indicator was defined using the percentage of Kint dike within each logged interval. The presence and behavior of the dikes north and south of the Lillian Fault are significantly different. Different variograms were fitted for each of these dike domains (Table 14.12). The variogram in the north dips steeply to the south. The variogram in the south was rotated with the horizontal plane dipping to the south-west.
14.7.4 Money Knob Sequence and Lower Sands
Continuous indicators were defined using the percentage of Money Knob Sequence and Lower Sands within each logged interval (Table 14.13). The Money Knob Sequence material occurs only in the Cambrian, south of the Lillian Fault. The Lower Sands material occurs only in the Lower Sediments. Although the percentage of Shale was also estimated in previous updates, this unit is no longer considered to be significant metallurgically and it was therefore not estimated. .
Table 14.10 Average Gold Indicator Variograms
| Indicator | Sill | Range X | Range Y | Range Z |
| 1 | 0.50 | |||
| 0.39 | 90 | 62 | 67 | |
| 0.11 | 570 | 303 | 188 | |
| 2 | 0.48 | |||
| 0.35 | 69 | 116 | 61 | |
| 0.17 | 208 | 399 | 390 | |
| 3 | 0.48 | |||
| 0.36 | 77 | 115 | 57 | |
| 0.16 | 190 | 386 | 375 |
| 172 |
| August 2011 Summary Report On The Livengood Project, Tolovana District, Alaska |
| Indicator | Sill | Range X | Range Y | Range Z |
| 4 | 0.54 | |||
| 0.32 | 58 | 104 | 99 | |
| 0.14 | 324 | 405 | 158 | |
| 5 | 0.55 | |||
| 0.33 | 61 | 82 | 61 | |
| 0.12 | 191 | 442 | 253 | |
| 6 | 0.60 | |||
| 0.30 | 59 | 72 | 64 | |
| 0.10 | 183 | 562 | 242 | |
| 7 | 0.61 | |||
| 0.31 | 16 | 50 | 46 | |
| 0.08 | 159 | 525 | 205 | |
| 8 & 9 | 0.61 | |||
| 0.33 | 23 | 42 | 30 | |
| 0.06 | 106 | 518 | 158 |
Table 14.11 Oxide Indicator Variograms
| Indicator | Sill | RangeX | RangeY | Range Z |
| Oxidized | 0.19 | |||
| 0.40 | 134 | 73 | 115 | |
| 0.41 | 2317 | 2553 | 273 | |
| Trace | 0.03 | |||
| 0.52 | 155 | 47 | 144 | |
| 0.45 | 2867 | 1117 | 320 |
| 173 |
| August 2011 Summary Report On The Livengood Project, Tolovana District, Alaska |
Table 14.12 Kint Dike Variograms
| Domain | Sill | RangeX | RangeY | Range Z |
| North | 0.30 | |||
| 0.51 | 64 | 54 | 616 | |
| 0.19 | 119 | 552 | 696 | |
| South | 0.23 | |||
| 0.65 | 259 | 19 | 33 | |
| 0.12 | 368 | 254 | 431 |
Table 14.13 Lower Sands & Money Knob Seq. Variograms
| Domain | Sill | RangeX | RangeY | Range Z |
| L. Sand | 0.22 | |||
| 0.46 | 63 | 189 | 233 | |
| 0.32 | 633 | 2570 | 2 | |
| Amy Seq. | 0.15 | |||
| 0.25 | 579 | 115 | 114 | |
| 0.60 | 774 | 614 | 211 | |
| N. Shale | 0.21 | |||
| 0.67 | 91 | 48 | 110 | |
| 0.12 | 95 | 812 | 399 | |
| S. Shale | 0.11 | |||
| 0.63 | 46 | 40 | 177 | |
| 0.26 | 1000 | 1205 | 167 |
The Money Knob Sequence variogram dips shallowly to the East, while the Lower Sand variogram is essentially horizontal.
14.8 Resource Model
14.8.1 Model Extents
The resource model was constructed to encompass the drilling data and the defined geological model. The entire project is done using UTM NAD27 Alaska coordinate system. The model extents are shown inTable 14.14.
The selected block size was chosen because it is envisioned that the deposit will be mined with bulk mining methods that would not warrant smaller blocks but also because the drill hole spacing would not support a smaller block size.
| 174 |
| August 2011 Summary Report On The Livengood Project, Tolovana District, Alaska |
Table 14.14 Model Extents
| Minimum (m) | Maximum (m) | Extent (m) | Block Size (m) | No. of Blocks | |
| East | 427,500 | 430,800 | 3,300 | 15 | 220 |
| North | 7,264,300 | 7,266,700 | 2,400 | 15 | 160 |
| Elevation | 50 | 560 | 510 | 10 | 51 |
14.8.2 Gold Estimation
The gold contained within each block was estimated using MIK with nine indicator thresholds. The block model was tagged with the geological model using a block majority coding method. The contact analysis indicated that there are significant grade discontinuities at the lithologic boundaries. Hard boundaries were used between each of the units. That is, each unit was estimated using only data that also fell within the same unit. There was no potentially economic mineralization outside of the geological model and it was not estimated. The estimation was done in three passes, with progressively larger search distances and varying interpolation parameters. The gold kriging plan is shown inTable 14.15 for all units.
An octant search was used. The kriging plan forces data to be available from a minimum of two octants and from two separate drill holes for an estimate to be made. Each of the gold indicators was estimated independently.
Table 14.15 Gold Kriging Plan
| Pass 1 | |
| Minimum No. of Composites | 12 |
| Maximum No. of Composites | 48 |
| Maximum Composites per Octant | 6 |
| Maximum No. of Composites per Hole | 4 |
| Block Discretization | 4 x 4 x 1 |
| Search Distances (m) | 100 (Maj.), 100 (Semi-Maj.), 60 (Min.) |
| Search Rotation | Maj. -5º→190º, Semi-Maj. 100º |
| 175 |
| August 2011 Summary Report On The Livengood Project, Tolovana District, Alaska |
| Pass 2 | |
| Minimum No. of Composites | 12 |
| Maximum No. of Composites | 48 |
| Maximum Composites per Octant | 6 |
| Maximum No. of Composites per Hole | 4 |
| Block Discretization | 4 x 4 x 1 |
| Search Distances (m) | 200 (Maj.), 160 (Semi-Maj.), 120 (Min.) |
| Search Rotation | Maj. -5º→190º, Semi-Maj. 100º |
| Pass 3 | |
| Minimum No. of Composites | 8 |
| Maximum No. of Composites | 48 |
| Maximum Composites per Octant | 6 |
| Maximum No. of Composites per Hole | 4 |
| Block Discretization | 4 x 4 x 1 |
| Search Distances (m) | 300 (Maj.), 250 (Semi-Maj.), 200 (Min.) |
| Search Rotation | Maj. -5º→190º, Semi-Maj. 100º |
14.8.3 Oxidation Estimation
Two levels of oxidation were estimated: oxidized and trace oxidation. These levels correspond to the metallurgical testing and were therefore necessary to estimate to allow the application of the metallurgical recoveries to the model. The oxidation level has been visually logged for each sample interval by ITH geologists. Two oxidation indicators were used to estimate the oxidation. Historically, oxidation has been logged using ten different descriptors ranging from “complete” to” none”. Any interval described as “moderate” or greater was classified as oxidized. Any interval described as anything except “none” was classified as trace or better. The two indicators were tagged on each of the samples as 1 (meeting the criteria) or 0 (not meeting the criteria). Each indicator represents the probability of the sample being oxidized. These indicators were composited into 10m composites with the rest of the data. The two indicators were estimated independently. The kriging plans are shown inTable 14.16 and Table 14.17.
The blocks were then coded as fully oxidized (coded as 1) if the probability of being oxidized was greater than 50%. The blocks were coded as trace (coded as 2) oxidized if the probability of trace oxidization was greater than 50% and not already tagged as oxidized. The remaining un-oxidized blocks were coded as 3. As would be expected, the fully oxidized material is nearer the surface and consequently mostly in the Cambrian rocks. The trace oxidization is pervasive. Significant un-oxidized material is not encountered except in the lower sediments.
| 176 |
| August 2011 Summary Report On The Livengood Project, Tolovana District, Alaska |
Table 14.16 Oxidized Kriging Plan
| Minimum No. of Composites | 8 |
| Maximum No. of Composites | 48 |
| Maximum Composites per Octant | 6 |
| Maximum No. of Composites per Hole | 4 |
| Block Discretization | 4 x 4 x 1 |
| Search Distances (m) | 300 (Maj.), 150 (Semi-Maj.), 100 (Min.) |
| Search Rotation | None |
Table 14.17 Trace Oxidized Kriging Plan
| Minimum No. of Composites | 8 |
| Maximum No. of Composites | 48 |
| Maximum Composites per Octant | 6 |
| Maximum No. of Composites per Hole | 4 |
| Block Discretization | 4 x 4 x 1 |
| Search Distances (m) | 300 (Maj.), 150 (Semi-Maj.), 100 (Min.) |
| Search Rotation | None |
14.8.4 KINT Dike Estimation
The Kint dikes are significant metallurgically. It was therefore necessary to estimate them. The dikes are small enough that the drilling information is insufficient to build a deterministic model of the dike locations. Consequently, the dikes were estimated using a probabilistic model. In each block in the model, the probability of encountering dike was treated as the dike proportion within the block.
A single continuous dike indicator was used to estimate the presence of dikes. The presence of dikes was logged for each logged interval. The percentage of dike within the interval was logged, as in many cases the dike represented less than 100% of the interval. The dike indicator was set to be the proportion of dike within the interval. This indicator was then composited into 10m composites along with the rest of the data.
The presence and distribution of dikes is significantly different north and south of the Lillian Fault. The two domains were estimated separately. The kriging plan to estimate the proportion of dike within each block is shown inTable 14.18 andTable 14.19.
The Kint dikes are important for metallurgical but make up a very small portion of the total resource. The Kint dikes average between 3 and 4% of the tonnage.
| 177 |
| August 2011 Summary Report On The Livengood Project, Tolovana District, Alaska |
Table 14.18 Kint Dike Indicator Kriging Plan – Southern Domain
| Minimum No. of Composites | 8 |
| Maximum No. of Composites | 48 |
| Maximum Composites per Octant | 6 |
| Maximum No. of Composites per Hole | 4 |
| Block Discretization | 4 x 4 x 1 |
| Search Distances (m) | 300 (Maj.), 250 (Semi-Maj.), 150 (Min.) |
| Search Rotation | Maj. -55º→248º, Semi-Maj. 80º |
Table 14.19 Kint Dike Indicator Kriging Plan - Northern Domain
| Minimum No. of Composites | 8 |
| Maximum No. of Composites | 48 |
| Maximum Composites per Octant | 6 |
| Maximum No. of Composites per Hole | 4 |
| Block Discretization | 4 x 4 x 1 |
| Search Distances (m) | 300 (Maj.), 250 (Semi-Maj.), 50 (Min.) |
| Search Rotation | Maj. -80º→191º, Semi-Maj. 352º |
14.8.5 Money Knob Sequence and Lower Sands Estimation
The Money Knob (MK) Sequence and Lower Sands units are significant metallurgically. (Note: the Money Knob Sequence was formerly designated as the Amy Sequence, and it was therefore necessary to estimate them. The occurrences are small enough that the drilling information is insufficient to build a deterministic model of their locations. Consequently, these were estimated using a probabilistic model. In each block in the model, the probability of encountering these units was treated as the material proportion within the block. Note that although the proportion of Shale was also estimated in previous updates, that this material is no longer considered to be significant metallurgically and it was, therefore, not estimated. Based on ongoing metallurgical testing, a new index known as the ‘Preg Rob’ index has been defined, and has been calculated for all relevant drill hole intervals. This index was estimated into the model using inverse distance interpolation and is used in the derivation of the recovery models.
A single continuous indicator was used to estimate the presence of the units. The presence of Money Knob Sequence and Lower Sands was logged for each logged interval. The percentage of these units within the interval was logged, as in many cases the lithology represented less than 100% of the interval. The unit indicator was set to be the proportion of lithology within the interval. This indicator was then composited into 10m composites along with the rest of the data. The kriging plan to estimate the proportion of these units within each block is shown inTable 14.20.Note that the Money Knob Sequence occurs only in the Cambrian, and that the Lower Sands occur only in the Lower Sediments.
| 178 |
| August 2011 Summary Report On The Livengood Project, Tolovana District, Alaska |
Table 14.20 Lower Sands & Money Knob Seq. Indicator Kriging Plan
| Minimum No. of Composites | 8 |
| Maximum No. of Composites | 48 |
| Maximum Composites per Octant | 6 |
| Maximum No. of Composites per Hole | 4 |
| Block Discretization | 4 x 4 x 1 |
| Search Distances (m) – Lower Sand | Major 300, Int. 150, Minor 100 |
| Search Rotation – Lower Sand | Major 0º→ Azimuth 290º |
| Search Distance (m) – MK Sequence | Major 300, Int. 150, Minor 100 |
| Search Rotation – MK Sequence | Major 0º→ Azimuth 104º |
14.8.6 Preg-Rob Index Estimation
The Preg Rob Index is used in the adjustment of HeapLeach and Gravity/CIL recovery factors, and is based on metallurgical testing. Preg Rob indicators in six separate bins were estimated using inverse distance interpolation and a similar search neighborhood to that used for the gold indicator estimates. The final Preg Rob Index was calculated as the weighted average of the bin estimates.
14.9 Model Validation
Various forms of model validation were undertaken and are shown below. In all cases, the model appears to be unbiased and fairly represent the drilling data. The composite data was declustered by estimating a nearest-neighbor value into each block.
14.9.1 Global Bias Check
The global average of the declustered composite values is 0.376 g/t Au and the correspondingaverage block value (E-Type estimate, or block average calculated from MIK bins) is 0.353 g/t. The estimated block values are within 6.5 % of the declustered values. Although a reasonable comparison would be within 5%, further analysis shows that the comparison is within 2% and 4.5% for the higher confidence Measured (0.453 vs. 0.427) and Indicated (0.346 vs. 0.331) categories respectively. This is reasonable and within the expectations of the model.
14.9.2 Visual Validation
The model was visually compared to the composite gold data in both N-S and E-W sections. The estimates were checked to see that they appeared to be consistent with the data and that they were geologically reasonable. In all cases everything appeared reasonable.
| 179 |
| August 2011 Summary Report On The Livengood Project, Tolovana District, Alaska |
14.9.3 Swath Plots
Swaths were taken through the model and the averaged block values (e-type MIK estimates) and the averaged declustered composite values (nearest-neighbor estimates) were compared on E-W, N-S and vertical swaths (Figure 14.3). The kriged values have a small amount of spatial smoothing, but generally compare quite favorable to the composite values, with areas of some divergence corresponding to swaths with a low number of samples.

Figure 14.3 Swath Plots of E-Type Estimate v. Nearest Neighbor
14.9.4 Review of Resource Estimation Methodology
ITH has commissioned an independent review of the resource estimation methodology as part of its Quality Assurance program (Schofield, 2010). The review concluded that Multiple Indicator Kriging (MIK) was the appropriate estimation method for the deposit. The MIK approach to recoverable resource estimation has been found to be more useful than Ordinary Kriging (OK) where the size of the mineralized material selection unit is small compared to the spacing of the drill holes, and/or when sensitivity to extreme sample grades exists.
The review suggested that the block/panel size and SMU size should be larger due the generally 75 m drill hole spacing, and that a composite length of 3 m would be more appropriate than the 10 m composite currently selected for the Livengood model. Based on spatial analysis that places more emphasis on short range variability, and sample spacing, the review also recommended reducing the size of the search neighborhood selected for the estimation.
The impact on the resource estimation of the different assumptions was evaluated by generating an alternative estimate using the Livengood data. The comparison between alternate calculation and the Livengood resource estimate is summarized below:
| 180 |
| August 2011 Summary Report On The Livengood Project, Tolovana District, Alaska |
- The current Livengood resource estimate is larger than would be produced using the alternate assumptions, with the main difference relating to material that is projected below the drill holes when using the larger neighborhood search parameters. The location of this material is illustrated by the cross sections showing drill hole data and model blocks inFigures 14.4., where resource blocks are extrapolated beyond the base of the drill data due to the larger search neighborhood used in the current Livengood resource estimate. This material, and similar material extrapolated laterally are predominantly classified as Inferred resource in the current Livengood resource estimate.
- The tonnage, grade and contained metal of the volumes common to both calculations are quite similar. The common volumes are constrained to close proximity of the drilling data due to the reduced search radius in the alternate method. This was evaluated by comparing calculations of recoverable resource above 0.5 g/t within the pit shell used in the heap leach analysis reported by Klipfel et.al., 2009b.
- Although the distribution of classifications was different, both the alternative calculation and the Livengood resource estimate predominantly assigned the material in the volumes common to both calculations an Indicated or above.
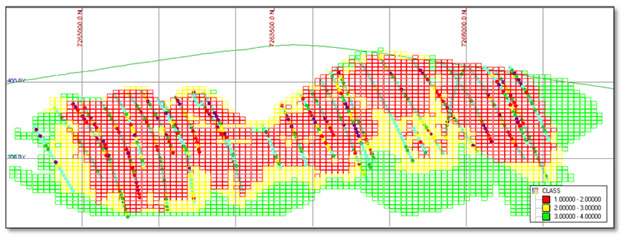
Figure 14.4 Cross Section Through Global Resource Block Model Showing Extrapolation Below the Base of Drilling Data
ITH believes that extrapolation beyond the current drilling data, due to the larger search radius, is appropriate and supported by a limited number of holes that extend beyond the current typical drill depth and provide support for geologic and grade projection. This portion of the Livengood resource estimate is predominantly classified as Inferred resource, which does not have verified geological and grade continuity.
14.10 Post-processing of MIK Model
| 181 |
| August 2011 Summary Report On The Livengood Project, Tolovana District, Alaska |
The post-processing of the indicator kriging was done with the GSLIB post processing routine (postik). It is necessary to provide a maximum grade of the distribution. This grade can be calculated as:
Zmax= Zcn+ 3(Zn– Zcn)
Where Zcnis the uppermost indicator threshold, and Znis the mean of values > Zcn. Considering a mean of 3.45 ppm (raw composites), the maximum grade used in the post-processing was calculated to be 6.35 ppm.
The multiple indicator kriging produces an estimate of the distribution of grade within a block rather than just a single average grade of a block. The distribution produced is the distribution of composite sized units within the block not minable units. It is therefore necessary to correct the distribution so that the distribution represents selective mining units (SMU’s) not composite sized units. This correction is called a change of support correction. Since the average grade of the block is the same whether mined in one scoop or mined by a core drill, the correction does not change the average grade of the block only reduces the variance of the distribution.
The variance reduction factor is the ratio of the variance of an SMU within a block to the variance of a composite within a block. This is calculated using average variogram values. The variance of the SMU within the block is the variance of a composite within a block minus the variance of a composite within an SMU. Since the estimated blocks are small relative to the data spacing the effective block size was taken to be 40m by 40m (approximately ½ the drill spacing).
The method used for the change of support was an indirect lognormal correction. This correction uses the ratio of standard deviations rather than the ratio of variances. This is just the square root of the ratio of variances.
The mining SMU was assumed to be 5m by 5m selectivity. Although the projected size of the operation indicates that a larger SMU is indicated, this size was retained in the global resource estimation for consistency purposes. The estimation of the ‘Economic’ resource is, accordingly, based on a larger SMU size of 7.5m by 7.5m
The following factors were derived using the average gold variogram model.

| 182 |
| August 2011 Summary Report On The Livengood Project, Tolovana District, Alaska |
This correction is applied on a block-by-block basis with a global reduction target of 0.46. This is done on a trial and error basis to find the block reduction factor that will achieve the target global variance reduction of 0.46. A reduction factor of 0.20 was used by block.
14.11 Resource Classification
The resource is broken down into three categories: Measured, Indicated and Inferred. As mentioned, the MIK interpolation was done in three passes, with the search distances and other relevant interpolation parameters varying from pass to pass. The interpolation parameters include the distance and orientation of the search neighborhood, the minimum and maximum number of samples, and the minimum number of holes and octants informed for each pass. These parameters were selected to reflect levels of confidence commensurate with classification into Measured, Indicated and Inferred categories. Blocks are therefore classified with respect to the pass in which they are interpolated, with Pass 1 corresponding to the Measured category, Pass 2 corresponding to the Indicated category and Pass 3 corresponding to the Inferred category. The estimation variance from the estimation of the third indicator (median indicator), along with the number of composites used, number of drill holes used and the distance to the nearest composite was also saved for each block estimated, for possible use in refining the classification. The estimation variance provides a good measure of the confidence in the estimate, remaining relatively low when data is near and evenly spaced around the block being estimated, and rising rapidly with extrapolation.
Blocks estimated in the first Pass are considered to be in the Measured category. Blocks estimated in the second Pass are considered to be in the Indicated category. Blocks estimated in the third Pass are considered to be in the Inferred category.
On average, Measured blocks are within 27m of the nearest composite, and are informed by 23 composites from at least 6 drill holes. On average, Indicated blocks are within 40m of the nearest composite, and are informed by 23 composites from at least 6 drill holes. On average, Inferred blocks are within 83m of the nearest composite, and are informed by 20 composites from at least 5 drill holes.
| 183 |
| August 2011 Summary Report On The Livengood Project, Tolovana District, Alaska |
15.0 Mineral Reserve Estimates
No mineral reserves have been defined at Livengood. The Project must complete its PFS prior to reviewing the potential for a statement of reserves.
| 184 |
| August 2011 Summary Report On The Livengood Project, Tolovana District, Alaska |
16.0 Mining Methods
16.1 Mining Methods
This report envisions that the project would operate via large-scale, bulk tonnage, surface mining methods. Mining would be conducted via a typical truck and shovel mining operation. Material would be mined from the Core Zone and Sunshine surface excavations in a series of logical and economic push backs or phases. The Core Zone and Sunshine surface mine was derived from an economic mine limit as determined from the output from Gemcom Whittle 4X software. Surface mine slopes were recommended in a geotechnical review by SRK Consulting (2011). Recoveries are based on recommendations by PCI, discussed in section 17.0 and stored in the block model as variables within the resource model. After the final surface mine size was determined, a mine design was generated with Vulcan 3D mining software. Resources from the mine design were exported to Minemax Scheduler and schedule alternatives were analyzed to determine the most efficient and profitable extraction scenario for the Livengood project. The schedule (Table 16.1) delimits resulting the mine plan used for the economic analysis of this report.
Mineralized material and overburden would be drilled on 15 meter high mining benches. The material will be blasted and then loaded by 34-m3 hydraulic mining shovels into 220 metric tonne capacity haul trucks. Mineralized material will be transported by truck to the milling facility. Overburden will be transported by truck to the overburden storage facilities. The mine plan indicates that a mining rate of approximately 65 million tons per year of combined mineralized material and overburden would be associated with mining the resource. The average overburden to mineralized material ratio (strip ratio) is approximately 1.19:1. On an annual basis the mill will process approximately 33.2 million tonnes of material. The ultimate mining equipment fleet necessary to achieve this annual mining rate is shown inTable 16.2.
The Livengood project has a 23 year mine life. Over this timeframe 750 million tons of mineralized material will be delivered to a crusher that feeds the mill directly or to a buffer stockpile. Haul trucks will dump directly into the crusher. Buffer stockpiles are built in years that more mineralized material is mined than the crusher and mill are capable of processing. In the case of stockpiling, lower grade rock was preferentially segregated to the stockpile. The stockpiled material will be loaded to trucks and dumped directly in the crusher as required.
The mine production includes mineralized material classified as Measured, Indicated and Inferred. The Inferred portion of the mineralized material scheduled to the processing plant is approximately 16% of tonnes and Au ounces. Measured and Indicated material were 60% and 24%. respectively. The gold production projected in the PEA is based on the in-situ resource model and estimates of mining recoverable resources at a 0.28 - 0.36 g/t cut-off grade for the different lithologic units, based on Whittle optimization.
| 185 |
| August 2011 Summary Report On The Livengood Project, Tolovana District, Alaska |
Table 16.1 Mine Production Schedule
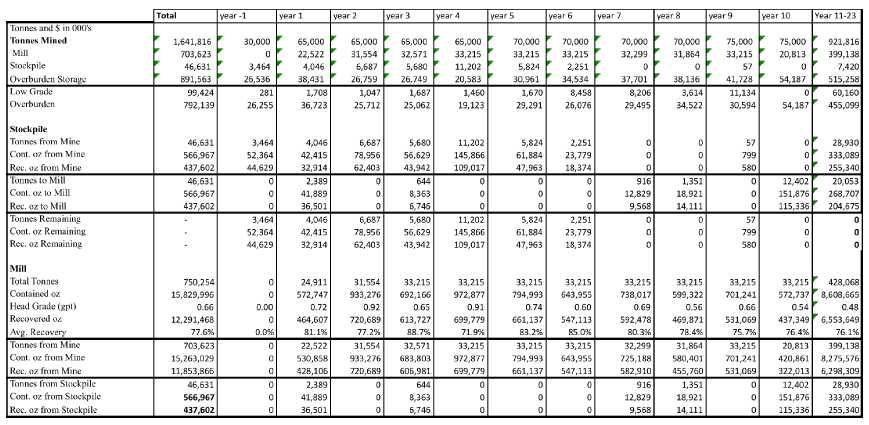
| 186 |
| August 2011 Summary Report On The Livengood Project, Tolovana District, Alaska |
Table 16.2 Mining Equipment List (000'$)
| Equipment | Quantity | Cost Each | Total Cost |
| O&K RH340B Hydraulic Shovels | 4 | $7,233 | $28,932 |
| Caterpillar 793F Haul Trucks | 16 | $3,502 | $56,032 |
| Rotary Blast Hole Drills | 4 | $4,300 | $17,200 |
| Reverse Circulation Grade Control Drills | 2 | $1,161 | $2,322 |
| Caterpillar D9 Class Dozers | 7 | $1,038 | $7.266 |
| Caterpillar 14H Motor Graders | 4 | $321 | $1,284 |
| Caterpillar 773F WTR Water Tankers | 2 | $1,581 | $3,162 |
| Tire Service Trucks | 4 | $228 | $912 |
| Bulk Trucks | 3 | $406 | $1,218 |
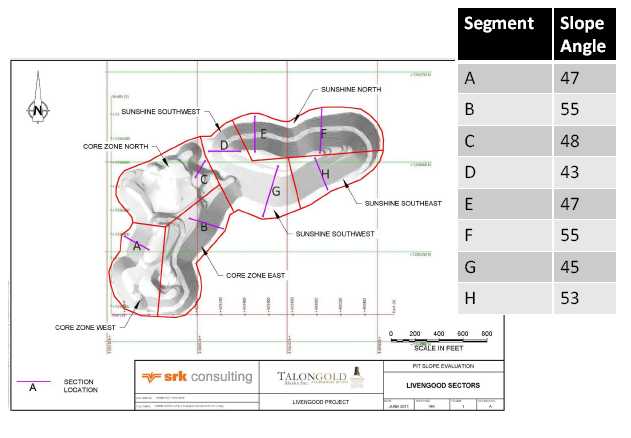
Figure 16.1 Surface Mine Slope Analysis by Segment - SRK (2010)
| 187 |
| August 2011 Summary Report On The Livengood Project, Tolovana District, Alaska |
16.2 Surface Mine Optimization
Economic surface mine limits were determined using Whittle® 4X software which employs the Lerch-Grossman© economic algorithm. Whittle works on a block model of the mineral resource, and progressively constructs lists of related blocks that should or should not be mined. The final list defines a surface mine outline that has the highest possible total value, while honoring the required surface mine slope parameters. Block sizes of 15m by15m by10m were used for the report. Each block contains four potential mineralized material parcels. Overall slope angles (Figure 16.1) were determined by SRK Anchorage, June 2011. Whittle Inputs are listed inTable 16.3 – 16.4.
Table 16.3 Whittle Inputs used in Surface Mine Plan
| Parameter | Unit | Value |
| Base Mining Cost | US$/tonne | 1.80 |
| Processing Cost – Table 16.4 | US$/tonne | 6.00 – 8.00 |
| General & Admin | US$/tonne | 0.81 |
| Transport and Refining | US$/oz | 4.73 |
| Recovery Gold – Variable | % | 70 - 95 |
| Selling Price Gold | US$/oz | 1,100 |
| Royalty on Gross Gold Sales | % | 2.5 |
| Bench Height | Metres | 10 |
| Slope Angle From Horizontal | Degrees | 43 - 51 |
| Minimum Mining Width | Metres | 90 |
Table 16.4 Processing Costs by Rock Type (weighted avg cost )
| Rock Type | Rock Code | Oxidation | Processing Cost |
| Lower Seds | 3 | 3 | $6.92 |
| Cambrian | 4 | 3 | $6.67 |
| Sunshine Upper Seds | 5 | 3 | $6.86 |
| Upper Seds - Core | 6 | 3 | $6.88 |
| Main Volcanics | 8 | 3 | $6.60 |
16.3 Surface Mine Design
The potentially mineable shell was designed in Vulcan softwareFigure 16.5. The final mine design took into account the geotechnical considerations recommended by SRK (2010).Table 16.5 lists the surface mine design parameters. The final mine design took into account a logical mining sequence of phases. The selection of the final phases was determined with the aid of the Whittle Pushback Chooser algorithm. This ensures that the extraction of resources maximizes the net present value of the project.
| 188 |
| August 2011 Summary Report On The Livengood Project, Tolovana District, Alaska |
Table 16.5 Surface Mine Design Parameters
| Parameter | Units | Value |
| Bench Height (pit designed with double benches) | Meters | 10 |
| Road Width | Meters | 37.5 |
| Road Grade | % | 10 |
| Bench Face Angle From Horizontal | Degrees | 70 |
| Overall Slope Angle from Horizontal | Degrees | 43 - 51 |
| Catch Bench Width – depends on overall slope recommendation | Meters | 9 – 14 |
| 189 |
| August 2011 Summary Report On The Livengood Project, Tolovana District, Alaska |
Figure 16.2 Livengood Surface Mine Design
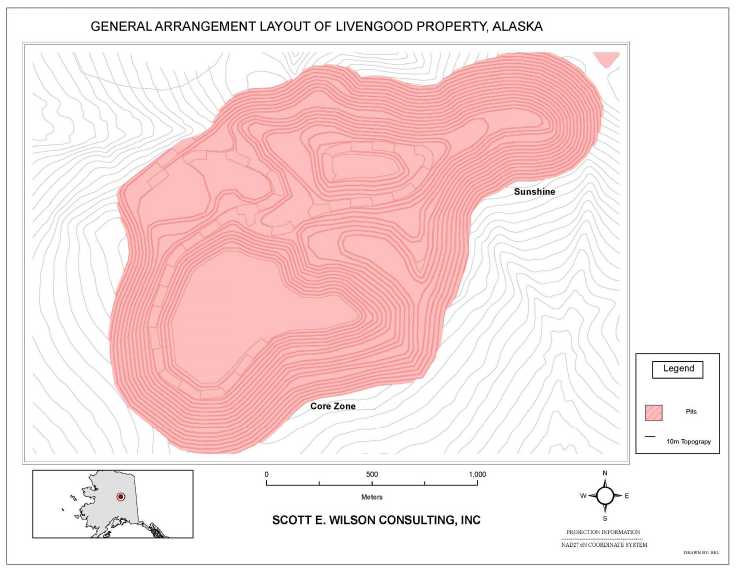
| 190 |
| August 2011 Summary Report On The Livengood Project, Tolovana District, Alaska |
16.4 Mine Schedule
ITH intends on constructing a mill to recover gold from mineralized material mined from the Core Zone and the Sunshine Zone. The expected annual contained gold in mineralized material sent to the mill varies but is expected to be approximately 715,000 ounces per year for the first ten years. Recovered gold production for the same period would average 568,000 ounces per year. In order to meet this production target, 65 million tonnes of material must be removed from the surface mine in order to expose 34 million tonnes of mineralized material on an annual basis. The plan based on current economics is expect to have a mine life of 23 years as shown inTable 16.1.
16.5 Mine Fleet & Capital
Mine fleet selection was determined by matching hydraulic shovels to two different size haul trucks. SEWC used Adventurine Sherpa software to assist with optimal equipment recommendations. Sherpa uses a worldwide sampling of actual equipment utilization and accurately simulates the production process in terms of material movement and production costs. The Livengood project requires a fleet that can move 75 million tonnes per year including the ability to deliver 34 million tonnes per year to the mill with the remaining overburden being delivered to the overburden storage facility .
Haulage distances were determined for the centroid of each bench of the surface mine, to the haul road and then to the exit point of the mine. From that point, individual distances were determined to the crusher and to the overburden storage facility. Haul road grades were determined for each of the segments and the data was modeled with a haul cycle simulator.
Based on these assumptions a total initial capital expenditure for mine rolling stock would be US$127 million dollars to get the Livengood project into operation. Haul trucks would be rebuilt at 60,000 hrs, 100,000 hrs and 130,000 hrs, and would be replaced at 150,000 hours of operation.
| 191 |
| August 2011 Summary Report On The Livengood Project, Tolovana District, Alaska |
17.0 Recovery Methods
Based on the test work discussed previously and on the current estimated resource, numerous process options were investigated.Figure 17.1presents a simple block flow diagram of the preliminary circuit. The process envisioned crushing run of mine mineralized material in a primary gyratory crusher, conveying the primary crushed material to a coarse stockpile and reclaiming the crushed mineralized material from beneath the stockpile using apron feeders discharging onto a SAG mill feed conveyor.
The grinding circuit consists of a single SAG mill feeding two ball mills in parallel. The gravity circuit will scalp material from the grinding circuit producing a rougher gravity concentrate. The rougher gravity concentrate will be cleaned using a gravity cleaning step, producing a gravity middlings and gravity cleaner concentrate. The gravity cleaner concentrate will be processed in the gold refinery into doré bars. Gravity rougher tailing will be returned to the grinding circuit. The grinding circuit utilizes cyclones to make a size separation at about 130µm, allowing material finer than this to report to the flotation circuit.
The ground mineralized material, which will have the gravity recoverable gold removed, will be floated in tank flotation cells using a suite of gold specific chemical collectors. The flotation concentrate will be combined with the gravity middlings, the combined concentrate will be reground and leached in a CIL circuit.
The CIL circuit will produce a loaded carbon which will be acid washed, stripped of gold, and reactivated for reuse in the CIL circuit. The carbon stripping will produce a pregnant gold solution that will be processed in the refinery electrowinning cells. The electrowon cell product, gold sludge, will be dried, smelted and poured into doré bars for offsite refining and marketing.
Benign flotation tailing will be thickened and piped to a tailing management facility. CIL tailing will be treated to destroy any remaining free cyanide and will be piped to a CIL tailing management facility. Process water will be reclaimed from the tailing management facilities for reuse in the process facilities.
| 192 |
| August 2011 Summary Report On The Livengood Project, Tolovana District, Alaska |
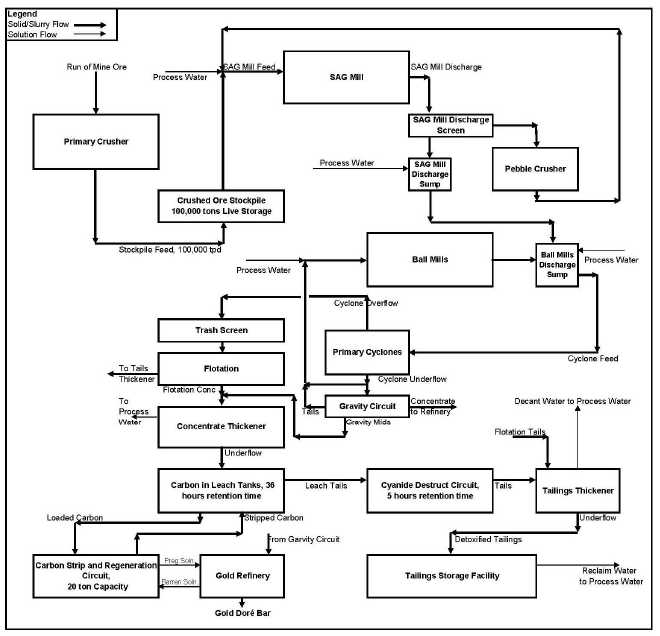
Figure 17.1 Proposed Livengood Process Block Flow Diagram
17.1 Gold Recovery
Utilizing existing test work data as well as industry experience and applying the process scenarios described previously, an estimation of the gold recovery by mineralization type has been performed.Table 17.1provides the gold recoveries as currently estimated.
| 193 |
| August 2011 Summary Report On The Livengood Project, Tolovana District, Alaska |
Table 17.1 Gold Recovery Assumptions By Mineralized Material Type (Weighted Avg Recovery)
| Mineralized Material Type | Gravity/Flotation/CIL Gold Recovery (%) |
| Cambrian | 88.2 |
| Upper Seds Core Zone | 78.5 |
| Kint | 62.6 |
| Main Volcanics | 67.5 |
| Lower Seds | 67.6 |
| Sunshine Upper Seds | 89.1 |
The mill recoveries utilized in this study are from preliminary test data on the various mineralization types. The scoping tests completed include column tests, bottle roll tests using both straight cyanide leaching, cyanide leaching with activated carbon added, and a combined gravity concentration/flotation schemes. Preliminary testing on flotation concentrate and gravity concentrate leaching has been performed and is a focus for on-going test work. Initial test work utilizing the proposed flow sheet has been performed on samples from the main volcanics, upper sediments, lower sediments, Cambrian and lower sand units to quantify a range of likely recoveries. See Section 13 for a complete discussion on the test work results for the different types of mineralized material.
A factor of +4% has been added to the weighted average recoveries listed inTable 17.1 based on the relatively early stage of the metallurgical testing program and the fact that optimization studies have not been conducted. This forward-looking factor was applied in the economic model, and was considered a reasonable expectation for improvement by the Qualified Person based on historical experience.
17.2 Processing Cost
The test work performed to date has enabled the development of reagent consumptions and power requirements for processing of Livengood mineralized materials. Test work provides the consumptions of the major process chemicals, such as cyanide, lime, flotation reagents, etc., as well as abrasion and grinding work indices that have been used to calculate grinding media and liner consumption, as well as power consumption. The process costs were developed using a first principles approach by unit operation.
Labor has also been estimated by establishing man power loading requirements to operate and maintain the facilities, and staffing for providing operations support. Wages and salaries were established by position and referenced against other mining facilities in Alaska.
Table 17.2 shows the estimated process operating costs that were developed for each Livengood mineralized material type.
| 194 |
| August 2011 Summary Report On The Livengood Project, Tolovana District, Alaska |
Table 17.2 Process Operating Cost Estimate by Mineralized Material Type (Weighted Avg Costs)
| Rock Type | Rock Code | Oxidation | Processing Cost |
| Lower Seds | 3 | 3 | $6.92 |
| Cambrian | 4 | 3 | $6.67 |
| Sunshine Upper Seds | 5 | 3 | $6.86 |
| Upper Seds - Core | 6 | 3 | $6.88 |
| Main Volcanics | 8 | 3 | $6.60 |
| 195 |
| August 2011 Summary Report On The Livengood Project, Tolovana District, Alaska |
18.0 Project Infrastructure
This section of the report discusses regional infrastructure available to support the development of a mining project at Livengood. Regional capacities to supply infrastructure and personnel are critical factors in the success of subarctic mining operations. Local terrain and topography are also reviewed with respect to the construction of site specific infrastructure during mine development.
18.1 Human Resources
The community of Fairbanks, AK is the regional center for skilled labor, business services, health services and logistics. The greater metropolitan area has a population of approximately 98,000 people, with skills well suited to development and operation of a mining project. The labor force available includes personnel with specific experience in mining due to proximity to the Ft. Knox and Pogo mining operations. A local construction industry also supports operation of the Prudhoe Bay oil fields at the extreme north coast. Local military bases also contribute members to the community with skills in cold weather logistics and maintenance.
18.2 Logistics
A regional transportation corridor, illustrated by the map inFigure 18.1, has been developed in Alaska, connecting the city of Anchorage and ocean ports on the south coast with central Alaska and Fairbanks. The corridor includes 2 paved, all weather highways, and a railroad. The paved section of the all weather Elliot-Dalton highways have been extended north approximately 80 km beyond Livengood, and pass 2 km to the west of the deposit. This north extension of the highway system runs parallel to the Aleyeska Pipeline, which carries Prudhoe Bay oil production to the southern terminal at Valdez. The Aleyeska Pipeline passes within 4 km of Livengood.
The Ft. Knox mine, located adjacent to Fairbanks, is similar in scale, mining method and processing method, and has created the commercial basis for labor skills, materials supply and equipment service for the mining industry.
18.3 Electrical Power
Alaska's electrical grid is locally developed without external connection and with generation resources tied together along the railbelt north-south transportation corridor. Electrical power would be supplied to the Livengood Project by the Golden Valley Electrical Association (GVEA). GVEA has indicated to ITH that it would be capable of supplying 80-100 MW of power using existing generating capacity and with installation of additional capacity which has already been designed and permitted. The current estimates of the Livengood Project requirements are within this range.
| 196 |
| August 2011 Summary Report On The Livengood Project, Tolovana District, Alaska |
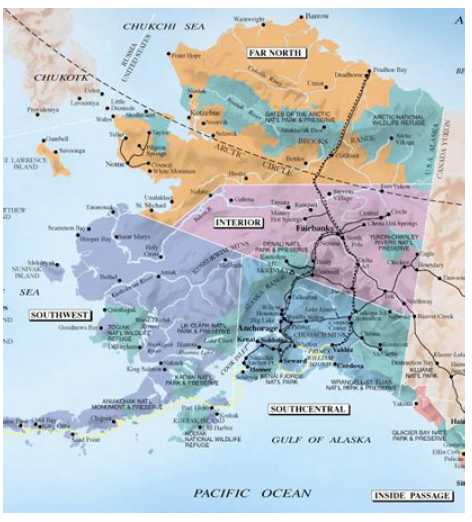
Figure 18.1 Map of Alaska – Livengood Location & Transportation Corridor in Central Alaska
The Livengood Project currently assumes that it will extend the power line approximately 64 km from its current termination north of Fairbanks to the project site along the Alyeska pipeline corridor. The project initiated the environmental baseline studies necessary to support construction applications in June 2011.
GVEA recently announced a partnership to truck liquefied natural gas from the North Slope to Interior Alaska. On a preliminary basis, GVEA estimates that replacing diesel with natural gas could reduce electricity costs by 10 percent.
18.4 Water Resources
Review of water resources available in the Livengood area indicate that they are adequate to support the operations, however, the project will be required to construct substantial storage capacity. Water demand is highest at project start up, and then declines as stored water within the tailing management
| 197 |
| August 2011 Summary Report On The Livengood Project, Tolovana District, Alaska |
facility builds up over the course of the first year of operations, after which most process water needs are met by recirculation.
Acquisition of permits to use the water will be part of the mine permitting process.
18.5 Site Infrastructure
A mining project at Livengood will require the construction of supporting infrastructure consisting of reticulation elements (roads, power line, and pipelines), process plant, overburden storage facilities, tailings management facility and mine shops. Locations and designs for these facilities are part of studies currently ongoing, with preliminary designs and locations due to be specified in the PFS. The investigations and preliminary designs are being performed by Knight Piesold Consulting. Knight Piesold has prepared initial concept level designs (Knight Piesold, 2011a) for the purpose of preliminary costing. The estimates address approximate unit rates and quantities for major cost items and serve to outline technical issues to be addressed as the work proceeds. The information is subject to revision prior to its incorporation into the PFS.
Critical major infrastructure on site will consist of the water reservoir, tailings management facility, overburden management facility, process plant, primary crusher and mine equipment shops. Potential locations for these facilities are being investigated with condemnation and geotechnical drilling to assess their suitability. Priority has been placed on concentrating the project footprint within the Livengood and Goldstream watersheds to the extent possible. Locations have been further refined based on a evaluation by Knight Piesold (2010a) and the obvious need to keep facilities representing large tonnages of material, or material that is more expensive to transport close to the surface mine location.
Figure 18.2 presents a series of photographs of the northeast trending ridge, showing the variety of topographic features considered for locations of the infrastructure facilities. Large drainages incised into the ridge are suitable as overburden storage sites and have capacity for the volumes being considered. Suitable flat terrain is available between the drainages for primary crusher installations, mine shops and the processing plant of the scale being considered.
![]()
| 198 |
| August 2011 Summary Report On The Livengood Project, Tolovana District, Alaska |
Figure 18.2 Photographs of Livengood Area illustrating suitable character for infrastructure locations, A-looking northeast up Livengood Valley, B-looking south at Gertrude Drainage, and C-looking south at flat terrain on the ridge flank adjacent to the Money Knob mineral deposit.
A hydrogeologic testing program is currently underway to characterize the groundwater regime in the Livengood Valley between the north and south bounding ridges. This information will be used in the PFS to support design of the facilities.
| 199 |
| August 2011 Summary Report On The Livengood Project, Tolovana District, Alaska |
19.0 Market Studies and Contracts
The market for gold is global in nature and is unlikely to be unaffected by production from the Livengood Project.
In 2010, global mined production of gold increased from 2009 levels by 99 tonnes for a total of 2,689 tonnes of newly mined metal. Scrap gold sales for 2010 were approximately 1,780 tonnes. Net official sector sales and producer hedging supply were both essentially zero. Thus, total 2010 gold supply was 4,469 tonnes.
Demand for gold occurred in roughly four areas during 2010: 52% in jewelery, 19% in investment, 16% in official sector purchases, and 13% for industrial fabrication and dental uses. The global gold market was in balance during 2010.
Above ground stores of gold bullion at the end of 2010 were estimated to be 166,000 tonnes.
The price of gold is the most significant factor in determining the profitability of any mine operation. Over time, gold price has been subject to volatile price movements over short time frames as the result of various macroeconomic and industry factors that cannot be controlled to any degree by producing companies. It can be stated, however, that the following issues have served to support the increasing gold price trend of the past several years:
| 1. | Global currency concerns regarding the viability of the euro and fiat currencies in general | |
| 2. | A general move towards a higher inflation environment in developed countries and rising prices in BRIC (Brazil, Russia, India, China) countries as well | |
| 3. | Increased demand in both China and India as ownership and banking policies have been clarified. |
In 2011, gold price has reached all time nominal values in excess of $1900 per ounce. For planning and valuation purposes, a backward looking three year average of $1100 was developed whereas an industry market analyst consensus of $1100 is apparent.
This Preliminary Economic Assessment utilized a refining, transportation and insurance charge of $4.73 per ounce of doré, no silver charges were included due to minimal concentrations in the final mine site product.
There are several large third party gold refineries with well established industry relationships in North America. Among the more notable ones are:
- Metalor; North Attleboro, Massachusetts
- Johnson Matthey; Salt Lake City, Utah
- Canadian Mint; Ottawa, Ontario
ITH has not contacted any of the aforementioned companies for competitive treatment bids, rather utilizing industry averages for this stage of development.
| 200 |
| August 2011 Summary Report On The Livengood Project, Tolovana District, Alaska |
For the development of mine site operating costs, preliminary budget values have been derived from direct contacts with current operating mines in similar situations or potential consumable product vendors. At this time, no long term supply contracts have been negotiated regarding any products to be utilized at the Livengood Project.
| 201 |
| August 2011 Summary Report On The Livengood Project, Tolovana District, Alaska |
20.0 Environmental Studies, Permitting and Social or Community Impacts
20.1 Summary of the Results of Environmental Studies
ITH has been conducting environmental baseline studies at the Livengood Project since 2008. The following sections provide a brief summary of the environmental baseline programs conducted or currently underway at Livengood.
20.1.1 Surface Water
Surface water quality baseline studies were initiated in March 2009, with 14 stations sampled during 7 events through 4 seasons. In 2010, the program was increased to 19 stations sampled during 7 events through 4 seasons. A similar program is underway in 2011. The samples are analyzed for a comprehensive suite of analytes and include QC sample collection.
While there are apparent local and seasonal spikes among some analytes, these are deemed to be mostly natural and, in part, a reflection of past placer mining activity.
20.1.2 Hydrology
Surface water flow investigations were added during the 2010 sampling program and included instantaneous flow measurements. In the fall of 2010, ITH entered into a cooperative agreement with the USGS to install water gauging stations at four locations in the project vicinity. Station data is available over the internet on a real-time basis. Many of the local streams are ephemeral during periods of low precipitation.
Snow surveys were completed on several aspects, elevations, and vegetation types in late spring 2010 and in 2011.
20.1.3 Geohydrology
Groundwater flow and characterization studies were initiated in 2010 with the installation of 9 deep groundwater wells on Money Knob and 8 shallower wells in valley gravels. Additionally, 21 packer tests were completed in 4 HQ core holes and 28 short-term air-lift pump tests were completed. Thermal Acquisition Cables (TAC) strings were also installed in 9 deep monitoring wells on Money Knob and 19 short TAC strings were installed in a variety of aspects and vegetation types to characterize the permafrost conditions in the area. Groundwater sampling on Money Knob is currently underway. The TAC string information has corroborated that permafrost underlies extensive portions in the project area, particularly those areas with shallow gradients and north-facing aspects.
Monitoring wells have also been installed in areas that are currently being evaluated for potential infrastructure locations. Groundwater elevation, thermal, and water quality data is being collected from these wells.
Work plans for 2011 include the installation and sampling of several dedicated groundwater monitoring wells on and around Money Knob.
| 202 |
| August 2011 Summary Report On The Livengood Project, Tolovana District, Alaska |
20.1.4 Wetlands
A reconnaissance wetland survey was undertaken in 2009 and targeted the resource drilling area and those areas that were accessible by the existing road and access trail network. This work was used to prepare a preliminary wetlands jurisdictional determination that was accepted by the Army Corps of Engineers for exploration disturbance within the resource area (as discussed in Section 4.3) . In 2010, wetlands surveys continued, focusing on both refining wetlands delineations within the resource area and verifying GIS mapping in the expanded project area. In late 2010, new orthophotography was taken of the project area as well as additional land holdings. To date, nearly 50,000 acres have been mapped and nearly 700 wetland determinations (field plots) have been made. The majority of the wetlands mapped in the project are located in areas dominated by black spruce forests and near-surface permafrost.
The 2011 field program, currently underway, is targeting field verifications in new land holdings and additional QC work in the previously surveyed areas.
20.1.5 Meteorology and Air Quality
Two meteorological stations were installed at the project in September 2010. One station is located on Gertrude Ridge, above and east of the resource area and collects meteorological data including temperature, year-round precipitation, wind direction and speed, and relative humidity. The other station is located to the southwest of the resource area at a lower elevation and collects the same meteorological parameters. Two PM 2.5 meters are co-located with this station to monitor ambient air quality. An evaporation pan was installed at the lower meteorological station in May 2011. PM 2.5 data will be collected through the fall of 2011. Metrological data will be collected over several years in order to support project design and water management considerations.
20.1.6 Aquatic Resources
Aquatic investigations began in June 2009 with a preliminary assessment of fish species suitable for tissue metal analysis. As the most populous fish in the project area, young of year Arctic Grayling were targeted for full-body tissue analysis. In addition, macroinvertebrate and periphyton sampling was performed using a variety of sampling techniques in an effort to determine which method was most suitable for the Livengood Project.
In 2010, the program was expanded to include: 1) fish presence/absence throughout the summer; 2) a May Arctic Grayling spawning survey; 3) May Northern pike metals analysis; 4) August grayling metals analysis; 5) a fall Whitefish otolith study; 6) benthic and drift macroinvertebrate surveys; and 7) periphyton surveys. The preliminary results of these programs indicate that tissues of the resident fish in the area do contain detectable metals concentrations, as do many regional steams in naturally mineralized areas.
A fish overwintering investigation was completed in March 201l. Additional aquatics work underway this year includes grayling tissue analyses as well as macroinvertebrate & periphyton surveys.
| 203 |
| August 2011 Summary Report On The Livengood Project, Tolovana District, Alaska |
20.1.7 Rock Characterization
In 2010, a review and interpretation of the entire geo-database was undertaken to understand the rock types and potential metals of concern. Based on this review, 1403 samples were combined into 351 composites based on rock type, alteration, and oxidation. These composites were analyzed for metal content by standard ICP methods, sulfur speciation, and Acid-Rock Drainage (ARD) potential.
Statistical analysis of the dataset has shown that the main rock characteristic controlling ARD potential is rock type, rather than hydrothermal alteration type. The existence of partial oxidation also does not appear to exert a strong control on ARD. The following observations can be made with respect to ARD potential:
- Cambrian rocks have very low ARD potential due to the dominance of low sulfur concentrations and elevated NP.
- The Money Knob unit has low sulfur and low NP and is considered mainly non-PAG regardless of NP.
- Upper Sediments are mainly non-PAG though some components are uncertain.
- Lower Sediments are mainly PAG though some components are uncertain and non-PAG.
- Greatest ARD potential is associated with the Main Volcanics.
- Kint and Lower Sand have variable ARD potential.
Based on this initial test work, two kinetic test work programs are underway in 2011. The entire rock dataset has been screened by rock type and various percentile sulfur and arsenic content. Mercury, selenium, and antimony content were also used in the sample selection process. From these samples, 23 humidity cells tests are currently underway. In addition, rock types with varying paste pH, iron sulfide to arsenic ratios, and mercury contents will be tested for MWMP.
An additional screening process has been completed targeting similar rock types with gold contents below 0.3 g/t. From these samples, 18 humidity cell tests and MWMP tests will be intitiated later this summer. This program will be used to characterize the overburden rock generated at the project.
20.1.8 Wildlife
Wildlife studies were initiated in 2011 and include a review and synthesis of existing data in the project area, GIS mapping of wildlife habitats, an invasive plant survey, and field surveys for key wildlife species. Moose surveys were completed in March 2011 and raptor/bird surveys were completed in May and June 2011. Hunters are active in the region and local trap lines are present. The area is typical of interior Alaska with respect to wildlife habitat.
20.1.9 Cultural Resources
Talon Gold has been coordinating with the State Historic Preservation Office (SHPO) and the BLM on cultural resources in the project area since 2008. Archeological consultants have conducted block surveys on nearly 6,000 acres of the project to date. This work was initiated in the resource area to support exploration permitting and has expanded to outer project areas. To date, 65 historic sites have
| 204 |
| August 2011 Summary Report On The Livengood Project, Tolovana District, Alaska |
been identified, including 2 prehistoric sites. In 2011, surveys are being conducted in the Livengood and Goldstream Creek areas.
These historic sites are not currently expected to impact project construction, and the archaeological consultants have provided recommendations which include a policy of feature avoidance to prevent damage to the condition or integrity of identified features. All recommendations will be reviewed by SHPO, who will determine if any identified cultural resources require further action or mitigation.
20.2 No Known Material Environmental Issues
Based on review of the studies completed to date, there are no known environmental issues that are anticipated to materially impact the Project’s ability to extract the gold resource.
20.3 Overburden and Tailings Disposal, Site Monitoring, and Water Management
Based on the potential project development scenario described in Sections 18.0 and 19.0 above, the Project will generate 750 M tonnes of mineralized material that will be processed through the mill and placed as hydraulic fill in a tailing management facility. The Project will also generate 892 M tonnes of rock that will be placed in an overburden storage facility. The details associated with location and design of these facilities is still being evaluated and has not been finalized.
A site-specific monitoring plan and water management plan for both operations and post mine closure will be developed in the future in conjunction with detailed engineering and Project permitting.
20.4 Project Permitting Requirements
The Project will require numerous Federal and State permits and authorizations. Table 20.1 is an estimate of the permits likely to be required based on the conditions at the time of this report.
Table 20.1 Project Permit Requirements
| Agency | Authorization |
| Federal | |
| U.S. Army Corps of Engineers (USACE) | CWA Section 404 Permit (wetlands dredge and fill) |
| Section 106 Historical and Cultural Resources Protection | |
| U.S. Environmental Protection Agency (EPA) | Storm Water Construction General Permit |
| Storm Water Discharge Multi-Sector General Permit for Industrial Activities | |
| Spill Prevention, Control and Countermeasure Plan (SPCC) | |
| EPA Air Quality Permit Review | |
| EPA Hazardous Waste Generator ID Resource Conservation and Recovery Act (RCRA) | |
| National Marine Fisheries Service | Threatened and Endangered Species Act Applicability Consultation |
| U.S. Fish and Wildlife Service | Section 7 Threatened and Endangered Species Act Consultation |
| Bald Eagle Protection Act Clearance | |
| Migratory Bird Protection | |
| Fish and Wildlife Coordination Act |
| 205 |
| August 2011 Summary Report On The Livengood Project, Tolovana District, Alaska |
| Agency | Authorization |
| U.S. Bureau of Land Management | Plan of Operations Approval |
| Decision Record | |
| Bond Approvals | |
| U.S. Bureau of Alcohol, Tobacco & Firearms | Permit & License for Use of Explosives |
| License to Transport Explosives | |
| Mine Safety and Health Administration | Notification of Legal Identity |
| Training of Miners Plan | |
| Federal Aviation Administration (FAA) | Notice of Controlled Firing Area (Blasting) |
| Structure Warning Lights | |
| Federal Communication Commission - WTB | Radio Station License |
| U.S. Department of Transportation | Approval to Transport Hazardous Materials |
| U.S. Regulatory Commission | Material License for geotechnical studies |
| State | |
| Alaska Department of Natural Resources Division of Mining, Land & Water | |
| Plan of Operations | |
| Reclamation Plan Approval | |
| Reclamation Bond | |
| Mining License | |
| Land Use Permits and Leases | |
| Certificate of Approval to Construct a Dam | |
| Certificate of Approval to Operate a Dam | |
| Dam Safety Certification | |
| Material Sale (for construction material borrow areas) | |
| Temporary Water Use Permit (if not acquiring water rights) | |
| Water Rights Permit (if not using Temporary Water Use Permit) | |
| Road Right of Way/Access | |
| Power Line ROW | |
| Cultural Resource Protection | |
| Archeology Study Permits | |
| Alaska Department of Environmental Conservation | Alaska Pollution Discharge Elimination System (APDES) |
| Section 401 Water Quality Certification (SWA 404 Permit) | |
| Overburden Management Permit (includes Solid Overburden and wastewater) | |
| Storm Water Pollution Prevention Plan (SWPPP) | |
| SPCC Plan Review Approval | |
| Approvals to Construct and Operate a Public Water Supply System | |
| Plan Review and Construction Approval for Domestic Sewage System | |
| Solid Waste Landfill Permit | |
| Food Sanitation Permit | |
| Air Quality Pre-Approved Limit – Diesel Engines | |
| Air Quality Construction Permit (first 12 months) | |
| Air Quality Control Major/Minor Permit to Operate | |
| Air Quality Permit to Open Burn | |
| Alaska Department of Fish & Game | Fish Habitat and Fish Passage permits |
| Alaska Department of Transportation & Public Facilities | Notification of Blasting for Road Closure |
| Controlled Firing Area for Blasting | |
| Right of Way/Access/Driveway | |
| Alaska Department of Public Safety-FP | Communication Site Permit |
| Fire Marshal Plan Review | |
| Alaska Department of Labor and Workforce Development | Certificate of Inspection for Fired & Unfired Pressure Vessels |
| Employer Registration |
| 206 |
| August 2011 Summary Report On The Livengood Project, Tolovana District, Alaska |
| Agency | Authorization |
| Alaska Department of Health and Social Services-CHEMS | Life Flight Service |
| Other Entities | |
| Alyeska Pipeline | TAPS ROW access/crossing approvals |
Since development of the Project will require a number of Federal permits, the National Environmental Policy Act (NEPA) and Council of Environmental Quality (CEQ) Regulations 40 CFR parts 1500-1508 will govern the federal permitting portion of the Project. The NEPA process requires that all elements of a project and their direct, indirect, and cumulative impacts be considered. A reasonable range of alternatives are evaluated to assess their comparative environmental impacts, including consideration of feasibility and practicality. In fulfillment of the NEPA requirements, it is anticipated that the Project will be required to prepare an Environmental Impact Statement (EIS). Upon completion of the EIS and the associated Record of Decision by the lead federal agency, the federal and state agencies will then complete their own permitting actions and decisions. Although at this time it is unknown which department will become the lead federal agency, the State of Alaska is expected to take a cooperating role to coordinate the NEPA review with the State permit process.
Actual permitting timelines are controlled by the Federal NEPA review and Federal and State agency decisions.
20.5 Status of Permit Applications
There have been no permit applications submitted for Project construction.
20.6 Requirements for Performance or Reclamation Bonds
There are two State of Alaska agencies that require financial assurance in conjunction with approval and issuance of large mine permits. The Department of Natural Resources Division of Mining, Land and Water, under authority of Alaska Statute 27.19, requires a Reclamation and Closure Plan be submitted prior to development and requires financial assurance to assure reclamation of the site. The Department of Environmental Conservation requires financial assurance both during and after operations, and to cover short and long-term and long term water treatment if necessary, as well as reclamation and closure costs, monitoring, and maintenance needs. The financial assurance amounts will be estimated in conjunction with development of the Reclamation and Closure Plan. The Project may satisfy the financial assurance requirement by providing any of the following (1) a surety bond (2) a letter of credit (3) a certificate of deposit (4) a corporate guarantee that meets the financial tests set in regulation by the commissioner; (5) payments and deposits into the trust fund established in AS 37.14.800; or (6) any other form of financial assurance that meets the financial test or other conditions set in regulation the commissioner. The adequacy of the Closure Plan and the amount of the financial assurance is reviewed by the State agencies at a minimum of every five years.
20.7 Social or Community Related Requirements and Plans
The Project in located 70 miles north of Fairbanks, Alaska and approximately 40 road miles north of the boundary of the Fairbanks North Star Borough. The Project is in an unincorporated area of the State and encompasses a combination of State of Alaska mining claims, State of Alaska Mental Health
| 207 |
| August 2011 Summary Report On The Livengood Project, Tolovana District, Alaska |
Trust lands, private lands, and federal mining claims. While the old mining town of Livengood no longer has year round residents or an organized government, there are approximately 15 residents living on remote homesteads on the road system within a 16 km radius of the Project. The nearest community is the village of Minto, a town of 200 located approximately 64 km southwest by road from the Project. Thus, while the local residents and the community of Minto are important stakeholders in the region and to the Project, there are no municipal or community agreements required for the Project.
20.8 Mine Closure Requirements and Costs
The reclamation standard under AS.27.19 is that “a mining operation shall be conducted in a manner that prevents unnecessary and undue degradation of the land and water resources, and the mining operation shall be reclaimed as contemporaneously with the mining operation to leave the site in a stable condition”.
A key to the successful closure of the Livengood Project will be to incorporate as many environmental considerations into the initial design process as possible. These considerations include the characterization of the overburden, tailing, and water that are currently underway.
A reclamation and closure plan will be submitted to the agencies during the permitting process and will discuss the final outcome of the project. This document will cover the storage of growth media stockpiles and the techniques necessary to promote successful revegetation. It will also present a final land use plan, re-grading, long-term water quality monitoring and management, test vegetation plots, the closure design, removal of facility components, and financial assurances. The financial assurance amounts will be estimated in conjunction with development of the Reclamation and Closure Plan.
In addition, the Livengood Project will need to prepare the 12-step Compensatory Mitigation Plan required by the USACE since June 2008. This will be an in-depth plan for mitigating unavoidable wetlands impacts and should include the input from many reclamation and mitigation bank experts. It may require the setting up of mitigation banks with third parties.
| 208 |
| August 2011 Summary Report On The Livengood Project, Tolovana District, Alaska |
21.0 Capital and Operating Costs
International Tower Hill Mines Ltd. engaged MTB Project Management Professionals, Inc. to review capital cost that had been prepared in previous PEA estimates, make appropriate adjustments, prepare capital estimates, develop a work breakdown structure (WBS) for the capital cost, and develop an execution schedule for the capital expenditures, based on the scope of work as defined as of July 2011. Also, a sustaining capital cost estimate was to be prepared.
The capital cost scope was developed to a WBS. This WBS was developed from several historical projects of similar scope. The capital components of the estimate were allocated into two major groupings:
- Initial capital
- Sustaining capital cost for both incremental capital and replacement capital.
Costs were defined by the preproduction milestone schedule, with an approved feasibility study initiating the start of the capital cost being incurred; costs prior to the approved feasibility study were considered to be “sunk” costs. Initial capital cost was defined as all cost incurred before startup, which is when the first mineralized material is discharged into the primary crusher. Production year +1 begins at startup and defines operating cost.
The mill production starts in year +1 at a nominal 61,700 mtpd feed rate and ramps up to a nominal 91,000 mtpd in production year +2. The Life of Mine (LOM) average feed rate is 89,400. mineralized material tonnes per day and 195,600 total mineralized material and overburden tonnes per day.
| The capital cost summary is as follows: | |
| Initial Capital Cost | $1,614 million |
| LOM Sustaining Capital Cost | $585 million |
| Contingency included in initial capital cost | $323 million |
21.1 Estimate Basis
The estimate is prepared in July 2011 dollars. No forward escalation is included. The accuracy level is +/- 35%. Contingency is allowed at 25% of direct cost.
The process capital cost was estimated by preparing an equipment list from preliminary flow sheets and pricing the equipment from published documentation, historical estimate pricing, and estimating judgment. The total process cost of the other commodities for each installed process area was obtained by factoring the equipment cost using a 2.5 factor. For some WBS accounts, historical costs from recent projects were used and in other WBS accounts, first principal estimating was performed, using quantities and historical or quoted unit rates. Contractor budget quotations support preproduction mining and geotechnical facilities.
| 209 |
| August 2011 Summary Report On The Livengood Project, Tolovana District, Alaska |
21.2 Initial Capital
The initial capital cost consists of cost to be incurred after an approved feasibility study has been prepared. It includes all cost up to the start of production, which is defined as when the first mineralized material feed is introduced to the concentrator. The initial capital consists of the scope to construct a concentrator of a nominal 91,000 mtpd mineralized material feed, including processing to produce doré.
The scope of the initial capital includes contract and Owner preproduction overburden removal to the tailings dam and water storage dam, process plant construction, material handling, support facilities, freight, design and procurement engineering, vendor representatives, construction management, and commissioning support. It also includes Owner direct and indirect cost.
21.3 Sustaining Capital Cost
Sustaining capital is cost that is incurred after production starts and includes incremental capital (expansion of production capability and special production needs) and replacement capital (major overhaul or replacement of worn out equipment).
Sustaining capital consists of dewatering construction, tailings impoundments and overburden facility storage expansions, mobile equipment replacement, and both mine equipment replacement and major overhauls. Major overhauls have been estimated on major mining equipment at 60,000, 100,000 and 130,00 operating hours, throughout the life of the mine.
21.4 Capital Cost Build up
Capital Costs were defined by the preproduction milestone schedule, with an approved feasibility study initiating the capital cost. Initial capital cost was defined as all cost incurred before startup, which is when the first mineralized material is crushed and introduced into the concentrator.
This section provides detail of the costs estimated with aTable 21.1 providing a summary of the Capital Cost.
| 210 |
| August 2011 Summary Report On The Livengood Project, Tolovana District, Alaska |
Table 21.1 Summary of Initial Capital Costs
| WBS | Description | $000 |
| 100 | Mine Area Facilities including Preproduction mining & rolling stock | 271,371 |
| 200 | Crushing | 42,057 |
| 300 | Grinding and Gravity Separation | 288,854 |
| 400 | Flotation | 96,369 |
| 500 | Concentrate Leaching and Cyanide Destruction | 32,894 |
| 700 | Carbon Stripping, Regeneration, and Refining | 28,222 |
| 800 | Reagents | 11,445 |
| 900 | Tailings and Water Storage | 118,318 |
| 1000 | Utilities | 55,290 |
| 1100 | Buildings | 6,217 |
| 1200 | Site Development and Plant Roads | 24,100 |
| 1300 | Common Distributables: Contractor Indirects, Freight, etc. | 76,546 |
| Total Contracted Directs | 1,051,683 | |
| 2000 | EPCM, Vendor Representatives and Commissioning/Startup | 142,072 |
| 3000 | Owner’s Direct Cost | 39,340 |
| 4000 | Owner’s Indirect Cost | 57,950 |
| Total Contracted Indirects and Owner’s Cost | 239,362 | |
| Total Cost without Contingency | 1,291,044 | |
| 9200 | Contingency | 322,761 |
| Total Initial Capital Cost | 1,613,805 |
21.4.1 Accuracy, Escalation, and Contingency
The accuracy of the estimate is a nominal +/- 35%. No forward escalation has been included. Based on the minimal engineering that has been performed, a 25% contingency has been added to the project estimated cost.
21.4.2 Currency and Cost Date
The estimate has used US dollars as the currency for reporting cost. The estimate has used July 2011 as the estimate cost baseline.
21.4.3 Scope
The scope of the capital cost estimate consists of all costs incurred after a final feasibility study has been approved and continues through to production startup and commissioning support. Working capital is included in year +1, to provide the cost required to operate prior to the cash flow providing a self-sustaining project status, where cumulative revenue exceeds cumulative operation cost for an ongoing LOM period. Working capital is not included in the initial capital cost, but is addressed in the financial model.
| 211 |
| August 2011 Summary Report On The Livengood Project, Tolovana District, Alaska |
Sustaining capital is estimated for the LOM period.
21.4.4 Mining Costs
The preproduction stripping is estimated to be performed by a contract mining company for two years, with Owner mining equipment augmenting the contractor in year -1. During this period, the Owner will procure the balance of the initial mining fleet and assemble it onsite to begin production mining at the beginning of year +1. The Owner’s fleet consists of 793 CAT haul trucks and Bucyrus 34 cubic meter hydraulic shovels, the main mining equipment to start year +1 production.
Budget Pricing was obtained from CAT for the haul trucks and from Bucyrus for the shovels in August 2010 with prices escalated to July 2011.
Other mining equipment includes:
- Pit Viper Blasthole Drill, Crawler
- RC drills
- Front-End Loader, 25-cu-m
- Crawler Dozer, D9
- Vibratory Compactor, 30-t
- RT Dozer, 335-kW
- Motor Grader, 200 kW
- Water Truck, 80,000-liter
- Spare Shovel Dipper
Ancillary mine equipment includes:
- ANFO/Slurry Truck, 15-t
- Blasthole Dewatering Truck
- Powder Truck, 1-t
- Crawler Excavator, 1.5-cu-m
- Fuel/Lube Truck
- Mechanic Field Service Truck
- Off-Road Tire Handling Truck
Miscellaneous mining equipment includes:
- Powder Magazine, 14-t
- AN Storage Bin, 60-t
- Emulsion Storage Bin, 65-t
- Mobile Radios
- Mining Software
- Truck Dispatch System
- Radio Com Base Station
| 212 |
| August 2011 Summary Report On The Livengood Project, Tolovana District, Alaska |
21.4.5 Power Transmission
A three-ring bus substation is assumed connected to GVEA’s Ft. Knox 138kV transmission line, 70 km of 230 kV transmission line to the Livengood project site is included at a cost of $37 million. A site substation is included at $5 million.
21.4.6 Process Facilities and Ancillary Buildings
The initial capital includes:
- Primary Crusher, Mineralized Material Stockpile, and Reclaim System
- Sag Mill
- Pebble Crushers
- Ball Mills
- Primary Cyclones and Gravity Separation Circuit
- Flotation and Concentrate Thickener
- Carbon in Leach Tanks
- Cyanide Destruct Circuit
- Carbon Stripping, Regeneration, and Refining
- Tailings Thickener, Pipeline and Storage Facility
- Process Water Reclaim System
The ancillary facilities for initial capital include:
- Truck shop, warehouse, change house, and mine offices
- Administration building, warehouse, and plant change house
- Laboratory
- Gatehouse and security building
21.4.7 Common Distributables
Common distributables are costs that are estimated on an aggregate basis, rather than on a line item basis.
The items estimated are:
- Construction equipment
- Contractors’ indirects
- Contractors’ camp
- Contractors’ catering
- Freight and logistics
- Auxiliary equipment e.g. compressors, sump pumps, etc.
Freight was calculated at an average 8% of equipment and material cost.
21.4.8 Contracted Indirects
Contracted indirects include cost for work required to complete the construction, but which efforts are not incorporated in the physical plant. These items include:
| 213 |
| August 2011 Summary Report On The Livengood Project, Tolovana District, Alaska |
- Design and procurement engineering, including field support and components of direct construction management.
- Vendor representatives for support of construction and commissioning
- Support labor and supervision for plant commissioning
Design and procurement engineering and construction management are included at 16% for the concentrator capital and other direct cost designed elements and 8% for design and contractor QC/QA for geotechnical capital.
21.4.9 Owner’s Cost
Owner’s major direct costs include:
- Plant and mine support mobile equipment
- Plant and mine spare parts at 7% of equipment costs
- Initial fills of consumables, such as reagents, diesel fuel, etc.
- Owner’s camp renovation
- Owner other direct costs, factored from a historical project
- Communications equipment furniture, office and engineering equipment and software
- Mine and plant shop equipment and warehouse shelving
- Medical and security equipment
Owner’s major indirect cost includes: Preproduction Employment and training: this includes the staffing up of project personnel and training labor prior to startup of production. This category also includes mining staff overseeing the contract miner.
Owner other indirect costs are factored from a historical project:
- Client Management is direct management of the Engineer and Contractors during the engineering and construction duration of initial capital efforts.
- An allowance to provide catering for permanent camp operations is included for staff and labor that are not providing their own accommodations off-site.
- Owner other indirect costs as factored from a historical project;
- Communication expenses
- Insurances
- Corporate travel and services
- Environmental
- Security and medical expenses
- Community development.
- Legal, permits, and fees
21.4.10 Working Capital
Working capital is calculated by scheduling operating cost cash flow and receipt of revenues on a weekly schedule. The operating cash flow and receipt of revenue is then tabulated on a cumulative basis with the difference between cumulative operating cost and cumulative revenue presented on a weekly basis. The largest difference between cumulative operating costs required vs. cumulative
| 214 |
| August 2011 Summary Report On The Livengood Project, Tolovana District, Alaska |
revenue received is the working capital that needs to be funded to maintain operations until cumulative revenue provides a self-sustaining operation.
Cost of labor is considered a weekly cash disbursement. Mining purchases are delayed approximately 45 days from average monthly incurrence. G&A expense is delayed approximately two weeks after average monthly incurrence.
Revenue receipt considers 90% of receipt after one week. The balance of 10% is considered to be received 4 weeks after receipt by buyer. Shipments are on a weekly basis.
Working Capital is not included in the initial capital total, but is addressed in the financial model.
21.4.11 Sustaining Capital Cost
Additional mining fleet equipment will be brought on line, as production increases and this cost is recognized in the sustaining capital. Major overhauls of major equipment will be performed at approximately 60,000 machine hours. Smaller support equipment will be replaced at the end of its useful life.
Infrastructure sustaining capital includes for an expansion of dewatering capability for both dewatering pumping of the pit, as well as drainage gallery dewatering in production years +6 through +8.
The tailing impoundment is raised for production capacity in years +4, +10, and +18.
The overburden storage facility will be expanded for production capacity in years +3, +7, and +15. Plant mobile equipment is replaced after its useful life cycle; no major overhauls are included for plant mobile equipment.
21.5 Schedule
The schedule has been prepared with an ordinal time frame; however it has a calendar that The schedule time line year +1 begins at the start of production, which is when crushing of mineralized material is initiated.
21.5.1 Major Milestones:
| Start Detailed Engineering and Long Lead Procurement | Year -3 |
| Approved Feasibility Study | Year -2 |
| Project Release | Year -2 |
| Financing in place | Year -2 |
| Mobilize on site and begin plant construction | Year -1 |
| Contractor begins preproduction stripping | Year -2 |
| Owner augmentation of preproduction stripping starts | Year -1 |
| Tailing Cofferdam and Water Storage Facilities in place | Year -1 |
| Start production from concentrator | Beginning of Year +1 |
21.5.2 Construction Schedule
| 215 |
| August 2011 Summary Report On The Livengood Project, Tolovana District, Alaska |
Upon project release, the balance of procurement of Owner mine trucks, concentrator long lead-time equipment orders will be released and critical contracts will be mobilized in order to be in place to support the construction schedule and mining preproduction. The balance of detailed engineering and procurement will also be fully released at this time, with construction to follow for a total of 24 months duration on site to startup of the concentrator. .
Both the tailings cofferdam and the water storage dam will be in place to catch a freshet each, to support the process water requirement at startup.
| 216 |
| August 2011 Summary Report On The Livengood Project, Tolovana District, Alaska |
22.0 Economic Analysis
22.1 Economic Assumptions
A financial model was prepared for the Livengood project to estimate the economic potential. The financial model calculates pre-tax, 100% equity cash flows that can be used for estimating the Net Present Value (NPV) and Internal Rate of Return (IRR). Constant US dollars from Q3 2011 are assumed for all cost information, with no escalation applied. The current exchange rate is 1.00 CDN = 1.01 USD.
A long term gold price of US $1,100 per ounce has been assumed in both the economic analysis, and the Whittle optimization to produce the preliminary mine layout and production schedule. The gold production projected in the analysis is based on the in-situ resource model and estimates of mining recoverable resources at a 0.28 - 0.36 g/t cut-off grade for the different lithologic units. The average monthly price of gold for the 36 month period (August 2008 – July 2011) was US $1,123 per ounce. The average price level for the period August 1 – 12, 2011 was US $1,697, so the long term price assumption was 65% of the market price at the time this report was developed.
22.2 Technical Assumptions
The primary technical assumptions used in the economic analysis are listed inTable 22.1.
Table 22.1 Technical Assumptions used in the Economic Analysis
| Parameter | Units | Parameter Value |
| Total overburden mined | 000’ tonnes | 891,563 |
| Total mineralized material processed | 000’ tonnes | 750,254 |
| Process Plant head grade | g/t | 0.66 |
| Contained gold* | 000’ oz | 15,8307 |
| Assumed gold recover | % | 81.6 |
| Gold sales | 000’ oz | 12,925 |
| Gold refining change ($4.73/oz) | $/tonne processed | $0.08 |
| Mining cost | $/tonne processed | $ 3.87 |
| Processing cost | $/tonne procesed | $ 6.81 |
| Administration cost | $ /tonne processed | $ 0.81 |
| Reclamation cost | $/tonne processed | $ 0.08 |
| Royalty @ 2.5% | $/tonne processed | $0.47 |
| Total Operating cost | $/tonne processed | $12.12 |
| Pre-production capital cost | 000’ $ US | $1,613,805 |
| Sustaining $ cost | 000’ $ US | $ 584,658 |
*-60% Measured, 24% Indicated and 16% Inferred
| 217 |
| August 2011 Summary Report On The Livengood Project, Tolovana District, Alaska |
22.3 Cash Flow
The cash flow projection is based on the mining and processing schedule, as outlined in sections 16.0 and 17.0. The expenditures start in year -3, when engineering design is advanced and long lead equipment items are ordered, in parallel with the permit acquisition. Construction is assumed to start in year -2, and to require 24 months. Process plant start up would occur at the beginning of production year +1.
The production schedule assumes that pioneering of the surface mine begins in year -2 and that a portion of the waste materials are used in construction of the beginning lift of the tailing management facility. This would allow storage of snowmelt from year -1 to support start up of the process plant. This initial mining is assumed to be performed by contractor.
Major production of mineralized material begins in year +1, and the process tonnage of mineralized material and produced gold are used to calculate operating costs and gold production in annual periods. The mineralized material scheduled to the process plant includes 60% from the measured classification, 24% from the Indicated classification and 16% from the inferred classification.
. Project capital expenditures are distributed over the 3 year period, prior to production year +1, based on proportions experienced from previous construction projects, and considering Alaska requirements. All capital expenditures prior to year -3, are considered sunk costs.
Based on the calculated cost and revenue, the pre-tax cash flow was calculated and used to estimate the NPV and IRR. Table 22.2 lists the production schedule and derived cash flow. Table 22.3 presents a summary of key financial parameters derived from the economic analysis.
| 218 |
| August 2011 Summary Report On The Livengood Project, Tolovana District, Alaska |
Table 22.2 Projected Production and Cash Flow Schedule ($ US)
| LOM Total | -3 | -2 | -1 | 1 | 2 | 3 | 4 | 5 | 6 | 7 | 8 | 9 | 10 | 11 | |||||||||||||||||||||||||||||||||
| Overburden mined | 000' tonnes | 891,563 | - | 15,000 | 11,536 | 38,431 | 26,759 | 26,749 | 20,583 | 30,961 | 34,534 | 37,701 | 38,136 | 41,728 | 54,187 | 60,941 | |||||||||||||||||||||||||||||||
| Ore mined | 000' tonnes | 750,254 | - | - | 3,464 | 26,569 | 38,241 | 38,251 | 44,417 | 39,039 | 35,466 | 32,299 | 31,864 | 33,272 | 20,813 | 14,059 | |||||||||||||||||||||||||||||||
| Strip ratio | 1.19 | 3.3 | 1.4 | 0.7 | 0.7 | 0.5 | 0.8 | 1.0 | 1.2 | 1.2 | 1.3 | 2.6 | 4.3 | ||||||||||||||||||||||||||||||||||
| Ore processed | 000' tonnes | 750,254 | - | - | - | 24,911 | 31,554 | 33,215 | 33,215 | 33,215 | 33,215 | 33,215 | 33,215 | 33,215 | 33,215 | 33,215 | |||||||||||||||||||||||||||||||
| Head grade | g/t | 0.66 | - | - | - | 0.72 | 0.92 | 0.65 | 0.91 | 0.74 | 0.60 | 0.69 | 0.56 | 0.66 | 0.54 | 0.43 | |||||||||||||||||||||||||||||||
| Contained Au | oz | 15,829,996 | - | - | - | 572,747 | 933,276 | 692,166 | 972,877 | 794,993 | 643,955 | 738,017 | 599,322 | 701,241 | 572,737 | 463,963 | |||||||||||||||||||||||||||||||
| Assumed process recovery | % | 81.6% | 0.0% | 0.0% | 0.0% | 85.1% | 81.2% | 92.7% | 75.9% | 87.2% | 89.0% | 84.3% | 82.4% | 79.7% | 80.4% | 84.7% | |||||||||||||||||||||||||||||||
| Produced Au | oz | 12,924,668 | - | - | - | 487,517 | 758,020 | 641,414 | 738,694 | 692,937 | 572,871 | 621,999 | 493,844 | 559,119 | 460,258 | 393,156 | |||||||||||||||||||||||||||||||
| Gross Revenue | 000' $ US | $ | 14,217,135 | $ | - | $ | - | $ | - | $ | 536,269 $ | 833,822 | $ | 705,555 | $ | 812,563 | $ | 762,230 | $ | 630,158 | $ | 684,199 $ | 543,228 | $ | 615,031 | $ | 506,284 | $ | 432,471 | ||||||||||||||||||
| Mining cost | 000' $ US | (2,812,065 | ) | $ | - | $ | - | $ | - | $ | (104,693 | ) | $ | (103,953 | ) | $ | (104,152 | ) | $ | (103,953 | ) | $ | (115,922 | ) | $ | (115,922 | ) | $ | (116,206 | ) | $ | (116,341 | ) | $ | (128,460 | ) | $ | (132,304 | ) | $ | (134,398 | ) | |||||
| Processing cost | 000' $ US | (5,108,092 | ) | $ | - | $ | - | $ | - | $ | (166,648 | ) | $ | (216,568 | ) | $ | (225,069 | ) | $ | (222,843 | ) | $ | (228,472 | ) | $ | (227,456 | ) | $ | (225,539 | ) | $ | (226,709 | ) | $ | (226,061 | ) | $ | (226,783 | ) | $ | (223,147 | ) | |||||
| Reclamation cost | 000' $ US | (53,750 | ) | $ | - | $ | - | $ | - | $ | (160 | ) | $ | (249 | ) | $ | (211 | ) | $ | (243 | ) | $ | (228 | ) | $ | (188 | ) | $ | (205 | ) | $ | (162 | ) | $ | (184 | ) | $ | (151 | ) | $ | (129 | ) | |||||
| Transport and refining cost | 000' $ US | (61,134 | ) | $ | - | $ | - | $ | - | $ | (2,306 | ) | $ | (3,585 | ) | $ | (3,034 | ) | $ | (3,494 | ) | $ | (3,278 | ) | $ | (2,710 | ) | $ | (2,942 | ) | $ | (2,336 | ) | $ | (2,645 | ) | $ | (2,177 | ) | $ | (1,860 | ) | |||||
| Administration cost | 000' $ US | (607,705 | ) | $ | - | $ | - | $ | - | $ | (20,178 | ) | $ | (25,559 | ) | $ | (26,904 | ) | $ | (26,904 | ) | $ | (26,904 | ) | $ | (26,904 | ) | $ | (26,904 | ) | $ | (26,904 | ) | $ | (26,904 | ) | $ | (26,904 | ) | $ | (26,904 | ) | |||||
| Royalty | 000' $ US | (355,428 | ) | $ | - | $ | - | $ | - | $ | (13,407 | ) | $ | (20,846 | ) | $ | (17,639 | ) | $ | (20,314 | ) | $ | (19,056 | ) | $ | (15,754 | ) | $ | (17,105 | ) | $ | (13,581 | ) | $ | (15,376 | ) | $ | (12,657 | ) | $ | (10,812 | ) | |||||
| Total Operating cost | 000' $ US | (8,998,174 | ) | $ | - | $ | - | $ | - | $ | (307,392 | ) | $ | (370,760 | ) | $ | (377,010 | ) | $ | (377,751 | ) | $ | (393,860 | ) | $ | (388,935 | ) | $ | (388,901 | ) | $ | (386,033 | ) | $ | (399,629 | ) | $ | (400,976 | ) | $ | (397,249 | ) | |||||
| Project capital cost | 000' $ US | (1,493,470 | ) | (37,988 | ) | (578,973 | ) | (996,844 | ) | - | - | - | - | - | - | - | - | - | - | - | |||||||||||||||||||||||||||
| Sustaining capital cost | 000' $ US | (584,658 | ) | - | - | - | - | - | (9,685 | ) | (119,389 | ) | (2,168 | ) | (436 | ) | (29,733 | ) | (21,235 | ) | (67,714 | ) | (59,031 | ) | (2,168 | ) | |||||||||||||||||||||
| Working capital cost | 000' $ US | (31,774 | ) | (31,774 | ) | ||||||||||||||||||||||||||||||||||||||||||
| Total capital cost | 000' $ US | (2,109,902 | ) | $ | (37,988 | ) | $ | (578,973 | ) | $ | (996,844 | ) | $ | (31,774 | ) | $ | - | $ | (9,685 | ) | $ | (119,389 | ) | $ | (2,168 | ) | $ | (436 | ) | $ | (29,733 | ) | $ | (21,235 | ) | $ | (67,714 | ) | $ | (59,031 | ) | $ | (2,168 | ) | |||
| Total cost | 000' $ US | (11,108,077 | ) | (37,988 | ) | (578,973 | ) | (996,844 | ) | (339,166 | ) | (370,760 | ) | (386,694 | ) | (497,141 | ) | (396,028 | ) | (389,371 | ) | (418,634 | ) | (407,268 | ) | (467,342 | ) | (460,008 | ) | (399,418 | ) | ||||||||||||||||
| Pre-tax cash flow | 000' $ US | 3,109,058 | (37,988 | ) | (578,973 | ) | (996,844 | ) | 197,102 | 463,062 | 318,861 | 315,423 | 366,202 | 240,788 | 265,564 | 135,961 | 147,688 | 46,276 | 33,054 | ||||||||||||||||||||||||||||
| year | |||||||||||||||||||||||||||||||||||||||||||||||
| 12 | 13 | 14 | 15 | 16 | 17 | 18 | 19 | 20 | 21 | 22 | 23 | 24 | 25 | 26 | |||||||||||||||||||||||||||||||||
| Overburden mined | 000' tonnes | 44,139 | 40,356 | 36,261 | 35,794 | 31,150 | 49,205 | 41,662 | 41,785 | 39,578 | 44,987 | 41,341 | 8,059 | - | - | - | |||||||||||||||||||||||||||||||
| Ore mined | 000' tonnes | 30,861 | 34,644 | 33,215 | 39,206 | 33,215 | 25,795 | 33,215 | 33,215 | 33,215 | 30,013 | 33,215 | 32,690 | - | - | - | |||||||||||||||||||||||||||||||
| Strip ratio | 1.43 | 1.16 | 1.09 | 0.91 | 0.94 | 1.91 | 1.25 | 1.26 | 1.19 | 1.50 | 1.24 | 0.25 | - | - | - | ||||||||||||||||||||||||||||||||
| - | - | - | - | - | - | - | - | - | - | - | - | - | - | - | |||||||||||||||||||||||||||||||||
| Ore processed | 000' tonnes | 33,215 | 33,215 | 33,215 | 33,215 | 33,215 | 33,215 | 33,215 | 33,215 | 33,215 | 30,013 | 33,215 | 32,690 | - | - | - | |||||||||||||||||||||||||||||||
| Head grade | g/t | 0.62 | 0.79 | 0.69 | 0.80 | 0.88 | 0.50 | 0.61 | 0.59 | 0.49 | 0.54 | 0.52 | 0.65 | - | - | - | |||||||||||||||||||||||||||||||
| Contained Au | oz | 665,248 | 844,874 | 737,575 | 859,002 | 935,681 | 529,939 | 648,179 | 634,488 | 524,311 | 524,510 | 559,686 | 681,208 | - | - | - | |||||||||||||||||||||||||||||||
| Assumed process recovery | % | 83.6% | 76.3% | 77.8% | 76.5% | 77.4% | 84.5% | 81.2% | 80.9% | 90.4% | 78.8% | 79.3% | 77.9% | 0.0% | 0.0% | 0.0% | |||||||||||||||||||||||||||||||
| Produced Au | oz | 556,183 | 644,276 | 573,612 | 656,875 | 724,489 | 447,596 | 526,561 | 513,488 | 473,996 | 413,211 | 443,645 | 530,907 | - | - | - | |||||||||||||||||||||||||||||||
| Gross Revenue | 000' $ US | 611,801 | 708,704 | 630,973 | 722,563 | 796,938 | 492,355 | 579,217 | 564,836 | 521,396 | 454,533 | 488,010 | 583,998 | - | - | - | |||||||||||||||||||||||||||||||
| Mining cost | 000' $ US | (129,189 | ) | (132,717 | ) | (122,942 | ) | (132,717 | ) | (113,897 | ) | (139,274 | ) | (136,749 | ) | (136,974 | ) | (132,943 | ) | (141,231 | ) | (140,394 | ) | (76,734 | ) | - | - | - | |||||||||||||||||||
| Processing cost | 000' $ US | (223,236 | ) | (220,598 | ) | (225,745 | ) | (227,059 | ) | (228,242 | ) | (227,919 | ) | (225,575 | ) | (227,094 | ) | (227,875 | ) | (204,928 | ) | (228,692 | ) | (225,834 | ) | - | - | - | |||||||||||||||||||
| Reclamation cost | 000' $ US | (183 | ) | (212 | ) | (189 | ) | (216 | ) | (238 | ) | (147 | ) | (173 | ) | (169 | ) | (156 | ) | (136 | ) | (146 | ) | (175 | ) | (16,500 | ) | (16,500 | ) | (16,500 | ) | ||||||||||||||||
| Transport and refining cost | 000' $ US | (2,631 | ) | (3,047 | ) | (2,713 | ) | (3,107 | ) | (3,427 | ) | (2,117 | ) | (2,491 | ) | (2,429 | ) | (2,242 | ) | (1,954 | ) | (2,098 | ) | (2,511 | ) | - | - | - | |||||||||||||||||||
| Administration cost | 000' $ US | (26,904 | ) | (26,904 | ) | (26,904 | ) | (26,904 | ) | (26,904 | ) | (26,904 | ) | (26,904 | ) | (26,904 | ) | (26,904 | ) | (24,310 | ) | (26,904 | ) | (26,479 | ) | - | - | - | |||||||||||||||||||
| Royalty | 000' $ US | (15,295 | ) | (17,718 | ) | (15,774 | ) | (18,064 | ) | (19,923 | ) | (12,309 | ) | (14,480 | ) | (14,121 | ) | (13,035 | ) | (11,363 | ) | (12,200 | ) | (14,600 | ) | - | - | - | |||||||||||||||||||
| Total Operating cost | 000' $ US | (397,438 | ) | (401,196 | ) | (394,267 | ) | (408,067 | ) | (392,631 | ) | (408,670 | ) | (406,372 | ) | (407,690 | ) | (403,155 | ) | (383,923 | ) | (410,434 | ) | (346,334 | ) | (16,500 | ) | (16,500 | ) | (16,500 | ) | ||||||||||||||||
| - | - | - | - | - | - | - | - | - | - | - | - | - | - | - | |||||||||||||||||||||||||||||||||
| Project capital cost | 000' $ US | - | - | - | - | - | - | - | - | - | - | - | 46,258 | 26,592 | 47,485 | - | |||||||||||||||||||||||||||||||
| Sustaining capital cost | 000' $ US | (53,532 | ) | (840 | ) | (17,733 | ) | (41,026 | ) | (10,016 | ) | (2,168 | ) | (94,435 | ) | (2,168 | ) | (29,404 | ) | (21,282 | ) | (495 | ) | - | - | - | - | ||||||||||||||||||||
| Working capital cost | 000' $ US | - | - | - | - | - | - | - | - | - | - | - | - | - | - | - | |||||||||||||||||||||||||||||||
| Total capital cost | 000' $ US | (53,532 | ) | (840 | ) | (17,733 | ) | (41,026 | ) | (10,016 | ) | (2,168 | ) | (94,435 | ) | (2,168 | ) | (29,404 | ) | (21,282 | ) | (495 | ) | 46,258 | 26,592 | 47,485 | - | ||||||||||||||||||||
| Total cost | 000' $ US | (450,970 | ) | (402,035 | ) | (412,000 | ) | (449,093 | ) | (402,647 | ) | (410,838 | ) | (500,807 | ) | (409,858 | ) | (432,559 | ) | (405,205 | ) | (410,929 | ) | (300,076 | ) | 10,092 | 30,985 | (16,500 | ) | ||||||||||||||||||
| Pre-tax cash flow | 000' $ US | 160,831 | 306,668 | 218,973 | 273,469 | 394,291 | 81,517 | 78,410 | 154,978 | 88,837 | 49,328 | 77,081 | 283,922 | 10,092 | 30,985 | (16,500 | ) | ||||||||||||||||||||||||||||||
| 219 |
| August 2011 Summary Report On The Livengood Project, Tolovana District, Alaska |
Table 22.3 Projected Key Economic Parameters (pre-tax, 100% equity)
| Economics | ||||||
| IRR | 14.14% | |||||
| NPV* | 0.00% | $ | 3,109,058 | |||
| NPV* | 5.00% | $ | 1,241,153 | |||
| NPV* | 7.50% | $ | 734,472 | |||
| NPV* | 10.00% | $ | 380,496 | |||
| Summary Statistics | ||||||
| Initial Capex | $ | 1,613,805 | ||||
| Sustaining Capex | $ | 584,658 | ||||
| Gold recovered-oz | 12,924,668 | |||||
| Cash operating cost/oz | $ | 703 | ||||
| Total cost/oz | $ | 875 | ||||
| Stripping ratio | 1.19 | |||||
| LOM mill Au recovery | 81.6% | |||||
| * - 000' $ US ** - includes recovery of working capital and assumed salvage | ||||||
22.4 Sensitivity Analysis
Sensitivity of the projected economic performance has been examined for variations in operating cost (opex), capital cost (capex), process recovery and gold price. The sensitivity is shown graphically in Figure 22.2, which plots the IRR as function of the change in % from the base assumptions in the economic model (gold price = $1,100 per ounce, process recovery = 81.6%,) . The base cost which produced the result in Table 22.1 is the 100% case and is varied between 85% and 115% (+-15%).
Process recovery has been assumed to be improved over the estimates in section 17.0,Table 17.1 by four (4.0) percentage points. The production plan derived from the mine optimization in section 17.0 produced an average recovery over all the mineralized material scheduled to the process plant of 77.6% . This value was increased by 4 percentage points in the economic analysis to 81.6% based on historical operations experience with similar process flow sheets, and the potential for further optimization of process operating parameters with continued test work and process improvements during operation of the planned facilities. The economic performance is most sensitive to gold price and process recovery, where a variation between 85-115% of price or cost produces a change of approximately 15% in the projected IRR. The similar change in opex or capex produces a change in projected IRR of 8% and 6%, respectively. Projected sensitivities in IRR and NPV at discounts of 0%, 5%, 7.5% and 10% are listed in Tables 22. 3, 22.4, 22.5 and 22.5, for gold price, process recovery, opex and capex, respectively.
| 220 |
| August 2011 Summary Report On The Livengood Project, Tolovana District, Alaska |
Figure 22.1 Sensitivity Graph – IRR, Gold Price, Gold Recovery, and Cost (Range 85-115% of the Base Assumptions)
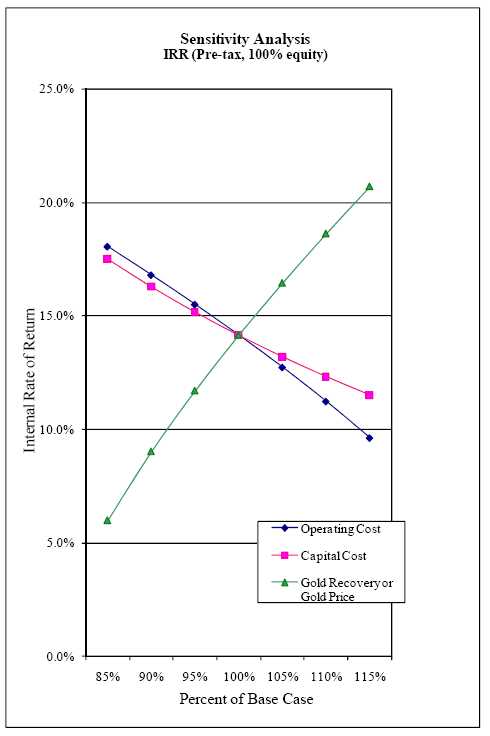
| 221 |
| August 2011 Summary Report On The Livengood Project, Tolovana District, Alaska |
Table 22.4 Variation of Projected Livengood Project IRR and NPV (000’ US $) for a gold price range of US $800-$1,700 (pre-tax, 100% equity)
Gold Price
| Change | IRR | NPV 0% | NPV 5% | NPV 7.5% | NPV 10% |
| 800 | -6.7% | $(654,735) | $(816,710) | $(857,480) | $(882,725) |
| 900 | 3.7% | $599,863 | $(130,756) | $(326,829) | $(461,652) |
| 1000 | 9.5% | $1,854,461 | $555,198 | $203,821 | $(40,578) |
| 1100 | 14.1% | $3,109,058 | $1,241,153 | $734,472 | $380,496 |
| 1200 | 18.2% | $4,363,656 | $1,927,107 | $1,265,123 | $801,570 |
| 1300 | 22.0% | $5,618,253 | $2,613,061 | $1,795,774 | $1,222,644 |
| 1400 | 25.5% | $6,872,851 | $3,299,016 | $2,326,425 | $1,643,718 |
| 1500 | 28.8% | $8,127,448 | $3,984,970 | $2,857,075 | $2,064,791 |
| 1600 | 32.0% | $9,382,046 | $4,670,924 | $3,387,726 | $2,485,865 |
| 1700 | 35.1% | $10,636,643 | $5,356,879 | $3,918,377 | $2,906,939 |
Table 22.5 Variation of Projected Livengood Project IRR and NPV (000’ US $) for a process recovery changes of 5% between 85-115% of the base assumption (81.6%) -pre-tax, 100% equity
Process recovery
| Change | IRR | NPV 0% | NPV 5% | NPV 7.5% | NPV 10% |
| 15% | 20.7% | $5,179,144 | $2,372,977 | $1,610,046 | $1,075,268 |
| 10% | 18.6% | $4,489,115 | $1,995,703 | $1,318,188 | $843,677 |
| 5% | 16.4% | $3,799,087 | $1,618,428 | $1,026,330 | $612,087 |
| 0% | 14.1% | $3,109,058 | $1,241,153 | $734,472 | $380,496 |
| -5% | 11.7% | $2,419,029 | $863,878 | $442,614 | $148,905 |
| -10% | 9.0% | $1,729,001 | $486,603 | $150,756 | $(82,685) |
| -15% | 6.0% | $1,038,972 | $109,328 | $(141,102) | $(314,276) |
Table 22.6 Variation of Projected Livengood Project IRR and NPV (000’ US $) for 5% changes in opex assumptions between 85% and 115% - pre-tax, 100% equity
Opex
| Change | IRR | NPV 0% | NPV 5% | NPV 7.5% | NPV 10% |
| 15% | 9.6% | $1,815,100 | $554,864 | $210,542 | $(30,494) |
| 10% | 11.2% | $2,246,419 | $783,627 | $385,186 | $106,503 |
| 5% | 12.7% | $2,677,739 | $1,012,390 | $559,829 | $243,499 |
| 0% | 14.1% | $3,109,058 | $1,241,153 | $734,472 | $380,496 |
| -5% | 15.5% | $3,540,377 | $1,469,916 | $909,115 | $517,493 |
| -10% | 16.8% | $3,971,697 | $1,698,679 | $1,083,759 | $654,490 |
| -15% | 18.0% | $4,403,016 | $1,927,442 | $1,258,402 | $791,486 |
| 222 |
| August 2011 Summary Report On The Livengood Project, Tolovana District, Alaska |
Table 22.7 Variation of Projected Livengood Project IRR and NPV (‘000 US $) for 5% changes in capex assumptions between 85% and 115%
Capex
| Change | IRR | NPV 0% | NPV 5% | NPV 7.5% | NPV 10% |
| 15% | 11.5% | $2,804,541 | $983,139 | $493,698 | $154,157 |
| 10% | 12.3% | $2,906,047 | $1,069,143 | $573,956 | $229,603 |
| 5% | 13.2% | $3,007,553 | $1,155,148 | $654,214 | $305,050 |
| 0% | 14.1% | $3,109,058 | $1,241,153 | $734,472 | $380,496 |
| -5% | 15.2% | $3,210,564 | $1,327,157 | $814,730 | $455,943 |
| -10% | 16.3% | $3,312,069 | $1,413,162 | $894,988 | $531,389 |
| -15% | 17.5% | $3,413,575 | $1,499,167 | $975,246 | $606,836 |
The PEA is preliminary in nature, and is based on technical and economic assumptions which will be evaluated in the Pre-feasibility Study. The PEA is based on the Livengood in-situ resource model (August, 2011) which consists of material in both the measured, indicated and inferred classification. Inferred mineral resources are considered too speculative geologically to have technical and economic considerations applied to them. The current basis of project information is not sufficient to convert the in-situ mineral resources to Mineral Reserves, and mineral resources that are not mineral reserves do not have demonstrated economic viability. Accordingly, there can be no certainty that the results estimated in this PEA will be realized. The PEA results are only intended as an initial, first-pass review of the potential project economics based on preliminary information.
| 223 |
| August 2011 Summary Report On The Livengood Project, Tolovana District, Alaska |
23.0 Adjacent Properties
Select Resources controls the adjacent ground to the south of the Livengood project, and has sporadically been exploring it for gold mineralization in the past.
The Alaska Pipeline, the main means of transporting crude oil from Alaska’s North Slope to the south coast of Alaska, runs northwest-southeast about 6 km to the west. This feature is not expected to have any impact on the project.
| 224 |
| August 2011 Summary Report On The Livengood Project, Tolovana District, Alaska |
24.0 Other Relevant Data and Information
No additional information or explanation is known by the authors to be necessary to make the technical report understandable and not misleading.
| 225 |
| August 2011 Summary Report On The Livengood Project, Tolovana District, Alaska |
25.0 Interpretation and Conclusions
A Pre-feasibility Study for the Livengood mineral resource is currently underway. This report provides an update of the anticipated project configuration, and an overview of the geological, exploration, metallurgical test work, process plant and infrastructure engineering, and surface mine planning work that has been completed to date. A preliminary economic assessment (PEA) of the updated configuration has been developed which is based on a surface mining operation supplying mineralized material to a processing plant with nominal throughput of 91,000 tonnes per day. The processing plant would produce gravity and flotation concentrates with gold recovered by Carbon-in-Leach processing of the concentrates. The PEA addresses the basic framework of how gold mineralization will be mined, mineralized material processed, and recovery achieved.
The interpretation and conclusions supplied here are preliminary and are provided for the purposes of updating information about ITH’s progress in the PFS since the issuance of the November 2010 technical report (Carew, et al, 2010). The information is subject to revision prior to its incorporation into the final PFS document.
25.1 Geology and Deposit Type
Gold mineralization at Livengood is hosted in a thrust interleaved sequence of Late Proterozoic to Palaeozoic ophiolitic rocks thrust emplaced over a Devonian sequence of sedimentary and volcanic rocks. Mineralization is related to a ~90 million year old set of monzonite to diorite dikes that intrude the thrust stack along faults. Mineralization is hosted primarily by Devonian volcanics and Cretaceous dikes, but occurs in all rock types and consists of gold associated with arsenopyrite and to a lesser extent pyrite. Other associated minerals include stibnite, marcasite, pyrrhotite, and minor to trace amounts of chalcopyrite and sphalerite.
The Livengood property is centered on Money Knob and adjacent ridges and is an area considered by many for a long time to be the lode source for gold in the Livengood placer deposits which have produced in excess of 500,000 ounces of gold. Anomalous gold in soil samples occurs in a northeast trend over an area of approximately 6 x 2 km with a principal concentration of surface anomalies in a smaller area measuring approximately 2.3 x 1.1 km. Previous drilling by AGA, and ITH identified wide intervals (>100 m @ ≥ 1.0 g/t Au) of gold mineralization with local higher grade narrow intervals beneath the soil anomaly and in rocks beneath thrust surfaces which are not expressed geochemically at the surface. The presence of mineralization over broad areas beneath thrust faults and an expanding area of drill hole intercepts suggests that there is still further discovery potential at Livengood.
The style of mineralization in the Money Knob deposit shows some similarities with several types of gold deposits including orogenic, sediment-hosted disseminated (SHD or Carlin type), and Intrusion-Related-Gold Systems (IRGS) of the Tintina Gold Belt. However, the geochemical and metallogenic associations of As, Sb, Bi, and lack of some features typical of SHD’s indicates that Livengood is most comparable to IRGS type deposits and is typical of other such deposits within the host Tintina Gold Belt.
| 226 |
| August 2011 Summary Report On The Livengood Project, Tolovana District, Alaska |
Four stages of alteration are currently recognized. These include biotite, albite, sericite, and carbonate. These stages are interpreted to reflect alteration of host rocks by a fluid with decreasing temperature and evolving chemistry over time.
Overall, mineralization and alteration appear to be controlled by the thrust fault architecture and possibly by later normal faults.
The original surface geochemical anomaly in soil that attracted initial exploration in this location probably reflects only a portion of the mineralization present. Mineralization has been shown to continue down-dip along and/or beneath thrust surfaces and therefore be blind at the surface. This point, along with the fact that the area drilled currently represents only a portion of the original surface geochemical anomaly, suggests that the identification of more mineralization over a broader area is possible.
25.2 Drilling
Drilling has continued during 2011 with an extensive summer program currently in progress. Drill data produced up to May 31, 2011 has been included in this technical report. At total of 648 holes have been drilled.
25.3 Sample Preparation, Analyses and Security
ITH has implemented industry standard systems for collection of samples during RC drilling, and for logging and analysis of the geology. Descriptive data are collected by examination of chip sample trays under a microscope. Similarly, rigorous procedures are employed for the creation of descriptive core logs. All core is oriented, and all drill holes are surveyed for surface location and orientation/inclination are logged using a wireline logging system. These data are assembled in a computer database, for correlation with geochemical and assay data.
Samples are collected and labeled at Livengood. The majority of core is split by diamond saw, with half preserved on site for future analysis or sampling. Assay samples are transported from Livengood to an ALS Chemex prep lab in Fairbanks by laboratory staff. Sample custody is managed by the lab after receiving the materials from Livengood.
A rigorous system of QA/QC is maintained for assay quality control. This includes repeated assays for questionable results, duplicate samples for reproducibility, preparation duplicates, field duplicates, preparation blanks and reference standards. The QA/QC results indicate data scatter and reproducibility consistent with the characteristics of the mineralization which has a substantial free gold content with relatively coarse particles. During 2011, a group of 2096 metallic screen fire assays were performed to test for bias in standard fire assays due to coarse free gold content. Comparison of these metallic screen fire assays to standard fire assays indicated no bias between the two data sets.
In addition to assay QA/QC, statistical analysis of the two data sets comprised of core versus RC drill data has been performed. Tests for down hole contamination using cyclicity and decay analysis have been performed on individual holes, and led to the removal of sections of data from only 7 of the 550 RC holes. Quantile-Quantile plots comparing the core and RC data sets indicate that the two
| 227 |
| August 2011 Summary Report On The Livengood Project, Tolovana District, Alaska |
distributions are similar over the range of grade comprising the majority of the sample composites for all drilling and for individual strategraphic units.
Further statistical comparison of core and RC data has been performed for individual stratigraphic units and for location with respect to the water table. No difference between core and RC data distrubtions are indicated below the water, indicating that down hole contamination is not occurring. The core and RC data distribution mean values are within 4% for all data. The analysis indicates that core data exhibits lower grade than RC in the Upper Sediment unit above the water table, which will be the object of further investigations during the Summer 2011 drilling program.
25.4 Data Verification
Data verification has been performed by Mr. Carew during a site visit in November 2011, when a series of samples were collected directly at the drilling operation. Previously, Dr. Paul Klipfel collected verification samples from trench excavations and from portions of 2 different drill holes. Assays of these samples indicated gold occurrence with characteristics and grade similar to the resource database and modeling results.
25.5 Mineral Processing and Metallurgical Testing
Substantial metallurgical test work has been performed on Livengood mineralized material to provide a basis for specification of the mineral processing approach. Test work includes response to cyanide leaching with straight cyanide solution and with carbon-in-leach solution, gravity concentration and gold recovery from gravity concentrate, and flotation concentration and leach recovery from concentrates. An extensive set of column leach tests is currently in process which includes scaling tests at various particle sizes up to run-of-mine. Gold deportment studies have been conducted on splits of the metallurgical samples to characterize the physical occurrence of gold with the Livengood rock units.
Preliminary analysis of the available data has focused the project configuration on a mill process to produce a gravity and flotation concentrate, with gold recovery by CIL. Projected process recoveries have been developed for each stratigraphic unit, based on evaluation of all the available test work, and range from 55% to 91%. These recoveries have been utilized in surface mine optimization and produce an average metallurgical recovery of 77.6% .. Further testing results will be produced as part of the ongoing PFS, to be followed by more focused test work to indicate process methodologies to optimize gold recovery.
There is potential for heap leaching of Livengood mineralized material, however, the current high gold price environment provides the potential for substantial financial leverage from the higher gold recovery that can be achieved by the gravity-flotation-CIL processing. Heap leaching in the Fairbanks area has been demonstrated to be successful at the Ft. Knox mine, and the assessment of technical conditions at Livengood has indicated similar potential for success. Future mine development may include heap leaching of marginal grade materials, but this is not considered in the current planning.
| 228 |
| August 2011 Summary Report On The Livengood Project, Tolovana District, Alaska |
25.6 Mineral Resource Estimate
An updated resource estimate has been calculated and is based on all drill data through May 31, 2011. This new estimate includes the addition of data from drill holes received after completion of the March 2011 resource estimate. The global mineral resource is classified as measured, indicated and inferred, based on interpolation distances of 100, 200 and 300 m, respectively. Table 25.1 lists the global mineral resource for cut-off grades of 0.2 g/t.
Table 25.1 Livengood Global Mineral Resource at 0.2 g/t Cut-Off Grade
| Category | Ore (000’ tonnes) | In situ grade (g/t) | Contained Au (‘000 oz) |
| Measured | 742,000 | 0.54 | 12.800 |
| Indicated | 322,000 | 0.47 | 4,800 |
| Total Measured &Indicated | 1,064,000 | 0.51 | 17,600 |
| Inferred | 447,000 | 0.42 | 6,100 |
This global mineral resource is based on drilling on a 75 m grid pattern, with the Core and Sunshine Zones being infilled with a central hole in each grid.
Economic testing has been performed assuming a long term gold price of US $1,400 per ounce by optimization of a surface mine based on production costs and recoveries outlined in sections 16.0, 17.0 and 21.0. The resource defined by this potential surface mine shape is listed in Table 25.2, for an average cut-off grade of 0.22 g/t.
Table 25.2 Livengood Surface Mine Resource Defined at 0.22 g/t Cut-Off Grade and a Long Term Gold Price of US $ 1,400 per Ounce.
| Classification | Au Cutoff (g/t) | Tonnes (millions) | Au (g/t) | Million Ounces Au |
| Measured | 0.22* | 676 | 0.56 | 12.2 |
| Indicated | 0.22* | 257 | 0.52 | 4.3 |
| M&I | 0.22* | 933 | 0.55 | 16.5 |
| Inferred | 0.22* | 257 | 0.50 | 4.1 |
25.7 Mineral Reserves
No mineral reserves have been defined at Livengood because of the relatively early stage of the PFS progress.
25.8 Mining Methods
Preliminary designs for a surface mine have been developed on the basis of incremental revenue optimization using the in-situ resource block model and projected operating costs. The optimization
| 229 |
| August 2011 Summary Report On The Livengood Project, Tolovana District, Alaska |
produced surface mine shells at different gold price assumptions ranging from US $200-$1,600 per ounce. Those shells assumed a 45-51 degree pit slope, depending on orientation of the wall according to recommendations by SRK 2011. Surface mine design was produced to include the effect of additional overburden production through inclusion of ramps and other access facilities in the pit.
The current mine plan is based on conventional surface mining methods of drill-blast-load-haul assuming the use of large hydraulic excavators (34 cubic meter) and 220 tonne haul trucks. Blasted mineralized material would be trucked to a primary crusher designed for direct dumping and with an adjacent ROM stockpile. Overburden would be hauled to developed storage facilities in the large drainages adjacent to the surface mine. Peak production rate was assumed to be 75 million tonnes per year of overburden and mineralized material.
25.9 Recovery Methods
Metallurgical testing data have been assembled as the basis for a process flow sheet. The ongoing PFS design work has been used as the basis of processing facilities assumptions. The preliminary flow sheets outline a crushing system feeding mineralized material to a single 12.3 m (40 foot) diameter SAG mill, followed by 2 ball mills. Ground mineralized material will pass through a gravity recovery circuit with the gravity tails going through a flotation circuit. Standard CIL tanks will be used to recover the gold. These plans were used to estimate construction and equipment costs.
Baseline process metallurgical recovery assumptions have been derived based on the metallurgical testing data and a recovery model has been built into the resource block model which develops weighted average metallurgical recovery of 77.6% for the mineralized material in the pit.
A factor of +4% has been added to the weighted average recovery based on the relatively early stage of the metallurgical testing program and the fact that optimization studies have not been conducted. This factor was applied in the economic model.
25.10 Project Infrastructure
Regional transport, communications and community infrastructure are available in Fairbanks AK. A paved all weather highway passes the north west edge of the mineral resource. The Alyeska Pipeline corridor runs generally parallel to the highway, and provides a route for extension of a power line from Fairbanks to Livengood. Communication by fiber optic cable is already in place along the pipeline and provides service to the Livengood facilities.
Construction of other site infrastructure necessary to support a mining project would consist of a tailings management facility, overburden management facility, water storage reservoir, site roads and pipelines, primary crushing facility, ROM mineralized material storage stockpile, mine shops and processing plant.
25.11 Market Studies and Contracts
Gold would be sold into the spot market. No forward sales or contracts are anticipated at this time.
| 230 |
| August 2011 Summary Report On The Livengood Project, Tolovana District, Alaska |
25.12 Environmental Studies, Permitting and Social or Community Impact
Baseline environmental monitoring programs at Livengood were initiated in 2008, and include surface water quality sampling, surface water flow monitoring, geohydrologic sampling and testing at potential surface mine location and in the adjacent valley bottoms, wetlands survey and characterization, meterological and air quality monitoring, aquatic resource characterization, wildlife characterization, cultural resource characterization and rock geochemical characterization. No known environmental issues have been identified to date that would materially impact the projects ability to extract the gold resource.
Site specific monitoring, water management and closure plans will be developed for placement of tailings material and overburden material when detailed engineering has been completed.
Both Federal and State of Alaska permits will be required for construction and operation of a mining facility at Livengood. The required permits are identified and included in the project’s planning. The National Environmental Policy Act will govern the federal environmental impact analysis.
Communities which might be affected by the potential development of the Livengood Project are limited in the immediate area, and consist of approximately 15 residents on remote homesteads within 16 km of the site. The nearest community is the village of Minto which is 64 km from the site. These two groups and the city of Fairbanks are important stakeholders in the potential project.
25.13 Capital and Operating Cost
Capital costs have been generated from preliminary plans for project infrastructure and process facilities being developed in the PFS. The estimates are factored from previous projects and are projected to have an accuracy of +- 35%. Mine equipment has been based on haulage profiles defined in the surface mine optimization work, with major mine production units calculated from the production schedule.
Operating cost assumptions are based on indicated data from other mining operations in Alaska, and on scaling of those cost assumptions to the anticipated Livengood configuration.
25.14 Economic Analysis
The Livengood Project is projected to provide an IRR of 14.2 % and an NPV at 5% discount rate of US $1.24 B on a pre-tax, 100% equity basis, assuming 2011 constant dollars.
Cumulative cash flow is projected to reach a maximum negative value of US $ 1.61 B the year before production start up (year -1), and has a payback period of 4.9 year based on pre-tax cash flow.
| 231 |
| August 2011 Summary Report On The Livengood Project, Tolovana District, Alaska |
The economic performance is most sensitive to gold price and process recovery. The sensitivity analysis indicates the project would be breakeven on an undiscounted basis at approximately US $850 per ounce.
25.15 Conclusions
ITH believes that this preliminary economic assessment indicates that the Livengood project has the potential to be a commercial facility. ThePEA is based on estimates of operating costs and capital costs that must be further validated. The gold production projected in thePEA is based on the in-situ resource model and estimates of mining recoverable resources at a 0.28 - 0.36 g/t cut-off grade for the different lithologic units. Infill drilling is on-going at Livengood in the Summer 2011 program to increase confidence in mineral continuity and to test the resource model predictions.
This Technical Report and the PEA contained preliminary in nature, and are based on technical and economic assumptions which are being evaluated in the Pre-feasibility Study and are subject to revision. The PEA is based on the Livengood in-situ resource model (August 2011) which consists of material in the measured, indicated and inferred classifications. Inferred mineral resources are considered too speculative geologically to have technical and economic considerations applied to them. The current basis of project information is not sufficient to convert the in-situ mineral resources to Mineral Reserves, and mineral resources that are not mineral reserves do not have demonstrated economic viability. Accordingly, there can be no certainty that the results estimated in this PEA will be realized. The PEA results are only intended as a preliminary review of the potential project economics based on preliminary information.
| 232 |
| August 2011 Summary Report On The Livengood Project, Tolovana District, Alaska |
26.0 Recommendations
26.1 Prefeasibility Program
Completion of the PFS is scheduled for Q4 of 2011, and the preliminary results and conclusions provided in this PEA subject to revision prior to their incorporation into the final PFS document. Some elements of will be examined in more detail prior to proceeding to the next stage of the project.
26.2 Budget for 2011
ITH has proposed expenditure of approximately US $68.1 million (CDN $65.3 million) in FY 2011 (June 1, 2011-May 31, 2012) for further evaluation of the Livengood project (Table 21.1). This budget will be allocated to a work breakdown structure that have been developed to organize the PFS, and for ongoing phases of the Project studies. The budget is significant, but appropriate for the studies and drilling planned and feasible within the time allocated. ITH has sufficient funds to accomplish this goal.
Table 26.1 Fiscal Year (Ending May 31, 2012) Project Budget
| Expenditure | $M USD | $M CAD | Comments |
| Corporate Administration | 5.0 | 4.9 | Admin, technical management, Claim and lease fees, materials, purchase agreements, office, salaries, travel, reporting, |
| Operating Permits | 0.9 | 0.9 | operating permits, reclamation bonding, compliance monitoring, reclamation |
| Project Management, Administration and Corporate AdministrationSite Operations | 27.4 | 27.0 | Operations, contract/consulting fees for geologic and geotechnical studies, other field activities, camp operation, catering, land purchase project contingency |
| Geological Studies | 18.1 | 17.8 | drilling, sampling, mapping, geophysical surveys, assaying, data management |
| Metallurgical Studies | 4.0 | 3.9 | met lab testing, process design, process plant design |
| Infrastructure/Engineering | 4.7 | 4.7 | Geotechnical investigations, condemnation drilling, site layout, road layout and design, pipeline layouts, power line, plant location, foundation design |
| Baseline/Environmental Studies | 5.1 | 4.9 | |
| Community and Social Engagement | 0.8 | 0.8 | Community and government outreach |
| Mining Studies | 0.2 | 0.2 | Mine optimization and layout, mobile equipment specification, production scheduling, pit slope design |
| Study Integration | 1.3 | 1.3 | Contractor management, Integration of technical reports into PFS documents, risk assessment, front end loading planning |
| Front End Loading/Permitting | 0.6 | 0.6 | Pre-permitting meetings and discussions of plans |
| TOTAL | 68.1 | 67.0 | $75% PFS; 25% Permitting/Feasibility |
| 233 |
| August 2011 Summary Report On The Livengood Project, Tolovana District, Alaska |
27.0 References
Albanese, M.D., 1983, Geochemical reconnaissance of the Livengood B-3, B-4, and C-4 quadrangles, Alaska; summary of data on stream-sediment, pan concentrate, and rock samples: Report of Investigations – Alaska. Division of Geological and Geophysical Surveys, v. 83-1, 55 pp.
AMTEL (2011), Deportment of Gold in Livengood's Oxide Feeds, a Report prepared by Advanced Mineral Technology Laboratory Ltd. for International Tower Hill Mines Ltd., June 22, 2011.
Arbogast, B., Lee, G., Light, T., 1991, Analytical results and sample locality map of stream-sediment and heavy –mineral-concentrate samples from the Livengood 1 degree X 3 degree Quadrangle, Alaska: U.S. Geological Survey, Open file Report OF 91-0023A and B, 121 pp., 1 sheet.
Athey, J.E., and Craw, P.A., 2004, Geologic maps of the Livengood SW C-3 and SE C-4 Quadrangles, Tolovana mining district, Alaska, Preliminary Interpretive report 2004-3, Division of Geological and Geophysical Surveys., 1 sheet, 24 p.
Athey , J.E., Layer, P.W., and Drake, J., 2004,40Ar/39Ar ages of rocks collected in the Livengood C-3, C-4, and B-5 quadranges, Alaska: Alaska Division of Geological and Geophysical Surveys Raw-Data File 2004-1, 12p.
Athey, J.E., Szumigala, D.J., Newberry, R.J., Werdon, M.B., and Hicks, S.A., 2004, Bedrock geologic map of the Livengood SW C-3 and SE C-4 Quadrangles, Tolovana mining district, Alaska, Preliminary Interpretive report 2004-3, Division of Geological and Geophysical Surveys.
Bell, R.J., 2010. August 2010 PEA Study Cost Report, Livengood Project, a report by MTB Project Management Professionals, Inc. to International Tower Hill Mines Ltd.
Brooks, A. H., 1916, Preliminary report on the Tolovana district: U.S. Geological Survey Bulletin 642, p. 201-209.
Burns, L.E., and Liss, S. A., 1999, Portfolio of aeromagnetic and resistivity maps of part of the Livengood mining district, Alaska, central Livengood Quadrangle: Public-Data File, Alaska Division of Geological and Geophysical Surveys, Report 99-16, 16 pp.
Carew, T., 2010a, Livengood Deposit – March 2010 resource update final: independent consultant’s report; Reserva International LLC, 1p.
Carew, T., 2010b, Livengood Deposit – June 2010 resource update final: independent consultant’s report; Reserva International LLC, 1p.
Carew, T., Pennstrom, W., and Bell, R.J., 2010, November 2010 Summary Report on the Livengood Project, Tolovana District, Alaska, 210p.
| 234 |
| August 2011 Summary Report On The Livengood Project, Tolovana District, Alaska |
Chapman, R.M., and Weber, F.R., 1972, Geochemical analyses of bedrock and stream sediment samples from the Livengood Quadrangle, Alaska: U.S. Geological Survey, Open File Report, OF 72-0067, 2 sheets.
Chapman, R.M., Weber, F.R., and Taber, B., 1971, Preliminary map of the Livengood Quadrangle, Alaska; map and explanation: U.S. Geological Survey, Open File Report, OF 71-0066, 2 sheets.
CIM, 2005, CIM Definition Standards – For Mineral Resources and Mineral Reserves; Prepared by theCIM Standing Committee on Reserve Definitions, Adopted by CIM Council on December 11, 2005. 10pp.
Cobb, E.H., 1972, Metallic mineral resources map of the Livengood Quadrangle, Alaska: U.S. Geological Survey, Misc. field Studies, Report MF-0413, 2 sheets.
Ebert, S., Dodd, S., Miller, L., and Petsel, S., 2000, The Donlin Creek Au-As-Sb-Hg deposit, southwestern Alaska, in Geology and Ore Deposits 2000, The Great Basin and Beyond, Symposium Proceedings, Geological Society of Nevada, ed., Cluer, J.K., Price, J.G., Struhsacker, E.M., Hardyman, R.F., and Morris, C.L., p. 1069-1081.
Foster, R.L., 1968, Potential for lode deposits in the Livengood gold placer district, east-central Alaska: U.S. Geological Survey Circular, Report: C-590, 18 pp.
Giroux Consultants Ltd, 2007, Livengood resource evaluation, Consultants report to ITH, 22 p.
Giroux Consultants Ltd, 2008, Livengood resource evaluation, Consultants report to ITH, 35 p.
Giroux Consultants Ltd, 2009, Livengood resource evaluation, January, 2009, Consultants report to ITH, 36 p.
Goldfarb, 1997, Metallogenic evolution of Alaska: Economic Geology Monograph 9, Society of Economic Geologists, pp. 4-34.
Goldfarb, R., Hart, C., Miller, M., Miller, L., Farmer, G.L., Groves, D., 2000, The Tintina gold belt – a global perspective, in The Tintina Gold Belt: Concepts, Exploration, and Discoveries, British Columbia and Yukon Chamber of Mines, Cordilleran Roundup Special Volume 2, p. 5-31.
Hazen Research Inc., 2007, Characterization of Livengood Gold Ore, Hazen Project 10504: letter report dated February 7, 2007.
ITH, 2009, International Tower Hill Expands Livengood Gold Resource by 64%, October 13, 2009 press release. 6p.
Karl, S.M., Ager, T.A., Hanneman, K., and Teller, S.D., 1988, Tertiary gold-bearing gravel at Livengood, Alaska, in Geologic Studies in Alaska by the USGS in 1987, U.S.G.S. Circular 1016, p. 61-63.
| 235 |
| August 2011 Summary Report On The Livengood Project, Tolovana District, Alaska |
Kitze, 1972. An Earthfill Dam on Permafrost, Hess Creek Dam, Livengood, Alaska, CRREL, Technical Report 196.
Klipfel, P., 2006, Summary report on the Livengood Project, Tolovana District, Alaska, consultants report to ITH, 37 p.
Klipfel, P. and Giroux, G., 2008a, Summary report on the Livengood Project, Tolovana District, Alaska; consultants report to ITH, 62 p.
Klipfel, P. and Giroux, G., 2008b, October 2008 Summary report on the Livengood Project, Tolovana District, Alaska; consultants report to ITH, 90 p.
Klipfel, P., Giroux, G. and Puchner, C, 2008, Summary report on the Livengood Project, Tolovana District, Alaska; technical report to ITH, 72 p.
Klipfel, P. and Giroux, G., 2009, January 2009 Summary report on the Livengood Project, Tolovana District, Alaska: consultant’s technical report to ITH, 99 p.
Klipfel, P., Barnes, T., and Pennstrom, 2009a, July 2009 Summary report on the Livengood Project, Tolovana District, Alaska: consultant’s technical report to ITH, 120 p.
Klipfel, P., Carew, T., and Pennstrom, W., 2009b, October 2009 summary report on the Livengood Project, Tolovana District, Alaska: consultant’s technical report to ITH, 144 p.
Klipfel, P., Carew, T., and Pennstrom, W., 2010a, March 2010 summary report on the Livengood Project, Tolovana District, Alaska: consultant’s technical report to ITH, 151 p.
Klipfel, P., Carew, T., and Pennstrom, W., 2010b, June 2010 summary report on the Livengood Project, Tolovana District, Alaska: consultant’s technical report to ITH, 163 p.
Klipfel, P., 2010c, Geology of the Livengood Deposit, Alaska: consultant’s technical report to ITH, September 15, 2010.
Knight Piesold Consulting, 2010a. International Tower Hill Mines, Inc., Livengood Project, Identification of Potential Alternative Sites for Tailings, Heap Leach, and Overburden Rock Storage Facilities Report, a report to International Tower Hill Mines, Ltd., June 4, 2010.
Knight Piesold Consulting, 2010b. Livengood Project, Tailings Facilities, Overburden Dump and Heap Leach Pad, Pre-conceptual CAPEX Estimates for the Tailings, Heap Leach and Overburden Rock Facilities, a letter report from Tom F. Kerr, President, Knight Piesold Consulting, Denver CO, to Carl Brechtel, COO, International Tower Hill Mines, Ltd., dated July 27, 2010.
Knight Piesold Consulting 2011a, Technical Memorandum No. 04, Livengood Gold Project Pre-Feasibility Study, Conceptual Designs and CAPEX costing of Four Significant Project Facilities, Knight Piesold Consulting, Denver CO, to Talon Gold Alaska, Inc., June 23, 2011.
| 236 |
| August 2011 Summary Report On The Livengood Project, Tolovana District, Alaska |
Knight Piesold Consulting, 2011b, Letter to Carl Brechtel, Livengood Gold Project Pre-Feasibility Study Updated Unit Costing for Preliminary Economic Analyses, Knight Piesold Consulting, Denver CO, June 29, 2011.
Larson, L., 2002, Petrographic report – AngloGold, Samples – Fort Knox, Livengood, and West Pogo, consultants report to AngloGold, 79pp.
Levinson, A.A., 1974,Introduction to Exploration Geochemistry: Applied Publishing Ltd. 614 pp.
Mader, E., 2010. Livengood Project Pit Optimization, Pit Design and Production Scheduling September 2010, a report prepared by Cube Consulting Inc., Franklin, TN, USA, Cube Project: 2010_037.
McCoy, D., Newberry, R.J., Layer, P., DiMarchi, J.J., Bakke, A., Masterman, J.S., and Minehane, D.L., 1997, Plutonic related gold deposits of interior Alaska, Society of Economic Geologists, Economic Geology Monograph 9, pp. 91-241.
Newberry, R.J., McCoy, D.T., and Brew, D.A., 1995, Plutonic-hosted gold ores in Alaska: Igneous vs. metamorphic origins: Resource Geology special issue, N0 18, pp. 57-100.
Northern Land Use Research, Inc., 2009, Cultural resources survey of proposed 634-acre Talon Gold core drilling program parcel near Livengood, Interior Alaska; consultant’s report to ITH, 60pp.
Northern Land Use Research, Inc., 2010, Cultural resources survey of Talon Gold core drilling program parcels near Livengood, Interior Alaska: 2009 survey results and recommendations: consultant’s report to Talon Gold. 190 pp.
Plafker, G. and Berg, H.C., 1994, Overview of the geology and tectonic evolution of Alaska, in Plafker, G. and Berg, H.C. eds., The Geology of Alaska: Geological Society of America, Boulder Co. The Geology of North America, v. G1, p. 989-1017.
Prenn, N.B. (1996). Decay Analysis – A Tool For Determination of Drill Hole Contamination.
Poulsen, K.H., 1996, Carlin-type gold deposits and their potential occurrence in the Canadian Cordillera: in Current Research, 1996a, Geological Survey of Canada, pp x-x.
Quandt, D, Ekstrom, C. and Triebel, K., 2008. Technical Report for the Fort Knox Mine, prepared for Kinross Gold Corporation and Fairbanks Gold Mining Incorporated, Fairbanks North Star Borough, Alaska, USA, www. Sedar.com.
RDi (2010 a), Metallurgical Testing of Livengood Samples, A report prepared by Resource Development Inc. for International Tower Hill Mines, Ltd., July 28, 2010.
RDi (2010b), Metallurgical Testing of Livengood Samples Phase II Study, A report prepared by Resource Development Inc. for International Tower Hill Mines, Ltd., September 9, 2010.
| 237 |
| August 2011 Summary Report On The Livengood Project, Tolovana District, Alaska |
RDi (2011), Metallurgical Testing of Livengood Samples Phase III Study, A report prepared by Resource Development Inc. for International Tower Hill Mines, Ltd., January 14, 2011.
Reifenstuhl, R.R., Dover, J.H., Pinney D.S., Newberry, R.J., Clautice, K.H., Liss, S.A., Blodgett, R.B., Bundtzen, T.K., and Weber, F.R., 1997, Geologic map of the Tanana B-1 quadrangle, central C. Alaska, RI 97-15A, State of Alaska, Department of Natural Resources, Division of Geological & Geophysical Surveys, 17 p., 1 sheet, scale 1:63,360
Robinson, M.S., 1983, Bedrock geologic map of the C-4 quadrangle, east-central Alaska: Report of Investigations – Alaska. Division of Geological and Geophysical Surveys, vol. 83-4, 1 sheet.
Rose, A.W., Hawkes, H.E., and Webb, J.S., 1979,Geochemistry in Mineral Exploration: Academic Press, 657 pp.
Rudd, J., 1999, Project report of the 1998 geophysical survey data for part for the Livengood mining district, Alaska, central Livengood Quadrangle: Alaska Division of Geology and Geophysics, Report, 99-17, 132 pp.
Schofield, N., 2010, Review of resource estimates, Livengood gold deposit, Alaska; independent consultants report prepared for ITH by Hellman and Schofield Pty. Ltd., June 2010, 29 p.
Silberling, N.J., Jones, D.J., Monger, J.W.H., Coney, P.J., Berg, H.C., and Plafker, G., 1994, Lithotectonic terrane map of Alaska and adjacent parts of Canada: Geology of Alaska, Geological Society of America. Vol. G-1, Plate 3.
Sillitoe, R.H., 2009, Geologic model and potential of the Livengood gold prospect, Alaska; consultant’s report to ITH, 13 pp.
Smith, M., 2000, The Tintina gold belt: an emerging gold district in Alaska and Yukon, in The Tintina Gold Belt: Concepts, Exploration, and Discoveries, British Columbia and Yukon Chamber of Mines, Cordilleran Roundup Special Volume 2, p. 1-3.
Smith, T.E., 1983, Bedrock geology of the Livengood C-3 Quadrangle, east-central Alaska: Report of Investigations – Alaska. Division of Geological and Geophysical Surveys, v. 83-5, 1 sheet
Three Parameters Plus, 2009, Livengood Project baseline surface water sampling report – 2009, consultant’s report to Talon Gold US Inc., 389p.
Waythomas, C.F., Ten Brink, N.W., Ritter, D.F., 1984, Surficial geologic map of the Livengood B-3, B-4, C-3 and C-4 quadrangles, Yukon-Tanana Upland: Report of Investigations – Alaska. Division of Geological and Geophysical Surveys, v. 84-6, 1 sheet.
| 238 |
| August 2011 Summary Report On The Livengood Project, Tolovana District, Alaska |
28.0 Appendices
28.1 Appendix 1: Claim/Property Information
| Owner | File Number | Tenure Name | Date Acquired | MTRS Location |
| Alaska State Lease | ||||
| Alaska Mental Health Land Trust | 9400248 | AMHLT - ML | 1-Jul-2004 | F008N005W |
| Federal Patented Claims | ||||
| MS 1990, Patent | ||||
| Griffin heirs | 1041576 | Mastodon | 18-Jan-2007 | F008N005W |
| Federal Unpatented Claims | ||||
| Richard Hudson | 55469 | ANNE | 21-Apr-2003 | F008N005W24 |
| Richard Hudson | 55466 | BLACK ROCK | 21-Apr-2003 | F008N005W24 |
| Richard Hudson | 55471 | BRIDGET | 21-Apr-2003 | F008N005W24 |
| Richard Hudson | 55453 | DOROTHEA | 21-Apr-2003 | F008N005W23 |
| Richard Hudson | 55470 | EILEEN | 21-Apr-2003 | F008N005W24 |
| Richard Hudson | 55455 | FOSTER | 21-Apr-2003 | F008N005W24 |
| Richard Hudson | 55454 | LENORA | 21-Apr-2003 | F008N005W23 |
| Richard Hudson | 55459 | NICKIE | 21-Apr-2003 | F008N005W24 |
| Richard Hudson | 55464 | OLD SMOKY | 21-Apr-2003 | F008N005W23 |
| Richard Hudson | 55468 | PATRICIA | 21-Apr-2003 | F008N005W13 |
| Richard Hudson | 55460 | PATRICK | 21-Apr-2003 | F008N005W23 |
| Richard Hudson | 55458 | SAUNDERS | 21-Apr-2003 | F008N005W23 |
| Richard Hudson | 55452 | SHARON | 21-Apr-2003 | F008N005W23 |
| Richard Geraghty | 55462 | SUNSHINE #1 | 21-Apr-2003 | F008N005W23 |
| Richard Geraghty | 55463 | SUNSHINE #2 | 21-Apr-2003 | F008N005W23 |
| Richard Hudson | 55467 | TRAPLINE | 21-Apr-2003 | F008N005W24 |
| Richard Hudson | 55457 | TWERPIT | 21-Apr-2003 | F008N005W24 |
| Richard Hudson | 55456 | VANCE | 21-Apr-2003 | F008N005W24 |
| Richard Hudson | 55461 | WHITE ROCK | 21-Apr-2003 | F008N005W23 |
| Richard Hudson | 55465 | WITTROCK | 21-Apr-2003 | F008N005W23 |
| Ronald Tucker | 37580 | Lillian No. 1 | 30-Sep-1968 | F008N005E22 |
| Ronald Tucker | 37581 | Satellite | 30-Sep-1968 | F008N005E22 |
| Ronald Tucker | 37582 | Nickel Bench R.L.* | 30-Jun-1972 | F008N005E22 & 15 |
| Ronald Tucker | 37583 | The Nickel* | 12-Aug-1965 | F008N005E22 |
| Ronald Tucker | 37584 | Overlooked* | 6-Sep-1975 | F008N005E22 |
| Ronald Tucker | 37585 | The Lad* | 12-Aug-1965 | F008N005E22 |
| State Claims | ||||
| Karl Hanneman and Bergelin Family Trust | 330936 | LUCKY 55 | 14-May-1981 | F009N004W33 |
| Karl Hanneman and Bergelin Family Trust | 330937 | LUCKY 56 | 14-May-1981 | F009N004W33 |
| Karl Hanneman and Bergelin Family Trust | 330938 | LUCKY 64 | 13-May-1981 | F009N004W32 F009N004W33 |
| Karl Hanneman and Bergelin Family Trust | 330939 | LUCKY 65 | 14-May-1981 | F009N004W33 |
| Karl Hanneman and Bergelin Family Trust | 330940 | LUCKY 66 | 14-May-1981 | F009N004W33 |
| Karl Hanneman and Bergelin Family Trust | 330941 | LUCKY 72 | 12-May-1981 | F008N004W05 |
| 239 |
| August 2011 Summary Report On The Livengood Project, Tolovana District, Alaska |
| Owner | File Number | Tenure Name | Date Acquired | MTRS Location |
| Karl Hanneman and Bergelin Family Trust | 330942 | LUCKY 73 | 13-May-1981 | F008N004W05 |
| Karl Hanneman and Bergelin Family Trust | 330943 | LUCKY 74 | 13-May-1981 | F008N004W05 |
| Karl Hanneman and Bergelin Family Trust | 330944 | LUCKY 75 | 14-May-1981 | F008N004W04 |
| Karl Hanneman and Bergelin Family Trust | 330945 | LUCKY 76 | 14-May-1981 | F008N004W04 |
| Karl Hanneman and Bergelin Family Trust | 330946 | LUCKY 82 | 12-May-1981 | F008N004W05 |
| Karl Hanneman and Bergelin Family Trust | 330947 | LUCKY 83 | 13-May-1981 | F008N004W05 |
| Karl Hanneman and Bergelin Family Trust | 330948 | LUCKY 84 | 13-May-1981 | F008N004W05 |
| Karl Hanneman and Bergelin Family Trust | 330949 | LUCKY 85 | 14-May-1981 | F008N004W04 |
| Karl Hanneman and Bergelin Family Trust | 330950 | LUCKY 86 | 14-May-1981 | F008N004W04 |
| Karl Hanneman and Bergelin Family Trust | 330951 | LUCKY 91 | 12-May-1981 | F008N004W05 |
| Karl Hanneman and Bergelin Family Trust | 330952 | LUCKY 92 | 12-May-1981 | F008N004W05 |
| Karl Hanneman and Bergelin Family Trust | 330953 | LUCKY 93 | 13-May-1981 | F008N004W05 |
| Karl Hanneman and Bergelin Family Trust | 330954 | LUCKY 94 | 13-May-1981 | F008N004W05 |
| Karl Hanneman and Bergelin Family Trust | 330955 | LUCKY 95 | 14-May-1981 | F008N004W04 |
| Karl Hanneman and Bergelin Family Trust | 330956 | LUCKY 96 | 14-May-1981 | F008N004W04 |
| Karl Hanneman and Bergelin Family Trust | 330957 | LUCKY 101 | 12-May-1981 | F008N004W05 |
| Karl Hanneman and Bergelin Family Trust | 330958 | LUCKY 102 | 12-May-1981 | F008N004W05 |
| Karl Hanneman and Bergelin Family Trust | 330959 | LUCKY 103 | 12-May-1981 | F008N004W05 |
| Karl Hanneman and Bergelin Family Trust | 330960 | LUCKY 104 | 12-May-1981 | F008N004W05 |
| Karl Hanneman and Bergelin Family Trust | 330961 | LUCKY 105 | 12-May-1981 | F008N004W04 |
| Karl Hanneman and Bergelin Family Trust | 330962 | LUCKY 106 | 12-May-1981 | F008N004W04 |
| Karl Hanneman and Bergelin Family Trust | 330963 | LUCKY 202 | 13-May-1981 | F008N004W08 |
| Karl Hanneman and Bergelin Family Trust | 330964 | LUCKY 203 | 13-May-1981 | F008N004W08 |
| Karl Hanneman and Bergelin Family Trust | 330965 | LUCKY 204 | 15-May-1981 | F008N004W08 |
| Karl Hanneman and Bergelin Family Trust | 330966 | LUCKY 205 | 13-May-1981 | F008N004W09 |
| Karl Hanneman and Bergelin Family Trust | 330967 | LUCKY 206 | 14-May-1981 | F008N004W09 |
| Karl Hanneman and Bergelin Family Trust | 330968 | LUCKY 207 | 14-May-1981 | F008N004W09 |
| Karl Hanneman and Bergelin Family Trust | 330969 | LUCKY 208 | 14-May-1981 | F008N004W09 |
| Karl Hanneman and Bergelin Family Trust | 330970 | LUCKY 302 | 13-May-1981 | F008N004W08 |
| Karl Hanneman and Bergelin Family Trust | 330971 | LUCKY 303 | 13-May-1981 | F008N004W08 |
| Karl Hanneman and Bergelin Family Trust | 330972 | LUCKY 304 | 15-May-1981 | F008N004W08 |
| Karl Hanneman and Bergelin Family Trust | 330973 | LUCKY 305 | 13-May-1981 | F008N004W09 |
| 240 |
| August 2011 Summary Report On The Livengood Project, Tolovana District, Alaska |
| Owner | File Number | Tenure Name | Date Acquired | MTRS Location |
| Karl Hanneman and Bergelin Family Trust | 330974 | LUCKY 306 | 14-May-1981 | F008N004W09 |
| Karl Hanneman and Bergelin Family Trust | 330975 | LUCKY 307 | 14-May-1981 | F008N004W09 |
| Karl Hanneman and Bergelin Family Trust | 330976 | LUCKY 308 | 14-May-1981 | F008N004W09 |
| Karl Hanneman and Bergelin Family Trust | 330977 | LUCKY 404 | 15-May-1981 | F008N004W08 |
| Karl Hanneman and Bergelin Family Trust | 330978 | LUCKY 405 | 13-May-1981 | F008N004W09 |
| Karl Hanneman and Bergelin Family Trust | 330979 | LUCKY 406 | 14-May-1981 | F008N004W09 |
| Karl Hanneman and Bergelin Family Trust | 338477 | LUCKY 198 | 17-Sep-1981 | F008N004W07 |
| Karl Hanneman and Bergelin Family Trust | 338478 | LUCKY 199 | 17-Sep-1981 | F008N004W07 |
| Karl Hanneman and Bergelin Family Trust | 338479 | LUCKY 295 | 17-Sep-1981 | F008N005W12 |
| Karl Hanneman and Bergelin Family Trust | 338480 | LUCKY 296 | 17-Sep-1981 | F008N005W12 |
| Karl Hanneman and Bergelin Family Trust | 338481 | LUCKY 297 | 17-Sep-1981 | F008N004W07 |
| Karl Hanneman and Bergelin Family Trust | 338482 | LUCKY 298 | 17-Sep-1981 | F008N004W07 |
| Karl Hanneman and Bergelin Family Trust | 338483 | LUCKY 299 | 17-Sep-1981 | F008N004W07 |
| Karl Hanneman and Bergelin Family Trust | 338484 | LUCKY 392 | 21-Sep-1981 | F008N005W11 |
| Karl Hanneman and Bergelin Family Trust | 338485 | LUCKY 395 | 18-Sep-1981 | F008N005W12 |
| Karl Hanneman and Bergelin Family Trust | 338486 | LUCKY 396 | 18-Sep-1981 | F008N005W12 |
| Karl Hanneman and Bergelin Family Trust | 338487 | LUCKY 397 | 18-Sep-1981 | F008N004W07 |
| Karl Hanneman and Bergelin Family Trust | 338488 | LUCKY 398 | 18-Sep-1981 | F008N004W07 |
| Karl Hanneman and Bergelin Family Trust | 338489 | LUCKY 399 | 17-Sep-1981 | F008N004W07 |
| Karl Hanneman and Bergelin Family Trust | 338490 | LUCKY 400 | 23-Sep-1981 | F008N004W07 F008N004W08 |
| Karl Hanneman and Bergelin Family Trust | 338491 | LUCKY 491 | 21-Sep-1981 | F008N005W11 |
| Karl Hanneman and Bergelin Family Trust | 338492 | LUCKY 492 | 21-Sep-1981 | F008N005W11 |
| Karl Hanneman and Bergelin Family Trust | 338493 | LUCKY 493 | 21-Sep-1981 | F008N005W12 |
| Karl Hanneman and Bergelin Family Trust | 338494 | LUCKY 494 | 21-Sep-1981 | F008N005W12 |
| Karl Hanneman and Bergelin Family Trust | 338495 | LUCKY 495 | 18-Sep-1981 | F008N005W12 |
| Karl Hanneman and Bergelin Family Trust | 338496 | LUCKY 496 | 18-Sep-1981 | F008N005W12 |
| Karl Hanneman and Bergelin Family Trust | 338497 | LUCKY 497 | 18-Sep-1981 | F008N004W07 |
| Karl Hanneman and Bergelin Family Trust | 338498 | LUCKY 498 | 18-Sep-1981 | F008N004W07 |
| Karl Hanneman and Bergelin Family Trust | 338499 | LUCKY 499 | 17-Sep-1981 | F008N004W07 |
| Karl Hanneman and Bergelin Family Trust | 338500 | LUCKY 500 | 23-Sep-1981 | F008N004W07 F008N004W08 |
| Karl Hanneman and Bergelin Family Trust | 338501 | LUCKY 504 | 10-Sep-1981 | F008N004W08 |
| Karl Hanneman and Bergelin Family Trust | 338502 | LUCKY 505 | 10-Sep-1981 | F008N004W09 |
| 241 |
| August 2011 Summary Report On The Livengood Project, Tolovana District, Alaska |
| Owner | File Number | Tenure Name | Date Acquired | MTRS Location |
| Karl Hanneman and Bergelin Family Trust | 338503 | LUCKY 589 | 21-Sep-1981 | F008N005W14 |
| Karl Hanneman and Bergelin Family Trust | 338504 | LUCKY 590 | 21-Sep-1981 | F008N005W14 |
| Karl Hanneman and Bergelin Family Trust | 338505 | LUCKY 591 | 21-Sep-1981 | F008N005W14 |
| Karl Hanneman and Bergelin Family Trust | 338506 | LUCKY 592 | 21-Sep-1981 | F008N005W14 |
| Karl Hanneman and Bergelin Family Trust | 338507 | LUCKY 593 | 21-Sep-1981 | F008N005W13 |
| Karl Hanneman and Bergelin Family Trust | 338508 | LUCKY 594 | 21-Sep-1981 | F008N005W13 |
| Karl Hanneman and Bergelin Family Trust | 338509 | LUCKY 595 | 18-Sep-1981 | F008N005W13 |
| Karl Hanneman and Bergelin Family Trust | 338510 | LUCKY 596 | 18-Sep-1981 | F008N005W13 |
| Karl Hanneman and Bergelin Family Trust | 338511 | LUCKY 597 | 18-Sep-1981 | F008N004W18 |
| Karl Hanneman and Bergelin Family Trust | 338512 | LUCKY 598 | 18-Sep-1981 | F008N004W18 |
| Karl Hanneman and Bergelin Family Trust | 338513 | LUCKY 599 | 17-Sep-1981 | F008N004W18 |
| Karl Hanneman and Bergelin Family Trust | 338514 | LUCKY 689 | 22-Sep-1981 | F008N005W14 |
| Karl Hanneman and Bergelin Family Trust | 338515 | LUCKY 690 | 22-Sep-1981 | F008N005W14 |
| Karl Hanneman and Bergelin Family Trust | 338516 | LUCKY 691 | 22-Sep-1981 | F008N005W14 |
| Karl Hanneman and Bergelin Family Trust | 338517 | LUCKY 692 | 22-Sep-1981 | F008N005W14 |
| Karl Hanneman and Bergelin Family Trust | 338518 | LUCKY 693 | 22-Sep-1981 | F008N005W13 |
| Karl Hanneman and Bergelin Family Trust | 338519 | LUCKY 694 | 22-Sep-1981 | F008N005W13 |
| Karl Hanneman and Bergelin Family Trust | 338520 | LUCKY 697 | 18-Sep-1981 | F008N004W18 |
| Karl Hanneman and Bergelin Family Trust | 338521 | LUCKY 698 | 18-Sep-1981 | F008N004W18 |
| Karl Hanneman and Bergelin Family Trust | 338522 | LUCKY 699 | 17-Sep-1981 | F008N004W18 |
| Karl Hanneman and Bergelin Family Trust | 347943 | LC 407 | 5-Jun-1982 | F008N004W18 |
| Karl Hanneman and Bergelin Family Trust | 347945 | LC 502 | 5-Jun-1982 | F008N004W08 |
| Karl Hanneman and Bergelin Family Trust | 347946 | LC 503 | 5-Jun-1982 | F008N004W08 |
| Karl Hanneman and Bergelin Family Trust | 347947 | LC 506 | 7-Jun-1982 | F008N004W09 |
| Karl Hanneman and Bergelin Family Trust | 347948 | LC 507 | 7-Jun-1982 | F008N004W09 |
| Karl Hanneman and Bergelin Family Trust | 347949 | LC 600 | 5-Jun-1982 | F008N004W17 F008N004W18 |
| Karl Hanneman and Bergelin Family Trust | 347950 | LC 601 | 5-Jun-1982 | F008N004W17 |
| Karl Hanneman and Bergelin Family Trust | 347951 | LC 602 | 5-Jun-1982 | F008N004W17 |
| Karl Hanneman and Bergelin Family Trust | 347952 | LC 603 | 5-Jun-1982 | F008N004W17 |
| Karl Hanneman and Bergelin Family Trust | 347953 | LC 604 | 6-Jun-1982 | F008N004W17 |
| Karl Hanneman and Bergelin Family Trust | 347954 | LC 605 | 6-Jun-1982 | F008N004W16 |
| Karl Hanneman and Bergelin Family Trust | 347955 | LC 695 | 10-Jun-1982 | F008N005W13 |
| 242 |
| August 2011 Summary Report On The Livengood Project, Tolovana District, Alaska |
| Owner | File Number | Tenure Name | Date Acquired | MTRS Location |
| Karl Hanneman and Bergelin Family Trust | 347956 | LC 696 | 10-Jun-1982 | F008N005W13 |
| Karl Hanneman and Bergelin Family Trust | 347957 | LC 700 | 6-Jun-1982 | F008N004W17 F008N004W18 |
| Karl Hanneman and Bergelin Family Trust | 347958 | LC 701 | 6-Jun-1982 | F008N004W17 |
| Karl Hanneman and Bergelin Family Trust | 347959 | LC 702 | 6-Jun-1982 | F008N004W17 |
| Karl Hanneman and Bergelin Family Trust | 347960 | LC 703 | 6-Jun-1982 | F008N004W17 |
| Karl Hanneman and Bergelin Family Trust | 347961 | LC 704 | 6-Jun-1982 | F008N004W17 |
| Karl Hanneman and Bergelin Family Trust | 347962 | LC 790 | 12-Jun-1982 | F008N005W14 |
| Karl Hanneman and Bergelin Family Trust | 347963 | LC 791 | 12-Jun-1982 | F008N005W14 |
| Karl Hanneman and Bergelin Family Trust | 347964 | LC 792 | 11-Jun-1982 | F008N005W14 |
| Karl Hanneman and Bergelin Family Trust | 347965 | LC 793 | 11-Jun-1982 | F008N005W13 |
| Karl Hanneman and Bergelin Family Trust | 347966 | LC 794 | 11-Jun-1982 | F008N005W13 |
| Karl Hanneman and Bergelin Family Trust | 347967 | LC 795 | 10-Jun-1982 | F008N005W13 |
| Karl Hanneman and Bergelin Family Trust | 347968 | LC 796 | 10-Jun-1982 | F008N005W13 |
| Karl Hanneman and Bergelin Family Trust | 347969 | LC 797 | 10-Jun-1982 | F008N004W18 |
| Karl Hanneman and Bergelin Family Trust | 347970 | LC 798 | 9-Jun-1982 | F008N004W18 |
| Karl Hanneman and Bergelin Family Trust | 347971 | LC 799 | 8-Jun-1982 | F008N004W18 |
| Karl Hanneman and Bergelin Family Trust | 347972 | LC 800 | 8-Jun-1982 | F008N004W17 F008N004W18 |
| Karl Hanneman and Bergelin Family Trust | 347973 | LC 801 | 8-Jun-1982 | F008N004W17 |
| Karl Hanneman and Bergelin Family Trust | 347974 | LC 802 | 8-Jun-1982 | F008N004W17 |
| Karl Hanneman and Bergelin Family Trust | 347975 | LC 803 | 8-Jun-1982 | F008N004W17 |
| Karl Hanneman and Bergelin Family Trust | 347976 | LC 891 | 12-Jun-1982 | F008N005W14 |
| Karl Hanneman and Bergelin Family Trust | 347977 | LC 892 | 11-Jun-1982 | F008N005W14 |
| Karl Hanneman and Bergelin Family Trust | 347978 | LC 893 | 11-Jun-1982 | F008N005W13 |
| Karl Hanneman and Bergelin Family Trust | 347979 | LC 894 | 11-Jun-1982 | F008N005W13 |
| Karl Hanneman and Bergelin Family Trust | 347980 | LC 895 | 10-Jun-1982 | F008N005W13 |
| Karl Hanneman and Bergelin Family Trust | 348802 | LC 688 | 4-Jun-1982 | F008N005W15 |
| Karl Hanneman and Bergelin Family Trust | 348803 | LC 787 | 4-Jun-1982 | F008N005W15 |
| Karl Hanneman and Bergelin Family Trust | 348804 | LC 788 | 4-Jun-1982 | F008N005W15 |
| Karl Hanneman and Bergelin Family Trust | 348805 | LC 884 | 31-May-1982 | F008N005W16 |
| Karl Hanneman and Bergelin Family Trust | 348805 | LC 884 | 31-May-1982 | F008N005W16 |
| Karl Hanneman and Bergelin Family Trust | 348806 | LC 885 | 31-May-1982 | F008N005W15 |
| Karl Hanneman and Bergelin Family Trust | 348807 | LC 886 | 25-May-1982 | F008N005W15 |
| 243 |
| August 2011 Summary Report On The Livengood Project, Tolovana District, Alaska |
| Owner | File Number | Tenure Name | Date Acquired | MTRS Location |
| Karl Hanneman and Bergelin Family Trust | 348808 | LC 887 | 2-Jun-1982 | F008N005W15 |
| Karl Hanneman and Bergelin Family Trust | 348809 | LC 888 | 4-Jun-1982 | F008N005W15 |
| Karl Hanneman and Bergelin Family Trust | 348810 | LC 984 | 31-May-1982 | F008N005W21 |
| Karl Hanneman and Bergelin Family Trust | 348811 | LC 985 | 31-May-1982 | F008N005W22 |
| Karl Hanneman and Bergelin Family Trust | 348812 | LC 986 | 25-May-1982 | F008N005W22 |
| Karl Hanneman and Bergelin Family Trust | 348813 | LC 987 | 4-Jun-1982 | F008N005W22 |
| Karl Hanneman and Bergelin Family Trust | 348814 | LC 1083 | 30-May-1982 | F008N005W21 |
| Karl Hanneman and Bergelin Family Trust | 348815 | LC 1084 | 30-May-1982 | F008N005W21 |
| Karl Hanneman and Bergelin Family Trust | 348816 | LC 1085 | 30-May-1982 | F008N005W22 |
| Karl Hanneman and Bergelin Family Trust | 348817 | LC 1086 | 25-May-1982 | F008N005W22 |
| Karl Hanneman and Bergelin Family Trust | 348818 | LC 1183 | 29-May-1982 | F008N005W21 |
| Karl Hanneman and Bergelin Family Trust | 348819 | LC 1184 | 29-May-1982 | F008N005W21 |
| Karl Hanneman and Bergelin Family Trust | 348820 | LC 1185 | 29-May-1982 | F008N005W22 |
| Karl Hanneman and Bergelin Family Trust | 348821 | LC 1186 | 25-May-1982 | F008N005W22 |
| Karl Hanneman and Bergelin Family Trust | 348822 | LC 1282 | 28-May-1982 | F008N005W21 |
| Karl Hanneman and Bergelin Family Trust | 348823 | LC 1283 | 28-May-1982 | F008N005W21 |
| Karl Hanneman and Bergelin Family Trust | 348824 | LC 1284 | 28-May-1982 | F008N005W21 |
| Karl Hanneman and Bergelin Family Trust | 348825 | LC 1285 | 28-May-1982 | F008N005W22 |
| Karl Hanneman and Bergelin Family Trust | 348826 | LC 1286 | 26-May-1982 | F008N005W22 |
| Karl Hanneman and Bergelin Family Trust | 348827 | LC 1287 | 26-May-1982 | F008N005W22 |
| Karl Hanneman and Bergelin Family Trust | 348828 | LC 1288 | 2-Jun-1982 | F008N005W22 |
| Karl Hanneman and Bergelin Family Trust | 348829 | LC 1382 | 27-May-1982 | F008N005W28 |
| Karl Hanneman and Bergelin Family Trust | 348830 | LC 1383 | 27-May-1982 | F008N005W28 |
| Karl Hanneman and Bergelin Family Trust | 348831 | LC 1384 | 27-May-1982 | F008N005W28 |
| Karl Hanneman and Bergelin Family Trust | 348832 | LC 1385 | 27-May-1982 | F008N005W27 |
| Karl Hanneman and Bergelin Family Trust | 361326 | LUCKY 90 | 24-Oct-1983 | F008N004W06 |
| Karl Hanneman and Bergelin Family Trust | 361327 | LUCKY 100 | 24-Oct-1983 | F008N004W06 |
| Karl Hanneman and Bergelin Family Trust | 361328 | LUCKY 200 | 24-Oct-1983 | F008N004W07 |
| Karl Hanneman and Bergelin Family Trust | 361329 | LUCKY 294 | 28-Oct-1983 | F008N005W12 |
| Karl Hanneman and Bergelin Family Trust | 361330 | LUCKY 300 | 24-Oct-1983 | F008N004W07 |
| Karl Hanneman and Bergelin Family Trust | 361331 | LUCKY 394 | 28-Oct-1983 | F008N005W12 |
| Karl Hanneman and Bergelin Family Trust | 361332 | LUCKY 401 | 24-Oct-1983 | F008N004W08 |
| 244 |
| August 2011 Summary Report On The Livengood Project, Tolovana District, Alaska |
| Owner | File Number | Tenure Name | Date Acquired | MTRS Location |
| Karl Hanneman and Bergelin Family Trust | 361333 | LUCKY 402 | 24-Oct-1983 | F008N004W08 |
| Karl Hanneman and Bergelin Family Trust | 361334 | LUCKY 403 | 24-Oct-1983 | F008N004W08 |
| Karl Hanneman and Bergelin Family Trust | 361335 | LUCKY 501 | 24-Oct-1983 | F008N004W08 |
| Talon Gold Alaska Inc | 669377 | LVG 1 | 02/20/10 | F8N4W9SESE |
| Talon Gold Alaska Inc | 669378 | LVG 2 | 02/20/10 | F8N4W16NWNE |
| Talon Gold Alaska Inc | 669379 | LVG 3 | 02/20/10 | F8N4W16NWSW |
| Talon Gold Alaska Inc | 669380 | LVG 4 | 02/20/10 | F8N4W16NWSE |
| Talon Gold Alaska Inc | 669381 | LVG 5 | 02/20/10 | F9N4W20NW |
| Talon Gold Alaska Inc | 669382 | LVG 6 | 02/20/10 | F9N4W20NE |
| Talon Gold Alaska Inc | 669383 | LVG 7 | 02/20/10 | F9N4W21NW |
| Talon Gold Alaska Inc | 669384 | LVG 8 | 02/20/10 | F9N4W21NE |
| Talon Gold Alaska Inc | 669385 | LVG 9 | 02/20/10 | F9N4W22NW |
| Talon Gold Alaska Inc | 669386 | LVG 10 | 02/20/10 | F9N4W22NE |
| Talon Gold Alaska Inc | 669387 | LVG 11 | 02/20/10 | F9N4W20SW |
| Talon Gold Alaska Inc | 669388 | LVG 12 | 02/20/10 | F9N4W20SE |
| Talon Gold Alaska Inc | 669389 | LVG 13 | 02/20/10 | F9N4W21SW |
| Talon Gold Alaska Inc | 669390 | LVG 14 | 02/20/10 | F9N4W21SE |
| Talon Gold Alaska Inc | 669391 | LVG 15 | 02/20/10 | F9N4W22SW |
| Talon Gold Alaska Inc | 669392 | LVG 16 | 02/20/10 | F9N4W22SE |
| Talon Gold Alaska Inc | 669393 | LVG 17 | 02/20/10 | F9N5W25NW |
| Talon Gold Alaska Inc | 669394 | LVG 18 | 02/20/10 | F9N5W25NE |
| Talon Gold Alaska Inc | 669395 | LVG 19 | 02/20/10 | F9N4W30NW |
| Talon Gold Alaska Inc | 669396 | LVG 20 | 02/20/10 | F9N4W30NE |
| Talon Gold Alaska Inc | 669397 | LVG 21 | 02/20/10 | F9N4W29NW |
| Talon Gold Alaska Inc | 669398 | LVG 22 | 02/20/10 | F9N4W29NE |
| Talon Gold Alaska Inc | 669399 | LVG 23 | 02/20/10 | F9N5W25SW |
| Talon Gold Alaska Inc | 669400 | LVG 24 | 02/20/10 | F9N5W25SE |
| Talon Gold Alaska Inc | 669401 | LVG 25 | 02/20/10 | F9N4W30SW |
| Talon Gold Alaska Inc | 669402 | LVG 26 | 02/20/10 | F9N4W30SE |
| Talon Gold Alaska Inc | 669403 | LVG 27 | 02/20/10 | F9N4W29SW |
| Talon Gold Alaska Inc | 669404 | LVG 28 | 02/20/10 | F9N4W29SE |
| Talon Gold Alaska Inc | 669405 | LVG 29 | 02/20/10 | F9N5W35NW |
| Talon Gold Alaska Inc | 669406 | LVG 30 | 02/20/10 | F9N5W35NE |
| Talon Gold Alaska Inc | 669407 | LVG 31 | 02/20/10 | F9N5W36NW |
| Talon Gold Alaska Inc | 669408 | LVG 32 | 02/20/10 | F9N5W36NE |
| Talon Gold Alaska Inc | 669409 | LVG 33 | 02/20/10 | F9N5W35SW |
| Talon Gold Alaska Inc | 669410 | LVG 34 | 02/20/10 | F9N5W35SE |
| Talon Gold Alaska Inc | 669411 | LVG 35 | 02/20/10 | F9N5W36SW |
| 245 |
| August 2011 Summary Report On The Livengood Project, Tolovana District, Alaska |
| Owner | File Number | Tenure Name | Date Acquired | MTRS Location |
| Talon Gold Alaska Inc | 669412 | LVG 36 | 02/20/10 | F9N5W36SE |
| Talon Gold Alaska Inc | 669413 | LVG 37 | 02/20/10 | F8N5W3NW |
| Talon Gold Alaska Inc | 669414 | LVG 38 | 02/20/10 | F8N5W3NE |
| Talon Gold Alaska Inc | 669415 | LVG 39 | 02/20/10 | F8N5W3SW |
| Talon Gold Alaska Inc | 669416 | LVG 40 | 02/20/10 | F8N5W3SE |
| Talon Gold Alaska Inc | 669417 | LVG 41 | 02/20/10 | F9N4W27NW |
| Talon Gold Alaska Inc | 669418 | LVG 42 | 02/20/10 | F9N4W27NE |
| Talon Gold Alaska Inc | 669419 | LVG 43 | 02/20/10 | F9N4W27SW |
| Talon Gold Alaska Inc | 669420 | LVG 44 | 02/20/10 | F9N4W27SE |
| Talon Gold Alaska Inc | 669421 | LVG 45 | 02/20/10 | F9N4W34NW |
| Talon Gold Alaska Inc | 669422 | LVG 46 | 02/20/10 | F9N4W34NE |
| Talon Gold Alaska Inc | 669423 | LVG 47 | 02/20/10 | F9N4W34SW |
| Talon Gold Alaska Inc | 669424 | LVG 48 | 02/20/10 | F9N4W34SE |
| Talon Gold Alaska Inc | 669425 | LVG 49 | 02/20/10 | F8N4W4NE |
| Talon Gold Alaska Inc | 669426 | LVG 50 | 02/20/10 | F8N4W3NW |
| Talon Gold Alaska Inc | 669427 | LVG 51 | 02/20/10 | F8N4W3NE |
| Talon Gold Alaska Inc | 669428 | LVG 52 | 02/20/10 | F8N4W2NW |
| Talon Gold Alaska Inc | 669429 | LVG 53 | 02/20/10 | F8N4W2NE |
| Talon Gold Alaska Inc | 669430 | LVG 54 | 02/20/10 | F8N4W4SE |
| Talon Gold Alaska Inc | 669431 | LVG 55 | 02/20/10 | F8N4W3SW |
| Talon Gold Alaska Inc | 669432 | LVG 56 | 02/20/10 | F8N4W3SE |
| Talon Gold Alaska Inc | 669433 | LVG 57 | 02/20/10 | F8N4W2SW |
| Talon Gold Alaska Inc | 669434 | LVG 58 | 02/20/10 | F8N4W2SE |
| Talon Gold Alaska Inc | 669435 | LVG 59 | 02/20/10 | F8N4W10NW |
| Talon Gold Alaska Inc | 669436 | LVG 60 | 02/20/10 | F8N4W10NE |
| Talon Gold Alaska Inc | 669437 | LVG 61 | 02/20/10 | F8N4W11NW |
| Talon Gold Alaska Inc | 669438 | LVG 62 | 02/20/10 | F8N4W11NE |
| Talon Gold Alaska Inc | 669439 | LVG 63 | 02/20/10 | F8N4W10SW |
| Talon Gold Alaska Inc | 669440 | LVG 64 | 02/20/10 | F8N4W10SE |
| Talon Gold Alaska Inc | 669441 | LVG 65 | 02/20/10 | F8N4W11SW |
| Talon Gold Alaska Inc | 669442 | LVG 66 | 02/20/10 | F8N4W11SE |
| Talon Gold Alaska Inc | 669443 | LVG 67 | 02/20/10 | F8N4W16NE |
| Talon Gold Alaska Inc | 669444 | LVG 68 | 02/20/10 | F8N4W15NW |
| Talon Gold Alaska Inc | 669445 | LVG 69 | 02/20/10 | F8N4W15NE |
| Talon Gold Alaska Inc | 669446 | LVG 70 | 02/20/10 | F8N4W14NW |
| Talon Gold Alaska Inc | 669447 | LVG 71 | 02/20/10 | F8N4W14NE |
| Talon Gold Alaska Inc | 669448 | LVG 72 | 02/20/10 | F8N4W16SW |
| Talon Gold Alaska Inc | 669449 | LVG 73 | 02/20/10 | F8N4W16SE |
| Talon Gold Alaska Inc | 669450 | LVG 74 | 02/20/10 | F8N4W15SW |
| 246 |
| August 2011 Summary Report On The Livengood Project, Tolovana District, Alaska |
| Owner | File Number | Tenure Name | Date Acquired | MTRS Location |
| Talon Gold Alaska Inc | 669451 | LVG 75 | 02/20/10 | F8N4W15SE |
| Talon Gold Alaska Inc | 669452 | LVG 76 | 02/20/10 | F8N4W14SW |
| Talon Gold Alaska Inc | 669453 | LVG 77 | 02/20/10 | F8N4W14SE |
| Talon Gold Alaska Inc | 669454 | LVG 78 | 02/20/10 | F8N4W21NW |
| Talon Gold Alaska Inc | 669455 | LVG 79 | 02/20/10 | F8N4W21NE |
| Talon Gold Alaska Inc | 669456 | LVG 80 | 02/20/10 | F8N4W22NW |
| Talon Gold Alaska Inc | 669457 | LVG 81 | 02/20/10 | F8N4W22NE |
| Talon Gold Alaska Inc | 669458 | LVG 82 | 02/20/10 | F8N4W23NW |
| Talon Gold Alaska Inc | 669459 | LVG 83 | 02/20/10 | F8N4W23NE |
| Talon Gold Alaska Inc | 669460 | LVG 84 | 02/20/10 | F8N4W21SW |
| Talon Gold Alaska Inc | 669461 | LVG 85 | 02/20/10 | F8N4W21SE |
| Talon Gold Alaska Inc | 669462 | LVG 86 | 02/20/10 | F8N4W22SW |
| Talon Gold Alaska Inc | 669463 | LVG 87 | 02/20/10 | F8N4W22SE |
| Talon Gold Alaska Inc | 669464 | LVG 88 | 02/20/10 | F8N4W23SW |
| Talon Gold Alaska Inc | 669465 | LVG 89 | 02/20/10 | F8N4W23SE |
| Talon Gold Alaska Inc. | 700008 | LVG 90 | 03/21/10 | F9 N4 W17NW |
| Talon Gold Alaska Inc. | 700009 | LVG 91 | 03/21/10 | F9 N4 W17NE |
| Talon Gold Alaska Inc. | 700010 | LVG 92 | 03/21/10 | F9 N4 W16NW |
| Talon Gold Alaska Inc. | 700011 | LVG 93 | 03/21/10 | F9 N4 W16NE |
| Talon Gold Alaska Inc. | 700012 | LVG 94 | 03/21/10 | F9 N4 W17SW |
| Talon Gold Alaska Inc. | 700013 | LVG 95 | 03/21/10 | F9 N4 W17SE |
| Talon Gold Alaska Inc. | 700014 | LVG 96 | 03/21/10 | F9 N4 W16SW |
| Talon Gold Alaska Inc. | 700015 | LVG 97 | 03/21/10 | F9 N4 W16SE |
| Talon Gold Alaska Inc. | 700016 | LVG 98 | 03/21/10 | F8 N5 W9NW |
| Talon Gold Alaska Inc. | 700017 | LVG 99 | 03/21/10 | F8 N5 W9NE |
| Talon Gold Alaska Inc. | 700018 | LVG 100 | 03/21/10 | F8 N5 W9SW |
| Talon Gold Alaska Inc. | 700019 | LVG 101 | 03/21/10 | F8 N5 W9SE |
| Talon Gold Alaska Inc. | 700020 | LVG 102 | 03/21/10 | F8 N4 W31NW |
| Talon Gold Alaska Inc. | 700021 | LVG 103 | 03/21/10 | F8 N4 W31NE |
| Talon Gold Alaska Inc. | 700022 | LVG 104 | 03/21/10 | F8 N4 W32NW |
| Talon Gold Alaska Inc. | 700023 | LVG 105 | 03/21/10 | F8 N4 W32NE |
| Talon Gold Alaska Inc. | 700024 | LVG 106 | 03/21/10 | F8 N4 W31SW |
| Talon Gold Alaska Inc. | 700025 | LVG 107 | 03/21/10 | F8 N4 W31SE |
| Talon Gold Alaska Inc. | 700026 | LVG 108 | 03/21/10 | F8 N4 W32SW |
| Talon Gold Alaska Inc. | 700027 | LVG 109 | 03/21/10 | F8 N4 W32SE |
| Talon Gold Alaska Inc. | 700028 | LVG 110 | 03/21/10 | F7 N4 W6NW |
| Talon Gold Alaska Inc. | 700029 | LVG 111 | 03/21/10 | F7 N4 W6NE |
| Talon Gold Alaska Inc. | 700030 | LVG 112 | 03/21/10 | F7 N4 W5NW |
| Talon Gold Alaska Inc. | 700031 | LVG 113 | 03/21/10 | F7 N4 W5NE |
| 247 |
| August 2011 Summary Report On The Livengood Project, Tolovana District, Alaska |
| Owner | File Number | Tenure Name | Date Acquired | MTRS Location |
| Talon Gold Alaska Inc. | 700032 | LVG 114 | 03/21/10 | F7 N4 W4NW |
| Talon Gold Alaska Inc. | 700033 | LVG 115 | 03/21/10 | F7 N4 W4NE |
* - Placer claim
Note: Meridian Township Range and Section (MTRS) Location is the Federal land location system. Example F006S013E12 is a section of land located in the Fairbanks Meridian, Township 6 South, Range 13 East, Section 12.
| 248 |
| August 2011 Summary Report On The Livengood Project, Tolovana District, Alaska |
28.2 Appendix 2: Listof Drill Holes (UTM, NAD27, Z6N)
| DrillHole | Easting | Northing | Elev (m) | Depth (m) |
| BAF-1 | 430060.0 | 7266021.0 | 508.3 | 213.4 |
| BAF-2 | 430073.0 | 7266149.0 | 512.7 | 152.4 |
| BAF-3 | 429760.0 | 7266096.0 | 501.3 | 150.9 |
| BAF-4 | 430073.0 | 7265881.0 | 470.2 | 216.4 |
| BAF-5 | 430078.0 | 7265765.0 | 444.4 | 189.9 |
| BAF-6 | 429745.0 | 7265979.0 | 511.9 | 134.1 |
| BAF-7 | 430056.0 | 7266034.0 | 508.3 | 304.8 |
| BAF-8 | 430342.0 | 7266042.0 | 510.1 | 152.4 |
| L-1 | 429726.0 | 7265450.0 | 508.7 | 31.0 |
| L-2 | 429350.0 | 7265457.0 | 496.8 | 73.0 |
| L-3 | 429050.0 | 7265715.0 | 464.5 | 46.0 |
| L-4 | 429045.0 | 7265688.0 | 464.4 | 20.0 |
| L-5 | 428910.0 | 7265675.0 | 447.0 | 70.0 |
| L-6 | 428805.0 | 7265640.0 | 432.1 | 70.0 |
| MK-1 | 428945.0 | 7265820.0 | 427.4 | 76.0 |
| MK-2 | 428825.0 | 7265850.0 | 422.3 | 77.0 |
| MK-3 | 429500.0 | 7266190.0 | 450.4 | 28.0 |
| MK-4 | 429493.0 | 7266117.0 | 466.0 | 15.2 |
| MK-4B | 429493.0 | 7266117.0 | 466.0 | 106.7 |
| MK-5 | 428660.0 | 7265925.0 | 357.2 | 0.0 |
| MK-6 | 428680.0 | 7265940.0 | 357.7 | 0.0 |
| MK-04-01 | 428734.4 | 7265596.0 | 421.5 | 109.7 |
| MK-04-02 | 428492.1 | 7265738.0 | 361.6 | 305.7 |
| MK-04-03 | 428674.7 | 7265520.5 | 412.2 | 208.8 |
| MK-04-04 | 428547.7 | 7265813.5 | 354.4 | 137.8 |
| MK-06-05 | 429099.0 | 7266101.0 | 397.9 | 305.1 |
| 249 |
| August 2011 Summary Report On The Livengood Project, Tolovana District, Alaska |
| MK-06-06 | 429299.0 | 7266298.0 | 395.0 | 205.4 |
| MK-06-07 | 428772.3 | 7265845.0 | 412.8 | 276.5 |
| MK-06-08 | 428915.3 | 7265897.0 | 408.7 | 288.3 |
| MK-06-09 | 427614.0 | 7264251.0 | 213.4 | 124.7 |
| MK-06-10 | 427533.0 | 7264335.0 | 210.5 | 10.4 |
| MK-06-11 | 427691.0 | 7264430.0 | 230.0 | 17.1 |
| MK-07-12 | 428915.3 | 7265897.0 | 408.7 | 282.9 |
| MK-07-13 | 428773.3 | 7265847.5 | 412.8 | 351.1 |
| MK-07-14 | 428774.8 | 7265846.0 | 412.8 | 44.8 |
| MK-07-15 | 428774.8 | 7265849.0 | 412.8 | 281.6 |
| MK-07-16 | 430220.0 | 7265985.0 | 517.6 | 332.8 |
| MK-07-17 | 428773.4 | 7265621.5 | 427.7 | 421.8 |
| MK-07-18 | 428853.6 | 7265780.0 | 431.8 | 301.1 |
| MK-07-19 | 429002.6 | 7265704.0 | 458.4 | 436.2 |
| MK-07-20 | 428851.7 | 7265720.0 | 435.3 | 244.3 |
| MK-07-21 | 428925.8 | 7265760.5 | 440.2 | 310.0 |
| MK-07-22 | 428703.3 | 7265764.0 | 408.5 | 382.8 |
| MK-07-23 | 429075.8 | 7265779.5 | 458.8 | 290.2 |
| MK-07-24 | 429529.8 | 7265631.0 | 508.9 | 372.2 |
| MK-07-25 | 428399.6 | 7265253.0 | 368.2 | 330.4 |
| MK-07-26 | 429900.0 | 7265470.0 | 448.3 | 28.4 |
| MK-08-27 | 429592.6 | 7265927.3 | 499.9 | 201.8 |
| MK-08-28 | 429518.3 | 7266005.7 | 485.9 | 229.2 |
| MK-08-29 | 429896.0 | 7265778.7 | 470.1 | 266.7 |
| MK-08-30 | 428891.9 | 7265737.9 | 438.7 | 345.2 |
| MK-08-31 | 429142.4 | 7265606.6 | 479.1 | 376.4 |
| MK-08-32 | 429186.5 | 7265431.2 | 474.1 | 343.8 |
| MK-08-33 | 429066.3 | 7265091.1 | 427.5 | 276.8 |
| MK-09-34 | 428771.9 | 7265545.0 | 427.5 | 296.3 |
| 250 |
| August 2011 Summary Report On The Livengood Project, Tolovana District, Alaska |
| MK-09-35 | 428851.1 | 7265490.9 | 437.1 | 276.5 |
| MK-09-36 | 428782.5 | 7265215.5 | 409.5 | 697.9 |
| MK-09-37 | 429109.1 | 7265405.9 | 463.7 | 527.3 |
| MK-09-38 | 429251.3 | 7265387.9 | 477.3 | 215.8 |
| MK-09-39 | 429524.8 | 7265998.9 | 487.8 | 309.4 |
| MK-09-40 | 429254.1 | 7265386.1 | 477.7 | 584.6 |
| MK-09-41 | 430048.6 | 7265921.9 | 480.9 | 407.8 |
| MK-09-42 | 429604.1 | 7265703.3 | 503.4 | 341.4 |
| MK-09-43 | 429562.3 | 7265812.8 | 500.0 | 428.2 |
| MK-09-44 | 428946.3 | 7265103.7 | 417.9 | 313.3 |
| MK-09-45 | 429451.7 | 7265094.3 | 441.1 | 174.8 |
| MK-10-46 | 429519.3 | 7265865.3 | 496.1 | 350.7 |
| MK-10-47 | 428962.5 | 7265498.9 | 451.2 | 297.8 |
| MK-10-48 | 428930.3 | 7265240.0 | 430.0 | 441.0 |
| MK-10-49 | 428778.2 | 7265392.9 | 422.3 | 305.7 |
| MK-10-50 | 428775.8 | 7264872.4 | 379.1 | 263.4 |
| MK-10-51 | 428702.0 | 7265024.6 | 383.4 | 339.5 |
| MK-10-52 | 429338.9 | 7265137.1 | 450.5 | 287.1 |
| MK-10-53 | 429039.6 | 7265062.0 | 421.7 | 437.4 |
| MK-10-54 | 429590.0 | 7265401.2 | 537.0 | 302.8 |
| MK-10-55 | 428961.0 | 7265361.7 | 446.7 | 397.0 |
| MK-10-56 | 429788.1 | 7265965.1 | 517.2 | 405.7 |
| MK-10-57 | 429551.3 | 7265949.4 | 493.4 | 390.5 |
| MK-10-58 | 428886.8 | 7265651.0 | 449.9 | 276.8 |
| MK-10-59 | 430240.8 | 7266100.2 | 556.0 | 384.4 |
| MK-10-60 | 429043.2 | 7265813.7 | 451.4 | 390.8 |
| MK-10-61 | 429585.5 | 7264825.3 | 391.3 | 394.1 |
| MK-10-62 | 428964.2 | 7265442.7 | 460.9 | 473.4 |
| MK-10-63 | 429712.5 | 7265732.0 | 495.7 | 378.1 |
| 251 |
| August 2011 Summary Report On The Livengood Project, Tolovana District, Alaska |
| MK-10-64 | 429572.1 | 7265626.2 | 511.9 | 537.4 |
| MK-10-65 | 429489.2 | 7265877.4 | 493.9 | 431.3 |
| MK-10-66 | 429413.1 | 7266117.8 | 449.7 | 275.5 |
| MK-10-67 | 429488.6 | 7265964.8 | 485.5 | 414.5 |
| MK-10-68 | 428688.9 | 7266201.2 | 336.5 | 31.1 |
| MK-10-69 | 429562.2 | 7266039.1 | 498.8 | 354.2 |
| MK-10-70 | 428884.6 | 7265889.8 | 414.7 | 379.9 |
| MK-10-71 | 434515.5 | 7267721.5 | 421.4 | 75.6 |
| MK-10-72 | 429594.9 | 7265323.8 | 492.8 | 436.9 |
| MK-10-73 | 434334.5 | 7267744.6 | 384.4 | 76.8 |
| MK-10-73A | 434334.5 | 7267744.6 | 384.4 | 279.2 |
| MK-10-74 | 430304.5 | 7266032.1 | 525.1 | 401.7 |
| MK-10-75 | 428784.3 | 7266799.6 | 357.0 | 196.9 |
| MK-10-76 | 429510.9 | 7267591.1 | 335.7 | 198.1 |
| MK-10-77 | 429897.7 | 7266073.2 | 502.2 | 387.1 |
| MK-10-78 | 429225.4 | 7266980.3 | 303.6 | 198.7 |
| MK-10-79 | 431378.7 | 7266004.6 | 576.1 | 198.7 |
| MK-10-80 | 428916.7 | 7261885.3 | 149.6 | 25.0 |
| MK-10-81 | 429638.0 | 7265958.5 | 511.3 | 344.6 |
| MK-10-82 | 429712.9 | 7265811.0 | 503.2 | 404.5 |
| MK-10-83 | 429567.7 | 7265886.1 | 506.3 | 425.2 |
| MK-10-84 | 428913.4 | 7261882.6 | 148.7 | 83.8 |
| MK-10-85 | 428311.9 | 7262031.9 | 149.4 | 101.5 |
| MK-10-86 | 428311.7 | 7262032.2 | 145.3 | 28.6 |
| MK-10-87 | 429487.9 | 7265963.0 | 485.8 | 335.3 |
| MK-10-88 | 429672.6 | 7265025.6 | 407.1 | 385.7 |
| MK-10-89 | 428955.4 | 7265656.3 | 453.5 | 259.7 |
| MK-10-90 | 428888.3 | 7265514.4 | 451.0 | 265.8 |
| MK-10-91 | 428914.4 | 7265654.8 | 448.2 | 266.1 |
| 252 |
| August 2011 Summary Report On The Livengood Project, Tolovana District, Alaska |
| MK-10-92 | 429033.1 | 7265362.2 | 452.8 | 346.6 |
| MK-10-93 | 430614.0 | 7266334.0 | 542.0 | 50.3 |
| MK-10-94 | 430422.0 | 7268040.0 | 330.0 | 50.3 |
| MK-10-95 | 432959.0 | 7267959.0 | 500.0 | 50.9 |
| MK-10-96 | 428956.0 | 7264205.0 | 402.0 | 50.3 |
| MK-10-97 | 431639.0 | 7263901.0 | 238.0 | 50.3 |
| MK-10-98 | 434560.0 | 7269453.0 | 405.0 | 50.6 |
| MK-10-99 | 435128.0 | 7267577.0 | 514.0 | 50.3 |
| MK-10-100 | 433956.0 | 7267429.0 | 326.0 | 67.7 |
| MK-10-101 | 434228.0 | 7267434.0 | 338.0 | 136.1 |
| MK-10-102 | 433966.0 | 7267416.0 | 332.0 | 169.6 |
| MK-11-103 | 428885.2 | 7265133.6 | 418.8 | 195.2 |
| MK-11-104 | 428887.0 | 7265208.2 | 427.1 | 64.2 |
| MK-11-105 | 428817.7 | 7265350.5 | 426.0 | 118.6 |
| MK-11-106 | 434698.0 | 7267517.0 | 440.0 | 152.4 |
| MK-11-107 | 434331.0 | 7267664.0 | 384.0 | 100.6 |
| MK-11-108 | 428887.0 | 7265208.2 | 427.1 | 597.7 |
| MK-11-109 | 436754.0 | 7272103.0 | 368.0 | 152.4 |
| MK-11-110 | 428817.7 | 7265350.5 | 426.0 | 244.8 |
| MK-11-111 | 437040.0 | 7272320.0 | 366.0 | 62.2 |
| MK-11-112 | 437312.0 | 7272477.0 | 392.0 | 43.6 |
| MK-11-113 | 436623.0 | 7272244.0 | 364.0 | 131.1 |
| MK-11-114 | 429818.7 | 7265968.1 | 517.2 | 370.7 |
| MK-11-115 | 436478.0 | 7272399.0 | 359.4 | 19.8 |
| MK-11-116 | 429030.9 | 7265129.2 | 434.2 | 540.7 |
| MK-11-117 | 436899.0 | 7271974.0 | 362.4 | 50.4 |
| MK-11-118 | 436531.0 | 7272651.0 | 359.1 | 102.6 |
| MK-11-119 | 429813.0 | 7267092.0 | 382.2 | 51.8 |
| MK-11-120 | 429852.0 | 7266980.0 | 402.1 | 198.1 |
| 253 |
| August 2011 Summary Report On The Livengood Project, Tolovana District, Alaska |
| MK-11-121 | 429008.8 | 7265573.7 | 467.8 | 219.6 |
| MK-11-122 | 430298.0 | 7267162.0 | 439.1 | 49.7 |
| MK-11-123 | 430442.0 | 7266893.0 | 471.4 | 223.1 |
| MK-11-124 | 428625.2 | 7265315.0 | 406.5 | 250.1 |
| MK-11-125 | 430148.0 | 7268940.0 | 265.0 | 201.2 |
| MK-BH-001 | 429706.8 | 7265843.1 | 505.3 | 4.6 |
| MK-BH-002 | 429704.9 | 7265842.5 | 506.1 | 4.6 |
| MK-BH-003 | 429697.4 | 7265842.5 | 506.1 | 4.6 |
| MK-BH-004 | 429694.3 | 7265842.6 | 505.6 | 4.6 |
| MK-BH-005 | 429705.9 | 7265839.9 | 505.3 | 4.6 |
| MK-BH-006 | 429703.4 | 7265839.8 | 504.8 | 4.6 |
| MK-BH-007 | 429699.7 | 7265840.2 | 505.9 | 4.6 |
| MK-BH-008 | 429696.3 | 7265840.4 | 506.3 | 4.6 |
| MK-BH-009 | 429657.6 | 7265840.3 | 505.9 | 4.6 |
| MK-BH-010 | 429654.5 | 7265840.3 | 507.0 | 4.6 |
| MK-BH-011 | 429648.1 | 7265839.9 | 507.0 | 4.6 |
| MK-BH-012 | 429644.6 | 7265839.4 | 506.6 | 4.6 |
| MK-BH-013 | 429656.6 | 7265837.5 | 506.0 | 4.6 |
| MK-BH-014 | 429653.5 | 7265837.1 | 507.2 | 4.6 |
| MK-BH-015 | 429649.9 | 7265836.6 | 506.8 | 4.6 |
| MK-BH-016 | 429646.7 | 7265836.4 | 506.9 | 4.6 |
| MK-MS-001 | 429619.5 | 7265836.3 | 507.9 | 10.7 |
| MK-MS-002 | 429629.0 | 7265837.9 | 508.1 | 10.7 |
| MK-MS-003 | 429638.8 | 7265840.0 | 507.6 | 10.7 |
| MK-MS-004 | 429648.7 | 7265841.3 | 507.6 | 10.7 |
| MK-MS-005 | 429658.4 | 7265842.6 | 507.6 | 10.7 |
| MK-MS-006 | 429668.2 | 7265843.7 | 508.1 | 10.7 |
| MK-MS-007 | 429678.0 | 7265843.8 | 507.6 | 10.7 |
| MK-MS-008 | 429688.0 | 7265843.0 | 508.4 | 10.7 |
| 254 |
| August 2011 Summary Report On The Livengood Project, Tolovana District, Alaska |
| MK-MS-009 | 429697.9 | 7265843.6 | 507.8 | 10.7 |
| MK-MS-010 | 429707.3 | 7265843.1 | 507.5 | 10.7 |
| MK-MS-011 | 429717.4 | 7265842.9 | 507.3 | 10.7 |
| MK-MS-012 | 429727.5 | 7265842.8 | 506.6 | 10.7 |
| MK-MS-013 | 429737.3 | 7265842.5 | 506.3 | 10.7 |
| MK-RC-0001 | 428996.0 | 7265778.0 | 449.0 | 321.6 |
| MK-RC-0002 | 429001.8 | 7265854.5 | 426.1 | 335.3 |
| MK-RC-0003 | 428703.2 | 7265998.5 | 335.9 | 222.5 |
| MK-RC-0004 | 428612.0 | 7265921.0 | 343.5 | 274.0 |
| MK-RC-0005 | 428561.8 | 7265841.5 | 350.0 | 269.8 |
| MK-RC-0006 | 429045.7 | 7265695.5 | 460.7 | 353.6 |
| MK-RC-0007 | 428846.0 | 7265843.0 | 423.6 | 286.5 |
| MK-RC-0008 | 428925.0 | 7265691.6 | 445.9 | 213.4 |
| MK-RC-0009 | 428997.9 | 7265632.1 | 456.5 | 246.9 |
| MK-RC-0010 | 428547.7 | 7265470.9 | 393.2 | 240.8 |
| MK-RC-0011 | 428925.7 | 7265626.3 | 448.0 | 225.6 |
| MK-RC-0012 | 428997.0 | 7265544.7 | 459.5 | 307.9 |
| MK-RC-0013 | 428624.2 | 7265480.1 | 403.2 | 225.6 |
| MK-RC-0014 | 428176.9 | 7265590.7 | 357.3 | 217.9 |
| MK-RC-0015 | 428323.1 | 7265696.5 | 349.2 | 195.1 |
| MK-RC-0016 | 428319.5 | 7265542.5 | 367.7 | 134.1 |
| MK-RC-0017 | 428779.1 | 7265774.0 | 423.2 | 297.2 |
| MK-RC-0018 | 428710.9 | 7265834.0 | 396.9 | 252.4 |
| MK-RC-0019 | 428550.0 | 7265925.0 | 329.2 | 54.9 |
| MK-RC-0020 | 428549.7 | 7265909.8 | 331.5 | 213.4 |
| MK-RC-0021 | 428470.0 | 7265852.1 | 330.5 | 213.4 |
| MK-RC-0022 | 428847.9 | 7265920.7 | 399.8 | 280.4 |
| MK-RC-0023 | 428849.3 | 7265622.6 | 437.7 | 288.0 |
| MK-RC-0024 | 428697.8 | 7265630.0 | 413.9 | 207.3 |
| 255 |
| August 2011 Summary Report On The Livengood Project, Tolovana District, Alaska |
| MK-RC-0025 | 428920.9 | 7265909.1 | 404.5 | 213.4 |
| MK-RC-0026 | 428622.9 | 7265760.0 | 385.8 | 167.6 |
| MK-RC-0027 | 428559.1 | 7265703.8 | 381.6 | 131.1 |
| MK-RC-0028 | 428844.5 | 7266105.7 | 339.4 | 93.0 |
| MK-RC-0029 | 429057.9 | 7265856.7 | 432.5 | 256.0 |
| MK-RC-0030 | 428777.2 | 7265548.2 | 425.8 | 243.8 |
| MK-RC-0031 | 428926.5 | 7265548.0 | 447.2 | 303.3 |
| MK-RC-0032 | 428554.9 | 7265783.1 | 363.5 | 91.4 |
| MK-RC-0033 | 428849.4 | 7265566.5 | 437.1 | 335.3 |
| MK-RC-0034 | 429073.8 | 7265553.4 | 467.9 | 365.8 |
| MK-RC-0035 | 429071.9 | 7265468.1 | 467.9 | 330.7 |
| MK-RC-0036 | 429001.6 | 7265463.4 | 453.2 | 257.9 |
| MK-RC-0037 | 429149.4 | 7265558.7 | 483.5 | 295.7 |
| MK-RC-0038 | 428784.1 | 7265918.7 | 392.5 | 234.7 |
| MK-RC-0039 | 428999.1 | 7265410.2 | 450.7 | 277.4 |
| MK-RC-0040 | 428927.4 | 7265860.4 | 419.0 | 335.3 |
| MK-RC-0041 | 428850.7 | 7265504.1 | 437.5 | 262.1 |
| MK-RC-0042 | 428778.6 | 7265473.1 | 425.9 | 274.3 |
| MK-RC-0043 | 428940.3 | 7265472.3 | 446.4 | 265.2 |
| MK-RC-0044 | 428698.1 | 7265487.5 | 417.6 | 237.7 |
| MK-RC-0045 | 428922.0 | 7265395.5 | 441.1 | 317.0 |
| MK-RC-0046 | 429084.0 | 7265622.3 | 470.5 | 323.1 |
| MK-RC-0047 | 429152.6 | 7265477.7 | 475.4 | 263.6 |
| MK-RC-0047CT | 429152.6 | 7265477.7 | 475.4 | 326.8 |
| MK-RC-0048 | 429144.0 | 7265399.3 | 466.9 | 350.5 |
| MK-RC-0049 | 428697.7 | 7265404.7 | 416.9 | 274.3 |
| MK-RC-0050 | 429225.1 | 7265481.3 | 488.5 | 266.7 |
| MK-RC-0050CT | 429225.1 | 7265481.3 | 488.5 | 350.8 |
| MK-RC-0051 | 428699.8 | 7265549.4 | 416.6 | 239.3 |
| 256 |
| August 2011 Summary Report On The Livengood Project, Tolovana District, Alaska |
| MK-RC-0052 | 428625.5 | 7265847.8 | 366.6 | 249.9 |
| MK-RC-0053 | 428544.0 | 7265550.0 | 393.2 | 204.2 |
| MK-RC-0054 | 429297.2 | 7265483.5 | 493.4 | 341.4 |
| MK-RC-0055 | 428706.4 | 7265926.9 | 368.9 | 262.1 |
| MK-RC-0056 | 428477.4 | 7265559.9 | 384.5 | 195.1 |
| MK-RC-0057 | 429374.3 | 7265486.8 | 504.8 | 304.8 |
| MK-RC-0058 | 428700.1 | 7266242.3 | 334.3 | 213.4 |
| MK-RC-0059 | 429450.2 | 7265478.3 | 511.6 | 262.1 |
| MK-RC-0060 | 429077.1 | 7265328.3 | 453.5 | 336.8 |
| MK-RC-0061 | 429225.8 | 7265326.4 | 468.3 | 302.1 |
| MK-RC-0062 | 429150.2 | 7265323.5 | 460.5 | 312.4 |
| MK-RC-0063 | 429299.6 | 7265329.0 | 474.4 | 359.7 |
| MK-RC-0064 | 429072.4 | 7265252.3 | 445.3 | 363.3 |
| MK-RC-0065 | 429302.8 | 7265425.0 | 484.8 | 346.0 |
| MK-RC-0066 | 429156.3 | 7265243.1 | 452.1 | 304.8 |
| MK-RC-0067 | 429155.3 | 7265174.8 | 448.2 | 349.0 |
| MK-RC-0068 | 429227.3 | 7265403.3 | 476.2 | 396.2 |
| MK-RC-0069 | 429147.5 | 7265098.4 | 434.7 | 256.0 |
| MK-RC-0070 | 429452.1 | 7265548.9 | 509.9 | 378.0 |
| MK-RC-0071 | 428928.3 | 7265326.2 | 435.5 | 301.8 |
| MK-RC-0072 | 428997.9 | 7265323.8 | 444.9 | 262.1 |
| MK-RC-0073 | 429521.6 | 7265549.7 | 513.2 | 335.3 |
| MK-RC-0074 | 428474.0 | 7265632.5 | 377.3 | 158.5 |
| MK-RC-0075 | 428477.2 | 7265481.9 | 386.5 | 243.8 |
| MK-RC-0076 | 429151.1 | 7265033.4 | 425.5 | 285.0 |
| MK-RC-0077 | 428475.9 | 7265930.2 | 312.1 | 152.4 |
| MK-RC-0078 | 429225.9 | 7265026.6 | 428.2 | 298.7 |
| MK-RC-0079 | 428399.4 | 7265859.2 | 320.0 | 161.5 |
| MK-RC-0080 | 428626.7 | 7265396.6 | 402.6 | 265.2 |
| 257 |
| August 2011 Summary Report On The Livengood Project, Tolovana District, Alaska |
| MK-RC-0081 | 428841.6 | 7265250.0 | 419.9 | 243.8 |
| MK-RC-0082 | 429073.6 | 7265037.5 | 421.6 | 317.0 |
| MK-RC-0083 | 428911.1 | 7265169.4 | 420.6 | 300.2 |
| MK-RC-0084 | 429224.5 | 7265250.7 | 458.2 | 374.9 |
| MK-RC-0085 | 429599.1 | 7265554.4 | 510.8 | 326.1 |
| MK-RC-0086 | 429377.9 | 7265391.3 | 491.4 | 36.6 |
| MK-RC-0087 | 429148.5 | 7264949.8 | 417.2 | 254.5 |
| MK-RC-0088 | 429003.4 | 7265008.7 | 413.5 | 115.8 |
| MK-RC-0089 | 429003.4 | 7265008.7 | 413.5 | 374.9 |
| MK-RC-0090 | 429070.1 | 7264946.9 | 413.3 | 201.2 |
| MK-RC-0091 | 429007.1 | 7264948.0 | 407.4 | 283.5 |
| MK-RC-0092 | 429377.9 | 7265391.3 | 491.4 | 344.4 |
| MK-RC-0093 | 429226.1 | 7265103.9 | 439.0 | 323.1 |
| MK-RC-0094 | 429747.5 | 7265480.3 | 497.8 | 329.2 |
| MK-RC-0095 | 429595.8 | 7266007.1 | 500.0 | 268.2 |
| MK-RC-0096 | 428780.9 | 7265217.9 | 410.0 | 262.1 |
| MK-RC-0097 | 429897.4 | 7265464.7 | 447.7 | 237.7 |
| MK-RC-0098 | 428925.0 | 7265112.1 | 415.3 | 219.5 |
| MK-RC-0099 | 429296.7 | 7264946.8 | 419.0 | 268.2 |
| MK-RC-0100 | 429214.0 | 7264951.7 | 418.3 | 274.3 |
| MK-RC-0101 | 429294.0 | 7265027.9 | 429.7 | 295.7 |
| MK-RC-0102 | 429296.3 | 7265176.2 | 453.0 | 274.3 |
| MK-RC-0103 | 429229.1 | 7265170.7 | 449.2 | 306.6 |
| MK-RC-0103a | 429225.0 | 7265175.0 | 449.9 | 6.1 |
| MK-RC-0104 | 429159.8 | 7264696.2 | 386.6 | 128.0 |
| MK-RC-0105 | 429138.4 | 7264694.5 | 387.8 | 190.5 |
| MK-RC-0106 | 429071.2 | 7265245.2 | 445.9 | 335.3 |
| MK-RC-0107 | 429296.0 | 7264725.1 | 378.3 | 224.0 |
| MK-RC-0108 | 429296.7 | 7265103.1 | 442.4 | 271.3 |
| 258 |
| August 2011 Summary Report On The Livengood Project, Tolovana District, Alaska |
| MK-RC-0109 | 428934.3 | 7265034.7 | 409.7 | 285.0 |
| MK-RC-0110 | 428996.0 | 7265174.3 | 430.5 | 355.1 |
| MK-RC-0111 | 429446.9 | 7265637.8 | 504.2 | 303.6 |
| MK-RC-0112 | 429376.1 | 7265625.5 | 500.4 | 356.6 |
| MK-RC-0113 | 429296.7 | 7265617.7 | 493.5 | 334.4 |
| MK-RC-0114 | 429229.3 | 7265624.3 | 486.7 | 307.9 |
| MK-RC-0115 | 428694.1 | 7264869.6 | 369.1 | 264.0 |
| MK-RC-0116 | 428636.1 | 7264959.9 | 369.9 | 295.7 |
| MK-RC-0117 | 428775.0 | 7265085.7 | 397.6 | 182.9 |
| MK-RC-0118 | 428761.0 | 7264784.0 | 370.4 | 289.6 |
| MK-RC-0119 | 428774.3 | 7265081.3 | 397.7 | 225.6 |
| MK-RC-0120 | 428610.5 | 7264794.5 | 353.3 | 313.9 |
| MK-RC-0121 | 428693.6 | 7265241.3 | 401.2 | 231.6 |
| MK-RC-0122 | 428773.4 | 7264966.5 | 385.0 | 295.7 |
| MK-RC-0123 | 428694.8 | 7265247.4 | 401.6 | 332.8 |
| MK-RC-0124 | 428627.5 | 7265097.7 | 380.2 | 301.8 |
| MK-RC-0125 | 428764.9 | 7265308.5 | 414.6 | 306.9 |
| MK-RC-0126 | 428851.3 | 7265319.4 | 425.8 | 263.6 |
| MK-RC-0127 | 428617.2 | 7265252.4 | 391.9 | 307.9 |
| MK-RC-0128 | 429302.2 | 7265768.1 | 476.9 | 320.0 |
| MK-RC-0129 | 428846.6 | 7265012.9 | 398.6 | 262.1 |
| MK-RC-0130 | 429150.7 | 7265775.7 | 462.4 | 286.5 |
| MK-RC-0131 | 428848.7 | 7264870.7 | 386.8 | 260.6 |
| MK-RC-0132 | 428928.8 | 7264939.7 | 401.0 | 221.0 |
| MK-RC-0133 | 428845.8 | 7265095.3 | 407.4 | 327.7 |
| MK-RC-0134 | 428627.3 | 7265628.6 | 404.3 | 182.9 |
| MK-RC-0135 | 429376.7 | 7265704.6 | 492.0 | 301.8 |
| MK-RC-0136 | 428854.1 | 7265401.7 | 432.0 | 297.2 |
| MK-RC-0137 | 429466.4 | 7265926.7 | 482.7 | 280.4 |
| 259 |
| August 2011 Summary Report On The Livengood Project, Tolovana District, Alaska |
| MK-RC-0138 | 428992.3 | 7265089.2 | 421.8 | 269.8 |
| MK-RC-0139 | 429368.1 | 7265988.9 | 456.9 | 289.6 |
| MK-RC-0140 | 428700.3 | 7265164.6 | 396.1 | 320.0 |
| MK-RC-0141 | 429304.2 | 7265999.5 | 443.2 | 198.1 |
| MK-RC-0142 | 428686.4 | 7265103.8 | 388.4 | 280.4 |
| MK-RC-0143 | 430273.2 | 7266146.2 | 542.4 | 301.8 |
| MK-RC-0144 | 429677.2 | 7265407.2 | 514.0 | 310.9 |
| MK-RC-0145 | 430421.0 | 7266012.0 | 477.8 | 311.5 |
| MK-RC-0146 | 429818.9 | 7265396.5 | 473.5 | 256.0 |
| MK-RC-0147 | 429245.4 | 7264877.0 | 408.2 | 350.5 |
| MK-RC-0148 | 430417.4 | 7266142.6 | 504.5 | 307.9 |
| MK-RC-0149 | 429826.0 | 7265554.9 | 464.1 | 170.7 |
| MK-RC-0150 | 429380.0 | 7264892.0 | 412.0 | 193.6 |
| MK-RC-0151 | 429673.3 | 7265549.2 | 504.3 | 266.7 |
| MK-RC-0152 | 430124.4 | 7265924.4 | 486.8 | 306.9 |
| MK-RC-0153 | 429372.8 | 7265019.2 | 429.5 | 262.1 |
| MK-RC-0154 | 429373.2 | 7265177.0 | 454.7 | 344.4 |
| MK-RC-0155 | 429984.4 | 7265930.1 | 483.4 | 300.2 |
| MK-RC-0156 | 429670.2 | 7265842.5 | 503.9 | 317.0 |
| MK-RC-0157 | 429374.2 | 7265250.9 | 466.4 | 301.8 |
| MK-RC-0158 | 429672.0 | 7265915.8 | 507.8 | 324.6 |
| MK-RC-0159 | 429825.1 | 7265847.9 | 491.7 | 272.8 |
| MK-RC-0160 | 429673.9 | 7266069.5 | 503.6 | 317.0 |
| MK-RC-0161 | 429458.4 | 7264796.0 | 389.3 | 242.9 |
| MK-RC-0162 | 429524.4 | 7266077.7 | 480.7 | 263.6 |
| MK-RC-0163 | 429376.4 | 7264799.7 | 389.8 | 325.2 |
| MK-RC-0164 | 429302.0 | 7264795.5 | 391.9 | 334.7 |
| MK-RC-0165 | 429746.2 | 7265846.5 | 500.6 | 249.9 |
| MK-RC-0166 | 429740.3 | 7265918.0 | 509.2 | 240.8 |
| 260 |
| August 2011 Summary Report On The Livengood Project, Tolovana District, Alaska |
| MK-RC-0167 | 429676.3 | 7265703.1 | 497.8 | 286.5 |
| MK-RC-0168 | 429356.5 | 7264949.1 | 419.6 | 312.4 |
| MK-RC-0169 | 430124.6 | 7266078.6 | 531.5 | 339.9 |
| MK-RC-0170 | 429526.0 | 7265861.5 | 494.4 | 301.8 |
| MK-RC-0171 | 429454.4 | 7264940.2 | 413.5 | 276.8 |
| MK-RC-0172 | 429602.6 | 7264877.4 | 391.8 | 298.7 |
| MK-RC-0173 | 429520.3 | 7264950.7 | 412.1 | 242.3 |
| MK-RC-0174 | 429602.4 | 7265860.4 | 502.1 | 321.6 |
| MK-RC-0175 | 428413.1 | 7265552.1 | 377.1 | 198.1 |
| MK-RC-0176 | 429447.4 | 7265018.4 | 430.5 | 248.4 |
| MK-RC-0177 | 429969.4 | 7266054.9 | 503.0 | 278.9 |
| MK-RC-0178 | 429302.7 | 7264870.5 | 407.2 | 317.0 |
| MK-RC-0179 | 428545.1 | 7265408.8 | 393.2 | 73.2 |
| MK-RC-0180 | 429670.9 | 7265996.6 | 507.3 | 347.5 |
| MK-RC-0181 | 429372.5 | 7265122.5 | 446.1 | 262.1 |
| MK-RC-0182 | 428817.4 | 7265677.6 | 433.0 | 274.3 |
| MK-RC-0183 | 429301.9 | 7265247.2 | 463.9 | 332.2 |
| MK-RC-0184 | 428545.1 | 7265408.8 | 393.2 | 268.2 |
| MK-RC-0185 | 429599.0 | 7266015.8 | 499.6 | 289.6 |
| MK-RC-0186 | 429176.4 | 7265350.5 | 465.0 | 365.8 |
| MK-RC-0187 | 429971.6 | 7265854.6 | 470.5 | 317.6 |
| MK-RC-0188 | 429602.9 | 7266075.6 | 496.2 | 268.2 |
| MK-RC-0189 | 429451.7 | 7265098.5 | 440.8 | 233.5 |
| MK-RC-0190 | 429889.9 | 7265852.2 | 483.6 | 286.5 |
| MK-RC-0191 | 430205.1 | 7265554.9 | 391.2 | 170.7 |
| MK-RC-0192 | 429522.7 | 7265104.6 | 435.3 | 300.5 |
| MK-RC-0193 | 430351.3 | 7265706.2 | 413.7 | 368.8 |
| MK-RC-0194 | 429524.1 | 7265025.7 | 425.6 | 251.5 |
| MK-RC-0195 | 430349.7 | 7266234.9 | 529.9 | 319.7 |
| 261 |
| August 2011 Summary Report On The Livengood Project, Tolovana District, Alaska |
| MK-RC-0196 | 430493.3 | 7265843.7 | 427.6 | 359.7 |
| MK-RC-0197 | 428480.5 | 7265397.6 | 385.6 | 313.9 |
| MK-RC-0198 | 430637.3 | 7265918.6 | 451.0 | 335.3 |
| MK-RC-0199 | 430343.5 | 7266153.7 | 523.3 | 341.4 |
| MK-RC-0200 | 428400.6 | 7265467.4 | 377.6 | 277.4 |
| MK-RC-0201 | 429533.4 | 7265188.3 | 450.5 | 298.7 |
| MK-RC-0202 | 430278.3 | 7266087.8 | 539.3 | 365.8 |
| MK-RC-0203 | 430501.2 | 7265921.9 | 443.5 | 365.8 |
| MK-RC-0204 | 429597.9 | 7265251.3 | 455.7 | 213.4 |
| MK-RC-0205 | 429453.0 | 7265177.9 | 452.6 | 253.0 |
| MK-RC-0206 | 429829.0 | 7265995.5 | 508.0 | 402.3 |
| MK-RC-0207 | 429974.1 | 7265999.1 | 500.8 | 399.3 |
| MK-RC-0208 | 429525.2 | 7265255.0 | 466.0 | 262.1 |
| MK-RC-0209 | 429900.3 | 7265925.7 | 492.0 | 408.4 |
| MK-RC-0210 | 429448.8 | 7265248.2 | 467.9 | 278.9 |
| MK-RC-0211 | 429754.4 | 7266003.2 | 510.6 | 402.3 |
| MK-RC-0212 | 429598.3 | 7265192.7 | 441.6 | 213.4 |
| MK-RC-0213 | 429901.2 | 7266006.1 | 504.1 | 411.5 |
| MK-RC-0214 | 429599.7 | 7265094.7 | 425.0 | 201.2 |
| MK-RC-0215 | 429756.2 | 7266074.4 | 505.8 | 396.2 |
| MK-RC-0216 | 429680.1 | 7265175.5 | 427.2 | 216.4 |
| MK-RC-0217 | 429818.7 | 7265922.5 | 501.7 | 396.2 |
| MK-RC-0218 | 429600.5 | 7265023.7 | 413.9 | 224.0 |
| MK-RC-0219 | 429598.1 | 7264948.9 | 403.5 | 356.6 |
| MK-RC-0220 | 429602.7 | 7265774.1 | 501.1 | 396.2 |
| MK-RC-0221 | 430029.1 | 7265465.0 | 401.8 | 353.6 |
| MK-RC-0222 | 429530.8 | 7265926.4 | 492.4 | 399.3 |
| MK-RC-0223 | 429678.5 | 7265773.4 | 499.5 | 341.4 |
| MK-RC-0224 | 429467.2 | 7265932.5 | 481.7 | 376.4 |
| 262 |
| August 2011 Summary Report On The Livengood Project, Tolovana District, Alaska |
| MK-RC-0225 | 429968.1 | 7265308.5 | 397.6 | 347.5 |
| MK-RC-0226 | 429747.1 | 7265700.4 | 485.8 | 341.4 |
| MK-RC-0227 | 429898.7 | 7265163.7 | 386.4 | 256.0 |
| MK-RC-0228 | 429527.7 | 7266160.8 | 463.3 | 254.5 |
| MK-RC-0229 | 429605.8 | 7265704.7 | 503.3 | 237.7 |
| MK-RC-0230 | 429743.3 | 7265023.7 | 391.3 | 317.0 |
| MK-RC-0231 | 429457.4 | 7266073.4 | 466.3 | 335.3 |
| MK-RC-0232 | 429000.6 | 7264436.4 | 368.3 | 243.8 |
| MK-RC-0233 | 429454.4 | 7266000.8 | 473.3 | 350.5 |
| MK-RC-0234 | 429606.5 | 7265700.9 | 503.7 | 423.7 |
| MK-RC-0235 | 428953.9 | 7264668.7 | 383.4 | 323.1 |
| MK-RC-0236 | 429600.7 | 7265621.6 | 505.8 | 396.2 |
| MK-RC-0237 | 429519.4 | 7265999.7 | 487.5 | 396.2 |
| MK-RC-0238 | 428998.1 | 7264724.1 | 390.1 | 271.3 |
| MK-RC-0239 | 429673.2 | 7265628.3 | 497.4 | 426.7 |
| MK-RC-0240 | 429598.0 | 7266144.8 | 480.2 | 320.0 |
| MK-RC-0241 | 428776.1 | 7264506.8 | 363.6 | 292.6 |
| MK-RC-0242 | 429750.3 | 7265775.3 | 492.5 | 426.7 |
| MK-RC-0243 | 430040.6 | 7266070.3 | 506.2 | 310.9 |
| MK-RC-0244 | 429673.5 | 7266147.0 | 483.8 | 396.2 |
| MK-RC-0245 | 431101.9 | 7266321.8 | 539.8 | 410.0 |
| MK-RC-0246 | 429753.7 | 7265626.2 | 481.0 | 91.4 |
| MK-RC-0247 | 429745.1 | 7266148.6 | 484.1 | 271.3 |
| MK-RC-0248 | 430949.3 | 7266218.9 | 548.1 | 371.9 |
| MK-RC-0249 | 429753.7 | 7265624.7 | 481.0 | 402.3 |
| MK-RC-0250 | 429824.2 | 7265702.2 | 471.2 | 353.6 |
| MK-RC-0251 | 429823.8 | 7266148.9 | 485.3 | 219.5 |
| MK-RC-0252 | 430832.7 | 7266113.1 | 533.2 | 361.2 |
| MK-RC-0253 | 429824.3 | 7266147.6 | 485.5 | 353.6 |
| 263 |
| August 2011 Summary Report On The Livengood Project, Tolovana District, Alaska |
| MK-RC-0254 | 429822.1 | 7265782.8 | 485.0 | 429.8 |
| MK-RC-0255 | 430200.3 | 7266241.7 | 524.1 | 286.5 |
| MK-RC-0256 | 429525.6 | 7265702.6 | 503.9 | 426.7 |
| MK-RC-0257 | 429527.0 | 7265767.5 | 499.1 | 274.3 |
| MK-RC-0258 | 429824.1 | 7266074.1 | 502.8 | 374.9 |
| MK-RC-0259 | 429742.9 | 7265548.7 | 493.0 | 315.5 |
| MK-RC-0260 | 430126.0 | 7266147.3 | 526.0 | 396.2 |
| MK-RC-0261 | 430283.4 | 7266008.0 | 520.0 | 390.1 |
| MK-RC-0262 | 429751.0 | 7265403.2 | 489.9 | 378.0 |
| MK-RC-0263 | 430200.3 | 7266141.5 | 544.8 | 378.0 |
| MK-RC-0264 | 429518.5 | 7265490.2 | 519.8 | 423.7 |
| MK-RC-0265 | 430418.9 | 7266070.5 | 491.3 | 396.2 |
| MK-RC-0266 | 430339.7 | 7266001.5 | 500.4 | 365.8 |
| MK-RC-0267 | 429526.7 | 7265759.7 | 499.1 | 365.8 |
| MK-RC-0268 | 430510.7 | 7266078.8 | 478.6 | 365.8 |
| MK-RC-0269 | 429450.3 | 7265873.3 | 484.1 | 371.9 |
| MK-RC-0270 | 429597.3 | 7265932.1 | 501.6 | 152.4 |
| MK-RC-0271 | 430492.2 | 7266001.6 | 461.5 | 280.4 |
| MK-RC-0272 | 430345.3 | 7265919.3 | 471.5 | 387.1 |
| MK-RC-0273 | 430054.9 | 7266004.3 | 505.1 | 338.3 |
| MK-RC-0274 | 430421.8 | 7265922.9 | 455.7 | 379.5 |
| MK-RC-0275 | 430353.1 | 7266078.4 | 512.4 | 320.0 |
| MK-RC-0276 | 428623.1 | 7265320.5 | 397.1 | 310.9 |
| MK-RC-0277 | 430957.4 | 7265913.3 | 496.0 | 304.8 |
| MK-RC-0278 | 428775.6 | 7265175.1 | 406.6 | 243.8 |
| MK-RC-0279 | 428095.3 | 7265434.1 | 334.7 | 332.2 |
| MK-RC-0280 | 429671.3 | 7265349.3 | 493.3 | 359.7 |
| MK-RC-0281 | 427898.2 | 7265539.1 | 291.2 | 286.5 |
| MK-RC-0282 | 431106.5 | 7265779.4 | 479.7 | 347.5 |
| 264 |
| August 2011 Summary Report On The Livengood Project, Tolovana District, Alaska |
| MK-RC-0283 | 428030.5 | 7265567.3 | 317.6 | 214.9 |
| MK-RC-0284 | 429746.6 | 7265331.4 | 471.4 | 396.2 |
| MK-RC-0285 | 430049.7 | 7266159.3 | 506.9 | 353.6 |
| MK-RC-0286 | 429826.8 | 7265465.4 | 469.7 | 326.1 |
| MK-RC-0287 | 428403.3 | 7265395.7 | 375.9 | 274.3 |
| MK-RC-0288 | 430273.3 | 7266233.5 | 533.4 | 396.2 |
| MK-RC-0289 | 428846.8 | 7266470.7 | 358.1 | 355.1 |
| MK-RC-0290 | 430052.2 | 7265866.0 | 468.5 | 350.5 |
| MK-RC-0291 | 429755.8 | 7264872.8 | 370.1 | 234.7 |
| MK-RC-0292 | 429379.5 | 7266154.9 | 431.9 | 187.4 |
| MK-RC-0293 | 429603.8 | 7265476.3 | 533.6 | 396.2 |
| MK-RC-0294 | 429369.7 | 7265988.4 | 457.5 | 318.5 |
| MK-RC-0295 | 429825.0 | 7265325.0 | 451.0 | 99.1 |
| MK-RC-0296 | 429821.1 | 7265327.8 | 451.8 | 274.3 |
| MK-RC-0297 | 429377.2 | 7265928.2 | 466.8 | 314.9 |
| MK-RC-0298 | 429674.2 | 7265472.8 | 523.5 | 396.2 |
| MK-RC-0299 | 429737.4 | 7265261.5 | 443.1 | 265.2 |
| MK-RC-0300 | 429454.7 | 7266156.0 | 447.5 | 152.4 |
| MK-RC-0301 | 429682.1 | 7265237.4 | 443.1 | 222.5 |
| MK-RC-0302 | 429377.9 | 7265322.9 | 479.0 | 307.9 |
| MK-RC-0303 | 429378.6 | 7266083.5 | 444.1 | 256.0 |
| MK-RC-0304 | 429374.2 | 7265554.1 | 503.4 | 368.8 |
| MK-RC-0305 | 429296.9 | 7265555.0 | 497.1 | 408.4 |
| MK-RC-0306 | 429151.6 | 7265705.3 | 472.8 | 416.0 |
| MK-RC-0307 | 429447.0 | 7265701.9 | 501.0 | 298.7 |
| MK-RC-0308 | 429228.1 | 7265549.5 | 490.5 | 442.0 |
| MK-RC-0309 | 429224.6 | 7265704.4 | 479.6 | 365.8 |
| MK-RC-0310 | 429373.1 | 7265859.4 | 473.6 | 402.3 |
| MK-RC-0311 | 429295.8 | 7265697.7 | 485.5 | 341.4 |
| 265 |
| August 2011 Summary Report On The Livengood Project, Tolovana District, Alaska |
| MK-RC-0312 | 429447.4 | 7265780.7 | 491.8 | 457.2 |
| MK-RC-0313 | 429376.5 | 7265777.6 | 484.0 | 432.8 |
| MK-RC-0314 | 429226.9 | 7265854.4 | 455.5 | 274.3 |
| MK-RC-0315 | 429076.7 | 7265406.0 | 461.3 | 457.2 |
| MK-RC-0316 | 429148.9 | 7265841.1 | 450.0 | 340.5 |
| MK-RC-0317 | 429009.3 | 7265932.2 | 403.2 | 280.4 |
| MK-RC-0318 | 429218.0 | 7265789.0 | 466.1 | 109.7 |
| MK-RC-0319 | 428776.7 | 7265707.9 | 426.4 | 231.6 |
| MK-RC-0320 | 429305.1 | 7266001.5 | 443.2 | 288.0 |
| MK-RC-0321 | 429220.0 | 7265787.1 | 466.1 | 457.2 |
| MK-RC-0322 | 429296.7 | 7265939.3 | 451.0 | 246.9 |
| MK-RC-0323 | 428702.0 | 7265710.2 | 414.0 | 189.0 |
| MK-RC-0324 | 428629.6 | 7265552.2 | 406.3 | 231.6 |
| MK-RC-0325 | 428623.6 | 7265693.7 | 399.2 | 158.5 |
| MK-RC-0326 | 429080.0 | 7265929.8 | 418.2 | 140.2 |
| MK-RC-0327 | 428701.8 | 7265332.9 | 408.0 | 356.6 |
| MK-RC-0328 | 429300.9 | 7265851.9 | 465.2 | 306.3 |
| MK-RC-0329 | 428849.2 | 7265175.1 | 414.7 | 368.8 |
| MK-RC-0330 | 429013.4 | 7265238.8 | 439.8 | 365.8 |
| MK-RC-0331 | 429285.9 | 7266075.6 | 428.3 | 314.3 |
| MK-RC-0332 | 428552.3 | 7264733.1 | 342.7 | 384.0 |
| MK-RC-0333 | 428550.8 | 7265028.8 | 367.0 | 256.0 |
| MK-RC-0334 | 428549.9 | 7264869.9 | 351.6 | 327.7 |
| MK-RC-0335 | 428550.7 | 7265175.6 | 378.1 | 243.8 |
| MK-RC-0336 | 428701.0 | 7264732.7 | 362.9 | 91.4 |
| MK-RC-0337 | 428475.0 | 7264953.2 | 350.8 | 332.2 |
| MK-RC-0338 | 428478.1 | 7264804.0 | 338.4 | 353.6 |
| MK-RC-0339 | 428701.0 | 7264734.7 | 362.9 | 324.6 |
| MK-RC-0340 | 429224.6 | 7266071.6 | 419.8 | 201.2 |
| 266 |
| August 2011 Summary Report On The Livengood Project, Tolovana District, Alaska |
| MK-RC-0341 | 428399.8 | 7265028.2 | 347.4 | 323.1 |
| MK-RC-0342 | 428700.6 | 7264951.4 | 375.9 | 262.4 |
| MK-RC-0343 | 429225.8 | 7265930.3 | 442.3 | 231.6 |
| MK-RC-0344 | 428479.2 | 7265100.9 | 363.1 | 323.1 |
| MK-RC-0345 | 428622.5 | 7264882.6 | 360.8 | 356.0 |
| MK-RC-0346 | 428848.9 | 7264727.6 | 378.2 | 265.2 |
| MK-RC-0347 | 428626.7 | 7265029.0 | 375.9 | 249.9 |
| MK-RC-0348 | 428626.6 | 7265027.0 | 375.0 | 338.3 |
| MK-RC-0349 | 428626.2 | 7265178.0 | 386.9 | 365.8 |
| MK-RC-0350 | 429153.6 | 7265923.9 | 432.6 | 259.1 |
| MK-RC-0351 | 429231.8 | 7266009.4 | 430.1 | 274.3 |
| MK-RC-0352 | 428098.7 | 7265394.7 | 335.5 | 390.1 |
| MK-RC-0353 | 428175.5 | 7265405.1 | 348.0 | 378.0 |
| MK-RC-0354 | 428476.2 | 7265335.2 | 384.8 | 320.0 |
| MK-RC-0355 | 428028.1 | 7265475.2 | 328.5 | 350.5 |
| MK-RC-0356 | 429827.0 | 7265620.6 | 467.9 | 416.0 |
| MK-RC-0357 | 429449.7 | 7265406.4 | 516.5 | 285.0 |
| MK-RC-0358 | 429900.0 | 7265704.3 | 465.3 | 277.4 |
| MK-RC-0359 | 428098.3 | 7265480.7 | 334.9 | 396.2 |
| MK-RC-0360 | 429528.5 | 7265390.1 | 527.6 | 362.7 |
| MK-RC-0361 | 429458.2 | 7265310.4 | 483.3 | 306.3 |
| MK-RC-0362 | 428176.4 | 7265476.7 | 352.2 | 286.5 |
| MK-RC-0363 | 429975.0 | 7265775.0 | 459.0 | 254.5 |
| MK-RC-0364 | 429564.6 | 7265663.0 | 511.8 | 455.7 |
| MK-RC-0365 | 429900.0 | 7265626.1 | 446.7 | 388.6 |
| MK-RC-0366 | 429269.3 | 7264982.4 | 427.2 | 414.5 |
| MK-RC-0367 | 429635.5 | 7265887.7 | 505.6 | 393.2 |
| MK-RC-0368 | 429189.6 | 7264987.9 | 427.6 | 383.4 |
| MK-RC-0369 | 429979.1 | 7265785.4 | 459.0 | 382.5 |
| 267 |
| August 2011 Summary Report On The Livengood Project, Tolovana District, Alaska |
| MK-RC-0370 | 429638.7 | 7265663.3 | 502.2 | 396.2 |
| MK-RC-0371 | 430046.2 | 7265779.7 | 447.9 | 97.5 |
| MK-RC-0372 | 429192.2 | 7265060.4 | 436.0 | 390.1 |
| MK-RC-0373 | 429489.4 | 7265739.3 | 507.1 | 402.3 |
| MK-RC-0374 | 429267.6 | 7265065.0 | 435.9 | 414.5 |
| MK-RC-0375 | 429266.2 | 7265132.1 | 445.5 | 405.4 |
| MK-RC-0376 | 429565.7 | 7265740.3 | 503.0 | 378.0 |
| MK-RC-0377 | 430046.2 | 7265779.7 | 447.9 | 192.0 |
| MK-RC-0378 | 429564.7 | 7265890.8 | 499.4 | 365.8 |
| MK-RC-0379 | 430122.9 | 7265775.4 | 444.1 | 310.9 |
| MK-RC-0380 | 429670.7 | 7264878.3 | 384.6 | 365.8 |
| MK-RC-0381 | 430122.8 | 7265852.3 | 464.6 | 365.8 |
| MK-RC-0382 | 429639.4 | 7265963.8 | 507.2 | 393.2 |
| MK-RC-0383 | 429523.0 | 7264809.1 | 395.1 | 359.7 |
| MK-RC-0384 | 428028.1 | 7266072.5 | 215.6 | 146.3 |
| MK-RC-0385 | 429636.4 | 7265809.2 | 503.1 | 353.6 |
| MK-RC-0386 | 429638.9 | 7265743.6 | 510.4 | 310.9 |
| MK-RC-0387 | 429523.0 | 7264811.0 | 395.1 | 394.7 |
| MK-RC-0388 | 427953.1 | 7266087.8 | 209.1 | 115.8 |
| MK-RC-0389 | 427949.8 | 7266079.1 | 211.8 | 109.7 |
| MK-RC-0390 | 429712.3 | 7266037.2 | 509.9 | 353.6 |
| MK-RC-0391 | 429669.1 | 7264950.8 | 398.1 | 364.2 |
| MK-RC-0392 | 428025.0 | 7266070.0 | 215.6 | 274.3 |
| MK-RC-0393 | 429640.2 | 7265516.9 | 525.0 | 384.0 |
| MK-RC-0394 | 428816.5 | 7265514.1 | 436.2 | 365.8 |
| MK-RC-0395 | 429713.4 | 7265890.9 | 514.2 | 417.6 |
| MK-RC-0396 | 429675.7 | 7264794.3 | 374.5 | 353.6 |
| MK-RC-0397 | 429719.4 | 7265961.4 | 517.0 | 353.6 |
| MK-RC-0398 | 428887.5 | 7265594.6 | 443.4 | 335.3 |
| 268 |
| August 2011 Summary Report On The Livengood Project, Tolovana District, Alaska |
| MK-RC-0399 | 429638.7 | 7266041.0 | 509.4 | 350.5 |
| MK-RC-0400 | 428817.5 | 7265586.5 | 435.2 | 335.3 |
| MK-RC-0401 | 429751.2 | 7264795.5 | 365.9 | 393.2 |
| MK-RC-0402 | 429788.0 | 7265887.2 | 503.3 | 396.2 |
| MK-RC-0403 | 428098.9 | 7266089.5 | 224.0 | 121.9 |
| MK-RC-0404 | 429743.9 | 7264958.1 | 386.3 | 335.3 |
| MK-RC-0405 | 429039.9 | 7265442.4 | 465.0 | 457.2 |
| MK-RC-0406 | 429418.3 | 7265587.8 | 511.9 | 451.1 |
| MK-RC-0407 | 429711.1 | 7265668.1 | 494.5 | 426.7 |
| MK-RC-0408 | 429602.3 | 7264727.1 | 372.3 | 365.8 |
| MK-RC-0409 | 429786.2 | 7265748.2 | 491.3 | 457.2 |
| MK-RC-0410 | 429112.8 | 7265518.7 | 476.7 | 396.2 |
| MK-RC-0411 | 429035.7 | 7265516.5 | 467.1 | 396.2 |
| MK-RC-0412 | 429819.4 | 7265251.6 | 421.5 | 359.7 |
| MK-RC-0413 | 429525.5 | 7265328.3 | 498.4 | 335.3 |
| MK-RC-0414 | 428956.7 | 7265588.9 | 458.0 | 335.3 |
| MK-RC-0415 | 430278.2 | 7265931.9 | 493.1 | 396.2 |
| MK-RC-0416 | 429821.0 | 7265186.0 | 400.9 | 335.3 |
| MK-RC-0417 | 428817.5 | 7265443.4 | 429.7 | 396.2 |
| MK-RC-0418 | 429751.2 | 7265169.9 | 413.7 | 344.4 |
| MK-RC-0419 | 430278.2 | 7265858.2 | 469.8 | 335.3 |
| MK-RC-0420 | 428002.8 | 7265716.5 | 284.4 | 155.4 |
| MK-RC-0421 | 429671.5 | 7265111.3 | 416.0 | 335.3 |
| MK-RC-0422 | 428002.8 | 7265719.8 | 284.4 | 182.9 |
| MK-RC-0423 | 430370.8 | 7265865.0 | 448.3 | 365.8 |
| MK-RC-0424 | 428737.2 | 7265580.9 | 423.6 | 335.3 |
| MK-RC-0425 | 429342.3 | 7265294.6 | 474.4 | 386.2 |
| MK-RC-0426 | 430420.3 | 7265852.0 | 445.9 | 347.5 |
| MK-RC-0427 | 428737.8 | 7265363.5 | 415.7 | 326.1 |
| 269 |
| August 2011 Summary Report On The Livengood Project, Tolovana District, Alaska |
| MK-RC-0428 | 429192.5 | 7265289.4 | 466.0 | 350.5 |
| MK-RC-0429 | 428810.0 | 7265807.6 | 429.3 | 321.6 |
| MK-RC-0430 | 429451.2 | 7266231.9 | 434.0 | 283.5 |
| MK-RC-0431 | 429408.5 | 7265203.9 | 459.0 | 359.7 |
| MK-RC-0432 | 429037.7 | 7265736.3 | 463.3 | 426.7 |
| MK-RC-0433 | 429262.4 | 7265212.6 | 457.9 | 411.5 |
| MK-RC-0434 | 429111.1 | 7265591.3 | 481.7 | 426.7 |
| MK-RC-0435 | 429514.3 | 7266226.7 | 446.4 | 356.6 |
| MK-RC-0436 | 429190.9 | 7265218.9 | 454.6 | 417.6 |
| MK-RC-0437 | 429261.3 | 7265514.5 | 497.5 | 396.2 |
| MK-RC-0438 | 429336.0 | 7265210.0 | 461.6 | 426.7 |
| MK-RC-0439 | 429592.1 | 7266208.9 | 462.9 | 335.3 |
| MK-RC-0440 | 429415.0 | 7265137.6 | 452.6 | 393.2 |
| MK-RC-0441 | 428889.0 | 7265826.4 | 433.9 | 396.2 |
| MK-RC-0442 | 429487.2 | 7266116.6 | 468.1 | 327.7 |
| MK-RC-0443 | 429489.1 | 7265142.8 | 446.8 | 396.2 |
| MK-RC-0444 | 428961.4 | 7265817.8 | 437.8 | 396.2 |
| MK-RC-0445 | 429265.1 | 7264916.2 | 416.4 | 457.2 |
| MK-RC-0446 | 429489.5 | 7266049.9 | 476.2 | 172.2 |
| MK-RC-0447 | 429259.5 | 7265435.3 | 485.3 | 438.9 |
| MK-RC-0448 | 429339.5 | 7264908.7 | 418.7 | 448.1 |
| MK-RC-0449 | 429117.9 | 7265286.4 | 454.8 | 457.2 |
| MK-RC-0450 | 429489.5 | 7266051.7 | 476.2 | 365.8 |
| MK-RC-0451 | 429411.2 | 7265963.7 | 467.5 | 335.3 |
| MK-RC-0452 | 428954.4 | 7265062.2 | 408.2 | 438.9 |
| MK-RC-0453 | 429635.6 | 7266113.6 | 494.4 | 410.0 |
| MK-RC-0454 | 429487.2 | 7265063.1 | 438.6 | 417.6 |
| MK-RC-0455 | 429100.6 | 7264993.8 | 420.7 | 317.0 |
| MK-RC-0456 | 429719.2 | 7266115.5 | 498.7 | 356.7 |
| 270 |
| August 2011 Summary Report On The Livengood Project, Tolovana District, Alaska |
| MK-RC-0457 | 429752.0 | 7264742.4 | 358.3 | 300.2 |
| MK-RC-0458 | 428885.0 | 7265285.1 | 429.6 | 423.7 |
| MK-RC-0459 | 431607.6 | 7265924.6 | 594.6 | 253.0 |
| MK-RC-0460 | 428756.5 | 7267485.7 | 192.5 | 76.2 |
| MK-RC-0460A | 428761.1 | 7267484.6 | 195.6 | 103.6 |
| MK-RC-0461 | 429749.3 | 7264742.1 | 360.5 | 29.0 |
| MK-RC-0462 | 431205.0 | 7266128.1 | 564.4 | 207.3 |
| MK-RC-0463 | 429688.8 | 7264642.4 | 349.7 | 359.7 |
| MK-RC-0464 | 429746.7 | 7264741.0 | 360.8 | 315.5 |
| MK-RC-0465 | 429785.8 | 7265818.7 | 496.4 | 365.8 |
| MK-RC-0466 | 427359.2 | 7266356.2 | 169.8 | 36.6 |
| MK-RC-0466A | 427353.2 | 7266358.2 | 171.7 | 85.3 |
| MK-RC-0467 | 429709.7 | 7265363.6 | 495.5 | 365.8 |
| MK-RC-0468 | 429411.9 | 7265065.1 | 438.3 | 432.8 |
| MK-RC-0469 | 429787.3 | 7265432.1 | 482.8 | 335.3 |
| MK-RC-0470 | 429343.2 | 7265069.6 | 442.7 | 405.4 |
| MK-RC-0471 | 429562.5 | 7266120.6 | 481.4 | 339.9 |
| MK-RC-0472 | 428561.0 | 7265325.4 | 394.1 | 225.6 |
| MK-RC-0473 | 428556.9 | 7265327.2 | 394.3 | 274.3 |
| MK-RC-0474 | 429331.6 | 7265591.0 | 500.6 | 365.8 |
| MK-RC-0475 | 429105.1 | 7265225.5 | 446.9 | 246.9 |
| MK-RC-0476 | 429033.5 | 7264988.1 | 418.2 | 256.0 |
| MK-RC-0477 | 429031.0 | 7265129.7 | 424.3 | 291.1 |
| MK-RC-0478 | 429037.7 | 7265215.1 | 442.9 | 283.5 |
| MK-RC-0479 | 429037.2 | 7265288.6 | 447.2 | 304.8 |
| MK-RC-0480 | 429071.1 | 7265174.3 | 438.8 | 265.2 |
| MK-RC-0480CT | 429071.1 | 7265174.3 | 438.8 | 553.8 |
| MK-RC-0481 | 428960.3 | 7265289.2 | 441.2 | 396.2 |
| MK-RC-0482 | 429258.9 | 7265587.5 | 504.1 | 353.6 |
| 271 |
| August 2011 Summary Report On The Livengood Project, Tolovana District, Alaska |
| MK-RC-0483 | 428854.1 | 7264651.8 | 381.0 | 378.0 |
| MK-RC-0484 | 428849.1 | 7264806.9 | 388.4 | 213.4 |
| MK-RC-0485 | 429112.7 | 7265441.8 | 471.2 | 396.2 |
| MK-RC-0486 | 429263.9 | 7266116.7 | 427.6 | 213.4 |
| MK-RC-0487 | 428771.6 | 7264647.5 | 367.5 | 352.0 |
| MK-RC-0488 | 429108.3 | 7265128.5 | 438.7 | 413.0 |
| MK-RC-0489 | 428697.9 | 7264800.5 | 369.1 | 349.0 |
| MK-RC-0490 | 429335.2 | 7266109.8 | 442.5 | 225.6 |
| MK-RC-0491 | 428625.1 | 7264653.7 | 352.5 | 407.2 |
| MK-RC-0492 | 429190.8 | 7265965.3 | 435.7 | 243.8 |
| MK-RC-0493 | 428960.6 | 7265216.9 | 436.4 | 152.4 |
| MK-RC-0494 | 428701.0 | 7264650.0 | 362.0 | 384.0 |
| MK-RC-0495 | 429259.2 | 7266039.4 | 426.2 | 283.5 |
| MK-RC-0496 | 429263.0 | 7265962.8 | 438.5 | 263.4 |
| MK-RC-0497 | 428776.3 | 7264721.7 | 378.4 | 419.1 |
| MK-RC-0498 | 428960.2 | 7265215.3 | 428.6 | 152.4 |
| MK-RC-0499 | 428400.3 | 7264944.9 | 344.7 | 353.6 |
| MK-RC-0500 | 428961.3 | 7265144.6 | 428.7 | 152.4 |
| MK-RC-0500CT | 428961.3 | 7265144.6 | 428.7 | 424.6 |
| MK-RC-0501 | 428476.3 | 7264874.0 | 345.9 | 376.4 |
| MK-RC-0502 | 428476.4 | 7265026.4 | 357.7 | 294.1 |
| MK-RC-0503 | 429337.2 | 7266043.9 | 443.3 | 243.8 |
| MK-RC-0504 | 428876.0 | 7265056.0 | 417.7 | 356.6 |
| MK-RC-0505 | 429411.5 | 7266040.4 | 461.6 | 304.8 |
| MK-RC-0506 | 428397.5 | 7264803.4 | 326.8 | 329.2 |
| MK-RC-0507 | 428814.0 | 7265293.5 | 427.3 | 234.7 |
| MK-RC-0508 | 428400.9 | 7264883.0 | 344.2 | 423.7 |
| MK-RC-0509 | 429338.4 | 7265962.1 | 463.6 | 285.0 |
| MK-RC-0510 | 428474.9 | 7264720.7 | 339.3 | 365.8 |
| 272 |
| August 2011 Summary Report On The Livengood Project, Tolovana District, Alaska |
| MK-RC-0511 | 429337.7 | 7265890.3 | 468.3 | 297.2 |
| MK-RC-0512 | 428816.7 | 7265292.4 | 428.8 | 457.2 |
| MK-RC-0513 | 428847.4 | 7264943.3 | 390.1 | 396.2 |
| MK-RC-0514 | 429187.0 | 7265890.1 | 445.3 | 335.3 |
| MK-RC-0515 | 428885.0 | 7265444.6 | 454.0 | 374.9 |
| MK-RC-0516 | 428890.0 | 7264989.4 | 407.2 | 426.7 |
| MK-RC-0517 | 429413.6 | 7265741.6 | 495.6 | 396.2 |
| MK-RC-0518 | 428885.5 | 7265370.3 | 429.8 | 274.3 |
| MK-RC-0519 | 429109.2 | 7265657.7 | 473.6 | 271.3 |
| MK-RC-0520 | 429340.2 | 7265741.0 | 490.6 | 323.1 |
| MK-RC-0521 | 429259.1 | 7265661.8 | 491.3 | 280.4 |
| MK-SW-001 | 428730.0 | 7267388.7 | 204.9 | 9.1 |
| MK-SW-001A | 428730.0 | 7267388.7 | 204.9 | 10.7 |
| MK-SW-002 | 428025.3 | 7266041.1 | 219.0 | 12.2 |
| MK-VW-0460 | 428775.9 | 7267487.9 | 196.2 | 24.4 |
| MK-VW-0466 | 427355.0 | 7266353.0 | 167.5 | 24.4 |
| MN-1 | 428864.0 | 7266045.0 | 341.0 | 106.7 |
| MN-2 | 428864.0 | 7266045.0 | 341.0 | 106.7 |
| MN-3 | 428745.0 | 7266065.0 | 313.6 | 106.7 |
| TL-10 | 428183.0 | 7265586.0 | 358.5 | 79.0 |
| TL-11 | 429528.0 | 7266520.0 | 352.6 | 105.0 |
| TL-12 | 429223.0 | 7266654.0 | 297.8 | 199.9 |
| TL-13 | 429054.0 | 7266654.0 | 318.4 | 150.3 |
| TL-14 | 427780.0 | 7265504.0 | 272.8 | 124.0 |
| TL-6 | 433265.0 | 7269380.0 | 277.0 | 43.9 |
| TL-7 | 428443.0 | 7266477.0 | 303.2 | 101.2 |
| TL-8 | 428443.0 | 7266477.0 | 303.2 | 192.9 |
| TL-9 | 428443.0 | 7266477.0 | 303.2 | 105.0 |
| 273 |