
Delivering Value…
for Customers and Investors
ANALYST CONFERENCE • WASHINGTON, DC • APRIL 8, 2011

Some of the statements contained in today’s presentation are forward-looking statements within the meaning of Section 21E
of the Securities Exchange Act of 1934, as amended, and are subject to the safe harbor created by the Private Securities
Litigation Reform Act of 1995. These statements include declarations regarding Pepco Holdings’ intents, beliefs and current
expectations. In some cases, you can identify forward-looking statements by terminology such as “may,” “will,” “should,”
“expects,” “plans,” “anticipates,” “believes,” “estimates,” “predicts,” “potential” or “continue” or the negative of such terms or
other comparable terminology. Any forward-looking statements are not guarantees of future performance, and actual results
could differ materially from those indicated by the forward-looking statements. Forward-looking statements involve estimates,
assumptions, known and unknown risks, uncertainties and other factors that may cause PHI’s actual results, levels of activity,
performance or achievements to be materially different from any future results, levels of activity, performance or achievements
expressed or implied by such forward-looking statements. The forward-looking statements contained herein are qualified in
their entirety by reference to the following important factors, which are difficult to predict, contain uncertainties, are beyond
Pepco Holdings’ control and may cause actual results to differ materially from those contained in forward-looking statements:
prevailing governmental policies and regulatory actions affecting the energy industry, including allowed rates of return,
industry and rate structure, acquisition and disposal of assets and facilities, operation and construction of transmission and
distribution facilities, and the recovery of purchased power expenses; changes in and compliance with environmental and
safety laws and policies; weather conditions; population growth rates and demographic patterns; general economic conditions,
including potential negative impacts resulting from an economic downturn; changes in tax rates or policies or in rates of
inflation; changes in accounting standards or practices; changes in project costs; unanticipated changes in operating
expenses and capital expenditures; the ability to obtain funding in the capital markets on favorable terms; rules and
regulations imposed by Federal and/or state regulatory commissions, PJM, the North American Electric Reliability Corporation
and other applicable electric reliability organizations; legal and administrative proceedings (whether civil or criminal) and
settlements that influence PHI’s business and profitability; pace of entry into new markets; volatility in customer demand for
electricity and natural gas; interest rate fluctuations and credit and capital market conditions; and effects of geopolitical events,
including the threat of domestic terrorism. Any forward-looking statements speak only as to the date of this presentation and
Pepco Holdings undertakes no obligation to update any forward-looking statements to reflect events or circumstances after
the date on which such statements are made or to reflect the occurrence of unanticipated events. New factors emerge from
time to time, and it is not possible for Pepco Holdings to predict all such factors, nor can Pepco Holdings assess the impact of
any such factor on Pepco Holdings’ business or the extent to which any factor, or combination of factors, may cause results to
differ materially from those contained in any forward-looking statement. The foregoing review of factors should not be
construed as exhaustive. Readers are referred to the most recent reports filed with the Securities and Exchange Commission.
Safe Harbor Statement

Today’s Agenda
• Opening Remarks Tony Kamerick
• Strategic Overview Joe Rigby
• Power Delivery Overview Dave Velazquez
• Regulatory Overview Tony Kamerick
• Pepco Energy Services Overview John Huffman
• Financial Overview Tony Kamerick
• Closing Remarks Joe Rigby

Strategic Overview
Joe Rigby
Chairman, President & Chief Executive Officer

We are confident in our strategic direction
1
Strategic Overview: PHI Today
• Fundamentally a regulated T&D utility with a clear value proposition
– Focused on achieving continued reasonable regulatory outcomes
– Working to achieve excellence in reliability and operations
– Investing in an attractive service territory
• A complementary, profitable and growing energy services business
• Strong financial profile
• Stable investment grade credit profile
• Positioned to provide an above average total return to investors -
combining a secure dividend with sustainable long term earnings
growth
combining a secure dividend with sustainable long term earnings
growth

* Excludes special items. See Appendix for reconciliation of GAAP earnings to earnings excluding special
items.
items.
2
Accomplishments Since Our Last Analyst Conference
• Clarified our strategic direction with the sale of Conectiv Energy
• Received decisions in Pepco’s Maryland and Delmarva Power’s Delaware
Electric base rate cases resulting in an aggregate annual increase in
revenue of $24 million
Electric base rate cases resulting in an aggregate annual increase in
revenue of $24 million
• Negotiated a settlement in Delmarva Power’s Delaware Gas base rate case
• Received FERC transmission rate increases under the FERC formula
resulting in an annual increase in revenue of $56 million
resulting in an annual increase in revenue of $56 million
• Continued to advance “Blueprint for the Future” initiatives
• Signed $169 million of energy efficiency contracts in 2010 at PES
• Used Conectiv Energy sale proceeds to reduce PHI debt and issued $250
million in notes at PHI to refund higher cost debt
million in notes at PHI to refund higher cost debt
• Completed the restructuring of PHI corporate and shared services
organizations resulting in the reduction of $28 million in annual costs that
were previously allocated to Conectiv Energy
organizations resulting in the reduction of $28 million in annual costs that
were previously allocated to Conectiv Energy
• Realized continuing operations EPS of $1.24*

Smart Grid | Blueprint for the Future | |
Aging and Inadequate Transmission Infrastructure | MAPP, Transmission Upgrades | |
Large Construction Programs, Regulatory Lag | Stable Investment Grade Credit Profile, Proposals Pending to Reduce Distribution Regulatory Lag | |
Excess Generation Capacity and Low Natural Gas Prices | Exited from the Generation Business | |
Tighter Environmental Regulation and Legislation | Exited from the Generation Business | |
Renewable Energy Standards | Working with State and Local Jurisdictions to Address Evolving Issues | |
Economic Recession/Regions with Net Migration | Continued Sales and Population Growth, Decoupling in Place for 64% of Forecasted Distribution Revenues | |
Service and Reliability | Reliability Enhancement Plan |
Industry Opportunities/Challenges
PHI’s Strategic Position/Focus
3
Strategic Direction Aligned with
Industry Opportunities & Challenges
Industry Opportunities & Challenges

Positioned to
deliver attractive
total return to
shareholders
Attractive Fundamentals
• A “pure play” regulated T&D company
• Clear strategic direction
• Stable and growing service territory
• Focus on operational excellence
• Profitable and growing ESCO
Strong Financial & Risk Profiles
• Stable investment grade credit
• Reduced financial and business risk
• Secure current dividend with EPS growth
• Valuation focus moving from yield to P/E
Compelling Regulated Capital
Investment Opportunities
Investment Opportunities
• MAPP
• Blueprint
• Load growth
• System upgrades
Supportive Regulatory Environment
• Reasonable regulatory outcomes
• Proposed changes to streamline ratemaking
process to reduce distribution regulatory lag
• FERC formula rates for transmission
assets
assets
• Approval and recovery of Blueprint in DE,
DC and MD (Pepco) jurisdictions
DC and MD (Pepco) jurisdictions
• Decoupled rates for approximately 64% of
forecasted distribution revenues
forecasted distribution revenues
Note: See Safe Harbor Statement at the beginning of today’s presentations.
4
PHI’s Value Proposition

Power Delivery
Pepco Energy Services
• Build profitable market share in the energy
performance contracting business focused on
government customers
performance contracting business focused on
government customers
• Increase earnings contribution from energy
services
services
Operating Income Business Mix
Note: See Safe Harbor Statement at the beginning of today’s presentations.
5 - 10%
90 - 95%
5
PHI’s Strategic Focus
• Focused on reliability and operational excellence
• Implement Blueprint for the Future - AMI, energy
efficiency, demand response, decoupling
efficiency, demand response, decoupling
• Achieve reasonable regulatory outcomes
2010
Rate Base
Estimate
Plant Placed
In Service
Depreciation /
Other
2015
Rate Base
Projection
Strong T&D Infrastructure Investment Growth
Rate base increases by ~ 60% by 2015
Plan focused on reliability and operational excellence
Note: See Safe Harbor Statement at the beginning of today’s presentations.
*
* Assumes MAPP in-service date of 2015.
6

7
PHI Key Challenges
• Reliability and service restoration concerns in Pepco service area
• Regulatory lag
• MAPP in-service date
• Seamless roll-out of AMI
• IRS challenge of cross-border leases

Our strategic direction is clear -
2011 is about executing our plan
8
2011 Focus
• Focus on reliability, infrastructure expansion and operational
excellence
excellence
• File next round of rate cases and achieve reasonable outcomes,
including those that reduce regulatory lag
including those that reduce regulatory lag
• Continue to implement Blueprint for the Future
• Implement electric and gas decoupling in Delaware
• Profitably grow the energy services business and continue wind
down of retail energy supply at Pepco Energy Services
down of retail energy supply at Pepco Energy Services

We are positioned to provide an attractive total return to our shareholders
Note: See Safe Harbor Statement at the beginning of today’s presentations.
9
PHI - Well Positioned
• Clear value proposition - focused T&D business
• Significant regulated capital plan that will enable the utilities to
meet customers’ expectations
meet customers’ expectations
• Strategic direction aligned with industry trends
• Low risk profile, including low exposure to environmental
regulations
regulations
• Strong financial profile
• Reasonable regulatory outcomes, including FERC formula rates
• Manageable financing plan

Strategic Overview
Joe Rigby
Chairman, President & Chief Executive Officer

Appendix

Net Earnings from Continuing Operations (Millions of dollars) | Twelve Months Ended December 31, | |||
2010 | 2009 | |||
Reported (GAAP) Net Earnings from Continuing Operations | $139 | $223 | ||
Special Items: | ||||
· | Debt extinguishment costs | 113 | - | |
· | Restructuring charge | 18 | - | |
· | Effects of Pepco divestiture-related claims | 6 | - | |
· | Mirant bankruptcy settlement | - | (24) | |
· | Maryland income tax benefit | - | (11) | |
Net Earnings from Continuing Operations, Excluding Special Items | $276 | $188 | ||
Earnings per Share from Continuing Operations | Twelve Months Ended December 31, | ||
2010 | 2009 | ||
Reported (GAAP) Earnings per Share from Continuing Operations | $0.62 | $1.01 | |
Special Items: | |||
· | Debt extinguishment costs | 0.51 | - |
· | Restructuring charge | 0.08 | - |
· | Effects of Pepco divestiture-related claims | 0.03 | - |
· | Mirant bankruptcy settlement | - | (0.11) |
· | Maryland income tax benefit | - | (0.05) |
Earnings per Share from Continuing Operations, Excluding Special Items | $1.24 | $0.85 | |
12
Reconciliation of GAAP Earnings to
Earnings Excluding Special Items
Earnings Excluding Special Items

Power Delivery
Dave Velazquez
Executive Vice President, Power Delivery
Business Overview - Power Delivery
1

2
2010 In Review
• Executed regulatory strategy
• Made good progress on installation of advanced metering in Delaware and
the District of Columbia
the District of Columbia
• Gained approval for the installation of advanced metering in Pepco -
Maryland
Maryland
• Invested $765 million in T&D infrastructure
• Accelerated reliability enhancement plans
• Continued progress on improving operational efficiency

$0.74
-$0.12
-$0.07
-$0.04
-$0.01
$0.02
$0.09
$0.10
$1.03
$0.11
* Excludes special items; see Appendix for reconciliation of EPS to GAAP.
Key Drivers
- Higher distribution revenue - rate case decisions
- Higher transmission revenue - increased investment
- Higher sales - temperature driven
- Federal income tax settlement (2001 and 2002)
- Higher O&M expense - storms, tree-trimming and
environmental remediation costs
environmental remediation costs
3
2010 Financial Performance - Power Delivery

Note: See Safe Harbor Statement at the beginning of today’s presentations.
4
2011 Focus
• Improve the “customer experience” - improve reliability, and
storm response and communications with customers
• Continue to implement Blueprint for the Future
– Complete Delaware smart meter installation by year end
– Continue deployment of smart meters in Pepco region (continue in
the District of Columbia and start in Maryland)
– Activate first phase of customer benefits
• Continue investments in T&D infrastructure
– Complete projects on time and within budget
– Gain clarity from PJM on MAPP in-service date
Diverse, Stable Service Territory
Residential 37%
Commercial 47%
Government 10%
Industrial 6%
Customer Diversity, 2010 MWh Sales
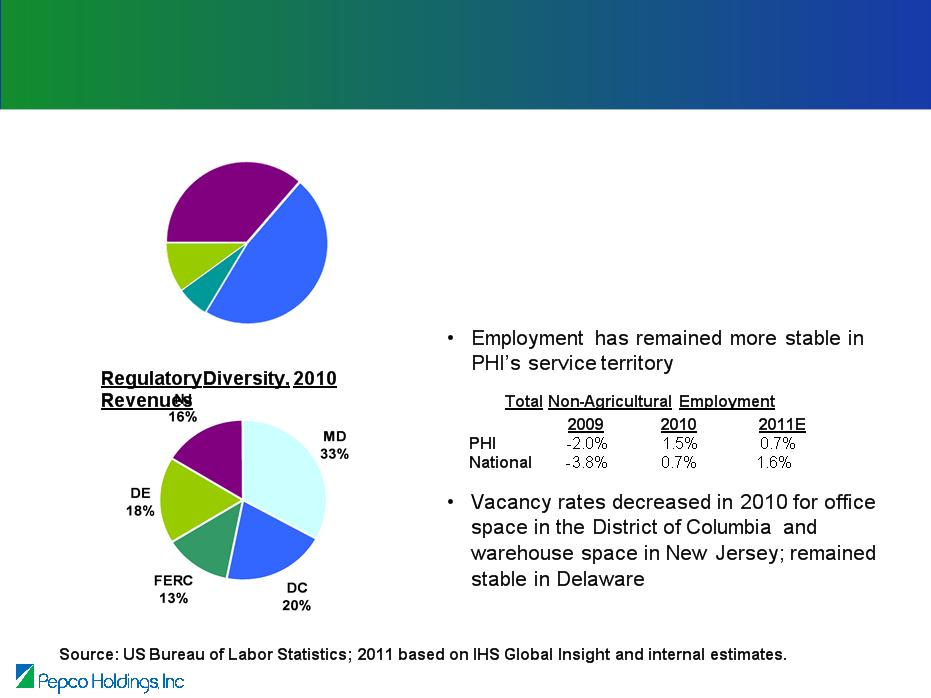
• PHI’s service territory has been less
impacted by the recessionary environment
due to its customer makeup
impacted by the recessionary environment
due to its customer makeup
– Small industrial load (6%)
– Strong governmental presence (10%)
Note: See Safe Harbor Statement at the beginning of today’s presentations.
5
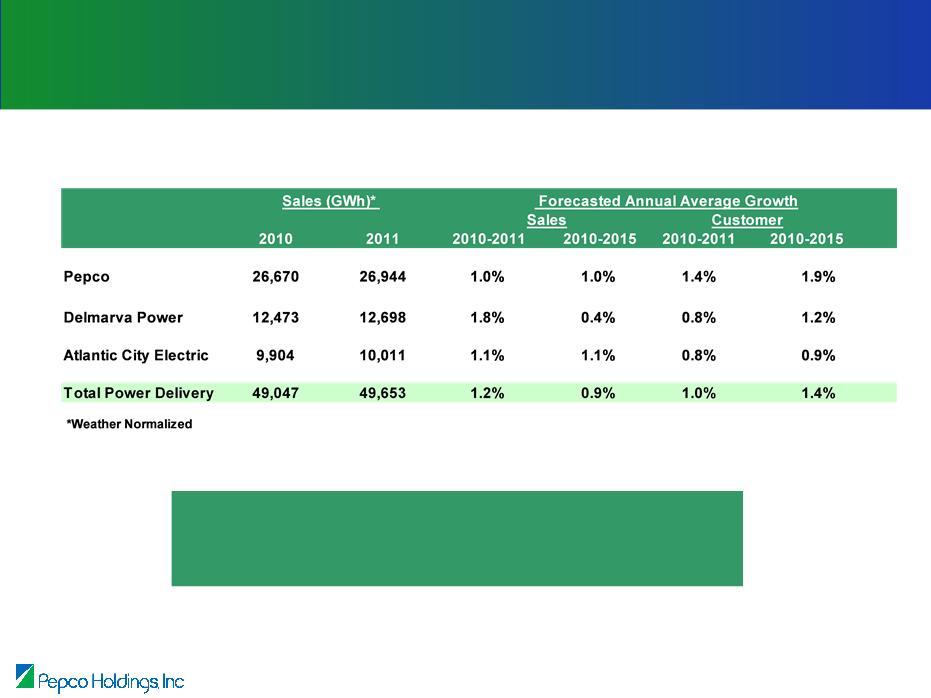
Sales and Customer Growth
We expect continued growth over the
long-term across our service territory
Note: See Appendix for detailed sales and customer growth forecasts.
Note: See Safe Harbor Statement at the beginning of today’s presentations.
6
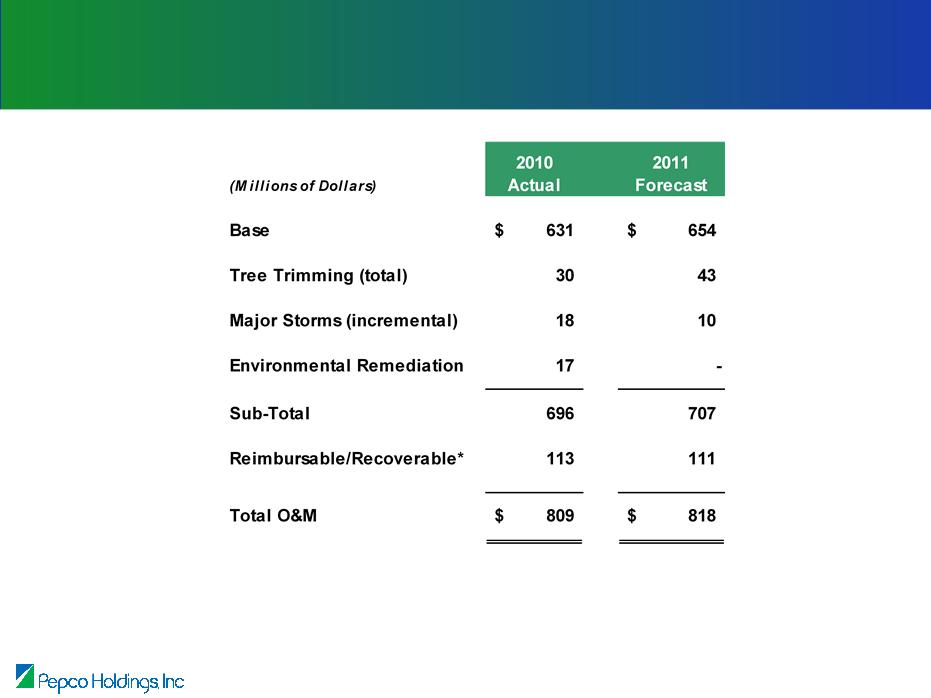
* This includes various items that are customer reimbursed or recoverable through rates in the same year,
such as default electricity supply, customer reimbursed service work, claims, Atlantic City Electric bad
debt expense, and regulatory commission expenses.
such as default electricity supply, customer reimbursed service work, claims, Atlantic City Electric bad
debt expense, and regulatory commission expenses.
Note: See Safe Harbor Statement at the beginning of today’s presentations.
7
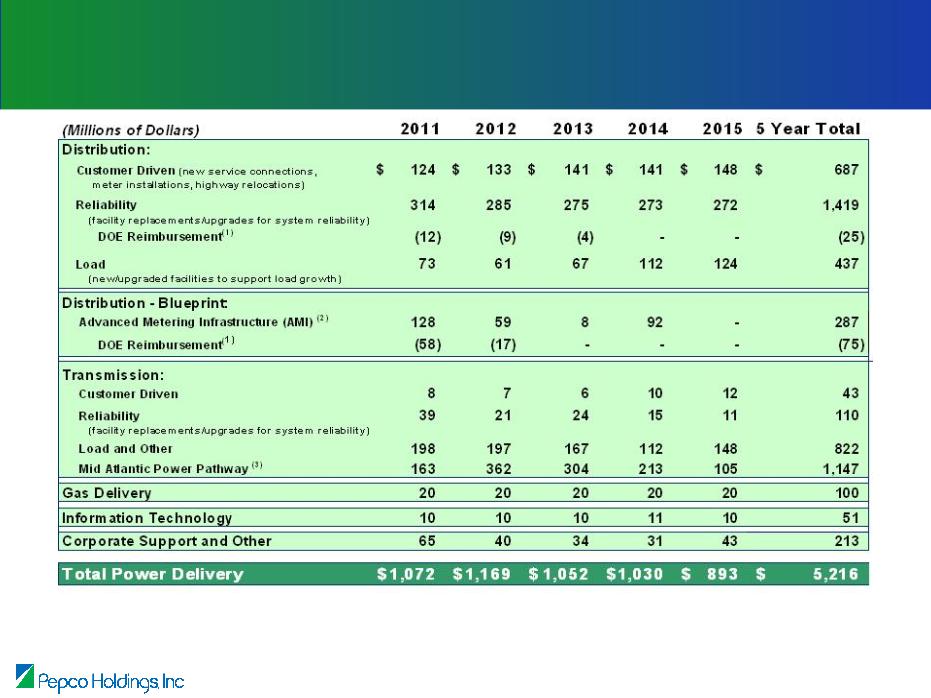
Power Delivery - O&M
Total = $5,216
Notes: Amounts are net of anticipated reimbursement pursuant to awards from the U.S. Department
of Energy (DOE) under the American Recovery and Reinvestment Act of 2009 (ARRA).
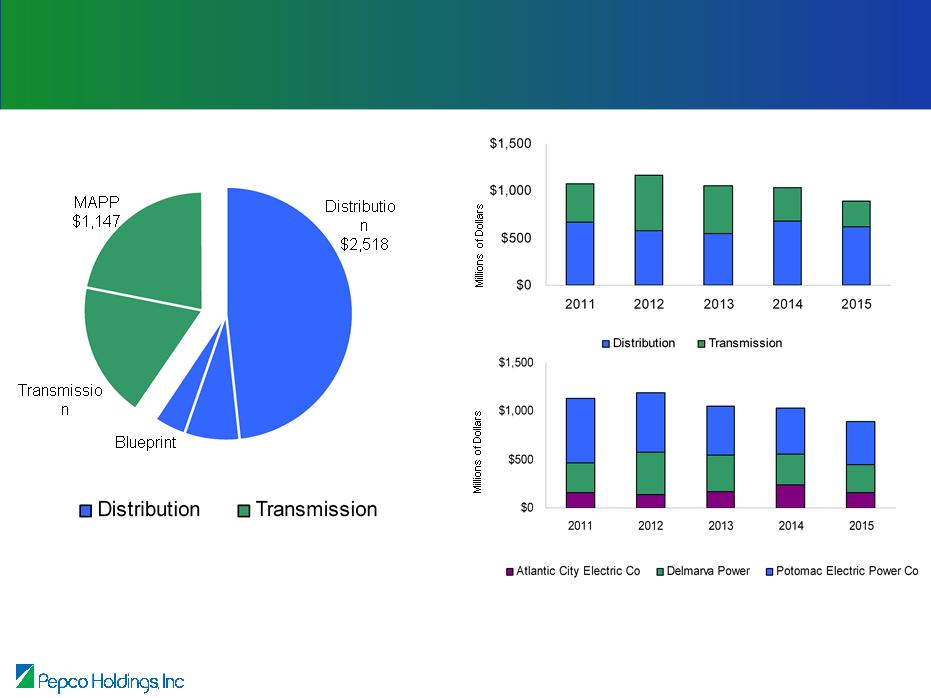
Assumes MAPP in-service date of 2015. See Appendix for detailed construction forecast.
Other
$975
$212
Other
$364
$1,072
$1,169
$1,052
$1,030
$893
$1,072
$1,169
$1,052
$1,030
$893
(Millions of Dollars)
Note: See Safe Harbor Statement at the beginning of today’s presentations.
8
Forecast Construction Expenditures - 2011 - 2015

* Amounts are net of anticipated reimbursement pursuant to awards from the U.S. DOE under the ARRA.
Note: See Safe Harbor Statement at the beginning of today’s presentations.
9
Forecast Construction Comparison
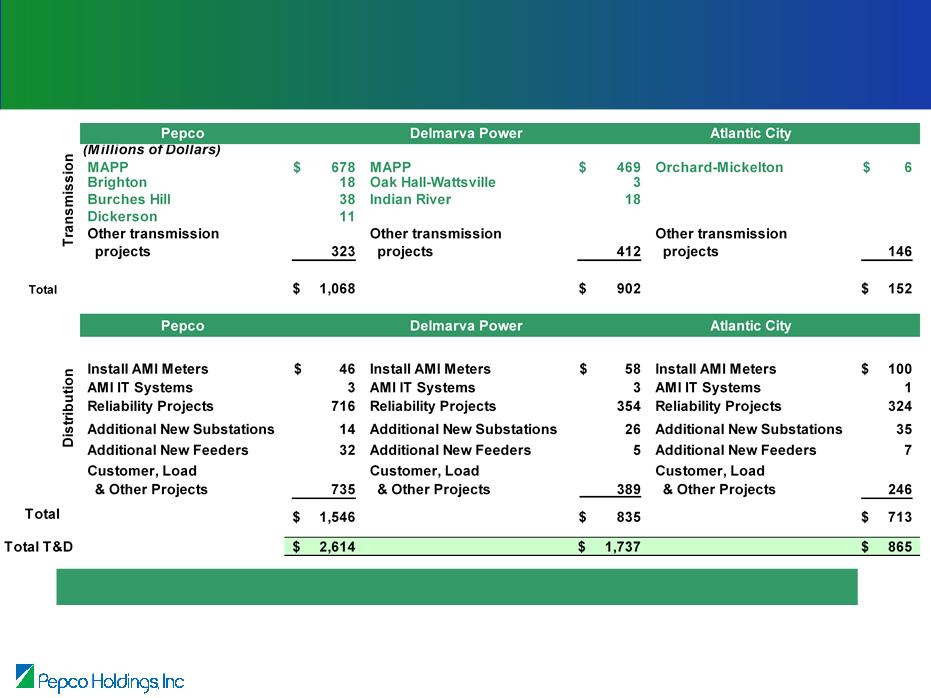
(1) Transmission projects shown in green were granted 150 basis point ROE adder by the FERC.
(2) Installation of AMI meters and IT systems is contingent on Delmarva-Maryland and New Jersey regulatory approval.
(3) Amounts are net of anticipated reimbursements pursuant to awards from the U.S. DOE under the ARRA.
Significant infrastructure investment opportunities exist in each of the utilities
Note: See Safe Harbor Statement at the beginning of today’s presentations.
10
Construction Program - 2011 - 2015
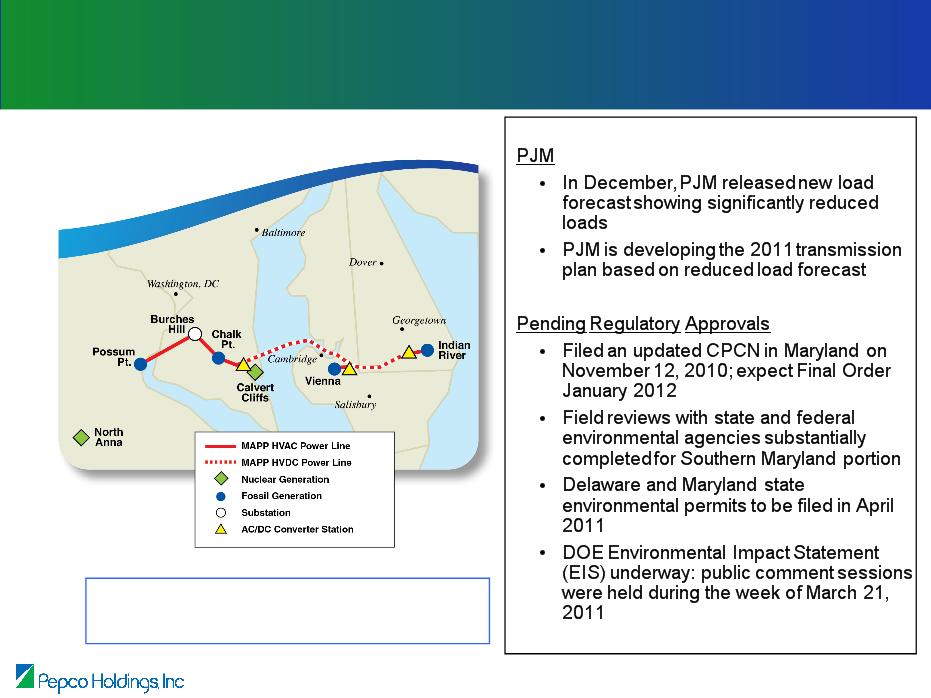
Mid-Atlantic Power Pathway (MAPP) - Project Update
Total Projected Construction Cost: $1.2 billion
Current In-Service Date: June 2015
FERC Approved ROE: 12.8%
Note: See Safe Harbor Statement at the beginning of today’s presentations.
11
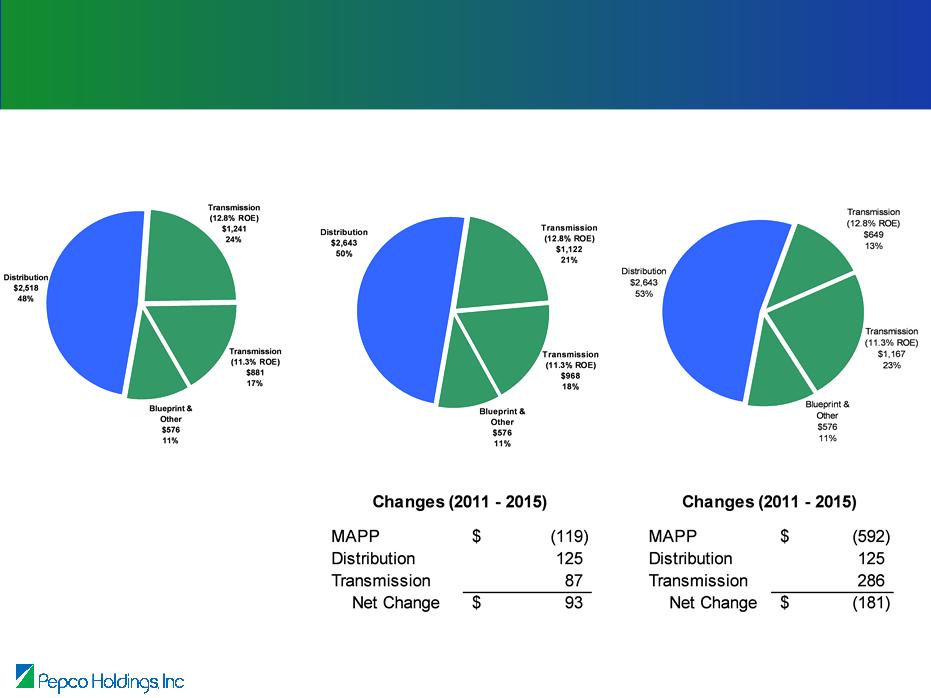
Note: Amounts are net of anticipated reimbursement pursuant to awards from the U.S. DOE under the ARRA.
2015 MAPP In-Service Date
2017 MAPP In-Service Date
2019 MAPP In-Service Date
Total $5,216
Total $5,309
Total $5,035
(Millions of Dollars)
Note: See Safe Harbor Statement at the beginning of today’s presentations.
12
Forecast Construction Expenditures -
MAPP In-Service Date Scenarios
MAPP In-Service Date Scenarios
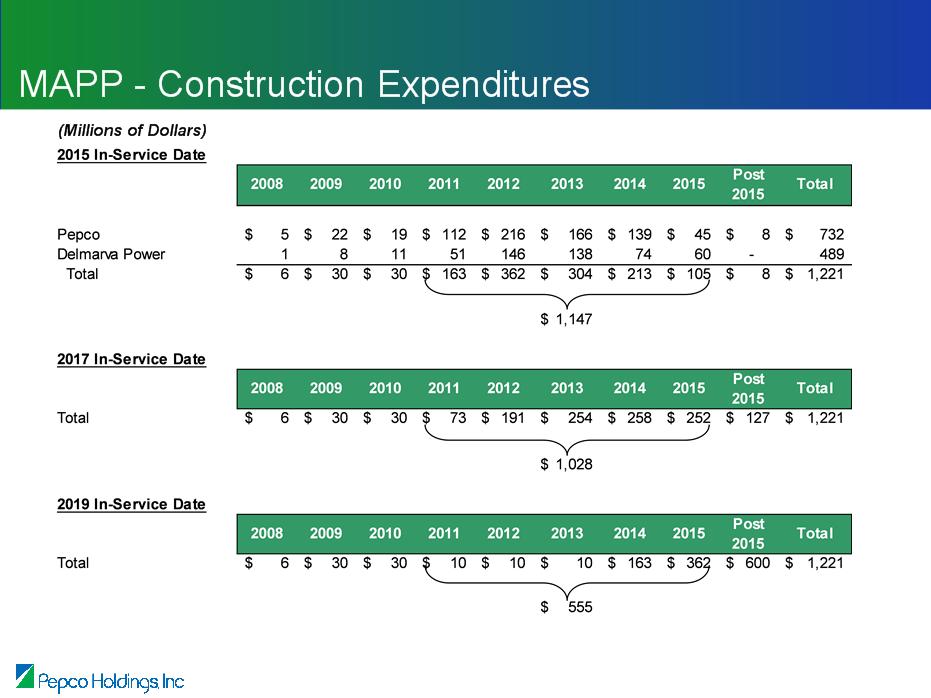
Note: Construction expenditures for in-service dates post-2015 not adjusted for inflation or changes in material prices.
Note: See Safe Harbor Statement at the beginning of today’s presentations.
13

14
Reliability Enhancement Plan
• Acceleration of existing multi-year plan designed to significantly improve
reliability
reliability
• Both engineering and construction work on the plan are already
underway - additional tree trimming, priority feeder work, URD cable
replacement, and substation supply line improvements
underway - additional tree trimming, priority feeder work, URD cable
replacement, and substation supply line improvements
• Outside expertise has been retained to provide insight into industry best
practices
practices
• Level of expenditures will be adjusted as necessary to deliver target
improvements in reliability
improvements in reliability
• Total forecasted five year expenditures for plan (2011-2015, primarily
capital), including all jurisdictions, are $1.2 billion
capital), including all jurisdictions, are $1.2 billion

15
Reliability Standards
Maryland
• The PSC recently proposed new rules (RM 43) covering reliability, storm restoration,
tree trimming, and customer service standards effective in 2011
tree trimming, and customer service standards effective in 2011
• New rules provide for civil penalties for failure to meet standards
• PHI has stated that it “supports reasonable and achievable reliability and service
quality standards”
quality standards”
• Hearings were held on March 24 and rules are expected to be finalized late 2011
• Legislation, initiated by the Governor, is also pending in the House (HB 391) and
Senate (SB 692), directing the PSC to adopt regulations by July 2012, expected to
pass in this session (which ends April 11)
Senate (SB 692), directing the PSC to adopt regulations by July 2012, expected to
pass in this session (which ends April 11)
Other Jurisdictions
• Delaware, New Jersey, and the District of Columbia all have reliability standards
which Delmarva Power, Atlantic City Electric and Pepco meet, respectively
which Delmarva Power, Atlantic City Electric and Pepco meet, respectively
• The District of Columbia PSC recently proposed revisions to their rules that would
require Pepco to meet “benchmark levels” for reliability starting in 2013, expected to
be finalized in 2nd quarter of 2011
require Pepco to meet “benchmark levels” for reliability starting in 2013, expected to
be finalized in 2nd quarter of 2011
• Reliability and customer service targets are also part of Phase II of the ACE rate case

16
PHI’s Blueprint for the Future
Blueprint for the Future is a comprehensive initiative covering all
aspects of our utility business
• Smart grid activities:
– AMI (Advanced Metering Infrastructure) - includes smart meters and
communication and data infrastructure
communication and data infrastructure
– Customer applications - empowering customers
– Distribution Automation
– Advanced transmission - includes HVDC and synchrophasors
• Dynamic pricing
• Energy efficiency and demand response programs
• Revenue decoupling
• Renewable energy, electric vehicles and other distributed generation

Note: See Safe Harbor Statement at the beginning of today’s presentations.
17
AMI - Under Construction - DE, DC and MD
Customer Benefits
2011 - DE, DC
• Cost efficiencies being realized via
automated meter reading
automated meter reading
• Energy Advisors using interval usage
data are helping to solve customer
concerns
data are helping to solve customer
concerns
• Customers have view of energy usage
via web
via web
• Outage processing
2012 - DE, DC, MD
• Continued realization of cost efficiencies
via automated meter reading
via automated meter reading
• Energy Advisors continue to work with
customers in all regions
customers in all regions
• Continued rollout of web presentment of
usage data
usage data
• Continued rollout of outage processing
• Proposed rollout of dynamic pricing

18
Dynamic Pricing - Status
• Have filed with Delaware, Maryland, and the District of Columbia for
implementation of dynamic pricing. Deferred in New Jersey,
pending AMI
implementation of dynamic pricing. Deferred in New Jersey,
pending AMI
• Proposing either Critical Peak Rebate (CPR) or a combination of
CPR and Critical Peak Pricing (CPP) rate structures
CPR and Critical Peak Pricing (CPP) rate structures
• Maryland approved in concept CPR rate structure for all Standard
Offer Service (SOS) residential customers (no opt-out) last
September
Offer Service (SOS) residential customers (no opt-out) last
September
• No implementation plans have been approved yet
• In all three jurisdictions, proposed to offer dynamic pricing to a group
of several thousand residential customers in 2012, with rollout to all
customers in 2013
of several thousand residential customers in 2012, with rollout to all
customers in 2013
• Proposed similar rollout strategy for non-residential SOS customers,
phase-in beginning in 2013 with full rollout in 2014
phase-in beginning in 2013 with full rollout in 2014
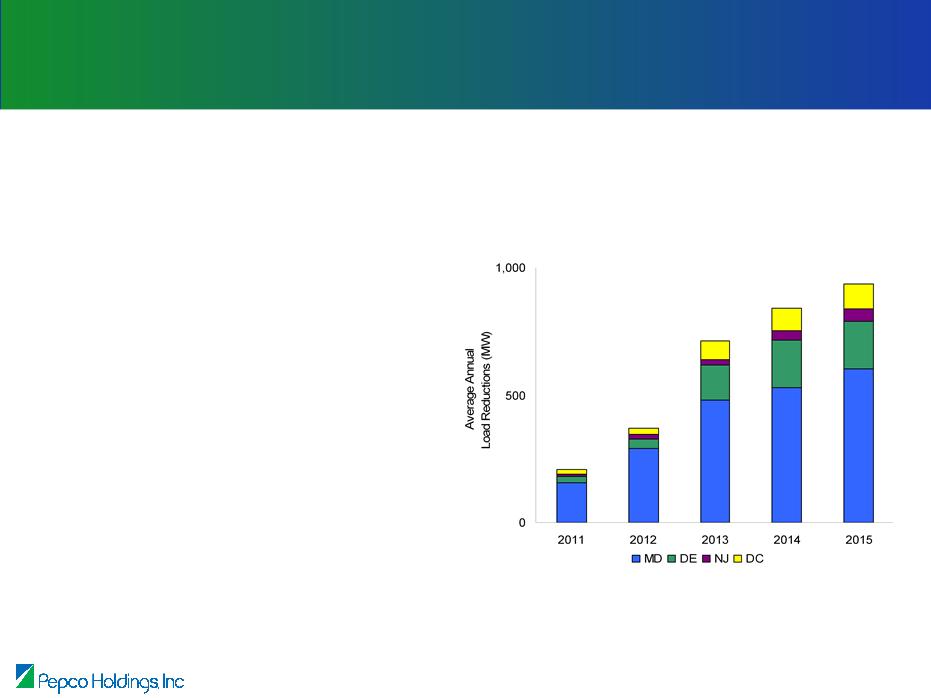
PHI’s Current Targets for Load Reductions
(from AMI enabled dynamic pricing
and direct load control programs)
Note: See Safe Harbor Statement at the beginning of today’s presentations.
19
Demand Response and Energy Efficiency - Status
Demand Response
• Direct load control program started in Maryland in
June 2009, target of 289 MW by 2015
June 2009, target of 289 MW by 2015
• Direct load control program started in New Jersey in
Q2 2010, target of 51 MW by 2015
Q2 2010, target of 51 MW by 2015
• District of Columbia and Delaware programs are
planned to start in 2012; heritage program in place in
Delaware
planned to start in 2012; heritage program in place in
Delaware
Energy Efficiency
• Energy efficiency programs launched in 2009-2010
• Maryland:
– Residential: Home Performance with
EnergySTARTM HVAC Rebates, Efficient
Appliance Rebates and Lighting Buy Downs,
and Qualifying Income Energy Weatherization
Audits and High Efficiency Equipment
Replacement
EnergySTARTM HVAC Rebates, Efficient
Appliance Rebates and Lighting Buy Downs,
and Qualifying Income Energy Weatherization
Audits and High Efficiency Equipment
Replacement
– Non-Residential: Prescriptive Lighting and
Other Measure Rebates, HVAC Rebates,
Custom Rebates, and Building Commissioning
Other Measure Rebates, HVAC Rebates,
Custom Rebates, and Building Commissioning
• DC:
– Energy Efficiency programs terminated in DC in
September 2010 due to fiscal situation;
Sustainable Energy Utility startup is pending
September 2010 due to fiscal situation;
Sustainable Energy Utility startup is pending

* SEU denotes Sustainable Energy Utility which is a non-utility, governmental organization charged with
implementing EE&C programs funded by ARRA Grants and Regional Greenhouse Gas Initiative auctions.
implementing EE&C programs funded by ARRA Grants and Regional Greenhouse Gas Initiative auctions.
MD | DE | DC | NJ | |
Energy Efficiency and Conservation (EE&C) | Ongoing | SEU* | SEU* | Filed |
Direct Load Control | Ongoing | Heritage program in place; new plan to be filed | Filed | Ongoing |
AMI-Enabled Dynamic Pricing | Filed CPR and CPP; CPR approved in concept | Filed (CPR only) | Filed (CPR only) | N/A |
AMI Customer Education | Pepco - Approved Delmarva - Planned | Planned | Filed | N/A |
MD (Pepco), NJ | EE&C, DLC | Surcharge |
DE, DC, MD | AMI | Regulatory Asset |
Cost Recovery
20
Demand Side Management Initiatives

Smart Grid is not a destination, it is an ongoing evolution
21
Blueprint for the Future - Some Key Considerations
• Public education, understanding and perception is a key focus
• Customer and operational benefits will be realized over time
• Customer adoption and participation is a key enabler of benefits
• Customers will begin to manage their energy usage the same way
they manage other purchases
they manage other purchases

Our plan positions us for significant long-term growth
in both transmission and distribution
Note: See Safe Harbor Statement at the beginning of today’s presentations.
22
Power Delivery Business Outlook
• Continued improvement in operating performance - safety, customer
satisfaction, reliability, cost
satisfaction, reliability, cost
• Over $5.2 billion in planned infrastructure investment over next 5 years -
change in MAPP in-service date will not materially change anticipated total
spend
change in MAPP in-service date will not materially change anticipated total
spend
• Continued smart grid deployment backed by stimulus grants
• Revenue growth through modest, long-term growth in the number of
customers - comparatively strong, resilient economy
customers - comparatively strong, resilient economy
• Achieving reasonable regulatory outcomes - ongoing rate cases,
decoupling, and FERC formula and incentive rates
decoupling, and FERC formula and incentive rates

Power Delivery
Dave Velazquez
Executive Vice President, Power Delivery

Appendix
Note: See Safe Harbor Statement at the beginning of today’s presentations.
25
(1) Reflects the remaining anticipated reimbursement pursuant to awards from the U.S. DOE under the
ARRA.
ARRA.
(2) Installation of AMI in Delmarva-Maryland and New Jersey is contingent on regulatory approval.
(3) Assumes MAPP in-service date of 2015.
Construction Expenditure Forecast

* Assumes MAPP in-service date of 2015.
Note: See Safe Harbor Statement at the beginning of today’s presentations.
26
Construction Expenditure Forecast
Note: See Safe Harbor Statement at the beginning of today’s presentations.
27
* Weather normalized
Sales Growth

Note: See Safe Harbor Statement at the beginning of today’s presentations.
* End-of-period amounts
28
Residential Customer Growth

Pepco-DC | Pepco-MD | ACE-NJ |
- 280,000 smart meters - 20,000 Direct Load Control (DLC) devices - 17 Automated Sectionalizing & Reclosing (ASR) systems - Enabling communications - Dynamic pricing | - 570,000 smart meters - 168,000 DLC devices - 62 ASR systems - Dynamic pricing - Enabling communications | - 25,000 DLC devices - 20 ASR systems - 158 Capacitor banks - Enabling communications |
$44.6M | $104.8M | $18.7M |
Note: See Safe Harbor Statement at the beginning of today’s presentations.
29
Blueprint for the Future - DOE Funding
• Smart Grid Investment Grant awards have been granted to Pepco DC, Pepco MD and
ACE; contracts were signed in April 2010
ACE; contracts were signed in April 2010
• PHI also received a $4 million Smart Grid Workforce Training Grant
• DOE awarded PHI $168 million under the ARRA - $100 million to offset AMI; $30 million to
be used to offset distribution automation; and $38 million to offset expenses associated
with direct load control programs
be used to offset distribution automation; and $38 million to offset expenses associated
with direct load control programs
• Started receiving reimbursements from DOE in Q3 2010
• Metric/benefit reporting plan approved by DOE and Q4 2010 data submitted
• Maryland regulatory approval of AMI for Pepco customers received in early 2011

(1) Installation of AMI in Delmarva-Maryland and New Jersey is contingent on regulatory approval.
(2) Reflects the remaining anticipated reimbursement pursuant to awards from the U.S. DOE under the ARRA.
(3) Demand response and energy efficiency program costs are recorded as deferred regulatory assets or
recovered through a surcharge.
recovered through a surcharge.
Note: See Safe Harbor Statement at the beginning of today’s presentations.
30

31
Reconciliation of Power Delivery GAAP Earnings
to Earnings Excluding Special Items
to Earnings Excluding Special Items

Tony Kamerick
Senior Vice President & Chief Financial Officer
Regulatory Overview

1
Executing Our Regulatory Strategy - A Core Competency
• Years of experience in multi-jurisdictional construct
• Demonstrated capability to manage simultaneous cases
• Demonstrated leadership in emerging regulatory issues
– Decoupling
– Smart Grid Cost Recovery
– Energy Efficiency Cost Recovery
– Stimulus Funding
– Dynamic Pricing

Regulatory Highlights - 2010 to Present
2
• Four distribution base rate case decisions received since early 2010 authorizing a
total annual increase of $64 million; two cases pending:
total annual increase of $64 million; two cases pending:
– Pepco - District of Columbia, March 2010
– Atlantic City Electric - New Jersey, June 2010
– Pepco - Maryland, July 2010
– Delmarva Power (Electric) - Delaware, February 2011
– Delmarva Power (Gas) - Delaware, pending (settlement agreement reached)
– Delmarva Power - Maryland, pending (filed December 2010)
• Received annual transmission rate adjustments totaling $56 million under FERC
formula rate process, effective June 1, 2010
formula rate process, effective June 1, 2010
• Advanced Blueprint for the Future initiatives
– Smart Grid
– Energy efficiency and demand response programs
– Dynamic Pricing
• Revenue decoupling in place for 64% of forecasted regulated distribution revenue
– Implemented in Maryland and the District of Columbia
– Implementation in Delaware pending approval and implementation of a customer education
plan (expected in first half of 2012)
plan (expected in first half of 2012)
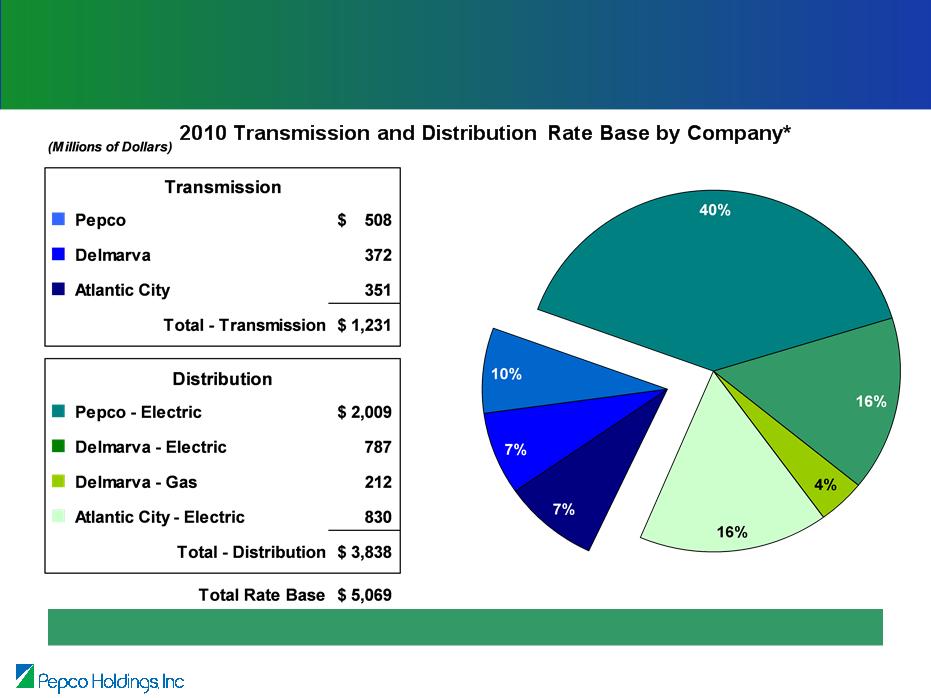
* Based on estimated year-end 2010 rate base.
Strengths
• Recent distribution rate case decisions have
generally reflected adherence to key
ratemaking precedents
generally reflected adherence to key
ratemaking precedents
• Regulators have been supportive of cost
recovery for AMI, energy efficiency and
demand response initiatives
recovery for AMI, energy efficiency and
demand response initiatives
• Regulators have been supportive of
decoupling efforts in Maryland, the District
of Columbia and Delaware
decoupling efforts in Maryland, the District
of Columbia and Delaware
• Formula rates in place at FERC
Challenges
• Recent lower ROEs in certain distribution
jurisdictions
jurisdictions
• Regulatory lag in distribution business
• Current focus on improving reliability and
customer service
customer service
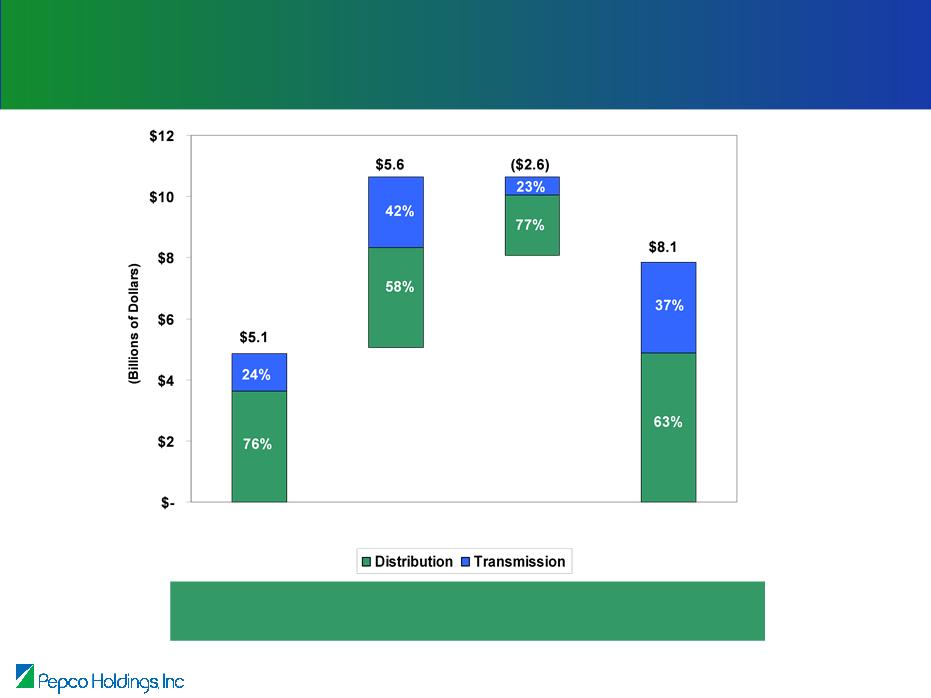
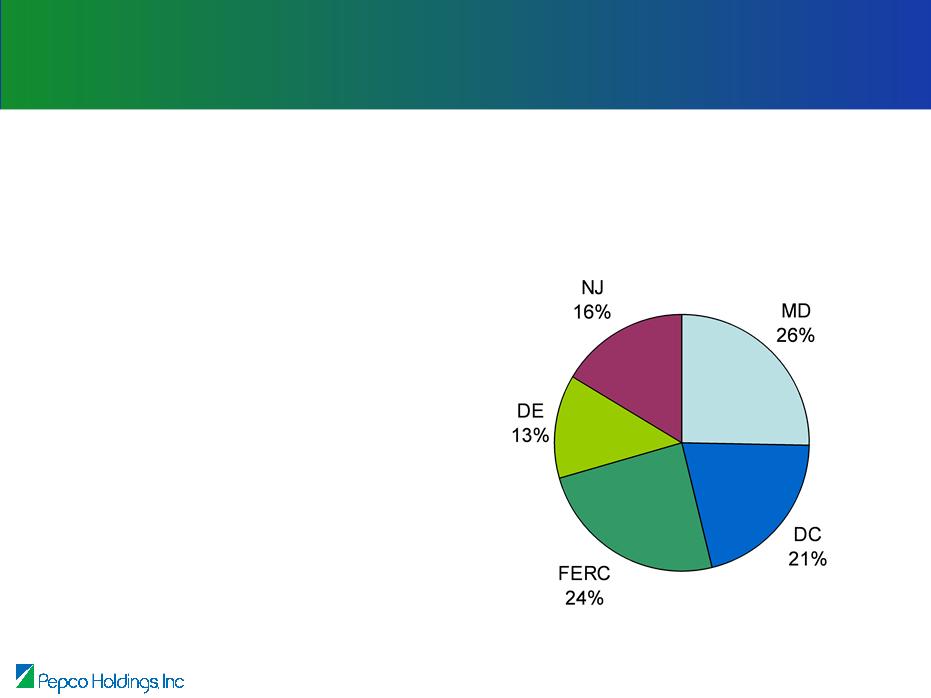
2010 Rate Base*
Regulatory Diversity
3
Regulatory Environment
Distribution is 76% and Transmission is 24% of our 2010 preliminary rate base
Note: See Safe Harbor Statement at the beginning of today’s presentations.
* Preliminary numbers
4
Rate Base Summary
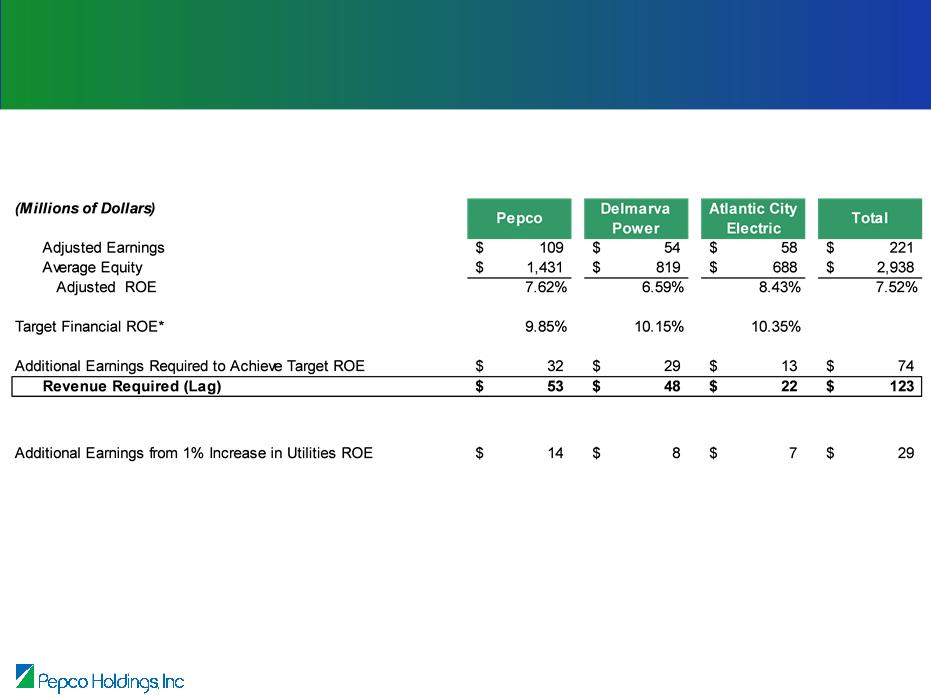
* Target financial ROE reflects estimated weighted average authorized return on equity based on the estimated
2010 rate base. Reduced ROEs by 25 basis points to allow for the historical differences between “financial”
and “regulatory” cost of service.
2010 rate base. Reduced ROEs by 25 basis points to allow for the historical differences between “financial”
and “regulatory” cost of service.
See Appendix for reconciliation of GAAP earnings to adjusted earnings.
5
Focus on Regulatory Lag
(1) The settlement is subject to the approval of the Delaware Public Service
Commission
Commission
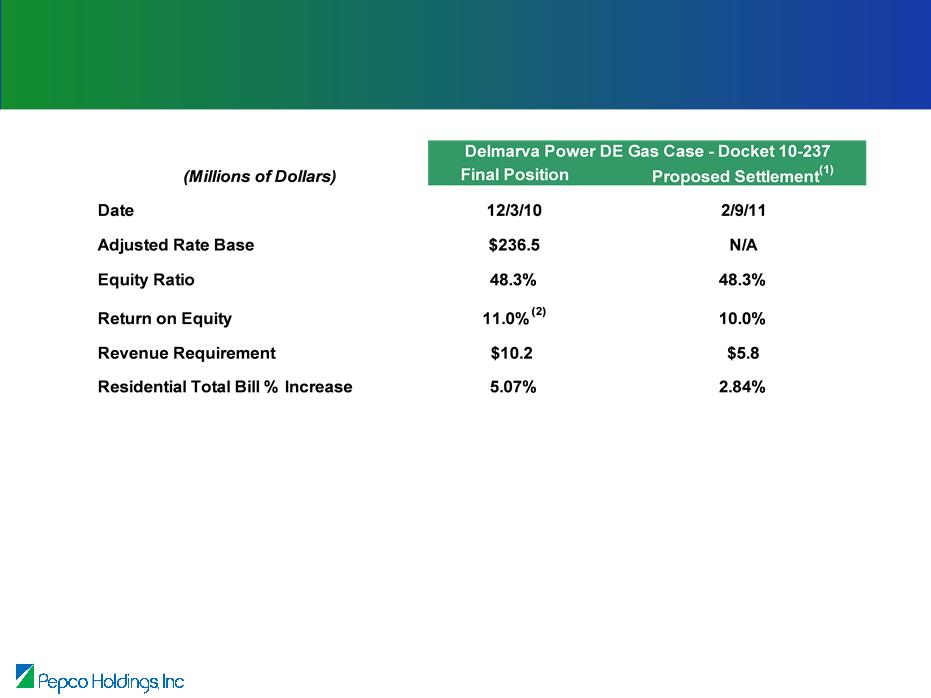
(2) Requested return on equity position without revenue decoupling is 11.25%
• Interim rates
– Interim rate increase of $2.5 million put into effect August 31, 2010, subject to refund
– Balance of requested increase put into effect February 2, 2011, subject to refund
• Decoupling status
– Parties agreed to defer the request to place revenue decoupling into effect until an
implementation plan is developed
implementation plan is developed
6
Distribution Rate Cases - Proposed Settlement
Delmarva Power - Delaware Gas
Delmarva Power - Delaware Gas

Note: See Safe Harbor Statement at the beginning of today’s presentations.
Drivers of requested increase:
• Under-earning at current authorized ROE
• Reliability investment
7
Distribution Rate Cases - Pending
Delmarva Power - Maryland
Delmarva Power - Maryland

• Filing includes:
– Comprehensive discussion of regulatory lag and its negative effects
– Perspective of investors by addition of a new Company witness
• Two regulatory lag mitigation measures proposed in filing:
– Reliability Investment Recovery Mechanism - Provides full and timely
recovery of future capital investments related to distribution system
reliability
recovery of future capital investments related to distribution system
reliability
– Annual Rate Review Process - Adjusts rates annually using actual
financial data and the return on equity approved in the most recent case
to calculate the revenue requirement which is then used as the basis for
rate adjustments
financial data and the return on equity approved in the most recent case
to calculate the revenue requirement which is then used as the basis for
rate adjustments
8
Distribution Rate Cases - Pending
Delmarva Power - Maryland (continued)
Delmarva Power - Maryland (continued)

9
Continued Consideration of
Regulatory Lag Reduction Mechanisms
Regulatory Lag Reduction Mechanisms
• Formula rates at retail level/annual review process
• Rate adjustment/tracker mechanisms
• Future test periods
• Use of end of period rate base
• Alternative incentive regulation, performance based
ratemaking
ratemaking
• Cash return on CWIP

Distribution Rate Cases - The Next Cycle
Note: See Safe Harbor Statement at the beginning of today’s presentations.
10
• Preliminary Filing Cycle Tentative Filing Date
– Delmarva Power MD Filed December 2010
– Pepco DC 2Q2011
– Atlantic City Electric NJ 3Q2011
– Pepco MD 4Q2011
– Delmarva Power DE - Electric 4Q2011
– Delmarva Power DE - Gas 1Q2013
• Filing cycle may be altered by financial projections and other
considerations
considerations

Combines smart grid technology with energy efficiency programs to help
customers control their energy use and cost, while providing earnings potential for
the Company
customers control their energy use and cost, while providing earnings potential for
the Company
Note: See Safe Harbor Statement at the beginning of today’s presentations.
11
Blueprint - Project Status by Jurisdiction

Decoupling provides benefits to both utilities and customers:
• Fosters energy conservation as it aligns the interests of customers and utilities
• Eliminates revenue fluctuations due to weather and changes in customer usage
• Provides for more predictable utility distribution revenues
• Stabilizes the delivery portion of customer bills over time
• More closely aligns cost recovery with the fixed cost nature of the delivery business
78%
64%
Note: See Safe Harbor Statement at the beginning of today’s presentations.
12
Decoupling Status
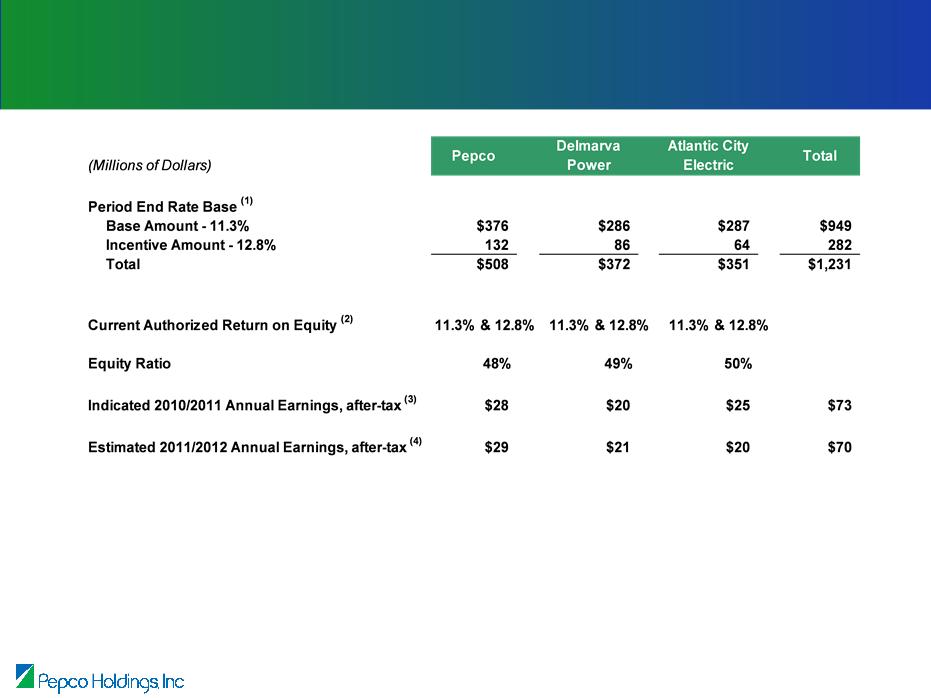
(1) Estimated rate base at 12/31/10 based on FERC-approved formula.
(2) Projects with a FERC-approved incentive ROE adder earn 12.8%. Authorized return on equity is 11.3% for
all other transmission.
all other transmission.
(3) Includes the impact of true-ups totaling a positive $7 million, after-tax.
(4) Excludes the impact of any true-up.
Note: See Safe Harbor Statement at the beginning of today’s presentations.
13
FERC Regulated Transmission Business

Note: See Appendix for details.
MD | DC | DE | NJ | |
Transmission rate recovery via FERC formula rates - adjusted annually; retail rate reflects FERC formula rate | ü | ü | ü | ü |
Procurement cost adjustment mechanisms - reconciles purchased power costs | ü | ü | ü | ü |
AMI Costs - deferred as a regulatory asset for subsequent recovery | ü | ü | ü | N/A |
Energy efficiency programs - recovery through a surcharge | ü | N/A | N/A | ü |
Demand response programs - recovery through a surcharge | ü | - | N/A | ü |
Certain state and local taxes - recovery through a surcharge | ü | ü | - | - |
Delivery bad debt expense - recovery through Societal Benefits Charge | - | - | - | ü |
Default service bad debt expense - recovery through default service rates adjusted annually | - | ü | ü | ü |
Revenue decoupling mechanism | ü | ü | - | - |
N/A - Not Applicable
14
Methods of Cost Recovery
Outside of Base Rate Case Process
Outside of Base Rate Case Process

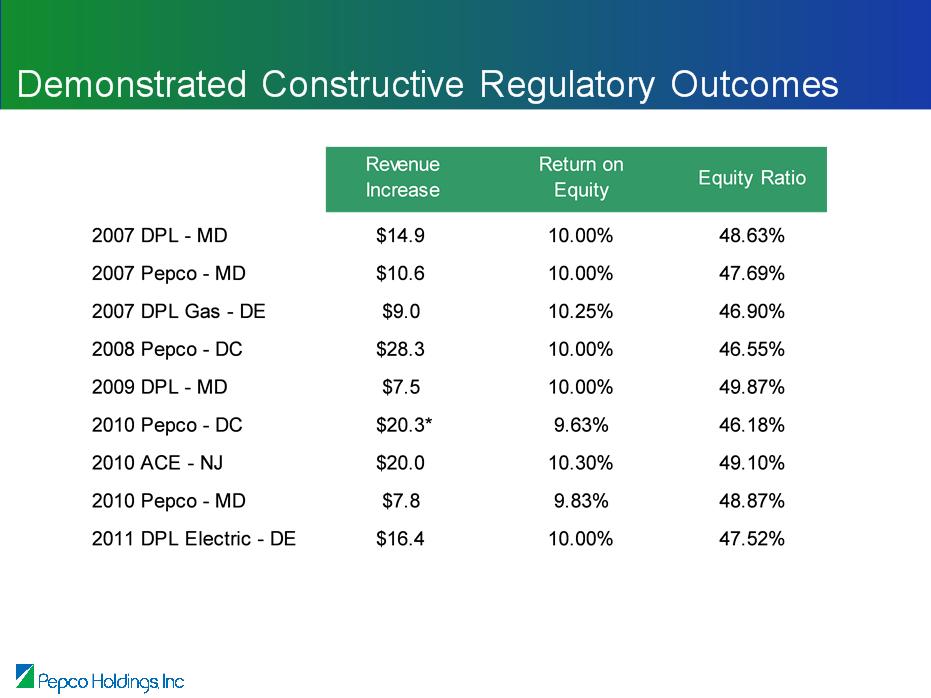
Regulatory Summary
• Demonstrated ability to achieve reasonable outcomes
• Demonstrated capability to manage simultaneous cases
• PHI strategy aligns well with states’ energy efficiency objectives and
customer interests
customer interests
• Continued focus on improving reliability, managing costs, and achieving
timely recovery and fair regulatory returns
timely recovery and fair regulatory returns
Deep regulatory competency aligns with
transmission and distribution strategy
15

Tony Kamerick
Senior Vice President & Chief Financial Officer
Regulatory Overview

Appendix

18
Distribution Rate Cases - Most Recent Decisions

* On 6/23/10, the DC Commission issued an order granting in part Pepco’s application for reconsideration
• Additional $1.0 million of allowed rate base
• Additional increase in revenues of approximately $0.5 million annually effective 7/21/10
19
Distribution Rate Cases - Most Recent Decisions (continued)
* Includes additional increase of revenues of approximately $0.5 million annually granted by the DC
Commission in response to Pepco’s application for reconsideration.
Commission in response to Pepco’s application for reconsideration.
20
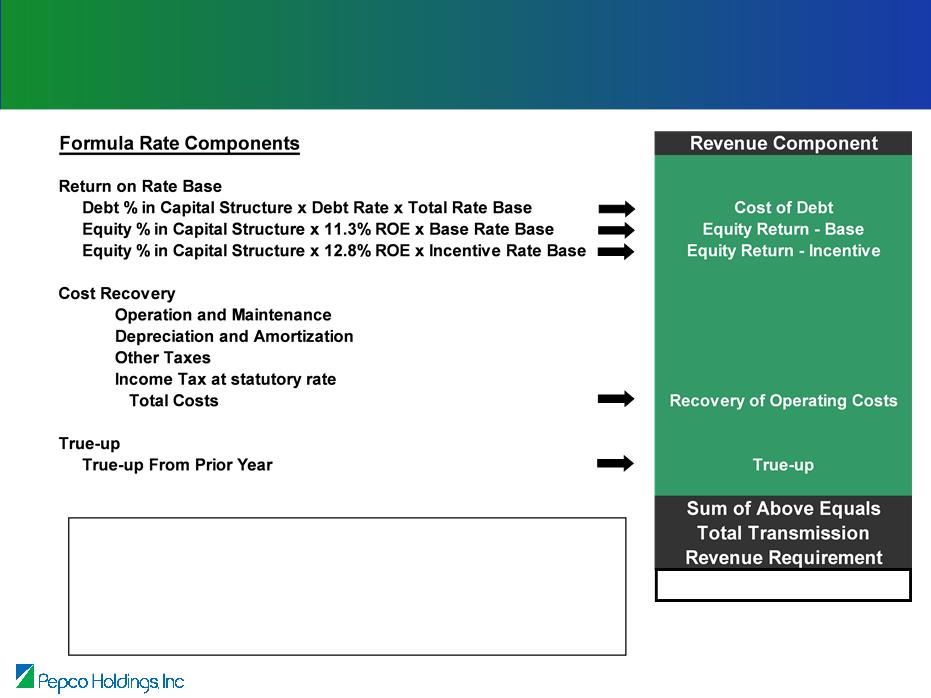
Minimizes Regulatory Lag
• Rates updated annually
• Better match between rates and costs
• Current year recovery of projected capital additions
Rates effective June 1st
21
Transmission Formula Rate Process
22
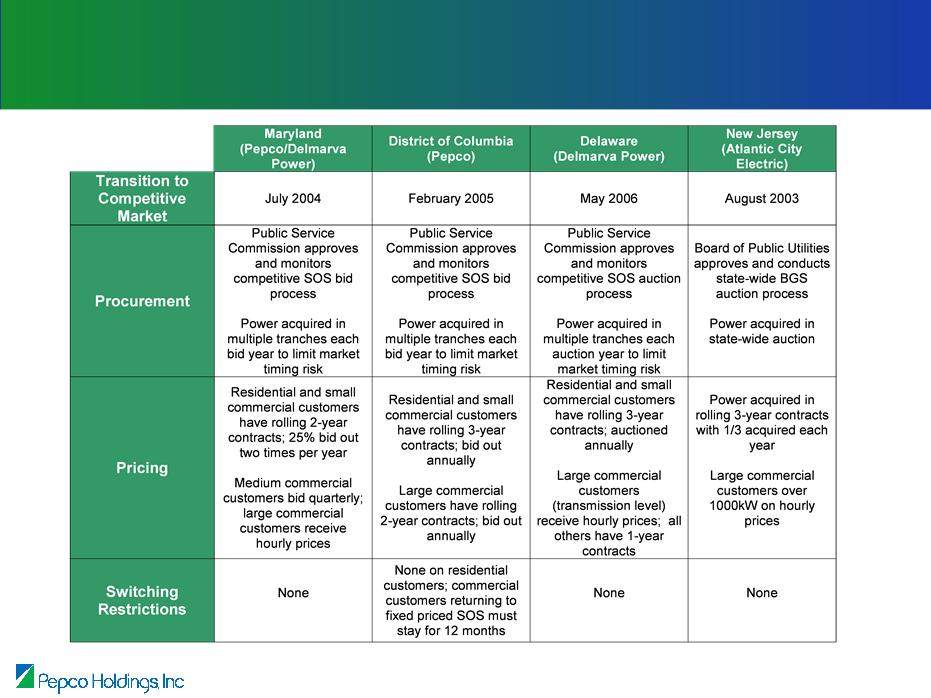
Default Service Auction/Bidding Process
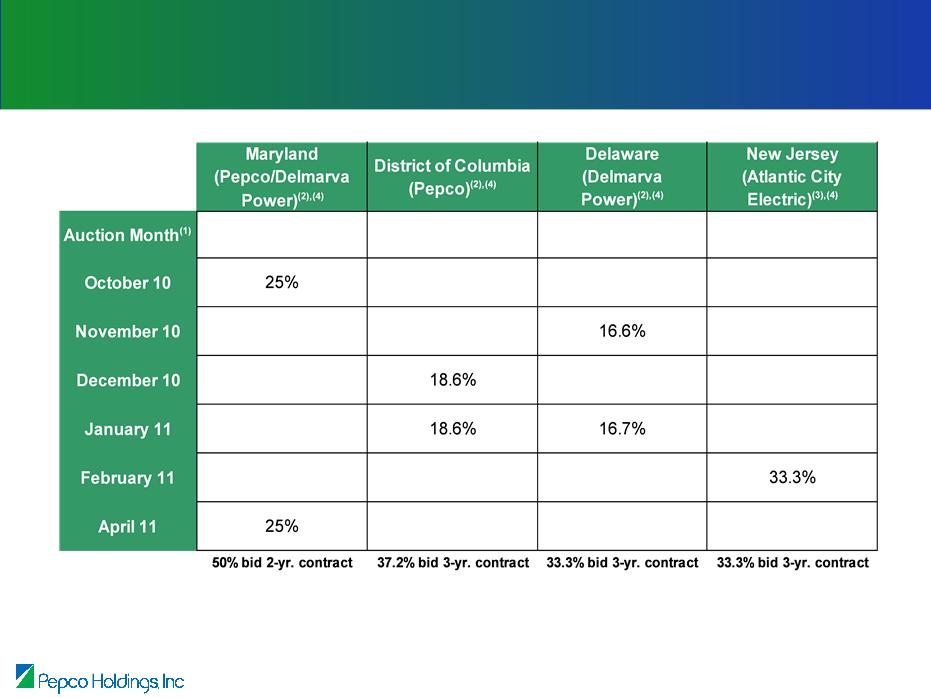
Auction Schedules for Load Bid 2011/12
(1) Actual auction dates for the 6/1/11 to 5/31/12 year are approved by the Public Service Commissions
(2) Includes Residential & Small Commercial
(3) Includes all fixed price load
(4) Reflects portion of the load for contracts expiring on 5/31/11
23
Default Service Procurement

24
Methods of Cost Recovery Outside of Base Rate Case Process
Maryland (Pepco and Delmarva)
Maryland (Pepco and Delmarva)
• Procurement Cost Adjustment (PCA)
– Reconciles purchased power and retail transmission costs
• Decoupling Mechanism
– Decouples sales and revenue
• EmPowerMD Charge (E-MD)
– Recovers DSM program expenses over five years and demand
response equipment costs over 15 years through a surcharge
response equipment costs over 15 years through a surcharge
– Earnings on unrecovered amounts at authorized rate of return
• Gross Receipts Tax, Delivery Tax, Montgomery County Fuel and
Energy, and Environmental Surcharges
Energy, and Environmental Surcharges
– Recovers certain State and local taxes
• Annual Transmission Update
– Provides mechanism for retail rate to reflect FERC-approved formula
rate
rate

25
Methods of Cost Recovery Outside of Base Rate Case
Process
District of Columbia
Process
District of Columbia
• Procurement Cost Adjustment (PCA)
– Reconciles purchased power and retail transmission costs
• Decoupling Mechanism
– Decouples sales and revenue
• Sustainable Energy Trust Fund Surcharge
– Recovers program expenditures
– Energy Assistance Trust Fund Surcharge
• Delivery Tax Surcharge and Public Space Occupancy Surcharge
– Recovers State and local taxes
• Annual Transmission Update
– Provides mechanism for retail rate to reflect FERC-approved formula
rate
rate

26
Methods of Cost Recovery Outside of Base Rate Case
Process
Delaware
Process
Delaware
Electric
• Procurement Cost Adjustment (PCA)
– Reconciles purchased power costs
• Annual Transmission Update
– Provides mechanism for retail rate to reflect FERC-approved formula rate
• Reasonable Allowance for Retail Margin (RARM) from Default Supply
Service
Service
– Reconciles SOS administrative costs
• Decoupling Mechanism
– Decouples sales and revenue
– To be implemented upon Commission approval (expected in first half of 2012)
Gas
• Gas Cost Rate (GCR)
– Reconciles purchased gas costs
• Environmental Surcharge Rider
– Recovers costs associated with manufactured gas plant site clean up
• Decoupling Mechanism
– Decouples sales and revenue
– To be implemented upon Commission approval (expected in first half of 2012)

27
Methods of Cost Recovery Outside of Base Rate Case
Process
New Jersey
Process
New Jersey
• Basic Generation Service Reconciliation Charge (BGS RC)
– Reconciles purchased power costs
• Non-Utility Generation (NUG) Charge (NGC)
– Provides full and timely recovery of BPU-approved NUG contract costs
• Societal Benefits Charge (SBC)
– Designed to ensure recovery of all bad debt expense
– Provides full recovery of BPU-approved programs for clean energy, Lifeline, Universal
Service
Service
• Annual Transmission Update
– Provides mechanism for retail rate to reflect FERC-approved formula rate
• Infrastructure Investment Surcharge (IIS)
– Provides recovery of revenue requirements for approved distribution investment prior to
base rate case filing
base rate case filing
• Regional Greenhouse Gas Initiative (RGGI) Recovery Charge
– Provides for recovery of costs for Energy Efficiency, Demand Response and Solar
Energy Initiatives
Energy Initiatives

(1) The District of Columbia allows rates to be developed using a partially forecasted test period. The
Company is required to update the test period to all actual within 180 days of the completion of the rate
proceeding.
Company is required to update the test period to all actual within 180 days of the completion of the rate
proceeding.
(2) Chairperson denoted in bold.
28
Regulatory Information by Commission

Twelve Months Ended December 31, 2010 | |||||
Pepco | Delmarva Power | Atlantic City Electric | Total | ||
Reported (GAAP) Net Earnings | $108 | $45 | $53 | $206 | |
Adjustments: | |||||
· | Severance costs | 9 | 5 | 3 | 17 |
· | O&M costs related to Conectiv Energy | 2 | 1 | 1 | 4 |
· | Interest related to tax settlements (1996 - 2002) and reallocation of certain tax deposits | (24) | 3 | 1 | (20) |
· | Environmental Remediation costs | 8 | - | - | 8 |
· | Pepco divestiture-related claims | 6 | - | - | 6 |
Net Earnings Adjusted | $109 | $54 | $58 | $221 | |
29
Reconciliation of GAAP Earnings to
Adjusted Earnings
Adjusted Earnings

Pepco Energy Services
Overview
Overview
John Huffman
President & Chief Executive Officer, Pepco Energy Services

PES Overview
• PES provides retail energy services to large
customers
customers
– Government
– Institutional
• Energy Services
– PES develops, installs, operates, and
maintains energy efficiency, renewable
energy, and combined heat and power (CHP)
projects
maintains energy efficiency, renewable
energy, and combined heat and power (CHP)
projects
• Energy Supply
– PES will substantially wind down the retail
energy supply business by 2012
energy supply business by 2012
PES has shifted its strategic focus from
Energy Supply to Energy Services
Energy Supply to Energy Services
1

PES Annual Earnings
Year-over-Year Drivers
Energy Services
• Revenue increased due to increased
contract signings
contract signings
• Operating Income decreased due to
increased personnel expense, equipment
repair, and equipment overhaul
increased personnel expense, equipment
repair, and equipment overhaul
Retail Energy Supply
• Revenue decreased due to ongoing wind
down of retail energy supply, partially
offset by higher generation at the power
plants
down of retail energy supply, partially
offset by higher generation at the power
plants
• Depreciation expense increased due to
decommissioning costs related to the
power plants
decommissioning costs related to the
power plants
• Credit costs decreased due to lower
amortization of credit intermediation fee
and lower borrowings; 90% of interest
expense attributable to energy supply
amortization of credit intermediation fee
and lower borrowings; 90% of interest
expense attributable to energy supply
(1) Certain transactions among business units are not eliminated
(2) Includes power plants
(3) Includes energy efficiency and renewable energy credits
2
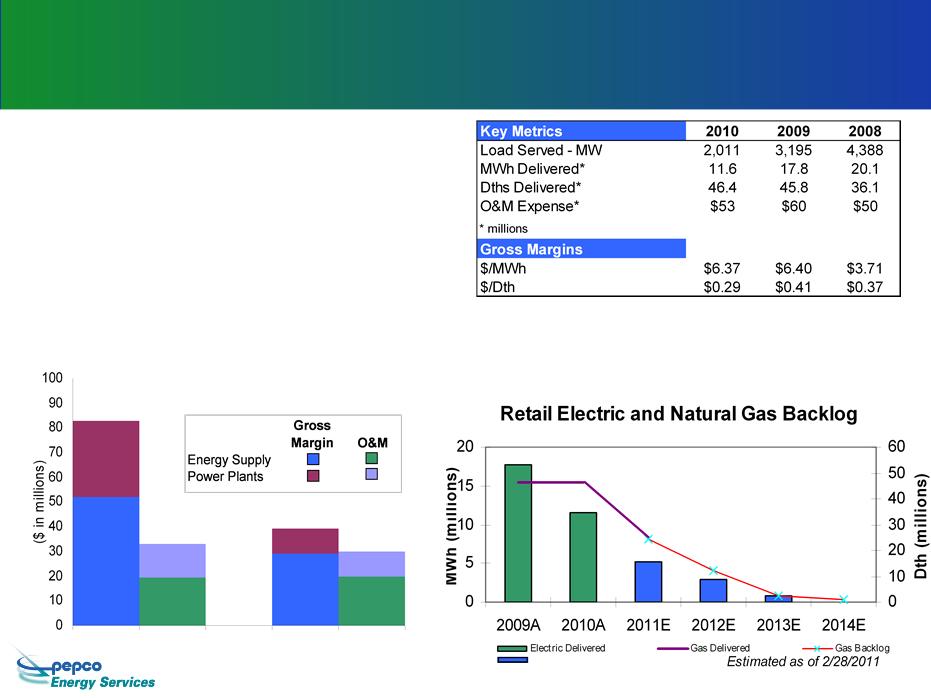
• PES is on track in winding down this
business; the retail energy supply
contracts completely roll off by 2014
business; the retail energy supply
contracts completely roll off by 2014
• Power Plants are on target for May
2012 retirement
2012 retirement
• Gross margin expectations for the
contract backlog:
contract backlog:
– Electric: ~$6.00/MWh
– Natural Gas: ~$0.35/Dth
2011
2012
Electric Backlog
Note: See Safe Harbor Statement at the beginning of today’s presentations.
Wind Down of Retail Supply and Retirement of Power
Plants
Plants
3
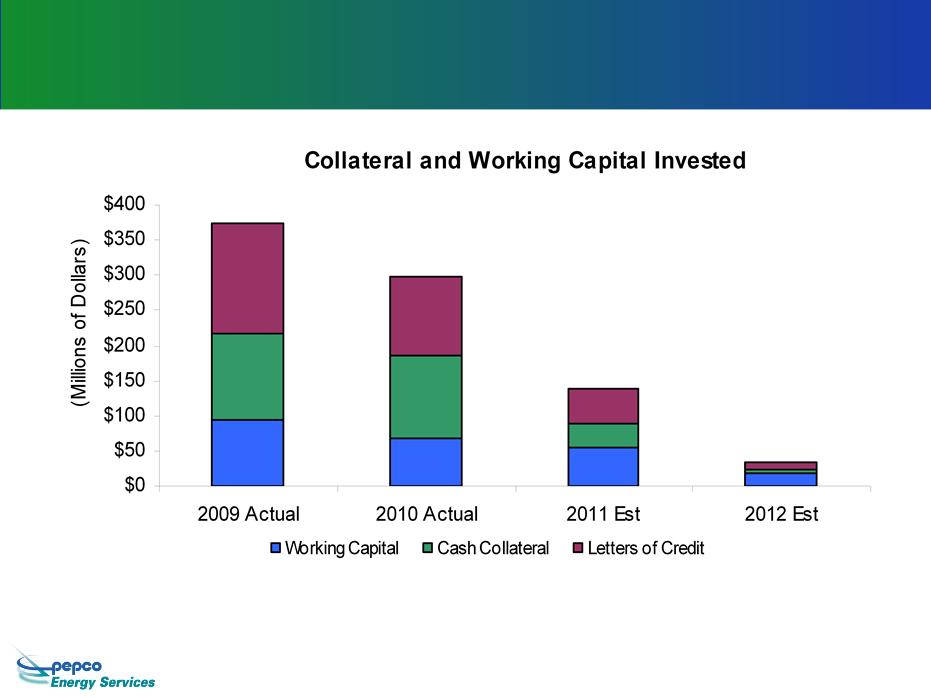
Wind Down of Retail Electric and Natural Gas
Supply
Supply
• End of year amounts
• Estimates based on energy prices as of 2/28/2011; decreasing energy prices require higher
amounts of collateral and vice versa
amounts of collateral and vice versa
$299
$138
$33
$364
Note: See Safe Harbor Statement at the beginning of today’s presentations.
4

Pepco Energy Services Going Forward
• Energy Efficiency
– PES is a leading developer of energy
efficiency projects
efficiency projects
– Since 1995, completed $850 million of
energy efficiency projects
energy efficiency projects
• Combined Heat and Power/ Thermal (CHP)
– PES develops, operates, and maintains
central heating and cooling plants
central heating and cooling plants
• 70,000 tons of cooling
• 950 MMBtu/hour of heating
• 23 MW of CHP
• Renewable Energy
– PES owns and operates 12 MW of
renewable energy facilities
renewable energy facilities
• Landfill gas to energy
• Solar energy
• W.A. Chester
– Primarily underground high voltage
transmission construction for utilities
transmission construction for utilities
Targeting annual EPS of 15¢ by 2014*
* Based on shares outstanding at 12/31/10
Note: See Safe Harbor Statement at the beginning of today’s presentations.
5

Typical Energy Efficiency Project
Project Summary
Under Construction
• $9 million contract value
• Energy conservation for 1.5 million sq ft of space at the
Wilbur Wright and Orville Wright Buildings
Wilbur Wright and Orville Wright Buildings
• $1 million annual savings for both buildings
• Reduce energy use by approximately 16% each year
• Services include lighting retrofits, energy management
controls, domestic water conservation and various other
improvements
controls, domestic water conservation and various other
improvements
Schedule
• Construction began in January 2011 and will be
completed by July 2012
completed by July 2012
Benefits
• Provides much needed upgrades to the energy
infrastructure
infrastructure
• Reduces energy consumption and provides environmental
benefits
benefits
• This project will reduce CO2 by 3,100 metric tons per year
Customer:
Federal Aviation
Administration (US GSA)
Administration (US GSA)
Location:
Washington, DC
Note: See Safe Harbor Statement at the beginning of today’s presentations.
6

Energy Services: Earnings Components
Typical projects:
• Construction contract value:
– $5 to $25 million (revenue)
• Gross margins:
– 20% to 25% range
• Strong track record for performance contracts
requiring on going measurement/ verification of
energy savings
requiring on going measurement/ verification of
energy savings
• Projects are financed by 3rd parties requiring
minimal capital from PHI and customers
minimal capital from PHI and customers
– $20 million of gross margin at 2/28/2011
– 10-month weighted average remaining
construction period
construction period
Construction Revenues from
Energy Efficiency Projects
Energy Efficiency Projects
1
Note: See Safe Harbor Statement at the beginning of today’s presentations.
7

Energy Services: Earnings Components
Recurring Revenue
Operations and
maintenance contracts
related to energy
efficiency projects; 3-15
year contracts
maintenance contracts
related to energy
efficiency projects; 3-15
year contracts
Long-term CHP and
thermal contracts from
facilities operated and
maintained by PES
thermal contracts from
facilities operated and
maintained by PES
• Military District of Washington
• Baltimore City Schools
• BWI Thurgood Marshall Airport
• Other universities, state agencies and
municipal governments
municipal governments
Projects
• Atlantic City District Energy
• Wilmington District Energy
• 23 MW NIH Combined Heat and Power,
Bethesda, MD
Bethesda, MD
• Washington Convention Center Thermal
Facility**
Facility**
Gross Margin
Expectations
$25 million
Contract Backlog
Contract Backlog
8-year remaining
contract life*
contract life*
$241 million
Contract Backlog
Contract Backlog
11-year remaining
contract life*
contract life*
* Weighted average, contract backlog at
2/28/2011
2/28/2011
** Excluded from backlog (partnership income)
Renewable Energy
Projects
Projects
• 2 MW Atlantic City Convention Center Solar
• 5 MW Bethlehem Landfill Gas (LFG), PA
• 2 MW Fauquier County LFG, VA
• 3 MW Eastern LFG, MD
2
Recurring Gross
Margin
Margin
$5-$7M per year
W.A. Chester
• Underground high voltage transmission
construction for utilities
construction for utilities
Recurring Gross
Margin
Margin
$6-$10M per year
Note: See Safe Harbor Statement at the beginning of today’s presentations.
8

Growing the Business
2007
2008
2009
2010
• PES signed $169 million of energy
efficiency contracts in 2010 - a
record sales year
efficiency contracts in 2010 - a
record sales year
• Project development pipeline has
grown to $450 million
grown to $450 million
- 88% year-over-year growth
• PES continues to grow its business
development staff
development staff
- Sales and engineering staff grew
30% in 2010
30% in 2010
- PES continues to add staff to meet
its growth aspirations
its growth aspirations
- Talent added now will create
sustainable value over the longer
term
sustainable value over the longer
term
Note: See Safe Harbor Statement at the beginning of today’s presentations.
9

ESCO Market Update
• PES focuses on the local, state, and
federal government sectors
federal government sectors
- Uncertainty in financial markets dampened
state and local government markets
through the 1st half of 2010; since then
activity has picked up and remains strong
state and local government markets
through the 1st half of 2010; since then
activity has picked up and remains strong
- Development of new projects with the
federal government is progressing but at a
slower pace
federal government is progressing but at a
slower pace
- PES estimates its market share in the Mid-
Atlantic region to be in the 25% range
Atlantic region to be in the 25% range
• PES expects to continue signing contracts
at the pace of 2nd half of 2010
at the pace of 2nd half of 2010
Major
Competitors
Competitors
Manufacturers
• Johnson Controls
• Siemens
• Honeywell
• Trane
• TAC
• Noresco (United
Technologies)
Utility Affiliated
• Constellation
• Con Ed
• FPL
Other
• Chevron
• Ameresco
• SAIC
• Lockheed Martin
Note: See Safe Harbor Statement at the beginning of today’s presentations.
10

Summary
• Pepco Energy Services is well aligned with PHI’s
strategic focus
strategic focus
– Requires minimal capital
– Minimal exposure to commodity risk
• PES is transforming into an energy efficiency-focused
company
company
– PES is on track to substantially wind down the retail energy
supply business and retire the power plants in 2012
supply business and retire the power plants in 2012
PES has developed a core competency in the ESCO
business and is building on a successful track record
Note: See Safe Harbor Statement at the beginning of today’s presentations.
11

Pepco Energy Services
Overview
Overview
John Huffman
President & Chief Executive Officer, Pepco Energy Services

Financial Overview
Tony Kamerick
Senior Vice President & Chief Financial
Officer
Officer

Note: See Safe Harbor Statement at the beginning of today’s presentations.
Our regulated business model positions us to meet these objectives
1
Financial Objectives
• Maintain solid investment grade credit ratings
• Achieve long-term earnings and dividend growth
• Disciplined approach to capital spend
• Minimize regulatory lag
• Maintain ready access to capital markets at favorable
terms
terms

2009 Actual (1) | 2010 Actual (1) | Long-Term Target Metrics | |
FFO Interest Coverage(2) | 2.5X | 3.2X | 3.5X |
FFO/Debt (2) | 11% | 15% | >15% |
Debt/Capitalization (2) | 60% | 55% | ~55% |
(1) 2009 calculations include Conectiv Energy’s results. Following the Conectiv Energy generation asset sale
in 2010, its results were reported as discontinued operations and, therefore, have been excluded from the
2010 calculations.
in 2010, its results were reported as discontinued operations and, therefore, have been excluded from the
2010 calculations.
(2) See Appendix for calculations.
Note: See Safe Harbor Statement at the beginning of today’s presentations.
2
Strengthened Credit Profile
Conectiv Energy transaction significantly
improved business risk profile and credit metrics
Note: See Safe Harbor Statement at the beginning of today’s presentations.
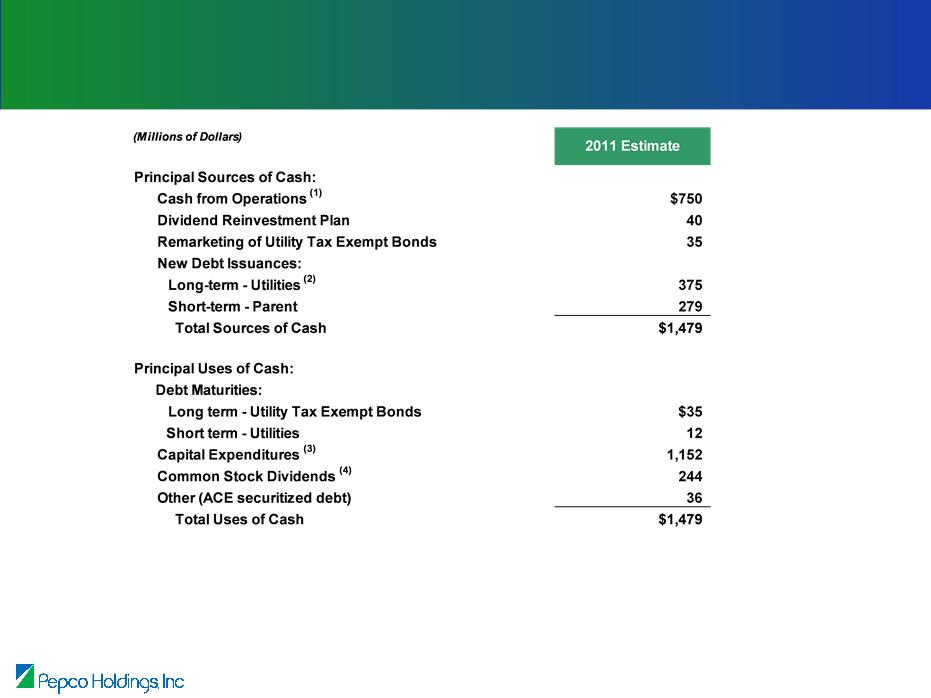
(1) Mid-point of projected cash from operations range of $700 - $800 million. Includes planned pension
contribution of $150 million.
contribution of $150 million.
(2) Mid-point of projected range.
(3) Net of anticipated reimbursement by the U.S. DOE; includes Demand Side Management expenditures of $61
million.
million.
(4) The dividend rate is determined by the Board of Directors on a quarterly basis; assumes annual dividend rate of
$1.08 per share.
$1.08 per share.
3
Principal Sources & Uses of Cash
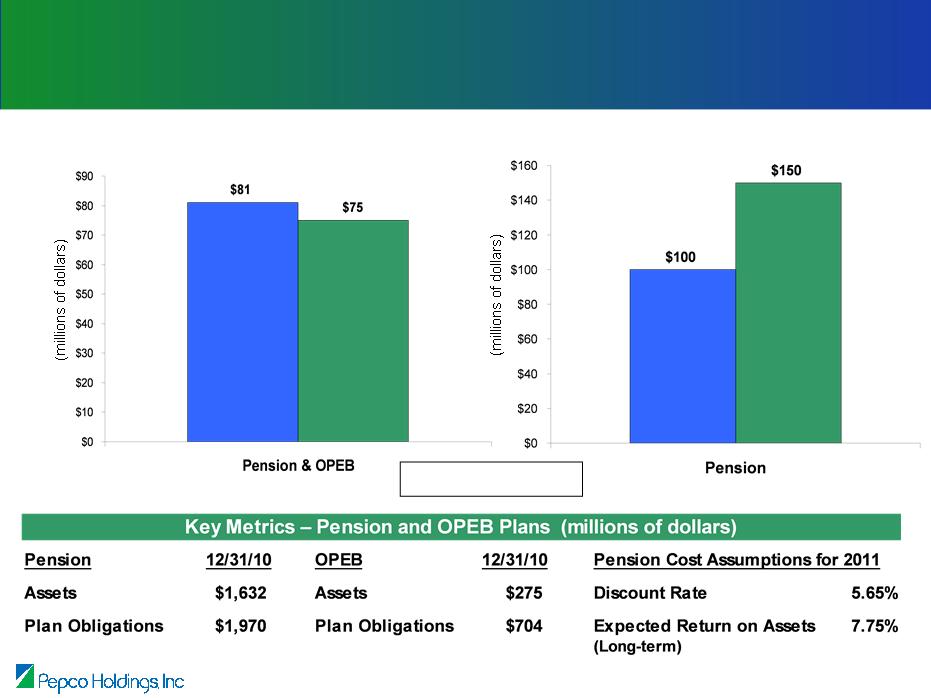
Net Pension & OPEB Pre-Tax Expense
(O&M)
(O&M)
Pension Cash Contributions
■ 2010A ■ 2011E
Note: See Safe Harbor Statement at the beginning of today’s presentations.
4
Pension and OPEB Impacts
Note: See Safe Harbor Statement at the beginning of today’s presentations.
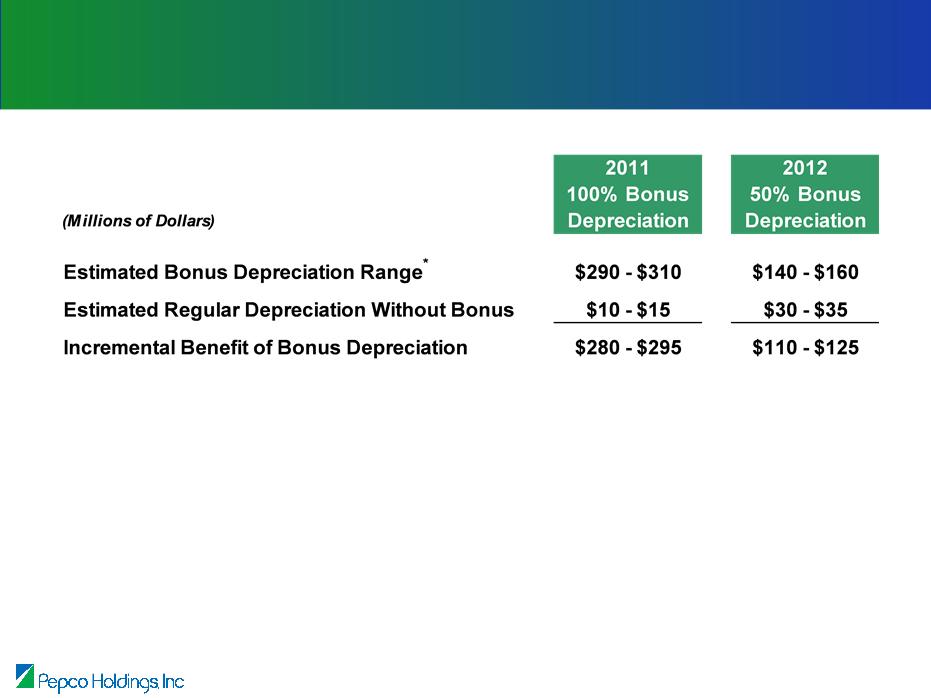
* Estimated for federal tax only.
• Cash Flow Impact:
– 2011 - 2012: No impact; bonus depreciation for 2011 and 2012 is expected to
increase the consolidated net operating loss position for these tax
years
increase the consolidated net operating loss position for these tax
years
– 2013 - 2015: $137 - $147 million
• Rate Base Impact:
– A reduction in rate base from bonus depreciation would not occur until the utilities have
received the cash benefit of taking the deductions
received the cash benefit of taking the deductions
5
Bonus Depreciation

2011
• Utility long-term debt issuance of $385 - $435 million
– Atlantic City Electric - $200 million (completed)
– Pepco - $150 - $200 million
– Delmarva Power - $35 million (tax-exempt refunding)
• Dividend Reinvestment Plan (approximately $40 million)
2012
• Utility long-term debt issuance of $350 - $450 million
• Equity issuance target of $250 - $350 million; may include the
following:
following:
– Forward sale
– Secondary offering
– Continuous equity program
• Dividend Reinvestment Plan (approximately $40 million)
Note: See Safe Harbor Statement at the beginning of today’s presentations.
6
2011 - 2012 Financing Activity
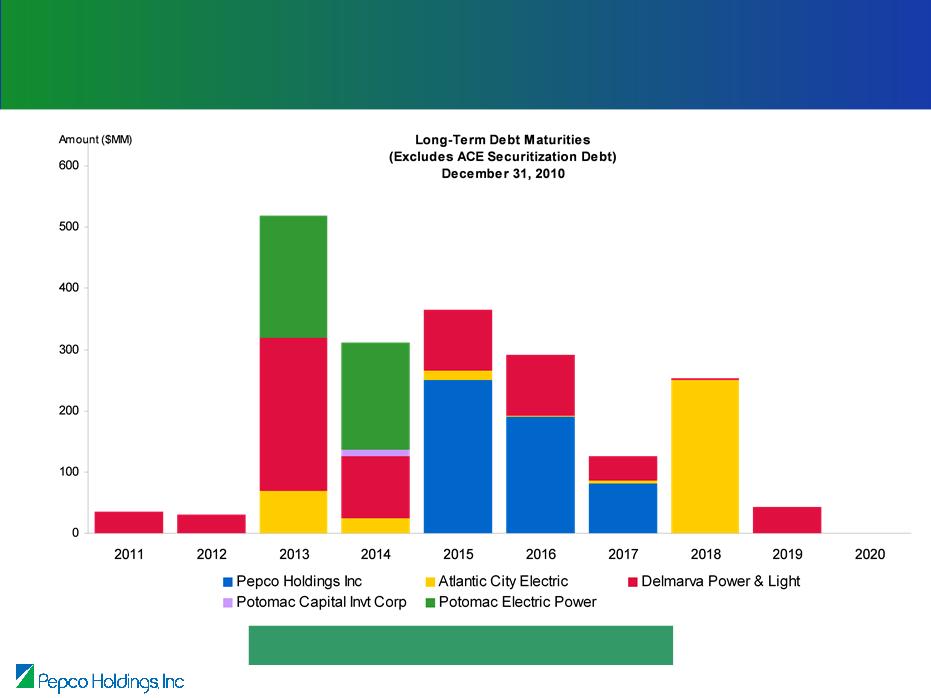
Manageable debt maturity schedule
7
PHI Debt Maturity Profile - 2011 - 2020
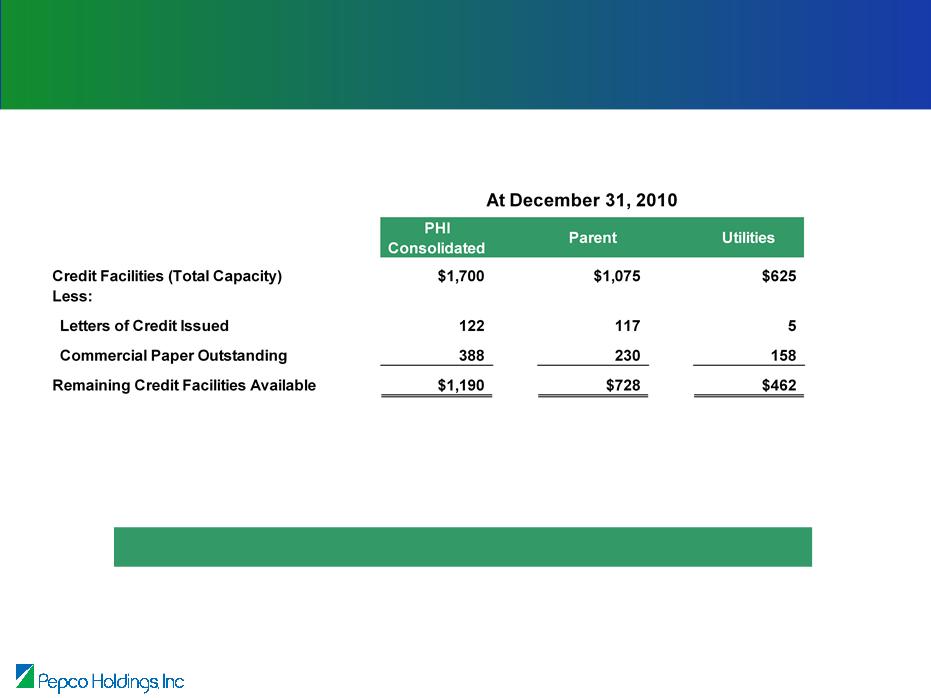
Liquidity Position
We maintain sufficient liquidity to execute our business
plan
plan
(Millions of Dollars)
8

(1) Assumes MAPP in-service date of 2015.
(2) Reflects anticipated cash reimbursements pursuant to awards from the U.S. Department of Energy under
the American Recovery and Reinvestment Act of 2009.
the American Recovery and Reinvestment Act of 2009.
Note: See Safe Harbor Statement at the beginning of today’s presentations.
9
Projected Capital Expenditures - 2011 - 2015

Power Delivery - The Driver of Growth
Total Rate Base
Growth - 59%
Growth - 59%
Electric Distribution Rate
Base Growth - 35%
Base Growth - 35%
Transmission Rate
Base Growth - 140%
Base Growth - 140%
Projected Year-End Rate Base
* See Appendix for projection by utility. Assumes MAPP in-service date of 2015.
$5,069
$8,081
$5,874
$6,565
$3,626
$3,999
$4,209
$4,366
$4,634
$4,887
$212
$221
$228
$230
$233
$237
$1,231
$1,654
$2,128
$2,541
$2,816
$2,957
*
Note: See Safe Harbor Statement at the beginning of today’s presentations.
10
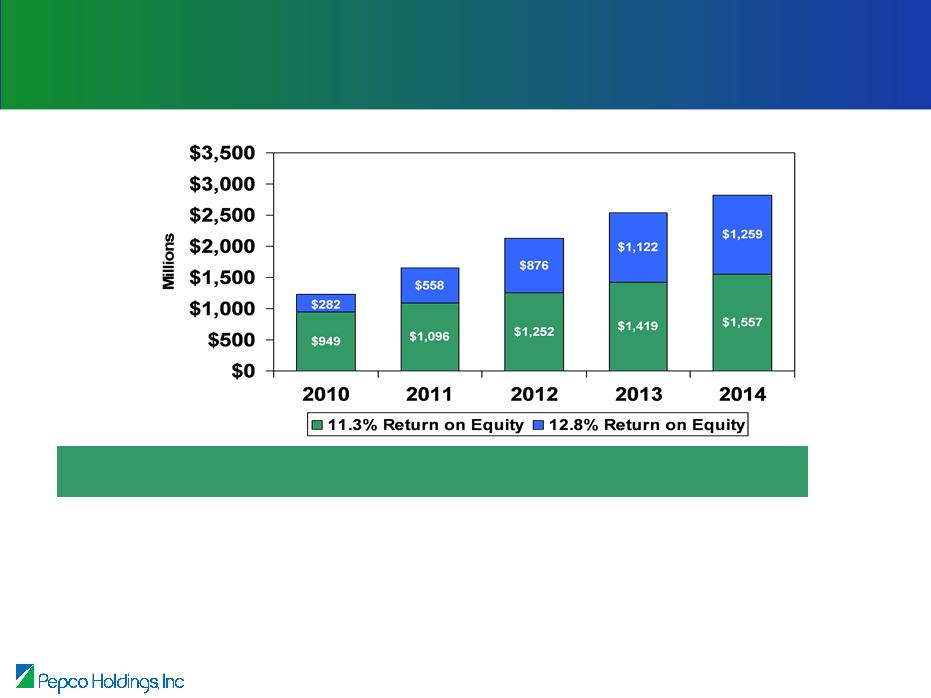
Rate Year (June 1 - May 31) Estimate* Projected Transmission Earnings* | |||||
Millions of dollars, after-tax | 2011-12 | 2012-13 | 2013-14 | 2014-15 | 2015-16 |
Earnings - 11.3% ROE | $52 | $62 | $71 | $80 | $88 |
Earnings - 12.8% ROE | $18 | $36 | $56 | $72 | $81 |
Total Earnings | $70 | $98 | $127 | $152 | $169 |
$1,231
$1,654
$2,128
$2,541
$2,816
* The 2011-12 rate year estimated earnings are based on an estimated 2010 year-end rate base and equity
ratio. Projected earnings are based on a simplified computation: projected year-end rate base x 50% equity
x authorized returns on equity. Assumes MAPP in-service date of 2015.
ratio. Projected earnings are based on a simplified computation: projected year-end rate base x 50% equity
x authorized returns on equity. Assumes MAPP in-service date of 2015.
Projected Transmission Rate Base
Note: See Safe Harbor Statement at the beginning of today’s presentations.
11
Transmission Rate Base and Earnings

2011 Earnings Guidance
Earnings Per Share
$1.10 - $1.30
$1.24
Guidance
as of Feb 2011
Reflects earnings per share from ongoing operations
(GAAP results excluding special, unusual or extraordinary items)
$1.10 - $1.25
The guidance range excludes:
• The net mark-to-market effects of
economic hedging activities at
Pepco Energy Services
economic hedging activities at
Pepco Energy Services
The guidance range
assumes/includes:
assumes/includes:
• Normal weather
• Estimated incremental storm
expenses incurred in January 2011
expenses incurred in January 2011
Actual*
Outlook
as of Dec 2010
* Excludes special items. See Appendix for reconciliation of GAAP earnings to earnings excluding special
items.
items.
Note: See Safe Harbor Statement at the beginning of today’s presentations.
12
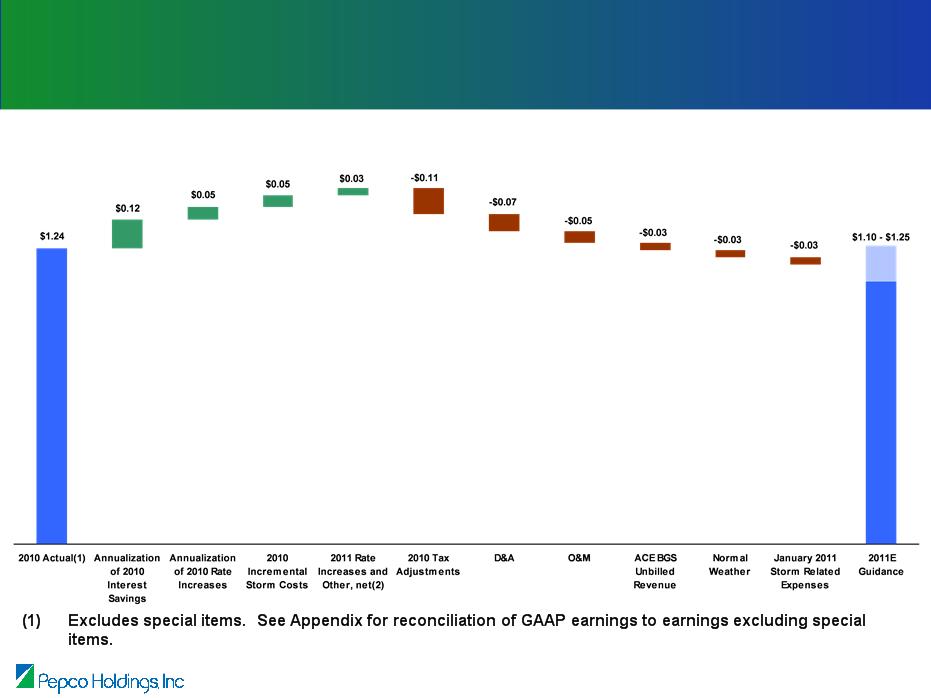
2011 Earnings Guidance (continued)
Earnings Per Share - 2010 Actual vs. 2011 Guidance
(2) Assumes PSC approval of settlement agreement in Delmarva Power gas delivery base rate case in Delaware.
Note: See Safe Harbor Statement at the beginning of today’s presentations.
13

2011 Earnings Guidance Assumptions
Note: See Safe Harbor Statement at the beginning of today’s presentations.
14
Power Delivery
• Normal weather and operating conditions
• Constructive regulatory outcome for pending Delmarva Power case in MD
• Delmarva Power gas settlement in DE reflected in rates February 2, 2011
• Forecasted growth in number of customers of approximately 1%
• Forecasted sales growth of approximately 1%
• Construction expenditures of $1.1 billion
• O&M expense, net of reimbursable/recoverable, of $707 million, including
expenses due to January 2011 storm event
expenses due to January 2011 storm event
• Depreciation and amortization expense of $381 million in 2011

Note: See Safe Harbor Statement at the beginning of today’s presentations.
15
2011 Earnings Guidance Assumptions -
Continued
Continued
Pepco Energy Services
• Growth in ESCO construction activity
• Retail Energy gross margins of $80 million
• Retail Energy O&M expense of $33 million
• Excludes net mark-to-market effects of economic hedging activities
PHI
• Other non-regulated (primarily cross-border leases) earnings at
approximate 2010 level
approximate 2010 level
�� Composite consolidated effective tax rate range of 35% - 38%

Cross Border Energy Lease Status
Note: See Safe Harbor Statement at the beginning of today’s presentations.
16
• Equity Investment of $1.4 billion at 12/31/10
• Annual tax benefits of approximately $59 million
• Annual net earnings of approximately $24 million
• Current Status:
– IRS settlement approved in November 2010 for the 2001/2002 audit; disallowed net
losses on the cross border leases
losses on the cross border leases
– Paid $74 million of taxes and $1 million of penalties in January 2011 associated with
the 2001/2002 audit
the 2001/2002 audit
– Expect IRS interest assessment in the near term
• Path Forward:
– Intend to file with the IRS a claim for refund of the tax payment, interest and penalties
– Expect claim to be denied by the IRS
– Intend to pursue litigation in the U.S. Court of Federal Claims against the IRS to
recover the tax payment, interest and penalties (expected filing second quarter 2011)
recover the tax payment, interest and penalties (expected filing second quarter 2011)
– Absent a settlement, litigation against the IRS may take several years to resolve

Delivering Value
Note: See Safe Harbor Statement at the beginning of today’s presentations.
PHI - Well Positioned to Deliver Value
17
• Stable Earnings Base - Derived primarily from regulated utility business
• Long-term Earnings Growth - Driven by T&D utility infrastructure
investments and constructive regulatory outcomes
investments and constructive regulatory outcomes
– Power Delivery - 10% CAGR of Rate Base (2010 - 2015)
• Secure Dividend - Attractive dividend yield
• Solid Investment Grade Credit Ratings - Improved credit metrics and
stable outlook
stable outlook
• Experienced Team - Delivering on commitments

Financial Overview
Tony Kamerick
Senior Vice President & Chief Financial Officer

Appendix

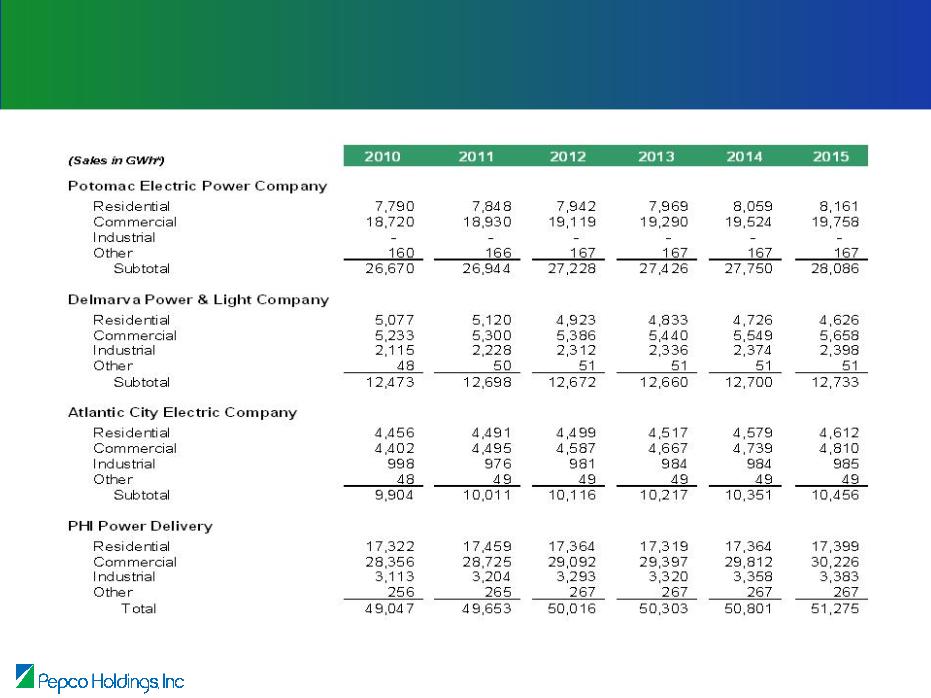
Sales and Financial Information
Note: See Safe Harbor Statement at the beginning of today’s presentations.
20

Sales and Financial Information
Note: See Safe Harbor Statement at the beginning of today’s presentations.
21
Sales and Financial Information
Note: See Safe Harbor Statement at the beginning of today’s presentations.
22

2010 | 2011 | 2012 | 2013 | 2014 | 2015 | |
Estimated | Projected | Projected | Projected | Projected | Projected | |
Distribution - Electric | ||||||
Pepco | $2,009 | $2,158 | $2,245 | $2,290 | $2,335 | $2,457 |
Delmarva Power | 787 | 915 | 1,001 | 1,041 | 1,104 | 1,152 |
Atlantic City Electric | 830 | 926 | 963 | 1,035 | 1,195 | 1,278 |
Total Distribution | 3,626 | 3,999 | 4,209 | 4,366 | 4,634 | 4,887 |
Distribution - Gas | ||||||
Delmarva Power | 212 | 221 | 228 | 230 | 233 | 237 |
Transmission | ||||||
Pepco* | 508 | 746 | 1,055 | 1,223 | 1,352 | 1,403 |
Delmarva Power* | 372 | 523 | 690 | 895 | 1,036 | 1,122 |
Atlantic City Electric | 351 | 385 | 383 | 423 | 428 | 432 |
Total Transmission | 1,231 | 1,654 | 2,128 | 2,541 | 2,816 | 2,957 |
Total Distribution & Transmission | $5,069 | $5,874 | $6,565 | $7,137 | $7,683 | $8,081 |
(Millions of Dollars)
Note: See Safe Harbor Statement at the beginning of today’s presentations.
* Assumes MAPP in-service date of 2015.
23
Projected Rate Base by Utility
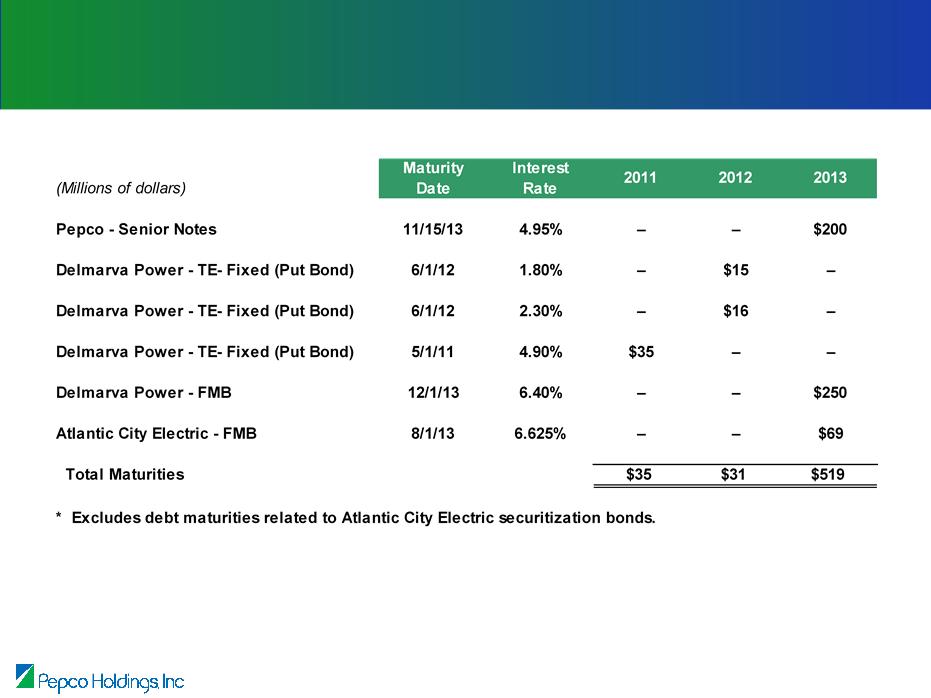
Long-term Debt Maturities*
24

* Pepco and ACE have no outstanding Senior Unsecured debt at this time. If new Senior Unsecured debt is
issued, the expected rating is indicated in the table above.
issued, the expected rating is indicated in the table above.
25
Credit Ratings
26
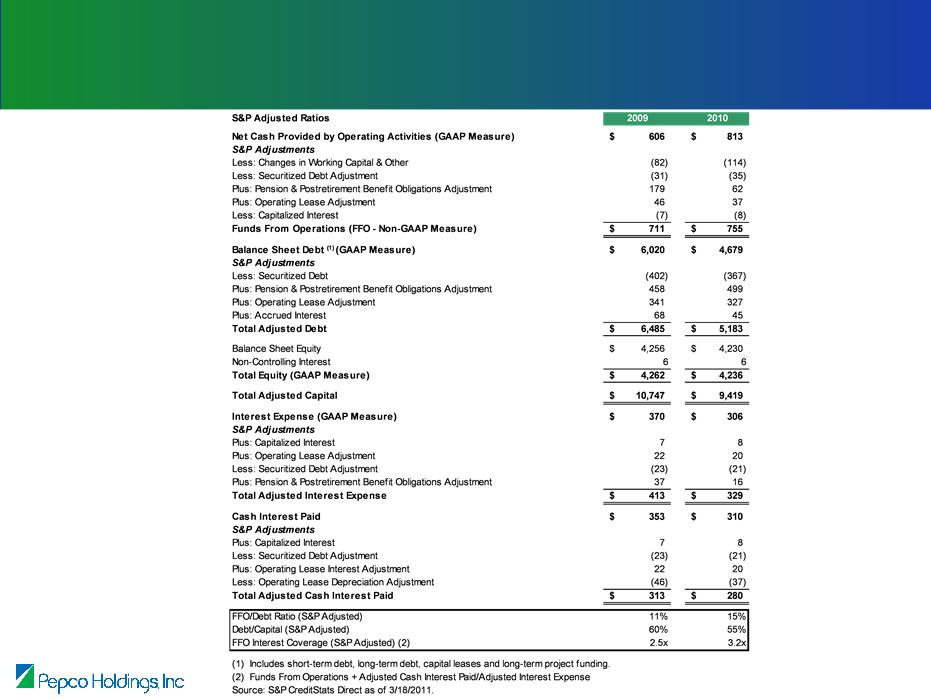
Calculation of Credit Metrics
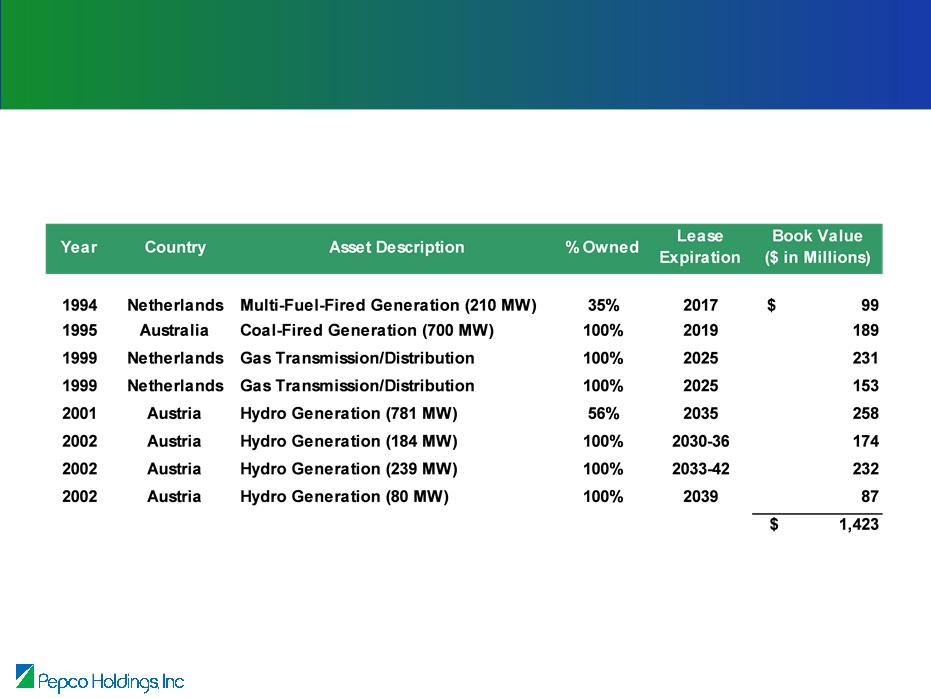
Potomac Capital Investment (PCI)
As of December 31, 2010
Cross-Border Energy Lease Portfolio
27

28
Our Approach to Earnings Guidance
• Range provided for ongoing operations (GAAP results excluding
special, unusual or extraordinary items)
special, unusual or extraordinary items)
• For guidance purposes, the items below will be excluded from
results even if not classified as a special item for reporting
purposes:
results even if not classified as a special item for reporting
purposes:
– Effect of adopting new accounting standards
– Effect of changes in tax law
– Significant impairments of assets, including goodwill
– Effect of changes in the tax treatment or estimated cash flows of the
cross-border energy lease investments
cross-border energy lease investments
– Effect of net mark-to-market economic hedging activities at Pepco
Energy Services
Energy Services
– Other unusual items

Net Earnings from Continuing Operations (Millions of dollars) | Twelve Months Ended December 31, | |||
2010 | 2009 | |||
Reported (GAAP) Net Earnings from Continuing Operations | $139 | $223 | ||
Special Items: | ||||
· | Debt extinguishment costs | 113 | - | |
· | Restructuring charge | 18 | - | |
· | Effects of Pepco divestiture-related claims | 6 | - | |
· | Mirant bankruptcy settlement | - | (24) | |
· | Maryland income tax benefit | - | (11) | |
Net Earnings from Continuing Operations, Excluding Special Items | $276 | $188 | ||
Earnings per Share from Continuing Operations | Twelve Months Ended December 31, | ||
2010 | 2009 | ||
Reported (GAAP) Earnings per Share from Continuing Operations | $0.62 | $1.01 | |
Special Items: | |||
· | Debt extinguishment costs | 0.51 | - |
· | Restructuring charge | 0.08 | - |
· | Effects of Pepco divestiture-related claims | 0.03 | - |
· | Mirant bankruptcy settlement | - | (0.11) |
· | Maryland income tax benefit | - | (0.05) |
Earnings per Share from Continuing Operations, Excluding Special Items | $1.24 | $0.85 | |
29
Reconciliation of GAAP Earnings to
Earnings Excluding Special Items
Earnings Excluding Special Items