Exhibit 99.1

2014 Analyst Conference Well Positioned to Deliver Value March 21, 2014 New York, NY Exhibit 99
Safe Harbor Statement/Regulation G Information Some of the statements contained in today’s presentation with respect to Pepco Holdings, Pepco, Delmarva Power and Atlantic C ity Electric, including each of their respective subsidiaries, are forward - looking statements within the meaning of the U.S. federal securitie s laws and are subject to the safe harbor created thereby under the Private Securities Litigation Reform Act of 1995. These statements inclu de declarations regarding the intents, beliefs and current expectations of one or more of PHI, Pepco, DPL or ACE (each, a Reporting Company) or their subsidiaries. In some cases you can identify forward - looking statements by terminology such as “may,” “might,” “will,” “should, ” “could,” “expects,” “intends,” “assumes,” “seeks to,” “plans,” “anticipates,” “believes,” “projects,” “estimates,” “predicts,” “potent ial ,” “future,” “goal,” “objective,” or “continue”, the negative or other variations of such terms, or comparable terminology, or by discussions of s tra tegy that involve risks and uncertainties. Forward - looking statements involve estimates, assumptions, known and unknown risks, uncertainties and other factors that may cause one or more Reporting Companies’ or their subsidiaries’ actual results, levels of activity, performance or ach iev ements to be materially different from any future results, levels of activity, performance or achievements expressed or implied by such fo rwa rd - looking statements. Therefore, forward - looking statements are not guarantees or assurances of future performance, and actual results cou ld differ materially from those indicated by the forward - looking statements. These forward - looking statements are qualified in their enti rety by, and should be read together with, the risk factors included in the “Risk Factors” section and other statements in each Reporting Com pany’s annual report on Form 10 - K for the year ended December 31, 2013 filed on February 28, 2014 and in other Securities and Exchange Commiss ion (SEC) filings, and investors should refer to these risk factor sections and such other statements. All such factors are diff icu lt to predict, contain uncertainties, are beyond each Reporting Company’s or its subsidiaries’ control and may cause actual results to differ materi all y from those contained in the forward - looking statements. Any forward - looking statements speak only as of the date of this presentation and none of the Reporting Companies undertakes any obligation to update any forward - looking statements to reflect events or circumstances after the date on which such statements are made or to reflect the occurrence of unanticipated events. New factors emerge from time to time, an d i t is not possible for a Reporting Company to predict all such factors. Furthermore, it may not be possible to assess the impact of an y s uch factor on such Reporting Company’s or its subsidiaries’ business (viewed independently or together with the business or businesses of some or all of the other Reporting Companies or their subsidiaries) or the extent to which any factor, or combination of factors, may cause results to differ materially from those contained in any forward - looking statement. Any specific factors that may be provided should not be constr ued as exhaustive. PHI routinely makes available important information with respect to each Reporting Company, including copies of each Reportin g C ompany’s annual, quarterly and current reports filed with or furnished to the SEC under the Securities Exchange Act of 1934, on PHI’s web site at http://www.pepcoholdings.com/investors. PHI recognizes its website as a key channel of distribution to reach public investor s a nd as a means of disclosing material non - public information to comply with each Reporting Company’s disclosure obligations under SEC Regulatio n FD. PHI discloses net income from continuing operations and related per share data (both as historical information and earnings g uid ance) excluding certain items (non - GAAP financial information) because management believes that these items are not representative of PHI’s ongo ing business operations. Management uses this information, and believes that such information is useful to investors, in evaluating PHI’s per iod - over - period performance. The inclusion of this disclosure is intended to complement, and should not be considered as an alternative to, P HI’ s reported net income from continuing operations and related per share data in accordance with accounting principles generally accepted in t he United States (GAAP).
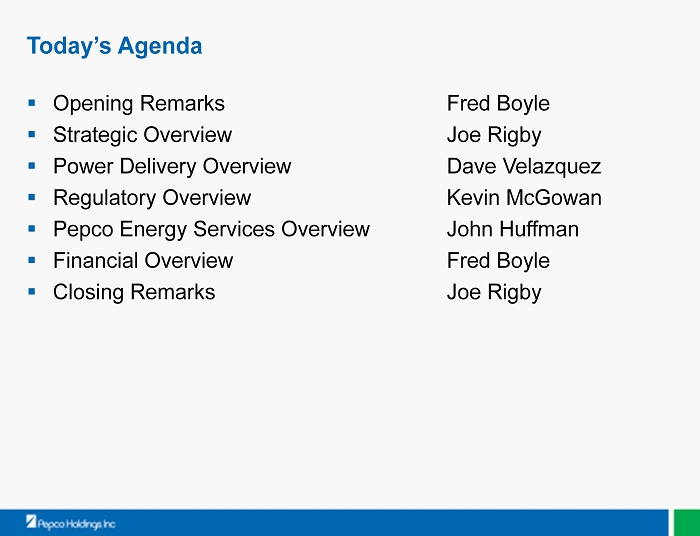
Today’s Agenda ▪ Opening Remarks Fred Boyle ▪ Strategic Overview Joe Rigby ▪ Power Delivery Overview Dave Velazquez ▪ Regulatory Overview Kevin McGowan ▪ Pepco Energy Services Overview John Huffman ▪ Financial Overview Fred Boyle ▪ Closing Remarks Joe Rigby

Strategic Overview Joe Rigby, Chairman, President & Chief Executive Officer
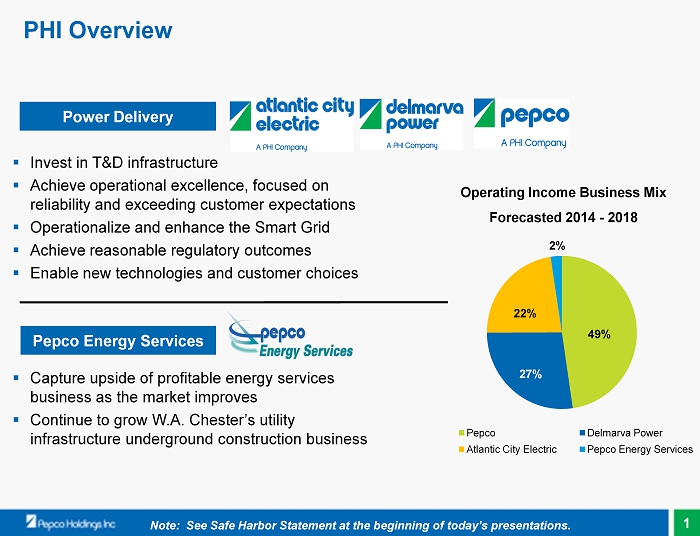
Pepco Delmarva Power Atlantic City Electric Pepco Energy Services PHI Overview ▪ Invest in T&D infrastructure ▪ Achieve operational excellence, focused on reliability and exceeding customer expectations ▪ Operationalize and enhance the Smart Grid ▪ Achieve reasonable regulatory outcomes ▪ Enable new technologies and customer choices Power Delivery Pepco Energy Services ▪ Capture upside of profitable energy services business as the market improves ▪ Continue to grow W.A. Chester’s utility infrastructure underground construction business Operating Income Business Mix Forecasted 2014 - 2018 2% Note: See Safe Harbor Statement at the beginning of today’s presentations. 27% 22% 49% 1
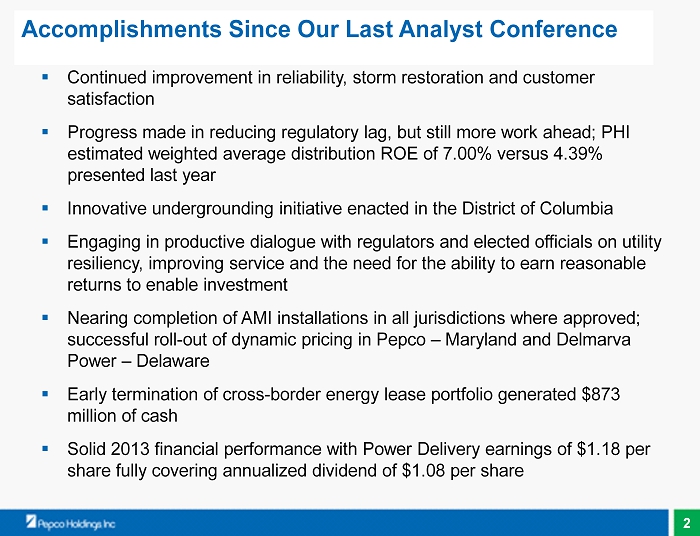
Accomplishments Since Our Last Analyst Conference ▪ Continued improvement in reliability, storm restoration and customer satisfaction ▪ Progress made in reducing regulatory lag, but still more work ahead; PHI estimated weighted average distribution ROE of 7.00% versus 4.39% presented last year ▪ Innovative undergrounding initiative enacted in the District of Columbia ▪ Engaging in productive dialogue with regulators and elected officials on utility resiliency, improving service and the need for the ability to earn reasonable returns to enable investment ▪ Nearing completion of AMI installations in all jurisdictions where approved; successful roll - out of dynamic pricing in Pepco – Maryland and Delmarva Power – Delaware ▪ Early termination of cross - border energy lease portfolio generated $873 million of cash ▪ Solid 2013 financial performance with Power Delivery earnings of $1.18 per share fully covering annualized dividend of $1.08 per share 2

2014 Objectives Continue to Improve the Customer Experience Deliver Value to Customers and Investors with Emerging Technologies and Services Grow Earnings and Achieve Above Average Total Return Achieve Regulatory Outcomes that Improve Earned Returns ▪ Exceed customer expectations ▪ Invest $1.3 billion in T&D infrastructure ▪ Continue to implement the Smart Grid, including new functionality ▪ Pursue innovative opportunities to improve system resiliency, such as DC Undergrounding ▪ Build on Smart Grid and communications platform ▪ Evaluate Utility 2.0 opportunities ( microgrids , integration of distributed generation resources, “big data”, etc.) ▪ Prepare to implement an enhanced customer relationship system - SolutionOne ▪ Continue to drive internal cultural transformation ▪ Pursue collaborative dialogue with regulators and government officials ▪ Continue to file annual rate cases ▪ Monitor spend relative to rate case outcomes ▪ Shape policy discussions that preserve value of T&D assets, while providing customers with enhanced service through expanded offerings ▪ Grow rate base ▪ Improve earned ROEs by reducing regulatory lag ▪ Maintain solid credit metrics and ample liquidity ▪ Maintain the dividend with full support from utility earnings Note: See Safe Harbor Statement at the beginning of today’s presentations. 3

$0 $2 $4 $6 $8 $10 $12 $14 (Billions of Dollars) 21% 79% 25% 75% 23% 77% 23% 77% $7.0 $6.1 ($3.2) $9.9 2013 Rate Base Estimate Plant Placed In Service Depreciation/ Other 2018 Rate Base Projection Rate base expected to increase ~40 % by 2018 Strong T&D Infrastructure Growth ■ Transmission ■ Distribution Note: See Safe Harbor Statement at the beginning of today’s presentations. 4
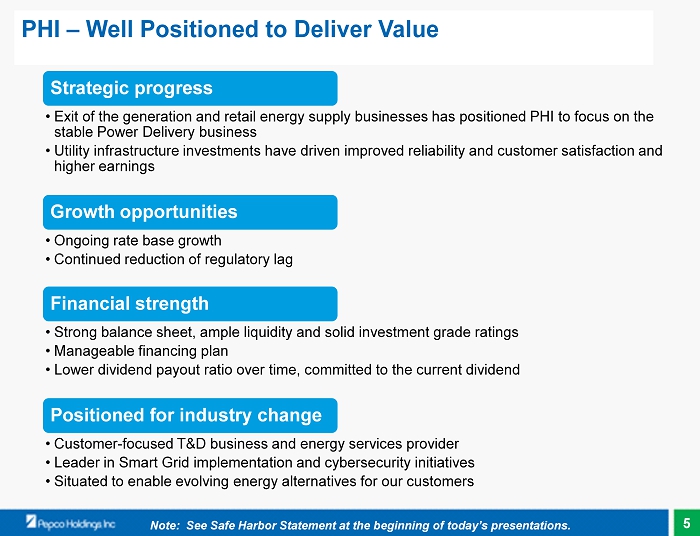
PHI – Well Positioned to Deliver Value Strategic progress • Exit of the generation and retail energy supply businesses has positioned PHI to focus on the stable Power Delivery business • Utility infrastructure investments have driven improved reliability and customer satisfaction and higher earnings Growth opportunities • Ongoing rate base growth • Continued reduction of regulatory lag Financial strength • Strong balance sheet, ample liquidity and solid investment grade ratings • Manageable financing plan • Lower dividend payout ratio over time, committed to the current dividend Positioned for industry change • Customer - focused T&D business and energy services provider • Leader in Smart Grid implementation and cybersecurity initiatives • Situated to enable evolving energy alternatives for our customers Note: See Safe Harbor Statement at the beginning of today’s presentations. 5

Power Delivery Overview Dave Velazquez, Executive Vice President, Power Delivery

Operating Company Service Customers GWh Bcf Service Area Population Electric 801,000 25,801 N/A 640 square miles - District of Columbia, major portions of Prince George's and Montgomery Counties in Maryland 2.2 Million Electric 506,000 12,465 N/A 5,000 square miles - Delmarva Peninsula 1.4 Million Gas 126,000 N/A 20 275 square miles - Northern Delaware .5 Million Electric 545,000 9,231 N/A 2,700 square miles - Southern one-third of New Jersey 1.1 Million Totals 1,978,000 47,497 20 8,340 square miles 2013 Annual Data Combined Service Territory Power Delivery – Overview 1
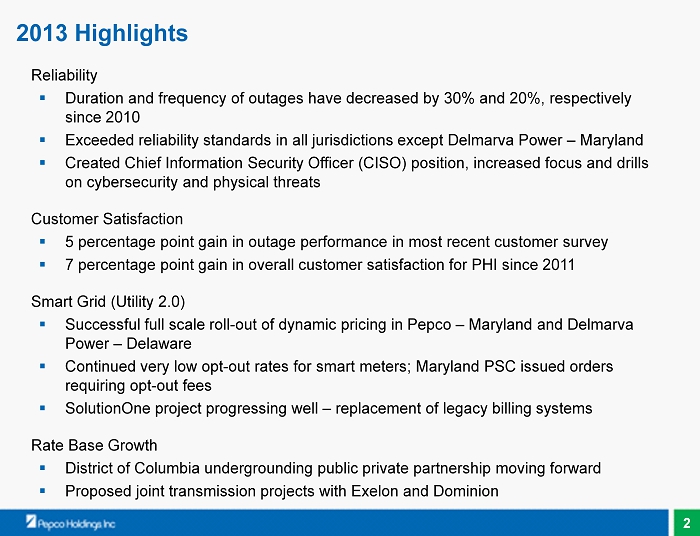
Reliability ▪ Duration and frequency of outages have decreased by 30% and 20%, respectively since 2010 ▪ Exceeded reliability standards in all jurisdictions except Delmarva Power – Maryland ▪ Created Chief Information Security Officer (CISO) position, increased focus and drills on cybersecurity and physical threats Customer Satisfaction ▪ 5 percentage point gain in outage performance in most recent customer survey ▪ 7 percentage point gain in overall customer satisfaction for PHI since 2011 Smart Grid (Utility 2.0) ▪ Successful full scale roll - out of dynamic pricing in Pepco – Maryland and Delmarva Power – Delaware ▪ Continued very low opt - out rates for smart meters; Maryland PSC issued orders requiring opt - out fees ▪ SolutionOne project progressing well – replacement of legacy billing systems Rate Base Growth ▪ District of Columbia undergrounding public private partnership moving forward ▪ Proposed joint transmission projects with Exelon and Dominion 2013 Highlights 2

▪ Improving reliability and customer service ▪ Investing in transmission and distribution infrastructure ▪ Implementing Smart Grid • Complete the activation of smart meters in Delmarva Power – Maryland • Continue wide - spread roll - out of dynamic pricing ▪ Preparing for the conversion of our legacy billing systems in early 2015 ▪ Executing our regulatory strategy 2014 Focus – Continuing to Build on 2013 Progress We remain focused on exceeding our customers’ expectations Note: See Safe Harbor Statement at the beginning of today’s presentations. 3
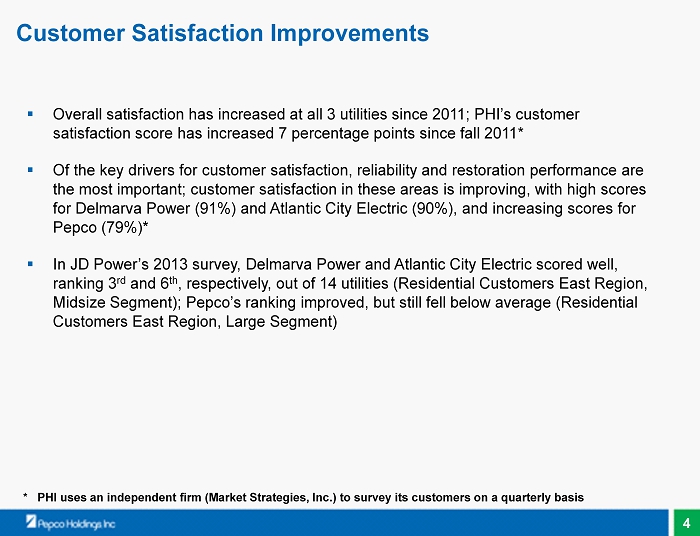
▪ Overall satisfaction has increased at all 3 utilities since 2011; PHI’s customer satisfaction score has increased 7 percentage points since fall 2011* ▪ Of the key drivers for customer satisfaction, reliability and restoration performance are the most important; customer satisfaction in these areas is improving, with high scores for Delmarva Power (91%) and Atlantic City Electric (90%), and increasing scores for Pepco (79 %)* ▪ In JD Power’s 2013 survey, Delmarva Power and Atlantic City Electric scored well, ranking 3 rd and 6 th , respectively, out of 14 utilities (Residential Customers East Region, Midsize Segment); Pepco’s ranking improved, but still fell below average (Residential Customers East Region, Large Segment ) * PHI uses an independent firm (Market Strategies, Inc.) to survey its customers on a quarterly basis Customer Satisfaction Improvements 4
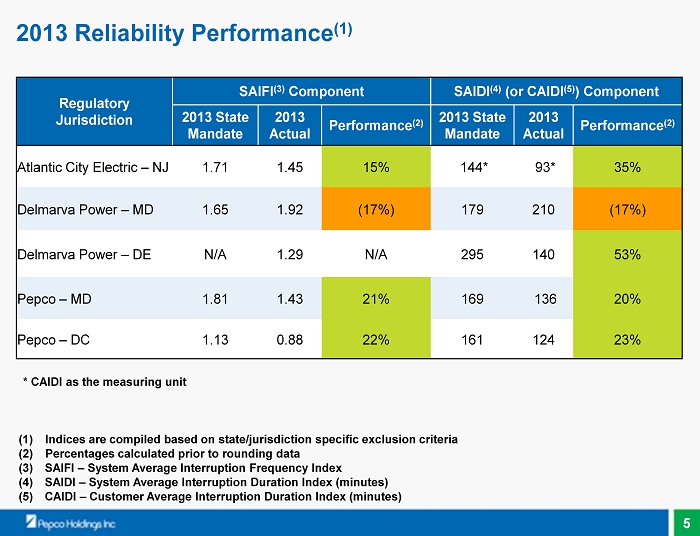
2013 Reliability Performance (1 ) Regulatory Jurisdiction SAIFI (3) Component SAIDI (4) ( or CAIDI (5) ) Component 2013 State Mandate 2013 Actual Performance (2) 2013 State Mandate 2013 Actual Performance (2) Atlantic City Electric – NJ 1.71 1.45 15% 144* 93* 35% Delmarva Power – MD 1.65 1.92 ( 17%) 179 210 ( 17%) Delmarva Power – DE N/A 1.29 N/A 295 140 53% Pepco – MD 1.81 1.43 21% 169 136 20% Pepco – DC 1.13 0.88 22% 161 124 23% * CAIDI as the measuring unit (1) Indices are compiled based on state/jurisdiction specific exclusion criteria (2) Percentages calculated prior to rounding data (3) SAIFI – System Average Interruption Frequency Index (4) SAIDI – System Average Interruption Duration Index (minutes) (5) CAIDI – Customer Average Interruption Duration Index (minutes) 5

Reliability Performance - Pepco – Maryland Jurisdiction In 2012, the Maryland PSC Rule Making (RM) 43, “Reliability and Service Quality Standards,” established reliability standards which the electric utilities are required to meet. Code of Maryland Regulations (COMAR) defines which major events are excluded. COMAR criteria differ from the Institute of Electrical and Electronics Engineers (IEEE) criteria. Notes: 1.99 1.36 1.43 1.95 1.81 1.61 1.49 2.15 0.0 0.5 1.0 1.5 2.0 2.5 2011 2012 2013 2014 2015 Actual Performance Mandated SAIFI Avg. Performance (2007-11) Pepco - MD Performance vs. RM43 Standard SAIFI Component (COMAR Exclusion) SAIFI 215 159 136 191 169 155 143 276 0 80 160 240 320 400 2011 2012 2013 2014 2015 Actual Performance Mandated SAIDI Avg. Performance (2007-11) Pepco - MD Performance vs. RM43 Standard SAIDI Component (COMAR Exclusion) SAIDI (minutes) 10% 45% SAIFI in 2013 meets the 2015 RM43 requirements SAIDI in 2013 meets the 2015 RM43 requirements 6
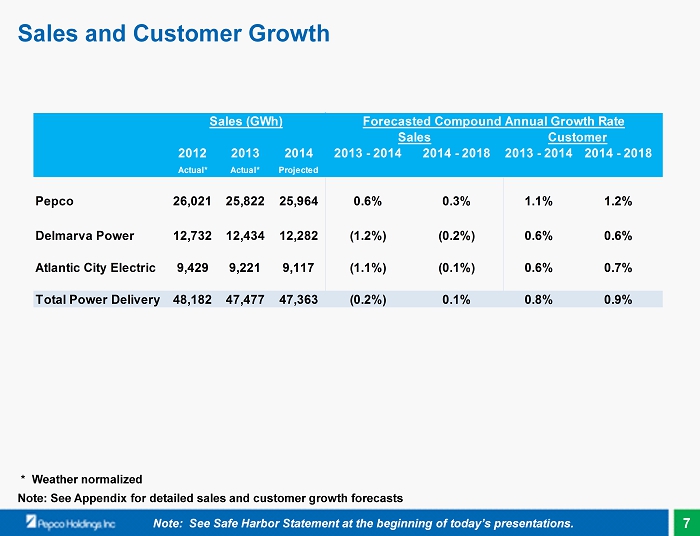
Note: See Appendix for detailed sales and customer growth forecasts Sales and Customer Growth Note: See Safe Harbor Statement at the beginning of today’s presentations. 2012 2013 2014 2013 - 2014 2014 - 2018 2013 - 2014 2014 - 2018 Actual* Actual* Projected Pepco 26,021 25,822 25,964 0.6% 0.3% 1.1% 1.2% Delmarva Power 12,732 12,434 12,282 (1.2%) (0.2%) 0.6% 0.6% Atlantic City Electric 9,429 9,221 9,117 (1.1%) (0.1%) 0.6% 0.7% Total Power Delivery 48,182 47,477 47,363 (0.2%) 0.1% 0.8% 0.9% Forecasted Compound Annual Growth Rate Sales Customer Sales (GWh) * Weather normalized 7
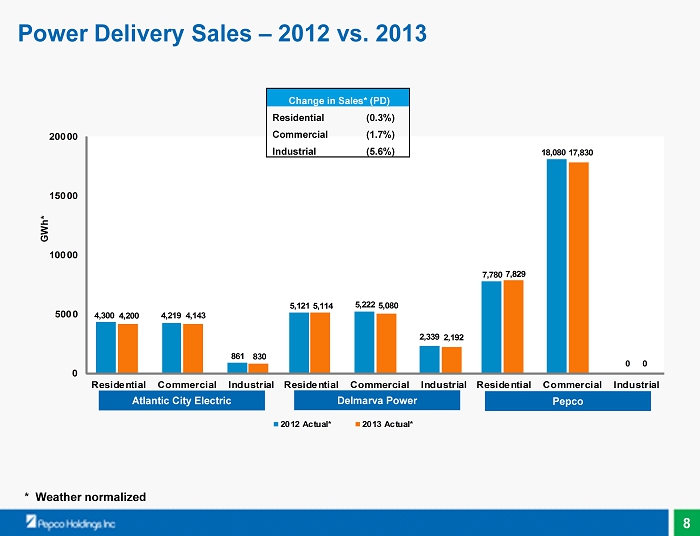
4,300 5,121 7,780 4,200 5,114 7,829 4,219 5,222 18,080 4,143 5,080 17,830 2,339 0 861 830 2,192 0 0 5000 10000 15000 20000 Residential Commercial Industrial ACE Residential Commercial Industrial DPL Residential Commercial Industrial Pepco GWh* 2012 Actual* 2013 Actual* Change in Sales* (PD) Residential (0.3%) Commercial ( 1.7%) Industrial ( 5.6%) Power Delivery Sales – 2012 vs. 2013 * Weather normalized Atlantic City Electric Delmarva Power Pepco 8
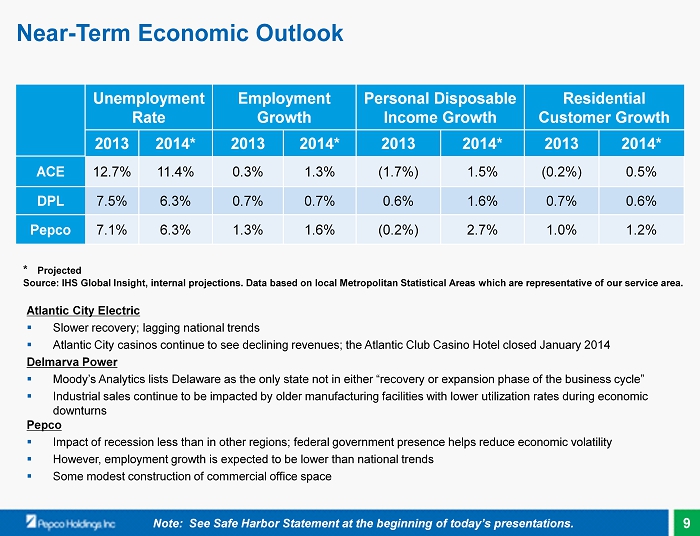
Atlantic City Electric ▪ Slower recovery; lagging national trends ▪ Atlantic City casinos continue to see declining revenues; the Atlantic Club Casino Hotel closed January 2014 Delmarva Power ▪ Moody’s Analytics lists Delaware as the only state not in either “recovery or expansion phase of the business cycle” ▪ Industrial sales continue to be impacted by older manufacturing facilities with lower utilization rates during economic downturns Pepco ▪ Impact of recession less than in other regions; federal government presence helps reduce economic volatility ▪ However, employment growth is expected to be lower than national trends ▪ Some modest construction of commercial office space * Projected Source : IHS Global Insight, internal projections. Data based on local Metropolitan Statistical Areas which are representative of our service area . Near - Term Economic Outlook Note: See Safe Harbor Statement at the beginning of today’s presentations. Unemployment Rate Employment Growth Personal Disposable Income Growth Residential Customer Growth 2013 2014* 2013 2014* 2013 2014* 2013 2014* ACE 12.7% 11.4% 0.3% 1.3% (1.7%) 1.5% (0.2%) 0.5% DPL 7.5% 6.3% 0.7% 0.7% 0.6% 1.6% 0.7% 0.6% Pepco 7.1% 6.3% 1.3% 1.6% (0.2%) 2.7% 1.0% 1.2% 9
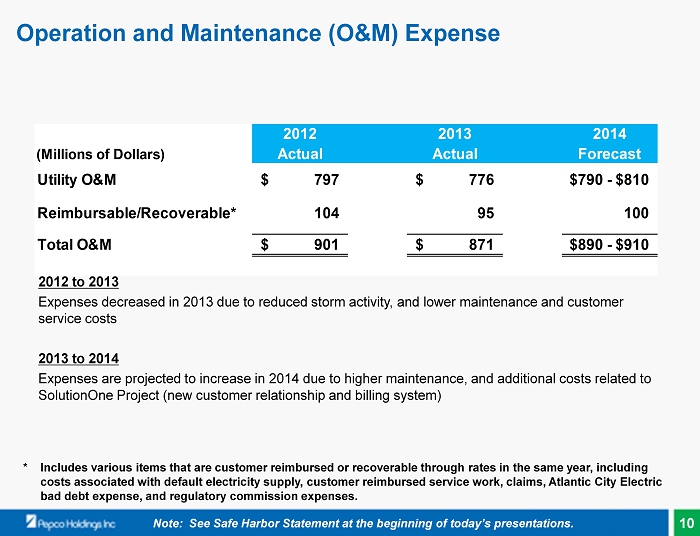
Operation and Maintenance (O&M) Expense * Includes various items that are customer reimbursed or recoverable through rates in the same year, including costs associated with default electricity supply, customer reimbursed service work, claims, Atlantic City Electric bad debt expense, and regulatory commission expenses . Note: See Safe Harbor Statement at the beginning of today’s presentations. (Millions of Dollars) Utility O&M 797$ 776$ $790 - $810 Reimbursable/Recoverable* 104 95 100 Total O&M 901$ 871$ $890 - $910 2012 Actual 2013 Actual 2014 Forecast 2012 to 2013 Expenses decreased in 2013 due to reduced storm activity, and lower maintenance and customer service costs 2013 to 2014 Expenses are projected to increase in 2014 due to higher maintenance, and additional costs related to SolutionOne Project (new customer relationship and billing system) 10
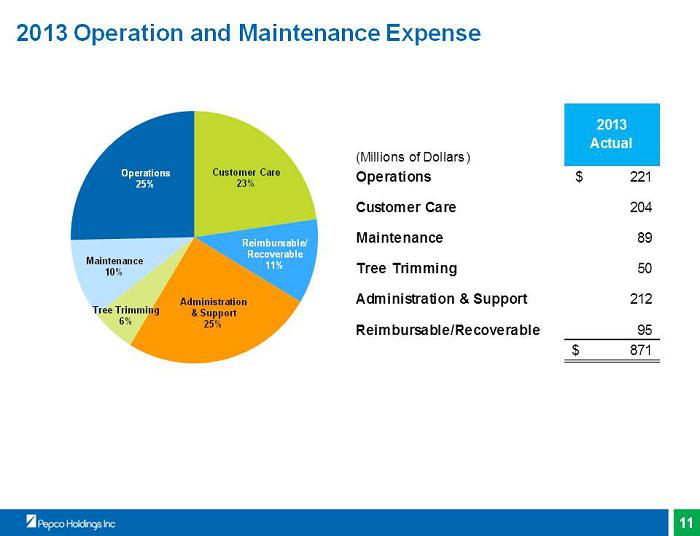
Customer Care 23% Reimbursable/ Recoverable 11% Administration & Support 25% Tree Trimming 6% 0 Maintenance 10% 0 Operations 25% 2013 Operation and Maintenance Expense (Millions of Dollars) 2013 Actual Operations 221$ Customer Care 204 Maintenance 89 Tree Trimming 50 Administration & Support 212 Reimbursable/Recoverable 95 871$ 11
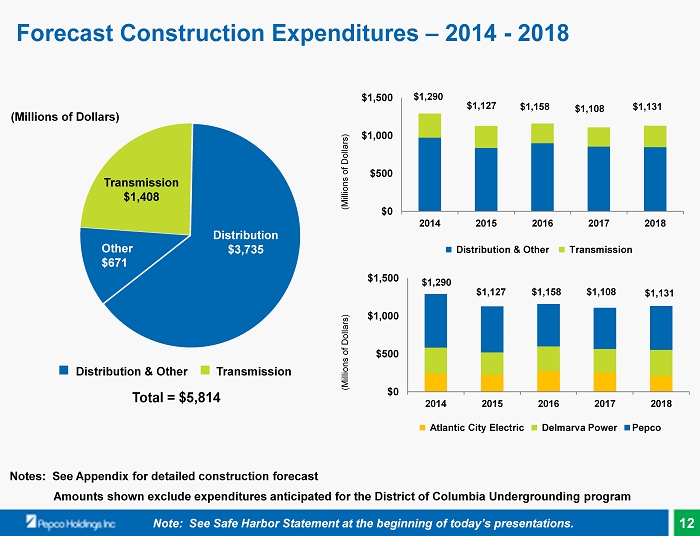
Notes: See Appendix for detailed construction forecast Amounts shown exclude expenditures anticipated for the District of Columbia Undergrounding program Distribution $ 3,797 Other $670 $ 1,290 $ 1,127 $ 1,158 $ 1,108 $ 1,131 (Millions of Dollars) Total = $ 5,814 ■ Distribution & Other ■ Transmission (Millions of Dollars) Transmission $ 1,408 Distribution $ 3,735 Other $671 $0 $500 $1,000 $1,500 2014 2015 2016 2017 2018 $0 $500 $1,000 $1,500 2014 2015 2016 2017 2018 ■ Distribution & Other ■ Transmission $ 1,290 $ 1,127 $ 1,158 $ 1,108 $ 1,131 ■ Atlantic City Electric ■ Delmarva Power ■ Pepco Forecast Construction Expenditures – 2014 - 2018 Note: See Safe Harbor Statement at the beginning of today’s presentations. (Millions of Dollars) 12
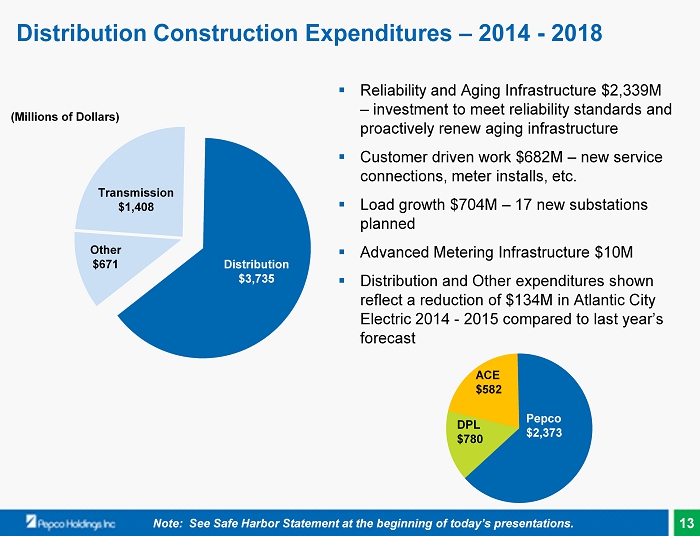
(Millions of Dollars) ▪ Reliability and Aging Infrastructure $2,339M – investment to meet reliability standards and proactively renew aging infrastructure ▪ Customer driven work $682M – new service connections, meter installs, etc. ▪ Load growth $704M – 17 new substations planned ▪ Advanced Metering Infrastructure $10M ▪ Distribution and Other expenditures shown reflect a reduction of $134M in Atlantic City Electric 2014 - 2015 compared to last year’s forecast Distribution $ 3,797 Distribution $ 3,797 Other $671 Transmission $ 1,408 Distribution $3,735 ACE $582 DPL $780 Pepco $2,373 Distribution Construction Expenditures – 2014 - 2018 Note: See Safe Harbor Statement at the beginning of today’s presentations. 13

Smart Grid – Customer Benefits (In Service/Pilot) Customer ▪ Peak Energy Savings Credits (Dynamic Pricing) ▪ Energy Wise Rewards (Direct Load Control ) ▪ Web - based Thermostat Control ▪ Energy Efficiency Programs ▪ Web presentment of Daily & Hourly U sage ▪ Green Button ▪ Home Energy Reports ▪ In Home Displays of Consumption (pilot) ▪ Electric Vehicle Charging rates (pilot) ▪ Conservation Voltage Reduction (pilot) Customer ▪ Energy Advisor Conversations ▪ Bill to Date and Projected Monthly Bill ▪ Outage Detection ▪ Outage Restoration ▪ Remote Disconnect and Reconnect ▪ Improved Reliability Power Delivery ▪ Reduce Manual Meter Reading Costs ▪ Improve Billing Activities ▪ Reduce Off - Cycle Meter Reading Costs ▪ Asset Optimization ▪ Other Operational Efficiencies ▪ Automatic Switching and Restoration Supply 70% Delivery 30% Average Residential Bill Focus is shifting from installing the infrastructure to implementing new uses for the customer and integrating into operations 14
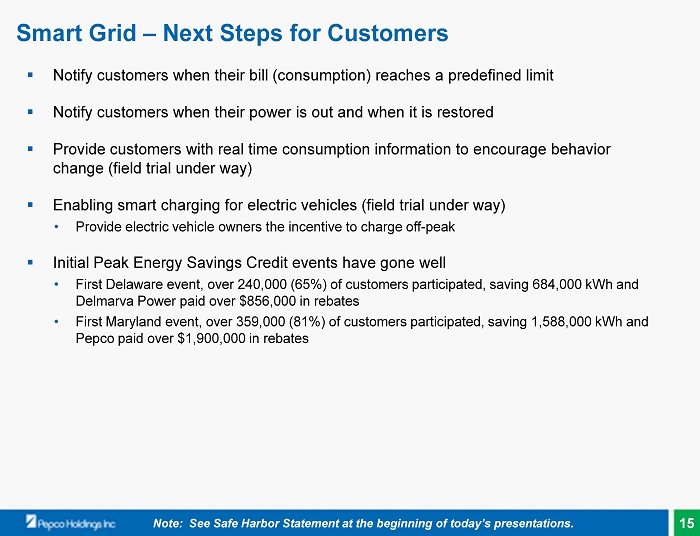
Smart Grid – Next Steps for Customers ▪ Notify customers when their bill (consumption) reaches a predefined limit ▪ Notify customers when their power is out and when it is restored ▪ Provide customers with real time consumption information to encourage behavior change (field trial under way) ▪ Enabling smart charging for electric vehicles (field trial under way) • Provide electric vehicle owners the incentive to charge off - peak ▪ Initial Peak Energy Savings Credit events have gone well • First Delaware event, over 240,000 ( 65%) of customers participated, saving 684,000 kWh and Delmarva Power paid over $856,000 in rebates • First Maryland event, over 359,000 (81%) of customers participated, saving 1,588,000 kWh and Pepco paid over $1,900,000 in rebates Note: See Safe Harbor Statement at the beginning of today’s presentations. 15

Smart Grid – Next Steps for Operations ▪ Processing outage and restore notifications from smart meters (in use) • Continue to realize operational savings from avoided “truck rolls” ▪ Conservation Voltage Reduction (under way) • Using smart meter data, we can lower voltage without violating operating standards • Net effect to customers - lower energy consumption and total cost ▪ High temperature at the meter (field trial under way) • Dispatch crews as a precaution when the temperature exceeds threshold ▪ Measuring transformer loading (field trial under way) • Anticipate when a distribution transformer approaches its operating limits • Replace a transformer as a “planned” outage, not an “unplanned” outage ▪ Power Quality Analysis • Measuring and correcting voltage irregularities customers may be experiencing ▪ Theft Analysis • Identify potential energy theft through consumption analysis coupled with digital alarms sent by the meter 16

▪ S uccessfully interconnected over 9,800 customer renewable energy systems ( 192 MW); another 2,350 ( 107 MW) are in process ▪ The number of these customers has been steadily growing; customers grew 36% in 2013 over 2012 ▪ W orking on an advanced modeling program to rapidly provide the studies necessary to safely connect these systems to the grid ▪ W orking on using advanced inverter designs that communicate with the grid and allow a higher level of voltage control; utility co - lead in Department of Energy (DOE) Sunshot program ▪ A warded a DOE grant to investigate advanced strategies of voltage regulation as solar penetration increases ▪ Next challenge will be to develop a rate structure so that customers displacing a portion of their energy usage will pay for their fair share of the grid; our other customers are currently subsidizing almost $4 million of costs for these customers Renewable Integration – Current Status Utility Customer Installations Atlantic City Electric 5,318 Delmarva Power 1,715 Pepco 2,805 Total 9,838 Note: See Safe Harbor Statement at the beginning of today’s presentations. 17

Electric Grid Delivers Value to Our Customers 24 by 7 Electricity Startup Power Grid Supplied Power Voltage Quality Source: Electric Power Research Institute (EPRI) 18
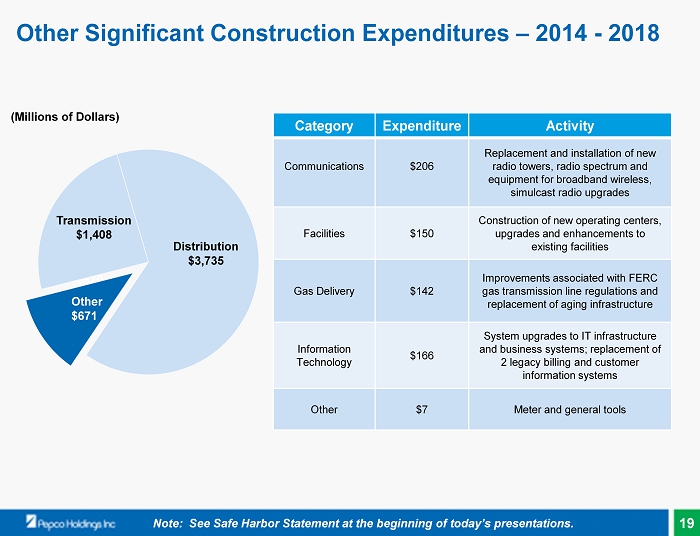
Other $670 Category Expenditure Activity Communications $206 Replacement and installation of new radio towers, radio spectrum and equipment for broadband wireless, simulcast radio upgrades Facilities $150 Construction of new operating centers, upgrades and enhancements to existing facilities Gas Delivery $142 Improvements associated with FERC gas transmission line regulations and replacement of aging infrastructure Information Technology $166 System upgrades to IT infrastructure and business systems; r eplacement of 2 legacy billing and customer information systems Other $7 Meter and general tools Other Significant Construction Expenditures – 2014 - 2018 Transmission $1,408 Distribution $ 3,735 Other $671 Note: See Safe Harbor Statement at the beginning of today’s presentations. (Millions of Dollars) 19
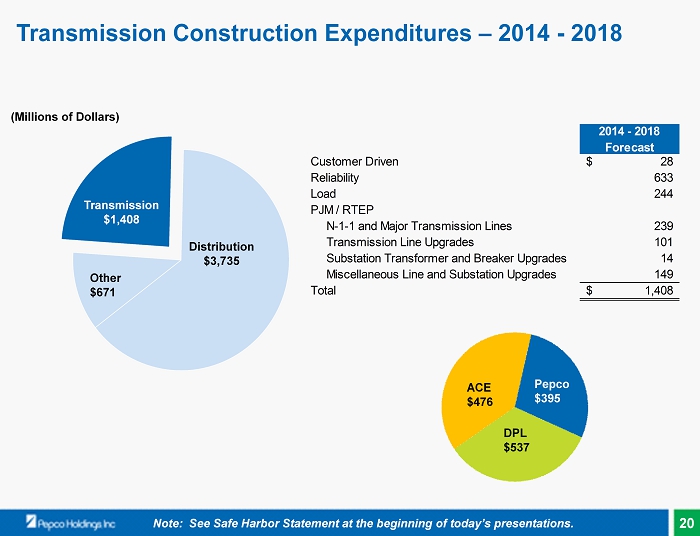
Transmission $ 1,340 Transmission $1,408 Distribution $ 3,735 Other $671 ACE $476 DPL $537 Pepco $395 Transmission Construction Expenditures – 2014 - 2018 Note: See Safe Harbor Statement at the beginning of today’s presentations. 2014 - 2018 Forecast Customer Driven 28$ Reliability 633 Load 244 PJM / RTEP N-1-1 and Major Transmission Lines 239 Transmission Line Upgrades 101 Substation Transformer and Breaker Upgrades 14 Miscellaneous Line and Substation Upgrades 149 Total 1,408$ (Millions of Dollars) 20

Project Timeframe Status Anticipated Cost Recovery Cost District of Columbia Undergrounding Program 2015 – 2021 Legislation Signed Surcharge $500M* NJ Grid Resiliency Program 2014 – 2020 Proposal Presented Surcharge $600 - $800M Artificial Island Transmission Project 2014 – 2020 Under Consideration by PJM Formula Rates $150 - $200M* Dominion Transmission Zone ( Glebe Road – Potomac River Station Project) 2014 – 2018 Approved by PJM Board Formula Rates $60 – $70M* Construction Expenditures – Planned and Potential Additions * Cost reflects only PHI’s portion of the project. Total costs of project are greater. Note: See Safe Harbor Statement at the beginning of today’s presentations. 21

Pepco Undergrounding Status – District of Columbia ▪ On March 3, 2014, the Mayor of the District of Columbia signed into law the $1 billion undergrounding legislation initially recommended by the District of Columbia’s Power Line Undergrounding Task Force ▪ The legislation is expected to become law early in the second quarter of 2014 following a 30 - day Congressional review period ▪ Recovery of expenditures is well defined in the legislation and will not result in additional regulatory lag ▪ Once the legislation becomes law, Pepco will submit a financing plan and a construction plan, including surcharge cost recovery, to the Public Service Commission; approval is expected in the fourth quarter of 2014 ▪ The program will underground up to 60 high voltage distribution feeder lines over a seven to ten year period in areas most impacted by storms and overhead related outages ▪ Annual staffing levels during construction will be over 650 personnel inclusive of Pepco and District Department of Transportation (DDOT) labor forces; DDOT to perform conduit installation, and Pepco will complete the electrical work ▪ Funding will be split 50/50 between Pepco and the District of Columbia (Millions of Dollars) 2015 2016 2017 2018 2019 2020 2021 Total Capital Expenditures* $50 $75 $75 $75 $75 $75 $75 $500 Note: See Safe Harbor Statement at the beginning of today’s presentations. * Amounts shown above are not included in the company’s current capital expenditure plan 22
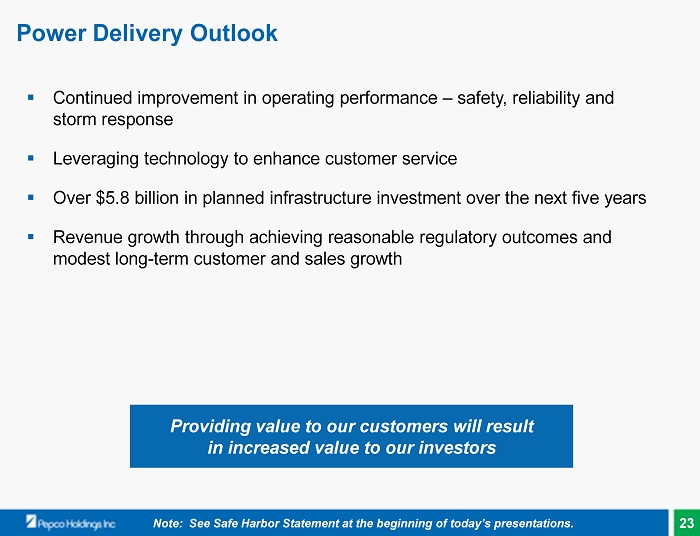
Note: See Safe Harbor Statement at the beginning of today’s presentations. Power Delivery Outlook Providing value to our customers will result in increased value to our investors ▪ Continued improvement in operating performance – safety, reliability and storm response ▪ Leveraging technology to enhance customer service ▪ Over $5.8 billion in planned infrastructure investment over the next five years ▪ Revenue growth through achieving reasonable regulatory outcomes and modest long - term customer and sales growth 23
Power Delivery Overview Dave Velazquez, Executive Vice President, Power Delivery

Appendix
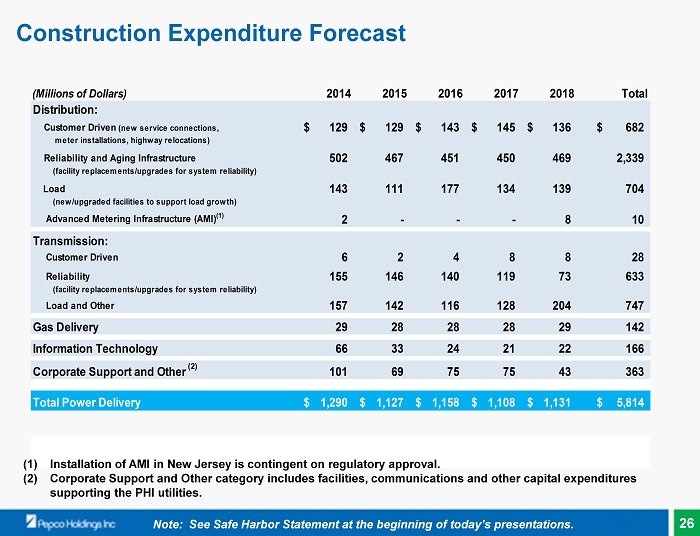
(Millions of Dollars) 2014 2015 2016 2017 2018 Total Distribution: Customer Driven (new service connections, 129$ 129$ 143$ 145$ 136$ 682$ meter installations, highway relocations) Reliability and Aging Infrastructure 502 467 451 450 469 2,339 (facility replacements/upgrades for system reliability) Load 143 111 177 134 139 704 (new/upgraded facilities to support load growth) Advanced Metering Infrastructure (AMI) (1) 2 - - - 8 10 Transmission: Customer Driven 6 2 4 8 8 28 Reliability 155 146 140 119 73 633 (facility replacements/upgrades for system reliability) Load and Other 157 142 116 128 204 747 Gas Delivery 29 28 28 28 29 142 Information Technology 66 33 24 21 22 166 Corporate Support and Other (2) 101 69 75 75 43 363 Total Power Delivery 1,290$ 1,127$ 1,158$ 1,108$ 1,131$ 5,814$ Note: See Safe Harbor Statement at the beginning of today’s presentations. (1) Installation of AMI in New Jersey is contingent on regulatory approval. (2) Corporate Support and Other category includes facilities, communications and other capital expenditures supporting the PHI utilities. Construction Expenditure Forecast 26

Note: See Safe Harbor Statement at the beginning of today’s presentations. (Millions of Dollars) 2014 2015 2016 2017 2018 Total Potomac Electric Power Company Distribution 505$ 480$ 481$ 442$ 465$ 2,373$ Distribution – Advanced Metering - - - - - - Transmission 113 74 43 74 91 395 Other 91 54 36 29 23 233 Total Pepco 709$ 608$ 560$ 545$ 579$ 3,001$ Delmarva Power & Light Company Distribution 162$ 149$ 153$ 159$ 155$ 778$ Distribution - Advanced Metering 2 - - - - 2 Transmission 96 88 119 96 138 537 Gas Delivery 29 28 28 28 29 142 Other 51 32 24 28 20 155 Total DPL 340$ 297$ 324$ 311$ 342$ 1,614$ Atlantic City Electric Company Distribution 107$ 78$ 137$ 128$ 124$ 574$ Distribution - Advanced Metering - - - - 8 8 Transmission 109 128 98 85 56 476 Other 25 16 39 39 22 141 Total ACE 241$ 222$ 274$ 252$ 210$ 1,199$ Power Delivery Distribution 774$ 707$ 771$ 729$ 744$ 3,725$ Distribution - Advanced Metering 2 - - - 8 10 Transmission 318 290 260 255 285 1,408 Gas Delivery 29 28 28 28 29 142 Other 167 102 99 96 65 529 Total for Power Delivery Business 1,290$ 1,127$ 1,158$ 1,108$ 1,131$ 5,814$ Construction Expenditure Forecast 27
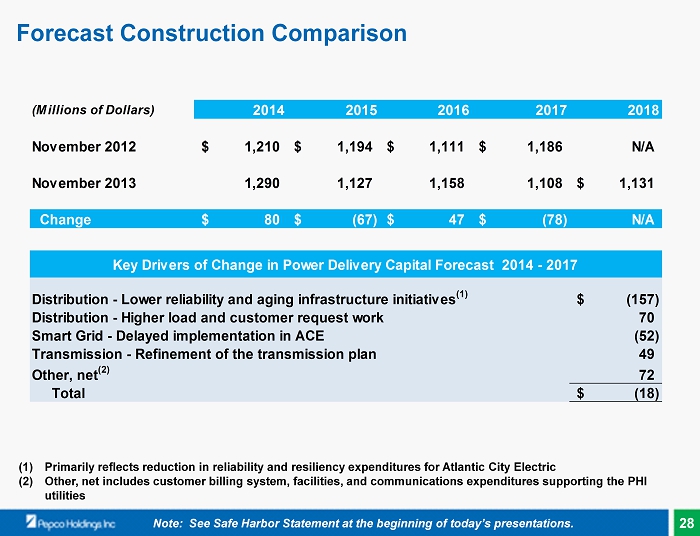
(Millions of Dollars) 2014 2015 2016 2017 2018 November 2012 1,210$ 1,194$ 1,111$ 1,186$ N/A November 2013 1,290 1,127 1,158 1,108 1,131$ Change 80$ (67)$ 47$ (78)$ N/A (157)$ 70 (52) 49 72 (18)$ Other, net (2) Total Key Drivers of Change in Power Delivery Capital Forecast 2014 - 2017 Distribution - Lower reliability and aging infrastructure initiatives (1) Distribution - Higher load and customer request work Smart Grid - Delayed implementation in ACE Transmission - Refinement of the transmission plan Note: See Safe Harbor Statement at the beginning of today’s presentations. Forecast Construction Comparison (1) Primarily reflects reduction in reliability and resiliency expenditures for Atlantic City Electric (2) Other, net includes customer billing system, facilities, and communications expenditures supporting the PHI utilities 28
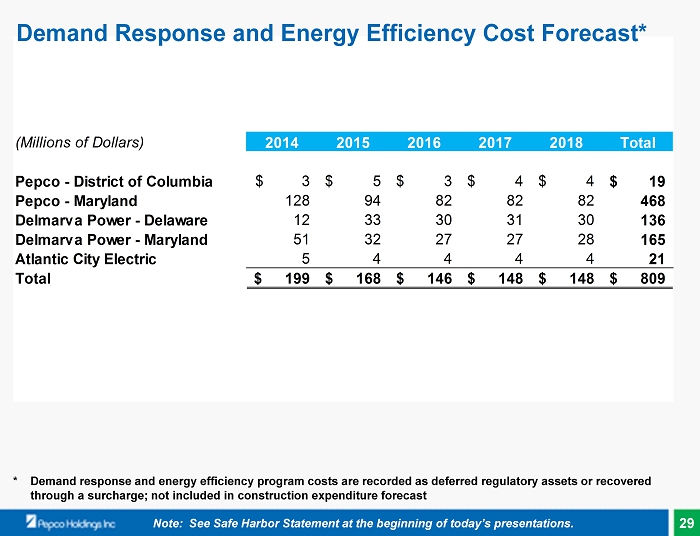
(Millions of Dollars) 2014 2015 2016 2017 2018 Total Pepco - District of Columbia 3$ 5$ 3$ 4$ 4$ 19$ Pepco - Maryland 128 94 82 82 82 468 Delmarva Power - Delaware 12 33 30 31 30 136 Delmarva Power - Maryland 51 32 27 27 28 165 Atlantic City Electric 5 4 4 4 4 21 Total 199$ 168$ 146$ 148$ 148$ 809$ * Demand response and energy efficiency program costs are recorded as deferred regulatory assets or recovered through a surcharge; not included in construction expenditure forecast Note: See Safe Harbor Statement at the beginning of today’s presentations. Demand Response and Energy Efficiency Cost Forecast* 29
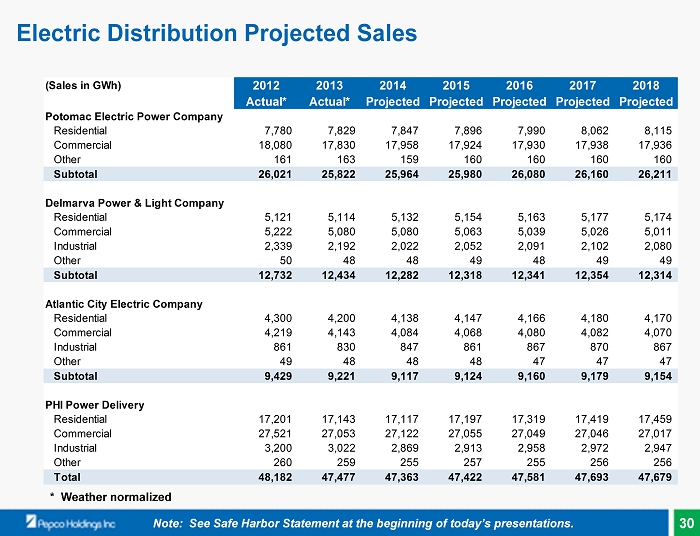
Note: See Safe Harbor Statement at the beginning of today’s presentations. * Weather normalized Electric Distribution Projected Sales (Sales in GWh) 2012 2013 2014 2015 2016 2017 2018 Actual* Actual* Projected Projected Projected Projected Projected Potomac Electric Power Company Residential 7,780 7,829 7,847 7,896 7,990 8,062 8,115 Commercial 18,080 17,830 17,958 17,924 17,930 17,938 17,936 Other 161 163 159 160 160 160 160 Subtotal 26,021 25,822 25,964 25,980 26,080 26,160 26,211 Delmarva Power & Light Company Residential 5,121 5,114 5,132 5,154 5,163 5,177 5,174 Commercial 5,222 5,080 5,080 5,063 5,039 5,026 5,011 Industrial 2,339 2,192 2,022 2,052 2,091 2,102 2,080 Other 50 48 48 49 48 49 49 Subtotal 12,732 12,434 12,282 12,318 12,341 12,354 12,314 Atlantic City Electric Company Residential 4,300 4,200 4,138 4,147 4,166 4,180 4,170 Commercial 4,219 4,143 4,084 4,068 4,080 4,082 4,070 Industrial 861 830 847 861 867 870 867 Other 49 48 48 48 47 47 47 Subtotal 9,429 9,221 9,117 9,124 9,160 9,179 9,154 PHI Power Delivery Residential 17,201 17,143 17,117 17,197 17,319 17,419 17,459 Commercial 27,521 27,053 27,122 27,055 27,049 27,046 27,017 Industrial 3,200 3,022 2,869 2,913 2,958 2,972 2,947 Other 260 259 255 257 255 256 256 Total 48,182 47,477 47,363 47,422 47,581 47,693 47,679 30

* End - of - period amounts Note: See Safe Harbor Statement at the beginning of today’s presentations. Residential Electric Distribution Projected Customers 2012 2013 2014 2015 2016 2017 2018 Actual Actual Projected Projected Projected Projected Projected Pepco Residential 719,820 727,001 735,724 745,143 754,749 764,553 774,616 Annual Increase 1.0% 1.2% 1.3% 1.3% 1.3% 1.3% Delmarva Power Residential 442,235 445,267 447,925 450,692 453,393 455,964 458,435 Annual Increase 0.7% 0.6% 0.6% 0.6% 0.6% 0.5% Atlantic City Electric Residential 478,956 478,023 480,322 483,580 486,814 489,994 493,106 Annual Increase -0.2% 0.5% 0.7% 0.7% 0.7% 0.6% Total Power Delivery Residential 1,641,011 1,650,291 1,663,971 1,679,415 1,694,956 1,710,511 1,726,157 Annual Increase 0.6% 0.8% 0.9% 0.9% 0.9% 0.9% Electric Customers* 31

Power Delivery Electric Customer Analysis By Jjdududududu (Thousands) December 2013 December 2012 Change % Change from Prior Year Pepco 801 793 8 1.0% District of Columbia 264 260 4 1.5% Maryland 537 533 4 0.7% Delmarva Power 506 503 3 0.6% Delaware 305 303 2 0.7% Maryland 201 200 1 0.5% Atlantic City Electric 545 545 0 0.0% New Jersey 545 545 0 0.0% Total Power Delivery 1,852 1,841 11 0.6% 32

Artificial Island Transmission Project ▪ On April 29 th , PJM issued a Request for Proposals that would mitigate reliability and operational performance issues associated with the nuclear units at Artificial Island (near Salem, New Jersey) ▪ PHI submitted a joint proposal with Exelon to extend a transmission line from Artificial Island to Peach Bottom substation ($ 475M project; 60 month construction schedule) ▪ The PHI/Exelon bid was one of approximately 26 proposals received by PJM. PJM has narrowed the list to 230kV and 500kV projects that stop at sites along the Delmarva peninsula (4 – 230kV and 5 – 500kV proposals) ▪ The PHI/Exelon proposal provided several variations that could be considered by PJM including a line that stopped at the Red Lion substation on the peninsula. This portion of our proposal is still under consideration ▪ We expect a decision from PJM late in the third quarter of 2014 ▪ Project estimate (PHI portion): $150M - $ 200M Note: See Safe Harbor Statement at the beginning of today’s presentations. 33
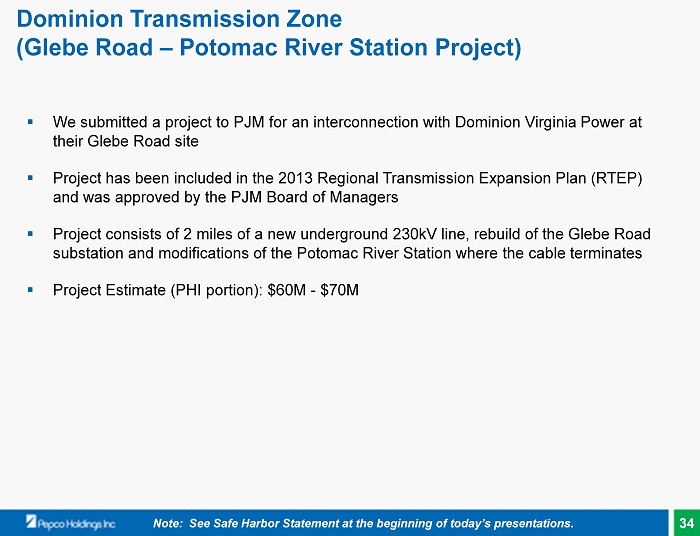
Dominion Transmission Zone (Glebe Road – Potomac River Station Project) ▪ We submitted a project to PJM for an interconnection with Dominion Virginia Power at their Glebe Road site ▪ Project has been included in the 2013 Regional Transmission Expansion Plan (RTEP) and was approved by the PJM Board of Managers ▪ Project consists of 2 miles of a new underground 230kV line, rebuild of the Glebe Road substation and modifications of the Potomac River Station where the cable terminates ▪ Project Estimate (PHI portion): $ 60M - $ 70M Note: See Safe Harbor Statement at the beginning of today’s presentations. 34
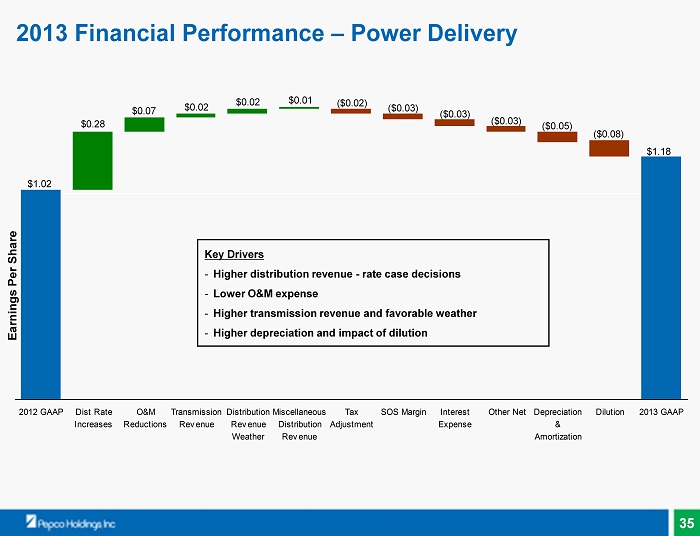
2012 GAAP Dist Rate Increases O&M Reductions Transmission Revenue Distribution Revenue Weather Miscellaneous Distribution Revenue Tax Adjustment SOS Margin Interest Expense Other Net Depreciation & Amortization Dilution 2013 GAAP Earnings Per Share $1.02 ( $0.05) ( $0.03) ( $0.03) ( $0.02) $ 0.02 $ 0.07 $1.18 $0.01 $ 0.02 $ 0.28 Key Drivers - Higher distribution revenue - rate case decisions - Lower O&M expense - Higher transmission revenue and favorable weather - Higher depreciation and impact of dilution ( $0.03) ( $0.08) 2013 Financial Performance – Power Delivery 35

Regulatory Overview Kevin McGowan, Vice President, Regulatory Affairs
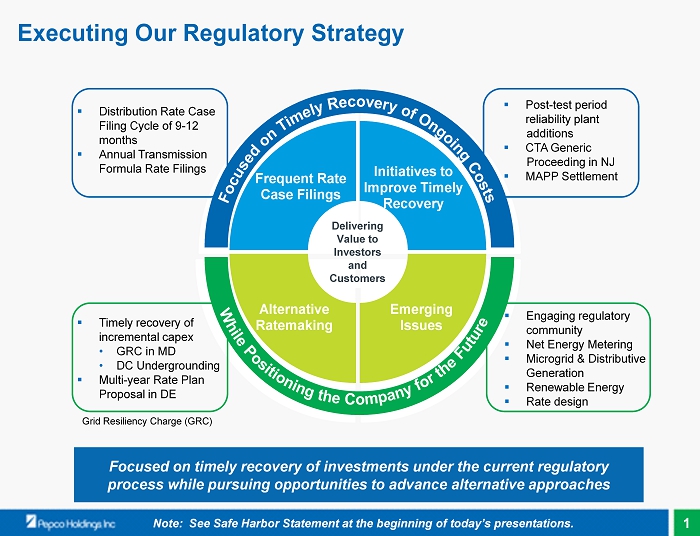
▪ Timely recovery of incremental capex • GRC in MD • DC Undergrounding ▪ Multi - year Rate Plan Proposal in DE ▪ Engaging regulatory community ▪ Net Energy Metering ▪ Microgrid & Distributive Generation ▪ Renewable Energy ▪ Rate design ▪ Post - test period reliability plant additions ▪ CTA Generic Proceeding in NJ ▪ MAPP Settlement ▪ Distribution Rate Case Filing Cycle of 9 - 12 months ▪ Annual Transmission Formula Rate Filings Executing Our Regulatory Strategy Focused on timely recovery of investments under the current regulatory process while pursuing opportunities to advance alternative approaches Frequent Rate Case Filings Initiatives to Improve Timely Recovery Emerging Issues Alternative Ratemaking Delivering Value to Investors and Customers Note: See Safe Harbor Statement at the beginning of today’s presentations. Grid Resiliency Charge (GRC) 1
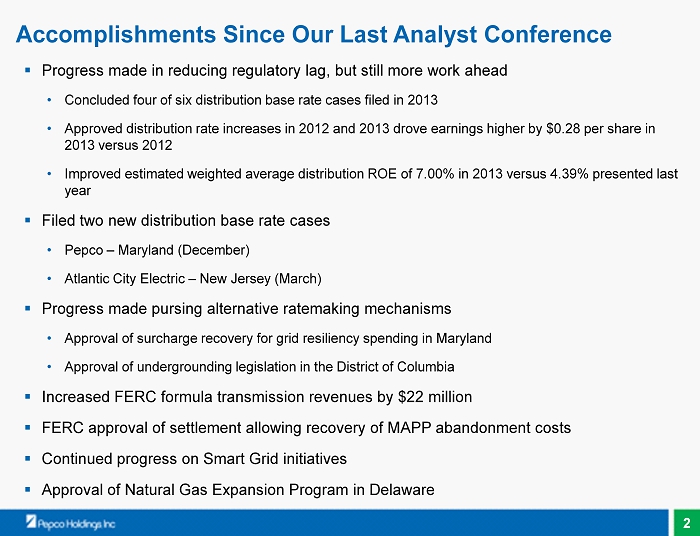
▪ Progress made in reducing regulatory lag, but still more work ahead • Concluded four of six distribution base rate cases filed in 2013 • Approved distribution rate increases in 2012 and 2013 drove earnings higher by $0.28 per share in 2013 versus 2012 • Improved estimated weighted average distribution ROE of 7.00% in 2013 versus 4.39% presented last year ▪ Filed two new distribution base rate cases • Pepco – Maryland (December) • Atlantic City Electric – New Jersey (March) ▪ Progress made pursing alternative ratemaking mechanisms • Approval of surcharge recovery for grid r esiliency spending in Maryland • Approval of undergrounding legislation in the District of Columbia ▪ Increased FERC formula transmission revenues by $22 million ▪ FERC approval of settlement allowing recovery of MAPP abandonment costs ▪ Continued progress on Smart Grid initiatives ▪ Approval of Natural Gas Expansion Program in Delaware Accomplishments Since Our Last Analyst Conference 2

▪ Timely recovery of investments and improvement in earned ROEs • File and manage new rate cases in most jurisdictions • Proposals for post - test period capital and operations and maintenance expenditures ▪ Continue to pursue alternative approaches for timely cost recovery • Multi - year rate plan in Delaware • Current recovery of incremental capital expenditures ▪ Defend the challenges to our t ransmission ROE and f ormula r ate process ▪ Continue advocating in New Jersey for the elimination of the Consolidated Tax Adjustment ▪ Manage the appeal of the 2013 Pepco – Maryland rate case decision ▪ Engage the regulatory community on current and emerging issues within the company and the utility industry Regulatory Focus for 2014 Note: See Safe Harbor Statement at the beginning of today’s presentations. 3

Transmission MD 28% DC 20% NJ 17% DE 14 % FERC 21% Regulatory Environment Percentage of 2013 Year End Rate Base Note: See Safe Harbor Statement at the beginning of today’s presentations. Leveraging Our Strengths Addressing Our Challenges ▪ Regulatory diversity ▪ Improved overall tone ▪ Formula transmission rates ▪ Opportunities for significant grid resiliency investment ▪ Decreasing energy supply costs ▪ Aligned with customers to reduce energy usage ▪ Regulatory lag ▪ Economy in certain jurisdictions ▪ Slow customer growth ▪ Aging infrastructure ▪ Resistance to change the current cost recovery model Distribution 4
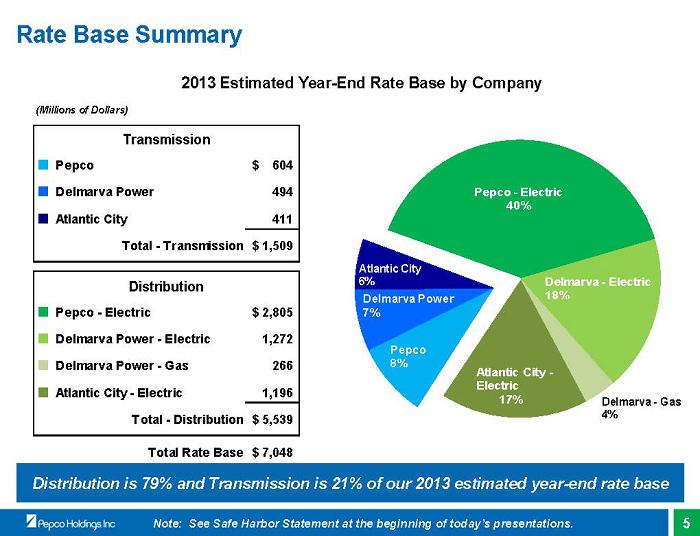
Rate Base Summary Pepco - Electric 40% Delmarva - Electric 18% Delmarva - Gas 4% Atlantic City - Electric 17% Series1 8% Series1 7% Series1 6% 2013 Estimated Year - End Rate Base by Company Distribution Pepco - Electric, $1,912 40% Distribution Delmarva - Gas, $231 4% Pepco 8% Delmarva Power 7% Atlantic City 6% (Millions of Dollars) ■ Pepco 604$ ■ Delmarva Power 494 ■ Atlantic City 411 Total - Transmission 1,509$ ■ Pepco - Electric 2,805$ ■ Delmarva Power - Electric 1,272 ■ Delmarva Power - Gas 266 ■ Atlantic City - Electric 1,196 Total - Distribution 5,539$ Total Rate Base 7,048$ Transmission Distribution Note: See Safe Harbor Statement at the beginning of today’s presentations. Distribution is 79% and Transmission is 21% of our 2013 estimated year - end rate base 5

Regulatory Distribution Returns on Equity Company/Jurisdiction 12 Month Measurement Period Estimated Rate Base (Millions of Dollars) 2013 Estimated Per Books ROE Authorized ROE 2012 (1) Estimated Per Books ROE Pepco – MD 9/30/13 (Avg. Rate Base) $1,278 7.50% 9.36% 5.24% Pepco – DC 12/31/13 (Avg. Rate Base) $1,333 6.67% 9.50% 5.21% DPL – DE Electric 12/31/13 (Avg. Rate Base) $717 8.84% 9.75% 3.96% DPL – MD 12/31/13 (Avg. Rate Base) $495 8.03% 9.81% (2) 5.59% DPL – DE Gas 12/31/13 (Avg. Rate Base) $258 8.59% 9.75% (2) 6.88% ACE – NJ 12/31/13 (Pd. End Rate Base) $1,196 4.94% 9.75% 1.53% PHI (Weighted Average) 7.00% 9.60% 4.39% (1) Based on 12/31/12 test periods; Atlantic City Electric based on 9/30/12 test period (2) ROE for purposes of calculating the Allowance for Funds Used During Construction ( AFUDC) and regulatory asset carrying costs Note: See Safe Harbor Statement at the beginning of today’s presentations. 6

Regulatory Schedule Note: See Safe Harbor Statement at the beginning of today’s presentations. Q1 2014 Q2 2014 Q3 2014 Q4 2014 Pepco Distribution Rates - DC Delmarva Power Distribution Rates - DE Atlantic City Electric Distribution Rates - NJ Pepco Distribution Rates - MD Delmarva Power Distribution Rates - MD Transmission Formula Rates DC Formal Case No. 1103 Final O rder Expected MD Case No. 9336 Final O rder E xpected DE Docket No. 13 - 115 Final O rder E xpected 2014 FERC Formula R ate F iling; Rates Eff. 6/14 through 5/15 DC Base Rate Case Filing Planned Forward Looking Rate Plan Update Planned MD Base Rate Case Filing Planned MD Base Rate Case Filing Planned NJ Base Rate Case Filed 7
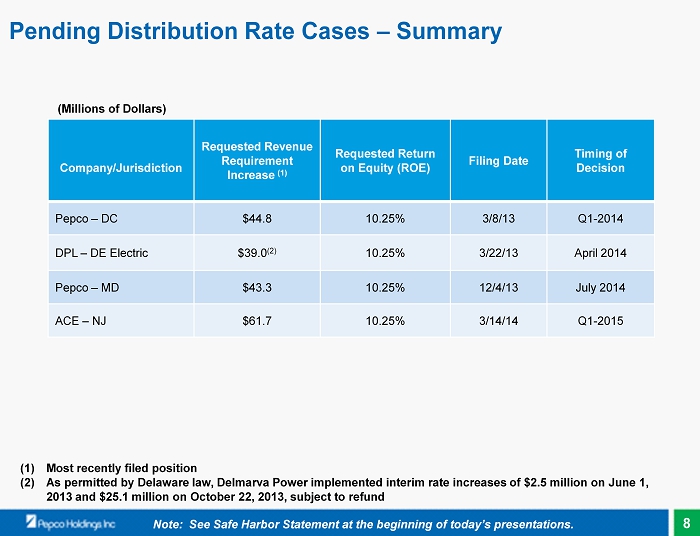
Pending Distribution Rate Cases – Summary Company/Jurisdiction Requested Revenue Requirement Increase (1) Requested Return on Equity (ROE) Filing Date Timing of Decision Pepco – DC $44.8 10.25% 3/8/13 Q1 - 2014 DPL – DE Electric $39.0 (2) 10.25% 3/22/13 April 2014 Pepco – MD $43.3 10.25% 12/4/13 July 2014 ACE – NJ $61.7 10.25% 3/14/14 Q1 - 2015 (Millions of Dollars) Note: See Safe Harbor Statement at the beginning of today’s presentations. (1) Most recently filed position (2) As permitted by Delaware law, Delmarva Power implemented interim rate increases of $2.5 million on June 1, 2013 and $25.1 million on October 22, 2013, subject to refund 8
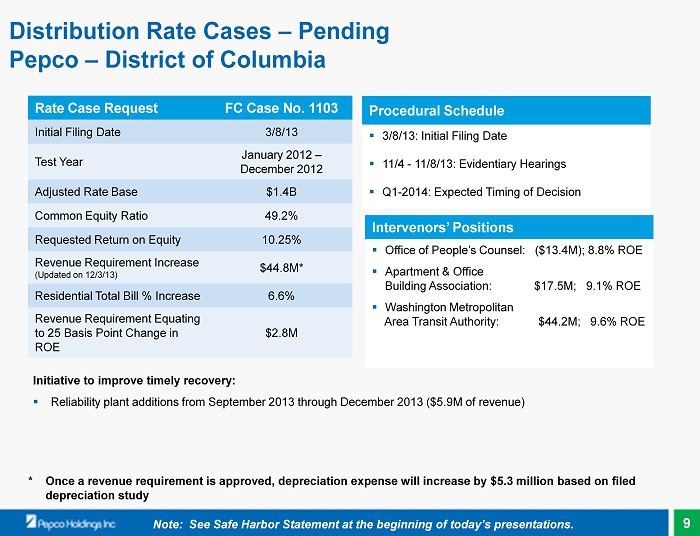
Distribution Rate Cases – Pending Pepco – District of Columbia Note: See Safe Harbor Statement at the beginning of today’s presentations. Rate Case Request FC Case No. 1103 Initial Filing Date 3/8/13 Test Year January 2012 – December 2012 Adjusted Rate Base $1.4B Common Equity Ratio 49.2% Requested Return on Equity 10.25% Revenue Requirement Increase (Updated on 12 /3/13) $44.8M * Residential Total Bill % Increase 6.6% Revenue Requirement Equating to 25 Basis Point Change in ROE $2.8M Procedural Schedule ▪ 3/8/13: Initial Filing Date ▪ 11/4 - 11/8/13: Evidentiary Hearings ▪ Q1 - 2014: Expected Timing of Decision Intervenors’ Positions ▪ Office of People’s Counsel: ($13.4M); 8.8% ROE ▪ Apartment & Office Building Association: $17.5M; 9.1% ROE ▪ Washington Metropolitan Area Transit Authority: $44.2M; 9.6% ROE Initiative to improve timely recovery: ▪ Reliability plant additions from September 2013 through December 2013 ($5.9M of revenue) * Once a revenue requirement is approved, depreciation expense will increase by $ 5.3 million based on filed depreciation study 9
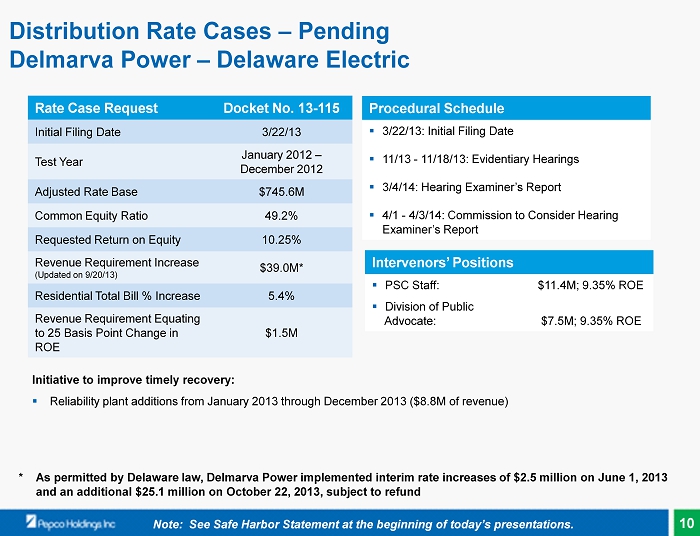
Distribution Rate Cases – Pending Delmarva Power – Delaware Electric Note: See Safe Harbor Statement at the beginning of today’s presentations. Rate Case Request Docket No. 13 - 115 Initial Filing Date 3/22/13 Test Year January 2012 – December 2012 Adjusted Rate Base $745.6M Common Equity Ratio 49.2% Requested Return on Equity 10.25% Revenue Requirement Increase (Updated on 9/20/13) $39.0M * Residential Total Bill % Increase 5.4% Revenue Requirement Equating to 25 Basis Point Change in ROE $1.5M Procedural Schedule ▪ 3/22/13: Initial Filing Date ▪ 11/13 - 11/18/13: Evidentiary Hearings ▪ 3/4/14: Hearing Examiner’s Report ▪ 4/1 - 4/3/14: Commission to Consider Hearing Examiner’s Report Intervenors’ Positions ▪ PSC Staff: $11.4M; 9.35% ROE ▪ Division of Public Advocate: $7.5M; 9.35% ROE Initiative to improve timely recovery: ▪ Reliability plant additions from January 2013 through December 2013 ($8.8M of revenue) * As permitted by Delaware law, Delmarva Power implemented interim rate increases of $2.5 million on June 1, 2013 and an additional $25.1 million on October 22, 2013, subject to refund 10
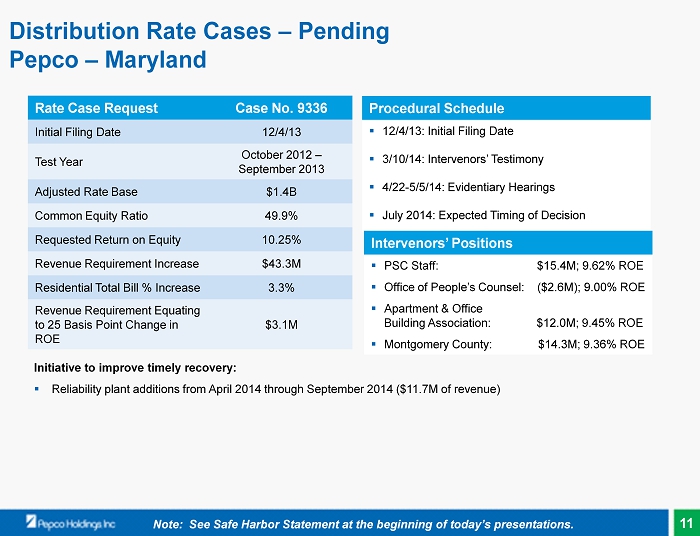
Distribution Rate Cases – Pending Pepco – Maryland Note: See Safe Harbor Statement at the beginning of today’s presentations. Rate Case Request Case No. 9336 Initial Filing Date 12/4/13 Test Year October 2012 – September 2013 Adjusted Rate Base $1.4B Common Equity Ratio 49.9% Requested Return on Equity 10.25% Revenue Requirement Increase $43.3M Residential Total Bill % Increase 3.3% Revenue Requirement Equating to 25 Basis Point Change in ROE $3.1M Procedural Schedule ▪ 12/4/13: Initial Filing Date ▪ 3/10/14: Intervenors’ Testimony ▪ 4/22 - 5/5/14: Evidentiary Hearings ▪ July 2014 : Expected Timing of Decision Initiative to improve timely recovery: ▪ R eliability plant additions from April 2014 through September 2014 ($11.7M of revenue) Intervenors’ Positions ▪ PSC Staff: $15.4M; 9.62% ROE ▪ Office of People’s Counsel: ($2.6M); 9.00% ROE ▪ Apartment & Office Building Association: $12.0M; 9.45% ROE ▪ Montgomery County: $14.3M; 9.36% ROE 11

Distribution Rate Cases – Pending Atlantic City Electric – New Jersey Note: See Safe Harbor Statement at the beginning of today’s presentations. Rate Case Request Initial Filing Date 3/14/14 Test Year January 2013 – December 2013 Adjusted Rate Base $1.4B Common Equity Ratio 50.0% Requested Return on Equity 10.25% Revenue Requirement Increase $61.7M Residential Total Bill % Increase 5.6% Revenue Requirement Equating to 25 Basis Point Change in ROE $2.9 Initiative to improve timely recovery: ▪ Reliability and other plant additions from January 2014 through December 2014 ($ 17.4M of revenue) 12
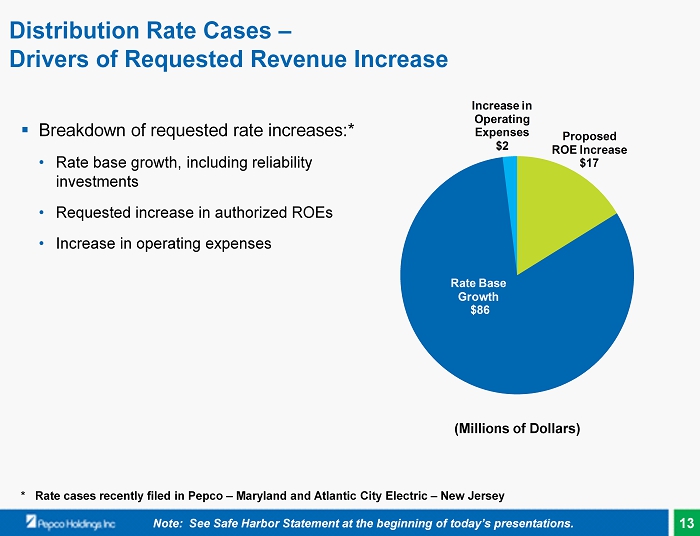
Proposed ROE Increase $17 Rate Base Growth $86 Increase in Operating Expenses $2 Distribution Rate Cases – Drivers of Requested Revenue Increase ▪ Breakdown of requested rate increases:* • Rate base growth, including reliability investments • Requested increase in authorized ROEs • Increase in operating expenses ( Millions of Dollars) Note: See Safe Harbor Statement at the beginning of today’s presentations. * R ate cases recently filed in Pepco – Maryland and Atlantic City Electric – New Jersey 13

Regulatory Information by Commission (1) The District of Columbia PSC allows rates to be developed using a partially forecasted test period. The Company is required to update the test period to all actual within 180 days of the completion of the rate proceeding (2) The statutory deadline for NJBPU decisions has not been successfully enforced by a utility; fully litigated cases can take 12 months or more for decision (3) Chairperson denoted in bold (4) Lester and Conaway holding over Note: See Safe Harbor Statement at the beginning of today’s presentations. Rate Cases District of Columbia Maryland Delaware New Jersey Permitted to file partially forecasted test year? Yes Yes Yes Yes Required to update test year data to actual? No (1) Yes No Yes Timing for rate implementation No statute; target to complete cases within 9 mos. of filing Statute - 7 mos.; rates automatically go into effect subject to refund, unless company agrees to extension Statute - 7 mos.; company files request to implement rates, subject to refund Statute - 9 mos.; company files request to implement rates, subject to refund (2) Time restrictions on initiating subsequent rate filings? No No No No Staff party to case? No Yes Yes Yes Full Time/Part Time Full-Time Full-Time Part-Time Full-Time Appointed/Elected Appointed Appointed Appointed Appointed Length of Term 4 years 5 years 5 years 6 years Name/Term expiration (3) Betty Ann Kane (2014) Kevin Hughes (2018) Dallas Winslow (2015) Diane Solomon (2019) Joanne Doddy Fort (2016) Harold Williams (2017) Jeffrey Clark (2014) Joseph L. Fiordaliso (2014) Vacant Lawrence Brenner (2015) Joann Conaway (2012) (4) Jeanne M. Fox (2014) Kelly Speakes-Backman (2014) Jaymes Lester (2012) (4) Mary-Anna Holden (2018) Anne Hoskins (2016) Vacant Vacant Commissions Commissioners Indicates change from prior year 14
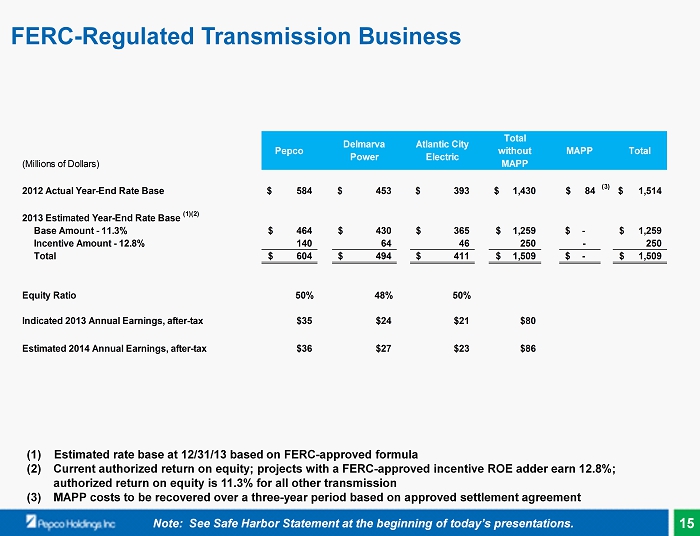
FERC - Regulated Transmission Business (1) Estimated rate base at 12/31/13 based on FERC - approved formula (2) Current authorized return on equity; projects with a FERC - approved incentive ROE adder earn 12.8%; authorized return on equity is 11.3% for all other transmission (3) MAPP costs to be recovered over a three - year period based on approved settlement agreement (Millions of Dollars) Pepco Delmarva Power Atlantic City Electric Total without MAPP MAPP Total 2012 Actual Year-End Rate Base 584$ 453$ 393$ 1,430$ 84$ (3) 1,514$ 2013 Estimated Year-End Rate Base (1)(2) Base Amount - 11.3% 464$ 430$ 365$ 1,259$ -$ 1,259$ Incentive Amount - 12.8% 140 64 46 250 - 250 Total 604$ 494$ 411$ 1,509$ -$ 1,509$ Equity Ratio 50% 48% 50% Indicated 2013 Annual Earnings, after-tax $35 $24 $21 $80 Estimated 2014 Annual Earnings, after-tax $36 $27 $23 $86 Note: See Safe Harbor Statement at the beginning of today’s presentations. 15
Transmission Update ▪ MAPP Abandonment Costs • On February 28, 2014, FERC approved a settlement agreement approving recovery of $80.5 million over three years, and allows PHI to retain title to all real property interests ▪ ROE and Protocol Complaint • On February 27, 2013, a Section 206 complaint was filed at FERC by the state regulatory commissions and consumer advocates of MD, DE, NJ and DC, as well as the Delaware Municipal Electric Corporation (DEMEC) • Complainants seek a reduction to 8.7% for the PHI utilities’ base ROE, as well as a change to the formula rate protocols • PHI filed a response on April 3, 2013 seeking dismissal of the complaint • Awaiting FERC decision on rehearing (no statutory deadlines ) ▪ Preliminary settlement discussions continue on the complaint filed by DEMEC against Delmarva’s 2011, 2012 and 2013 annual formula rate filings Note: See Safe Harbor Statement at the beginning of today’s presentations. 16

Regulatory Summary ▪ Regulatory success is driven by continued focus on improving reliability and customer service ▪ Focused on timely recovery of ongoing costs and reasonable returns on current investments under the current regulatory process ▪ P ursuing opportunities to advance alternative rate making approaches ▪ Focused on enhancing key relationships and engaging the regulatory community on utility industry issues ▪ Addressing emerging issues within the industry Note: See Safe Harbor Statement at the beginning of today’s presentations. 17

Regulatory Overview Kevin McGowan, Vice President, Regulatory Affairs

Appendix
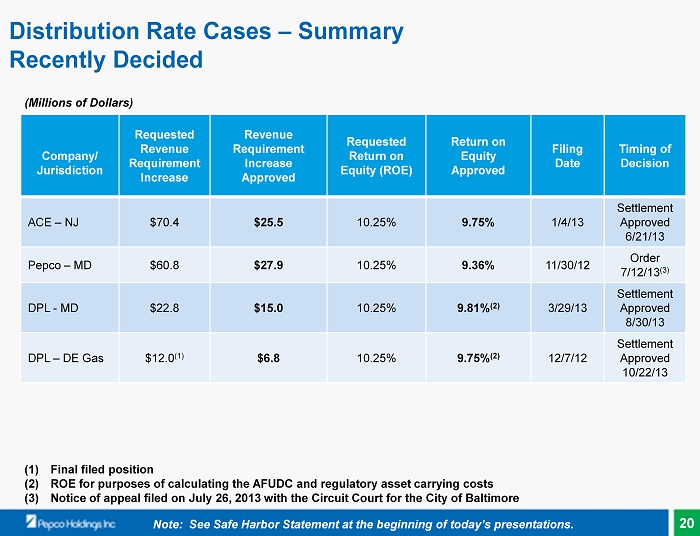
Distribution Rate Cases – Summary Recently Decided Company/ Jurisdiction Requested Revenue Requirement Increase Revenue Requirement Increase Approved Requested Return on Equity (ROE) Return on Equity Approved Filing Date Timing of Decision ACE – NJ $70.4 $25.5 10.25% 9.75% 1/4/13 Settlement Approved 6/21/13 Pepco – MD $60.8 $27.9 10.25% 9.36% 11/30/12 Order 7/12/13 (3) DPL - MD $22.8 $15.0 10.25% 9.81% (2 ) 3/29/13 Settlement Approved 8/30/13 DPL – DE Gas $12.0 (1) $6.8 10.25% 9.75% (2) 12/7/12 Settlement Approved 10/22/13 (Millions of Dollars) Note: See Safe Harbor Statement at the beginning of today’s presentations. (1) Final filed position (2) ROE for purposes of calculating the AFUDC and regulatory asset carrying costs (3) Notice of appeal filed on July 26, 2013 with the Circuit Court for the City of Baltimore 20
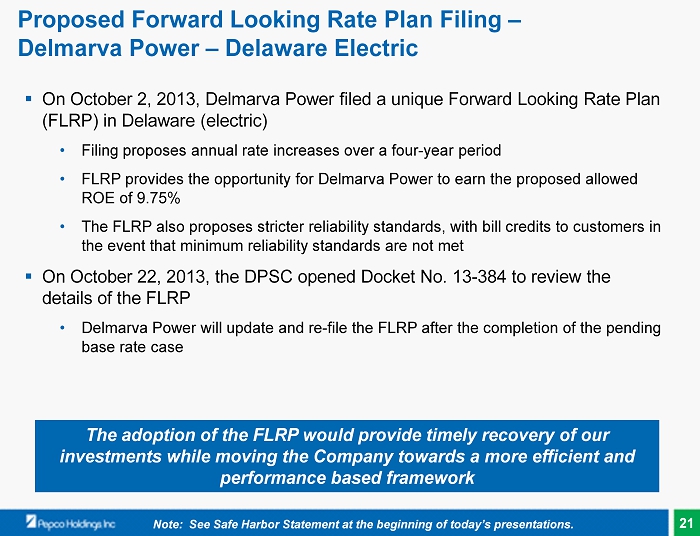
Proposed Forward Looking Rate Plan Filing – Delmarva Power – Delaware Electric ▪ On October 2, 2013, Delmarva Power filed a unique Forward Looking Rate Plan (FLRP) in Delaware (electric) • Filing proposes annual rate increases over a four - year period • FLRP provides the opportunity for Delmarva Power to earn the proposed allowed ROE of 9.75% • The FLRP also proposes stricter reliability standards, with bill credits to customers in the event that minimum reliability standards are not met ▪ O n October 22, 2013, the DPSC opened Docket No. 13 - 384 to review the details of the FLRP • Delmarva Power will update and re - file the FLRP after the completion of the pending base rate case Note: See Safe Harbor Statement at the beginning of today’s presentations. The adoption of the FLRP would provide timely recovery of our investments while moving the Company towards a more efficient and performance based framework 21
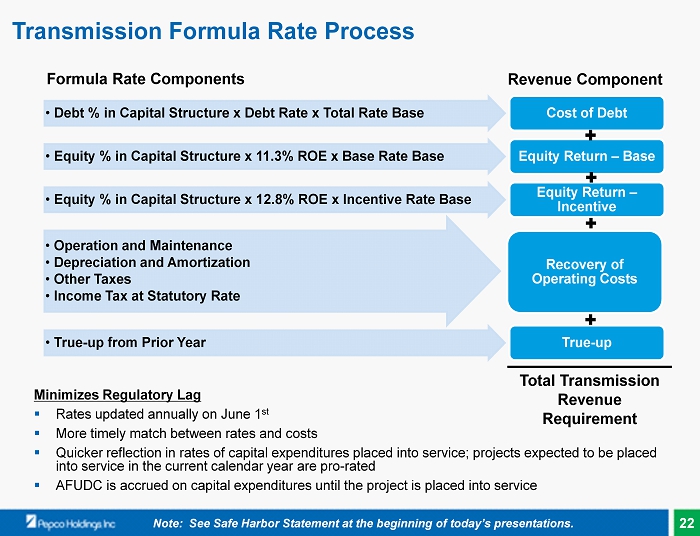
Transmission Formula Rate Process • Debt % in Capital Structure x Debt Rate x Total Rate Base Cost of Debt • Equity % in Capital Structure x 11.3% ROE x Base Rate Base Equity Return – Base • Equity % in Capital Structure x 12.8% ROE x Incentive Rate Base Equity Return – Incentive • Operation and Maintenance • Depreciation and Amortization • Other Taxes • Income Tax at Statutory Rate Recovery of Operating Costs • True - up from Prior Year True - up Formula Rate Components Revenue Component Minimizes Regulatory Lag ▪ Rates updated annually on June 1 st ▪ More timely match between rates and costs ▪ Quicker reflection in rates of capital expenditures placed into service; projects expected to be placed into service in the current calendar year are pro - rated ▪ AFUDC is accrued on capital expenditures until the project is placed into service Total Transmission Revenue Requirement Note: See Safe Harbor Statement at the beginning of today’s presentations. 22
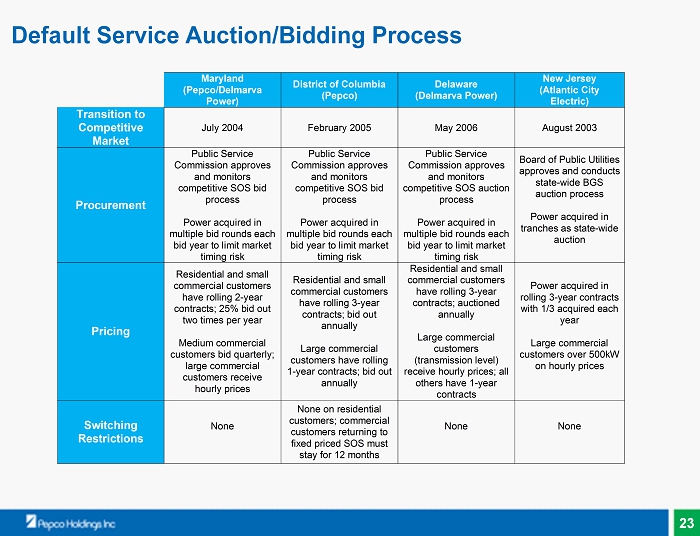
Default Service Auction/Bidding Process Maryland (Pepco/Delmarva Power) District of Columbia (Pepco) Delaware (Delmarva Power) New Jersey (Atlantic City Electric) Transition to Competitive Market July 2004 February 2005 May 2006 August 2003 Procurement Public Service Commission approves and monitors competitive SOS bid process Power acquired in multiple bid rounds each bid year to limit market timing risk Public Service Commission approves and monitors competitive SOS bid process Power acquired in multiple bid rounds each bid year to limit market timing risk Public Service Commission approves and monitors competitive SOS auction process Power acquired in multiple bid rounds each bid year to limit market timing risk Board of Public Utilities approves and conducts state-wide BGS auction process Power acquired in tranches as state-wide auction Pricing Residential and small commercial customers have rolling 2-year contracts; 25% bid out two times per year Medium commercial customers bid quarterly; large commercial customers receive hourly prices Residential and small commercial customers have rolling 3-year contracts; bid out annually Large commercial customers have rolling 1-year contracts; bid out annually Residential and small commercial customers have rolling 3-year contracts; auctioned annually Large commercial customers (transmission level) receive hourly prices; all others have 1-year contracts Power acquired in rolling 3-year contracts with 1/3 acquired each year Large commercial customers over 500kW on hourly prices Switching Restrictions None None on residential customers; commercial customers returning to fixed priced SOS must stay for 12 months None None 23
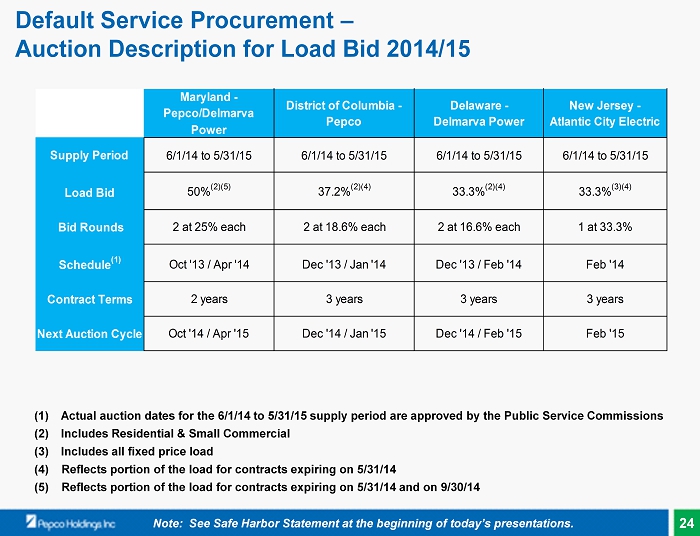
Default Service Procurement – Auction Description for Load Bid 2014/15 Maryland - Pepco/Delmarva Power District of Columbia - Pepco Delaware - Delmarva Power New Jersey - Atlantic City Electric Supply Period 6/1/14 to 5/31/15 6/1/14 to 5/31/15 6/1/14 to 5/31/15 6/1/14 to 5/31/15 Load Bid 50% (2)(5) 37.2% (2)(4) 33.3% (2)(4) 33.3% (3)(4) Bid Rounds 2 at 25% each 2 at 18.6% each 2 at 16.6% each 1 at 33.3% Schedule (1) Oct '13 / Apr '14 Dec '13 / Jan '14 Dec '13 / Feb '14 Feb '14 Contract Terms 2 years 3 years 3 years 3 years Next Auction Cycle Dec '14 / Feb '15 Feb '15 Oct '14 / Apr '15 Dec '14 / Jan '15 (1) Actual auction dates for the 6/1/14 to 5/31/15 supply period are approved by the Public Service Commissions (2) Includes Residential & Small Commercial (3) Includes all fixed price load (4) Reflects portion of the load for contracts expiring on 5/31/14 (5) Reflects portion of the load for contracts expiring on 5/31/14 and on 9/30/14 Note: See Safe Harbor Statement at the beginning of today’s presentations. 24

Pepco Energy Services Overview John Huffman, President and CEO, Pepco Energy Services
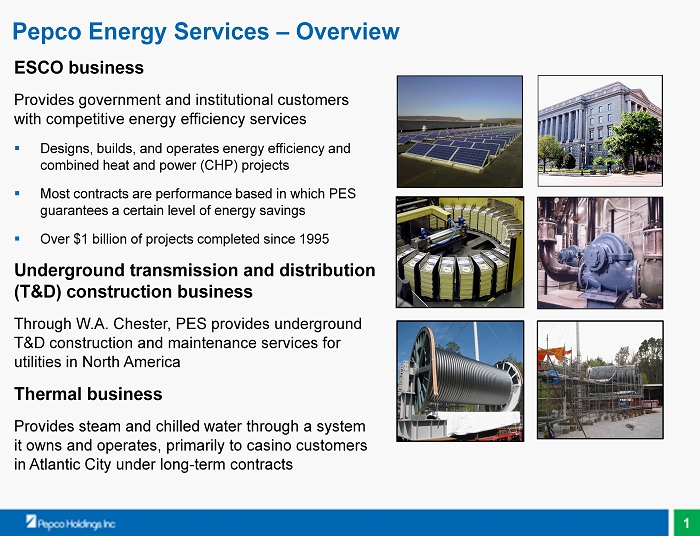
Pepco Energy Services – Overview ESCO business Provides government and institutional customers with competitive energy efficiency services ▪ Designs, builds, and operates energy efficiency and combined heat and power (CHP) projects ▪ Most contracts are performance based in which PES guarantees a certain level of energy savings ▪ Over $1 billion of projects completed since 1995 Underground transmission and distribution (T&D) construction business Through W.A . Chester, PES provides underground T&D construction and maintenance services for utilities in North America Thermal business Provides steam and chilled water through a system it owns and operates, primarily to casino customers in Atlantic City under long - term contracts 1
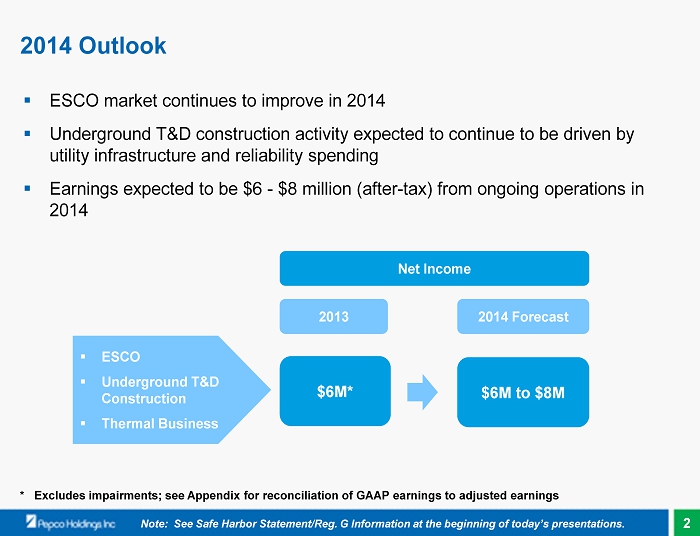
2014 Outlook * Excludes impairments; see Appendix for reconciliation of GAAP earnings to adjusted earnings ▪ ESCO market continues to improve in 2014 ▪ Underground T&D construction activity expected to continue to be driven by utility infrastructure and reliability spending ▪ Earnings expected to be $6 - $8 million (after - tax) from ongoing operations in 2014 $6M* $6M to $8M 2013 2014 Forecast ▪ ESCO ▪ Underground T&D Construction ▪ Thermal Business Net Income Note: See Safe Harbor Statement/Reg. G Information at the beginning of today’s presentations. 2

ESCO Business ▪ The ESCO market has rebounded and continues to improve ▪ PES signed $66 million of ESCO contracts during 2013, up significantly from $9 million in 2012 ▪ While much improved over 2012, market activity has not yet returned to 2010 – 2011 levels • State and local government markets : Improved economic conditions are driving the rebound • Federal market : Presidential Executive Orders 13514 and 13423, the 2007 Energy Independence and Security Act, agency directives, and the President’s 2011 Better Building Challenge continue to drive demand $0 $50 $100 $150 $200 $250 $300 $350 $400 $450 (Millions of Dollars) Energy Efficiency Contracts Signed and Prospective Project Pipeline New Construction Contracts New O&M Contracts Prospective Project Pipeline at year - end 2010 2011 2012 2013 3
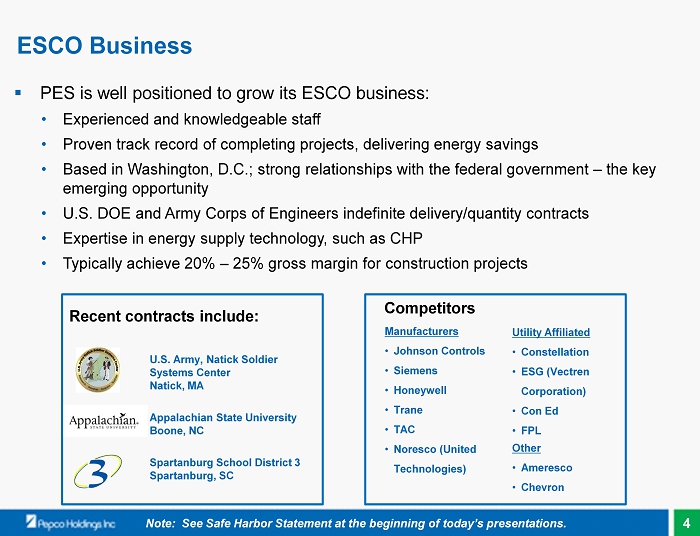
ESCO Business ▪ PES is well positioned to grow its ESCO business: • Experienced and knowledgeable staff • Proven track record of completing projects, delivering energy savings • Based in Washington , D.C.; strong relationships with the federal government – the key emerging opportunity • U.S. DOE and Army Corps of Engineers indefinite delivery/quantity contracts • Expertise in energy supply technology, such as CHP • Typically achieve 20% – 25% gross margin for construction projects Note: See Safe Harbor Statement at the beginning of today’s presentations. Recent contracts include: U.S. Army, Natick Soldier Systems Center Natick , MA Appalachian State University Boone, NC Manufacturers • Johnson Controls • Siemens • Honeywell • Trane • TAC • Noresco (United Technologies) Competitors Utility Affiliated • Constellation • ESG ( Vectren Corporation) • Con Ed • FPL Other • Ameresco • Chevron Spartanburg School District 3 Spartanburg, SC 4
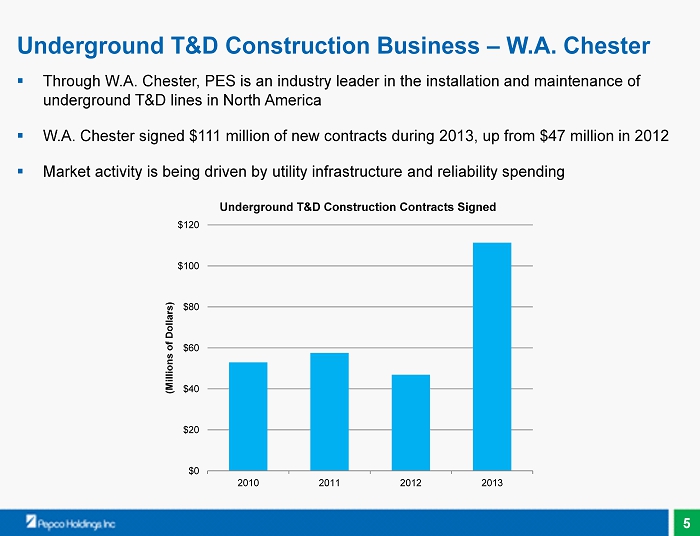
Underground T&D Construction Business – W.A. Chester ▪ Through W.A. Chester, PES is an industry leader in the installation and maintenance of underground T&D lines in North America ▪ W.A. Chester signed $111 million of new contracts during 2013, up from $47 million in 2012 ▪ Market activity is being driven by utility infrastructure and reliability spending $0 $20 $40 $60 $80 $100 $120 2010 2011 2012 2013 (Millions of Dollars) Underground T&D Construction Contracts Signed 5
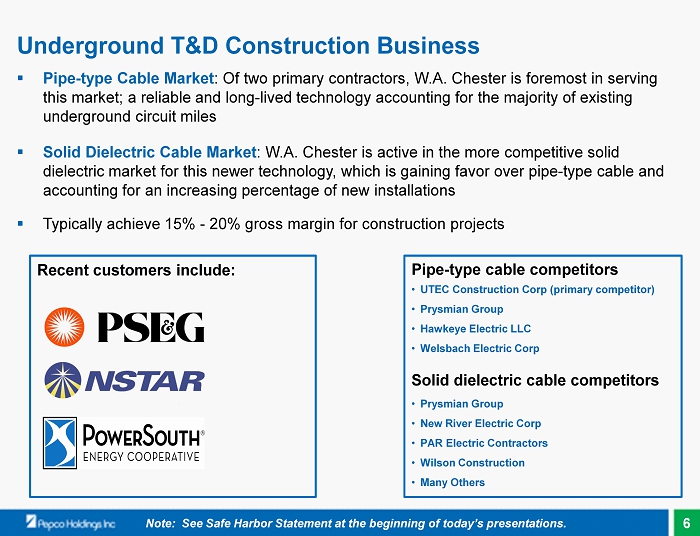
Underground T&D Construction Business ▪ Pipe - type Cable Market : Of two primary contractors, W.A . Chester is foremost in serving this market; a reliable and long - lived technology accounting for the majority of existing underground circuit miles ▪ Solid Dielectric C able Market : W.A. Chester is active in the more competitive solid dielectric market for this newer technology, which is gaining favor over pipe - type cable and accounting for an increasing percentage of new installations ▪ Typically achieve 15% - 20% gross margin for construction projects Note: See Safe Harbor Statement at the beginning of today’s presentations. Recent customers include: Pipe - type cable c ompetitors • UTEC Construction Corp (primary competitor) • Prysmian Group • Hawkeye Electric LLC • Welsbach Electric Corp Solid d ielectric c able c ompetitors • Prysmian Group • New River Electric Corp • PAR Electric Contractors • Wilson Construction • M any O thers 6

Forecasted Gross Margin Under Contract $ 34 million Gross Margin 11 - year remaining weighted average vs. $38 million / 12 - year contract backlog last year $11 million Gross Margin 12 - month remaining weighted average vs. $7 million / 9 - month contract backlog last year Construction: Energy Efficiency and Combined Heat and Power Operations and maintenance contracts related to energy efficiency and CHP projects; 3 - 15 year contracts ESCO Under Contract $278 million Gross Margin vs. $334 million last year Atlantic City Thermal Includes small Wilmington, DE thermal system Thermal $13 million Gross Margin 12 - month remaining weighted average vs. $11 million / 17 - month contract backlog last year Construction: W.A . Chester Underground T&D Construction Note: See Safe Harbor Statement at the beginning of today’s presentations. $0 $10 $20 $30 $40 $50 $60 2013 Actual 2014 2015 2016 2017 (Millions of Dollars) ESCO Construction ESCO O&M W.A. Chester Thermal PES Forecasted Gross Margin Under Contract as of 12/31/13 7

Summary ▪ PES is well positioned to grow as the market continues to rebound; the long - term fundamentals of the ESCO business remain solid ▪ Expect continued demand for PES ’ underground T&D construction business driven by reliability and infrastructure spending ▪ PES provides a platform for PHI to pursue future additional opportunities in the unregulated energy market PES provides incremental e arnings with minimal capital and risk Note: See Safe Harbor Statement at the beginning of today’s presentations. 8
Pepco Energy Services Overview John Huffman, President and CEO, Pepco Energy Services

Appendix

Reconciliation of GAAP Earnings to Adjusted Earnings Note: See Regulation G Information at the beginning of today’s presentations. (Millions of Dollars) 2013 Net Income from Continuing Operations (GAAP) $ 3.0 Adjustments (after - tax ): Impairment charges 3.0 Adjusted Net Income from Continuing Operations ( Non - GAAP) $ 6.0 11

Financial Overview Fred Boyle, Senior Vice President & Chief Financial Officer
Financial Objectives ▪ Achieve sustainable earnings and dividend growth by: • Investment in infrastructure • Reduction of regulatory lag ▪ Maintain solid investment grade credit ratings by preserving: • Solid credit metrics • Ample liquidity • Strong cash flow • Low business risk profile Note: See Safe Harbor Statement at the beginning of today’s presentations. Our regulated business model positions us to meet these objectives 1
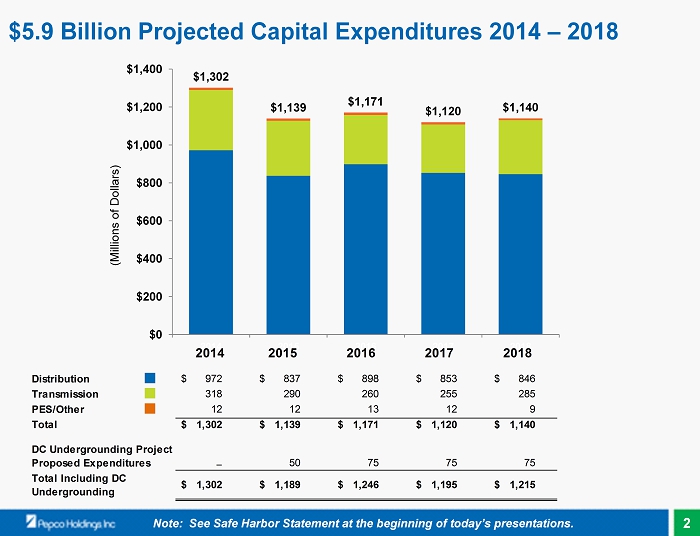
$1,302 $1,139 $1,171 $1,120 $1,140 $0 $200 $400 $600 $800 $1,000 $1,200 $1,400 2014 2015 2016 2017 2018 $ 5.9 Billion Projected Capital Expenditures 2014 – 2018 (Millions of Dollars) Distribution g $ 972 $ 837 $ 898 $ 853 $ 846 Transmission g 318 290 260 255 285 PES/Other g 12 12 13 12 9 Total $ 1,302 $ 1,139 $ 1,171 $ 1,120 $ 1,140 ─ 50 75 75 75 $ 1,302 $ 1,189 $ 1,246 $ 1,195 $ 1,215 Total Including DC Undergrounding 2014 2015 2016 2017 2018 DC Undergrounding Project Proposed Expenditures Note: See Safe Harbor Statement at the beginning of today’s presentations. 2
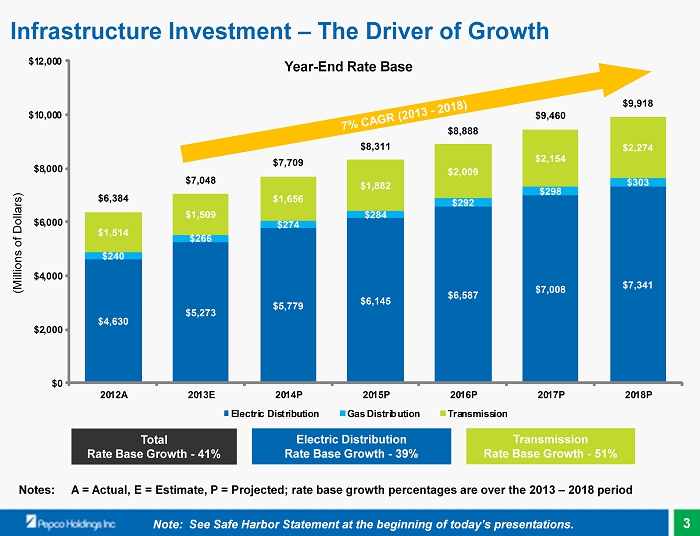
$4,630 $5,273 $5,779 $6,145 $6,587 $7,008 $7,341 $240 $266 $274 $284 $292 $298 $303 $1,514 $1,509 $1,656 $1,882 $2,009 $2,154 $2,274 $6,384 $7,048 $7,709 $8,311 $8,888 $9,460 $9,918 $0 $2,000 $4,000 $6,000 $8,000 $10,000 $12,000 2012A 2013E 2014P 2015P 2016P 2017P 2018P Electric Distribution Gas Distribution Transmission Infrastructure Investment – The Driver of Growth Total Rate Base Growth - 41% Electric Distribution Rate Base Growth - 39% Transmission Rate Base Growth - 51% Year - End Rate Base (Millions of Dollars) Notes: A = Actual, E = Estimate, P = Projected; rate base growth percentages are over the 2013 – 2018 period Note: See Safe Harbor Statement at the beginning of today’s presentations. 3
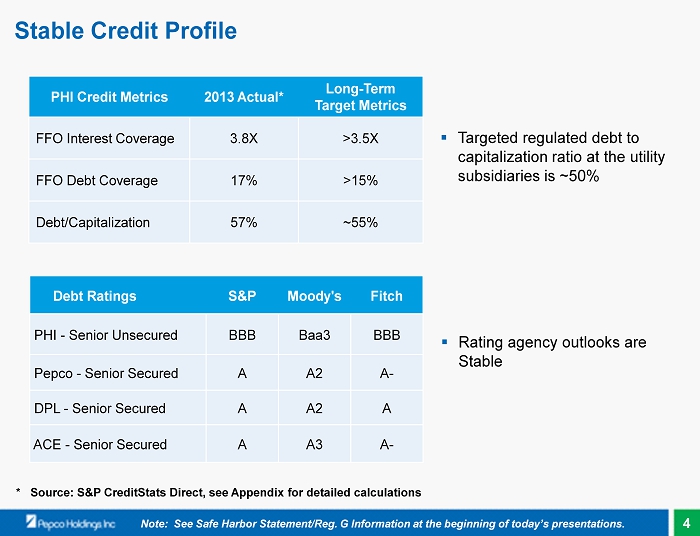
Stable Credit Profile PHI Credit Metrics 2013 Actual* Long - Term Target Metrics FFO Interest Coverage 3.8X >3.5X FFO Debt Coverage 17% >15% Debt/Capitalization 57% ~55% * Source: S&P CreditStats Direct, see Appendix for detailed calculations ▪ Targeted regulated debt to capitalization ratio at the utility subsidiaries is ~50 % Note: See Safe Harbor Statement/Reg. G Information at the beginning of today’s presentations. Debt Ratings S&P Moody's Fitch PHI - Senior Unsecured BBB Baa3 BBB Pepco - Senior Secured A A2 A - DPL - Senior Secured A A2 A ACE - Senior Secured A A3 A - ▪ Rating agency outlooks are Stable 4
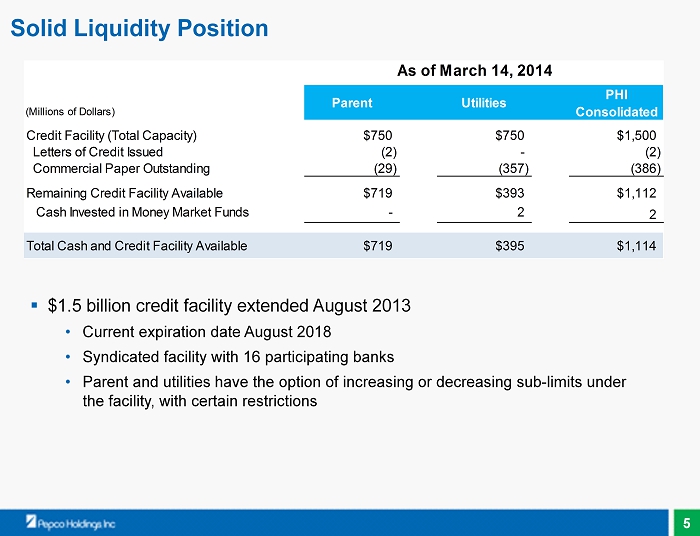
Solid Liquidity Position PHI (Millions of Dollars) Consolidated Credit Facility (Total Capacity) $750 $750 $1,500 Letters of Credit Issued (2) - (2) Commercial Paper Outstanding (29) (357) (386) Remaining Credit Facility Available $719 $393 $1,112 Cash Invested in Money Market Funds - 2 2 Total Cash and Credit Facility Available $719 $395 $1,114 As of March 14, 2014 Parent Utilities ▪ $1.5 billion credit facility extended August 2013 • Current expiration date August 2018 • Syndicated facility with 16 participating banks • Parent and utilities have the option of increasing or decreasing sub - limits under the facility, with certain restrictions 5

• Utility long - term debt issuance of $750 - $850 million Debt Issuance • Dividend Reinvestment Plan/Employee Savings Plan (approximately $43 million) Equity Issuance Issuance Maturing Pepco $400 million 3.60% First Mortgage Bonds due 2024 issued March 18 $175 million Delmarva Power $200 - $250 million $100 million Atlantic City Electric $150 - $200 million $125 million Note: See Safe Harbor Statement at the beginning of today’s presentations. Next anticipated equity issuance will be beyond 2015 2014 Financing Activity 6
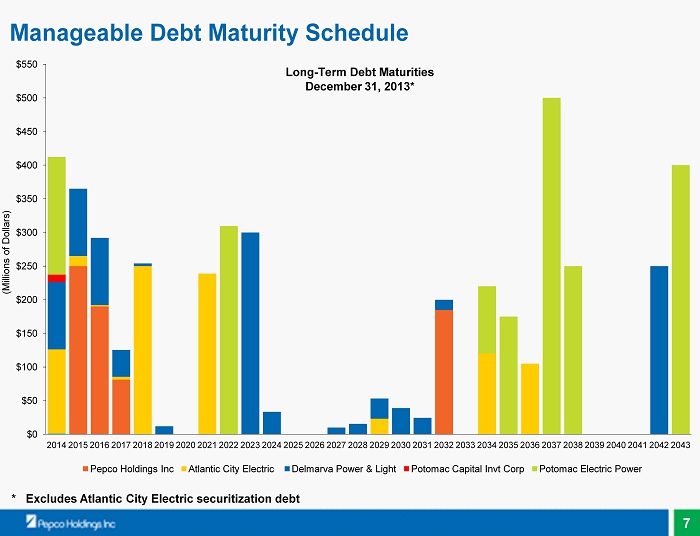
$0 $50 $100 $150 $200 $250 $300 $350 $400 $450 $500 $550 2014 2015 2016 2017 2018 2019 2020 2021 2022 2023 2024 2025 2026 2027 2028 2029 2030 2031 2032 2033 2034 2035 2036 2037 2038 2039 2040 2041 2042 2043 Pepco Holdings Inc Atlantic City Electric Delmarva Power & Light Potomac Capital Invt Corp Potomac Electric Power Long - Term Debt Maturities December 31, 2013* * Excludes Atlantic City Electric securitization debt Manageable Debt Maturity Schedule (Millions of Dollars) 7

Sources and Uses Sources Cash Flow from Operations (1) $1,094 Dividend Reinvestment Plan 43 Long-Term Debt Issuance (2) 750 Short-Term Debt Issuance 368 Total Sources $2,255 Uses Capital Expenditures (3) $1,501 Common Stock Dividends (4) 271 Long-Term Debt Retirements (2) 400 ACE Securitization Debt 42 All Other (Includes Potomac Capital Invt Corp) 41 Total Uses $2,255 2014 Estimated Sources & Uses of Cash $1,094 $400 $43 $1,501 $368 $271 $750 $42 $41 $0 $500 $1,000 $1,500 $2,000 $2,500 Sources of Cash Uses of Cash (Millions of Dollars) $ 2,255 $ 2,255 Cash Flow from Ops DRP ST Debt Issuance LT Debt Issuance Debt Paydown Capex Dividends Securitization Other Note: See Safe Harbor Statement at the beginning of today’s presentations. (1) Mid - point of projected cash from operations range of $1,070 - $1,120 million (2) N ew debt issuance range is $750 - $850 million; net new debt range is $350 million - $450 million (3) Includes non - capital demand s ide m anagement expenditures of $199 million (4) Reflects annual dividend rate of $1.08 per share; the dividend rate is determined by the Board of Directors on a quarterly basis 8

Pension and OPEB Impacts $67 $57 $40 $0 $10 $20 $30 $40 $50 $60 $70 $80 $90 $100 2012A 2013A 2014E $200 $120 $0 $0 $50 $100 $150 $200 $250 $300 2012A 2013A 2014E Net Pension & OPEB Pre - Tax Expense (O&M) Pension Cash Contributions (Millions of Dollars ) Note: See Safe Harbor Statement at the beginning of today’s presentations. Pension 12/31/13 OPEB 12/31/13 Assets $2,116 Assets $368 Plan Obligations $2,238 Plan Obligations $574 19% 12% 7% 62% U.S. Equities Non - U.S. Equities Other Liability - Hedging Pension Fund Asset Allocation 12/31/13 As of December 31, 2013, the funded status of the qualified pension plan was 99% Pension Cost Assumptions 2013 2014 Discount Rate 4.15% 5.05% Expected Return on Assets (Long - term) 7.00% 7.00% (Millions of Dollars ) Key Metrics - Pension & OPEB Plans (Millions of Dollars) 9

Cash Tax Summary ▪ PHI is in the process of negotiating a settlement with the IRS for open tax years back to 2001 ▪ After reaching a settlement, we expect to have a Net Operating Loss (NOL) of approximately $350 million as of December 31, 2013 ▪ We estimate the NOL will be fully utilized in 2017 Note: See Safe Harbor Statement at the beginning of today’s presentations. 10
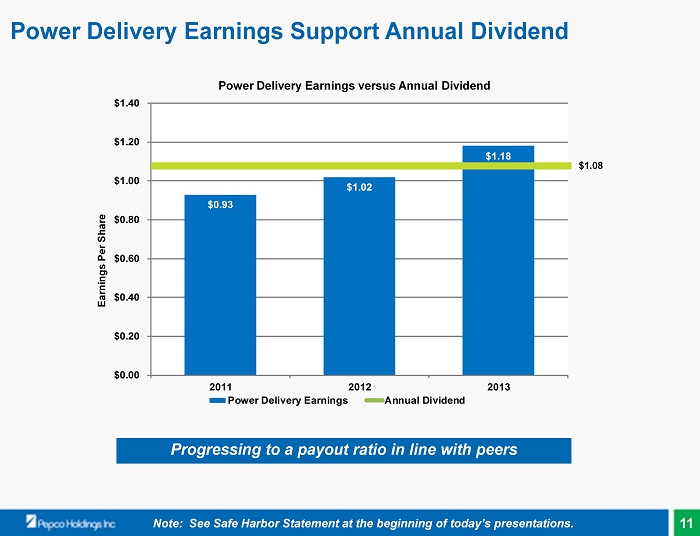
Power Delivery Earnings Support Annual Dividend Power Delivery Earnings versus Annual Dividend $0.93 $1.02 $1.18 $0.00 $0.20 $0.40 $0.60 $0.80 $1.00 $1.20 $1.40 2011 2012 2013 Earnings Per Share Power Delivery Earnings Annual Dividend P rogressing to a payout r atio in line with peers Note: See Safe Harbor Statement at the beginning of today’s presentations. $1.08 11
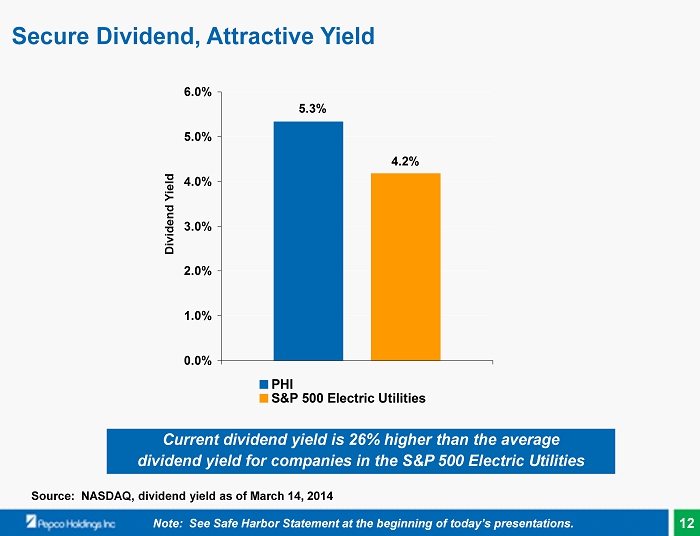
Secure Dividend, Attractive Yield Current dividend yield is 26% higher than the average dividend yield for companies in the S&P 500 Electric Utilities Source: NASDAQ, dividend yield as of March 14, 2014 Note: See Safe Harbor Statement at the beginning of today’s presentations. Dividend Yield 4.2% 5.3% 0.0% 1.0% 2.0% 3.0% 4.0% 5.0% 6.0% PHI S&P 500 Electric Utilities 12
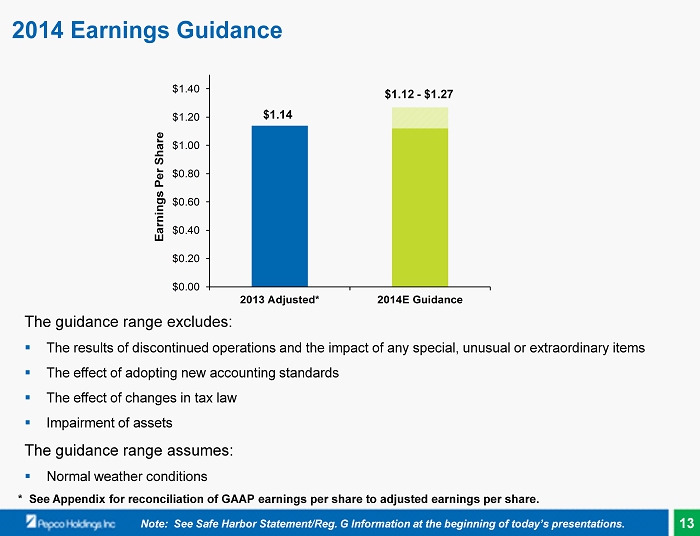
$0.00 $0.20 $0.40 $0.60 $0.80 $1.00 $1.20 $1.40 2013 Adjusted* 2014E Guidance 2014 Earnings Guidance Earnings Per Share $ 1.12 - $1.27 $1.14 The guidance range excludes: ▪ The results of discontinued operations and the impact of any special, unusual or extraordinary items ▪ The effect of adopting new accounting standards ▪ The effect of changes in tax law ▪ Impairment of assets The guidance range assumes: ▪ Normal weather conditions * See Appendix for reconciliation of GAAP earnings per share to adjusted earnings per share. Note: See Safe Harbor Statement/Reg. G Information at the beginning of today’s presentations. 13
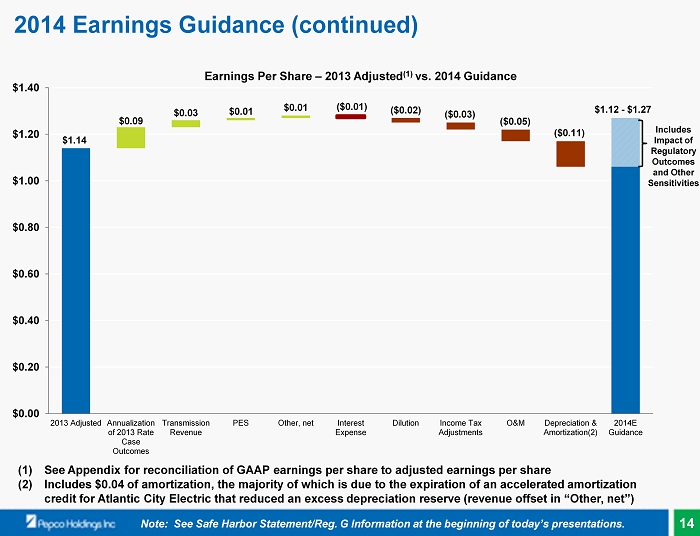
$0.00 $0.20 $0.40 $0.60 $0.80 $1.00 $1.20 $1.40 2013 Adjusted Annualization of 2013 Rate Case Outcomes Transmission Revenue PES Other, net Interest Expense Dilution Income Tax Adjustments O&M Depreciation & Amortization(2) 2014E Guidance $1.14 ($0.11) ($0.05) ( $0.03) ( $0.02) $ 0.01 $ 0.03 ( $0.01) $ 0.01 $ 0.09 $1.12 - $1.27 Includes Impact of Regulatory Outcomes and Other Sensitivities 2014 Earnings Guidance (continued) Earnings Per Share – 2013 Adjusted (1) vs. 2014 Guidance Note: See Safe Harbor Statement/Reg. G Information at the beginning of today’s presentations. (1) See Appendix for reconciliation of GAAP earnings per share to adjusted earnings per share (2) Includes $0.04 of amortization, the majority of which is due to the expiration of an accelerated amortization credit for Atlantic City Electric that reduced an excess depreciation reserve (revenue offset in “Other, net”) 14
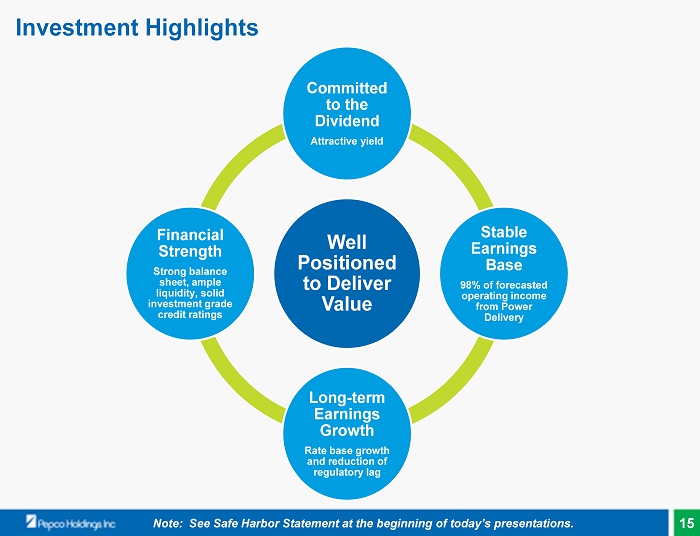
Well Positioned to Deliver Value Committed to the Dividend Attractive yield Stable Earnings Base 98% of forecasted operating income from Power Delivery Long - term Earnings Growth Rate base growth and reduction of regulatory lag Financial Strength Strong balance sheet, ample liquidity, solid investment grade credit ratings Investment Highlights Note: See Safe Harbor Statement at the beginning of today’s presentations. 15

Financial Overview Fred Boyle, Senior Vice President & Chief Financial Officer

Appendix
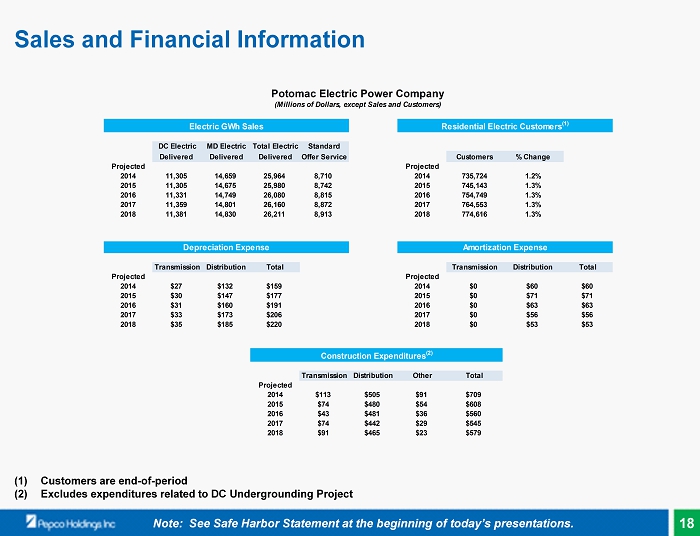
DC Electric MD Electric Total Electric Standard Delivered Delivered Delivered Offer Service Customers % Change Projected Projected 2014 11,305 14,659 25,964 8,710 2014 735,724 1.2% 2015 11,305 14,675 25,980 8,742 2015 745,143 1.3% 2016 11,331 14,749 26,080 8,815 2016 754,749 1.3% 2017 11,359 14,801 26,160 8,872 2017 764,553 1.3% 2018 11,381 14,830 26,211 8,913 2018 774,616 1.3% Transmission Distribution Total Transmission Distribution Total Projected Projected 2014 $27 $132 $159 2014 $0 $60 $60 2015 $30 $147 $177 2015 $0 $71 $71 2016 $31 $160 $191 2016 $0 $63 $63 2017 $33 $173 $206 2017 $0 $56 $56 2018 $35 $185 $220 2018 $0 $53 $53 Transmission Distribution Other Total Projected 2014 $113 $505 $91 $709 2015 $74 $480 $54 $608 2016 $43 $481 $36 $560 2017 $74 $442 $29 $545 2018 $91 $465 $23 $579 Construction Expenditures (2) Potomac Electric Power Company (Millions of Dollars, except Sales and Customers) Amortization Expense Electric GWh Sales Depreciation Expense Residential Electric Customers (1) Sales and Financial Information Note: See Safe Harbor Statement at the beginning of today’s presentations. (1) Customers are end - of - period (2) Excludes expenditures related to DC Undergrounding Project 18
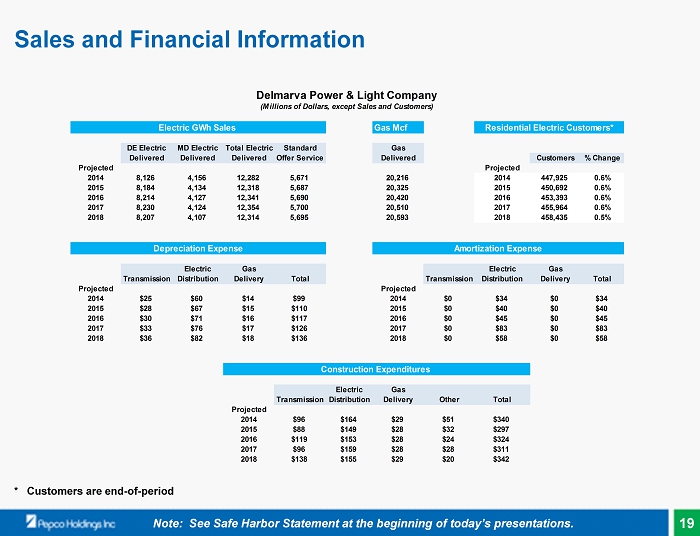
Gas Mcf DE Electric MD Electric Total Electric Standard Gas Delivered Delivered Delivered Offer Service Delivered Customers % Change Projected Projected 2014 8,126 4,156 12,282 5,671 20,216 2014 447,925 0.6% 2015 8,184 4,134 12,318 5,687 20,325 2015 450,692 0.6% 2016 8,214 4,127 12,341 5,690 20,420 2016 453,393 0.6% 2017 8,230 4,124 12,354 5,700 20,510 2017 455,964 0.6% 2018 8,207 4,107 12,314 5,695 20,593 2018 458,435 0.5% Electric Gas Electric Gas Transmission Distribution Delivery Total Transmission Distribution Delivery Total Projected Projected 2014 $25 $60 $14 $99 2014 $0 $34 $0 $34 2015 $28 $67 $15 $110 2015 $0 $40 $0 $40 2016 $30 $71 $16 $117 2016 $0 $45 $0 $45 2017 $33 $76 $17 $126 2017 $0 $83 $0 $83 2018 $36 $82 $18 $136 2018 $0 $58 $0 $58 Electric Gas Transmission Distribution Delivery Other Total Projected 2014 $96 $164 $29 $51 $340 2015 $88 $149 $28 $32 $297 2016 $119 $153 $28 $24 $324 2017 $96 $159 $28 $28 $311 2018 $138 $155 $29 $20 $342 Construction Expenditures Residential Electric Customers* Delmarva Power & Light Company (Millions of Dollars, except Sales and Customers) Electric GWh Sales Depreciation Expense Amortization Expense Sales and Financial Information Note: See Safe Harbor Statement at the beginning of today’s presentations. * Customers are end - of - period 19
NJ Electric Basic Generation Delivered Service Customers % Change Projected Projected 2014 9,117 4,415 2014 480,322 0.5% 2015 9,124 4,424 2015 483,580 0.7% 2016 9,160 4,443 2016 486,814 0.7% 2017 9,179 4,455 2017 489,994 0.7% 2018 9,154 4,444 2018 493,106 0.6% Transmission Distribution Total Transmission Distribution Other (2) Total Projected Projected 2014 $21 $54 $75 2014 $0 $22 $62 $84 2015 $23 $58 $81 2015 $0 $16 $63 $79 2016 $27 $61 $88 2016 $0 $9 $66 $75 2017 $29 $66 $95 2017 $0 $5 $69 $74 2018 $31 $70 $101 2018 $0 $6 $70 $76 Transmission Distribution Other Total Projected 2014 $109 $107 $25 $241 2015 $128 $78 $16 $222 2016 $98 $137 $39 $274 2017 $85 $128 $39 $252 2018 $56 $132 $22 $210 Construction Expenditures Atlantic City Electric Company (Millions of Dollars, except Sales and Customers) Depreciation Expense Electric GWh Sales Amortization Expense Residential Electric Customers (1) Sales and Financial Information Note: See Safe Harbor Statement at the beginning of today’s presentations. (1) Customers are end - of - period (2) Other amortization is related to the recovery of securitized stranded costs through the issuance of transition bonds by Atlantic Ci ty Electric Transition Funding LLC. The stranded costs are being amortized over the life of the bonds maturing 2014 through 2023 . 20
Projected Capital Expenditures – 2014 – 2018 (Millions of Dollars) 2014 2015 2016 2017 2018 Total Power Delivery Distribution $ 774 $ 707 $ 771 $ 729 $ 744 $ 3,725 Distribution - Smart Grid 2 - - - 8 10 Transmission 318 290 260 255 285 1,408 Gas Delivery 29 28 28 28 29 142 Other 167 102 99 96 65 529 Total for Power Delivery 1,290 1,127 1,158 1,108 1,131 5,814 Pepco Energy Services 6 6 7 6 3 28 Corporate and Other 6 6 6 6 6 30 Total PHI $ 1,302 $ 1,139 $ 1,171 $ 1,120 $ 1,140 $ 5,872 DC Undergrounding Project Proposed Expenditures − 50 75 75 75 275 Total Including DC Undergrounding$ 1,302 $ 1,189 $ 1,246 $ 1,195 $ 1,215 $ 6,147 Note: See Safe Harbor Statement at the beginning of today’s presentations. 21
(Millions of Dollars) 2013 2014 2015 2016 2017 2018 Estimated Projected Projected Projected Projected Projected Distribution – Electric Pepco $2,805 $3,146 $3,425 $3,727 $4,010 $4,228 Delmarva Power 1,272 1,363 1,442 1,512 1,582 1,642 Atlantic City Electric 1,196 1,270 1,278 1,348 1,416 1,471 Total Distribution – Electric $5,273 $5,779 $6,145 $6,587 $7,008 $7,341 Distribution – Gas $266 $274 $284 $292 $298 $303 Transmission Pepco $604 $647 $701 $729 $729 $783 Delmarva Power 494 572 613 664 756 827 Atlantic City Electric 411 437 568 616 669 664 Total Transmission $1,509 $1,656 $1,882 $2,009 $2,154 $2,274 Total Distribution & Transmission $7,048 $7,709 $8,311 $8,888 $9,460 $9,918 Projected Year - End Rate Base by Utility Note: See Safe Harbor Statement at the beginning of today’s presentations. 22
Calculation of Credit Metrics Note: See Regulation G Information at the beginning of today’s presentations. Source: S&P Credit Stats Direct 2013 EBITDA (GAAP Measure) 1,180$ Rating Agency Adjustments Less: Interest Expense, adjusted (314) Less: Current Tax Expense, adjusted 112 Plus: Interest Income - Adjusted Funds From Operations (FFO - Non-GAAP Measure) 978 Balance Sheet Debt (GAAP Measure) 5,357$ Rating Agency Adjustments Less: Securitized Debt (296) Less: Surplus Cash (17) Plus: Pension & Postretirement Benefit Obligations Adjustment 213 Plus: Operating Lease Adjustment 335 Plus: Accrued Interest 47 Plus: ARO Debt Adjustment 5 Total Adjusted Debt 5,644 Balance Sheet Equity 4,315$ Non-Controlling Interest - Total Equity (GAAP Measure) 4,315 Total Adjusted Capital 9,959$ Interest Expense (GAAP Measure) 273$ Rating Agency Adjustments Plus: Capitalized Interest 5 Plus: Operating Lease Adjustment 24 Less: Securitized Debt Adjustment (14) Plus: Pension & Postretirement Benefit Obligations Adjustment 26 Total Adjusted Interest Expense 314 Cash Interest Paid 260$ Ratios (Rating Agency Adjusted) Debt/Capitalization 56.7% FFO/Debt 17.3% FFO/Interest Coverage 3.8x 23
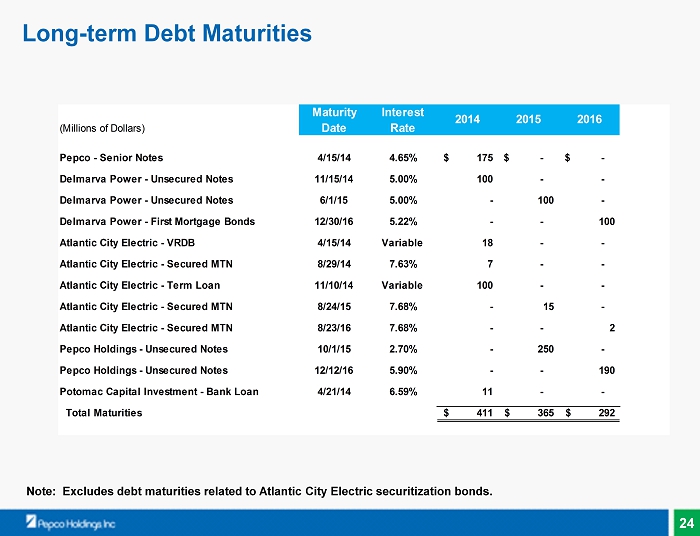
Long - term Debt Maturities Note: Excludes debt maturities related to Atlantic City Electric securitization bonds. Maturity Interest (Millions of Dollars) Date Rate Pepco - Senior Notes 4/15/14 4.65% 175$ -$ -$ Delmarva Power - Unsecured Notes 11/15/14 5.00% 100 - - Delmarva Power - Unsecured Notes 6/1/15 5.00% - 100 - Delmarva Power - First Mortgage Bonds 12/30/16 5.22% - - 100 Atlantic City Electric - VRDB 4/15/14 Variable 18 - - Atlantic City Electric - Secured MTN 8/29/14 7.63% 7 - - Atlantic City Electric - Term Loan 11/10/14 Variable 100 - - Atlantic City Electric - Secured MTN 8/24/15 7.68% - 15 - Atlantic City Electric - Secured MTN 8/23/16 7.68% - - 2 Pepco Holdings - Unsecured Notes 10/1/15 2.70% - 250 - Pepco Holdings - Unsecured Notes 12/12/16 5.90% - - 190 Potomac Capital Investment - Bank Loan 4/21/14 6.59% 11 - - Total Maturities 411$ 365$ 292$ 2014 2015 2016 24
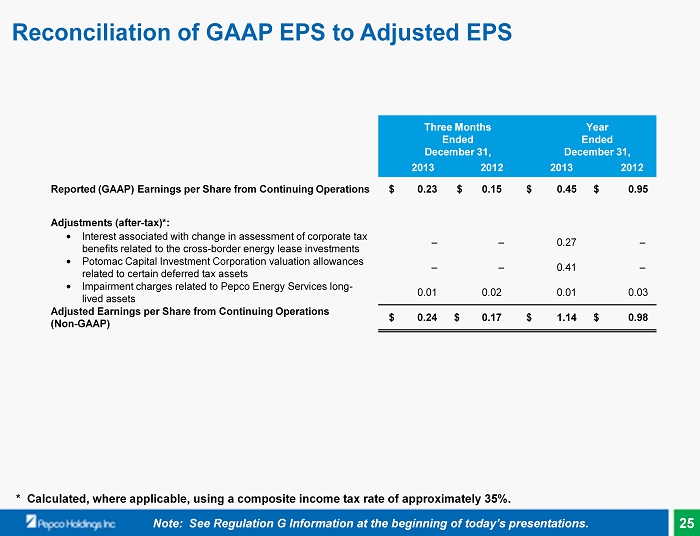
Reconciliation of GAAP EPS to Adjusted EPS Note: See Regulation G Information at the beginning of today’s presentations. Three Months Ended December 31, Year Ended December 31, 2013 2012 2013 2012 Reported (GAAP) Earnings per Share from Continuing Operations $ 0.23 $ 0.15 $ 0.45 $ 0.95 Adjustments (after - tax )*: Interest associated with c hange in assessment of corporate tax benefits related to the cross - border energy lease investments – – 0.27 – Potomac Capital Investment Corporation valuation allowances related to certain deferred tax assets – – 0.41 – Impairment charges related to Pepco Energy Services long - lived assets 0.01 0.02 0.01 0.03 Adjusted Earnings per Share from Continuing Operations ( Non - GAAP) $ 0.24 $ 0.17 $ 1.14 $ 0.98 * Calculated, where applicable, using a composite income tax rate of approximately 35%. 25
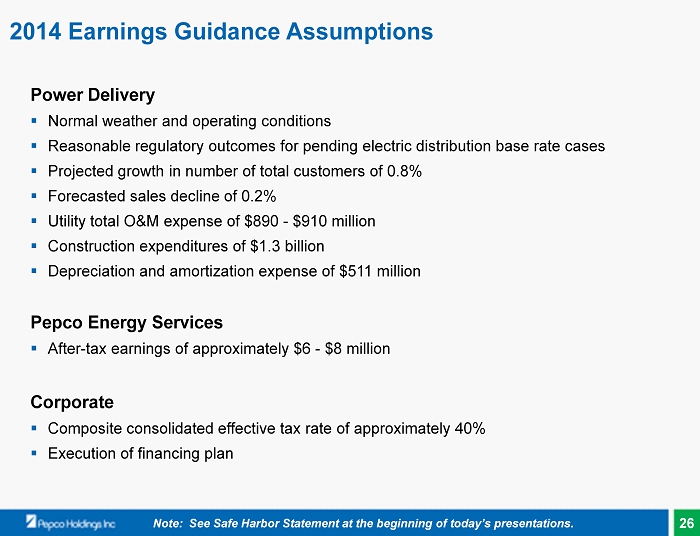
Power Delivery ▪ Normal weather and operating conditions ▪ Reasonable regulatory outcomes for pending electric distribution base rate cases ▪ Projected growth in number of total customers of 0.8% ▪ Forecasted sales decline of 0.2% ▪ Utility total O&M expense of $890 - $910 million ▪ Construction expenditures of $1.3 billion ▪ Depreciation and amortization expense of $511 million Pepco Energy Services ▪ After - tax earnings of approximately $6 - $8 million Corporate ▪ Composite consolidated effective tax rate of approximately 40% ▪ Execution of financing plan 2014 Earnings Guidance Assumptions Note: See Safe Harbor Statement at the beginning of today’s presentations. 26