
Exhibit 99.2
Third Quarter 2013 Earnings Call
November 6, 2013
Safe Harbor Statement/Regulation G Information
Some of the statements contained in today’s presentation with respect to Pepco Holdings, Pepco, Delmarva Power and Atlantic City Electric, including each of their respective subsidiaries, are forward-looking statements within the meaning of the U.S. federal securities laws and are subject to the safe harbor created thereby under the Private Securities Litigation Reform Act of 1995. These statements include declarations regarding the intents, beliefs and current expectations of one or more of PHI, Pepco, DPL or ACE (each, a Reporting Company) or their subsidiaries. In some cases you can identify forward-looking statements by terminology such as “may,” “might,” “will,” “should,” “could,” “expects,” “intends,” “assumes,” “seeks to,” “plans,” “anticipates,” “believes,” “projects,” “estimates,” “predicts,” “potential,” “future,” “goal,” “objective,” or “continue”, the negative or other variations of such terms, or comparable terminology, or by discussions of strategy that involve risks and uncertainties. Forward-looking statements involve estimates, assumptions, known and unknown risks, uncertainties and other factors that may cause one or more Reporting Companies’ or their subsidiaries’ actual results, levels of activity, performance or achievements to be materially different from any future results, levels of activity, performance or achievements expressed or implied by such forward-looking statements. Therefore, forward-looking statements are not guarantees or assurances of future performance, and actual results could differ materially from those indicated by the forward-looking statements. These forward-looking statements are qualified in their entirety by, and should be read together with, the risk factors included in the “Risk Factors” section and other statements in each Reporting Company’s annual report on Form 10-K for the year ended December 31, 2012 filed on March 1, 2013 and in other Securities and Exchange Commission (SEC) filings, and investors should refer to these risk factor sections and such other statements. All such factors are difficult to predict, contain uncertainties, are beyond each Reporting Company’s or its subsidiaries’ control and may cause actual results to differ materially from those contained in the forward-looking statements. Any forward-looking statements speak only as of the date of this presentation and none of the Reporting Companies undertakes any obligation to update any forward-looking statements to reflect events or circumstances after the date on which such statements are made or to reflect the occurrence of unanticipated events. New factors emerge from time to time, and it is not possible for a Reporting Company to predict all such factors. Furthermore, it may not be possible to assess the impact of any such factor on such Reporting Company’s or its subsidiaries’ business (viewed independently or together with the business or businesses of some or all of the other Reporting Companies or their subsidiaries) or the extent to which any factor, or combination of factors, may cause results to differ materially from those contained in any forward-looking statement. Any specific factors that may be provided should not be construed as exhaustive.
PHI routinely makes available important information with respect to each Reporting Company, including copies of each Reporting Company’s annual, quarterly and current reports filed with or furnished to the SEC under the Securities Exchange Act of 1934, on PHI’s website at http://www.pepcoholdings.com/investors. PHI recognizes its website as a key channel of distribution to reach public investors and as a means of disclosing material non-public information to comply with each Reporting Company’s disclosure obligations under SEC Regulation FD.
PHI discloses net income from continuing operations and related per share data (both as historical information and earnings guidance) excluding certain items (non-GAAP financial information) because management believes that these items are not representative of PHI’s ongoing business operations. Management uses this information, and believes that such information is useful to investors, in evaluating PHI’s period-over-period performance. The inclusion of this disclosure is intended to complement, and should not be considered as an alternative to, PHI’s reported net income from continuing operations and related per share data in accordance with accounting principles generally accepted in the United States (GAAP). 2
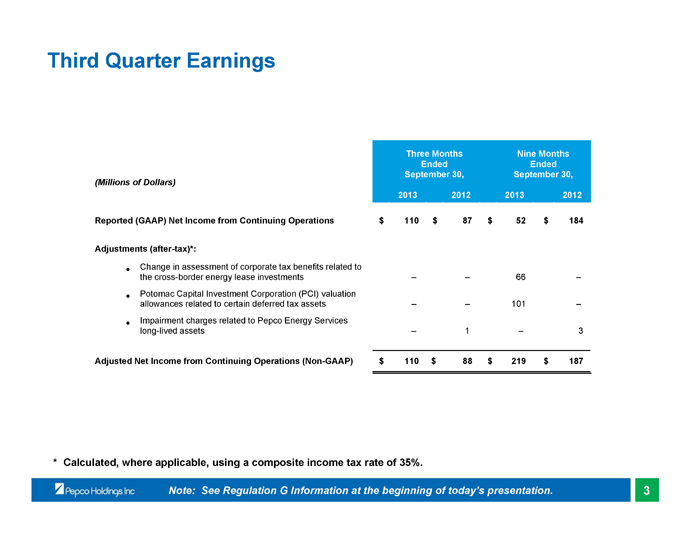
Third Quarter Earnings
Three Months Ended September 30, 2013 2012 Nine Months Ended September 30, 2013 2012
(Millions of Dollars)
Reported (GAAP) Net Income from Continuing Operations $ 110 $ 87 $ 52 $ 184
Adjustments (after-tax)*:
·Change in assessment of corporate tax benefits related to the cross-border energy lease investments – – 66 –
·Potomac Capital Investment Corporation (PCI) valuation allowances related to certain deferred tax assets – – 101 –
·Impairment charges related to Pepco Energy Services long-lived assets – 1 – 3
Adjusted Net Income from Continuing Operations (Non-GAAP) $ 110 $ 88 $ 219 $ 187
* Calculated, where applicable, using a composite income tax rate of 35%.
Note: See Regulation G Information at the beginning of today’s presentation.3
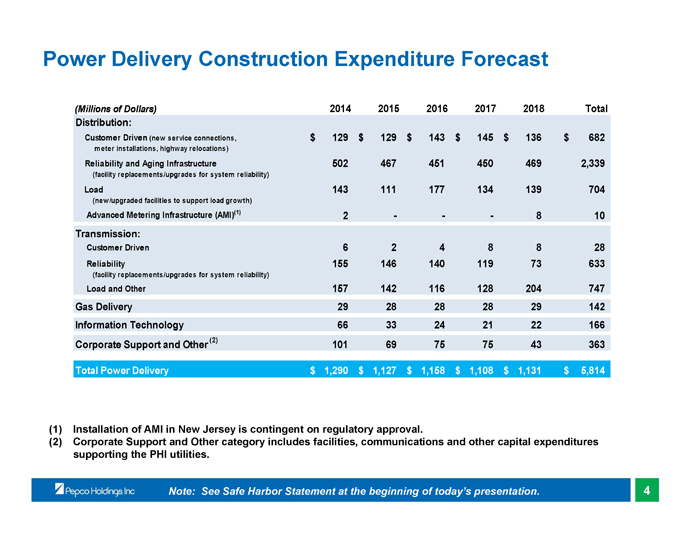
Power Delivery Construction Expenditure Forecast
(Millions of Dollars) 2014 2015 2016 2017 2018 Total
Distribution: Customer Driven (new service connections, meter installations, highway relocations) $ 129 $ 129 $ 143 $ 145 $ 136 $ 682
Reliability and Aging Infrastructure (facility replacements/upgrades for system reliability) 502 467 451 450 469 2,339
Load (new/upgraded facilities to support load growth) 143 111 177 134 139 704
Advanced Metering Infrastructure (AMI)(1)2 - - - 8 10
Transmission: Customer Driven 6 2 4 8 8 28
Reliability (facility replacements/upgrades for system reliability) 155 146 140 119 73 633
Load and Other 157 142 116 128 204 747
Gas Delivery 29 28 28 28 29 142
Information Technology 66 33 24 21 22 166
Corporate Support and Other (2) 101 69 75 75 43 363
Total Power Delivery $ 1,290 $ 1,127 $ 1,158 $ 1,108 $ 1,131 $ 5,814
(1) Installation of AMI in New Jersey is contingent on regulatory approval.
(2) Corporate Support and Other category includes facilities, communications and other capital expenditures supporting the PHI utilities.
Note: See Safe Harbor Statement at the beginning of today’s presentation.4
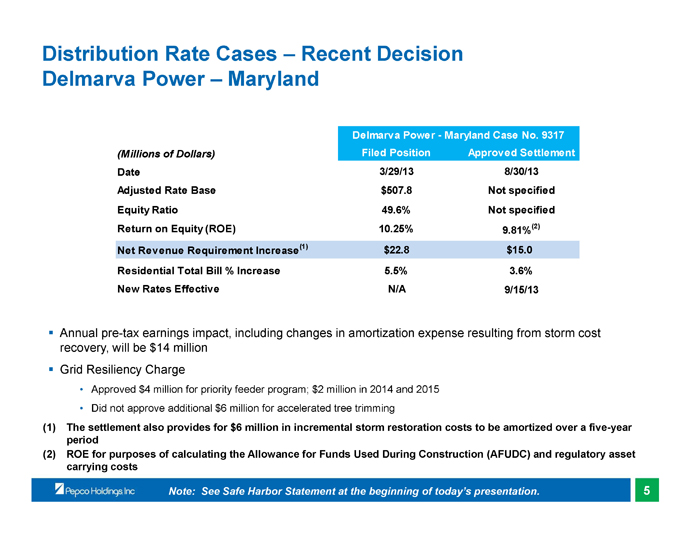
Distribution Rate Cases – Recent Decision
Delmarva Power – Maryland
Delmarva Power - Maryland Case No. 9317 Filed Position Approved Settlement
(Millions of Dollars) Date 3/29/13 8/30/13 Adjusted Rate Base $507.8 Not specified
Equity Ratio 49.6% Not specified Return on Equity (ROE) 10.25% 9.81%(2)
Net Revenue Requirement Increase(1)$22.8 $15.0 Residential Total Bill % Increase 5.5% 3.6%
New Rates Effective N/A 9/15/13
Annual pre-tax earnings impact, including changes in amortization expense resulting from storm cost recovery, will be $14 million
Grid Resiliency Charge
• Approved $4 million for priority feeder program; $2 million in 2014 and 2015
• Did not approve additional $6 million for accelerated tree trimming
(1) The settlement also provides for $6 million in incremental storm restoration costs to be amortized over a five-year period
(2) ROE for purposes of calculating the Allowance for Funds Used During Construction (AFUDC) and regulatory asset carrying costs
Note: See Safe Harbor Statement at the beginning of today’s presentation.5
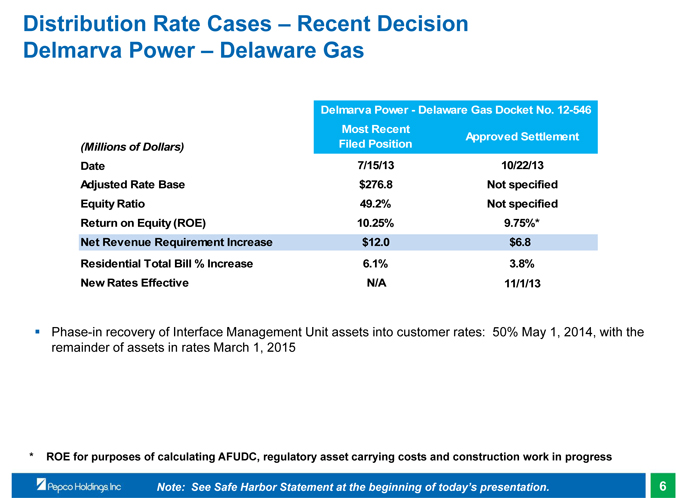
Distribution Rate Cases – Approved Settlement Agreement
Delmarva Power – Delaware Gas
Delmarva Power - Delaware Gas Docket No. 12-546 Most Recent Filed Position Approved Settlement
(Millions of Dollars)
Date 7/15/13 10/22/13 Adjusted Rate Base $276.8 Not specified
Equity Ratio 49.2% Not specified Return on Equity (ROE) 10.25% 9.75%*
Net Revenue Requirement Increase $12.0 $6.8 Residential Total Bill % Increase 4.3% 4.3%
New Rates Effective N/A 11/1/13
Phase-in recovery of Interface Management Unit assets into customer rates: 50% May 1, 2014, with the remainder of assets in rates March 1, 2015
* ROE for purposes of calculating AFUDC, regulatory asset carrying costs and construction work in progress
Note: See Safe Harbor Statement at the beginning of today’s presentation.6

Proposed Forward Looking Rate Plan Filing –
Delmarva Power – Delaware Electric
In our November 2012 Delmarva Power Delaware Electric settlement (Docket No. 11-528), Delmarva Power, the Delaware Public Service Commission (DPSC) Staff and the Division of the Public Advocate agreed to meet to discuss:
• Establishment of metrics to help customers understand the benefits of infrastructure investment
• Alternative regulatory mechanisms, including multi-year rate plans
On October 2, 2013, Delmarva Power filed a proposed Forward Looking Rate Plan (FLRP) in Delaware (electric)
• Filing proposes annual rate increases over a four-year period
• FLRP provides the opportunity for Delmarva Power to earn the proposed allowed ROE of 9.75%
• The FLRP also proposes stricter reliability standards, with bill credits to customers in the event that minimum reliability standards are not met
On October 22, 2013, the DPSC opened Docket No. 13-384 to review the details of the FLRP
• Delmarva Power will update and re-file the FLRP after the completion of the pending base rate case
Note: See Safe Harbor Statement at the beginning of today’s presentation.7

Distribution Rate Cases – Pending
Delmarva Power – Delaware Electric
Delmarva Power -Delaware Electric Docket No. 13-115 Procedural Schedule
(Millions of Dollars)
Most Recently Filed Position 9/20/13 Initial Filing Date 3/22/13
Test Period 12 mos. actual data ending 12/31/12 Intervenors' Testimony Rebuttal Testimony 8/16/13 9/20/13
Adjusted Rate Base $745.6 Equity Ratio 49.2% Evidentiary Hearings 11/13 - 11/14, 11/18/13
Return on Equity (ROE) 10.25% Initial Briefs TBD Net Revenue Requirement Increase $39.0(1)(2)Reply Briefs TBD Residential Total Bill % Increase 5.4% Expected Timing of Decision Q1-2014 Revenue Requirement Equating to 25 Basis Point Change in ROE $1.5
Regulatory lag mitigation measure proposed:
Test period adjusted to recover additional reliability plant additions from January 2013 through December 2013 ($10.4 million of revenue)
(1) As permitted by Delaware law, Delmarva Power implemented an interim rate increase of $2.5 million on June 1, 2013, subject to refund, and an interim rate increase of $25.1 million on October 22, 2013, subject to refund
(2) Intervenors’ revenue requirements are as follows: PSC Staff $11.4 million based on 9.35% ROE; Division of Public Advocate $7.3 million based on 9.35% ROE
Note: See Safe Harbor Statement at the beginning of today’s presentation.8
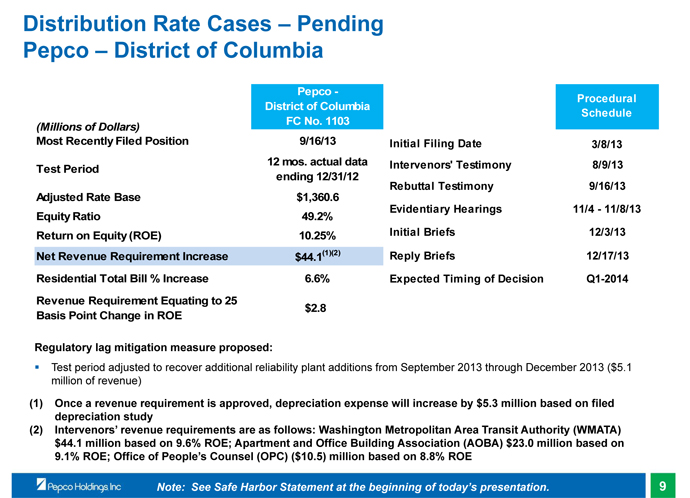
Distribution Rate Cases – Pending
Pepco – District of Columbia
Pepco - District of Columbia FC No. 1103 Procedural Schedule
(Millions of Dollars)
Most Recently Filed Position 9/16/13 Initial Filing Date 3/8/13 12 mos. actual data ending 12/31/12 Intervenors' Testimony 8/9/13 Test Period Intervenors' Testimony Rebuttal Testimony
Adjusted Rate Base $1,360.6 Evidentiary Hearings 11/4 - 11/8/13 Equity Ratio 49.2% Return on Equity (ROE) 10.25% Initial Briefs 12/3/13 Net Revenue Requirement Increase $44.1(1)(2) Reply Briefs 12/17/13 Residential Total Bill % Increase 6.6% Expected Timing of Decision Q1-2014 Revenue Requirement Equating to 25 Basis Point Change in ROE $2.8
Regulatory lag mitigation measure proposed:
Test period adjusted to recover additional reliability plant additions from September 2013 through December 2013 ($6.8 million of revenue)
(1) Once a revenue requirement is approved, depreciation expense will increase by $5.7 million based on filed depreciation study
(2) Intervenors’ revenue requirements are as follows: Washington Metropolitan Area Transit Authority (WMATA) $44.1 million based on 9.61% ROE; Apartment and Office Building Association (AOBA) $23.0 million based on 9.1% ROE; Office of People’s Counsel (OPC) ($10.5) million based on 8.8% ROE
Note: See Safe Harbor Statement at the beginning of today’s presentation.9
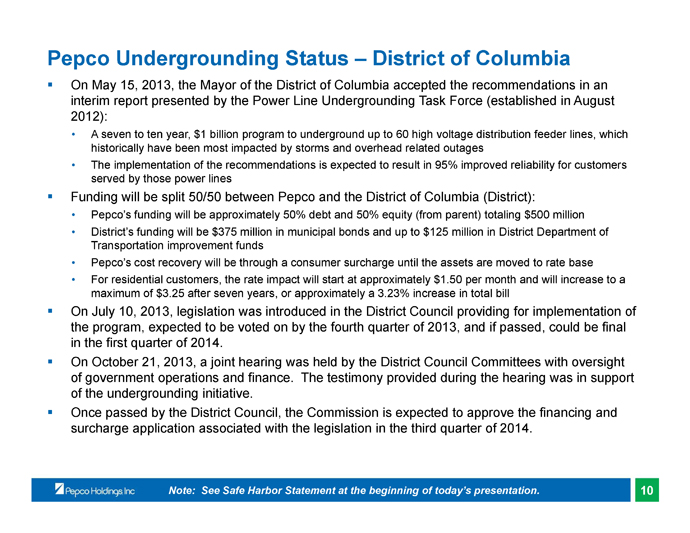
Pepco Undergrounding Status – District of Columbia
On May 15, 2013, the Mayor of the District of Columbia accepted the recommendations in an interim report presented by the Power Line Undergrounding Task Force (established in August 2012):
• A seven to ten year, $1 billion program to underground up to 60 high voltage distribution feeder lines, which historically have been most impacted by storms and overhead related outages
• The implementation of the recommendations is expected to result in 95% improved reliability for customers served by those power lines
Funding will be split 50/50 between Pepco and the District of Columbia (District):
• Pepco’s funding will be approximately 50% debt and 50% equity (from parent) totaling $500 million
• District’s funding will be $375 million in municipal bonds and up to $125 million in District Department of Transportation improvement funds
• Pepco’s cost recovery will be through a consumer surcharge until the assets are moved to rate base
• For residential customers, the rate impact will start at approximately $1.50 per month and will increase to a maximum of $3.25 after seven years, or approximately a 3.23% increase in total bill
On July 10, 2013, legislation was introduced in the District Council providing for implementation of the program, expected to be voted on by the fourth quarter of 2013, and if passed, could be final in the first quarter of 2014.
On October 21, 2013, a joint hearing was held by the District Council Committees with oversight of government operations and finance. The testimony provided during the hearing was in support of the undergrounding initiative.
Once passed by the District Council, the Commission is expected to approve the financing and surcharge application associated with the legislation in the third quarter of 2014.
Note: See Safe Harbor Statement at the beginning of today’s presentation.10
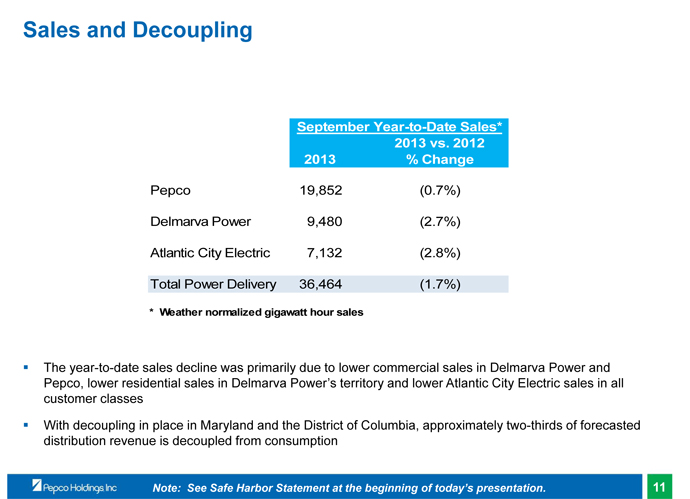
Sales and Decoupling
Third Quarter Sales* September Year-to-Date Sales*
2013 vs. 2012 2013 vs. 2012
2013 % Change 2013 % Change
Pepco 7,345 1.1% 19,852 (0.7%) Delmarva Power 3,282 (8.8%) 9,480 (2.7%) Atlantic City Electric 2,812 (4.3%) 7,132 (2.8%) Total Power Delivery 13,439 (2.6%) 36,464 (1.7%)
* Weather normalized gigawatt hour sales
The quarterly sales decline was driven by significantly lower usage in the residential and commercial customer classes in Delmarva Power and Atlantic City Electric, partially offset by higher Pepco residential and commercial sales
The year-to-date sales decline was primarily due to lower commercial sales in Delmarva Power and Pepco, lower residential sales in Delmarva Power’s Delaware territory and lower Atlantic City Electric sales in all customer classes
With decoupling in place in Maryland and the District of Columbia, approximately two-thirds of forecasted distribution revenue is decoupled from consumption
Note: See Safe Harbor Statement at the beginning of today’s presentation.11
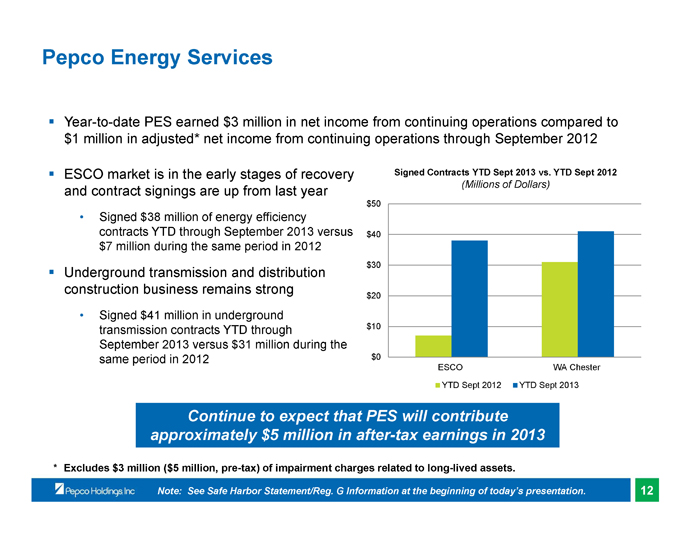
Pepco Energy Services
Year-to-date PES earned $3 million in net income from continuing operations compared to $1 million in adjusted* net income from continuing operations through September 2012
ESCO market is in the early stages of recovery and contract signings are up from last year
• Signed $38 million of energy efficiency contracts YTD through September 2013 versus $7 million during the same period in 2012
Underground transmission and distribution construction business remains strong
• Signed $41 million in underground transmission contracts YTD through September 2013 versus $31 million during the same period in 2012
Signed Contracts YTD Sept 2013 vs. YTD Sept 2012
(Millions of Dollars) $50 $40 $30 $20 $10 $0
ESCO WA Chester YTD Sept 2012 YTD Sept 2013
Continue to expect that PES will contribute approximately $5 million in after-tax earnings in 2013
* Excludes $3 million ($5 million, pre-tax) of impairment charges related to long-lived assets.
Note: See Safe Harbor Statement/Reg. G Information at the beginning of today’s presentation.12
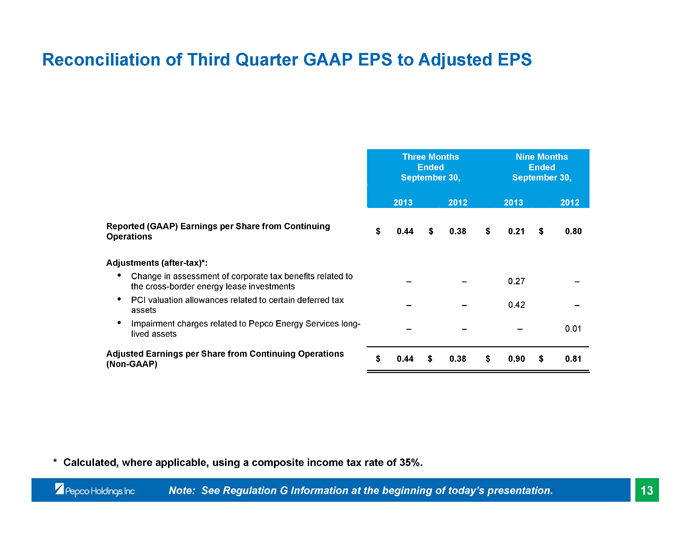
Reconciliation of Third Quarter GAAP EPS to Adjusted EPS
Three Months Ended September 30, 2013 2012 Nine Months Ended September 30, 2013 2012
Reported (GAAP) Earnings per Share from Continuing Operations $ 0.44 $ 0.38 $ 0.21 $ 0.80
Adjustments (after-tax)*:
·Change in assessment of corporate tax benefits related to the cross-border energy lease investments – – 0.27 –
·PCI valuation allowances related to certain deferred tax assets – – 0.42 –
·Impairment charges related to Pepco Energy Services long-lived assets – – – 0.01
Adjusted Earnings per Share from Continuing Operations (Non-GAAP) $ 0.44 $ 0.38 $ 0.90 $ 0.81
* Calculated, where applicable, using a composite income tax rate of 35%.
Note: See Regulation G Information at the beginning of today’s presentation.13
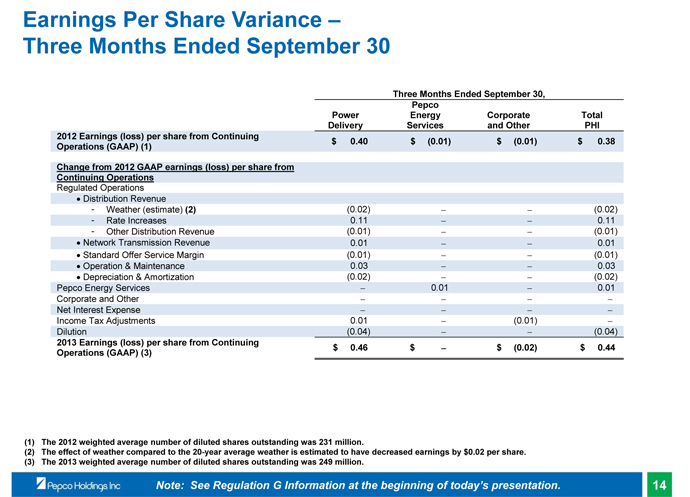
Earnings Per Share Variance –
Three Months Ended September 30
Three Months Ended September 30,
Power Delivery Pepco Energy Services Corporate and Other Total PHI
2012 Earnings (loss) per share from Continuing Operations (GAAP) (1) $ 0.40 $ (0.01) $ (0.01) $ 0.38
Change from 2012 GAAP earnings (loss) per share from Continuing Operations Regulated Operations
• Distribution Revenue
- Weather (estimate) (2) (0.02) – – (0.02)
- Rate Increases 0.11 – – 0.11
- Other Distribution Revenue (0.01) – – (0.01)
• Network Transmission Revenue 0.01 – – 0.01
• Standard Offer Service Margin (0.01) – – (0.01)
• Operation & Maintenance 0.03 – – 0.03
Depreciation (0.02) – – (0.02) Pepco Energy Services – 0.01 – 0.01 Corporate and Other – – – – Net Interest Expense – – – – Income Tax Adjustments 0.01 – (0.01) – Dilution (0.04) – – (0.04)
2013 Earnings (loss) per share from Continuing Operations (GAAP) (3) $ 0.46 $– $ (0.02) $ 0.44
(1) The 2012 weighted average number of diluted shares outstanding was 231 million.
(2) The effect of weather compared to the 20-year average weather is estimated to have decreased earnings by $0.02 per share. (3) The 2013 weighted average number of diluted shares outstanding was 249 million.
Note: See Regulation G Information at the beginning of today’s presentation.14
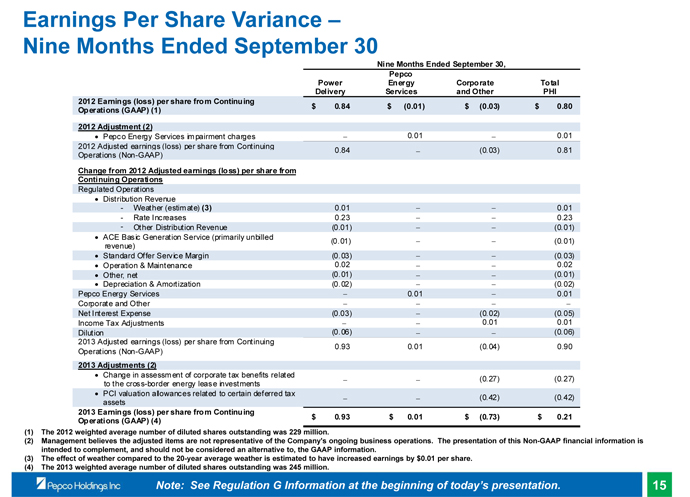
Earnings Per Share Variance – Nine Months Ended September 30
Nine Months Ended September 30,
Power Delivery Pepco Energy Services Corporate and Other Total PHI
2012 Earnings (loss) per share from Continuing Operations (GAAP) (1)
$ 0.84 $ (0.01) $ (0.03) $ 0.80
2012 Adjustment (2)
Pepco Energy Services impairment charges – 0.01 – 0.01
2012 Adjusted earnings (loss) per share from Continuing Operations (Non-GAAP) 0.84 – (0.03) 0.81
Change from 2012 Adjusted earnings (loss) per share from Continuing Operations
Regulated Operations Distribution Revenue
- Weather (estimate) (3) 0.01 – – 0.01
- Rate Increases 0.23 – – 0.23
- Other Distribution Revenue (0.01) – – (0.01)
ACE Basic Generation Service (primarily unbilled revenue) (0.01) – – (0.01)
Standard Offer Service Margin (0.03) – – (0.03)
Operation & Maintenance 0.02 – – 0.02 Other, net (0.01) – – (0.01) Depreciation (0.02) – – (0.02) Pepco Energy Services – 0.01 – 0.01 Corporate and Other – – – – Net Interest Expense (0.03) – (0.02) (0.05) Income Tax Adjustments – – 0.01 0.01 Dilution (0.06) – – (0.06)
2013 Adjusted earnings (loss) per share from Continuing Operations (Non-GAAP) 0.93 0.01 (0.04) 0.90
2013 Adjustments (2)
Change in assessment of corporate tax benefits related to the cross-border energy lease investments – – (0.27) (0.27)
PCI valuation allowances related to certain deferred tax assets
– – (0.42) (0.42)
2013 Earnings (loss) per share from Continuing Operations (GAAP) (4)
$ 0.93 $ 0.01 $ (0.73) $ 0.21
(1) The 2012 weighted average number of diluted shares outstanding was 229 million.
(2) Management believes the adjusted items are not representative of the Company's ongoing business operations. The presentation of this Non-GAAP financial information is intended to complement, and should not be considered an alternative to, the GAAP information.
(3) The effect of weather compared to the 20-year average weather is estimated to have increased earnings by $0.01 per share. (4) The 2013 weighted average number of diluted shares outstanding was 245 million.
Note: See Regulation G Information at the beginning of today’s presentation. 15

2013 Earnings Guidance
Pepco Holdings 2013 earnings guidance range is narrowed to $1.08 - $1.18 per share from $1.05 - $1.20 per share
The guidance range excludes:
• The results of discontinued operations and the impact of any special, unusual or extraordinary items, and
The guidance range assumes:
• Normal weather conditions for the fourth quarter of 2013
Note: See Safe Harbor Statement/Reg. G Information at the beginning of today’s presentation.16