Management’s Discussion and Analysis
The following is management’s discussion and analysis (MD&A) of PrimeWest’s operating and financial results for the year ended December 31, 2004, compared to the corresponding period in the prior year as well as information and opinions concerning the Trust’s future outlook based on currently available information. This discussion should be read in conjunction with the Trust’s audited consolidated financial statements for the years ended December 31, 2004 and 2003, together with accompanying notes.
| FINANCIAL AND OPERATING HIGHLIGHTS – FULL YEAR | | | | | | | |
| Financial($ millions, except per BOE(1)and per Trust Unit) | | 2004 | | 2003 | | Change (%) | |
| Gross revenue (net of transportation expense) | | | 513.7 | | | 434.6 | | | 18 | |
| Per BOE | | | 39.45 | | | 35.74 | | | 10 | |
| Cash flow from operations | | | 266.8 | | | 216.6 | | | 23 | |
| Per BOE | | | 20.49 | | | 17.82 | | | 15 | |
| Per Trust Unit(2) | | | 4.33 | | | 4.67 | | | (7 | ) |
| Royalty expense | | | 119.8 | | | 101.9 | | | 18 | |
| Per BOE | | | 9.20 | | | 8.38 | | | 10 | |
| Operating expenses | | | 88.9 | | | 79.4 | | | 12 | |
| Per BOE | | | 6.83 | | | 6.53 | | | 5 | |
| General and administrative expenses – Cash | | | 19.0 | | | 14.5 | | | 31 | |
| Per BOE | | | 1.46 | | | 1.20 | | | 22 | |
| General and administrative expenses – Non-cash | | | 9.4 | | | 14.4 | | | (35 | ) |
| Per BOE | | | 0.73 | | | 1.19 | | | (39 | ) |
| Interest expense(3) | | | 20.6 | | | 15.1 | | | 36 | |
| Per BOE | | | 1.58 | | | 1.24 | | | 27 | |
| Net income | | | 103.4 | | | 95.9 | | | 8 | |
| Per Trust Unit – Diluted(2) | | | 1.74 | | | 2.07 | | | (16 | ) |
| Distributions to Unitholders | | | 196.1 | | | 192.6 | | | 2 | |
| Per Trust Unit(4) | | | 3.30 | | | 4.32 | | | (24 | ) |
| Net debt(5) | | | 552.0 | | | 255.9 | | | 116 | |
| Per Trust Unit(6) | | | 7.77 | | | 5.07 | | | 53 | |
(1)
| All calculations required to convert natural gas to a crude oil equivalent (BOE) have been made using a ratio of 6,000 cubic feet of natural gas to one barrel of crude oil. BOEs may be misleading, particularly if used in isolation. The BOE conversion ratio is based on an energy equivalency conversion method primarily applicable at the burner tip and does not represent a value equivalency at the wellhead.
|
(2)
| Weighted Average Trust Units, Exchangeable Shares, Convertible Unsecured Subordinated Debentures and Trust Units issuable pursuant to Long-Term Incentive Plan (diluted). Cash flow and net income are increased to adjust for the interest on Convertible Unsecured Subordinated Debentures.
|
(3)
| Interest expense includes the interest on the Convertible Unsecured Subordinated Debentures.
|
(4)
| Based on Trust Units outstanding at date of distribution.
|
(5)
| Net debt is long-term debt including Convertible Unsecured Subordinated Debentures, adjusted for working capital, excluding financial derivative assets and liabilities.
|
(6)
| Trust Units and Exchangeable Shares outstanding and Trust Units issuable pursuant to the Long-Term Incentive Plan December 31, 2004.
|
| Operating | | 2004 | | 2003 | | Change (%) | |
| Daily sales volume | | | | | | | | | | |
| Natural gas (mmcf/day) | | | 145.1 | | | 134.1 | | | 8 | |
| Crude oil (bbls/day) | | | 8,282 | | | 8,116 | | | 2 | |
| Natural gas liquids (bbls/day) | | | 3,107 | | | 2,855 | | | 9 | |
| Total (BOE/day) | | | 35,578 | | | 33,316 | | | 7 | |
PrimeWest Energy Trust Annual Report 2004
| Realized Commodity Prices(Cdn$) | | 2004 | | 2003 | | Change (%) | |
| Natural gas ($/mcf)(1) (2) | | | 6.61 | | | 6.05 | | | 9 | |
| Without hedging | | | 6.70 | | | 6.51 | | | 3 | |
| Crude oil ($/bbl)(1) | | | 36.83 | | | 33.94 | | | 9 | |
| Without hedging | | | 44.46 | | | 36.55 | | | 22 | |
| Natural gas liquids ($/bbl) | | | 43.69 | | | 35.34 | | | 24 | |
| Total ($/BOE)(1) | | | 39.35 | | | 35.63 | | | 10 | |
| Without hedging | | | 41.51 | | | 38.14 | | | 9 | |
(1)
| Includes hedging losses.
|
(2)
| Excludes sulphur.
|
FINANCIAL AND OPERATING HIGHLIGHTS
- Production in 2004 averaged 35,578 BOE/day, up 7% from the 2003 level of 33,316 BOE/day as a result of the Calpine and Seventh Energy acquisitions and development capital volume additions, offset by natural production declines.
- During the year, PrimeWest closed non-core asset sales for proceeds of $99.5 million. These funds were used to reduce the amount drawn on the bank credit facility. In addition, another $5.4 million of assets were held for sale and closed in February 2005.
- Year end net debt to annualized fourth quarter 2004 cash flow is 1.7 times.
- Operating margin of $23.47/BOE for 2004, up 14% from 2003 primarily due to higher commodity prices throughout the year, offset by higher operating costs in 2004.
- Distributions of $3.30 per Trust Unit in 2004 compared to $4.32 in 2003 due partially to a lower payout ratio of 74% in 2004 compared to 89% in 2003.
- Hedging losses of $28.2 million ($2.16/BOE) in 2004, compared to losses of $30.5 million ($2.51/BOE) in 2003 and gains of $28.1 million ($2.55/BOE) in 2002.
- Capital development program of $125.1 million added 10.3 mmBOE of Proved plus Probable reserves on a Company Interest basis at $12.15/BOE, which excludes $0.92/BOE for future development capital. (Refer to the Reserves and Production section on page 40 for reserve definitions.)
- In 2004, PrimeWest’s corporate and asset acquisitions, which included Seventh Energy and the Calpine assets, were $807.4 million.
- Operating expenses at $6.83/BOE were 5% higher on a per BOE basis in 2004 compared to 2003, primarily due to rising industry costs.
- Company Interest Proved plus Probable reserves of 155.2 mmBOE at December 31, 2004, represents an increase of 45% from 106.8 mmBOE reported as at December 31, 2003. PrimeWest’s current Reserve Life Index (RLI) is 10.3 years on a Company Interest Proved plus Probable basis.
- Company Interest Proved Producing reserves of 105.8 mmBOE at December 31, 2004, represent an increase of 37% over the December 31, 2003 Company Interest Proved Producing reserves of 77.5 mmBOE. The Company Interest Proved Producing RLI is 7.6 years.
- Cash general and administrative expenses increased $4.5 million over 2003 reflecting higher salaries, higher short-term incentive bonuses, increased information technology expenditures, one-time consultingcosts associated with potential acquisitions, and increased Board of Directors costs. These increases were partially offset by increases in overhead recoveries.
PrimeWest Energy Trust Annual Report 2004
- Interest expense during 2004 is 36% higher compared to 2003 as a result of higher average debt levels during the fourth quarter due to the acquisition of the Calpine assets.
- The Distribution Reinvestment, Premium Distribution and Optional Trust Unit Purchase Plans added $60 million of proceeds that were used for the capital development program and to repay debt.
SUBSEQUENT EVENTS
On January 26, 2005, Standard & Poor’s announced the inclusion of income trusts in the S&P/TSX Composite Index, Canada's benchmark stock index. Specifics regarding the inclusion process, including the impact on PrimeWest is expected to be announced by mid-year 2005.
On January 27, 2005 the Unitholders of Calpine Natural Gas Trust approved the business combination of Calpine Natural Gas Trust and Viking Energy Royalty Trust. As a result PrimeWest’s 25% Unit ownership of Calpine Natural Gas Trust has been converted into an 8.3% ownership of Viking Energy Trust. As of February 24, 2005, PrimeWest has sold its 8.3% ownership of Viking Energy Trust and has received gross proceeds of $95.8 million.
NON-GAAP MEASURES
This annual report contains the following measurements that are not defined by Canadian Generally Accepted Accounting Principles (“GAAP”):
- Cash flow from operations on a total and per Unit basis;
- Distributions per Trust Unit; and
- Net debt per Trust Unit.
These measurements do not have any standardized meaning prescribed by GAAP and are, therefore, unlikely to be comparable to similar measures presented by other entities.
Cash flow from operations is calculated from the Trust’s cash flow statement as cash flow from operating activities before changes in working capital. Cash flow from operations per Trust Unit is calculated using cash flow and adding back the interest expense on the Convertible Unsecured Subordinated Debentures, divided by the diluted weighted average Units outstanding in the year. The diluted weighted average Units outstanding consists of the weighted average Trust Units and Exchangeable Shares outstanding and includes the Trust Units issuable pursuant to the conversion of the Convertible Unsecured Subordinated Debentures, and Trust Units issuable pursuant to the Long-Term Incentive Plan. Cash flow from operations is a key performance indicator of PrimeWest’s ability to generate cash and finance operations and pay monthly distributions.
Distributions per Trust Unit disclose the cash distributions accrued in 2004 based on the number of Trust Units outstanding on the date the distributions were declared.
Net debt per Trust Unit is calculated as long-term debt, including Convertible Unsecured Subordinated Debentures, less working capital, excluding financial derivative assets and liabilities, divided by the number of Trust Units and Exchangeable Shares outstanding and Trust Units issuable pursuant to the Long-Term Incentive Plan at December 31, 2004.
PrimeWest Energy Trust Annual Report 2004
The Trust’s cash flow from operations, distributions per Trust Unit and net debt per Trust Unit may not be directly comparable to similar measures presented by other companies or trusts.
FORWARD-LOOKING INFORMATION
This MD&A contains forward-looking or outlook information with respect to PrimeWest.
The use of any of the words “anticipate, “continue, “estimate”, “expect”, “forecast”, “may”, “will”, “project”, “should”, “believe”, “outlook” and similar expressions are intended to identify forward-looking statements. These statements involve known and unknown risks, uncertainties and other factors that may cause actual results or events to differ materially from those anticipated in our forward-looking statements. We believe the expectations reflected in those forward-looking statements are reasonable. However, we cannot assure you that these expectations will prove to be correct. You should not unduly rely on forward-looking statements included in this report. These statements speak only as of the date of this MD&A.
In particular, this MD&A contains forward-looking statements pertaining to the following:
- The quantity and recoverability of our reserves;
- The timing and amount of future production;
- Prices for oil, natural gas, and natural gas liquids produced;
- Operating and other costs;
- Business strategies and plans of management;
- Supply and demand for oil and natural gas;
- Expectations regarding our ability to raise capital and to add to our reserves through acquisitions and exploration and development;
- Our treatment under governmental regulatory regimes;
- The focus of capital expenditures on development activity rather than exploration;
- The sale, farming in, farming out or development of certain exploration properties using third-party resources;
- The objective to achieve a predictable level of monthly cash distributions;
- The use of development activity and acquisitions to replace and add to reserves;
- The impact of changes in oil and natural gas prices on cash flow after hedging;
- Drilling plans;
- The existence, operations and strategy of the commodity price risk management program;
- The approximate and maximum amount of forward sales and hedging to be employed;
- The Trust’s acquisition strategy, the criteria to be considered in connection therewith and the benefits to be derived therefrom;
- The impact of the Canadian federal and provincial governmental regulation on the Trust relative to other oil and natural gas issuers of similar size;
- The goal to sustain or grow production and reserves through prudent management and acquisitions;
PrimeWest Energy Trust Annual Report 2004
- The emergence of accretive growth opportunities; and
- The Trust’s ability to benefit from the combination of growth opportunities and the ability to grow through the capital markets.
Our actual results could differ materially from those anticipated in these forward-looking statements as a result of the risk factors set forth below and elsewhere in this MD&A:
- Volatility in market prices for oil and natural gas;
- The impact of weather conditions on seasonal demand;
- Risks inherent in our oil and natural gas operations;
- Uncertainties associated with estimating reserves;
- Competition for, among other things: capital, acquisitions of reserves, undeveloped lands and skilled personnel;
- Incorrect assessments of the value of acquisitions;
- Geological, technical, drilling and processing problems;
- General economic conditions in Canada, the United States and globally;
- Industry conditions, including fluctuations in the price of oil and natural gas;
- Royalties payable in respect of PrimeWest’s oil and natural gas production;
- Government regulation of the oil and natural gas industry, including environmental regulation;
- Fluctuation in foreign exchange or interest rates;
- Unanticipated operating events that can reduce production or cause production to be shut-in or delayed;
- Failure to obtain industry partner and other third-party consents and approvals, when required;
- Stock market volatility and market valuations;
- OPEC’s ability to control production to balance global supply and demand of crude oil at desired price levels;
- Political uncertainty, including the risks of hostilities, in the petroleum producing regions of the world;
- The need to obtain required approvals from regulatory authorities; and
- The other factors discussed under “Operational and Other Business Risks” in this MD&A.
These factors should not be construed as exhaustive.
EVALUATION OF DISCLOSURE CONTROLS AND PROCEDURES
The Chief Executive Officer, Don Garner, and Chief Financial Officer, Dennis Feuchuk, evaluated the effectiveness of PrimeWest’s disclosure controls and procedures as of December 31, 2004, and concluded that PrimeWest’s disclosure controls and procedures are effective in ensuring that information PrimeWest is required to disclose in its filings with the Securities and Exchange Commission under the Securities Exchange Act of 1934 is recorded, processed, summarized and reported, within the time periods specified in the Commission’s rules and forms. PrimeWest’s disclosure controls ensures that the information required to be disclosed by PrimeWest in itsreports filed under the Exchange Act are accumulated and communicated to PrimeWest’s management, including its principal Executive Officer and principal Financial Officer, appropriately to allow timely decisions regarding required disclosure.
PrimeWest Energy Trust Annual Report 2004
CHANGES TO INTERNAL CONTROLS AND PROCEDURES FOR FINANCIAL REPORTING
There were no significant changes to PrimeWest’s internal controls or in other factors that could significantly affect these controls subsequent to the evaluation date.
VISION, CORE BUSINESS AND STRATEGY
PrimeWest Energy Trust is a conventional oil and natural gas royalty trust actively managed to generate monthly cash distributions for Unitholders. The Trust’s operations are focused in Canada, with its assets concentrated in the Western Canada Sedimentary Basin. PrimeWest is one of North America’s largest natural gas weighted energy trusts.
Maximizing total return to Unitholders, in the form of cash distributions and change in unit price, is PrimeWest’s overriding objective. Our strategies for asset management and growth, financial management and corporate governance are outlined in this MD&A, along with a discussion of our performance in 2004 and our goals for 2005 and beyond.
We believe that PrimeWest can maximize total return to Unitholders through the continued development of our core properties, making opportunistic acquisitions that emphasize value creation, exercising disciplined financial management which broadens access to capital while minimizing risk to Unitholders, and complying with strong corporate governance to protect the interests of all stakeholders.
ASSET MANAGEMENT AND GROWTH
PrimeWest has a strategy to focus our expansion efforts on existing Canadian core areas, and pursue depletion optimization strategies within those core areas to maximize asset value. We strive to control our operations whenever possible, and maintain high working interests. Maintaining control of 80% of operations allows us to use existing infrastructure and synergies within our core areas. We believe this high level of operatorship can translate to control over costs and timing of capital outlays and projects. The current size of the Trust gives us the ability and critical mass to make acquisitions of significant size, while still being able to add value by transacting smaller acquisitions.
FINANCIAL MANAGEMENT
PrimeWest strives to maintain a conservative debt position to allow us to fund smaller acquisitions without tapping into the capital markets, and to fund ongoing development activities. Our long-term debt is comprised of bank credit facilities through a bank syndicate, Senior Secured Notes and Convertible Unsecured Subordinated Debentures. Our diversified debt instruments help to reduce our reliance on the bank syndicate, as well as afford additional foreign exchange protection because a portion of our debt, the Senior Secured Notes, are denominated in US dollars. PrimeWest’s commodity hedging approach helps to stabilize cash flow, reduce volatility, and protect transaction economics.
PrimeWest Energy Trust Annual Report 2004
PrimeWest continues to target a payout ratio between 70-90% of annual cash flow from operations to increase the Trust’s financial flexibility. The 2004 payout ratio was approximately 74%, and the retained cash flow was utilized to partially fund the Trust’s capital spending program and repay debt. PrimeWest’s net debt to cash flow level is 1.7 times at 2004 year end using annualized fourth quarter cash flows.
PrimeWest’s dual listing on both the Toronto Stock Exchange (TSX) and New York Stock Exchange (NYSE) provides increased liquidity and a broadened investor base. The NYSE listing enables US Unitholders to conveniently trade in our Trust Units, and allows us to access the US capital markets in the future. Our status as a corporation for US tax purposes simplifies tax reporting for our US Unitholders.
For eligible Canadian Unitholders, PrimeWest offers participation in the Distribution Reinvestment Plan (DRIP), Premium Distribution Plan (PREP), and Optional Trust Unit Purchase Plan (OTUPP), which represent a convenient way to maximize an investment in PrimeWest. For alternate investment styles, PrimeWest also has Exchangeable Shares and Convertible Unsecured Subordinated Debentures available, which permit participation in PrimeWest without the ongoing tax implications associated with receiving a distribution.
CORPORATE GOVERNANCE
PrimeWest remains committed to the highest standards of corporate governance and upholds the rules of the governing regulatory bodies under which it operates. Full disclosure of our compliance with existing corporate governance rules and regulations is available on our website at www.primewestenergy.com. PrimeWest actively monitors the corporate governance and disclosure environment to ensure compliance with current and future requirements.
Our high standards of corporate governance are not limited to the boardroom. At the field level, PrimeWest proactively manages environmental, health and safety issues. We place a great deal of importance on community involvement and maintaining good relationships with landowners.
OUTLOOK – 2005
PrimeWest expects 2005 production volumes to average approximately 41,000 BOE/day. Full year operating costs are expected to be approximately $6.60/BOE, while full year general and administrative (G&A) costs are expected to be approximately $1.25/BOE. PrimeWest expects to invest approximately $125 million in its capital development program with the focus on further development of our Alberta natural gas assets. Approximately $50 million will be invested in development of tight gas assets at Caroline and Columbia; $20 million will be invested in developing shallow gas assets in southeastern Alberta; and approximately $55 million will be invested in development of natural gas at Crossfield and conventional development opportunities. The Trust plans to begin evaluating coal bed methane potential on our land holdings in the Horseshoe Canyon fairway.
PrimeWest Energy Trust Annual Report 2004
| CASH FLOW RECONCILIATION | | | |
| ($ millions) | | | |
| 2003 cash flow from operations | | $ | 216.6 | |
| Production volumes | | | 33.1 | |
| Commodity prices | | | 43.8 | |
| Net hedging change from prior year | | | 2.3 | |
| Operating expenses | | | (9.5 | ) |
| Royalties | | | (17.9 | ) |
| Interest | | | (5.5 | ) |
| General and administrative | | | (4.5 | ) |
| Other | | | 8.4 | |
| 2004 cash flow from operations | | $ | 266.8 | |
The above table includes non-GAAP measurements (Refer to Non-GAAP Measures on page 33.)
The key performance driver for the Trust is cash flow from operations which directly affects PrimeWest’s ability to pay monthly distributions. Cash flow is generated through the production and sale of crude oil, natural gas and natural gas liquids, and is dependent on production levels, commodity prices, operating expenses, interest, G&A, hedging gains or losses, royalties and currency exchange rates. Some of these factors such as commodity prices, the currency exchange rate and royalties are not controllable by PrimeWest. Other factors that are, to a certain extent, controllable by PrimeWest include production levels and operating expenses, as well as interest and G&A expenses.
CAPITAL SPENDING
Capital expenditures, including development, acquisitions and divestitures, totalled $837.6 million in 2004, versus $334.4 million in 2003.
| ($ millions, except per BOE) | | 2004 | | 2003 | |
| Land and lease acquisitions | | $ | 8.3 | | $ | 6.0 | |
| Geological and geophysical | | | 8.2 | | | 5.8 | |
| Drilling and completions | | | 69.8 | | | 58.4 | |
| Equipping and tie-in | | | 12.1 | | | 19.0 | |
| Compression and processing | | | 4.7 | | | 6.3 | |
| Gas gathering | | | 4.4 | | | 2.3 | |
| Production facilities | | | 15.8 | | | 5.7 | |
| Capitalized general and administrative | | | 1.8 | | | 1.0 | |
| Development capital | | $ | 125.1 | | $ | 104.5 | |
| Corporate/property acquisitions | | | 807.4 | | | 230.9 | |
| Dispositions | | | (99.5 | ) | | (2.3 | ) |
| Leasehold improvements, furniture and equipment | | | 4.6 | | | 1.3 | |
| Total | | $ | 837.6 | | $ | 334.4 | |
In 2004, PrimeWest completed $807.4 million of corporate and property acquisitions that included the Calpine assets and Seventh Energy. Total capital and corporate acquisitions added 46.5 mmBOE of Company Interest Proved reserves and 58.3 mmBOE of Company Interest Proved plus Probable reserves. Property dispositions of $104.9 million, comprised of proceeds of $99.5 million and assets held for sale of $5.4 million, resulted in a reduction of the Company Interest Proved plus Probable reserves of 5.1 mmBOE.
PrimeWest’s 2004 capital development program totalled $125.1 million (2003 – $104.5 million). The program focused on core areas of Caroline, Columbia, Princess, Boundary Lake, Brant Farrow and Valhalla. Thedevelopment program added 7.3 mmBOE of Company Interest Proved reserves and 10.3 mmBOE of Company Interest Proved plus Probable reserves.
PrimeWest Energy Trust Annual Report 2004
Leasehold improvements during 2004 of $2.5 million were incurred as a result of additional office space requirements associated with the Calpine acquisition.
| | | 2004 | | 2003 | |
| Development program | | | | | | | |
| Proved reserve additions (mmBOE)(1) | | | 7.3 | | | 6.9 | |
| Average cost ($/BOE)(2)(3) | | $ | 17.76 | | $ | 15.98 | |
| Proved plus Probable reserve additions (mmBOE)(1) | | | 10.3 | | | 7.9 | |
| Average cost ($/BOE)(2)(3) | | $ | 13.07 | | $ | 14.29 | |
| Acquisition program(4) | | | | | | | |
| Proved reserve additions (mmBOE) | | | 42.4 | | | 12.7 | |
| Average cost ($/BOE) | | $ | 16.57 | | $ | 18.84 | |
| Proved plus Probable reserve additions (mmBOE) | | | 53.2 | | | 15.6 | |
| Average cost ($/BOE) | | $ | 13.20 | | $ | 15.71 | |
(1)
| Proved and Proved plus Probable reserve additions exclude the impact of technical revisions and economic factors.
|
(2)
| Under NI 51-101 the implied methodology to be used to calculate finding development and acquisition (FD&A) costs includes incorporating future development capital (FDC) required to bring the Company Interest Proved Undeveloped and Probable reserves to production. The average cost per BOE from Company Interest Proved reserve additions includes FDC of $0.62/BOE ($0.84/BOE for 2003), and the average cost per BOE from Company Interest Proved plus Probable reserve additions includes FDC of $0.92/BOE ($1.06/BOE for 2003).
|
(3)
| The aggregate of the costs incurred under the capital development program incurred in 2004 and the estimated future development costs generally will not reflect total finding and development costs related to reserve additions for that year.
|
(4)
| Net of dispositions.
|

Drilling, completions and tie-in spending represents 65% of development capital that contributed to new reserve additions. Of the development capital, $24.9 million or 20% was invested in facilities, which includes debottlenecking, increasing capacity and other activities that contribute to future production volumes.
In 2005, PrimeWest plans to invest approximately $125 million on its capital development programs. The 2005 program will focus on further development of our Alberta natural gas assets.
Given that production volumes will decline naturally over time as oil or natural gas reservoirs are depleted, PrimeWest is always striving to offset this natural production decline and add to reserves in an effort to sustain cash flows. Investment in activities such as development drilling, workovers, and recompletions can add incremental production volumes and reserves.
Capital is allocated on the basis of anticipated rate of return on projects undertaken. At PrimeWest, every capital project is measured against stringent economic evaluation criteria prior to approval. These criteria include expected return, risks and further development opportunities.
PrimeWest Energy Trust Annual Report 2004
ASSETS
Since inception, PrimeWest has focused on the conventional oil and natural gas plays of the Western Canada Sedimentary Basin. Within this focused area, we have a diversified, multi-zone suite of assets stretching from northeast B.C. and across much of Alberta. We believe this diversity reduces risks to overall corporate production and cash flow, while the core area focus allows us to capitalize on our existing technical knowledge in each of the core areas.
RESERVES AND PRODUCTION
National Instrument 51-101 (NI 51-101) was introduced by the Canadian Securities Administrators in 2003 to improve the standards and quality of reserve reporting and to achieve a higher industry consistency. Under NI 51-101, “Proved” reserves are those reserves that can be estimated with a high degree of certainty to be recoverable (i.e. it is likely that the actual remaining quantities recovered will exceed the estimated Proved reserves). In accordance with this definition, the level of certainty targeted by the reporting company should result in at least a 90% probability that the quantities actually recovered will equal or exceed the estimated reserves. In the case of “Probable” reserves, which are obviously less certain to be recovered than Proved reserves, NI 51-101 states that it must be equally likely that the actual remaining quantities recovered will be greater or less than the sum of the estimated Proved plus Probable reserves. With respect to the consideration of certainty, in order to report reserves as Proved plus Probable, the reporting company must believe that there is at least a 50% probability that the quantities actually recovered will equal or exceed the sum of the estimated Proved plus Probable reserves.
In accordance with NI 51-101, six thousand cubic feet (6 mcf) of natural gas and one barrel of natural gas liquids (1 barrel NGLs) each equal one barrel of oil equivalent (1 BOE). This conversion rate is not based on price or energy content. As such, BOEs may be misleading, particularly if used in isolation. A BOE conversion ratio of 6 mcf of natural gas to 1 barrel of crude oil is based on an energy equivalency conversion method primarily applicable at the burner tip and does not represent a value equivalency at the wellhead.
The following table sets forth a reconciliation of light, medium and heavy crude oil, natural gas, natural gas liquids and barrels of oil equivalent of the Company Interest reserves of PrimeWest for the year ended December 31, 2004, derived from the report of the independent reserve evaluators, Gilbert Lausten Jung Associates Ltd. (GLJ), using Forecast Price and Cost estimates, and reconciled to December 31, 2003. PrimeWest’s Company Interest reserves include working interest and royalties receivable. This definition is consistent with the basis on which reserves were reported in prior years.
Company Interest Reserves – Consultants’ Average Pricing
| | | Light,Medium and Heavy Crude Oil (mbbls) | | Natural Gas (Bcf) | |
| | | Proved Producing | | Total Proved | | Probable | | Proved plus Probable | | Proved Producing | | Total Proved | | Probable | | Proved plus Probable | |
| December 31, 2003 | | | 18,854.0 | | | 19,554.6 | | | 3,324.4 | | | 22,879.0 | | | 304.9 | | | 343.2 | | | 89.0 | | | 432.2 | |
| Capital additions | | | 680.3 | | | 704.9 | | | 545.4 | | | 1,250.3 | | | 10.5 | | | 19.8 | | | 5.6 | | | 25.4 | |
| Improved recovery | | | 356.1 | | | 329.1 | | | 20.1 | | | 349.2 | | | 11.9 | | | 13.2 | | | 6.7 | | | 19.9 | |
| Technical revisions | | | 1,233.5 | | | 1,193.9 | | | 107.1 | | | 1,301.0 | | | (6.3 | ) | | (3.2 | ) | | (7.7 | ) | | (10.9 | ) |
| Acquisitions | | | 3,033.7 | | | 3,306.1 | | | 600.4 | | | 3,906.5 | | | 194.2 | | | 224.7 | | | 58.7 | | | 283.4 | |
| Dispositions | | | (2,074.3 | ) | | (2,292.3 | ) | | (459.4 | ) | | (2,751.7 | ) | | (6.6 | ) | | (10.1 | ) | | (3.1 | ) | | (13.2 | ) |
| Economic factors(1) | | | – | | | – | | | – | | | – | | | (5.0 | ) | | (5.1 | ) | | (0.3 | ) | | (5.4 | ) |
| Production | | | (3,031.3 | ) | | (3,031.3 | ) | | – | | | (3,031.3 | ) | | (53.4 | ) | | (53.4 | ) | | – | | | (53.4 | ) |
| December 31, 2004 | | | 19,052.0 | | | 19,765.0 | | | 4,138.0 | | | 23,903.0 | | | 450.2 | | | 529.2 | | | 148.7 | | | 677.9 | |
PrimeWest Energy Trust Annual Report 2004
| | | Natural Gas Liquids (mbbls) | | Barrel of Oil Equivalent (mmBOE) | |
| | | Proved | | Total | | | | Proved plus | | Proved | | Total | | | | Proved plus | |
| | | Producing | | Proved | | Probable | | Probable | | Producing | | Proved | | Probable | | Probable | |
| December 31, 2003 | | | 7,798.0 | | | 8,975.1 | | | 2,887.7 | | | 11,862.8 | | | 77.5 | | | 85.7 | | | 21.1 | | | 106.8 | |
| Capital additions | | | 259.1 | | | 294.0 | | | 61.3 | | | 355.3 | | | 2.7 | | | 4.3 | | | 1.5 | | | 5.8 | |
| Improved recovery | | | 398.3 | | | 458.6 | | | 311.1 | | | 769.7 | | | 2.7 | | | 3.0 | | | 1.4 | | | 4.4 | |
| Technical revisions | | | (365.4 | ) | | (243.5 | ) | | (349.0 | ) | | (592.5 | ) | | (0.2 | ) | | 0.4 | | | (1.5 | ) | | (1.1(1 | )) |
| Acquisitions | | | 4,838.6 | | | 5,706.4 | | | 1,406.0 | | | 7,112.4 | | | 40.3 | | | 46.5 | | | 11.8 | | | 58.3 | |
| Dispositions | | | (52.3 | ) | | (65.3 | ) | | (35.1 | ) | | (100.4 | ) | | (3.2 | ) | | (4.0 | ) | | (1.1 | ) | | (5.1 | ) |
| Economic factors(2) | | | – | | | – | | | – | | | – | | | (0.8 | ) | | (0.9 | ) | | – | | | (0.9 | ) |
| Production | | | (1,137.3 | ) | | (1,137.3 | ) | | – | | | (1,137.3 | ) | | (13.1 | ) | | (13.1 | ) | | – | | | (13.1 | ) |
| December 31, 2004 | | | 11,739.0 | | | 13,988.0 | | | 4,282.0 | | | 18,270.0 | | | 105.8 | | | 121.9 | | | 33.3 | | | 155.2 | |
| Columns may not add due to rounding. | | | | | | | | | | | | | | | | | | |
(1)
| Approximately 0.8 mmBOE of this amount is attributable to the cessation of liquids stripping, resulting in a higher heat content gas stream.
|
(2)
| Economic factors relate to reserves that have been shut-in due to the EUB gas-over-bitumen issue. Due to the uncertainty of their future production, these reserves have been removed from the corporate total.
|
The following table sets forth a reconciliation of PrimeWest’s net reserves for the year ended December 31, 2004 derived from the report of the independent reserve evaluators, GLJ, using the Consultants’ Average Pricing and cost estimates. These year end reserves are reconciled to December 31, 2003 reserves. PrimeWest’s net reserves include working interest reserves plus royalties receivable, less royalties payable, as stipulated by NI 51-101. All data in the following tables was provided by GLJ.
Net Reserves – Consultants’ Average Pricing
| | | Light and Medium Crude Oil (mbbls) | | Heavy Oil (mbbls) | |
| | | Proved | | Total | | | | Proved plus | | Proved | | Total | | | | Proved plus | |
| | | Producing | | Proved | | Probable | | Probable | | Producing | | Proved | | Probable | | Probable | |
| December 31, 2003 | | | 14,284 | | | 14,829 | | | 2,504 | | | 17,333 | | | 2,856 | | | 2,959 | | | 435 | | | 3,394 | |
| Extensions | | | 460 | | | 482 | | | 427 | | | 909 | | | – | | | – | | | – | | | – | |
| Improved | | | | | | | | | | | | | | | | | | | | | | | | | |
| Recovery | | | 312 | | | 286 | | | 17 | | | 303 | | | 4 | | | 4 | | | 1 | | | 5 | |
| Technical revisions | | | 126 | | | 5 | | | 69 | | | 74 | | | (40 | ) | | (1 | ) | | (14 | ) | | (15 | ) |
| Discoveries | | | 82 | | | 82 | | | 28 | | | 110 | | | – | | | – | | | – | | | – | |
| Acquisitions | | | 2,415 | | | 2,602 | | | 458 | | | 3,060 | | | 297 | | | 352 | | | 74 | | | 426 | |
| Dispositions | | | (1,331 | ) | | (1,417 | ) | | (454 | ) | | (1,871 | ) | | (454 | ) | | (570 | ) | | (136 | ) | | (706 | ) |
| Economic factors(1) | | | 268 | | | 276 | | | 49 | | | 325 | | | 762 | | | 763 | | | 143 | | | 906 | |
| Production | | | (1,849 | ) | | (1,849 | ) | | – | | | (1,849 | ) | | (884 | ) | | (884 | ) | | – | | | (884 | ) |
| December 31, 2004 | | | 14,767 | | | 15,296 | | | 3,098 | | | 18,394 | | | 2,541 | | | 2,623 | | | 503 | | | 3,126 | |
| | | Associated and Non-Associated Gas (Natural Gas) (Bcf) | | Natural Gas Liquids (mbbls) | |
| | | Proved | | Total | | | | Proved plus | | Proved | | Total | | | | Proved plus | |
| | | Producing | | Proved | | Probable | | Probable | | Producing | | Proved | | Probable | | Probable | |
| December 31, 2003 | | | 240.7 | | | 269.9 | | | 70.1 | | | 339.9 | | | 5,570 | | | 6,381 | | | 2,051 | | | 8,433 | |
| Extensions | | | 7.3 | | | 14.9 | | | 4.1 | | | 19.1 | | | 174 | | | 205 | | | 40 | | | 245 | |
| Improved recovery | | | 9.5 | | | 10.6 | | | 5.3 | | | 15.9 | | | 278 | | | 320 | | | 214 | | | 534 | |
| Technical revisions | | | (0.8 | ) | | 1.8 | | | (6.1 | ) | | (4.4 | ) | | (305 | ) | | (189 | ) | | (259 | ) | | (448 | ) |
| Discoveries | | | 0.9 | | | 1.2 | | | 0.4 | | | 1.6 | | | 3 | | | 6 | | | 2 | | | 8 | |
| Acquisitions | | | 154.5 | | | 179.0 | | | 46.6 | | | 225.6 | | | 3,405 | | | 4,021 | | | 980 | | | 5,001 | |
| Dispositions | | | (9.3 | ) | | (12.1 | ) | | (2.9 | ) | | (15.0 | ) | | (37 | ) | | (46 | ) | | (23 | ) | | (69 | ) |
| Economic factors(1) | | | (2.4 | ) | | (2.6 | ) | | 0.1 | | | (2.4 | ) | | 20 | | | 13 | | | 2 | | | 15 | |
| Production | | | (42.2 | ) | | (42.2 | ) | | 0.0 | | | (42.2 | ) | | (800 | ) | | (800 | ) | | – | | | (800 | ) |
| December 31, 2004 | | | 358.2 | | | 420.4 | | | 117.6 | | | 538.0 | | | 8,308 | | | 9,911 | | | 3,008 | | | 12,919 | |
PrimeWest Energy Trust Annual Report 2004
| | | Total (mmBOE) | |
| | | Proved | | | | | | Proved plus | |
| | | Producing | | Proved | | Probable | | Probable | |
| December 31, 2003 | | | 62.8 | | | 69.1 | | | 16.7 | | | 85.8 | |
| Extensions | | | 1.9 | | | 3.2 | | | 1.2 | | | 4.3 | |
| Improved recovery | | | 2.2 | | | 2.4 | | | 1.1 | | | 3.5 | |
| Technical revisions | | | (0.4 | ) | | 0.1 | | | (1.2 | ) | | (1.1(1 | )) |
| Discoveries | | | 0.2 | | | 0.3 | | | 0.1 | | | 0.4 | |
| Acquisitions | | | 31.9 | | | 36.8 | | | 9.3 | | | 46.1 | |
| Dispositions | | | (3.4 | ) | | (4.1 | ) | | (1.1 | ) | | (5.2 | ) |
| Economic factors(2) | | | 0.6 | | | 0.6 | | | 0.2 | | | 0.8 | |
| Production | | | (10.6 | ) | | (10.6 | ) | | 0.0 | | | (10.6 | ) |
| December 31, 2004 | | | 85.3 | | | 97.9 | | | 26.2 | | | 124.1 | |
| Columns may not add due to rounding. | | | | | | | | | | | | | |
(1)
| Approximately 0.8 mmBOE of this amount is attributable to the cessation of liquids stripping, resulting in a higher heat content gas stream.
|
(2)
| Economic factors relate to reserves that have been shut-in due to the EUB gas-over-bitumen issue. Due to the uncertainty of their future production, these reserves have been removed from the corporate total.
|
FORECAST PRICES AND COSTS
The following tables provide reserves data and a breakdown of future net revenue by component and production group using forecast prices and costs on a Company Interest, gross and net basis.
Summary of Oil and Natural Gas Reserves and Net Present Values of Future Net Revenue as of December 31, 2004 Forecast Prices and Costs
| | | Reserves | |
| | | Light and Medium Crude Oil (mbbls) | | Heavy Oil (mbbls) | |
| | | Company | | | | | | Company | | | | | |
| Reserves Category | | Interest | | Gross | | Net | | Interest | | Gross | | Net | |
| PROVED | | | | | | | | | | | | | | | | | | | |
| Developed producing | | | 16,272 | | | 14,701 | | | 14,767 | | | 2,780 | | | 2,766 | | | 2,541 | |
| Developed non-producing | | | 267 | | | 267 | | | 249 | | | 61 | | | 61 | | | 54 | |
| Undeveloped | | | 354 | | | 335 | | | 280 | | | 32 | | | 32 | | | 28 | |
| TOTAL PROVED | | | 16,893 | | | 15,303 | | | 15,296 | | | 2,872 | | | 2,859 | | | 2,623 | |
| PROBABLE | | | 3,587 | | | 3,295 | | | 3,098 | | | 551 | | | 548 | | | 503 | |
| TOTAL PROVED PLUS PROBABLE | | | 20,480 | | | 18,597 | | | 18,394 | | | 3,423 | | | 3,407 | | | 3,126 | |
| Columns may not add due to rounding. | | | | | | | | | | | | | | | | | | | |
| | | Reserves | |
| | | Natural Gas (Bcf) | | Natural Gas Liquids (mbbls) | |
| | | Company | | | | | | Company | | | | | |
| Reserves Category | | Interest | | Gross | | Net | | Interest | | Gross | | Net | |
| PROVED | | | | | | | | | | | | | | | | | | | |
| Developed producing | | | 450.2 | | | 440.8 | | | 358.2 | | | 11,739 | | | 11,494 | | | 8,308 | |
| Developed non-producing | | | 38.1 | | | 38.0 | | | 30.2 | | | 1,089 | | | 1,089 | | | 808 | |
| Undeveloped | | | 40.9 | | | 40.9 | | | 32.0 | | | 1,160 | | | 1,160 | | | 795 | |
| TOTAL PROVED | | | 529.2 | | | 519.8 | | | 420.4 | | | 13,988 | | | 13,743 | | | 9,911 | |
| PROBABLE | | | 148.7 | | | 147.3 | | | 117.6 | | | 4,282 | | | 4,243 | | | 3,008 | |
| TOTAL PROVED PLUS PROBABLE | | | 677.9 | | | 667.0 | | | 538.0 | | | 18,270 | | | 17,986 | | | 12,919 | |
| Columns may not add due to rounding. | | | | | | | | | | | | | | | | | | | |
PrimeWest Energy Trust Annual Report 2004
| | | Reserves | |
| | | Total (mBOE) | |
| | | Company | | | | | |
| Reserves Category | | Interest | | Gross | | Net | |
| PROVED | | | | | | | | | | |
| Developed producing | | | 105,825 | | | 102,431 | | | 85,316 | |
| Developed non-producing | | | 7,761 | | | 7,753 | | | 6,143 | |
| Undeveloped | | | 8,368 | | | 8,349 | | | 6,441 | |
| TOTAL PROVED | | | 121,954 | | | 118,533 | | | 97,900 | |
| PROBABLE | | | 33,208 | | | 32,629 | | | 26,207 | |
| TOTAL PROVED PLUS PROBABLE | | | 155,162 | | | 151,162 | | | 124,107 | |
| Columns may not add due to rounding. | | | | | | | | | | |
| | | Net Present Values of Future Net Revenue | |
| | | Before Future Income Tax Expenses | | After Future Income Tax Expenses | |
| | | Discounted at (%) | | Discounted at (%) | |
| | | 0% | | 5% | | 10% | | 15% | | 20% | | 0% | | 5% | | 10% | | 15% | | 20% | |
| Reserves Category | | ($ millions) | | ($ millions) | |
| PROVED | | | | | | | | | | | | | | | | | | | | | | | | | | | | | | | |
| Developed producing | | | 2,263.6 | | | 1,655.8 | | | 1,331.5 | | | 1,129.6 | | | 990.8 | | | 2,263.6 | | | 1,655.8 | | | 1,331.5 | | | 1,129.6 | | | 990.8 | |
| Developed non-producing | | | 165.2 | | | 99.4 | | | 71.7 | | | 56.6 | | | 47.2 | | | 165.2 | | | 99.4 | | | 71.7 | | | 56.6 | | | 47.2 | |
| Undeveloped | | | 137.5 | | | 84.1 | | | 56.4 | | | 40.0 | | | 29.2 | | | 137.5 | | | 84.1 | | | 56.4 | | | 40.0 | | | 29.2 | |
| TOTAL PROVED | | | 2,566.2 | | | 1,839.3 | | | 1,459.6 | | | 1,226.1 | | | 1,067.2 | | | 2,566.2 | | | 1,839.3 | | | 1,459.6 | | | 1,226.1 | | | 1,067.2 | |
| PROBABLE | | | 731.8 | | | 392.1 | | | 254.8 | | | 184.9 | | | 143.3 | | | 731.8 | | | 392.1 | | | 254.8 | | | 184.9 | | | 143.3 | |
TOTAL PROVED PLUS PROBABLE | | | 3,298.1 | | | 2,231.4 | | | 1,714.4 | | | 1,411.0 | | | 1,210.5 | | | 3,298.1 | | | 2,231.4 | | | 1,714.4 | | | 1,411.0 | | | 1,210.5 | |
| Columns may not add due to rounding. | | | | | | | | | | | | | | | | | | | | | | | | | | | |
| PRODUCTION VOLUMES | | | | | | | |
| | | 2004 | | 2003 | | Change (%) | |
| Natural gas (mmcf/day) | | | 145.1 | | | 134.1 | | | 8 | |
| Crude oil (bbls/day) | | | 8,282 | | | 8,116 | | | 2 | |
| Natural gas liquids (bbls/day) | | | 3,107 | | | 2,855 | | | 9 | |
| Total (BOE/day) | | | 35,578 | | | 33,316 | | | 7 | |
| Gross overriding royalty volumes included above (BOE/day) | | | 1,440 | | | 1,604 | | | (10 | ) |
All production information is reported before the deduction of Crown and freehold royalties.
The 7% increase in production volumes year-over-year is due to the acquisition of Seventh Energy and Calpine assets during the year, combined with development additions, and offset by asset divestitures and natural decline. During 2004, approximately 2,900 BOE/day of annualized incremental production was brought online from development activities to mitigate decline. Approximately 1,900 BOE/day of new production remained behind pipe at the end of 2004.
The acquisition of the Calpine assets, with current production volumes of approximately 14,360 BOE/day added the equivalent of 4,759 BOE/day in 2004 average daily production volumes. Assets acquired from Seventh Energy contributed 1,198 BOE/day to 2004 average daily production volumes.
PrimeWest Energy Trust Annual Report 2004
Production from PrimeWest’s non-operated Ells property in northeast Alberta was shut-in by the Alberta Energy and Utilities Board (EUB) effective July 1, 2004, as a result of the gas-over-bitumen issue. The gas-over-bitumen issue refers to the announcement on June 3, 2003 by the Alberta Energy and Utilities Board (“EUB”) proposing a change in policy respecting gas production from the Wabiskaw and McMurray formations in the Athabasca Oil Sands area of northeastern Alberta. The process outlined by the EUB resulted in the shut-in of approximately 330 BOE/day of PrimeWest’s production. In October 2004, the Government of Alberta enacted amendments to the Natural Gas Royalty Regulations of 2002 specifically with respect to gas production in the affected area. This amendment provides for a technical change to the royalty calculation for gas producers adversely affected by the EUB shut-in orders. This technical change to the calculation of royalties represents a reduction in royalties paid by PrimeWest to the Province of Alberta. PrimeWest is evaluating the change to the royalty calculation and its impact as well as any further steps to be taken in relation to the gas-over-bitumen issue.
An additional shut-in of 300 BOE/day at PrimeWest’s non-operated Whiskey Creek area is a result of the limited capacity at the Quirk Creek gas plant. With no alternate facilities in the area, PrimeWest’s production will remain behind pipe until processing capacity becomes available at the Quirk Creek facility, which is expected to be mid-2005.
PrimeWest expects production for full year 2005 to be approximately 41,000 BOE/day. This estimate incorporates PrimeWest’s expected natural decline rate and production volume shut-ins, offset by production additions resulting from the capital development program.
| COMMODITY PRICES | | | | | | | |
| Benchmark Prices | | 2004 | | 2003 | | Change (%) | |
| Natural Gas | | | | | | | | | | |
| NYMEX (US$/mcf) | | $ | 6.09 | | $ | 5.44 | | | 12 | |
| AECO (Cdn$/mcf) | | $ | 6.79 | | $ | 6.70 | | | 1 | |
| Crude oil WTI (US$/bbl) | | $ | 41.40 | | $ | 31.04 | | | 33 | |
| Average Realized Sales Prices(1)(Canadian Dollars) | | 2004 | | 2003 | | Change (%) | |
| Natural gas ($/mcf)(2) | | $ | 6.61 | | $ | 6.05 | | | 9 | |
| Crude oil ($/bbl) | | $ | 36.83 | | $ | 33.94 | | | 9 | |
| Natural gas liquids ($/bbl) | | $ | 43.69 | | $ | 35.34 | | | 24 | |
| Total ($/BOE) | | $ | 39.35 | | $ | 35.63 | | | 10 | |
| Realized hedging loss included in prices above ($/BOE) | | $ | (2.16 | ) | $ | (2.51 | ) | | (14 | ) |
(1)
| Includes hedging losses.
|
(2)
| Excludes sulphur.
|
Commodity prices were generally higher in 2004 than in 2003, with the average realized selling price per BOE of PrimeWest’s production increased by 10% before hedging impact. The effect of hedging reduced PrimeWest’s 2004 realized price by $2.16/BOE, compared to a reduction of $2.51/BOE in 2003. The use of financial hedges is designed to reduce the impact of commodity price volatility and improve the predictability of cash flow from operations.
PrimeWest Energy Trust Annual Report 2004
The realized Canadian selling price that PrimeWest receives from its oil production is also impacted by currency exchange rates. Canadian oil prices are benchmarked in US dollars, therefore a stronger Canadian dollar translates into lower realized prices and revenue, when measured in Canadian dollars.
Crude Oil Prices –Crude oil prices rose strongly in 2004, reflecting higher global demand and continued concerns over supply amidst political uncertainty in a number of the producing regions around the world. Strong economic growth in China and India, together with a recovering US economy, has significantly increased oil consumption and tightened the supply/demand balance. On the supply side, the anticipated increase in Iraqi export capability did not occur due to continued violence and sabotage of production and pipeline infrastructures within the country. With rising demand, excess production capacity that existed within OPEC was used up, leaving Saudi Arabia, Kuwait and United Arab Emirates as the only OPEC members with surplus capability to increase production quickly to offset any supply disruptions that may occur in other parts of the world. As a result, prices fluctuated in response to world events and weather conditions. During 2004, oil prices increased from US$32.50/barrel at the beginning of the year to a historical high of US$55.17/barrel on October 22, before dropping back to US$43.45/barrel by year end.
As at December 31, 2004, the forward market for crude oil indicated a gradual lessening of prices over the next 12 months to approximately US$41.50/barrel by next year end. However, prices rebounded once again in late January 2005, nearing US$50.00/barrel, reflecting continued market nervousness with potential supply disruptions. Key factors that could influence prices in 2005 include: potential for a slow down in demand growth in Asia in response to higher prices, particularly in China and India; OPEC’s ability to control production to balance supply and demand at their desired price levels; Iraq’s ability to restore oil export capability; non- OPEC production growth and the impact of higher oil prices on world consumption.
Canadian companies that produce crude oil of a heavier grade will be required to contend with the widening of the price differential versus lighter, sweet crude oil. As the majority of the new crude production brought into the markets is a heavier crude with higher H2S content that requires special refinery handling capability,the price differential has increased over the course of 2004. In addition, the realized price for heavy oil producers has been negatively affected by the large premium being priced into the cost of diluents, natural gas by-products that are used to blend heavier crude oil to improve transportability. PrimeWest’s crude oil production consists of 70% light and 30% medium to slightly heavy grade. The medium and slightly heavy grade oil does not require any diluent blending and attracts a better pricing differential than $8.00 the heavier crude oil production.
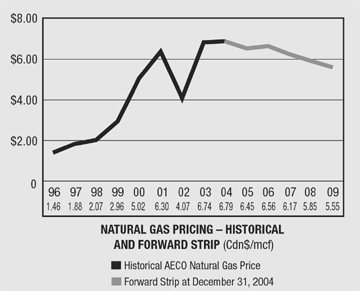
Natural Gas Prices –PrimeWest’s realized natural gas price increased approximately 3% from a 2003 average of $6.51/mcf to $6.70/mcf during 2004. Industry outlook for natural gas prices was bullish at the beginning of 2004 as North American gas storage levels were being drawn down to below historical averages due tolate cold winter weather. Even though gas storage recovered and exceeded historical levels later in the year, higher crude oil prices helped sustain gas prices in the summer. However, cool summer temperatures that reduced electricity demand, coupled with mild winter weather during the latter part of 2004, dampened previously bullish gas price expectations. North American gas storage levels at 2004 year end were higher than the five-year average. As of December 31, 2004, forward gas prices had also retracted from previous high levels, with the NYMEX price increasing only slightly from US$6.15/mmbtu at 2004 year end to US$6.88/mmbtu by December 2005. However, it should be noted that this forward price curve is still considerably higher than the forward curve at 2003 year end.
PrimeWest Energy Trust Annual Report 2004
Early in 2005, gas prices have partly recovered from the more bearish view at year end with brief periods of cold weather in many of the US gas-consuming regions. Although gas storage levels remain high by historical standards, the market will likely accept higher storage levels going forward as the operating norm for fear of shortages during extreme weather conditions. A continued buoyant crude oil market should serve as a support for gas prices. Based on energy equivalent, natural gas is currently trading at the low end of the price range established by distillates and fuel oil. With demand remaining strong after adjusting for weather-related factors, the upside potential for gas price is favourable. Key factors which will influence gas prices in 2005 include: North American weather patterns in the upcoming summer and winter seasons; the ability of producers in Canada and the US to replace and add to production levels with increased drilling; the growth of gas demand in the electricity sector; the impact of government regulations and the market response to conservation.
| SALES REVENUE | | | | | | | | | | | |
Revenue ($ millions)(1) | | 2004 | | % of Total | | 2003 | | % of Total | | Change (%) | |
| Natural gas(2) | | $ | 351.0 | | | 69 | | $ | 295.9 | | | 68 | | | 19 | |
| Crude oil | | | 111.7 | | | 22 | | | 100.5 | | | 23 | | | 11 | |
| Natural gas liquids | | | 49.7 | | | 9 | | | 36.8 | | | 9 | | | 35 | |
| Total | | $ | 512.4 | | | | | $ | 433.2 | | | | | | | |
| Hedging loss included above | | $ | (28.2 | ) | | | | $ | (30.5 | ) | | | | | (8 | ) |
(1)
| Net of transportation expense.
|
(2)
| Excludes sulphur.
|
Revenues for 2004 were $512.4 million compared to $433.2 million in the previous year, including the effect of hedging. Higher gas sales volumes as a result of the Calpine asset and Seventh Energy acquisitions completed in 2004, along with higher crude oil and natural gas liquids prices were the major contributors to the increased revenue in 2004.
Based on the forward markets, the overall outlook for commodity prices in 2005 is lower, and has been reflected in PrimeWest’s internal price forecasts. If the pricing environment softens in 2005, and the Canadian dollar remains strong, oil and gas revenues will be negatively impacted. Since a greater portion of PrimeWest’s revenues (69%) is derived from natural gas, the Trust has greater sensitivity to changes in natural gas prices than crude oil prices.
2004 HEDGING RESULTS
As part of our financial management strategy, PrimeWest uses a consistent commodity hedging approach. The purposes of the hedging program are to reduce volatility in cash flows, protect acquisition economicsand stabilize cash flow against the unpredictable commodity price environment. PrimeWest’s hedging policy reflects a willingness to forfeit a portion of the pricing upside in return for protection against a significant downturn in prices.
PrimeWest Energy Trust Annual Report 2004
| | | Crude Oil ($/bbl) | | Natural Gas ($/mcf)(1) | | BOE ($/BOE)(1) | |
| | | 2004 | | 2003 | | 2004 | | 2003 | | 2004 | | 2003 | |
| Unhedged price | | $ | 44.46 | | $ | 36.55 | | $ | 6.70 | | $ | 6.51 | | $ | 41.51 | | $ | 38.14 | |
| Hedging loss | | | (7.63 | ) | | (2.61 | ) | | (0.09 | ) | | (0.46 | ) | | (2.16 | ) | | (2.51 | ) |
| Realized price | | $ | 36.83 | | $ | 33.94 | | $ | 6.61 | | $ | 6.05 | | $ | 39.35 | | $ | 35.63 | |
| (1) Excludes sulphur. | | | | | | | | | | | | | | | | | | | |
| | | 2004 Hedge Loss | | 2003 Hedge Loss | |
| | | % Hedged | | $ Millions | | % Hedged | | $ Millions | |
| Crude oil | | | 58 | | $ | 23.1 | | | 65 | | $ | 7.7 | |
| Natural gas | | | 54 | | | 5.1 | | | 61 | | | 22.8 | |
| Total loss | | | | | $ | 28.2 | | | | | $ | 30.5 | |
The table below shows the approximate percentage of future anticipated production volumes hedged at December 31, 2004, net of anticipated royalties, reflecting full production declines with no offsetting additions.
| 2005 | | Q1 | | Q2 | | Q3 | | Q4 | | Full Year | |
| Crude oil | | | 72 | % | | 68 | % | | 47 | % | | 41 | % | | 57 | % |
| Natural gas | | | 59 | % | | 56 | % | | 49 | % | | 49 | % | | 53 | % |
| 2006 | | | | | | | | | | | | | | | | |
| Crude oil | | | 17 | % | | 0 | % | | 0 | % | | 0 | % | | 4 | % |
| Natural gas | | | 35 | % | | 0 | % | | 0 | % | | 0 | % | | 9 | % |
A summary of hedging contracts in place as at December 31, 2004 is available under Note 16 in the Notes to consolidated financial statements.
CICA Accounting Guideline 13 (AcG-13), “Hedging Relationships,” became effective for fiscal years beginning on or after July 1, 2003. AcG-13 addresses the identification, designation, documentation and effectiveness of hedging transactions for the purposes of applying hedge accounting. It also establishes conditions for applying or discontinuing hedge accounting. Under the new guideline, hedging transactions must be documented and it must be demonstrated that the hedges are sufficiently effective in order to continue accrual accounting for positions hedged with derivatives. PrimeWest is not applying hedge accounting to its hedging relationships. As a result, PrimeWest’s derivatives are marked-to-market with the resulting gain or loss reflected in earnings for the reporting period.
The 2004 income statement shows an unrealized gain of $0.1 million on derivatives resulting from the change in the mark-to-market valuation of the derivative financial instruments during the period. The gain was comprised of an $8.9 million loss for crude oil hedges, a $9.1 million gain for natural gas hedges and a $0.1 million loss for electrical power hedges.
For the year ended December 31, 2004 the cash impact of contract settlement was a $28.1 million loss comprised of a $23.1 million loss in crude oil, a $5.1 million loss in natural gas, a $0.8 million gain on electrical power and a $0.7 million loss in interest-rate swaps.
PrimeWest Energy Trust Annual Report 2004
ROYALTIES (NET OF ARTC)
PrimeWest pays royalties to the owners of mineral rights with whom PrimeWest holds leases. PrimeWest has mineral leases with the Crown (provincial and federal governments) and freeholders (individuals or other companies). Alberta Royalty Tax Credit (ARTC) is a tax rebate provided by the Alberta government to producers that paid eligible Crown royalties in the year.
| ($ millions, except per BOE) | | 2004 | | 2003 | | Change (%) | |
| Royalty expense (net of ARTC) | | $ | 119.8 | | $ | 101.9 | | | 18 | |
| Per BOE | | $ | 9.20 | | $ | 8.38 | | | 10 | |
| Royalties as a percentage of sales revenues | | | | | | | | | | |
| With hedge revenue | | | 23 | % | | 24 | % | | (4 | %) |
| Excluding hedge revenue | | | 22 | % | | 22 | % | | 0 | % |
Royalty expense in 2004 was 18% higher than in 2003 due to higher revenues year-over-year. The Crown royalty system is based on a sliding scale structure that increases the royalty rates as commodity prices rise.
Because of the sliding scale Crown royalty system, future changes to prices will be accompanied by changes in royalty rates and royalty expense.
| OPERATING EXPENSES | | | | | | | |
| ($ millions, except per BOE) | | 2004 | | 2003 | | Change (%) | |
| Operating expense | | $ | 88.9 | | $ | 79.4 | | | 12 | |
| Per BOE | | $ | 6.83 | | $ | 6.53 | | | 5 | |
Operating expenses for 2004 are $9.5 million higher than 2003. A primary contributor to the increase in operating expense was the increased production volume from the Seventh Energy and Calpine asset acquisitions in 2004. On a per BOE basis, operating expenses increased 5% over the 2003 level reflecting the impact on costs of high activity in the industry.
Operating expenses are primarily impacted by labour and power costs which represent approximately 29% of PrimeWest’s costs. Other costs that are difficult to influence, including partner-operated expenses, property taxes and lease rentals, make up approximately 32% of our costs. PrimeWest is targeting 2005 operating expenses at approximately $6.60/BOE.
| OPERATING MARGIN | | | | | | | |
| ($/BOE) | | 2004 | | 2003 | | Change (%) | |
| Sales price and other revenue(1) | | $ | 40.13 | | $ | 36.20 | | | 11 | |
| Transportation expense | | | (0.63 | ) | | (0.68 | ) | | (7 | ) |
| Royalties | | | (9.20 | ) | | (8.38 | ) | | 10 | |
| Operating expenses | | | (6.83 | ) | | (6.53 | ) | | 5 | |
| Operating margin | | $ | 23.47 | | $ | 20.61 | | | 14 | |
| (1) Includes hedging and sulphur. | | | | | | | | | | |
PrimeWest Energy Trust Annual Report 2004
Operating margins increased 14% from 2003 on a per BOE basis. The increase in 2004 compared to 2003 is primarily due to higher sales prices, offset by higher unit operating expenses and higher royalties. Operating margin measures the level of cash flow per BOE at the field level and before head office expenses.
The operating margin for 2005 will be heavily dependent on commodity prices. PrimeWest will continue to emphasize the maintenance of lower than average operating expenses to maximize margins, which can reduce the volatility of cash flows through commodity price cycles.

| GENERAL AND ADMINISTRATIVE EXPENSE (G&A) | | | | | | | |
| ($ millions, except per BOE) | | | | | | | |
| | | 2004 | | 2003 | | Change (%) | |
| Cash general and administrative expense | | $ | 19.0 | | $ | 14.5 | | | 31 | |
| Per BOE | | $ | 1.46 | | $ | 1.20 | | | 22 | |
| Non-cash general and administrative expense | | $ | 9.4 | | $ | 14.4 | | | (35 | ) |
| Per BOE | | $ | 0.73 | | $ | 1.19 | | | (39 | ) |
Cash G&A expenses increased $4.5 million over 2003 reflecting higher salaries, higher short-term incentive bonuses, increased information technology expenditures, one-time consulting costs associated with potential acquisitions, and increased Board of Directors costs. These increases were partially offset by increases in overhead recoveries.
Included in non-cash G&A expense is $8.5 million relating to the change in the value of the Unit Appreciation Rights (UARs), granted under the Long-Term Incentive Plan (LTIP). UARs in a Trust are similar to stock options in a corporation. The program is based on total Unitholder return, which is comprised of cumulative distributions on a reinvested basis plus growth in Unit price. No benefit accrues to the UARs until the Unitholders have first achieved a 5% total annual return from the time of grant. PrimeWest continues to pay for the exercise of UARs in Trust Units. Expenses related to the LTIP are recorded on a mark-to-market basis, whereby increases or decreases in the valuation of the UAR liability are reported quarterly, as a charge to the income statement. Also included in non-cash G&A expense is $0.9 million related to the Special Employee Retention Plan. See Note 14 to the consolidated financial statements.
| INTEREST EXPENSE | | | | | | | |
| ($ millions, except per Trust Unit) | | 2004 | | 2003 | | Change (%) | |
| Interest expense | | $ | 20.6 | | $ | 15.1 | | | 36 | |
| Period end net debt level | | $ | 552.0 | | $ | 255.9 | | | 116 | |
| Debt per Trust Unit | | $ | 7.77 | | $ | 5.07 | | | 53 | |
| Average cost of debt | | | 4.8 | % | | 4.7 | % | | | |
Interest expense, representing interest on bank debt, the Senior Secured Notes, and the Convertible Unsecured Subordinated Debentures increased to $20.6 million from $15.1 million in 2003 due to higher average debt balances in 2004 compared to 2003. Debt levels increased in the third quarter of 2004 with the issuance of additional bank debt and the Convertible Debentures to fund the acquisition of the Calpine assets.
PrimeWest Energy Trust Annual Report 2004
The average cost of debt has increased due to the issuance of the Convertible Unsecured Subordinated Debentures in the third quarter of 2004. The $150 million Series I and $100 million Series II Debentures bear annual interest at 7.5% and 7.75% respectively.
FOREIGN EXCHANGE GAIN
The foreign exchange gain of $11.7 million results from the translation of the US dollar denominated Senior Secured Notes and related interest payable. The notes were issued at 1.3923:1 Canadian to US dollars, and the close rate on December 31, 2004 was 1.2020:1 Canadian to US dollars.
DEPLETION, DEPRECIATION AND AMORTIZATION (DD&A)
The 2004 DD&A rate of $15.15/BOE is lower than the 2003 rate of $16.70/BOE due to the January 1, 2004 ceiling test write-down of $309 million, offset by the impact of the Calpine asset acquisition.
CEILING TEST
Effective January 1, 2004, PrimeWest adopted CICA Accounting Guideline 16 (AcG-16), “Oil and Gas Accounting – Full Cost”.
The guideline is effective for fiscal years beginning on or after January 1, 2004. The cost impairment test is a two-stage process that is performed at least annually. The first stage of the test determines if the cost pool is impaired. An impairment loss exists when the carrying amount of an asset is not recoverable and exceeds its fair value. The carrying amount is not recoverable if it exceeds the sum of the undiscounted cash flows from Proved reserves plus Unproved properties using management’s best estimate of future prices. The second stage determines the amount of the impairment loss to be recorded. The impairment is measured as the amount by which the carrying amount of capitalized assets exceeds the future discounted cash flows from Proved plus Probable reserves. The discount rate used is the risk-free rate.
Performing this test at January 1, 2004, using Consultants’ Average Prices as at January 1, 2004 of AECO $5.90/mcf for natural gas and US$29.21/barrel WTI for crude oil resulted in a before tax impairment of $308.9 million, and an after-tax impairment of $233.3 million. The write-down was booked to accumulated income in the first quarter of 2004.
Performing this test at December 31, 2004, using consultants’ average prices as at January 1, 2005, of AECO $6.79/mcf for natural gas and US$42.76/barrel WTI for crude oil results in a ceiling test surplus.
SITE RECLAMATION AND RESTORATION RESERVE
Since the inception of the Trust, PrimeWest has maintained a site reclamation fund to pay for future costs related to well abandonment and site cleanup. The fund is used to pay for such costs as they are incurred. The 2004 contribution rate for the fund was unchanged from 2003 at $0.50/BOE, which was expected to be sufficient to meet expenditure requirements for the future. As at December 31, 2004, the site reclamation fund had a balance of $10.3 million.
The site reclamation and abandonment costs incurred for 2004 were $4.6 million, compared to $2.2 million in 2003.
The 2005 contribution rate has been set at $0.50/BOE.
PrimeWest Energy Trust Annual Report 2004
ASSET RETIREMENT OBLIGATION
PrimeWest retroactively adopted the new CICA Handbook section 3110, “Asset Retirement Obligations” in the first quarter of 2004. This standard focuses on the recognition and measurement of liabilities related to legal obligations associated with the retirement of property, plant and equipment. Under this standard, these obligations are initially measured at fair value and subsequently adjusted for the accretion of discount and any changes in the underlying cash flows. The asset retirement cost is capitalized to the related asset and amortized into earnings over time.
NET ASSET VALUE
Net asset value (NAV) measures the net worth of PrimeWest by subtracting the value of debt from the estimated economic value of its underlying assets – primarily crude oil, natural gas and natural gas liquids reserves. The value placed on these reserves is the pre-tax present value of future net cash flows, discounted at 10%, as independently assessed by GLJ as at January 1, 2005. The present value of reserves reflects provisions for royalties, operating costs, future capital costs and site reclamation and abandonment costs, but is prior to deductions for income taxes, interest costs and general and administrative costs.
This calculation is a “snapshot” in time and is heavily dependent upon commodity price expectations at the point in time the “snapshot” is taken. Accordingly, the NAV as at January 1, 2005 may not reflect fairly the equity market trading value of PrimeWest. It is also significant to note that NAV reduces as reserves are produced and net operating cash flow is distributed to Unitholders. Value is delivered to Unitholders through such monthly distributions.
| The following table sets forth the calculation of NAV: | | | | | |
| | | 2004 | | 2003 | |
| | | Consultants’ | | Consultants’ | |
| As at December 31 ($ millions, except per Trust Unit amounts) | | Average | | Average | |
| Assets | | | | | | | |
| Present value of future cash flow discounted at 10%(1) (3) | | $ | 1,714.4 | | $ | 904.6 | |
| Market value of Calpine Trust Units | | | 91.0 | | | – | |
| Mark-to-market value of hedging contracts | | | 0.1 | | | (0.5 | ) |
| Unproved lands | | | 103.9 | | | 36.0 | |
| Reclamation fund | | | 10.3 | | | 8.2 | |
| | | | 1,919.7 | | | 948.3 | |
| Liabilities | | | | | | | |
| Debt and working capital deficiency(2) | | | (378.5 | ) | | (255.9 | ) |
| Net asset value | | $ | 1,541.2 | | $ | 692.4 | |
| Outstanding Trust Units – millions, diluted | | | 80.5 | | | 50.4 | |
| Net asset value per Trust Unit | | $ | 19.15 | | $ | 13.74 | |
(1)
| Company Interest Proved plus Probable reserves.
|
(2)
| Debt excludes Convertible Unsecured Subordinated Debentures.
|
(3)
| Refer to Summary of Oil and Natural Gas Reserves and Net Present Values of Future Net Revenue table under the section “Reserves and Production” on page 42.
|
PrimeWest Energy Trust Annual Report 2004
| | | 2004 | | 2003 | |
| | | Consultants’ | | Consultants’ | |
| Pricing Assumptions | | Average | | Average | |
| Edmonton Par Oil – Cdn$/bbl | | | | | | | |
| 2004 | | | – | | $ | 37.81 | |
| 2005 | | $ | 50.37 | | $ | 34.10 | |
| 2006 | | $ | 47.46 | | $ | 32.79 | |
| 2007 | | $ | 43.88 | | $ | 32.72 | |
| 2008 | | $ | 40.89 | | $ | 32.89 | |
| 2009 | | $ | 39.20 | | | – | |
| Spot Gas at AECO-C – Cdn$/mcf | | | | | | | |
| 2004 | | | – | | $ | 5.90 | |
| 2005 | | $ | 6.79 | | $ | 5.33 | |
| 2006 | | $ | 6.52 | | $ | 4.98 | |
| 2007 | | $ | 6.25 | | $ | 4.95 | |
| 2008 | | $ | 5.95 | | $ | 4.92 | |
| 2009 | | $ | 5.79 | | | – | |
The NAV calculation is based on the above reference prices as of December 31, 2004 and 2003 and is highly sensitive to changes in price forecasts over time as well as the exchange rate. In addition, the year-over-year change is impacted by the cash distributions made throughout the year, which totalled $196.1 million or $3.30 per Trust Unit. Also, the NAV calculation assumes a “blow down” scenario whereby existing reserves are produced without being replaced by acquisitions and development. A major cornerstone of PrimeWest’s strategy is to replace reserves through accretive acquisitions and capital development.
| INCOME AND CAPITAL TAXES | | | | | | | |
| ($ millions) | | 2004 | | 2003 | | Change (%) | |
| Income and capital taxes | | $ | 3.3 | | $ | 3.8 | | | (13 | ) |
| Future income taxes recovery | | | (37.6 | ) | | (79.9 | ) | | (53 | ) |
| Total income and capital taxes | | $ | (34.3 | ) | $ | (76.1 | ) | | (55 | ) |
The Alberta government enacted a tax rate reduction of 1% in the first quarter of 2004, reducing the rate from 12.5% to 11.5% effective April 1, 2004.
During 2003, the Canadian government enacted federal income tax changes for the oil and gas resource sector. The federal income tax changes effectively reduced the statutory tax rates for current and future periods. Specifically, the 100% deductibility of the resource allowance will be completely phased out by the year 2007. During the same time-frame, Crown charges will become 100% deductible and resource tax rates will decline from the current 27% to 21%. These tax rate reductions contributed to the large future tax recovery in 2003.
Cash taxes paid include tax instalments for current and prior years and payments for taxes owing upon the filing of year end tax returns. Cash taxes paid in 2004 include $1.3 million relating to prior years. Income and capital tax expense includes the estimate of the current year’s taxes and any adjustments resulting from prior year tax assessments. The year ending December 31, 2004 includes $0.5 million related to prior years.
PrimeWest Energy Trust Annual Report 2004
| NET INCOME | | | | | |
| ($ millions) | | 2004 | | 2003 | |
| Net income | | $ | 103.4 | | $ | 95.9 | |
Cash flow from operations, as opposed to net income, is the primary measure of performance for an energy trust. The generation of cash flow is critical to the ability of an energy trust to continue to sustain the monthly distribution of cash to Unitholders.
Conversely, net income is an accounting measure impacted by both cash and non-cash items. The largest non-cash items impacting PrimeWest's net income are foreign exchange gains, depletion, depreciation, and amortization (DD&A) and future taxes.
Net income of $103.4 million exceeded 2003 net income of $95.9 million due to higher revenues offset by increased operating expenses, royalties, general and administrative expenses and lower future tax recoveries.
| LIQUIDITY AND CAPITAL RESOURCES | | | | | | | |
| Long-Term Debt($ millions) | | 2004 | | 2003 | | Change (%) | |
| Long-term debt | | $ | 656.3 | | $ | 250.1 | | | 162 | |
| Working capital deficit/(surplus) | | | (104.3 | ) | | 5.8 | | | 1,898 | |
| Net debt | | $ | 552.0 | | $ | 255.9 | | | 116 | |
| Market value of Trust Units and Exchangeable Shares outstanding(1) | | | 1,877.7 | | | 1,380.7 | | | 36 | |
| Total capitalization | | $ | 2,429.7 | | $ | 1,636.6 | | | 48 | |
| Net debt as a % of total capitalization | | | 23 | % | | 16 | % | | (44 | ) |
(1) Based on December 31 Trust Unit closing price of $26.62 and exchangeable ratio of 0.50408:1.
Long-term debt is comprised of bank credit facilities, Senior Secured Notes and Convertible Unsecured Subordinated Debentures of $264.0 million, $150.3 million and $242.0 million respectively.
PrimeWest had a borrowing base of $625 million at year-end 2004. The bank credit facilities consist of an available revolving term loan of $437.5 million and an operating facility of $25 million with the balance being the maximum amount of the Senior Secured Notes of $162.5 million. In addition to amounts outstanding under the facility, PrimeWest has outstanding letters of credit in the amount of $4.9 million (2003 – $5.1 million). The credit facility revolves until June 30, 2005, by which time the lenders will have conducted their annual borrowing base review.
The Senior Secured Notes in the amount of US$125 million have a final maturity date of May 7, 2010, and bear interest at 4.19% per annum, with interest paid semi-annually on November 7 and May 7 of each year. The Note Purchase Agreement requires PrimeWest to make four annual principal repayments of US$31,250,000 commencing May 7, 2007.
PrimeWest issued 7.5% (Series I) and 7.75% (Series II) Convertible Unsecured Subordinated Debentures in the third quarter of 2004 for proceeds of $150.0 million and $100.0 million respectively.
PrimeWest Energy Trust Annual Report 2004
The Series I Debentures pay interest semi-annually on March 31 and September 30 and have a maturity date of September 30, 2009. The Series I Debentures are convertible to Trust Units at the option of the holder at a conversion price of $26.50 per Trust Unit. PrimeWest has the option to redeem the Series I Debentures at a price of $1,050 per Series I Debenture after September 30, 2007 and on or before September 30, 2008, and at a price of $1,025 per Series I Debenture after September 30, 2008 and before maturity. On redemption or maturity, the Trust may elect to satisfy its obligation to repay the principal by issuing PrimeWest Trust Units.
The Series II Debentures pay interest semi-annually on June 30 andDecember 30 and have a maturity date of December 31, 2011. The Series II Debentures are convertible to Trust Units at the option of the holder at a conversion price of $26.50 per Trust Unit. PrimeWest has the option to redeem the Series II Debentures at a price of $1,050 per Series II Debenture after December 31, 2007 and on or before December 31, 2008, at a price of $1,025 per Debenture after December 31, 2008 and on or before December 31, 2009 and after December 31, 2009 and before maturity at $1,000 per Series II Debenture. On redemption or maturity the Trust may elect to satisfy its obligations to repay the principal by issuing PrimeWest Trust Units.
PrimeWest has early adopted CICA Handbook section 3860 – “FinancialCASH FLOW MULTIPLEInstruments”. In accordance with this new section, the ConvertibleUnsecured Subordinated Debentures were initially recorded at their fair value of $147.0 million (Series I) and $94.9 million (Series II). The difference between the fair value and the issue proceeds of $8.1 million was recorded in Unitholders’ equity ($3.0 million Series I and $5.1 million Series II).

Unitholders’ Equity
The Trust had 69,886,111 Trust Units outstanding at December 31, 2004 compared to 48,751,883 Trust Units at the end of 2003. In addition, there were 1,294,391 Exchangeable Shares (see below) outstanding at year end, exchangeable into a total of 652,477 Trust Units. The weighted average number of Trust Units, including those issuable by the exchange of Exchangeable Shares, was 59,482,034 Trust Units for 2004 compared to 46,015,519 for 2003.
During 2004, 116,233 Trust Units were issued to employees pursuant to the LTIP.
In 2004, PrimeWest completed two equity offerings. The first closed on April 22,2004 raising net proceeds of $134.9 million on the issuance of 5.4 million Trust Units at $26.30 per Trust Unit. Proceeds were used to reduce the indebtedness of PrimeWest under its credit facility. The second offering closed on September 2, 2004 raising net proceeds of $285.1 million on the issuance of 12.3 million Trust Units at $24.40 per Trust Unit. Proceeds were used in the acquisition of the Calpine assets.
In 2004, PrimeWest issued 268,677 Trust Units under the Distribution Reinvestment Plan (DRIP) for $6.5 million (465,969 Trust Units, $11.4 million in 2003); 1,311,462 Trust Units pursuant to the Premium Distribution (PREP) for $32.0 million (134,629 Trust Units, $3.4 million in 2003); and 894,167 Trust Units pursuant to the Optional Trust Unit Purchase Plan component (OTUPP) for $21.5 million in 2004 (721,209 Trust Units, $17.6 million in 2003).
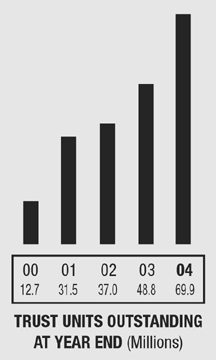
PrimeWest Energy Trust Annual Report 2004
As an alternative to the DRIP component of the Plan, the PREP allows eligible Canadian Unitholders to elect to receive a premium cash distribution of up to 102% of the cash that the Unitholder would otherwise have received on the distribution date, subject to proration in certain events.
The DRIP gives Canadian Unitholders the chance to reinvest their monthly distributions at a 5% discount to the volume weighted average market price of the Trust Units, while the OTUPP gives Canadian Unitholders an opportunity to purchase additional Trust Units directly from PrimeWest at the same 5% discount to the volume weighted average market price. The DRIP and PREP components are mutually exclusive, and participation in the OTUPP requires enrolment in either the DRIP or PREP.
These plan components benefit the Unitholders by offering alternatives to maximize their investment in PrimeWest, while providing the Trust with an inexpensive method to raise additional capital. The Trust expects interest in these plans in 2005 to be similar to 2004. Proceeds from these plans are used for debt reduction of PrimeWest’s credit facility and to help fund ongoing capital development programs.
For additional information or to join these plans, contact PrimeWest’s Plan Agent, Computershare Trust Company of Canada, at 1-800-564-6253 or visit PrimeWest’s website at www.primewestenergy.com.
Exchangeable Shares
Exchangeable Shares were issued in connection with both the Venator Petroleum Company Ltd. acquisition in April 2000 and the Cypress Energy Inc. acquisition in March 2001. These shares were issued to provide a tax-deferred rollover of the adjusted cost base from the shares being exchanged to the Exchangeable Shares of PrimeWest. Canadian law does not permit a tax deferral when shares are exchanged for Trust Units.
In 2004, 94,340 Exchangeable Shares were issued pursuant to the Special Employee Retention Plan. During 2003, 161,717 Exchangeable Shares were issued in relation to the termination of the management incentive program of PrimeWest Management Inc. (see Note 14 in the consolidated financial statements).
The Exchangeable Shares do not receive cash distributions. In lieu of receiving cash distributions, the number of Trust Units that the exchangeable shareholder will receive upon exchange increases each month based on the distribution amount divided by the market price of the Trust Units on the 15th day of each month.
At December 31, 2004, there were 1,294,391 Exchangeable Shares outstanding. The exchange ratio on the shares was 0.50408:1 Trust Units for each Exchangeable Share as at year end.
For purposes of calculating basic per Trust Unit amounts, these Exchangeable Shares have been assumed to be exchanged into Trust Units at the current exchange ratio.
Cash Distributions
Cash distributions to Unitholders are at the discretion of the Board of Directors and can fluctuate depending on the cash flow generated from operations. As discussed previously, the cash flow available for distribution is dependent upon many factors including commodity prices, production levels, debt levels, capital spending requirements, and factors in the overall industry environment. In order to increase PrimeWest’s financial flexibility, the Board of Directors maintains a longer-term target distribution payout ratio of approximately 70–90% of cash flow from operations.
PrimeWest Energy Trust Annual Report 2004
Cash distributions for 2004 were $196.1 million or $3.30 per Trust Unit representing a payout ratio of approximately 74% versus 2003 distributions of $192.6 million or $4.32 per Trust Unit representing a payout ratio of approximately 89%.
Distribution payments to US Unitholders are subject to 15% Canadian withholding tax, which is deducted from the distribution amount prior to deposit into accounts.
Cash Flow Sensitivities
The table below is designed to provide the directional impact on 2005 annual cash available for distribution per Unit (increase/decrease) depending on changes in the following:
| | | $/Trust Unit(1) | |
| Crude oil price (US$1.00/bbl WTI increase) | | | 0.04 | |
| Natural gas price ($0.10/mcf increase) | | | 0.06 | |
| Exchange rate (US$0.01 decrease) | | | 0.03 | |
| Interest rate (1% decrease) | | | 0.02 | |
| Production (1,000 BOE/day increase) | | | 0.12 | |
| (1) Without the effect of hedging. | | | | |
The figures in the above table are provided for directional information only and are based on the Units outstanding as at December 31, 2004. Should changes to the commodity price, interest rate, exchange rate or production levels noted above take place, it should not be assumed that a corresponding change would be made to the distribution level.
CONTRACTUAL OBLIGATIONS
PrimeWest enters into many contractual obligations as part of conducting day-to-day business. Material contractual obligations include debt obligations, lease rental commitments that run from 2005 through 2009 and various pipeline transportation commitments that run through 2010. The details of the timing of these contractual obligations are included in the following table.
| | | | | Payments Due by Period ($ millions) | | | |
| | | | | Less Than | | | | | | More Than | |
| As at December 31, 2004 | | Total | | 1 Year | | 1-3 Years | | 4-5 Years | | 5 Years | |
| Long-term debt obligations | | | 414.2 | | | – | | | 339.1 | | | 75.1 | | | – | |
| Series I and II Convertible Unsecured Subordinated Debentures | | | 250.0 | | | – | | | – | | | 150.0 | | | 100.0 | |
| Lease rental obligations | | | 14.7 | | | 3.6 | | | 10.3 | | | 0.8 | | | – | |
| Pipeline transportation obligations | | | 15.1 | | | 7.1 | | | 7.6 | | | 0.4 | | | – | |
| Total contractual obligations | | | 694.0 | | | 10.7 | | | 357.0 | | | 226.3 | | | 100.0 | |
As part of PrimeWest’s internalization transaction (see Note 14 in the consolidated financial statements) PrimeWest agreed to issue 377,360 Exchangeable Shares pursuant to a Special Employee Retention Plan. One-quarter of the Exchangeable Shares were issued to the executive officers of PrimeWest on November 6, 2004. One-third of the remaining Exchangeable Shares will be issued on each of the third, fourth and fifth anniversaries of transaction closing, November 6, 2002. As at December 31, 2004, $0.2 million has been accrued in non-cash general and administrative expenses related to the Special Employee Retention Plan.
PrimeWest Energy Trust Annual Report 2004
CRITICAL ACCOUNTING ESTIMATES
PrimeWest’s financial statements have been prepared in accordance with Canadian generally accepted accounting principles (GAAP). Certain accounting policies require that management make appropriate decisions with respect to the formulation of estimates and assumptions that affect the reported amounts of assets, liabilities, revenues and expenses. The following discussion reviews such accounting policies and is included in Management’s Discussion and Analysis to aid the reader in assessing the critical accounting policies and practices of the Trust and the likelihood of materially different results being reported. PrimeWest’s management reviews its estimates regularly, but new information and changed circumstances may result in actual results or changes to estimated amounts that differ materially from current estimates.
The following assessment of significant accounting policies is not meant to be exhaustive. The Trust may realize different results from the application of new accounting standards proposed and/or implemented, from time-to-time, by various rule-making bodies.
Proved and Probable Oil and Gas Reserves
Proved oil and gas reserves, as defined by the Canadian Securities Administrators’ National Instrument 51-101 (NI 51-101), are the estimated quantities of crude oil, natural gas liquids, including condensate, and natural gas that geological and engineering data demonstrate with reasonable certainty can be recovered in future years from known reservoirs under existing economic and operating conditions, (i.e. prices and costs as of the date the estimate is made).
Proved reserves are those reserves that can be estimated with a high degree of certainty to be recoverable (i.e. it is likely that the actual remaining quantities recovered will exceed the estimated proved reserves). In accordance with this definition, the level of certainty targeted by the reporting company should result in at least a 90% probability that the quantities actually recovered will equal or exceed the estimated proved reserves.
For Probable reserves, which are by definition less certain to be recovered than Proved reserves, NI 51-101 states that it must be equally likely that the actual remaining quantities recovered will be greater or less than the sum of the estimated Proved plus Probable reserves. With respect to the consideration of certainty, in order to report reserves as Proved plus Probable, the level of certainty targeted by the reporting company should result in at least a 50% probability that the quantities actually recovered will equal or exceed the sum of the estimated Proved plus Probable reserves.
The oil and natural gas reserve estimates are made using all available geological and reservoir data as well as historical production data. Estimates are reviewed and revised as appropriate. Revisions occur as a result of changes in prices, costs, fiscal regimes, reservoir performance or a change in PrimeWest’s plans. The effect of changes in Proved oil and natural gas reserves on the financial results and position of PrimeWest is described under the heading “Full Cost Accounting for Oil and Gas Activities”.
Full Cost Accounting For Oil and Gas Activities
PrimeWest adopted CICA Accounting Guideline 16 (AcG-16), “Oil and Gas Accounting – Full Costs” on January 1, 2004. The new guideline modifies how the ceiling test is performed and requires that cost centres be tested for recoverability using undiscounted future cash flows from Proved reserves, which are determined by using forward indexed prices. When the carrying amount of a cost centre is not recoverable, the cost centre must be written down to its fair value. Fair value is estimated using accepted present value techniques that incorporate risks and other uncertainties when determining expected cash flows.
PrimeWest Energy Trust Annual Report 2004
Depletion Expense
PrimeWest uses the full cost method of accounting for exploration and development activities. In accordance with this method of accounting, all costs associated with exploration and development are capitalized whether successful or not. The aggregate of net capitalized costs and estimated future development costs less estimated salvage values is amortized using the unit-of-production method based on estimated Proved oil and natural gas reserves. An increase in estimated Proved oil and natural gas reserves would result in a corresponding reduction in depletion expense. A decrease in estimated future development costs would result in a corresponding reduction in depletion expense.
Fair Value of Derivative Instruments
As part of its financial management strategy, PrimeWest utilizes financial derivatives to manage market risk. The purpose of the hedge is to provide an element of stability to PrimeWest’s cash flow in a volatile commodity price environment. Effective January 1, 2004, PrimeWest adopted CICA Accounting Guideline 13, “Hedging Relationships” (“AcG-13”).
The estimation of the fair value of certain hedging derivatives requires considerable judgment. The estimation of the fair value of commodity price hedges requires sophisticated financial models that incorporate forward price and volatility data and, when compared with PrimeWest’s outstanding hedging contracts, produce cash inflow or outflow variances over the contract period.
Asset Retirement Obligations
Effective January 1, 2004, PrimeWest changed its accounting policy with respect to accounting for asset retirement obligations. CICA section 3110 requires the fair value of asset retirement obligations to be recorded when they are incurred rather than merely accumulated or accrued over the useful life of the respective asset.
PrimeWest, under the current policy, is required to provide for future asset retirement obligations. PrimeWest must estimate these costs in accordance with existing laws, contracts or other policies. These estimated costs are charged to earnings and the appropriate liability account over the expected service life of the asset.
Legal, Environmental Remediation and Other Contingent Matters
The Trust is required to both determine whether a loss is probable based on judgment and interpretation of laws and regulations and whether that loss can reasonably be estimated. When the loss is determined, it is charged to earnings. PrimeWest’s management must continually monitor known and potential contingent matters and make appropriate provisions through charges to earnings when warranted by circumstance.
Income Tax Accounting
The determination of the Trust’s income and other tax liabilities requires interpretation of complex laws and regulations. All tax filings are subject to audit and potential reassessment after the lapse of considerable time. Accordingly, the actual income tax liability may differ significantly from that estimated and recorded by management.
PrimeWest Energy Trust Annual Report 2004
Business Combinations
Since inception, PrimeWest has grown considerably through combining with other businesses. PrimeWest acquired Seventh Energy Ltd. in the first quarter of 2004 and the assets of Calpine Canada in the third quarter of 2004. These transactions were accounted for using what is now the only accounting method available, the purchase method. Under the purchase method, the acquiring company includes the fair value of the assets of the acquired entity on its balance sheet. The determination of fair value necessarily involves many assumptions. The valuation of oil and gas properties primarily involves placing a value on the oil and gas reserves. The valuation of oil and gas reserves entails the process described above under the caption “Proved and Probable Oil and Gas Reserves” but also incorporates the use of economic forecasts that estimate future changes in prices and costs. This methodology is also used to value Unproved oil and gas reserves. The valuation of these reserves, by their nature, is less certain than the valuation of Proved reserves.
Goodwill
The process of accounting for the purchase of a company, described above, results in recognizing the fair value of the acquired company’s assets on the balance sheet of the acquiring company. Any excess of the purchase price over fair value is recorded as goodwill. Since goodwill results from the culmination of a process that is inherently imprecise, the determination of goodwill is also imprecise. In accordance with the recent issuance of CICA section 3062, "Goodwill and Other Intangible Assets", goodwill is no longer amortized but assessed periodically for impairment. The process of assessing goodwill for impairment necessarily requires PrimeWest to determine the fair value of its assets and liabilities. Such a process involves considerable judgment.
RECENT ACCOUNTING PRONOUNCEMENTS ISSUED BUT NOT IMPLEMENTED
The following new or amended standards and guidelines were issued but not implemented by PrimeWest.
Exchangeable Share Accounting
In January 2005 the CICA issued Emerging Issues Committee (EIC) 151 “Exchangeable Securities Issued by Subsidiaries of Income Trusts.” The EIC deals with the presentation of exchangeable securities on the balance sheet. The EIC states that exchangeable securities should be included as part of Unitholders’ equity only if the holders of the exchangeable securities are entitled to receive distributions of earnings economically equivalent to distributions received by units of the income trust and if the exchangeable securities ultimately are required to be exchanged for units of the income trust as a result of the passage of a fixed period of time. The Trust has reviewed the impact of the pronouncement and determined that it does not materially impact the financial statements.
Variable Interest Entities
In June 2003, the CICA issued Accounting Guideline 15 “Consolidation of Variable Interest Entities” which deals with the consolidation of entities that are subject to control on a basis other than ownership of voting interests. This guideline is effective for annual and interim periods beginning on or after November 1, 2004. The Trust has determined that this new guideline is not applicable based on the current structure of the Trust and therefore, will have no impact on the financial statements of the Trust.
PrimeWest Energy Trust Annual Report 2004
BUSINESS RISKS
PrimeWest’s operations are affected by a number of underlying risks, both internal and external to the Trust. These risks are similar to those affecting others in both the conventional oil and gas royalty trust sector and the conventional oil and gas producers sector. The Trust’s financial position, results of operations, and cash available for distribution to Unitholders are directly impacted by these factors. These factors are discussed under two broad categories – Commodity Price, Foreign Exchange and Interest Rate Risk; and Operational and Other Business Risks.
Commodity Price, Foreign Exchange and Interest Rate Risk
The two most important factors affecting the level of cash distributions available to Unitholders are the level of production achieved by PrimeWest, and the price received for its products. These prices are influenced in varying degrees by factors outside the Trust’s control. Some of these factors include:
- World market forces, specifically the actions of OPEC and other large crude oil producing countries including Russia, and their implications on the supply of crude oil;
- World and North American economic conditions which influence the demand for both crude oil and natural gas and the level of interest rates set by the governments of Canada and the US;
- Weather conditions that influence the demand for natural gas and heating oil;
- The Canadian/US exchange rate that affects the price received for crude oil as the price of crude oil is referenced in US dollars;
- Transportation availability and costs; and
- Price differentials between world and North American markets based on transportation costs to major markets and quality of production.
To mitigate these risks, PrimeWest has an active hedging program in place based on an established set of criteria that has been approved by the Board of Directors. The results of the hedging program are reviewed against these criteria and the results actively monitored by the Board.
Beyond our hedging strategy, PrimeWest also mitigates risk by having a well-diversified marketing portfolio and by transacting with a number of counterparties and limiting exposure to each counterparty. In 2004, approximately 25% of natural gas production was sold to aggregators and 75% into the Alberta short-term or export long-term markets.
The contracts that PrimeWest has with aggregators vary in length. They represent a blend of domestic and US markets and fixed and floating prices designed to provide price diversification to our revenue stream.
The primary objective of our commodity risk management program is to reduce the volatility of our cash distributions, to lock in the economics on major acquisitions and to protect our capital structure when commodity prices cycle downwards. In 2004, PrimeWest recognized a commodity hedging loss of $28.2 million ($0.45 per Trust Unit), compared to a loss of $30.5 million ($0.66 per Trust Unit) in 2003.
PrimeWest Energy Trust Annual Report 2004
Operational and Other Business Risks
PrimeWest is exposed to a number of risks related to its activities within the oil and gas industry that also have an impact on the amount of cash available to Unitholders. These risks, and the ways in which PrimeWest seeks to mitigate these risks include, but are not limited to:
RISK | WE MITIGATE BY |
Production | |
| Risk associated with the production of oil and gas –includes well operations, processing and the physical delivery of commodities to market. | Performing regular and proactive well, facility and pipeline maintenance supported by telemetry, physical inspection and diagnostic tools. |
Commodity Price | |
| Fluctuations in natural gas, crude oil and natural gas liquid prices. | Hedging. Refer to page 46. |
Transportation | |
| Market risk related to the availability of transportation to market and potential disruption in delivery systems. | Diversifying the transportation systems on which we rely to get our product to market. |
Natural Decline | |
| Development risk associated with capital enhancement activities undertaken – the risk that capital spending on activities such as drilling, well completions, well workovers and other capital activities will not result in reserve additions or in quantities sufficient to replace annual production declines. | Diversifying our capital spending program over a large number of projects so that large amounts of capital are not risked on any one activity. We also have a highly skilled technical team of geologists, geophysicists and engineers working to apply the latest technology in planning and executing capital programs. Capital is spent only after strict economic criteria for production and reserve additions are assessed. |
Acquisitions | |
| Acquisition risk associated with acquiring producing properties at low cost to renew our inventory of assets. | Continually scanning the marketplace for opportunities to acquire assets. Our technical acquisition specialists evaluate potential corporate or property acquisitions and identify areas for value enhancement through operational efficiencies or capital investment. All prospects are subjected to rigorous economic review against established acquisition and economic hurdle rates. In some cases we may also hedge commodity prices to protect the acquisition economics in the near-term period. |
Reserves | |
| Reserve risk in respect of the quantity and quality of recoverable reserves. | Contracting our reserves evaluation to a reputable third-party consultant, GLJ. The Operations and Reserves Committee of the Board of Directors of PrimeWest review the work and independence of GLJ. Our strategy is to invest in mature, longer life properties having a higher proved producing component where the reserve risk is generally lower and cash flows are more stable and predictable. |
PrimeWest Energy Trust Annual Report 2004
RISK | WE MITIGATE BY |
Environmental Health and Safety (EH&S) | |
| Environmental, health and safety risks associated with oil and gas properties and facilities. | Establishing and adhering to strict guidelines for EH&S including training, proper reporting of incidents, supervision and awareness. PrimeWest has active community involvement in field locations including regular meetings with stakeholders in the area. PrimeWest carries adequate insurance to cover property losses, liability and business interruption. These risks are reviewed regularly by the Corporate Governance and EH&S Committee of the Board, which acts as PrimeWest’s Environmental, Health and Safety Committee. |
Regulation, Tax and Royalties | |
| Changes in government regulations including reporting requirements, income tax laws, operating practices and environmental protection requirements and royalty rates. | Keeping informed of proposed changes in regulations and laws to properly respond to and plan for the effects that these changes may have on our operations. |
Liability to Unitholders is Uncertain | |
| Because of uncertainties in the law relating to investment trusts, there is a risk that a Unitholder could be held personally liable for obligations of the Trust. | On July 1, 2004, a new statute entitled theIncome Trusts Liability Act(Alberta) was proclaimed in force, creating a statutory limitation on the liability of unitholders of Alberta income trusts such as PrimeWest. The legislation provides that a Unitholder is not, as a beneficiary, liable for any act, default, obligation or liability of the Trust that arises after July 1, 2004. Similar legislation was proclaimed in force in Ontario in December of 2004. |
INCOME TAXES – UNITHOLDERS – 2004
For the 2004 taxation year, Canadian Unitholders of PrimeWest were paid $3.30 Canadian per Trust Unit in distributions. Of this distribution amount, 45% or $1.49 per Trust Unit is deemed a tax-deferred return of capital, and 55% or $1.81 per Trust Unit is taxable to Unitholders as other income (taxed at the same rate as interest income).
For Unitholders resident in the United States, the taxability of distributions is calculated using US tax rules which allow for the deduction of Crown royalties and accounting based depletion. As a result of these deductions, distributions are taxable as dividends and 45% of the 2004 distributions are taxable as a “qualified dividend” with the remaining 55% treated as a tax-deferred return of capital. A 15% withholding tax applies to distributions paid to US Unitholders. Further details regarding the withholding tax is available on PrimeWest’s website at www.primewestenergy.com.
For both Canadian and United States Unitholders, the tax-deferred return of capital portion reduces the Unitholders’ adjusted cost base for purposes of calculating a capital gain or loss upon ultimate disposition of their Trust Units. Unitholders contemplating a disposition may wish to consult the “Unitholder Info” section on PrimeWest’s website and use the adjusted cost base calculator.
PrimeWest Energy Trust Annual Report 2004
| QUARTERLY PERFORMANCE – SELECTED MEASURES | | | | | | | | | | | | | |
| ($ millions, | | 2004 | | 2003 | | 2002 | |
| except per Trust Unit amounts) | | Q4 | | Q3 | | Q2 | | Q1 | | Q4 | | Q3 | | Q2 | | Q1 | | Q4 | |
| Net revenues | | | 126.8 | | | 97.2 | | | 84.9 | | | 85.7 | | | 73.0 | | | 77.3 | | | 85.6 | | | 94.0 | | | 68.8 | |
| Net income | | | 40.6 | | | 20.2 | | | 22.4 | | | 20.1 | | | 0.7 | | | 8.8 | | | 63.0 | | | 23.4 | | | (7.3 | ) |
| Net income per Unit – Basic | | | 0.57 | | | 0.31 | | | 0.41 | | | 0.40 | | | 0.01 | | | 0.19 | | | 1.38 | | | 0.56 | | | (0.20 | ) |
| Net income per Unit – Diluted | | | 0.56 | | | 0.31 | | | 0.40 | | | 0.40 | | | 0.01 | | | 0.19 | | | 1.37 | | | 0.55 | | | (0.20 | ) |
The above table highlights PrimeWest’s performance by selected measures for the fourth quarter ended 2004, and the preceding eight quarters through 2003 and 2002.
Net revenues are primarily impacted by commodity prices, production volumes and royalties.
Net income and net income per Unit are secondary measures for a royalty trust because they include both cash and non-cash items. The non-cash items such as depletion, depreciation and amortization (DD&A), future income taxes, unrealized foreign exchange gains or losses, and unrealized gains or losses on derivatives will not affect PrimeWest’s ability to pay a monthly distribution.
PrimeWest Energy Trust Annual Report 2004