Slide 1
Exhibit 99.3
Fourth Quarter 2003 Earnings Call
February 18, 2004 9:00 AM EDT
Slide 2
“Forward Looking Statements”
Statements made during this presentation are based on management’s beliefs as well as assumptions made by, and information currently available to management, pursuant to “safe-harbor” provisions of the Private Securities Litigation Reform Act of 1995. While these statements reflect our best judgment, they are subject to risks and uncertainties that could cause a change in focus and direction. Information concerning some of the factors that could cause actual results to differ materially from those in, or implied by, the forward looking statements are set forth under “Risk Factors” in the Company’s Form 10-K for the period ending December 28, 2002.
Non-GAAP Financial Measure
This presentation contains disclosure of EBITDA, which is a non-GAAP financial measure within the meaning of Regulation G promulgated by the Securities and Exchange Commission. A reconciliation of EBITDA to net income available to common stockholder before income taxes, the most directly comparable GAAP financial measure, as well as additional information concerning EBITDA, is included in the exhibits to Global Power Equipment Group’s fourth quarter earnings release of February 17, 2004. This press release is available at http://www.globalpower.com by accessing Press Releases through the Investor Relations tab.

Slide 3
Power Market Developments
1. China and East Asia remains our major focus for 2004-2007
2. International opportunities increasing
• Iraq
• Saudi Arabia
• Other
3. Upward movement in OEM turbine forecasts
4. Risks
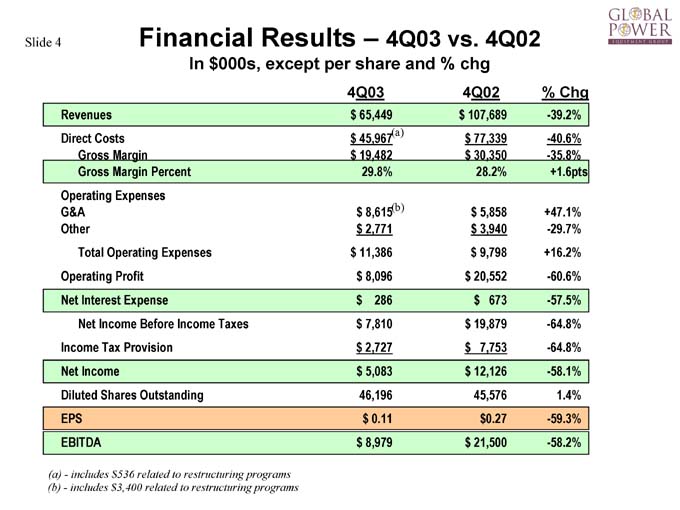
Slide 4 Financial Results – 4Q03 vs. 4Q02
In $000s, except per share and % chg
4Q03 4Q02 % Chg
Revenues $ 65,449 $ 107,689 -39.2%
Direct Costs $ 45,967(a) $ 77,339 -40.6%
Gross Margin $ 19,482 $ 30,350 -35.8%
Gross Margin Percent 29.8% 28.2% +1.6pts
Operating Expenses
G&A $ 8,615(b) $ 5,858 +47.1%
Other $ 2,771 $ 3,940 -29.7%
Total Operating Expenses $ 11,386 $ 9,798 +16.2%
Operating Profit $ 8,096 $ 20,552 -60.6%
Net Interest Expense $ 286 $ 673 -57.5%
Net Income Before Income Taxes $ 7,810 $ 19,879 -64.8%
Income Tax Provision $ 2,727 $ 7,753 -64.8%
Net Income $ 5,083 $ 12,126 -58.1%
Diluted Shares Outstanding 46,196 45,576 1.4%
EPS $ 0.11 $ 0.27 -59.3%
EBITDA $ 8,979 $ 21,500 -58.2%
(a)—includes $536 related to restructuring programs (b)—includes $3,400 related to restructuring programs
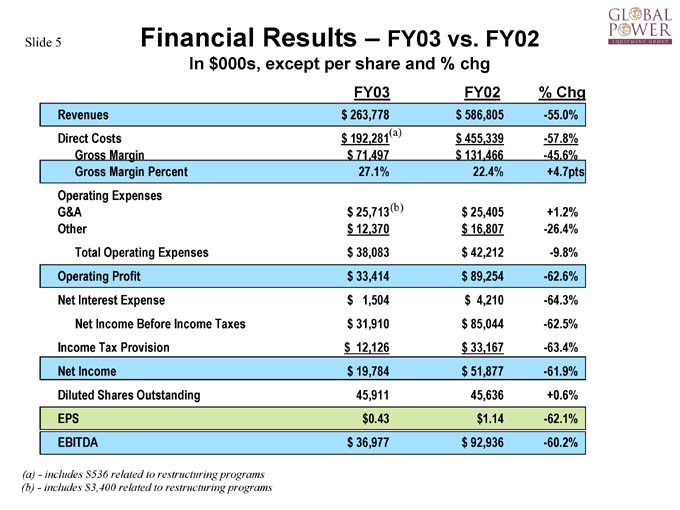
Slide 5 Financial Results – FY03 vs. FY02
In $000s, except per share and % chg
FY03 FY02 % Chg
Revenues $ 263,778 $ 586,805 -55.0%
Direct Costs $ 192,281(a) $ 455,339 -57.8%
Gross Margin $ 71,497 $ 131,466 -45.6%
Gross Margin Percent 27.1% 22.4% +4.7pts
Operating Expenses
G&A $ 25,713(b) $ 25,405 +1.2%
Other $ 12,370 $ 16,807 -26.4%
Total Operating Expenses $ 38,083 $ 42,212 -9.8%
Operating Profit $ 33,414 $ 89,254 -62.6%
Net Interest Expense $ 1,504 $ 4,210 -64.3%
Net Income Before Income Taxes $ 31,910 $ 85,044 -62.5%
Income Tax Provision $ 12,126 $ 33,167 -63.4%
Net Income$19,784$51,877-61.9%
Diluted Shares Outstanding 45,911 45,636 +0.6%
EPS $0.43 $1.14 -62.1%
EBITDA $ 36,977 $ 92,936 -60.2%
(a)—includes $536 related to restructuring programs (b)—includes $3,400 related to restructuring programs
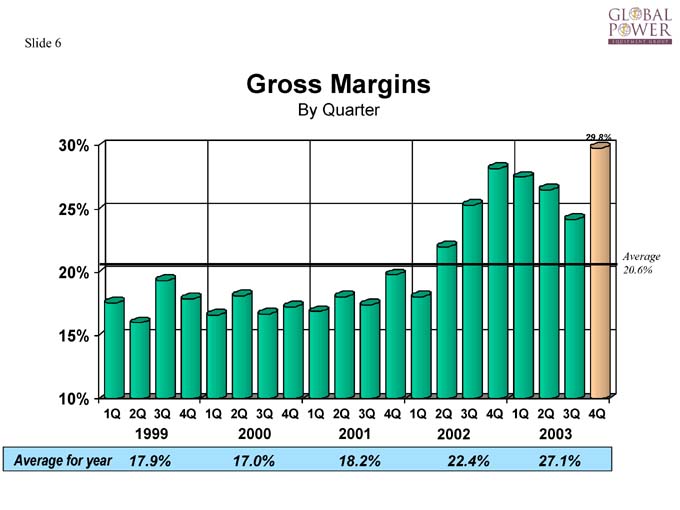
Slide 6
Gross Margins
By Quarter
30%
25%
20%
15%
10%
1Q 2Q 3Q 4Q 1Q 2Q 3Q 4Q 1Q 2Q 3Q 4Q 1Q 2Q 3Q 4Q 1Q 2Q 3Q 4Q
1999 2000 2001 2002 2003
Average for year 17.9% 17.0% 18.2% 22.4% 27.1%
Slide 7
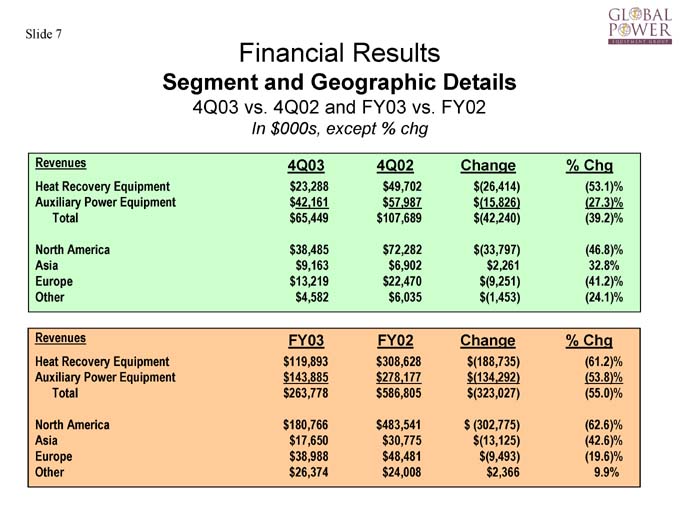
Financial Results
Segment and Geographic Details
4Q03 vs. 4Q02 and FY03 vs. FY02
In $000s, except % chg
Revenues 4Q03 4Q02 Change % Chg
Heat Recovery Equipment $ 23,288 $ 49,702 $ (26,414) (53.1)%
Auxiliary Power Equipment $ 42,161 $ 57,987 $ (15,826) (27.3)%
Total $ 65,449 $ 107,689 $ (42,240) (39.2)%
North America $ 38,485 $ 72,282 $ (33,797) (46.8)%
Asia $ 9,163 $ 6,902 $2,261 32.8%
Europe $ 13,219 $ 22,470 $ (9,251) (41.2)%
Other $ 4,582 $ 6,035 $ (1,453) (24.1)%
Revenues FY03 FY02 Change % Chg
Heat Recovery Equipment $ 119,893 $ 308,628 $ (188,735) (61.2)%
Auxiliary Power Equipment $ 143,885 $ 278,177 $ (134,292) (53.8)%
Total $ 263,778 $ 586,805 $ (323,027) (55.0)%
North America $ 180,766 $ 483,541 $ (302,775) (62.6)%
Asia $ 17,650 $ 30,775 $ (13,125) (42.6)%
Europe $ 38,988 $ 48,481 $(9,493) (19.6)%
Other $ 26,374 $ 24,008 $2,366 9.9%
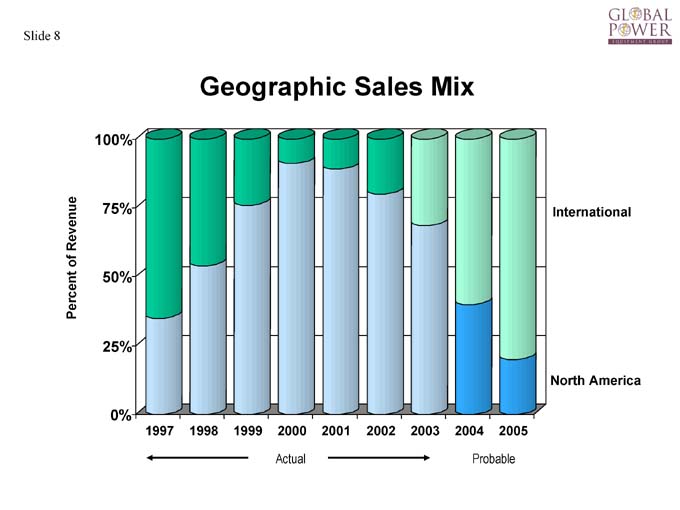
Slide 8
Geographic Sales Mix
1997 1998 1999 2000 2001 2002 2003 2004 2005
Actual Probable
International
North America
Slide 9
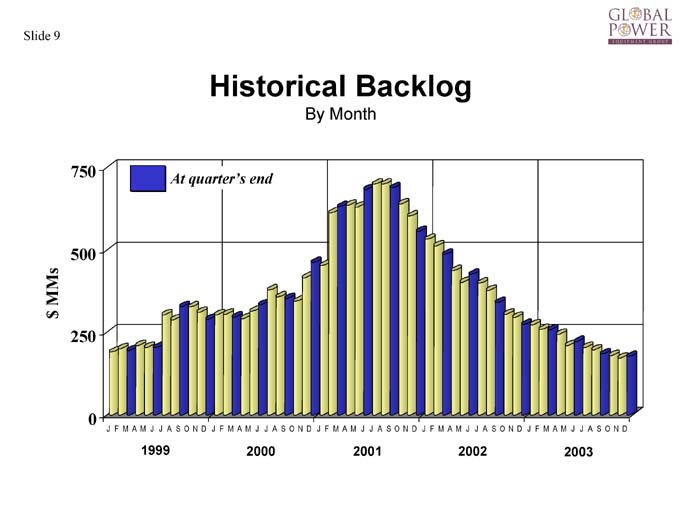
Historical Backlog
By Month
750
500
250
0
At quarter’s end
1999 2000 2001 2002 2003
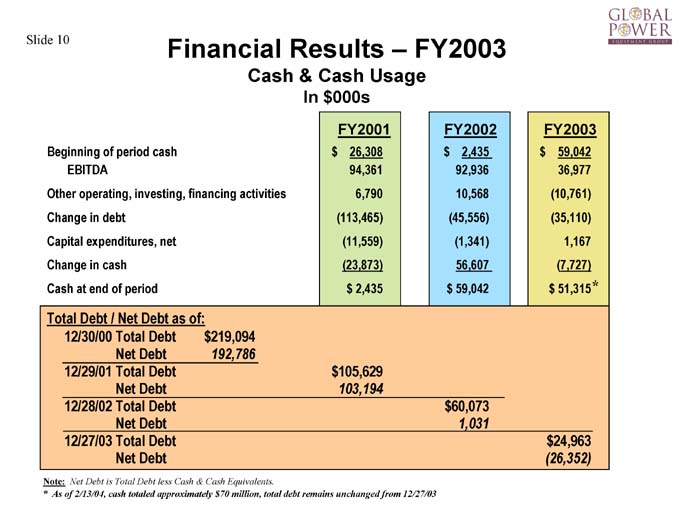
Slide 10 Financial Results – FY2003
Cash & Cash Usage
In $000s
FY2001 FY2002 FY2003
Beginning of period cash $ 26,308 $ 2,435 $ 59,042
EBITDA 94,361 92,936 36,977
Other operating, investing, financing activities 6,790 10,568 (10,761)
Change in debt (113,465) (45,556) (35,110)
Capital expenditures, net (11,559) (1,341) 1,167
Change in cash (23,873) 56,607 (7,727)
Cash at end of period $ 2,435 $ 59,042 $ 51,315*
Total Debt / Net Debt as of:
12/30/00 Total Debt $ 219,094
Net Debt 192,786
12/29/01 Total Debt $ 105,629
Net Debt 103,194
12/28/02 Total Debt $ 60,073
Net Debt 1,031
12/27/03 Total Debt $ 24,963
Net Debt (26,352)
Note: Net Debt is Total Debt less Cash & Cash Equivalents.
* As of 2/13/04, cash totaled approximately $70 million, total debt remains unchanged from 12/27/03
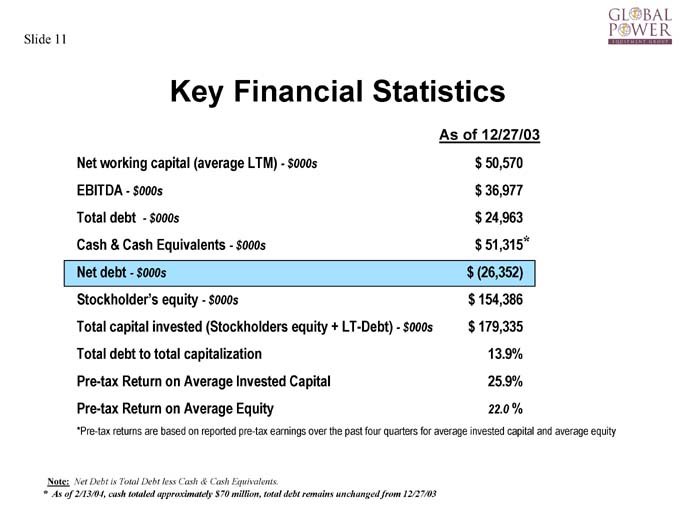
Slide 11
Key Financial Statistics
As of 12/27/03
Net working capital (average LTM)—$000s $ 50,570
EBITDA—$000s $ 36,977
Total debt — $000s $ 24,963
Cash & Cash Equivalents—$000s $ 51,315*
Net debt—$000s $ (26,352)
Stockholder’s equity—$000s $ 154,386
Total capital invested (Stockholders equity + LT-Debt)— $000s $ 179,335
Total debt to total capitalization 13.9%
Pre-tax Return on Average Invested Capital 25.9%
Pre-tax Return on Average Equity 22.0 %
*Pre-tax returns are based on reported pre-tax earnings over the past four quarters for average invested capital and average equity
Note: Net Debt is Total Debt less Cash & Cash Equivalents.
* As of 2/13/04, cash totaled approximately $70 million, total debt remains unchanged from 12/27/03

Slide 12
Thank You
For Additional Information Please Contact: Bob Zwerneman Director, Investor Relations Global Power Equipment Group (918) 274-2398 bobz@globalpower.com