Slide 1
Exhibit 99.3
Second Quarter 2004 Earnings Call
July 27, 2004 9:00 AM EDT
Slide 2
“Forward Looking Statements”
Statements made during this presentation are based on management’s beliefs as well as assumptions made by, and information currently available to management, pursuant to “safe-harbor” provisions of the Private Securities Litigation Reform Act of 1995. While these statements reflect our best judgment, they are subject to risks and uncertainties that could cause a change in focus and direction. Information concerning some of the factors that could cause actual results to differ materially from those in, or implied by, the forward looking statements are set forth under “Risk Factors” in the Company’s Form 10-K for the period ending December 27, 2003.
Non-GAAP Financial Measure
This presentation contains disclosure of EBITDA, which is a non-GAAP financial measure within the meaning of Regulation G promulgated by the Securities and Exchange Commission. A reconciliation of EBITDA to net income available to common stockholder before income taxes, the most directly comparable GAAP financial measure, as well as additional information concerning EBITDA, is included in the exhibits to Global Power Equipment Group’s second quarter earnings release of July 26, 2004. This press release is available at http://www.globalpower.com by accessing Press Releases through the Investor Relations tab.
Slide 3
Operating Environment
1. Market Environment
2. Factors Impacting Gross Margin
3. Growth Initiatives – Nanjing Boiler Works
4. Earnings Guidance
Slide 4
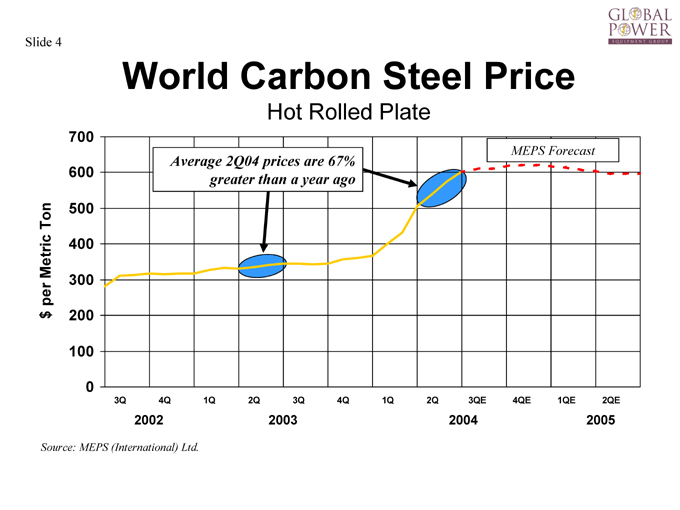
World Carbon Steel Price
Hot Rolled Plate $ per Metric Ton
700 600 500 400 300 200 100 0
Average 2Q04 prices are 67% greater than a year ago
MEPS Forecast
3Q 4Q 1Q 2Q 3Q 4Q 1Q 2Q 3QE 4QE 1QE 2QE
2002 2003 2004 2005
Source: MEPS (International) Ltd.
Slide 5
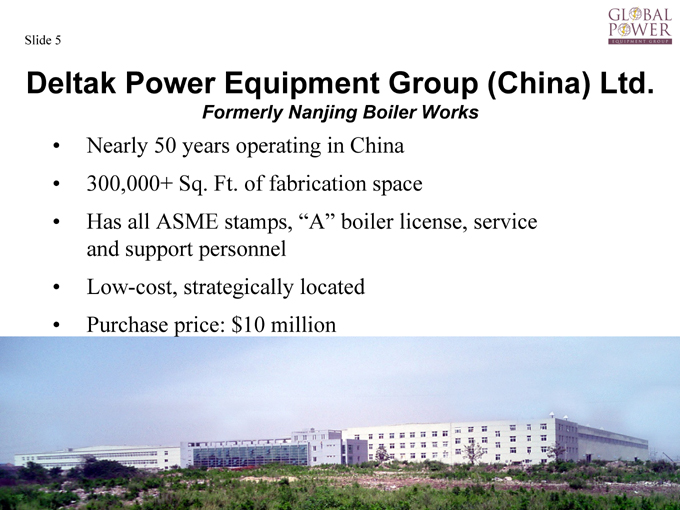
Deltak Power Equipment Group (China) Ltd.
Formerly Nanjing Boiler Works
Nearly 50 years operating in China
300,000+ Sq. Ft. of fabrication space
Has all ASME stamps, “A” boiler license, service and support personnel
Low-cost, strategically located
Purchase price: $10 million
Slide 6
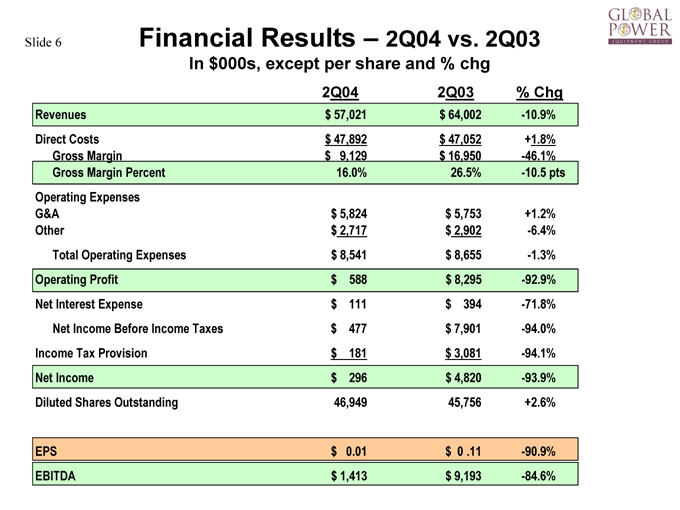
Financial Results – 2Q04 vs. 2Q03
In $000s, except per share and % chg
2Q04 2Q03 % Chg
Revenues $57,021 $64,002 -10.9%
Direct Costs $47,892 $47,052 +1.8%
Gross Margin $9,129 $16,950 -46.1%
Gross Margin Percent 16.0% 26.5% -10.5 pts
Operating Expenses
G&A $5,824 $5,753 +1.2%
Other $2,717 $2,902 -6.4%
Total Operating Expenses $8,541 $8,655 -1.3%
Operating Profit $588 $8,295 -92.9%
Net Interest Expense $111 $394 -71.8%
Net Income Before Income Taxes $477 $7,901 -94.0%
Income Tax Provision $181 $3,081 -94.1%
Net Income $296 $4,820 -93.9%
Diluted Shares Outstanding 46,949 45,756 +2.6%
EPS $0.01 $0 .11 -90.9%
EBITDA $1,413 $9,193 -84.6%
Slide 7
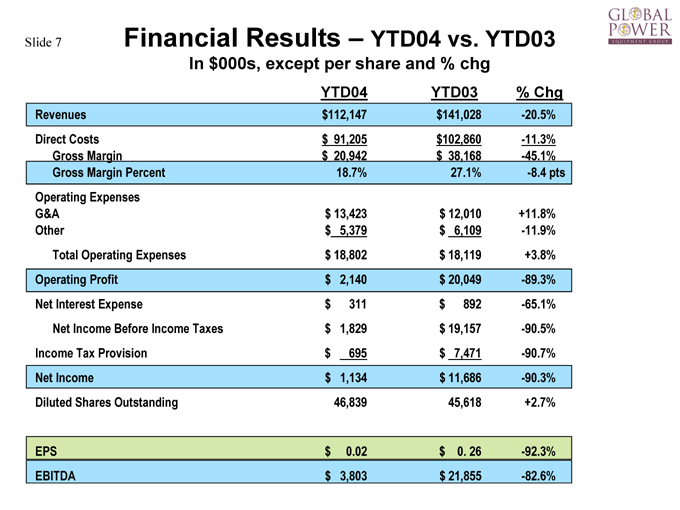
Financial Results – YTD04 vs. YTD03
In $000s, except per share and % chg
YTD04 YTD03 % Chg
Revenues $112,147 $141,028 -20.5%
Direct Costs $91,205 $102,860 -11.3%
Gross Margin $20,942 $38,168 -45.1%
Gross Margin Percent 18.7% 27.1% -8.4 pts
Operating Expenses
G&A $13,423 $12,010 +11.8%
Other $5,379 $6,109 -11.9%
Total Operating Expenses $18,802 $18,119 +3.8%
Operating Profit $2,140 $20,049 -89.3%
Net Interest Expense $311 $892 -65.1%
Net Income Before Income Taxes $1,829 $19,157 -90.5%
Income Tax Provision $695 $7,471 -90.7%
Net Income $1,134 $11,686 -90.3%
Diluted Shares Outstanding 46,839 45,618 +2.7%
EPS $0.02 $0. 26 -92.3%
EBITDA $3,803 $21,855 -82.6%
Slide 8
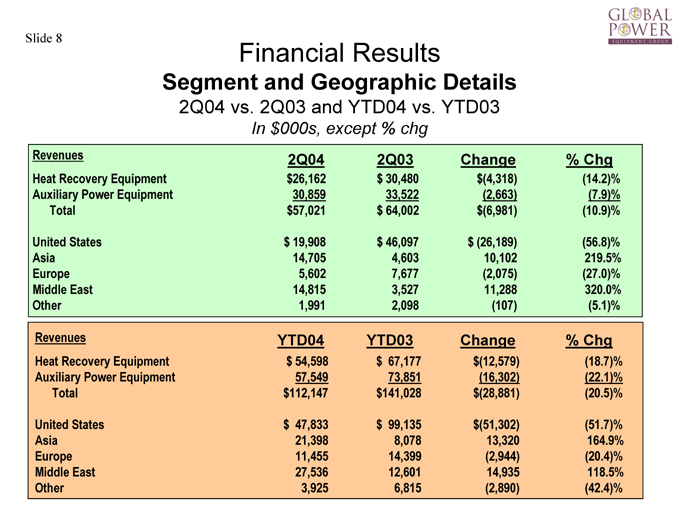
Financial Results
Segment and Geographic Details
2Q04 vs. 2Q03 and YTD04 vs. YTD03
In $000s, except % chg
Revenues 2Q04 2Q03 Change % Chg
Heat Recovery Equipment $26,162 $30,480 $(4,318) (14.2)%
Auxiliary Power Equipment 30,859 33,522 (2,663) (7.9)%
Total $57,021 $64,002 $(6,981) (10.9)%
United States $19,908 $46,097 $(26,189) (56.8)%
Asia 14,705 4,603 10,102 219.5%
Europe 5,602 7,677 (2,075) (27.0)%
Middle East 14,815 3,527 11,288 320.0%
Other 1,991 2,098 (107) (5.1)%
Revenues YTD04 YTD03 Change % Chg
Heat Recovery Equipment $54,598 $67,177 $(12,579) (18.7)%
Auxiliary Power Equipment 57,549 73,851 (16,302) (22.1)%
Total $112,147 $141,028 $(28,881) (20.5)%
United States $47,833 $99,135 $(51,302) (51.7)%
Asia 21,398 8,078 13,320 164.9%
Europe 11,455 14,399 (2,944) (20.4)%
Middle East 27,536 12,601 14,935 118.5%
Other 3,925 6,815 (2,890) (42.4)%
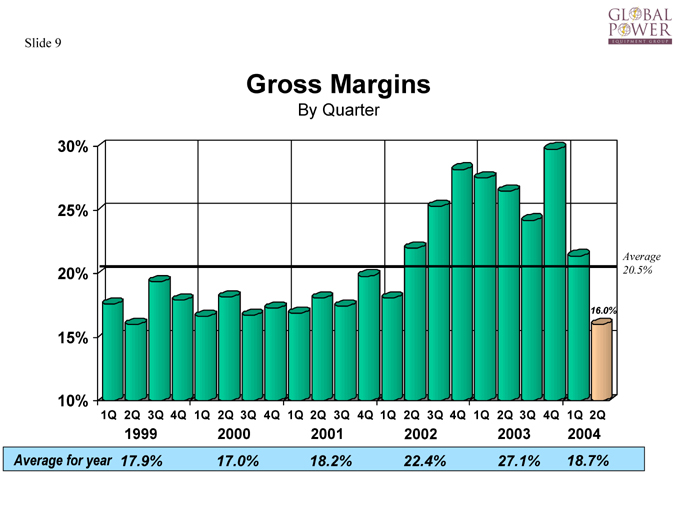
Slide 9
Gross Margins
By Quarter
30%
25%
20%
15%
10%
16.0%
Average 20.5%
1Q 2Q 3Q 4Q 1Q 2Q 3Q 4Q 1Q 2Q 3Q 4Q 1Q 2Q 3Q 4Q 1Q 2Q 3Q 4Q 1Q 2Q
1999 2000 2001 2002 2003 2004
Average for year 17.9% 17.0% 18.2% 22.4% 27.1% 18.7%
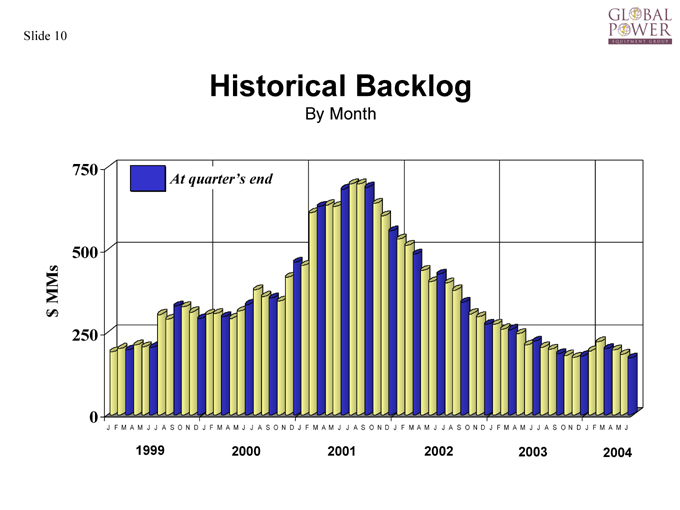
Slide 10
Historical Backlog
By Month $ MMs
750 500 250 0
At quarter’s end
J F M A M J J A S O N D J F M A M J J A S O N D J F M A M J J A S O N D J F M A M J J A S O N D J F M A M J J A S O N D J F M A M J
1999 2000 2001 2002 2003 2004
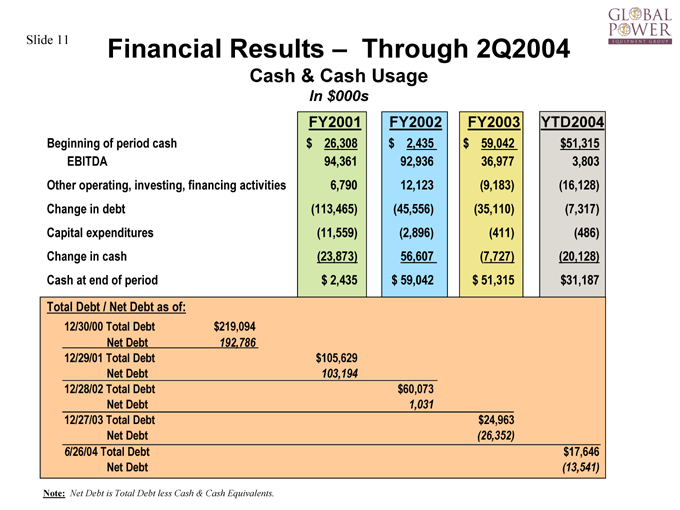
Slide 11
Financial Results – Through 2Q2004
Cash & Cash Usage
In $000s
FY2001 FY2002 FY2003 YTD2004
Beginning of period cash $26,308 $2,435 $59,042 $51,315
EBITDA 94,361 92,936 36,977 3,803
Other operating, investing, financing activities 6,790 12,123 (9,183) (16,128)
Change in debt (113,465) (45,556) (35,110) (7,317)
Capital expenditures (11,559) (2,896) (411) (486)
Change in cash (23,873) 56,607 (7,727) (20,128)
Cash at end of period $2,435 $59,042 $51,315 $31,187
Total Debt / Net Debt as of:
12/30/00 Total Debt $219,094
Net Debt 192,786
12/29/01 Total Debt $105,629
Net Debt 103,194
12/28/02 Total Debt $60,073
Net Debt 1,031
12/27/03 Total Debt $24,963
Net Debt (26,352)
6/26/04 Total Debt $17,646\
Net Debt (13,541)
Note: Net Debt is Total Debt less Cash & Cash Equivalents.
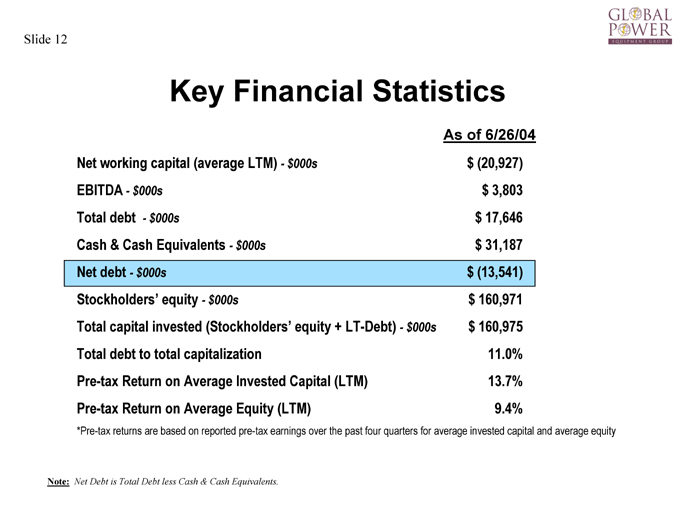
Slide 12
Key Financial Statistics
As of 6/26/04
Net working capital (average LTM) - $000s $(20,927)
EBITDA - $000s $3,803
Total debt - $000s $17,646
Cash & Cash Equivalents - $000s $31,187
Net debt - $000s $(13,541)
Stockholders’ equity - $000s $160,971
Total capital invested (Stockholders’ equity + LT-Debt) - $000s $160,975
Total debt to total capitalization 11.0%
Pre-tax Return on Average Invested Capital (LTM) 13.7%
Pre-tax Return on Average Equity (LTM) 9.4%
*Pre-tax returns are based on reported pre-tax earnings over the past four quarters for average invested capital and average equity
Note: Net Debt is Total Debt less Cash & Cash Equivalents.
Slide 13
Thank You
For Additional Information Please Contact: Bob Zwerneman Director, Investor Relations Global Power Equipment Group Inc.
(918) 274-2398 bobz@globalpower.com