Exhibit 99.3

Slide 1
Third Quarter 2005 Earnings Call
November 8, 2005 9:00 AM EST
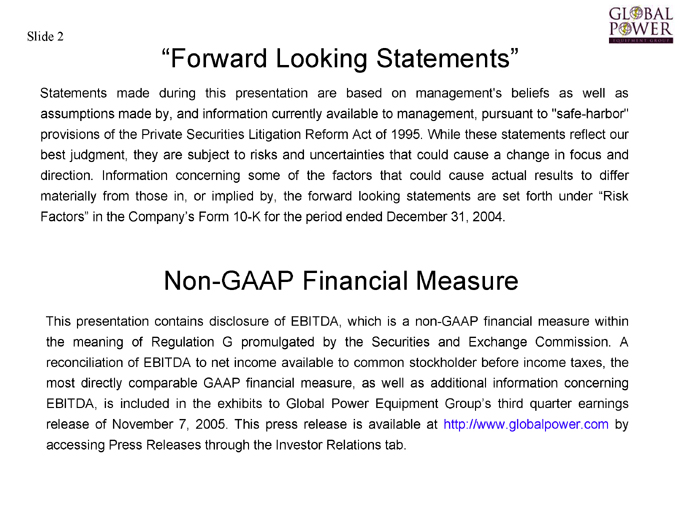
Slide 2
“Forward Looking Statements”
Statements made during this presentation are based on management’s beliefs as well as assumptions made by, and information currently available to management, pursuant to “safe-harbor” provisions of the Private Securities Litigation Reform Act of 1995. While these statements reflect our best judgment, they are subject to risks and uncertainties that could cause a change in focus and direction. Information concerning some of the factors that could cause actual results to differ materially from those in, or implied by, the forward looking statements are set forth under “Risk Factors” in the Company’s Form 10-K for the period ended December 31, 2004.
Non-GAAP Financial Measure
This presentation contains disclosure of EBITDA, which is a non-GAAP financial measure within the meaning of Regulation G promulgated by the Securities and Exchange Commission. A reconciliation of EBITDA to net income available to common stockholder before income taxes, the most directly comparable GAAP financial measure, as well as additional information concerning EBITDA, is included in the exhibits to Global Power Equipment Group’s third quarter earnings release of November 7, 2005. This press release is available at http://www.globalpower.com by accessing Press Releases through the Investor Relations tab.
Slide 3
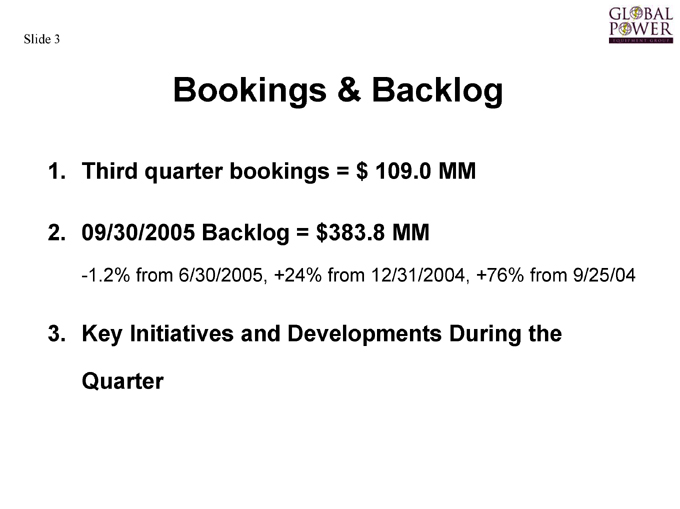
Bookings & Backlog
1. Third quarter bookings = $109.0 MM
2. 09/30/2005 Backlog = $383.8 MM
-1.2% from 6/30/2005, +24% from 12/31/2004, +76% from 9/25/04
3. Key Initiatives and Developments During the Quarter
Slide 4
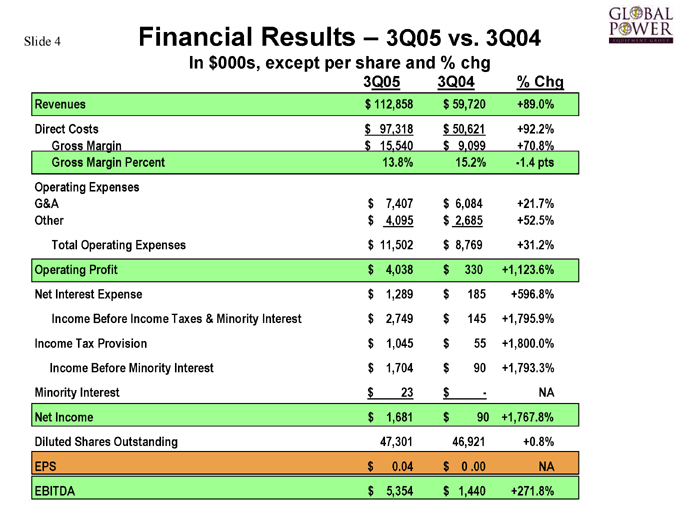
Financial Results – 3Q05 vs. 3Q04
In $000s, except per share and % chg
Revenues | | $112,858 $59,720 +89.0% |
Direct | | Costs $97,318 $50,621 +92.2% |
Gross | | Margin $15,540 $9,099 +70.8% |
Gross | | Margin Percent 13.8% 15.2% -1.4 pts |
Other | | $4,095 $2,685 +52.5% |
Total | | Operating Expenses $11,502 $8,769 +31.2% |
Operating | | Profit $4,038 $330 +1,123.6% |
Net | | Interest Expense $1,289 $185 +596.8% |
Income | | Before Income Taxes & Minority Interest $2,749 $145 +1,795.9% |
Income | | Tax Provision $1,045 $55 +1,800.0% |
Income | | Before Minority Interest $1,704 $90 +1,793.3% |
Minority | | Interest $23 $NA— |
Net | | Income $1,681 $90 +1,767.8% |
Diluted | | Shares Outstanding 47,301 46,921 +0.8% |
EBITDA | | $5,354 $1,440 +271.8% |
Slide 5
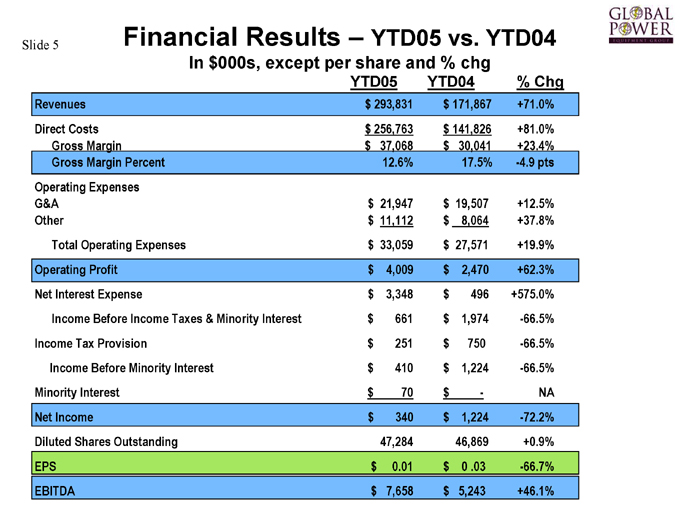
Financial Results – YTD05 vs. YTD04
In $000s, except per share and % chg
Revenues | | $293,831 $171,867 +71.0% |
Direct | | Costs $256,763 $141,826 +81.0% |
Gross | | Margin $37,068 $30,041 +23.4% |
Gross | | Margin Percent 12.6% 17.5% -4.9 pts |
G&A | | $21,947 $19,507 +12.5% |
Other | | $11,112 $8,064 +37.8% |
Total | | Operating Expenses $33,059 $27,571 +19.9% |
Operating | | Profit $4,009 $2,470 +62.3% |
Net | | Interest Expense $3,348 $496 +575.0% |
Income | | Before Income Taxes & Minority Interest $661 $1,974 -66.5% |
Income | | Tax Provision $251 $750 -66.5% |
Income | | Before Minority Interest $410 $1,224 -66.5% |
Minority | | Interest $70 $NA— |
Net | | Income $340 $1,224 -72.2% |
Diluted | | Shares Outstanding 47,284 46,869 +0.9% |
EBITDA | | $7,658 $5,243 +46.1% |
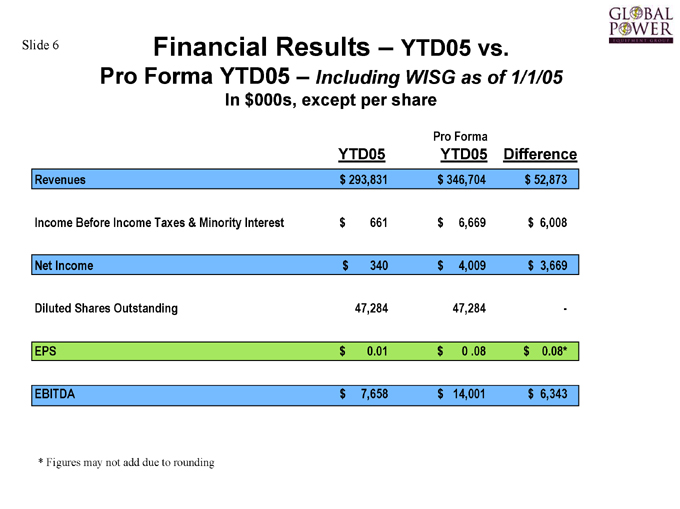
Slide 6
Financial Results – YTD05 vs.
Pro Forma YTD05 – Including WISG as of 1/1/05
In $000s, except per share
Pro Forma
Revenues | | $293,831 $346,704 $52,873 |
Income | | Before Income Taxes & Minority Interest $661 $6,669 $6,008 |
Net | | Income $340 $4,009 $3,669 |
Diluted | | Shares Outstanding 47,284 47,284 - |
EBITDA | | $7,658 $14,001 $6,343 |
* | | Figures may not add due to rounding |

Slide 7
Financial Results
Segment and Geographic Details
3Q05 vs. 3Q04
In $000s, except % chg
Heat | | Recovery Equipment $63,537 $31,973 $31,564 98.7% |
Auxiliary | | Power Equipment 20,433 27,747 (7,314) (26.4)% |
Industrial | | Services 28,888—28,888 N/A |
Total | | $112,858 $59,720 $53,138 89.0% |
United | | States and Canada $68,275 $15,096 $53,179 352.3% |
Asia | | 7,267 28,778 (21,511) (74.7)% |
Europe | | 21,103 3,990 17,113 428.9% |
Middle | | East 6,541 10,005 (3,464) (34.6)% |
Other | | 1,492 1,851 (359) (19.4)% |
Revenues | | YTD05 YTD04 Change % Chg |
Heat | | Recovery Equipment $146,265 $86,571 $59,694 69.0% |
Auxiliary | | Power Equipment 82,592 85,296 (2,704) 3.2% |
Industrial | | Services 64,974—64,974 N/A |
Total | | $293,831 $171,867 $121,964 71.0% |
United | | States and Canada $153,568 $65,565 $88,003 134.2% |
Asia | | 38,507 50,176 (11,669) (23.3)% |
Europe | | 47,486 15,445 32,041 207.5% |
Middle | | East 20,193 37,541 (17,348) (46.2)% |
Other | | 5,692 3,140 2,552 81.3% |
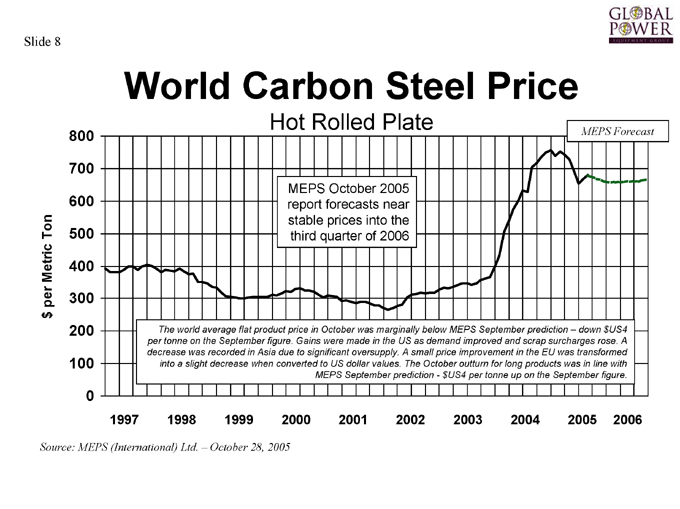
Slide 8
World Carbon Steel Price
Hot Rolled Plate $ per Metric Ton
800 700 600 500 400 300 200 100 0
1997 1998 1999 2000 2001 2002 2003 2004 2005 2006
MEPS October 2005 report forecasts near stable prices into the third quarter of 2006
MEPS Forecast
The world average flat product price in October was marginally below MEPS September prediction – down $US4 per tonne on the September figure. Gains were made in the US as demand improved and scrap surcharges rose. A decrease was recorded in Asia due to significant oversupply. A small price improvement in the EU was transformed into a slight decrease when converted to US dollar values. The October outturn for long products was in line with MEPS September prediction—$US4 per tonne up on the September figure.
Source: MEPS (International) Ltd. – October 28, 2005
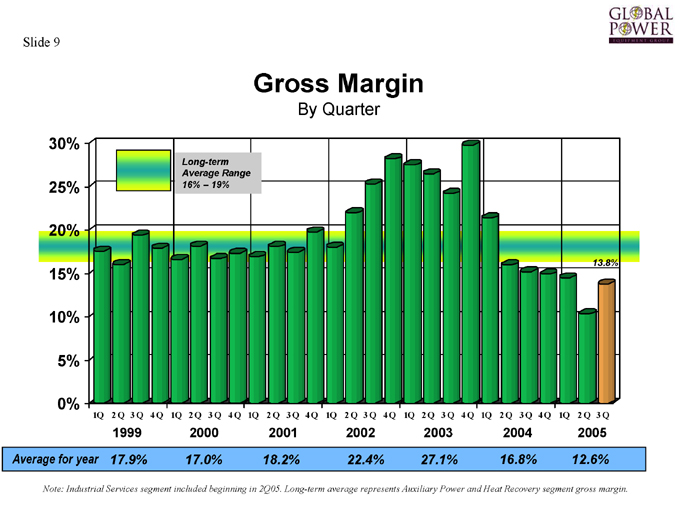
Slide 9
Gross Margin
By Quarter
30% 25% 20% 15% 10% 5% 0%
1Q 2Q 3Q 4Q 1Q 2Q 3Q 4Q 1Q 2Q 3Q 4Q 1Q 2Q 3Q 4Q 1Q 2Q 3Q 4Q 1Q 2Q 3Q 4Q 1Q 2Q 3Q
1999 2000 2001 2002 2003 2004 2005
Long-term Average Range
16% – 19%
13.8%
Average for year 17.9% 17.0% 18.2% 22.4% 27.1% 16.8% 12.6%
Note: Industrial Services segment included beginning in 2Q05. Long-term average represents Auxiliary Power and Heat Recovery segment gross margin.
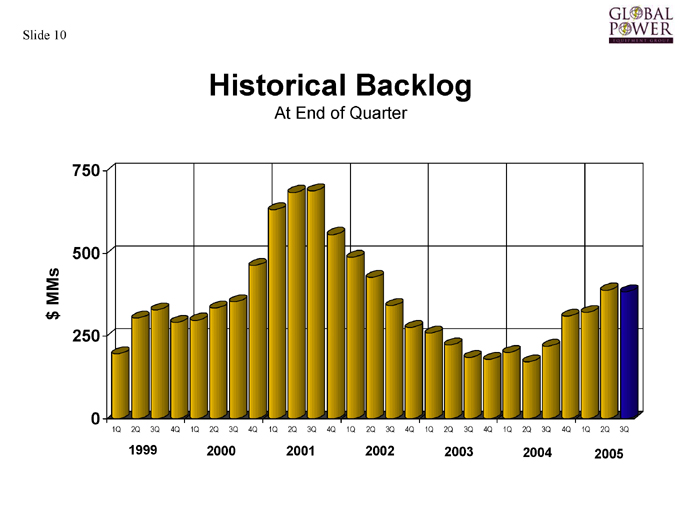
Slide 10
Historical Backlog
At End of Quarter $ MMs
750 500 250 0
1Q 2Q 3Q 4Q 1Q 2Q 3Q 4Q 1Q 2Q 3Q 4Q 1Q 2Q 3Q 4Q 1Q 2Q 3Q 4Q 1Q 2Q 3Q 4Q 1Q 2Q 3Q
1999 2000 2001 2002 2003 2004 2005
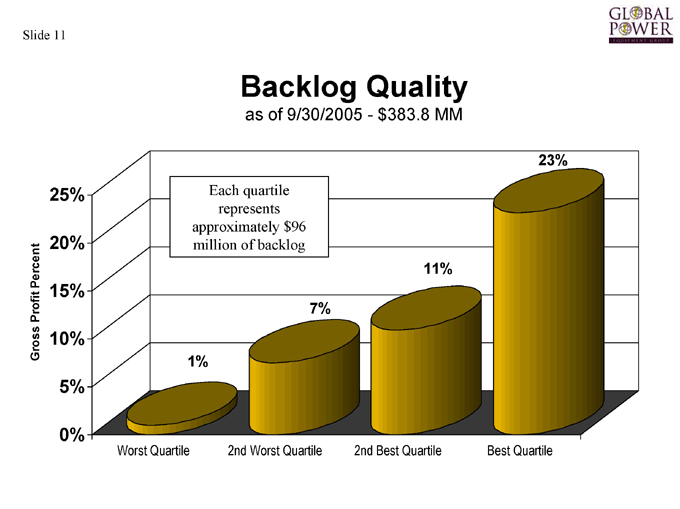
Slide 11
Backlog Quality
as of 9/30/2005 - $383.8 MM
Gross Profit Percent
25% 20% 15% 10% 5% 0%
Worst Quartile 2nd Worst Quartile 2nd Best Quartile Best Quartile
Each quartile represents approximately $96 million of backlog
1%
7%
11%
23%
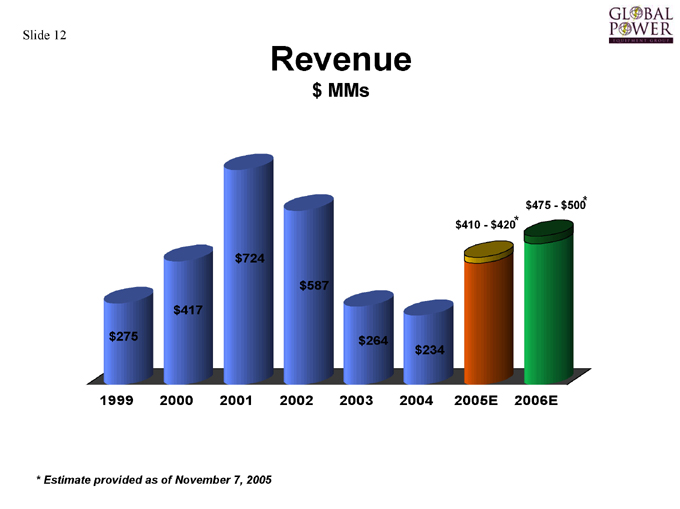
Slide 12
Revenue
$ MMs
1999 2000 2001 2002 2003 2004 2005E 2006E $275 $417 $724 $587 $264 $234 $410 - $420*
$475 - $500*
* | | Estimate provided as of November 7, 2005 |
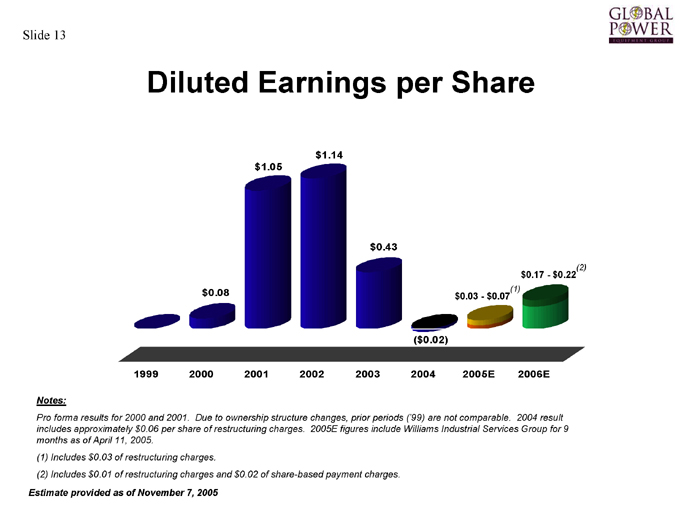
Slide 13
Diluted Earnings per Share
1999 2000 2001 2002 2003 2004 2005E 2006E $0.08
$1.05 $1.14 $0.43
($0.02) $0.03 - $0.07(1) $0.17 - $0.22(2)
Notes:
Pro forma results for 2000 and 2001. Due to ownership structure changes, prior periods (‘99) are not comparable. 2004 result includes approximately $0.06 per share of restructuring charges. 2005E figures include Williams Industrial Services Group for 9 months as of April 11, 2005.
(1) | | Includes $0.03 of restructuring charges. |
(2) | | Includes $0.01 of restructuring charges and $0.02 of share-based payment charges. |
Estimate provided as of November 7, 2005
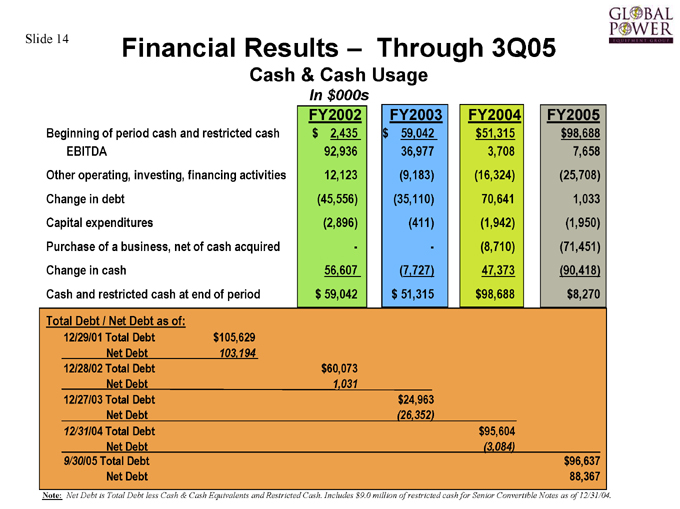
Slide 14
Financial Results – Through 3Q05
Cash & Cash Usage
In $000s
FY2002 | | FY2003 FY2004 FY2005 |
Beginning | | of period cash and restricted cash $2,435 $59,042 $51,315 $98,688 |
EBITDA | | 92,936 36,977 3,708 7,658 |
Other | | operating, investing, financing activities 12,123 (9,183) (16,324) (25,708) |
Change | | in debt (45,556) (35,110) 70,641 1,033 |
Capital | | expenditures (2,896) (411) (1,942) (1,950) |
Purchase | | of a business, net of cash acquired—- (8,710) (71,451) |
Change | | in cash 56,607 (7,727) 47,373 (90,418) |
Cash | | and restricted cash at end of period $59,042 $51,315 $98,688 $8,270 |
Total | | Debt / Net Debt as of: |
12/29/01 | | Total Debt $105,629 |
12/28/02 | | Total Debt $60,073 |
12/27/03 | | Total Debt $24,963 |
12/31/04 | | Total Debt $95,604 |
9/30/05 | | Total Debt $96,637 |
Note: Net Debt is Total Debt less Cash & Cash Equivalents and Restricted Cash. Includes $9.0 million of restricted cash for Senior Convertible Notes as of 12/31/04.

Slide 15
Thank You
For Additional Information Please Contact: Bob Zwerneman Director, Investor Relations Global Power Equipment Group Inc.
(918) 274-2398 bobz@globalpower.com