Exhibit 99.2
| Q1 2019 Financial Results May 16, 2019 Tracy Pagliara President and CEO Tim Howsman Chief Financial Officer OTCQX: WLMS |
| 2 Forward-looking Statement Disclaimer This presentation contains “forward-looking statements” within the meaning of the term set forth in the Private Securities Litigation Reform Act of 1995. The forward-looking statements include statements or expectations regarding the Company’s ability to realize opportunities and successfully achieve its growth and strategic initiatives, such as midstream oil & gas opportunities, water-related projects and expansion into Canada, as well as expectations for future growth, backlog conversion, revenue, profitability and earnings, the continuing impact of the Company’s cost reduction, reorganization and restructuring efforts, expectations relating to the Company’s performance, expected work in the energy and industrial markets, and other related matters. These statements reflect the Company’s current views of future events and financial performance and are subject to a number of risks and uncertainties, including its ability to comply with the terms of its debt instruments and access letters of credit, ability to implement strategic initiatives, business plans, and liquidity plans, and ability to maintain effective internal control over financial reporting and disclosure controls and procedures. Actual results, performance or achievements may differ materially from those expressed or implied in the forward-looking statements. Additional risks and uncertainties that could cause or contribute to such material differences include, but are not limited to, decreased demand for new gas turbine power plants, reduced demand for, or increased regulation of, nuclear power, loss of any of the Company’s major customers, whether pursuant to the loss of pending or future bids for either new business or an extension of existing business, termination of customer or vendor relationships, cost increases and project cost overruns, unforeseen schedule delays, poor performance by its subcontractors, cancellation of projects, competition, including competitors being awarded business by current customers, damage to the Company’s reputation, warranty or product liability claims, increased exposure to environmental or other liabilities, failure to comply with various laws and regulations, failure to attract and retain highly-qualified personnel, loss of customer relationships with critical personnel, volatility of the Company’s stock price, deterioration or uncertainty of credit markets, and changes in the economic and social and political conditions in the United States, including the banking environment or monetary policy. Other important factors that may cause actual results to differ materially from those expressed in the forward-looking statements are discussed in the Company’s filings with the U.S. Securities and Exchange Commission, including the section of the Annual Report on Form 10-K for its 2018 fiscal year titled “Risk Factors.” Any forward-looking statement speaks only as of the date of this presentation. Except as may be required by applicable law, the Company undertakes no obligation to publicly update or revise any forward-looking statements, whether as a result of new information, future events or otherwise, and you are cautioned not to rely upon them unduly. Non-GAAP Financial Measures This presentation will discuss some non-GAAP financial measures, which the Company believes are useful in evaluating our performance. You should not consider the presentation of this additional information in isolation or as a substitute for results prepared in accordance with GAAP. The Company has provided reconciliations of comparable GAAP to non-GAAP measures in tables found on the slides following the “Supplemental Information” slide of this presentation. Cautionary Notes * Note: Unless otherwise noted, all discussion is based upon continuing operations. |
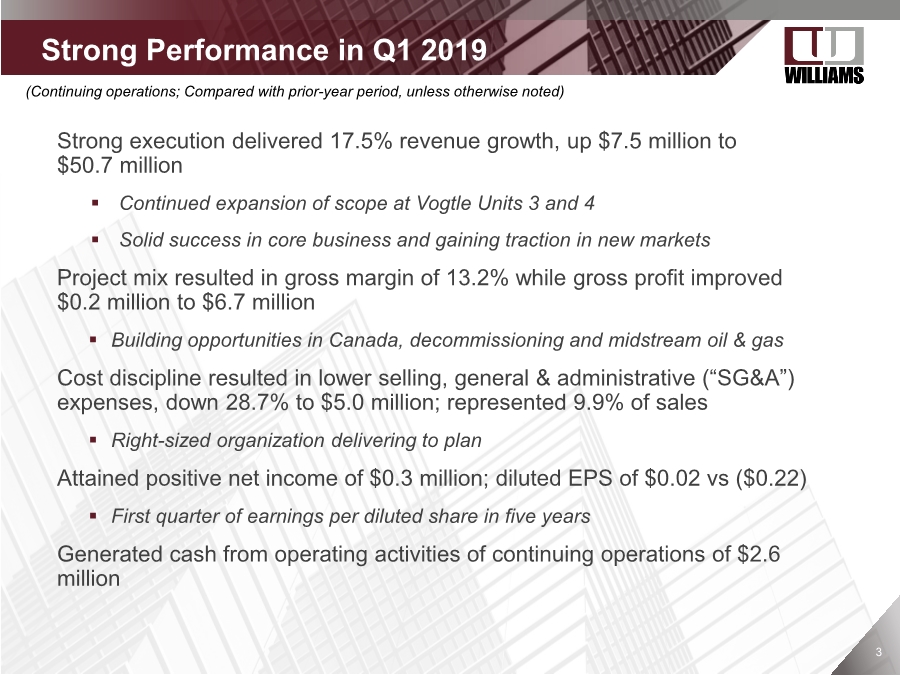
| 3 Strong Performance in Q1 2019 (Continuing operations; Compared with prior-year period, unless otherwise noted) Strong execution delivered 17.5% revenue growth, up $7.5 million to $50.7 million .. Continued expansion of scope at Vogtle Units 3 and 4 .. Solid success in core business and gaining traction in new markets Project mix resulted in gross margin of 13.2% while gross profit improved $0.2 million to $6.7 million .. Building opportunities in Canada, decommissioning and midstream oil & gas Cost discipline resulted in lower selling, general & administrative (“SG&A”) expenses, down 28.7% to $5.0 million; represented 9.9% of sales .. Right-sized organization delivering to plan Attained positive net income of $0.3 million; diluted EPS of $0.02 vs ($0.22) .. First quarter of earnings per diluted share in five years Generated cash from operating activities of continuing operations of $2.6 million |
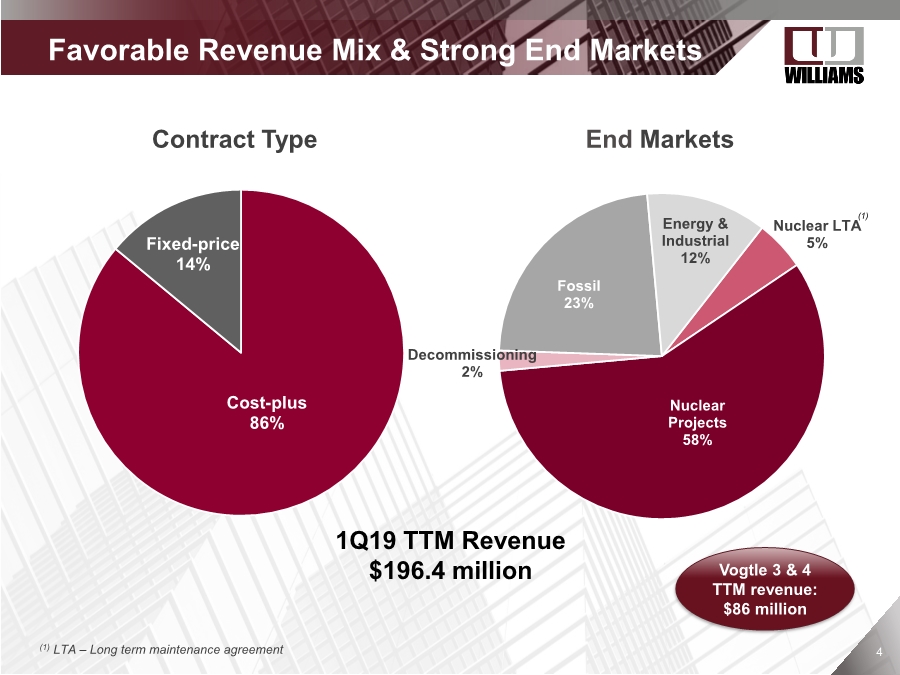
| Company Confidential 44 Nuclear LTA 5% Nuclear Projects 58% Decommissioning 2% Fossil 23% Energy & Industrial 12% .. Favorable Revenue Mix & Strong End Markets Cost-plus 86% Fixed-price 14% 1Q19 TTM Revenue $196.4 million Contract Type End Markets Vogtle 3 & 4 TTM revenue: $86 million (1) (1) LTA – Long term maintenance agreement |
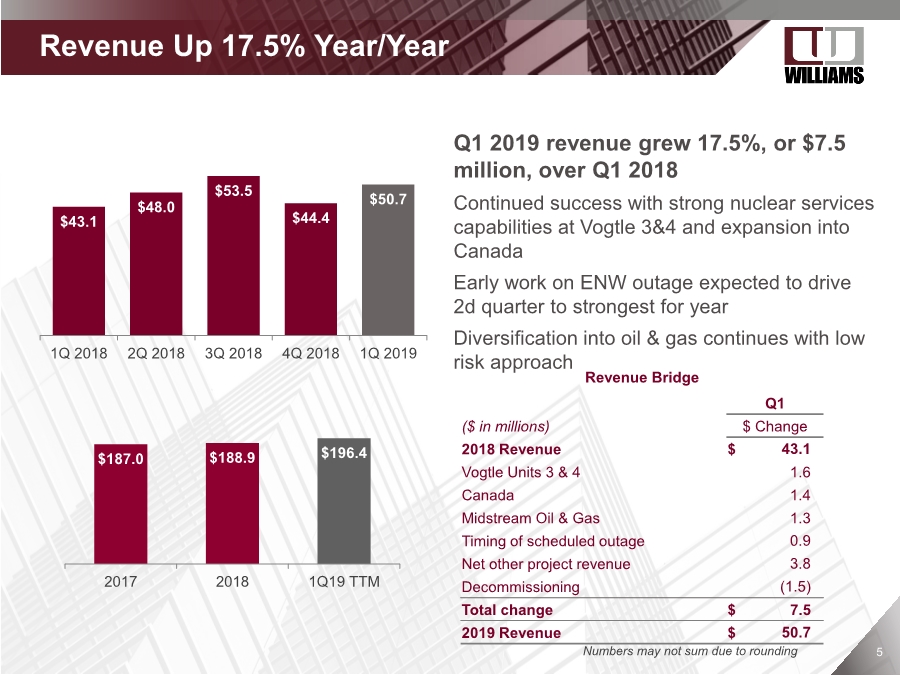
| Company Confidential 55 Q1 2019 revenue grew 17.5%, or $7.5 million, over Q1 2018 Continued success with strong nuclear services capabilities at Vogtle 3&4 and expansion into Canada Early work on ENW outage expected to drive 2d quarter to strongest for year Diversification into oil & gas continues with low risk approach $43.1 $48.0 $53.5 $44.4 $50.7 1Q 2018 2Q 2018 3Q 2018 4Q 2018 1Q 2019 Revenue Bridge Q1 ($ in millions) $ Change 2018 Revenue $ 43.1 Vogtle Units 3 & 4 1.6 Canada 1.4 Midstream Oil & Gas 1.3 Timing of scheduled outage 0.9 Net other project revenue 3.8 Decommissioning (1.5) Total change $ 7.5 2019 Revenue $ 50.7 Revenue Up 17.5% Year/Year $187.0 $188.9 $196.4 2017 2018 1Q19 TTM Numbers may not sum due to rounding |
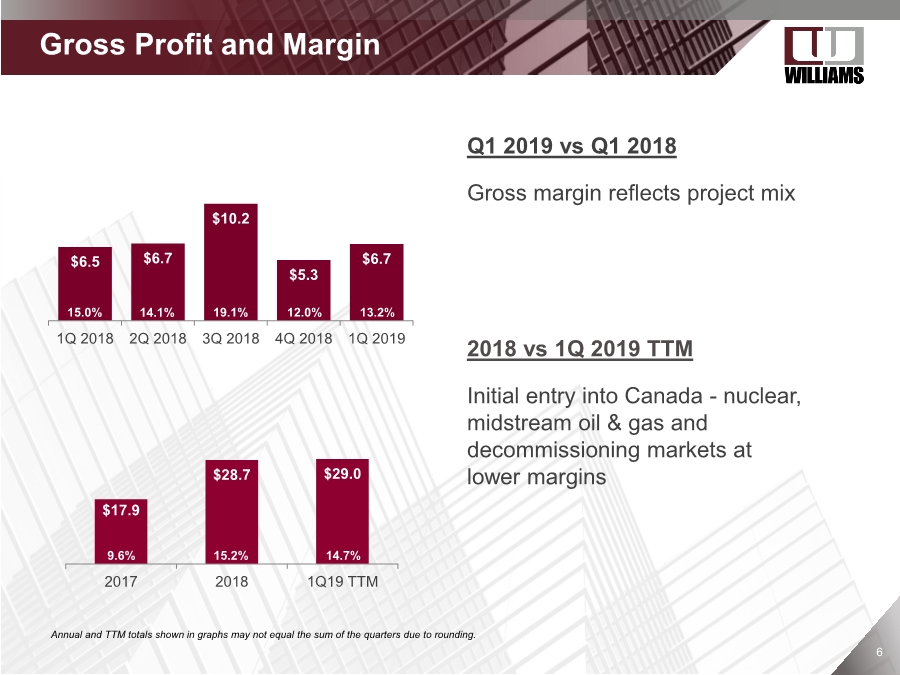
| Company Confidential 66 Gross Profit and Margin Q1 2019 vs Q1 2018 Gross margin reflects project mix 2018 vs 1Q 2019 TTM Initial entry into Canada - nuclear, midstream oil & gas and decommissioning markets at lower margins $6.5 $6.7 $10.2 $5.3 $6.7 1Q 2018 2Q 2018 3Q 2018 4Q 2018 1Q 2019 15.0% 14.1% 19.1% 13.2% $17.9 $28.7 $29.0 2017 2018 1Q19 TTM 15.2% 14.7%9.6% 12.0% Annual and TTM totals shown in graphs may not equal the sum of the quarters due to rounding. |
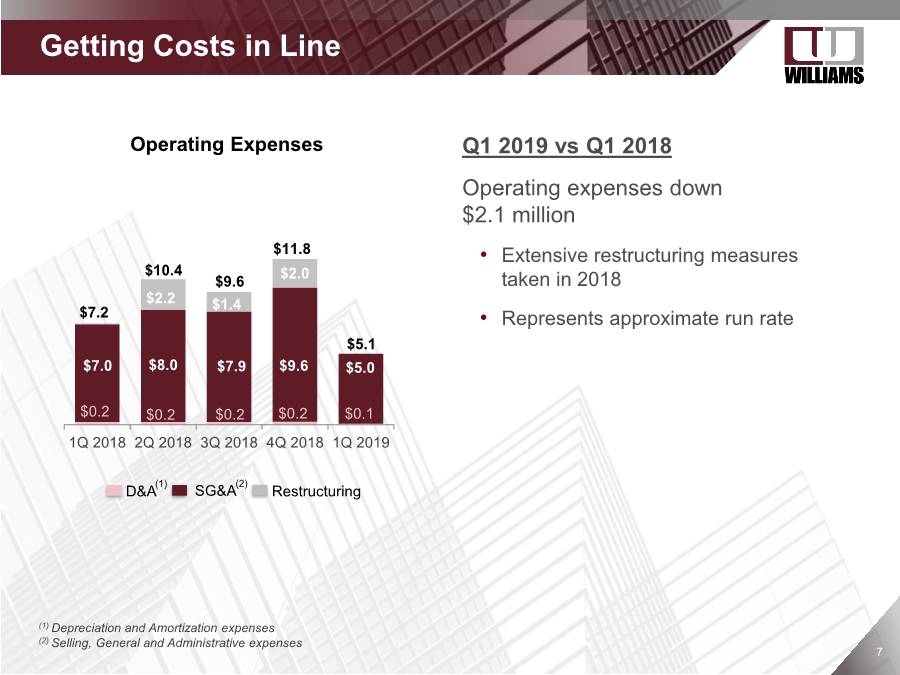
| Company Confidential 77 Operating Expenses Getting Costs in Line $7.2 $10.4 $9.6 $5.1 $7.0 $8.0 $7.9 $9.6 $5.0 $2.2 $1.4 $2.0 1Q 2018 2Q 2018 3Q 2018 4Q 2018 1Q 2019 $0.1$0.2 $0.2 $0.2 $0.2 $11.8 Q1 2019 vs Q1 2018 Operating expenses down $2.1 million • Extensive restructuring measures taken in 2018 • Represents approximate run rate (1) Depreciation and Amortization expenses (2) Selling, General and Administrative expenses SG&AD&A Restructuring(1) (2) |
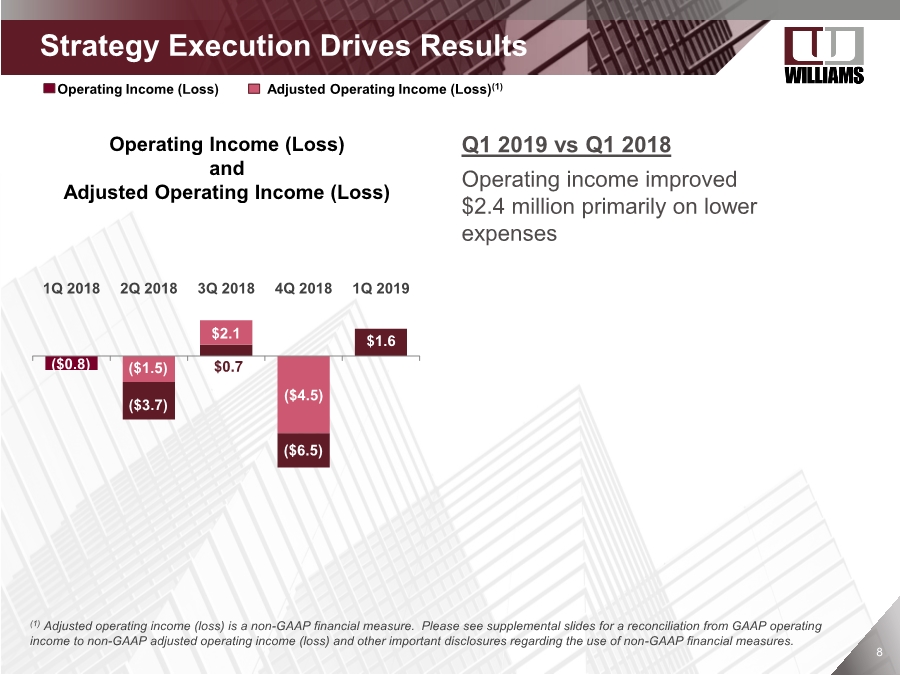
| Company Confidential 88 Strategy Execution Drives Results Q1 2019 vs Q1 2018 Operating income improved $2.4 million primarily on lower expenses ($0.8) ($3.7) ($4.5) $1.6 1Q 2018 2Q 2018 3Q 2018 4Q 2018 1Q 2019 $2.1 $0.7($1.5) Operating Income (Loss) Adjusted Operating Income (Loss)(1) (1) Adjusted operating income (loss) is a non-GAAP financial measure. Please see supplemental slides for a reconciliation from GAAP operating income to non-GAAP adjusted operating income (loss) and other important disclosures regarding the use of non-GAAP financial measures. ($6.5) Operating Income (Loss) and Adjusted Operating Income (Loss) |
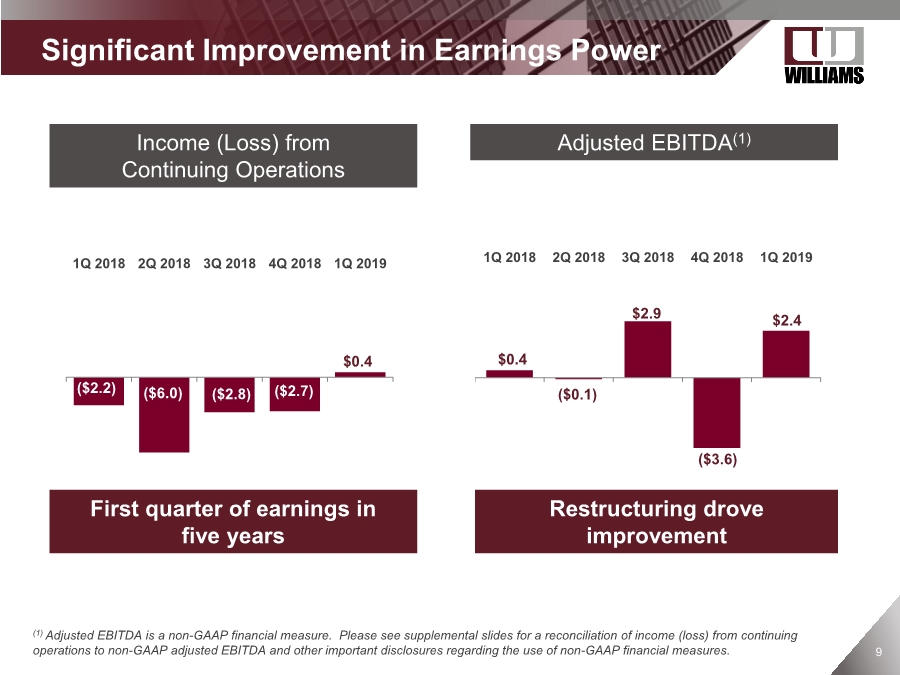
| 9 $0.4 ($0.1) $2.9 ($3.6) $2.4 1Q 2018 2Q 2018 3Q 2018 4Q 2018 1Q 2019 ($2.2) ($6.0) ($2.7)($2.8) $0.4 1Q 2018 2Q 2018 3Q 2018 4Q 2018 1Q 2019 (1) Adjusted EBITDA is a non-GAAP financial measure. Please see supplemental slides for a reconciliation of income (loss) from continuing operations to non-GAAP adjusted EBITDA and other important disclosures regarding the use of non-GAAP financial measures. Income (Loss) from Continuing Operations Adjusted EBITDA(1) First quarter of earnings in five years Restructuring drove improvement Significant Improvement in Earnings Power |
| 10 Meeting working capital needs for outage work in Q2 2019 Improving cash generation to support strong growth plans • Generated $2.6 million in cash from operating activities of continuing operations in the quarter; net cash generated from operating activities was $2.4 million • Cash generated from operations dedicated to organic growth • Net income plus non-cash items is a proxy for cash generated Plan to refinance term loan following lifting of no call With strengthening cash flow and building cash reserves, will assess using cash to reduce debt in 2020 Term loan debt: $33.5 million (net of $1.3 million of unamortized deferred financing costs) • With new term loan, variable rate reduced to 12.5% from 21.1% • Maturity extended to September 2022 from mandatory pre-payment due date in April 2020 Three-year $15 million revolver • LIBOR + 6.0% with a minimum LIBOR rate of 1.0% Generating Cash & Balance Sheet |

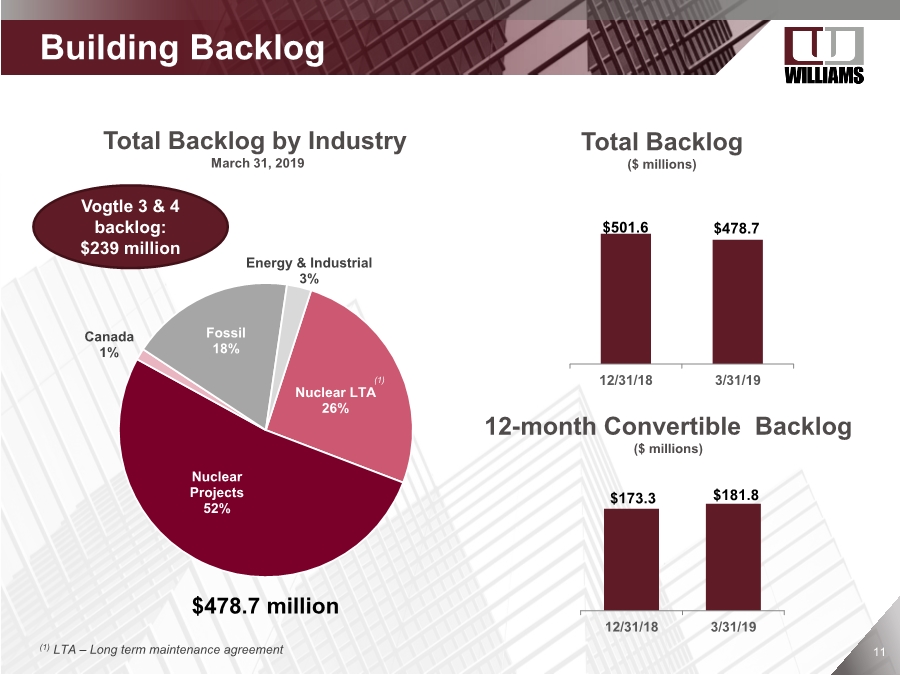
| Company Confidential 1111 $501.6 $478.7 12/31/18 3/31/19 .. Building Backlog Nuclear LTA 26% Nuclear Projects 52% Canada 1% Fossil 18% Energy & Industrial 3% Total Backlog by Industry March 31, 2019 Total Backlog ($ millions) Vogtle 3 & 4 backlog: $239 million (1) LTA – Long term maintenance agreement (1) $173.3 $181.8 12/31/18 3/31/19 12-month Convertible Backlog ($ millions) $478.7 million |
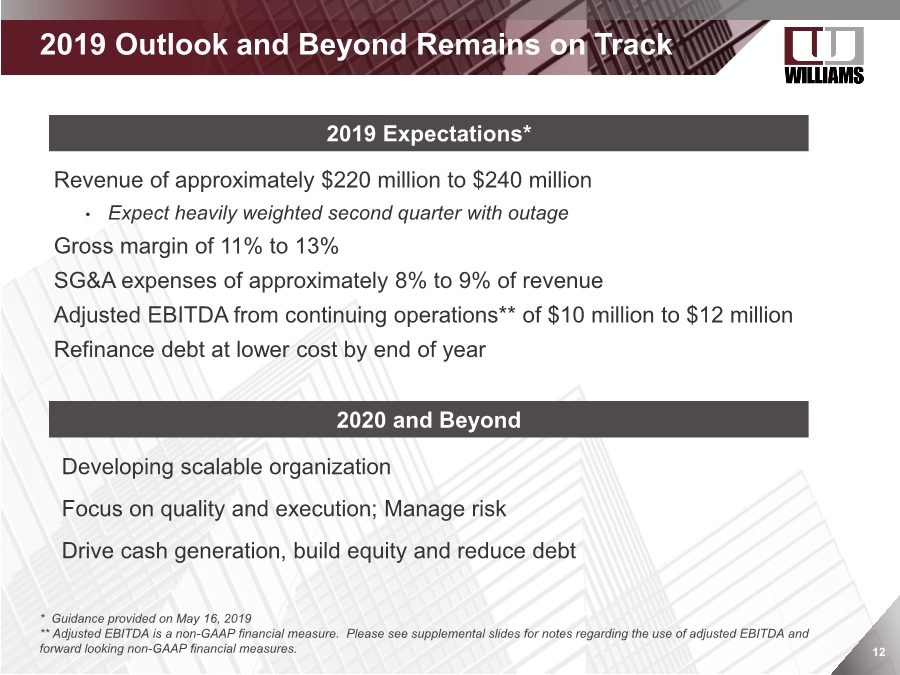
| 12 Revenue of approximately $220 million to $240 million • Expect heavily weighted second quarter with outage Gross margin of 11% to 13% SG&A expenses of approximately 8% to 9% of revenue Adjusted EBITDA from continuing operations** of $10 million to $12 million Refinance debt at lower cost by end of year .. 2019 Outlook and Beyond Remains on Track * Guidance provided on May 16, 2019 ** Adjusted EBITDA is a non-GAAP financial measure. Please see supplemental slides for notes regarding the use of adjusted EBITDA and forward looking non-GAAP financial measures. 2019 Expectations* 2020 and Beyond Developing scalable organization Focus on quality and execution; Manage risk Drive cash generation, build equity and reduce debt |
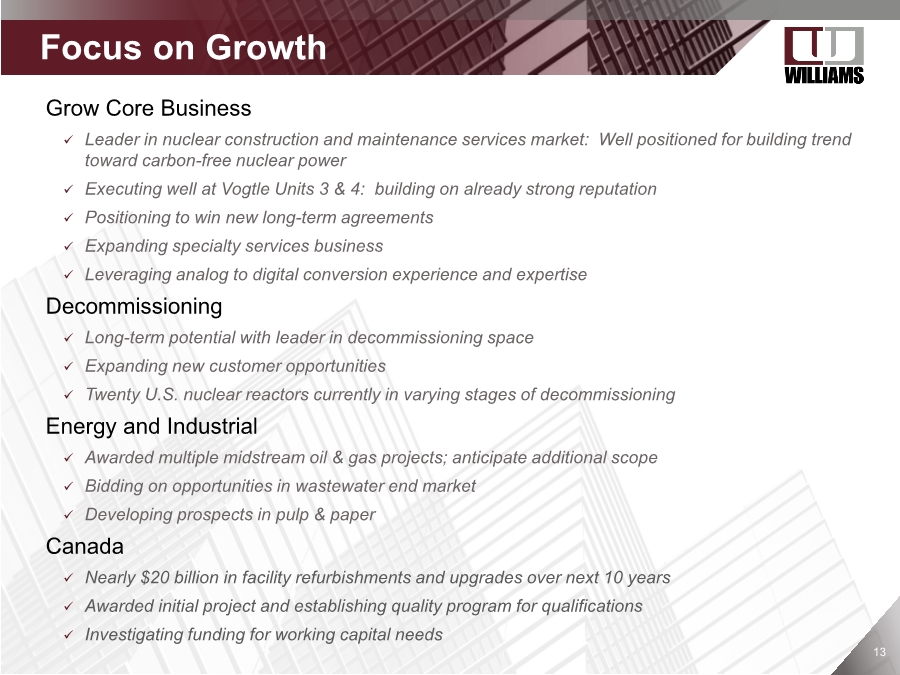
| Company Confidential 1313 Grow Core Business Leader in nuclear construction and maintenance services market: Well positioned for building trend toward carbon-free nuclear power Executing well at Vogtle Units 3 & 4: building on already strong reputation Positioning to win new long-term agreements Expanding specialty services business Leveraging analog to digital conversion experience and expertise Decommissioning Long-term potential with leader in decommissioning space Expanding new customer opportunities Twenty U.S. nuclear reactors currently in varying stages of decommissioning Energy and Industrial Awarded multiple midstream oil & gas projects; anticipate additional scope Bidding on opportunities in wastewater end market Developing prospects in pulp & paper Canada Nearly $20 billion in facility refurbishments and upgrades over next 10 years Awarded initial project and establishing quality program for qualifications Investigating funding for working capital needs .. Focus on Growth |
| Supplemental Information OTCQX: WLMS |

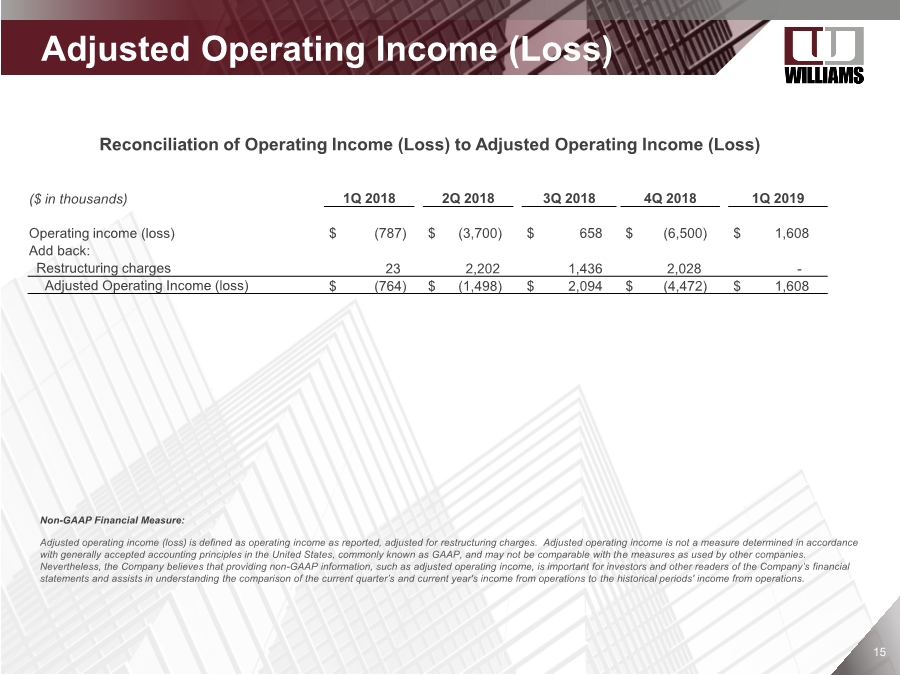
| Company Confidential 1515 Adjusted Operating Income (Loss) Reconciliation of Operating Income (Loss) to Adjusted Operating Income (Loss) ($ in thousands) 1Q 2018 2Q 2018 3Q 2018 4Q 2018 1Q 2019 Operating income (loss) $ (787) $ (3,700) $ 658 $ (6,500) $ 1,608 Add back: Restructuring charges 23 2,202 1,436 2,028 - Adjusted Operating Income (loss) $ (764) $ (1,498) $ 2,094 $ (4,472) $ 1,608 Non-GAAP Financial Measure: Adjusted operating income (loss) is defined as operating income as reported, adjusted for restructuring charges. Adjusted operating income is not a measure determined in accordance with generally accepted accounting principles in the United States, commonly known as GAAP, and may not be comparable with the measures as used by other companies. Nevertheless, the Company believes that providing non-GAAP information, such as adjusted operating income, is important for investors and other readers of the Company’s financial statements and assists in understanding the comparison of the current quarter’s and current year's income from operations to the historical periods' income from operations. |
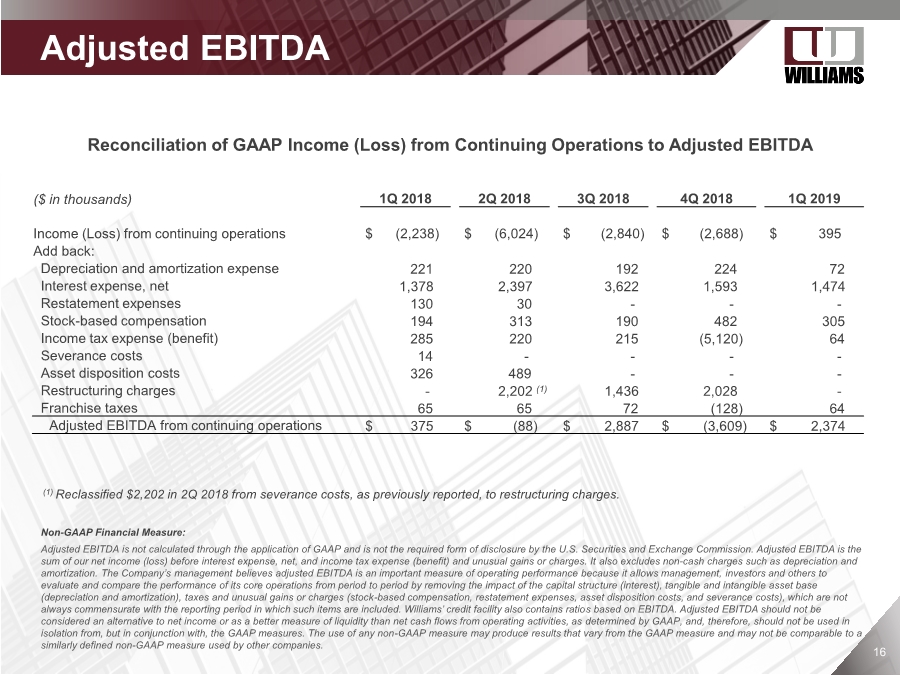
| Company Confidential 1616 Adjusted EBITDA Reconciliation of GAAP Income (Loss) from Continuing Operations to Adjusted EBITDA ($ in thousands) 1Q 2018 2Q 2018 3Q 2018 4Q 2018 1Q 2019 Income (Loss) from continuing operations $ (2,238) $ (6,024) $ (2,840) $ (2,688) $ 395 Add back: Depreciation and amortization expense 221 220 192 224 72 Interest expense, net 1,378 2,397 3,622 1,593 1,474 Restatement expenses 130 30 --- Stock-based compensation 194 313 190 482 305 Income tax expense (benefit) 285 220 215 (5,120) 64 Severance costs 14 ---- Asset disposition costs 326 489 --- Restructuring charges - 2,202 (1) 1,436 2,028 - Franchise taxes 65 65 72 (128) 64 Adjusted EBITDA from continuing operations $ 375 $ (88) $ 2,887 $ (3,609) $ 2,374 Non-GAAP Financial Measure: Adjusted EBITDA is not calculated through the application of GAAP and is not the required form of disclosure by the U.S. Securities and Exchange Commission. Adjusted EBITDA is the sum of our net income (loss) before interest expense, net, and income tax expense (benefit) and unusual gains or charges. It also excludes non-cash charges such as depreciation and amortization. The Company’s management believes adjusted EBITDA is an important measure of operating performance because it allows management, investors and others to evaluate and compare the performance of its core operations from period to period by removing the impact of the capital structure (interest), tangible and intangible asset base (depreciation and amortization), taxes and unusual gains or charges (stock-based compensation, restatement expenses, asset disposition costs, and severance costs), which are not always commensurate with the reporting period in which such items are included. Williams’ credit facility also contains ratios based on EBITDA. Adjusted EBITDA should not be considered an alternative to net income or as a better measure of liquidity than net cash flows from operating activities, as determined by GAAP, and, therefore, should not be used in isolation from, but in conjunction with, the GAAP measures. The use of any non-GAAP measure may produce results that vary from the GAAP measure and may not be comparable to a similarly defined non-GAAP measure used by other companies. (1) Reclassified $2,202 in 2Q 2018 from severance costs, as previously reported, to restructuring charges. |
| Company Confidential 1717 Non-GAAP Guidance Note Regarding Forward-Looking Non-GAAP Financial Measures The Company does not provide a reconciliation of forward-looking non-GAAP financial measures to their comparable GAAP financial measures because it could not do so without unreasonable effort due to the unavailability of the information needed to calculate reconciling items and due to the variability, complexity and limited visibility of the adjusting items that would be excluded from the non-GAAP financial measures in future periods. When planning, forecasting and analyzing future periods, the Company does so primarily on a non-GAAP basis without preparing a GAAP analysis. |