[GRAPHIC]
Atlanta
July 1, 2003

Forward Looking Statement
This presentation and the accompanying commentary may contain “forward-looking statements” that may be identified by use of such words as “believe,” “expect,” “anticipate,” “should,” “planned,” “estimated,” and “potential.” Examples of forward- looking statements include, but are not limited to, estimates with respect to our financial condition and results of operation and business that are subject to various factors that could cause actual results to differ materially from these estimates. These factors include but are not limited to general and local economic conditions; changes in interest rates, deposit flows, demand for mortgages and other loans, real estate values, and competition; changes in accounting principles, policies, or guidelines; changes in legislation or regulation; and other economic, competitive, governmental, regulatory, and technological factors affecting our operations, pricing, products, and services. Any or all forward-looking statements in this release and in any other public statements we make may turn out to be wrong. They can be affected by inaccurate assumptions we might make or known or unknown risks and uncertainties. Consequently, no forward-looking statements can be guaranteed. The Company disclaims any obligation to subsequently revise any forward- looking statements to reflect events or circumstances after the date of such statements or to reflect the occurrence of anticipated or unanticipated events.
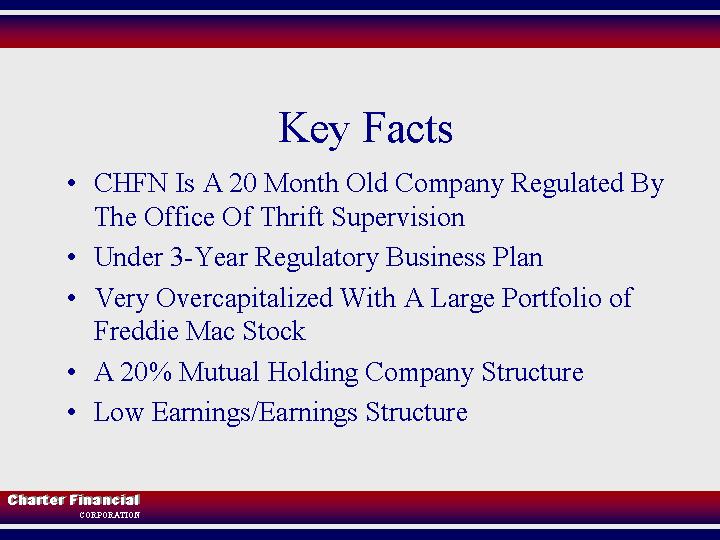
Key Facts
| • | CHFN Is A 20 Month Old Company Regulated By The Office Of Thrift Supervision |
| • | Under 3-Year Regulatory Business Plan |
| • | Very Overcapitalized With A Large Portfolio of Freddie Mac Stock |
| • | A 20% Mutual Holding Company Structure |
| • | Low Earnings/Earnings Structure |
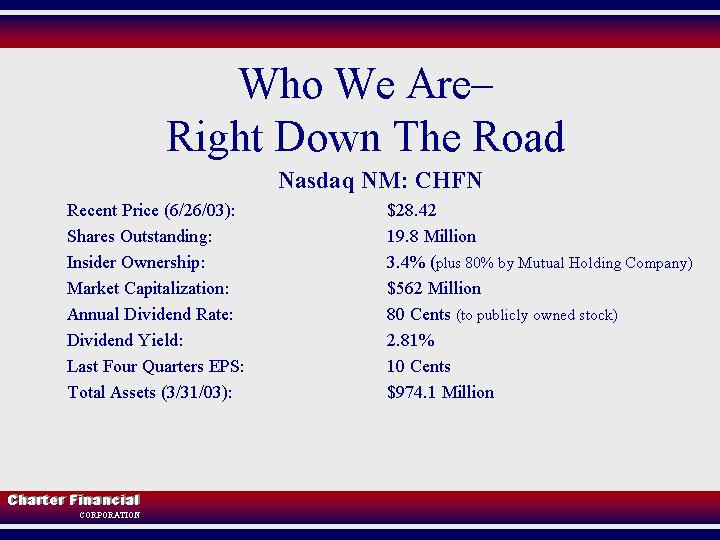
Who We Are—
Right Down The Road
Nasdaq NM: CHFN
Recent Price (6/26/03): | $28.42 | |
Shares Outstanding: | 19.8 Million | |
Insider Ownership: | 3.4% (plus 80% by Mutual Holding Company) | |
Market Capitalization: | $562 Million | |
Annual Dividend Rate: | 80 Cents (to publicly owned stock) | |
Dividend Yield: | 2.81% | |
Last Four Quarters EPS: | 10 Cents | |
Total Assets (3/31/03): | $974.1 Million |
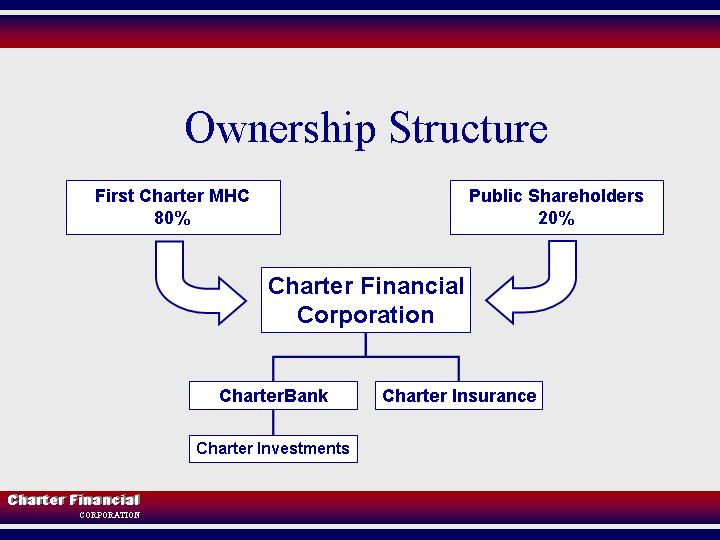
Ownership Structure
[GRAPHIC]
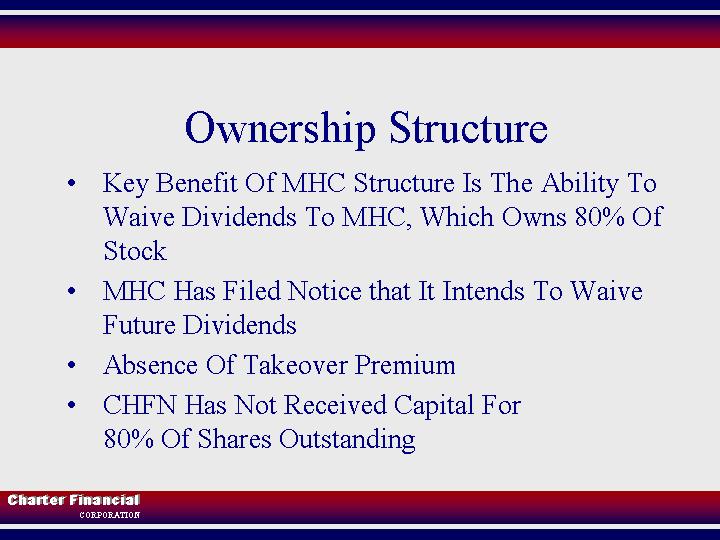
Ownership Structure
| • | Key Benefit Of MHC Structure Is The Ability To Waive Dividends To MHC, Which Owns 80% Of Stock |
| • | MHC Has Filed Notice that It Intends To Waive Future Dividends |
| • | Absence Of Takeover Premium |
| • | CHFN Has Not Received Capital For 80% Of Shares Outstanding |
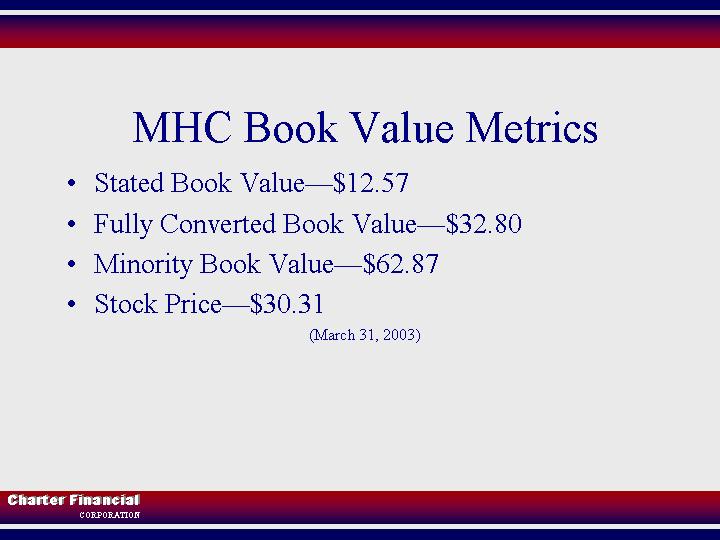
MHC Book Value Metrics
| • | Stated Book Value—$12.57 |
| • | Fully Converted Book Value—$32.80 |
| • | Minority Book Value—$62.87 |
| • | Stock Price—$30.31 |
(March 31, 2003)
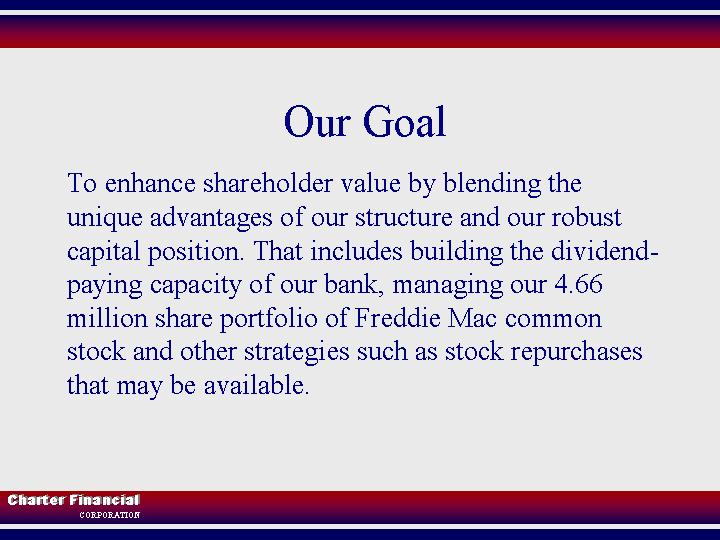
Our Goal
To enhance shareholder value by blending the unique advantages of our structure and our robust capital position. That includes building the dividend-paying capacity of our bank, managing our 4.66 million share portfolio of Freddie Mac common stock and other strategies such as stock repurchases that may be available.

Our Value Grows Out Of Our
| • | SECURITY: Dividend Yield, Strong Capital Base, Good Asset Quality, Profitable |
| • | GROWTH: Build Retail Bank & Retain Freddie Mac Stock |
| • | CAPITAL MANAGEMENT: Use Freddie Mac Stock & Surplus Capital For Cash Acquisitions, Dividend Payments or Stock Buy Backs |
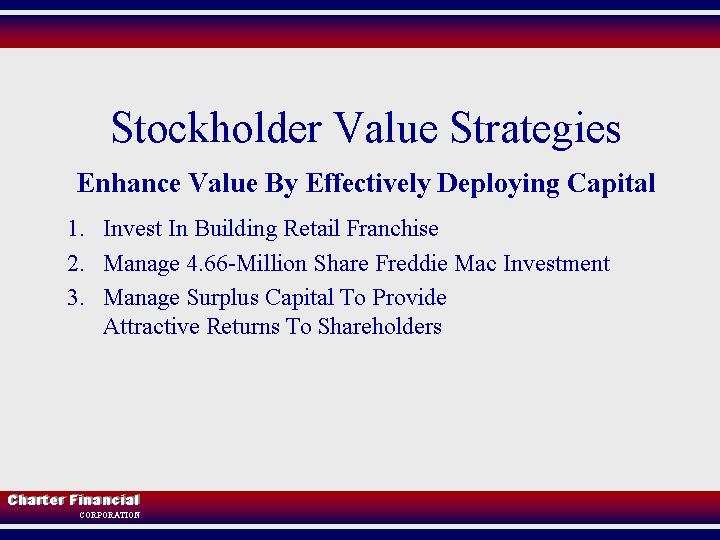
Stockholder Value Strategies
Enhance Value By Effectively Deploying Capital
| 1. | Invest In Building Retail Franchise |
| 2. | Manage 4.66-Million Share Freddie Mac Investment |
| 3. | Manage Surplus Capital To Provide Attractive Returns To Shareholders |
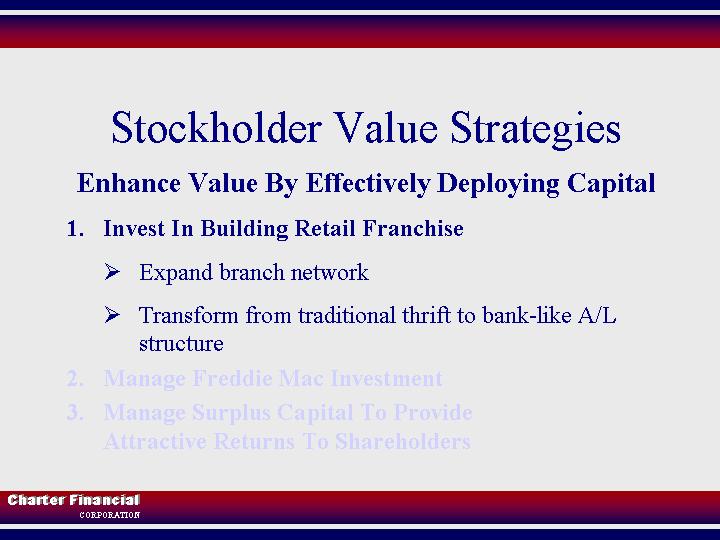
Stockholder Value Strategies
Enhance Value By Effectively Deploying Capital
| 1. | Invest In Building Retail Franchise |
| Ø | Expand branch network |
| Ø | Transform from traditional thrift to bank-like A/L structure |
| 2. | Manage Freddie Mac Investment |
| 3. | Manage Surplus Capital To Provide Attractive Returns To Shareholders |
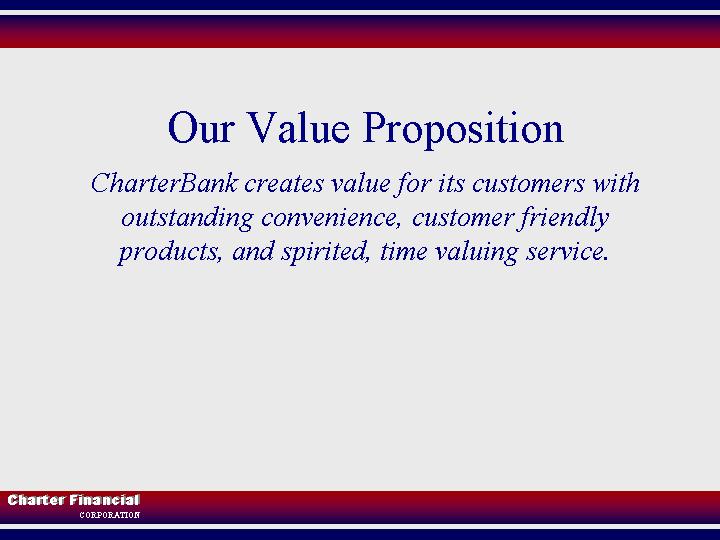
Our Value Proposition
CharterBank creates value for its customers with
outstanding convenience, customer friendly
products, and spirited, time valuing service.
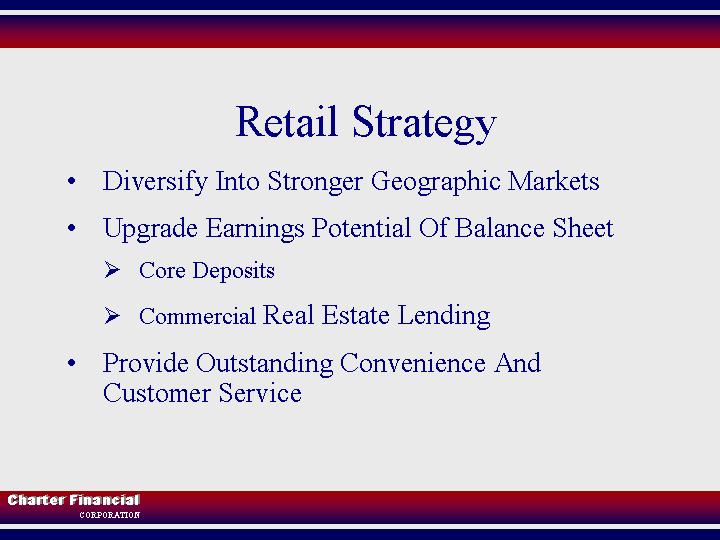
Retail Strategy
| • | Diversify Into Stronger Geographic Markets |
| • | Upgrade Earnings Potential Of Balance Sheet |
| Ø | Core Deposits |
| Ø | Commercial Real Estate Lending |
| • | Provide Outstanding Convenience And Customer Service |
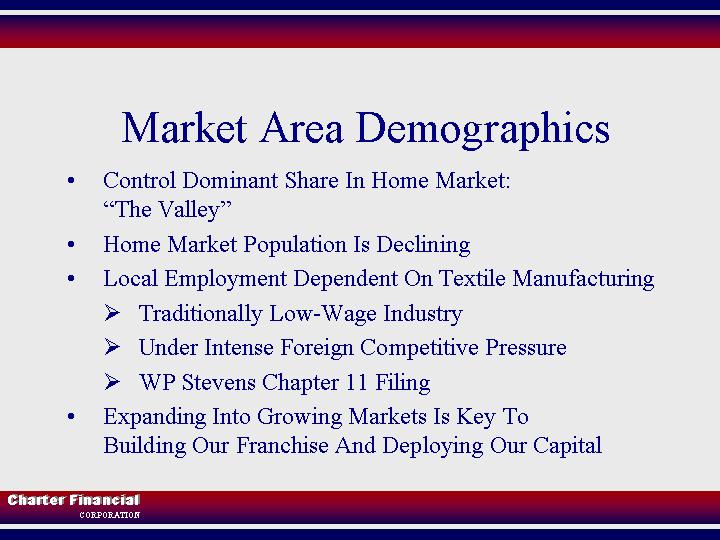
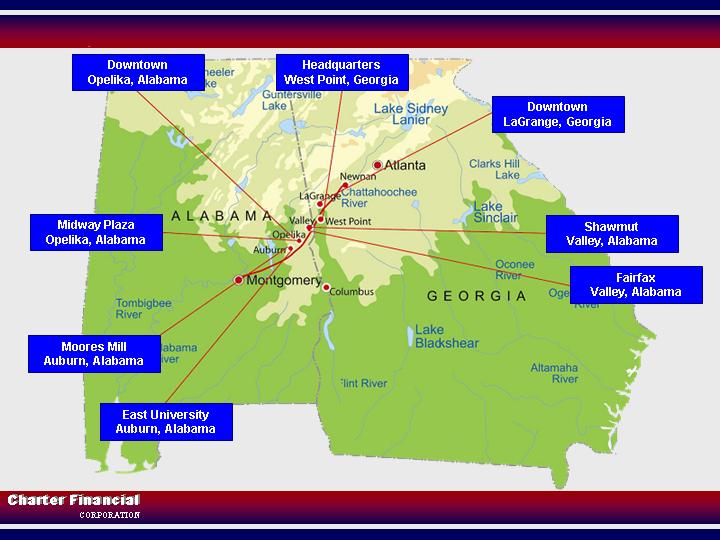
Market Area Demographics
| • | Control Dominant Share In Home Market: “The Valley” |
| • | Home Market Population Is Declining |
| • | Local Employment Dependent On Textile Manufacturing |
| Ø | Traditionally Low-Wage Industry |
| Ø | Under Intense Foreign Competitive Pressure |
| Ø | WP Stevens Chapter 11 Filing |
| • | Expanding Into Growing Markets Is Key To Building Our Franchise And Deploying Our Capital |
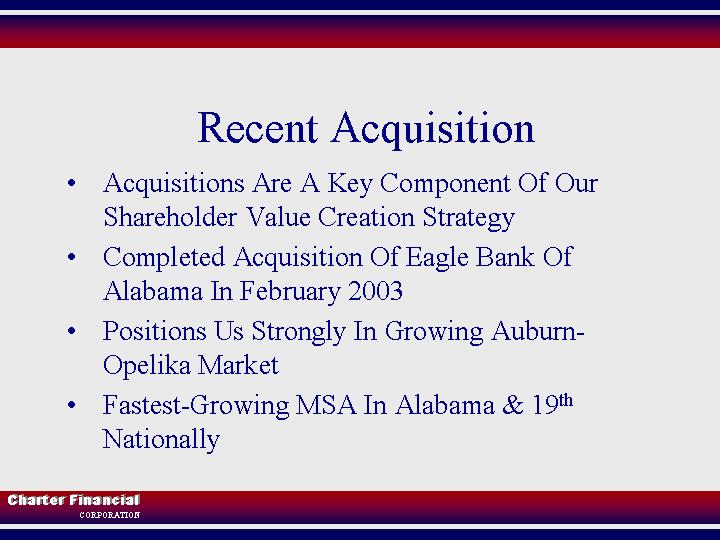
Recent Acquisition
| • | Acquisitions Are A Key Component Of Our Shareholder Value Creation Strategy |
| • | Completed Acquisition Of Eagle Bank Of Alabama In February 2003 |
| • | Positions Us Strongly In Growing Auburn-Opelika Market |
| • | Fastest-Growing MSA In Alabama & 19th Nationally |
[GRAPHIC]
Stockholder Value Strategies
Enhance Value By Effectively Deploying Capital
| 1. | Invest In Building Retail Franchise |
| 2. | Manage Freddie Mac Investment |
| 3. | Manage Surplus Capital To Provide Attractive Returns To Shareholders |
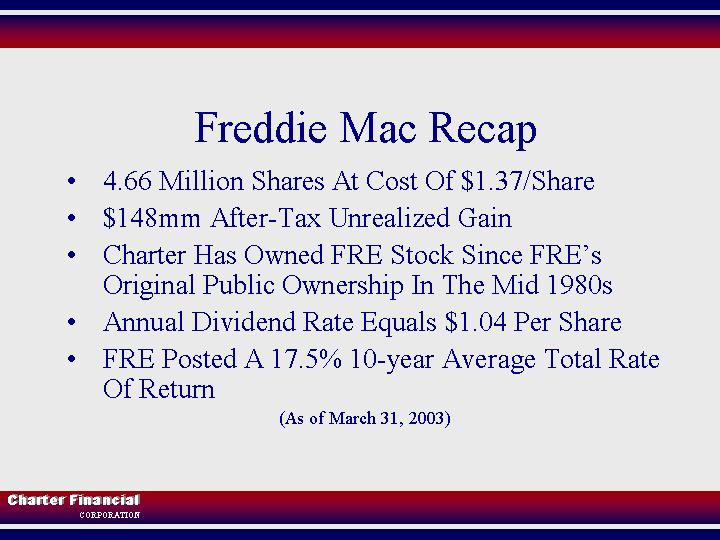
Freddie Mac Recap
| • | 4.66 Million Shares At Cost Of $1.37/Share |
| • | $148mm After-Tax Unrealized Gain |
| • | Charter Has Owned FRE Stock Since FRE’s Original Public Ownership In The Mid 1980s |
| • | Annual Dividend Rate Equals $1.04 Per Share |
| • | FRE Posted A 17.5% 10-year Average Total Rate Of Return |
(As of March 31, 2003)
Importance Of FRE To CHFN
| • | Represents 62% Of Our Capital |
| • | Equals $7.08 Per CHFN Share Net Of Taxes At 38.6% |
| • | $4.8Million Pre-tax Dividend=24 Cents Per CHFN Share |
Manage Freddie Mac Investment
| • | View FRE from Long Term Perspective |
| • | Can It Sustain Long Term Growth Trends? |
| • | Continued Confidence In FRE’s Ability To Generate Earnings & Dividends |
| • | Gain Is Not Hedged—No Current Intent To Hedge Or Sell |
Manage Freddie Mac Investment
| • | Covered Call Pilot On 250,000 Shares |
| • | Long-Term Strategy To Diversify But Have Limited Reinvestment Options |
| • | Balancing Future Value Growth Against Income Recognition |
| • | Equitable To The Insured Bank And To Public And Private (MHC) Shareholders |
Stockholder Value Strategies
Enhance Value By Effectively Deploying Capital
| 1. | Invest In Building Retail Franchise |
| 2. | Manage Freddie Mac Investment |
| 3. | Manage Surplus Capital To Provide Attractive Returns To Shareholders |
$190 Million
Unleveraged Capital
| • | Charter Financial Has $11 Million Cash And Unrealized Gains (after tax) On Freddie Mac Stock Of $54 Million |
**********
| • | CharterBank Regulatory Capital Is $32 Million Over “Well Capitalized” Level |
| • | Bank Has $81 Million Unrealized Gains (after tax) On FRE Stock |
| • | Capital Exceeds Foreseeable Retail Franchise Needs |
(As of March 31, 2003)
Cash Dividends
| • | First Charter MHC Can Waive Right To Cash Dividends |
| • | Paid 10 Cent Quarterly Dividend From June 2002 |
| • | Increased To 20 Cents For June 2003 |
| • | 2.81% Indicated Dividend Yield |
Stock Purchases And Buybacks
| • | Stock Buybacks Reduce Outstanding Shares And Are Evaluated Against Other Capital Management Opportunities |
| • | Program To Purchase Stock For Restricted Stock Plans Recently Completed |
Capital Management Goals
| • | Use MHC Dividend Waiver To Enhance Returns To Minority Shareholders |
| • | Use Capital To Build Earnings |
| • | Use Cash,Not Stock, For Acquisitions to Minimize Share Dilution of Minority Shareholders |
| • | Maintain/Build Stock Liquidity |
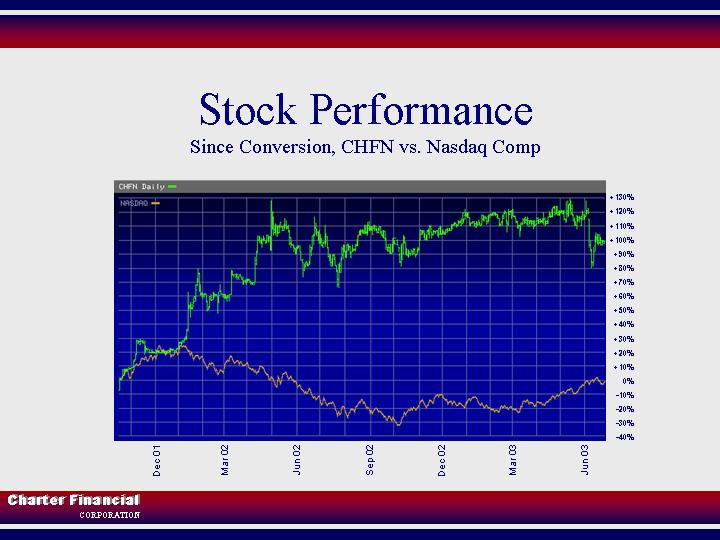
Stock Performance
Since Conversion, CHFN vs. Nasdaq Comp
[GRAPHIC]
Directors
John W. Johnson, Jr.* | Jane W. Darden1 | |
Robert L. Johnson | Thomas M. Lane3 | |
David Z. Cauble, III2 | William B. Hudson4 |
| * | Chairman of the Board |
| 1 | Executive Committee Chairman |
| 2 | Audit Committee Chairman |
| 3 | Compensation Committee Chairman |
| 4 | Nominating Committee Chairman |
Executive Officers
John W. Johnson, Jr., Chairman Of The Board
Robert L. Johnson, President And Chief Executive Officer
Lee Washam, Executive Vice President
Curtis R. Kollar, Chief Financial Officer
William C. Gladden, Vice President And Secretary
[GRAPHIC]
Financial Performance
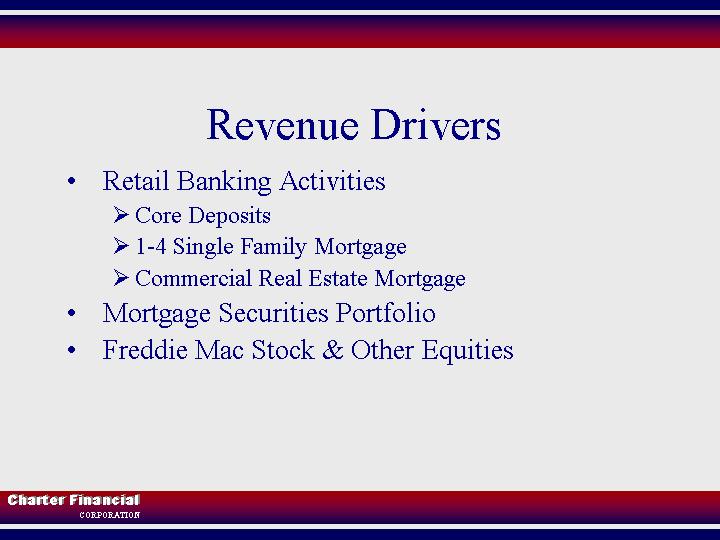
Revenue Drivers
| • | Retail Banking Activities |
| Ø | Core Deposits |
| Ø | 1-4 Single Family Mortgage |
| Ø | Commercial Real Estate Mortgage |
| • | Mortgage Securities Portfolio |
| • | Freddie Mac Stock & Other Equities |
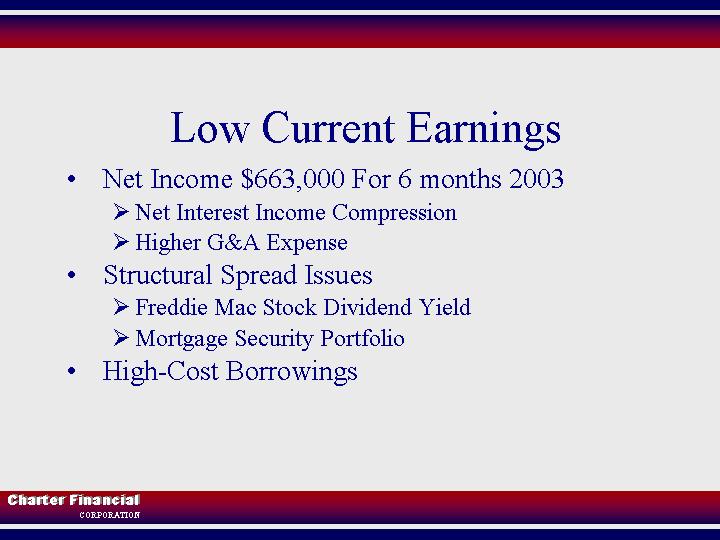
Low Current Earnings
| • | Net Income $663,000 For 6 months 2003 |
| Ø | Net Interest Income Compression |
| Ø | Higher G&A Expense |
| • | Structural Spread Issues |
| Ø | Freddie Mac Stock Dividend Yield |
| Ø | Mortgage Security Portfolio |
| • | High-Cost Borrowings |
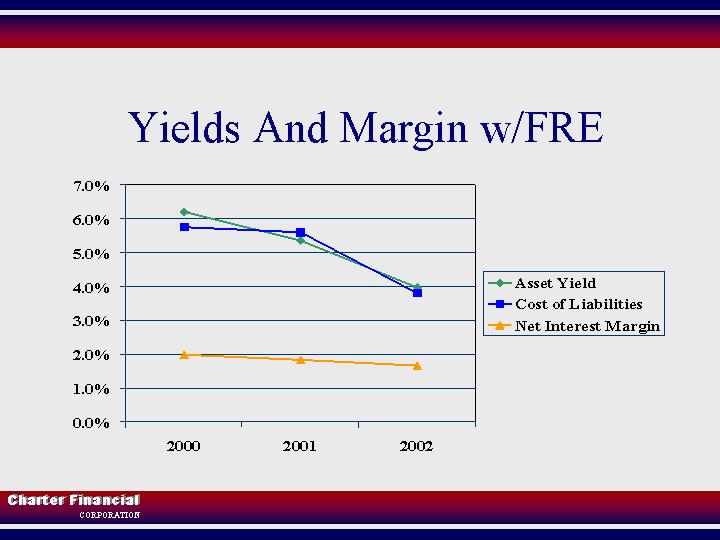
Yields And Margin w/FRE
[GRAPHIC]
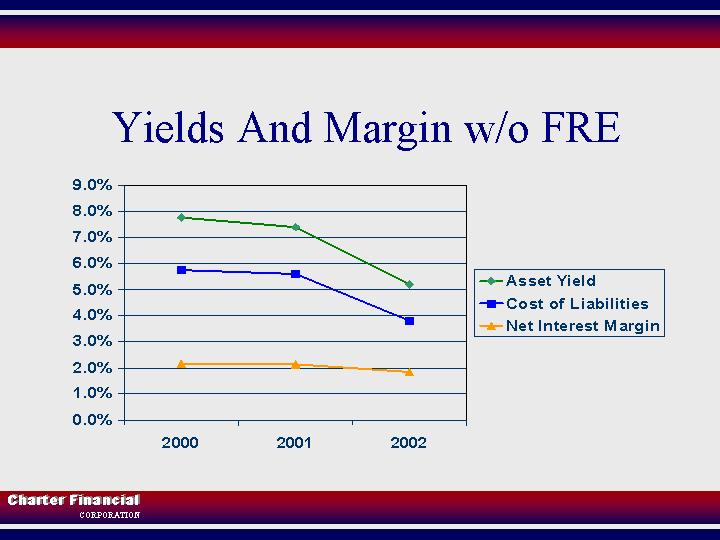
Yields And Margin w/o FRE
[GRAPHIC]
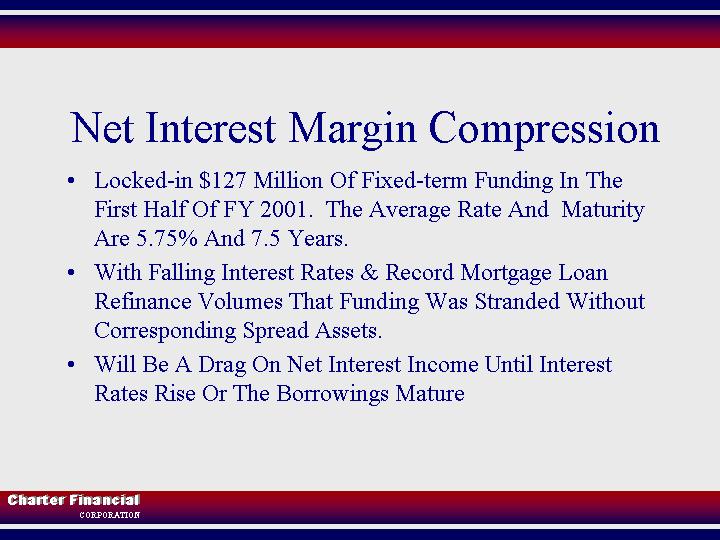
Net Interest Margin Compression
| • | Locked-in $127 Million Of Fixed-term Funding In The First Half Of FY 2001. The Average Rate And Maturity Are 5.75% And 7.5 Years. |
| • | With Falling Interest Rates & Record Mortgage Loan Refinance Volumes That Funding Was Stranded Without Corresponding Spread Assets. |
| • | Will Be A Drag On Net Interest Income Until Interest Rates Rise Or The Borrowings Mature |
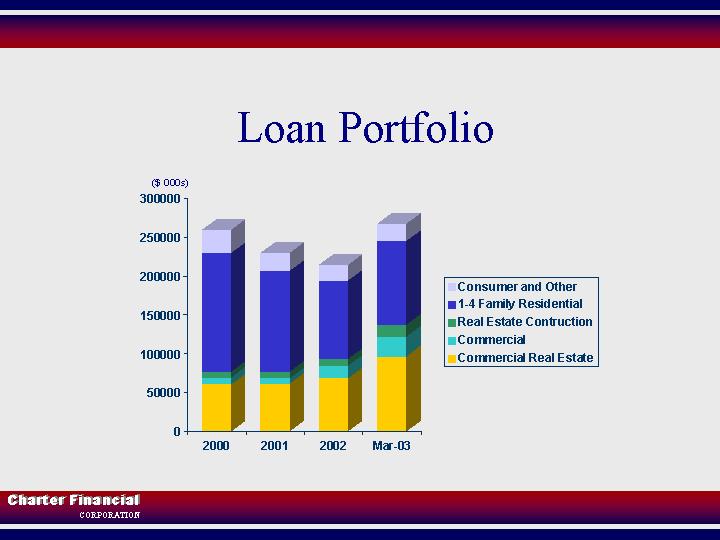
Loan Portfolio
[GRAPHIC]
Loan Quality
| • | Loan Portfolio is Primarily Secured by Real Estate |
| • | Reserve Coverage is 155% of Non-performing Assets |
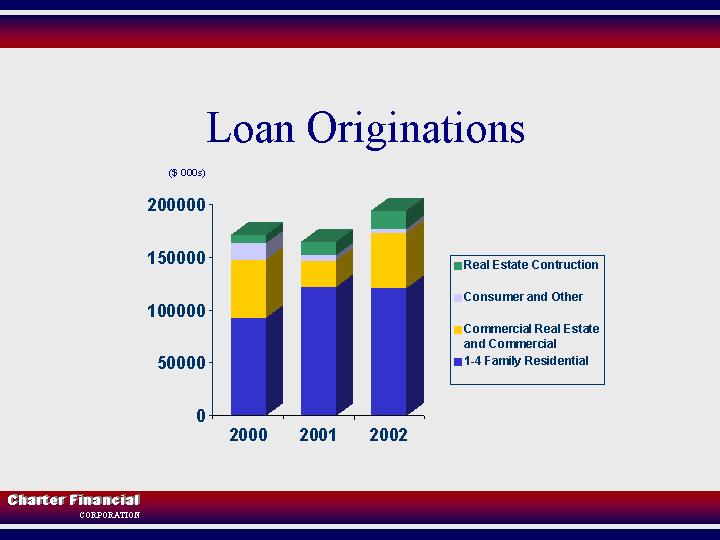
Loan Originations
[GRAPHIC]
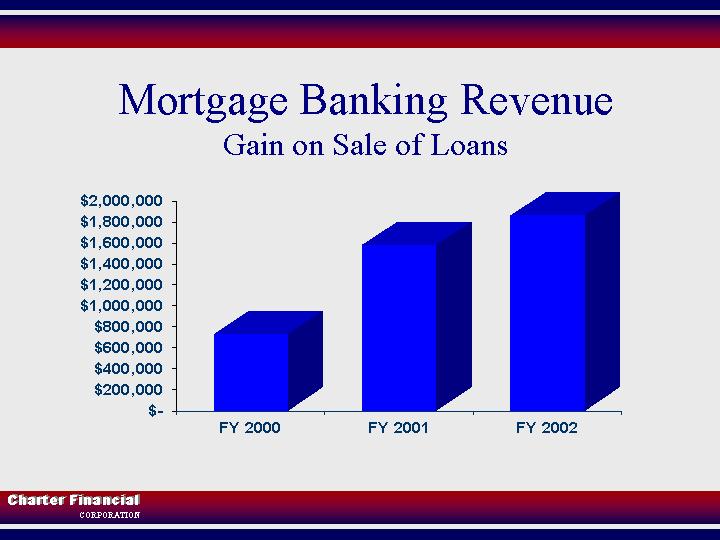
Mortgage Banking Revenue
Gain on Sale of Loans
[GRAPHIC]
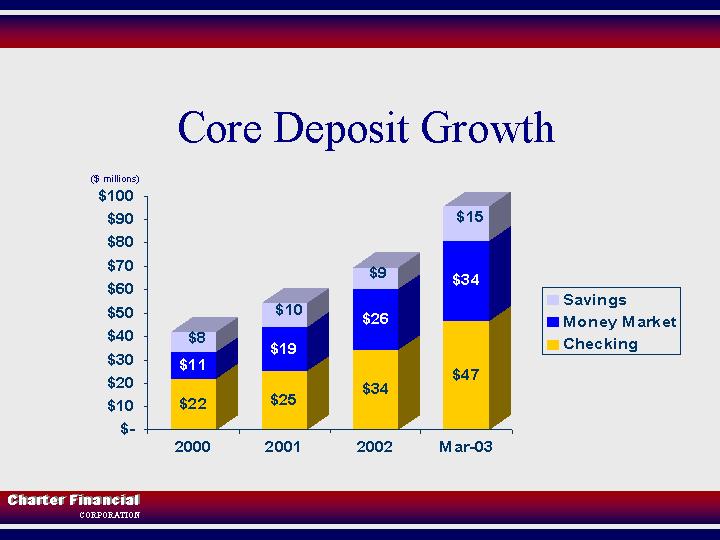
Core Deposit Growth
[GRAPHIC]
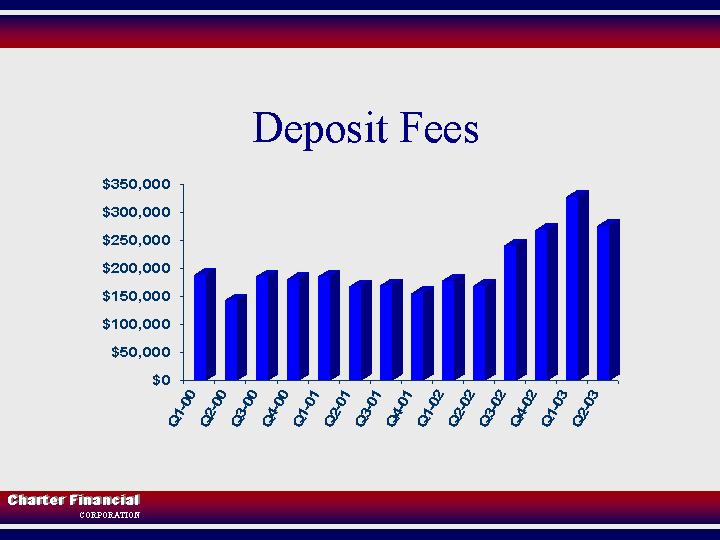
Deposit Fees
[GRAPHIC]
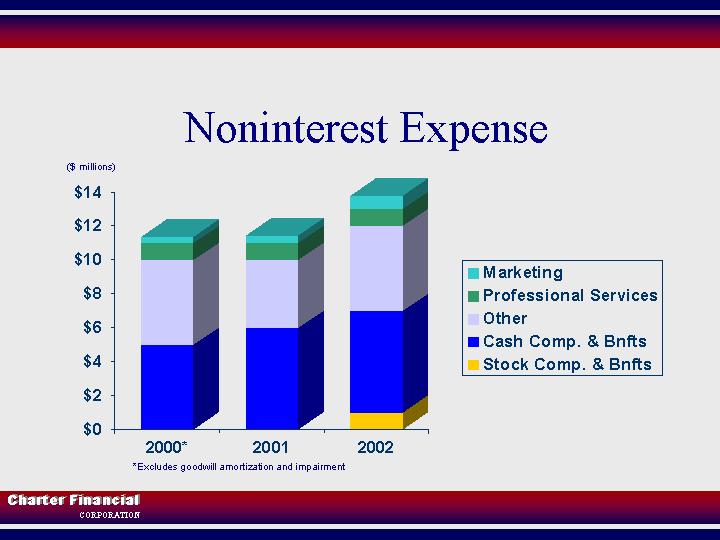
Noninterest Expense
[GRAPHIC]
*Excludes goodwill amortization and impairment
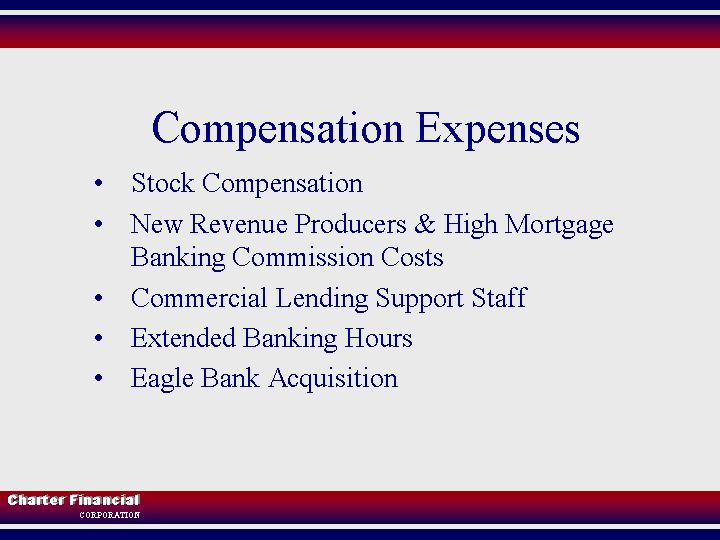
Compensation Expenses
| • | Stock Compensation |
| • | New Revenue Producers & High Mortgage Banking Commission Costs |
| • | Commercial Lending Support Staff |
| • | Extended Banking Hours |
| • | Eagle Bank Acquisition |
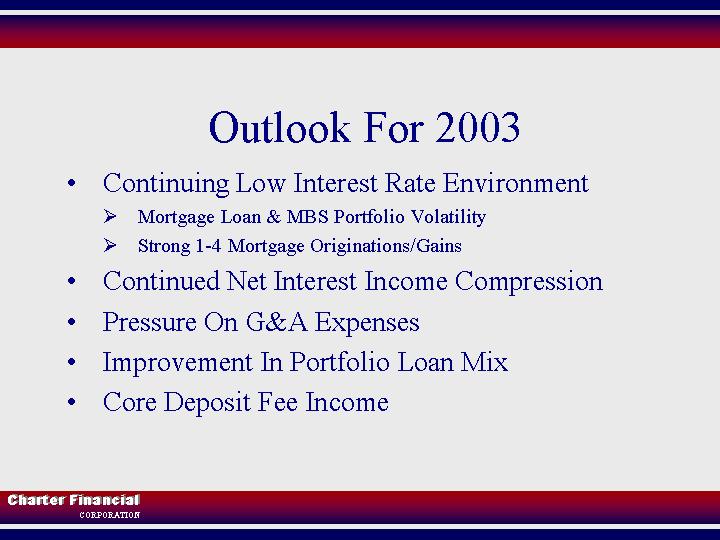
Outlook For 2003
| • | Continuing Low Interest Rate Environment |
| Ø | Mortgage Loan & MBS Portfolio Volatility |
| Ø | Strong 1-4 Mortgage Originations/Gains |
| • | Continued Net Interest Income Compression |
| • | Pressure On G&A Expenses |
| • | Improvement In Portfolio Loan Mix |
| • | Core Deposit Fee Income |
Stockholder Value Strategies
Enhance Value By Effectively Deploying Capital
| 1. | Invest In Building Retail Franchise |
| 2. | Manage Freddie Mac Investment |
| 3. | Manage Surplus Capital To Provide Attractive Returns To Shareholders |
Our Value Grows Out Of Our
| • | SECURITY: Dividend Yield, Strong Capital Base, Good Asset Quality, Profitable |
| • | GROWTH: Build Retail Bank & Retain Freddie Mac Stock |
| • | CAPITAL MANAGEMENT: Use Freddie Mac Stock & Surplus Capital For Cash Acquisitions, Dividend Payments or Stock Buy Backs |
[GRAPHIC]
Financial Performance