EXHIBIT 99.1
|
Charter Financial
CORPORATION
Investor Presentation
February 2011
1
|
Forward Looking Statement
This presentation and the accompanying commentary may contain “forward-looking statements” that may be identified by use of such words as “believe,” “expect,” “anticipate,” “should,” “planned,” “estimated,” and “potential.” Examples of forward-looking statements include, but are not limited to, estimates with respect to our financial condition and results of operation and business that are subject to various factors that could cause actual results to differ materially from these estimates. These factors include but are not limited to general and local economic conditions; changes in interest rates, deposit flows, demand for mortgages and other loans, real estate values, and competition; changes in accounting principles, policies, or guidelines; changes in legislation or regulation; and other economic, competitive, governmental, regulatory, and technological factors affecting our operations, pricing, products, and services. Any or all forward-looking statements in this release and in any other public statements we make may turn out to be wrong. They can be affected by inaccurate assumptions we might make or known or unknown risks and uncertainties.
Consequently, no forward-looking statements can be guaranteed. The Company disclaims any obligation to subsequently revise any forward- looking statements to reflect events or circumstances after the date of such statements or to reflect the occurrence of anticipated or unanticipated events.
Charter Financial
CORPORATION
2
|
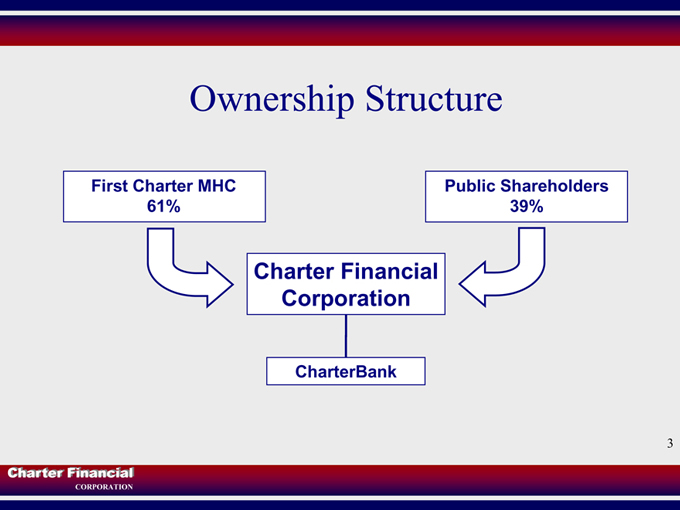
Ownership Structure
First Charter MHC 61%
Public Shareholders 39%
Charter Financial Corporation
CharterBank
Charter Financial
CORPORATION
3
|
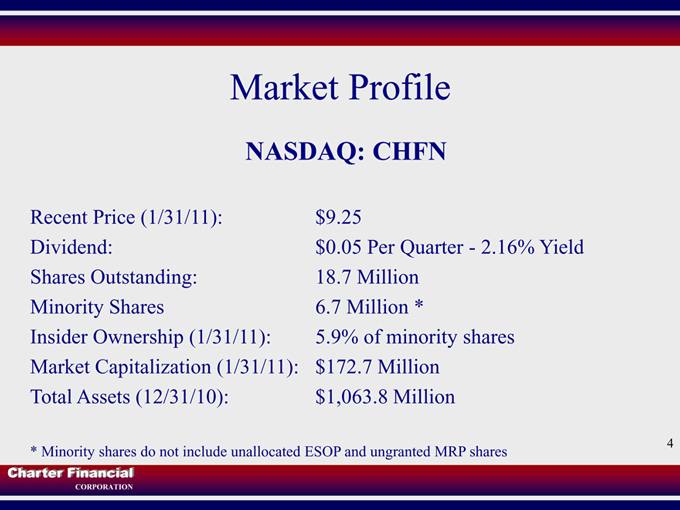
Market Profile
NASDAQ: CHFN
Recent Price (1/31/11): Dividend: Shares Outstanding: Minority Shares Insider Ownership (1/31/11): Market Capitalization (1/31/11): Total Assets (12/31/10):
$9.25
$0.05 Per Quarter - 2.16% Yield
18.7 Million
6.7 Million *
5.9% of minority shares $172.7 Million $1,063.8 Million
* Minority shares do not include unallocated ESOP and ungranted MRP shares
Charter Financial
CORPORATION
4
|
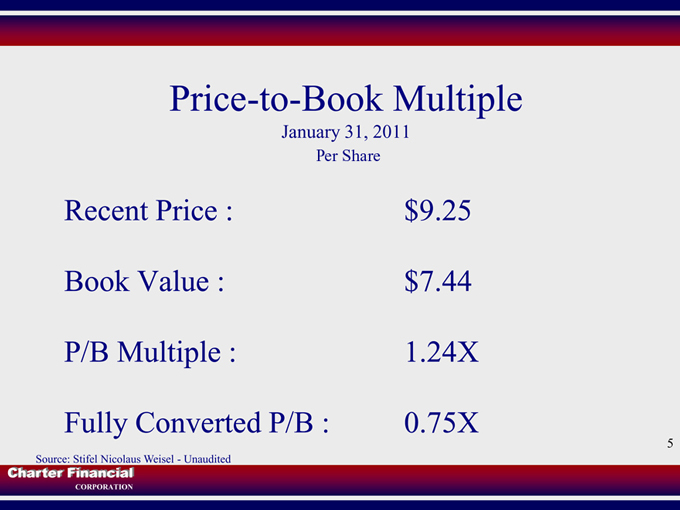
Price-to-Book Multiple
January 31, 2011
Recent Price : $9.25
Book Value : $7.44
P/B Multiple : 1.24X
Fully Converted P/B : 0.75X
Source: Stifel Nicolaus Weisel - Unaudited
Charter Financial
CORPORATION
5
|
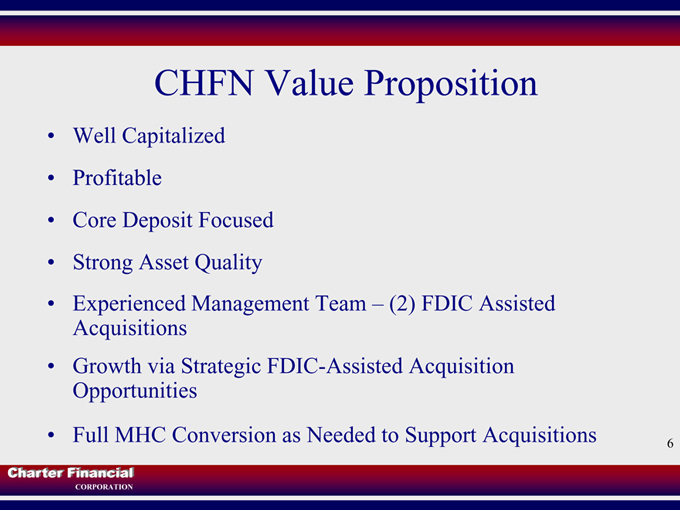
CHFN Value Proposition
• Well Capitalized Profitable
• Core Deposit Focused
• Strong Asset Quality
• Experienced Management Team – (2) FDIC Assisted Acquisitions
• Growth via Strategic FDIC-Assisted Acquisition Opportunities
• Full MHC Conversion as Needed to Support Acquisitions
Charter Financial
CORPORATION
6
|
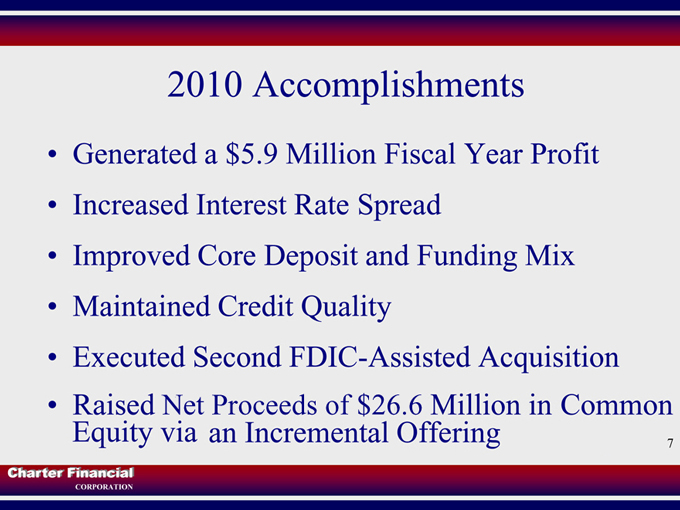
2010 Accomplishments
• Generated a $5.9 Million Fiscal Year Profit
• Increased Interest Rate Spread
• Improved Core Deposit and Funding Mix
• Maintained Credit Quality
• Executed Second FDIC-Assisted Acquisition
• Raised an Incremental Net Proceeds of $26.6 Million Offering in Common Equity via
Charter Financial
CORPORATION
7
|
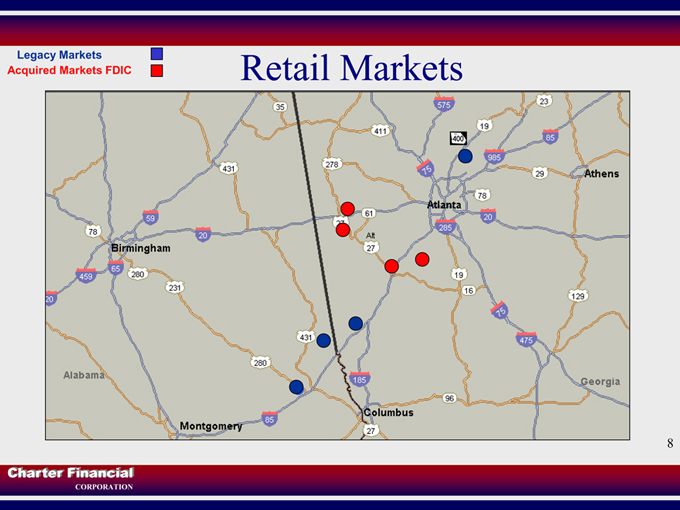
Retail Markets
Legacy Markets Acquired Markets FDIC
Birmingham
Athens
Atlanta
Columbus
Alabama
Georgia
Montgomery
Charter Financial
CORPORATION
8
|
Market Conditions
• KIA Motors Assembly Plant and Related Suppliers
• BRAC – Fort Benning
• Selective Lending Opportunities – Few Qualified Borrowers Seeking Loans
• Opportunities for FDIC-Assisted Acquisitions
Charter Financial
CORPORATION
9
|
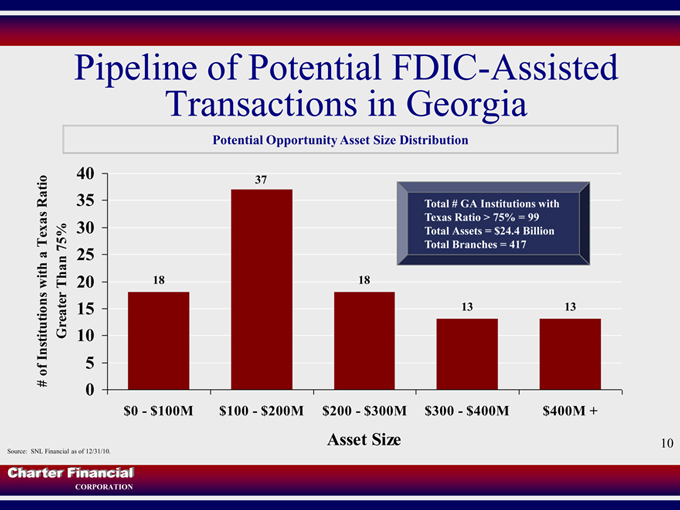
Pipeline of Potential FDIC-Assisted Transactions in Georgia
Potential Opportunity Asset Size Distribution
# of Institutions with a Texas Ratio Greater Than 75%
40 35 30 25 20 15 10 5 0
18
37
18
13
13
Total # GA Institutions with Texas Ratio > 75% = 99 Total Assets = $24.4 Billion Total Branches = 417
$0 - $100M $100 - $200M $200 - $300M $300 - $400M $400M +
Asset Size
Source: SNL Financial as of 12/31/10.
Charter Financial
CORPORATION
10
|
FDIC-Assisted Acquisitions
•Benefits
• Opportunity to Strategically Grow Franchise
• Can Generate Sizeable Bargain Purchase Gain
• Substantial Source of Cash
•Difficulties
• Limited Due Diligence
• Liquidation of Nonperforming Covered Assets
• Infrastructure and Management
• Distorts Financial Results and Reporting
Charter Financial
CORPORATION
11
|
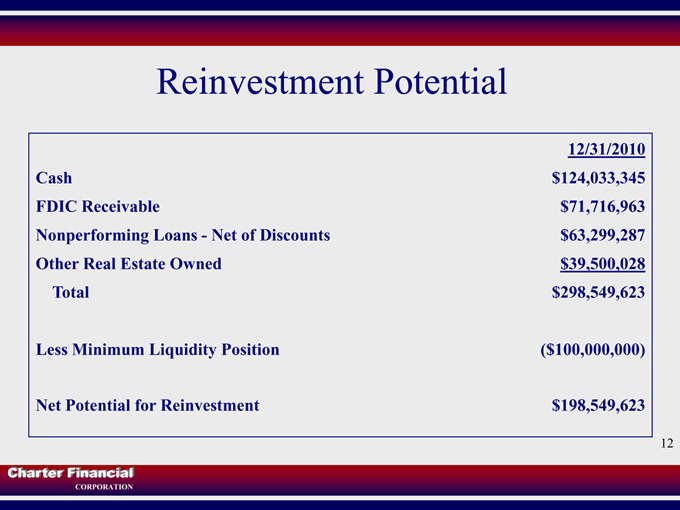
Reinvestment Potential
12/31/2010
Cash $124,033,345
FDIC Receivable $71,716,963
Nonperforming Loans - Net of Discounts $63,299,287
Other Real Estate Owned $39,500,028
Total $298,549,623
Less Minimum Liquidity Position ($100,000,000)
Net Potential for Reinvestment $198,549,623
Charter Financial
CORPORATION
12
|
Charter Financial
CORPORATION
Financial Performance
13
|
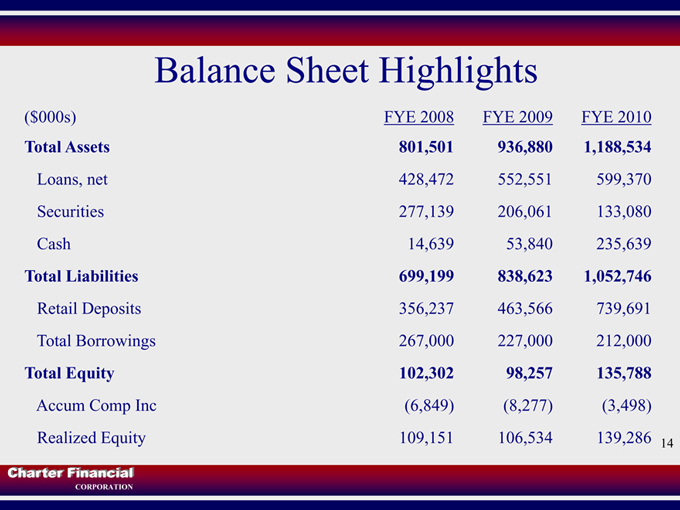
Balance Sheet Highlights
($000s) FYE 2008 FYE 2009 FYE 2010
Total Assets 801,501 936,880 1,188,534
Loans, net 428,472 552,551 599,370
Securities 277,139 206,061 133,080
Cash 14,639 53,840 235,639
Total Liabilities 699,199 838,623 1,052,746
Retail Deposits 356,237 463,566 739,691
Total Borrowings 267,000 227,000 212,000
Total Equity 102,302 98,257 135,788
Accum Comp Inc (6,849) (8,277) (3,498)
Realized Equity 109,151 106,534 139,286
Charter Financial
CORPORATION
14
|
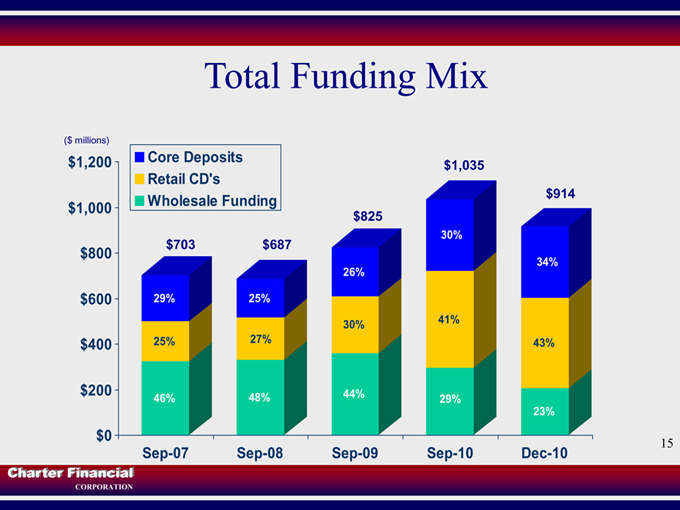
Total Funding Mix
($ millions)
$1,200 $1,000 $800 $600 $400 $200 $0
Core Deposits Retail CD’s Wholesale Funding
Sep-07 Sep-08 Sep-09 Sep-10 Dec-10
$703
29%
25%
46%
$687
25%
27%
48%
$825 26% 30% 44%
$1,035 30% 41% 29%
$914 34% 43% 23%
15
Charter Financial
CORPORATION
|
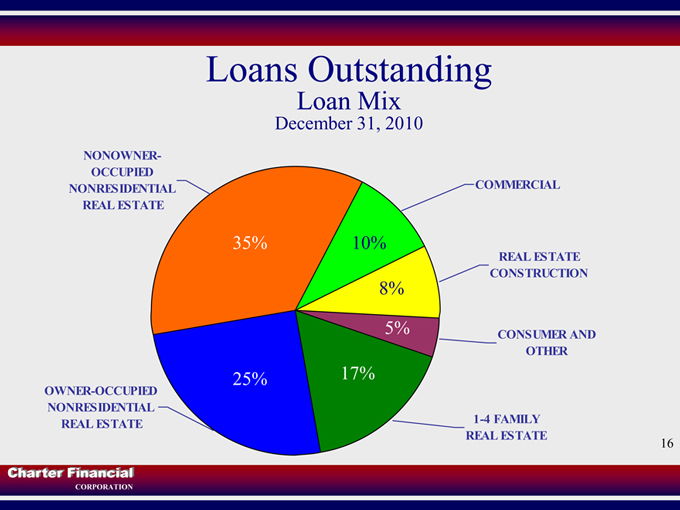
Loans Outstanding
Loan Mix
December 31, 2010
NONOWNER-OCCUPIED
NONRESIDENTIAL REAL ESTATE
OWNER-OCCUPIED NONRESIDENTIAL
REAL ESTATE
COMMERICAL
REAL ESTATE CONSTRUCTION
CONSUMER AND OTHER
1-4 FAMILY
REAL ESTATE
35%
25%
10%
8%
5%
17%
Charter Financial
CORPORATION
16
|
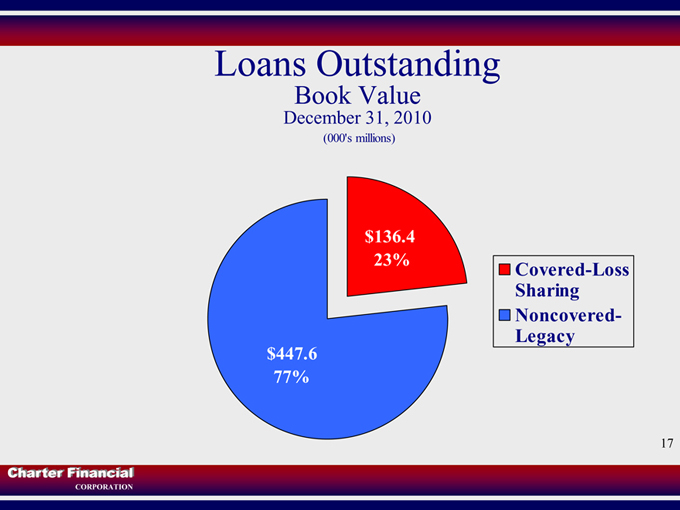
Loans Outstanding
Book Value
December 31, 2010
(000’s millions)
Covered-Loss Sharing Noncovered-Legacy
$136.4 23%
$447.6 77%
Charter Financial
CORPORATION
17
|
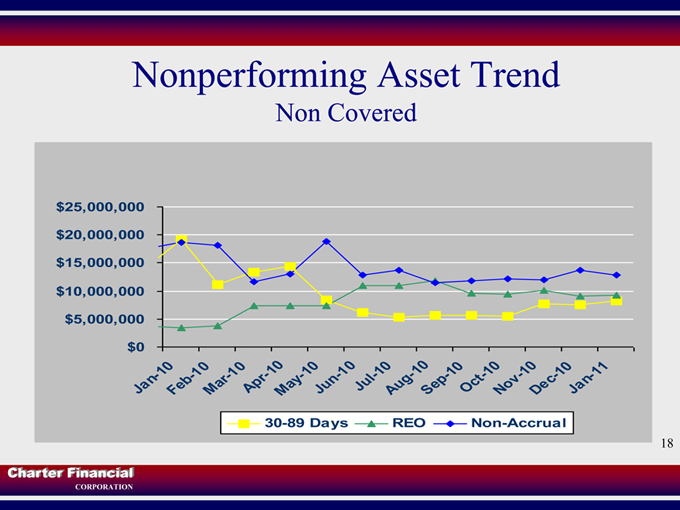
Nonperforming Asset Trend
Non Covered
$25,000,000 $20,000,000 $15,000,000 $10,000,000 $5,000,000 $0
Jan-10 Feb-10 Mar-10 Apr-10 May-10 Jun-10 Jul-10 Aug-10 Sep-10 Oct-10 Nov-10 Dec-10 Jan-11
30-89 Days REO Non-Accrual
Charter Financial
CORPORATION
18
|
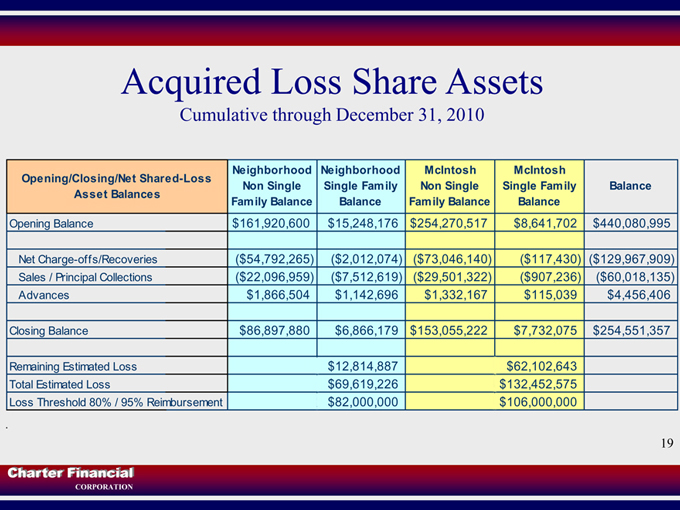
Acquired Loss Share Assets
Cumulative through December 31, 2010
Opening/Closing/Net Shared-Loss Asset Balances
Neighborhood Non Single Family Balance
Neighborhood Single Family Balance
McIntosh Non Single Family Balance
McIntosh Single Family Balance
Balance
Opening Balance $161,920,600 $15,248,176 $254,270,517 $8,641,702 $440,080,995
Net Charge-offs/Recoveries ($54,792,265) ($2,012,074) ($73,046,140) ($117,430) ($129,967,909)
Sales / Principal Collections ($22,096,959) ($7,512,619) ($29,501,322) ($907,236) ($60,018,135)
Advances $1,866,504 $1,142,696 $1,332,167 $115,039 $4,456,406
Closing Balance $86,897,880 $6,866,179 $153,055,222 $7,732,075 $254,551,357
Remaining Estimated Loss $12,814,887 $62,102,643
Total Estimated Loss $69,619,226 $132,452,575
Loss Threshold 80% / 95% Reimbursement $82,000,000 $106,000,000
Charter Financial
CORPORATION
19
|
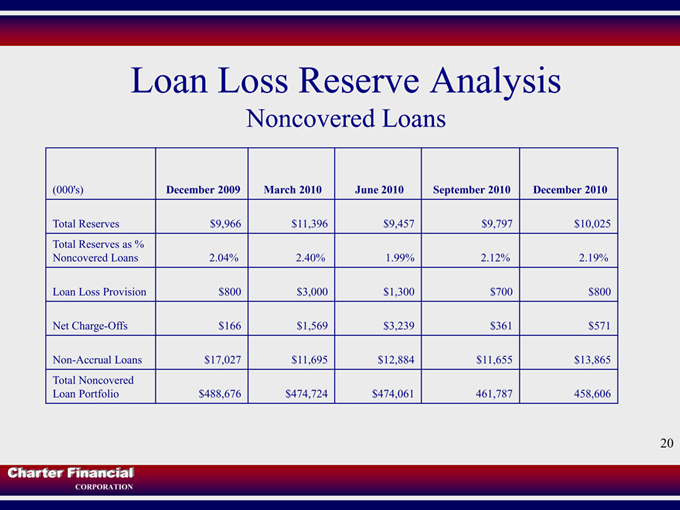
Loan Loss Reserve Analysis
Noncovered Loans
(000’s) December 2009 March 2010 June 2010 September 2010 December 2010
Total Reserves $9,966 $11,396 $9,457 $9,797 $10,025
Total Reserves as %
Noncovered Loans 2.04% 2.40% 1.99% 2.12% 2.19%
Loan Loss Provision $800 $3,000 $1,300 $700 $800
Net Charge-Offs $166 $1,569 $3,239 $361 $571
Non-Accrual Loans $17,027 $11,695 $12,884 $11,655 $13,865
Total Noncovered
Loan Portfolio $488,676 $474,724 $474,061 461,787 458,606
20
Charter Financial
CORPORATION
|

Income Statement Highlights
($000s) FY 2008 FY 2009 FY 2010
Net Interest Income 19,606 17,960 27,201
Provision for Loan Losses 3,250 4,550 5,800
Provision for Loan Losses 0 0 420
on Covered Assets
Noninterest Income 18,950 11,792 17,510
Noninterest Expense 20,284 22,581 30,469
Income Tax Expense 4,491 306 2,087
Net Income 10,531 2,315 5,935
Fully Diluted EPS $.55 $.12 $.32
21
Charter Financial
CORPORATION
|
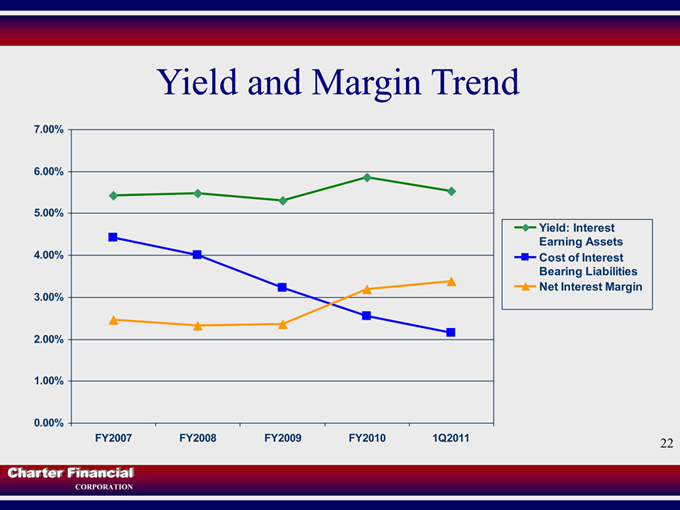
Yield and Margin Trend
7.00%
6.00%
5.00%
4.00%
3.00%
2.00%
1.00%
0.00%
FY2007 FY2008 FY2009 FY2010 1Q2011
Yield: Interest Earning Assets Cost of Interest Bearing Liabilities Net Interest Margin
Charter Financial
CORPORATION
22
|
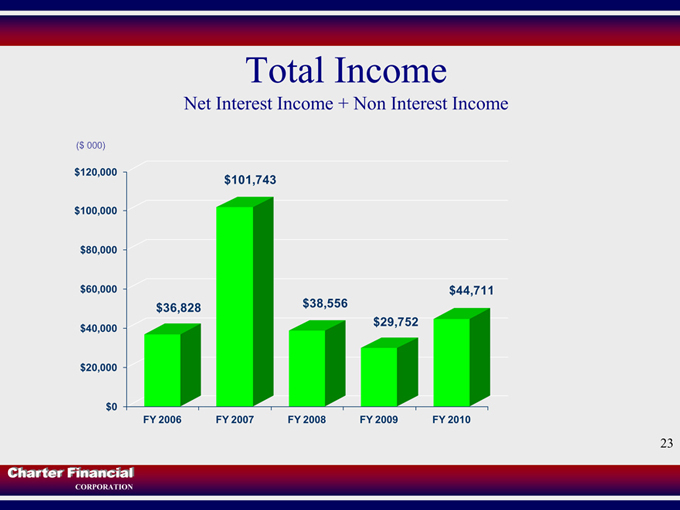
Total Income
Net Interest Income + Non Interest Income
($ 000) $120,000 $100,000 $80,000 $60,000 $40,000 $20,000 $0
FY 2006 FY 2007 FY 2008 FY 2009 FY 2010
$101,743
$44,711 $36,828 $38,556 $29,752
Charter Financial
CORPORATION
23
|
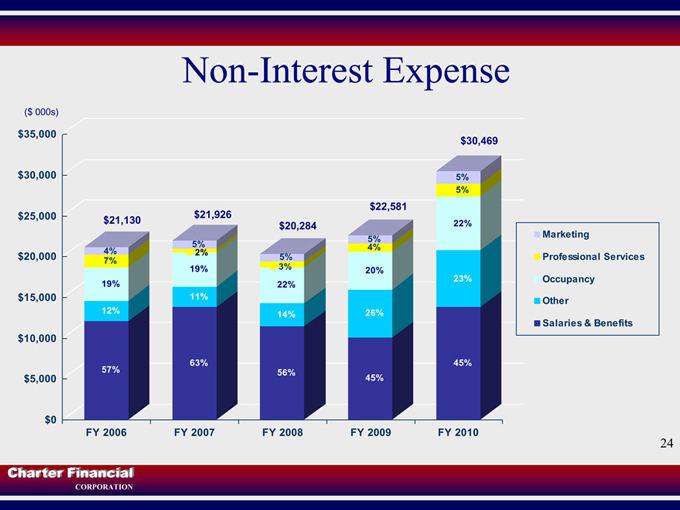
Non-Interest Expense
($ 000s) $35,000
$30,000
$25,000
$20,000
$15,000
$10,000
$5,000
$0
$21,130
4% 7%
19%
12%
57%
FY 2006
$21,926
5% 2% 19%
11% 63% FY 2007
$20,284
5% 3%
22%
14%
56%
FY 2008
$22,581
4% 5% 20%
26% 45% FY 2009
$30,469
5% 5%
22% 23% 45% FY 2010
Marketing
Professional Services Occupancy Other Salaries & Benefits
Charter Financial
CORPORATION
24
|
Future Challenges
• Deal with Challenging Conditions Including Loan Loss Mitigation
• Consider Strategic FDIC-Assisted Acquisitions
• Enhance Management Infrastructure while Controlling Expenses
• Convert Loss Share Assets to Cash
• Invest Cash Effectively while Maintaining Credit Quality
• Comply with Dodd-Frank Act 25
Charter Financial
CORPORATION
|
Charter Financial
CORPORATION