I have
UNITED STATES SECURITIES AND EXCHANGE COMMISSION
Washington, D.C. 20549
FORM 10-K
ANNUAL REPORT PURSUANT TO SECTION 13 OR 15(d) OF THE
SECURITIES EXCHANGE ACT OF 1934
For year ended December 31, 2024
Commission file number 001-16407
ZIMMER BIOMET HOLDINGS, INC.
(Exact name of registrant as specified in its charter)
| | |
Delaware | | 13-4151777 |
(State of Incorporation) | | (IRS Employer
Identification No.) |
| | |
345 East Main Street Warsaw, Indiana | | 46580 |
(Address of principal executive offices) | | (Zip Code) |
Registrant’s telephone number, including area code: (574) 373-3333
Securities registered pursuant to Section 12(b) of the Act:
| | |
Title of each class | Trading Symbol(s) | Name of each exchange on which registered |
Common Stock, $0.01 par value | ZBH | New York Stock Exchange |
2.425% Notes due 2026 1.164% Notes due 2027 | ZBH 26 ZBH 27 | New York Stock Exchange New York Stock Exchange |
3.518% Notes due 2032 | ZBH 32 | New York Stock Exchange |
Securities registered pursuant to Section 12(g) of the Act: None
.
Indicate by check mark if the registrant is a well-known seasoned issuer, as defined in Rule 405 of the Securities Act.
Yes ☒ No ☐
Indicate by check mark if the registrant is not required to file reports pursuant to Section 13 or Section 15(d) of the Act.
Yes ☐ No ☒
Indicate by check mark whether the registrant (1) has filed all reports required to be filed by Section 13 or 15(d) of the Securities Exchange Act of 1934 during the preceding 12 months (or for such shorter period that the registrant was required to file such reports), and (2) has been subject to such filing requirements for the past 90 days. Yes ☒ No ☐
Indicate by check mark whether the registrant has submitted electronically every Interactive Data File required to be submitted pursuant to Rule 405 of Regulation S-T (§ 232.405 of this chapter) during the preceding 12 months (or for such shorter period that the registrant was required to submit such files). Yes ☒ No ☐
Indicate by checkmark whether the registrant is a large accelerated filer, an accelerated filer, a non-accelerated filer, a smaller reporting company or an emerging growth company. See the definitions of “large accelerated filer”, “accelerated filer”, “smaller reporting company,” and “emerging growth company” in Rule 12b-2 of the Exchange Act.
| | | | |
Large accelerated filer | ☒ |
| Accelerated filer | ☐ |
Non-accelerated filer | ☐ | | Smaller reporting company | ☐ |
| | | Emerging growth company | ☐ |
If an emerging growth company, indicate by check mark if the registrant has elected not to use the extended transition period for complying with any new or revised financial accounting standards provided pursuant to Section 13(a) of the Exchange Act. ☐
Indicate by check mark whether the registrant has filed a report on and attestation to its management’s assessment of the effectiveness of its internal control over financial reporting under Section 404(b) of the Sarbanes-Oxley Act (15 U.S.C. 7262(b)) by the registered public accounting firm that prepared or issued its audit report. ☒
If securities are registered pursuant to Section 12(b) of the Act, indicate by check mark whether the financial statements of the registrant included in the filing reflect the correction of an error to previously issued financial statements. ☐
Indicate by check mark whether any of those error corrections are restatements that required a recovery analysis of incentive-based compensation received by any of the registrant’s executive officers during the relevant recovery period pursuant to §240.10D-1(b). ☐
Indicate by check mark whether the registrant is a shell company (as defined in Rule 12b-2 of the Act). Yes ☐ No ☒
The aggregate market value of shares held by non-affiliates was $22,228,595,506 (based on the closing price of these shares on the New York Stock Exchange on June 28, 2024 and assuming solely for the purpose of this calculation that all directors and executive officers of the registrant are “affiliates”). As of February 14, 2025, 199,063,164 shares of the registrant’s $.01 par value common stock were outstanding.
Documents Incorporated by Reference
| | |
Document | | Form 10-K |
Portions of the Proxy Statement with respect to the 2025 Annual Meeting of Stockholders | | Part III |
ZIMMER BIOMET HOLDINGS, INC.
ANNUAL REPORT
Cautionary Note Regarding Forward-Looking Statements
This Annual Report contains forward-looking statements within the meaning of federal securities laws, including, among others, statements regarding sales and earnings guidance and any statements about our expectations, plans, intentions, strategies or prospects. We generally use the words “may,” “will,” “expects,” “believes,” “anticipates,” “plans,” “estimates,” “projects,” “assumes,” “guides,” “targets,” “forecasts,” “sees,” “seeks,” “should,” “could,” “would,” “predicts,” “potential,” “strategy,” “future,” “opportunity,” “work toward,” “intends,” “guidance,” “confidence,” “positioned,” “design,” “strive,” “continue,” “look forward to” and similar expressions to identify forward-looking statements. All statements other than statements of historical or current fact are, or may be deemed to be, forward-looking statements. Such statements are based upon the current beliefs, expectations and assumptions of management and are subject to significant risks, uncertainties and changes in circumstances that could cause actual outcomes and results to differ materially from the forward-looking statements. These risks, uncertainties and changes in circumstances include, but are not limited to: competition; pricing pressures; dependence on new product development, technological advances and innovation; changes in customer demand for our products and services caused by demographic changes, obsolescence, development of different therapies or other factors; our ability to attract, retain, develop and maintain adequate succession plans for the highly skilled employees, senior management, independent agents and distributors we need to support our business; shifts in the product category or regional sales mix of our products and services; the risks and uncertainties related to our ability to successfully execute our restructuring plans; control of costs and expenses; risks related to the satisfaction of the conditions to closing the proposed transaction with Paragon 28 (including the failure to obtain necessary regulatory approvals) in the anticipated timeframe or at all, including uncertainties as whether the stockholders of Paragon 28 will approve the proposed transaction and the possibility that the proposed transaction does not close; risks related to the ability to realize the anticipated benefits of the proposed transaction with Paragon 28, including the possibility that the expected benefits from the proposed transaction will not be realized or will not be realized within the expected time period; the risk that the businesses of Paragon 28, if the proposed transaction closes will not be integrated successfully; disruption from the proposed transaction making it more difficult to maintain business and operational relationships, including with customers, vendors, service providers, independent sales representatives, agents or agencies; the effects of business disruptions affecting us, our suppliers, customers or payors, either alone or in combination with other risks on our business and operations; the risks and uncertainties related to our ability to successfully integrate the operations, products, employees and distributors of acquired companies; the effect of the potential disruption of management’s attention from ongoing business operations due to integration matters related to mergers and acquisitions; the effect of mergers and acquisitions on our relationships with customers, suppliers and lenders and on our operating results and businesses generally; unplanned delays, disruptions and expenses attributable to our enterprise resource planning and other system updates; the ability to form and implement alliances; dependence on a limited number of suppliers for key raw materials and other inputs and for outsourced activities; the risk of disruptions in the supply of materials and components used in manufacturing or sterilizing our products; breaches or failures of our (or of our business partners’ or other third parties’) information technology systems or products, including by cyberattack, unauthorized access or theft; the outcome of government investigations; the impact of healthcare reform and cost containment measures, including efforts sponsored by government agencies, legislative bodies, the private sector and healthcare purchasing organizations, through reductions in reimbursement levels, repayment demands and otherwise; the impact of substantial indebtedness on our ability to service our debt obligations and/or refinance amounts outstanding under our debt obligations at maturity on terms favorable to us, or at all; changes in tax obligations arising from examinations by tax authorities and from changes in tax laws in jurisdictions where we do business, including as a result of the “base erosion and profit shifting” project undertaken by the Organisation for Economic Co-operation and Development and otherwise; challenges to the tax-free nature of the ZimVie Inc. spinoff transaction and the subsequent liquidation of our retained interest in ZimVie Inc.; the risk of additional tax liability due to the recategorization of our independent agents and distributors to employees; changes in tariffs relating to imports to the U.S. and other countries; the risk that material impairment of the carrying value of our intangible assets, including goodwill, could negatively affect our operating results; changes in general domestic and international economic conditions, including interest rate and currency exchange rate fluctuations; changes in general industry and market conditions, including domestic and international growth, inflation and currency exchange rates; the domestic and international business impact of political, social and economic instability, tariffs, trade restrictions and embargoes, sanctions, wars, disputes and other conflicts, including on our ability to operate in, export from or collect accounts receivable in affected countries; challenges relating to changes in and compliance with governmental laws and regulations affecting our U.S. and international businesses, including regulations of the U.S. Food and Drug Administration (“FDA”) and other government regulators relating to medical products, healthcare fraud and abuse laws and data privacy and cybersecurity laws; the success of our quality and operational excellence initiatives; the ability to remediate matters
identified in inspectional observations issued by the FDA and other regulators, while continuing to satisfy the demand for our products; product liability, intellectual property and commercial litigation losses; and the ability to obtain and maintain adequate intellectual property protection.
See also the section titled “Risk Factors” (refer to Part I, Item 1A of this report) for further discussion of certain risks and uncertainties that could cause actual results and events to differ materially from the forward-looking statements. Readers of this report are cautioned not to rely on these forward-looking statements, since there can be no assurance that these forward-looking statements will prove to be accurate. Forward-looking statements speak only as of the date they are made, and we expressly disclaim any intention or obligation to update or revise any forward-looking statements, whether as a result of new information, future events or otherwise. You are advised, however, to consult any further disclosures we make on related subjects in our Quarterly Reports on Form 10-Q and Current Reports on Form 8-K. This cautionary note is applicable to all forward-looking statements contained in this report.
TABLE OF CONTENTS
PART I
Item 1. Business
Overview
Zimmer Biomet is a global medical technology leader with a comprehensive portfolio designed to maximize mobility and improve health. We design, manufacture and market orthopedic reconstructive products; sports medicine, biologics, extremities and trauma products; craniomaxillofacial and thoracic (“CMFT”) products; surgical products; and a suite of integrated digital and robotic technologies that leverage data, data analytics and artificial intelligence. We collaborate with healthcare professionals around the globe to advance the pace of innovation. Our products and solutions help treat patients suffering from disorders of, or injuries to, bones, joints or supporting soft tissues. Together with healthcare professionals, we help millions of people live better lives. In this report, “Zimmer Biomet,” “we,” “us,” “our,” “the Company” and similar words refer collectively to Zimmer Biomet Holdings, Inc. and its subsidiaries. “Zimmer Biomet Holdings” refers to the parent company only.
Zimmer Biomet Holdings was incorporated in Delaware in 2001. Our history dates to 1927, when Zimmer Manufacturing Company, a predecessor, was founded in Warsaw, Indiana. On August 6, 2001, we were spun off from our former parent and became an independent public company. In 2015, we acquired LVB Acquisition, Inc. (“LVB”), the parent company of Biomet, Inc. (“Biomet”), and LVB and Biomet became our wholly-owned subsidiaries. In connection with the merger, we changed our name from Zimmer Holdings, Inc. to Zimmer Biomet Holdings, Inc.
On March 1, 2022, we completed the spinoff of our spine and dental businesses into a new public company, ZimVie Inc. (“ZimVie”). The transaction was intended to benefit our stockholders by enhancing the focus of both Zimmer Biomet and ZimVie to meet the needs of patients and customers and, therefore, achieve faster growth and deliver greater value for all stakeholders.
Customers, Sales and Marketing
Our primary customers include orthopedic surgeons, neurosurgeons, and other specialists, healthcare institutions, stocking distributors, healthcare dealers and, in their capacity as agents, healthcare purchasing organizations or buying groups. These customers range from large multinational enterprises to independent clinicians.
We market and sell products through two principal channels: 1) direct to healthcare institutions, such as hospitals and ambulatory surgery centers, referred to as direct channel accounts; and 2) through stocking distributors and healthcare dealers. With direct channel accounts and some healthcare dealers, inventory is generally consigned to sales agents or customers. With sales to stocking distributors, some healthcare dealers and some hospitals, title to product passes upon shipment. Consignment sales represented approximately 85 percent of our net sales in 2024. No individual customer accounted for more than 2 percent of our net sales for 2024.
We stock inventory in our warehouse facilities and retain title to consigned inventory in an effort to have sufficient quantities available when products are needed for surgical procedures. Safety stock levels are determined based on a number of factors, including demand, manufacturing lead times and quantities required to maintain service levels.
We also carry trade accounts receivable balances based on credit terms that are generally consistent with local market practices.
We utilize a network of sales associates, sales managers and support personnel, some of whom are employed or contracted by independent distributors and sales agencies. We invest a significant amount of time and expense in training sales associates in how to use specific products and how to best inform surgeons of product uses and features. Sales force representatives must have strong technical selling and medical education skills to provide technical support for surgeons.
In response to the different healthcare systems throughout the world, our sales and marketing strategies and organizational structures differ by region. We utilize a global approach to sales force training, marketing and medical education to provide consistent, high quality service. Additionally, we keep current with key surgical developments and other issues related to orthopedic surgeons, neurosurgeons, other specialists, and the medical procedures they perform.
We allocate resources to achieve our operating profit goals through three regional operating segments. Our operating segments are comprised of the Americas; Europe, Middle East and Africa (“EMEA”); and Asia Pacific. The following is a summary of our operating segments. See Note 19 to our consolidated financial statements for more information regarding our segments.
Americas. The Americas operating segment is our largest operating segment. This segment is comprised principally of the U.S. and includes other North, Central and South American markets. The U.S. accounted for approximately 95 percent of net sales in this region in 2024. The U.S. sales force consists of a combination of employees and independent sales agents, most of whom sell products exclusively for Zimmer Biomet. The sales force in the U.S. receives a commission on product sales and is responsible for many operating decisions and costs.
In this region, we contract with group purchasing organizations and managed care accounts and have promoted unit growth by offering volume discounts to customer healthcare institutions within a specified group. Generally, we are designated as one of several preferred purchasing sources for specified products, although members are not obligated to purchase our products. Contracts with group purchasing organizations generally have a term of three years, with extensions as warranted.
EMEA. The EMEA operating segment is our second largest operating segment. France, Germany, Italy, Spain and the United Kingdom (the “UK”) collectively accounted for approximately 50 percent of net sales in the region in 2024. This segment also includes other key markets, including Switzerland, Benelux, Nordic, Central and Eastern Europe, the Middle East and Africa. Our sales force in this segment is comprised of direct sales associates, commissioned agents, independent distributors and sales support personnel. In most European countries, healthcare is sponsored by the government and therefore government budgets impact healthcare spending, which can affect our sales in this segment.
Asia Pacific. The Asia Pacific operating segment includes key markets such as Japan, China, Australia, New Zealand, Korea, Taiwan, India, Thailand, Singapore, Hong Kong and Malaysia. Japan is the largest market within this segment, accounting for approximately 45 percent of the region’s net sales in 2024. In Japan and most countries in the Asia Pacific region, we maintain a network of dealers, who act as order agents on behalf of hospitals in the region, and sales associates, who build and maintain relationships with orthopedic surgeons and neurosurgeons in their markets. The knowledge and skills of these sales associates play a critical role in providing service, product information and support to surgeons. In certain countries of this region, healthcare is sponsored by governments.
Seasonality
Our business is seasonal in nature to some extent, as many of our products are used in elective procedures, which typically decline during the summer months and can increase at the end of the year once annual deductibles have been met on health insurance plans. Additionally, with sales to customers where title to product passes upon shipment, these customers may purchase items in large quantities if incentives are offered or if there are new product offerings in a market, which could cause period-to-period differences in sales.
Distribution
We distribute our products both through large, centralized warehouses and through smaller, market specific facilities, depending on the needs of the market. We maintain large, centralized warehouses in the U.S. and Europe to be able to efficiently distribute our products to customers in those regions. In addition to these centralized warehouses, we maintain smaller distribution facilities in the U.S. and in each of the countries where we have a direct sales presence. In many locations, our inventory is consigned to the healthcare institution.
We generally ship our orders via expedited courier. Since most of our sales occur at the time of an elective procedure, we generally do not have firm orders.
Products
Our products include orthopedic reconstructive products; sports medicine, biologics, extremities and trauma products; CMFT products; surgical products; and a suite of integrated digital and robotic technologies.
KNEES
Total knee replacement surgeries typically include a femoral component, a patella (knee cap), a tibial tray and an articular surface (placed on the tibial tray). Knee replacement surgeries include first-time, or primary, joint replacement procedures and revision procedures for the replacement, repair or enhancement of an implant or component from a previous procedure. There are also procedures for partial reconstruction of the knee, which treat limited knee degeneration and involve the replacement of only one side, or compartment, of the knee with a unicompartmental knee prosthesis. Our significant knee brands include the Persona® Knee, NexGen® Knee Implants, Vanguard® Knee, and Oxford® Partial Knee. Additionally, our ROSA® Robot utilizes robotic technologies to assist a surgeon with implant positioning in total knee arthroplasty or partial knee arthroplasty.
HIPS
Total hip replacement surgeries replace both the head of the femur and the socket portion of the pelvis (acetabulum) of the natural hip. Hip procedures include first-time, or primary, joint replacement as well as revision procedures. Hip implant procedures involve the use of bone cement to attach or affix the prosthetic components to the surrounding bone, or are press-fit into bone, which means that they have a surface that bone affixes to through either ongrowth or ingrowth technologies. Our significant hip brands include the Taperloc® Hip System, Avenir Complete® Hip System, Arcos® Modular Hip System, and G7® Acetabular System. Our ROSA® Robot is also utilized in hip procedures.
S.E.T.
Our S.E.T. product category includes sports medicine, biologics, foot and ankle, upper extremities, trauma and CMFT products. Our sports medicine products are primarily for the repair of soft tissue injuries, most commonly used in the knee and shoulder. Sports medicine products represented 13 percent of our S.E.T. product category net sales in 2024. Our biologics products are used as early intervention for joint preservation or to support surgical procedures. Biologics products represented 6 percent of our S.E.T. product category net sales in 2024. Our foot and ankle and upper extremities products are designed to treat arthritic conditions and fractures in the foot, ankle, shoulder, elbow and wrist. Our foot and ankle products represented 3 percent of our S.E.T. product category net sales in 2024. Our upper extremities products represented 32 percent of our S.E.T. product category net sales in 2024. Our trauma products are used to stabilize damaged or broken bones and their surrounding tissues to support the body’s natural healing process. Trauma products represented 23 percent of our S.E.T. product category net sales in 2024. Our CMFT product division includes face and skull reconstruction products as well as products that fixate and stabilize the bones of the chest in order to facilitate healing or reconstruction after open heart surgery, trauma or for deformities of the chest. CMFT products represented 21 percent of our S.E.T. product category net sales in 2024. Our significant S.E.T. brands include the JuggerKnot® Soft Anchor System, Gel-One® Cross-linked Hyaluronate, Comprehensive® Shoulder, Natural Nail® System, and SternaLock® System. Gel-One® is a registered trademark of Seikagaku Corporation. Our ROSA® Robot is also utilized in shoulder procedures.
TECHNOLOGY & DATA, BONE CEMENT AND SURGICAL
Through our Technology & Data, Bone Cement and Surgical product category, we market a collective suite of our products and technologies as the ZBEdge® Platform. The ZBEdge Platform connects robotic and digital technologies together to collect data before, during and after surgery, that can deliver insights to surgeons to assist in making informed decisions on patient care. Bone cement is used to assist with implant fixation in orthopedic surgeries. We offer an assortment of bone cements and products for mixing and delivery. We also offer a portfolio of surgical solutions used by healthcare institutions.
Research and Development
We have extensive research and development activities to develop new surgical techniques, including robotic techniques, materials, biologics and product designs. The research and development teams work closely with our strategic brand marketing function. The rapid commercialization of new data solutions, surgical techniques, innovative new materials, biologics products, and implant and instrument designs remains one of our core strategies and continues to be an important driver of sales growth.
We are broadening our offerings in certain of our product categories and exploring new technologies, including artificial intelligence and machine learning, with possible applications in multiple areas. Our primary research and development facility is located in Warsaw, Indiana. We have other research and development personnel based in, among other places, Canada, China, France, Switzerland and other U.S. locations. As of December 31, 2024, we employed approximately 2,000 research and development employees worldwide.
We expect to continue to identify innovative technologies, which may include acquiring complementary products or businesses, establishing technology licensing arrangements or strategic alliances.
Government Regulation and Compliance
Our operations, products and customers are subject to extensive government regulation by numerous government agencies, both within and outside the U.S. We are subject to national, state and other regulations affecting, among other things, the development, design, manufacturing, product standards, packaging, advertising, promotion, labeling, marketing and post-market surveillance of medical products and medical devices in many of the countries in which our products are sold. Our global regulatory environment is increasingly stringent, unpredictable and complex. There is a global trend toward increased regulatory activity related to medical products and medical devices.
Medical Product and Medical Device Regulation
In the U.S., numerous laws and regulations govern the processes by which our products are brought to market. These include the Federal Food, Drug and Cosmetic Act, as amended (“FDCA”), and associated regulations. U.S. Food and Drug Administration (“FDA”) regulations control all aspects of the development, manufacturing, advertising, promotion, marketing, distribution and post-market surveillance of medical products and medical devices. All of our devices marketed in the U.S. have been cleared or approved by the FDA, except for those exempt from FDA premarket clearance and approval and those in commercial distribution prior to May 28, 1976. The process of obtaining FDA clearance or approval to market a product is resource intensive, lengthy, and costly. The FDA review may involve substantial delays that adversely affect the marketing and sale of our products. Most of our new products fall into a classification that requires the submission of a Premarket Notification (510(k)) to the FDA before we can market the new device. This process requires us to demonstrate that the device to be marketed is at least as safe and effective as, that is, substantially equivalent to, a legally marketed device. Other devices we develop and market require stringent FDA clinical investigation and Premarket Approval (“PMA”) requirements, including submission of clinical and laboratory data that establishes that the new medical device is safe and effective. Additionally, certain of our new products incorporate innovations related to artificial intelligence, machine learning and software as a medical device, which are subject to emerging FDA oversight and regulation.
We are subject to FDA Quality System regulations governing design and manufacturing practices, testing, manufacturing quality assurance, labeling and record keeping and reporting requirements for our products, which apply both to our own and to our third-party manufacturers' operations. We are required to establish a quality system by which we monitor our (and our third-party manufacturers') manufacturing processes and maintain records that show compliance with FDA regulations and manufacturers' written specifications and procedures.
There are also requirements of state and local governments with which we must comply in the manufacture and marketing of our products.
The FDA conducts announced and unannounced periodic and on-going inspections of medical device manufacturers to determine compliance with its Quality System, and other applicable, regulations. If in connection with these inspections the FDA believes the manufacturer has failed to comply with applicable regulations and/or procedures, it may issue inspectional observations on Form FDA-483 (“Form 483”) that would necessitate prompt corrective action. If FDA inspectional observations are not addressed and/or corrective action is not taken in a timely manner and to the FDA’s satisfaction, the FDA may issue a warning letter (which would similarly necessitate prompt corrective action) and/or proceed directly to other forms of enforcement action, including the imposition of operating restrictions, including ceasing operations on one or more facilities, enjoining and restraining legal violations pertaining to products, seizing products, negotiating the entry of a consent decree and permanent injunction against us, recommending prosecution to the U.S. Department of Justice (the “DOJ”), and assessing civil or criminal penalties against our officers, employees or us. Any adverse regulatory action, depending on its magnitude, may restrict us from effectively manufacturing, marketing and selling our products and could have a material adverse effect on our business, financial condition and results of operations.
The FDA, in cooperation with U.S. Customs and Border Protection (“CBP”), administers controls over the import of medical devices into the U.S. and can prevent the importation of products the FDA deems to violate the FDCA or its implementing regulations. The CBP imposes its own regulatory requirements on the import of our products, including inspection and possible sanctions for noncompliance. We are also subject to foreign trade controls
administered by certain U.S. government agencies, including the Bureau of Industry and Security within the Commerce Department and the Office of Foreign Assets Control within the Treasury Department (“OFAC”). In addition, exported medical products are subject to the regulatory requirements of each country to which the medical product is exported.
The European Union (the “EU”) has adopted the European Medical Device Regulation (the “EU MDR”), which created a single set of medical device regulations for products marketed in all member countries. The EU MDR took effect in May 2021, replacing the European Medical Device Directive (the “MDD”). The EU MDR imposes significant additional premarket and post-market requirements. Products currently certified per the MDD regulations must be certified to the new EU MDR regulation prior to December 2027 or December 2028, depending upon the device’s risk class. The UK additionally is in the process of creating secondary legislation to implement the future medical device regulations. The first piece of the Statutory Instrument (“SI”) for post-market surveillance requirements was released in January 2025 with further SIs planned to be released later in 2025 and in 2026. These SIs will form part of the new medical device regulatory framework (the “UK MDR”) following its exit from the European Union. The UK, in the meantime, continues to allow products meeting the current EU regulations to be marketed through June 2028 for EU MDD and EU Active Implantable Medical Devices or through June 2030 for EU MDR devices.
Our quality management system is based upon the requirements of ISO 13485, the FDA Quality System regulations, the MDD, the EU MDR and other applicable regulations for the markets in which we sell. Our principal manufacturing sites are certified to ISO 13485 and audited at regular intervals. Additionally, our principal sites are certified under the Medical Device Single Audit Program (“MDSAP”), a voluntary audit program developed by regulatory authorities in Australia, Brazil, Canada, Japan, and the United States to assess compliance with the quality management system regulatory requirements of those countries. MDSAP audits are conducted by an MDSAP-recognized auditing organization and can fulfill the needs of the participating regulatory jurisdictions, replacing standard surveillance audits by the regulatory authorities in those countries.
We are subject to international, national, state and other laws and regulations concerning healthcare cost containment, including price regulation, competitive pricing, coverage and payment policies, comparative effectiveness reviews and other methods, including through efforts to reduce healthcare fraud and abuse, false claims and anti-kickback laws as well as the U.S. Physician Payments Sunshine Act and similar state and foreign healthcare professional payment transparency laws. Many authorities have increased their enforcement activities with respect to medical products manufacturers in recent years. Violations of these laws are punishable by criminal and/or civil sanctions, including, in some instances, fines, imprisonment and exclusion from participation in certain government healthcare programs.
Foreign Corrupt Practices Act and Related Laws
Our operations outside the U.S. are subject to the extraterritorial application of the U.S. Foreign Corrupt Practices Act (the “FCPA”). Our global operations are also subject to non-U.S. anti-corruption laws, such as the United Kingdom Bribery Act. As part of our global compliance program, we seek to address anti-corruption risks proactively.
Environmental Laws
All of our facilities and operations are subject to complex national, state and local environmental and occupational safety laws and regulations, including those relating to discharges of substances in the air, water and land, the handling, storage and disposal of wastes and the clean-up of properties contaminated by pollutants. We do not expect that the ongoing costs of compliance with these environmental requirements will have a material impact on our consolidated earnings, capital expenditures or competitive position.
Data Privacy Laws
We are subject to evolving national, state, international and other data privacy and security laws and regulations that govern the collection, use, disclosure, transfer, location, storage, disposal and protection of health-related and other personal information, including laws and regulations that regulate and restrict cross-border data transfers. Certain of these laws and regulations impose time-sensitive notification requirements to governmental authorities or consumers. We are also subject to emerging regulations, directives, voluntary commitments and guidance governing data security and cyber risk management for medical devices as well as emerging regulations, directives,
voluntary commitments and guidance relating to artificial intelligence. Failure to comply with any such data protection laws, regulations, directives, voluntary commitments and guidance could result in government enforcement actions (which could include civil and/or criminal penalties), private litigation and/or adverse publicity and could negatively affect our operating results and business. Information regarding the risks associated with data privacy and protection laws may be found in Item 1A. Risk Factors – If we fail to comply with data privacy and security laws and regulations, we could face substantial penalties and our business, operations and financial condition could be adversely affected.
Competition
The orthopedics and broader musculoskeletal care industry is highly competitive. In the global markets for our knees, hips, and S.E.T. products, our major competitors include Johnson & Johnson MedTech (formerly the DePuy Synthes Companies of Johnson & Johnson), Stryker Corporation and Smith & Nephew plc. There are smaller competitors in these product categories as well that focus on smaller subsegments of the industry.
Competition within the industry is primarily based on technology, innovation, quality, reputation, customer service and pricing. A key factor in our continuing success in the future will be our ability to develop new products and technologies and improve existing products and technologies.
Manufacturing and Raw Materials
We manufacture our products at various sites. We also strategically outsource some manufacturing to qualified suppliers who are highly capable of producing components.
The manufacturing operations at our facilities are designed to incorporate the cellular concept for production and to implement tenets of a manufacturing philosophy focused on continuous improvement efforts in product quality, lead time reduction and capacity optimization. Our continuous improvement efforts are driven by Lean and Six Sigma methodologies. In addition, at certain of our manufacturing facilities, many of the employees are cross-trained to perform a broad array of operations.
We generally target operating our manufacturing facilities at optimal levels of total capacity. We continually evaluate the potential to in‑source and outsource production as part of our manufacturing strategy to provide value to our stakeholders.
In most of our manufacturing network, we have improved our manufacturing processes to harmonize and optimize our quality systems and to protect our profitability and offset the impact of inflationary costs. We have, for example, employed computer-assisted robots and multi-axis grinders to precision polish medical devices; automated certain manufacturing and inspection processes, including on-machine inspection and process controls; purchased state-of-the-art equipment; in-sourced core products and processes; and negotiated cost reductions from third-party suppliers.
We use a diverse and broad range of raw materials in the manufacturing of our products. We purchase all of our raw materials and select components used in manufacturing our products from external suppliers. In addition, we purchase some supplies from single sources for reasons of quality assurance, sole source availability, cost effectiveness or constraints resulting from regulatory requirements. We work closely with our suppliers to assure continuity of supply while maintaining high quality and reliability.
Intellectual Property
Patents and other proprietary rights are important to the continued success of our business. We also rely upon trade secrets, know-how, continuing technological innovation and licensing opportunities to develop and maintain our competitive position. We protect our proprietary rights through a variety of methods, including confidentiality agreements and proprietary information agreements with suppliers, employees, consultants and others who may have access to proprietary information. We own or control through licensing arrangements over 6,000 issued patents and patent applications throughout the world that relate to aspects of the technology incorporated in many of our products.
Human Capital
As of December 31, 2024, we employed approximately 17,000 employees worldwide, including approximately 2,000 employees dedicated to research and development. Approximately 7,000 employees are located within the U.S. and approximately 10,000 employees are located outside of the U.S., primarily throughout Europe and in Japan and China. We have approximately 7,000 employees dedicated to manufacturing our products worldwide.
Our mission is to alleviate pain and improve the quality of life for people around the world. Our commitment to patients shapes all day-to-day decisions at Zimmer Biomet. To be able to accomplish our mission, we have established guiding principles. These guiding principles are central to our human capital management policies and practices. The guiding principles are:
•Respect and show gratitude for the contributions and diverse perspectives of all team members
•Commit to the highest standards of patient safety, quality and integrity
•Focus our resources in areas where we will make a difference
•Ensure the company’s return is equivalent to the value we provide our customers and patients
•Give back to our communities and people in need.
Team Member Inclusion
Our team member inclusion efforts are intended to identify, attract and retain talent for our business. We monitor and benchmark our team member demographics at all levels of the organization. Our eight global employee resource groups (“ERGs”) continue to have substantial participation with membership representing approximately 15 percent of our workforce. Our ERGs also receive funding from the Zimmer Biomet Foundation, Inc. to support communities and partnerships aligned to our Mission.
Employee Engagement
We value our employees’ input and to that end, from time to time, we conduct comprehensive employee engagement surveys that ultimately inform our actions towards improving employee engagement. Surveys attempt to assess five drivers of engagement including purpose, culture, leadership, personal growth and belonging. The key results of surveys, and commensurate action plans, are shared with our Board of Directors and with our employee base. Employee engagement is the degree to which employees invest their cognitive, emotional, and behavioral energies toward positive organizational outcomes. While we strive for engagement scores to sequentially improve, the outcomes of the surveys can be influenced by many factors that are internal and external to the company.
We believe it is critical to keep our employees engaged through frequent and transparent communication. This is accomplished through town halls, video and written messages, news and recognition on our intranet site, and various other methods.
Health, Safety and Wellness
The physical and mental health, financial wellbeing, and work/life balance of our employees is vital to accomplishing our mission. We sponsor wellness programs designed to enhance physical, financial and mental wellbeing for our employees. We encourage participation in these programs through regular communications, educational sessions and other incentives.
We are also intensely focused on the health and safety of our team members in the workplace. Our environmental, health and safety team constantly monitors various metrics to ensure we are providing a safe environment in which to work. In 2024, our Total Recordable Incident Rate was 0.30 and our Lost Time Incident Rate was 0.14. These results are shared with relevant regulatory agencies as required and presented to our Board of Directors.
INFORMATION ABOUT OUR EXECUTIVE OFFICERS
The following table sets forth certain information with respect to our executive officers as of February 15, 2025.
| | | | |
Ivan Tornos | | 49 | | President and Chief Executive Officer |
Mark Bezjak | | 50 | | President, Americas |
Rachel Ellingson | | 55 | | Senior Vice President and Chief Administrative Officer |
Chad Phipps | | 53 | | Senior Vice President, General Counsel and Secretary |
Paul Stellato | | 50 | | Vice President, Controller and Chief Accounting Officer |
Suketu Upadhyay | | 55 | | Chief Financial Officer and Executive Vice President - Finance, Operations and Supply Chain |
Wilfred van Zuilen | | 55 | | Group President, Europe, Middle East and Africa |
Lori Winkler | | 63 | | Senior Vice President, Chief Human Resources Officer |
Sang Yi | | 62 | | Group President, Asia Pacific |
Mr. Tornos was appointed President and Chief Executive Officer and a member of the Board of Directors in August 2023. Previously, he served as the Company’s Chief Operating Officer since March 2021, as Group President, Global Businesses and the Americas from December 2019 until March 2021, and as Group President, Orthopedics from joining the Company in November 2018 until December 2019. Prior to joining Zimmer Biomet, Mr. Tornos served as Worldwide President of the Global Urology, Medical and Critical Care Divisions of Becton, Dickinson and Company (“BD”) (and previously, C. R. Bard, Inc. (“Bard”)) from June 2017 until October 2018. From June 2017 until BD’s acquisition of Bard in December 2017, Mr. Tornos also continued to serve as President, EMEA of Bard, a position to which he was appointed in September 2013. Mr. Tornos joined Bard in August 2011 and, prior to his appointment as President, EMEA, served as Vice President and General Manager with leadership responsibility for Bard’s business in Southern Europe, Central Europe and the Emerging Markets Region of the Middle East and Africa. Before joining Bard, Mr. Tornos served as Vice President and General Manager of the Americas Pharmaceutical and Medical/Imaging Segments of Covidien International from April 2009 to August 2011. Before that, he served as International Vice President, Business Development and Strategy with Baxter International Inc. from July 2008 to April 2009 and, prior to that, Mr. Tornos spent 11 years with Johnson & Johnson in positions of increasing responsibility. He has also served as a member of the board of directors at PHC Holdings Corporation since September 2021.
Mr. Bezjak was appointed President, Americas in September 2023. As President, Americas, he oversees all commercial, downstream marketing and distribution activities in North America and Latin America. Mr. Bezjak joined Zimmer Biomet in April of 2008 as Director of Corporate Sales and has held roles of increasing importance within the Company, most recently serving as President, North America, since 2021. Prior to his work at Zimmer Biomet, Mr. Bezjak held multiple roles with Teleflex Incorporated ranging from a regional sales representative to Director of Strategic Accounts from 2000 to 2008. He also held various sales representative roles with Michelin Tire Company from 1997 to 2000.
Ms. Ellingson was appointed Senior Vice President and Chief Administrative Officer in May 2024. Prior to that, she served as Senior Vice President and Chief Strategy Officer since April 2018 and was designated as an executive officer in January 2021. Prior to joining Zimmer Biomet, Ms. Ellingson served as a member of the executive leadership team of St. Jude Medical in positions of increasing responsibility from 2012 until 2017, most recently as Vice President, Corporate Strategy from 2015 until 2017. Before joining St. Jude Medical, Ms. Ellingson served as Vice President, Business Development and Investor Relations at AGA Medical Corporation. Prior to joining AGA Medical, Ms. Ellingson had more than 15 years of experience in investment banking, rising to the position of Managing Director, Medical Technology Investment Banking with Bank of America. She has served as a member of the board of directors of Biolife Solutions, Inc. since April 2021 and serves on their audit and compensation committees.
Mr. Phipps was appointed Senior Vice President, General Counsel and Secretary in May 2007. He has global responsibility for the Company’s Legal Affairs and he serves as Secretary to the Board of Directors. Mr. Phipps also oversees the Company’s Government Affairs activities. Previously, Mr. Phipps served as Associate General Counsel and Corporate Secretary from December 2005 to May 2007. He joined the Company in September 2003 as Associate Counsel and Assistant Secretary. Prior to joining the Company, he served as Vice President and General Counsel of L&N Sales and Marketing, Inc. in Pennsylvania and he practiced law with the firm of Morgan, Lewis & Bockius in Philadelphia, focusing on corporate and securities law, mergers and acquisitions and financial transactions.
Mr. Stellato was appointed Vice President, Controller and Chief Accounting Officer in May 2022. Previously, he served as Vice President Finance, Global Business Services from March 2019 through April 2022, with Xylem Inc. (“Xylem”), a global provider of water technology products and services. He joined Xylem upon its spinoff from ITT
Corporation (“ITT”) in October 2011 and served as Xylem’s Vice President Finance, Financial Planning and Analysis through August 2017. He was promoted to Vice President, Controller and Chief Accounting Officer in August 2017 after serving as Interim Corporate Controller starting in August 2016, and became Vice President Finance, Global Business Services in March 2019. Prior to Xylem’s spinoff from ITT in October 2011, Mr. Stellato served with ITT beginning in May 2003, having served most recently as ITT’s General Auditor and prior to that, as Manager - Investor Relations. He began his career in public accounting with Ernst & Young LLP and Arthur Andersen LLP and is a certified public accountant.
Mr. Upadhyay was appointed Chief Financial Officer and Executive Vice President - Finance, Operations and Supply Chain in August 2023. Previously, he served as our Executive Vice President and Chief Financial Officer since joining the Company in July 2019. Prior to joining Zimmer Biomet, Mr. Upadhyay served as Senior Vice President, Global Financial Operations at Bristol-Myers Squibb Company from November 2016 until June 2019. Before joining Bristol-Myers Squibb, he served as Executive Vice President and Chief Financial Officer of Endo International plc from September 2013 to November 2016. Prior to his tenure at Endo International, Mr. Upadhyay served as Interim Chief Financial Officer as well as Senior Vice President of Finance, Corporate Controller and Principal Accounting Officer of BD. Prior to his role as BD’s Interim Chief Financial Officer and Corporate Controller, Mr. Upadhyay was the Senior Vice President of Global Financial Planning and Analysis and also held the role of Vice President and Chief Financial Officer of BD’s international business. Before joining BD in 2010, Mr. Upadhyay held a number of leadership roles across AstraZeneca PLC and Johnson & Johnson. Mr. Upadhyay spent the early part of his career in public accounting with KPMG. He has also served as a member of the board of directors of Vertex Pharmaceuticals Incorporated since May 2022. He holds a B.S. in Finance from Albright College and an M.B.A. from the Fuqua School of Business at Duke University. He holds the inactive designations of C.P.A. and C.M.A.
Mr. van Zuilen was appointed Group President, Europe, Middle East and Africa in September 2023, after having served as President, Europe, Middle East and Africa since joining the Company in June 2021. He is responsible for the sales, marketing and distribution of products, services and solutions in the Europe, Middle East and Africa region. Prior to joining Zimmer Biomet, Mr. van Zuilen served in various roles for Medtronic plc, including as Vice President, North Western Europe from October 2020 to May 2021, as Vice President, Restorative Therapies Group EMEA from February 2017 through September 2020, and as Vice President, Advanced Surgical Technologies Europe, Surgical Solution Group, from October 2011 through January 2017. He served in other roles of increasing responsibility with Medtronic plc through January 1998. Before joining Medtronic, he spent more than five years in medical sales, most recently with Baxter BV (Edwards Lifesciences).
Ms. Winkler joined Zimmer Biomet as Group Vice President of Human Resources in February 2020 and was appointed Senior Vice President, Chief Human Resources Officer in March 2021. Prior to joining Zimmer Biomet, she served Cardinal Health, Inc. as a Worldwide Vice President of Human Resources in the Medical Segment from November 2016 through January 2020. Before joining Cardinal Health, Ms. Winkler served more than 20 years with Johnson and Johnson, including its subsidiary companies DePuy and Cordis, most recently as Global Head, Human Resources Global Finance from April 2011 through November 2016. She has served as an independent voting member of the board of directors of Family Promise, Inc., a 501(c)(3) charity focused on housing and homelessness, since August 2022.
Mr. Yi was appointed Group President, Asia Pacific, in March 2021. He is responsible for the sales, marketing and distribution of products, services and solutions in the Asia Pacific region. Mr. Yi joined the Company in March 2013 as Senior Vice President, Asia Pacific and was promoted to President, Asia Pacific, in June 2015. Prior to joining the Company, he served as Vice President and General Manager of St. Jude Medical for Asia Pacific and Australia from 2005 to 2013. Prior to that, Mr. Yi held several leadership positions over a ten-year period with Boston Scientific Corporation, ultimately serving as Vice President for North Asia.
AVAILABLE INFORMATION
Our Internet address is www.zimmerbiomet.com. We routinely post important information for investors on our website in the “Investor Relations” section, which may be accessed from our homepage at www.zimmerbiomet.com or directly at https://investor.zimmerbiomet.com. We use this website as a means of disclosing material, non-public information and for complying with our disclosure obligations under Regulation FD. Accordingly, investors should monitor the Investor Relations section of our website, in addition to following our press releases, SEC filings, public
conference calls, presentations and webcasts. Our goal is to maintain the Investor Relations website as a portal through which investors can easily find or navigate to pertinent information about us, free of charge, including:
•our Annual Reports on Form 10-K, Quarterly Reports on Form 10-Q, Current Reports on Form 8-K and amendments to those reports filed or furnished pursuant to Section 13(a) or 15(d) of the Securities Exchange Act of 1934, as amended (“Exchange Act”), as soon as reasonably practicable after we electronically file that material with or furnish it to the SEC;
•announcements of investor conferences and events at which our executives talk about our products and competitive strategies, as well as archives of these events;
•press releases on quarterly earnings, product announcements, legal developments and other material news that we may post from time to time;
•corporate governance information including our Corporate Governance Guidelines, Code of Business Conduct and Ethics, Code of Ethics for Chief Executive Officer and Senior Financial Officers, information concerning our Board of Directors and its committees, including the charters of the Audit Committee, Compensation and Management Development Committee, Corporate Governance Committee and Quality, Regulatory and Technology Committee, and other governance-related policies;
•stockholder services information, including ways to contact our transfer agent and information on how to sign up for direct deposit of dividends or enroll in our dividend reinvestment plan; and
•opportunities to sign up for email alerts and RSS feeds to have information provided in real time.
The information available on our website is not incorporated by reference in, or a part of, this or any other report we file with or furnish to the SEC.
Item 1A. Risk Factors
We operate in a rapidly changing competitive, economic and technological environment that presents numerous risks, many of which are driven by factors that we cannot control or predict. Our business, financial condition and results of operations may be impacted by a number of factors. In addition to the factors discussed elsewhere in this report, the following risks and uncertainties could materially harm our business, financial condition or results of operations, including causing our actual results to differ materially from those projected in any forward-looking statements. The following list of material risk factors is not all-inclusive or necessarily in order of importance. Additional risks and uncertainties not presently known to us, or that we currently deem immaterial, also may materially adversely affect us in future periods. You should carefully consider these risks and uncertainties before investing in our securities.
Risks Related to our Business, Operations and Strategy
Our success depends on our ability to effectively develop and market our products against those of our competitors.
We operate in a highly competitive environment. Our present or future products could be rendered obsolete or uneconomical by technological advances by one or more of our present or future competitors. To remain competitive, we must continue to identify, prioritize, develop and acquire new products and technologies, as well as identify, prioritize and improve existing products and technologies. We must also obtain and maintain regulatory approvals for such products, accurately forecast demand, manufacture the correct mix of products, distribute products to multiple global markets and market those products profitably. For example, in the past we have experienced elevated charges for excess and obsolete inventory while also facing increased backorders due to unpredictable demand fluctuations across our various markets, and there can be no assurance that production mix planning or inventory allocation will match end market demand.
Competition within our markets is primarily on the basis of technology, innovation, quality, reputation, customer service and pricing. In markets outside of the U.S., other factors influence competition as well, including local distribution systems, complex regulatory environments, differing medical philosophies and differing product preferences. Our competition may have greater financial, marketing, technical and other resources than us; respond more quickly to new or emerging technologies; undertake more extensive marketing campaigns; operate more effective planning, manufacturing, sales and distribution channels; adopt more aggressive pricing policies; or be more successful in attracting potential customers, employees and strategic partners. We also face competition from pharmaceutical and other therapies that may be more attractive than, or have other benefits over, our products, or
that could affect the frequency, progressions or symptoms of diseases and conditions that our products treat. Any of these factors, alone or in combination, could cause us to have difficulty maintaining or increasing sales of our products or otherwise have an adverse effect on our business and financial results.
Our products may become obsolete, customers may not buy our products, and our revenue and profitability may decline without the timely introduction of new products and enhancements, due to changes in markets, or due to changes in applicable standards of care.
Demand for our products may change, in certain cases, in ways we may not anticipate because of evolving customer needs, changing demographics, changing industry growth rates, declines in the musculoskeletal implant market, the introduction of competing products and technologies, the emergence of alternative treatment methods, evolving surgical philosophies and evolving industry standards. Our products may become obsolete without the timely introduction of new products and enhancements, or due to changes in applicable standards of care. If that happens, our revenue and operating results would suffer. The success of our new and enhanced product offerings will depend on several factors, including our ability to properly identify and anticipate customer needs; commercialize new products in a timely manner; manufacture and deliver instruments and products on time and in sufficient volumes; differentiate our offerings from competitors’ offerings; achieve positive clinical outcomes for new products; satisfy the increased demands by healthcare payors, providers and patients for shorter hospital stays, faster post-operative recovery and lower-cost procedures; innovate and develop new materials, product designs and surgical techniques; and provide adequate medical education relating to new products.
In addition, new materials, product designs, product enhancements and surgical techniques that we develop may not be accepted quickly or at all, or in some or all markets, because of, among other factors, the need for regulatory clearance, entrenched patterns of clinical practice, competitive factors and uncertainty with respect to third-party reimbursement.
Moreover, innovations generally require a substantial investment in research and development before we can determine their commercial viability, and we may not have the financial resources necessary to fund the research, development and production. In addition, even if we are able to successfully develop enhancements or new generations of our products, these enhancements or new generations of products may not produce revenue in excess of the costs of development and they may be quickly rendered obsolete by changing customer preferences or the introduction by our competitors of products embodying new technologies or features.
Our success largely depends on our ability to attract, retain, develop and motivate our human capital, including our senior management, key employees and key third parties, and on our ability to have meaningful succession plans in place to prepare for foreseen and unforeseen changes.
Our future performance depends on the continued skills, experiences, competencies and services of our senior management, key employees and key third parties (including independent distributors and sales agents), and our ability to attract, retain, develop and motivate such talent. We rely on certain employees and third parties for research and development; operations; quality assurance; and the distribution, marketing and sales of our products. If we fail to retain our senior management, key employees and key third parties, our revenue and profitability may decline, and our business may be otherwise adversely affected.
Additionally, certain of our key employees and third parties have detailed knowledge of our products and instruments and have developed professional relationships with existing and potential customers due to this knowledge. Recent legal and regulatory changes may affect our ability to enforce post-termination obligations from certain employees and third parties with respect to non-competition, non-solicitation and protection of confidential information, which may negatively impact our ability to retain employees and third-party distributors and to protect our information and relationships with our customers.
Competition for talent in our business is significant. Our ability to attract and retain key employee and third-party talent is dependent on a number of factors, including prevailing market conditions, our ability to offer competitive compensation packages, our ability to be perceived as a preferred place to work and the contract terms we offer to third parties. Changes in the terms and conditions of employment or engagement, such as the availability of remote and hybrid work programs, benefit and perquisite programs and engagement on an employee or independent contractor basis, may affect our ability to attract and retain key talent.
Effective succession planning for senior management, key employees and key third parties (including independent distributors and sales agents) is also important to our long-term success. Failure to ensure orderly transitions involving senior management, key employees and key third parties, as well as inadequate transfer of knowledge, customer relationships and other know-how, could adversely affect our business and financial results.
Our restructuring programs may not be successful or we may not fully realize the expected cost savings and/or operating efficiencies from our restructuring initiatives.
We have initiated a series of restructuring programs to reduce costs, improve efficiency, spin off certain businesses, and prioritize investments in higher-priority growth operations. Restructuring initiatives involve complex plans and actions that may include, or result in, workforce reductions, plant closures and/or consolidations, product portfolio rationalizations and asset impairments. Additionally, as a result of restructuring initiatives, we may experience a loss of continuity, loss of accumulated knowledge and/or inefficiencies during transitional periods. Restructuring initiatives present risks that may impair our ability to achieve anticipated operating enhancements and/or cost reductions, or otherwise harm our business, including higher than anticipated costs in implementing our restructuring programs, as well as management distraction. For more information on our restructuring programs, see Note 5 to our consolidated financial statements. If we fail to achieve some or all of the expected benefits of our restructuring programs, it could have a material adverse effect on our competitive position, business, financial condition, results of operations and cash flows.
We may not be able to effectively integrate acquired businesses into our operations or achieve expected cost savings or profitability from our acquisitions.
Our acquisitions involve numerous risks, including:
•unforeseen difficulties in integrating personnel and sales forces, operations, manufacturing, logistics, research and development, information technology, compliance, vendor management, communications, purchasing, accounting, marketing, administration and other systems and processes;
•difficulties harmonizing and optimizing quality systems and operations;
•diversion of financial and management resources from existing operations;
•unforeseen difficulties related to entering markets for which or geographic regions where we do not have prior experience;
•potential loss of key employees;
•unforeseen risks and liabilities associated with businesses acquired, including any unknown vulnerabilities in acquired technology, compromises of acquired data or noncompliance with data privacy requirements; and/or
•inability to generate sufficient revenue or realize sufficient cost savings to offset acquisition or investment costs.
As a result, if we fail to evaluate and execute acquisitions properly, we might not achieve the anticipated benefits of such acquisitions, and we may incur costs in excess of what we anticipate. These risks would likely be greater in the case of larger acquisitions.
Interruption of manufacturing or distribution operations could adversely affect our business, financial condition and results of operations.
We and our third-party manufacturers have manufacturing sites all over the world. In some instances, however, the manufacturing of certain of our product lines is concentrated in one or a few plants which are concentrated in a single country or region. Damage to one or more facilities or related operations from weather or natural disaster-related events, vulnerabilities in technology, cyber-attacks against our information systems or the information systems of our business partners (such as ransomware attacks), issues in manufacturing arising from failure to follow specific internal protocols and procedures, compliance concerns relating to the Quality System Regulation (“QSR”) and Good Manufacturing Practice requirements, equipment breakdown or malfunction, reductions in operations and/or worker absences, trade impediments, international sanctions, wars or other factors could adversely affect the ability to manufacture and distribute our products. In the event of an interruption in manufacturing or involving a critical supplier, we may be unable to move quickly to alternate means of producing or acquiring affected products or to meet customer demand, and alternative sources of supply may not be adequate to accommodate sudden increases in demand. We have experienced such interruptions previously (including in connection with our enterprise resource planning system implementation which negatively impacted distribution of our products), and we may experience such interruptions in the future. In the event of a significant interruption, for example, as a result of our or a supplier’s failure to follow regulatory protocols and procedures or as a result of a bankruptcy, we (or our suppliers) may experience lengthy delays in resuming production of affected products due primarily to the need for additional regulatory approvals. The global supply chain has been and continues to be negatively impacted by a variety of macro factors which have, in part, resulted in challenges to meet end market
demand in some instances. As a result, we may experience lost sales, which we may be unable to recover, loss of market share, which we may be unable to recapture, and/or harm to our reputation, which could adversely affect our business, financial condition and results of operations.
Challenges integrating, transitioning and implementing a new enterprise resource planning ("ERP") system have adversely affected our business and operations, and may in the future have further adverse effects.
As a result of technology initiatives, changes in our system platforms and the ongoing integration of business acquisitions, we have been consolidating and integrating the ERP systems that we operate. ERP consolidation and integration programs are highly complex, require substantial management and financial resources, and may adversely affect our ability to process and/or fulfill orders, provide customer service, send and collect invoices, manage our contracts, manage our distribution network, provide financial information or otherwise run our business, in a timely manner or at all, or without incurring additional expenses or disruption.
At the beginning of our third quarter of fiscal 2024, we began transitioning certain distribution and sales systems in the Americas to a new ERP system as part of a multi-year project. We experienced unanticipated challenges during the transition that disrupted our ability to fulfill customer orders during the second half of fiscal 2024. These ERP-related business interruptions caused several adverse consequences, including disruption to our ability to distribute product, difficulty in meeting customer demand, productivity declines and delays in invoicing customers, as well as causing the transition to the new ERP system to be more expensive and time-consuming than we anticipated. In addition, some customers affected by these disruptions may have secured supply from alternative sources, and we may not be able to regain their trust and business. Additional disruptions, delays or deficiencies in the transition, design, and implementation of this ERP system, particularly any disruptions, delays or deficiencies that impact our operations, could in the future have a material adverse effect on our business.
Disruptions in the supply of the materials and components used in manufacturing our products or the sterilization of our products by us or third-party suppliers could adversely affect our business, financial condition and results of operations.
We purchase many of the materials and components used in manufacturing our products from third-party suppliers, and we outsource some key manufacturing activities. Certain of these materials and components and outsourced activities can only be obtained from a single source or a limited number of sources due to quality considerations, expertise, costs or constraints resulting from regulatory requirements. In certain cases, we may not be able to establish additional or replacement suppliers for such materials or components or outsourced activities in a timely or cost effective manner, due to market constraints or as a result of FDA or other worldwide regulations that require validation of materials and components prior to their use in our products and the complex nature of our and many of our suppliers' manufacturing processes and the need for clearance or approval of significant changes by FDA and other worldwide regulatory bodies prior to implementation. A reduction or interruption in the supply of materials or components used in manufacturing our products, such as due to loss of access to one or more suppliers; an inability to timely develop and validate alternative sources if required; or a significant increase in the price of such materials or components could adversely affect our business, financial condition and results of operations.
In addition, many of our products require sterilization prior to sale, and we utilize a mix of internal resources and contract sterilizers to perform this service. We also provide contract sterilization services to certain of our customers. To the extent we or our contract sterilizers are or may become unable to sterilize our products or provide sterilization services to us or to our customers, whether caused by insufficient capacity; unavailability of materials for sterilization; regulatory or other restrictions on the use of certain sterilizing methods such as use of ethylene oxide; the bankruptcy or other financial constraints of the sterilizer (as we experienced with respect to one sterilization supplier in 2024); or otherwise, we may be unable to transition to other contract sterilizers, sterilizer locations or sterilization methods in a timely or cost effective manner or at all, which could have a material impact on our results of operations and financial condition.
We and our business partners are dependent on sophisticated information technology and if we fail to effectively maintain or protect our information systems and data, including from cybersecurity events, our business could be adversely affected.
We are dependent on sophisticated information technology for our products and infrastructure. As a result of technology initiatives, expanding and evolving privacy and cybersecurity laws, changes in our system platforms and the ongoing integration of business acquisitions, we have been consolidating and integrating the number of systems we operate and have upgraded and expanded our information systems and cybersecurity capabilities. In addition, some of our products and services incorporate software or information technology that collects data regarding patients and patient therapy, and some software and other products we provide to customers connect to our and third
party systems for maintenance and other purposes. We also have outsourced elements of our operations to third parties (including suppliers, customers and other business partners), and, as a result, we manage a number of third parties who may now or could in the future have access to our confidential information, including, but not limited to, intellectual property, proprietary business information and personal information of patients, team members and customers (collectively “Confidential Information”).
Our information systems, and those of third parties with whom we contract, require an ongoing commitment of significant resources to maintain, protect and enhance existing systems and develop new systems to keep pace with continuing changes in information technology, evolving systems and regulatory standards, changing threats and vulnerabilities, and the increasing need to protect data including patient, customer and Confidential Information. In addition, given their size and complexity, these systems are vulnerable to service interruptions and to security breaches from inadvertent or intentional actions by our employees, third party suppliers and/or business partners, and from cyber attacks by malicious third parties attempting to gain unauthorized access to our products, systems or Confidential Information. Our use of artificial intelligence and machine learning in our infrastructure and products exposes us to new threats, risks and uncertainties, including with respect to changing laws and regulations regarding the use of such technologies.
Like other large multi-national corporations, we and the third parties with whom we contract regularly experience cyber attacks, certain of which (including email phishing attacks on our email systems) have been successful, and we expect to continue to be subject to such attacks. These attacks may include phishing, state-sponsored cyber attacks, industrial espionage, insider threats, computer denial-of-service attacks, computer viruses, ransomware and other malware, payment fraud or other cyber incidents. Evolving artificial intelligence and machine learning tools continue to improve the capabilities of cyber attackers. In addition, as a result of our adoption of remote work arrangements in many positions, a significant number of our employees who are able to work remotely are doing so, and malicious cyber actors may increase efforts targeting remote workers, which exposes us to additional cybersecurity risks. Our cybersecurity program, incident response efforts, business continuity procedures and disaster recovery planning may not be sufficient for all eventualities. If we (or third parties with whom we contract) fail to maintain or protect our information systems and data integrity effectively, we could:
•suffer a loss of access to or alteration of all or a portion of our Confidential Information;
•have difficulty meeting our compliance requirements, including with respect to data retention and reporting, QMS, quality reporting or other requirements;
•have difficulty developing new or enhanced products;
•lose existing customers, suppliers and business partners;
•have difficulty attracting new customers;
•have problems in determining product cost estimates and establishing appropriate pricing;
•suffer outages or disruptions in our operations, supply chain, products and/or services, including our ZBEdge® ecosystem;
•have difficulty preventing, detecting, and controlling fraud;
•have disputes with customers, physicians, other healthcare professionals and payors for our products;
•have regulatory sanctions or penalties imposed;
•incur increased operating expenses;
•be subject to issues with product functionality that may result in a loss of data, risk to patient safety, field actions and/or product recalls;
•incur expenses or lose revenues as a result of a data privacy breach; or
•suffer other adverse consequences.
Additionally, cybersecurity events suffered by health insurers and other third-party payors have delayed and otherwise adversely affected the demand and payment for surgical procedures and treatments involving our products and services, which adverse effects may continue, recur, and/or change in scope or magnitude in the future.
We will continue to dedicate significant resources to protect against unauthorized access to our systems and work with government authorities to detect and reduce the risk of future cyber incidents; however, cyber attacks are becoming more sophisticated, frequent and adaptive. Therefore, despite our efforts, we cannot assure that cybersecurity incidents or data breaches will not occur or that technology or information system issues will not arise in the future. Any significant breakdown, intrusion, breach, interruption, corruption or destruction of these systems
could have a material adverse effect on our business and reputation and could materially adversely affect our results of operations and financial condition.
Business interruptions and disruptions have adversely impacted, and may, either alone or in combination with other risks, in the future adversely impact, our business, results of operations and financial condition, the nature and extent of which impacts are uncertain and unpredictable.
Our operations expose us to risks from business interruptions that may arise from a variety of sources, including public health crises; supply chain disruptions; loss of or limitations on access to certain markets due to trade and tariff disputes and disruptions or national, regional and global conflicts; adverse economic developments; healthcare staffing challenges; government shutdowns; natural disasters; and other events that can, singly or in combination with other factors, adversely affect our business and financial results. There can be no assurance that we will successfully manage such risks without adverse impacts to our business or financial results.
If third-party payors decline to reimburse our customers for our products or reduce reimbursement levels, the demand for our products may decline and our ability to sell our products profitably may be harmed. In addition, we are subject to cost containment measures in the United States and other countries, resulting in pricing pressures, which could have a material adverse effect on our business, results of operations, and cash flows.
We sell our products and services to hospitals, doctors and other healthcare providers, which receive reimbursement for the healthcare services provided to their patients from third-party payors, such as domestic and international government programs, private insurance plans and managed care programs. These third-party payors may deny reimbursement if they determine that a product or service used in a procedure was not in accordance with cost-effective treatment methods, as determined by the third-party payor, or was used for an unapproved indication. Third-party payors may also decline to reimburse for experimental procedures and products. In addition, third-party payors are increasingly attempting to contain healthcare costs by limiting both coverage and the level of reimbursement for medical products and services. If third-party payors deny or decline reimbursement, reduce reimbursement levels or change reimbursement models for our products, demand for our products may decline, or we may experience increased pressure to reduce the prices of our products, which could have a material adverse effect on our sales and results of operations.
Many customers of our products have formed group purchasing organizations in an effort to contain costs. Group purchasing organizations negotiate pricing arrangements with medical supply manufacturers and distributors, and these negotiated prices are made available to a group purchasing organization’s affiliated hospitals and other members. If we are not one of the providers selected by a group purchasing organization, affiliated hospitals and other members may be less likely to purchase our products, and, if the group purchasing organization has negotiated a strict compliance contract for another manufacturer’s products, we may be precluded from making sales to members of the group purchasing organization for the duration of the contractual arrangement. Our failure to respond to the cost-containment efforts of group purchasing organizations may cause us to lose market share to our competitors and could have a material adverse effect on our sales and results of operations.
Initiatives to limit the growth of general healthcare expenses and hospital costs are ongoing in the markets in which we do business, and we have experienced downward pressure on product pricing and other effects of healthcare reform in our international markets. These initiatives are sponsored by government agencies, legislative bodies and the private sector and include price regulation and competitive pricing. For example, China has implemented volume-based procurement (“VBP”) processes designed to reduce medical spending, which have in the past resulted in, and could in the future result in, reduced margins on covered devices and products, required renegotiation of distributor arrangements, and incurrence of inventory-related charges. In cases where our product is not selected in VBP, sales of that product are substantially impacted. “Buy local” initiatives have in the past resulted in, and could in the future result in, reduced demand for our products, as well as reduced margins on covered devices and products, required renegotiation of distributor arrangements and incurrence of inventory-related charges. Similarly, the Italian Public Administration has implemented a “Pay Back” law to obtain reimbursement from the medical device industry to contribute to government overspending on medical devices beginning in 2015, which assessments we have challenged, and a “Fund for the Government of Medical Devices” applicable to revenues relating to medical devices, large medical equipment and in vitro diagnostic devices commencing in 2024, which assessment we have also challenged. Additional cost reduction and recovery strategies are likely to be proposed in various jurisdictions, the effects of which are difficult to predict, but may have a material adverse effect on our sales and results of operations.
Pricing pressure continues due to consolidation among healthcare providers, trends toward managed care, the shift toward governments becoming the primary payors of healthcare expenses, reductions in reimbursement levels and
government laws and regulations relating to reimbursement and pricing generally. If key participants in government healthcare systems reduce the reimbursement levels for our products, including through regulatory changes, elections and other political changes, our business, financial condition, results of operations and cash flows may be adversely affected.
Financial, Credit and Liquidity Risks
We incurred substantial additional indebtedness in connection with previous mergers and acquisitions, may incur additional substantial indebtedness in connection with future mergers and acquisitions, and may not be able to meet all of our current and future debt obligations. In addition, interest rate risk could adversely affect our current and future indebtedness.
We incurred substantial indebtedness in connection with previous mergers and acquisitions, and may incur substantial additional indebtedness in connection with future mergers and acquisitions. At December 31, 2024, our total indebtedness was $6.2 billion. As of December 31, 2024, our debt service principal obligations (excluding interest, leases and equipment notes), during the next 12 months are expected to be $0.9 billion. As a result of the increase in our debt, demands on our cash resources have increased; such demand would further amplify if we fund future mergers and acquisitions using debt financing. Our current and future increased level of debt could, among other things:
•require us to dedicate a large portion of our cash flow from operations to the servicing and repayment of our debt, thereby reducing funds available for working capital, capital expenditures, research and development expenditures and other general corporate requirements;
•limit our ability to obtain additional financing to fund future working capital, capital expenditures, research and development expenditures and other general corporate requirements;
•limit our flexibility in planning for, or reacting to, changes in our business and the industry in which we operate;
•restrict our ability to make strategic investments, collaborations, acquisitions or dispositions or to exploit business opportunities;
•place us at a competitive disadvantage compared to our competitors that have less debt;
•adversely affect our credit rating, with the result that the cost of servicing our indebtedness might increase and our ability to obtain surety bonds could be impaired;
•adversely affect the market price of our common stock; and
•limit our ability to apply proceeds from a future offering or asset sale to purposes other than the servicing and repayment of debt.
In addition, the interest rates applicable to certain of our debt obligations are based on a fluctuating rate of interest determined by reference to the Secure Overnight Financing Rate (“SOFR”) or other externally-determined rates. SOFR and such other rates have increased from recent lows, which has increased our cost of borrowing. Any further increase in interest rates applicable to our debt obligations would increase our cost of borrowing and could adversely affect our financial position, results of operations or cash flows.
Changes in tax laws in countries in which we do business are expected to negatively impact our effective tax rate; further changes in tax laws may have a further negative impact.
Changes in the tax laws and regulations of the jurisdictions where we do business, including an increase in tax rates or an adverse change in the treatment of an item of income or expense, could result in a material increase in our tax expense and/or tax payments, could increase tax uncertainty and could have a material adverse impact on our business, financial condition or results of operations.
Tax law changes in certain foreign jurisdictions in which we operate conforming to Pillar Two of the base erosion and profit shifting plan (“Pillar Two”) undertaken by the Organisation for Economic Co-operation and Development began to take effect in 2024. We expect the implementation and interpretation of Pillar Two across jurisdictions where we do business to have adverse effects on our effective tax rate, results of operations, and cash flows. These tax law changes require profits earned in such jurisdictions to be subject to a minimum 15 percent income tax rate.
We may have additional tax liabilities as a result of examinations and audits.
We are subject to income taxes in the U.S. and many foreign jurisdictions. Significant judgment is required in determining our worldwide provision for income taxes. In the ordinary course of our business, there are many transactions and calculations where the ultimate tax determination is uncertain. We are regularly under audit by tax authorities. Although we believe our tax estimates are reasonable, the final determination of tax audits and any related litigation could be materially different from our historical income tax provisions and accruals. The results of an audit or litigation could have a material effect on our financial statements in the period or periods for which that determination is made.
If our independent agents and distributors are characterized as employees, we would be subject to additional tax and other liabilities.
We structure certain of our relationships with independent agents and distributors in a manner that we believe results in an independent contractor relationship, not an employee relationship. Although we believe that these independent agents and distributors are properly characterized as independent contractors, tax, labor or other regulatory authorities may in the future challenge our characterization of these relationships. Further, we have been subject to lawsuits challenging the characterization of these relationships. Changes in classification from independent contractor to employee can result in a change to various requirements associated with the payment of wages, tax withholding, and the provision of unemployment, health, and other traditional employer-employee related benefits. If regulatory authorities or state, federal or foreign courts were to determine our independent agents or distributors are employees and not independent contractors, we would be required to withhold income taxes, to withhold and pay social security, Medicare and similar taxes and to pay unemployment and other related payroll taxes, as well as provide other employer-employee related benefits. We would also be liable for unpaid past taxes and subject to penalties. As a result, any determination that our independent agents and distributors are our employees could have a material adverse effect on our business, financial condition or results of operations.
Future material impairments in the carrying value of our intangible assets, including goodwill, would negatively affect our operating results.
Goodwill and intangible assets represent a significant portion of our assets. At December 31, 2024, we had $9.0 billion in goodwill and $4.6 billion of intangible assets. The goodwill results from our acquisition activity and represents the excess of the consideration transferred over the fair value of the net assets acquired. We assess at least annually whether events or changes in circumstances indicate that the carrying value of our intangible assets may not be recoverable. As discussed further in Note 11 to our consolidated financial statements, in the fourth quarter of 2022, we recorded goodwill impairment charges of $289.8 million as a result of, among other factors, changes in foreign currency exchange rates in our European-based currencies, inflation and a higher interest rate environment; and in the second quarter of 2022, we recorded $3.0 million of an in-process research and development (“IPR&D”) intangible asset impairment on a certain IPR&D project. There were no impairment charges during the years ended December 31, 2024 and 2023, but if the operating performance at one or more of our reporting units significantly declines, including if competing or alternative technologies or pharmacological treatments, emerge, if market conditions or future cash flow estimates for one or more of our businesses decline, or as a result of restructuring initiatives pursuant to which we reorganize our reporting units, we could be required to record additional impairment charges. Any write-off of a material portion of our goodwill or unamortized intangible assets would negatively affect our results of operations.
The spinoff of ZimVie Inc. and the divestiture of our retained interest in ZimVie Inc. could result in substantial tax liability.
We obtained Internal Revenue Service (“IRS”) rulings and an opinion as to the tax-free nature of the spinoff under the U.S. Internal Revenue Code of 1986, as amended. We subsequently obtained supplemental IRS rulings as to the tax-free nature of our divestiture of retained shares of ZimVie common stock following the spinoff, which divestiture completed in February 2023. The IRS rulings and opinion are based, among other things, on various factual assumptions and representations we made. If any of these assumptions or representations are, or become, inaccurate or incomplete, reliance on the opinion and rulings may be jeopardized. If the spinoff, or the subsequent divestiture of our retained interest in ZimVie, does not qualify for tax-free treatment for U.S. federal income tax purposes, the resulting tax liability to us, to our stockholders and to ZimVie stockholders could be substantial.
Global Operational Risks
We conduct a significant amount of our sales and manufacturing activities outside of the U.S., which subjects us to additional business risks and may cause our profitability to decline due to increased costs.
We sell our products in more than 100 countries and derived approximately 42 percent of our net sales in 2024 from outside the U.S. We intend to continue to pursue growth opportunities in sales internationally, including in emerging markets, which could expose us to additional risks associated with international sales and operations. Our international operations are, and will continue to be, subject to a number of risks and potential costs, including:
•changes in foreign medical reimbursement policies and programs;
•differences in and changes to foreign regulatory requirements, such as more stringent requirements for regulatory clearance of products;
•differing local product preferences, local product requirements and “buy local” initiatives;
•fluctuations in foreign currency exchange rates;
•the effects of inflation, including the effects of different rates of inflation in different countries, on our costs and expenses, and the costs of our products;
•diminished protection of intellectual property in some countries outside of the U.S.;
•foreign exchange controls that might prevent us from repatriating cash earned in countries outside the U.S.;
•data privacy and cybersecurity requirements and labor relations laws that may add to the complexity and costs of our operations or require changes to our products or business processes;
•extraterritorial effects of U.S. laws such as the FCPA;
•effects of foreign anti-corruption laws, such as the United Kingdom Bribery Act;
•difficulty in staffing and managing foreign operations;
•labor force instability;
•increased tax liabilities under foreign tax laws or changes thereto; and
•political, social and economic instability and uncertainty, including wars, other conflict and sovereign debt issues.
Violations of foreign laws or regulations could result in fines; criminal sanctions against us, our directors, officers, employees, agents or distributors; prohibitions or restrictions relating to the conduct of our business; and damage to our reputation.
Furthermore, political tensions between the U.S., Canada, Mexico, China and certain other countries have escalated in recent years. Rising political tensions could reduce trade, investment and other economic activities between or among these economies. Any of these factors could have a material adverse effect on our business, prospects, financial condition and results of operations.
The effects of emerging, expanding and new conflicts, such as a possible expansion of the Russian-Ukrainian conflict, a possible expansion of conflicts in the Middle East, or a possible conflict involving China and Taiwan, may not be limited to the specific markets involved. Sanctions and other civil, political and economic effects of such conflicts are likely to have adverse impacts upon us. Additionally, other trade disruptions include supply chain continuity disruption; inflationary pressures and increased costs of raw materials and inputs; manufacturing or shipping delays; increased shipping costs and transit delays (such as experienced due to attacks on shipping transiting the Red Sea); and increased disruptions and delays affecting our ability to operate in and to collect payment for our products and services in particular markets.
Tariffs, trade restrictions and other trade measures could adversely affect our business and financial results.
We operate in multiple countries and maintain a complex global supply chain and distribution network which exposes us to a variety of risks from U.S. and other countries’ international trade and tariff policies. Changes to tariffs, trade restrictions and protection measures applicable to trade with certain countries, trade in certain types of goods, or otherwise; new import or export requirements; changes to trade agreements; new or increased tariffs, trade embargoes, sanctions and other trade barriers may prevent us from shipping products to or from a particular market, restrict our access to certain sources of raw materials and other inputs, increase our operating costs and disrupt our ability to collect payment for our products and services in particular markets. For example, the U.S. has imposed tariffs and export controls on certain goods and products imported from China and certain other countries, which has
resulted in retaliatory tariffs by China and other countries. Recently, the U.S. has imposed or threatened to impose additional tariffs on imports from Canada, China, Mexico and other countries, and has further threatened to impose additional tariffs on certain steel and aluminum imports; certain countries have imposed or threatened to impose retaliatory tariffs. We cannot predict how these developments will impact us, and existing or future tariffs and trade restrictions could have a material adverse effect on our business and financial results. Additionally, these and other tariffs and further retaliatory trade measures could result in an increase in supply chain costs that we may not be able to offset in full or in part or that may otherwise adversely impact our financial results.
We are subject to risks arising from currency exchange rate fluctuations, which can increase our costs, cause our profitability to decline and expose us to counterparty risks.
A substantial portion of our foreign revenues is generated in Europe and Japan. The U.S. Dollar value of our foreign-generated revenues varies with currency exchange rate fluctuations. Significant increases in the value of the U.S. Dollar relative to the Euro, the Japanese Yen, the Swiss Franc or other currencies could have a material adverse effect on our results of operations. Although we address currency risk management through regular operating and financing activities, and, on a limited basis, through the use of derivative financial instruments, those actions may not prove to be fully effective or may create additional financial obligations for us. Further, if the counterparties to the derivative financial instrument transactions fail to honor their obligations due to financial distress or otherwise, we would be exposed to potential losses or the inability to recover anticipated gains from those transactions.
Legal, Regulatory and Compliance Risks
We are subject to complex and expensive laws and governmental regulations relating to the development, design, product standards, packaging, advertising, promotion, post-market surveillance, manufacturing, labeling and marketing of our products, non-compliance with which could adversely affect our business, financial condition and results of operations.
Our global regulatory environment is increasingly stringent, unpredictable and complex. The products and services we design, develop, manufacture and market are subject to rigorous regulation by the FDA and numerous other national, regional, state and other governmental authorities. The process of obtaining regulatory approvals and clearances to market these products can be costly and time consuming and approvals might not be granted for future products on a timely basis, if at all. Delays in receipt of, or failure to obtain, approvals for future products or product enhancements, or loss of approval for current products, could result in delayed realization of product revenues or in substantial additional costs. Emerging opportunities, including those presented by the use of machine learning and artificial intelligence in our current and future products, devices and services are expected to present new, complex and potentially inconsistent legal and regulatory requirements across the various jurisdictions in which we operate.
Both before and after a product is commercially released, we have ongoing responsibilities under FDA regulations, the EU MDR and other national, regional, state and other requirements. These requirements relate to quality systems, recordkeeping, labeling, promotional and marketing requirements, adverse event reporting, monitoring and other regulations, which are subject to continual review and are monitored rigorously through periodic inspections by regulators, which may result in observations (such as on FDA Form 483), and in some cases warning letters, that require corrective action or other forms of enforcement. Additionally, the availability of designated European notified body services to certify compliance with the EU MDR requirements is limited, which may delay the marketing approval for some of our products under the EU MDR (and, potentially, the UK MDR). Furthermore, regulators strictly regulate the promotional claims that we may make about approved or cleared products.
If a regulator were to conclude that we are not in compliance with applicable laws or regulations, that any of our products are ineffective or pose an unreasonable health risk, that any of our products’ long-term statistical performance does not meet regulatory expectations, or that we have marketed or promoted a product for use other than as indicated in the product labelling approved by the regulator, the regulator may ban such products; detain or seize adulterated or misbranded products; order a recall, repair, replacement, or refund of payment of such products; refuse to grant pending premarket approval applications; refuse to provide certificates for exports; require us to notify healthcare professionals and others that the products present unreasonable risks of substantial harm to the public health; and subject us to fines, injunctions or other penalties. The regulator may also impose operating restrictions, including a ceasing of operations at one or more facilities, enjoining and restraining certain violations of applicable law pertaining to our products, seizing our products, and/or assessing civil or criminal penalties against our officers, employees or us. Regulators could also issue a corporate warning letter or a recidivist warning letter or negotiate the entry of a consent decree of permanent injunction with us, and/or recommend prosecution. Any
adverse regulatory action, depending on its magnitude, may restrict us from effectively manufacturing, marketing and selling our products and could have a material adverse effect on our business, financial condition and results of operations.
Our products and operations are also often subject to the rules of industrial standards bodies, such as the International Standards Organization. If we fail to adequately address any of these regulations, our business could be harmed.
If we fail to comply with healthcare fraud and abuse laws and regulations, we could face substantial penalties and our business, operations and financial condition could be adversely affected.
The sales, marketing and pricing of products and relationships that medical products companies have with healthcare providers are under increased scrutiny around the world. Our industry is subject to various laws and regulations pertaining to healthcare fraud and abuse, including the False Claims Act, the Anti-Kickback Statute, the Stark law, the Physician Payments Sunshine Act, the Food, Drug, and Cosmetic Act and similar laws and regulations in the U.S. and around the world. In addition, we are subject to various laws concerning anti-corruption and anti-bribery matters (including the FCPA and the United Kingdom Bribery Act), sales to countries or persons subject to economic sanctions and other matters affecting our international operations. Violations of these laws are punishable by criminal and/or civil sanctions, including, in some instances, fines, imprisonment and, within the U.S., exclusion from participation in government healthcare programs, including Medicare, Medicaid and Veterans Administration health programs. These laws are administered by, among others, the DOJ, the Office of Inspector General of the Department of Health and Human Services, the SEC, the OFAC, the Bureau of Industry and Security of the U.S. Department of Commerce and state attorneys general.
If we fail to comply with data privacy and security laws and regulations, we could face substantial penalties and our business, operations and financial condition could be adversely affected.
We process personal and personal health data in our business, particularly through our ZBEdge® ecosystem. In addition, some of our products and services incorporate software or information technology that processes patient health data for treatment, maintenance and other purposes. Further, we obtain and process personal data related to our employees, individual business partners (such as physicians and consultants), and website visitors located around the world. These data and information-focused activities carry additional risk.
We are subject to laws and regulations that govern the collection, use, disclosure, transfer, storage, location, disposal, processing and protection of health-related, personal and other information. The FDA has issued guidance to which we are subject concerning data security for medical devices. In addition to U.S. federal laws and regulations, a number of U.S. states have also enacted data privacy and security laws and regulations that govern the collection, use, disclosure, transfer, storage, disposal, and protection of personal information, such as social security numbers, medical and financial information, biometric data and other personal information. These laws and regulations may be more restrictive than, and not be preempted by, U.S. federal laws. The legislative and regulatory framework for privacy and data protection issues worldwide is rapidly evolving as countries continue to adopt privacy and data security laws that may apply to us, both because our operations are located in those countries and/or because we provide products and services to customers in those countries. In addition, certain of our suppliers, partners, affiliates and associates are subject to privacy, security and breach notification regulations established under these and other international, national, state and local laws. We, and certain of our suppliers, partners, affiliates and associates, are also subject to reporting requirements relating to certain data breaches and cybersecurity events.
The interpretation and enforcement of the laws and regulations described above are uncertain and subject to change, and we expect to incur substantial costs to monitor for and comply with changing and additional requirements. In addition, new and more stringent multinational, national and state privacy legislation and regulations are likely to be adopted. We cannot predict all the jurisdictions in which new legislation, regulation or enforcement might arise, the scope of such legislation, regulation and enforcement, or the potential impact to our business and operations of any such changes. Failure to comply with U.S. and international data protection laws and regulations, and the disclosure of any data or related breach, could result in government enforcement actions (which could include substantial civil and/or criminal penalties and injunctive relief), private litigation and/or adverse publicity and could have a material adverse impact on our business, financial condition or results of operations.
Pending and future product liability claims and litigation could adversely impact our financial condition and results of operations and impair our reputation.
Our business exposes us to potential product liability risks that are inherent in the design, manufacture and marketing of medical devices. In the ordinary course of business, we are the subject of product liability lawsuits alleging that component failures, manufacturing flaws, design defects or inadequate disclosure of product-related risks or product-related information resulted in an unsafe condition or injury to patients. As discussed further in Note 21 to our consolidated financial statements, we are defending product liability lawsuits relating to the Durom® Acetabular Component (“Durom Cup”), certain products within the M/L Taper and M/L Taper with Kinectiv® Technology hip stems and Versys® Femoral Head implants, and the M2a-MagnumTM hip system. We are also currently defending a number of other product liability lawsuits and claims related to various other products. Any product liability claim brought against us, with or without merit, can be costly to defend. Product liability lawsuits and claims, safety alerts or product recalls, regardless of their ultimate outcome, could have a material adverse effect on our business and reputation and on our ability to attract and retain customers.
We are substantially dependent on patent and other proprietary rights, and failing to protect such rights or to be successful in litigation related to our rights or the rights of others may result in the payment of significant monetary damages and/or royalty payments, negatively impact our ability to sell current or future products, or prohibit us from enforcing our patent and other proprietary rights against others.
Claims of intellectual property infringement and litigation regarding patent and other intellectual property rights are commonplace in our industry and are frequently time consuming and costly. At any given time, we may be involved as either plaintiff or defendant in a number of patent infringement actions, the outcomes of which may not be known for prolonged periods of time. While it is not possible to predict the outcome of patent and other intellectual property litigation, such litigation has in the past resulted in, and could in the future result in, our payment of significant monetary damages and/or royalty payments, negatively impact our ability to sell current or future products, or prohibit us from enforcing our patent and proprietary rights against others, which could have a material adverse effect on our business, finances and results of operations.
Our success depends in part on our proprietary technology, processes, methodologies and information. We rely on a combination of patent, copyright, trademark, trade secret and other intellectual property laws and nondisclosure, license, assignment and confidentiality arrangements to establish, maintain and protect our proprietary rights, as well as the intellectual property rights of third parties whose assets we license. However, the steps we have taken to protect our intellectual property rights, and the rights of those from whom we license intellectual property, may not be adequate to prevent unauthorized use, misappropriation or theft of our intellectual property. Further, our currently pending or future patent applications may not result in patents being issued to us, patents issued to or licensed by us in the past or in the future may be challenged or circumvented by competitors, and such patents may be found invalid, unenforceable or insufficiently broad to protect our technology or to provide us with any competitive advantage. Third parties could obtain patents that may require us to negotiate licenses to conduct our business, and the required licenses may not be available on reasonable terms or at all. We also cannot be certain that others will not independently develop substantially equivalent proprietary information.
In addition, intellectual property laws differ in various jurisdictions in which we operate and are subject to change at any time, which could further restrict our ability to protect our intellectual property and proprietary rights. In particular, a portion of our revenues is derived from jurisdictions where adequately protecting intellectual property rights may prove more challenging or impossible. We may also not be able to detect unauthorized uses or take timely and effective steps to remedy unauthorized conduct. To prevent or respond to unauthorized uses of our intellectual property, we might be required to engage in costly and time-consuming litigation or other proceedings and we may not ultimately prevail. Any failure to establish, maintain or protect our intellectual property or proprietary rights could have a material adverse effect on our business, financial condition, or results of operations.
We are involved in legal proceedings that may result in adverse outcomes.
In addition to intellectual property and product liability claims and lawsuits, we are involved in various other litigation, claims and other proceedings that arise from time to time. Although we believe there are substantial defenses in these matters, litigation and other claims are subject to inherent uncertainties and management’s view of these matters may change in the future. Given the uncertain nature of legal proceedings generally, we are not able in all cases to estimate the amount or range of loss that could result from an unfavorable outcome. We could in the future incur judgments or enter into settlements of claims that could have a material adverse effect on our financial results in any particular period.
Risks Related to Our Organizational Documents and Jurisdiction of Incorporation
Anti-takeover provisions in our organizational documents could delay or prevent a change of control.
Certain provisions of our Restated Certificate of Incorporation, our Restated By-Laws and the Delaware General Corporation Law may have an anti-takeover effect and may delay, complicate, defer or prevent a merger, acquisition, tender offer, takeover attempt or other change of control transaction, including those that a stockholder might consider in its best interest, that might result in a premium over the market price for the shares held by our stockholders, or that may be considered beneficial by many of our stockholders. As a result, our stockholders may be limited in their ability to obtain a premium for their shares.
Our Restated By-Laws designate certain Delaware courts as the sole and exclusive forum for certain types of actions and proceedings that may be initiated by our stockholders, which could limit our stockholders’ ability to obtain a favorable judicial forum for disputes with us or our directors, officers or other employees.
Our Restated By-Laws provide that, unless we consent in writing to the selection of an alternative forum, a state court located within the State of Delaware (or, if no state court located in the State of Delaware has jurisdiction, the federal district court for the District of Delaware) will be the sole and exclusive forum for any stockholder (including any beneficial owner) to bring certain actions against us or on behalf of the Company. Any person or entity purchasing or otherwise acquiring any interest in shares of our common stock is deemed to have received notice of and consented to this provision. This choice of forum provision may limit a stockholder’s ability to bring a claim in a judicial forum that it finds favorable for disputes with us or our directors, officers or other employees, which may discourage such lawsuits against us and our directors, officers and employees. Alternatively, if a court were to find this choice of forum provision inapplicable to, or unenforceable in respect of, one or more of the specified types of actions or proceedings, we may incur additional costs associated with resolving such matters in other jurisdictions, which could adversely affect our business, financial condition or results of operations.
Not Applicable.
Item 1C. Cybersecurity
Risk Management and Strategy
We have established a cybersecurity program intended to protect the confidentiality, integrity and availability of our systems, data and products in a manner consistent with industry best practices and the National Institute of Standards and Technology (“NIST”) Cybersecurity Framework. We are currently ISO 27001 certified for our surgery planning ecosystem and plan to continue to maintain this industry certification. We evaluate and monitor cybersecurity risk as part of our overall enterprise risk management framework. Our cybersecurity program includes a variety of processes to assess, identify and manage risks from cybersecurity threats arising from our own and third-party provided systems, including customized annual training requirements, simulation exercises, threat monitoring and detection tools (including those using artificial intelligence and machine learning), threat containment methods, risk assessments, third-party penetration testing and security requirements for our suppliers and other third parties. We assess third party cybersecurity controls through a cybersecurity questionnaire and include security and privacy addenda to our contracts where applicable. We maintain separation of duties between our cybersecurity organization and other IT functional areas as well as established roles that define the responsibility of the cybersecurity team within our organization.
Under our program, cybersecurity issues are analyzed by subject matter experts, including those in information security, information technology, risk, and other areas to evaluate potential security, financial, operational, reputational and other risks, as well as to identify any potential data breaches or other cybersecurity incidents. Matters involving potential data breaches and other cybersecurity incidents are considered against applicable escalation and notification requirements. We monitor and periodically enhance our cybersecurity program, processes, techniques and procedures to combat evolving and adaptive cybersecurity threats.
We engage third parties to enhance and strengthen our cybersecurity program, to provide additional capabilities and support and to provide annual independent assessments and evaluations of our cybersecurity program. Third parties
also provide managed services for incident response, proactive threat identification services, security architecture consulting, security remediation services, patching and external audit services.
Like other large multi-national corporations, we regularly experience cybersecurity incidents, and we expect to continue to be subject to such incidents. To date, there have not been any previous cybersecurity incidents that materially affected us. However, we are subject to ongoing risks from cybersecurity threats that could materially affect us, including our business strategy, results of operations, or financial condition, as further described in Item 1A. Risk Factors - We and our business partners are dependent on sophisticated information technology and if we fail to effectively maintain or protect our information systems and data, including from cybersecurity events, our business could be adversely affected.
Governance
The Audit Committee of the Board of Directors oversees our cybersecurity program. It considers cybersecurity risk individually and within our overall risk management framework. We obtain periodic assessments of our cybersecurity program from independent third party experts, the results of which assessments are reported to the Audit Committee. Additionally, cybersecurity threats and incidents determined through our cybersecurity program to present potential material impacts to our financial results, operations, and/or reputation are required to be immediately reported to the Audit Committee in accordance with our escalation framework.
Our VP, IT Global Infrastructure (“ITGI”) leads our cybersecurity program through our global information security operations team and also leads our IT Governance, Risk and Compliance and Incident Response functions. Our acting Chief Information Security Officer (“CISO”) leads our security operations functions. Our CISO has over 10 years of experience in information technology security obtained in civilian and military roles and our ITGI has over 20 years of experience in information technology and cybersecurity leadership obtained in civilian roles. As part of our cybersecurity program, our CISO and/or our Chief Information and Technology Officer regularly report on cybersecurity matters to our Audit Committee. As of December 31, 2024, our Cybersecurity, Risk and Compliance teams consisted of team members and contractors, many of whom have advanced degrees and cybersecurity-related industry certifications. Under the direction of our ITGI and CISO, we monitor developments that could affect our long-term organizational cybersecurity strategy based on threats globally and to continually enhance our cybersecurity program in response to such developments.
We have established processes providing for timely review of cybersecurity incidents by a cross-functional subcommittee of our Disclosure Committee to evaluate such incidents for potential disclosure, and to ensure that the members of management responsible for overseeing the operation of our disclosure controls and procedures are informed of such cybersecurity risks and incidents. This subcommittee consists of leading representatives from our information security, accounting, legal and internal audit functions and may be supplemented by other subject matter experts depending on the nature of cybersecurity incidents under review. The subcommittee meets on a periodic and ad hoc basis to receive reports about cybersecurity incidents and our cybersecurity program. The subcommittee escalates certain cybersecurity incidents to the Disclosure Committee within our escalation framework. Additionally, our escalation framework requires that any cybersecurity incidents determined to be material be immediately reported to the Audit Committee.
Item 2. Properties
We own or lease approximately 300 different facilities around the world, of which approximately half are in the U.S. Our corporate headquarters is in Warsaw, Indiana. Warsaw, Indiana is also home to our most significant manufacturing, research and development (“R&D”) and other business activities for our Knees, Hips and S.E.T. product divisions. Internationally, our EMEA regional headquarters is in Switzerland and our Asia Pacific regional headquarters is in Singapore.
We have approximately 25 manufacturing locations in the U.S. and internationally. Our most significant locations outside of the U.S. are in Switzerland, Ireland, China, and Puerto Rico. We primarily own our manufacturing facilities in the U.S.; internationally, we occupy both owned and leased manufacturing facilities.
We maintain sales and administrative offices and warehouse and distribution facilities in more than 45 countries around the world. These local market facilities are primarily leased due to common businesses practices and to allow us to be more adaptable to changing needs in the market.
We distribute our products both through large, centralized warehouses and through smaller, market specific facilities, depending on the needs of the market. We maintain large, centralized warehouses in the U.S. and the Netherlands to be able to efficiently distribute our products to customers in the U.S. and EMEA.
We believe that all of the facilities and equipment are in good condition, well maintained and able to operate at present levels. We believe the current facilities, including manufacturing, warehousing, R&D and office space, provide sufficient capacity to meet ongoing demands.
Item 3. Legal Proceedings
Information pertaining to certain legal proceedings in which we are involved can be found in Note 21 to our consolidated financial statements included in Part II, Item 8 of this report and is incorporated herein by reference.
Item 4. Mine Safety Disclosures
Not Applicable.
PART II
Item 5. Market for the Registrant’s Common Equity, Related Stockholder Matters and Issuer Purchases of Equity Securities
Market for the Registrant’s Common Equity and Related Stockholder Matters
Our common stock is traded on the New York Stock Exchange and the SIX Swiss Exchange under the symbol “ZBH.” As of February 10, 2025, there were approximately 12,544 holders of record of our common stock. A substantially greater number of holders of our common stock are “street name” or beneficial holders, whose shares of record are held by banks, brokers and other financial institutions.
We expect to continue paying cash dividends on a quarterly basis; however, future dividends are subject to approval of the Board of Directors and may be adjusted as business needs or market conditions change.
The information required by this Item concerning equity compensation plans is incorporated herein by reference to Item 12 of this report.
The graph below shows the cumulative total stockholder return on our common stock compared to the S&P 500 Stock Index and the S&P 500 Health Care Equipment Index. The chart assumes $100 was invested on December 31, 2019 in Zimmer Biomet common stock and each index and that dividends were reinvested. Returns over the indicated period should not be considered indicative of future returns.
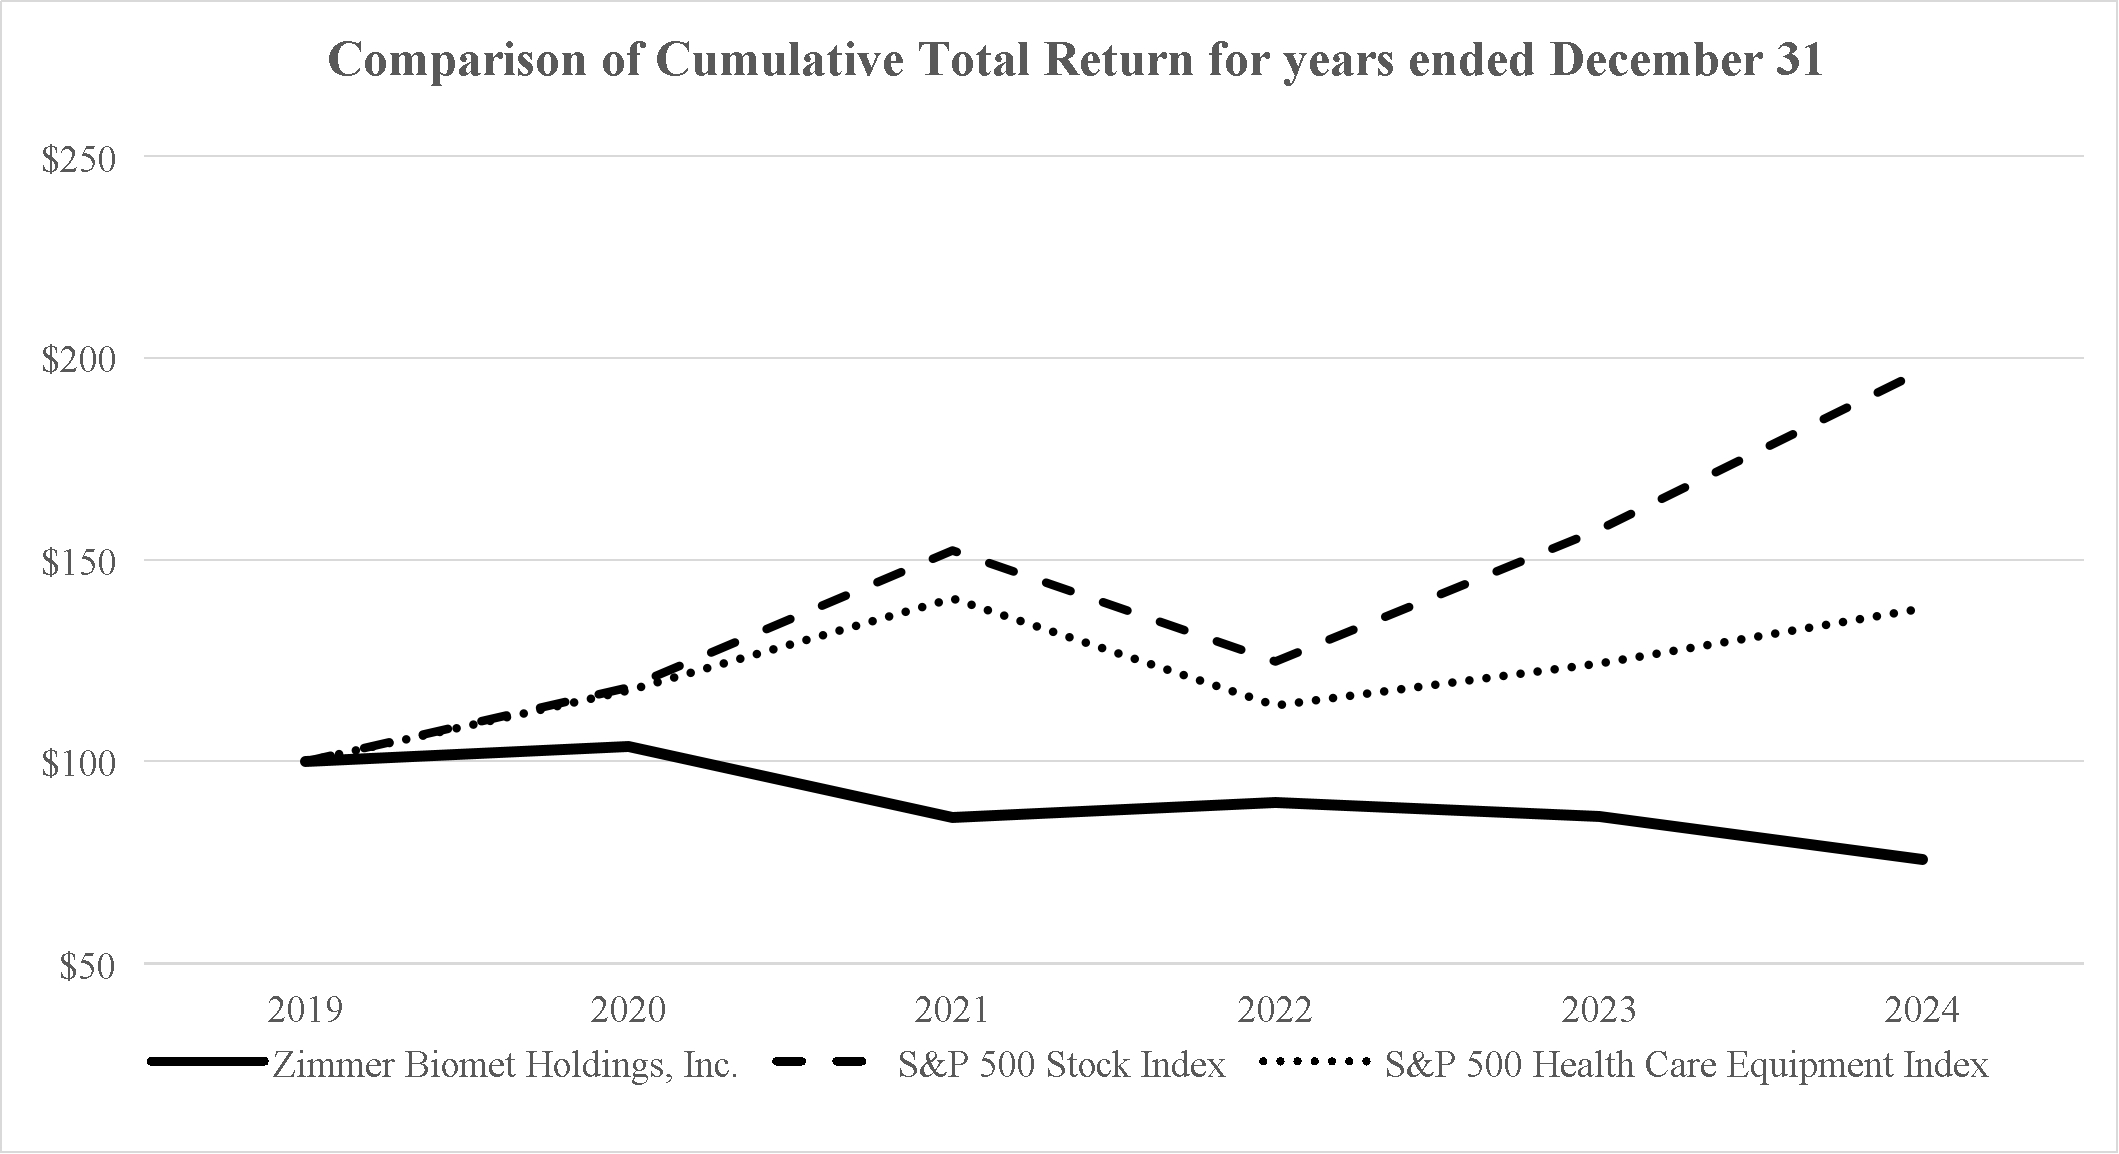
| | | | | | | | | | | | | | | | | | | | | | | | |
| | December 31, | |
Company/Index | | 2019 | | | 2020 | | | 2021 | | | 2022 | | | 2023 | | | 2024 | |
Zimmer Biomet Holdings, Inc. | | $ | 100.00 | | | $ | 103.76 | | | $ | 86.09 | | | $ | 89.80 | | | $ | 86.38 | | | $ | 75.61 | |
S&P 500 Stock Index | | | 100.00 | | | | 118.40 | | | | 152.39 | | | | 124.79 | | | | 157.59 | | | | 197.02 | |
S&P 500 Health Care Equipment Index | | | 100.00 | | | | 117.63 | | | | 140.40 | | | | 113.92 | | | | 124.22 | | | | 137.81 | |
Issuer Purchases of Equity Securities
The following table summarizes repurchases of common stock settled during the three months ended December 31, 2024:
| | | | | | | | | | | | | | | | |
Period | | Total Number of Shares Purchased | | | Average Price Paid per Share | | | Total Number of Shares Purchased as a Part of Publicly Announced Program(1) | | | Maximum Approximate Dollar Value of Shares that may yet be
Purchased Under the Program(1) | |
October 2024 | | | 554,874 | | | $ | 104.62 | | | | 554,874 | | | $ | 1,249,999,420 | |
November 2024 | | | - | | | | - | | | | - | | | | 1,249,999,420 | |
December 2024 | | | - | | | | - | | | | - | | | | 1,249,999,420 | |
Total | | | 554,874 | | | $ | 104.62 | | | | 554,874 | | | $ | 1,249,999,420 | |
(1) In May 2024, our Board of Directors authorized a $2.0 billion share repurchase program effective May 29, 2024, with no expiration date.
Item 6. [Reserved]
Item 7. Management’s Discussion and Analysis of Financial Condition and Results of Operations
On March 1, 2022, we completed the spinoff of our spine and dental businesses into ZimVie. The historical results of our spine and dental businesses have been reflected as discontinued operations in our consolidated financial statements in our 2022 results through the date of the spinoff. See Note 3 to our consolidated financial statements for additional information. The following discussion and analysis is presented on a continuing operations basis unless otherwise noted.
The following discussion and analysis should be read in conjunction with the consolidated financial statements and the corresponding notes included elsewhere in this Annual Report on Form 10-K. Amounts reported in millions within this Annual Report on Form 10-K are computed based on the actual amounts. As a result, the sum of the components may not equal the total amount reported in millions due to rounding. In addition, certain columns and rows within tables may not sum to the totals due to the use of rounded numbers. Percentages presented are calculated from the underlying unrounded amounts.
The following discussion, analysis and comparisons generally focus on the operating results for the years ended December 31, 2024 and 2023. Discussion, analysis and comparisons of the years ended December 31, 2023 and 2022 that are not included in this Form 10-K can be found in “Management's Discussion and Analysis of Financial Condition and Results of Operations” in Exhibit 99.1 to our Current Report on Form 8-K filed on August 7, 2024. The Current Report on Form 8-K filed on August 7, 2024 was filed solely to recast financial information and related disclosures contained in our Annual Report on Form 10-K for the year ended December 31, 2023 to reflect changes to the operating profit measures of our operating segments.
EXECUTIVE LEVEL OVERVIEW
2024 Financial Highlights
In 2024, our net sales increased 3.8 percent when compared to 2023. Net sales growth was driven by a combination of market growth, new product introductions, positive price realization and commercial execution across the organization. These favorable items were negatively impacted by our transition in July 2024 to a new enterprise resource planning ("ERP") software system for a significant portion of our U.S. and Canada sales and commercial operations. As a result of this ERP implementation, we experienced operational challenges which affected our ability to fulfill certain customer orders. This disruption mostly affected our U.S. net sales, but our International net sales were also impacted as shipments to our international affiliates were delayed. Shipping levels returned to similar levels that existed prior to the implementation by the end of the year. For the full year 2024, we estimate this ERP implementation had less than a one percent impact to our net sales. In addition, our net sales in 2024 were tempered by a negative 1.0 percent effect from changes in foreign currency exchange rates.
Our net earnings were $903.8 million in 2024 compared to $1,024.0 million in 2023. The decline in net earnings was driven by higher favorable tax settlements in 2023 compared to 2024, higher charges from our 2023 Restructuring Plan which was instituted at the end of 2023 and continued into 2024, including $84.6 million in employee termination benefits-related charges recognized in 2024, and higher intangible asset amortization. These unfavorable items were partially offset by the net sales increase, savings from our 2023 Restructuring Plan and other initiatives, and lower research and development ("R&D") spending for initial compliance with the European Union Medical Device Regulation ("EU MDR").
2025 Outlook (excludes any impacts from the proposed Paragon 28, Inc. acquisition)
We expect year-over-year revenue growth of 1.0 percent to 3.5 percent in 2025 to be driven by a combination of market growth, new product introductions and commercial execution. Based on foreign currency exchange rates at the end of 2024, we expect foreign currency to negatively affect year-over-year net sales by approximately 1.5 percent to 2.0 percent. We estimate operating profit will increase in 2025 when compared to 2024 due to higher net sales, leverage from fixed operating expenses, ongoing savings from our restructuring plans and lower employee termination and other charges from our restructuring plans. However, we estimate these favorable items may be partially offset by higher intangible asset amortization, higher net interest expense due to higher interest rates and a higher estimated effective tax rate due to favorable 2024 adjustments that are not expected to recur.
RESULTS OF OPERATIONS
We review sales by two geographies, the United States and International, and by the following product categories: Knees; Hips; S.E.T. (Sports Medicine, Extremities, Trauma, Craniomaxillofacial and Thoracic); and Technology & Data, Bone Cement and Surgical. This sales analysis differs from our reportable operating segments, which are based upon our senior management organizational structure and how we allocate resources toward achieving operating profit goals. We review sales by these geographies because the underlying market trends in any particular geography tend to be similar across product categories, because we primarily sell the same products in all geographies and because many of our competitors publicly report in this manner. Our business is seasonal in nature to some extent, as many of our products are used in elective surgical procedures, which typically decline during the summer months and can increase at the end of the year once annual deductibles have been met on health insurance plans.
Net Sales by Geography
The following table presents net sales by geography and the percentage changes (dollars in millions):
| | | | | | | | | | | | | | | | | | | | | |
| | Year Ended December 31, | | | | | | | | |
| | 2024 | | | 2023 | | | 2022 | | | 2024 vs. 2023
% Inc | | | 2023 vs. 2022
% Inc | | |
United States | | $ | 4,439.0 | | | $ | 4,288.8 | | | $ | 4,012.4 | | | | 3.5 | | % | | 6.9 | | % |
International | | | 3,239.6 | | | | 3,105.4 | | | | 2,927.5 | | | | 4.3 | | | | 6.1 | | |
Total | | $ | 7,678.6 | | | $ | 7,394.2 | | | $ | 6,939.9 | | | | 3.8 | | | | 6.5 | | |
Net Sales by Product Category
The following table presents net sales by product category and the percentage changes (dollars in millions):
| | | | | | | | | | | | | | | | | | | | | |
| | Year Ended December 31, | | | | | | | | |
| | 2024 | | | 2023 | | | 2022 | | | 2024 vs. 2023
% Inc | | | 2023 vs. 2022
% Inc | | |
Knees | | $ | 3,173.5 | | | $ | 3,038.4 | | | $ | 2,778.3 | | | | 4.4 | | % | | 9.4 | | % |
Hips | | | 1,999.1 | | | | 1,967.2 | | | | 1,894.9 | | | | 1.6 | | | | 3.8 | | |
S.E.T. | | | 1,865.7 | | | | 1,752.6 | | | | 1,696.7 | | | | 6.5 | | | | 3.3 | | |
Technology & Data, Bone Cement and Surgical | | | 640.3 | | | | 636.0 | | | | 570.0 | | | | 0.7 | | | | 11.6 | | |
Total | | $ | 7,678.6 | | | $ | 7,394.2 | | | $ | 6,939.9 | | | | 3.8 | | | | 6.5 | | |
The following table presents net sales by product category by geography for our Knees and Hips product categories (dollars in millions):
| | | | | | | | | | | | | | | | | | | | | |
| | Year Ended December 31, | | | | | | | | |
| | 2024 | | | 2023 | | | 2022 | | | 2024 vs. 2023
% Inc | | | 2023 vs. 2022
% Inc | | |
Knees | | | | | | | | | | | | | | | | |
United States | | $ | 1,814.7 | | | $ | 1,770.6 | | | $ | 1,615.0 | | | | 2.5 | | % | | 9.6 | | % |
International | | | 1,358.8 | | | | 1,267.8 | | | | 1,163.3 | | | | 7.2 | | | | 9.0 | | |
Total | | $ | 3,173.5 | | | $ | 3,038.4 | | | $ | 2,778.3 | | | | 4.4 | | | | 9.4 | | |
Hips | | | | | | | | | | | | | | | | |
United States | | $ | 1,040.0 | | | $ | 1,012.3 | | | $ | 960.9 | | | | 2.7 | | % | | 5.4 | | % |
International | | | 959.1 | | | | 954.9 | | | | 934.0 | | | | 0.4 | | | | 2.2 | | |
Total | | $ | 1,999.1 | | | $ | 1,967.2 | | | $ | 1,894.9 | | | | 1.6 | | | | 3.8 | | |
Demand (Volume/Mix) Trends
Changes in volume and mix of product sales had a positive effect of 4.2 percent on year-over-year sales growth in 2024. Market growth and new product introductions contributed positively to volume and mix trends, but were
partially offset by the operational challenges resulting from our ERP implementation. Market growth is being driven by an aging and active population, technological advancements, and data showcasing positive clinical outcomes among other factors.
Pricing Trends
Global selling prices had a positive effect of 0.6 percent on year-over-year sales growth in 2024. The majority of countries in which we operate continue to experience pricing pressure from local hospitals, health systems, and governmental healthcare cost containment efforts. However, we have had success in offsetting negative effects of pricing pressure due to internal initiatives and being able to pass some inflationary impacts on to customers.
Foreign Currency Exchange Rates
In 2024, changes in foreign currency exchange rates had a negative effect of 1.0 percent on year-over-year sales.
Geography
The 3.5 percent net sales growth in the U.S. in 2024 when compared to 2023 was driven by market growth in our Knees, Hips and S.E.T. product categories. However, net sales in the U.S. were negatively impacted by the implementation of our new ERP system which caused operational challenges in fulfilling customer orders. Internationally, net sales increased by 4.3 percent in 2024 when compared to 2023. The 2024 International net sales increase was similarly driven by market growth in most of our international markets, but volume increases were partially offset by the negative impacts of changes in foreign currency exchange rates of 2.3 percent.
Product Categories
In 2024, our Knees and Hips net sales increased by 4.4 percent and 1.6 percent, respectively, when compared to 2023 due to market growth and new product introductions. Changes in foreign currency exchange rates had negative effects of 0.8 percent and 1.4 percent on 2024 Knees and Hips net sales, respectively. S.E.T. net sales increased by 6.5 percent in 2024 when compared to 2023. S.E.T. net sales growth was primarily driven by net sales growth in CMFT, sports medicine and upper extremities products of 14.0 percent, 13.1 percent and 6.0 percent, respectively, partially offset by a 0.5 percent decline in net sales of trauma products. Changes in foreign currency exchange rates had a negative effect of 0.6 percent on 2024 S.E.T. net sales. Technology & Data, Bone Cement and Surgical product category net sales increased by 0.7 percent in 2024 when compared to 2023 primarily due to higher net sales for our ROSA robot in the first half of the year, but was partially offset by the operational challenges from our ERP system implementation.
Expenses as a Percent of Net Sales
| | | | | | | | | | | |
| | Year Ended December 31, | | | | | |
| | 2024 | | 2023 | | 2022 | | 2024 vs. 2023
Inc/(Dec) | | 2023 vs. 2022
Inc/(Dec) | |
Cost of products sold, excluding intangible asset amortization | | 28.5 | % | 28.2 | % | 29.1 | % | 0.3 | % | (0.9) | % |
Intangible asset amortization | | 7.7 | | 7.6 | | 7.6 | | 0.1 | | - | |
Research and development | | 5.7 | | 6.2 | | 5.9 | | (0.5) | | 0.3 | |
Selling, general and administrative | | 38.2 | | 38.4 | | 39.8 | | (0.2) | | (1.4) | |
Goodwill and intangible asset impairment | | - | | - | | 4.2 | | - | | (4.2) | |
Restructuring and other cost reduction initiatives | | 2.9 | | 2.1 | | 2.8 | | 0.8 | | (0.7) | |
Quality remediation | | - | | - | | 0.5 | | - | | (0.5) | |
Acquisition, integration, divestiture and related | | 0.3 | | 0.3 | | 0.2 | | - | | 0.1 | |
Operating Profit | | 16.7 | | 17.3 | | 10.0 | | (0.6) | | 7.3 | |
Cost of Products Sold and Intangible Asset Amortization
Cost of products sold, excluding intangible asset amortization, increased in both amount and as a percentage of net sales in 2024 compared to 2023. The increase in amount was primarily due to a higher volume of net sales. The increase as a percentage of net sales was due to higher manufacturing costs from inflation and other cost pressures. The manufacturing cost increase was partially offset by lower royalty expense, volume and mix shift to higher margin products and markets, and improved pricing. The reduction in royalty expense was partially the result of agreements we entered into in 2023 to acquire intellectual property through the buyout of certain licensing arrangements, which are recognized as intangible assets and result in additional intangible asset amortization expense instead of royalty expense.
Intangible asset amortization expense increased in amount and as a percentage of net sales in 2024 when compared to 2023 due to acquisitions we made in 2024 and 2023, the buyout of certain royalty-related licensing agreements as described above and other technology-based asset purchases in 2024.
We calculate gross profit as net sales minus cost of products sold and intangible asset amortization. Our gross margin percentage is gross profit divided by net sales. The following table sets forth the factors that contributed to the gross margin changes in each of 2024 and 2023 compared to the prior year:
| | | | | | | | |
| | Year Ended December 31, | |
| | 2024 | | | 2023 | |
Prior year gross margin | | | 64.2 | % | | | 63.3 | % |
Impact from selling prices | | | 0.2 | | | | (0.2 | ) |
Manufacturing costs | | | (1.2 | ) | | | (0.1 | ) |
Volume, product and market mix and other | | | 0.7 | | | | 1.4 | |
Inventory charges | | | 0.1 | | | | (0.5 | ) |
Changes in foreign currency exchange rates | | | (0.1 | ) | | | 0.3 | |
Intangible asset amortization | | | (0.1 | ) | | | - | |
Current year gross margin | | | 63.8 | % | | | 64.2 | % |
Operating Expenses
Research & development (“R&D”) expenses decreased in both amount and as a percentage of net sales in 2024 compared to 2023. The decreases were driven by lower spending on our initial compliance with the EU MDR as we continue to make progress on the approvals of our products, and savings from our 2023 Restructuring Plan.
Selling, general & administrative (“SG&A”) expenses increased in amount, but decreased as a percentage of net sales in 2024 compared to 2023. The increase in expenses was due to selling and distribution costs that are variable expenses which increase as net sales increase. In addition, SG&A expense increased due to higher bad debt-related charges driven by a bankruptcy at a significant U.S. healthcare system, higher instrument-related costs due to new product introductions, higher litigation-related charges, a gain recognized in 2023 from the sale of an asset which did not recur in 2024, and higher spending on various strategic initiatives. These higher expenses were partially offset by savings from our 2023 Restructuring Plan and lower performance-related expenses. The decline in SG&A expenses as a percentage of net sales was due to many of our SG&A expenses being fixed costs that do not change as net sales increase.
In December of each of 2023, 2021 and 2019, we initiated global restructuring programs (the “2023 Restructuring Plan,” the “2021 Restructuring Plan” and the “2019 Restructuring Plan,” respectively). We also have other cost reduction and optimization initiatives that have the goal of reducing costs across the organization. We recognized expenses of $219.0 million and $151.9 million in 2024 and 2023, respectively, primarily related to employee termination benefits, sales agent contract terminations, and consulting and project management expenses associated with these programs. The expenses were higher in 2024 compared to 2023 primarily due to additional expenses related to the 2023 Restructuring Plan that had just been initiated at the end of 2023 and additional expenses related to our U.S. and Canada ERP implementation. For more information regarding these expenses, see Note 5 to our consolidated financial statements.
Acquisition, integration, divestiture and related expenses increased in 2024 when compared to 2023 due to the acquisitions made in 2024 as well as the fact that the 2023 acquisitions only had a partial year of integration costs in 2023.
Other Expense, net, Interest Expense, net, and Income Taxes
In 2024, we incurred a loss of $31.1 million in our other expense, net compared to a loss of $9.3 million in 2023. The year-over-year change was primarily due to higher losses on debt and equity security investments in 2024 when compared to 2023.
Interest expense, net, increased in 2024 when compared to 2023, primarily from higher average debt balances, higher interest rates on new debt issued in 2024 that replaced debt that matured and higher losses incurred on our fixed-to-variable interest rate swaps in 2024.
Our effective tax rate (“ETR”) on earnings from continuing operations before income taxes was 12.7 percent and 4.0 percent for the years ended December 31, 2024 and 2023, respectively. In 2024, the ETR was primarily driven by the foreign rate differential as our foreign locations have lower corporate income tax rates and net favorable impact of changes to unrecognized tax benefits. In 2023, the ETR was primarily driven by net favorable impact of changes to unrecognized tax benefits.
Absent discrete tax events, we expect our future ETR will be lower than the U.S. corporate income tax rate of 21.0 percent due to our mix of earnings between U.S. and foreign locations, which have lower corporate income tax rates. Our ETR in future periods could also potentially be impacted by: changes in our mix of pre-tax earnings; changes in tax rates, tax laws or their interpretation, including the continued adoption of Pillar Two proposals which began to take effect in 2024; the outcome of various federal, state and foreign audits, appeals, and litigation; and the expiration of certain statutes of limitations. Currently, we cannot reasonably estimate the impact of all these items on our financial results.
See Note 17 to our consolidated financial statements for additional information on our income taxes.
Segment Operating Profit
| | | | | | | | | | | | | | | | | | | | | | | | | | | | | | | | | | | | | |
| | | | | | | | | | | | | | | | | | | | Segment Profit as a | | |
| | Net Sales | | | Segment Profit | | | Percentage of Net Sales | | |
| | Year Ended December 31, | | | Year Ended December 31, | | | Year Ended December 31, | | |
(dollars in millions) | | 2024 | | | 2023 | | | 2022 | | | 2024 | | | 2023 | | | 2022 | | | 2024 | | | 2023 | | | 2022 | | |
Americas | | $ | 4,794.8 | | | $ | 4,624.1 | | | $ | 4,295.5 | | | $ | 2,577.0 | | | $ | 2,487.1 | | | $ | 2,282.4 | | | | 53.7 | | % | | 53.8 | | % | | 53.1 | | % |
EMEA | | | 1,691.1 | | | | 1,592.4 | | | | 1,456.5 | | | | 585.8 | | | | 538.2 | | | | 416.1 | | | | 34.6 | | | | 33.8 | | | | 28.6 | | |
Asia Pacific | | | 1,192.8 | | | | 1,177.7 | | | | 1,187.8 | | | | 457.6 | | | | 432.3 | | | | 429.1 | | | | 38.4 | | | | 36.7 | | | | 36.1 | | |
Americas
In the Americas, operating profit increased, but operating profit as a percentage of net sales slightly decreased, in 2024 compared to 2023. The increase in operating profit in 2024 was primarily due to higher net sales driven by market growth and new product introductions, coupled with lower royalty expense as a result of agreements we entered into in 2023 to acquire intellectual property through the buyout of certain licensing arrangements. However, operating profit as a percentage of net sales decreased slightly due to investments in instruments to support new product introductions and higher bad debt-related charges in 2024.
EMEA
In EMEA, operating profit and operating profit as a percentage of net sales increased in 2024 when compared to 2023. The increases were due to higher net sales driven by market growth and improved pricing, lower excess and obsolete inventory charges, reduced royalty expense as a result of agreements we entered into in 2023 to acquire intellectual property through the buyout of certain licensing arrangements, and lower expenses driven by our 2023 Restructuring Plan and cost savings initiatives.
Asia Pacific
In Asia Pacific, operating profit and operating profit as a percentage of net sales increased in 2024 when compared to 2023. The increases were due to higher net sales driven by market growth and improved pricing, reduced royalty expense as a result of agreements we entered into in 2023 to acquire intellectual property through the buyout of certain licensing arrangements, and lower expenses driven by our 2023 Restructuring Plan and cost savings initiatives.
LIQUIDITY AND CAPITAL RESOURCES
As of December 31, 2024, we had $525.5 million in cash and cash equivalents. In addition, we had $1.0 billion available to borrow under a 364-day revolving credit agreement that matures on June 27, 2025, and $1.5 billion available under a five-year revolving facility that matures on June 28, 2029. The terms of the 364-day revolving credit agreement and the five-year revolving facility are described further in Note 13 to our consolidated financial statements.
We believe that cash flows from operations, our cash and cash equivalents on hand, and available borrowings under our revolving credit facilities will be sufficient to meet our ongoing liquidity requirements for at least the next twelve months. However, it is possible our needs may change. Further, there can be no assurance that, if needed, we will be able to secure additional financing on terms favorable to us, if at all.
Sources of Liquidity
Cash flows provided by operating activities from continuing operations were $1,499.4 million in 2024 compared to $1,581.6 million in 2023. The decrease in 2024 was primarily due to a higher volume of accounts payable payments near the end of 2024 relative to 2023 as well as higher bonus, income tax and restructuring-related payments. These unfavorable items were partially offset by lower inventory investments in 2024 when compared to 2023.
Cash flows used in investing activities from continuing operations were $888.1 million in 2024 compared to $778.9 million in 2023. Instrument and property, plant and equipment additions reflected ongoing investments in our product portfolio, including new product introductions, optimization of our manufacturing and logistics networks, and investments in ERP software. The decline in property, plant and equipment additions in 2024 when compared to 2023 was driven by lower ERP software spend as that project is getting implemented, in addition to 2023 including investment in a corporate aircraft which did not recur in 2024. In addition, in 2024 we paid $276.3 million related to acquisitions and $153.0 million to acquire the ownership rights or gain access to various technologies that were recognized as intangible assets.
Cash flows used in financing activities from continuing operations were $484.5 million in 2024 compared to $763.5 million in 2023. In 2024, we issued senior notes for $1,436.3 million and used the proceeds, along with cash on hand, to repurchase $868.0 million of our common stock, redeem $850.0 of our senior notes and repay a net $50.0 million under an uncommitted credit facility. In 2023, we used the proceeds from draws on our existing credit facilities, along with cash on hand, to repurchase $692.2 million of our common stock. In 2023, we issued senior notes for $499.8 million and used those proceeds to repay amounts outstanding under our existing credit facilities and for general corporate purposes, such that we repaid a net $325.0 million on our various revolving credit facilities and $120.2 million of other debt obligations that were due in the first quarter of 2023.
We place our cash and cash equivalents in highly-rated financial institutions and limit the amount of credit exposure to any one entity. We invest only in high-quality financial instruments in accordance with our internal investment policy.
As of December 31, 2024, $436.8 million of our cash and cash equivalents were held in jurisdictions outside of the U.S. Of this amount, $59.3 million is denominated in U.S. Dollars and, therefore, bears no foreign currency translation risk. The remaining amount is denominated in currencies of the various countries where we operate. As discussed in Note 17 to our consolidated financial statements, we generally intend to limit distributions such that they would not result in significant U.S. tax costs.
Material Cash Requirements from Known Contractual and Other Obligations
At December 31, 2024, we had outstanding debt of $6,204.6 million, of which $863.0 million was classified as current debt that matures on April 1, 2025. We believe we can satisfy these debt obligations with cash generated from our operations, by issuing new debt and/or by borrowing on our committed revolving credit facilities.
For additional information on our debt, including types of debt, maturity dates, interest rates, debt covenants and available revolving credit facilities, see Note 13 to our consolidated financial statements.
In January 2025, we entered into a definitive agreement to acquire all outstanding shares of Paragon 28, Inc (“Paragon 28”). The proposed transaction will require initial consideration of approximately $1.2 billion to be paid at closing, which is expected to occur in the first half of 2025. We expect to fund the proposed transaction through a combination of cash on hand and other available debt financing sources. See Note 22 to our consolidated financial statements for additional information related to this proposed transaction.
In February 2025, we issued senior notes with aggregate principal amounts of $600 million of 4.700% notes due 2027 (“2027 Notes”), $550 million of 5.050% notes due 2030 (“2030 Notes”), and $600 million of 5.500% notes due 2035 (“2035 Notes”). We intend to use the net proceeds from these notes, together with cash on hand or other immediately available funds, to pay the consideration, fees, and expenses for the Paragon 28 acquisition. We further intend to use a portion of the proceeds of the 2027 Notes for general corporate purposes, which may include the repayment of other indebtedness (which could include the repayment of our 3.550% notes due April 1, 2025), share repurchases, financing capital commitments and financing future acquisitions. If we fail to consummate the Paragon 28 acquisition either (i) prior to November 28, 2025 (as such date may be extended in accordance with the terms of the Paragon 28 merger agreement and the supplemental indenture governing the 2030 Notes and the 2035 Notes); or (ii) due to the termination of Paragon 28 merger agreement pursuant to its terms, then we will be obligated to redeem all of the 2030 notes and the 2035 notes on the special mandatory redemption date at a redemption price equal to 101% of the principal amount of such series of notes, plus accrued and unpaid interest to, but excluding, the special mandatory redemption date.
In March, May, August and December 2024, our Board of Directors declared cash dividends of $0.24 per share. We expect to continue paying cash dividends on a quarterly basis; however, future dividends are subject to approval of the Board of Directors and may be adjusted as business needs or market conditions change.
In May 2024, our Board of Directors authorized a $2.0 billion share repurchase program effective May 29, 2024, with no expiration date. In 2024, we executed share repurchases under this new repurchase program as well as a previous program in an aggregate amount of $868.0 million to return cash to investors as well as to limit ownership dilution from the issuance of common stock under our share-based compensation programs and in connection with our acquisition of Embody, Inc. As of December 31, 2024, $1,250.0 million remained authorized under this program.
As discussed in Note 5 to our consolidated financial statements, we are executing on a 2023 Restructuring Plan, a 2021 Restructuring Plan and a 2019 Restructuring Plan. The 2023 Restructuring Plan along is expected to result in total pre-tax charges of approximately $120 million by the end of 2025, of which $114 million was incurred through December 31, 2024. We expect to reduce gross annual pre-tax operating expenses by $175 million to $200 million relative to the 2023 baseline expenses by the end of 2025 as program benefits under the 2023 Restructuring Plan are realized. The 2021 Restructuring Plan was completed by the end of 2024, resulting in $169 million of total pre-tax charges. We estimate gross annual pre-tax operating expenses were reduced by approximately $190 million relative to the 2021 baseline expenses by the end of 2024. The 2019 Restructuring Plan is expected to result in total pre-tax restructuring charges of approximately $400 million by the end of 2025, of which $368 million was incurred through December 31, 2024. In our original estimates, we expected to reduce gross annual pre-tax operating expenses by approximately $180 million to $280 million relative to the 2019 baseline expenses by the end of 2023 as benefits under the 2019 Restructuring Plan were realized. Our latest estimates indicate that we will be near the low end of that range, and the full benefits will not be realized until we complete the closure of a manufacturing facility, which is expected to occur in 2025.
As discussed in Note 17 to our consolidated financial statements, the IRS has issued proposed adjustments for years 2013 through 2015 and for years 2016 through 2019. We have disputed these proposed adjustments and intend to continue to vigorously defend our positions. Although the ultimate timing for resolution of the disputed tax issues is uncertain, future payments may be significant to our operating cash flows.
Under the Tax Cuts and Jobs Act of 2017, we have a $154.6 million liability remaining from a one-time tax on the mandatory deemed repatriation of post-1986 untaxed foreign earnings and profits (“transition tax”) for the deemed repatriation of unremitted foreign earnings. As of December, 31, 2024, $68.7 million and $85.9 million of this amount is recorded in current income tax liabilities and non-current income tax liabilities, respectively, on our consolidated balance sheet.
As discussed in Note 21 to our consolidated financial statements, we are involved in various litigation matters. We estimate the total liabilities for all litigation matters was $156.4 million as of December 31, 2024. However,
litigation is inherently uncertain, and upon resolution of any of these uncertainties, we may incur charges in excess of these estimates, and may in the future incur other material judgments or enter into other material settlements of claims. We expect to pay these liabilities over the next few years.
In the normal course of business, we enter into purchase commitments, primarily related to raw materials. However, we do not believe these purchase commitments are material to the overall standing of our business or our liquidity.
We have entered into development, distribution and other contractual arrangements that may result in future payments dependent upon various events such as the achievement of certain product R&D milestones, sales milestones, or exclusive rights to distribute a product. Since there is uncertainty on the timing or whether such payments will have to be made, they have not been recognized on our consolidated balance sheets. These estimated payments related to these agreements could range from $0 to $325 million.
CRITICAL ACCOUNTING ESTIMATES
The preparation of our financial statements is affected by the selection and application of accounting policies and methods, and also requires us to make estimates and assumptions that affect the reported amounts of assets and liabilities and disclosure of contingent assets and liabilities at the date of the financial statements and the reported amounts of revenues and expenses during the reporting period. Critical accounting estimates are those that involve a significant level of estimation uncertainty and have had or are reasonably likely to have a material impact on our financial condition and results of operations. We believe that the accounting estimates and assumptions described below involve significant subjectivity and judgment, and changes to such estimates or assumptions could have a material impact on our financial condition or operating results.
Excess Inventory and Instruments - We must determine as of each balance sheet date how much, if any, of our inventory may ultimately prove to be unsaleable or unsaleable at our carrying cost. Similarly, we must also determine if instruments on hand will be put to productive use or remain undeployed as a result of excess supply. Accordingly, inventory and instruments are written down to their net realizable value. To determine the appropriate net realizable value, we evaluate current stock levels in relation to historical and expected patterns of demand for all of our products and instrument systems and components. The basis for the determination is generally the same for all inventory and instrument items and categories except for work in process inventory, which is recorded at cost. Obsolete or discontinued items are generally destroyed and completely written off. Management evaluates the need for changes to the net realizable values of inventory and instruments based on market conditions, competitive offerings and other factors on a regular basis.
Income Taxes - Our income tax expense, deferred tax assets and liabilities and reserves for unrecognized tax benefits reflect management’s best assessment of estimated future taxes to be paid. We are subject to income taxes in the U.S. and numerous foreign jurisdictions. Significant judgments and estimates are required in determining the consolidated income tax expense.
We estimate income tax expense and income tax liabilities and assets by taxable jurisdiction. Realization of deferred tax assets in each taxable jurisdiction is dependent on our ability to generate future taxable income sufficient to realize the benefits. We evaluate deferred tax assets on an ongoing basis and provide valuation allowances unless we determine it is “more likely than not” that the deferred tax benefit will be realized.
The calculation of our tax liabilities involves dealing with uncertainties in the application of complex tax laws and regulations in numerous jurisdictions across our global operations. We are subject to regulatory review or audit in virtually all of those jurisdictions and those reviews and audits may require extended periods of time to resolve. We record our income tax provisions based on our knowledge of all relevant facts and circumstances, including existing tax laws, our experience with previous settlement agreements, the status of current examinations and our understanding of how the tax authorities view certain relevant industry and commercial matters.
We recognize tax liabilities in accordance with the Financial Accounting Standards Board (“FASB”) guidance on income taxes and we adjust these liabilities when our judgment changes as a result of the evaluation of new information not previously available. Due to the complexity of some of these uncertainties, the ultimate resolution may result in a payment that is materially different from our current estimate of the tax liabilities. These differences will be reflected as increases or decreases to income tax expense in the period in which they are determined.
Commitments and Contingencies - We are involved in various ongoing proceedings, legal actions and claims, including product liability, intellectual property, stockholder matters, tax disputes, commercial disputes, employment matters, whistleblower and qui tam claims and investigations, governmental proceedings and investigations, and other legal matters that arise in the normal course of our business. We establish liabilities for loss contingencies when it is probable that a loss has been incurred and the amount of the loss can be reasonably estimated. Accruals for product liability and other claims are established with the assistance of internal and external legal counsel based on current information and historical settlement information for claims, related legal fees and for claims incurred but not reported.
Goodwill and Intangible Assets - We evaluate the carrying value of goodwill and indefinite life intangible assets annually, or whenever events or circumstances indicate that the fair value is below its carrying amount. We evaluate the carrying value of finite life intangible assets whenever events or circumstances indicate the carrying value may not be recoverable. Significant assumptions are required to estimate the fair value of goodwill and intangible assets, most notably estimated future cash flows generated by these assets and risk-adjusted discount rates. As such, these fair value measurements use significant unobservable inputs. Changes to these assumptions could require us to record impairment charges on these assets.
We have four reporting units with goodwill assigned to them. During our annual goodwill impairment testing in the fourth quarter of 2024, for the three reporting units we quantitatively tested their estimated fair values exceeded their carrying values by more than 30 percent. We estimated the fair value of these reporting units using the income and market approaches. Fair value under the income approach was determined by discounting to present value the estimated future cash flows of the reporting unit. Fair value under the market approach utilized the guideline public company methodology, which uses valuation indicators determined from other businesses that are similar to our reporting unit. We performed a qualitative test on the other reporting unit and concluded it was more likely than not the fair value of this reporting unit exceeded its carrying value.
Future impairment in our reporting units could occur if the estimates used in the income and market approaches change. If our estimates of profitability in the reporting unit decline, the fair value estimate under the income approach will decline. Additionally, changes in the broader economic environment could cause changes to our estimated discount rates and comparable company valuation indicators, which may impact our estimated fair values. Further, changes in foreign currency exchange rates could increase the cost of procuring inventory and services from foreign suppliers, which could reduce reporting unit profitability.
RECENT ACCOUNTING PRONOUNCEMENTS
See Note 2 to our consolidated financial statements for information on how recent accounting pronouncements have affected or may affect our financial position, results of operations or cash flows.
Item 7A. Quantitative and Qualitative Disclosures About Market Risk
MARKET RISK
We are exposed to certain market risks as part of our ongoing business operations, including risks from changes in foreign currency exchange rates, interest rates and commodity prices that could affect our financial condition, results of operations and cash flows. We manage our exposure to these and other market risks through regular operating and financing activities and through the use of derivative financial instruments. We use derivative financial instruments solely as risk management tools and not for speculative investment purposes.
FOREIGN CURRENCY EXCHANGE RISK
We operate on a global basis and are exposed to the risk that our financial condition, results of operations and cash flows could be adversely affected by changes in foreign currency exchange rates. To reduce the potential effects of foreign currency exchange rate movements on net earnings, we enter into derivative financial instruments in the form of foreign currency exchange forward contracts with major financial institutions. See Note 15 to our consolidated financial statements for further details on our foreign currency exchange risk exposure and management.
We maintain written policies and procedures governing our risk management activities. Our policy requires that critical terms of hedging instruments be the same as hedged forecasted transactions. On this basis, with respect to
cash flow hedges, changes in cash flows attributable to hedged transactions are generally expected to be offset by changes in the fair value of hedge instruments. As part of our risk management program, we also perform sensitivity analyses to assess potential changes in revenue, operating results, cash flows and financial position relating to hypothetical movements in currency exchange rates. A sensitivity analysis of changes in the fair value of foreign currency exchange forward contracts outstanding at December 31, 2024 indicated that, if the U.S. Dollar uniformly strengthened or weakened in value by 10 percent relative to all currencies, with no change in the interest differentials, the fair value of those contracts would affect earnings in a range of a decrease of approximately $85 million to an increase of approximately $84 million before income taxes in periods through June 2027.
Any change in the fair value of foreign currency exchange forward contracts as a result of a fluctuation in a currency exchange rate is expected to be largely offset by a change in the value of the hedged transaction. Consequently, foreign currency exchange contracts would not subject us to material risk due to exchange rate movements because gains and losses on these contracts offset gains and losses on the assets, liabilities and transactions being hedged.
We had net assets, excluding goodwill and intangible assets, in legal entities with non-U.S. Dollar functional currencies of $1,950.5 million at December 31, 2024.
We enter into foreign currency forward exchange contracts with terms of one to three months to manage currency exposures for monetary assets and liabilities denominated in a currency other than an entity’s functional currency. As a result, foreign currency remeasurement gains/losses recognized in earnings are generally offset with gains/losses on the foreign currency forward exchange contracts in the same reporting period.
For details about these and other financial instruments, including fair value methodologies, see Note 15 to our consolidated financial statements.
COMMODITY PRICE RISK
We purchase raw material commodities such as cobalt chrome, titanium, tantalum, polymer and sterile packaging. We enter into supply contracts generally with terms of 12 to 24 months, where available, on these commodities to alleviate the effect of market fluctuation in prices. As part of our risk management program, we perform sensitivity analyses related to potential commodity price changes.
INTEREST RATE RISK
In the normal course of business, we are exposed to market risk from changes in interest rates that could affect our results of operations and financial condition. We manage our exposure to interest rate risks through our regular operations and financing activities.
We invest our cash and cash equivalents primarily in highly-rated corporate commercial paper and bank deposits. The primary investment objective is to ensure capital preservation. Currently, we do not use derivative financial instruments in our investment portfolio.
The majority of our debt is fixed-rate debt and therefore is not exposed to changes in interest rates. Based upon our overall interest rate exposure as of December 31, 2024, a change of 10 percent in interest rates, assuming the principal amount outstanding remains constant, would not have a material effect on interest expense, net. This analysis does not consider the effect of the change in the level of overall economic activity that could exist in such an environment.
CREDIT RISK
Financial instruments, which potentially subject us to concentrations of credit risk, are primarily cash and cash equivalents, derivative instruments and accounts receivable.
We place our cash and cash equivalents and enter into derivative transactions with highly-rated financial institutions and limit the amount of credit exposure to any one entity. We believe we do not have any significant credit risk on our cash and cash equivalents or derivative instruments.
Our concentrations of credit risks with respect to trade accounts receivable is limited due to the large number of customers and their dispersion across a number of geographic areas and by frequent monitoring of the creditworthiness of the customers to whom credit is granted in the normal course of business. Substantially all of our trade receivables are concentrated in the public and private hospital and healthcare industry in the U.S. and internationally or with distributors or dealers who operate in international markets and, accordingly, are exposed to their respective business, economic and country specific variables. Our ability to collect accounts receivable in some countries depends in part upon the financial stability of these hospital and healthcare sectors and the respective countries’ national economic and healthcare systems. Most notably, in Europe healthcare is typically sponsored by the government. Since we sell products to public hospitals in those countries, we are indirectly exposed to government budget constraints and price reduction initiatives. To the extent the respective governments’ ability to fund their public hospital programs deteriorates, we may have to record significant bad debt expenses in the future.
While we are exposed to risks from the broader healthcare industry in Europe and around the world, there is no significant net exposure due to any individual customer. Exposure to credit risk is controlled through credit approvals, credit limits and monitoring procedures, and we believe that reserves for losses are adequate.
Item 8. Financial Statements and Supplementary Data
Zimmer Biomet Holdings, Inc.
Index to Consolidated Financial Statements
Report of Independent Registered Public Accounting Firm
To the Board of Directors and Stockholders of Zimmer Biomet Holdings, Inc.
Opinions on the Financial Statements and Internal Control over Financial Reporting
We have audited the accompanying consolidated balance sheets of Zimmer Biomet Holdings, Inc. and its subsidiaries (the "Company") as of December 31, 2024 and 2023, and the related consolidated statements of earnings, of comprehensive income (loss), of stockholders’ equity and of cash flows for each of the three years in the period ended December 31, 2024, including the related notes and schedule of valuation and qualifying accounts for each of the three years in the period ended December 31, 2024 appearing under Item 15(a)(2) (collectively referred to as the "consolidated financial statements"). We also have audited the Company's internal control over financial reporting as of December 31, 2024, based on criteria established in Internal Control - Integrated Framework (2013) issued by the Committee of Sponsoring Organizations of the Treadway Commission (COSO).
In our opinion, the consolidated financial statements referred to above present fairly, in all material respects, the financial position of the Company as of December 31, 2024 and 2023, and the results of its operations and its cash flows for each of the three years in the period ended December 31, 2024 in conformity with accounting principles generally accepted in the United States of America. Also in our opinion, the Company maintained, in all material respects, effective internal control over financial reporting as of December 31, 2024, based on criteria established in Internal Control - Integrated Framework (2013) issued by the COSO.
Basis for Opinions
The Company's management is responsible for these consolidated financial statements, for maintaining effective internal control over financial reporting, and for its assessment of the effectiveness of internal control over financial reporting, included in Management’s Annual Report on Internal Control over Financial Reporting appearing under Item 9A. Our responsibility is to express opinions on the Company’s consolidated financial statements and on the Company's internal control over financial reporting based on our audits. We are a public accounting firm registered with the Public Company Accounting Oversight Board (United States) (PCAOB) and are required to be independent with respect to the Company in accordance with the U.S. federal securities laws and the applicable rules and regulations of the Securities and Exchange Commission and the PCAOB.
We conducted our audits in accordance with the standards of the PCAOB. Those standards require that we plan and perform the audits to obtain reasonable assurance about whether the consolidated financial statements are free of material misstatement, whether due to error or fraud, and whether effective internal control over financial reporting was maintained in all material respects.
Our audits of the consolidated financial statements included performing procedures to assess the risks of material misstatement of the consolidated financial statements, whether due to error or fraud, and performing procedures that respond to those risks. Such procedures included examining, on a test basis, evidence regarding the amounts and disclosures in the consolidated financial statements. Our audits also included evaluating the accounting principles used and significant estimates made by management, as well as evaluating the overall presentation of the consolidated financial statements. Our audit of internal control over financial reporting included obtaining an understanding of internal control over financial reporting, assessing the risk that a material weakness exists, and testing and evaluating the design and operating effectiveness of internal control based on the assessed risk. Our audits also included performing such other procedures as we considered necessary in the circumstances. We believe that our audits provide a reasonable basis for our opinions.
Definition and Limitations of Internal Control over Financial Reporting
A company’s internal control over financial reporting is a process designed to provide reasonable assurance regarding the reliability of financial reporting and the preparation of financial statements for external purposes in accordance with generally accepted accounting principles. A company’s internal control over financial reporting includes those policies and procedures that (i) pertain to the maintenance of records that, in reasonable detail, accurately and fairly reflect the transactions and dispositions of the assets of the company; (ii) provide reasonable assurance that transactions are recorded as necessary to permit preparation of financial statements in accordance with generally accepted accounting principles, and that receipts and expenditures of the company are being made only in accordance with authorizations of management and directors of the company; and (iii) provide reasonable
assurance regarding prevention or timely detection of unauthorized acquisition, use, or disposition of the company’s assets that could have a material effect on the financial statements.
Because of its inherent limitations, internal control over financial reporting may not prevent or detect misstatements. Also, projections of any evaluation of effectiveness to future periods are subject to the risk that controls may become inadequate because of changes in conditions, or that the degree of compliance with the policies or procedures may deteriorate.
Critical Audit Matters
The critical audit matter communicated below is a matter arising from the current period audit of the consolidated financial statements that was communicated or required to be communicated to the audit committee and that (i) relates to accounts or disclosures that are material to the consolidated financial statements and (ii) involved our especially challenging, subjective, or complex judgments. The communication of critical audit matters does not alter in any way our opinion on the consolidated financial statements, taken as a whole, and we are not, by communicating the critical audit matter below, providing a separate opinion on the critical audit matter or on the accounts or disclosures to which it relates.
Tax Liabilities for Certain Unrecognized Tax Benefits
As described in Notes 2 and 17 to the consolidated financial statements, the Company has recorded tax liabilities for unrecognized tax benefits with a consolidated balance of $241.4 million as of December 31, 2024. The calculation of certain of the Company’s estimated tax liabilities, representing a majority of the consolidated balance, involves dealing with uncertainties in the application of complex tax laws and regulations in numerous jurisdictions across the Company’s global operations. The Company’s income tax filings are regularly under audit in multiple federal, state and foreign jurisdictions. Income tax audits may require an extended period of time to reach resolution and may result in significant income tax adjustments when interpretation of tax laws or allocation of company profits is disputed.
The principal considerations for our determination that performing procedures relating to tax liabilities for certain unrecognized tax benefits is a critical audit matter are (i) the significant judgment by management when determining the tax liabilities for certain unrecognized tax benefits due to a high degree of estimation uncertainty related to management’s application of complex tax laws and regulations, the result of income tax audits, and potential for significant adjustments as a result of such audits; (ii) a high degree of auditor judgment, subjectivity, and effort in performing procedures to evaluate the timely identification and accurate measurement of tax liabilities for certain unrecognized tax benefits and evaluating audit evidence available to support the estimates; and (iii) the audit effort involved the use of professionals with specialized skill and knowledge.
Addressing the matter involved performing procedures and evaluating audit evidence in connection with forming our overall opinion on the consolidated financial statements. These procedures included testing the effectiveness of controls relating to the identification and accurate measurement of tax liabilities for unrecognized tax benefits, including controls addressing the completeness of the tax liabilities. These procedures also included, among others, (i) evaluating the accuracy of the measurement of tax liabilities for certain unrecognized tax benefits by testing certain information used in the calculation of tax liabilities for certain unrecognized tax benefits by jurisdiction, on a sample basis; (ii) assessing the completeness of the Company’s identification of tax liabilities for unrecognized tax benefits and possible outcomes for certain unrecognized tax benefits; and (iii) evaluating the status and results of income tax audits related to certain unrecognized tax benefits with the relevant tax authorities. Professionals with specialized skill and knowledge were used to assist in evaluating management’s application of complex tax laws and regulations in various jurisdictions and assessing the reasonableness of certain of the Company’s tax positions.
/s/ PricewaterhouseCoopers LLP
Chicago, Illinois
February 25, 2025
We have served as the Company’s auditor since 2000.
ZIMMER BIOMET HOLDINGS, INC. AND SUBSIDIARIES
CONSOLIDATED STATEMENTS OF EARNINGS
(in millions, except per share amounts)
| | | | | | | | | | | | |
| | For the Years Ended December 31, | |
| | 2024 | | | 2023 | | | 2022 | |
Net Sales | | $ | 7,678.6 | | | $ | 7,394.2 | | | $ | 6,939.9 | |
Cost of products sold, excluding intangible asset amortization | | | 2,191.2 | | | | 2,083.8 | | | | 2,019.5 | |
Intangible asset amortization | | | 591.9 | | | | 561.5 | | | | 526.8 | |
Research and development | | | 437.4 | | | | 458.7 | | | | 406.0 | |
Selling, general and administrative | | | 2,929.8 | | | | 2,838.9 | | | | 2,761.7 | |
Goodwill and intangible asset impairment | | | - | | | | - | | | | 292.8 | |
Restructuring and other cost reduction initiatives | | | 219.0 | | | | 151.9 | | | | 191.6 | |
Quality remediation | | | - | | | | - | | | | 33.8 | |
Acquisition, integration, divestiture and related | | | 23.6 | | | | 21.7 | | | | 11.4 | |
Operating expenses | | | 6,392.9 | | | | 6,116.5 | | | | 6,243.6 | |
Operating Profit | | | 1,285.7 | | | | 1,277.7 | | | | 696.3 | |
Other expense, net | | | (31.1 | ) | | | (9.3 | ) | | | (128.0 | ) |
Interest expense, net | | | (218.0 | ) | | | (201.2 | ) | | | (164.8 | ) |
Earnings from continuing operations before income taxes | | | 1,036.6 | | | | 1,067.3 | | | | 403.5 | |
Provision for income taxes from continuing operations | | | 131.4 | | | | 42.2 | | | | 112.3 | |
Net Earnings from Continuing Operations | | | 905.2 | | | | 1,025.1 | | | | 291.2 | |
Less: Net earnings attributable to noncontrolling interest | | | 1.5 | | | | 1.1 | | | | 1.0 | |
Net Earnings from Continuing Operations of Zimmer Biomet Holdings, Inc. | | | 903.8 | | | | 1,024.0 | | | | 290.2 | |
Loss from Discontinued Operations, Net of Tax | | | - | | | | - | | | | (58.8 | ) |
Net Earnings of Zimmer Biomet Holdings, Inc. | | $ | 903.8 | | | $ | 1,024.0 | | | $ | 231.4 | |
| | | | | | | | | |
Basic Earnings Per Common Share | | | | | | | | | |
Earnings from Continuing Operations | | $ | 4.45 | | | $ | 4.91 | | | $ | 1.38 | |
Loss from Discontinued Operations | | | - | | | | - | | | | (0.28 | ) |
Basic Earnings Per Common Share | | $ | 4.45 | | | $ | 4.91 | | | $ | 1.10 | |
| | | | | | | | | |
Diluted Earnings Per Common Share | | | | | | | | | |
Earnings from Continuing Operations | | $ | 4.43 | | | $ | 4.88 | | | $ | 1.38 | |
Loss from Discontinued Operations | | | - | | | | - | | | | (0.28 | ) |
Diluted Earnings Per Common Share | | $ | 4.43 | | | $ | 4.88 | | | $ | 1.10 | |
| | | | | | | | | |
Weighted Average Common Shares Outstanding | | | | | | | | | |
Basic | | | 203.1 | | | | 208.7 | | | | 209.6 | |
Diluted | | | 203.9 | | | | 209.7 | | | | 210.3 | |
The accompanying notes are an integral part of these consolidated financial statements.
ZIMMER BIOMET HOLDINGS, INC. AND SUBSIDIARIES
CONSOLIDATED STATEMENTS OF COMPREHENSIVE INCOME (LOSS)
(in millions)
| | | | | | | | | | | | |
| | For the Years Ended December 31, | |
| | 2024 | | | 2023 | | | 2022 | |
Net Earnings of Zimmer Biomet Holdings, Inc. | | $ | 903.8 | | | $ | 1,024.0 | | | $ | 231.4 | |
Other Comprehensive Loss: | | | | | | | | | |
Foreign currency cumulative translation adjustments, net of tax | | | (79.6 | ) | | | 9.9 | | | | (123.3 | ) |
Unrealized cash flow hedge gains, net of tax | | | 94.8 | | | | 71.1 | | | | 83.5 | |
Reclassification adjustments on hedges, net of tax | | | (69.9 | ) | | | (77.4 | ) | | | (46.0 | ) |
Adjustments to prior service cost and unrecognized actuarial
assumptions, net of tax | | | (17.1 | ) | | | (15.3 | ) | | | 77.0 | |
Total Other Comprehensive Loss | | | (71.8 | ) | | | (11.7 | ) | | | (8.8 | ) |
Comprehensive Income Attributable to Zimmer Biomet Holdings, Inc. | | $ | 832.0 | | | $ | 1,012.3 | | | $ | 222.6 | |
The accompanying notes are an integral part of these consolidated financial statements.
ZIMMER BIOMET HOLDINGS, INC. AND SUBSIDIARIES
CONSOLIDATED BALANCE SHEETS
(in millions, except per share amounts)
| | | | | | | | |
| | As of December 31, | |
| | 2024 | | | 2023 | |
ASSETS | | | | | | |
Current Assets: | | | | | | |
Cash and cash equivalents | | $ | 525.5 | | | $ | 415.8 | |
Accounts receivable, less allowance for credit losses | | | 1,480.7 | | | | 1,442.4 | |
Inventories | | | 2,235.3 | | | | 2,385.2 | |
Prepaid expenses and other current assets | | | 430.1 | | | | 366.1 | |
Total Current Assets | | | 4,671.5 | | | | 4,609.5 | |
Property, plant and equipment, net | | | 2,048.8 | | | | 2,060.4 | |
Goodwill | | | 8,951.1 | | | | 8,818.5 | |
Intangible assets, net | | | 4,598.4 | | | | 4,856.4 | |
Other assets | | | 1,095.5 | | | | 1,152.1 | |
Total Assets | | $ | 21,365.3 | | | $ | 21,496.9 | |
LIABILITIES AND STOCKHOLDERS' EQUITY | | | | | | |
Current Liabilities: | | | | | | |
Accounts payable | | $ | 194.6 | | | $ | 410.6 | |
Other current liabilities | | | 1,393.3 | | | | 1,546.9 | |
Current portion of long-term debt | | | 863.0 | | | | 900.0 | |
Total Current Liabilities | | | 2,450.9 | | | | 2,857.4 | |
Deferred income taxes, net | | | 352.5 | | | | 357.6 | |
Other long-term liabilities | | | 744.1 | | | | 925.8 | |
Long-term debt | | | 5,341.6 | | | | 4,867.9 | |
Total Liabilities | | | 8,889.1 | | | | 9,008.7 | |
Commitments and Contingencies (Note 21) | | | | | | |
Stockholders' Equity: | | | | | | |
Common stock, $0.01 par value, one billion shares authorized,
317.5 million (316.2 million in 2023) issued | | | 3.2 | | | | 3.2 | |
Paid-in capital | | | 10,038.1 | | | | 9,846.1 | |
Retained earnings | | | 11,095.3 | | | | 10,384.5 | |
Accumulated other comprehensive loss | | | (262.8 | ) | | | (191.0 | ) |
Treasury stock, 118.4 million shares (110.6 million shares in 2023) | | | (8,405.7 | ) | | | (7,562.3 | ) |
Total Zimmer Biomet Holdings, Inc. stockholders' equity | | | 12,468.1 | | | | 12,480.5 | |
Noncontrolling interest | | | 8.1 | | | | 7.7 | |
Total Stockholders' Equity | | | 12,476.2 | | | | 12,488.1 | |
Total Liabilities and Stockholders' Equity | | $ | 21,365.3 | | | $ | 21,496.9 | |
The accompanying notes are an integral part of these consolidated financial statements.
ZIMMER BIOMET HOLDINGS, INC. AND SUBSIDIARIES
CONSOLIDATED STATEMENTS OF STOCKHOLDERS' EQUITY
(in millions, except per share amounts)
| | | | | | | | | | | | | | | | | | | | | | | | | | | | | | | | | | | | |
| | Zimmer Biomet Holdings, Inc. Stockholders | | | | | | | |
| | | | | | | | | | | | | | Accumulated | | | | | | | | | | | | | |
| | | | | | | | | | | | | | Other | | | | | | | | | | | | Total | |
| | Common Shares | | | Paid-in | | | Retained | | | Comprehensive | | | Treasury Shares | | | Noncontrolling | | | Stockholders' | |
| | Number | | | Amount | | | Capital | | | Earnings | | | (Loss) Income | | | Number | | | Amount | | | Interest | | | Equity | |
Balance January 1, 2022 | | | 312.8 | | | $ | 3.1 | | | $ | 9,314.8 | | | $ | 10,292.2 | | | $ | (231.6 | ) | | | (103.8 | ) | | $ | (6,717.8 | ) | | $ | 5.7 | | | $ | 12,666.4 | |
Net earnings | | | - | | | | - | | | | - | | | | 231.4 | | | | - | | | | - | | | | - | | | | 1.0 | | | | 232.4 | |
Other comprehensive loss | | | - | | | | - | | | | - | | | | - | | | | (8.8 | ) | | | - | | | | - | | | | - | | | | (8.8 | ) |
Cash dividends declared
($0.96 per share) | | | - | | | | - | | | | - | | | | (201.3 | ) | | | - | | | | - | | | | - | | | | - | | | | (201.3 | ) |
Reclassifications of net investment hedges | | | - | | | | - | | | | - | | | | - | | | | 25.9 | | | | - | | | | - | | | | - | | | | 25.9 | |
Spinoff of ZimVie Inc. | | | - | | | | - | | | | - | | | | (763.4 | ) | | | 35.2 | | | | - | | | | - | | | | - | | | | (728.2 | ) |
Stock compensation plans | | | 1.0 | | | | - | | | | 189.6 | | | | 0.4 | | | | - | | | | - | | | | 0.6 | | | | - | | | | 190.6 | |
Share repurchases | | | | | | - | | | | - | | | | - | | | | - | | | | (1.0 | ) | | | (150.0 | ) | | | - | | | | (150.0 | ) |
Balance December 31, 2022 | | | 313.8 | | | | 3.1 | | | | 9,504.4 | | | | 9,559.3 | | | | (179.3 | ) | | | (104.8 | ) | | | (6,867.2 | ) | | | 6.7 | | | | 12,027.0 | |
Net earnings | | | - | | | | - | | | | - | | | | 1,024.0 | | | | - | | | | - | | | | - | | | | 1.1 | | | | 1,025.1 | |
Other comprehensive loss | | | - | | | | - | | | | - | | | | - | | | | (11.7 | ) | | | - | | | | - | | | | - | | | | (11.7 | ) |
Cash dividends declared
($0.96 per share) | | | - | | | | - | | | | - | | | | (200.1 | ) | | | - | | | | - | | | | - | | | | - | | | | (200.1 | ) |
Stock compensation plans | | | 1.2 | | | | - | | | | 193.6 | | | | 1.3 | | | | - | | | | - | | | | 1.0 | | | | - | | | | 195.8 | |
Embody, Inc acquisition consideration | | | 1.2 | | | | 0.1 | | | | 150.4 | | | | - | | | | - | | | | - | | | | - | | | | - | | | | 150.5 | |
Share repurchases | | | - | | | | - | | | | (2.3 | ) | | | - | | | | - | | | | (5.8 | ) | | | (696.1 | ) | | | - | | | | (698.4 | ) |
Balance December 31, 2023 | | | 316.2 | | | | 3.2 | | | | 9,846.1 | | | | 10,384.5 | | | | (191.0 | ) | | | (110.6 | ) | | | (7,562.3 | ) | | | 7.7 | | | | 12,488.1 | |
Net earnings | | | - | | | | - | | | | - | | | | 903.8 | | | | - | | | | - | | | | - | | | | 1.5 | | | | 905.3 | |
Other comprehensive loss | | | - | | | | - | | | | - | | | | - | | | | (71.8 | ) | | | - | | | | - | | | | - | | | | (71.8 | ) |
Cash dividends declared
($0.96 per share) | | | - | | | | - | | | | - | | | | (194.4 | ) | | | - | | | | - | | | | - | | | | - | | | | (194.4 | ) |
Cash dividends to noncontrolling interest | | | - | | | | - | | | | - | | | | - | | | | - | | | | - | | | | - | | | | (1.0 | ) | | | (1.0 | ) |
Stock compensation plans | | | 1.1 | | | | - | | | | 168.6 | | | | 1.4 | | | | - | | | | - | | | | 1.4 | | | | - | | | | 171.4 | |
Embody, Inc acquisition consideration | | | 0.2 | | | | - | | | | 23.4 | | | | - | | | | - | | | | - | | | | - | | | | - | | | | 23.4 | |
Share repurchases | | | - | | | | - | | | | - | | | | - | | | | - | | | | (7.8 | ) | | | (844.8 | ) | | | - | | | | (844.8 | ) |
Balance December 31, 2024 | | | 317.5 | | | $ | 3.2 | | | $ | 10,038.1 | | | $ | 11,095.3 | | | $ | (262.8 | ) | | | (118.4 | ) | | $ | (8,405.7 | ) | | $ | 8.1 | | | $ | 12,476.2 | |
The accompanying notes are an integral part of these consolidated financial statements.
ZIMMER BIOMET HOLDINGS, INC. AND SUBSIDIARIES
CONSOLIDATED STATEMENTS OF CASH FLOWS
(in millions)
| | | | | | | | | | | | |
| | For the Years Ended December 31, | |
| | 2024 | | | 2023 | | | 2022 | |
Cash flows provided by (used in) operating activities from continuing operations: | | | | | | | | | |
Net earnings from continuing operations | | $ | 905.2 | | | $ | 1,025.1 | | | $ | 291.2 | |
Adjustments to reconcile net earnings to net cash provided by
operating activities: | | | | | | | | | |
Depreciation and amortization | | | 996.3 | | | | 951.7 | | | | 926.4 | |
Share-based compensation | | | 101.0 | | | | 99.8 | | | | 105.0 | |
Goodwill and intangible asset impairment | | | - | | | | - | | | | 292.8 | |
(Gain) loss on investment in ZimVie Inc. | | | - | | | | (2.5 | ) | | | 116.6 | |
Deferred income tax benefit | | | (47.7 | ) | | | (96.3 | ) | | | (64.4 | ) |
Changes in operating assets and liabilities, net of acquired assets and liabilities | | | | | | | | | |
Income taxes | | | (158.6 | ) | | | (73.8 | ) | | | (152.9 | ) |
Receivables | | | (89.7 | ) | | | (51.9 | ) | | | (184.7 | ) |
Inventories | | | 49.9 | | | | (240.4 | ) | | | (75.6 | ) |
Accounts payable and accrued liabilities | | | (322.0 | ) | | | (55.3 | ) | | | 103.0 | |
Other assets and liabilities | | | 65.0 | | | | 25.2 | | | | (1.2 | ) |
Net cash provided by operating activities from continuing operations | | | 1,499.4 | | | | 1,581.6 | | | | 1,356.2 | |
Cash flows provided by (used in) investing activities from continuing operations: | | | | | | | | | |
Additions to instruments | | | (240.3 | ) | | | (311.7 | ) | | | (258.3 | ) |
Additions to other property, plant and equipment | | | (203.8 | ) | | | (291.1 | ) | | | (187.9 | ) |
Net investment hedge settlements | | | 22.1 | | | | 33.4 | | | | 89.4 | |
Acquisition of intangible assets | | | (153.0 | ) | | | (103.4 | ) | | | (29.7 | ) |
Business combination investments, net of acquired cash | | | (276.3 | ) | | | (134.9 | ) | | | (99.8 | ) |
Other investing activities | | | (36.9 | ) | | | 28.8 | | | | (35.7 | ) |
Net cash used in investing activities from continuing operations | | | (888.1 | ) | | | (778.9 | ) | | | (522.0 | ) |
Cash flows provided by (used in) financing activities from continuing operations: | | | | | | | | | |
Net (payments) proceeds on revolving facilities | | | (50.0 | ) | | | (325.0 | ) | | | 375.0 | |
Proceeds from senior notes | | | 1,436.3 | | | | 499.8 | | | | - | |
Redemption of senior notes | | | (850.0 | ) | | | (86.3 | ) | | | (1,275.8 | ) |
Proceeds from term loan | | | - | | | | - | | | | 83.0 | |
Payments on term loans | | | - | | | | (33.9 | ) | | | (242.9 | ) |
Dividends paid to stockholders | | | (196.0 | ) | | | (200.9 | ) | | | (201.2 | ) |
Proceeds from employee stock compensation plans | | | 82.1 | | | | 101.1 | | | | 78.1 | |
Distribution from ZimVie, Inc. | | | - | | | | - | | | | 540.6 | |
Business combination contingent consideration payments | | | (3.5 | ) | | | (10.3 | ) | | | - | |
Debt issuance costs | | | (13.0 | ) | | | (5.8 | ) | | | (1.6 | ) |
Repurchase of common stock | | | (868.0 | ) | | | (692.2 | ) | | | (126.4 | ) |
Other financing activities | | | (22.4 | ) | | | (10.1 | ) | | | (4.5 | ) |
Net cash used in financing activities from continuing operations | | | (484.5 | ) | | | (763.5 | ) | | | (775.7 | ) |
Cash flows used in discontinued operations: | | | | | | | | | |
Net cash used in operating activities | | | - | | | | - | | | | (71.5 | ) |
Net cash used in investing activities | | | - | | | | - | | | | (7.2 | ) |
Net cash used in financing activities | | | - | | | | - | | | | (68.1 | ) |
Net cash used in discontinued operations | | | - | | | | - | | | | (146.8 | ) |
Effect of exchange rates on cash and cash equivalents | | | (17.1 | ) | | | 0.9 | | | | (14.5 | ) |
Increase (decrease) in cash and cash equivalents | | | 109.7 | | | | 40.1 | | | | (102.8 | ) |
Cash and cash equivalents, beginning of year | | | 415.8 | | | | 375.7 | | | | 478.5 | |
Cash and cash equivalents, end of year | | $ | 525.5 | | | $ | 415.8 | | | $ | 375.7 | |
The accompanying notes are an integral part of these consolidated financial statements.
ZIMMER BIOMET HOLDINGS, INC. AND SUBSIDIARIES
NOTES TO CONSOLIDATED FINANCIAL STATEMENTS
We design, manufacture and market orthopedic reconstructive products; sports medicine, biologics, extremities and trauma products; craniomaxillofacial and thoracic products; surgical products; and a suite of integrated digital and robotic technologies that leverage data, data analytics and artificial intelligence. We collaborate with healthcare professionals around the globe to advance the pace of innovation. Our products and solutions help treat patients suffering from disorders of, or injuries to, bones, joints or supporting soft tissues. Together with healthcare professionals, we help millions of people live better lives.
The words “Zimmer Biomet,” “we,” “us,” “our,” “the Company” and similar words refer to Zimmer Biomet Holdings, Inc. and its subsidiaries. “Zimmer Biomet Holdings” refers to the parent company only.
We reclassified certain prior year amounts to conform to the current year presentation.
Spinoff - On March 1, 2022, we completed the previously announced separation of our spine and dental businesses into a new public company through the distribution by Zimmer Biomet Holdings of 80.3% of the outstanding shares of common stock of ZimVie Inc. (“ZimVie”) to Zimmer Biomet Holding’s stockholders. We disposed of our remaining shares of ZimVie in February 2023. The historical results of our spine and dental businesses that were contributed to ZimVie in the spinoff have been reflected as discontinued operations in our consolidated financial statements through the date of the spinoff in 2022 as the spinoff represented a strategic shift in our business that had a major effect on operations and financial results. The disclosures presented in our notes to the consolidated financial statements are presented on a continuing operations basis.
2.Significant Accounting Policies
Basis of Presentation - The consolidated financial statements include the accounts of Zimmer Biomet Holdings and its subsidiaries in which it holds a controlling financial interest. All significant intercompany accounts and transactions are eliminated. Amounts reported in millions within these notes to the consolidated financial statements are computed based on the actual amounts. As a result, the sum of the components may not equal the total amount reported in millions due to rounding. In addition, certain columns and rows within tables may not sum to the totals due to the use of rounded numbers. Percentages presented are calculated from the underlying unrounded amounts.
Use of Estimates - The consolidated financial statements are prepared in conformity with accounting principles generally accepted in the United States of America (“GAAP”), which requires us to make estimates and assumptions that affect the reported amounts of assets and liabilities and disclosure of contingent assets and liabilities at the date of the financial statements and the reported amounts of revenues and expenses during the reporting period. We have made our best estimates, as appropriate under GAAP, in the recognition of our assets and liabilities. Such estimates include, but are not limited to, variable consideration to our customers, our allowance for doubtful accounts for expected credit losses, the net realizable value of our inventory, the fair value of our goodwill, the recoverability of other long-lived assets and unrecognized tax benefits. Actual results could differ materially from these estimates.
Foreign Currency Translation - The financial statements of our foreign subsidiaries are translated into U.S. Dollars using period-end exchange rates for assets and liabilities and average exchange rates for operating results. Unrealized translation gains and losses are included in accumulated other comprehensive loss in stockholders’ equity. When a transaction is denominated in a currency other than the subsidiary’s functional currency, we remeasure the transaction into the functional currency and recognize any transactional gains or losses in earnings.
Shipping and Handling - Amounts billed to customers for shipping and handling of products are reflected in net sales and are not significant. Expenses incurred related to shipping and handling of products are reflected in selling, general and administrative (“SG&A”) expenses and were $288.3 million, $272.7 million and $254.4 million for the years ended December 31, 2024, 2023 and 2022, respectively.
Research and Development - We expense all research and development (“R&D”) costs as incurred except when there is an alternative future use for the R&D. R&D costs include salaries, prototypes, depreciation of equipment used in R&D, consultant fees, service fees paid to collaborative partners, and arrangements to gain access to or acquire third-party in-process R&D projects with no alternative future use. Where contingent milestone payments
are due to third parties under R&D arrangements, we expense the milestone payment obligations when it is probable that the milestone results will be achieved.
Litigation - We record an undiscounted liability for contingent losses, including future legal costs, settlements and judgments, when we consider it is probable that a liability has been incurred and the amount of the loss can be reasonably estimated.
Quality remediation - We used the financial statement line item “Quality remediation” to recognize expenses related to addressing inspectional observations on Form 483 and a warning letter issued by the FDA following its inspections of our Warsaw North Campus facility, among other matters. The majority of these expenses were related to consultants who helped us to update previous documents and redesign certain processes.
Restructuring and other cost reduction initiatives - A restructuring is defined as a program that is planned and controlled by management, and materially changes either the scope of a business undertaken by an entity, or the manner in which that business is conducted. Restructuring charges include (i) employee termination benefits, (ii) contract termination costs and (iii) other related costs associated with exit or disposal activities.
In December 2023, 2021 and 2019, we approved separate global restructuring programs intended to further reduce costs and to reorganize our global operations. Restructuring charges for the years ended December 31, 2024, 2023 and 2022 were attributable to these programs. See Note 5 for additional information regarding these restructuring programs.
We have also initiated other cost reduction and optimization projects that have the goal of reducing costs across the organization. Costs related to these projects are included in our “Restructuring and other cost reduction initiatives” financial statement line item.
Acquisition, integration, divestiture and related – We use the financial statement line item, “Acquisition, integration, divestiture and related” to recognize expenses resulting from the consummation of business mergers and acquisitions and the related integration of those businesses, and expenses related to the divestiture of our businesses. Acquisition, integration, divestiture and related gains and expenses are primarily composed of:
•Consulting and professional fees related to third-party integration performed in a variety of areas, such as finance, tax, compliance, logistics and human resources, and legal fees related to the consummation of mergers and acquisitions.
•Employee termination benefits related to terminating employees with overlapping responsibilities in various areas of our business.
•Dedicated project personnel expenses which include the salary, benefits, travel expenses and other costs directly associated with employees who are 100 percent dedicated to our integration of acquired businesses and employees who have been notified of termination, but are continuing to work on transferring their responsibilities.
•Contract termination expenses related to terminated contracts, primarily with sales agents and distribution agreements.
•Changes to our contingent consideration liabilities related to our mergers and acquisitions.
•Other various expenses to relocate facilities, integrate information technology, losses incurred on assets resulting from the applicable acquisition, and other various expenses.
•Income and expenses related to providing ZimVie certain services after the separation date.
Cash and Cash Equivalents - We consider all highly liquid investments with an original maturity of three months or less to be cash equivalents. The carrying amounts reported in the balance sheet for cash and cash equivalents are valued at cost, which approximates their fair value.
Accounts Receivable - Accounts receivable consists of trade and other miscellaneous receivables. We grant credit to customers in the normal course of business and maintain an allowance for expected credit losses. We determine the allowance for credit losses by geographic market and take into consideration historical credit experience, creditworthiness of the customer and other pertinent information. We make concerted efforts to collect all accounts receivable, but sometimes we have to write-off the account against the allowance when we determine the account is uncollectible. The allowance for credit losses was $93.2 million and $75.1 million as of December 31, 2024 and 2023, respectively.
Inventories - Inventories are stated at the lower of cost and net realizable value, with cost determined on a first-in first-out basis.
Property, Plant and Equipment - Property, plant and equipment is carried at cost less accumulated depreciation. Depreciation is computed using the straight-line method based on estimated useful lives of ten to forty years for buildings and improvements and three to eight years for machinery and equipment. Maintenance and repairs are expensed as incurred. We review property, plant and equipment for impairment whenever events or changes in circumstances indicate that the carrying value of an asset may not be recoverable. An impairment loss would be recognized when estimated future undiscounted cash flows relating to the asset are less than its carrying amount. An impairment loss is measured as the amount by which the carrying amount of an asset exceeds its fair value.
Software Costs - We capitalize certain computer software and software development costs incurred in connection with developing or obtaining computer software for internal use when both the preliminary project stage is completed and it is probable that the software will be used as intended. Capitalized software costs generally include external direct costs of materials and services utilized in developing or obtaining computer software and compensation and related benefits for employees who are directly associated with the software project. Capitalized software costs are included in property, plant and equipment on our balance sheet and amortized on a straight-line or weighted average estimated user basis when the software is ready for its intended use over the estimated useful lives of the software, which approximate three to ten years.
For cloud computing arrangements that are considered a service contract, our capitalization of implementation costs is aligned with the internal use software requirements. However, on our consolidated balance sheet these implementation costs are recognized in other noncurrent assets. On our consolidated statement of cash flows, these implementations costs are recognized in operating cash flows. The implementation costs are recognized on a straight-line basis over the expected term of the related service contract.
Instruments - Instruments are hand-held devices used by surgeons during total joint replacement and other surgical procedures. Instruments are recognized as long-lived assets and are included in property, plant and equipment. Undeployed instruments are carried at cost or net realizable value. Instruments that have been deployed to be used in surgeries are carried at cost less accumulated depreciation. Depreciation is computed using the straight-line method based on average estimated useful lives, determined principally in reference to associated product life cycles, primarily five years. We review instruments for impairment whenever events or changes in circumstances indicate that the carrying value of an instrument may not be recoverable. Depreciation of instruments is recognized as SG&A expense.
Goodwill - Goodwill is not amortized but is subject to annual impairment tests. Goodwill has been assigned to reporting units. Potential impairment of a reporting unit is identified by either comparing a reporting unit’s estimated fair value to its carrying amount or doing a qualitative assessment of a reporting unit’s fair value from the last quantitative assessment to determine if there is potential impairment. We may do a qualitative assessment when the results of the previous quantitative test indicated the reporting unit’s estimated fair value was significantly in excess of the carrying value of its net assets and we do not believe there have been significant changes in the reporting unit’s operations that would significantly decrease its estimated fair value. If a quantitative assessment is performed, the fair value of the reporting unit and the fair value of goodwill are determined based upon a discounted cash flow analysis and/or use of a market approach by looking at market values of comparable companies. Significant assumptions are incorporated into our discounted cash flow analyses such as forecasted net sales, revenue growth rates, forecasted operating expenses and risk-adjusted discount rates. We perform this test in the fourth quarter of the year or whenever events or changes in circumstances indicate that the fair value of the reporting unit is more likely than not below its carrying amount. If the fair value of the reporting unit is less than its carrying value, an impairment loss is recorded in the amount that the carrying value of the reporting unit exceeds the fair value. See Note 11 for more information regarding goodwill.
Intangible Assets - Intangible assets are initially measured at their fair value. We have determined the fair value of our intangible assets either by the fair value of the consideration exchanged for the intangible asset or the estimated after-tax discounted cash flows expected to be generated from the intangible asset. Intangible assets with a finite life, including technology, certain trademarks and trade names, customer-related intangibles, intellectual property rights and patents and licenses are amortized on a straight-line basis over their estimated useful life or contractual life, which may range from less than one year to twenty years. Intangible assets with a finite life are tested for impairment whenever events or circumstances indicate that the carrying amount may not be recoverable.
Intangible assets with an indefinite life, including certain trademarks and trade names and in-process research and development (“IPR&D”) projects, are not amortized. Indefinite life intangible assets are assessed annually to determine whether events and circumstances continue to support an indefinite life. Intangible assets with an indefinite life are tested for impairment annually or whenever events or circumstances indicate that the fair value of the asset is more likely than not below its carrying amount. An impairment loss is recognized if the carrying amount exceeds the estimated fair value of the asset. The amount of the impairment loss to be recorded would be determined based upon the excess of the asset’s carrying value over its fair value. The fair values of indefinite lived intangible assets are determined based upon a discounted cash flow analysis using the relief from royalty method or a qualitative assessment may be performed for any changes to the asset’s fair value from the last quantitative assessment. The relief from royalty method estimates the cost savings associated with owning, rather than licensing, assets. Significant assumptions are incorporated into these discounted cash flow analyses such as estimated growth rates, royalty rates and risk-adjusted discount rates. We may do a qualitative assessment when the results of the previous quantitative test indicated that the asset’s fair value was significantly in excess of its carrying value.
In determining the useful lives of intangible assets, we consider the expected use of the assets and the effects of obsolescence, demand, competition, anticipated technological advances, changes in surgical techniques, market influences and other economic factors. For technology-based intangible assets, we consider the expected life cycles of products, absent unforeseen technological advances, which incorporate the corresponding technology. Trademarks and trade names that do not have a wasting characteristic (i.e., there are no legal, regulatory, contractual, competitive, economic or other factors which limit the useful life) are assigned an indefinite life. Trademarks and trade names that are related to products expected to be phased out are assigned lives consistent with the period in which the products bearing each brand are expected to be sold. For customer relationship intangible assets, we assign useful lives based upon historical levels of customer attrition. Intellectual property rights are assigned useful lives that approximate the contractual life of any related patent or the period for which we maintain exclusivity over the intellectual property.
Income Taxes - We account for income taxes under the asset and liability method, which requires the recognition of deferred tax assets and liabilities for the expected future tax consequences of events that have been included in the financial statements. Under this method, deferred tax assets and liabilities are determined based on the differences between the financial statements and tax basis of assets and liabilities using enacted tax rates in effect for the year in which the differences are expected to reverse. The effect of a change in tax rates on deferred tax assets and liabilities is recognized in income in the period the new tax rate is enacted.
We reduce our deferred tax assets by a valuation allowance if it is more likely than not that we will not realize some portion or all of the deferred tax assets. In making such determination, we consider all available positive and negative evidence, including future reversals of existing taxable temporary differences, projected future taxable income, tax planning strategies and recent financial operations. In the event we were to determine that we would be able to realize our deferred income tax assets in the future in excess of their net recorded amount, we would make an adjustment to the valuation allowance which would reduce the provision for income taxes.
We operate on a global basis and are subject to numerous and complex tax laws and regulations. The calculation of our tax liabilities involves dealing with uncertainties in the application of complex tax laws and regulations in numerous jurisdictions across our global operations. Our income tax filings are regularly under audit in multiple federal, state, and foreign jurisdictions. Income tax audits may require an extended period of time to reach resolution and may result in significant income tax adjustments when interpretation of tax laws or allocation of company profits is disputed. Because income tax adjustments in certain jurisdictions can be significant, we record tax positions based upon our estimates. For those tax positions where it is more likely than not that a tax benefit will be sustained, we have recorded the largest amount of tax benefit with a greater than 50 percent likelihood of being realized upon ultimate settlement with a taxing authority that has full knowledge of all relevant information. For those income tax positions where it is not more likely than not that a tax benefit will be sustained, no tax benefit has been recognized in the financial statements.
Derivative Financial Instruments - We measure all derivative instruments at fair value and report them on our consolidated balance sheet as assets or liabilities. We maintain written policies and procedures that permit, under appropriate circumstances and subject to proper authorization, the use of derivative financial instruments solely for risk management purposes. The use of derivative financial instruments for trading or speculative purposes is prohibited by our policy. See Note 15 for more information regarding our derivative and hedging activities.
Accumulated Other Comprehensive Income (Loss) – Accumulated other comprehensive income (loss) (“AOCI”) refers to gains and losses that under GAAP are included in comprehensive income but are excluded from net earnings as these amounts are recorded directly as an adjustment to stockholders’ equity. Our AOCI is comprised of foreign currency translation adjustments, including unrealized gains and losses on net investments hedges, unrealized gains and losses on cash flow hedges and amortization of prior service costs and unrecognized gains and losses in actuarial assumptions.
Other Expense, Net - Other expense, net includes gains/(losses) on changes in fair value of our investments, gains/(losses) on remeasurement of monetary assets and liabilities denominated in a currency other than an subsidiary's functional currency and the related gains/(losses) on derivative instruments that are not designated as hedging instruments that we use to manage the currency exposures of these assets and liabilities, certain components of pension expense, and other non-operating gains/(losses). In the years ended December 31, 2023 and 2022, we recognized a gain of $2.5 million and a loss of $116.6 million, respectively, related to our investment in ZimVie. We disposed of our remaining shares of ZimVie in February 2023. In the years ended December 31, 2024, 2023 and 2022, we recognized losses on our investments in other debt and equity securities of $42.1 million, $18.5 million and $19.4 million, respectively.
Treasury Stock - We account for repurchases of common stock under the cost method and present treasury stock as a reduction of stockholders’ equity. We reissue common stock held in treasury only for limited purposes.
Noncontrolling Interest - We have investments in other companies in which we have a controlling financial interest, but not 100 percent of the equity. Further information related to the noncontrolling interests of those investments has not been provided as it is not significant to our consolidated financial statements.
Accounting Pronouncements Recently Adopted
In November 2023, the Financial Accounting Standards Board (“FASB”) issued Accounting Standards Update (“ASU”) 2023-07, Improvements to Reportable Segment Disclosures, which is an amendment to ASC Topic 280 - Segment Reporting. The ASU requires more detailed and disaggregated segment information, including the disclosure of significant segment expense categories and amounts for each reportable segment. The ASU also requires certain annual disclosures to also be made in interim periods. We adopted the guidance effective for this report for the fiscal year ended December 31, 2024, and have retrospectively included any additional disclosures in the previous periods included in this report. See Note 19 for the segment disclosure.
Accounting Pronouncements Not Yet Adopted
In December 2023, the FASB issued ASU 2023-09, Improvements to Income Tax Disclosures, which is an amendment to topic ASC 740 - Income Taxes. The ASU improves the transparency of income tax disclosures by requiring greater disaggregated information about an entity’s effective tax rate reconciliation and requiring additional disclosures and disaggregation of income taxes, among other amendments to improve the effectiveness of income tax disclosures. The ASU is effective for fiscal years beginning after December 15, 2024. The guidance will be applied prospectively with an option to apply the guidance retrospectively. We will adopt this ASU for fiscal year ending December 31, 2025. We are currently evaluating the impact this ASU will have on our financial statements and disclosures.
In November 2024, the FASB issued ASU 2024-03, Disaggregation of Income Statement Expenses, which is an amendment to topic ASC 220 - Comprehensive Income. The ASU improves financial reporting by requiring disclosure of additional information about specific expense categories included in the expense captions presented on the income statement as well as disclosures about selling expenses. The ASU is effective for fiscal years beginning after December 15, 2026, and interim periods for fiscal years beginning after December 15, 2027. The guidance will be applied prospectively with an option to apply the guidance retrospectively. Early adoption of this ASU is permitted. We are currently evaluating the impact this ASU will have on our financial statements and disclosures.
3.Discontinued Operations and Related ZimVie Matters
On March 1, 2022, we completed the previously announced separation of our spine and dental businesses through the distribution of 80.3% of the outstanding shares of common stock of ZimVie to our stockholders at the close of business on February 15, 2022 (the “Record Date”).
At separation, ZimVie paid us $540.6 million in the form of a dividend which is included in our cash flows from financing activities in the consolidated statements of cash flows. We used proceeds from the dividend, along with cash on hand and proceeds from a draw on our revolving credit facility, to repay senior notes due in 2022 which had an outstanding principal balance of $750.0 million.
In connection with the spinoff, we entered into definitive agreements with ZimVie that, among other things, set forth the terms and conditions of the separation and distribution. These agreements include a Transition Services Agreement (the “TSA”), a Transition Manufacturing and Supply Agreement (the “TMA”), a Reverse Transition Manufacturing and Supply Agreement (the “Reverse TMA”), and various other agreements each dated as of March 1, 2022. Most TSA and TMA services were completed as of December 31, 2024. We recognized any gains or losses from the TSA and TMA agreements in Acquisition, integration, divestiture and related expense in our consolidated statements of earnings. Amounts included in the consolidated statements of earnings related to these agreements for the years ended December 31, 2024, 2023 and 2022 were immaterial.
We initially retained approximately 5.1 million common shares of ZimVie, representing approximately 19.7 percent of ZimVie's outstanding common shares on the separation date. We disposed of these shares in February 2023. Changes to the fair value of the investment were recognized in non-operating other expense, net. In the years ended December 31, 2023 and 2022, we recognized a gain of $2.5 million and a loss of $116.6 million, respectively, related to our investment in ZimVie.
On August 31, 2022, we borrowed an aggregate principal amount of $83.0 million under a short-term credit agreement (the “Short-Term Term Loan”) with a third-party financial institution, the proceeds of which were used to repay certain of our existing indebtedness. On September 1, 2022, we entered into a forward exchange agreement and pledge agreement (collectively the “Forward Exchange Agreement”) with the same financial institution to deliver to them our 5.1 million shares of ZimVie common stock in the first quarter of 2023. We pledged our 5.1 million shares of ZimVie common stock to the financial institution as collateral for our obligations under the Short-Term Term Loan and the Forward Exchange Agreement.
In February 2023, we repaid in full the Short-Term Term Loan by transferring our ZimVie common shares to the financial institution counterparty to settle the Forward Exchange Agreement and by paying $33.9 million in cash, representing an amount determined by the difference between the average daily volume-weighted average price of the ZimVie shares over the outstanding term of the Forward Exchange Agreement and the principal amount of $83.0 million. The transfer of our ZimVie common shares as part of the settlement resulted in a $49.1 million noncash financing activity for the year ended December 31, 2023.
The Forward Exchange Agreement was accounted for at fair value, with changes in fair value recognized in non-operating other expense, net and was included in the net gain related to our investment in ZimVie for the year ended December 31, 2023, as discussed above. The most significant input into the valuation of the Forward Exchange Agreement was the price of ZimVie shares. For the year ended December 31, 2022, an unrealized gain of $1.1 million related to the change in fair value of the Forward Exchange Agreement was recorded in non-operating other expense, net in our consolidated statements of earnings.
As discussed in Note 1, the results of our spine and dental businesses have been reflected as discontinued operations through the date of the spinoff for the year ended December 31, 2022. Details of loss from discontinued operations included in our consolidated statements of earnings are as follows (in millions):
| | | | | | |
| | For the Year Ended | | | |
| | December 31, | | | |
| | 2022 | | | |
Net Sales | | $ | 147.8 | | | |
Cost of products sold, excluding intangible asset amortization | | | 53.5 | | | |
Intangible asset amortization | | | 14.0 | | | |
Research and development | | | 10.5 | | | |
Selling, general and administrative | | | 89.4 | | | |
Restructuring and other cost reduction initiatives | | | 0.4 | | | |
Acquisition, integration, divestiture and related | | | 40.9 | | | |
Other expense, net | | | 0.3 | | | |
Loss from discontinued operations before income taxes | | | (61.2 | ) | | |
Benefit for income taxes from discontinued operations | | | (2.4 | ) | | |
Loss from discontinued operations, net of tax | | $ | (58.8 | ) | | |
We recognize revenue when our performance obligations under the terms of a contract with our customer are satisfied. This happens when we transfer control of our products to the customer, which generally occurs upon implantation or when title passes upon shipment. Revenue is measured as the amount of consideration we expect to receive in exchange for transferring our product. Taxes collected from customers and remitted to governmental authorities are excluded from revenues.
We sell products through two principal channels: 1) direct to healthcare institutions, referred to as direct channel accounts; and 2) through stocking distributors and healthcare dealers. In direct channel accounts and with some healthcare dealers, inventory is generally consigned to sales agents or customers so that products are available when needed for surgical procedures. No revenue is recognized upon the placement of inventory into consignment, as we retain the ability to control the inventory. Upon implantation, we issue an invoice and revenue is recognized. Consignment sales represented approximately 85 percent of our net sales in 2024. Pricing for products is generally predetermined by contracts with customers, agents acting on behalf of customer groups or by government regulatory bodies, depending on the market. Price discounts under group purchasing contracts are generally linked to volume of implant purchases by customer healthcare institutions within a specified group. At negotiated thresholds within a contract buying period, price discounts may increase. Payment terms vary by customer, but are typically less than 90 days.
With sales to stocking distributors and some healthcare dealers and hospitals, revenue is generally recognized when control of our product passes to the customer, which can be upon shipment of the product or receipt by the customer. We estimate sales recognized in this manner represented approximately 15 percent of our net sales in 2024. These customers may purchase items in large quantities if incentives are offered or if there are new product offerings in a market, which could cause period-to-period differences in sales. It is our accounting policy to account for shipping and handling activities as a fulfillment cost rather than as an additional promised service. We have contracts with these customers or orders may be placed from available price lists. Payment terms vary by customer, but are typically less than 90 days.
We offer standard warranties to our customers that our products are not defective. These standard warranties are not considered separate performance obligations. In limited circumstances, we offer extended warranties that are separate performance obligations. We have very few contracts that have multiple performance obligations. Since we do not have significant multiple element arrangements and essentially all of our sales are recognized upon implantation of a product or when title passes, very little judgment is required to allocate the transaction price of a contract or determine when control has passed to a customer. Our costs to obtain contracts consist primarily of sales commissions to employees or third-party agents that are earned when control of our product passes to the customer. Therefore, sales commissions are expensed as part of SG&A expenses at the same time revenue is recognized. Accordingly, we do not have significant contract assets, liabilities or future performance obligations.
We offer volume-based discounts, rebates, prompt pay discounts, right of return and other various incentives which we account for under the variable consideration model. If sales incentives may be earned by a customer for purchasing a specified amount of our product, we estimate whether such incentives will be achieved and recognize these incentives as a reduction in revenue in the same period the underlying revenue transaction is recognized. We primarily use the expected value method to estimate incentives. Under the expected value method, we consider the
historical experience of similar programs as well as review sales trends on a customer-by-customer basis to estimate what levels of incentives will be earned. Occasionally, products are returned and, accordingly, we maintain an estimated refund liability based upon the expected value method that is recorded as a reduction in revenue.
We analyze sales by two geographies, the United States and International; and by the following product categories: Knees; Hips; Sports Medicine, Extremities and Trauma (“S.E.T.”), which includes Craniomaxillofacial and Thoracic (“CMFT”); and Technology & Data, Bone Cement and Surgical.
This net sales presentation differs from our reportable operating segments, which are based upon our senior management organizational structure and how we allocate resources toward achieving operating profit goals. Each of our reportable operating segments sells all the product categories noted above. Accordingly, the only difference from the presentation below and our reportable operating segments are the geographic groupings.
Net sales by geography are as follows (in millions):
| | | | | | | | | | | | |
| | For the Years Ended December 31, | |
| | 2024 | | | 2023 | | | 2022 | |
United States | | $ | 4,439.0 | | | $ | 4,288.8 | | | $ | 4,012.4 | |
International | | | 3,239.6 | | | | 3,105.4 | | | | 2,927.5 | |
Total | | $ | 7,678.6 | | | $ | 7,394.2 | | | $ | 6,939.9 | |
Net sales by product category are as follows (in millions):
| | | | | | | | | | | | |
| | For the Years Ended December 31, | |
| | 2024 | | | 2023 | | | 2022 | |
Knees | | $ | 3,173.5 | | | $ | 3,038.4 | | | $ | 2,778.3 | |
Hips | | | 1,999.1 | | | | 1,967.2 | | | | 1,894.9 | |
S.E.T | | | 1,865.7 | | | | 1,752.6 | | | | 1,696.7 | |
Technology & Data, Bone Cement and Surgical | | | 640.3 | | | | 636.0 | | | | 570.0 | |
Total | | $ | 7,678.6 | | | $ | 7,394.2 | | | $ | 6,939.9 | |
In December 2023, our management approved a new global restructuring program (the “2023 Restructuring Plan”) intended to optimize our cost base and drive greater efficiencies throughout the company. The 2023 Restructuring Plan is expected to result in total pre-tax restructuring charges of approximately $120 million. The pre-tax restructuring charges consist of employee termination benefits, contract terminations for sales agents and other charges, such as consulting fees. The expenses incurred under our 2023 Restructuring Plan are reported in our “Restructuring and other cost reduction initiatives” financial statement line item. The following table summarizes the liabilities recognized related to the 2023 Restructuring Plan (in millions):
| | | | | | | | | | | | | | | | |
| | Employee | | | | | | | | | | |
| | Termination | | | Contract | | | | | | | |
| | Benefits | | | Terminations | | | Other | | | Total | |
Balance, December 31, 2022 | | $ | - | | | $ | - | | | $ | - | | | $ | - | |
Additions | | | 9.2 | | | | - | | | | 3.6 | | | | 12.8 | |
Cash payments | | | - | | | | - | | | | (1.0 | ) | | | (1.0 | ) |
Non-cash activity | | | - | | | | - | | | | 2.4 | | | | 2.4 | |
Balance, December 31, 2023 | | | 9.2 | | | | - | | | | 5.0 | | | | 14.2 | |
Additions | | | 84.6 | | | | 3.1 | | | | 13.0 | | | | 100.7 | |
Cash payments | | | (73.9 | ) | | | (1.7 | ) | | | (12.6 | ) | | | (88.2 | ) |
Foreign currency exchange rate changes | | | (1.1 | ) | | | - | | | | (0.1 | ) | | | (1.2 | ) |
Non-cash activity | | | - | | | | - | | | | 1.6 | | | | 1.6 | |
Balance, December 31, 2024 | | $ | 18.8 | | | $ | 1.4 | | | $ | 6.9 | | | $ | 27.1 | |
| | | | | | | | | | | | |
Expense incurred since the start of the 2023 Restructuring Plan | | $ | 93.8 | | | $ | 3.1 | | | $ | 16.6 | | | $ | 113.5 | |
| | | | | | | | | | | | |
Expense estimated to be recognized for the 2023 Restructuring Plan | | $ | 95.0 | | | $ | 5.0 | | | $ | 20.0 | | | $ | 120.0 | |
In December 2021, our management approved a new global restructuring program (the “2021 Restructuring Plan”) intended to further reduce costs and to reorganize our global operations in preparation for the spinoff of ZimVie. The 2021 Restructuring Plan concluded in 2024 and resulted in total pre-tax restructuring charges of approximately $170 million. The pre-tax restructuring charges consisted of employee termination benefits; contract terminations for sales agents; and other charges, such as consulting fees and project management expenses. The expenses incurred under our 2021 Restructuring Plan are reported in our “Restructuring and other cost reduction initiatives” financial statement line item. The following table summarizes the liabilities recognized related to the 2021 Restructuring Plan (in millions):
| | | | | | | | | | | | | | | | |
| | Employee | | | | | | | | | | |
| | Termination | | | Contract | | | | | | | |
| | Benefits | | | Terminations | | | Other | | | Total | |
Balance, December 31, 2021 | | $ | 19.5 | | | $ | 2.3 | | | $ | 10.3 | | | $ | 32.1 | |
Additions | | | 33.6 | | | | 49.5 | | | | 16.6 | | | | 99.7 | |
Cash payments | | | (43.4 | ) | | | (27.8 | ) | | | (23.9 | ) | | | (95.1 | ) |
Foreign currency exchange rate changes | | | 0.8 | | | | 1.0 | | | | 0.1 | | | | 1.9 | |
Balance, December 31, 2022 | | | 10.5 | | | | 25.0 | | | | 3.1 | | | | 38.6 | |
Additions | | | 6.0 | | | | 22.0 | | | | 9.3 | | | | 37.3 | |
Cash payments | | | (12.5 | ) | | | (30.2 | ) | | | (9.6 | ) | | | (52.3 | ) |
Foreign currency exchange rate changes | | | 0.2 | | | | 0.8 | | | | 0.1 | | | | 1.1 | |
Balance, December 31, 2023 | | | 4.2 | | | | 17.6 | | | | 2.9 | | | | 24.7 | |
Additions | | | (2.1 | ) | | | (0.1 | ) | | | 2.4 | | | | 0.2 | |
Cash payments | | | (1.5 | ) | | | (14.8 | ) | | | (3.8 | ) | | | (20.1 | ) |
Foreign currency exchange rate changes | | | (0.1 | ) | | | (0.7 | ) | | | (0.1 | ) | | | (0.9 | ) |
Balance, December 31, 2024 | | $ | 0.5 | | | $ | 2.0 | | | $ | 1.4 | | | $ | 3.9 | |
| | | | | | | | | | | | |
Expense incurred since the start of the 2021 Restructuring Plan | | $ | 57.0 | | | $ | 73.7 | | | $ | 38.6 | | | $ | 169.3 | |
In December 2019, our Board of Directors approved, and we initiated, a new global restructuring program (the “2019 Restructuring Plan”) with an objective of reducing costs to allow us to further invest in higher priority growth opportunities. The 2019 Restructuring Plan is expected to result in total pre-tax restructuring charges of
approximately $400 million. The pre-tax restructuring charges consist of employee termination benefits; contract terminations for facilities and sales agents; and other charges, such as consulting fees, project management and relocation costs, including costs to close a manufacturing facility.
The following table summarizes the location on our consolidated statement of earnings and type of cost for our 2019 Restructuring Plan (in millions):
| | | | | | | | | | | | | | | | |
| | Year Ended December 31, 2024 | |
| | Employee | | | | | | | | | | |
| | Termination | | | Contract | | | | | | | |
| | Benefits | | | Terminations | | | Other | | | Total | |
Cost of products sold, excluding intangible asset amortization | | $ | - | | | $ | - | | | $ | 11.5 | | | $ | 11.5 | |
Restructuring and other cost reduction initiatives | | | 26.4 | | | | - | | | | 10.2 | | | | 36.6 | |
| | $ | 26.4 | | | $ | - | | | $ | 21.7 | | | $ | 48.1 | |
| | | | | | | | | | | | |
| | Year Ended December 31, 2023 | |
| | Employee | | | | | | | | | | |
| | Termination | | | Contract | | | | | | | |
| | Benefits | | | Terminations | | | Other | | | Total | |
Cost of products sold, excluding intangible asset amortization | | $ | - | | | $ | - | | | $ | 8.2 | | | $ | 8.2 | |
Restructuring and other cost reduction initiatives | | | 17.4 | | | | - | | | | 15.9 | | | | 33.3 | |
| | $ | 17.4 | | | $ | - | | | $ | 24.1 | | | $ | 41.5 | |
In the year ended December 31, 2022, all expenses related to the 2019 Restructuring Plan were recognized in “Restructuring and other cost reduction initiatives”.
The following table summarizes the liabilities recognized related to the 2019 Restructuring Plan (in millions):
| | | | | | | | | | | | | | | | |
| | Employee | | | | | | | | | | |
| | Termination | | | Contract | | | | | | | |
| | Benefits | | | Terminations | | | Other | | | Total | |
Balance, December 31, 2021 | | $ | 14.8 | | | $ | 16.5 | | | $ | - | | | $ | 31.3 | |
Additions | | | 29.1 | | | | 0.7 | | | | 40.1 | | | | 69.9 | |
Cash payments | | | (13.4 | ) | | | (7.3 | ) | | | (33.3 | ) | | | (54.0 | ) |
Foreign currency exchange rate changes | | | (1.6 | ) | | | (0.9 | ) | | | (0.4 | ) | | | (2.9 | ) |
Balance, December 31, 2022 | | | 28.9 | | | | 9.0 | | | | 6.4 | | | | 44.3 | |
Additions | | | 17.4 | | | | - | | | | 24.1 | | | | 41.5 | |
Cash payments | | | (2.1 | ) | | | (3.4 | ) | | | (27.7 | ) | | | (33.2 | ) |
Foreign currency exchange rate changes | | | (0.4 | ) | | | - | | | | 0.1 | | | | (0.3 | ) |
Balance, December 31, 2023 | | | 43.8 | | | | 5.6 | | | | 2.9 | | | $ | 52.3 | |
Additions | | | 26.4 | | | | - | | | | 21.7 | | | | 48.1 | |
Cash payments | | | (32.0 | ) | | | (1.8 | ) | | | (23.2 | ) | | | (57.0 | ) |
Foreign currency exchange rate changes | | | (0.2 | ) | | | - | | | | (0.1 | ) | | | (0.3 | ) |
Balance, December 31, 2024 | | $ | 38.0 | | | $ | 3.8 | | | $ | 1.3 | | | $ | 43.1 | |
| | | | | | | | | | | | |
Expense incurred since the start of the 2019 Restructuring Plan | | $ | 152.1 | | | $ | 35.0 | | | $ | 180.4 | | | $ | 367.5 | |
| | | | | | | | | | | | |
Expense estimated to be recognized for the 2019 Restructuring Plan | | $ | 160.0 | | | $ | 35.0 | | | $ | 205.0 | | | $ | 400.0 | |
We do not include restructuring charges in the operating profit of our reportable segments. We report the expenses for other cost reduction and optimization initiatives in our “Restructuring and other cost reduction initiatives” financial statement line item because these activities also have the goal of reducing costs across the organization. However, since the cost reduction initiative expenses are not considered restructuring, they have been excluded from the amounts presented in this note.
6.Share-Based Compensation
Our share-based payments primarily consist of stock options and restricted stock units (“RSUs”). Share-based compensation expense was as follows (in millions):
| | | | | | | | | | | | |
| | For the Years Ended December 31, | |
| | 2024 | | | 2023 | | | 2022 | |
Total expense, pre-tax | | $ | 101.0 | | | $ | 99.8 | | | $ | 105.0 | |
Tax benefit related to awards | | | 8.7 | | | | 16.7 | | | | 16.9 | |
Total expense, net of tax | | $ | 92.3 | | | $ | 83.1 | | | $ | 88.1 | |
We had two equity compensation plans in effect at December 31, 2024: the 2009 Stock Incentive Plan (“2009 Plan”) and the Stock Plan for Non-Employee Directors. We have reserved the maximum number of shares of common stock available for awards under the terms of each of these plans. We have registered 49.9 million shares of common stock under these plans. The 2009 Plan provides for the grant of nonqualified stock options and incentive stock options, long-term performance awards in the form of performance shares or units, restricted stock, RSUs and stock appreciation rights. The Compensation and Management Development Committee of the Board of Directors determines the grant date for annual grants under our equity compensation plans. The date for annual grants under the 2009 Plan to our executive officers is expected to occur in the first quarter of each year following the earnings announcements for the previous quarter and full year. The Stock Plan for Non-Employee Directors provides for awards of stock options, restricted stock and RSUs to non-employee directors. It has been our practice to issue shares of common stock upon exercise of stock options from previously unissued shares, except in limited circumstances where they are issued from treasury stock. The total number of awards which may be granted in a given year and/or over the life of the plan under each of our equity compensation plans is limited. During 2024, we did not grant any type of stock option awards. At December 31, 2024, an aggregate of 7.0 million shares were available for future grants and awards under these plans.
Stock Options
Stock options granted to date under our plans generally vest over three or four years and have a maximum contractual life of 10 years. As established under our equity compensation plans, vesting may accelerate upon retirement after the first anniversary date of the award if certain criteria are met. We recognize expense related to stock options on a straight-line basis over the requisite service period, less awards expected to be forfeited using estimated forfeiture rates. Due to the accelerated retirement provisions, the requisite service period of our stock options range from one to four years. Stock options are granted with an exercise price equal to the market price of our common stock on the date of grant, except in limited circumstances where local law may dictate otherwise.
A summary of stock option activity for the year ended December 31, 2024 is as follows (options in thousands):
| | | | | | | | | | | | | | | | |
| | Stock
Options | | | Weighted
Average
Exercise
Price | | | Weighted
Average
Remaining
Contractual
Life | | | Intrinsic
Value
(in millions) | |
Outstanding at January 1, 2024 | | | 6,221 | | | $ | 123.29 | | | | | | | |
Options granted | | | - | | | | - | | | | | | | |
Options exercised | | | (477 | ) | | | 101.69 | | | | | | | |
Options forfeited | | | (43 | ) | | | 128.37 | | | | | | | |
Options expired | | | (330 | ) | | | 138.89 | | | | | | | |
Outstanding at December 31, 2024 | | | 5,371 | | | $ | 124.21 | | | | 4.1 | | | $ | 4.0 | |
Vested or expected to vest as of December 31, 2024 | | | 5,367 | | | $ | 124.20 | | | | 4.1 | | | $ | 4.0 | |
Exercisable at December 31, 2024 | | | 4,959 | | | $ | 123.65 | | | | 3.9 | | | $ | 4.0 | |
| | | | | | | | | | | | |
We use a Black-Scholes option-pricing model to determine the fair value of our stock options. Expected volatility was derived from a combination of historical volatility and implied volatility because the options that were actively traded around the grant date of our stock options did not have maturities of over one year. The expected term of the stock options has been derived from historical employee exercise behavior. The risk-free interest rate was determined using the implied yield currently available for zero-coupon U.S. government issues with a remaining term approximating the expected life of the options. The dividend yield was determined by using an estimated annual dividend and dividing it by the market price of our stock on the grant date.
The following table presents information regarding the weighted average fair value of stock options granted, the assumptions used to determine fair value, the intrinsic value of options exercised and the tax benefit of options exercised in the indicated year. No stock options were granted in 2024 and therefore certain information is not applicable (“N/A”).
| | | | | | | | | | | | |
| | For the Years Ended December 31, | |
| | 2024 | | | 2023 | | | 2022 | |
Dividend yield | | N/A | | | | 0.8 | % | | | 0.8 | % |
Volatility | | N/A | | | | 27.7 | % | | | 30.2 | % |
Risk-free interest rate | | N/A | | | | 3.5 | % | | | 1.9 | % |
Expected life (years) | | N/A | | | | 5.0 | | | | 5.0 | |
Weighted average fair value of options granted | | N/A | | | $ | 36.65 | | | $ | 32.07 | |
Intrinsic value of options exercised (in millions) | | $ | 11.4 | | | $ | 23.2 | | | $ | 20.5 | |
Tax benefit of options exercised (in millions) | | $ | 2.3 | | | $ | 4.4 | | | $ | 4.0 | |
As of December 31, 2024, there was $2.0 million of unrecognized share-based payment expense related to nonvested stock options granted under our plans. That expense is expected to be recognized over a weighted average period of 0.3 years.
RSUs
We have awarded RSUs to certain of our employees. The terms of the awards are generally three or four years. Some of the awards have only service conditions while some have performance and market conditions in addition to service conditions. Future service conditions may be waived if an employee retires after the first anniversary date of the award, but performance and market conditions continue to apply. Accordingly, the requisite service period used for share-based payment expense on our RSUs range from one year to four years.
A summary of nonvested RSU activity for the year ended December 31, 2024 is as follows (RSUs in thousands):
| | | | | | | | |
| | | | | Weighted
Average | |
| | | | | Grant Date | |
| | RSUs | | | Fair Value | |
Outstanding at January 1, 2024 | | | 1,807 | | | $ | 135.97 | |
Granted | | | 1,101 | | | | 124.64 | |
Vested | | | (405 | ) | | | 124.38 | |
Forfeited | | | (434 | ) | | | 138.16 | |
Outstanding at December 31, 2024 | | | 2,069 | | | $ | 123.37 | |
| | | | | | |
For the RSUs with service conditions only, the fair value of the awards was determined based upon the fair market value of our common stock on the date of grant. For the RSUs with market conditions, a Monte Carlo valuation technique was used to simulate the market conditions of the awards. The outcome of the simulation was used to determine the fair value of the awards.
We are required to estimate the number of RSUs that will vest and recognize share-based payment expense on a straight-line basis over the requisite service period. As of December 31, 2024, we estimate that 1,502,966 outstanding RSUs will vest. If our estimate were to change in the future, the cumulative effect of the change in
estimate will be recorded in that period. Based upon the number of RSUs that we expect to vest, the unrecognized share-based payment expense as of December 31, 2024 was $75.2 million and is expected to be recognized over a weighted-average period of 1.7 years. The fair value of RSUs that vested during the years ended December 31, 2024, 2023 and 2022 based upon our stock price on the date of vesting was $51.2 million, $26.9 million, and $20.3 million, respectively.
Inventories consisted of the following (in millions):
| | | | | | | | |
| | As of December 31, | |
| | 2024 | | | 2023 | |
Finished goods | | $ | 1,771.7 | | | $ | 1,831.2 | |
Work in progress | | | 175.1 | | | | 246.5 | |
Raw materials | | | 288.5 | | | | 307.5 | |
Inventories | | $ | 2,235.3 | | | $ | 2,385.2 | |
Amounts charged to the consolidated statements of earnings for excess and obsolete inventory in the years ended December 31, 2024, 2023 and 2022 were $149.9 million, $155.2 million and $137.3 million, respectively.
8.Property, Plant and Equipment
Property, plant and equipment consisted of the following (in millions):
| | | | | | | | |
| | As of December 31, | |
| | 2024 | | | 2023 | |
Land | | $ | 18.5 | | | $ | 18.9 | |
Building and equipment | | | 2,273.1 | | | | 2,245.9 | |
Capitalized software costs | | | 575.1 | | | | 552.2 | |
Instruments | | | 3,589.6 | | | | 3,748.6 | |
Construction in progress | | | 233.9 | | | | 200.6 | |
| | | 6,690.2 | | | | 6,766.2 | |
Accumulated depreciation | | | (4,641.4 | ) | | | (4,705.8 | ) |
Property, plant and equipment, net | | $ | 2,048.8 | | | $ | 2,060.4 | |
Depreciation expense was $404.4 million, $390.2 million and $399.6 million for the years ended December 31, 2024, 2023 and 2022, respectively.
We had $10.4 million and $30.8 million of property, plant and equipment included in accounts payable as of December 31, 2024 and 2023, respectively.
9.Fair Value Measurements of Assets and Liabilities
The following financial assets and liabilities are recorded at fair value on a recurring basis (in millions):
| | | | | | | | | | | | | | | | |
| | As of December 31, 2024 | |
| | | | | Fair Value Measurements at Reporting Date Using: | |
Description | | Recorded
Balance | | | Quoted Prices
in Active
Markets for
Identical
Assets
(Level 1) | | | Significant
Other
Observable
Inputs
(Level 2) | | | Significant
Unobservable
Inputs
(Level 3) | |
Assets | | | | | | | | | | | | |
Derivatives designated as hedges, current and long-term | |
| | | | | | | | | | |
Foreign currency forward contracts | | $ | 89.5 | | | $ | - | | | $ | 89.5 | | | $ | - | |
Cross-currency interest rate swaps | | | 50.3 | | | | - | | | | 50.3 | | | | - | |
Derivatives not designated as hedges, current and long-term | | | | | | | | | | | | |
Foreign currency forward contracts | | | 1.8 | | | | - | | | | 1.8 | | | | - | |
Total Assets | | $ | 141.6 | | | $ | - | | | $ | 141.6 | | | $ | - | |
Liabilities | | | | | | | | | | | | |
Derivatives designated as hedges, current and long-term | | | | | | | | | | | | |
Foreign currency forward contracts | | $ | 1.8 | | | $ | - | | | $ | 1.8 | | | $ | - | |
Cross-currency interest rate swaps | | | 14.2 | | | | - | | | | 14.2 | | | | - | |
Interest rate swaps | | | 158.6 | | | | - | | | | 158.6 | | | | - | |
Derivatives not designated as hedges, current and long-term | | | | | | | | | | | | |
Foreign currency forward contracts | | | 0.8 | | | | - | | | | 0.8 | | | | - | |
Contingent payments related to acquisitions | | | 180.7 | | | | - | | | | - | | | | 180.7 | |
Total Liabilities | | $ | 356.1 | | | $ | - | | | $ | 175.4 | | | $ | 180.7 | |
| | | | | | | | | | | | | | | | |
| | As of December 31, 2023 | |
| | | | | Fair Value Measurements at Reporting Date Using: | |
Description | | Recorded
Balance | | | Quoted Prices
in Active
Markets for
Identical
Assets
(Level 1) | | | Significant
Other
Observable
Inputs
(Level 2) | | | Significant
Unobservable
Inputs
(Level 3) | |
Assets | | | | | | | | | | | | |
Derivatives designated as hedges, current and long-term | |
| | | | | | | | | | |
Foreign currency forward contracts | | $ | 54.4 | | | $ | - | | | $ | 54.4 | | | $ | - | |
Cross-currency interest rate swaps | | | 5.4 | | | | - | | | | 5.4 | | | | - | |
Derivatives not designated as hedges, current and long-term | | | | | | | | | | | | |
Foreign currency forward contracts | | | 0.4 | | | | - | | | | 0.4 | | | | - | |
Total Assets | | $ | 60.2 | | | $ | - | | | $ | 60.2 | | | $ | - | |
Liabilities | | | | | | | | | | | | |
Derivatives designated as hedges, current and long-term | | | | | | | | | | | | |
Foreign currency forward contracts | | $ | 3.7 | | | $ | - | | | $ | 3.7 | | | $ | - | |
Cross-currency interest rate swaps | | | 68.1 | | | | - | | | | 68.1 | | | | - | |
Interest rate swaps | | | 144.7 | | | | - | | | | 144.7 | | | | - | |
Derivatives not designated as hedges, current and long-term | | | | | | | | | | | | |
Foreign currency forward contracts | | | 1.6 | | | | - | | | | 1.6 | | | | - | |
Contingent payments related to acquisitions | | | 141.7 | | | | - | | | | - | | | | 141.7 | |
Total Liabilities | | $ | 359.8 | | | $ | - | | | $ | 218.1 | | | $ | 141.7 | |
We value our foreign currency forward contracts using a market approach based on foreign currency exchange rates obtained from active markets, and we perform ongoing assessments of counterparty credit risk.
We value our interest rate swaps using a market approach based on publicly available market yield curves and the terms of our swaps, and we perform ongoing assessments of counterparty credit risk. The valuation of our cross-currency interest rate swaps also includes consideration of foreign currency exchange rates.
Contingent payments related to acquisitions consist of sales-based payments and regulatory milestones, and are valued using discounted cash flow techniques. The fair value of sales-based payments is based upon significant unobservable inputs such as probability-weighted future revenue estimates and simulating the numerous potential outcomes, and changes as revenue estimates increase or decrease. The fair value of the regulatory milestones is based on the probability of success in obtaining the specified regulatory approval.
Contingent payments related to our acquisition of Embody, Inc. (“Embody”) in February 2023 are to be settled by issuance of our common stock and cash payments. The Embody acquisition is discussed in Note 10. During the year ended December 31, 2024, we issued 0.2 million shares of our common stock valued at $23.4 million and paid $1.5 million of cash for a commercial milestone related to the Embody acquisition. The fair value of common stock was determined to be $123.87 per share, which represented the average of our high and low stock prices on the settlement date. To minimize dilution from issuing shares for the milestone settlement, we repurchased 0.2 million shares of our common stock in February of 2024.
The following table provides a reconciliation of the beginning and ending balances of items measured at fair value on a recurring basis in the tables above that used significant unobservable inputs (Level 3) (in millions):
| | | | |
| | Level 3 - Liabilities | |
Contingent payments related to acquisitions | | | |
Beginning balance December 31, 2023 | | $ | 141.7 | |
New contingent consideration related to acquisitions | | | 61.0 | |
Change in estimates | | | 7.1 | |
Settlements | | | (28.9 | ) |
Foreign currency impact | | | (0.2 | ) |
Ending balance December 31, 2024 | | $ | 180.7 | |
Changes in estimates for contingent payments related to acquisitions are recognized in the Acquisition, integration, divestiture and related line item on our consolidated statements of earnings.
On April 2, 2024, we completed the acquisition of all the outstanding shares of a third party orthopedics distributor in the EMEA market. Prior to the acquisition, the distributor sold our products to its customers. The acquisition is expected to improve our margins and allow us to better serve the end customers.
On April 29, 2024, we completed the acquisition of all the outstanding shares of V.I.M.S. Vidéo Interventionnelle Médicale Scientifique, a privately-held medical device company based in France, which expands our portfolio in the sports medicine market.
On August 16, 2024, we completed the acquisition of all the outstanding shares of a privately-held medical device company based in the United States, which expands our portfolio in the CMFT market.
On October 11, 2024, we completed the acquisition of all the outstanding shares of Orthogrid Systems, Inc. (“Orthogrid”), a privately-held medical device technology company focused on artificial intelligence-driven surgical guidance for total hip replacement, which expands our portfolio in the hips market.
These four acquisitions are collectively referred to in this report as the “2024 acquisitions”. Initial consideration related to the 2024 acquisitions was $294.5 million, with additional consideration up to $111.6 million, subject to the achievement of future regulatory milestones and commercial milestones. We determined the fair value of the additional consideration to be $61.0 million as of the acquisition dates.
The goodwill related to the 2024 acquisitions represents the excess of the consideration transferred over the fair value of the net assets acquired. The goodwill related to these acquisitions is generated from the operational synergies, cross-selling opportunities and future development we expect to achieve from the technologies acquired. No goodwill is expected to be deductible for income tax purposes. The goodwill related to the two acquisitions that occurred in April is included in the EMEA operating segment and reporting unit. The goodwill related to the August acquisition is included in the Americas operating segment and the Americas CMFT reporting unit. The goodwill related to the Orthogrid acquisition is included in the Americas operating segment and the Americas Orthopedics reporting unit.
The purchase price allocations for the 2024 acquisitions are preliminary as of December 31, 2024. We need additional time to evaluate the technology and tax attributes of those transactions, which may change the recognized intangible assets and tax assets and liabilities. There may be differences between the preliminary estimates of fair value and the final acquisition accounting. The final estimates of fair value are expected to be completed as soon as possible, but no later than one year after the respective acquisition dates.
The following table summarizes the estimates of fair value of the assets acquired and liabilities assumed related to the 2024 acquisitions (in millions):
| | | | |
Current assets | | $ | 24.9 | |
Intangible assets subject to amortization: | | | |
Technology | | | 112.8 | |
Trademarks and trade names | | | 5.0 | |
Customer relationships | | | 40.8 | |
Intangible assets not subject to amortization: | | | |
In-process research and development (IPR&D) | | | 7.0 | |
Goodwill | | | 200.6 | |
Other assets | | | 4.9 | |
Total assets acquired | | | 396.0 | |
Current liabilities | | | 6.1 | |
Deferred income taxes | | | 34.0 | |
Other long-term liabilities | | | 0.5 | |
Total liabilities assumed | | | 40.5 | |
Net assets acquired | | $ | 355.5 | |
The weighted average amortization periods selected for technology, customer relationships and trademarks and trade names were 14 years, 9 years and 14 years, respectively. Upon receiving regulatory approval subsequent to the applicable acquisition date, the $7.0 million of IPR&D was reclassified to a definite-lived intangible asset and began amortizing over the applicable estimated useful life.
During the quarter ended December 31, 2024, there were no material adjustments to the preliminary values of any of the 2024 acquisitions.
On February 14, 2023, we completed the acquisition of all the outstanding shares of Embody, Inc. (“Embody”), a medical device company focused on soft tissue healing, that expands our portfolio for the sports medicine market. Initial consideration consisted of the issuance of 1.1 million shares of our common stock valued at $135.0 million and $19.5 million of cash for a total value of $154.5 million. The fair value of our common stock was determined to be $127.34 per share, which represented the average of our high and low stock prices on the acquisition date. To minimize dilution from issuing shares for the Embody acquisition, we repurchased 1.9 million shares of our common stock in the three-month period ended March 31, 2023. The Embody acquisition includes additional consideration of up to $120.0 million in fair value of our common shares and cash, subject to achieving a future regulatory milestone after closing and commercial milestones based on sales growth over a three-year period. We assigned a fair value of $94.0 million for this contingent consideration as of the acquisition date. The estimated fair value of the contingent consideration liability was calculated based on the probability of achieving the specified regulatory milestone and by simulating numerous potential outcomes for the commercial milestones and discounting to present value the estimated payments.
On April 28, 2023, we completed the acquisition of all the outstanding shares of a privately held orthopedics medical device company that expands our portfolio in the orthopedics market ("April 2023 acquisition"). The initial consideration consisted of $15.0 million of cash and includes additional consideration of up to $8.0 million in cash, subject to achieving future regulatory milestones.
On October 6, 2023, we completed the acquisition of all the outstanding shares of a privately held orthopedics medical device company that provides us new surgical technology that can be used in procedures across multiple product categories (“October 2023 acquisition”). The initial consideration consisted of $42.2 million of cash and includes additional consideration of up to $33.0 million in cash contingent upon achieving certain commercial milestones based on sales growth over a three-year period. We assigned a fair value of $21.5 million for this contingent consideration as of the acquisition date. The estimated fair value of the contingent liability was calculated based on the probability of achieving the commercial milestones and discounting to present value the estimated payments.
On November 15, 2023, we completed the acquisition of a privately held technology company by acquiring certain assets, liabilities and employees of the technology company (“November 2023 acquisition”). The November acquisition expands our technology and data capabilities and solutions across multiple product categories to better serve our customers. The initial consideration consisted of $60.7 million of cash and includes additional consideration of up to $20.0 million in cash contingent upon achieving a commercial milestone based on a certain sales target which must be achieved by December 31, 2025. We assigned a fair value of $15.0 million for this contingent consideration as of the acquisition date. The estimated fair value of the contingent liability was calculated based on the probability of achieving the commercial milestone and discounting to present value the estimated payment.
These four acquisitions are collectively referred to in this report as the “2023 acquisitions”. Refer to Note 9 for information regarding the issuance of common stock and cash payments related to the contingent consideration liabilities that have occurred subsequent to the acquisition dates.
The goodwill related to the 2023 acquisitions represents the excess of the consideration transferred over the fair value of the net assets acquired. The goodwill related to the 2023 acquisitions is generated from the operational synergies and cross-selling opportunities we expect to achieve from the technologies acquired. A portion of the goodwill is expected to be deductible for U.S. income tax purposes. The goodwill related to the Embody, the October 2023 and the November 2023 acquisitions is included in the Americas operating segment and the Americas Orthopedics reporting unit. The goodwill related to the April 2023 acquisition is included in the Asia Pacific operating segment and reporting unit.
During the year ended December 31, 2024, there were no material adjustments to the preliminary values of the 2023 acquisitions.
The purchase price allocations for the 2023 acquisitions are final as of December 31, 2024. The following table summarizes the aggregate final estimates of fair value of the assets acquired and liabilities assumed related to the 2023 acquisitions (in millions):
| | | | |
Current assets | | $ | 13.1 | |
Intangible assets subject to amortization: | | | |
Technology | | | 144.0 | |
Trademarks and trade names | | | 3.5 | |
Customer relationships | | | 40.1 | |
Intangible assets not subject to amortization: | | | |
IPR&D | | | 36.3 | |
Goodwill | | | 215.0 | |
Other assets | | | 4.8 | |
Total assets acquired | | | 456.8 | |
Current liabilities | | | 8.2 | |
Deferred income taxes | | | 37.7 | |
Total liabilities assumed | | | 45.9 | |
Net assets acquired | | $ | 410.9 | |
The weighted average amortization periods selected for technology, customer relationships and trademarks and trade names were 15 years, 8 years and 13 years, respectively. Upon receiving regulatory approval subsequent to the Embody acquisition date, the $36.3 million of IPR&D was reclassified to a definite-lived intangible asset and began amortizing over the applicable estimated useful life.
On April 18, 2022, we completed the acquisition of all the outstanding shares of a privately held sternal closure company. The acquisition was completed primarily to expand our product offerings in the CMFT market. The total aggregate cash consideration paid at closing was $100.0 million, with an additional $11.0 million of deferred payments to be made over the following two years, of which $7.0 and $4.0 million was paid in the years ended December 31, 2024 and 2023, respectively.
The goodwill related to this acquisition represents the excess of the consideration transferred over the fair value of the net assets acquired. The goodwill is related to the operational synergies we expect to achieve from combining the
companies and the cash flows from future, undefined, development projects. The goodwill is included in the Americas operating segment and the Americas CMFT reporting unit. A portion of the goodwill is expected to be deductible for U.S. income tax purposes.
The following table summarizes the aggregate final estimates of fair value of the assets acquired and liabilities assumed related to this acquisition (in millions):
| | | | |
Current assets | | $ | 3.8 | |
Intangible assets subject to amortization: | | | |
Technology | | | 42.8 | |
Customer relationships | | | 12.3 | |
Goodwill | | | 48.3 | |
Other assets | | | 4.9 | |
Total assets acquired | | | 112.1 | |
Current liabilities | | | 1.1 | |
Total liabilities assumed | | | 1.1 | |
Net assets acquired | | $ | 111.0 | |
The amortization periods selected for technology and customer relationships were 10 years and 4 years, respectively.
We have not included pro forma information and certain other information under GAAP for the acquisitions from any years because they did not have a material impact on our financial position or results of operations.
11.Goodwill and Other Intangible Assets
The following table summarizes the changes in the carrying amount of goodwill (in millions):
| | | | | | | | | | | | | | | | |
| | Americas | | | EMEA | | | Asia Pacific | | | Total | |
Balance at January 1, 2023 | | | | | | | | | | | | |
Goodwill | | $ | 8,043.3 | | | $ | 1,326.8 | | | $ | 544.6 | | | $ | 9,914.7 | |
Accumulated impairment losses | | | (7.7 | ) | | | (1,326.8 | ) | | | - | | | | (1,334.5 | ) |
| | | 8,035.6 | | | | - | | | | 544.6 | | | | 8,580.2 | |
2023 acquisitions | | | 201.4 | | | | - | | | | 13.6 | | | | 215.0 | |
Currency translation | | | 28.8 | | | | - | | | | (5.5 | ) | | | 23.3 | |
Balance at December 31, 2023 | | | | | | | | | | | | |
Goodwill | | | 8,273.5 | | | | 1,326.8 | | | | 552.7 | | | | 10,153.0 | |
Accumulated impairment losses | | | (7.7 | ) | | | (1,326.8 | ) | | | - | | | | (1,334.5 | ) |
| | | 8,265.8 | | | | - | | | | 552.7 | | | | 8,818.5 | |
2024 acquisitions | | | 156.5 | | | | 44.1 | | | | - | | | | 200.6 | |
Currency translation | | | (53.2 | ) | | | (0.4 | ) | | | (14.4 | ) | | | (68.0 | ) |
Balance at December 31, 2024 | | | | | | | | | | | | |
Goodwill | | | 8,376.8 | | | | 1,370.5 | | | | 538.3 | | | | 10,285.6 | |
Accumulated impairment losses | | | (7.7 | ) | | | (1,326.8 | ) | | | - | | | | (1,334.5 | ) |
| | $ | 8,369.1 | | | $ | 43.7 | | | $ | 538.3 | | | $ | 8,951.1 | |
As discussed further in Note 10, we completed acquisitions during the years ended December 31, 2024, 2023 and 2022, resulting in additional goodwill.
We perform our annual test of goodwill impairment in the fourth quarter of every year. In connection with the annual goodwill impairment test in the fourth quarter of 2024, we estimated the fair value of our Americas Orthopedics, EMEA and Asia Pacific reporting units using the income and market approaches. In the annual 2024 test, the estimated fair values of each of the Americas Orthopedics, EMEA and Asia Pacific reporting units exceeded their carrying values by more than 30 percent. We performed a qualitative test on our Americas CMFT reporting unit and concluded it was more likely than not the fair value of this reporting unit exceeded its carrying value.
Fair value under the income approach was determined by discounting to present value the estimated future cash flows of the reporting unit. Fair value under the market approach utilized the guideline public company
methodology, which uses valuation indicators from publicly-traded companies that are similar to our reporting units and considers differences between our reporting units and the comparable companies.
In estimating the future cash flows of the reporting units, we utilized a combination of market and company-specific inputs that a market participant would use in assessing the fair value of the reporting units. The primary market input was revenue growth rates. These rates were based upon historical trends and estimated future growth drivers such as an aging global population, obesity and more active lifestyles. Significant company-specific inputs included assumptions regarding how the reporting unit could leverage operating expenses as revenue grows and the impact any of our differentiated products or new products will have on revenues.
Under the guideline public company methodology, we took into consideration specific risk differences between our reporting units and the comparable companies, such as recent financial performance, size risks and product portfolios, among other considerations.
We will continue to monitor the fair value of our reporting units in our interim and annual reporting periods. If our estimated cash flows decrease, we may have to record impairment charges in the future. Factors that could result in our cash flows being lower than our current estimates include: 1) decreased revenues caused by unforeseen changes in the healthcare market, or our inability to generate new product revenue from our research and development activities, 2) our inability to achieve the estimated operating margins in our forecasts from our restructuring programs, cost saving initiatives, and other unforeseen factors, and 3) the weakening of foreign currencies against the U.S. Dollar. Additionally, changes in the broader economic environment could cause changes to our estimated discount rates and comparable company valuation indicators, which may impact our estimated fair values.
There were no goodwill impairment charges for the years ended December 31, 2024 and 2023.
During the year ended December 31, 2022, we recorded a goodwill impairment charge of $289.8 million in our EMEA reporting unit, primarily due to the impacts from macroeconomic factors. The weakening of major foreign currencies in our EMEA reporting unit against the U.S. Dollar significantly impacted forecasted cash flows used in our analysis. For the EMEA reporting unit, operating expenses did not decline proportionally to revenue as many inventory-related and certain expenses are based on the U.S. Dollar. In addition, inflationary pressures also caused our forecasted expenses to increase. Furthermore, our discounted cash flows utilized a higher risk-adjusted discount rate for the 2022 impairment test when compared to the 2021 test, primarily due to central banks raising interest rates in 2022 and increased country-specific risk due to macroeconomic factors and risks the region faces. We had previously taken goodwill impairment charges related to this reporting unit in prior years so when these negative macroeconomic factors occurred in 2022, the remaining goodwill was determined to be fully impaired as of December 31, 2022.
The components of identifiable intangible assets were as follows (in millions):
| | | | | | | | | | | | | | | | | | | | | | | | | | | | |
| | Technology | | | Intellectual
Property
Rights | | | Trademarks
and Trade
Names | | | Customer
Relationships | | | IPR&D | | | Other | | | Total | |
As of December 31, 2024: | | | | | | | | | | | | | | | | | | | | | |
Intangible assets subject to amortization: | | | | | | | | | | | | | | | | | | | | | |
Gross carrying amount | | $ | 3,438.1 | | | $ | 478.0 | | | $ | 520.4 | | | $ | 5,124.5 | | | $ | - | | | $ | 188.4 | | | $ | 9,749.4 | |
Accumulated amortization | | | (2,056.6 | ) | | | (346.3 | ) | | | (313.0 | ) | | | (2,761.4 | ) | | | - | | | | (123.7 | ) | | | (5,601.0 | ) |
Intangible assets not subject to
amortization: | | | | | | | | | | | | | | | | | | | | | |
Gross carrying amount | | | - | | | | - | | | | 450.0 | | | | - | | | | - | | | | - | | | | 450.0 | |
Total identifiable intangible assets | | $ | 1,381.5 | | | $ | 131.7 | | | $ | 657.4 | | | $ | 2,363.1 | | | $ | - | | | $ | 64.7 | | | $ | 4,598.4 | |
As of December 31, 2023: | | | | | | | | | | | | | | | | | | | | | |
Intangible assets subject to amortization: | | | | | | | | | | | | | | | | | | | | | |
Gross carrying amount | | $ | 3,177.4 | | | $ | 473.2 | | | $ | 523.8 | | | $ | 5,130.7 | | | $ | - | | | $ | 172.7 | | | $ | 9,477.8 | |
Accumulated amortization | | | (1,894.2 | ) | | | (295.1 | ) | | | (289.9 | ) | | | (2,495.4 | ) | | | - | | | | (108.4 | ) | | | (5,083.0 | ) |
Intangible assets not subject to
amortization: | | | | | | | | | | | | | | | | | | | | | |
Gross carrying amount | | | - | | | | - | | | | 454.6 | | | | - | | | | 7.0 | | | | - | | | | 461.6 | |
Total identifiable intangible assets | | $ | 1,283.2 | | | $ | 178.1 | | | $ | 688.5 | | | $ | 2,635.3 | | | $ | 7.0 | | | $ | 64.3 | | | $ | 4,856.4 | |
We recognized an IPR&D intangible asset impairment charge of $3.0 million in the year ended December 31, 2022 in “Goodwill and intangible asset impairment” on our consolidated statements of earnings. This impairment was the result of delays and additional costs related to a project. Since this project had a low probability of success and was not a priority, there is not expected to be a significant impact on our future cash flows. There were no IPR&D intangible asset impairment charges in the years ended December 31, 2024 and 2023.
In the year ended December 31, 2024, we recognized intangible assets of $205.8 million related to agreements we have entered into in order to acquire the ownership rights or gain access to various technologies. The weighted average amortization period selected for these intangible assets was 8 years. The contractual payments under these agreements are included in "Acquisition of intangible assets" in our consolidated statements of cash flows. We have recognized current liabilities and noncurrent liabilities of approximately $31.0 million and $35.0 million, respectively, for the remaining portion of the contractual payments, which represents noncash investing activity for the year ended December 31, 2024.
In the year ended December 31, 2023, we entered into agreements to acquire intellectual property through the buyout of certain licensing arrangements. These new agreements and the related payments eliminate the various royalty payments that would have been due under the terms of previous licensing arrangements through 2030. These new agreements benefit us by expanding our ownership of intellectual property that we may use in the future. We recognized intangible assets of $86.1 million in 2023 related to these agreements, which will be amortized through
2030. The fixed, contractual payments made under these new agreements are reflected in "Acquisition of intangible assets" in our consolidated statements of cash flows.
Estimated annual amortization expense based upon intangible assets recognized as of December 31, 2024 for the years ending December 31, 2025 through 2029 is (in millions):
| | | | |
For the Years Ending December 31, | | | |
2025 | | $ | 596.0 | |
2026 | | | 564.1 | |
2027 | | | 549.0 | |
2028 | | | 542.2 | |
2029 | | | 517.4 | |
12.Other Current Liabilities
Other current liabilities consisted of the following (in millions):
| | | | | | | | |
| | As of December 31, | |
| | 2024 | | | 2023 | |
Other current liabilities: | | | | | | |
Salaries, wages and benefits | | $ | 373.2 | | | $ | 417.1 | |
Litigation and product liability | | | 82.9 | | | | 146.2 | |
Customer rebates | | | 203.1 | | | | 180.0 | |
Accrued liabilities | | | 734.1 | | | | 803.6 | |
Total other current liabilities | | $ | 1,393.3 | | | $ | 1,546.9 | |
.
Our debt consisted of the following (in millions):
| | | | | | | | |
| | As of December 31, | |
| | 2024 | | | 2023 | |
Current portion of long-term debt | | | | | | |
Uncommitted Credit Facility | | | - | | | | 50.0 | |
1.450% Senior Notes due 2024 | | | - | | | | 850.0 | |
3.550% Senior Notes due 2025 | | | 863.0 | | | | - | |
Total short-term debt | | $ | 863.0 | | | $ | 900.0 | |
Long-term debt | | | | | | |
3.550% Senior Notes due 2025 | | | - | | | $ | 863.0 | |
3.050% Senior Notes due 2026 | | | 600.0 | | | | 600.0 | |
5.350% Senior Notes due 2028 | | | 500.0 | | | | 500.0 | |
3.550% Senior Notes due 2030 | | | 257.5 | | | | 257.5 | |
2.600% Senior Notes due 2031 | | | 750.0 | | | | 750.0 | |
5.200% Senior Notes due 2034 | | | 700.0 | | | | - | |
4.250% Senior Notes due 2035 | | | 253.4 | | | | 253.4 | |
5.750% Senior Notes due 2039 | | | 317.8 | | | | 317.8 | |
4.450% Senior Notes due 2045 | | | 395.4 | | | | 395.4 | |
2.425% Euro Notes due 2026 | | | 517.7 | | | | 552.3 | |
1.164% Euro Notes due 2027 | | | 517.7 | | | | 552.3 | |
3.518% Euro Notes due 2032 | | | 724.8 | | | | - | |
Debt discount and issuance costs | | | (34.1 | ) | | | (29.1 | ) |
Adjustment related to interest rate swaps | | | (158.6 | ) | | | (144.7 | ) |
Total long-term debt | | $ | 5,341.6 | | | $ | 4,867.9 | |
On November 20, 2024, we completed the offering of €700.0 million aggregate principal amount of our 3.518% Euro Notes due December 15, 2032. Interest is payable on these Euro Notes on December 15 of each year until maturity, commencing on December 15, 2025. We received net proceeds of $736.3 million.
On August 15, 2024, we completed the offering of $700.0 million aggregate principal amount of our 5.200% Senior Notes due September 15, 2034. Interest is payable on these Senior Notes on March 15 and September 15 of each year until maturity. We received net proceeds of $700.0 million.
On June 28, 2024, we entered into a new five-year revolving credit agreement (the “2024 Five-Year Credit Agreement”) and a new 364-day revolving credit agreement (the “2024 364-Day Revolving Credit Agreement”), as described below. Borrowings under these credit agreements will be used for general corporate purposes.
The 2024 Five-Year Credit Agreement contains a five-year unsecured revolving facility of $1.5 billion (the “2024 Five-Year Revolving Facility”). The 2024 Five-Year Credit Agreement replaced the previous revolving credit agreement entered into on July 7, 2023 (the “2023 Five-Year Credit Agreement”), which contained a five-year unsecured revolving facility of $1.5 billion (the “2023 Five-Year Revolving Facility”). There were no outstanding borrowings under the 2023 Five-Year Credit Agreement at the time it was terminated.
The 2024 Five-Year Credit Agreement will mature on June 28, 2029, with two one-year extensions exercisable at our discretion and subject to required lender consent. The 2024 Five-Year Credit Agreement also includes an uncommitted incremental feature allowing us to request an increase of the facility by an aggregate amount of up to $500.0 million.
Borrowings under the 2024 Five-Year Credit Agreement bear interest at floating rates, based upon either an adjusted term secured overnight financing rate (“Term SOFR”) for the applicable interest period or an alternate base rate, in each case, plus an applicable margin determined by reference to our senior unsecured long-term debt credit rating. We pay a facility fee on the aggregate amount of the 2024 Five-Year Revolving Facility at a rate determined by reference to our senior unsecured long-term debt credit rating.
The 2024 Five-Year Credit Agreement contains customary affirmative and negative covenants and events of default for unsecured financing arrangements, including, among other things, limitations on consolidations, mergers, and sales of assets. The 2024 Five-Year Credit Agreement also requires us to maintain a consolidated indebtedness to consolidated EBITDA ratio of no greater than 4.5 to 1.0 as of the last day of any period of four consecutive fiscal quarters (with such ratio subject to increase to 5.0 to 1.0 for a period of time in connection with a qualified material acquisition and certain other restrictions). We were in compliance with all covenants under the 2024 Five-Year Credit Agreement as of December 31, 2024. As of December 31, 2024, there were no outstanding borrowings under the 2024 Five-Year Credit Agreement.
The 2024 364-Day Revolving Credit Agreement is an unsecured revolving credit facility in the principal amount of $1.0 billion (the “2024 364-Day Revolving Facility”). The 2024 364-Day Revolving Credit Agreement replaced a credit agreement entered into on July 7, 2023, which was also a 364-day unsecured revolving credit facility of $1.0 billion (the “2023 364-Day Revolving Facility”). There were no borrowings outstanding under the 2023 364-Day Revolving Facility when it was terminated.
The 2024 364-Day Revolving Facility will mature on June 27, 2025. Borrowings under the 2024 364-Day Revolving Credit Agreement bear interest at floating rates based upon either an adjusted Term SOFR for the applicable interest period or an alternate base rate, in each case, plus an applicable margin determined by reference to our senior unsecured long-term debt credit rating. We pay a facility fee on the aggregate amount of the 2024 364-Day Revolving Facility at a rate determined by reference to our senior unsecured long-term debt credit rating.
The 2024 364-Day Revolving Credit Agreement contains customary affirmative and negative covenants and events of default for an unsecured financing arrangement including, among other things, limitations on consolidations, mergers, and sales of assets. The 2024 364-Day Revolving Credit Agreement also requires us to maintain a consolidated indebtedness to consolidated EBITDA ratio of no greater than 4.5 to 1.0 as of the last day of any period of four consecutive fiscal quarters (with such ratio subject to increase to 5.0 to 1.0 in connection with a qualified material acquisition and certain other restrictions). We were in compliance with all covenants under the 2024 364-Day Revolving Credit Agreement as of December 31, 2024. As of December 31, 2024, there were no outstanding borrowings under the 2024 364-Day Revolving Credit Agreement.
On August 28, 2023, we entered into an uncommitted facility letter (the "Uncommitted Credit Facility"), which provides that from time to time, we may request, and the lender in its absolute and sole discretion may provide, short-term loans. Borrowings under the Uncommitted Credit Facility may be used only for general corporate and working capital purposes. The Uncommitted Credit Facility provides that the aggregate principal amount of outstanding borrowings at any time shall not exceed $300.0 million. Each borrowing under the Uncommitted Credit Facility will mature on the maturity date specified by the lender at the time of the advance, which will be no more than 90 days following the date of the advance. The Uncommitted Credit Facility and borrowings thereunder are unsecured. Borrowings under the Uncommitted Credit Facility bear interest at floating rates, based upon either Term SOFR for the applicable interest period, the prime rate, or lender’s cost of funds, in each case, plus an applicable margin determined at the time of each borrowing. The Uncommitted Credit Facility includes customary affirmative and negative covenants and events of default for unsecured uncommitted financing arrangements. We were in compliance with all covenants under the Uncommitted Credit Facility as of December 31, 2024. As of December 31, 2024, there were no outstanding borrowings under the Uncommitted Credit Facility.
Borrowings under our revolving credit facilities have been executed with underlying notes that have maturities of three months or less. At maturity of the underlying note, we elect to either repay the note, borrow the same amount, or some combination thereof. On our consolidated statements of cash flows, we present the borrowings and repayments of these underlying notes as net cash inflows or outflows due to their short-term nature.
The estimated fair value of our senior notes, which includes our Euro notes, as of December 31, 2024, based on quoted prices for the specific securities from transactions in over-the-counter markets (Level 2), was $6,145.2 million.
At December 31, 2024 and 2023, the weighted average interest rate for our borrowings was 3.7 percent and 3.2 percent, respectively. We paid $200.8 million, $200.6 million, and $161.7 million in interest during 2024, 2023, and 2022, respectively.
14.Accumulated Other Comprehensive Income
AOCI refers to certain gains and losses that under GAAP are included in comprehensive income but are excluded from net earnings as these amounts are initially recorded as an adjustment to stockholders’ equity. Amounts in AOCI may be reclassified to net earnings upon the occurrence of certain events.
Our AOCI is comprised of foreign currency translation adjustments, unrealized gains and losses on cash flow hedges, and amortization of prior service costs and unrecognized gains and losses in actuarial assumptions on our defined benefit plans. Foreign currency translation adjustments are reclassified to net earnings upon sale or upon a complete or substantially complete liquidation of an investment in a foreign entity. In the year ended December 31, 2022, due to the spinoff of ZimVie, certain foreign entities were completely liquidated. In a pro rata spinoff of consolidated subsidiaries’ assets and liabilities, the distribution of these net assets is recognized through equity instead of net earnings. Therefore, the foreign currency translation adjustments of those entities that were completely liquidated were reclassified to retained earnings. Similarly, we had entered into instruments designated as net investment hedges against certain of these same foreign entities. We reclassified the portion of the net investment hedge gains (losses) deferred in foreign currency translation adjustments related to those entities to retained earnings. Unrealized gains and losses on cash flow hedges are reclassified to net earnings when the hedged item affects net earnings. Amounts related to defined benefit plans that are in AOCI are reclassified over the service periods of employees in the plan. See Note 16 for more information on our defined benefit plans.
The following table shows the changes in the components of AOCI, net of tax (in millions):
| | | | | | | | | | | | | | | | |
| | Foreign | | | Cash | | | Defined | | | | |
| | Currency | | | Flow | | | Benefit | | | Total | |
| | Translation | | | Hedges | | | Plan Items | | | AOCI | |
Balance December 31, 2023 | | $ | (159.4 | ) | | $ | 63.3 | | | $ | (94.9 | ) | | $ | (191.0 | ) |
AOCI before reclassifications | | | (79.6 | ) | | | 94.8 | | | | (16.5 | ) | | | (1.3 | ) |
Reclassifications to statements of earnings | | | - | | | | (69.9 | ) | | | (0.6 | ) | | | (70.5 | ) |
Balance December 31, 2024 | | $ | (239.0 | ) | | $ | 88.2 | | | $ | (112.0 | ) | | $ | (262.8 | ) |
The following table shows the reclassification adjustments from AOCI (in millions):
| | | | | | | | | | | | | | |
| | Amount of Gain / (Loss) | | | |
| | Reclassified from AOCI | | | |
| | For the Years Ended December 31, | | | Location on |
Component of AOCI | | 2024 | | | 2023 | | | 2022 | | | Statements of Earnings |
Cash flow hedges | | | | | | | | | | | |
Foreign exchange forward contracts | | $ | 85.3 | | | $ | 94.1 | | | $ | 54.8 | | | Cost of products sold |
Forward starting interest rate swaps | | | (0.7 | ) | | | (0.7 | ) | | | (0.8 | ) | | Interest expense, net |
| | | 84.6 | | | | 93.4 | | | | 54.0 | | | Total before tax |
| | | 14.7 | | | | 16.0 | | | | 8.0 | | | Provision for income taxes |
| | $ | 69.9 | | | $ | 77.4 | | | $ | 46.0 | | | Net of tax |
Defined benefit plans | | | | | | | | | | | |
Settlements, Prior service cost and unrealized actuarial gain | | $ | 1.1 | | | $ | 6.1 | | | $ | 0.2 | | | Other expense, net |
| | | 0.5 | | | | 0.3 | | | | (1.2 | ) | | Provision for income taxes |
| | $ | 0.6 | | | $ | 5.8 | | | $ | 1.4 | | | Net of tax |
Total reclassifications | | $ | 70.5 | | | $ | 83.2 | | | $ | 47.4 | | | Net of tax |
The following table shows the tax effects on each component of AOCI recognized in our consolidated statements of comprehensive income (loss) (in millions):
| | | | | | | | | | | | | | | | | | | | | | | | | | | | | | | | | | | | |
| | For the Years Ended December 31, | |
| | Before Tax | | | Tax | | | Net of Tax | |
| | 2024 | | | 2023 | | | 2022 | | | 2024 | | | 2023 | | | 2022 | | | 2024 | | | 2023 | | | 2022 | |
Foreign currency cumulative
translation adjustments | | $ | (40.3 | ) | | $ | (2.9 | ) | | $ | (87.3 | ) | | $ | 39.3 | | | $ | (12.8 | ) | | $ | 36.0 | | | $ | (79.6 | ) | | $ | 9.9 | | | $ | (123.3 | ) |
Unrealized cash flow hedge gains | | | 116.0 | | | | 84.8 | | | | 100.5 | | | | 21.2 | | | | 13.7 | | | | 17.0 | | | | 94.8 | | | | 71.1 | | | | 83.5 | |
Reclassification adjustments on
cash flow hedges | | | (84.6 | ) | | | (93.4 | ) | | | (54.0 | ) | | | (14.7 | ) | | | (16.0 | ) | | | (8.0 | ) | | | (69.9 | ) | | | (77.4 | ) | | | (46.0 | ) |
Adjustments to prior service cost
and unrecognized actuarial
assumptions | | | (18.6 | ) | | | (17.0 | ) | | | 95.9 | | | | (1.5 | ) | | | (1.7 | ) | | | 18.9 | | | | (17.1 | ) | | | (15.3 | ) | | | 77.0 | |
Total Other Comprehensive
(Loss) Income | | $ | (27.5 | ) | | $ | (28.5 | ) | | $ | 55.1 | | | $ | 44.3 | | | $ | (16.8 | ) | | $ | 63.9 | | | $ | (71.8 | ) | | $ | (11.7 | ) | | $ | (8.8 | ) |
15.Derivative Instruments and Hedging Activities
We are exposed to certain market risks relating to our ongoing business operations, including foreign currency exchange rate risk, commodity price risk, interest rate risk and credit risk. We manage our exposure to these and other market risks through regular operating and financing activities. Currently, the only risks that we manage through the use of derivative instruments are interest rate risk and foreign currency exchange rate risk.
Interest Rate Risk
Derivatives Designated as Fair Value Hedges
We currently use fixed-to-variable interest rate swaps to partially manage our exposure to interest rate risk from our cash investments and debt portfolio. These derivative instruments are designated as fair value hedges under GAAP.
Changes in the fair value of the derivative instrument are recorded in current earnings and are offset by gains or losses on the underlying debt instrument.
In 2021, we entered into $1 billion of fixed-to-variable interest rate swaps that we have designated as fair value hedges of $1 billion of our fixed rate debt obligations.
As of December 31, 2024 and December 31, 2023, the following amounts were recorded on our consolidated balance sheets related to cumulative basis adjustments for fair value hedges (in millions):
| | | | | | | | | | | | | | | | | |
| | Carrying Amount of the Hedged Liabilities | | | | Cumulative Amount of Fair Value Hedging Adjustment Included in the Carrying Amount of the Hedged Liabilities | |
Balance Sheet Line Item | | December 31, 2024 | | | December 31, 2023 | | | | December 31, 2024 | | | December 31, 2023 | |
Long-term debt | | $ | 837.6 | | | $ | 851.3 | | | | $ | (158.6 | ) | | $ | (144.7 | ) |
Derivatives Designated as Cash Flow Hedges
In 2014, we entered into forward starting interest rate swaps that were designated as cash flow hedges of our thirty-year tranche of senior notes (the 4.450% Senior Notes due 2045) we expected to issue in 2015. The forward starting interest rate swaps mitigated the risk of changes in interest rates prior to the completion of the notes offering. The interest rate swaps were settled, and the remaining loss to be recognized at December 31, 2024 was $23.2 million, which will be recognized using the effective interest rate method over the remaining maturity period of the hedged notes.
Foreign Currency Exchange Rate Risk
We operate on a global basis and are exposed to the risk that our financial condition, results of operations and cash flows could be adversely affected by changes in foreign currency exchange rates. To reduce the potential effects of foreign currency exchange rate movements on net earnings, we enter into derivative financial instruments in the form of foreign currency exchange forward contracts with major financial institutions. We also designated our Euro notes and other foreign currency exchange forward contracts as net investment hedges of investments in foreign subsidiaries. We are primarily exposed to foreign currency exchange rate risk with respect to transactions and net assets denominated in Euros, Swiss Francs, Japanese Yen, British Pounds, Chinese Renminbi, Canadian Dollars, Australian Dollars, Korean Won, Swedish Krona, Czech Koruna, Thai Baht, Taiwan Dollars, South African Rand, Russian Rubles, Indian Rupees, Turkish Lira, Polish Zloty, Danish Krone, and Norwegian Krone. We do not use derivative financial instruments for trading or speculative purposes.
Derivatives Designated as Net Investment Hedges
We are exposed to the impact of foreign exchange rate fluctuations in the investments in our wholly-owned foreign subsidiaries that are denominated in currencies other than the U.S. Dollar. In order to mitigate the volatility in foreign exchange rates, we issued Euro notes in December 2016 and November 2019. In November 2024, we issued additional Euro notes, as discussed in Note 13. We have designated 100 percent of our Euro notes to hedge our net investment in certain wholly-owned foreign subsidiaries that have a functional currency of Euro. All changes in the fair value of the hedging instrument designated as a net investment hedge are recorded as a component of AOCI in our consolidated balance sheets.
At December 31, 2024, we had receive-fixed-rate, pay-fixed-rate cross-currency interest rate swaps with notional amounts outstanding of Euro 225 million, Japanese Yen 54.1 billion and Swiss Franc 125 million. These transactions further hedge our net investment in certain wholly-owned foreign subsidiaries that have a functional currency of Euro, Japanese Yen and Swiss Franc. All changes in the fair value of a derivative instrument designated as a net investment hedge are recorded as a component of AOCI in the consolidated balance sheets. The portion of this change related to the excluded component will be amortized into earnings over the life of the derivative while the remainder will be recorded in AOCI until the hedged net investment is sold or substantially liquidated. We recognize the excluded component in interest expense, net on our consolidated statements of earnings. The net cash received related to the receive-fixed-rate, pay-fixed-rate component of the cross-currency interest rate swaps is reflected in investing cash flows in our consolidated statements of cash flows. In the year ended December 31, 2024, Euro 475 million of these cross-currency interest rate swaps matured at a loss of $19.3 million. In the year ended December 31, 2023, Euro 100 million and Swiss Franc 50 million of these cross-currency interest rate swaps
matured at a gain of $6.0 million and a loss of $3.0 million, respectively. The settlement of these transactions with the counterparties is reflected in investing cash flows in our consolidated statements of cash flows and will remain in AOCI on our consolidated balance sheet until the hedged net investment is sold or substantially liquidated.
Derivatives Designated as Cash Flow Hedges
Our revenues are generated in various currencies throughout the world. However, a significant amount of our inventory is produced in U.S. Dollars. Therefore, movements in foreign currency exchange rates may have different proportional effects on our revenues compared to our cost of products sold. To minimize the effects of foreign currency exchange rate movements on cash flows, we hedge intercompany sales of inventory expected to occur within the next 30 months with foreign currency exchange forward contracts. We designate these derivative instruments as cash flow hedges.
We perform quarterly assessments of hedge effectiveness by verifying and documenting the critical terms of the hedge instrument and confirming that forecasted transactions have not changed significantly. We also assess on a quarterly basis whether there have been adverse developments regarding the risk of a counterparty default. For derivatives which qualify as hedges of future cash flows, the gains and losses are temporarily recorded in AOCI and then recognized in cost of products sold when the hedged item affects net earnings. On our consolidated statements of cash flows, the settlements of these cash flow hedges are recognized in operating cash flows.
For foreign currency exchange forward contracts outstanding at December 31, 2024, we had obligations to purchase U.S. Dollars and sell Euros, Japanese Yen, Canadian Dollars, Australian Dollars, Korean Won, Swedish Krona, Czech Koruna, Thai Baht, Taiwan Dollars, South African Rand, Indian Rupees, Polish Zloty, Danish Krone, and Norwegian Krone and obligations to purchase Swiss Francs and sell U.S. Dollars. These derivatives mature at dates ranging from January 2025 through May 2027. As of December 31, 2024, the notional amounts of outstanding forward contracts entered into with third parties to purchase U.S. Dollars were $1,454.9 million. As of December 31, 2024, the notional amounts of outstanding forward contracts entered into with third parties to purchase Swiss Francs were $394.0 million.
Derivatives Not Designated as Hedging Instruments
We enter into foreign currency forward exchange contracts with terms of one to three months to manage currency exposures for monetary assets and liabilities denominated in a currency other than an entity’s functional currency. Any foreign currency re-measurement gains/losses recognized in earnings are generally offset with gains/losses on the foreign currency forward exchange contracts in the same reporting period. The amount of these gains/losses is recorded in other expense, net. Outstanding contracts are recorded on the balance sheet at fair value as of the end of the reporting period. The notional amounts of these contracts are typically in a range of $1.25 billion to $1.75 billion per quarter.
As discussed in Note 3, we entered into the Forward Exchange Agreement as part of our pledge to transfer our ZimVie shares to a third-party financial institution, which occurred in February 2023.
Income Statement Presentation
Derivatives Designated as Cash Flow Hedges
Derivative instruments designated as cash flow hedges had the following effects, before taxes, on AOCI and net earnings on our consolidated statements of earnings, consolidated statements of comprehensive income (loss) and consolidated balance sheets (in millions):
| | | | | | | | | | | | | | | | | | | | | | | | | | |
| | Amount of Gain | | | | | Amount of Gain / (Loss) | |
| | Recognized in AOCI | | | Location on | | Reclassified from AOCI | |
| | Years Ended December 31, | | | Statement of | | Years Ended December 31, | |
Derivative Instrument | | 2024 | | | 2023 | | | 2022 | | | Earnings | | 2024 | | | 2023 | | | 2022 | |
Foreign exchange forward
contracts | | $ | 116.0 | | | $ | 84.8 | | | $ | 100.5 | | | Cost of products sold | | $ | 85.3 | | | $ | 94.1 | | | $ | 54.8 | |
Forward starting interest rate
swaps | | | - | | | | - | | | | - | | | Interest expense, net | | | (0.7 | ) | | | (0.7 | ) | | | (0.7 | ) |
| | $ | 116.0 | | | $ | 84.8 | | | $ | 100.5 | | | | | $ | 84.6 | | | $ | 93.4 | | | $ | 54.1 | |
The fair value of outstanding derivative instruments designated as cash flow hedges and recorded on the consolidated balance sheet at December 31, 2024, together with settled derivatives where the hedged item has not yet affected earnings, was a net unrealized gain of $103.0 million, or $88.2 million after taxes, which is deferred in AOCI. A gain of $83.1 million, or $69.3 million after taxes, is expected to be reclassified to earnings in cost of products sold and a loss of $0.7 million, or $0.6 million after taxes, is expected to be reclassified to earnings in interest expense, net over the next twelve months.
The following table presents the effects of fair value, cash flow and net investment hedge accounting on our consolidated statements of earnings (in millions):
| | | | | | | | | | | | | | | | | | | | | | | | | | |
| | | | Location and Amount of Gain/(Loss) Recognized in Income on Fair Value, Cash Flow and Net Investment Hedging Relationships | |
| | | | Years Ended December 31, | |
| | | | 2024 | | | 2023 | | | 2022 | |
| | | | Cost of | | | Interest | | | Cost of | | | Interest | | | Cost of | | | Interest | |
| | | | Products | | | Expense, | | | Products | | | Expense, | | | Products | | | Expense, | |
| | | | Sold | | | Net | | | Sold | | | Net | | | Sold | | | Net | |
Total amounts of income and expense line items presented in the statements of earnings in which the effects of fair value, cash flow and net investment hedges are recorded | $ | 2,191.2 | | | $ | (218.0 | ) | | $ | 2,083.8 | | | $ | (201.2 | ) | | $ | 2,019.5 | | | $ | (164.8 | ) |
| The effects of fair value, cash flow and net investment hedging: | | | | | | | | | | | | | | | | | |
| | Loss on fair value hedging relationships | | | | | | | | | | | | | | | | | |
| | | Interest rate swaps | | - | | | | (41.1 | ) | | | - | | | | (38.9 | ) | | | - | | | | (4.0 | ) |
| | Gain (loss) on cash flow hedging relationships | | | | | | | | | | | | | | | | | |
| | | Foreign exchange forward contracts | | 85.3 | | | | - | | | | 94.1 | | | | - | | | | 54.8 | | | | - | |
| | | Forward starting interest rate swaps | | - | | | | (0.7 | ) | | | - | | | | (0.7 | ) | | | - | | | | (0.7 | ) |
| | Gain on net investment hedging relationships | | | | | | | | | | | | | | | | | |
| | | Cross-currency interest rate swaps | | - | | | | 30.9 | | | | - | | | | 33.7 | | | | - | | | | 21.6 | |
Derivatives Not Designated as Hedging Instruments
The following gains/(losses) from these derivative instruments were recognized on our consolidated statements of earnings (in millions):
| | | | | | | | | | | | | | |
| | Location on | | Years Ended December 31, | |
Derivative Instrument | | Statements of Earnings | | 2024 | | | 2023 | | | 2022 | |
Foreign exchange forward contracts | | Other expense, net | | $ | 10.5 | | | $ | 4.4 | | | $ | (26.1 | ) |
Forward Exchange Agreement | | Other expense, net | | | - | | | | - | | | | 1.1 | |
These gains/(losses) do not reflect losses of $26.1 million, losses of $21.6 million and gains of $5.3 million in 2024, 2023 and 2022, respectively, recognized in other expense, net as a result of foreign currency re-measurement of monetary assets and liabilities denominated in a currency other than an entity’s functional currency.
Balance Sheet Presentation
As of December 31, 2024 and 2023, all derivative instruments designated as fair value hedges, cash flow hedges and net investment hedges are recorded at fair value on our consolidated balance sheets. On our consolidated balance sheets, we recognize individual forward contracts with the same counterparty on a net asset/liability basis if we have a master netting agreement with the counterparty. Under these master netting agreements, we are able to settle derivative instrument assets and liabilities with the same counterparty in a single transaction, instead of settling each derivative instrument separately. We have master netting agreements with all of our counterparties. The fair value of derivative instruments on a gross basis is as follows (in millions):
| | | | | | | | | | | | |
| | As of December 31, 2024 | | | As of December 31, 2023 | |
| | Balance Sheet | | Fair | | | Balance Sheet | | Fair | |
| | Location | | Value | | | Location | | Value | |
Asset Derivatives Designated as Hedges | | | | | | | | | | |
Foreign exchange forward contracts | | Other current assets | | $ | 82.3 | | | Other current assets | | $ | 58.4 | |
Cross-currency interest rate swaps | | Other current assets | | | 1.6 | | | Other current assets | | | - | |
Foreign exchange forward contracts | | Other assets | | | 24.5 | | | Other assets | | | 17.2 | |
Cross-currency interest rate swaps | | Other assets | | | 48.7 | | | Other assets | | | 5.4 | |
Total asset derivatives | | | | $ | 157.1 | | | | | $ | 81.0 | |
| | | | | | | | | | |
Asset Derivatives Not Designated as Hedges | | | | | | | | | | |
Foreign exchange forward contracts | | Other current assets | | $ | 7.1 | | | Other current assets | | $ | 1.2 | |
Total asset derivatives not designated as hedges | | | | $ | 7.1 | | | | | $ | 1.2 | |
| | | | | | | | | | |
Liability Derivatives Designated as Hedges | | | | | | | | | | |
Foreign exchange forward contracts | | Other current liabilities | | $ | 13.8 | | | Other current liabilities | | $ | 13.9 | |
Cross-currency interest rate swaps | | Other current liabilities | | | 12.0 | | | Other current liabilities | | | 33.3 | |
Foreign exchange forward contracts | | Other long-term liabilities | | | 5.3 | | | Other long-term liabilities | | | 11.0 | |
Cross-currency interest rate swaps | | Other long-term liabilities | | | 2.2 | | | Other long-term liabilities | | | 34.8 | |
Interest rate swaps | | Other long-term liabilities | | | 158.6 | | | Other long-term liabilities | | | 144.7 | |
Total liability derivatives | | | | $ | 191.9 | | | | | $ | 237.7 | |
| | | | | | | | | | |
Liability Derivatives Not Designated as Hedges | | | | | | | | | | |
Foreign exchange forward contracts | | Other current liabilities | | $ | 6.1 | | | Other current liabilities | | $ | 2.4 | |
The table below presents the effects of our master netting agreements on our consolidated balance sheets (in millions):
| | | | | | | | | | | | | | | | | | | | | | | | | | |
| | | | As of December 31, 2024 | | | As of December 31, 2023 | |
Description | | Location | | Gross
Amount | | | Offset | | | Net
Amount in
Balance
Sheet | | | Gross
Amount | | | Offset | | | Net
Amount in
Balance
Sheet | |
Asset Derivatives | | | | | | | | | | | | | | | | | | | | |
Cash flow hedges | | Other current assets | | $ | 82.3 | | | $ | 12.6 | | | $ | 69.7 | | | $ | 58.4 | | | $ | 13.0 | | | $ | 45.4 | |
Cash flow hedges | | Other assets | | | 24.5 | | | | 4.7 | | | | 19.8 | | | | 17.2 | | | | 8.2 | | | | 9.0 | |
Derivatives not designated as hedges | | Other current assets | | | 7.1 | | | | 5.3 | | | | 1.8 | | | | 1.2 | | | | 0.8 | | | | 0.4 | |
| | | | | | | | | | | | | | | | | | | | |
Liability Derivatives | | | | | | | | | | | |
| | | | | | | | |
Cash flow hedges | | Other current liabilities | | | 13.8 | | | | 12.6 | | | | 1.2 | | | | 13.9 | | | | 13.0 | | | | 0.9 | |
Cash flow hedges | | Other long-term liabilities | | | 5.3 | | | | 4.7 | | | | 0.6 | | | | 11.0 | | | | 8.2 | | | | 2.8 | |
Derivatives not designated as hedges | | Other current liabilities | | | 6.1 | | | | 5.3 | | | | 0.8 | | | | 2.4 | | | | 0.8 | | | | 1.6 | |
The following net investment hedge gains (losses) were recognized on our consolidated statements of comprehensive income (loss) (in millions):
| | | | | | | | | | | | |
| | Amount of Gain / (Loss) | |
| | Recognized in AOCI | |
| | Years Ended December 31, | |
Derivative Instrument | | 2024 | | | 2023 | | | 2022 | |
Euro Notes | | $ | 80.8 | | | $ | (37.4 | ) | | $ | 113.1 | |
Cross-currency interest rate swaps | | | 79.5 | | | | (16.9 | ) | | | 6.4 | |
| | $ | 160.3 | | | $ | (54.3 | ) | | $ | 119.5 | |
16.Retirement Benefit Plans
We have defined benefit pension plans covering certain U.S. and Puerto Rico employees. Plan benefits are primarily based on years of credited service and the participant’s average eligible compensation. The U.S. and Puerto Rico plans are frozen except for one insignificant plan; meaning there are no new participants that can join the plan and participants in the plan do not accrue additional years of service or compensation. In addition to the U.S. and Puerto Rico defined benefit pension plans, we sponsor various foreign pension arrangements, including retirement and termination benefit plans required by local law or coordinated with government sponsored plans.
We use a December 31 measurement date for our benefit plans.
Defined Benefit Plans
The components of net pension expense for our defined benefit retirement plans were as follows (in millions):
| | | | | | | | | | | | | | | | | | | | | | | | |
| | For the Years Ended December 31, | |
| | U.S. and Puerto Rico | | | Foreign | |
| | 2024 | | | 2023 | | | 2022 | | | 2024 | | | 2023 | | | 2022 | |
Service cost | | $ | 0.3 | | | $ | 0.4 | | | $ | 0.7 | | | $ | 18.1 | | | $ | 15.5 | | | $ | 22.7 | |
Interest cost | | | 18.3 | | | | 18.7 | | | | 11.7 | | | | 14.2 | | | | 15.7 | | | | 5.4 | |
Expected return on plan assets | | | (30.7 | ) | | | (30.1 | ) | | | (30.8 | ) | | | (24.4 | ) | | | (22.5 | ) | | | (14.3 | ) |
Settlements | | | - | | | | 0.1 | | | | - | | | | (2.2 | ) | | | (2.6 | ) | | | (5.0 | ) |
Amortization of prior service cost | | | 0.1 | | | | 0.2 | | | | 0.3 | | | | (3.1 | ) | | | (4.4 | ) | | | (4.1 | ) |
Amortization of unrecognized actuarial loss | | | 3.5 | | | | 2.8 | | | | 7.8 | | | | 0.6 | | | | (2.2 | ) | | | 0.8 | |
Net periodic (income) benefit expense | | $ | (8.5 | ) | | $ | (7.9 | ) | | $ | (10.3 | ) | | $ | 3.2 | | | $ | (0.5 | ) | | $ | 5.5 | |
In our consolidated statements of earnings, service cost is reported in the same location as other compensation costs arising from services rendered by the pertinent employees while the other components of net pension expense are reported in other expense, net.
The weighted average actuarial assumptions used to determine net pension expense for our defined benefit retirement plans were as follows:
| | | | | | | | | | | | | | | | | | | | | | | | |
| | For the Years Ended December 31, | |
| | U.S. and Puerto Rico | | | Foreign | |
| | 2024 | | | 2023 | | | 2022 | | | 2024 | | | 2023 | | | 2022 | |
Discount rate | | | 4.97 | % | | | 5.25 | % | | | 2.86 | % | | | 2.18 | % | | | 2.60 | % | | | 0.67 | % |
Rate of compensation increase | | - | | | - | | | - | | | | 2.49 | % | | | 2.33 | % | | | 2.27 | % |
Expected long-term rate of return on
plan assets | | | 6.75 | % | | | 6.75 | % | | | 6.75 | % | | | 3.30 | % | | | 3.17 | % | | | 1.83 | % |
The expected long-term rate of return on plan assets is based on the historical and estimated future rates of return on the different asset classes held in the plans. The expected long-term rate of return is the weighted average of the target asset allocation of each individual asset class. We believe that historical asset results approximate expected market returns applicable to the funding of a long-term benefit obligation.
Discount rates were determined for each of our defined benefit retirement plans at their measurement date to reflect the yield of a portfolio of high quality bonds matched against the timing and amounts of projected future benefit payments.
Changes in projected benefit obligations and plan assets were (in millions):
| | | | | | | | | | | | | | | | |
| | For the Years Ended December 31, | |
| | U.S. and Puerto Rico | | | Foreign | |
| | 2024 | | | 2023 | | | 2024 | | | 2023 | |
Projected benefit obligation - beginning of year | | $ | 380.6 | | | $ | 366.8 | | | $ | 654.4 | | | $ | 567.9 | |
Service cost | | | 0.3 | | | | 0.4 | | | | 18.1 | | | | 15.5 | |
Interest cost | | | 18.3 | | | | 18.7 | | | | 14.2 | | | | 15.7 | |
Plan Amendments | | | - | | | | - | | | | 7.6 | | | | - | |
Employee contributions | | | - | | | | - | | | | 21.7 | | | | 24.1 | |
Benefits paid | | | (22.0 | ) | | | (20.1 | ) | | | (67.3 | ) | | | (48.1 | ) |
Actuarial loss (gain) | | | (21.0 | ) | | | 15.1 | | | | 53.2 | | | | 31.1 | |
Settlements | | | - | | | | (0.3 | ) | | | (2.3 | ) | | | - | |
Translation loss (gain) | | | - | | | | - | | | | (43.2 | ) | | | 48.2 | |
Projected benefit obligation - end of year | | $ | 356.2 | | | $ | 380.6 | | | $ | 656.4 | | | $ | 654.4 | |
| | | | | | | | | | | | | | | | |
| | For the Years Ended December 31, | |
| | U.S. and Puerto Rico | | | Foreign | |
| | 2024 | | | 2023 | | | 2024 | | | 2023 | |
Plan assets at fair market value - beginning of year | | $ | 433.8 | | | $ | 396.2 | | | $ | 751.7 | | | $ | 667.2 | |
Actual return on plan assets | | | 32.0 | | | | 57.6 | | | | 46.0 | | | | 31.9 | |
Employer contributions | | | 0.1 | | | | 0.4 | | | | 17.5 | | | | 19.9 | |
Employee contributions | | | - | | | | - | | | | 21.7 | | | | 24.1 | |
Settlements | | | - | | | | (0.3 | ) | | | (2.3 | ) | | | - | |
Benefits paid | | | (22.0 | ) | | | (20.1 | ) | | | (67.3 | ) | | | (48.1 | ) |
Translation gain (loss) | | | - | | | | - | | | | (48.9 | ) | | | 56.7 | |
Plan assets at fair market value - end of year | | $ | 444.0 | | | $ | 433.8 | | | $ | 718.4 | | | $ | 751.7 | |
Funded status | | $ | 87.8 | | | $ | 53.2 | | | $ | 62.0 | | | $ | 97.3 | |
| | | | | | | | | | | | | | | | |
| | For the Years Ended December 31, | |
| | U.S. and Puerto Rico | | | Foreign | |
| | 2024 | | | 2023 | | | 2024 | | | 2023 | |
Amounts recognized in consolidated balance sheet: | | | | | | | | | | | | |
Prepaid pension | | $ | 89.0 | | | $ | 54.5 | | | $ | 82.5 | | | $ | 117.8 | |
Short-term accrued benefit liability | | | (0.1 | ) | | | (0.1 | ) | | | (1.3 | ) | | | (1.4 | ) |
Long-term accrued benefit liability | | | (1.1 | ) | | | (1.2 | ) | | | (19.2 | ) | | | (19.1 | ) |
Net amount recognized | | $ | 87.8 | | | $ | 53.2 | | | $ | 62.0 | | | $ | 97.3 | |
The weighted average actuarial assumptions used to determine the projected benefit obligation for our defined benefit retirement plans were as follows:
| | | | | | | | | | | | | | | | | | | | | | | | |
| | For the Years Ended December 31, | |
| | U.S. and Puerto Rico | | | Foreign | |
| | 2024 | | | 2023 | | | 2022 | | | 2024 | | | 2023 | | | 2022 | |
Discount rate | | | 5.05 | % | | | 5.38 | % | | | 5.37 | % | | | 1.76 | % | | | 2.21 | % | | | 2.65 | % |
Rate of compensation increase | | | - | | | | - | | | | - | | | | 2.50 | % | | | 2.34 | % | | | 2.25 | % |
Plans with projected benefit obligations in excess of plan assets were as follows (in millions):
| | | | | | | | | | | | | | | | |
| | As of December 31, | |
| | U.S. and Puerto Rico | | | Foreign | |
| | 2024 | | | 2023 | | | 2024 | | | 2023 | |
Projected benefit obligation | | $ | 1.2 | | | $ | 1.3 | | | $ | 26.9 | | | $ | 27.2 | |
Plan assets at fair market value | | | - | | | | - | | | | 8.0 | | | | 8.6 | |
Total accumulated benefit obligations and plans with accumulated benefit obligations in excess of plan assets were as follows (in millions):
| | | | | | | | | | | | | | | | |
| | As of December 31, | |
| | U.S. and Puerto Rico | | | Foreign | |
| | 2024 | | | 2023 | | | 2024 | | | 2023 | |
Total accumulated benefit obligations | | $ | 356.2 | | | $ | 380.6 | | | $ | 641.0 | | | $ | 640.3 | |
Plans with accumulated benefit obligations in excess
of plan assets: | | | | | | | | | | | | |
Accumulated benefit obligation | | | 1.2 | | | | 1.3 | | | | 24.8 | | | | 24.9 | |
Plan assets at fair market value | | | - | | | | - | | | | 8.0 | | | | 8.6 | |
The benefits expected to be paid out in each of the next five years and for the five years combined thereafter are as follows (in millions):
| | | | | | | | |
For the Years Ending December 31, | | U.S. and
Puerto Rico | | | Foreign | |
2025 | | $ | 25.4 | | | $ | 40.2 | |
2026 | | | 25.7 | | | | 36.3 | |
2027 | | | 26.1 | | | | 35.9 | |
2028 | | | 26.5 | | | | 35.6 | |
2029 | | | 28.2 | | | | 34.8 | |
2030-2034 | | | 130.8 | | | | 172.7 | |
The U.S. and Puerto Rico defined benefit retirement plans’ overall investment strategy is to balance total returns by emphasizing long-term growth of capital while mitigating risk. We have established target ranges of assets held by the plans of 30 to 65 percent for equity securities, 30 to 50 percent for debt securities and 0 to 15 percent in non-traditional investments. The plans strive to have sufficiently diversified assets so that adverse or unexpected results from one asset class will not have an unduly detrimental impact on the entire portfolio. We regularly review the investments in the plans and we may rebalance them from time-to-time based upon the target asset allocation of the plans.
For the U.S. and Puerto Rico plans, we maintain an investment policy statement that guides the investment allocation in the plans. The investment policy statement describes the target asset allocation positions described above. Our benefits committee, along with our investment advisor, monitor compliance with and administer the investment policy statement and the plans’ assets and oversee the general investment strategy and objectives of the plans. Our benefits committee generally meets quarterly to review performance.
The investment strategies of foreign based plans vary according to the plan provisions and local laws. The majority of the assets in foreign based plans are located in Switzerland-based plans. These assets are held in trusts and are commingled with the assets of other Swiss companies with representatives of all the companies making the investment decisions. The overall strategy is to maximize total returns while avoiding risk. The trustees of the assets have established target ranges of assets held by the plans of 30 to 50 percent in debt securities, 20 to 37 percent in equity securities, 15 to 24 percent in real estate, 3 to 15 percent in cash funds and 0 to 12 percent in other funds.
The fair value of our U.S. and Puerto Rico pension plan assets by asset category was as follows (in millions):
| | | | | | | | | | | | | | | | |
| | As of December 31, 2024 | |
| | | | | Fair Value Measurements at
Reporting Date Using: | |
Asset Category | | Total | | | Quoted Prices
in Active
Markets for
Identical
Assets
(Level 1) | | | Significant
Other
Observable
Inputs
(Level 2) | | | Significant
Unobservable
Inputs
(Level 3) | |
Cash and cash equivalents | | $ | 7.8 | | | $ | 7.8 | | | $ | - | | | $ | - | |
Equity securities | | | 225.8 | | | | - | | | | 225.8 | | | | - | |
Intermediate fixed income securities | | | 210.4 | | | | - | | | | 210.4 | | | | - | |
Total | | $ | 444.0 | | | $ | 7.8 | | | $ | 436.2 | | | $ | - | |
| | | | | | | | | | | | | | | | |
| | As of December 31, 2023 | |
| | | | | Fair Value Measurements at
Reporting Date Using: | |
Asset Category | | Total | | | Quoted Prices
in Active
Markets for
Identical
Assets
(Level 1) | | | Significant
Other
Observable
Inputs
(Level 2) | | | Significant
Unobservable
Inputs
(Level 3) | |
Cash and cash equivalents | | $ | 2.5 | | | $ | 2.5 | | | $ | - | | | $ | - | |
Equity securities | | | 296.2 | | | | - | | | | 296.2 | | | | - | |
Intermediate fixed income securities | | | 135.1 | | | | - | | | | 135.1 | | | | - | |
Total | | $ | 433.8 | | | $ | 2.5 | | | $ | 431.3 | | | $ | - | |
The fair value of our foreign pension plan assets was as follows (in millions):
| | | | | | | | | | | | | | | | |
| | As of December 31, 2024 | |
| | | | | Fair Value Measurements at
Reporting Date Using: | |
Asset Category | | Total | | | Quoted Prices
in Active
Markets for
Identical
Assets
(Level 1) | | | Significant
Other
Observable
Inputs
(Level 2) | | | Significant
Unobservable
Inputs
(Level 3) | |
| | | | | | | | | | | | |
Cash and cash equivalents | | $ | 29.3 | | | $ | 29.3 | | | $ | - | | | $ | - | |
Equity securities | | | 165.7 | | | | 150.6 | | | | 15.1 | | | | - | |
Fixed income securities | | | 177.6 | | | | - | | | | 177.6 | | | | - | |
Other types of investments | | | 162.8 | | | | - | | | | 162.8 | | | | - | |
Real estate | | | 183.0 | | | | - | | | | - | | | | 183.0 | |
Total | | $ | 718.4 | | | $ | 179.9 | | | $ | 355.5 | | | $ | 183.0 | |
| | | | | | | | | | | | | | | | |
| | As of December 31, 2023 | |
| | | | | Fair Value Measurements at
Reporting Date Using: | |
Asset Category | | Total | | | Quoted Prices
in Active
Markets for
Identical
Assets
(Level 1) | | | Significant
Other
Observable
Inputs
(Level 2) | | | Significant
Unobservable
Inputs
(Level 3) | |
| | | | | | | | | | | | |
Cash and cash equivalents | | $ | 28.5 | | | $ | 28.5 | | | $ | - | | | $ | - | |
Equity securities | | | 160.9 | | | | 148.2 | | | | 12.7 | | | | - | |
Fixed income securities | | | 181.3 | | | | - | | | | 181.3 | | | | - | |
Other types of investments | | | 185.3 | | | | - | | | | 185.3 | | | | - | |
Real estate | | | 195.7 | | | | - | | | | - | | | | 195.7 | |
Total | | $ | 751.7 | | | $ | 176.7 | | | $ | 379.3 | | | $ | 195.7 | |
As of December 31, 2024 and 2023, our defined benefit pension plans’ assets did not hold any direct investment in Zimmer Biomet Holdings common stock.
Equity securities are valued using a market approach, based on quoted prices for the specific security from transactions in active exchange markets (Level 1), or in some cases where we are invested in mutual or collective funds, based upon the net asset value per unit of the fund which is determined from quoted market prices of the underlying securities in the fund’s portfolio (Level 2). Fixed income securities are valued using a market approach, based upon quoted prices for the specific security or from institutional bid evaluations. Real estate is valued by discounting to present value the cash flows expected to be generated by the specific properties.
The following table provides a reconciliation of the beginning and ending balances of our foreign pension plan assets measured at fair value that used significant unobservable inputs (Level 3) (in millions):
| | | | |
| | December 31, 2024 | |
Beginning Balance | | $ | 195.7 | |
Change in fair value of assets | | | 8.6 | |
Net purchases and sales | | | (7.4 | ) |
Translation gain | | | (13.9 | ) |
Ending Balance | | $ | 183.0 | |
We expect that we will have minimal legally required funding requirements in 2024 for the qualified U.S. and Puerto Rico defined benefit retirement plans, and we do not expect to voluntarily contribute to these plans during 2025. Contributions to foreign defined benefit plans are estimated to be $15.1 million in 2025. We do not expect the assets in any of our plans to be returned to us in the next year.
Defined Contribution Plans
We also sponsor defined contribution plans for substantially all of the U.S. and Puerto Rico employees and certain employees in other countries.
The benefits offered under these plans are reflective of local customs and practices in the countries concerned. We expensed $56.2 million, $60.4 million and $48.5 million related to these plans for the years ended December 31, 2024, 2023 and 2022, respectively.
The components of earnings from continuing operations before income taxes consisted of the following (in millions):
| | | | | | | | | | | | |
| | For the Years Ended December 31, | |
| | 2024 | | | 2023 | | | 2022 | |
United States operations | | $ | 251.8 | | | $ | 57.0 | | | $ | (242.4 | ) |
Foreign operations | | | 784.8 | | | | 1,010.3 | | | | 645.9 | |
Total | | $ | 1,036.6 | | | $ | 1,067.3 | | | $ | 403.5 | |
The provision for income taxes and the income taxes paid consisted of the following (in millions):
| | | | | | | | | | | | |
| | For the Years Ended December 31, | |
| | 2024 | | | 2023 | | | 2022 | |
Current: | | | | | | | | | |
Federal | | $ | 4.4 | | | $ | 0.5 | | | $ | 175.3 | |
State | | | 20.9 | | | | 19.5 | | | | 16.1 | |
Foreign | | | 153.8 | | | | 118.5 | | | | (14.7 | ) |
| | | 179.1 | | | | 138.5 | | | | 176.7 | |
Deferred: | | | | | | | | | |
Federal | | | (59.7 | ) | | | (125.2 | ) | | | (74.8 | ) |
State | | | (12.3 | ) | | | (16.7 | ) | | | 1.6 | |
Foreign | | | 24.3 | | | | 45.6 | | | | 8.8 | |
| | | (47.7 | ) | | | (96.3 | ) | | | (64.4 | ) |
Provision for income taxes | | $ | 131.4 | | | $ | 42.2 | | | $ | 112.3 | |
Net income taxes paid | | $ | 328.5 | | | $ | 215.2 | | | $ | 326.6 | |
A reconciliation of the U.S. statutory income tax rate to our effective tax rate is as follows:
| | | | | | | | | | | | | | | |
| | For the Years Ended December 31, | | |
| | 2024 | | | | 2023 | | | | 2022 | | |
U.S. statutory income tax rate | | | 21.0 | | % | | | 21.0 | | % | | | 21.0 | | % |
State taxes, net of federal deduction | | | 0.7 | | | | | 0.2 | | | | | 3.2 | | |
Tax impact of foreign operations, including U.S. taxes on international income and foreign tax credits | | | (6.6 | ) | | | | (0.3 | ) | | | | (1.8 | ) | |
Change in valuation allowance | | | (0.3 | ) | | | | (0.2 | ) | | | | 1.1 | | |
Non-deductible expenses | | | 0.3 | | | | | 0.7 | | | | | 5.8 | | |
Goodwill impairment | | | - | | | | | - | | | | | 15.3 | | |
Tax rate change | | | - | | | | | - | | | | | 0.3 | | |
Tax impact of certain significant transactions | | | 0.1 | | | | | - | | | | | 0.9 | | |
Tax benefit relating to foreign derived intangible income and U.S. manufacturer’s
deduction | | | (0.2 | ) | | | | (0.8 | ) | | | | (2.9 | ) | |
R&D tax credit | | | (1.1 | ) | | | | (0.6 | ) | | | | (2.0 | ) | |
Share-based compensation | | | 1.0 | | | | | 0.1 | | | | | 1.8 | | |
Net uncertain tax positions, including interest and penalties | | | (3.2 | ) | | | | (16.0 | ) | | | | (14.6 | ) | |
Other | | | 1.0 | | | | | (0.1 | ) | | | | (0.2 | ) | |
Effective income tax rate | | | 12.7 | | % | | | 4.0 | | % | | | 27.9 | | % |
Our operations in Puerto Rico benefit from a tax incentive grant which expires in fiscal year 2026.
Deferred income taxes reflect the net tax effects of temporary differences between the carrying amounts of assets and liabilities for financial reporting purposes and the amounts used for income tax purposes. Valuation allowances are recorded to reduce deferred income tax assets when it is more likely than not that an income tax benefit will not be realized.
The components of deferred taxes consisted of the following (in millions):
| | | | | | | | |
| | As of December 31, | |
| | 2024 | | | 2023 | |
Deferred tax assets: | | | | | | |
Inventory | | $ | 202.6 | | | $ | 204.0 | |
Net operating loss carryover | | | 452.4 | | | | 484.3 | |
Tax credit carryover | | | 100.5 | | | | 81.8 | |
Capital loss carryover | | | 7.4 | | | | 8.1 | |
Product liability and litigation | | | 25.9 | | | | 27.9 | |
Accrued liabilities | | | 54.8 | | | | 92.4 | |
Share-based compensation | | | 42.2 | | | | 44.4 | |
Accounts receivable | | | 31.2 | | | | 23.0 | |
Research and development | | | 129.9 | | | | 103.9 | |
Lease liability | | | 58.1 | | | | 52.6 | |
Other | | | 9.4 | | | | 25.2 | |
Total deferred tax assets | | | 1,114.4 | | | | 1,147.6 | |
Less: Valuation allowances | | | (449.4 | ) | | | (464.6 | ) |
Total deferred tax assets after valuation allowances | | $ | 665.0 | | | $ | 683.0 | |
Deferred tax liabilities: | | | | | | |
Fixed assets | | $ | 118.2 | | | $ | 122.2 | |
Intangible assets | | | 437.0 | | | | 466.5 | |
Foreign currency items | | | 40.8 | | | | - | |
Lease asset | | | 51.4 | | | | 48.8 | |
Other | | | 50.0 | | | | 41.2 | |
Total deferred tax liabilities | | | 697.4 | | | | 678.7 | |
Total net deferred income taxes | | $ | (32.4 | ) | | $ | 4.3 | |
At December 31, 2024, net operating loss, tax credit carryovers, and capital loss carryovers are available to reduce future federal, state and foreign taxable earnings (in millions):
| | | | | | | | | | | | |
Expiration Period: | | Net operating loss carryover | | | Tax credit carryover | | | Capital loss carryover | |
1-5 years | | $ | 50.3 | | | $ | 22.7 | | | $ | - | |
6-10 years | | | 30.6 | | | | 72.7 | | | | - | |
11+ years | | | 245.5 | | | | 4.0 | | | | - | |
Indefinite | | | 126.0 | | | | 1.2 | | | | 7.4 | |
| | | 452.4 | | | | 100.5 | | | | 7.4 | |
Valuation allowances | | $ | 392.7 | | | $ | 41.7 | | | $ | 7.4 | |
The remaining valuation allowances booked against deferred tax assets of $7.7 million relate primarily to accrued liabilities and intangible assets that management believes, more likely than not, will not be realized.
We generally intend to limit distributions such that they would not result in significant U.S. tax costs. These distributions could come from foreign subsidiaries earnings that were previously taxed in the U.S. as a result of the transition tax or tax on Global Intangible Low-Taxed Income (“GILTI”). These previously taxed earnings would not be subject to further U.S. federal tax. We have not provided deferred taxes on any other outside basis differences in our investments in other foreign subsidiaries as these other outside basis differences are indefinitely reinvested in the
operations of our foreign entities. If we decide later to repatriate these earnings to the U.S., we would be required to provide for the net tax effects on these amounts. We estimate that the total tax effect of a potential repatriation would not be significant under enacted tax laws and regulations and at current foreign currency exchange rates.
The following is a tabular reconciliation of the total amounts of unrecognized tax benefits (in millions):
| | | | | | | | | | | | |
| | For the Years Ended December 31, | |
| | 2024 | | | 2023 | | | 2022 | |
Balance at January 1 | | $ | 391.9 | | | $ | 521.0 | | | $ | 558.6 | |
Increases related to prior periods | | | 80.9 | | | | 68.7 | | | | 25.0 | |
Decreases related to prior periods | | | (136.8 | ) | | | (206.2 | ) | | | (78.2 | ) |
Increases related to current period | | | 4.3 | | | | 8.7 | | | | 19.0 | |
Decreases related to settlements with taxing
authorities | | | (98.4 | ) | | | - | | | | (2.0 | ) |
Decreases related to lapse of statute of limitations | | | (0.5 | ) | | | (0.3 | ) | | | (1.4 | ) |
Balance at December 31 | | $ | 241.4 | | | $ | 391.9 | | | $ | 521.0 | |
Amounts impacting effective tax rate, if recognized balance at December 31 | | $ | 204.1 | | | $ | 251.6 | | | $ | 360.1 | |
We recognize accrued interest and penalties related to unrecognized tax benefits as income tax expense. During 2024, we released interest and penalties of $86.9 million, and as of December 31, 2024, had a recognized liability for interest and penalties of $2.3 million, which does not include any increase related to business combinations.
During 2023, we released interest and penalties of $45.3 million, and as of December 31, 2023, had a recognized liability for interest and penalties of $89.1 million, which does not include any increase related to business combinations. During 2022, we accrued interest and penalties of $18.1 million, and as of December 31, 2022, had a recognized liability for interest and penalties of $134.5 million, which does not include any increase related to business combinations.
We operate on a global basis and are subject to numerous and complex tax laws and regulations. Additionally, tax laws have and continue to undergo rapid changes in both application and interpretation by various countries, including initiatives led by the Organisation for Economic Cooperation and Development. Our income tax filings are subject to examinations by taxing authorities throughout the world. Income tax audits may require an extended period of time to reach resolution and may result in significant income tax adjustments when interpretation of tax laws or allocation of company profits is disputed. Although ultimate timing is uncertain, the net amount of tax liability for unrecognized tax benefits may change within the next twelve months due to changes in audit status, expiration of statutes of limitations, settlements of tax assessments, and other events. Management’s best estimate of such change is within the range of a $50 million decrease to a $20 million increase.
We are under continuous audit by the Internal Revenue Service (“IRS”) and other foreign taxing authorities in the jurisdictions where we operate. In addition, some jurisdictions in which we operate require payment of disputed taxes to petition a court or taxing authority, or we may elect to make such payments prior to final resolution. We record any prepayments as income tax receivables when we believe our position is more likely than not to be upheld. We assess our position on these disputes at each reporting period. During the course of these audits, we receive proposed adjustments from taxing authorities that may be material. Therefore, there is a possibility that an adverse outcome in these audits could have a material effect on our results of operations and financial condition. Our U.S. federal income tax returns have been audited through 2019.
In September 2024, we reached agreement with the IRS for tax years 2010-2012 primarily related to the reallocation of profits between certain U.S. and foreign subsidiaries. All issues related to these years are considered effectively settled.
The IRS has proposed adjustments for tax years 2013-2015, primarily related to transfer pricing involving our cost sharing agreement between the U.S. and Switzerland affiliated companies and the reallocation of profits between certain U.S. and foreign subsidiaries. We intend to continue to vigorously contest the adjustments, and we will pursue all available administrative and, if necessary, judicial remedies. If we pursue judicial remedies in the U.S. Tax Court for years 2013-2015, a number of years will likely elapse before such matters are finally resolved. No
payment of any amount related to this matter is required to be made, if at all, until all applicable proceedings have been completed.
The IRS has proposed adjustments for tax years 2016-2019, primarily related to the U.S. taxation of foreign earnings and profits, which could result in additional material tax expense if we are unsuccessful in defending our position. This includes a proposed increase to our U.S. federal taxable income, which would result in tax expense of approximately $312 million, subject to interest. We strongly believe that the position of the IRS, with regard to this matter, is inconsistent with the applicable U.S. Treasury Regulations. We intend to continue to vigorously contest the adjustment, and we will pursue all available administrative and, if necessary, judicial remedies. If we pursue judicial remedies in the U.S. Tax Court for years 2016-2019, a number of years will likely elapse before such matters are finally resolved. No payment of any amount related to this matter is required to be made, if at all, until all applicable proceedings have been completed.
State income tax returns are generally subject to examination for a period of 3 to 5 years after filing of the respective return. The state impact of any federal changes generally remains subject to examination by various states for a period of up to one year after formal notification to the states. We have various state income tax return positions in the process of audit or appeals.
In other major foreign jurisdictions, open years are generally 2016 or later.
18.Capital Stock and Earnings per Share
We are authorized to issue 250.0 million shares of preferred stock, none of which were issued or outstanding as of December 31, 2024.
The numerator for both basic and diluted earnings per share is net earnings available to common stockholders. The denominator for basic earnings per share is the weighted average number of common shares outstanding during the period. The denominator for diluted earnings per share is weighted average shares outstanding adjusted for the effect of dilutive stock options and other equity awards. The following is a reconciliation of weighted average shares for the basic and diluted share computations (in millions):
| | | | | | | | | | | | |
| | For the Years Ended December 31, | |
| | 2024 | | | 2023 | | | 2022 | |
Weighted average shares outstanding for basic net
earnings per share | | | 203.1 | | | | 208.7 | | | | 209.6 | |
Effect of dilutive stock options and other
equity awards | | | 0.8 | | | | 1.0 | | | | 0.7 | |
Weighted average shares outstanding for diluted net
earnings per share | | | 203.9 | | | | 209.7 | | | | 210.3 | |
For the years ended December 31, 2024, 2023 and 2022, an average of 3.5 million options, 2.7 million options and 4.4 million options, respectively, to purchase shares of common stock were not included in the computation of diluted earnings per share as the exercise prices of these options were greater than the average market price of the common stock.
We design, manufacture and market orthopedic reconstructive products; sports medicine, biologics, extremities and trauma products; CMFT products; surgical products; and a suite of integrated digital and robotic technologies that leverage data, data analytics and artificial intelligence. Our chief operating decision maker (“CODM”) is our President and Chief Executive Officer. Our CODM allocates resources to achieve our operating profit goals through three operating segments. These operating segments, which also constitute our reportable segments, are Americas; EMEA; and Asia Pacific.
Our CODM evaluates performance based upon segment operating profit exclusive of operating expenses and income pertaining to certain inventory and manufacturing-related charges, intangible asset amortization, goodwill and intangible asset impairment, restructuring and other cost reduction initiatives, quality remediation, acquisition,
integration, divestiture and related, certain litigation, certain EU MDR expenses, other charges and corporate functions (collectively referred to as “Corporate items”). Corporate functions include corporate legal, finance, information technology, human resources and other corporate departments as well as stock-based compensation and certain operations, distribution, quality assurance, regulatory expenses, research and development and marketing expenses. Intercompany transactions have been eliminated from segment operating profit. In addition to evaluating performance on a monthly basis, the CODM uses sales and operating profit information to manage the business, including identifying areas of focus and growth, reviewing operating trends and allocating resources. Our CODM reviews accounts receivables and inventory assets (“Segment Assets”) as part of operating segment performance.
Our Americas operating segment is comprised principally of the U.S. and includes other North, Central and South American markets. Our EMEA operating segment is comprised principally of Europe and includes the Middle East and African markets. Our Asia Pacific operating segment is comprised principally of Japan, China and Australia and includes other Asian and Pacific markets. The Americas, EMEA and Asia Pacific operating segments include the commercial operations as well as regional headquarter expenses to operate in those markets. Our operating segments do not include many centralized, product category expenses such as R&D and global marketing that benefit all regions.
As discussed in Note 2, we implemented ASU 2023-07, Improvements to Reportable Segment Disclosures, and have included the significant expense categories that are regularly provided to our CODM. Prior year information has been included to conform to the current year presentation as required by the ASU.
Segment operating profit measures by segment are as follows (in millions):
| | | | | | | | | | | | | | | | | | | | | | | | | | | | | | | | | | | | | | | | | | | | | | | | |
| | Americas | | | EMEA | | | Asia Pacific | | | Total | |
| | Year Ended December 31, | | | Year Ended December 31, | | | Year Ended December 31, | | | Year Ended December 31, | |
| | 2024 | | | 2023 | | | 2022 | | | 2024 | | | 2023 | | | 2022 | | | 2024 | | | 2023 | | | 2022 | | | 2024 | | | 2023 | | | 2022 | |
| | | | | | | | | | | | | | | | | | | | | | | | | | | | | | | | | | | | |
| | | | | | | | | | | | | | | | | | | | | | | | | | | | | | | | | | | | |
Net Sales | | $ | 4,794.8 | | | $ | 4,624.1 | | | $ | 4,295.5 | | | $ | 1,691.1 | | | $ | 1,592.4 | | | $ | 1,456.5 | | | $ | 1,192.8 | | | $ | 1,177.7 | | | $ | 1,187.8 | | | $ | 7,678.6 | | | $ | 7,394.2 | | | $ | 6,939.9 | |
Cost of products sold, excluding intangible asset amortization | | | 983.7 | | | | 967.8 | | | | 915.6 | | | | 588.9 | | | | 541.8 | | | | 550.4 | | | | 375.5 | | | | 362.5 | | | | 379.2 | | | | | | | | | | |
Selling, general and administrative | | | 1,230.7 | | | | 1,165.9 | | | | 1,094.8 | | | | 507.3 | | | | 505.5 | | | | 483.2 | | | | 346.5 | | | | 367.2 | | | | 363.3 | | | | | | | | | | |
Research and development | | | 3.5 | | | | 3.4 | | | | 2.8 | | | | 9.0 | | | | 6.9 | | | | 6.7 | | | | 13.3 | | | | 15.6 | | | | 16.3 | | | | | | | | | | |
Segment profit | | $ | 2,577.0 | | | $ | 2,487.1 | | | $ | 2,282.4 | | | $ | 585.8 | | | $ | 538.2 | | | $ | 416.1 | | | $ | 457.6 | | | $ | 432.3 | | | $ | 429.1 | | | $ | 3,620.4 | | | $ | 3,457.6 | | | $ | 3,127.6 | |
Corporate items | | | | | | | | | | | | | | | | | | | | | | | | | | | | | | 1,742.8 | | | | 1,618.4 | | | | 1,611.7 | |
Intangible asset amortization | | | | | | | | | | | | | | | | | | | | | | | | | | | | | | 591.9 | | | | 561.5 | | | | 526.8 | |
Goodwill and intangible asset impairment | | | | | | | | | | | | | | | | | | | | | | | | | | | | | | - | | | | - | | | | 292.8 | |
Other expense, net | | | | | | | | | | | | | | | | | | | | | | | | | | | | | | 31.1 | | | | 9.3 | | | | 128.0 | |
Interest expense, net | | | | | | | | | | | | | | | | | | | | | | | | | | | | | | 218.0 | | | | 201.2 | | | | 164.8 | |
Earnings from continuing operations before income taxes | | | | | | | | | | | | | | | | | | | | | | | | | | | | | $ | 1,036.6 | | | $ | 1,067.3 | | | $ | 403.5 | |
Other segment information is as follows (in millions):
| | | | | | | | | | | | | | | | | | | | | |
| | | Depreciation and Amortization | | | Segment Assets | |
| | | Year Ended December 31, | | | As of December 31, | |
| | | 2024 | | | 2023 | | | 2022 | | | 2024 | | | 2023 | |
| | | | | | | | | | | | | | | | |
| | | | | | | | | | | | | | | | |
Americas | | | $ | 150.3 | | | $ | 134.5 | | | $ | 130.3 | | | $ | 1,344.0 | | | $ | 1,212.0 | |
EMEA | | | | 65.8 | | | | 67.2 | | | | 64.4 | | | | 655.0 | | | | 679.0 | |
Asia Pacific | | | | 61.1 | | | | 62.3 | | | | 63.5 | | | | 311.0 | | | | 355.0 | |
Corporate items | | | | 127.2 | | | | 126.2 | | | | 141.4 | | | | 1,406.0 | | | | 1,581.6 | |
Intangible asset amortization | | | | 591.9 | | | | 561.5 | | | | 526.8 | | | | - | | | | - | |
Total | | | $ | 996.3 | | | $ | 951.7 | | | $ | 926.4 | | | $ | 3,716.0 | | | $ | 3,827.6 | |
We conduct business in the following countries that hold 10 percent or more of our total consolidated Property, plant and equipment, net (in millions):
| | | | | | | | |
| | As of December 31, | |
| | 2024 | | | 2023 | |
United States | | $ | 1,258.3 | | | $ | 1,265.1 | |
Other countries | | | 790.5 | | | | 795.3 | |
Property, plant and equipment, net | | $ | 2,048.8 | | | $ | 2,060.4 | |
U.S. sales were $4,439.0 million, $4,288.8 million, and $4,012.4 million for the years ended December 31, 2024, 2023 and 2022, respectively. Sales within any other individual country were less than 10 percent of our consolidated sales in each of those years. Sales are attributable to a country based upon the customer's country of domicile.
We own most of our manufacturing facilities, but lease various office space, vehicles and other less significant assets throughout the world. Our contracts contain a lease if they convey a right to control the use of an identified asset, either explicitly or implicitly, in exchange for consideration. We have elected not to recognize a right-of-use asset nor a lease liability for leases with an initial term of twelve months or less. Additionally, we have elected not to separate non-lease components from the leased components in the valuation of our right-of-use asset and lease liability for all asset classes. Our lease contracts are a necessary part of our business, but we do not believe they are significant to our overall operations. We do not have any significant finance leases. Additionally, we do not have significant leases: where we are considered a lessor; where we sublease our assets; with an initial term of twelve months or less; with related parties; with residual value guarantees; that impose restrictions or covenants on us; or that have not yet commenced, but create significant rights and obligations against us.
Our real estate leases generally have terms of between 5 to 10 years and contain lease extension options that can vary from month-to-month extensions to up to 5 year extensions. We include extension options in our lease term if we are reasonably certain to exercise that option. In determining whether an extension is reasonably certain, we consider the uniqueness of the property for our needs, the availability of similar properties, whether the extension period payments remain the same or may change due to market rates or fixed price increases in the contract, and other economic factors. Our vehicle leases generally have terms of between 3 to 5 years and contain lease extension options on a month-to-month basis. Our vehicle leases are generally not reasonably certain to be extended.
We are required to discount our lease liabilities to present value using the rate implicit in the lease, or our incremental borrowing rate for a similar term as the lease term if the implicit rate is not readily available. We generally do not have adequate information to know the implicit rate in a lease and therefore use our incremental borrowing rate. The incremental borrowing rate must be on a collateralized basis, but our debt arrangements are unsecured. We have determined our incremental borrowing rate by using our credit rating to estimate our unsecured borrowing rate and applying reasonable assumptions to reduce the unsecured rate for a risk adjustment effect from collateral.
Information on our leases is as follows ($ in millions):
| | | | | | | | | | | | |
| | For the Years Ended December 31, | |
| | 2024 | | | 2023 | | | 2022 | |
Lease cost | | $ | 64.7 | | | $ | 59.7 | | | $ | 62.4 | |
Cash paid for leases recognized in operating cash flows | | $ | 57.9 | | | $ | 62.8 | | | $ | 65.2 | |
Right-of-use assets obtained in exchange for new lease liabilities | | $ | 86.2 | | | $ | 77.8 | | | $ | 72.0 | |
| | | | | | | | | | |
| | | | As of December 31, | |
| | | | 2024 | | | 2023 | |
Right-of-use assets recognized in Other assets | | | | $ | 213.5 | | | $ | 203.8 | |
Lease liabilities recognized in Other current liabilities | | | | $ | 53.2 | | | $ | 52.9 | |
Lease liabilities recognized in Other long-term liabilities | | | | $ | 190.2 | | | $ | 174.4 | |
Weighted-average remaining lease term | | | | 6.6 years | | | 5.8 years | |
Weighted-average discount rate | | | | | 3.5 | % | | | 2.8 | % |
Our variable lease costs are not significant.
Our future minimum lease payments as of December 31, 2024 were (in millions):
| | | | | | | | |
For the Years Ending December 31, | | | | | | | |
2025 | | | | | | $ | 59.7 | |
2026 | | | | | | | 51.3 | |
2027 | | | | | | | 41.2 | |
2028 | | | | | | | 29.2 | |
2029 | | | | | | | 22.6 | |
Thereafter | | | | | | | 73.2 | |
Total | | | | | | | 277.2 | |
Less imputed interest | | | | | | | 33.8 | |
Total | | | | | | $ | 243.4 | |
21.Commitments and Contingencies
From time to time, we are involved in various legal proceedings, including product liability, intellectual property, stockholder matters, tax disputes, commercial disputes, employment matters, whistleblower and qui tam claims and investigations, governmental proceedings and investigations, and other legal matters that arise in the normal course of our business, including those described below. On a quarterly and annual basis, we review relevant information with respect to loss contingencies and update our accruals, disclosures and estimates of reasonably possible losses or ranges of loss based on such reviews. We establish liabilities for loss contingencies on an undiscounted basis when it is probable that a loss has been incurred and the amount of the loss can be reasonably estimated. If the reasonable estimate of a known or probable loss is a range, and no amount within the range is a better estimate than any other, the minimum amount of the range is accrued. For matters where a loss is believed to be reasonably possible, but not probable, or if no reasonable estimate of known or probable loss is available, no accrual has been made.
When determining the estimated loss or range of loss, significant judgment is required. Estimates of probable losses resulting from litigation and other contingencies are inherently difficult to predict, particularly when the matters are in early procedural stages with incomplete facts or legal discovery, involve unsubstantiated or indeterminate claims for damages, and/or potentially involve penalties, fines or punitive damages. In addition to the matters described herein, we remain subject to the risk of future governmental, regulatory and legal actions. Governmental and regulatory actions may lead to product recalls, injunctions and other restrictions on our operations and monetary sanctions, which may include substantial civil or criminal penalties. Actions involving intellectual property could result in a loss of patent protection or the ability to market products, which could lead to significant sales reductions or cost increases, or otherwise materially affect the results of our operations.
We recognize litigation-related charges and gains in Selling, general and administrative expense on our consolidated statement of earnings. During the years ended December 31, 2024, 2023, and 2022, we recognized $30.5 million, $21.6 million and $65.9 million, respectively, of net litigation-related charges. At December 31, 2024 and 2023, accrued litigation liabilities were $156.4 million and $244.1 million, respectively. These litigation-related charges and accrued liabilities reflect all of our litigation-related contingencies and not just the matters discussed below. The ultimate cost of litigation could be materially different than the amount of the current estimates and accruals and could have a material adverse impact on our financial condition and results of operations.
Litigation
Durom Cup-related claims: On July 22, 2008, we temporarily suspended marketing and distribution of the Durom Cup in the U.S. Subsequently, a number of product liability lawsuits were filed against us in various U.S. and foreign jurisdictions. The plaintiffs seek damages for personal injury, and they generally allege that the Durom Cup contains defects that result in complications and revision of the device. We have settled the majority of these claims in the U.S., but other lawsuits are pending in various foreign jurisdictions and additional claims may be asserted in the future. The majority of claims outside the U.S. are pending in Germany, Netherlands and Italy.
We rely on significant estimates in determining the provisions for Durom Cup-related claims, including our estimate of the number of claims that we will receive and the average amount we will pay per claim. The actual number of claims and the actual amount we pay per claim may differ from our estimates. For various reasons, we cannot reasonably estimate the possible loss or range of loss that may result from Durom Cup-related claims in excess of the losses we have accrued. Although we are vigorously defending these lawsuits, their ultimate resolution is uncertain. We accrued a litigation-related charge in this matter based on an estimate of the reasonably possible loss, as discussed above.
Zimmer M/L Taper, M/L Taper with Kinectiv Technology, and Versys Femoral Head-related claims (“Metal Reaction” claims): We are a defendant in a number of product liability lawsuits relating to our M/L Taper and M/L Taper with Kinectiv Technology hip stems, and Versys Femoral Head implants. The plaintiffs seek damages for personal injury, alleging that defects in the products lead to corrosion at the head/stem junction resulting in, among other things, pain, inflammation and revision surgery.
The majority of the cases are consolidated in an MDL that was created on October 3, 2018 in the U.S. District Court for the Southern District of New York (In Re: Zimmer M/L Taper Hip Prosthesis or M/L Taper Hip Prosthesis with Kinectiv Technology and Versys Femoral Head Products Liability Litigation). Most of the cases in the MDL have been resolved. Other related cases are pending in various state and federal courts and in courts in Canada, and additional claims may be asserted in the future. Although we are vigorously defending these lawsuits, their ultimate resolution is uncertain. We accrued a litigation-related charge in this matter based on an estimate of the reasonably possible loss, as discussed above.
Biomet metal-on-metal hip implant claims: Biomet is a defendant in a number of product liability lawsuits relating to metal-on-metal hip implants, most of which involve the M2a-Magnum hip system. Cases were originally consolidated in an MDL in the U.S. District Court for the Northern District of Indiana (In Re: Biomet M2a Magnum Hip Implant Product Liability Litigation), but the majority of the claims in the U.S. have been settled. Trials may still occur in the future, and although each case will be tried on its particular facts, a verdict and subsequent final judgment for the plaintiff in one or more of these cases could have a substantial impact on our potential liability. Lawsuits are pending in various foreign jurisdictions and additional claims are expected to be asserted. We continue to refine our estimates of the potential liability to resolve the remaining claims and lawsuits. Although we are vigorously defending these lawsuits, their ultimate resolution is uncertain. We accrued a litigation-related charge in this matter based on an estimate of the reasonably possible loss, as discussed above.
Other Contingencies
Contractual obligations: We have entered into development, distribution and other contractual arrangements that may result in future payments dependent upon various events such as the achievement of certain product R&D milestones, sales milestones, or, at our discretion, maintenance of exclusive rights to distribute a product. Since there is uncertainty on the timing or whether such payments will have to be made, they have not been recognized on our consolidated balance sheets. These estimated payments could range from $0 to approximately $325 million.
In January 2025, we entered into a definitive agreement to acquire all outstanding shares of Paragon 28, Inc. (“Paragon 28”), a leading medical device company focused exclusively on the foot and ankle orthopedic segment. The acquisition will give us a larger market share in the foot and ankle market, which is growing faster than some of the other markets we compete in. Initial consideration of approximately $1.2 billion will be paid at closing. Paragon 28 shareholders will also receive a non-tradeable contingent value right that may result in up to approximately $90 million in additional consideration if certain revenue milestones are achieved. We expect to fund the proposed transaction through a combination of cash on hand and other available debt financing sources. Closing of the proposed transaction is subject to the receipt of required regulatory approvals, approval by Paragon 28 stockholders and other customary closing conditions, and is anticipated to close in the first half of 2025.
In February 2025, we issued senior notes with aggregate principal amounts of $600 million of 4.700% notes due 2027 (“2027 Notes”), $550 million of 5.050% notes due 2030 (“2030 Notes”), and $600 million of 5.500% notes due 2035 (“2035 Notes”). We intend to use the net proceeds from these notes, together with cash on hand or other immediately available funds, to pay the consideration, fees, and expenses for the Paragon 28 acquisition. We further intend to use a portion of the proceeds of the 2027 Notes for general corporate purposes, which may include the repayment of other indebtedness (which could include the repayment of our 3.550% notes due April 1, 2025), share repurchases, financing capital commitments and financing future acquisitions. If we fail to consummate the Paragon 28 acquisition either (i) prior to November 28, 2025 (as such date may be extended in accordance with the terms of the Paragon 28 merger agreement and the supplemental indenture governing the 2030 Notes and the 2035 Notes); or (ii) due to the termination of Paragon 28 merger agreement pursuant to its terms, then we will be obligated to redeem all of the 2030 notes and the 2035 notes on the special mandatory redemption date at a redemption price equal to 101% of the principal amount of such series of notes, plus accrued and unpaid interest to, but excluding, the special mandatory redemption date.
Item 9. Changes in and Disagreements with Accountants on Accounting and Financial Disclosure
None.
Item 9A. Controls and Procedures
Evaluation of Disclosure Controls and Procedures
We maintain disclosure controls and procedures (as defined in Rules 13a-15(e) and 15d-15(e) under the Exchange Act) that are designed to provide reasonable assurance that information required to be disclosed in the reports that we file or submit under the Exchange Act is recorded, processed, summarized and reported within the time periods specified in the Securities and Exchange Commission’s rules and forms, and that such information is accumulated and communicated to our management, including our Chief Executive Officer and Chief Financial Officer, as appropriate to allow timely decisions regarding required disclosures. Because of inherent limitations, disclosure controls and procedures, no matter how well designed and operated, can provide only reasonable, and not absolute, assurance that the objectives of disclosure controls and procedures are met.
Our management, with the participation of our Chief Executive Officer and Chief Financial Officer, evaluated the effectiveness of our disclosure controls and procedures as of the end of the period covered by this report. Based on that evaluation, our Chief Executive Officer and Chief Financial Officer concluded that as of December 31, 2024, the end of the period covered by this report, our disclosure controls and procedures were effective at a reasonable assurance level.
Management’s Annual Report on Internal Control over Financial Reporting
The management of Zimmer Biomet Holdings, Inc. is responsible for establishing and maintaining adequate internal control over financial reporting. Internal control over financial reporting is defined in Rules 13a-15(f) and 15d-15(f) promulgated under the Exchange Act, as a process designed by, or under the supervision of, the Company’s principal executive and principal financial officers, or persons performing similar functions, and effected by the Company’s board of directors, management and other personnel, to provide reasonable assurance regarding the reliability of financial reporting and the preparation of financial statements for external purposes in accordance with generally accepted accounting principles and includes those policies and procedures that:
•Pertain to the maintenance of records that in reasonable detail accurately and fairly reflect the transactions and dispositions of the assets of the Company;
•Provide reasonable assurance that transactions are recorded as necessary to permit preparation of financial statements in accordance with generally accepted accounting principles, and that receipts and expenditures of the Company are being made only in accordance with authorizations of management and directors of the Company; and
•Provide reasonable assurance regarding prevention or timely detection of unauthorized acquisition, use or disposition of the Company’s assets that could have a material effect on the financial statements.
Because of its inherent limitations, internal control over financial reporting may not prevent or detect misstatements. Also, projections of any evaluation of effectiveness to future periods are subject to the risk that controls may become inadequate because of changes in conditions, or that the degree of compliance with the policies or procedures may deteriorate.
The Company’s management assessed the effectiveness of the Company’s internal control over financial reporting as of December 31, 2024. In making this assessment, the Company’s management used the criteria set forth by the Committee of Sponsoring Organizations of the Treadway Commission (COSO) in Internal Control-Integrated Framework (2013).
Based on their assessment, management has concluded that, as of December 31, 2024, the Company’s internal control over financial reporting is effective based on those criteria.
PricewaterhouseCoopers LLP, an independent registered public accounting firm, audited the effectiveness of our internal control over financial reporting as of December 31, 2024 and issued an unqualified opinion thereon as stated in their report, which appears under Item 8 of this Annual Report on Form 10-K.
Changes in Internal Control Over Financial Reporting
In July 2024 we transitioned to a new ERP software system for a significant portion of our U.S. and Canada sales and commercial operations (the "ERP implementation"). The new ERP replaced our existing order entry, fulfillment and financial systems, resulting in material changes to our business processes and internal controls. This ERP implementation included changes to certain financial and commercial processes impacting key controls related to our internal controls over financial reporting. We implemented and/or enhanced our internal control activities, where applicable, for any changes that occurred and we continued to monitor the impact and implemented and/or enhanced our processes, procedures, and internal control over financial reporting during the fourth quarter of 2024. Except as it relates to our ERP implementation, there were no changes in our internal control over financial reporting that occurred during the quarter ended December 31, 2024 that have materially affected, or are reasonably likely to materially affect, our internal control over financial reporting.
Item 9B. Other Information
Audit and Other Services
During the fourth quarter of 2024, the Audit Committee of our Board of Directors approved the engagement of PricewaterhouseCoopers LLP, our independent registered public accounting firm, to perform certain audit related and tax services. This disclosure is made pursuant to Section 10A(i)(2) of the Exchange Act.
Trading Plan Arrangements
During the three-month period ended December 31, 2024, no members of our Board of Directors or officers (as defined in Rule 16a-1(f) of the Exchange Act) adopted, amended or terminated any contract, instruction or written plan for the purchase or sale of our securities intended to satisfy the affirmative defense conditions of Rule 10b5-1(c) of the Exchange Act or any non-Rule 10b5-1 trading arrangement, as defined in rules of the Securities and Exchange Commission.
Item 9C. Disclosure Regarding Foreign Jurisdictions that Prevent Inspections
Not applicable.
PART III
Item 10. Directors, Executive Officers and Corporate Governance
Information regarding our executive officers is included in Part I, Item 1 of this Annual Report on Form 10-K under the caption “Information About our Executive Officers.”
We have adopted the Zimmer Biomet Code of Ethics for Chief Executive Officer and Senior Financial Officers (the “finance code of ethics”), a code of ethics that applies to our Chief Executive Officer, Chief Financial Officer, Chief Accounting Officer and Corporate Controller, and other finance organization senior employees. The finance code of ethics is publicly available in the Investor Relations section of our website, which may be accessed from our homepage at www.zimmerbiomet.com or directly at https://investor.zimmerbiomet.com. If we make any substantive amendments to the finance code of ethics or grant any waiver, including any implicit waiver, from a provision of the code to our Chief Executive Officer, Chief Financial Officer, or Chief Accounting Officer and Corporate Controller, we will disclose the nature of that amendment in the Investor Relations section of our website.
We have adopted an insider trading policy governing the purchase, sale and other dispositions of our securities by directors, senior management and employees. A copy of this policy is filed as an exhibit to this Annual Report on Form 10-K.
The additional information required by this item is incorporated by reference from our definitive Proxy Statement for our 2025 annual meeting of stockholders (the “2025 Proxy Statement”) under the captions “Corporate Governance” and “Delinquent Section 16(a) Reports.”
Item 11. Executive Compensation
The information required by this item is incorporated by reference from our 2025 Proxy Statement under the captions “Executive Compensation” and “Compensation of Non-Employee Directors.”
Item 12. Security Ownership of Certain Beneficial Owners and Management and Related Stockholder Matters
The information required by this item is incorporated by reference from our 2025 Proxy Statement under the captions “Executive Compensation” and “Ownership of our Stock.”
Item 13. Certain Relationships and Related Transactions and Director Independence
The information required by this item is incorporated by reference from our 2025 Proxy Statement under the caption “Corporate Governance.”
Item 14. Principal Accountant Fees and Services
The information required by this item is incorporated by reference from our 2025 Proxy Statement under the caption “Audit Committee Matters.”
PART IV
Item 15. Exhibits and Financial Statement Schedules
(a) (1) Financial Statements: See the Consolidated Financial Statements under Item 8 of this Report.
(2) Financial Statements Schedule
Schedule II. Valuation and Qualifying Accounts (in millions):
| | | | | | | | | | | | | | | | | | | | |
| | | | | Additions | | | | | | | | | | |
| | Balance at | | | Charged | | | Deductions / | | | Effects of | | | Balance at | |
| | Beginning | | | (Credited) | | | Other Additions | | | Foreign | | | End of | |
Description | | of Period | | | to Expense | | | to Reserve | | | Currency | | | Period | |
Allowance for Doubtful Accounts: | | | | | | | | | | | | | | | |
Year Ended December 31, 2022 | | $ | 60.1 | | | $ | 22.5 | | | $ | (7.6 | ) | | $ | 3.4 | | | $ | 78.4 | |
Year Ended December 31, 2023 | | | 78.4 | | | | 5.1 | | | | (5.1 | ) | | | (3.3 | ) | | | 75.1 | |
Year Ended December 31, 2024 | | | 75.1 | | | | 29.3 | | | | (7.1 | ) | | | (4.1 | ) | | | 93.2 | |
Deferred Tax Asset Valuation Allowances: | | | | | | | | | | | | | | | |
Year Ended December 31, 2022 | | $ | 460.1 | | | $ | 3.0 | | | $ | 2.0 | | (1) | $ | (1.9 | ) | | $ | 463.2 | |
Year Ended December 31, 2023 | | | 463.2 | | | | (3.1 | ) | | | 3.7 | | (1) | | 0.8 | | | | 464.6 | |
Year Ended December 31, 2024 | | | 464.6 | | | | (3.9 | ) | | | (7.9 | ) | (1) | | (3.4 | ) | | | 449.4 | |
(1)Primarily relate to amounts generated by tax rate changes or current year activity which have offsetting changes to the associated attribute and therefore there is no resulting impact on tax expense in the consolidated financial statements.
Other financial statement schedules are omitted because they are not applicable or the required information is shown in the financial statements or the notes thereto.
(3) Exhibits: See Index to Exhibits below
INDEX TO EXHIBITS
| | |
2.1 | | Separation and Distribution Agreement, dated as of March 1, 2022, by and between Zimmer Biomet Holdings, Inc. and ZimVie Inc. (incorporated by reference to Exhibit 2.1 to the Registrant’s Current Report on Form 8-K filed March 1, 2022) |
2.2+ | | Agreement and Plan of Merger, dated January 28, 2025, by and among Zimmer, Inc., Paragon 28, Inc., Gazelle Merger Sub I and Zimmer Biomet Holdings, Inc. (incorporated by reference to Exhibit 2.1 to the Registrant’s Current Report on Form 8-K filed January 29, 2025) |
3.1 |
| Restated Certificate of Incorporation of Zimmer Biomet Holdings, Inc., dated May 17, 2021 (incorporated by reference to Exhibit 3.2 to the Registrant’s Current Report on Form 8-K filed May 20, 2021) |
3.2 |
| Restated Bylaws of Zimmer Biomet Holdings, Inc., effective December 14, 2022 (incorporated by reference to Exhibit 3.2 to the Registrant's Annual Report on Form 10-K filed February 24, 2023) |
4.1 | | Description of Securities Registered under Section 12 of the Securities Exchange Act of 1934 |
4.2 |
| Specimen Common Stock Certificate (incorporated by reference to Exhibit 4.1 to the Registrant’s Quarterly Report on Form 10-Q filed August 5, 2019) |
4.3 |
| Indenture dated as of November 17, 2009 between Zimmer Holdings, Inc. (now known as Zimmer Biomet Holdings, Inc.) and Wells Fargo Bank, National Association, as Trustee (incorporated by reference to Exhibit 4.1 to the Registrant’s Current Report on Form 8-K filed December 13, 2016) |
4.4 |
| First Supplemental Indenture to the Indenture dated as of November 17, 2009 between Zimmer Holdings, Inc. and Wells Fargo Bank, National Association, as Trustee (incorporated by reference to Exhibit 4.2 to the Registrant’s Current Report on Form 8-K filed November 17, 2009) |
4.5 |
| Form of 5.750% Note due 2039 (incorporated by reference to Exhibit 4.4 above) |
4.6 |
| Second Supplemental Indenture dated as of November 10, 2011, to the Indenture dated as of November 17, 2009 between Zimmer Holdings, Inc. and Wells Fargo Bank, National Association, as Trustee (incorporated by reference to Exhibit 4.1 to the Registrant’s Current Report on Form 8-K filed November 10, 2011) |
4.7 |
| Third Supplemental Indenture, dated as of March 19, 2015, to the Indenture dated as of November 17, 2009 between Zimmer Holdings, Inc. and Wells Fargo Bank, National Association, as Trustee (incorporated by reference to Exhibit 4.1 to the Registrant’s Current Report on Form 8-K filed March 19, 2015) |
4.8 |
| Form of 3.550% Notes due 2025 (incorporated by reference to Exhibit 4.7 above) |
4.9 |
| Form of 4.250% Notes due 2035 (incorporated by reference to Exhibit 4.7 above) |
4.10 |
| Form of 4.450% Notes due 2045 (incorporated by reference to Exhibit 4.7 above) |
4.11 |
| Fourth Supplemental Indenture, dated as of December 13, 2016, between Zimmer Biomet Holdings, Inc. and Wells Fargo Bank, National Association, as Trustee (incorporated by reference to Exhibit 4.2 to the Registrant’s Current Report on Form 8-K filed December 13, 2016) |
4.12 | | Form of 2.425% Notes due 2026 (incorporated by reference to Exhibit 4.11 above) |
4.13 | | Agency Agreement, dated as of December 13, 2016, by and among Zimmer Biomet Holdings, Inc., as issuer, Elavon Financial Services DAC, UK Branch, as paying agent, Elavon Financial Services DAC, as registrar and transfer agent, and Wells Fargo Bank, National Association, as Trustee (incorporated by reference to Exhibit 4.3 to the Registrant’s Current Report on Form 8-K filed December 13, 2016) |
4.14 |
| Amendment No. 1, dated as of January 4, 2017, to the Agency Agreement dated as of December 13, 2016, by and among Zimmer Biomet Holdings, Inc., as issuer, Elavon Financial Services DAC, UK Branch, as paying agent, Elavon Financial Services DAC, as original registrar and original transfer agent, U.S. Bank National Association, as successor registrar and successor transfer agent, and Wells Fargo Bank, National Association, as Trustee (incorporated by reference to Exhibit 4.4 to the Registrant’s Registration Statement on Form 8-A filed January 4, 2017) |
4.15 |
| Fifth Supplemental Indenture, dated as of March 19, 2018, between Zimmer Biomet Holdings, Inc. and Wells Fargo Bank, National Association, as Trustee (incorporated by reference to Exhibit 4.2 to the Registrant’s Current Report on Form 8-K filed March 19, 2018) |
4.16 | | Sixth Supplemental Indenture, dated as of November 15, 2019, between Zimmer Biomet Holdings, Inc. and Wells Fargo Bank, National Association, as Trustee (incorporated by reference to Exhibit 4.2 to the Registrant’s Current Report on Form 8-K filed November 15, 2019) |
| | |
4.17 | | Form of 1.164% Notes due 2027 (incorporated by reference to Exhibit 4.16 above) |
4.18 | | Agency Agreement, dated as of November 15, 2019, by and between Zimmer Biomet Holdings, Inc., as issuer, Elavon Financial Services DAC, UK Branch, as paying agent, U.S. Bank National Association, as transfer agent and registrar, and Wells Fargo Bank, National Association, as trustee (incorporated by reference to Exhibit 4.3 to the Registrant’s Current Report on Form 8-K filed on November 15, 2019) |
4.19 | | Seventh Supplemental Indenture, dated as of March 20, 2020, between Zimmer Biomet Holdings, Inc. and Wells Fargo Bank, National Association, as trustee (incorporated by reference to Exhibit 4.2 to the Registrant’s Current Report on Form 8-K filed March 20, 2020) |
4.20 | | Form of 3.050% Notes due 2026 (incorporated by reference to Exhibit 4.19 above) |
4.21 | | Form of 3.550% Notes due 2030 (incorporated by reference to Exhibit 4.19 above) |
4.22 | | Eighth Supplemental Indenture, dated as of November 24, 2021, between Zimmer Biomet Holdings, Inc. and Computershare Trust Company, N.A., as trustee (incorporated by reference to Exhibit 4.2 to the Registrant’s Current Report on Form 8-K filed November 24, 2021) |
4.23 | | Form of 2.600% Notes due 2031 (incorporated by reference to Exhibit 4.22 above) |
4.24 | | Ninth Supplemental Indenture, dated as of December 1, 2023, between Zimmer Biomet Holdings, Inc. and Computershare Trust Company, N.A., as trustee (incorporated by reference to Exhibit 4.2 to the Registrant’s Current Report on Form 8-K filed December 1, 2023) |
4.25 | | Form of 5.350% Notes due 2028 (incorporated by reference to Exhibit 4.24 above) |
4.26 | | Tenth Supplemental Indenture, dated as of August 15, 2024, between Zimmer Biomet Holdings, Inc. and Computershare Trust Company, N.A., as trustee (incorporated by reference to Exhibit 4.2 to the Registrant’s Current Report on Form 8-K filed August 15, 2024) |
4.27 | | Form of 5.200% Notes due 2034 (incorporated by reference to Exhibit 4.26 above) |
4.28 | | Eleventh Supplemental Indenture, dated as of November 20, 2024, between Zimmer Biomet Holdings, Inc. and Computershare Trust Company, N.A., as trustee (incorporated by reference to Exhibit 4.2 to the Registrant’s Current Report on Form 8-K filed November 20, 2024) |
4.29 | | Form of 3.518% Notes due 2032 (incorporated by reference to Exhibit 4.28 above) |
4.30 | | Agency Agreement, dated as of November 20, 2024, by and among Zimmer Biomet Holdings, Inc., as issuer, U.S. Bank Europe DAC, UK Branch, as paying agent, U.S. Bank Trust Company, National Association, as transfer agent and registrar, and Computershare Trust Company, N.A., as trustee (incorporated by reference to Exhibit 4.3 to the Registrant’s Current Report on Form 8-K filed November 20, 2024) |
10.1* |
| Zimmer Biomet Holdings, Inc. Executive Performance Incentive Plan, as amended May 7, 2013 and further amended as of June 24, 2015 (incorporated by reference to Exhibit 10.4 to the Registrant’s Quarterly Report on Form 10-Q filed November 9, 2015) |
10.2* |
| Amendment to Zimmer Biomet Holdings, Inc. Executive Performance Incentive Plan (incorporated by reference to Exhibit 10.1 to the Registrant’s Current Report on Form 8-K filed January 7, 2016) |
10.3* | | Amendment to Zimmer Biomet Holdings, Inc. Executive Performance Incentive Plan, Effective May 7, 2020 (incorporated by reference to Exhibit 10.7 to the Registrant’s Quarterly Report on Form 10-Q filed May 11, 2020) |
10.4* | | Amended and Restated Zimmer Biomet Deferred Compensation Plan, effective as of January 1, 2022 (incorporated by reference to Exhibit 10.2 to the Registrant’s Quarterly Report on Form 10-Q filed May 5, 2022) |
10.5* |
| Restated Zimmer Biomet Holdings, Inc. Long Term Disability Income Plan for Highly Compensated Employees (incorporated by reference to Exhibit 10.4 to the Registrant’s Current Report on Form 8-K filed January 7, 2016) |
10.6* | | Restated Benefit Equalization Plan of Zimmer Holdings, Inc. and Its Subsidiary or Affiliated Corporations Participating in the Zimmer Holdings, Inc. Savings and Investment Program (incorporated by reference to Exhibit 10.16 to the Registrant’s Annual Report on Form 10-K filed February 27, 2009) |
10.7* | | First Amendment to the Restated Benefit Equalization Plan of Zimmer Holdings, Inc. and its Subsidiary or Affiliated Corporations Participating in the Zimmer Holdings, Inc. Savings and Investment Program (incorporated by reference to Exhibit 10.2 to the Registrant’s Current Report on Form 8-K filed January 7, 2016) |
10.8* | | Offer Letter, dated as of August 21, 2023, by and between Zimmer Biomet Holdings, Inc. and Ivan Tornos (incorporated by reference to Exhibit 10.1 to the Registrant's Current Report on Form 8-K filed August 22, 2023) |
| | |
10.9* |
| Change in Control Severance Agreement, dated as of August 21, 2023, by and between Zimmer Biomet Holdings, Inc. and Ivan Tornos (incorporated by reference to Exhibit 10.2 to the Registrant's Current Report on Form 8-K filed August 22, 2023) |
10.10* | | Form of Amendment to Change in Control Severance Agreement with Ivan Tornos, Suketu Upadhyay, Rachel Ellingson, Lori Winkler and Paul Stellato (incorporated by reference to Exhibit 10.51 to the Registrant’s Annual Report on Form 10-K filed February 23, 2024) |
10.11* | | Chief Executive Officer Confidentiality, Non-Competition and Non-Solicitation Agreement, dated as of August 21, 2023, by and between Zimmer Biomet Holdings, Inc. and Ivan Tornos (incorporated by reference to Exhibit 10.3 to the Registrant's Current Report on Form 8-K filed August 22, 2023) |
10.12* | | Form of Change in Control Severance Agreement with Rachel Ellingson, Paul Stellato, Suketu Upadhyay and Lori Winkler (incorporated by reference to Exhibit 10.11 to the Registrant’s Annual Report on Form 10-K filed February 26, 2019) |
10.13* | | Form of Confidentiality, Non-Competition and Non-Solicitation Agreement with Suketu Upadhyay, Rachel Ellingson and Lori Winkler (incorporated by reference to Exhibit 10.12 to the Registrant’s Annual Report on Form 10-K filed February 26, 2019) |
10.14* | | Swiss Employment Agreement by and between Zimmer GmbH and Wilfred van Zuilen dated as of May 5, 2021 (incorporated by reference to Exhibit 10.4 to the Quarterly Report on Form 10-Q filed August 3, 2021) |
10.15* | | Offer Letter by and between Zimmer Biomet Holdings, Inc. and Wilfred van Zuilen dated as of May 5, 2021 (incorporated by reference to Exhibit 10.5 to the Quarterly Report on Form 10-Q filed August 3, 2021) |
10.16* | | Change in Control Severance Agreement by and between Zimmer GmbH and Wilfred van Zuilen (incorporated by reference to Exhibit 10.6 to the Quarterly Report on Form 10-Q filed August 3, 2021) |
10.17* | | Amendment to Change in Control Severance Agreement dated February 19, 2024 between Zimmer GmbH and Wilfred van Zuilen (incorporated by reference to Exhibit 10.52 to the Registrant’s Annual Report on Form 10-K filed February 23, 2024) |
10.18* | | Confidentiality, Non-Competition and Non-Solicitation Agreement by and between Zimmer GmbH and Wilfred van Zuilen (incorporated by reference to Exhibit 10.7 to the Quarterly Report on Form 10-Q filed August 3, 2021) |
10.19* | | Offer Letter between Zimmer Biomet Holdings, Inc. and Suketu Upadhyay dated June 13, 2019 (incorporated by reference to Exhibit 10.1 to the Registrant’s Current Report on Form 8-K filed June 19, 2019) |
10.20* | | Letter of Appointment by and between Zimmer Asia (HK) Limited and Sang Yi dated June 15, 2020 (incorporated by reference to Exhibit 10.7 to the Registrant’s Quarterly Report on Form 10-Q filed August 5, 2020) |
10.21* | | Change in Control Severance Agreement with Sang Yi dated June 15, 2020 (incorporated by reference to Exhibit 10.6 to the Registrant’s Quarterly Report on Form 10-Q filed August 5, 2020) |
10.22* | | Deed of Amendment dated February 19, 2024 between Zimmer Asia (HK) Limited and Sang-Uk Yi (incorporated by reference to Exhibit 10.53 to the Registrant’s Annual Report on Form 10-K filed February 23, 2024) |
10.23* | | Confidentiality, Non-Competition and Non-Solicitation Agreement with Sang Yi dated June 15, 2020 (incorporated by reference to Exhibit 10.5 to the Registrant’s Quarterly Report on Form 10-Q filed August 5, 2020) |
10.24* |
| Form of Change in Control Severance Agreement with Chad F. Phipps (incorporated by reference to Exhibit 10.13 to the Registrant’s Annual Report on Form 10-K filed February 27, 2009) |
10.25* | | Form of Confidentiality, Non-Competition and Non-Solicitation Agreement with Chad F. Phipps (incorporated by reference to Exhibit 10.3 to the Registrant’s Current Report on Form 8-K filed June 26, 2015) |
10.26* | | Offer Letter by and between Zimmer Biomet Holdings, Inc. and Paul Stellato dated as of April 5, 2022 (incorporated by reference to Exhibit 10.1 to the Registrant’s Current Report on Form 8-K filed May 16, 2022) |
10.27* | | Form of Confidentiality, Non-Competition and Non-Solicitation Agreement with Paul Stellato (incorporated by reference to Exhibit 10.4 to the Registrant’s Current Report on Form 8-K filed May 16, 2022) |
10.28* | | Form of Change in Control Severance Agreement with Mark Bezjak (incorporated by reference to Exhibit 10.54 to the Registrant’s Annual Report on Form 10-K filed February 23, 2024) |
10.29* | | Restated Zimmer Biomet Holdings, Inc. Executive Severance Plan (incorporated by reference to Exhibit 10.1 to the Registrant’s Quarterly Report on Form 10-Q filed August 6, 2018) |
10.30* | | Amendment to Restated Zimmer Biomet Holdings, Inc. Executive Severance Plan (incorporated by reference to Exhibit 10.1 to the Registrant’s Quarterly Report on Form 10-Q filed May 5, 2022) |
10.31* |
| Zimmer Biomet Holdings, Inc. Amended Stock Plan for Non-Employee Directors, as amended May 14, 2021 (incorporated by reference to Exhibit 10.2 to the Registrant’s Current Report on Form 8-K filed May 20, 2021) |
| | |
10.32* |
| Form of Restricted Stock Unit Award Letter under the Zimmer Biomet Holdings, Inc. Stock Plan for Non-Employee Directors (incorporated by reference to Exhibit 10.23 to the Registrant’s Annual Report on Form 10-K filed February 29, 2016) |
10.33* |
| Zimmer Biomet Holdings, Inc. Deferred Compensation Plan for Non-Employee Directors, as amended August 25, 2023 (incorporated by reference to Exhibit 10.6 to the Registrant’s Quarterly Report on Form 10-Q filed November 7, 2023) |
10.34* | | Form of Indemnification Agreement with Non-Employee Directors and Officers (incorporated by reference to Exhibit 10.1 to the Registrant’s Current Report on Form 8-K filed July 31, 2008) |
10.35* | | Zimmer Biomet Holdings, Inc. Executive Physical Sub Plan (incorporated by reference to Exhibit 10.47 to the Registrant’s Annual Report on Form 10-K filed February 26, 2019) |
10.36* |
| Zimmer Biomet Holdings, Inc. 2009 Stock Incentive Plan (As Amended on May 14, 2021) (incorporated by reference to Exhibit 10.1 to the Registrant’s Current Report on Form 8-K filed May 20, 2021) |
10.37* |
| Form of Nonqualified Stock Option Award Agreement (four-year vesting) under the Zimmer Biomet Holdings, Inc. 2009 Stock Incentive Plan (incorporated by reference to Exhibit 10.32 to the Registrant’s Annual Report on Form 10-K filed February 21, 2020) |
10.38* | | Form of Nonqualified Stock Option Award Agreement (two-year vesting) under the Zimmer Biomet Holdings, Inc. 2009 Stock Incentive Plan (incorporated by reference to Exhibit 10.37 to the Registrant’s Annual Report on Form 10-K filed February 27, 2018) |
10.39* | | Form of Nonqualified Stock Option Award Agreement (three-year vesting) under the Zimmer Biomet Holdings, Inc. 2009 Stock Incentive Plan (incorporated by reference to Exhibit 10.34 to the Registrant’s Annual Report on Form 10-K filed February 25, 2022) |
10.40* | | Form of Performance-Based Restricted Stock Unit Award Agreement (2022) under the Zimmer Biomet Holdings, Inc. 2009 Stock Incentive Plan (incorporated by reference to Exhibit 10.38 to the Registrant’s Annual Report on Form 10-K filed February 25, 2022) |
10.41* | | Form of Restricted Stock Unit Award Agreement (four-year vesting) under the Zimmer Biomet Holdings, Inc. 2009 Stock Incentive Plan (incorporated by reference to Exhibit 10.38 to the Registrant’s Annual Report on Form 10-K filed February 21, 2020) |
10.42* | | Form of Restricted Stock Unit Award Agreement (three-year vesting) under the Zimmer Biomet Holdings, Inc. 2009 Stock Incentive Plan (incorporated by reference to Exhibit 10.40 to the Registrant’s Annual Report on Form 10-K filed February 25, 2022) |
10.43* | | Form of Restricted Stock Unit Award Agreement (two-year cliff vesting) under the Zimmer Biomet Holdings, Inc. 2009 Stock Incentive Plan (incorporated by reference to Exhibit 10.2 to the Registrant's Quarterly Report on Form 10-Q filed August 6, 2018) |
10.44 | | Zimmer Biomet Holdings, Inc. Employee Stock Purchase Plan, as amended and restated effective May 10, 2024 (incorporated by reference to Exhibit 10.1 to the Registrant’s Current Report on Form 8-K filed May 15, 2024) |
10.45 | | Tax Matters Agreement, dated as of March 1, 2022, by and between Zimmer Biomet Holdings, Inc. and ZimVie Inc. (incorporated by reference to Exhibit 10.1 to the Registrant’s Current Report on Form 8-K filed March 1, 2022) |
10.46 | | Transition Services Agreement, dated as of March 1, 2022, by and between Zimmer Biomet Holdings, Inc. and ZimVie Inc. (incorporated by reference to Exhibit 10.3 to the Registrant’s Current Report on Form 8-K filed March 1, 2022) |
10.47 | | Intellectual Property Matters Agreement, dated as of March 1, 2022, by and between Zimmer Biomet Holdings, Inc. and ZimVie Inc. (incorporated by reference to Exhibit 10.4 to the Registrant’s Current Report on Form 8-K filed March 1, 2022) |
10.48 | | Transition Manufacturing and Supply Agreement, dated as of March 1, 2022, by and between Zimmer, Inc. and ZimVie Inc. (incorporated by reference to Exhibit 10.6 to the Registrant’s Current Report on Form 8-K filed March 1, 2022) |
10.49 | | Reverse Transition Manufacturing and Supply Agreement, dated as of March 1, 2022, by and between Zimmer, Inc. and ZimVie Inc. (incorporated by reference to Exhibit 10.7 to the Registrant’s Current Report on Form 8-K filed March 1, 2022) |
10.50 | | Transitional Trademark License Agreement, dated as of March 1, 2022, by and between Zimmer Biomet Holdings, Inc. and ZimVie Inc. (incorporated by reference to Exhibit 10.8 to the Registrant’s Current Report on Form 8-K filed March 1, 2022) |
| | |
10.51 | | Five-Year Revolving Credit Agreement, dated as of June 28, 2024, among Zimmer Biomet Holdings, Inc., the lenders party thereto and JPMorgan Chase Bank, N.A., as administrative agent (incorporated by reference to Exhibit 10.1 to the Registrant’s Current Report on Form 8-K filed July 1, 2024) |
10.52 | | 364-Day Revolving Credit Agreement, dated as of June 28, 2024, among Zimmer Biomet Holdings, Inc., the lenders party thereto and JPMorgan Chase Bank, N.A., as administrative agent (incorporated by reference to Exhibit 10.2 to the Registrant’s Current Report on Form 8-K filed July 1, 2024) |
19 | | Zimmer Biomet Holdings, Inc. Stock Trading Policy, effective April 26, 2023 |
21 | | List of Subsidiaries of Zimmer Biomet Holdings, Inc. |
23 | | Consent of PricewaterhouseCoopers LLP |
31.1 | | Certification pursuant to Rule 13a-14(a)/15d-14(a) of the Securities Exchange Act of 1934 of the Chief Executive Officer, as adopted pursuant to Section 302 of the Sarbanes-Oxley Act of 2002 |
31.2 | | Certification pursuant to Rule 13a-14(a)/15d-14(a) of the Securities Exchange Act of 1934 of the Chief Financial Officer, as adopted pursuant to Section 302 of the Sarbanes-Oxley Act of 2002 |
32 | | Certification pursuant to 18 U.S.C. Section 1350, as adopted pursuant to Section 906 of the Sarbanes-Oxley Act of 2002 |
+ Certain schedules and exhibits have been omitted pursuant to Item 601(a)(5) of Regulation S-K. A copy of any omitted schedule or exhibit will be furnished supplementally to the SEC upon request; provided, however, that the parties may request confidential treatment pursuant to Rule 24b-2 of the Securities Exchange Act of 1934, as amended, for any document so furnished.
* Management contract or compensatory plan or arrangement.
Item 16. Form 10-K Summary
None
SIGNATURES
Pursuant to the requirements of Section 13 or 15(d) of the Securities Exchange Act of 1934, the registrant has duly caused this report to be signed on its behalf by the undersigned, thereunto duly authorized.
| | | | |
| | ZIMMER BIOMET HOLDINGS, INC. |
| | | | |
| | By: | | /s/ Ivan Tornos |
Dated: February 25, 2025 | | | | Ivan Tornos |
| | | | President and Chief Executive Officer |
Pursuant to the requirements of the Securities Exchange Act of 1934, this report has been signed below by the following persons on behalf of the registrant and in the capacities and on the dates indicated.
| | | | |
SIGNATURE | | TITLE | | DATE |
/s/ Ivan Tornos | | President, Chief Executive Officer and Director | | February 25, 2025 |
Ivan Tornos | | (Principal Executive Officer) | | |
| | | | |
/s/ Suketu Upadhyay | | Chief Financial Officer and Executive Vice President - Finance, Operations and Supply Chain | | February 25, 2025 |
Suketu Upadhyay | | (Principal Financial Officer) | | |
| | | | |
/s/ Paul Stellato | | Vice President, Controller and Chief Accounting | | February 25, 2025 |
Paul Stellato | | Officer (Principal Accounting Officer) | | |
| | | | |
/s/ Christopher Begley | | Director | | February 25, 2025 |
Christopher Begley | | | | |
| | | | |
/s/ Betsy Bernard | | Director | | February 25, 2025 |
Betsy Bernard | | | | |
| | | | |
/s/ Michael Farrell | | Director | | February 25, 2025 |
Michael Farrell | | | | |
| | | | |
/s/ Robert Hagemann | | Director | | February 25, 2025 |
Robert Hagemann | | | | |
| | | | |
/s/ Arthur Higgins | | Director | | February 25, 2025 |
Arthur Higgins | | | | |
| | | | |
/s/ Maria Teresa Hilado | | Director | | February 25, 2025 |
Maria Teresa Hilado | | | | |
| | | | |
/s/ Syed Jafry | | Director | | February 25, 2025 |
Syed Jafry | | | | |
| | | | |
/s/ Sreelakshmi Kolli | | Director | | February 25, 2025 |
Sreelakshmi Kolli | | | | |
| | | | |
/s/ Devdatt Kurdikar | | Director | | February 25, 2025 |
Devdatt Kurdikar | | | | |
| | | | |
/s/ Louis A. Shapiro | | Director | | February 25, 2025 |
Louis A. Shapiro | | | | |
| | | | |
| | | | |
| | | | |