Exhibit 99.1

| Fidelity National Information Services Investor Day May 28, 2008 |

| Forward-Looking Statements This presentation contains forward-looking statements that involve a number of risks and uncertainties. Statements that are not historical facts, including statements about our beliefs and expectations, are forward- looking statements. Forward-looking statements are based on management's beliefs, as well as assumptions made by, and information currently available to, management. Because such statements are based on expectations as to future economic performance and are not statements of fact, actual results may differ materially from those projected. We undertake no obligation to update any forward-looking statements, whether as a result of new information, future events or otherwise. The risks and uncertainties which forward-looking statements are subject to include, but are not limited to: risks associated with the proposed spin-off of the Lender Processing Services (LPS) segment by FIS, including the ability of FIS to contribute certain LPS assets and liabilities to the entity to be spun off, the ability of LPS to obtain debt on acceptable terms and exchange that debt with certain holders of the FIS debt, obtaining government approvals, obtaining FIS Board of Directors approval, market conditions for the spin-off, and the risk that the spin-off will not be beneficial once accomplished, including as a result of unexpected dis-synergies resulting from the separation or unfavorable reaction from customers, rating agencies or other constituencies; changes in general economic, business and political conditions, including changes in the financial markets; the effects of our substantial leverage (both at FIS prior to the spin-off and at the separate companies after the spin-off), which may limit the funds available to make acquisitions and invest in our business; the risks of reduction in revenue from the elimination of existing and potential customers due to consolidation in the banking, retail and financial services industries; failures to adapt our services to changes in technology or in the marketplace; adverse changes in the level of real estate activity, which would adversely affect certain of our businesses; our potential inability to find suitable acquisition candidates or difficulties in integrating acquisitions; significant competition that our operating subsidiaries face; the possibility that our acquisition of EFD/eFunds may not be accretive to our earnings due to undisclosed liabilities, management or integration issues, loss of customers, the inability to achieve targeted cost savings, or other factors; and other risks detailed in the "Statement Regarding Forward-Looking Information," "Risk Factors" and other sections of the Company's Form 10-K and other filings with the Securities and Exchange Commission. 3 |

| Agenda Strategic Overview Bill Foley Business Overview Lee Kennedy TPS Overview Gary Norcross/ Management Team FIS/LPS Sum-of-the-Parts Jeff Carbiener TPS Financial Summary George Scanlon Q&A Panel Lunch LPS Overview Jeff Carbiener/Management Team LPS Financial Summary Francis Chan Q & A Panel 5 |

| 7 7 Strategic Overview William P. Foley, II Executive Chairman |

| Strategic Initiatives M & A Summary Lender Processing Services Spin-Off Divestiture of non-strategic assets - Gaming - Credit - HFN - Check Services update eFunds Acquisition Share Repurchases $250 million authorized $106 million (42%) complete 2.8 million shares 9 |

| Lender Processing Services Spin-Off Strategic Rationale Unique and distinct businesses Different customers Different markets Different management Limited ability to leverage operations, technology and product development Competing investment and resource needs Pure play advantages Reduce complexity Optimize relative holdings based on investment criteria 11 FIS and LPS Well Positioned to Succeed as Stand-Alone Public Entities |
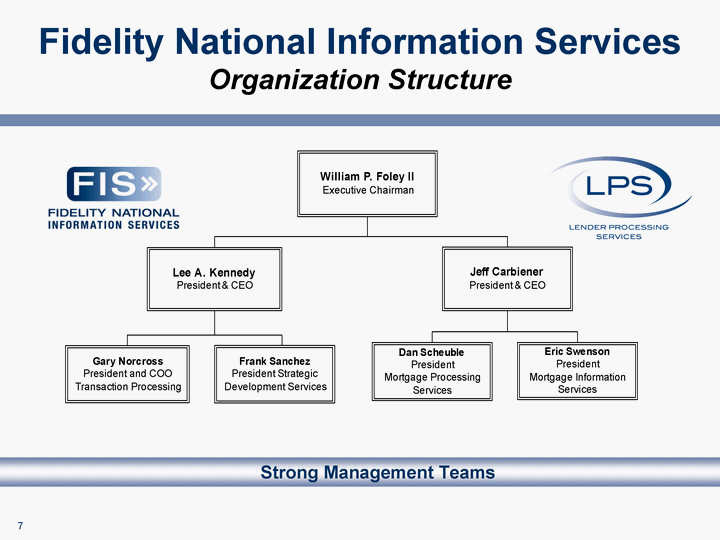
| Fidelity National Information Services Organization Structure Strong Management Teams 13 |

| Board Composition FIS William P. Foley, II Executive Chair Robert M. Clements Thomas M. Hagerty Keith W. Hughes David K. Hunt Lee A. Kennedy Richard N. Massey LPS William P. Foley, II Executive Chair Marshall Haines James K. Hunt Lee A. Kennedy Daniel D. (Ron) Lane Cary H. Thompson 15 |

| Key Dates IRS Private Letter Ruling April 14 Amended Form 10 Filing May 9 LPS Board Meeting Mid-June Approve by-laws Establish dividend policy FIS and LPS Road Shows June 16 - 27 When-issued trading Approximately 10 days prior to distribution Target effective date July 1 17 |

| 19 19 FIS Consolidated Business Overview Lee A. Kennedy President & Chief Executive Officer |

| Agenda FIS Consolidated Business Overview Competitive Position FIS Consolidated Financial Summary 21 |

| 23 One of the world's largest financial institution technology processing and services providers $4.6 billion in 2007 revenues $7.6 billion market capitalization S&P 500 Index Fortune 500 FIS Consolidated Global Market Leader |
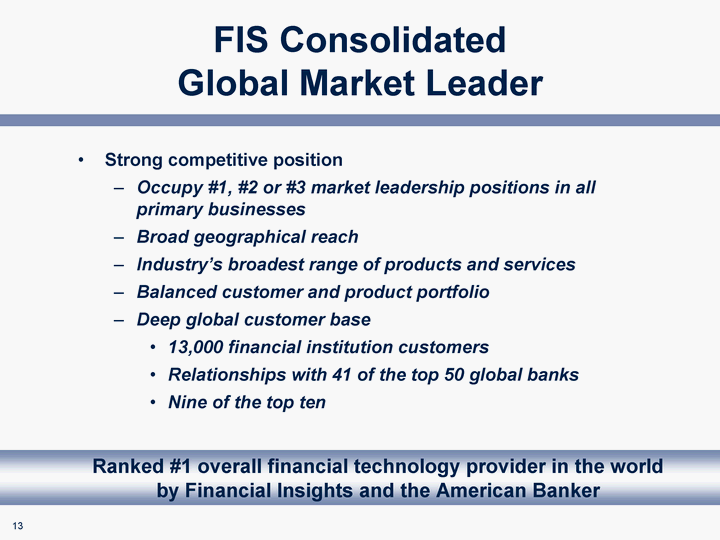
| 25 25 Strong competitive position Occupy #1, #2 or #3 market leadership positions in all primary businesses Broad geographical reach Industry's broadest range of products and services Balanced customer and product portfolio Deep global customer base 13,000 financial institution customers Relationships with 41 of the top 50 global banks Nine of the top ten Ranked #1 overall financial technology provider in the world by Financial Insights and the American Banker FIS Consolidated Global Market Leader |
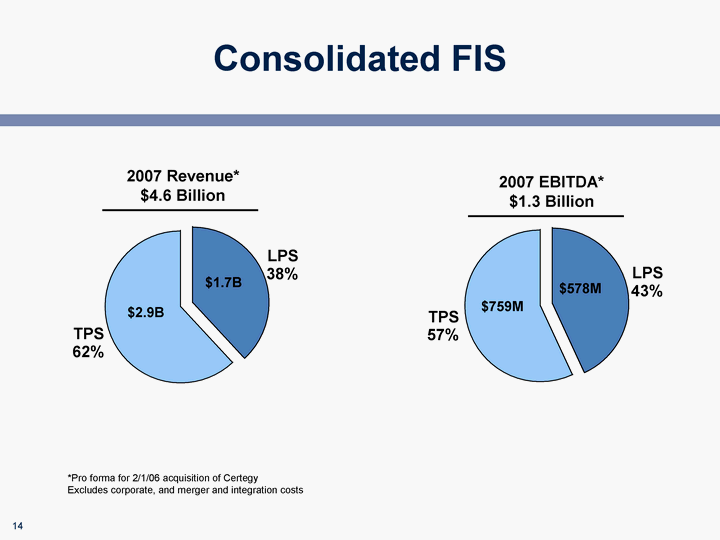
| 27 Consolidated FIS LPS TPS East 0.38 0.62 LPS TPS East 0.43 0.57 2007 Revenue* $4.6 Billion 2007 EBITDA* $1.3 Billion *Pro forma for 2/1/06 acquisition of Certegy Excludes corporate, and merger and integration costs $1.7B $2.9B $578M $759M |

| Strong Growth and Profitability 2005 2006 2007 TPS 2325.6 2549.741 2818.491 LPS 1483.5 1584.205 1761.102 2005 2006 2007 TPS 558.624 616.916 704.157 LPS 525.261 533.874 581.167 Revenue Includes corporate revenue and EBITDA. Excludes 9/12/07 acquisition of eFunds, and discontinued operations Pro forma for 2/1/06 acquisition of Certegy Excludes merger and integration costs CAGR = 9.9%(1,2) CAGR = 12.1%(1,2) TPS 9.8% LPS 9.6% TPS 12.5% LPS 5.2% EBITDA CAGR(2) CAGR(2) 29 |

| Targeted, Disciplined Acquisition Strategy 31 |
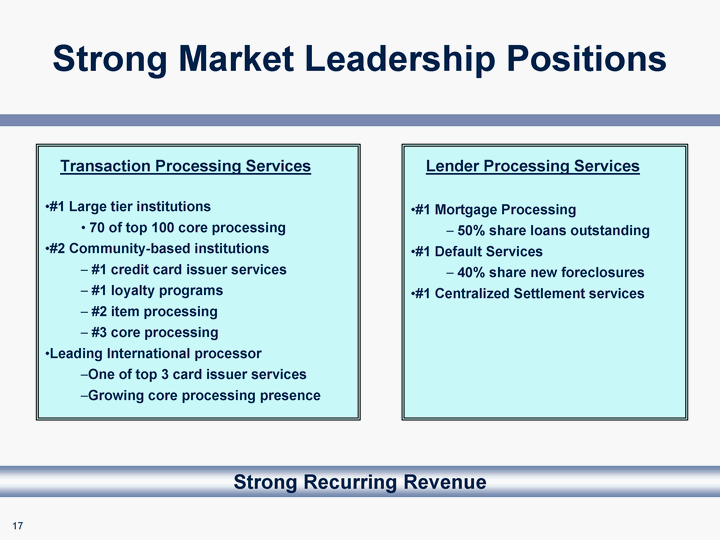
| Strong Market Leadership Positions Transaction Processing Services #1 Large tier institutions 70 of top 100 core processing #2 Community-based institutions #1 credit card issuer services #1 loyalty programs #2 item processing #3 core processing Leading International processor One of top 3 card issuer services Growing core processing presence Lender Processing Services #1 Mortgage Processing 50% share loans outstanding #1 Default Services 40% share new foreclosures #1 Centralized Settlement services Strong Recurring Revenue 33 |
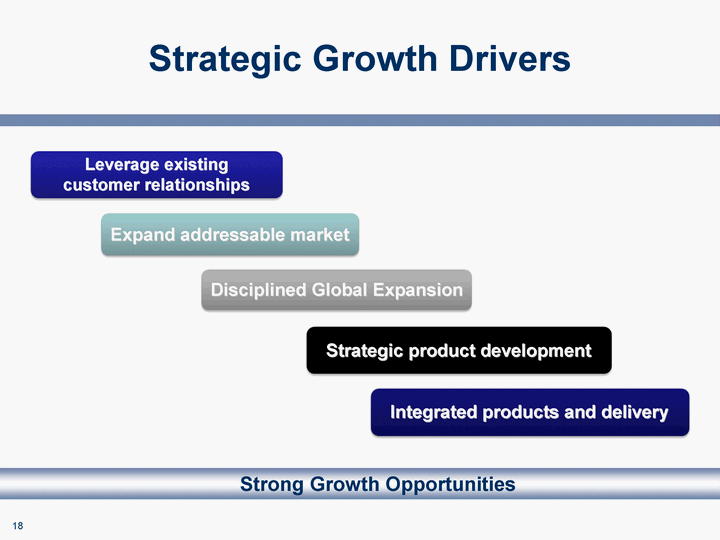
| Strategic Growth Drivers Strong Growth Opportunities 35 Leverage existing customer relationships Expand addressable market Disciplined Global Expansion Strategic product development Integrated products and delivery |

| Strong Product Capability Integrated Products and Services Transaction Processing Services Lender Processing Services Origination, Refi & Tax Services Property Valuation Services Default Management Services Analytics & Fraud Prevention Property Data and Marketing Products Secondary Market Services Mortgage Processing Platform Processing Services Core Processing Platform Credit Card Issuer Services Fraud Analytics Channel Solutions Professional Services Item Processing ATM/Debit EFT/Prepaid E-Banking/ Bill Payment Loyalty Programs 2007 Revenue: $2.9 Billion EBITDA Margin: 26.3% 2007 Revenue: $1.7 Billion EBITDA Margin: 33.3% 37 |

| Historical Business Structure Transaction Processing Services Lender Processing Services IFS EBS Int'l Technology Technology Technology Sales Sales Sales Product Development Product Development Product Development Operations Operations Operations Support Support Support Mortgage Processing Information Services Sales Sales Product Development Product Development Operations Operations Call Center/ Client Support Call Center/ Client Support Delivery Delivery 39 |

| New Operating Model (2006 - Present) Transaction Processing Services Lender Processing Services Functionally Integrated Organization 41 |
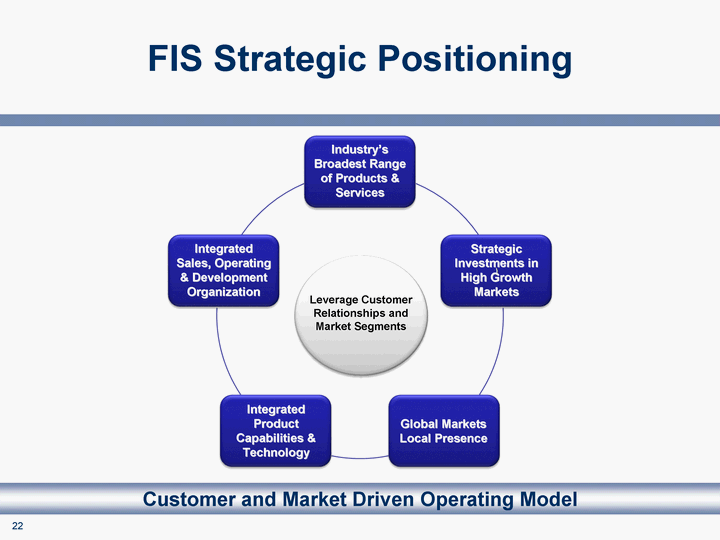
| FIS Strategic Positioning Customer and Market Driven Operating Model Leverage Customer Relationships and Market Segments Integrated Sales, Operating & Development Organization Industry's Broadest Range of Products & Services Strategic Investments in High Growth Markets Global Markets Local Presence Integrated Product Capabilities & Technology 43 |

| FIS Summary Transaction Processing Services Focused core processing and payments company Strong organic revenue growth and highly recurring revenue streams Integrated sales, service and delivery channels Lender Processing Services Industry leading core processing provider Strong organic revenue growth, margin and cash flow profile Integrated technology, data and outsourcing services Strong competitive positions Proven business models Each Business is Well Positioned to Succeed as a Stand-Alone Public Company 45 |

| 47 47 2008 Consolidated Financial Summary |

| FIS Consolidated Financial Summary 49 |

| 51 51 Transaction Processing Services Business Overview Lee A. Kennedy President & Chief Executive Officer |

| 53 Agenda Transaction Processing Services Overview Lee Kennedy Operations Overview and Strategy Gary Norcross Sales Organization Jim Susoreny International Vince Pavese Strategic Development Services John Gordon Financial Overview George Scanlon |

| 55 Strong Management Team 165 Years Combined Industry Experience |
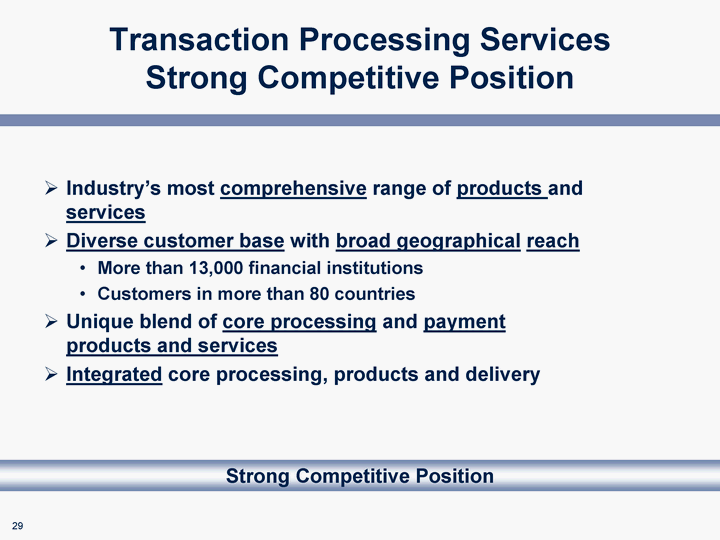
| Transaction Processing Services Strong Competitive Position Industry's most comprehensive range of products and services Diverse customer base with broad geographical reach More than 13,000 financial institutions Customers in more than 80 countries Unique blend of core processing and payment products and services Integrated core processing, products and delivery 57 Strong Competitive Position |
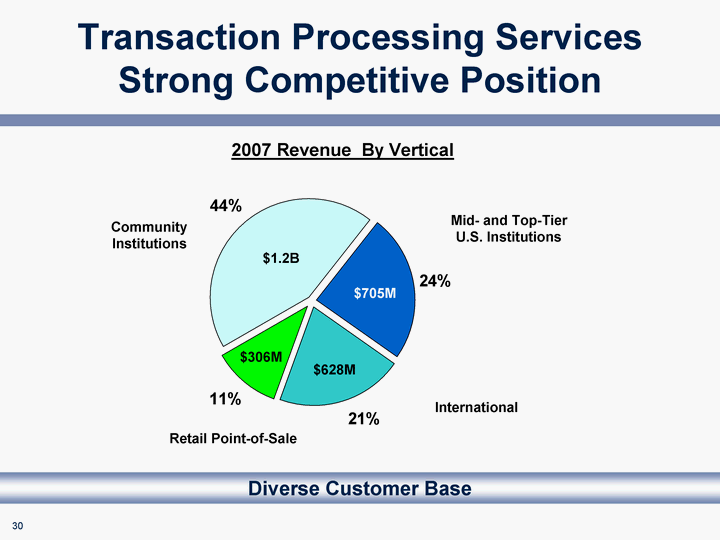
| 59 Transaction Processing Services Strong Competitive Position Community Large U.S. International Retail P.O.S. 0.44 0.24 0.21 0.11 Community Institutions Mid- and Top-Tier U.S. Institutions International Retail Point-of-Sale 2007 Revenue By Vertical Diverse Customer Base $1.2B $705M $628M $306M |

| Transaction Processing Services Strong Revenue and Profitability CAGR = 9.8%* CAGR 2005 2006 2007 Integrated Financial Solutions 1022.204 1102.419 1174.923 Enterprise Solutions 970.732 1011.874 1051.875 International 352.568 446.349 594.317 29.8% 3.0% 7.2% *Excludes 9/12/07 acquisition of eFunds, and discontinued operations 2005 2006 2007 TPS 554.6 611.3 701.3 CAGR = 12.5% Revenue EBITDA 61 |

| Priorities Leverage EFD product capability and scale ATM/Debit/Prepaid Risk Leverage product innovation Channel solutions Profile Strengthen Competitive Position Execute EFD integration $35M in-year savings Eliminate redundant costs $30M in-year savings Leverage technology across product lines and geographies Reduce capital spending Improve Operating Efficiency Leverage sales organizations Leverage customer relationships Leverage product capabilities across market segments and customer base Increase Organic Growth 63 |

| 65 65 Strategic Direction |
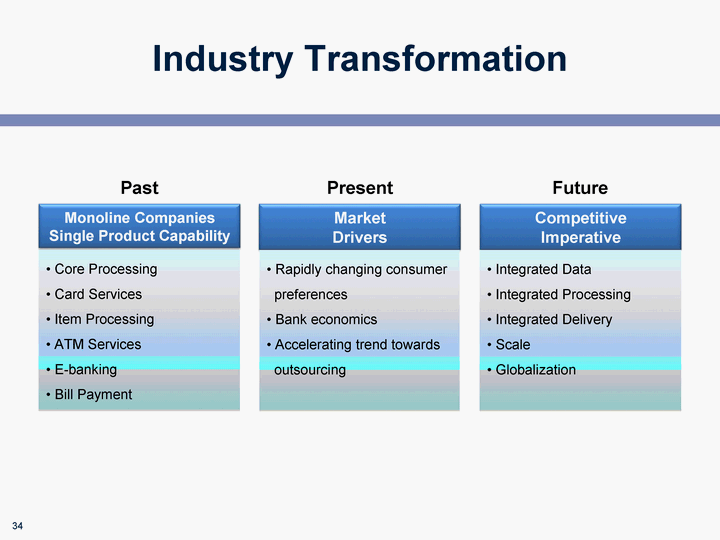
| Industry Transformation Past Monoline Companies Single Product Capability Core Processing Card Services Item Processing ATM Services E-banking Bill Payment Market Drivers Rapidly changing consumer preferences Bank economics Accelerating trend towards outsourcing Competitive Imperative Integrated Data Integrated Processing Integrated Delivery Scale Globalization Present Future 67 |
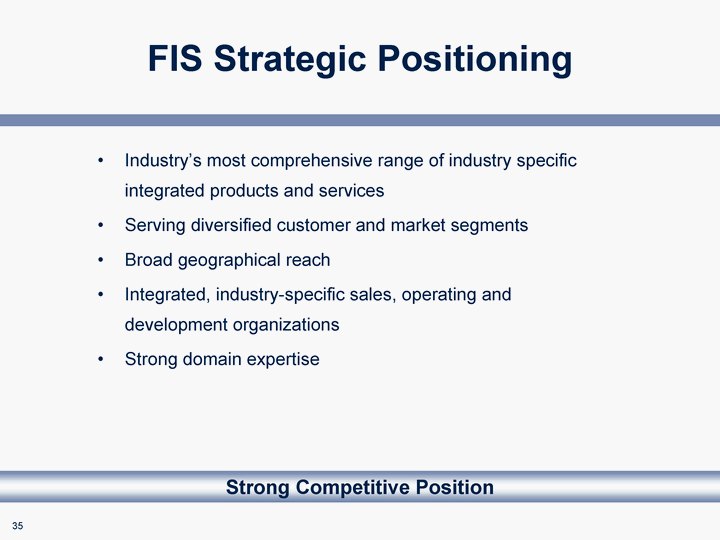
| FIS Strategic Positioning Industry's most comprehensive range of industry specific integrated products and services Serving diversified customer and market segments Broad geographical reach Integrated, industry-specific sales, operating and development organizations Strong domain expertise Strong Competitive Position 69 |

| Fidelity National Information Services Gary Norcross President and Chief Operating Officer Transaction Processing Services May 28, 2008 |

| Presentation Summary Transaction Processing Services Transaction processing services overview Business alignment and organizational structure Product and market strategy overview TPS - 2008 and beyond 73 |
| Transaction Processing Services Overview |

| Transaction Processing Services Overview 40 years of global market leadership in financial technology services $2.9 billion in annual revenues $759 million in EBITDA S&P 500 Index Strong competitive position 13,000+ financial institutions clients in over 80 countries Over 23,000 employees Leading market positions Core banking services Payment processing services Risk management services 77 |

| 55% 45% Core Processing Services Payment Processing Services Strong diversified revenue stream with continued growth in payments TPS CAGR = 9.8% Sub-segment CAGR 29.8% 3.0% 7.2% $3,000 $2,500 $2,000 $1,500 $1,000 $500 $ Integrated Financial Solutions Enterprise Solutions International 2005 2006 2007 Other 37% 51% 11% Transaction Processing Services 2007 Financial Results 79 |
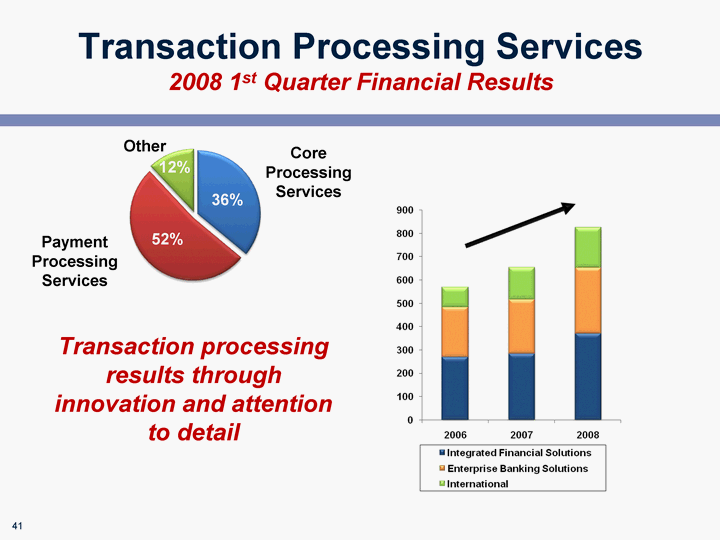
| 55% 45% Transaction Processing Services 2008 1st Quarter Financial Results Core Processing Services Payment Processing Services Transaction processing results through innovation and attention to detail Other 36% 52% 12% 81 |
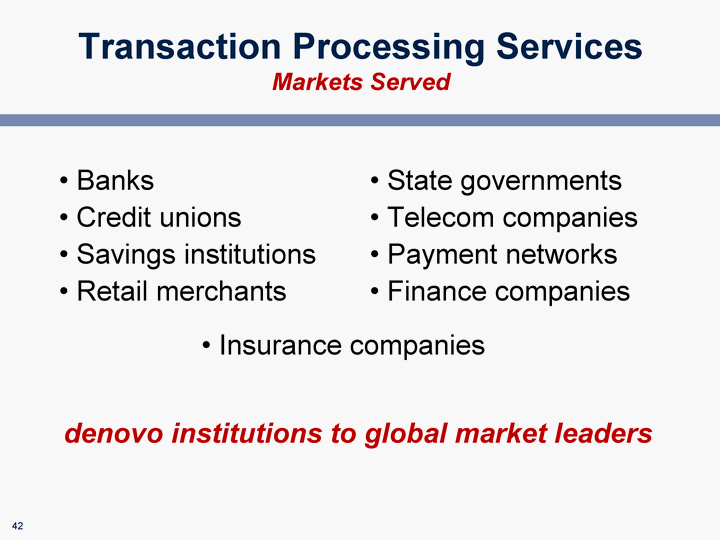
| denovo institutions to global market leaders Banks Credit unions Savings institutions Retail merchants State governments Telecom companies Payment networks Finance companies Insurance companies Transaction Processing Services Markets Served 83 |
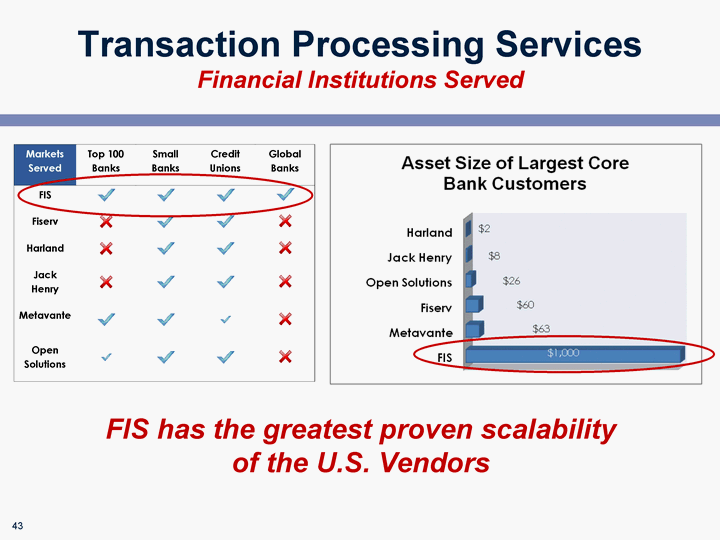
| Transaction Processing Services Financial Institutions Served FIS has the greatest proven scalability of the U.S. Vendors 85 |
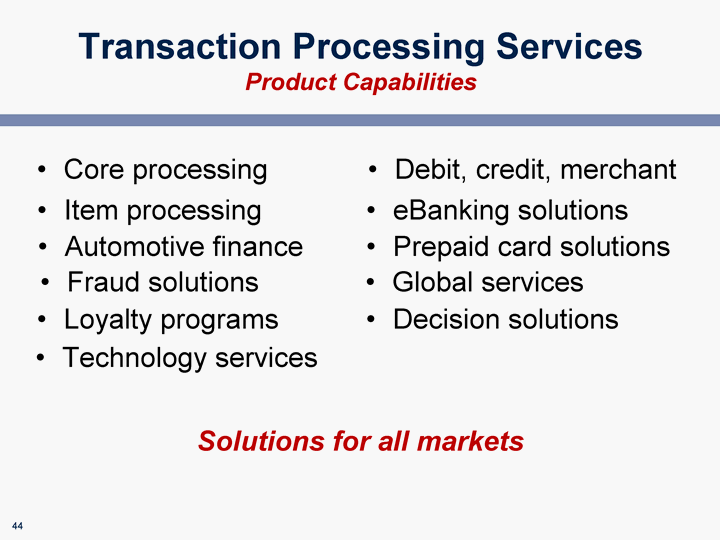
| Solutions for all markets Core processing Item processing Automotive finance Fraud solutions Loyalty programs Decision solutions Debit, credit, merchant eBanking solutions Prepaid card solutions Global services Technology services Transaction Processing Services Product Capabilities 87 |

| Transaction Processing Services Versus Our Competitors 89 |

| TPS Statistics: Domestic: 34 percent of all consumer debt 25 percent of all demand accounts More than 9 million credit card accounts More than 3.5 billion checks More than 8 million loyalty accounts More than 43 million debit cards and 18,000 ATMs International: 5 of the top 5 world banks 47 of the top 100 world banks More than 35 million cards Transaction Processing Services Processing Scale Across Six Domestic and Four International Technology Centers 91 |
| Transaction Processing Services Strong Global Relationships 93 |

| Transaction Processing Services Branded Financial Services Institutions 95 |

| Business Alignment and Organizational Structure |
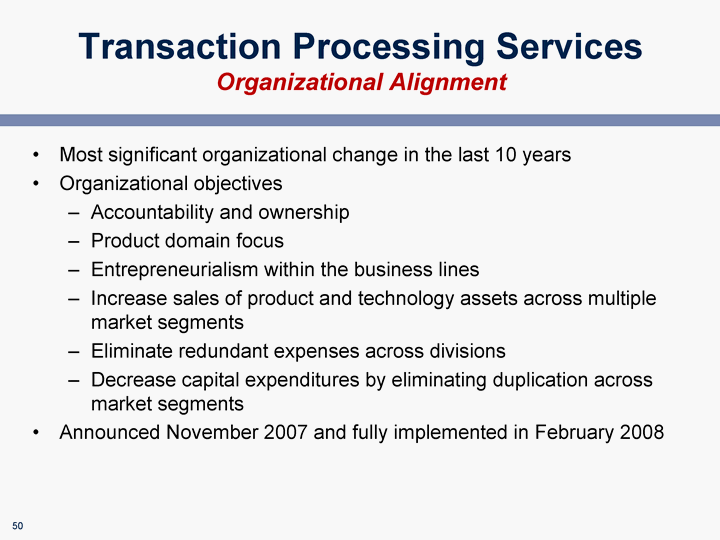
| Transaction Processing Services Organizational Alignment Most significant organizational change in the last 10 years Organizational objectives Accountability and ownership Product domain focus Entrepreneurialism within the business lines Increase sales of product and technology assets across multiple market segments Eliminate redundant expenses across divisions Decrease capital expenditures by eliminating duplication across market segments Announced November 2007 and fully implemented in February 2008 99 |
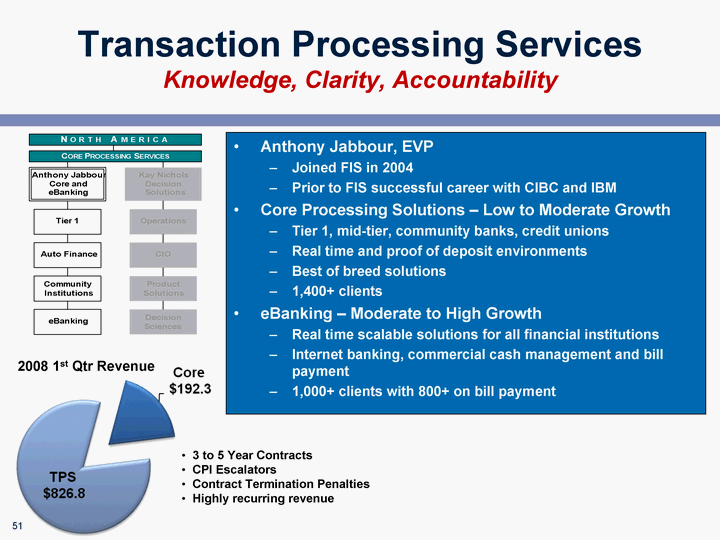
| Transaction Processing Services Knowledge, Clarity, Accountability Anthony Jabbour, EVP Joined FIS in 2004 Prior to FIS successful career with CIBC and IBM Core Processing Solutions - Low to Moderate Growth Tier 1, mid-tier, community banks, credit unions Real time and proof of deposit environments Best of breed solutions 1,400+ clients eBanking - Moderate to High Growth Real time scalable solutions for all financial institutions Internet banking, commercial cash management and bill payment 1,000+ clients with 800+ on bill payment 3 to 5 Year Contracts CPI Escalators Contract Termination Penalties Highly recurring revenue 2008 1st Qtr Revenue 101 |
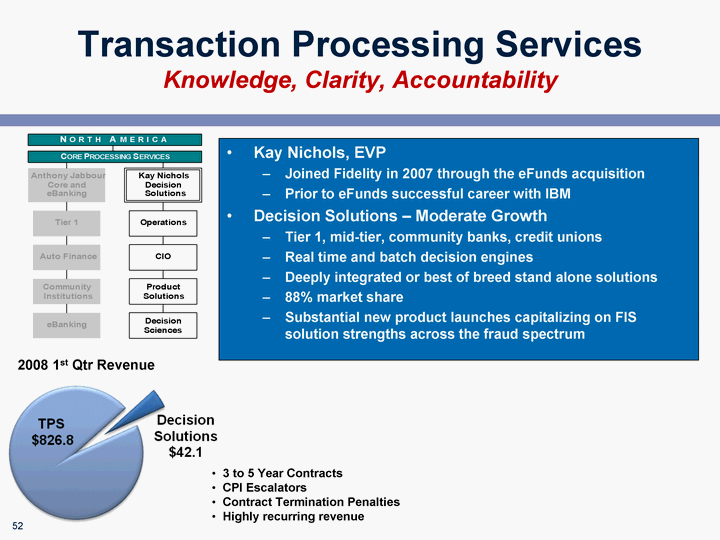
| Transaction Processing Services Knowledge, Clarity, Accountability Kay Nichols, EVP Joined Fidelity in 2007 through the eFunds acquisition Prior to eFunds successful career with IBM Decision Solutions - Moderate Growth Tier 1, mid-tier, community banks, credit unions Real time and batch decision engines Deeply integrated or best of breed stand alone solutions 88% market share Substantial new product launches capitalizing on FIS solution strengths across the fraud spectrum 3 to 5 Year Contracts CPI Escalators Contract Termination Penalties Highly recurring revenue 2008 1st Qtr Revenue 103 |

| Transaction Processing Services Knowledge, Clarity, Accountability Tony Ficarra, EVP Joined Fidelity in 2004 through Aurum acquisition Successful career with Bisys, Euronet Prepaid Credit Cards - High Growth Strong presence in retail & financial - 73M cards General reloadable and brand specific gift cards EFT/Debit Solutions - Moderate Growth Signature and PIN debit systems 2,450+ EFT Clients processing 6B transactions ATM driving and switching - 18,500+ ATMs Fraud Monitoring and Prevention - High Growth On-line real time fraud prevention Monitoring over 17M accounts Software Services - Low Growth Extensive installed base International market opportunity 3 to 5 Year Contracts CPI Escalators Contract Termination Penalties 2008 1st Qtr Revenue 105 |

| Transaction Processing Services Knowledge, Clarity, Accountability Randy Fluitt, EVP Joined FIS in 2004 with the InterCept acquisition Held senior leadership roles with Mtech, EDS and Bankline Item Processing Solutions - Low Growth Banks, savings institutions and credit unions 1,800+ clients Complete suite of distributed capture, lockbox, fraud, image and BPO products / services Print and Mail - Moderate to High Growth Financial Institutions, utilities and health care 250+ million annual mail pieces 3 to 5 Year Contracts CPI Escalators Contract termination penalties Highly recurring revenue 2008 1st Qtr Revenue 107 |

| Transaction Processing Services Knowledge, Clarity, Accountability Bob Bream, EVP Joined FIS in 2002 Prior executive leadership roles with Alliant Credit Union, VYSTAR and as a board member of CSCU, CUNA Mutual and Century Life of America Credit Card Services - Low Growth Full service customized solutions 3,000+ clients Loyalty Services - High Growth Flexible turnkey solution 10,000+ clients with 98% renewal rate Merchant - Moderate Growth Proprietary settlement system for Visa, MC and Discover 400+ clients , 30,000+ merchants 3 to 5 Year Contracts CPI Escalators Contract termination penalties Highly recurring revenue 2008 1st Qtr Revenue 109 |

| Transaction Processing Services Knowledge, Clarity, Accountability Jim Susoreny, EVP Joined FIS in 2002 Prior leadership roles with IBM and Regency Systems Sales Industry leader bringing rewarding new concepts and results to FIS Single sales organization implementation Continuous outpacing the industry in cross sales results Record breaking year over year total contract value sales results Marketing Unified FIS brand and messaging Solution packaging and promotions to augment end user sales by our clients 111 |
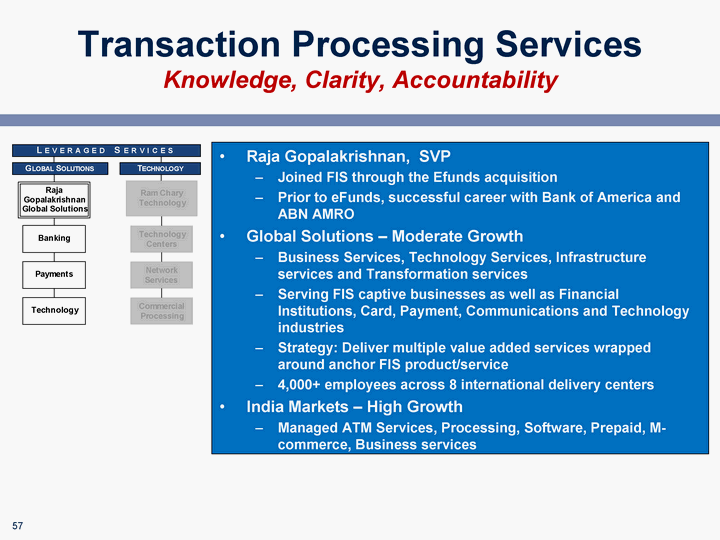
| Transaction Processing Services Knowledge, Clarity, Accountability Raja Gopalakrishnan, SVP Joined FIS through the Efunds acquisition Prior to eFunds, successful career with Bank of America and ABN AMRO Global Solutions - Moderate Growth Business Services, Technology Services, Infrastructure services and Transformation services Serving FIS captive businesses as well as Financial Institutions, Card, Payment, Communications and Technology industries Strategy: Deliver multiple value added services wrapped around anchor FIS product/service 4,000+ employees across 8 international delivery centers India Markets - High Growth Managed ATM Services, Processing, Software, Prepaid, M- commerce, Business services 113 |

| Ram Chary, SVP Joined FIS through the acquisition of eFunds in 2007 Prior career with IBM Global Solutions Commercial Technology - High Growth Infrastructure and managed operations outsourcing Unique client relationships Leverages FIS Technology Skills and Capabilities Fidelity Technology Line-of-business support from Fidelity Data Centers Mainframe processing and real-time transaction processing Home-grown internal applications, messaging and portals Extensive Network Infrastructure Transaction Processing Services Knowledge, Clarity, Accountability 115 |

| Transaction Processing Services Knowledge, Clarity, Accountability Vince Pavese, EVP Joined FIS with the Certegy merger Prior leadership roles with Equifax International Market Presence Europe, Middle East and Africa Asia Pacific Latin America International Product Offerings Core bank processing Card issuer processing Risk management Business process outsourcing 10,000+ employees 3 to 5 Year Contracts Contract Termination Penalties Combination of recurring and license fee revenue 2008 1st Qtr Revenue 117 |

| Product Strategy Overview |
| To deploy the broadest most comprehensive product suite in the financial services industry Building and enhancing our product suite A leader in the industry regarding product development Advantages to Product Development: Leveraging our historical investment Consistent technology and architecture deployment Direct input from our clients High sales penetration in current and future clients Disadvantages to Product Development: Speed to market Domain expertise on ever increasing product breadth Transaction Processing Services Product Strategy 121 |

| To deploy the broadest most comprehensive product suite in the financial services industry Buying new products to increase our product suite A leader in the industry regarding acquisitions of products and services Provide market leading products for existing clients and markets To expand our capabilities into new financial services markets Advantages to Acquisitions: Speed to market Increasing domain expertise Increased profit opportunities through expense synergies Immediate cross sell opportunities into our existing client base Disadvantages to Acquisitions: Company integration costs and distractions Cultural challenges Transaction Processing Services Product Strategy 123 |
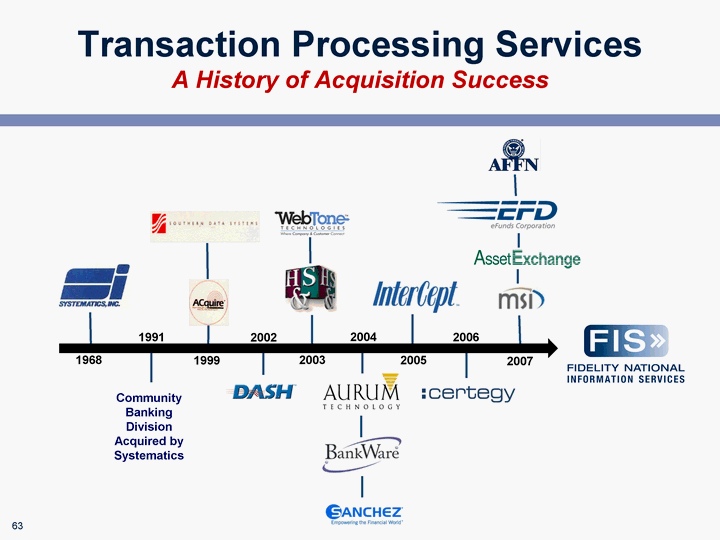
| Community Banking Division Acquired by Systematics 1991 1999 2002 2003 2004 2005 2006 1968 2007 Transaction Processing Services A History of Acquisition Success 125 |
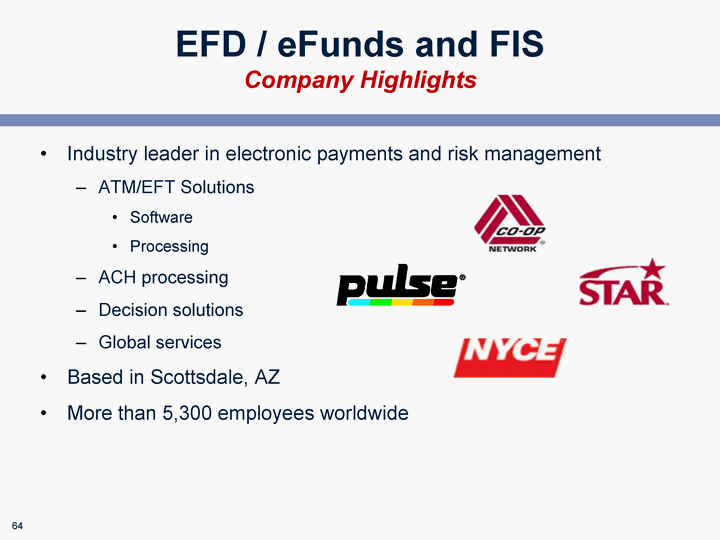
| Industry leader in electronic payments and risk management ATM/EFT Solutions Software Processing ACH processing Decision solutions Global services Based in Scottsdale, AZ More than 5,300 employees worldwide EFD / eFunds and FIS Company Highlights 127 |

| Greater product capability with minimal overlap Highly recurring revenue stream Accretive to cash EPS in year 1 $65M in projected cost savings Strong cross-sell opportunities Strengthens competitive position Client expansion with substantial overlap Additional offshore capabilities (BPO and IT) EFD / eFunds and FIS Strategic Rationale 129 |
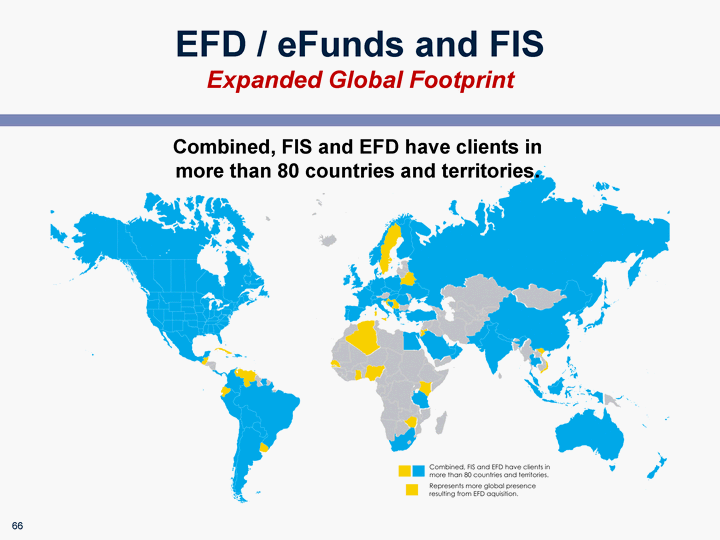
| Combined, FIS and EFD have clients in more than 80 countries and territories. EFD / eFunds and FIS Expanded Global Footprint 131 |
| Transaction Processing Services Acquisition Integration - The FIS Difference Value vs. Size Strategy Seeking the best for the business Objective driven integration Synergy attainment Sales and Product Integration Client Retention Leadership and expertise retention Cross business incentives maximizing revenues and profits Cross Sell Priority Aggressive analysis and execution Recognizing and seizing upon new solution creation 133 |
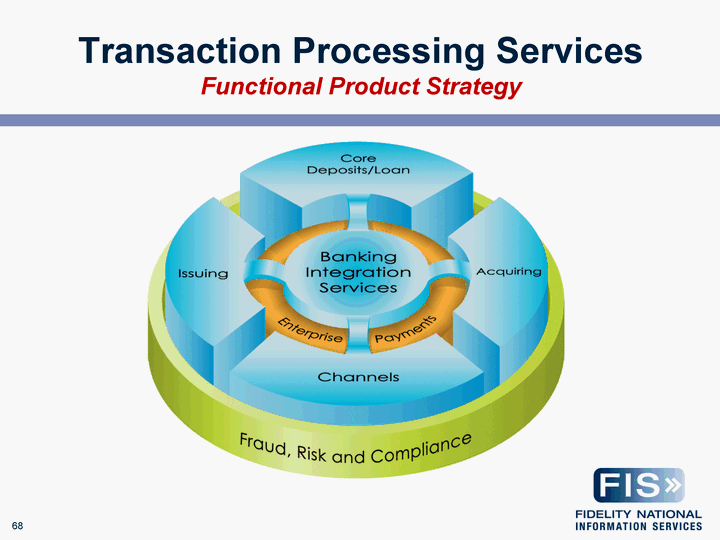
| 135 Transaction Processing Services Functional Product Strategy 135 |
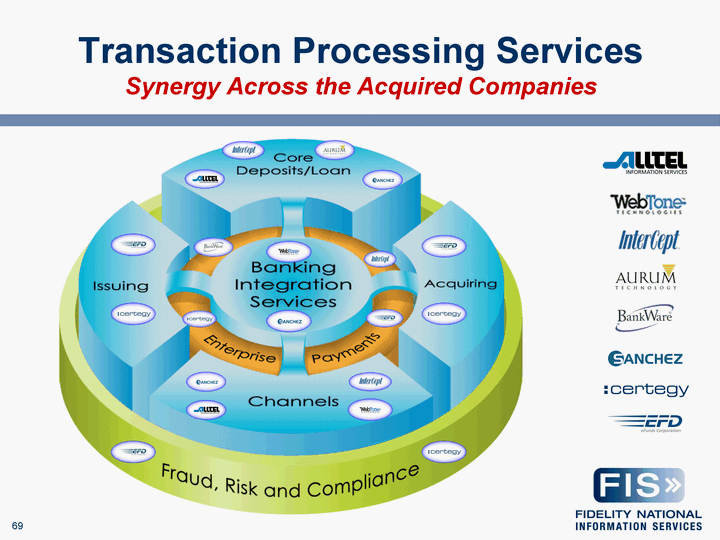
| 137 Transaction Processing Services Synergy Across the Acquired Companies 137 |

| Transaction Processing Services 2008 and Beyond Strengthen defenses around "commoditization" EFT networks Item processing capture centers Increase prepaid and other payment strengths Mobile banking ACH Loyalty over "everything" via householding Right - shoring as a service with our solutions 141 |
| Transaction Processing Services 2008 and Beyond Strengthen fraud/analytics position "Verified by FIS" Across all touch points of institutions Capture payments at all points Remote - branch, business, home International - Evolve and standardize Mitigate risk through structured partnership arrangements Acquisitions that round out business function and are consistent with our prior strategy Expense reductions through Business Process Outsourcing 143 |
| Transaction Processing Services The TPS Difference TPS has made the necessary investments to continue to grow Clear, accountable business lines under one business umbrella Diversified, long term and balanced recurring revenue stream Most comprehensive ... Product suite with leading edge technology Market coverage with minimal product overlap Relationships with global to denovo financial institutions as well as associations, leagues and retailers Single Sales Force with a 360 client view Continuous product portfolio expansion and integration Constant focus at every level on financials Our strategy has given us the broadest product and market scale with the most growth upside of any provider 145 |

| Fidelity National Information Services Jim Susoreny EVP, Sales and Marketing Transaction Processing Services May 28, 2008 |
| Agenda FIS historical and current sales perspective FIS Sales and Marketing organization chart FIS go to market strategy Cross-sell dynamics and metrics FIS Sales pipeline 149 |
| Historical Sales Perspective In recent history, FIS was a very different company from today Rigid divisional boundaries Multiple domestic sales forces Minimal focus on "new account sales" In need of significant product rounding Minimal next generation product strategy Fraction of our current clients for cross-sell lift Minimal focus on cross-sell into the client base Minimal focus on third-party sales and channel distribution 151 |
| Current Sales Perspective Today's FIS organization No divisional boundaries Single, united domestic sales force Over 13,000 domestic clients for cross-sell lift Industries largest breadth of solutions Industry leading integration methodologies Next generation technology deliverable Dedicated internal sales disciplines New account sales production (hunters) Client management cross-sell (farmers) Product sales specialists (industry experts) Dedicated third-party distribution management 153 |
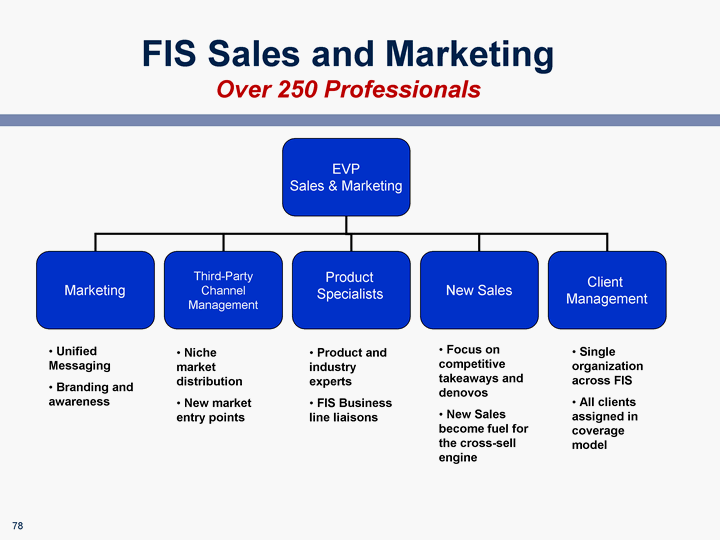
| FIS Sales and Marketing Over 250 Professionals EVP Sales & Marketing Marketing Third-Party Channel Management Product Specialists New Sales Client Management Product and industry experts FIS Business line liaisons Focus on competitive takeaways and denovos New Sales become fuel for the cross-sell engine Single organization across FIS All clients assigned in coverage model Niche market distribution New market entry points Unified Messaging Branding and awareness 155 |

| Go to Market Strategy Compete in every qualified contractual opportunity New business, cross-sell, third-party channels and non-FI Product breadth supports new business and cross-sell Integration capabilities drive cross-sell into the client base Contract for multi-year term, minimum commitments, termination penalties Turn client tactical product decision events into strategic organization decisions Leverage third-party distribution channel Low-end market Specified geographies Industry niches 157 |
| Go to Market Strategy Sales Channel Distribution Strategy Banks and Thrifts Banking Association Relationships Bankers Bank Relationships Credit Unions State Credit Union Leagues Cooperatives Industry Associations All Financial Institutions Ancillary Technology Relationships Consulting Organizations Data Center Relationships 159 |
| Go to Market Strategy Non-FI Industry Sales Focus Electronic payments software clients Branded payment networks Check processing service providers Merchants & ATM ISO providers Services to other Financial Institutions "group service providers" Prepaid/stored value cards & services Electronic debit/credit services Credit bureau/fraud management services Focus on Expansion in Specific Industry Verticals Utilities/telecommunications/transportation/petroleum Insurance/Brokerage 161 |

| Go to Market Results Market Leadership Core Almost 30% of all denovo market every year and increasing competitive take-away ratios year over year Decision Solutions Go to company for regulatory compliance and enterprise fraud management ATM, EFT, PrePaid Scale, network potential and growing capabilities of PrePaid Card Item Processing Ability to capture transactions any time, anywhere, any how Credit Card & Loyalty Wrap loyalty not only over our cards, but be able to household 163 |

| Go to Market Results Market Leadership Core Almost 30% of all denovo market every year and increasing competitive take-away ratios year over year Decision Solutions Go to company for regulatory compliance and enterprise fraud management ATM, EFT, PrePaid Scale, network potential and growing capabilities of PrePaid Card Item Processing Ability to capture transactions any time, anywhere, any how Credit Card & Loyalty Wrap loyalty not only over our cards, but be able to household Better opportunity to expand our proven, successful cross-sell model 165 |
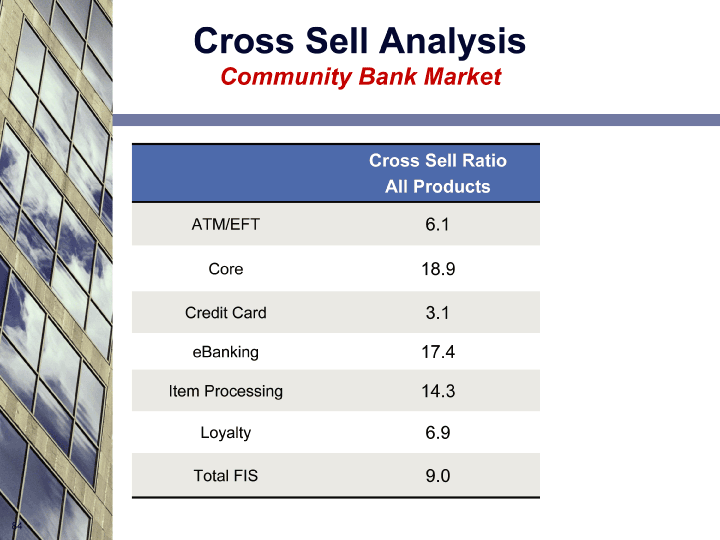
| Cross Sell Analysis Community Bank Market Cross Sell Ratio All Products ATM/EFT 6.1 Core 18.9 Credit Card 3.1 eBanking 17.4 Item Processing 14.3 Loyalty 6.9 Total FIS 9.0 167 |

| FIS "Tier One" Clients Cross-Sell Penetration Core Item Processing ATM/EFT Prepaid eBusiness Credit Card Channels Fraud/Risk FIS Installed Solutions Cross-Sell "Potential" 169 |

| Fidelity National Information Services Vince Pavese EVP, International Transaction Processing Services May 28, 2008 |

| Transaction Processing Services International Market Position Unique inventory of core banking assets Core bank processing Card issuer/acquiring services Risk management Business process outsourcing and item processing FIS scale and experience Active in established and emerging markets Banking and card cross-sell opportunities Strong integration capabilities 173 |

| Transaction Processing Services International Competitors Banking Oracle / I Flex SAP Temenos Other Regionals Cards FDC TSYS Outsourcing IBM EDS Indian Solutions (TATA) 175 |

| Transaction Processing Services Unique International Business Models Clients Banks, Insurance Companies, Finance Companies and Retailers Type of Business Traditional Branch Banking De Novo "Bank in a Box" Direct Bank Economics License Outsource / Hosted Managed Services 177 |

| Transaction Processing Services International Revenue Breakdown Payments Core 57% 43% $628 Million Annual Revenue 179 |
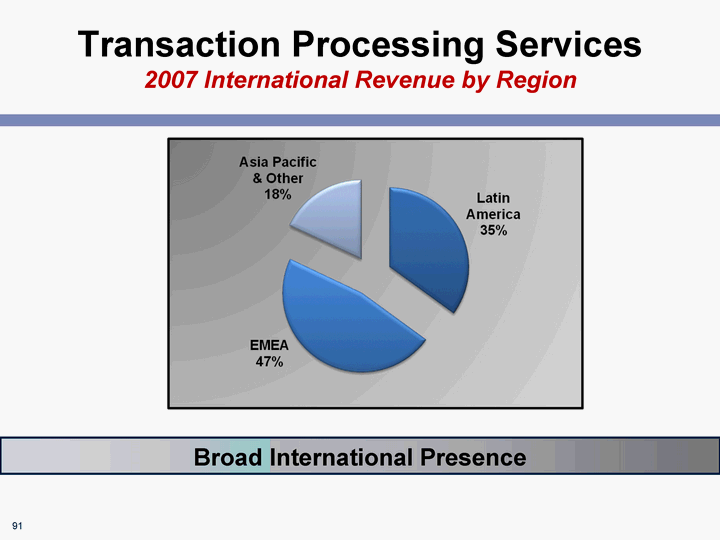
| Transaction Processing Services 2007 International Revenue by Region Broad International Presence 181 |

| Transaction Processing Services International Footprint International Footprint International Footprint 10,000 + Employees 82 Locations 183 |
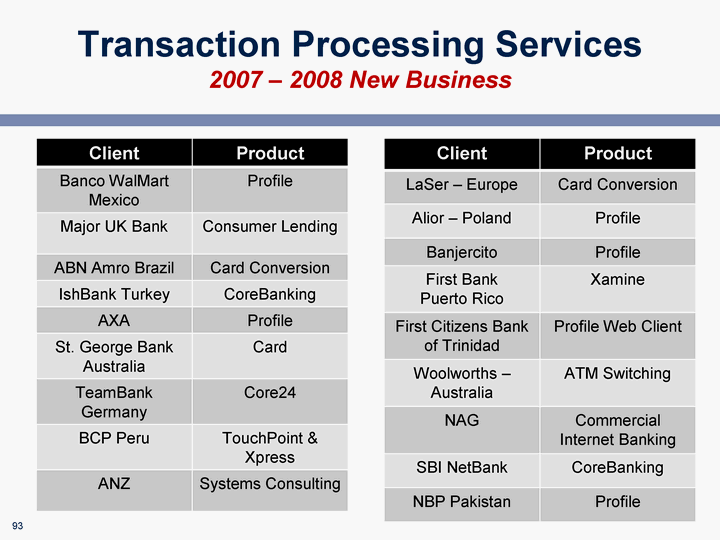
| Transaction Processing Services 2007 - 2008 New Business Client Product Banco WalMart Mexico Profile Major UK Bank Consumer Lending ABN Amro Brazil Card Conversion IshBank Turkey CoreBanking AXA Profile St. George Bank Australia Card TeamBank Germany Core24 BCP Peru TouchPoint & Xpress ANZ Systems Consulting Client Product LaSer - Europe Card Conversion Alior - Poland Profile Banjercito Profile First Bank Puerto Rico Xamine First Citizens Bank of Trinidad Profile Web Client Woolworths - Australia ATM Switching NAG Commercial Internet Banking SBI NetBank CoreBanking NBP Pakistan Profile 185 |

| Transaction Processing Services Banco Walmart - Mexico Entry into worldwide banking Aggressive timetable Required bank certification Personnel (little or no prior banking experience) Facilities Technology and systems Regulatory reporting Profile Profile Direct Financial Management System TIME FROM START UP TO OPEN DOORS: 10 MONTHS!! 187 |

| Transaction Processing Services International Lending Utility Anchor Client Complete consumer lending system Leverage existing UK footprint Leverage technology, resources and hosting expertise Compliance Time to market advantage Reduced cost of entry/pay for use Easy access to additional products and services 189 |

| Fidelity National Information Services Brazil International May 28, 2008 |

| Transaction Processing Services Brazil Update Population: 190 million Labor force: 100 million GDP World's 10th largest economy Large growing market 450 million active credit cards 205 million active debit cards Credit Card Transactions (in billions) 21% increase Strong Card Issuance and Usage Source: Brazilian Association of Credit and Service Card Companies 193 |

| Transaction Processing Services Brazil Update Joint Venture key customers: >22 million cards Bradesco: Largest non-government owned bank ABN Amro: Largest foreign bank Others: Panamericano, Itau, Unibanco, Citibank Other FIS Solutions: Item and payment processing Banking and loan solutions 195 |
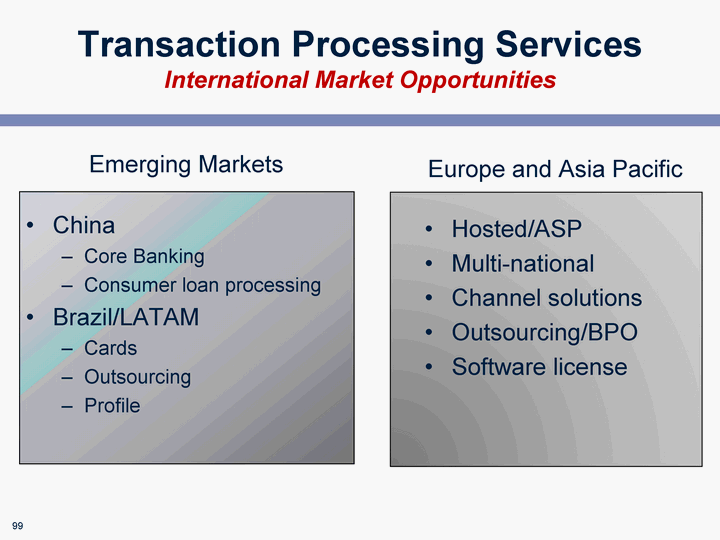
| Transaction Processing Services International Market Opportunities China Core Banking Consumer loan processing Brazil/LATAM Cards Outsourcing Profile Hosted/ASP Multi-national Channel solutions Outsourcing/BPO Software license Emerging Markets Europe and Asia Pacific 197 |

| Fidelity National Information Services John Gordon Strategic Development Services May 28, 2008 |

| Agenda Introduction Retail Banking Transformation Drivers Banks facing unprecedented challenges Market share, wallet share, cost reduction FIS Solutions Product Capability Progress Report Market Outlook Strategic Position 201 |
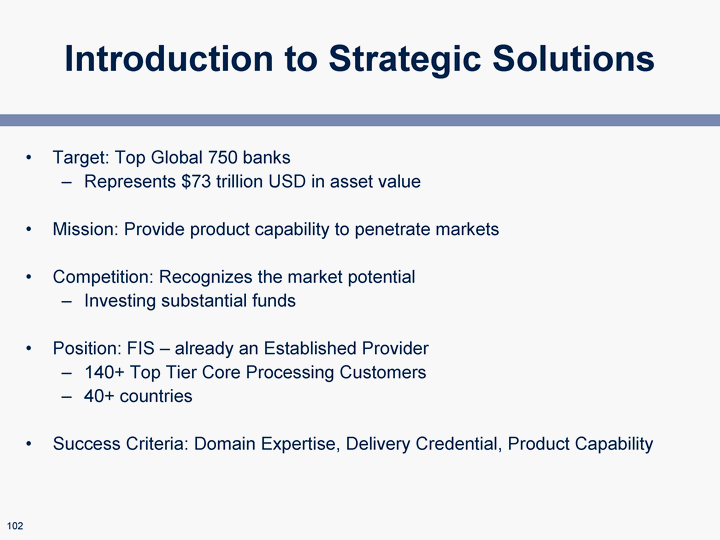
| Introduction to Strategic Solutions Target: Top Global 750 banks Represents $73 trillion USD in asset value Mission: Provide product capability to penetrate markets Competition: Recognizes the market potential Investing substantial funds Position: FIS - already an Established Provider 140+ Top Tier Core Processing Customers 40+ countries Success Criteria: Domain Expertise, Delivery Credential, Product Capability 203 |
| Agenda Introduction Retail Banking Transformation Drivers Banks facing unprecedented challenges Market share, wallet share, cost reduction FIS Solutions Product Capability Progress Report Market Outlook Strategic Position 205 |

| Retail Banking Transformation Drivers Current Bank Technology Does Not Support Model Competition Objective Customer Centricity Nimble, Integrated Infrastructure Real-time Systems 207 |

| Retail Bank Evolution Retail Bank Evolution 209 |

| Typical Retail Banking Environment 211 |

| Agenda Introduction Retail Banking Transformation Drivers Banks facing unprecedented challenges Market share, wallet share, cost reduction FIS Solutions Product Capability Progress Report Market Outlook Strategic Position 213 |

| FIS Touchpoint(tm) Customer Centric Channel Solution Customer Facing: FIS Touchpoint(tm) Channel Solutions Optimization of Sales Interactions Every Service Interaction is a Sales Interaction Consistent Decisioning Based on Customer Value Regulatory Compliance is Built-in Infrastructure is Pre-built for Intelligent Processing (not simply connectivity) 215 |
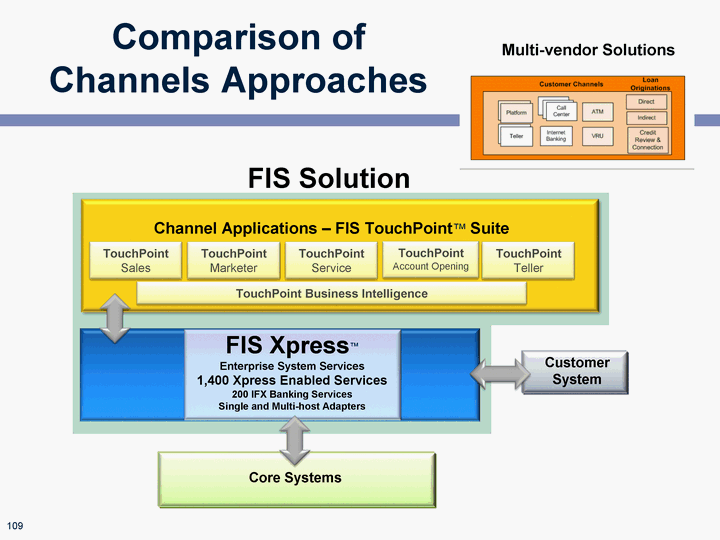
| Comparison of Channels Approaches Multi-vendor Solutions FIS Xpress(tm) Enterprise System Services 1,400 Xpress Enabled Services 200 IFX Banking Services Single and Multi-host Adapters TouchPoint Account Opening TouchPoint Teller TouchPoint Service TouchPoint Marketer TouchPoint Sales TouchPoint Business Intelligence Channel Applications - FIS TouchPoint(tm) Suite FIS Solution Customer System Core Systems 217 |

| Touchpoint(tm) Channel Solutions Drives product cross sales for new and established customers reducing churn and increasing profitability. During account opening banks have achieved opening 2x products in 50% of the time At the point of service, a major Retail US Bank achieves the following cross sell results: 50% of solicitations result in acceptance or close 20% are closed during the service transaction 219 |
| Progress Report - Touchpoint(tm) Channel Solutions 221 |

| FIS Profile(tm) Real-time Core Processing Solution Real-time Core Processing: FIS Profile(tm) Sophisticated Product Engine Dramatic IT Cost Reduction Dramatic Back Office Processing Reduction Hardened and Installed in Markets Worldwide Pre-Built User Interface, Available as Product 223 |
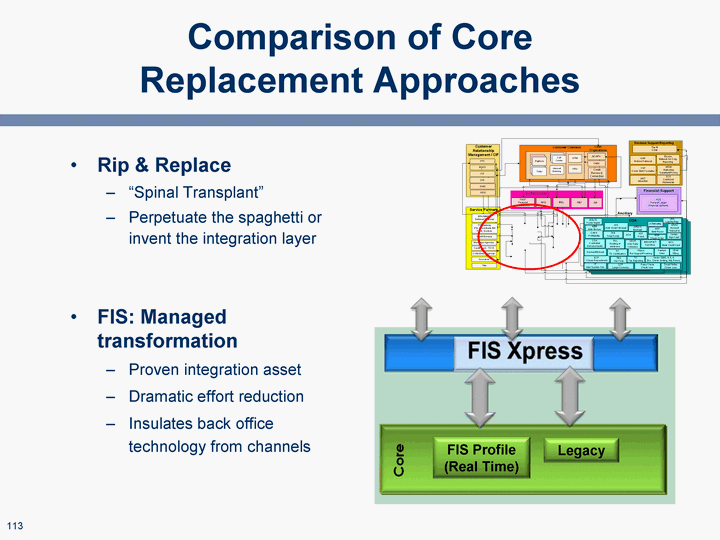
| Comparison of Core Replacement Approaches Rip & Replace "Spinal Transplant" Perpetuate the spaghetti or invent the integration layer FIS: Managed transformation Proven integration asset Dramatic effort reduction Insulates back office technology from channels FIS Profile (Real Time) Legacy 225 |
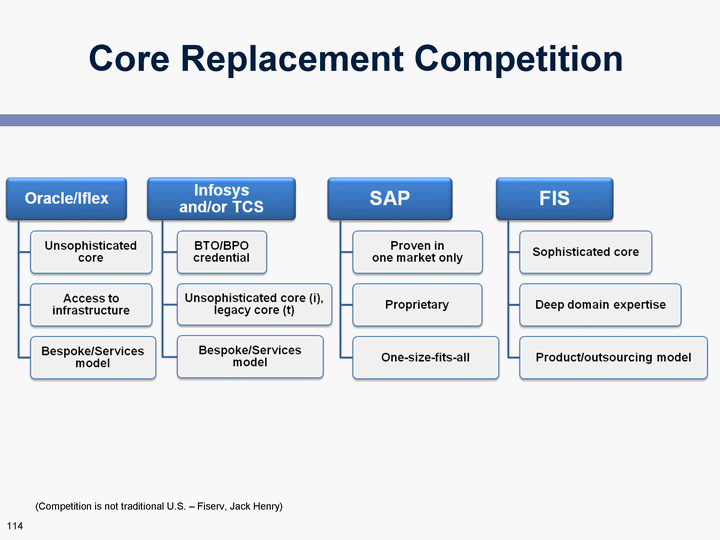
| Core Replacement Competition (Competition is not traditional U.S. - Fiserv, Jack Henry) 227 |

| Profile(tm) Core Processing Case Studies Profile(tm) customers have improved market penetration by being soonest to market with innovative products Reduced time to market from 6 months to 20 days Profile(tm) customers leveraged reduced operating cost and generally offer the most attractive deposit interest rates in their markets 229 |
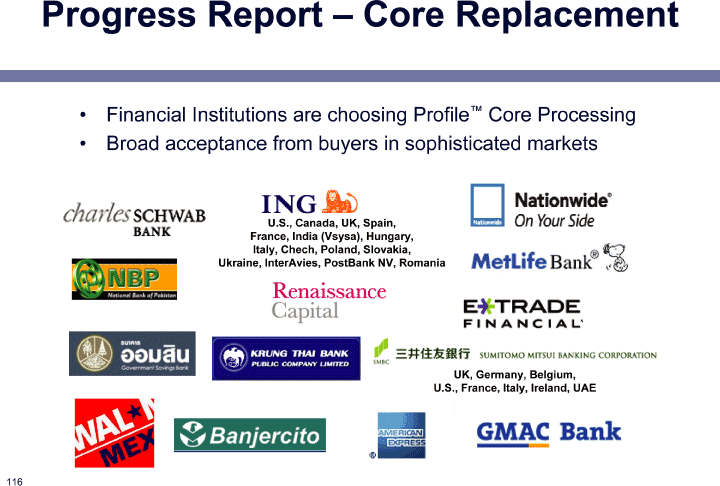
| Progress Report - Core Replacement Financial Institutions are choosing Profile(tm) Core Processing Broad acceptance from buyers in sophisticated markets UK, Germany, Belgium, U.S., France, Italy, Ireland, UAE U.S., Canada, UK, Spain, France, India (Vsysa), Hungary, Italy, Chech, Poland, Slovakia, Ukraine, InterAvies, PostBank NV, Romania 231 |

| Agenda Introduction Retail Banking Transformation Drivers Banks facing unprecedented challenges Market share, wallet share, cost reduction FIS Solutions Product Capability Progress Report Market Outlook Strategic Position 233 |
| Market Outlook Global Market Comprised of Top 750 banks Continued Traction in Touchpoint(tm) Channels $25b USD General Channels IT Spend 2008-2012 Accelerating Activity in FIS Profile(tm) Core Processing New/Cross-over Banks continue selecting FIS Profile International Banks continue selecting FIS Profile US Banks accelerate as cost pressure mounts Bottom line improvement Reduction as funding source $35b/year USD General Core Processing IT Spend 235 |

| Agenda Introduction Retail Banking Transformation Drivers Banks facing unprecedented challenges Market share, wallet share, cost reduction FIS Solutions Product Capability Progress Report Market Outlook Strategic Position 237 |

| Conclusion FIS Strategic Position FIS heavily invested in state-of-the-art solution set FIS provides substantial, proven improvement Bank efficiency, flexibility, and capability Financial Institutions have no alternative must address their aged infrastructure FIS makes transformation simple and easy Competitors aggressively trying to develop similar technology Leading edge capability competitively positions FIS TouchPoint(tm) Channels Suite FIS Profile (Real Time) Legacy 239 |

| Sum-of-the-Parts Guidance Jeff Carbiener Chief Financial Officer |

| Adjustments to 2007 Results of Operations |

| 2007 Income Statement Reconciliation |
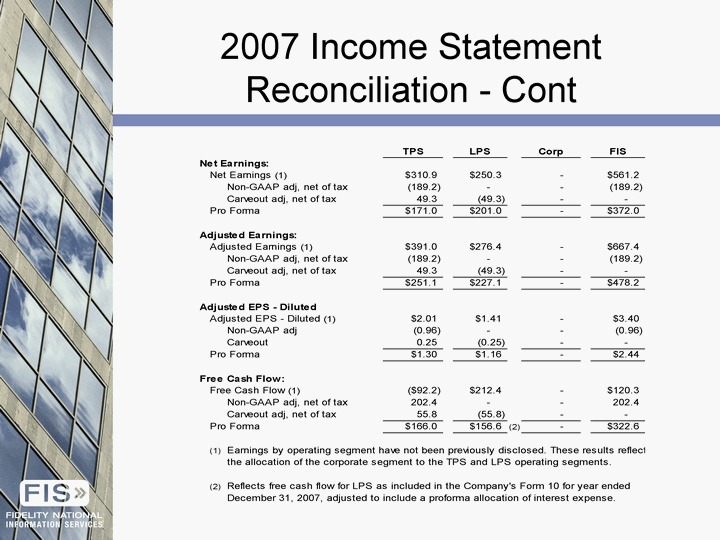
| 2007 Income Statement Reconciliation - Cont |

| 2008 Guidance Reconciliation |

| Estimated Incremental Costs |
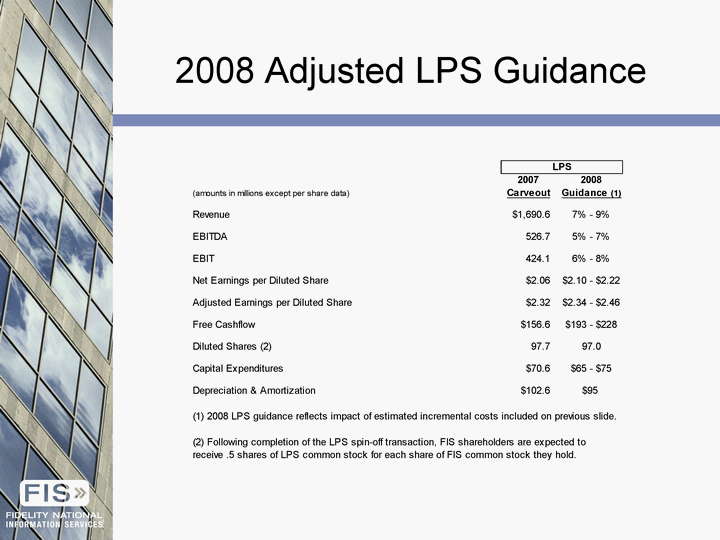
| 2008 Adjusted LPS Guidance |

| 2008 Restructuring Charges |

| Fidelity National Information Services George P. Scanlon Executive Vice President Finance |

| 3 Transaction Processing Services Broad Revenue Distribution EMEA Brazil APAC & Other U.S. 0.1 0.06 0.05 0.78 2007 Revenue by Region Community Large U.S. International Retail P.O.S. 0.44 0.24 0.21 0.11 Community Institutions Mid- and Top-Tier U.S. Institutions International Retail Point-of-Sale 2007 Revenue by Segment Diverse Customer Base Growing International Presence $1.2B $705M $628M $306M $2.2B $296M $175M $157M |

| 5 Transaction Processing Services Significant Recurring Revenue Processing & Maintenance Professional Services License, Equip, Term, Other 0.86 0.08 0.06 Processing and Maintenance Processing Services Software Maintenance Network/Interchange Fees Professional Services Other 86% Recurring Revenue 2007 Revenue $2.9 Billion $2.5B $224M $168M |
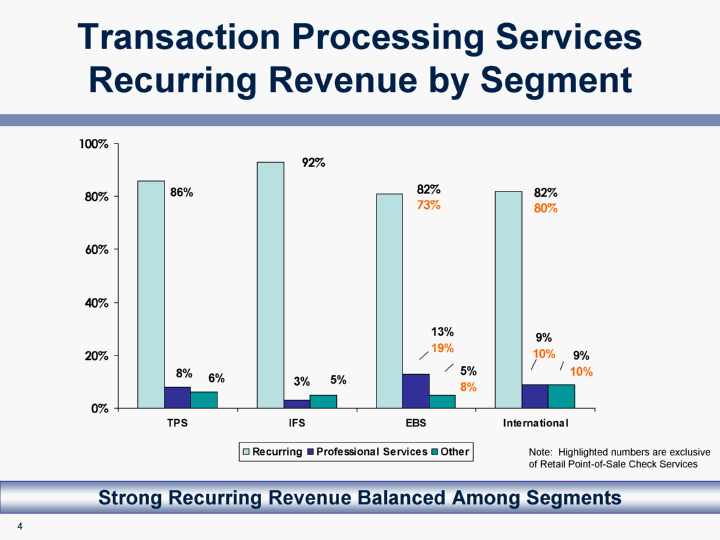
| 7 Transaction Processing Services Recurring Revenue by Segment TPS IFS EBS International Recurring 0.86 0.93 0.81 0.82 Professional Services 0.08 0.03 0.13 0.09 Other 0.06 0.05 0.05 0.09 Strong Recurring Revenue Balanced Among Segments Note: Highlighted numbers are exclusive of Retail Point-of-Sale Check Services |

| Transaction Processing Services 2007 EBITDA Margin |

| 13 Transaction Processing Services Margin Trends 2005 2006 2007 2008 (e) TPS Revenue 2310.3 2526.9 2946.1 3479.9 TPS EBITDA Margin 0.214 0.236 0.246 0.255 Primary Sources of Margin Expansion Target 90 bps improvement Tough first half comparables - second half improvement Margins rise sequentially balance of year Brazil card processing eFunds synergies Cost reductions |

| 15 Transaction Processing Services 2008 Outlook |

| 17 Transaction Processing Services Capital Expenditures by Segment 2006 2007 2008E IFS 53.105 82.133 63.048 EBS 78.617 49.958 54.819 FTS 36.251 48.778 34 Int'l 52.985 92.596 93.805 % of Revenue 0.088 0.095 0.07 Reduced Capital Intensity in 2008 (In millions) $245 $274 $221 |

| 19 Transaction Processing Services Estimated Free Cash Flow |

| 21 Transaction Processing Services Uses of Cash Investment in organic growth initiatives Debt Reduction $100 million eFunds notes retired 2/2008 $200 million Certegy notes due 9/2008 Scheduled Term A repayments 2008 - $68.5 million 2009 - $121 million 2010 - $226 million Share Repurchases $250 million buyback substantially complete by 6/30/08 $106 million completed (2.8 million shares) Targeted Acquisitions Increase scale and/or augment existing product capability Enhance long-term growth rates |

| 23 Transaction Processing Services Long-Term Growth Objectives |

| Lender Processing Services Investor Day May 28, 2008 |
| 243 Forward-Looking Statements |

| 245 Agenda Overview Jeff Carbiener Business Review Jeff Carbiener Products/Services Review Dan Scheuble Break Market Drivers Eric Swenson Financial Review Francis Chan 2008 Guidance & Long Term Outlook Jeff Carbiener Summary Jeff Carbiener Q & A All |

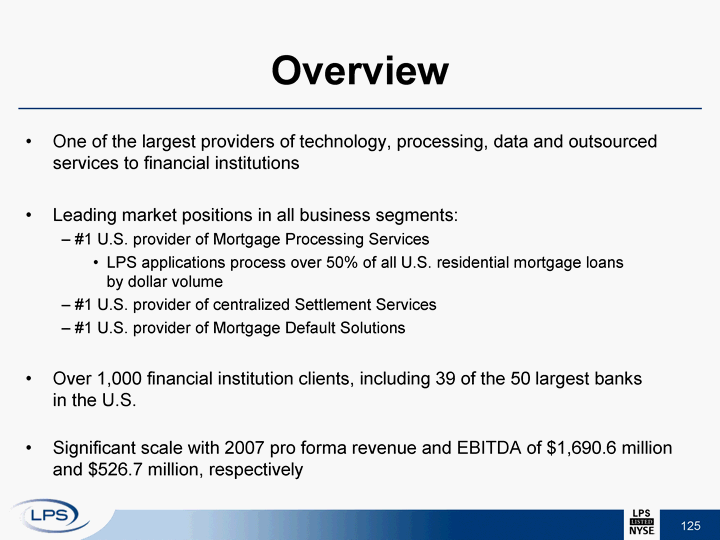
| 249 Overview One of the largest providers of technology, processing, data and outsourced services to financial institutions Leading market positions in all business segments: #1 U.S. provider of Mortgage Processing Services LPS applications process over 50% of all U.S. residential mortgage loans by dollar volume #1 U.S. provider of centralized Settlement Services #1 U.S. provider of Mortgage Default Solutions Over 1,000 financial institution clients, including 39 of the 50 largest banks in the U.S. Significant scale with 2007 pro forma revenue and EBITDA of $1,690.6 million and $526.7 million, respectively |

| Enhanced flood and tax services Automated title decisioning tool - - Streamlined Title Loan origination platform - - Empower 251 Overview Evolution of LPS Electronic delivery of settlement services - ELS Automated end-to-end servicing and loan boarding - - MSP and ELI Appraisal, property valuation and title and closing - LSI Process, invoice and imaging management - - Mortgage Desktop Data delivery at POS technology - - DecisionStream Web services Web-based closing technology - ClosingStream Lien release - DOCX Analytics expertise - AFT Comprehensive industry databases - McDash 2001 2002 2003 2004 2005 2006 2007 2008 Acquire Build Build, Acquire, Invest and Integrate |
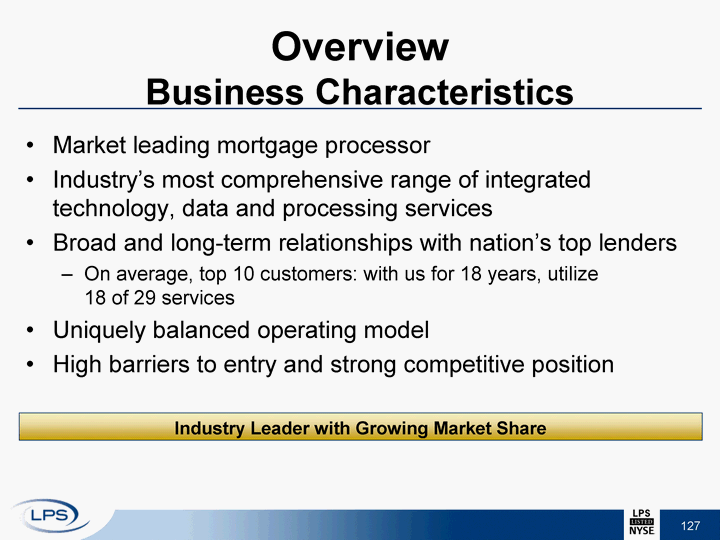
| 253 Overview Business Characteristics Market leading mortgage processor Industry's most comprehensive range of integrated technology, data and processing services Broad and long-term relationships with nation's top lenders On average, top 10 customers: with us for 18 years, utilize 18 of 29 services Uniquely balanced operating model High barriers to entry and strong competitive position Industry Leader with Growing Market Share |

| 255 Overview Growth Drivers Leveraging Comprehensive Solutions Drive market share gains Extend product penetration Expand usage Expanding Current Service Offerings Capital markets Data and analytics Fraud solutions Extending Technology Leadership Position Pursuing Selected Acquisitions Desktop expansion DecisionStream and ClosingStream RealEC Watterson Prime Applied Financial Technology McDash LPS is well-positioned to succeed as a stand-alone company |
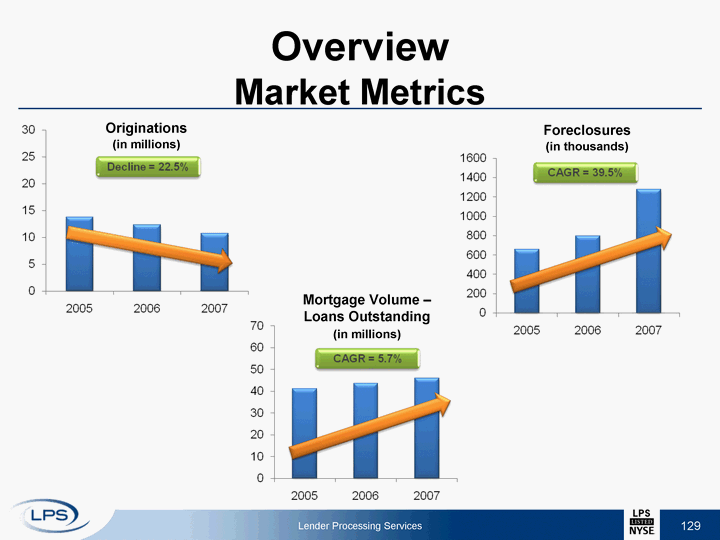
| 257 Overview Market Metrics Originations (in millions) Foreclosures (in thousands) Mortgage Volume - Loans Outstanding (in millions) Lender Processing Services |
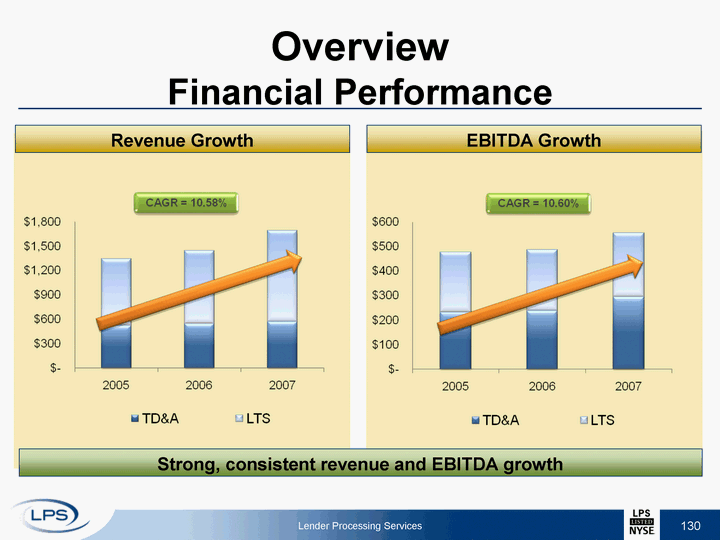
| 259 Overview Financial Performance Lender Processing Services Strong, consistent revenue and EBITDA growth Revenue Growth EBITDA Growth |
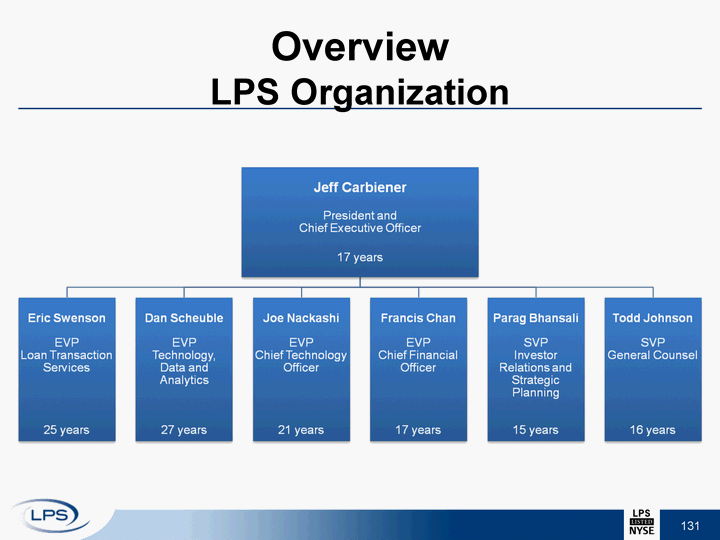
| 261 Overview LPS Organization LPS Organization LPS Organization |

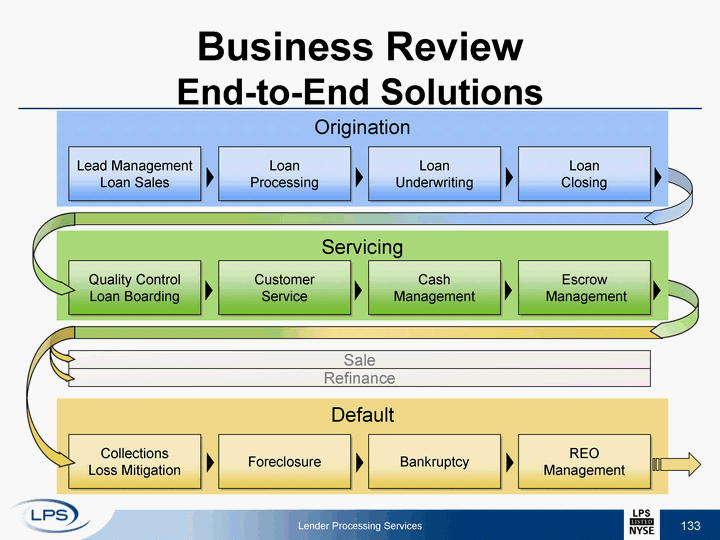
| 265 Business Review End-to-End Solutions Lender Processing Services Default Collections Loss Mitigation Foreclosure Bankruptcy REO Management Servicing Quality Control Loan Boarding Customer Service Cash Management Escrow Management Origination Lead Management Loan Sales Loan Processing Loan Underwriting Loan Closing |
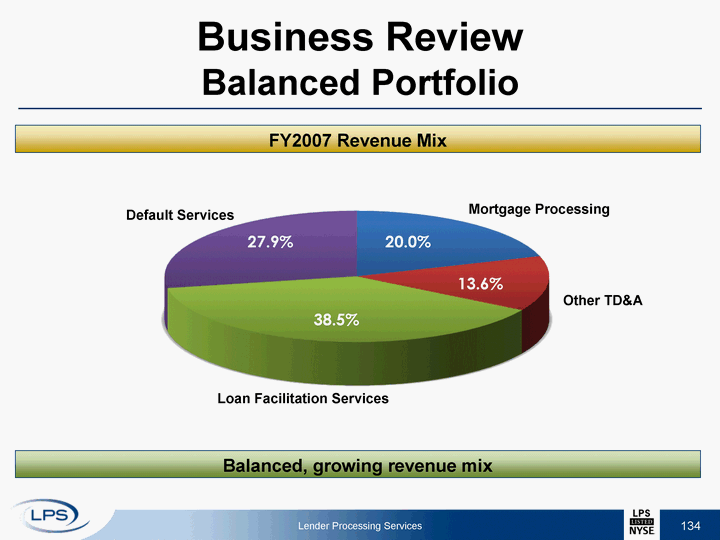
| 267 Business Review Balanced Portfolio Lender Processing Services 4.9% 27.9% 1.1% Loan Facilitation Services Mortgage Processing Other TD&A Default Services 38.5% 20.0% 13.6% FY2007 Revenue Mix Balanced, growing revenue mix |
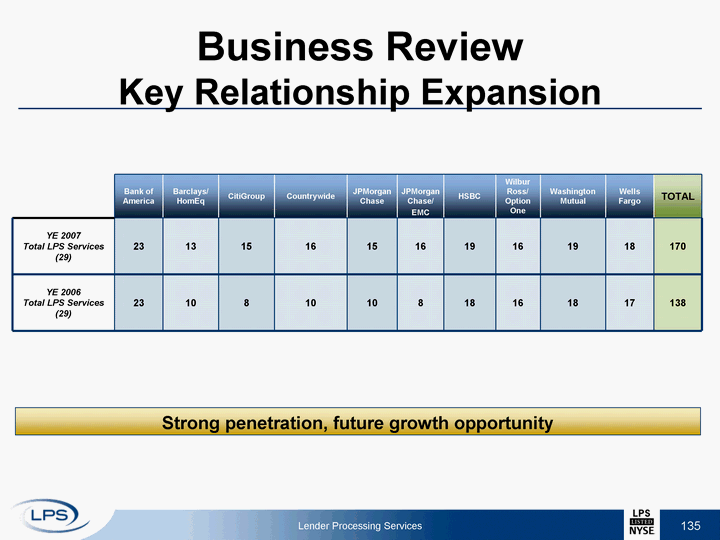
| 269 Business Review Key Relationship Expansion Bank of America Barclays/ HomEq CitiGroup Countrywide JPMorgan Chase JPMorgan Chase/ EMC HSBC Wilbur Ross/ Option One Washington Mutual Wells Fargo TOTAL YE 2007 Total LPS Services (29) 23 13 15 16 15 16 19 16 19 18 170 YE 2006 Total LPS Services (29) 23 10 8 10 10 8 18 16 18 17 138 Lender Processing Services Strong penetration, future growth opportunity |

| 271 Business Review Key Relationship Growth 2007 138 $554 MM 170 $692 MM 2006 100 $463 MM 2005 # of Services Revenue ($) Breadth Lender Processing Services Depth |
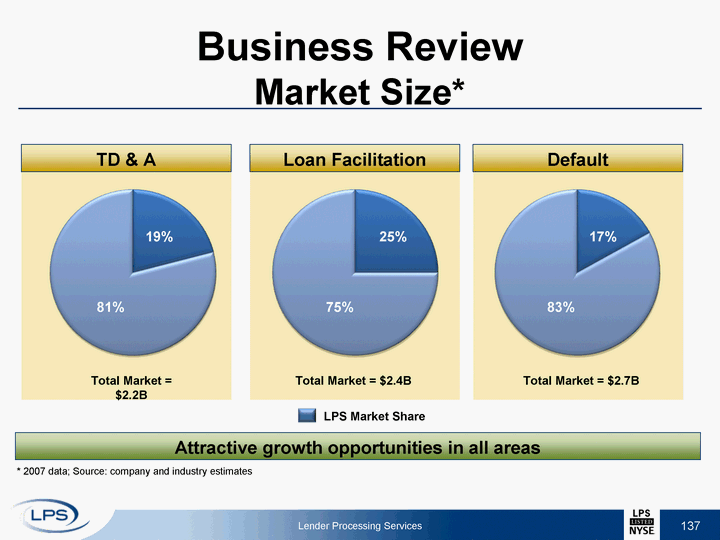
| 273 Business Review Market Size* TD & A Loan Facilitation Default 19% 81% 25% 75% Total Market = $2.2B Total Market = $2.4B Lender Processing Services 83% 17% * 2007 data; Source: company and industry estimates LPS Market Share Attractive growth opportunities in all areas Default Loan Facilitation TD & A Total Market = $2.7B |
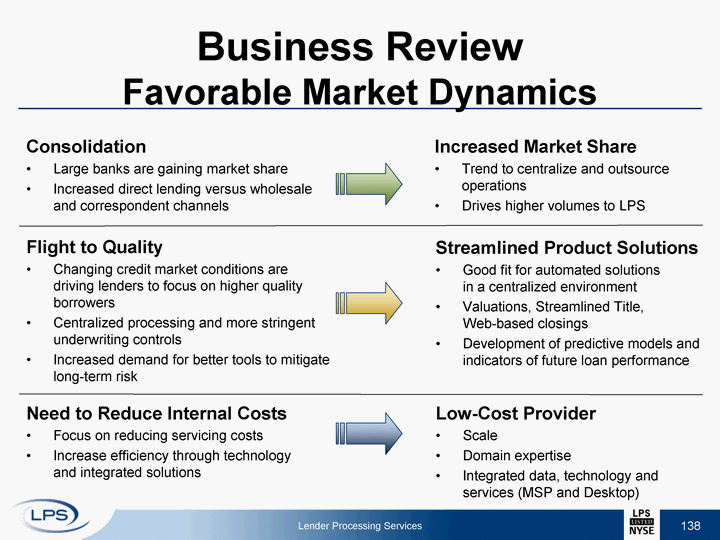
| 275 Business Review Favorable Market Dynamics Consolidation Large banks are gaining market share Increased direct lending versus wholesale and correspondent channels Low-Cost Provider Scale Domain expertise Integrated data, technology and services (MSP and Desktop) Lender Processing Services Need to Reduce Internal Costs Focus on reducing servicing costs Increase efficiency through technology and integrated solutions Increased Market Share Trend to centralize and outsource operations Drives higher volumes to LPS Flight to Quality Changing credit market conditions are driving lenders to focus on higher quality borrowers Centralized processing and more stringent underwriting controls Increased demand for better tools to mitigate long-term risk Streamlined Product Solutions Good fit for automated solutions in a centralized environment Valuations, Streamlined Title, Web-based closings Development of predictive models and indicators of future loan performance |

| 277 Products/Services Review |
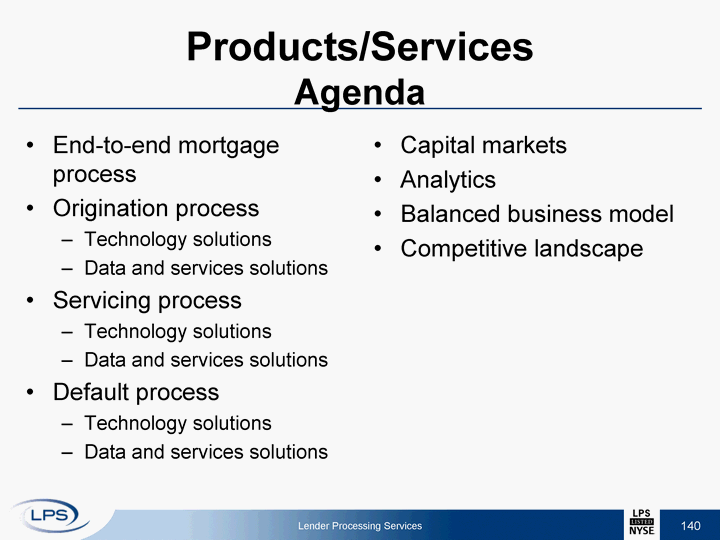
| 279 Products/Services Agenda End-to-end mortgage process Origination process Technology solutions Data and services solutions Servicing process Technology solutions Data and services solutions Default process Technology solutions Data and services solutions Capital markets Analytics Balanced business model Competitive landscape Lender Processing Services |

| 281 End-to-End Mortgage Process Lender Processing Services Default Collections Loss Mitigation Foreclosure Bankruptcy REO Management Servicing Quality Control Loan Boarding Customer Service Cash Management Escrow Management Origination Lead Management Loan Sales Loan Processing Loan Underwriting Loan Closing |

| 283 End-to-End Mortgage Process Lender Processing Services Default Collections Loss Mitigation Foreclosure Bankruptcy REO Management Servicing Quality Control Loan Boarding Customer Service Cash Management Escrow Management Origination Lead Management Loan Sales Loan Processing Loan Underwriting Loan Closing |
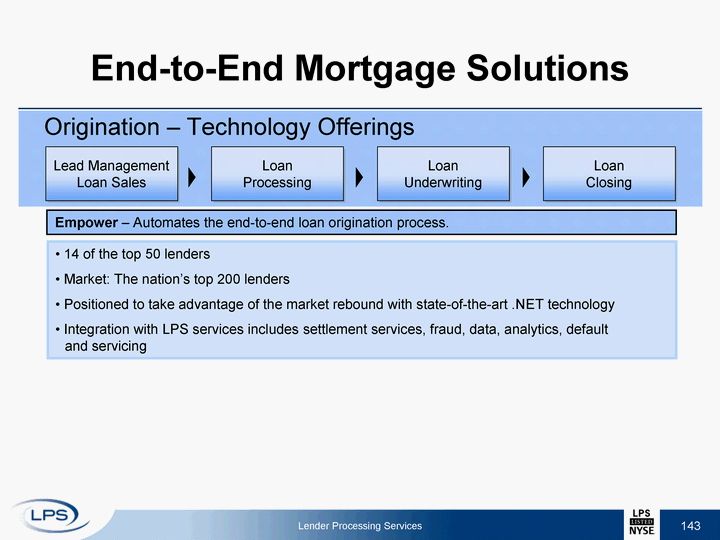
| 285 End-to-End Mortgage Solutions Origination - Technology Offerings Lender Processing Services Lead Management Loan Sales Loan Processing Loan Underwriting Loan Closing Empower - Automates the end-to-end loan origination process. 14 of the top 50 lenders Market: The nation's top 200 lenders Positioned to take advantage of the market rebound with state-of-the-art .NET technology Integration with LPS services includes settlement services, fraud, data, analytics, default and servicing |

| 287 End-to-End Mortgage Solutions Origination - Technology Offerings Lender Processing Services Lead Management Loan Sales Loan Processing Loan Underwriting Loan Closing DecisionStream - Delivers critical data, instantly, to the point of sale and provides the ability to upgrade to other products for fulfillment. Shortens length of time between application and closing Results in higher percentage of closings Saves lenders up to $300 per declined loan Turns shoppers into buyers |

| 289 End-to-End Mortgage Solutions Origination - Technology Offerings Lender Processing Services Lead Management Loan Sales Loan Processing Loan Underwriting Loan Closing Streamlined Title - Provides automated title decisions for refinances, instantly, at point-of- sale. 10 of the top 10 retail originators Allows lenders to easily place all orders through a single workflow Lowers cost of title policy - savings between $150 - $650 Dramatically increases customer retention |
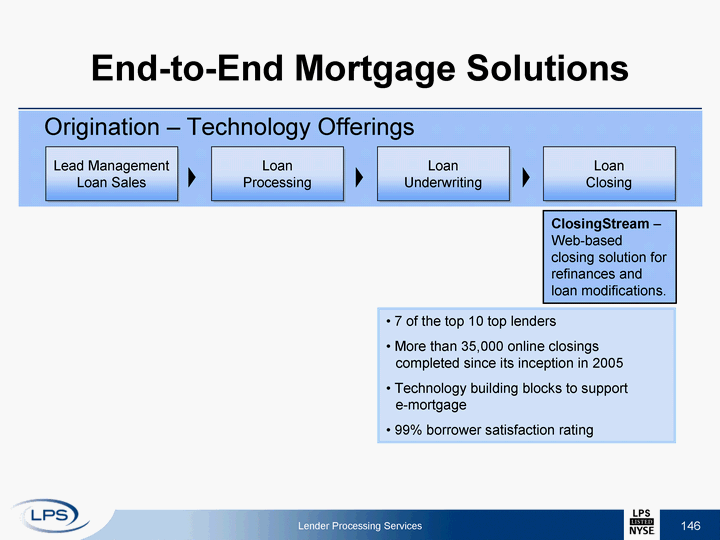
| 291 End-to-End Mortgage Solutions Origination - Technology Offerings Lender Processing Services Lead Management Loan Sales Loan Processing Loan Underwriting Loan Closing 7 of the top 10 top lenders More than 35,000 online closings completed since its inception in 2005 Technology building blocks to support e-mortgage 99% borrower satisfaction rating ClosingStream - Web-based closing solution for refinances and loan modifications. |
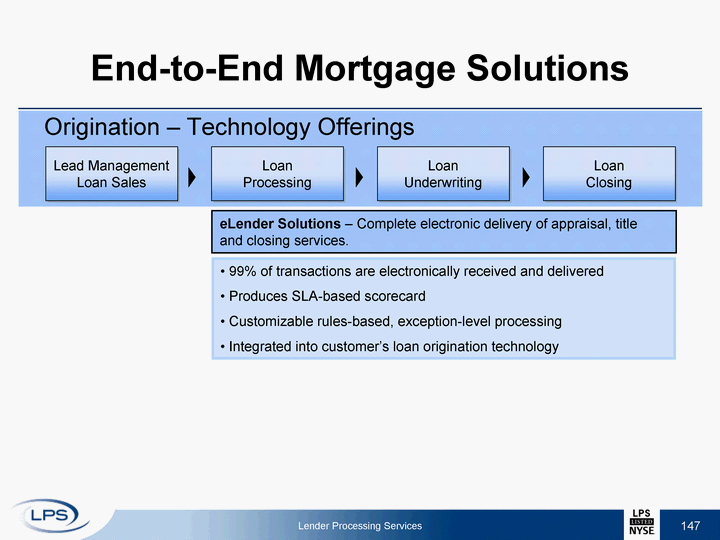
| 293 End-to-End Mortgage Solutions Origination - Technology Offerings Lender Processing Services Lead Management Loan Sales Loan Processing Loan Underwriting Loan Closing eLender Solutions - Complete electronic delivery of appraisal, title and closing services. 99% of transactions are electronically received and delivered Produces SLA-based scorecard Customizable rules-based, exception-level processing Integrated into customer's loan origination technology |

| 295 End-to-End Mortgage Solutions Origination - Technology Offerings Lender Processing Services Lead Management Loan Sales Loan Processing Loan Underwriting Loan Closing RealEC - Automates ordering, tracking and delivery of third-party mortgage services. 2,000+ lenders and brokers, including 17 of the top 20 lenders 13,000+ service providers (e.g. tax, title, etc.) All major settlement companies and all major title, closing and appraisal software packages are connected Enables a private-label, revenue-based model for the lender |

| 297 End-to-End Mortgage Solutions Origination - Data and Services Lender Processing Services Lead Management Loan Sales Loan Processing Loan Underwriting Loan Closing Tax Data - Solutions that can access powerful tax database in an automated environment as well as enable self-service access. More than 1,200 active clients One of the largest property tax databases in the country - 85% Automated tax line integration increases accuracy |
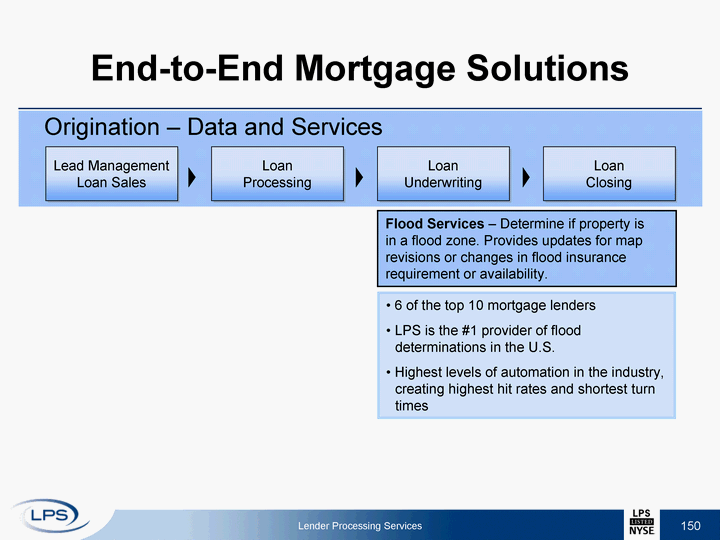
| 299 End-to-End Mortgage Solutions Origination - Data and Services Lender Processing Services Lead Management Loan Sales Loan Processing Loan Underwriting Loan Closing Flood Services - Determine if property is in a flood zone. Provides updates for map revisions or changes in flood insurance requirement or availability. 6 of the top 10 mortgage lenders LPS is the #1 provider of flood determinations in the U.S. Highest levels of automation in the industry, creating highest hit rates and shortest turn times |

| 301 End-to-End Mortgage Solutions Origination - Data and Services Lender Processing Services Lead Management Loan Sales Loan Processing Loan Underwriting Loan Closing 45,000 independent appraisers and real estate professionals in database 2 million valuations completed in 2007 Enhances quality control through reductions in FTE and steps in appraisal process Turnaround time reductions eliminate days from the closing process Improves overall borrower experience Appraisal/Property Valuation - Centralized, independent appraisal services used to determine the value of a property. |

| 303 End-to-End Mortgage Solutions Origination - Data and Services Lender Processing Services Lead Management Loan Sales Loan Processing Loan Underwriting Loan Closing Title and Closing Services - Centralized coordination of settlement process. 8 of the top 10 lenders Largest centralized title and appraisal company in the U.S. Closings handled quickly, professionally and correctly Increased customer satisfaction Extensive network of notaries experienced in escrow, title, mortgage or real estate |

| 305 Appraisal/Property Valuation Tax Data Flood Services Title and Closing Services Empower (Automated, End-to-End Originations) RealEC (Automated Ordering, Tracking and Delivery) eLender Solutions (Electronic Delivery Technology) DecisionStream (Data Delivery at Point of Sale) Streamlined Title (Automated Title Decisioning Tool) Closing Stream (Web-Based Closing Solution) End-to-End Mortgage Solutions Origination - Technology, Data and Services Offerings Lender Processing Services Lead Management Loan Sales Loan Processing Loan Underwriting Loan Closing |
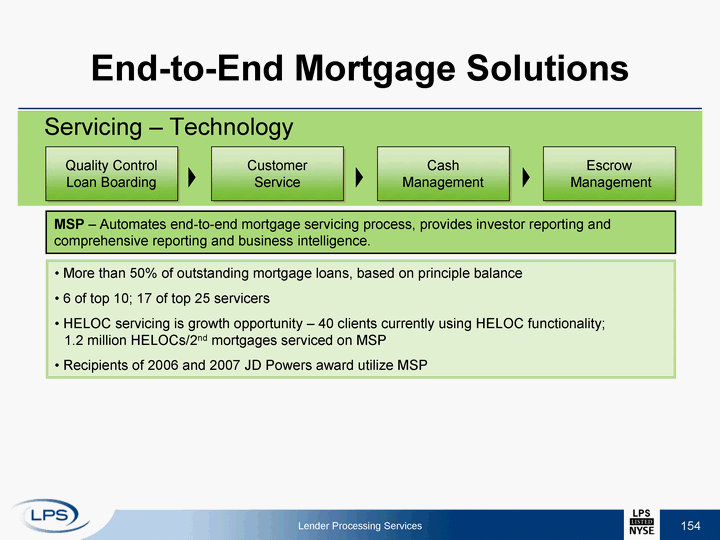
| 307 End-to-End Mortgage Solutions Servicing - Technology Lender Processing Services MSP - Automates end-to-end mortgage servicing process, provides investor reporting and comprehensive reporting and business intelligence. More than 50% of outstanding mortgage loans, based on principle balance 6 of top 10; 17 of top 25 servicers HELOC servicing is growth opportunity - 40 clients currently using HELOC functionality; 1.2 million HELOCs/2nd mortgages serviced on MSP Recipients of 2006 and 2007 JD Powers award utilize MSP Quality Control Loan Boarding Customer Service Cash Management Escrow Management |

| 309 End-to-End Mortgage Solutions Servicing - Technology Lender Processing Services Electronic Loan Interface - Automates loan boarding for new loans and portfolio acquisitions. Approximately 60% of LPS clients Rules processing greatly increases quality of data Dramatic reductions in time frames and cost Automates loan boarding for portfolio acquisitions Quality Control Loan Boarding Customer Service Cash Management Escrow Management |

| 311 End-to-End Mortgage Solutions Servicing - Technology Lender Processing Services Quality Control Loan Boarding Customer Service Cash Management Escrow Management MSP Web Services - Provides a secure mechanism to send MSP data to and from third parties and servicers. 45% of clients or their business partners using to update MSP Provides real-time access to loan level data Integrates MSP with LPS technology and services Provides consistent, timely and accurate data delivery |

| 313 End-to-End Mortgage Solutions Servicing - Data and Services Lender Processing Services Tax Data - Leverages property records database to provide up-to-date tax information; provides status of taxes on a property. Tax solution enables customers to insource tax business Reduction in post-close work performed to adjust escrow accounts Increased efficiencies through automated boarding of tax data into servicing platform Quality Control Loan Boarding Customer Service Cash Management Escrow Management |
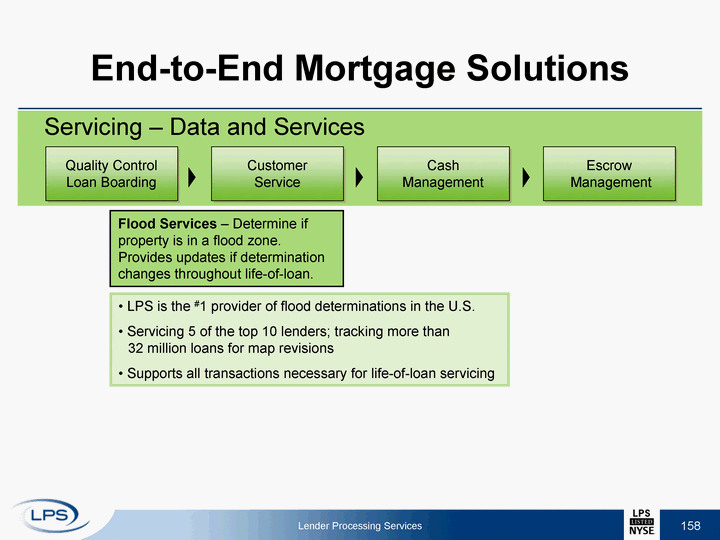
| 315 End-to-End Mortgage Solutions Servicing - Data and Services Lender Processing Services Flood Services - Determine if property is in a flood zone. Provides updates if determination changes throughout life-of-loan. LPS is the #1 provider of flood determinations in the U.S. Servicing 5 of the top 10 lenders; tracking more than 32 million loans for map revisions Supports all transactions necessary for life-of-loan servicing Quality Control Loan Boarding Customer Service Cash Management Escrow Management |
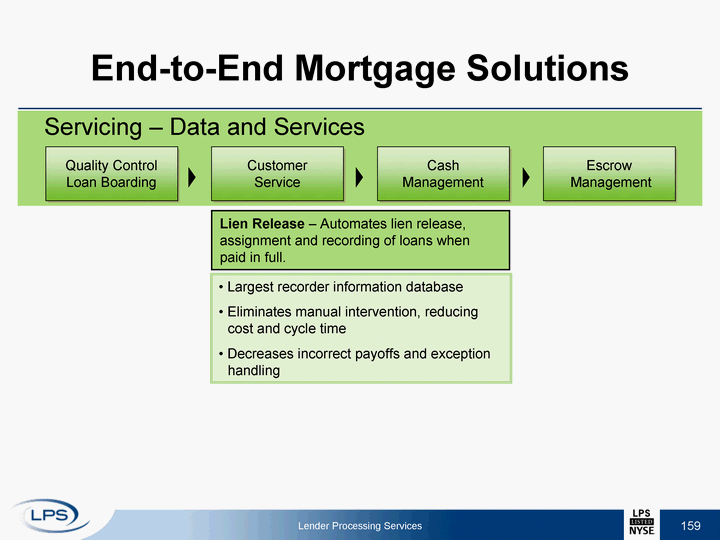
| 317 End-to-End Mortgage Solutions Servicing - Data and Services Lender Processing Services Quality Control Loan Boarding Customer Service Cash Management Escrow Management Largest recorder information database Eliminates manual intervention, reducing cost and cycle time Decreases incorrect payoffs and exception handling Lien Release - Automates lien release, assignment and recording of loans when paid in full. |
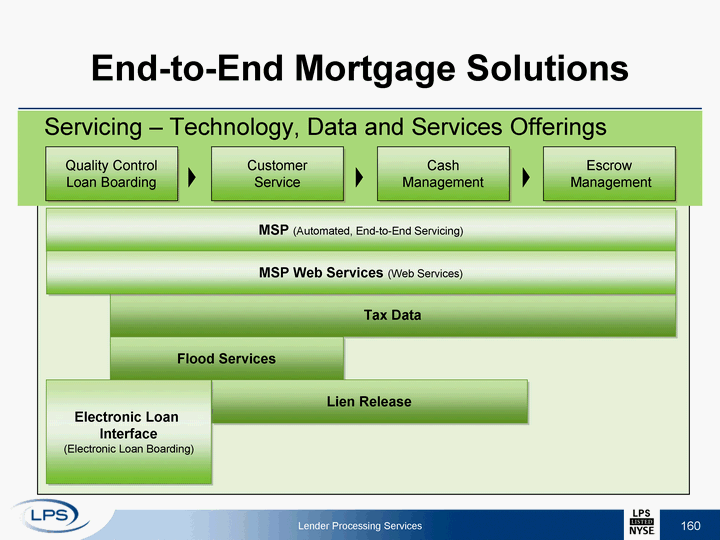
| 319 Tax Data Flood Services Lien Release MSP (Automated, End-to-End Servicing) Electronic Loan Interface (Electronic Loan Boarding) MSP Web Services (Web Services) End-to-End Mortgage Solutions Servicing - Technology, Data and Services Offerings Lender Processing Services Quality Control Loan Boarding Customer Service Cash Management Escrow Management |

| 321 End-to-End Mortgage Solutions Default - Technology Lender Processing Services Collections Loss Mitigation Foreclosure Bankruptcy REO Management Mortgage Desktop - Works in conjunction with MSP and provides process automation, digital invoice solutions and document management. Used by 8 of the top 10 servicers Manages more than 50% of default referrals in the industry Dramatic, documented increase in efficiency Reduces loan loss provisions Performance metrics create unprecedented timeline improvement MSP - Data of record; automates end-to-end mortgage servicing process. |

| 323 End-to-End Mortgage Solutions Default - Data and Services Lender Processing Services Collections Loss Mitigation Foreclosure Bankruptcy REO Management Title and Closing - - Provides all foreclosure title products required to transfer title from borrower to bank. Expedites transfer of title Reduces title expenses and shortens timelines Increases process transparency Working knowledge of local requirements and regulations |
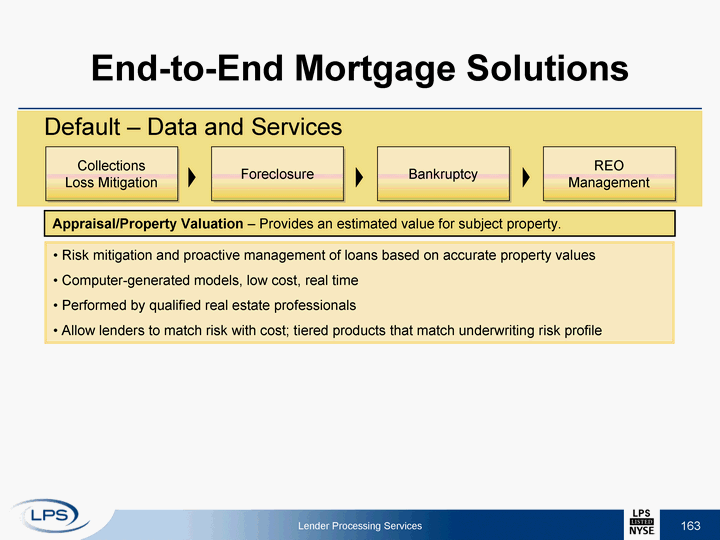
| 325 End-to-End Mortgage Solutions Default - Data and Services Lender Processing Services Collections Loss Mitigation Foreclosure Bankruptcy REO Management Risk mitigation and proactive management of loans based on accurate property values Computer-generated models, low cost, real time Performed by qualified real estate professionals Allow lenders to match risk with cost; tiered products that match underwriting risk profile Appraisal/Property Valuation - Provides an estimated value for subject property. |
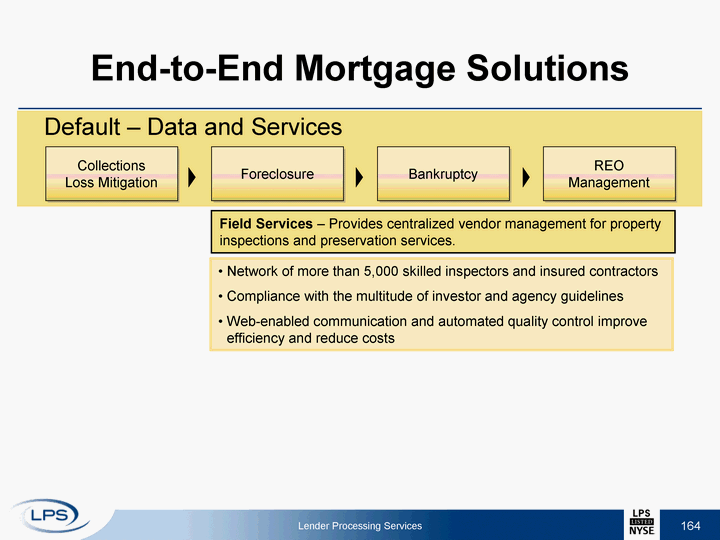
| 327 End-to-End Mortgage Solutions Default - Data and Services Lender Processing Services Collections Loss Mitigation Foreclosure Bankruptcy REO Management Network of more than 5,000 skilled inspectors and insured contractors Compliance with the multitude of investor and agency guidelines Web-enabled communication and automated quality control improve efficiency and reduce costs Field Services - Provides centralized vendor management for property inspections and preservation services. |
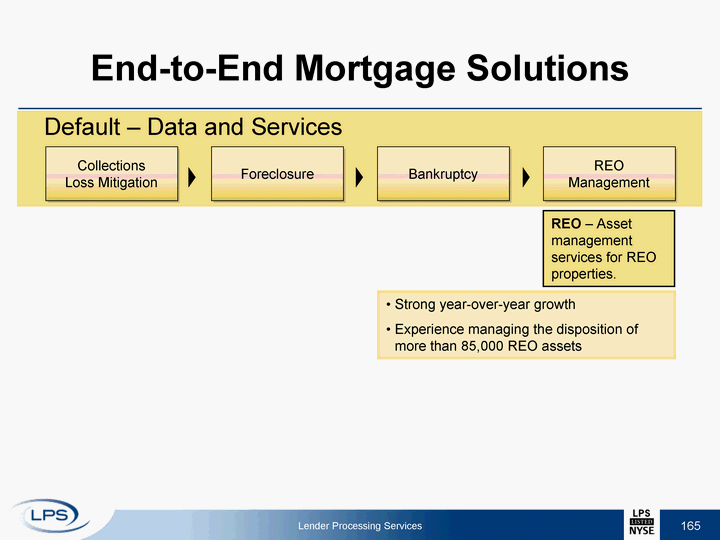
| 329 End-to-End Mortgage Solutions Default - Data and Services Lender Processing Services Collections Loss Mitigation Foreclosure Bankruptcy REO Management Strong year-over-year growth Experience managing the disposition of more than 85,000 REO assets REO - Asset management services for REO properties. |
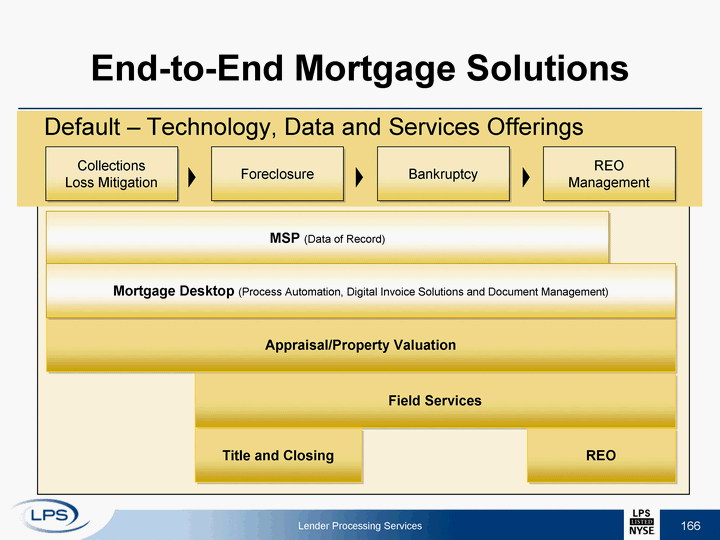
| 331 Appraisal/Property Valuation Field Services Title and Closing REO MSP (Data of Record) Mortgage Desktop (Process Automation, Digital Invoice Solutions and Document Management) End-to-End Mortgage Solutions Default - Technology, Data and Services Offerings Lender Processing Services Collections Loss Mitigation Foreclosure Bankruptcy REO Management |
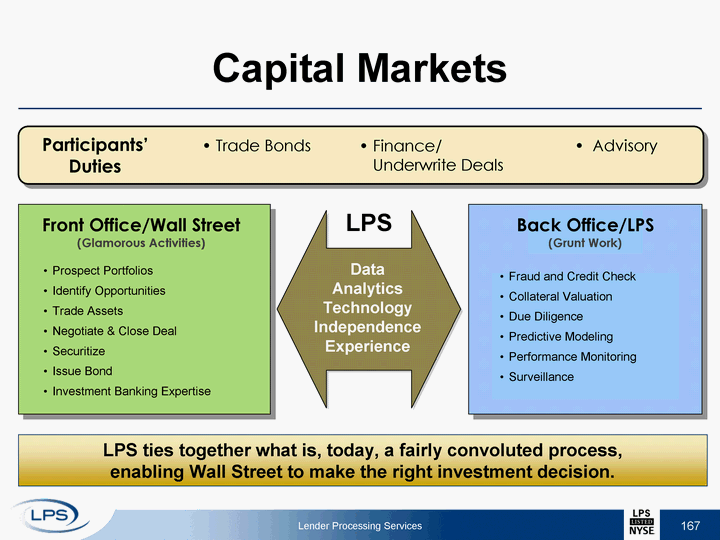
| 333 Capital Markets Lender Processing Services Trade Bonds Finance/ Underwrite Deals Advisory Prospect Portfolios Identify Opportunities Trade Assets Negotiate & Close Deal Securitize Issue Bond Investment Banking Expertise Front Office/Wall Street (Glamorous Activities) Back Office/LPS (Grunt Work) Fraud and Credit Check Collateral Valuation Due Diligence Predictive Modeling Performance Monitoring Surveillance Participants' Duties LPS Data Analytics Technology Independence Experience LPS ties together what is, today, a fairly convoluted process, enabling Wall Street to make the right investment decision. |
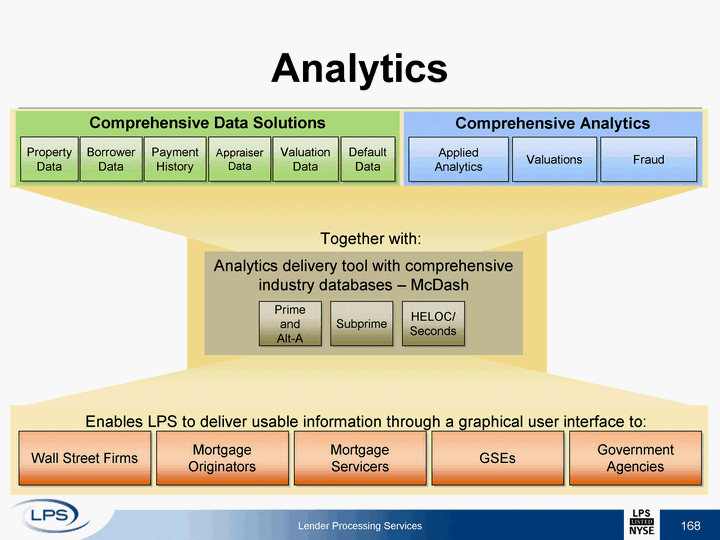
| 335 Analytics Lender Processing Services Together with: Enables LPS to deliver usable information through a graphical user interface to: Wall Street Firms Mortgage Originators Mortgage Servicers GSEs Government Agencies Comprehensive Data Solutions Property Data Borrower Data Payment History Appraiser Data Valuation Data Default Data Comprehensive Analytics Applied Analytics Valuations Fraud Analytics delivery tool with comprehensive industry databases - McDash Prime and Alt-A Subprime HELOC/ Seconds |
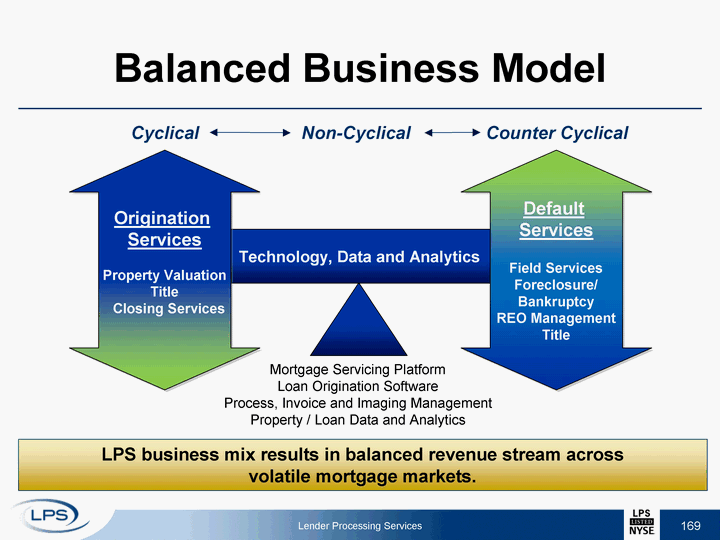
| 337 Balanced Business Model Lender Processing Services Technology, Data and Analytics Cyclical Counter Cyclical Non-Cyclical Origination Services Property Valuation Title Closing Services Default Services Field Services Foreclosure/ Bankruptcy REO Management Title Mortgage Servicing Platform Loan Origination Software Process, Invoice and Imaging Management Property / Loan Data and Analytics LPS business mix results in balanced revenue stream across volatile mortgage markets. |

| 339 Competitive Landscape Data and Services Lender Processing Services LPS First American LandAM Fiserv Credit Bureaus Tax Data ? ? Flood Services ? ? ? ? Appraisal/Property Valuation ? ? ? ? Title and Closing Services ? ? ? ? Lien Release ? ? AVM ? ? ? Field Services ? ? REO ? ? Data Services ? ? Title Underwriting ? ? Default Management Outsource ? ? Portfolio Analytics/ Due Diligence ? ? ? ? ? ? ? ? ? ? ? ? ? |

| 341 Competitive Landscape Technology Lender Processing Services LPS First American LandAM Fiserv Credit Bureaus Loan Origination Technology Loan Origination Technology Loan Origination Technology Loan Origination Technology Loan Origination Technology Loan Origination Technology Automated End-to-End Loan Process ? Web-Based Closing Solution ? ? Data Delivery at Point of Sale Automated Title Decisioning Tool ? ? Electronic Delivery Technology ? ? ? ? Automated Order, Track and Delivery ? ? Mortgage Servicing Technology Mortgage Servicing Technology Mortgage Servicing Technology Mortgage Servicing Technology Mortgage Servicing Technology Mortgage Servicing Technology Automated End-to-End Servicing ? Electronic Loan Boarding ? Web Services Default Management Technology Default Management Technology Default Management Technology Default Management Technology Default Management Technology Default Management Technology Automated End-to-End Servicing ? Process Invoice and Imaging Management ? ? ? ? ? ? ? ? ? ? ? ? ? |

| 343 Competitive Advantage Customer Benefits Lower cost to originate and service Better regulatory compliance Lower error rates Faster cycle times Increased customer satisfaction Increased pull-through Increased adaptability LPS Benefits Creates barriers to entry Difficult to replace - "stickiness" Facilitates the ordering of LPS data and services Faster time to market for new technology and services LPS services leverage our technology Lender Processing Services LPS Technology |

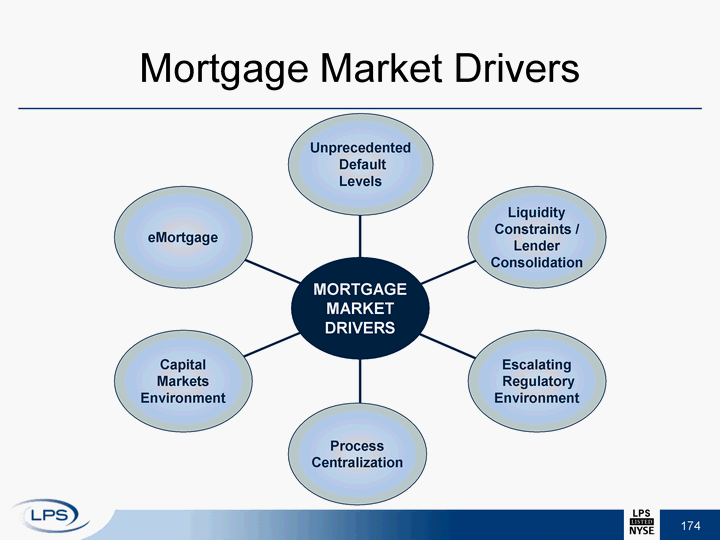
| 347 Mortgage Market Drivers Unprecedented Default Levels Liquidity Constraints / Lender Consolidation Escalating Regulatory Environment Process Centralization Capital Markets Environment eMortgage MORTGAGE MARKET DRIVERS |
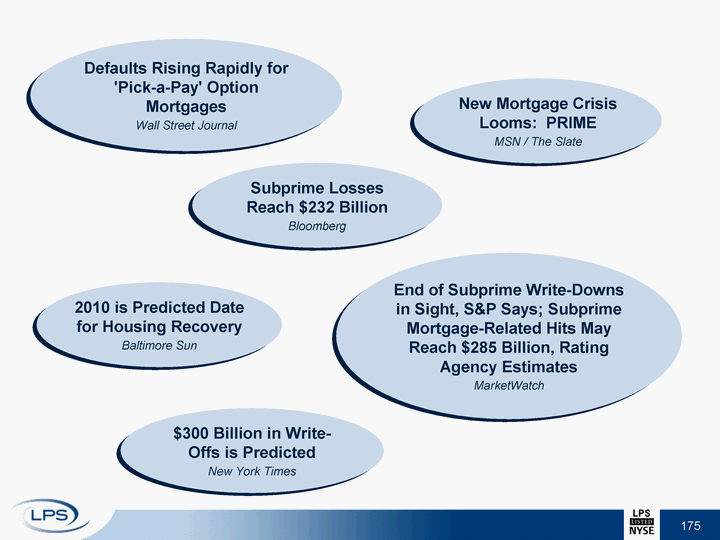
| 349 Defaults Rising Rapidly for 'Pick-a-Pay' Option Mortgages Wall Street Journal 2010 is Predicted Date for Housing Recovery Baltimore Sun New Mortgage Crisis Looms: PRIME MSN / The Slate $300 Billion in Write- Offs is Predicted New York Times End of Subprime Write-Downs in Sight, S&P Says; Subprime Mortgage-Related Hits May Reach $285 Billion, Rating Agency Estimates MarketWatch Subprime Losses Reach $232 Billion Bloomberg |
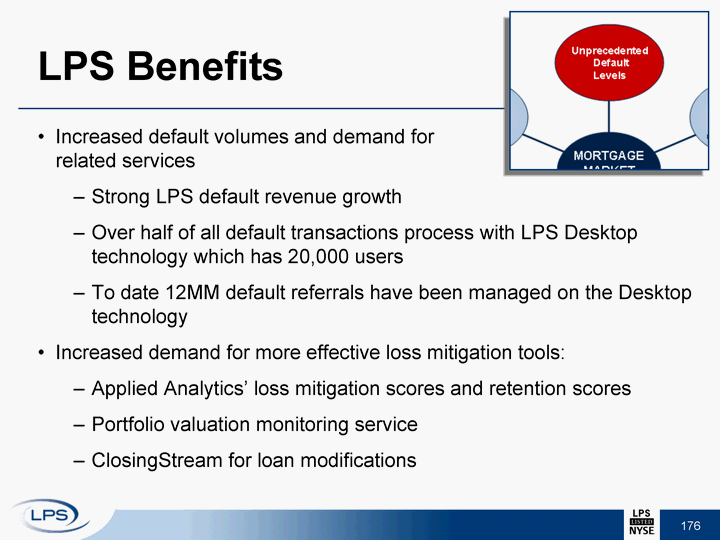
| 351 Increased default volumes and demand for related services Strong LPS default revenue growth Over half of all default transactions process with LPS Desktop technology which has 20,000 users To date 12MM default referrals have been managed on the Desktop technology Increased demand for more effective loss mitigation tools: Applied Analytics' loss mitigation scores and retention scores Portfolio valuation monitoring service ClosingStream for loan modifications LPS Benefits |

| 353 Mortgage Market Drivers Unprecedented Default Levels Liquidity Constraints / Lender Consolidation Escalating Regulatory Environment Process Centralization Capital Markets Environment eMortgage MORTGAGE MARKET DRIVERS |
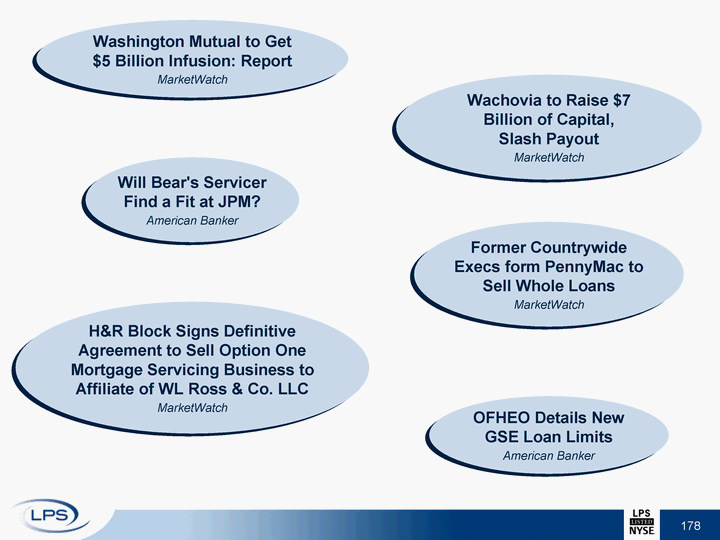
| 355 Washington Mutual to Get $5 Billion Infusion: Report MarketWatch Wachovia to Raise $7 Billion of Capital, Slash Payout MarketWatch Former Countrywide Execs form PennyMac to Sell Whole Loans MarketWatch H&R Block Signs Definitive Agreement to Sell Option One Mortgage Servicing Business to Affiliate of WL Ross & Co. LLC MarketWatch OFHEO Details New GSE Loan Limits American Banker Will Bear's Servicer Find a Fit at JPM? American Banker |

| 357 LPS Benefits Consolidation towards larger institutions and new entrants LPS' strongest relationships are with the top 25 lenders/servicers that have consolidated market Largest settlement services provider to the top 25 MSP currently has over 50% market share LPS Desktop manages over half of default referrals New market entrants look to LPS first for servicing and default technology LPS working with Government Agencies to utilize LPS Desktop technology |

| 359 Mortgage Market Drivers Unprecedented Default Levels Liquidity Constraints / Lender Consolidation Escalating Regulatory Environment Process Centralization Capital Markets Environment eMortgage MORTGAGE MARKET DRIVERS |

| 361 Cuomo-GSE Deal May Get Fight in Court American Banker Dodd Seeks New GSE Mandate Proposed RESPA Rule to Require Reading of Loan Details to Borrowers Prior to Closing Inside Mortgage Finance Frank Optimistic in Pushing Legislation Forward MBA NewsLink Government Debates New Home Foreclosure Rules KGW.com New Foreclosure Rules Pursuant to Emergency Legislation State of Maryland |
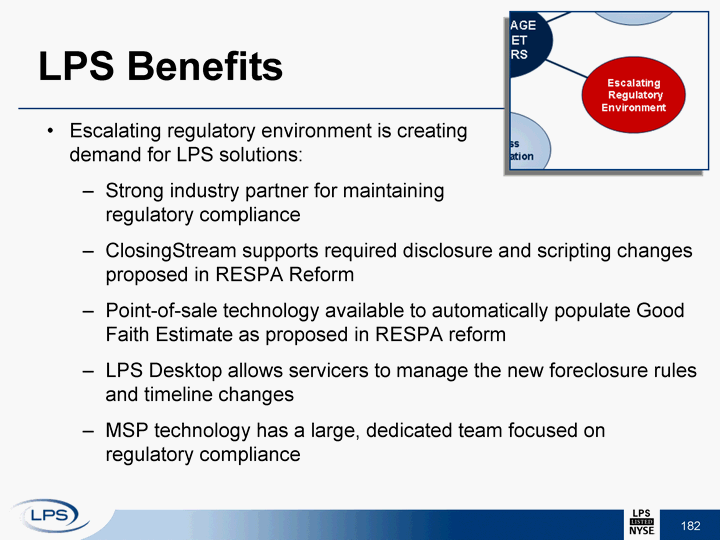
| 363 Escalating regulatory environment is creating demand for LPS solutions: Strong industry partner for maintaining regulatory compliance ClosingStream supports required disclosure and scripting changes proposed in RESPA Reform Point-of-sale technology available to automatically populate Good Faith Estimate as proposed in RESPA reform LPS Desktop allows servicers to manage the new foreclosure rules and timeline changes MSP technology has a large, dedicated team focused on regulatory compliance LPS Benefits |
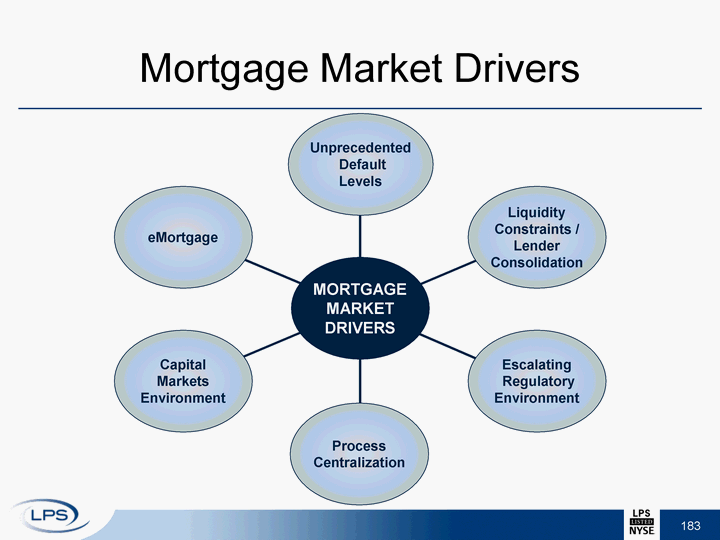
| 365 Mortgage Market Drivers Unprecedented Default Levels Liquidity Constraints / Lender Consolidation Escalating Regulatory Environment Process Centralization Capital Markets Environment eMortgage MORTGAGE MARKET DRIVERS |
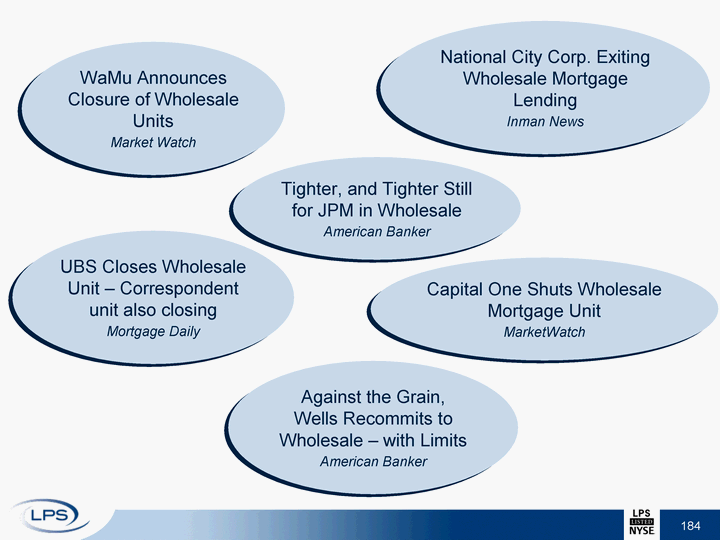
| 367 WaMu Announces Closure of Wholesale Units Market Watch Capital One Shuts Wholesale Mortgage Unit MarketWatch Against the Grain, Wells Recommits to Wholesale - with Limits American Banker UBS Closes Wholesale Unit - Correspondent unit also closing Mortgage Daily National City Corp. Exiting Wholesale Mortgage Lending Inman News Tighter, and Tighter Still for JPM in Wholesale American Banker |

| 369 LPS Benefits Lenders centralizing origination channels LPS' outsourced settlement services model was built to support the largest, centralized mortgage lenders in the industry Appraisal outsource model provides independence Point-of-sale title decisioning eliminates bottlenecks and saves borrower hundreds of dollars Lenders centralizing operating platforms MSP provides a single platform to efficiently track and monitor all real estate secured loans including HELOCs |
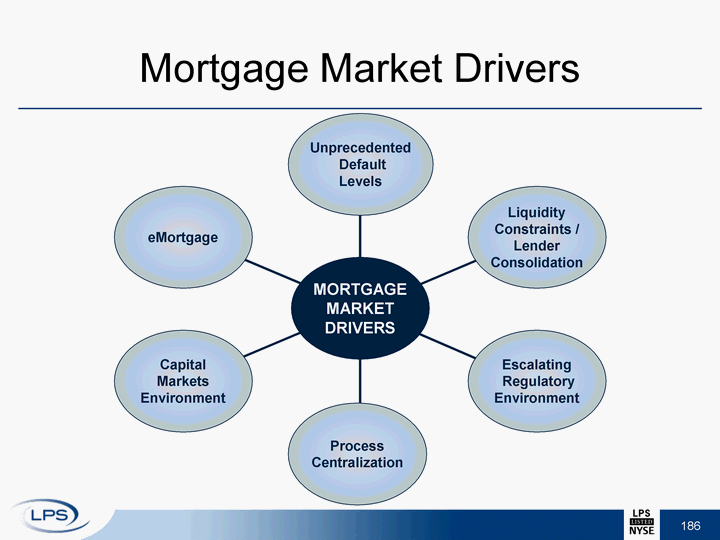
| 371 Mortgage Market Drivers Unprecedented Default Levels Liquidity Constraints / Lender Consolidation Escalating Regulatory Environment Process Centralization Capital Markets Environment eMortgage MORTGAGE MARKET DRIVERS |

| 373 It's Hard to Thaw a Frozen Market NY Times " ... No one, and I mean no one, is going to buy a package of loans without knowing what each and every one of them is, what the risk of default is, etc. ..." Andy Kessler Wall Street Journal Secondary Mortgage Market: in Trouble Mortgage Foundation CDO Market is Almost Frozen, Merrill, JPMorgan Say Bloomberg Bernanke Urges Better Risk Management AP |

| 375 LPS Benefits Need for more sophisticated risk management and analytical tools LPS offers comprehensive data and analytic solutions for investors to address the demand for improved due diligence practices and ultimately provide confidence in what they are buying LPS Due Diligence Solutions offer verification and compliance assessment services LPS Valuation Solutions assess property values more accurately LPS Applied Analytics provide tools to better assess the income stream risks of default, loss and prepayment LPS' McDash provides best execution analysis on both the buy and sell side |
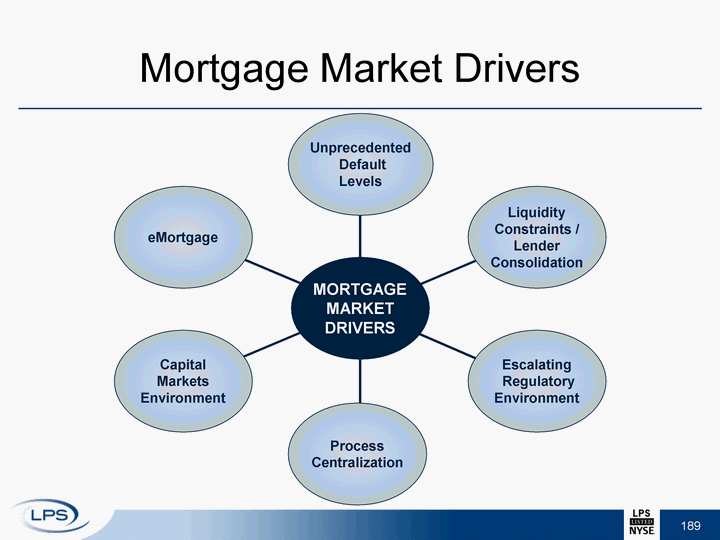
| 377 Mortgage Market Drivers Unprecedented Default Levels Liquidity Constraints / Lender Consolidation Escalating Regulatory Environment Process Centralization Capital Markets Environment eMortgage MORTGAGE MARKET DRIVERS |
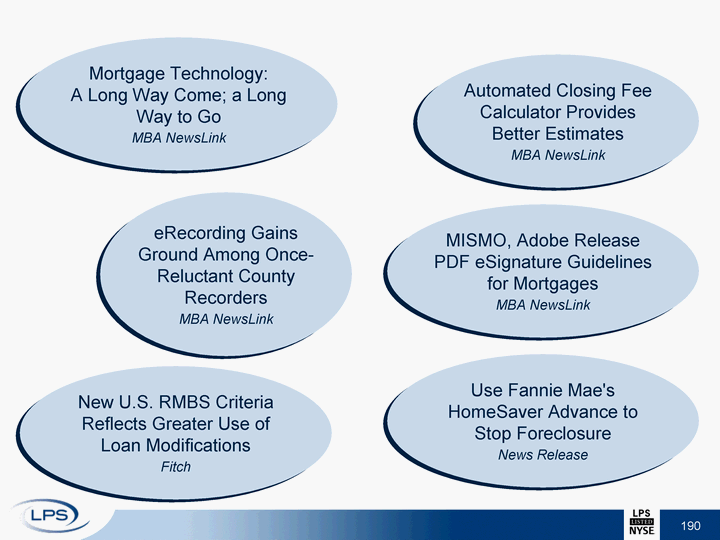
| 379 Mortgage Technology: A Long Way Come; a Long Way to Go MBA NewsLink Automated Closing Fee Calculator Provides Better Estimates MBA NewsLink eRecording Gains Ground Among Once- Reluctant County Recorders MBA NewsLink MISMO, Adobe Release PDF eSignature Guidelines for Mortgages MBA NewsLink Use Fannie Mae's HomeSaver Advance to Stop Foreclosure News Release New U.S. RMBS Criteria Reflects Greater Use of Loan Modifications Fitch |
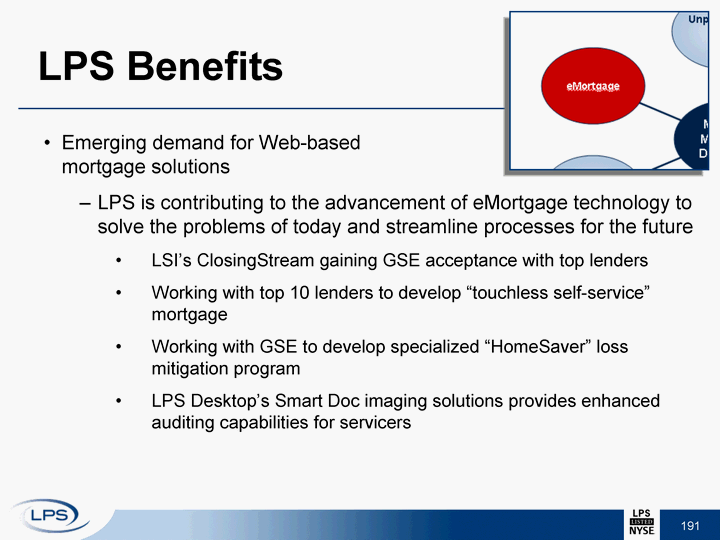
| 381 LPS Benefits Emerging demand for Web-based mortgage solutions LPS is contributing to the advancement of eMortgage technology to solve the problems of today and streamline processes for the future LSI's ClosingStream gaining GSE acceptance with top lenders Working with top 10 lenders to develop "touchless self-service" mortgage Working with GSE to develop specialized "HomeSaver" loss mitigation program LPS Desktop's Smart Doc imaging solutions provides enhanced auditing capabilities for servicers |

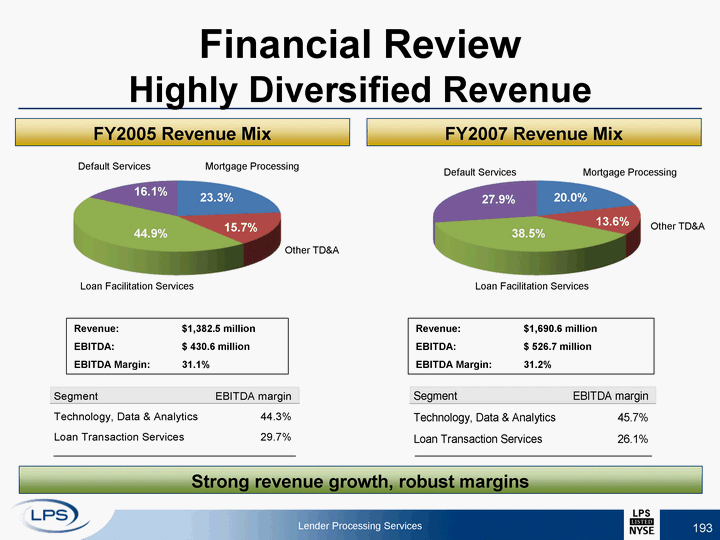
| Financial Review Highly Diversified Revenue Revenue: $1,382.5 million EBITDA: $ 430.6 million EBITDA Margin: 31.1% Revenue: $1,690.6 million EBITDA: $ 526.7 million EBITDA Margin: 31.2% Loan Facilitation Services Mortgage Processing Other TD&A Default Services Lender Processing Services 385 44.9% 15.7% 23.3% 16.1% Loan Facilitation Services Mortgage Processing Other TD&A Default Services 13.6% 38.5% 27.9% 20.0% Strong revenue growth, robust margins FY2005 Revenue Mix FY2007 Revenue Mix |

| Financial Review *Net income plus depreciation and amortization less capital expenditures and changes in working capital. As presented in Form 10; excludes pro forma after-tax interest expense of $55.8 million in 2007. Lender Processing Services 387 Free Cash Flow* ($ millions) Robust free cash flow |

| Lender Processing Services 389 Capital Expenditures ($ millions) Efficient capital deployment Financial Review |

| Financial Review Technology, Data & Analytics Mortgage processing services - automates all areas of loan servicing, including loan setup and ongoing processing, customer service, accounting and reporting. Desktop System - workflow information system that assists customers in managing business processes and connectivity used primarily in connection with default management. Other software applications - include mortgage origination, real estate, and title insurance software. Data and analytics businesses - includes alternative property valuations, property records business and advanced analytic services, which assists customers in their loan marketing or loss mitigation efforts. Mortgage processing services - Typically fee per month per loan on file. Recurring revenue, long-term contracts, high switching costs. Desktop System - Activity fees per foreclosure. To be expanded to other mortgage servicing business processes. High switching costs; clients typically use LPS exclusively. Other software applications - License, maintenance and professional service fees. Data and analytics businesses - Transaction, activity and subscription fees. Lender Processing Services 391 391 Segment Overview Revenue Drivers |

| Financial Review Technology, Data & Analytics Mortgage processing Other TD&A 2005 revenue: $525.3 MM 2007 Revenue: $570.1 MM 40.2% 59.8% 40.4% 59.6% 393 Lender Processing Services 393 |

| Financial Review Technology, Data & Analytics 395 Lender Processing Services ($MM) ($MM) 395 Historical Revenue Historical EBITDA |
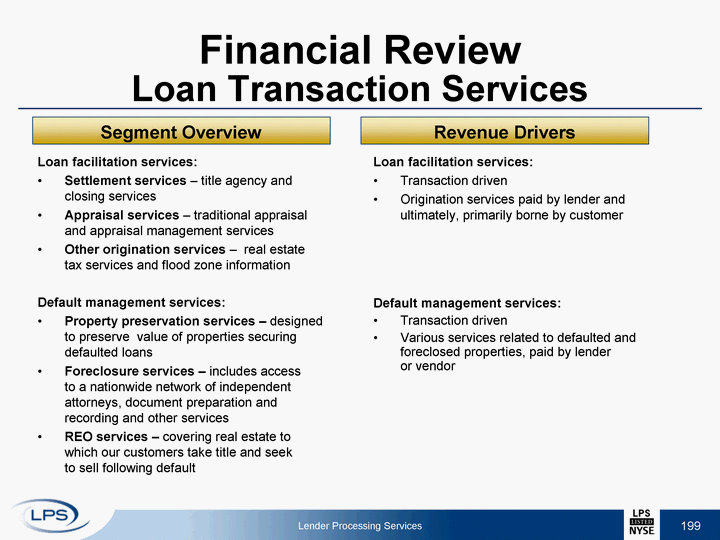
| Financial Review Loan Transaction Services 397 Lender Processing Services Loan facilitation services: Settlement services - title agency and closing services Appraisal services - traditional appraisal and appraisal management services Other origination services - real estate tax services and flood zone information Default management services: Property preservation services - designed to preserve value of properties securing defaulted loans Foreclosure services - includes access to a nationwide network of independent attorneys, document preparation and recording and other services REO services - covering real estate to which our customers take title and seek to sell following default Loan facilitation services: Transaction driven Origination services paid by lender and ultimately, primarily borne by customer Default management services: Transaction driven Various services related to defaulted and foreclosed properties, paid by lender or vendor 397 Segment Overview Revenue Drivers |

| Financial Review Loan Transaction Services 42.0% 58.0% 73.6 % 26.4% Lender Processing Services 399 399 2005 revenue: $820.1 MM 2007 Revenue: $1,125.9 MM Loan Facilitation Services Default Services |

| Financial Review Loan Transactions Services ($MM) ($MM) Lender Processing Services 401 401 Historical Revenue Historical EBITDA |

| 2008 Guidance and Long Term Outlook 403 |

| 2008 Adjusted Guidance 1 Lender Processing Services Solid start as a stand-alone public company |
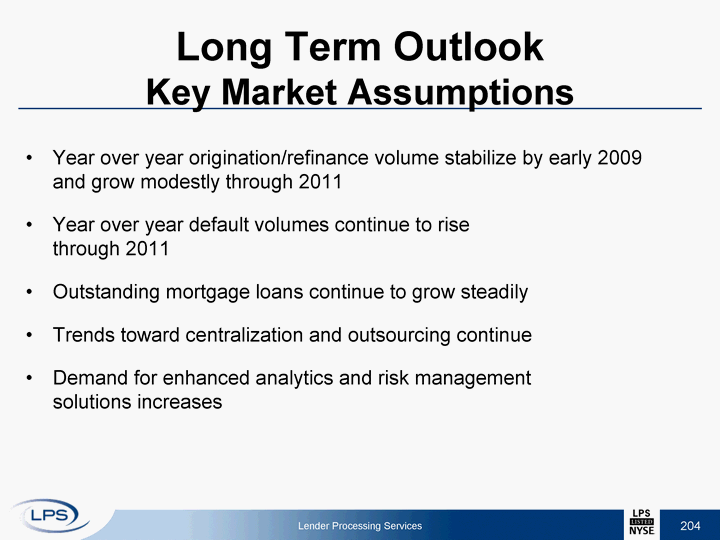
| Long Term Outlook Key Market Assumptions Year over year origination/refinance volume stabilize by early 2009 and grow modestly through 2011 Year over year default volumes continue to rise through 2011 Outstanding mortgage loans continue to grow steadily Trends toward centralization and outsourcing continue Demand for enhanced analytics and risk management solutions increases Lender Processing Services 407 |
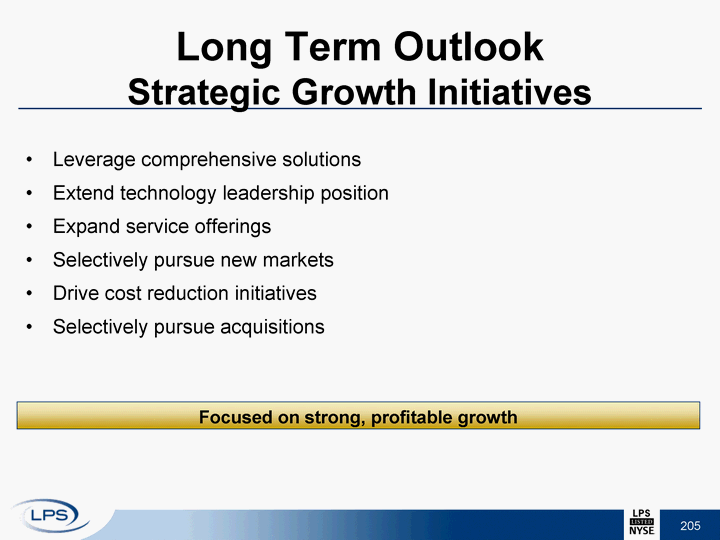
| Long Term Outlook Strategic Growth Initiatives Leverage comprehensive solutions Extend technology leadership position Expand service offerings Selectively pursue new markets Drive cost reduction initiatives Selectively pursue acquisitions 409 Focused on strong, profitable growth |
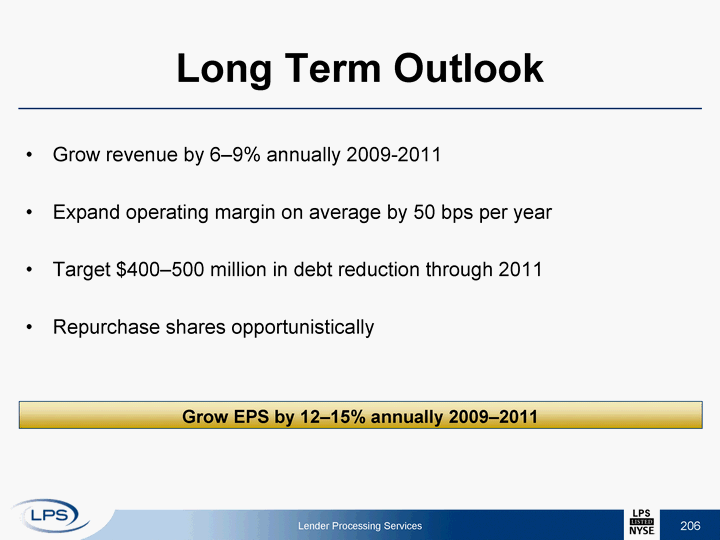
| Long Term Outlook Grow revenue by 6-9% annually 2009-2011 Expand operating margin on average by 50 bps per year Target $400-500 million in debt reduction through 2011 Repurchase shares opportunistically Lender Processing Services 411 Grow EPS by 12-15% annually 2009-2011 |


| Summary Leading market positions in: Technology, Data and Analytics Loan Transaction Services Revenue growth faster than market Expanding margins Attractive dividend Strong free cash flow Lender Processing Services 415 Focused on delivering above average returns to shareholders |


| Fidelity National Information Services Supplemental Materials Investor Day May 28, 2008 |

| 3 Use of Non-GAAP Measures |
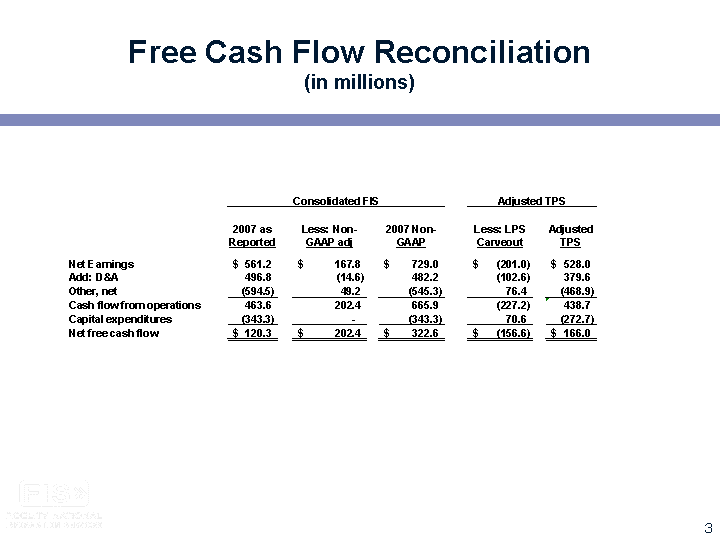
| 5 Free Cash Flow Reconciliation (in millions) |
| | |
| | | |
 | | PRESS RELEASE |
FIS FIRST QUARTER REVENUES INCREASE 20.5%
Reiterates Full-Year Earnings Guidance
Lender Processing Services Growth Rate Accelerates to 12.6%
Jacksonville, Fla. -April 24, 2008— Fidelity National Information Services, Inc. (NYSE:FIS), a leading global provider of technology services to financial institutions, today announced financial results for the first quarter of 2008. First quarter results include the divestiture of certain businesses which are reported as discontinued operations for all periods presented.
Consolidated revenue increased 20.5% to $1.3 billion, including approximately $141.3 million in revenue from eFunds, which was acquired in September 2007. Excluding eFunds, revenue increased 7.3% over the comparable 2007 quarter, driven by 12.6% growth in Lender Processing Services and 4.5% growth in Transaction Processing Services. GAAP net earnings totaled $70.5 million, and net earnings per diluted share totaled $0.36, including $0.01 from discontinued operations.
Adjusted EBITDA increased 14.8% to $312.3 million compared to $272.0 million in the first quarter of 2007. Adjusted net earnings (formerly referred to as “cash earnings”) totaled $0.57 per diluted share compared to $0.54 in the prior-year quarter. Adjusted net earnings from continuing operations totaled $0.56 per diluted share compared to $0.52 per diluted share in the prior year.
“While FIS achieved solid revenue growth in the first quarter, earnings came in at the low end of our guidance, primarily due to lower-than-expected software and professional services revenue,” stated William P. Foley, II, executive chairman for FIS. “In anticipation of continued economic weakness and the challenges faced by the financial services industry, we are taking a slightly more cautious view towards revenue growth in 2008. As a result, we have taken measures to reduce costs in order to achieve our previously provided earnings guidance.”
FIS updated its outlook for 2008 revenue to reflect growth of 13% to 16% (5% to 8% excluding eFunds) over comparable revenue of $4.8 billion in 2007. The company’s previously issued guidance was revenue growth of 14% to 16% (6% to 8% excluding eFunds). Management reiterated its outlook for full year adjusted net earnings of $2.73 to $2.83 per diluted share.
Consistent with prior guidance, this updated guidance excludes pre-tax eFunds integration expense of approximately $25 million, up-front costs associated with the spin-off of Lender Processing Services, as well as incremental operating expense for the proposed stand-alone entity. Also excluded is an estimated pre-tax restructuring charge of approximately $15 million to $20 million, which the company expects to record in the second quarter of 2008 in connection with various cost reduction initiatives.
Divestitures and Discontinued Operations
FIS recently completed the sale of two non-strategic businesses, including FIS Credit Services and Certegy Gaming Services’ quasi-credit card cash advance, debit and casino ATM operations. These sales are not expected to impact FIS’ future earnings. The company also established a plan to exit a small operation that provides services to the residential homebuilding market. These businesses have been accounted for as discontinued operations in the first quarter of 2008 and for all periods presented, along with Property Insight which was sold in the third quarter of 2007. Information pertaining to historical revenue and earnings per diluted share is provided in the attachments to this press release.
FIS’ operating results are presented in accordance with generally accepted accounting principles (“GAAP”) and on an adjusted pro forma basis, which management believes provides more meaningful comparisons between the periods presented. The adjusted results exclude the after-tax impact of merger and acquisition and integration expenses, certain stock compensation charges, debt restructuring and other charges, gains (losses) on the sale of certain non-strategic assets and acquisition related amortization.
Segment Information
Transaction Processing Services (TPS), which provides core processing and payment technology solutions to financial institutions, generated revenue of $826.8 million in the quarter (including $141.3 million from eFunds) compared to $656.0 million in the prior-year period, an increase of 26.0%. Adjusted EBITDA increased 22.3% to $195.5 million. The adjusted EBITDA margin was 23.6% compared to 24.4% in the first quarter of 2007. The decline in margin was driven by a change in revenue mix, including a decline in higher margin software license sales and professional services revenue compared to the prior-year quarter.
Excluding eFunds, TPS revenue increased 4.5% to $685.5 million driven by 17.0% growth in International to $161.7 million and 4.9% growth in Integrated Financial Solutions to $297.6 million. Enterprise Solutions revenue declined 3.4% to $226.6 million, as a result of lower software license sales, professional services revenues and lower retail check volume compared to the 2007 quarter.
Lender Processing Services (LPS), which provides core processing, information and outsourced solutions to mortgage lenders and servicers, generated revenue of $464.1 million, a 12.6% increase compared to the prior-year quarter, driven by 18.3% growth in Information Services. The strong results are attributable to growth in FIS’ default and appraisal services. Mortgage Processing revenue declined $6.7 million, or 7.4%, to $84.3 million compared to the first quarter of 2007, due to a decrease in software and maintenance revenue, and the previously announced deconversion of a customer portfolio in the fourth quarter of 2007. Lender Processing Services’ adjusted EBITDA increased 12.0% to $148.4 million. The adjusted EBITDA margin of 32.0% was comparable to the prior-year quarter.
Corporate expense, as adjusted, increased $8.9 million to $35.3 million in the first quarter of 2008, resulting from higher stock option expense and the addition of eFunds. The effective tax rate was 36.6%.
Free Cash Flow
Free cash flow from operations (net cash provided by operating activities minus additions to property and equipment and capitalized software) was $78.7 million. Working capital and other adjustments to cash totaled approximately $26.4 million, driven primarily by continued strong revenue growth in default services.
Net free cash flow, which excludes the after-tax impact of non-operating items, including merger and integration costs, costs associated with the spin-off of Lender Processing Services and other acquisition and investment related activities, was $127.3 million.
Status of Lender Processing Services Spin-Off
On March 27, 2008, Lender Processing Services, Inc. (LPS) filed a Form 10 with the Securities and Exchange Commission. On April 14, 2008, FIS received a formal private letter ruling from the Internal Revenue Service that the spin-off of Lender Processing Services will be tax-free to FIS as well as to LPS and FIS shareholders. The company expects to complete the distribution to shareholders by mid-2008.
Use of Non-GAAP Financial Information
FIS reports several non-GAAP measures, including earnings before interest, taxes, depreciation and amortization (“EBITDA”) and adjusted net earnings. The adjusted results exclude the after-tax impact of merger and acquisition and integration expenses, certain stock compensation charges, debt restructuring and other costs, gains (losses) on the sale of certain non-strategic assets and acquisition related amortization. Any non-GAAP measures should be considered in context with the GAAP financial presentation and should not be considered in isolation or as a substitute for GAAP net earnings. A reconciliation of these non-GAAP measures to related GAAP measures is included in the attachments to this release.
Conference Call and Webcast
FIS will host a call with investors and analysts to discuss first quarter 2008 results on Thursday, April 24, 2008, beginning at 5:00 p.m. Eastern daylight time. To register for the event and to access supplemental materials, go to the Investor Relations section at www.fidelityinfoservices.com and click on “Events and Multimedia.” Those wishing to participate via the telephone may do so by calling 800-230-1093 (USA) or 612-288-0337 (International). The webcast replay will be available on FIS’ Investor Relations website. The telephone replay will be available through May 1, 2008, by dialing 800-475-6701 (USA) or 320-365-3844 (International). The access code will be 917569.
To access a PDF version of this release and accompanying financial tables, go tohttp://www.investor.fidelityinfoservices.com.
About Fidelity National Information Services
Fidelity National Information Services, Inc. (NYSE:FIS) is a leading provider of core processing for financial institutions; card issuer and transaction processing services; mortgage loan processing and mortgage-related information products; and outsourcing services to financial institutions, retailers, mortgage lenders and real estate professionals. FIS has processing and technology relationships with 41 of the top 50 global banks, including nine of the top 10. Approximately 50 percent of all U.S. residential mortgages are processed using FIS software. FIS is a member of Standard and Poor’s (S&P) 500® Index and has been ranked the number one overall financial technology provider in the world byAmerican Bankerand the research firm Financial Insights in the annual FinTech 100 rankings. Headquartered in Jacksonville, Fla., FIS maintains a strong global presence, serving more than 9,000 financial institutions in more than 80 countries worldwide. For more information on Fidelity National Information Services, please visit www.fidelityinfoservices.com.
Forward-Looking Statements
This press release contains forward-looking statements that involve a number of risks and uncertainties. Statements that are not historical facts, including statements about our beliefs and expectations, are forward-looking statements. Forward-looking statements are based on management’s beliefs, as well as assumptions made by, and information currently available to, management. Because such statements are based on expectations as to future economic performance and are not statements of fact, actual results may differ materially from those projected. We undertake no obligation to update any forward-looking statements, whether as a result of new information, future events or otherwise. The risks and uncertainties which forward-looking statements are subject to include, but are not limited to: risks associated with the proposed spin-off of
the Lender Processing Services (LPS) segment by FIS, including the ability of FIS to contribute certain LPS assets and liabilities to the entity to be spun off, the ability of LPS to obtain debt on acceptable terms and exchange that debt with certain holders of the FIS debt, obtaining government approvals, obtaining FIS Board of Directors approval, market conditions for the spin-off, and the risk that the spin-off will not be beneficial once accomplished, including as a result of unexpected dis-synergies resulting from the separation or unfavorable reaction from customers, rating agencies or other constituencies; changes in general economic, business and political conditions, including changes in the financial markets; the effects of our substantial leverage (both at FIS prior to the spin-off and at the separate companies after the spin-off), which may limit the funds available to make acquisitions and invest in our business; the risks of reduction in revenue from the elimination of existing and potential customers due to consolidation in the banking, retail and financial services industries; failures to adapt our services to changes in technology or in the marketplace; adverse changes in the level of real estate activity, which would adversely affect certain of our businesses; our potential inability to find suitable acquisition candidates or difficulties in integrating acquisitions; significant competition that our operating subsidiaries face; the possibility that our acquisition of EFD/eFunds may not be accretive to our earnings due to undisclosed liabilities, management or integration issues, loss of customers, the inability to achieve targeted cost savings, or other factors; and other risks detailed in the “Statement Regarding Forward-Looking Information,” “Risk Factors” and other sections of the Company’s Form 10-K and other filings with the Securities and Exchange Commission.
FIS-e
SOURCE: Fidelity National Information Services, Inc.
CONTACT: Mary Waggoner, Senior Vice President, Investor Relations, 904-854-3282, mary.waggoner@fnis.com; Parag Bhansali, Senior Vice President Investor Relations and Strategy (LPS), 904-854-8640, parag.bhansali@fnis.com.
###
Exhibit A
FIDELITY NATIONAL INFORMATION SERVICES, INC. AND SUBSIDIARIES
CONSOLIDATED STATEMENTS OF EARNINGS - UNAUDITED
(In thousands, except per share data)
| | | | | | | | | |
| | | Three months ended March31, | |
| | | 2008 | | | 2007 | |
| Processing and services revenues | | $ | 1,290,952 | | | $ | 1,071,440 | |
| | | | | | | | | |
| Cost of revenues | | | 928,555 | | | | 772,381 | |
| Selling, general and administrative expenses | | | 163,551 | | | | 113,082 | |
| Research and development costs | | | 27,068 | | | | 27,109 | |
| | | | | | | |
| | | | | | | | | |
| Operating income | | | 171,778 | | | | 158,868 | |
| | | | | | | | | |
| Other income (expense): | | | | | | | | |
| Interest income | | | 3,018 | | | | 559 | |
| Other income (expense) | | | (451 | ) | | | 665 | |
| Interest expense | | | (62,448 | ) | | | (72,115 | ) |
| | | | | | | |
| Total other income (expense) | | | (59,881 | ) | | | (70,891 | ) |
| | | | | | | |
| | | | | | | | | |
| Earnings before income taxes, equity earnings and minority interest | | | 111,897 | | | | 87,977 | |
| Provision for income taxes | | | 40,955 | | | | 32,729 | |
| Equity in (losses) earnings of unconsolidated entities | | | (1,957 | ) | | | 936 | |
| Minority interest (expense) income | | | (122 | ) | | | 176 | |
| | | | | | | |
| | | | | | | | | |
| Net earnings from continuing operations | | | 68,863 | | | | 56,360 | |
| (Loss) earnings from discontinued operations, net of tax | | | (884 | ) | | | 3,143 | |
| Gain on disposition of discontinued operations, net of tax | | | 2,521 | | | | — | |
| | | | | | | |
| | | | | | | | | |
| Net earnings | | $ | 70,500 | | | $ | 59,503 | |
| | | | | | | |
| | | | | | | | | |
| Net earnings per share-basic from continuing operations | | $ | 0.35 | | | $ | 0.29 | |
| Net earnings per share-basic from discontined operations | | $ | 0.01 | | | $ | 0.02 | |
| | | | | | | |
| Net earnings per share-basic | | $ | 0.36 | | | $ | 0.31 | |
| | | | | | | |
| | | | | | | | | |
| Weighted average shares outstanding-basic | | | 194,542 | | | | 191,898 | |
| | | | | | | |
| | | | | | | | | |
| Net earnings per share-diluted from continuing operations | | $ | 0.35 | | | $ | 0.29 | |
| Net earnings per share-diluted from discontinued operations | | | 0.01 | | | | 0.01 | |
| | | | | | | |
| Net earnings per share-diluted | | $ | 0.36 | | | $ | 0.30 | |
| | | | | | | |
| | | | | | | | | |
| Weighted average shares outstanding-diluted | | | 196,537 | | | | 195,807 | |
| | | | | | | |
Exhibit B
FIDELITY NATIONAL INFORMATION SERVICES, INC. AND SUBSIDIARIES
CONSOLIDATED BALANCE SHEETS
(In thousands)
| | | | | | | | | |
| | | As of March 31, | | | As of December 31, | |
| | | 2008 | | | 2007 | |
| | | (unaudited) | | | | | |
Assets | | | | | | | | |
| Current assets: | | | | | | | | |
| Cash and cash equivalents | | $ | 327,965 | | | $ | 355,278 | |
| Settlement deposits | | | 42,742 | | | | 21,162 | |
| Trade receivables, net | | | 857,881 | | | | 825,915 | |
| Other receivables | | | 184,971 | | | | 206,746 | |
| Settlement receivables | | | 119,954 | | | | 116,935 | |
| Receivable from FNF | | | 11,687 | | | | 14,907 | |
| Prepaid expenses and other current assets | | | 174,914 | | | | 168,454 | |
| Deferred income taxes | | | 119,983 | | | | 120,098 | |
| | | | | | | |
| Total current assets | | | 1,840,097 | | | | 1,829,495 | |
| | | | | | | |
| | | | | | | | | |
| Property and equipment, net of accumulated depreciation and amortization | | | 402,848 | | | | 392,508 | |
| Goodwill | | | 5,338,727 | | | | 5,326,831 | |
| Other intangible assets, net of accumulated amortization | | | 986,084 | | | | 1,030,582 | |
| Computer software, net of accumulated amortization | | | 809,497 | | | | 775,151 | |
| Deferred costs | | | 269,946 | | | | 256,852 | |
| Investment in FNRES | | | 28,546 | | | | 30,491 | |
| Long-term notes receivable from FNF | | | 6,059 | | | | 6,154 | |
| Other noncurrent assets | | | 150,426 | | | | 146,519 | |
| | | | | | | |
| Total assets | | $ | 9,832,230 | | | $ | 9,794,583 | |
| | | | | | | |
| | | | | | | | | |
Liabilities and Stockholders’ Equity | | | | | | | | |
| Current liabilities: | | | | | | | | |
| Accounts payable and accrued liabilities | | $ | 606,250 | | | $ | 606,179 | |
| Settlement payables | | | 161,631 | | | | 129,799 | |
| Deferred revenues | | | 241,308 | | | | 246,222 | |
| Current portion of long-term debt | | | 270,615 | | | | 272,014 | |
| | | | | | | |
| Total current liabilities | | | 1,279,804 | | | | 1,254,214 | |
| | | | | | | |
| | | | | | | | | |
| Deferred revenues | | | 121,468 | | | | 111,884 | |
| Deferred income taxes | | | 382,245 | | | | 394,972 | |
| Long-term debt, excluding current portion | | | 3,908,702 | | | | 4,003,383 | |
| Other long-term liabilities | | | 288,930 | | | | 234,757 | |
| | | | | | | |
| Total liabilities | | | 5,981,149 | | | | 5,999,210 | |
| | | | | | | |
| | | | | | | | | |
| Minority interest | | | 11,249 | | | | 14,194 | |
| | | | | | | |
| Stockholders’ equity: | | | | | | | | |
| Preferred stock $0.01 par value | | | — | | | | — | |
| Common stock $0.01 par value | | | 1,990 | | | | 1,990 | |
| Additional paid in capital | | | 3,058,585 | | | | 3,038,203 | |
| Retained earnings | | | 960,296 | | | | 899,512 | |
| Accumulated other comprehensive earnings | | | 28,476 | | | | 53,389 | |
| Treasury stock | | | (209,515 | ) | | | (211,915 | ) |
| | | | | | | |
| Total stockholders’ equity | | | 3,839,832 | | | | 3,781,179 | |
| | | | | | | |
| Total liabilities and stockholders’equity | | $ | 9,832,230 | | | $ | 9,794,583 | |
| | | | | | | |
Exhibit C
FIDELITY NATIONAL INFORMATION SERVICES, INC. AND SUBSIDIARIES
CONSOLIDATED STATEMENTS OF CASH FLOWS — UNAUDITED
(In thousands)
| | | | | | | | | |
| | | Three months ended March 31, | |
| | | 2008 | | | 2007 | |
Cash flows from operating activities: | | | | | | | | |
| Net earnings | | $ | 70,500 | | | $ | 59,503 | |
| Adjustment to reconcile net earnings to net cash provided by operating activities: | | | | | | | | |
| Depreciation and amortization | | | 124,132 | | | | 110,612 | |
| Amortization of debt issue costs | | | 1,424 | | | | 28,324 | |
| (Gain) on sale of Credit business | | | (3,976 | ) | | | — | |
| Stock-based compensation cost | | | 26,378 | | | | 8,489 | |
| Deferred income taxes | | | 6,823 | | | | 8,950 | |
| Income tax benefit from exercise of stock options | | | (357 | ) | | | (10,752 | ) |
| Equity in earnings (loss) of unconsolidated entities | | | 1,957 | | | | (936 | ) |
| Minority interest | | | 122 | | | | 88 | |
| Changes in assets and liabilities, net of effects from acquisitions: | | | | | | | | |
| Net increase in trade receivables | | | (8,094 | ) | | | (65,348 | ) |
| Net increase in prepaid expenses and other assets | | | (12,023 | ) | | | (19,813 | ) |
| Additions to deferred contract costs | | | (21,955 | ) | | | (8,095 | ) |
| Net increase in deferred revenue | | | 4,616 | | | | 1,504 | |
| Net decrease in accounts payable, accrued liabilities and other liabilities | | | (21,321 | ) | | | (40,096 | ) |
| | | | | | | |
| | | | | | | | | |
| Net cash provided by operating activities | | | 168,226 | | | | 72,430 | |
| | | | | | | |
| | | | | | | | | |
Cash flows from investing activities: | | | | | | | | |
| Additions to property and equipment | | | (24,292 | ) | | | (27,410 | ) |
| Additions to capitalized software | | | (65,256 | ) | | | (46,706 | ) |
| Net proceeds from sale of company assets | | | 6,000 | | | | — | |
| Acquisitions, net of cash acquired | | | (1,916 | ) | | | (21,196 | ) |
| | | | | | | |
| | | | | | | | | |
| Net cash used in investing activities | | | (85,464 | ) | | | (95,312 | ) |
| | | | | | | |
| | | | | | | | | |
Cash flows from financing activities: | | | | | | | | |
| Borrowings | | | 1,283,600 | | | | 2,700,300 | |
| Debt service payments | | | (1,381,398 | ) | | | (2,689,045 | ) |
| Capitalized debt issue costs | | | (13 | ) | | | (12,573 | ) |
| Dividends paid | | | (9,716 | ) | | | (9,621 | ) |
| Income tax benefit from exercise of stock options | | | 357 | | | | 10,752 | |
| Stock options exercised | | | 5,991 | | | | 33,157 | |
| Treasury stock purchases | | | (9,944 | ) | | | — | |
| | | | | | | |
| | | | | | | | | |
| Net cash (used in) provided by financing activities | | | (111,123 | ) | | | 32,970 | |
| | | | | | | |
| | | | | | | | | |
| Effect of foreign currency exchange rates on cash | | | 1,048 | | | | 163 | |
| | | | | | | | | |
| Net (decrease) increase in cash and cash equivalents | | | (27,313 | ) | | | 10,251 | |
| | | | | | | | | |
| Cash and cash equivalents, at beginning of year | | | 355,278 | | | | 211,753 | |
| | | | | | | |
| | | | | | | | | |
| Cash and cash equivalents, at end of year | | $ | 327,965 | | | $ | 222,004 | |
| | | | | | | |
Exhibit D
FIDELITY NATIONAL INFORMATION SERVICES, INC.
SUPPLEMENTAL FINANCIAL INFORMATION — UNAUDITED
(In thousands, except per share data)
| | | | | | | | | | | | | | | | | | | | | | | | | |
| | | | | | | | | | | | | | | | | | | | | | | Full Year | |
| | | 3/31/2008 | | | 12/31/2007 | | | 9/30/2007 | | | 6/30/2007 | | | 3/31/2007 | | | 2007 | |
1. Revenues | | | | | | | | | | | | | | | | | | | | | | | | |
| | | | | | | | | | | | | | | | | | | | | | | | | |
Revenue from Continuing Operations: | | | | | | | | | | | | | | | | | | | | | | | | |
| | | | | | | | | | | | | | | | | | | | | | | | | |
| TPS | | | | | | | | | | | | | | | | | | | | | | | | |
| Integrated Financial Solutions | | $ | 368,585 | | | | 364,612 | | | | 308,803 | | | | 297,117 | | | | 283,753 | | | | 1,254,285 | |
| Enterprise Solutions | | | 280,544 | | | | 289,492 | | | | 241,395 | | | | 245,174 | | | | 234,560 | | | | 1,010,621 | |
| International | | | 178,109 | | | | 199,811 | | | | 147,242 | | | | 143,293 | | | | 138,185 | | | | 628,531 | |
| Other | | | (439 | ) | | | (1,657 | ) | | | (1,789 | ) | | | (773 | ) | | | (548 | ) | | | (4,767 | ) |
| | | | | | | | | | | | | | | | | | | |
| Total TPS Revenue | | | 826,799 | | | | 852,258 | | | | 695,651 | | | | 684,811 | | | | 655,950 | | | | 2,888,670 | |
| | | | | | | | | | | | | | | | | | | |
| LPS | | | | | | | | | | | | | | | | | | | | | | | | |
| Mortgage Processing | | | 84,268 | | | | 98,310 | | | | 88,323 | | | | 94,163 | | | | 91,005 | | | | 371,801 | |
| Information Services | | | 380,014 | | | | 352,556 | | | | 350,377 | | | | 342,090 | | | | 321,353 | | | | 1,366,376 | |
| Other | | | (169 | ) | | | (457 | ) | | | (1,463 | ) | | | (51 | ) | | | — | | | | (1,971 | ) |
| | | | | | | | | | | | | | | | | | | |
| Total LPS Revenue | | | 464,113 | | | | 450,409 | | | | 437,237 | | | | 436,202 | | | | 412,358 | | | | 1,736,206 | |
| | | | | | | | | | | | | | | | | | | |
| | | | | | | | | | | | | | | | | | | | | | | | | |
| Corporate | | | 40 | | | | 341 | | | | 4,343 | | | | 4,021 | | | | 3,132 | | | | 11,837 | |
| | | | | | | | | | | | | | | | | | | |
| | | | | | | | | | | | | | | | | | | | | | | | | |
| Total Revenue from Continuing Operations | | | 1,290,952 | | | | 1,303,008 | | | | 1,137,231 | | | | 1,125,034 | | | | 1,071,440 | | | | 4,636,713 | |
| | | | | | | | | | | | | | | | | | | |
| | | | | | | | | | | | | | | | | | | | | | | | | |
| Total Revenue from Discontinued Operations | | | 29,720 | | | | 27,406 | | | | 42,667 | | | | 51,204 | | | | 52,626 | | | | 173,903 | |
| | | | | | | | | | | | | | | | | | | |
| | | | | | | | | | | | | | | | | | | | | | | | | |
Revenue Growth from Prior Year Period (A) | | | | | | | | | | | | | | | | | | | | | | | | |
| | | | | | | | | | | | | | | | | | | | | | | | | |
| Revenue from Continuing Operations: | | | | | | | | | | | | | | | | | | | | | | | | |
| | | | | | | | | | | | | | | | | | | | | | | | | |
| TPS | | | | | | | | | | | | | | | | | | | | | | | | |
| Integrated Financial Solutions | | | 29.9 | % | | | 28.7 | % | | | 11.6 | % | | | 9.1 | % | | | 5.1 | % | | | 13.8 | % |
| Enterprise Solutions | | | 19.6 | % | | | 15.9 | % | | | 3.1 | % | | | 10.8 | % | | | 7.6 | % | | | 9.5 | % |
| International | | | 28.9 | % | | | 41.7 | % | | | 23.9 | % | | | 44.3 | % | | | 58.4 | % | | | 40.8 | % |
| Other | | | 19.9 | % | | | 14.1 | % | | | 33.6 | % | | | 73.2 | % | | | 83.9 | % | | | 56.3 | % |
| | | | | | | | | | | | | | | | | | | |
| Total TPS Revenue Growth | | | 26.0 | % | | | 26.8 | % | | | 11.0 | % | | | 16.1 | % | | | 14.7 | % | | | 17.4 | % |
| | | | | | | | | | | | | | | | | | | |
| LPS | | | | | | | | | | | | | | | | | | | | | | | | |
| Mortgage Information | | | -7.4 | % | | | 9.6 | % | | | -2.3 | % | | | 4.6 | % | | | 2.5 | % | | | 3.6 | % |
| Information Services | | | 18.3 | % | | | 14.0 | % | | | 16.7 | % | | | 25.4 | % | | | 19.6 | % | | | 18.7 | % |
| Other | | | — | | | | -104.6 | % | | | -112.7 | % | | | -100.4 | % | | | -100.0 | % | | | -104.4 | % |
| | | | | | | | | | | | | | | | | | | |
| Total LPS Revenue Growth | | | 12.6 | % | | | 10.1 | % | | | 8.7 | % | | | 16.6 | % | | | 11.8 | % | | | 11.7 | % |
| | | | | | | | | | | | | | | | | | | |
| | | | | | | | | | | | | | | | | | | | | | | | | |
| Corporate | | | -98.7 | % | | | 120.9 | % | | | 364.8 | % | | | 47.3 | % | | | 94.5 | % | | | 1007.3 | % |
| | | | | | | | | | | | | | | | | | | |
| | | | | | | | | | | | | | | | | | | | | | | | | |
| Total Revenue from Continuing Operations | | | 20.5 | % | | | 20.7 | % | | | 10.7 | % | | | 16.4 | % | | | 13.7 | % | | | 15.4 | % |
| | | | | | | | | | | | | | | | | | | |
| | | | | | | | | | | | | | | | | | | | | | | | | |
2. TPS Revenue from Continuing Operations, Excluding eFunds | | | | | | | | | | | | | | | | | | | | | | | | |
| TPS | | | | | | | | | | | | | | | | | | | | | | | | |
| Integrated Financial Solutions | | $ | 297,566 | | | | 297,912 | | | | 296,142 | | | | 297,117 | | | | 283,753 | | | | 1,174,924 | |
| Enterprise Solutions | | | 226,605 | | | | 244,121 | | | | 231,613 | | | | 245,174 | | | | 234,560 | | | | 955,468 | |
| International | | | 161,742 | | | | 170,782 | | | | 142,057 | | | | 143,293 | | | | 138,185 | | | | 594,317 | |
| Other | | | (423 | ) | | | (515 | ) | | | (789 | ) | | | (773 | ) | | | (548 | ) | | | (2,625 | ) |
| | | | | | | | | | | | | | | | | | | |
| Total TPS Revenue, excluding eFunds | | $ | 685,489 | | | | 712,300 | | | | 669,023 | | | | 684,811 | | | | 655,950 | | | | 2,722,083 | |
| | | | | | | | | | | | | | | | | | | |
| | | | | | | | | | | | | | | | | | | | | | | | | |
| Total Revenue from Continuing Operations, excluding eFunds | | $ | 1,149,642 | | | | 1,163,050 | | | | 1,110,603 | | | | 1,125,034 | | | | 1,071,440 | | | | 4,470,126 | |
| | | | | | | | | | | | | | | | | | | |
| | | | | | | | | | | | | | | | | | | | | | | | | |
TPS Revenue Growth from Prior Year Period, excluding eFunds (A) | | | | | | | | | | | | | | | | | | | | | | | | |
| | | | | | | | | | | | | | | | | | | | | | | | | |
| TPS | | | | | | | | | | | | | | | | | | | | | | | | |
| Integrated Financial Solutions | | | 4.9 | % | | | 5.2 | % | | | 7.0 | % | | | 9.1 | % | | | 5.1 | % | | | 6.6 | % |
| Enterprise Solutions | | | -3.4 | % | | | -2.3 | % | | | -1.0 | % | | | 10.8 | % | | | 7.6 | % | | | 3.5 | % |
| International | | | 17.0 | % | | | 21.2 | % | | | 19.5 | % | | | 44.3 | % | | | 58.4 | % | | | 33.2 | % |
| Other | | | 22.7 | % | | | 73.3 | % | | | 70.7 | % | | | 73.2 | % | | | 83.9 | % | | | 75.9 | % |
| | | | | | | | | | | | | | | | | | | |
| Total TPS Revenue Growth, excluding Efunds | | | 4.5 | % | | | 6.0 | % | | | 6.7 | % | | | 16.1 | % | | | 14.7 | % | | | 10.6 | % |
| | | | | | | | | | | | | | | | | | | |
| | | | | | | | | | | | | | | | | | | | | | | | | |
| Total Revenue Growth, excluding Efunds | | | 7.3 | % | | | 7.7 | % | | | 8.1 | % | | | 16.4 | % | | | 13.7 | % | | | 11.3 | % |
| | | | | | | | | | | | | | | | | | | |
| | | | | | | | | | | | | | | | | | | | | | | | | |
3. Depreciation and Amortization | | | | | | | | | | | | | | | | | | | | | | | | |
| | | | | | | | | | | | | | | | | | | | | | | | | |
| Depreciation and Amortization | | $ | 68,711 | | | | 79,171 | | | | 83,653 | | | | 68,027 | | | | 62,563 | | | | 293,414 | |
| Purchase Price Amortization | | | 46,560 | | | | 49,385 | | | | 40,599 | | | | 37,897 | | | | 40,780 | | | | 168,661 | |
| Other Amortization | | | 8,861 | | | | 9,347 | | | | 10,187 | | | | 7,968 | | | | 7,269 | | | | 34,771 | |
| | | | | | | | | | | | | | | | | | | |
| Total Depreciation and Amortization | | $ | 124,132 | | | | 137,903 | | | | 134,439 | | | | 113,892 | | | | 110,612 | | | | 496,846 | |
| | | | | | | | | | | | | | | | | | | |
| | | | | | | | | | | | | | | | | | | | | | | | | |
| Depreciation and Amortization Relating to Non-recurring Adjustments | | $ | — | | | | — | | | | 13,531 | | | | 393 | | | | 683 | | | | 14,608 | |
| Depreciation and Amortization from Discontinued Operations | | | 1,394 | | | | 1,322 | | | | 1,558 | | | | 1,714 | | | | 1,716 | | | | 6,310 | |
| | | | | | | | | | | | | | | | | | | |
| Total Depreciation and Amortization from Continuing Operations, as adjusted | | $ | 122,738 | | | | 136,581 | | | | 119,350 | | | | 111,785 | | | | 108,213 | | | | 475,928 | |
| | | | | | | | | | | | | | | | | | | |
Exhibit D
FIDELITY NATIONAL INFORMATION SERVICES, INC.
SUPPLEMENTAL FINANCIAL INFORMATION — UNAUDITED
(In thousands, except per share data)
| | | | | | | | | | | | | | | | | | | | | | | | | |
| | | | | | | | | | | | | | | | | | | | | | | Full Year | |
| | | 3/31/2008 | | | 12/31/2007 | | | 9/30/2007 | | | 6/30/2007 | | | 3/31/2007 | | | 2007 | |
4. Capital Expenditures | | | | | | | | | | | | | | | | | | | | | | | | |
| | | | | | | | | | | | | | | | | | | | | | | | | |
| TPS | | $ | 72,506 | | | | 71,664 | | | | 57,976 | | | | 50,279 | | | | 43,482 | | | | 223,401 | |
| LPS | | | 16,574 | | | | 23,706 | | | | 34,680 | | | | 22,039 | | | | 25,426 | | | | 105,851 | |
| Corporate | | | (522 | ) | | | 2,341 | | | | (3,057 | ) | | | 7,196 | | | | 4,183 | | | | 10,663 | |
| | | | | | | | | | | | | | | | | | | |
| Total Capital Expenditures — Continuing Operations | | | 88,558 | | | | 97,711 | | | | 89,599 | | | | 79,514 | | | | 73,091 | | | | 339,915 | |
| | | | | | | | | | | | | | | | | | | | | | | | | |
| Total Capital Expenditures — Discontinued Operations | | | 990 | | | | 917 | | | | 1,062 | | | | 380 | | | | 1,025 | | | | 3,384 | |
| | | | | | | | | | | | | | | | | | | |
| | | | | | | | | | | | | | | | | | | | | | | | | |
| Total Capital Expenditures | | $ | 89,548 | | | | 98,628 | | | | 90,661 | | | | 79,894 | | | | 74,116 | | | | 343,299 | |
| | | | | | | | | | | | | | | | | | | |
| | | | | | | | | | | | | | | | | | | | | | | | | |
5. Long-term Debt as of Period End and Interest Expense and Rates | | | | | | | | | | | | | | | | | | | | | | | | |
| | | | 2008 Q1 | | | | 2007 Q4 | | | | 2007 Q3 | | | | 2007 Q2 | | | | 2007 Q1 | | | | | |
| Term Note A | | $ | 2,034,375 | | | | 2,047,500 | | | | 2,060,625 | | | | 2,073,750 | | | | 2,086,875 | | | | | |
| Term Note B | | | 1,592,000 | | | | 1,596,000 | | | | 1,600,000 | | | | — | | | | — | | | | | |
| Revolver | | | 330,000 | | | | 308,000 | | | | 332,200 | | | | 430,500 | | | | 600,300 | | | | | |
| eFunds Notes | | | — | | | | 98,533 | | | | 98,226 | | | | — | | | | — | | | | | |
| Certegy Notes | | | 198,837 | | | | 198,221 | | | | 197,638 | | | | 197,040 | | | | 196,474 | | | | | |
| Other Long-term Debt | | | 24,105 | | | | 27,143 | | | | 32,187 | | | | 151,134 | | | | 145,631 | | | | | |
| | | | | | | | | | | | | | | | | | | |
| Total Long-term Debt | | $ | 4,179,317 | | | | 4,275,397 | | | | 4,320,876 | | | | 2,852,424 | | | | 3,029,280 | | | | | |
| | | | | | | | | | | | | | | | | | | | |
| | | | | | | | | | | | | | | | | | | | | | | | | |
| Total Interest Expense | | $ | 62,450 | | | | 68,864 | | | | 44,370 | | | | 42,991 | | | | 72,115 | | | | | |
| Less Debt Restructuring Charge | | | — | | | | — | | | | — | | | | — | | | | (27,164 | ) | | | | |
| | | | | | | | | | | | | | | | | | | |
| Adjusted Interest Expense | | $ | 62,450 | | | | 68,864 | | | | 44,370 | | | | 42,991 | | | | 44,951 | | | | | |
| | | | | | | | | | | | | | | | | | | | |
| | | | | | | | | | | | | | | | | | | | | | | | | |
| Average Interest Rate | | | 5.8 | % | | | 6.4 | % | | | 6.3 | % | | | 6.1 | % | | | 6.2 | % | | | | |
| | | | | | | | | | | | | | | | | | | | |
| | | | | | | | | | | | | | | | | | | | | | | | | |
6. Stock Compensation Expense | | | | | | | | | | | | | | | | | | | | | | | | |
| | | | | | | | | | | | | | | | | | | | | | | | | |
| Stock Compensation Expense, Excluding Acceleration Charges | | $ | 12,184 | | | | 10,170 | | | | 9,287 | | | | 8,751 | | | | 8,489 | | | | 36,697 | |
| Stock Acceleration Expense | | | 14,194 | | | | 1,653 | | | | 603 | | | | — | | | | — | | | | 2,256 | |
| | | | | | | | | | | | | | | | | | | |
| Total Stock Compensation Expense | | $ | 26,378 | | | | 11,823 | | | | 9,890 | | | | 8,751 | | | | 8,489 | | | | 38,953 | |
| | | | | | | | | | | | | | | | | | | |
Notes:
| | |
| (A) | | Growth calculation for 3/31/2007 growth includes Certegy revenue for January 2006. |
Exhibit E
FIDELITY NATIONAL INFORMATION SERVICES, INC.
NON-GAAP FINANCIAL INFORMATION — UNAUDITED
(In thousands, except per share data)
| | | | | | | | | | | | | | | | | | | | | | | | | |
| | | | | | | | | | | | | | | | | | | | | | | Full Year | |
| | | 3/31/2008 | | | 12/31/2007 | | | 9/30/2007 | | | 6/30/2007 | | | 3/31/2007 | | | 2007 | |
1. EBIT and EBITDA — Consolidated | | | | | | | | | | | | | | | | | | | | | | | | |
| | | | | | | | | | | | | | | | | | | | | | | | | |
| Revenue from Continuing Operations | | $ | 1,290,952 | | | | 1,303,008 | | | | 1,137,231 | | | | 1,125,034 | | | | 1,071,440 | | | | 4,636,713 | |
| | | | | | | | | | | | | | | | | | | | | | | | | |
| Operating Income | | $ | 171,778 | | | | 229,550 | | | | 177,831 | | | | 179,368 | | | | 158,868 | | | | 745,617 | |
| M&A, Restructuring and Integration Costs | | | 14,970 | | | | 1,653 | | | | 19,455 | | | | 2,195 | | | | 4,961 | | | | 28,264 | |
| LPS Spin Costs | | | 2,858 | | | | 500 | | | | — | | | | — | | | | — | | | | 500 | |
| | | | | | | | | | | | | | | | | | | |
| EBIT, as adjusted | | $ | 189,606 | | | | 231,703 | | | | 197,286 | | | | 181,563 | | | | 163,829 | | | | 774,381 | |
| | | | | | | | | | | | | | | | | | | |
| | | | | | | | | | | | | | | | | | | | | | | | | |
| Depr and Amort from Cont Ops, as adjusted | | | 122,738 | | | | 136,581 | | | | 119,350 | | | | 111,785 | | | | 108,213 | | | | 475,928 | |
| | | | | | | | | | | | | | | | | | | |
| EBITDA , as adjusted | | $ | 312,344 | | | | 368,284 | | | | 316,636 | | | | 293,348 | | | | 272,042 | | | | 1,250,309 | |
| | | | | | | | | | | | | | | | | | | |
| | | | | | | | | | | | | | | | | | | | | | | | | |
| EBIT Margin, as adjusted | | | 14.7 | % | | | 17.8 | % | | | 17.3 | % | | | 16.1 | % | | | 15.3 | % | | | 16.7 | % |
| | | | | | | | | | | | | | | | | | | |
| | | | | | | | | | | | | | | | | | | | | | | | | |
| EBITDA Margin, as adjusted | | | 24.2 | % | | | 28.3 | % | | | 27.8 | % | | | 26.1 | % | | | 25.4 | % | | | 27.0 | % |
| | | | | | | | | | | | | | | | | | | |
| | | | | | | | | | | | | | | | | | | | | | | | | |
2. EBITDA from Discontinued Operations | | | | | | | | | | | | | | | | | | | | | | | | |
| | | | | | | | | | | | | | | | | | | | | | | | | |
| Total EBITDA from Discontinued Operations | | $ | (3,128 | ) | | | 1,029 | | | | 5,646 | | | | 6,279 | | | | 7,007 | | | | 19,961 | |
| | | | | | | | | | | | | | | | | | | |
| | | | | | | | | | | | | | | | | | | | | | | | | |
3. EBITDA — TPS | | | | | | | | | | | | | | | | | | | | | | | | |
| | | | | | | | | | | | | | | | | | | | | | | | | |
| Revenue from Continuing Operations | | $ | 826,799 | | | | 852,258 | | | | 695,651 | | | | 684,811 | | | | 655,950 | | | | 2,888,670 | |
| | | | | | | | | | | | | | | | | | | | | | | | | |
| Operating Income | | $ | 107,879 | | | | 140,313 | | | | 86,092 | | | | 99,172 | | | | 90,059 | | | | 415,636 | |
| Depreciation | | | 43,124 | | | | 56,626 | | | | 56,447 | | | | 37,859 | | | | 33,751 | | | | 184,683 | |
| Purchase Price Amortization | | | 36,086 | | | | 35,949 | | | | 29,104 | | | | 27,027 | | | | 29,198 | | | | 121,278 | |
| Other Amortization | | | 8,386 | | | | 8,851 | | | | 9,585 | | | | 7,516 | | | | 6,869 | | | | 32,821 | |
| | | | | | | | | | | | | | | | | | | |
| EBITDA , before other items | | $ | 195,475 | | | | 241,739 | | | | 181,228 | | | | 171,574 | | | | 159,877 | | | | 754,418 | |
| | | | | | | | | | | | | | | | | | | |
| | | | | | | | | | | | | | | | | | | | | | | | | |
| M&A, Restructuring and Integration Costs | | | — | | | | — | | | | 4,614 | | | | — | | | | — | | | | 4,614 | |
| EBITDA, excluding other items | | $ | 195,475 | | | | 241,739 | | | | 185,842 | | | | 171,574 | | | | 159,877 | | | | 759,032 | |
| | | | | | | | | | | | | | | | | | | |
| | | | | | | | | | | | | | | | | | | | | | | | | |
| EBITDA Margin, as adjusted | | | 23.6 | % | | | 28.4 | % | | | 26.7 | % | | | 25.1 | % | | | 24.4 | % | | | 26.3 | % |
| | | | | | | | | | | | | | | | | | | |
| | | | | | | | | | | | | | | | | | | | | | | | | |
4. EBITDA — LPS | | | | | | | | | | | | | | | | | | | | | | | | |
| | | | | | | | | | | | | | | | | | | | | | | | | |
| Revenue from Continuing Operations | | $ | 464,113 | | | | 450,409 | | | | 437,237 | | | | 436,202 | | | | 412,358 | | | | 1,736,206 | |
| | | | | | | | | | | | | | | | | | | | | | | | | |
| Operating Income | | $ | 116,350 | | | | 122,527 | | | | 116,392 | | | | 107,846 | | | | 95,165 | | | | 441,930 | |
| Depreciation | | | 20,794 | | | | 20,455 | | | | 20,887 | | | | 22,281 | | | | 21,544 | | | | 85,167 | |
| Purchase Price Amortization | | | 10,107 | | | | 10,605 | | | | 10,538 | | | | 10,345 | | | | 11,046 | | | | 42,534 | |
| Other Amortization | | | 475 | | | | 496 | | | | 602 | | | | 452 | | | | 400 | | | | 1,950 | |
| | | | | | | | | | | | | | | | | | | |
| EBITDA , before other items | | $ | 147,726 | | | | 154,083 | | | | 148,419 | | | | 140,924 | | | | 128,155 | | | | 571,581 | |
| | | | | | | | | | | | | | | | | | | |
| | | | | | | | | | | | | | | | | | | | | | | | | |
| M&A, Restructuring and Integration Costs | | | 630 | | | | — | | | | 707 | | | | 1,802 | | | | 4,278 | | | | 6,787 | |
| | | | | | | | | | | | | | | | | | | |
| EBITDA, excluding other items | | $ | 148,356 | | | | 154,083 | | | | 149,126 | | | | 142,726 | | | | 132,433 | | | | 578,368 | |
| | | | | | | | | | | | | | | | | | | |
| | | | | | | | | | | | | | | | | | | | | | | | | |
| EBITDA Margin, as adjusted | | | 32.0 | % | | | 34.2 | % | | | 34.1 | % | | | 32.7 | % | | | 32.1 | % | | | 33.3 | % |
| | | | | | | | | | | | | | | | | | | |
| | | | | | | | | | | | | | | | | | | | | | | | | |
5. Net Earnings — Reconciliation | | | | | | | | | | | | | | | | | | | | | | | | |
| | | | | | | | | | | | | | | | | | | | | | | | | |
| Net Earnings | | $ | 70,500 | | | | 108,411 | | | | 245,304 | | | | 148,004 | | | | 59,503 | | | | 561,222 | |
| M&A, Restructuring and Integration Costs, net of tax | | | 9,491 | | | | (6,560 | ) | | | 10,505 | | | | 1,385 | | | | 3,116 | | | | 8,446 | |
| LPS Spin Costs, net of tax | | | 1,812 | | | | 315 | | | | — | | | | — | | | | — | | | | 315 | |
| Covansys Gain, net of tax | | | — | | | | — | | | | (114,939 | ) | | | (57,988 | ) | | | — | | | | (172,927 | ) |
| Gain on Property Insight, net of tax | | | — | | | | — | | | | (42,124 | ) | | | — | | | | — | | | | (42,124 | ) |
| Debt Restructure Charge, net of tax | | | — | | | | — | | | | — | | | | — | | | | 17,059 | | | | 17,059 | |
| | | | | | | | | | | | | | | | | | | |
| Net Earnings, excluding other items | | | 81,803 | | | | 102,166 | | | | 98,746 | | | | 91,401 | | | | 79,678 | | | | 371,991 | |
| | | | | | | | | | | | | | | | | | | |
| | | | | | | | | | | | | | | | | | | | | | | | | |
| After-tax Purchase Price Amortization | | | 29,518 | | | | 31,112 | | | | 25,578 | | | | 23,901 | | | | 25,612 | | | | 106,203 | |
| | | | | | | | | | | | | | | | | | | |
| | | | | | | | | | | | | | | | | | | | | | | | | |
| Adjusted Net Earnings | | $ | 111,321 | | | | 133,278 | | | | 124,324 | | | | 115,302 | | | | 105,290 | | | | 478,194 | |
| | | | | | | | | | | | | | | | | | | |
| | | | | | | | | | | | | | | | | | | | | | | | | |
| Net Earnings Per Share, excluding other items | | $ | 0.42 | | | | 0.52 | | | | 0.50 | | | | 0.46 | | | | 0.41 | | | | 1.89 | |
| | | | | | | | | | | | | | | | | | | |
| | | | | | | | | | | | | | | | | | | | | | | | | |
| Adjusted Net Earnings Per Share | | $ | 0.57 | | | | 0.68 | | | | 0.63 | | | | 0.59 | | | | 0.54 | | | | 2.43 | |
| | | | | | | | | | | | | | | | | | | |
| | | | | | | | | | | | | | | | | | | | | | | | | |
| Diluted Weighted Average Shares | | | 196,537 | | | | 196,741 | | | | 196,649 | | | | 196,977 | | | | 195,807 | | | | 196,546 | |
| | | | | | | | | | | | | | | | | | | |
Exhibit F
FIDELITY NATIONAL INFORMATION SERVICES, INC.
RECONCILIATION OF GAAP TO NON-GAAP CASHFLOW MEASURES — UNAUDITED
(In thousands)
| | | | | | | | | | | | | | | | | | | | | | | | | | | | | | | | | | | | | |
| | | 3/31/2007 | | | 6/30/2007 | | | 9/30/2007 | |
| | | GAAP | | | Adj | | | Non-GAAP | | | GAAP | | | Adj | | | Non-GAAP | | | GAAP | | | Adj | | | Non-GAAP | |
Cash flows from operating activities: | | | | | | | | | | | | | | | | | | | | | | | | | | | | | | | | | | | | |
| Net earnings (1) | | $ | 59,503 | | | | 3,115 | | | | 62,618 | | | $ | 148,004 | | | | 1,383 | | | | 149,387 | | | $ | 245,304 | | | | 109,728 | | | | 355,032 | |
| Adjustments to reconcile net earnings to net cash provided by operating activities: | | | | | | | | | | | | | | | | | | | | | | | | | | | | | | | | | | | | |
| Non-cash adjustments | | | 155,527 | | | | | | | | 155,527 | | | | 25,152 | | | | | | | | 25,152 | | | | (182,304 | ) | | | | | | | (182,304 | ) |
| Working capital adjustments (2) | | | (142,600 | ) | | | 12,700 | | | | (129,900 | ) | | | (2,499 | ) | | | 18,100 | | | | 15,601 | | | | (49,681 | ) | | | 9,500 | | | | (40,181 | ) |
| | | | | | | |
| Net cash provided by operating activities | | | 72,430 | | | | 15,815 | | | | 88,245 | | | | 170,657 | | | | 19,483 | | | | 190,140 | | | | 13,319 | | | | 119,228 | | | | 132,547 | |
| | | | | | | |
| | | | | | | | | | | | | | | | | | | | | | | | | | | | | | | | | | | | | |
| Capital expenditures included in investing activities: | | | | | | | | | | | | | | | | | | | | | | | | | | | | | | | | | | | | |
| Additions to property and equipment | | | (27,410 | ) | | | | | | | (27,410 | ) | | | (32,792 | ) | | | | | | | (32,792 | ) | | | (25,184 | ) | | | | | | | (25,184 | ) |
| Additions to capitalized software | | | (46,706 | ) | | | | | | | (46,706 | ) | | | (47,102 | ) | | | | | | | (47,102 | ) | | | (65,477 | ) | | | | | | | (65,477 | ) |
| | | | | | | |
| Net capital expenditures | | | (74,116 | ) | | | — | | | | (74,116 | ) | | | (79,894 | ) | | | — | | | | (79,894 | ) | | | (90,661 | ) | | | — | | | | (90,661 | ) |
| | | | | | | |
| Net free cash flow | | $ | (1,686 | ) | | | 15,815 | | | | 14,129 | | | $ | 90,763 | | | | 19,483 | | | | 110,246 | | | $ | (77,342 | ) | | | 119,228 | | | | 41,886 | |
| | | | | | | |
| | | | | | | | | | | | | | | | | | | | | | | | | | | | | | | | | | | | | |
Notes: | | | | | | | | | | | | | | | | | | | | | | | | | | | | | | | | | | | | |
| (1) Adjustments to Net Earnings | | | | | | | | | | | | | | | | | | | | | | | | | | | | | | | | | | | | |
| Eliminate after-tax impact of non-recurring integration costs | | | | | | | 3,115 | | | | | | | | | | | | 1,383 | | | | | | | | | | | | 3,168 | | | | | |
| | | | | | | | | | | | | | | | | | | | | | | | | | | | | | | | | | | | | |
| Eliminate payment of tax liabilities associated with disposition of non-strategic investments | | | | | | | — | | | | | | | | | | | | — | | | | | | | | | | | | 106,560 | | | | | |
| | | | | | | | | | | | | | | | | | | | | | | | | | | | | | | | | | |
| | | | | | | | 3,115 | | | | | | | | | | | | 1,383 | | | | | | | | | | | | 109,728 | | | | | |
| | | | | | | | | | | | | | | | | | | | | | | | | | | | | | | | | | |
| | | | | | | | | | | | | | | | | | | | | | | | | | | | | | | | | | | | | |
| (2) Adjustments to working capital reflect elimination of settlement of various acquisition related liabilities. | | | | | | | | | | | | | | | | | | | | | | | | | | | | | | | | | | | | |
| | | | | | | | | | | | | | | | | | | | | | | | | | | | | | | | | | | | | |
| | | 12/31/2007 | | | Full Year - 2007 | | | 3/31/2008 | |
| | | GAAP | | | Adj | | | Non-GAAP | | | GAAP | | | Adj | | | Non-GAAP | | | GAAP | | | Adj | | | Non-GAAP | |
Cash flows from operating activities: | | | | | | | | | | | | | | | | | | | | | | | | | | | | | | | | | | | | |
| Net earnings (1) | | $ | 108,411 | | | | 38,990 | | | | 147,401 | | | $ | 561,222 | | | | 153,216 | | | | 714,438 | | | $ | 70,500 | | | | 2,304 | | | | 72,804 | |
| Adjustments to reconcile net earnings to net cash provided by operating activities: | | | | | | | | | | | | | | | | | | | | | | | | | | | | | | | | | | | | |
| Non-cash adjustments | | | 181,495 | | | | | | | | 181,495 | | | | 179,870 | | | | — | | | | 179,870 | | | | 156,504 | | | | | | | | 156,504 | |
| Working capital adjustments (2) | | | (82,760 | ) | | | 8,870 | | | | (73,890 | ) | | | (277,540 | ) | | | 49,170 | | | | (228,370 | ) | | | (58,778 | ) | | | 46,342 | | | | (12,436 | ) |
| | | | | | | |
| Net cash provided by operating activities | | | 207,146 | | | | 47,860 | | | | 255,006 | | | | 463,552 | | | | 202,386 | | | | 665,938 | | | | 168,226 | | | | 48,646 | | | | 216,872 | |
| | | | | | | |
| | | | | | | | | | | | | | | | | | | | | | | | | | | | | | | | | | | | | |
| Capital expenditures included in investing activities: | | | | | | | | | | | | | | | | | | | | | | | | | | | | | | | | | | | | |
| Additions to property and equipment | | | (28,446 | ) | | | | | | | (28,446 | ) | | | (113,832 | ) | | | — | | | | (113,832 | ) | | | (24,292 | ) | | | | | | | (24,292 | ) |
| Additions to capitalized software | | | (70,182 | ) | | | | | | | (70,182 | ) | | | (229,467 | ) | | | — | | | | (229,467 | ) | | | (65,256 | ) | | | | | | | (65,256 | ) |
| | | | | | | |
| Net capital expenditures | | | (98,628 | ) | | | — | | | | (98,628 | ) | | | (343,299 | ) | | | — | | | | (343,299 | ) | | | (89,548 | ) | | | — | | | | (89,548 | ) |
| | | | | | | |
| Net free cash flow | | $ | 108,518 | | | | 47,860 | | | | 156,378 | | | $ | 120,253 | | | | 202,386 | | | | 322,639 | | | $ | 78,678 | | | | 48,646 | | | | 127,324 | |
| | | | | | | |
Notes: | | | | | | | | | | | | | | | | | | | | | | | | | | | | | | | | | | | | |
| (1) Adjustments to Net Earnings | | | | | | | | | | | | | | | | | | | | | | | | | | | | | | | | | | | | |
| Eliminate after-tax impact of non-recurring integration costs | | | | | | | — | | | | | | | | | | | | 7,666 | | | | | | | | | | | | 2,304 | | | | | |
| | | | | | | | | | | | | | | | | | | | | | | | | | | | | | | | | | | | | |
| Eliminate payment of tax liabilities associated with disposition of non-strategic investments | | | | | | | 38,990 | | | | | | | | | | | | 145,550 | | | | | | | | | | | | — | | | | | |
| | | | | | | | | | | | | | | | | | | | | | | | | | | | | | | | | | |
| | | | | | | | 38,990 | | | | | | | | | | | | 153,216 | | | | | | | | | | | | 2,304 | | | | | |
| | | | | | | | | | | | | | | | | | | | | | | | | | | | | | | | | | |
| | | | | | | | | | | | | | | | | | | | | | | | | | | | | | | | | | | | | |
| (2) Adjustments to working capital reflect elimination of settlement of various acquisition related liabilities. | | | | | | | | | | | | | | | | | | | | | | | | | | | | | | | | | | | | |
Appendix G
FIDELITY NATIONAL INFORMATION SERVICES, INC.
SEGMENT INFORMATION FROM CONTINUING OPERATIONS — UNAUDITED
(In thousands)
3/31/2008
| | | | | | | | | | | | | | | | | |
| | | Transaction | | Lender | | Corporate | | |
| | | Processing Services | | Processing Services | | and Other | | Total |
| Processing and services revenue | | $ | 826,799 | | | | 464,113 | | | | 40 | | | | 1,290,952 | |
| Cost of revenues | | | 634,264 | | | | 294,291 | | | | — | | | | 928,555 | |
| | | |
| Gross profit | | | 192,535 | | | | 169,822 | | | | 40 | | | | 362,397 | |
| Selling, general and admin costs | | | 65,176 | | | | 45,884 | | | | 52,491 | | | | 163,551 | |
| Research development costs | | | 19,480 | | | | 7,588 | | | | — | | | | 27,068 | |
| | | |
| Operating income | | | 107,879 | | | | 116,350 | | | | (52,451 | ) | | | 171,778 | |
| |
| Depreciation and amortization | | | 87,596 | | | | 31,376 | | | | 3,766 | | | | 122,738 | |
| | | |
| EBITDA | | $ | 195,475 | | | | 147,726 | | | | (48,685 | ) | | | 294,516 | |
| | | |
| Merger and acquisition costs | | | — | | | | 630 | | | | 14,340 | | | | 14,970 | |
| LPS spin costs | | | — | | | | — | | | | 2,858 | | | | 2,858 | |
| | | |
| EBITDA, excluding selected items | | $ | 195,475 | | | | 148,356 | | | | (31,487 | ) | | | 312,344 | |
| | | |
3/31/2007
| | | | | | | | | | | | | | | | | |
| | | Transaction | | Lender | | Corporate | | |
| | | Processing Services | | Processing Services | | and Other | | Total |
| Processing and services revenue | | $ | 655,950 | | | | 412,358 | | | | 3,132 | | | | 1,071,440 | |
| Cost of revenues | | | 507,487 | | | | 264,894 | | | | — | | | | 772,381 | |
| | | |
| Gross profit | | | 148,463 | | | | 147,464 | | | | 3,132 | | | | 299,059 | |
| Selling, general and admin costs | | | 40,886 | | | | 42,708 | | | | 29,488 | | | | 113,082 | |
| Research development costs | | | 17,518 | | | | 9,591 | | | | — | | | | 27,109 | |
| | | |
| Operating income | | | 90,059 | | | | 95,165 | | | | (26,356 | ) | | | 158,868 | |
| |
| Depreciation and amortization | | | 69,818 | | | | 32,990 | | | | 6,088 | | | | 108,896 | |
| | | |
| EBITDA | | $ | 159,877 | | | | 128,155 | | | | (20,268 | ) | | | 267,764 | |
| | | |
| Merger and acquisition costs | | | — | | | | 4,278 | | | | — | | | | 4,278 | |
| | | |
| EBITDA, excluding selected items | | $ | 159,877 | | | | 132,433 | | | | (20,268 | ) | | | 272,042 | |
| | | |


