EXHIBIT 99.1
FIS Investor Day March 27, 2007 |
Forward-Looking Statements This presentation will contain forward-looking statements that involve a number of risks and uncertainties. Statements that are not historical facts, including statements about our beliefs and expectations, are forward-looking statements. Forward-looking statements are based on management's beliefs, as well as assumptions made by, and information currently available to, management. Because such statements are based on expectations as to future economic performance and are not statements of fact, actual results may differ materially from those projected. We undertake no obligation to update any forward-looking statements, whether as a result of new information, future events or otherwise. The risks and uncertainties which forward- looking statements are subject to include, but are not limited to: changes in general economic, business and political conditions, including changes in the financial markets; the effects of our substantial leverage, which may limit the funds available to make acquisitions and invest in our business; the risks of reduction in revenue from the elimination of existing and potential customers due to consolidation in the banking, retail and financial services industries; failures to adapt our services to changes in technology or in the marketplace; adverse changes in the level of real estate activity, which would adversely affect certain of our businesses; our potential inability to find suitable acquisition candidates or difficulties in integrating acquisitions; significant competition that our operating subsidiaries face; and other risks detailed in the "Statement Regarding Forward- Looking Information," "Risk Factors" and other sections of the Company's Form 10-K and other filings with the Securities and Exchange Commission. |
Agenda Strategic Overview Bill Foley Business Review Lee Kennedy Integrated Financial Solutions Gary Norcross Enterprise Banking Solutions Frank Sanchez International Mike Sanchez Mortgage Processing Dan Scheuble Mortgage Information Services Eric Swenson Financial Summary Jeff Carbiener Q & A Panel Product Demonstrations/ Enterprise Command Center Tour |
Strategic Overview William P. Foley, II Executive Chairman |
FIS Objectives (CEY Acquisition) Strengthen Competitive Position Augment Management Team Expanded product capabilities to include payment services Further penetrated international markets Leveraged IFS customer base Well respected in the marketplace Blended key talent from FIS/CEY Deeper, stronger, more focused Operational experience and financial discipline |
FIS Objectives (CEY Acquisition) Drive Higher Growth Rates Unlock Shareholder Value Excellent financial performance 8.8% pro forma revenue growth in 2006 Value of FIS not recognized as subsidiary of FNF |
Strategic Accomplishments Successfully completed FIS/CEY merger Distributed shares to former FNF shareholders Eliminated parent company overhang Created wholly independent operating entity Increased share liquidity Provides increased flexibility for future M&A activity Added to S&P 500 Index |
Strategic Accomplishments Other Acquisitions and Divestitures Acquired Watterson Prime Due diligence for secondary market portfolios Acquired Second Foundation Added captive offshore resources Sold 61% stake in FNRES to FNF |
2007 Strategic Initiatives Capital Allocation Debt structure and repayment Refinanced debt facilities - estimated pre-tax savings of $15 million Better positioned to capitalize on acquisition opportunities (more flexibility) Share repurchases $160 million (4.3 million shares) repurchased in 2006 $200 million current authorization Strategic acquisitions |
2007 Strategic Initiatives Industry consolidation Increased M&A opportunities on a larger scale FIS M&A objectives: Build greater scale Supplement product capability Expand market presence Increase investment capacity |
Business Review Lee A. Kennedy President & Chief Executive Officer |
Business Review 2006 Accomplishments and Results 2007 Initiatives and Priorities |
2006 Results 8.8% pro forma revenue growth 10.6% pro forma EBITDA growth Achieved excellent financial results driven by: Record New Sales Successful Integration of FIS &CEY Core & Ancillary Product Integration Strong Cost Management |
2006 Pro Forma Revenue Growth Initial Guidance 2/2006 4 - 6% 2nd Quarter Guidance 7/2006 5 - 7% 7 - 8% 3rd Quarter Guidance 10/2006 2006 Results 8.8% (9.1% normalized*) TPS - 9.6% LPS - 7.5% *Excludes $21.6M contract termination fee in 2005 and $14.4M acquired revenue in 2006 |
Organic Revenue Growth Drivers Targeted Large Opportunities Improved Sales Force Effectiveness Cross-Sales of Additional Products & Services Targeted New Markets And Services BB&T Bear Stearns/EMC National City ING National Australia Bank Wamu IFS - $60M cross sales Brazil Card Processing JV Brazil Item Processing Chase (Mortgage) Wamu Bear Stearns/EMC RBC Centura (Channel) Comerica (Channel) John Deere (Profile) Nationwide (Profile) Sedgwick (DP Outsourcing) Ohio Savings (Item Processing) Home Equity Processing PHH Everhome Cenlar Strong accountability and performance Generated excellent results across all businesses IFS International Lender Processing Over $3.0 Billion in Total New Sales Contract Revenue |
Integrated FIS/CEY Generated $30M+ expense synergies ($50M run rate in 2007) Reduced corporate overhead Centralized business unit support Combined benefit plans Consolidated service centers and operating organizations Consolidated data centers (final mid-2007) Integrated payment and core processing systems and support Achieved $60M+ revenue synergies |
Increased Profitability and Cash Flow Refined organizational structure Strengthened financial reporting systems Stringent expense management Centralized technology support and management Centralized marketing support (1) Excludes $20.7M contract termination fee in 2005 and $$8.9M Brazil BPO start-up costs in 2006 Increased consolidated margin +40 basis points +120 basis points normalized(1) |
Focused Core and Ancillary Product Integration Community Institution Data Flow - Current |
Focused Core and Ancillary Product Integration Integrated Lender Processing Services |
Focused Core and Ancillary Product Integration Integrated Lender Processing Services Data Services Appraisal Services Origination Services Tax Services Flood Services Valuation Services Default Services Mortgage Processing Platform MSP Integrated Customer Data and Support FIS Workflow Manager |
2007 Initiatives & Priorities |
Revenue Initiatives Drive New Revenue Sources Continue To Drive Strong Revenue Growth Consumer and Expedited Bill Payment Channel Solutions Tax Services - "A" paper Mortgage Services imaging/archival capabilities Increase mid-market penetration HELOC processing Risk Management Services Continue to Execute Improve sales force effectiveness Leverage customer relationships and cross-sell products across business lines Focus on achieving large deals - "Home Runs" |
Operating Priorities Reduce Cost Base Chase mortgage processing BB&T card processing Brazil card processing Brazil item processing Drive Higher Profitability Complete Major Customer Conversions Reduce procurement expense Reduce technology spend Consolidate operating platforms Increase use of offshore resources |
FIS Competitive Position FOCUS AND EXECUTE Industry's most comprehensive integrated core processing and ancillary product capability Strong domain expertise Broadest geographic reach Under-penetrated diverse customer base Significant market share opportunities |
Integrated Financial Solutions Gary Norcross, President |
2006 Revenue Composition 25% 17% 30% 28% eBusiness Core Processing Item Processing Credit Card $1.1 Billion Annual Revenue |
Go-To-Market Strategy Single sales organization representing entire FIS value proposition Clearly defined roles around: New account sales Client Management Product Sales Specialists Reinforced by: Product managers Business line executives Clear messaging to/from client base and market Community banks, credit unions, savings institutions Financial Institutions looking for product and services suite that: Drives Operational Efficiencies Enhances Consumer Service Positions for rapid response to industry drivers Target Market Integrated Sales Culture |
2006 Sales Metrics Core 25% Item Processing 25% eBusiness 25% Core Processing Barksdale Credit Union 1st United Bank De Novo Banks 50 of 189 in 2006 (26%) 37 of 171 in 2005 (22%) Credit Card BB&T Palmetto Bank Item Processing Sun National Bank Ohio Savings Bank eBusiness RG Premier Bank FNB, Ft. Walton Significant 2006 Wins $623M in Total Contract Value 35% TCV increase over prior year 75% of TCV sold within Client Base Credit Card 25% |
Key Market Drivers Fraud exposure increasing across all delivery channels Regulatory compliance and security factors driving more decisions Payment and deposit "capture point" continues to change Growing outsourcing opportunity for capital intensive applications in declining transaction volume markets (IP, lockbox, print & mail) Continued strength in community bank de- novo market Commercial Services suite opportunity developing for providers that have assembled appropriate asset pool Loyalty and affinity programs across all delivery channels critical to retention (client, employee) Business recovery services offer revenue opportunities for the large/broad service providers |
Comprehensive Product Suite ATM/Debit/EFT Item Processing Credit Card Processing Card Support Services Merchant Processing Loyalty Programs E Banking and Bill Payment Core Bank Processing Improved Operating Efficiencies Enhanced Consumer Service |
Integrated Financial Solutions Core Processing Broad range of integrated core solutions specifically developed for commercial banks, credit unions and savings institutions Real-time and Proof Of Deposit environmental support De-novo through large mid-tier financial institutions Outsourced (ASP Model) In-house option Long-term contracts (3 - 7 years in duration) > 85% of business line revenue generated is recurring Competitors Fiserv Jack Henry Metavante OSI Clients Core Clients 1,283 Community Banks 60% Credit Unions 33% Savings Banks 7% |
Four Primary Core Processing Platforms Represent over 75% of IFS Core Processing Revenue Credit Unions Community Banks MISER Mercury HORIZON BancPac Savings Banks MISER Size Regional Community |
Full range of item processing services Conventional - Image exchange (Check 21) Branch capture - Print and mail Commercial capture Strong trend towards outsourcing in this business Long-term contracts (3 - 5 years in duration) > 90% of business line revenue is recurring Integrated Financial Solutions Item Processing Competitors FiServ Federal Reserve Correspondent Banks Clients Clients 800+ Processing centers 50 Annual transactions 1.7B Electronic capture 15% Remittance items 50M |
Sophisticated suite of electronic banking and fraud solutions: ATM/EFT - On-line banking Bill payment - Telephone banking Web hosting services - Multi-factor authentication Identify theft protection - Secure credit and debit Long-term contracts (3 - 5 years in duration) > 90% of business line revenue is recurring Integrated Financial Solutions eBusiness Competitors Fiserv Jack Henry Fifth Third Elan CheckFree Clients EFT Clients 2,100+ Cardholders 13.6M ATMs 4,274 Annual transactions 2B eBanking/Bill Payment 1,200+ |
Integrated Financial Solutions Credit Card Processing Leading community institution credit card processor in U.S. 73% market share of issuing institutions Long-term relationships with key trade associations ICBA CSCU Long-term contracts (3 - 5 years in duration) > 90% of business line revenue is recurring Competitors PSCU Community CUs FDC Mid and Top Tier FIs TSYS Mid and Top Tier FIs In-house Clients Clients 3,300+ Cardholders 74 million Annual transactions 370 million Loyalty accounts 5 million |
2007 Revenue Initiatives Responses to Market Driving Influences Fraud Suite expansion Secure Credit/Debit services Premium Bill Payment Credit Card Portfolio Retention Commercial and remote deposit Loyalty programs Payment Services FIS Payment Network Expansion FIS Cross-Sale Increasing Core Processing Card eBusiness Item Processing Other FIS Division Continue To Drive Strong Revenue Growth |
FIS Enterprise Solutions Frank Sanchez, President |
2006 Revenue Composition Check POS Core Banking Specialty Gaming/ Cash Access $1.0 Billion Annual Revenue 27% 45% 15% 13% |
2006 Revenue By Category Consulting and Professional Services Bank and Other Servicing License and Maintenance Other Gaming & Retail Servicing 42% 9% 36% 11% 2% $1.0 Billion Annual Revenue |
10 of top 10, 20 of top 25 40 of top 100 Market Position in Top 100 US Deposit Solutions: US Banks Commercial Lending Solutions: Global Banks Consumer Lending Solutions: US Banks Automotive Finance Lenders Check Risk Management National Retailers 4 of top 10, 44 of top 100 6 of top 10, 28 of top 50 60 of top 100 # 1 # 1 # 1 # 1 # 1 4 of top 6, 10 of top 25 |
Market Business Trends Banks Individual Product Pricing Business Day Delayed Fulfillment Geographic Advantage Campaigns Banking services Product packages 24 x 7 Availability Instant Fulfillment Brand Advantage Market-of-One |
Infrastructure Trends Batch Processing Work Flow Lines of Business Point-to-Point Interfaces Proprietary Specifications Customization Allocation based pricing Real-time Processing Straight Through Shared Product Utilities Seamless Distribution Industry Standards Plug and play Service level pricing |
Commoditization of core processing systems Escalating compliance requirements Limited window of opportunity for new product introduction New (non-traditional) competitors gaining traction Compression of profit margins Increasing complexity and support costs for legacy platforms Customized: Delivering profitable financial services to a market of one Nimble: Able to quickly respond to changing market demands and opportunities Efficient: Radically cheaper in core processing and back-office operations Today's Financial Institution Sees: Tomorrow's Financial Institution Will Be: Market Dynamics Driving Bank Transformation |
External Spend - Retail Channels Platform 351,728 515,736 867,464 Teller 1,391,412 4,037,203 5,428,615 Call Center 1,354,954 1,887,004 3,241,958 Internet 851,669 1,190,553 2,042,222 TOTAL 3,949,763 7,630,496 11,580,259 Software Services Total Source: Financial Insights 2006 Spending on retail delivery channels accounts for 13% of the overall banking IT spend and is expected to increase at a 4.15% compound annual growth rate (CAGR) through 2010. Spending is generally driven by initiatives to improve customer experiences. " " |
External Spend - Core Banking Core Banking 4,878,884 7,548,429 12,427,313 Consumer Lending 9,142,995 11,299,939 20,442,934 TOTAL 14,021,879 18,848,368 32,870,247 Software Services Total Source: Financial Insights 2006 Plus an additional combined $28 billion internal IT spend Core banking and consumer lending accounts for 42% of overall bank IT spend ... Core application spending is now most often related to maintenance and upkeep, and much of the actual new expense is in incremental investments to move to a more dynamic IT environment ... " " |
TouchPoint Sales & Service Xpress Enterprise Integration Xpress Enterprise Architecture Universal Customer System Smart Sell Transformation: Banking Solutions Next Generation Channel Solutions Every Interaction is a Selling Event Improved tools for sales prompting, financial advice More information about customers Enterprise Supply Chain Integration Consolidation of Business Lines (Originate, Service Relationships) Improved Integration of Enterprise- wide Customer Data Shift from Channel and Product Focus to Customer and Business Process Focus Leverage and Efficiency Service-Oriented Architectures and Enterprise Middleware Elimination of Redundancy Once & Done (Real-time, STP) Disruptive Technology Platforms Business Process Standards |
Profile SmartSell Default Manager Xamine Compliance Manager Fraud Prevention Solutions Transformation: Banking Solutions Real-Time Core Systems Disruptive Technology lowers TCO Enable faster, less costly introduction of new products Reduce risk and cost of payment processing Improve system availability and technology infrastructure Work process re-engineering resulting in lower costs Improved Analytical Tools Customer profitability Market segmentation Customer protection Event-based capability Improved Risk Management Protection of information Regulatory compliance Fraud prevention Information currency and accuracy |
FIS Integrated Solution Suite |
Enterprise Solutions Strategy To offer business solutions that create a compelling proposition within the financial services marketplace To be the reference vendor for banking application technology and processing utilities To be the acknowledged leader in banking services operations and technology domain expertise To provide supply chain technology and content that transforms the financial services operating model |
International Mike Sanchez, President |
International Market Region Top 25 Top 100 Top 1000 EMEA 14 49 269 AP 6 24 264 USA 4 18 197 LATAM 0 3 44 2006 Ranking by tier 1 capital - source - The Banker Magazine |
FIS Footprint |
FIS Competitive Position Unique inventory of core banking assets Core bank processing (license and outsourced models) Card issuer services Item processing and back-office outsourcing FIS scale and experience Active in established and emerging markets Banking and card cross-sell opportunities Strong integration capabilities |
Competition Banking SAP Alnova Oracle Temenos TCS Cards TSYS FDR IBM Accenture TCS Outsourcing IBM Chordiant Oracle Integration |
Customers Rural Informatica |
International Revenue ($millions) 2003 2004 2005 2006* Revenue 79 114 353 447 *2006 includes Certegy international revenues |
International Overview $450 Million Annual Revenue Banking Payment 247 221 Card & Payments Banking 55% 45% |
2006 Revenue Distribution License & Maint Recurring Consulting 0.19 0.68 0.13 Recurring Service Consulting/Other License & Maintenance 68% 13% 19% |
2006 Revenue by Region APR Latin EMEA Brazil East 21 6 55 18 Asia Pacific Latin America EMEA Brazil 18% 21% 55% 6% Broad International Presence |
Brazil Overview Population: 190 Million People GDP Growth: 3.1% World's 10th largest economy Inflation: 2.65% 95 Million bank accounts 35 Billion transactions, 17% growth 2005 Card Market Growth 30% Currency (Reais per US$) 2007 = 2.14 2006 = 2.19 2005 = 2.43 |
Brazil - Key Customers Banco Bradesco Largest non-government owned bank $63 billion in assets Banco ABN Amro Real Largest foreign bank $19 billion in local assets Others Panamericano Bank Bank of America Unibanco Processing FPS card processing joint venture - $125M annual run rate FBPO item processing operation - $100M annual run rate |
FPS Card Processing Joint Venture FIS 51% majority owner 8 Existing clients with 11 million cards Banking partners Banco ABN Amro Real 3.5 million cards converting Banco Bradesco Call Center Portfolio growing by 500K cards per month 10.5 million cards converting (4 million current) New client opportunities |
Fidelity BPO Business includes; Branch item processing Originations Bill pay Corporate lock box Check processing Settlement services Cash inventory management. Key clients include ABN Amro Real, Bradesco, Unibanco 42 operations centers throughout country 49% share of bank outsourcing market |
China CoreBank Consumer Loan Processing Russia Profile Brazil/LATAM Outsourcing Technology transformation Cards Top-tier transformation Outsourcing Channel Solutions Software license Emerging Markets Europe and Asia Pacific Market Opportunities |
Lender Processing Services Dan Scheuble President, Mortgage Processing Services Eric Swenson President, Mortgage Information Services |
Lender Processing Services Overview Industry Drivers Mortgage Continuum Market Trends FIS Responses End-to-End Solutions Technology Advantages Enterprise Cross-Sell Strategy FIS Success FIS success is derived from its strategic responses to market forces and client needs 131 |
SERVICING ORIGINATION Industry Drivers Mortgage Continuum Post-Closing Quality Control Loan Boarding/Servicing Default Management REO Asset Management Borrower Acquisition Loan Application Pre-qualification Product Selection Pricing Loan Underwriting Closing |
SERVICING Industry Drivers Challenges and Opportunities ORIGINATION Borrower Acquisition Loan Application REO Asset Management Default Management Loan Boarding/ Servicing Post-Closing Quality Control Closing Pre-qualification Product Selection Pricing Loan Underwriting Increase Capture Rates Cross-Sell Multiple Products Increase Customer Retention Improve Data Integrity Reduce Fraud Reduce Cost to Service Servicing on Single Platform Predict and Manage Defaults Reduce Product Time to Market Improve Borrower Experience E-Mortgage E-Delivery to Investors FIS works with its customers to enable mortgage best practices 135 |
SERVICING FIS Responses End-to-End Solutions Best in Breed Technology Solutions Across the Mortgage Continuum Product Solutions Servicing Platform, Vendor Network, Process & Invoice Management Technology Solutions ORIGINATION Technology Solutions Product Solutions Fraud Detection Title Flood Tax Property Valuation Credit Fraud Detection Property Valuation Credit Recording Services Closing Services Fraud Detection Due Diligence Solution Property Valuation Document Solutions Tax Property Valuation MSP Property Data Prospect Data Foreclosure & Bankruptcy Outsourcing Document Solutions Title Property Valuation Field Services Closing Services Document Solutions Title Property Valuation Asset Management Outsourcing Borrower Acquisition Loan Application Pre-Qualification Product Selection Pricing Loan Underwriting Closing Post-Closing Quality Control Loan Boarding/Servicing Default Management REO Asset Management Best in Breed Technology Solutions Across the Mortgage Continuum Loan Origination Software, Vendor Network, Document Management 137 |
SERVICING ORIGINATION Product Solutions Servicing Platform, Vendor Network, Process & Invoice Management Technology Solutions Technology Solutions Product Solutions Loan Origination Software, Vendor Network, Document Management Fraud Detection Title Flood Tax Property Valuation Credit Fraud Detection Property Valuation Credit Recording Services Closing Services Fraud Detection Due Diligence Solution Property Valuation Document Solutions Tax Property Valuation MSP Foreclosure & Bankruptcy Outsourcing Document Solutions Title Property Valuation Field Services Closing Services Document Solutions Title Property Valuation Asset Management Outsourcing Borrower Acquisition Loan Application Pre-Qualification Product Selection Pricing Loan Underwriting Closing Post-Closing Quality Control Loan Boarding/Servicing Default Management REO Asset Management Comprehensive Mortgage Outsourcing Solutions FIS Responses End-to-End Solutions Industry and Internal Data Sources Drive Better Market Solutions Property Data Prospect Data 139 |
SERVICING ORIGINATION FIS Responses End-to-End Solutions Product Solutions MSP, MAGNIFIDE Web Services, FIS Desktop Technology Solutions Technology Solutions Product Solutions Empower(r) LOS, RealEC, eLenderSolutions, FIS Desktop Fraud Detection Title Flood Tax Property Valuation Credit Fraud Detection Property Valuation Credit Recording Services Closing Services Fraud Detection Due Diligence Solution Property Valuation Document Solutions Tax Property Valuation MSP Property Data Prospect Data Foreclosure & Bankruptcy Outsourcing Document Solutions Title Property Valuation Field Services Closing Services Document Solutions Title Property Valuation Asset Management Outsourcing Borrower Acquisition Loan Application Pre-Qualification Product Selection Pricing Loan Underwriting Closing Post-Closing Quality Control Loan Boarding/Servicing Default Management REO Asset Management Comprehensive Mortgage Outsourcing Solutions 141 |
FIS Responses Technology Advantages All FIS products and services are built to be scalable, secure, flexible, standards-based, and web connected All FIS products and services are built to be scalable, secure, flexible, standards-based, and web connected Workflow Improves Process Management Rules Drives Efficiency Gains Web Services Eases Data Access & Integration Imaging Enhances Document Management |
FIS Responses Cyclicality Continuum Origination & Servicing Technology Cyclical Counter Cyclical Non-Cyclical Origination Services Property Valuation Title Closing Services Data Services Default Services Field Services Property Valuation Services Foreclosure/ Bankruptcy REO Management Mortgage Servicing Platform Loan Origination Software Process, Invoice & Imaging Management Property Valuation Services FIS business mix results in balanced revenue stream across challenging mortgage markets |
FIS Responses Enterprise Cross-Sell Strategy Loan Portfolio Solutions Default Management Mortgage Information Solutions Loan Origination Software Settlement Services Mortgage Servicing Package Office of the Enterprise Leverage the strength of FIS Solutions utilizing integrated technology, data and technology Coordinate cohesive sales force with cross-product incentives Execute strategic discussions with C-level executives Encourage strategic account management across business divisions FIS' Office of the Enterprise was formed to provide executive-level focus on key relationships with the top financial institutions nationwide |
FIS Success Key Relationship Expansion Existing Relationships Existing Relationships Existing Relationships Growing Relationships Growing Relationships Bank of America Washington Mutual Wachovia EMC Mortgage PHH Mortgage Appraisal ? ? ? ? Title & Closing Services ? ? ? ? Tax Services ? ? Flood Services ? ? ? MSP ? ? ? ? ? Default Management ? ? ? ? ? Total FIS Mortgage Products (29) 23 21 16 10 7 Total FIS Products (39) 27 23 17 11 7 MSP Centric |
FIS Success Key Relationship Expansion Growing Relationships Growing Relationships Growing Relationships Growing Relationships Growing Relationships JPMorgan Chase GMAC Countrywide Citigroup ING Appraisal ? ? ? ? ? Title & Closing Services ? ? ? ? ? Tax Services Flood Services ? ? ? ? MSP ? * Default Management ? Total FIS Mortgage Products (29) 13 14 11 8 5 Total FIS Products (39) 15 16 11 13 9 Non-MSP Centric *Current utilizes FIS Profile for servicing all domestic mortgages |
Subprime Market Impact to FIS Institutional Clients Independent Clients Wall Street Firms (9) Large Banks (8) Current * (11) Market Risk Low High FIS Impact Low Low Client Reaction Opportunity to Grow Business Make Acquisitions Better Pricing Better Quality Shut Down/ Be Acquired Transfer Servicing to Acquiring Entity FIS Response Expand Origination Data and Outsource Services Expand Servicing and Default Services Technology, Data and Outsourcing Opportunity Retain Servicing and Default Services FIS expects minimal impact to business Market Shift & Volume Recapture Opportunity *Note 8 out of the 11 current clients have already announced shut downs, acquisitions or filed Chapter 11 |
Financial Summary Jeff Carbiener Chief Financial Officer |
Lender Services Revenue Composition 4th Quarter 2006 Property Valuation Processing 27% Origination Services 12% Tax Services 6% Default Services 20% 19% Other Information Services 16% Origination Relocation Default 2006 Revenue Growth 4th Quarter 7.9% Full Year 7.5% |
2007 Guidance Pro Forma Revenue Growth 7% - 9% Pro Forma EBITDA Growth 10% - 12% Cash EPS $2.47 - $2.53 Free Cash Flow $530M - $560M Capital Expenditures $300M *FIS' 2006 results have been adjusted to reflect a 1/1/05 effective date for the merger with Certegy and the March 2005 recapitalization and sale of minority interests by FIS. Additionally, the 2007 projections exclude merger related integration costs and the 2006 pro forma results exclude merger related costs and the expense associated with the vesting of certain performance based stock options. Refer to Appendix and to February 6, 2007, press release which is posted on the Company's website at www.fidelityinfoservices.com for reconciliations to GAAP results. Assumes 10% overall market decline in mortgage origination and refinancing activity. |
2006 2007 2008 East 0.015 0.032 0.026 Well Positioned For Continued Growth Expected revenue contribution from significant new signings in 2006. |
2006 2007 2008 East 0.004 0.0075 0.0075 EBITDA Margin Expansion Anticipated margin expansion driven by: Operating leverage Expanded use of offshore resources Stringent cost containment FIS presents its financial results in accordance with Generally Accepted Accounting Principles ("GAP"). However, in order to provide the investment community with a more thorough means of evaluating the operating performance of its operations, FIS also reports several non_GAAP measures, including earnings before interest, taxes, depreciation and amortization ("EBITDA"). Any non- GAAP measures should be considered in context with eh GAAP financial presentation and should not be considered in isolation or as a substitute for GAAP net earnings. |
Questions & Answers FIS Executive Panel |
Appendix |
Fidelity National Information Services, Inc. and Subsidiaries and Affiliates Unaudited Consolidated and Combined Results for the Years Ending December 31, 2006 and 2005 |
Fidelity National Information Services, Inc. and Subsidiaries and Affiliates Historical Detail and Reconciliation of Non-GAAP Measures NOTE: The Adjustments Column represents pro forma adjustments relating to the merger transaction between CEY and FIS, the recapitalization transaction at FIS in March 2005, and the purchase of the remaining minority interest in Kordoba in September 2005 to reflect such transactions as if they occurred January 1, 2005 EBITDA Detail 2006 Full Year FIS CEY-Jan ADJ Pro Forma 2005 Full Year FIS CEY ADJ Pro Forma Net Earnings $ 259,087 $ (42,523) (3,708) $ 212,856 Net Earnings $ 196,550 $ 105,514 $ (52,616) $ 249,448 + Interest Expense 192,819 1,081 — 193,900 + Interest Expense 126,778 12,832 21,031 160,641 + Minority Interest 185 — - 185 + Minority Interest 4,450 — (2,368) 2,082 + Income Taxes 150,150 (26,396) (2,626) 121,128 + Income Taxes 116,085 68,927 (32,571) 152,441 + Depreciation/Amort 433,550 4,274 6,856 444,680 + Depreciation/Amort 299,638 51,858 83,969 435,465 — Interest Income (4,746) — - (4,746) — Interest Income (6,392) (2,435) — (8,827) — Equity in (Earnings) Loss of Unconsolidated - Equity in (Earnings) Loss of Non-Consolidated Entities, net of tax (5,792) — (5,792) Entites, net of tax (5,029) 117 — (4,912) — Other (Income) Expense 224 123 347 — Other (Income) Expense 4,237 - - - 4,237 EBITDA $ 1,025,477 $ (63,441) $ 522 $ 962,558 EBITDA $ 736,317 $ 236,813 $ 17,445 $ 990,575 EBITDA Margin 2006 Full Year FIS CEY-Jan ADJ Pro Forma 2005 Full Year FIS CEY ADJ Pro Forma EBITDA $ 1,025,477 $ (63,441) $ 522 $ 962,558 EBITDA $ 736,317 $ 236,813 $ 17,445 $ 990,575 Revenue $ 4,132,602 $ 92,915 $ — $ 4,225,517 Revenue $ 2,766,085 $ 1,117,141 $ — $ 3,883,226 EBITDA Margin 24.8% -68.3% 22.8% EBITDA Margin 26.6% 21.2% 25.5% EBIT Detail 2006 Full Year FIS CEY-Jan ADJ Pro Forma 2005 Full Year FIS CEY ADJ Pro Forma Net Earnings $ 259,087 $ (42,523) $ (3,708) $ 212,856 Net Earnings $ 196,550 $ 105,514 $ (52,616) $ 249,448 + Interest Expense 192,819 1,081 — 193,900 + Interest Expense 126,778 12,832 21,031 160,641 + Minority Interest 185 — - 185 + Minority Interest 4,450 — (2,368) 2,082 + Income Taxes 150,150 (26,396) (2,626) 121,128 + Income Taxes 116,085 68,927 (32,571) 152,441 — Interest Income (4,746) — - (4,746) — Interest Income (6,392) (2,435) — (8,827) — Equity in (Earnings) Loss of Unconsolidated - Equity in (Earnings) Loss of Non-Consolidated Entities, net of tax (5,792) — - (5,792) Entities, net of tax (5,029) 117 — (4,912) — Other (Income) Expense 224 123 — 347 — Other (Income) Expense 4,237 — - 4,237 EBIT $ 591,927 $ (67,715) $ (6,334) $ 517,878 EBIT $ 436,679 $ 184,955 $ (66,524) $ 555,110 EBIT Margin 2006 Full Year FIS CEY-Jan ADJ Pro Forma 2005 Full Year FIS CEY ADJ Pro Forma EBIT $ 591,927 $ (67,715) $ (6,334) $ 517,878 EBIT $ 436,679 $ 184,955 $ (66,524) $ 555,110 Revenue $ 4,132,602 $ 92,915 $ — $ 4,225,517 Revenue $ 2,766,085 $ 1,117,141 $ — $ 3,883,226 EBIT Margin 14.3% -72.9% 12.3% EBIT Margin 15.8% 16.6% 14.3% Adjusted Diluted EPS 2006 Full Year FIS CEY-Jan ADJ Pro Forma 2005 Full Year FIS CEY ADJ Pro Forma Net Earnings $ 259,087 $ (42,523) $ (3,708) $ 212,856 Net Earnings $ 196,550 $ 105,514 $ (52,616) $ 249,448 Adjusted EPS $ 1.37 $ 1.09 Adjusted EPS $ 1.53 $ 1.30 Diluted Shares Outstanding 189,196 194,653 Diluted Shares Outstanding 128,354 191,580 Cash Earnings 2006 Full Year FIS CEY-Jan ADJ Pro Forma 2005 Full Year FIS CEY ADJ Pro Forma Net Earnings $ 259,087 $ (42,523) $ (3,708) $ 212,856 Net Earnings $ 196,550 $ 105,514 $ (52,616) $ 249,448 + Tax Adjusted Purchase Price Amortization $ 109,467 233 3,524 113,224 + Tax Adjusted Purchase Price Amortization 78,733 2,721 42,425 123,879 Cash Earnings $ 368,554 $ (42,290) $ (184) $ 326,080 Cash Earnings $ 275,283 $ 108,235 $ (10,191) $ 373,327 Diluted Cash EPS $ 1.95 $ 1.68 Diluted Cash EPS $ 2.14 $ 1.95 Diluted Shares Outstanding 189,196 194,653 Diluted Shares Outstanding 128,354 — - 191,580 Free Cash Flow 2006 Full Year FIS CEY-Jan ADJ Pro Forma 2005 Full Year FIS CEY ADJ Pro Forma Net Earnings $ 259,087 $ (42,523) $ (3,708) $ 212,856 Net Earnings $ 196,550 $ 105,514 $ (52,616) $ 249,448 + Depreciation/Amort 433,550 4,274 6,856 444,680 + Depreciation/Amort 299,638 51,858 83,969 435,465 — Capital Expenditures (300,197) (5,200) — (305,397) — Capital Expenditures (238,665) (63,566) — (302,231) Free Cash Flow $ 392,440 $ (43,449) $ 3,148 $ 352,139 Free Cash Flow $ 257,523 $ 93,806 $ 31,353 $ 382,682 2006 Full Year 2005 Full Year Stock Compensation $ 50,074 $ 552 $ (552) $ 50,074 Stock Compensation $ 20,367 $ 12,205 $ (12,205) $ 20,3671 |
86
Fidelity National Information Services, Inc. and Subsidiaries and Affiliates Historical Detail and Reconciliation of Non-GAAP Measures (continued from previous page)Pro Forma Measures Excluding Selected ItemsPro Forma EBITDA$ 962,558 M&A and Integration costs 108,945 Performance Based Stock Option Costs 24,130 Pro Forma EBITDA, excluding selected items$ 1,095,633Pro Forma Net Earnings 212,856 M&A and Integration Costs, net of tax 67,654 Performance Based Stock Option Costs, net of tax 14,888 Pro Forma Net Earnings, excluding selected items$ 295,398Weighted Average Shares 189,196 Adjustment as if transaction took place 1/1/2005 5,457 Pro Forma Weighted Average Shares 194,653Pro Forma Net Earnings per diluted share$ 1.09 M&A and Integration costs per share 0.35 Performance Based Stock Option Costs per share 0.08 Pro Forma Net Earnings per diluted share, excluding selected items$ 1.52 Net Earnings, excluding selected items 295,398 + Tax Adjusted Purchase Price Amortization 113,224 Cash Earnings, excluding selected items 408,622Net Earnings per diluted share, excluding selected items 1.52 + Tax Adjusted Purchase Price Amortization-per share 0.58 Cash Earnings per diluted share, excluding selected items$ 2.10 Net Earnings, excluding selected items$ 295,398 + Depreciation/Amort 444,680 — Capital Expenditures (305,397) Free Cash Flow, excluding selected items$ 434,68186A1 |
Fidelity National Information Services, Inc. and Subsidiaries and Affiliates Unaudited Pro Forma Combined Statement of Continuing Operations For the Twelve Months Ended December 31, 2006 (in thousands except per share data) |
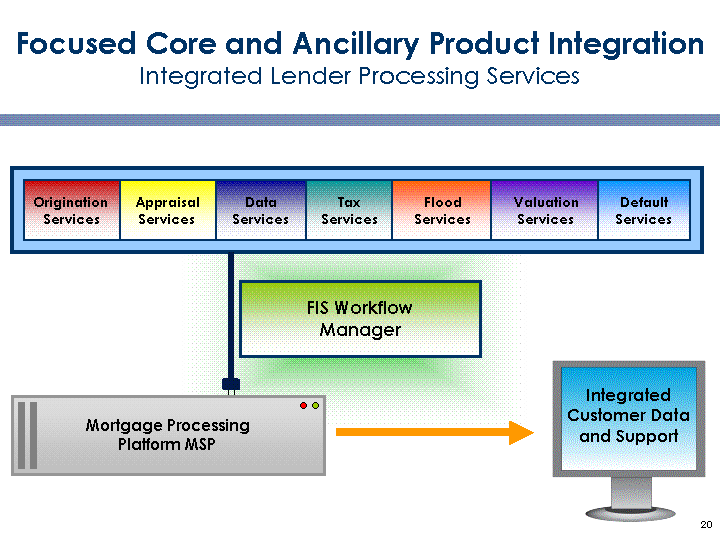
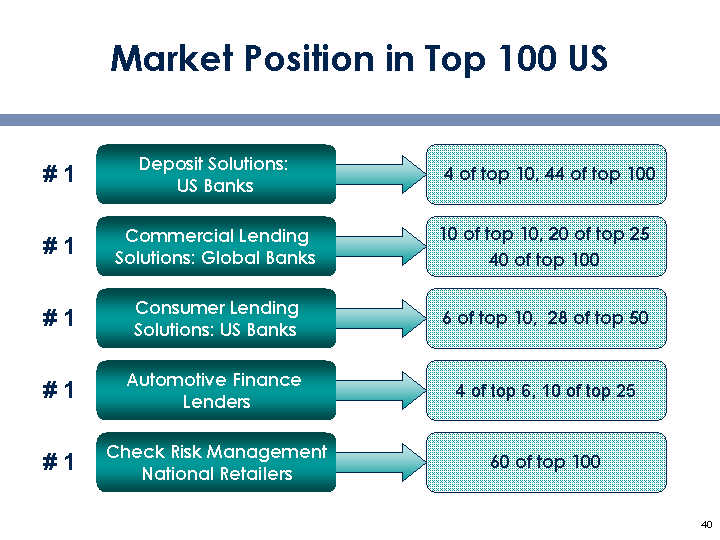
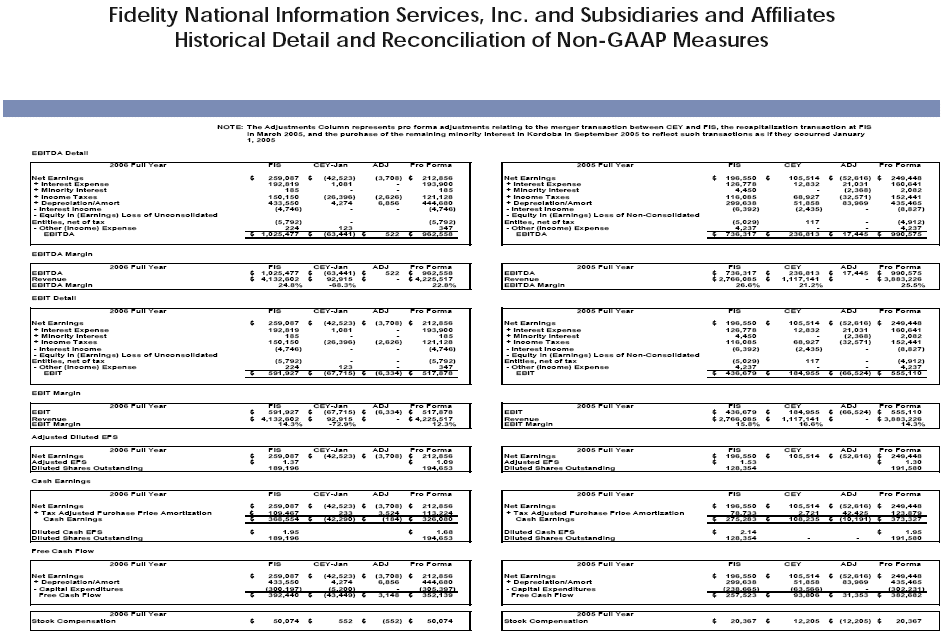
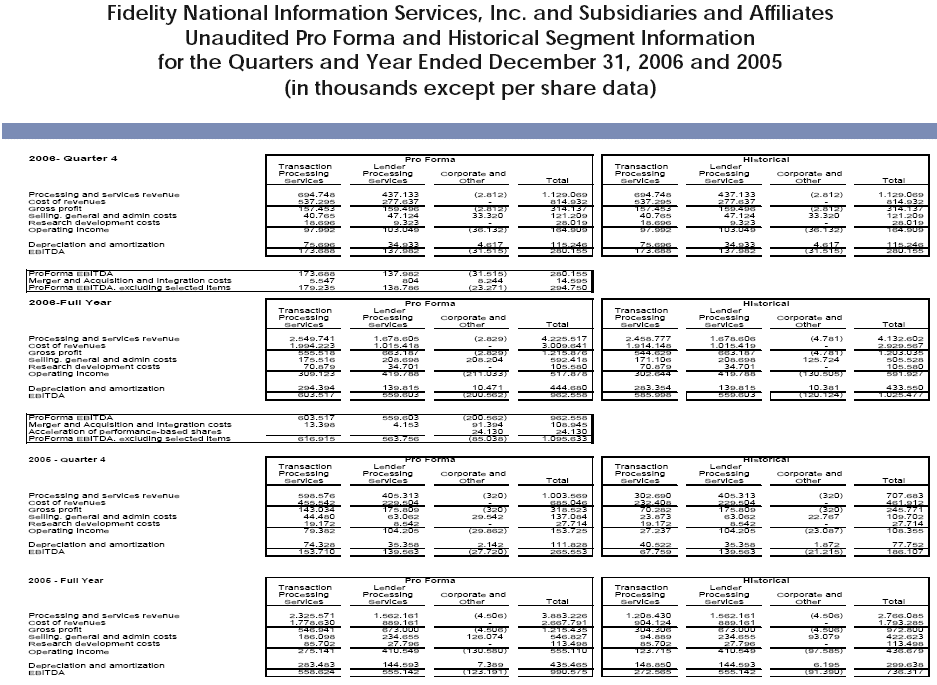
Fidelity National Information Services, Inc. and Subsidiaries and Affiliates Unaudited Pro Forma and Historical Segment Information for the Quarters and Year Ended December 31, 2006 and 2005 (in thousands except per share data) 2006- Quarter 4 Pro Forma HistoricalTransaction Lender Transaction Lender Processing Processing Corporate and Processing Processing Corporate and Services Services Other Total Services Services Other Total Processing and services revenue 694,748 437,133 (2,812) 1,129,069 694,748 437,133 (2,812) 1,129,069 Cost of revenues 537,295 277,637 — 814,932 537,295 277,637 — 814,932 Gross profit 157,453 159,496 (2,812) 314,137 157,453 159,496 (2,812) 314,137 Selling, general and admin costs 40,765 47,124 33,320 121,209 40,765 47,124 33,320 121,209 Research development costs 18,696 9,323 — 28,019 18,696 9,323 — 28,019 Operating income 97,992 103,049 (36,132) 164,909 97,992 103,049 (36,132) 164,909 Depreciation and amortization 75,696 34,933 4,617 115,246 75,696 34,933 4,617 115,246 EBITDA 173,688 137,982 (31,515) 280,155 173,688 137,982 (31,515) 280,155 ProForma EBITDA 173,688 137,982 (31,515) 280,155 Merger and Acquisition and Integration costs 5,547 804 8,244 14,595 ProForma EBITDA, excluding selected items 179,235 138,786 (23,271) 294,7502006-Full Year Pro Forma HistoricalTransaction Lender Transaction Lender Processing Processing Corporate and Processing Processing Corporate and Services Services Other Total Services Services Other Total Processing and services revenue 2,549,741 1,678,605 (2,829) 4,225,517 2,458,777 1,678,606 (4,781) 4,132,602 Cost of revenues 1,994,223 1,015,418 — 3,009,641 1,914,148 1,015,419 — 2,929,567 Gross profit 555,518 663,187 (2,829) 1,215,876 544,629 663,187 (4,781) 1,203,035 Selling, general and admin costs 175,516 208,698 208,204 592,418 171,106 208,698 125,724 505,528 Research development costs 70,879 34,701 — 105,580 70,879 34,701 — 105,580 Operating income 309,123 419,788 (211,033) 517,878 302,644 419,788 (130,505) 591,927 Depreciation and amortization 294,394 139,815 10,471 444,680 283,354 139,815 10,381 433,550 EBITDA 603,517 559,603 (200,562) 962,558 585,998 559,603 (120,124) 1,025,477 ProForma EBITDA 603,517 559,603 (200,562) 962,558 Merger and Acquisition and Integration costs 13,398 4,153 91,394 108,945 Acceleration of performance-based shares 24,130 24,130 ProForma EBITDA, excluding selected items 616,915 563,756 (85,038) 1,095,6332005 — Quarter 4 Pro Forma Historical Transaction Lender Transaction Lender Processing Processing Corporate and Processing Processing Corporate and Services Services Other Total Services Services Other Total Processing and services revenue 598,576 405,313 (320) 1,003,569 302,690 405,313 (320) 707,683 Cost of revenues 455,542 229,504 — 685,046 232,408 229,504 — 461,912 Gross profit 143,034 175,809 (320) 318,523 70,282 175,809 (320) 245,771 Selling, general and admin costs 44,480 63,062 29,542 137,084 23,873 63,062 22,767 109,702 Research development costs 19,172 8,542 — 27,714 19,172 8,542 — 27,714 Operating income 79,382 104,205 (29,862) 153,725 27,237 104,205 (23,087) 108,355 Depreciation and amortization 74,328 35,358 2,142 111,828 40,522 35,358 1,872 77,752 EBITDA 153,710 139,563 (27,720) 265,553 67,759 139,563 (21,215) 186,1072005 — Full Year Pro Forma HistoricalTransaction Lender Transaction Lender Processing Processing Corporate and Processing Processing Corporate and Services Services Other Total Services Services Other Total Processing and services revenue 2,325,571 1,562,161 (4,506) 3,883,226 1,208,430 1,562,161 (4,506) 2,766,085 Cost of revenues 1,778,630 889,161 — 2,667,791 904,124 889,161 — 1,793,285 Gross profit 546,941 673,000 (4,506) 1,215,435 304,306 673,000 (4,506) 972,800 Selling, general and admin costs 186,098 234,655 126,074 546,827 94,889 234,655 93,079 422,623 Research dev elopment costs 85,702 27,796 — 113,498 85,702 27,796 — 113,498 Operating income 275,141 410,549 (130,580) 555,110 123,715 410,549 (97,585) 436,679 2 Depreciation and amortization 283,483 144,593 7,389 435,465 148,850 144,593 6,195 299,638 EBITDA 558,624 555,142 (123,191) 990,575 272,565 555,142 (91,390) 736,317 |
88
* FIS presents its financial results in accordance with Generally Accepted Accounting Principals ("GAAP"). However, in order to provide the investment community with a more thorough means of evaluation the operating performance of its operations, FIS also reports several non-GAAP measures, including earnings before interest, taxes, depreciation and amortization ("EBITDA"), net earnings plus depreciation and amortization less capital expenditures ("Free Cash Flow") and net earnings plus intangible amortization, net of income tax ("Cash Earnings"). Any non-GAAP measures should be considered in context with the GAAP financial presentation and should not be considered in isolation or as a substitute for GAAP net earnings. The amounts below are projections based on the guidance range provided by FIS regarding its 2007 results. The tables below are reconciliations of pro forma projections on non-GAAP measures to the nearest GAAP measurement. All amounts are in millions, except per share amounts. Fidelity National Information Services, Inc. and Subsidiaries and Affiliates Reconciliation of Non-GAAP Measures 2007 Projections* |