Exhibit 99.1
Bear Stearns Sixth Annual Computer & Business Services Conference June 8, 2005
Forward-Looking Statements
The statements in this presentation include forward-looking statements that are based on current expectations, assumptions, estimates, and projections about Certegy and our industry. They are not guarantees of future performance and are subject to risks and uncertainties, many of which are outside of Certegy’s control, that may cause actual results to differ significantly from what is expressed in those statements.
Factors that could, either individually or in the aggregate, affect our performance include the following: Our reliance on a small number of financial services associations for the majority of our revenues; our reliance on key strategic relationships; the necessity to maintain qualifications set by bank card associations in order to continue to provide transaction processing services; potential liability when merchant customers cannot or do not reimburse us for charge-backs resolved in favor of cardholders, or when checks we guarantee are dishonored by the check writer’s bank; potential loss of customers from continued consolidation in the financial services and in retail industries; a prolonged and permanent decline in check writing; changes in regulation or industry standards applicable to our businesses or those of our customers; the level of economic growth or other factors affecting demand for our products and services; our ability to maintain or improve our competitive positions against current and potential competitors; database security and reliability of our information technology systems; risks associated with investments and operations in foreign countries, including exchange rate fluctuations and local political, social, and economic factors; the results of our acquisitions; our ability to continue definitive agreements with large customers; and other factors described in detail in the section entitled “Certain Factors Affecting Forward Looking Statements” in our 2004 Annual Report on Form 10-K filed on March 11, 2005, with the SEC.
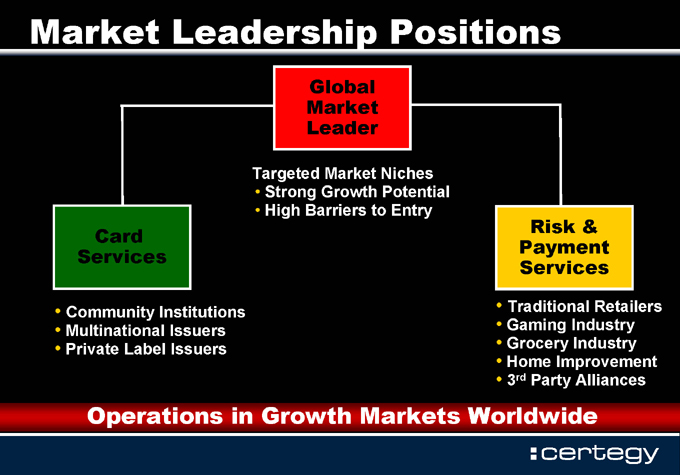
Market Leadership Positions
Global Market Leader
Targeted Market Niches
Strong Growth Potential High Barriers to Entry
Card Services
Community Institutions Multinational Issuers Private Label Issuers
Risk & PaymentServices
Traditional Retailers Gaming Industry Grocery Industry Home Improvement 3rd Party Alliances
Operations in Growth Markets Worldwide

Card Services
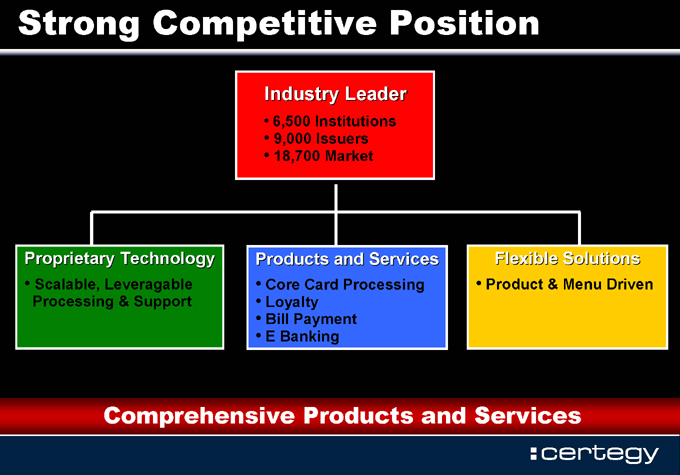
Strong Competitive Position
Industry Leader
6,500 Institutions 9,000 Issuers 18,700 Market
Proprietary Technology
Scalable, Leveragable Processing & Support
Products and Services
Core Card Processing Loyalty Bill Payment E Banking
Flexible Solutions
Product & Menu Driven
Comprehensive Products and Services
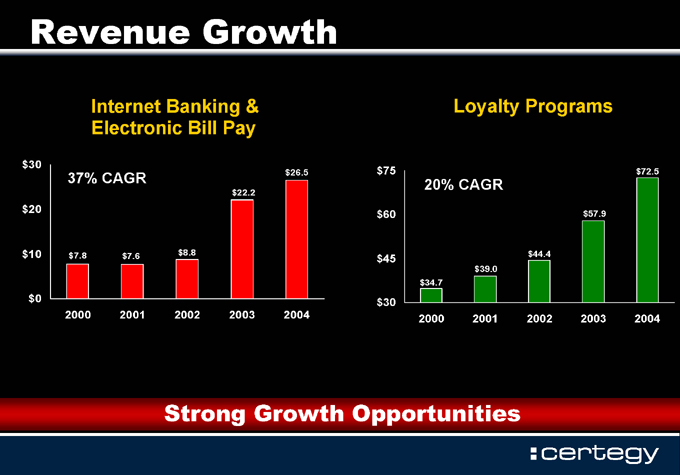
Revenue Growth
Internet Banking & Electronic Bill Pay $30
$20
$10
$0
37% CAGR
$7.8 $7.6 $8.8 $22.2 $26.5
2000 2001 2002 2003 2004
Loyalty Programs $75
$60
$45
$30
20% CAGR
$34.7 $39.0 $44.4 $57.9 $72.5
2000
2001
2002
2003
2004
Strong Growth Opportunities
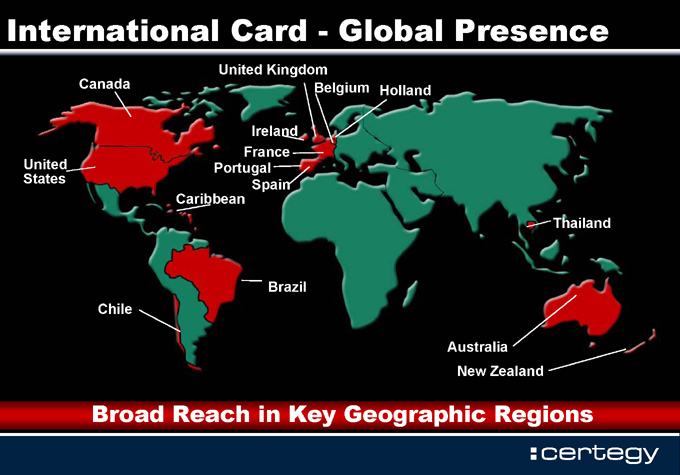
International Card - Global Presence
United Kingdom
Canada
Belgium Holland
United States
Ireland
France
Portugal Spain
Caribbean
Chile
Brazil
Thailand
Australia
New Zealand
Broad Reach in Key Geographic Regions

International Card – Key Growth Areas
Brazil
PanAmericano Bradesco
Bank Cards Stored Value Private Label
Asia Pacific
Krungthai Card
Bank Cards Personal Loans
Europe
LaSer
5 European Countries Private Label Personal Loans
Caribbean
CariCard
16 Caribbean Countries Leading Market Share Excellent
Cross Selling Opportunities
Over $25 Million in New Annualized Revenue

Risk & Payment Services
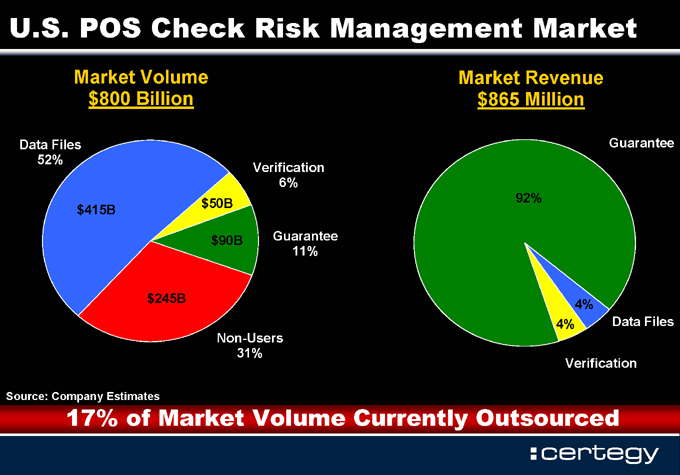
U.S. POS Check Risk Management Market
Market Volume $800 Billion
Data Files 52% $415B
Verification 6% $50B $90B
Guarantee 11% $245B
Non-Users 31%
Market Revenue $865 Million
Guarantee
92%
4% 4%
Data Files
Verification
Source: Company Estimates
17% of Market Volume Currently Outsourced
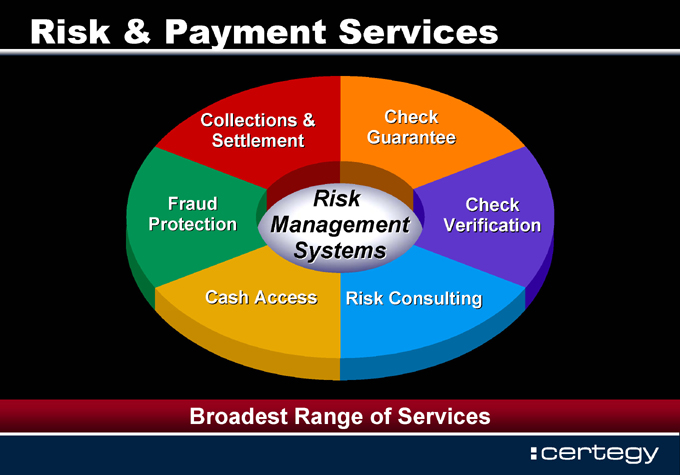
Risk & Payment Services
Collections & Settlement
Fraud Protection
Cash Access
Risk Consulting
Check Verification
Check Guarantee
Risk Management Systems
Broadest Range of Services

World’s Most Advanced Check Decisioning
Consumer Authentication
DL MICR Social
Consumer Identification
Risk Assessment
Artificial Intelligence Models Real Time Fraud Monitoring Consumer Based Decisioning
Real Time Transactions
Real Time Fraud Monitoring
Product Data
Store Demographic Data
Industry Data
Checking Account History
Negative Data
Consumer Attributes
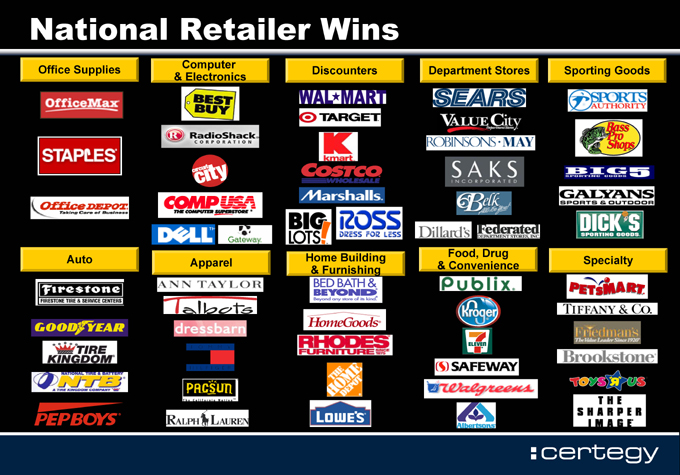
National Retailer Wins
Office Supplies
Computer & Electronics
Discounters
Department Stores
Sporting Goods
Auto
Apparel
Home Building & Furnishing
Food, Drug & Convenience
Specialty
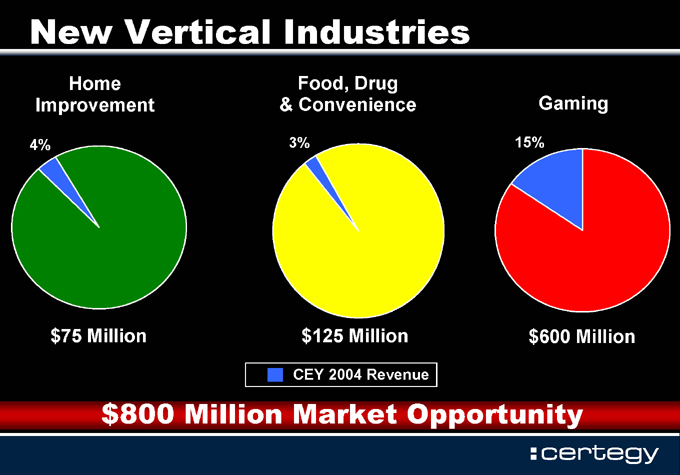
New Vertical Industries
Home Improvement
4% $75 Million
Food, Drug & Convenience
3% $125 Million
Gaming
15% $600 Million $800 Million Market Opportunity
CEY 2004 Revenue
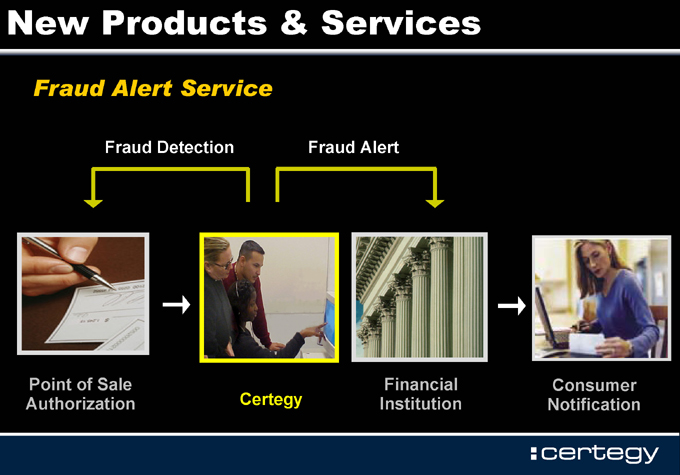
New Products & Services
Fraud Alert Service
Fraud Detection
Fraud Alert
Point of Sale Authorization
Certegy
Financial Institution
Consumer Notification

Shareholder Value
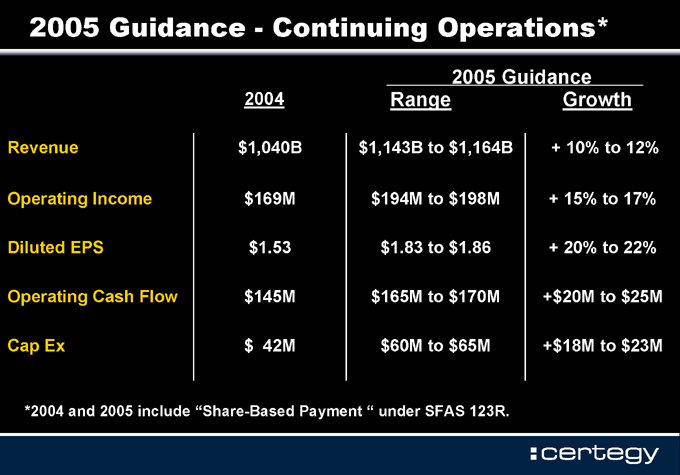
2005 Guidance - Continuing Operations*
2005 Guidance
2004
Range
Growth
Revenue $1,040B $1,143B to $1,164B + 10% to 12%
Operating Income $169M $194M to $198M + 15% to 17%
Diluted EPS $1.53 $1.83 to $1.86 + 20% to 22%
Operating Cash Flow $145M $165M to $170M +$20M to $25M
Cap Ex $42M $60M to $65M +$18M to $23M
*2004 and 2005 include “Share-Based Payment “ under SFAS 123R.
certegy