Imagistics is a direct sales, service and marketing organization
providing document imaging solutions in the U.S., Canada and
the U.K., with annual revenues of approximately $600 million.
The Imagistics served market of document imaging is large -
projected to grow to $28 billion by 2007.
Imagistics provides its customers “best of breed” products,
superior service, technological innovation and value.
Imagistics has an extensive nationwide sales and service
organization to provide a superior customer experience.
Imagistics is profitable, has a strong balance sheet, is
conservatively capitalized, generates strong positive cash flow
and has been growing EPS over 20% annually.
Management has a demonstrated track record of execution.
Imagistics – Who We Are
2

Highlights
3
4
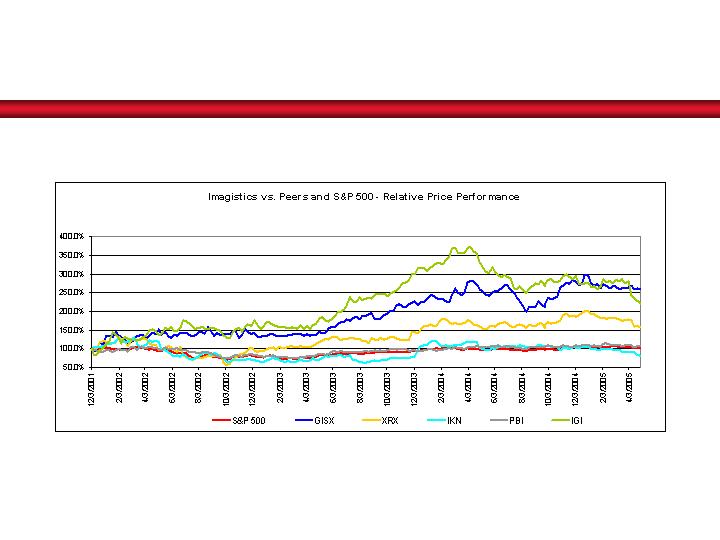
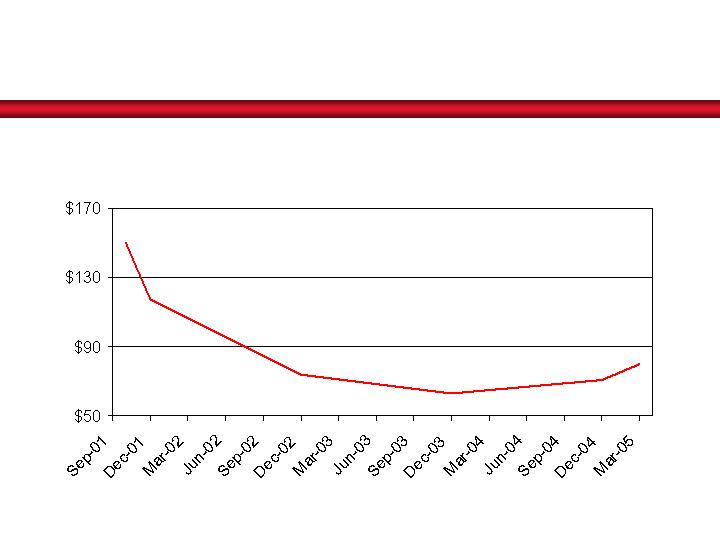
Strong Stock Performance Since Spin-Off
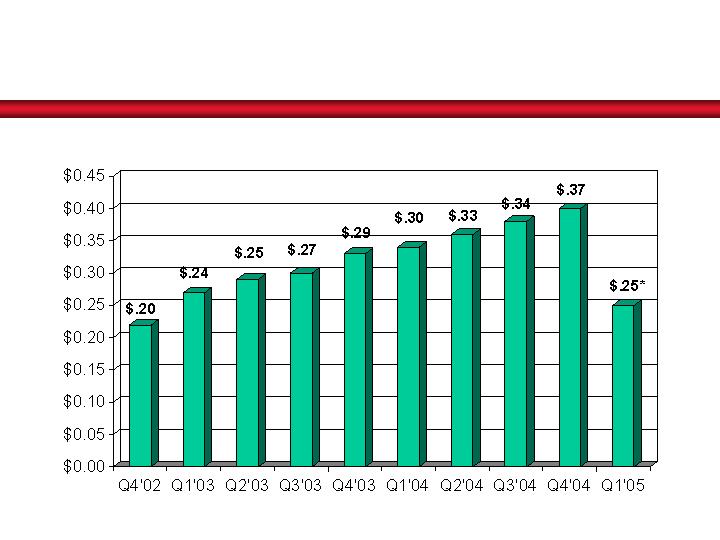
History of Strong Profitability
Diluted EPS
5
All periods restated for expensing stock options. *Q1’05 excludes $0.12 in charges for restructuring and severance
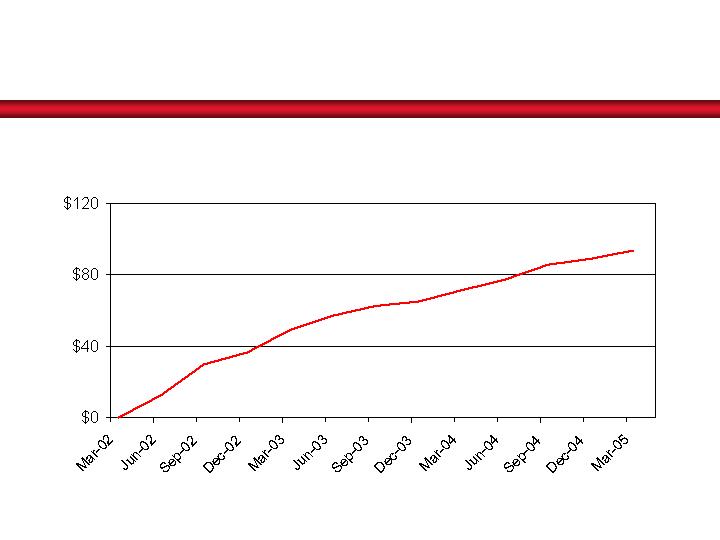
Significant Debt Reduction
(Dollars in millions)
$150
$117
$74
$63
$80
6
Stock Repurchases Continue
(Cumulative repurchases, dollars in millions)
7
$13
$30
$37
$49
$57
$63
$65
$71
$77
$85
$89
$93

Strategy
8

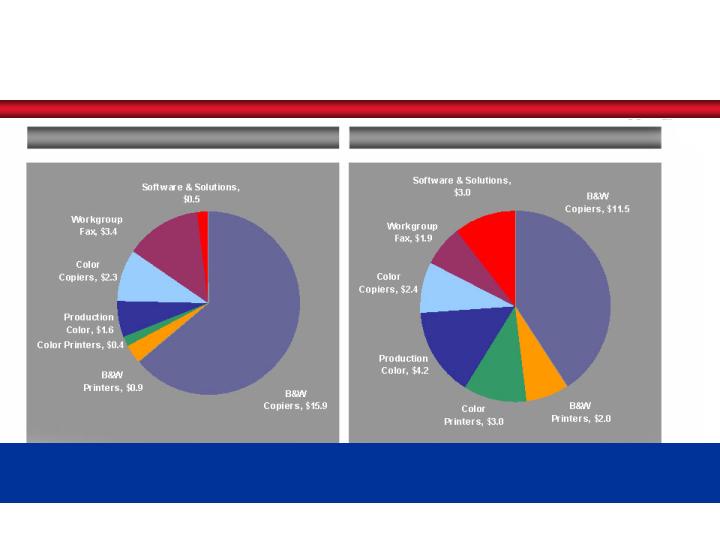
Transitioning to Copier/MFP
9
Solid Growth of Copier/MFP Revenue
2001
Q1’05
Distribution of total revenue

Leverage our product and marketplace
strengths to drive market share
Pursue opportunistic expansion to broaden
our sales and service capabilities
Growth Strategy
14
10

Our Market
11
Imagistics Served Markets
(Equipment, Supplies and Service)
Source: CAP Ventures
Imagistics has a small share of a huge market
2002: $25 Billion
2007: $28 Billion
12

Capabilities
13

World Class Products
“Best of Breed” sourcing strategy
Imagistics uses various third party
suppliers to provide the latest features
and technology
no R&D or manufacturing expense
Testing lab ensures highest reliability
Complete Segment 1-5 Document Solutions
Meets both workgroup and departmental
needs
Multifunctional copiers, printers and facsimile
13 to 85 ppm
1,000 to 750,000 prints per month
B&W and Color
Buyers Laboratory Inc.
History of awards since 1997
“2003 Line of the Year”
Individual product awards in 2004
Better Buys For Business
“2003 Editor’s Choice” awards
“2005 Editor’s Choice” award for DL 850
14
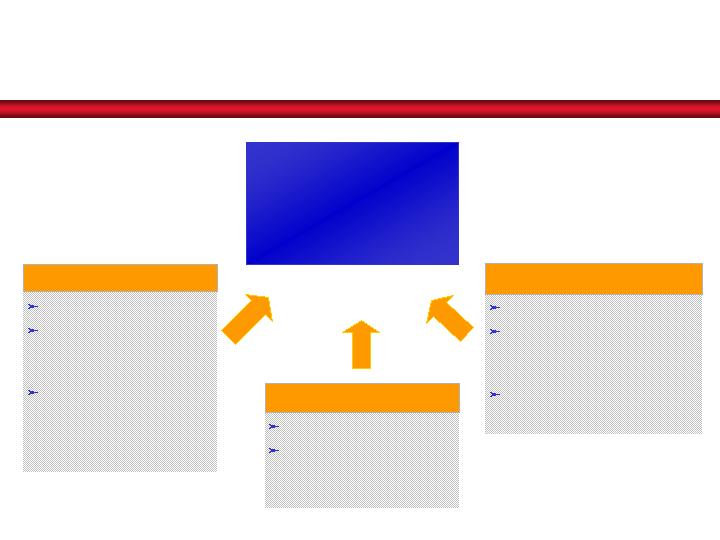
Sales force of 200
Major national and
international
corporations
Large governmental
and educational
organizations
National Accounts
Sales force of 275
Acquired businesses
covering secondary
geographic markets
Local, national and
commercial accounts
Business Product Centers
Imagistics has an
extensive direct sales
force
Sales force of 750
Mid-size and regional
businesses
Commercial Accounts
Extensive Sales Force
15

Strong Service Capabilities
Direct service - approximately 1200
professionals
National Call Center
24/7 network support
Immediate dispatch via hand-held
wireless devices
Promotes on-site arrival times
Value Added Maintenance System
(VAMS)
Ensures consistent copy quality
via systematic diagnostics and preventive
steps to maintain
optimal performance
16
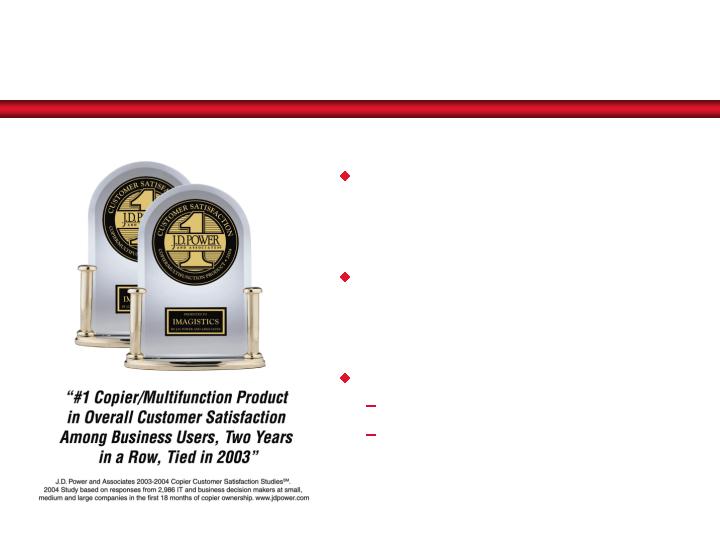
Award Winning Customer Satisfaction
J.D. Power and Associates, a
globally recognized marketing
information firm, represents the
voice of the customer
Satisfaction measured on three key
factors that define the customer
experience: product, sales and
service
Imagistics Delivers…
“Best of Breed” products
Nationwide sales and service
support
17

Finances
18

Strong operating performance and financial
position supports strategic initiatives
Diversified revenue stream is 72% recurring
Strong annual EPS growth
Strong positive cash flow
Strong balance sheet, conservatively
capitalized at 22% debt to total capital
Credit rating upgraded twice in 2004 by
Moody’s
Strong Financial Position
13
19

Recurring revenue represents 72% of Total Q1 2005 Revenues
Total Q1 2005 Revenues
Total Q1 2005 Revenues
North
America
Copier/MFP
North
America
Fax
U.K.
Copier/MFP
& Fax
Supply
Sales
Support Services
Equipment
Rentals
$142.1 Million
$142.1 Million
Equipment
Sales
Recurring Revenue
Components
Revenue Sources – Q1’ 05
16
20

Summary Income Statement –
First Quarter
21
(Dollars in millions, except EPS)
(Unaudtied)
2005
2004
B/(W)
Copier/MFP
103.8
$
97.8
$
6%
Facsimile
36.2
50.4
(28%)
PB Canada
2.1
10.1
(79%)
Total revenue
142.1
158.3
(10%)
Cost of sales and rentals
56.5
64.7
13%
Selling, service and administrative expenses
80.8
83.6
3%
Operating income
4.8
10.0
(52%)
Interest expense, net
1.1
0.9
(21%)
Income before income taxes
3.7
9.1
(60%)
Provision for income taxes
1.6
3.9
61%
Net income
2.1
$
5.2
$
(59%)
Diluted EPS
0.13
$
0.30
$
(57%)
Diluted EPS without restructuring
and severance charges*
$0.25
$0.30
(17%)
The Company adopted SFAS No. 123(R), effective January 1, 2005. Accordingly, certain previously reported amounts
have been restated. * Q1'05 restructuring and severance charges were $0.12, reported diluted EPS was $0.13.
March 31,
Three months ended

Summary Income Statement –
Full Year
22
(Dollars in millions, except EPS)
(Unaudited)
2004
2003
B/(W)
Copier/MFP
414.6
$
380.8
$
9%
Facsimile
179.0
212.5
(16%)
PB Canada
15.5
28.9
(46%)
Total revenue
609.1
622.2
(2%)
Cost of sales and rentals
230.5
265.1
13%
Selling, service and administrative expenses
335.4
316.8
(6%)
Operating income
43.2
40.3
7%
Interest expense, net
3.7
8.4
56%
Income before income taxes
39.5
31.9
24%
Provision for income taxes
16.8
13.7
(23%)
Net income
22.7
$
18.2
$
25%
Diluted EPS
1.35
$
1.05
$
29%
The Company adopted SFAS No. 123(R), effective January 1, 2005. Accordingly, certain previously reported amounts
have been restated.

Condensed Balance Sheets
23
(Dollars in millions)
(Unaudited)
3/31/2005
12/31/04
3/31/04
3/31/2005
12/31/04
3/31/04
Cash
13.4
$
12.8
$
12.5
$
Payables and accrued liabilities
57.3
$
80.3
$
67.1
$
Receivables, net
99.7
105.7
119.8
Advance billings
14.3
14.8
15.2
Accrued billings
30.8
29.0
22.2
Current long-term debt
0.5
0.5
0.5
Inventories
89.0
94.7
83.6
Total current
72.1
95.6
82.8
Other current
28.9
31.4
32.5
Total current
261.8
273.6
270.6
Long-term debt
79.2
70.4
77.8
Other liabilities
17.6
18.2
15.3
P, P&E, net
59.5
60.3
53.5
Total liabilities
168.9
184.2
175.9
Rental assets, net
60.1
62.8
63.2
Other assets
70.3
70.8
63.2
Equity
282.8
283.3
274.6
Total assets
451.7
$
467.5
$
450.5
$
Total liabilities & equity
451.7
$
467.5
$
450.5
$
The Company adopted SFAS No. 123(R), "Share-Based Payment," as of January 1, 2005. Accordingly, certain previously reported amounts have been restated.

Condensed Cash Flow Summaries –
First Quarter
24
(Dollars in millions)
(Unaudited)
2005
2004
Net income
2.1
$
5.2
$
Depreciation and amortization
15.3
17.1
Provision for bad debt
2.0
2.4
Reserve for inventory obsolescence
1.4
1.4
Stock-based compensation expense
0.5
1.0
Excess tax benefits from stock-based compensation
(0.5)
(0.5)
Deferred taxes on income
3.0
(3.0)
Non-cash restructuring impairment charges
0.5
-
Net working capital
(16.0)
(28.9)
Other, net
(2.3)
0.9
Net cash provided by (used in) operating activities
6.0
(4.4)
Expenditures for rental equipment assets
(9.4)
(9.8)
Expenditures for property, plant and equipment
(2.1)
(2.8)
Acquisitions, net of cash acquired
-
(3.8)
Net cash used in investing activities
(11.5)
(16.4)
Purchase of treasury stock
(4.7)
(6.3)
Net loan (repayments) borrowings
8.9
14.9
Exercises of stock options and ESPP
1.6
1.1
Excess tax benefits from stock-based compensation
0.5
0.5
Net cash (used in) provided by financing activities
6.3
10.2
Effect of exchange rates on cash
(0.2)
0.2
Increase (decrease) in cash
0.6
$
(10.4)
$
The Company adopted SFAS No. 123(R), "Share-Based Payment," as of January 1, 2005. Accordingly, certain previously
reported amounts have been restated, and certain previously reported amounts have been reclassified to conform to the
current year presentation.
March 31,
Three months ended

Condensed Cash Flow Summaries –
Full Year
25
(Dollars in millions)
(Unaudited)
2004
2003
Net income
22.7
$
18.2
$
Depreciation and amortization
65.8
74.5
Provision for bad debt
12.4
6.7
Reserve for inventory obsolescence
2.4
7.5
Stock-based compensation expense
3.9
4.1
Excess tax benefits from stock-based compensation
(0.9)
(0.1)
Deferred taxes on income
2.1
(2.8)
Net working capital
(29.2)
(29.7)
Other, net
(1.4)
4.5
Net cash provided by operating activities
77.8
82.9
Expenditures for rental equipment assets
(46.4)
(34.9)
Expenditures for property, plant and equipment
(17.0)
(16.1)
Acquisitions, net of cash acquired
(12.9)
(4.1)
Net cash used in investing activities
(76.3)
(55.1)
Purchase of treasury stock
(23.9)
(28.3)
Net loan (repayments) borrowings
7.5
(10.7)
Exercises of stock options and ESPP
3.2
2.7
Excess tax benefits from stock-based compensation
0.9
0.1
Net cash (used in) financing activities
(12.3)
(36.2)
Effect of exchange rates on cash
0.7
-
Increase (decrease) in cash
(10.1)
$
(8.4)
$
The Company adopted SFAS No. 123(R), "Share-Based Payment," as of January 1, 2005. Accordingly, certain previously
reported amounts have been restated, and certain previously reported amounts have been reclassified to conform to the
current year presentation.

Targeting EPS in the $1.61-$1.66 range, up 19-
23% over 2004
Expect copier/MFP revenue growth in the mid-
single digit percent range
Expect facsimile revenue decline in the mid-to-high
twenty percent range
Selling, service and administrative expenses and
accounts receivable balance expected to continue
to decline
Accelerated cost reduction actions to offset greater
than anticipated fax revenue decline
Guidance for 2005
13
26

Outlook
Targeting 15-20% average
annual growth
Targeting continuous
productivity improvements
resulting in a decline in SS&A
expenses as a percent of
revenue
Significant reduction
expected as ERP
implementation is completed
in 2005
Operating Expenses
Targeting $1.61-$1.66 for
2005
EPS
Significant cash flow generation will be used to:
1.
Finance copier rental asset base
2.
Acquire independent dealerships
3.
Repurchase IGI stock
Cash Flow
Targeting mid-to-high single
digit percent growth in
copier/MFP revenue and mid-to-
high single digit percent decline
in facsimile revenue
Growth of copier/MFP
revenue is expected to
exceed the decline in fax
Revenue
Long Term
Short Term
27

Summary
28

An Investment With Imagistics
is Compelling
For Our Customers:
We provide the best of breed products from the best manufacturers
around the world.
We test our products for superior quality, reliability and
functionality so the customer can focus on their business.
We provide a complete office document solution – from facsimile to
networked multifunctional copy/scan/fax/print/email – black & white
to color.
We have extensive national sales and service organizations to
provide a superior sales and customer service experience.
We are nationally recognized by J.D. Power and Associates as the
“#1 Copier/Multifunction Product in Overall Customer Satisfaction
Among Business Users, Two Years in a Row, Tied in 2003”.
29

For Our Shareholders:
We have a proven business model with superior growth
potential in the huge office document market.
Our core copier/MFP business continues its solid growth.
We are focused on profitability and cash generation.
We have a strong balance sheet and are conservatively
capitalized.
We use our substantial cash flow to finance the rental asset
base, further grow through selective acquisitions, and
repurchase shares.
We have a strong management team with a demonstrated
track record of successfully executing our business plan.
We have provided superior shareholder returns since
inception.
30
An Investment With Imagistics
is Compelling

For Our Employees:
Our work environment stresses integrity and can be summed
up by PRIDE, our winning principles:
- Profitable growth
- Respect
- Imaginative solutions
- Delivery of commitments
- Excellence of operations
31
An Investment With Imagistics
is Compelling