
CORPORATE OVERVIEW MAY 16, 2019 Exhibit 99.2
SAFE HARBOR & OTHER CAUTIONARY NOTES This presentation has been prepared by Power Solutions International, Inc. (PSI) for investors, solely for informational purposes. The information contained in this presentation does not purport to be all-inclusive or to contain all of the information a prospective or existing investor may desire. All of the financial information and other information regarding PSI contained in this presentation (including any oral statements transmitted to the recipients of this presentation) is qualified in its entirety by PSI’s filings with the Securities and Exchange Commission (SEC), including the financial statements and other financial disclosure contained in those filings. PSI makes no representation or warranty as to the accuracy or completeness of the information contained in this presentation (including any oral statements transmitted to the recipients of this presentation). This presentation (including any oral statements transmitted to the recipients of this presentation) contains forward-looking statements regarding the current expectations of the Company about its prospects and opportunities. These forward-looking statements are entitled to the safe-harbor provisions of Section 21E of the Securities Exchange Act of 1934. The Company has tried to identify these forward-looking statements by using words such as “anticipate,” “believe,” “budgeted,” “contemplate,” “estimate,” “expect,” “forecast,” “guidance,” “may,” “outlook,” “plan,” “projection,” “should,” “target,” “will,” “would,” or similar expressions, but these words are not the exclusive means for identifying such statements. These forward-looking statements include statements regarding the Company’s sales expectations and potential profitability, future business strategies and market opportunities, improvements in its business, remediation of internal controls, improvement of product margins, product market conditions and trends, a debt refinancing and a potential listing on a national exchange. These statements are subject to a number of risks, uncertainties, and assumptions that may cause actual results, performance or achievements to be materially different from those expressed in, or implied by, such statements. The Company cautions that the risks, uncertainties and other factors that could cause its actual results to differ materially from those expressed in, or implied by, the forward-looking statements, include, without limitation: management’s ability to successfully implement the Audit Committee’s remedial recommendations; the time and effort required to complete its delinquent financial statements and prepare the related Form 10-K and Form 10-Q filings, particularly within the current anticipated timeline; the timing of completion of necessary interim reviews and audits by the Company’s independent registered public accounting firm; the timing of completion of steps to address, and the inability to address and remedy, material weaknesses; the identification of additional material weaknesses or significant deficiencies; variances in non-recurring expenses; risks relating to the substantial costs and diversion of personnel’s attention and resources deployed to address the financial reporting and internal control matters and related class action litigation; the ability of the Company to accurately budget for and forecast sales, and the extent to which sales result in recorded revenues; the impact of the investigations being conducted by United States Securities and Exchange Commission (“SEC”), and the criminal division of the United States Attorney’s Office for the Northern District of Illinois (“USAO”) and any related or additional governmental investigative or enforcement proceedings; any delays and challenges in recruiting key employees consistent with the Company’s plans; any negative impacts from delisting of the Company's Common Stock from the NASDAQ Stock Market and any delays and challenges in obtaining a re-listing on a stock exchange; and the risks and uncertainties described in reports filed by the Company with the SEC, including without limitation its Annual Report on Form 10-K for the fiscal year ended December 31, 2017. The Company's forward-looking statements are presented as of the date hereof. Except as required by law, the Company expressly disclaims any intention or obligation to revise or update any forward-looking statements, whether as a result of new information, future events or otherwise.
ABOUT PSI
“ POWERING FORWARD Powering the future of energy, transportation and industrial applications
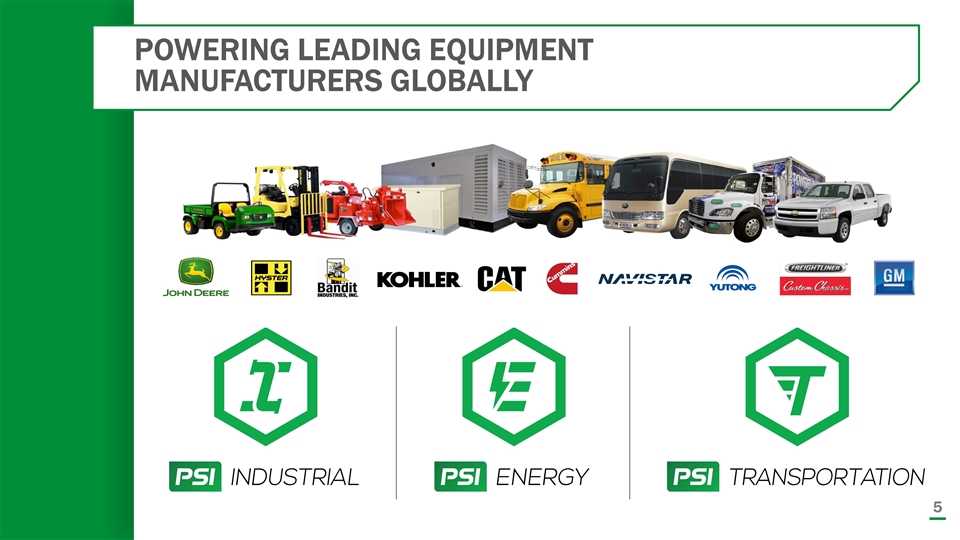
POWERING LEADING EQUIPMENT MANUFACTURERS GLOBALLY
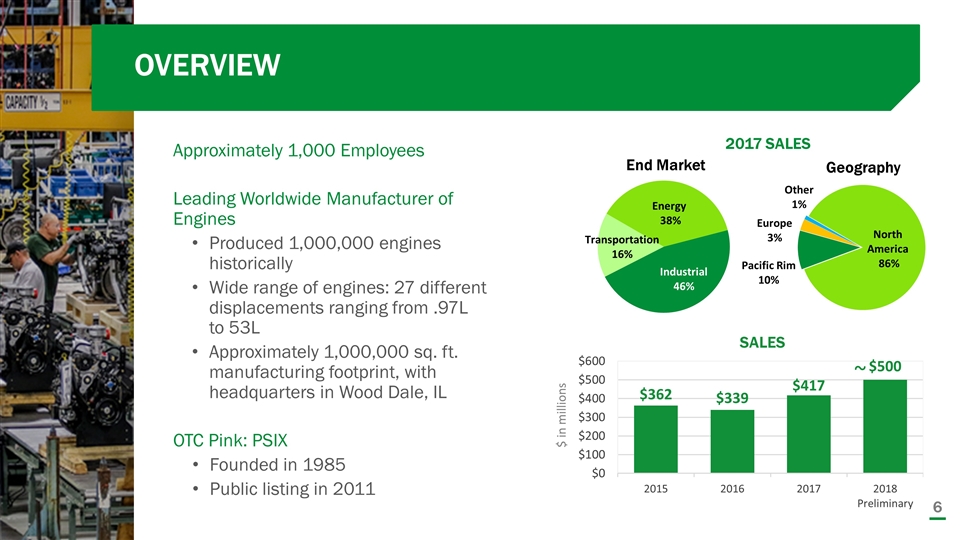
OVERVIEW Approximately 1,000 Employees Leading Worldwide Manufacturer of Engines Produced 1,000,000 engines historically Wide range of engines: 27 different displacements ranging from .97L to 53L Approximately 1,000,000 sq. ft. manufacturing footprint, with headquarters in Wood Dale, IL OTC Pink: PSIX Founded in 1985 Public listing in 2011 2017 SALES End Market Geography SALES ~ $ in millions
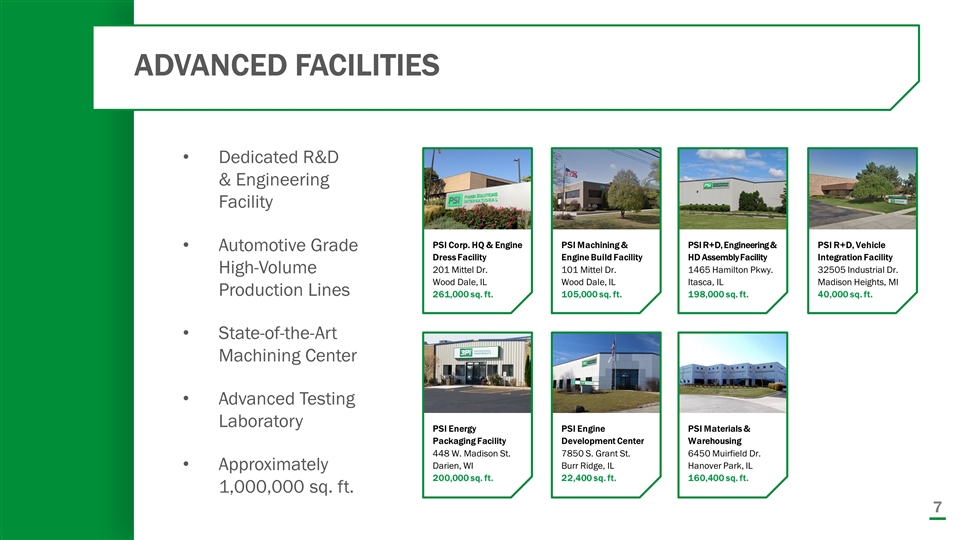
ADVANCED FACILITIES PSI Corp. HQ & Engine Dress Facility 201 Mittel Dr. Wood Dale, IL 261,000 sq. ft. Dedicated R&D & Engineering Facility Automotive Grade High-Volume Production Lines State-of-the-Art Machining Center Advanced Testing Laboratory Approximately 1,000,000 sq. ft. PSI Machining & Engine Build Facility 101 Mittel Dr. Wood Dale, IL 105,000 sq. ft. PSI R+D, Engineering & HD Assembly Facility 1465 Hamilton Pkwy. Itasca, IL 198,000 sq. ft. PSI R+D, Vehicle Integration Facility 32505 Industrial Dr. Madison Heights, MI 40,000 sq. ft. PSI Energy Packaging Facility 448 W. Madison St. Darien, WI 200,000 sq. ft. PSI Engine Development Center 7850 S. Grant St. Burr Ridge, IL 22,400 sq. ft. PSI Materials & Warehousing 6450 Muirfield Dr. Hanover Park, IL 160,400 sq. ft.
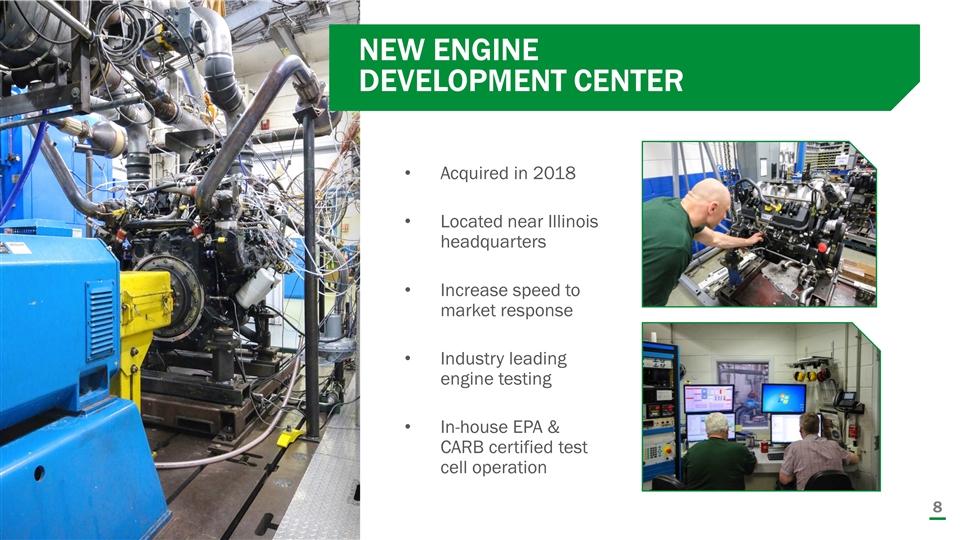
NEW ENGINE DEVELOPMENT CENTER Acquired in 2018 Located near Illinois headquarters Increase speed to market response Industry leading engine testing In-house EPA & CARB certified test cell operation
TECHNOLOGIES & TALENT Leading Talent Advanced Engineering Disciplines Industry-Leading Application Knowledge Strategic Partnerships Approximately 1,000 Employees Innovative Technologies PSI Proprietary Engines & Controls Certified, Low-Emission Solutions (EPA, CARB Certifications) Fuel-Flexible Systems: Natural Gas, Propane, Gasoline, Diesel
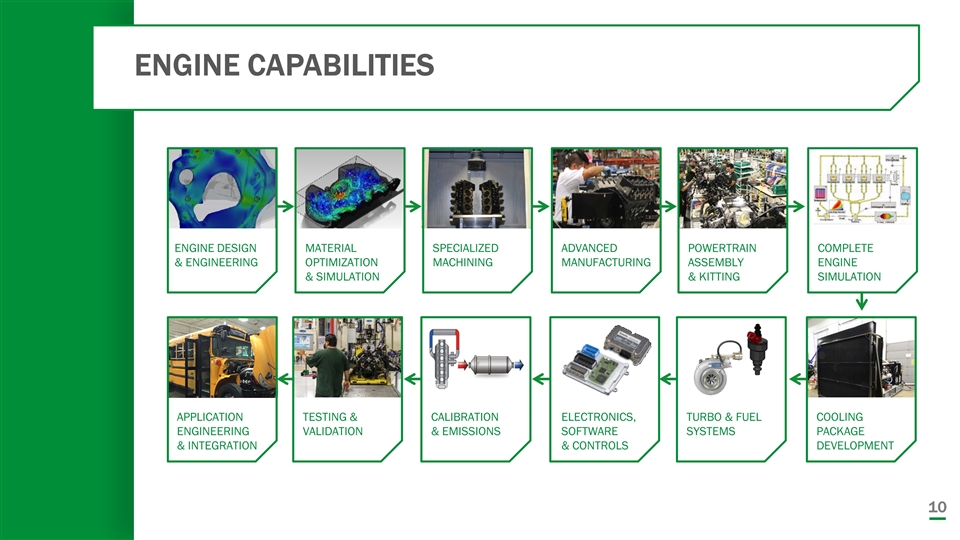
ENGINE CAPABILITIES APPLICATION ENGINEERING & INTEGRATION TESTING & VALIDATION CALIBRATION & EMISSIONS ENGINE DESIGN & ENGINEERING MATERIAL OPTIMIZATION & SIMULATION SPECIALIZED MACHINING ADVANCED MANUFACTURING POWERTRAIN ASSEMBLY & KITTING COMPLETE ENGINE SIMULATION COOLING PACKAGE DEVELOPMENT TURBO & FUEL SYSTEMS ELECTRONICS, SOFTWARE & CONTROLS
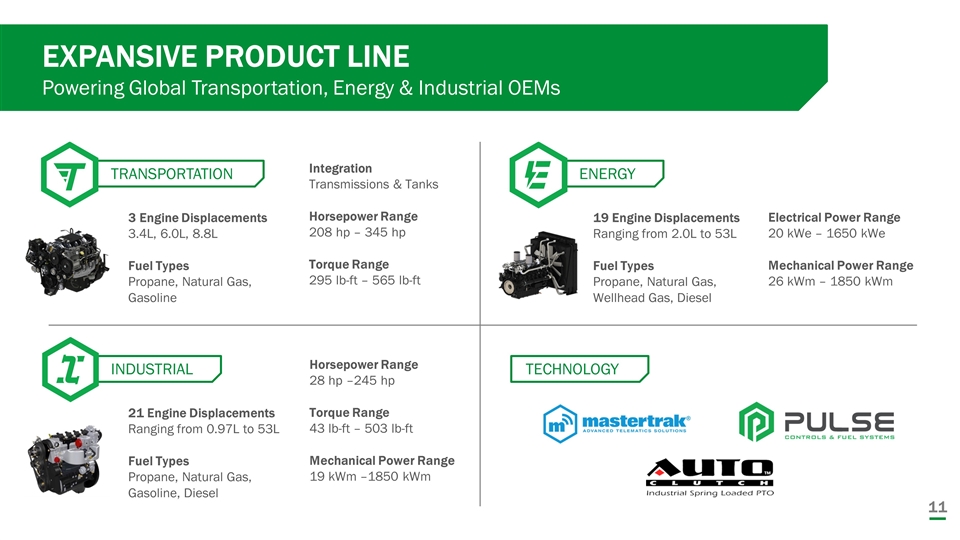
TRANSPORTATION EXPANSIVE PRODUCT LINE Powering Global Transportation, Energy & Industrial OEMs 3 Engine Displacements 3.4L, 6.0L, 8.8L Fuel Types Propane, Natural Gas, Gasoline Integration Transmissions & Tanks Horsepower Range 208 hp – 345 hp Torque Range 295 lb-ft – 565 lb-ft INDUSTRIAL 21 Engine Displacements Ranging from 0.97L to 53L Fuel Types Propane, Natural Gas, Gasoline, Diesel Horsepower Range 28 hp –245 hp Torque Range 43 lb-ft – 503 lb-ft Mechanical Power Range 19 kWm –1850 kWm ENERGY 19 Engine Displacements Ranging from 2.0L to 53L Fuel Types Propane, Natural Gas, Wellhead Gas, Diesel Electrical Power Range 20 kWe – 1650 kWe Mechanical Power Range 26 kWm – 1850 kWm TECHNOLOGY
WEICHAI COLLABORATION A Global Partner
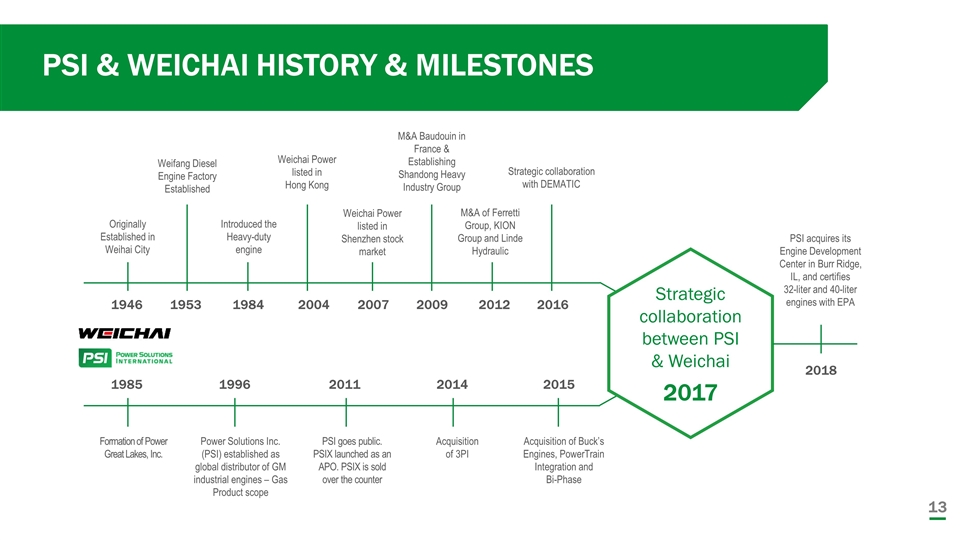
PSI & WEICHAI HISTORY & MILESTONES Formation of Power Great Lakes, Inc. Power Solutions Inc. (PSI) established as global distributor of GM industrial engines – Gas Product scope Acquisition of 3PI Acquisition of Buck’s Engines, PowerTrain Integration and Bi-Phase PSI goes public. PSIX launched as an APO. PSIX is sold over the counter Originally Established in Weihai City Weifang Diesel Engine Factory Established Introduced the Heavy-duty engine Weichai Power listed in Hong Kong Weichai Power listed in Shenzhen stock market M&A Baudouin in France & Establishing Shandong Heavy Industry Group M&A of Ferretti Group, KION Group and Linde Hydraulic Strategic collaboration with DEMATIC 1985 1996 2011 2014 2015 1946 2004 2007 2012 2016 1953 1984 2009 Strategic collaboration between PSI & Weichai 2017 2018 PSI acquires its Engine Development Center in Burr Ridge, IL, and certifies 32-liter and 40-liter engines with EPA
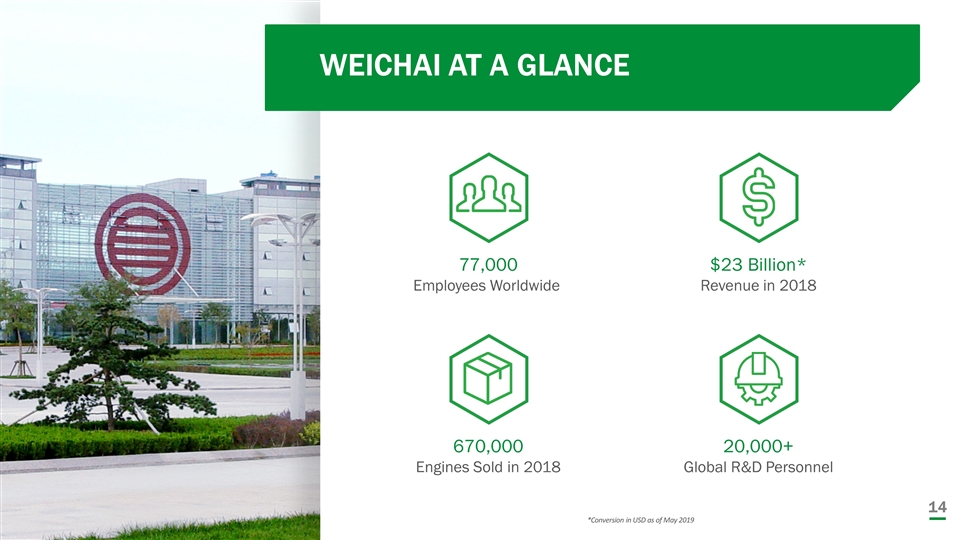
WEICHAI AT A GLANCE 77,000 Employees Worldwide $23 Billion* Revenue in 2018 670,000 Engines Sold in 2018 20,000+ Global R&D Personnel *Conversion in USD as of May 2019
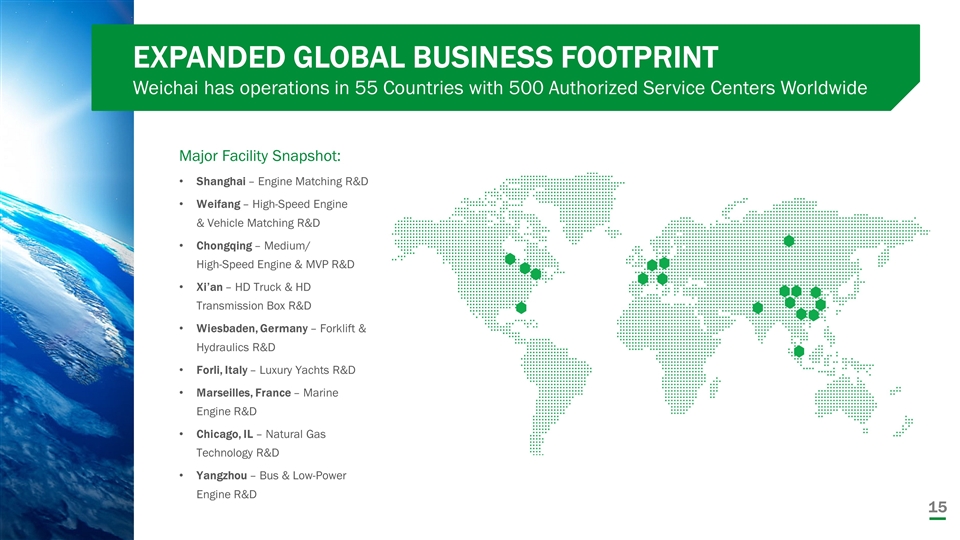
Major Facility Snapshot: Shanghai – Engine Matching R&D Weifang – High-Speed Engine & Vehicle Matching R&D Chongqing – Medium/ High-Speed Engine & MVP R&D Xi’an – HD Truck & HD Transmission Box R&D Wiesbaden, Germany – Forklift & Hydraulics R&D Forli, Italy – Luxury Yachts R&D Marseilles, France – Marine Engine R&D Chicago, IL – Natural Gas Technology R&D Yangzhou – Bus & Low-Power Engine R&D EXPANDED GLOBAL BUSINESS FOOTPRINT Weichai has operations in 55 Countries with 500 Authorized Service Centers Worldwide
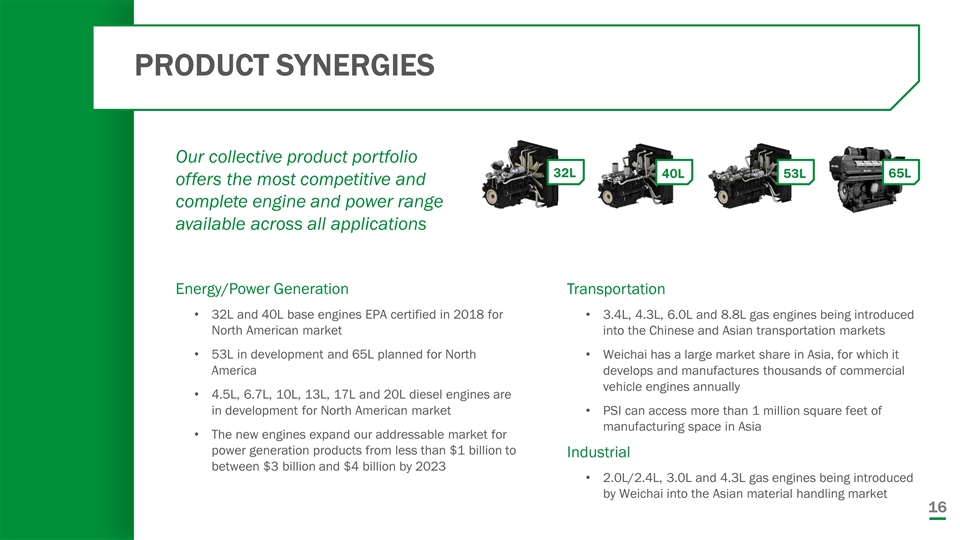
PRODUCT SYNERGIES Our collective product portfolio offers the most competitive and complete engine and power range available across all applications Transportation 3.4L, 4.3L, 6.0L and 8.8L gas engines being introduced into the Chinese and Asian transportation markets Weichai has a large market share in Asia, for which it develops and manufactures thousands of commercial vehicle engines annually PSI can access more than 1 million square feet of manufacturing space in Asia Industrial 2.0L/2.4L, 3.0L and 4.3L gas engines being introduced by Weichai into the Asian material handling market Energy/Power Generation 32L and 40L base engines EPA certified in 2018 for North American market 53L in development and 65L planned for North America 4.5L, 6.7L, 10L, 13L, 17L and 20L diesel engines are in development for North American market The new engines expand our addressable market for power generation products from less than $1 billion to between $3 billion and $4 billion by 2023 32L 40L 53L 65L
A STRONGER FOUNDATION Expanded China Service Network (On‐Highway/Industrial) Weichai service network consists of 5,000 special maintenance service centers in Asia 243 overseas service stations Weichai Can Assist with Certification of Engines in China Weichai testing and certification laboratory (1 of 3 National Certified Test labs for all Chinese regulations for Gas & Diesel) 20,000+ Global R&D personnel Cost Reduction Opportunities State-of‐the‐art foundries and machining facilities Resourcing of block and head machining for PSI’s 8.8L Potential manufacturing and global supply chain opportunities R&D PRODUCT FINANCE SUPPLY CHAIN SERVICE NETWORK
MARKET INDICATORS
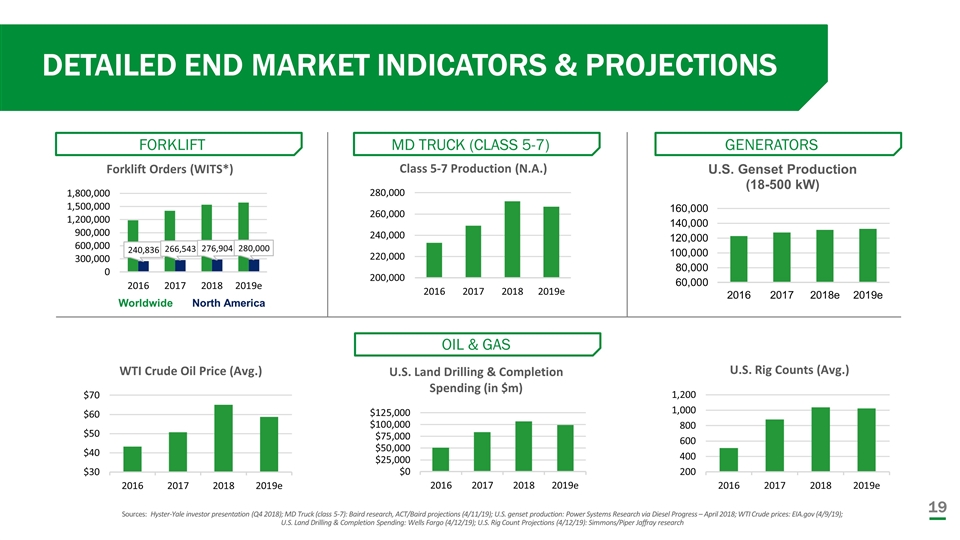
DETAILED END MARKET INDICATORS & PROJECTIONS Worldwide North America Sources: Hyster-Yale investor presentation (Q4 2018); MD Truck (class 5-7): Baird research, ACT/Baird projections (4/11/19); U.S. genset production: Power Systems Research via Diesel Progress – April 2018; WTI Crude prices: EIA.gov (4/9/19); U.S. Land Drilling & Completion Spending: Wells Fargo (4/12/19); U.S. Rig Count Projections (4/12/19): Simmons/Piper Jaffray research FORKLIFT MD TRUCK (CLASS 5-7) GENERATORS OIL & GAS
ENERGY Powering the Future
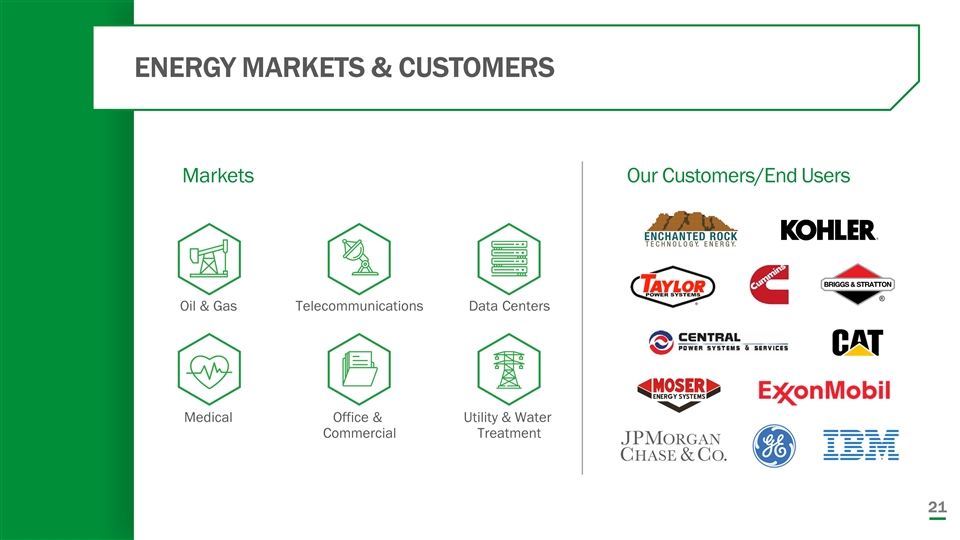
ENERGY MARKETS & CUSTOMERS Our Customers/End Users Markets Oil & Gas Telecommunications Data Centers Medical Office & Commercial Utility & Water Treatment
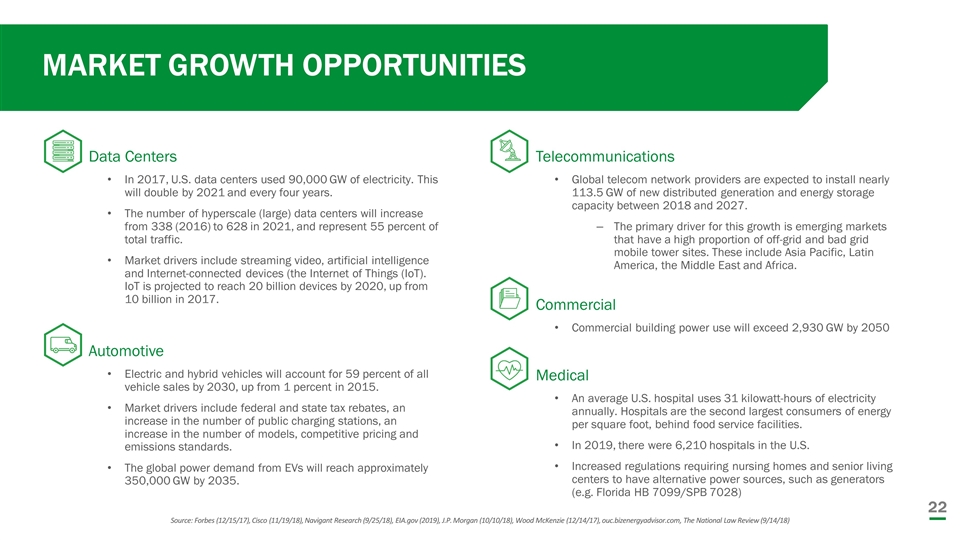
Data Centers In 2017, U.S. data centers used 90,000 GW of electricity. This will double by 2021 and every four years. The number of hyperscale (large) data centers will increase from 338 (2016) to 628 in 2021, and represent 55 percent of total traffic. Market drivers include streaming video, artificial intelligence and Internet-connected devices (the Internet of Things (IoT). IoT is projected to reach 20 billion devices by 2020, up from 10 billion in 2017. Telecommunications Global telecom network providers are expected to install nearly 113.5 GW of new distributed generation and energy storage capacity between 2018 and 2027. The primary driver for this growth is emerging markets that have a high proportion of off-grid and bad grid mobile tower sites. These include Asia Pacific, Latin America, the Middle East and Africa. Commercial Commercial building power use will exceed 2,930 GW by 2050 Automotive Electric and hybrid vehicles will account for 59 percent of all vehicle sales by 2030, up from 1 percent in 2015. Market drivers include federal and state tax rebates, an increase in the number of public charging stations, an increase in the number of models, competitive pricing and emissions standards. The global power demand from EVs will reach approximately 350,000 GW by 2035. Medical An average U.S. hospital uses 31 kilowatt-hours of electricity annually. Hospitals are the second largest consumers of energy per square foot, behind food service facilities. In 2019, there were 6,210 hospitals in the U.S. Increased regulations requiring nursing homes and senior living centers to have alternative power sources, such as generators (e.g. Florida HB 7099/SPB 7028) Source: Forbes (12/15/17), Cisco (11/19/18), Navigant Research (9/25/18), EIA.gov (2019), J.P. Morgan (10/10/18), Wood McKenzie (12/14/17), ouc.bizenergyadvisor.com, The National Law Review (9/14/18) MARKET GROWTH OPPORTUNITIES
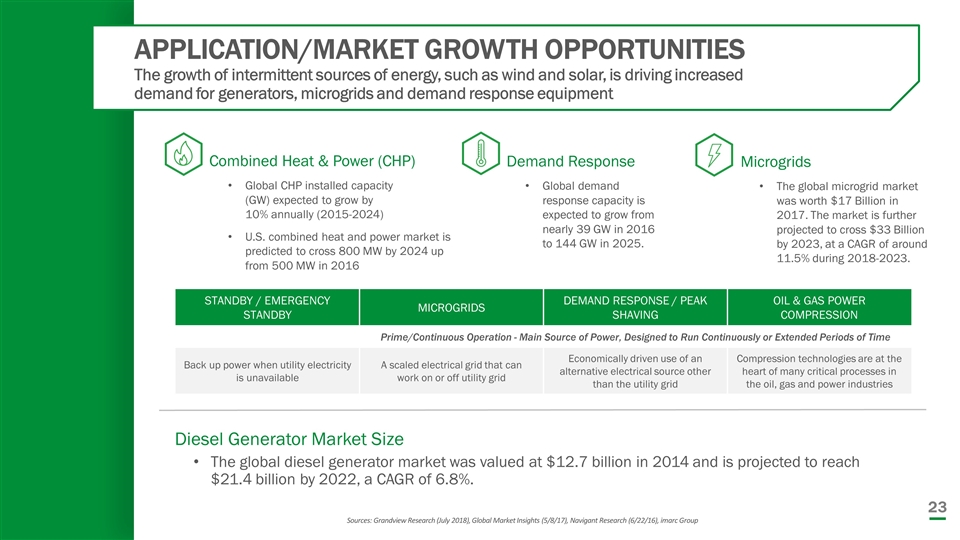
APPLICATION/MARKET GROWTH OPPORTUNITIES The growth of intermittent sources of energy, such as wind and solar, is driving increased demand for generators, microgrids and demand response equipment Sources: Grandview Research (July 2018), Global Market Insights (5/8/17), Navigant Research (6/22/16), imarc Group Diesel Generator Market Size The global diesel generator market was valued at $12.7 billion in 2014 and is projected to reach $21.4 billion by 2022, a CAGR of 6.8%. Combined Heat & Power (CHP) Global CHP installed capacity (GW) expected to grow by 10% annually (2015-2024) U.S. combined heat and power market is predicted to cross 800 MW by 2024 up from 500 MW in 2016 Microgrids The global microgrid market was worth $17 Billion in 2017. The market is further projected to cross $33 Billion by 2023, at a CAGR of around 11.5% during 2018-2023. Demand Response Global demand response capacity is expected to grow from nearly 39 GW in 2016 to 144 GW in 2025. STANDBY / EMERGENCY STANDBY MICROGRIDS DEMAND RESPONSE / PEAK SHAVING OIL & GAS POWER COMPRESSION Prime/Continuous Operation - Main Source of Power, Designed to Run Continuously or Extended Periods of Time Back up power when utility electricity is unavailable A scaled electrical grid that can work on or off utility grid Economically driven use of an alternative electrical source other than the utility grid Compression technologies are at the heart of many critical processes in the oil, gas and power industries
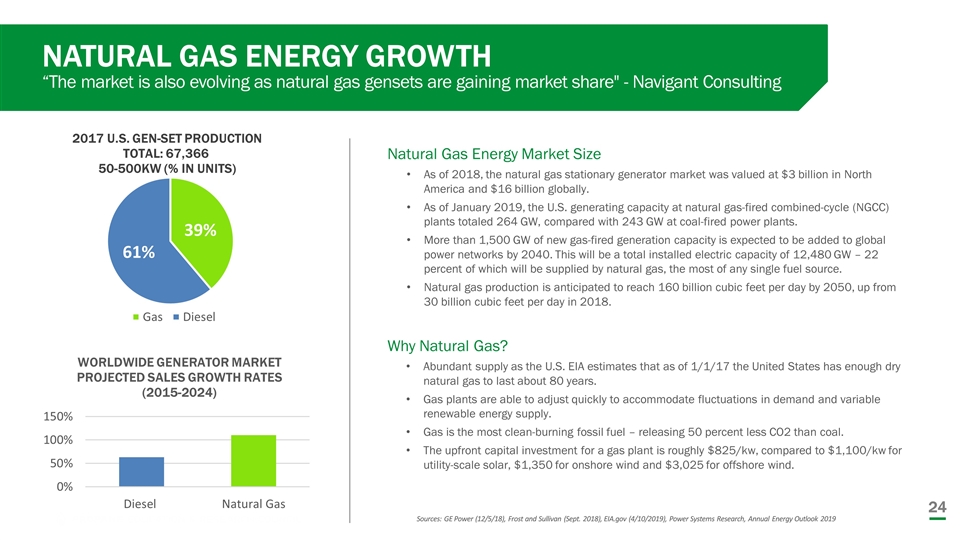
NATURAL GAS ENERGY GROWTH “The market is also evolving as natural gas gensets are gaining market share" - Navigant Consulting Sources: GE Power (12/5/18), Frost and Sullivan (Sept. 2018), EIA.gov (4/10/2019), Power Systems Research, Annual Energy Outlook 2019 Natural Gas Energy Market Size As of 2018, the natural gas stationary generator market was valued at $3 billion in North America and $16 billion globally. As of January 2019, the U.S. generating capacity at natural gas-fired combined-cycle (NGCC) plants totaled 264 GW, compared with 243 GW at coal-fired power plants. More than 1,500 GW of new gas-fired generation capacity is expected to be added to global power networks by 2040. This will be a total installed electric capacity of 12,480 GW – 22 percent of which will be supplied by natural gas, the most of any single fuel source. Natural gas production is anticipated to reach 160 billion cubic feet per day by 2050, up from 30 billion cubic feet per day in 2018. Why Natural Gas? Abundant supply as the U.S. EIA estimates that as of 1/1/17 the United States has enough dry natural gas to last about 80 years. Gas plants are able to adjust quickly to accommodate fluctuations in demand and variable renewable energy supply. Gas is the most clean-burning fossil fuel – releasing 50 percent less CO2 than coal. The upfront capital investment for a gas plant is roughly $825/kw, compared to $1,100/kw for utility-scale solar, $1,350 for onshore wind and $3,025 for offshore wind.
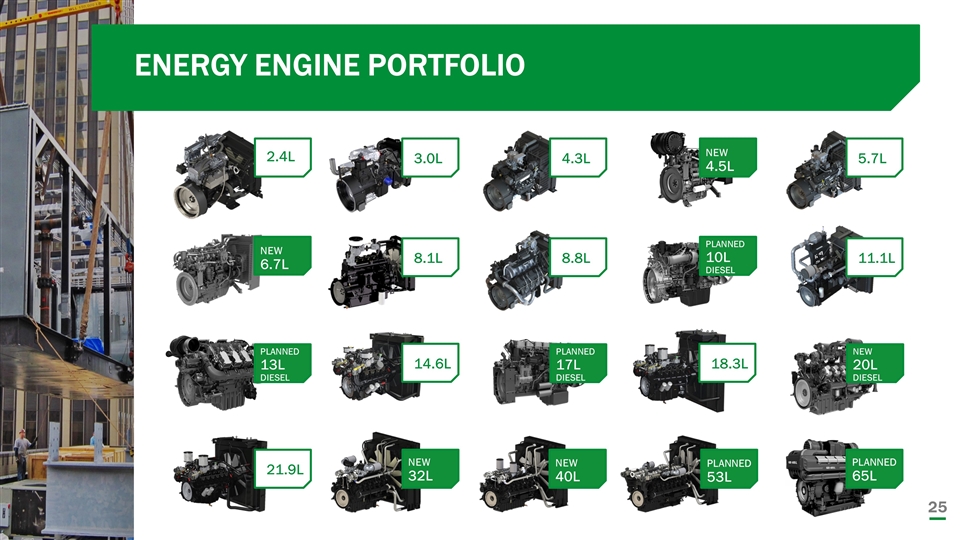
ENERGY ENGINE PORTFOLIO 2.4L 3.0L 4.3L 5.7L 8.1L 8.8L 11.1L 14.6L 18.3L 21.9L PLANNED 65L PLANNED 53L NEW 40L NEW 32L NEW 6.7L PLANNED 10L DIESEL NEW 20L DIESEL PLANNED 17L DIESEL PLANNED 13L DIESEL NEW 4.5L
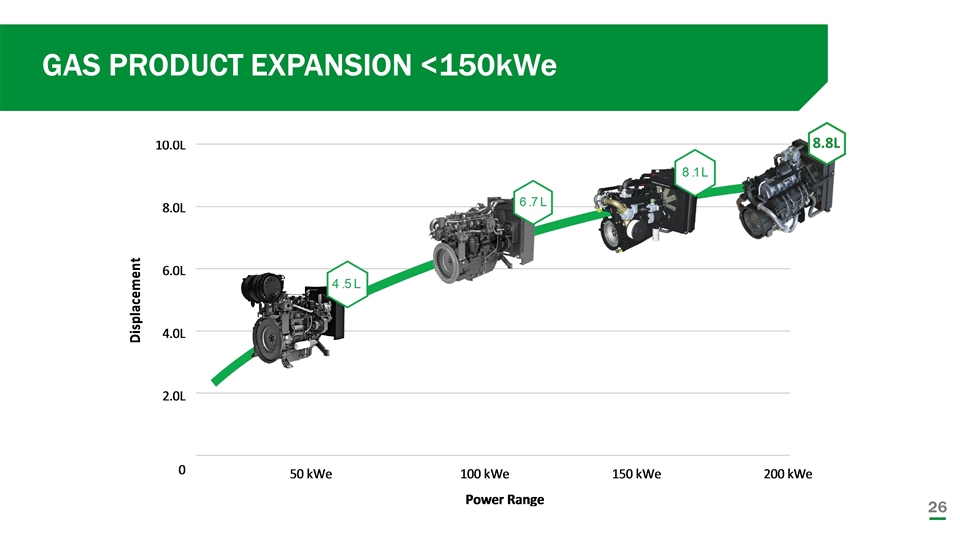
GAS PRODUCT EXPANSION <150kWe 8.8L
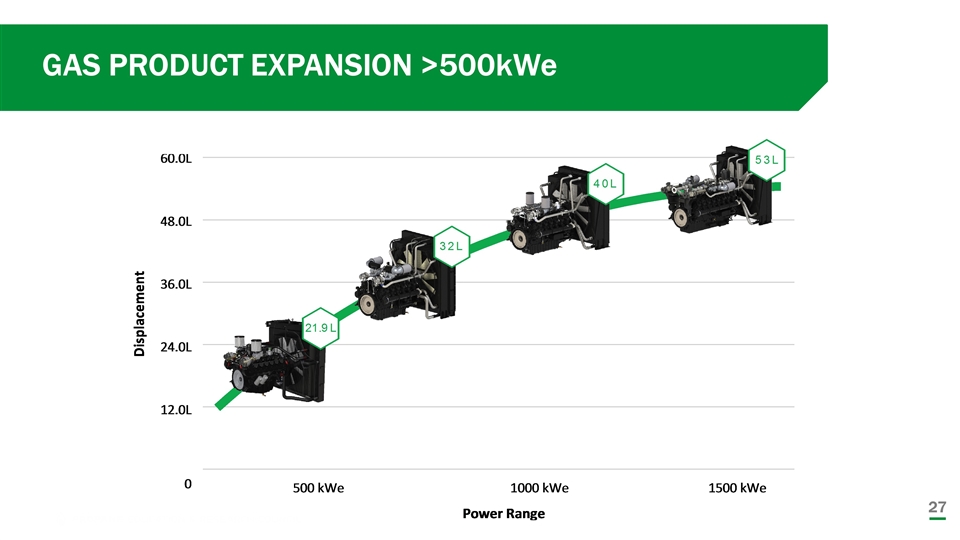
GAS PRODUCT EXPANSION >500kWe
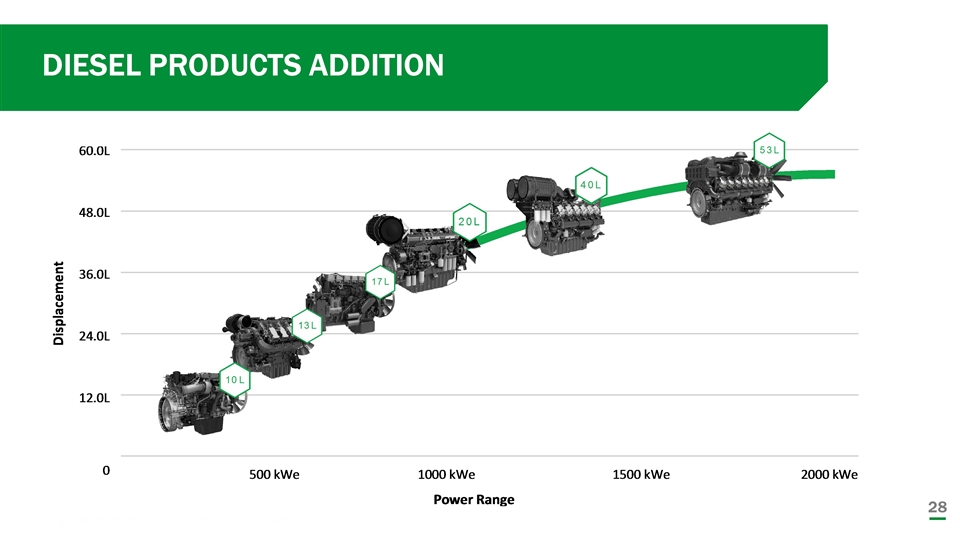
DIESEL PRODUCTS ADDITION
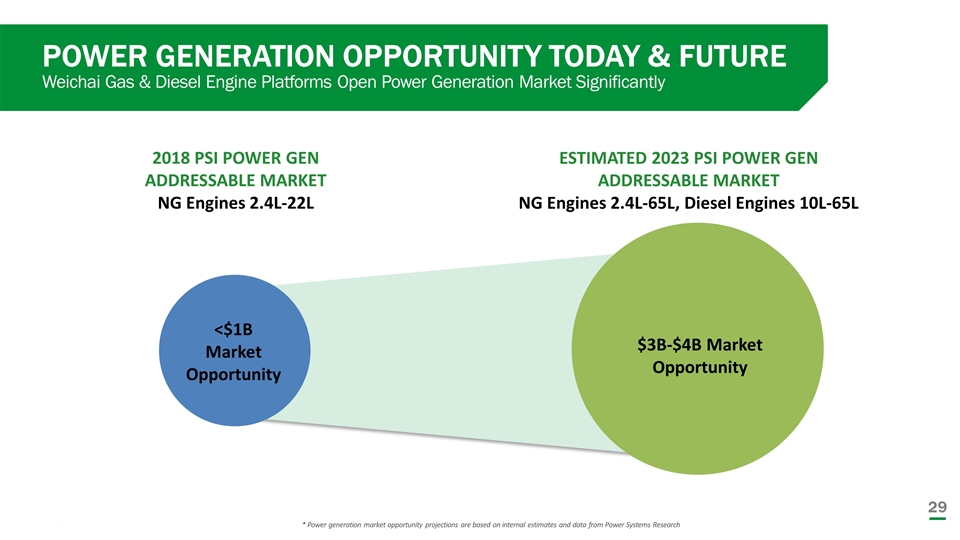
POWER GENERATION OPPORTUNITY TODAY & FUTURE Weichai Gas & Diesel Engine Platforms Open Power Generation Market Significantly * Power generation market opportunity projections are based on internal estimates and data from Power Systems Research 2018 PSI POWER GEN ADDRESSABLE MARKET NG Engines 2.4L-22L ESTIMATED 2023 PSI POWER GEN ADDRESSABLE MARKET NG Engines 2.4L-65L, Diesel Engines 10L-65L $3B-$4B Market Opportunity <$1B Market Opportunity

TRANSPORTATION Powering the Road Ahead
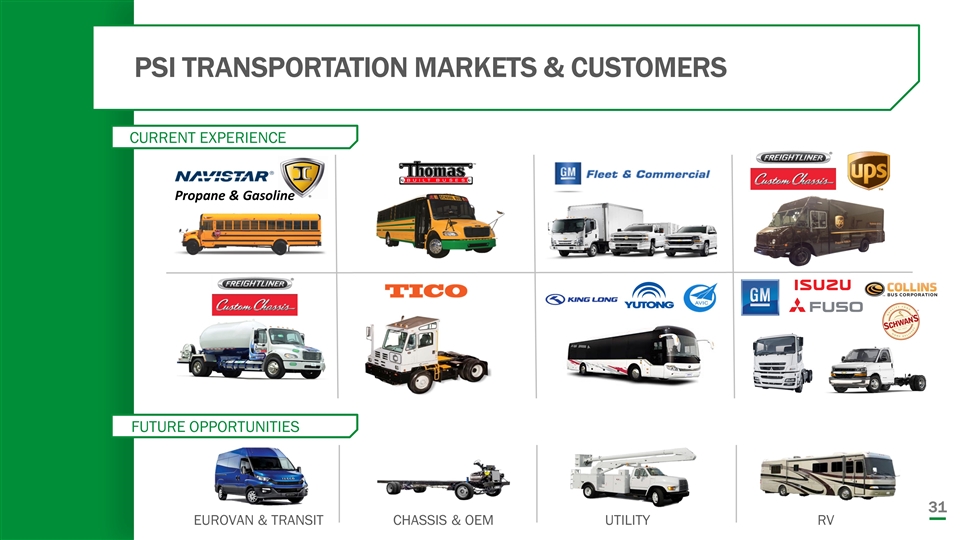
PSI TRANSPORTATION MARKETS & CUSTOMERS Propane & Gasoline EUROVAN & TRANSIT CHASSIS & OEM UTILITY RV CURRENT EXPERIENCE FUTURE OPPORTUNITIES
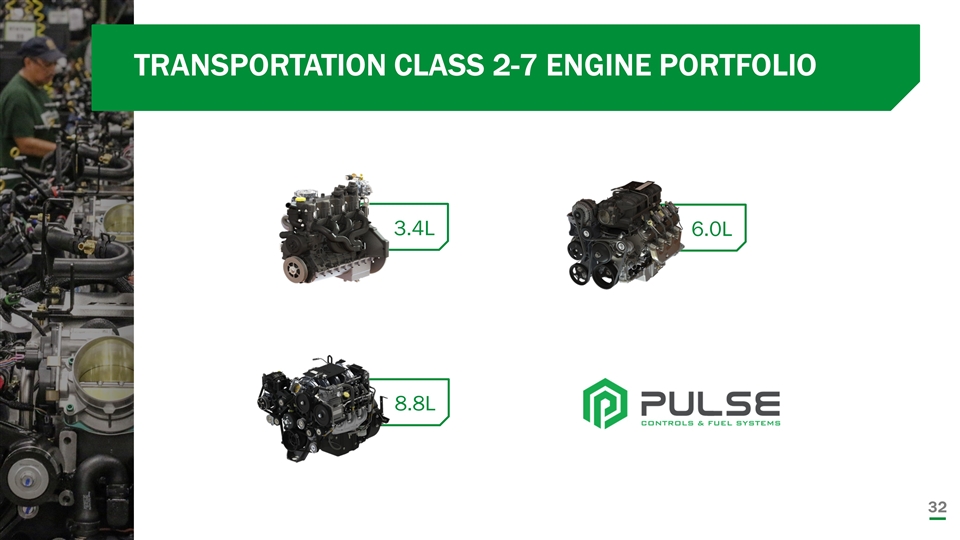
8.8L 6.0L TRANSPORTATION CLASS 2-7 ENGINE PORTFOLIO 3.4L
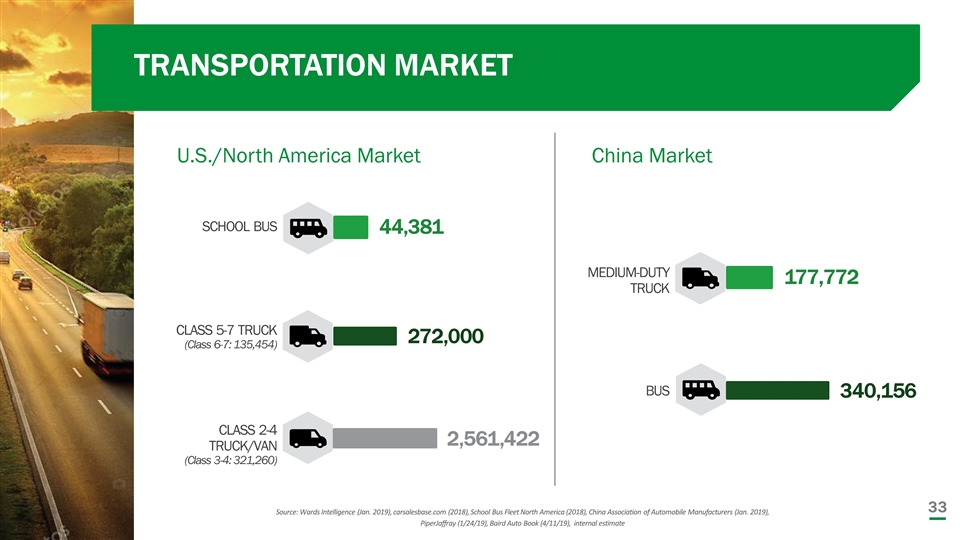
TRANSPORTATION MARKET China Market U.S./North America Market Source: Wards Intelligence (Jan. 2019), carsalesbase.com (2018), School Bus Fleet North America (2018), China Association of Automobile Manufacturers (Jan. 2019), PiperJaffray (1/24/19), Baird Auto Book (4/11/19), internal estimate SCHOOL BUS CLASS 5-7 TRUCK (Class 6-7: 135,454) CLASS 2-4 TRUCK/VAN (Class 3-4: 321,260) 44,381 272,000 2,561,422 MEDIUM-DUTY TRUCK BUS 177,772 340,156
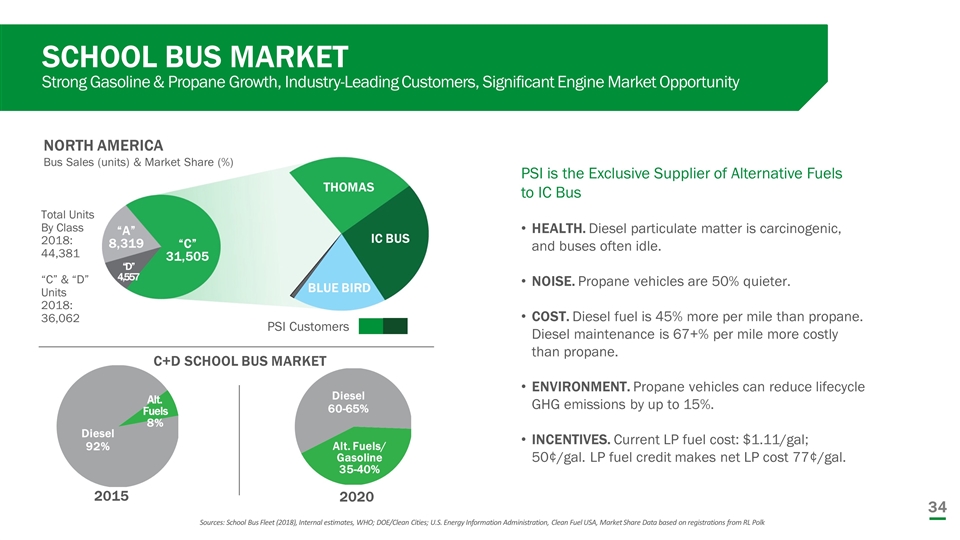
SCHOOL BUS MARKET Strong Gasoline & Propane Growth, Industry-Leading Customers, Significant Engine Market Opportunity Sources: School Bus Fleet (2018), Internal estimates, WHO; DOE/Clean Cities; U.S. Energy Information Administration, Clean Fuel USA, Market Share Data based on registrations from RL Polk Total Units By Class 2018: 44,381 “C” & “D” Units 2018: 36,062 “C” 31,505 “A” 8,319 “D” 4,557 THOMAS IC BUS BLUE BIRD 2015 2020 Diesel 92% Alt. Fuels 8% Diesel 60-65% Alt. Fuels/ Gasoline 35-40% PSI Customers NORTH AMERICA Bus Sales (units) & Market Share (%) PSI is the Exclusive Supplier of Alternative Fuels to IC Bus HEALTH. Diesel particulate matter is carcinogenic, and buses often idle. NOISE. Propane vehicles are 50% quieter. COST. Diesel fuel is 45% more per mile than propane. Diesel maintenance is 67+% per mile more costly than propane. ENVIRONMENT. Propane vehicles can reduce lifecycle GHG emissions by up to 15%. INCENTIVES. Current LP fuel cost: $1.11/gal; 50¢/gal. LP fuel credit makes net LP cost 77¢/gal. C+D SCHOOL BUS MARKET
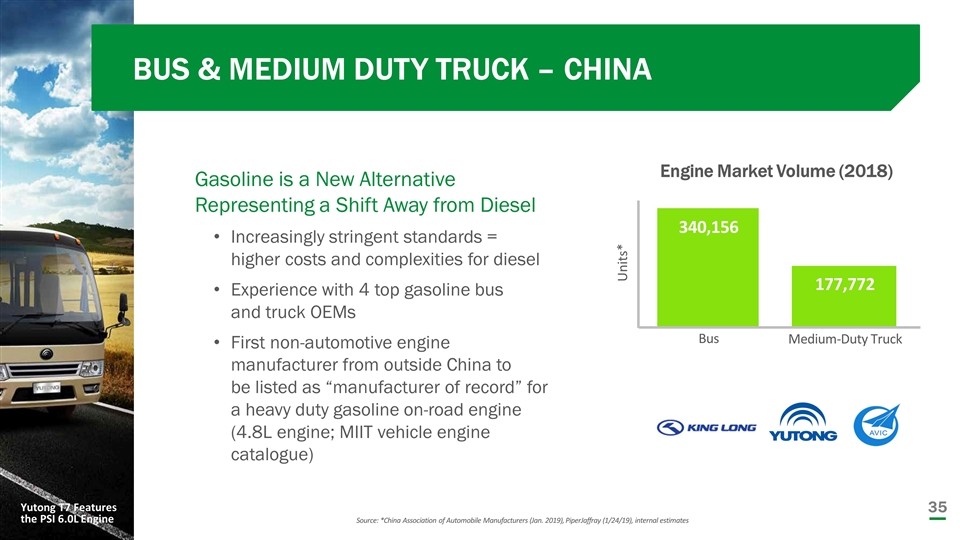
BUS & MEDIUM DUTY TRUCK – CHINA Gasoline is a New Alternative Representing a Shift Away from Diesel Increasingly stringent standards = higher costs and complexities for diesel Experience with 4 top gasoline bus and truck OEMs First non-automotive engine manufacturer from outside China to be listed as “manufacturer of record” for a heavy duty gasoline on-road engine (4.8L engine; MIIT vehicle engine catalogue) Engine Market Volume (2018) Units* Bus Medium-Duty Truck 340,156 177,772 Source: *China Association of Automobile Manufacturers (Jan. 2019), PiperJaffray (1/24/19), internal estimates Yutong T7 Features the PSI 6.0L Engine
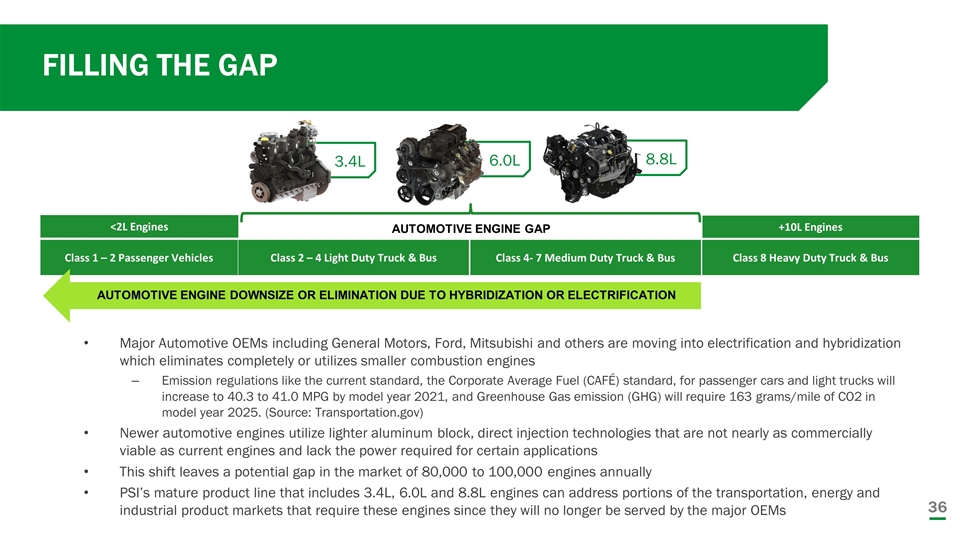
Major Automotive OEMs including General Motors, Ford, Mitsubishi and others are moving into electrification and hybridization which eliminates completely or utilizes smaller combustion engines Emission regulations like the current standard, the Corporate Average Fuel (CAFÉ) standard, for passenger cars and light trucks will increase to 40.3 to 41.0 MPG by model year 2021, and Greenhouse Gas emission (GHG) will require 163 grams/mile of CO2 in model year 2025. (Source: Transportation.gov) Newer automotive engines utilize lighter aluminum block, direct injection technologies that are not nearly as commercially viable as current engines and lack the power required for certain applications This shift leaves a potential gap in the market of 80,000 to 100,000 engines annually PSI’s mature product line that includes 3.4L, 6.0L and 8.8L engines can address portions of the transportation, energy and industrial product markets that require these engines since they will no longer be served by the major OEMs Class 1 – 2 Passenger Vehicles Class 2 – 4 Light Duty Truck & Bus Class 4- 7 Medium Duty Truck & Bus Class 8 Heavy Duty Truck & Bus 8.8L 6.0L 3.4L +10L Engines <2L Engines AUTOMOTIVE ENGINE DOWNSIZE OR ELIMINATION DUE TO HYBRIDIZATION OR ELECTRIFICATION AUTOMOTIVE ENGINE GAP FILLING THE GAP
INDUSTRIAL Powering Productivity
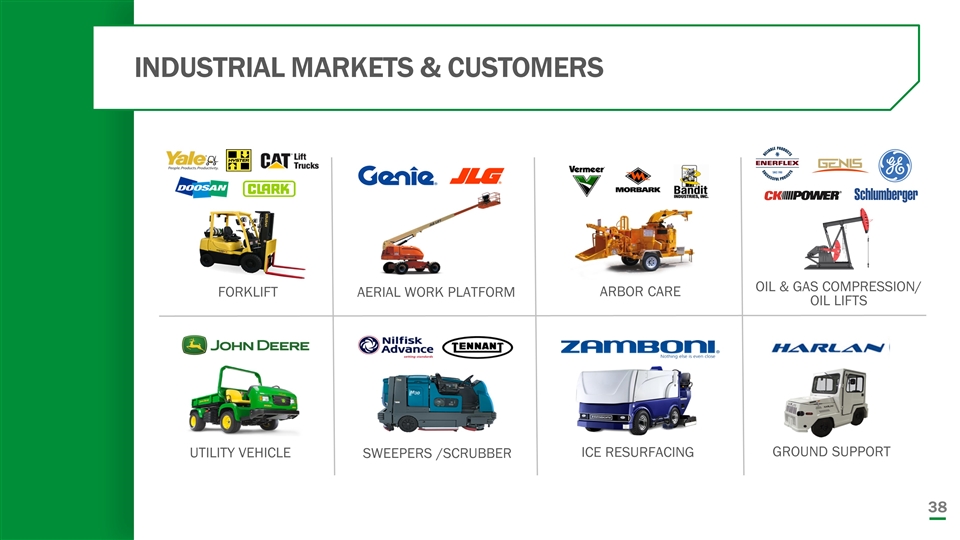
INDUSTRIAL MARKETS & CUSTOMERS OIL & GAS COMPRESSION/ OIL LIFTS GROUND SUPPORT FORKLIFT AERIAL WORK PLATFORM ARBOR CARE UTILITY VEHICLE SWEEPERS /SCRUBBER ICE RESURFACING
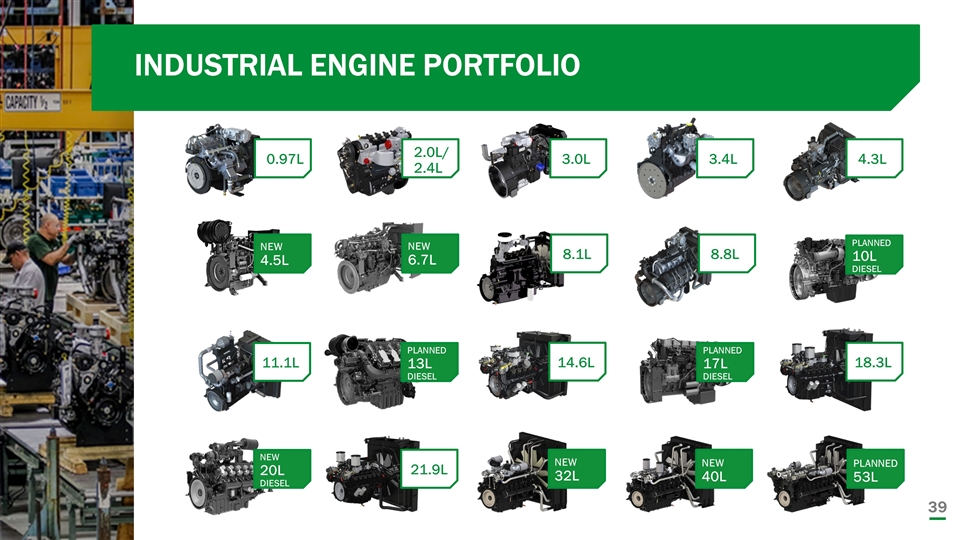
0.97L 2.0L/ 2.4L 4.3L 21.9L PLANNED 53L NEW 40L NEW 32L NEW 20L DIESEL 3.0L 3.4L NEW 6.7L NEW 4.5L 8.1L 8.8L PLANNED 10L DIESEL 14.6L 18.3L PLANNED 17L DIESEL PLANNED 13L DIESEL 11.1L INDUSTRIAL ENGINE PORTFOLIO

FINANCIAL UPDATE NEXT STEPS BUSINESS OBJECTIVES
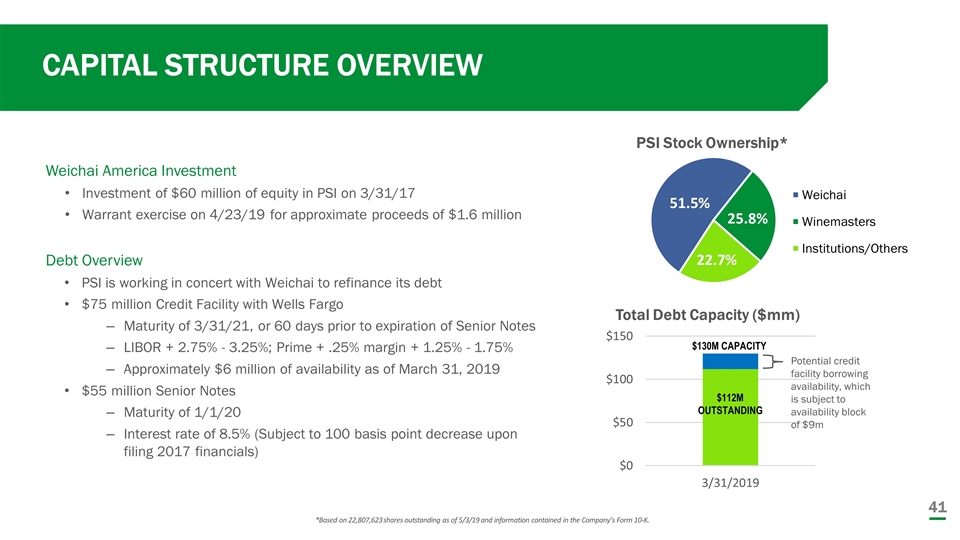
CAPITAL STRUCTURE OVERVIEW *Based on 22,807,623 shares outstanding as of 5/3/19 and information contained in the Company’s Form 10-K. Weichai America Investment Investment of $60 million of equity in PSI on 3/31/17 Warrant exercise on 4/23/19 for approximate proceeds of $1.6 million Debt Overview PSI is working in concert with Weichai to refinance its debt $75 million Credit Facility with Wells Fargo Maturity of 3/31/21, or 60 days prior to expiration of Senior Notes LIBOR + 2.75% - 3.25%; Prime + .25% margin + 1.25% - 1.75% Approximately $6 million of availability as of March 31, 2019 $55 million Senior Notes Maturity of 1/1/20 Interest rate of 8.5% (Subject to 100 basis point decrease upon filing 2017 financials) Potential credit facility borrowing availability, which is subject to availability block of $9m $130M CAPACITY $112M OUTSTANDING
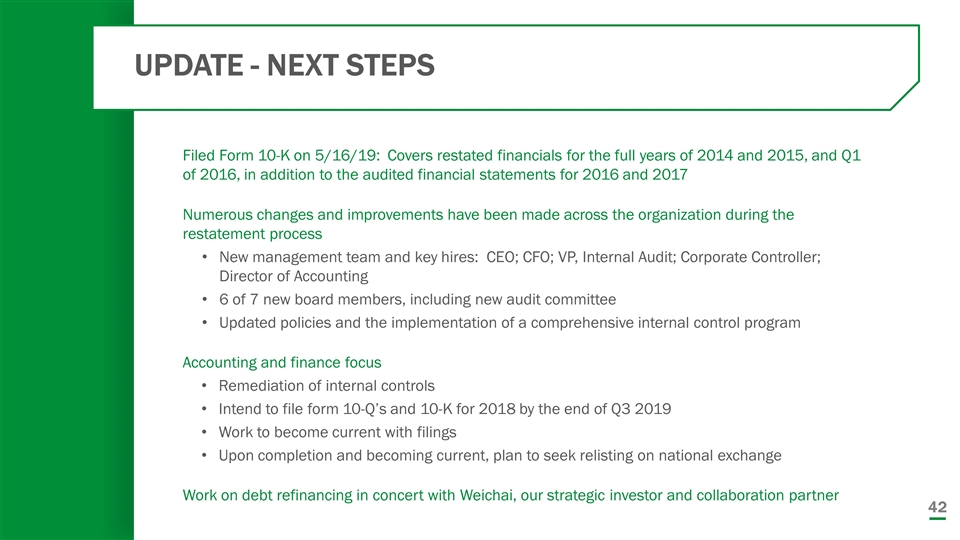
UPDATE - NEXT STEPS Filed Form 10-K on 5/16/19: Covers restated financials for the full years of 2014 and 2015, and Q1 of 2016, in addition to the audited financial statements for 2016 and 2017 Numerous changes and improvements have been made across the organization during the restatement process New management team and key hires: CEO; CFO; VP, Internal Audit; Corporate Controller; Director of Accounting 6 of 7 new board members, including new audit committee Updated policies and the implementation of a comprehensive internal control program Accounting and finance focus Remediation of internal controls Intend to file form 10-Q’s and 10-K for 2018 by the end of Q3 2019 Work to become current with filings Upon completion and becoming current, plan to seek relisting on national exchange Work on debt refinancing in concert with Weichai, our strategic investor and collaboration partner
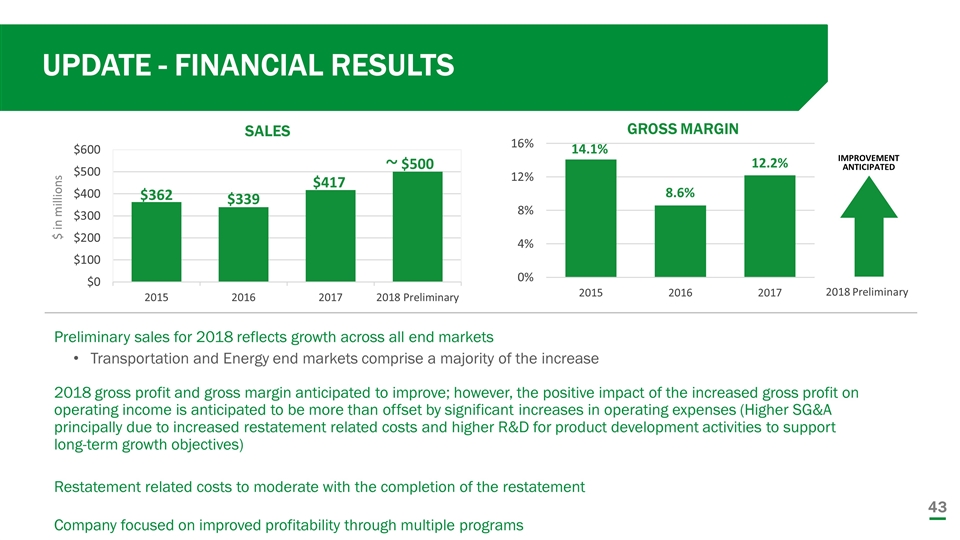
UPDATE - FINANCIAL RESULTS GROSS MARGIN Preliminary sales for 2018 reflects growth across all end markets Transportation and Energy end markets comprise a majority of the increase 2018 gross profit and gross margin anticipated to improve; however, the positive impact of the increased gross profit on operating income is anticipated to be more than offset by significant increases in operating expenses (Higher SG&A principally due to increased restatement related costs and higher R&D for product development activities to support long-term growth objectives) Restatement related costs to moderate with the completion of the restatement Company focused on improved profitability through multiple programs IMPROVEMENT ANTICIPATED 2018 Preliminary SALES ~ $ in millions
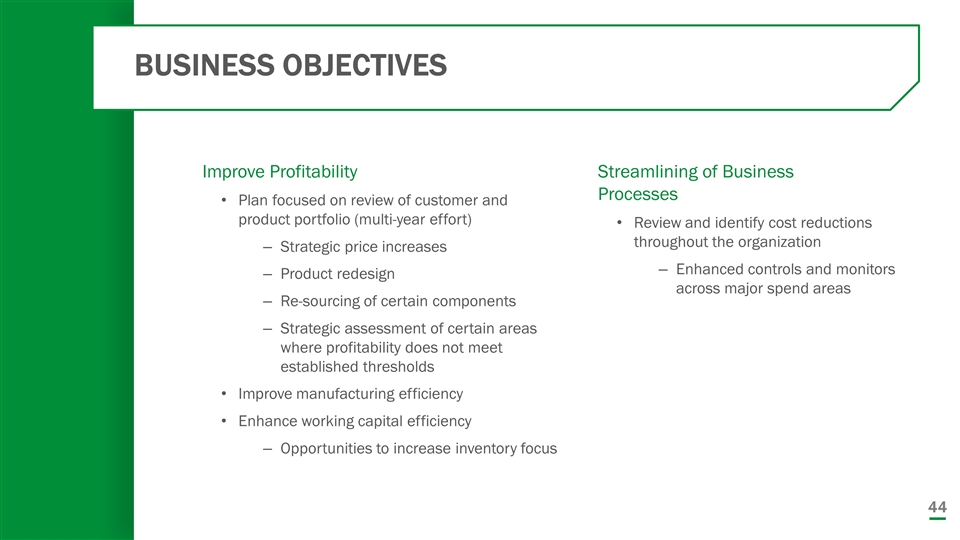
Streamlining of Business Processes Review and identify cost reductions throughout the organization Enhanced controls and monitors across major spend areas Improve Profitability Plan focused on review of customer and product portfolio (multi-year effort) Strategic price increases Product redesign Re-sourcing of certain components Strategic assessment of certain areas where profitability does not meet established thresholds Improve manufacturing efficiency Enhance working capital efficiency Opportunities to increase inventory focus BUSINESS OBJECTIVES
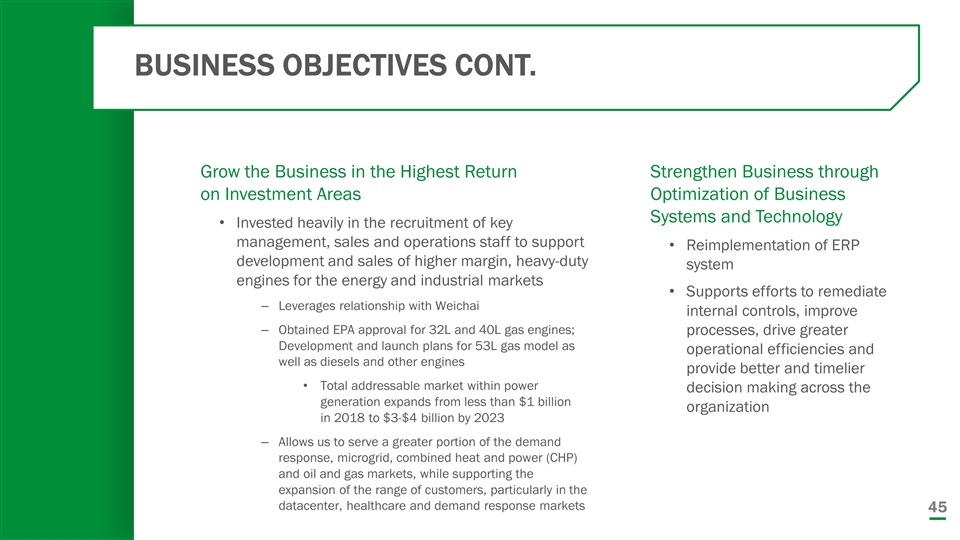
Strengthen Business through Optimization of Business Systems and Technology Reimplementation of ERP system Supports efforts to remediate internal controls, improve processes, drive greater operational efficiencies and provide better and timelier decision making across the organization BUSINESS OBJECTIVES CONT. Grow the Business in the Highest Return on Investment Areas Invested heavily in the recruitment of key management, sales and operations staff to support development and sales of higher margin, heavy-duty engines for the energy and industrial markets Leverages relationship with Weichai Obtained EPA approval for 32L and 40L gas engines; Development and launch plans for 53L gas model as well as diesels and other engines Total addressable market within power generation expands from less than $1 billion in 2018 to $3-$4 billion by 2023 Allows us to serve a greater portion of the demand response, microgrid, combined heat and power (CHP) and oil and gas markets, while supporting the expansion of the range of customers, particularly in the datacenter, healthcare and demand response markets

THANK YOU. 201 Mittel Drive, Wood Dale, IL 60191 630.350.9400 • www.psiengines.com


