                                  UNITED STATES

                       SECURITIES AND EXCHANGE COMMISSION

                             Washington, D.C. 20549

                                   FORM N-CSR

              CERTIFIED SHAREHOLDER REPORT OF REGISTERED MANAGEMENT

                              INVESTMENT COMPANIES

Investment Company Act file number  811-10325

                            VANECK VECTORS ETF TRUST
               (Exact name of registrant as specified in charter)

                      666 Third Avenue, New York, NY 10017
               (Address of principal executive offices) (Zip code)

                         Van Eck Associates Corporation
                      666 Third Avenue, New York, NY 10017
                     (Name and address of agent for service)

Registrant's telephone number, including area code: (212) 293-2000

Date of fiscal year end:  SEPTEMBER 30

Date of reporting period: MARCH 31, 2017
ITEM 1. REPORT TO SHAREHOLDERS
 | SEMI-ANNUAL REPORT March 31, 2017 (unaudited) |
| | |
| VANECK VECTORS® | |
| | |
| Biotech ETF | BBH |
| | |
| Environmental Services ETF | EVX® |
| | |
| Gaming ETF | BJK® |
| | |
| Generic Drugs ETF | GNRX |
| | |
| Pharmaceutical ETF | PPH® |
| | |
| Retail ETF | RTH® |
| | |
| Semiconductor ETF | SMH® |
The information contained in the management discussion represents the opinions of VanEck Vectors ETFs and may differ from other persons. This information is not intended to be a forecast of future events, a guarantee of future results or investment advice. The information contained herein regarding each index has been provided by the relevant index provider. Also, unless otherwise specifically noted, any discussion of the Funds’ holdings and the Funds’ performance, and the views of VanEck Vectors ETFs are as of March 31, 2017, and are subject to change.
VANECK VECTORS ETFs
(unaudited)
Dear Shareholder:
We are pleased to present this semi-annual report for the seven industry exchange-traded funds (ETFs) of the VanEck Vectors® ETF Trust for the six-month period ended March 31, 2017.
The top performing fund in our suite of industry ETFs was the VanEck Vectors Semiconductor ETF (NYSE Arca: SMH) which returned 15.83% for the period under review. Much of its notable performance was attributable to the predominance of U.S. listed companies in its portfolio.
The semiconductor industry ended 2016 on a high: global sales of $338.9 billion for the year; its highest ever.1 Sales in December 2016 of $31.0 billion bettered sales in December 2015 by 12.3%.2 According to John Neuffer, president and CEO of the Semiconductor Industry Association, “market growth was driven by macroeconomic factors, industry trends, and the ever increasing amount of semiconductor technology in devices the world depends on for working, communicating, manufacturing, treating illness, and countless other applications. We expect modest growth to continue in 2017 and beyond.”3
The industry started 2017 on a solid footing. While on a month-on-month basis, sales in February 2017 were a little softer than they were in January, year-to-year growth was the global market’s largest since October 2010.4 Fourth quarter earnings from several of the large chipmakers, reported in the first quarter of 2017, were particularly solid.5
Semiconductors – Worldwide Market Billings: 3-Month Moving Averages ($B)
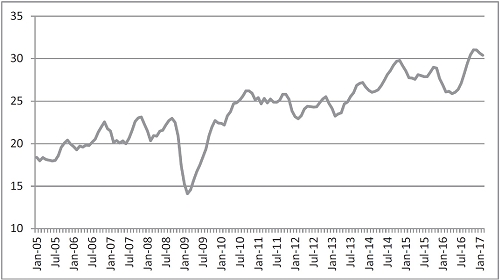
Source: Semiconductor Industry Association. Not intended to be a forecast of future events, a guarantee of future results or investment advice. Current market conditions may not continue. Past performance is no guarantee of future results; current performance may be lower or higher than the performance data quoted.
Large-capitalization stocks continued to be key drivers of SMH’s returns. NVIDIA (5.3% of Fund net assets†), for example, was the best performing company in the Fund with its ”... GPU [Graphics Processing Units] computing platform is enjoying rapid adoption in artificial intelligence, cloud computing, gaming, and autonomous vehicles.”6 The advantage of GPUs is their speed. The company launched the world’s fastest gaming GPU (containing 12 billion transistors), the GeForce GTX 1080 TI, in March this year.7
Only two companies in the Fund’s portfolio, both U.S., detracted from performance, Intel (11.4% of Fund net assets† and with the highest weighting) and Qualcomm (6.1% of Fund net assets†). Late in 2016 Qualcomm made an offer for NXP Semiconductors (4.3% of Fund net assets†). However by the end of the reporting period, acceptance of the offer by NXP shareholders was far from certain. By early April, shortly after the period under review, owners of only just over 16.3% of NXP Semiconductors had tendered their shares and the offer from Qualcomm was extended.8
VANECK VECTORS ETFs
(unaudited)
We will, as always, continue to seek out and evaluate the most attractive opportunities for you as a shareholder. We encourage you to stay in touch with us through the videos, email subscriptions, and blogs available on our website, vaneck.com. And should you have any questions, please contact us at 800.826.2333 or visit vaneck.com.
Thank you for participating in the VanEck Vectors ETF Trust. On the following pages, you will find the performance record of each of the funds for the six months ended March 31, 2017. You will also find their financial statements. We value your continuing confidence in us and look forward to helping you meet your investment goals in future.

Jan F. van Eck
Trustee and President
VanEck Vectors ETF Trust
April 18, 2017
Represents the opinions of the investment adviser. Past performance is no guarantee of future results. Not intended to be a forecast of future events, a guarantee of future results or investment advice. Current market conditions may not continue.
| † | All Fund assets referenced are total net assets as of March 31, 2017. |
| | |
| 1 | Semiconductor Industry Association: Global Semiconductor Sales Reach $339 Billion in 2016, https://www.semiconductors.org/news/2017/02/02/global_sales_report_2015/global_semiconductor_sales_reach_339_billion_in_2016/ |
| | |
| 2 | Ibid. |
| | |
| 3 | Ibid. |
| | |
| 4 | Semiconductor Industry Association: Global Semiconductor Sales Up 16.5 Percent Year-to-Year, https://www.semiconductors.org/news/2017/04/03/global_sales_report_2017/global_semiconductor_sales_up_16.5_percent_year_to_year/ |
| | |
| 5 | Zacks: Semiconductor ETFs Riding High on Q4 Earnings, http://finance.yahoo.com/news/semiconductor-etfs-riding-high-q4-140002875.html |
| | |
| 6 | NVIDIA: NVIDIA Announces Financial Results for Fourth Quarter and Fiscal 2017, http://nvidianews.nvidia.com/news/nvidia-announces-financial-results-for-fourth-quarter-and-fiscal-2017 |
| | |
| 7 | VR-VOICE: NVIDIA Launches World’s Fastest Gaming GPU (4K VR Ready), https://vrvoice.co/nvidia-launches-worlds-fastest-gaming-gpu-4k-vr-ready/ |
| | |
| 8 | NASDAQ: Qualcomm Extends Tender Offer For NXP Semiconductors Until May 2, http://www.nasdaq.com/article/qualcomm-extends-tender-offer-for-nxp-semiconductors-until-may-2-20170404-00349 |
Management Discussion (unaudited)
Five of the seven VanEck Vectors Industry ETFs realized positive performance in the six months ended March 31, 2017. VanEck Vectors Semiconductor ETF (NYSE Arca: SMH) posted an impressive total return of 15.83%, with VanEck Vectors Environmental Services ETF NYSE Arca: EVX) not far behind, providing a total return of 12.37%. Both funds easily outperformed the S&P 500® Index’s‡ 10.12% gain over the same period.
October 1, 2016 through March 31, 2017
VanEck Vectors Industry ETFs Total Return
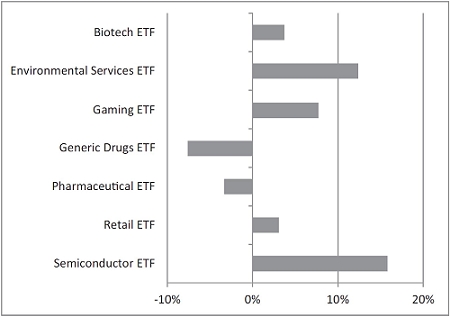
Source: VanEck. Returns based on NAV. The performance data quoted represent past performance. Past performance is not a guarantee of future results. Performance information for the Funds reflects temporary waivers of expenses and/or fees. Had the Funds incurred all expenses, investment returns would have been reduced. Investment return and value of the shares of the Funds will fluctuate so that an investor’s shares, when sold, may be worth more or less than their original cost. Current performance may be lower or higher than performance data quoted.
Biotech – possible pricing pressures
After some significant movements both before and following the U.S. presidential election at the beginning of November, biotech companies ended 2016 down slightly from the start of the fourth quarter. Thereafter, they rose during most of the first quarter of 2017, to end the six-month period up 3.71%. As with the pharmaceutical and generic drugs industries, the biotech industry was not helped by President Trump’s use of his Twitter account to protest against the price of drugs. Positive contributions to the Fund’s performance came mainly from three companies: Celgene (11.4% of Fund net assets†), Incyte (4.5% of Fund net assets†), and Vertex Pharmaceuticals (5.4% of Fund net assets†). The company that detracted most from performance was Gilead Sciences (10.4% of Fund net assets†).
Environmental Services – still in demand
Historically, growth in the construction and home-building industries has benefitted environmental services companies. Due in part to significant upticks in both construction1 and home-building2 in the U.S. in the first quarter of 2017, the Fund returned notable performance, gaining 12.37% over the six-month period under review. While U.S. stocks accounted for the vast majority of the Fund’s healthy positive total return, the single Canadian stock in the Fund (Waste Connections, 10.0% of Fund net assets†) was the second best performing company over the period. The best performing company with the top individual weighting in the Fund was U.S. company Republic Services (9.9% of Fund net assets†). Only three companies detracted from performance over the period under review, CECO Environmental (2.0% of Fund net assets†), Advanced Disposal Services (3.8% of Fund net assets†), and STERIS (3.8% of Fund net assets†).
VANECK VECTORS ETFs
(unaudited)
Gaming – Macau recovering
The Fund posted a rise of 7.71% for the six-month period. The fourth quarter of 2016 was particularly tumultuous, with the Fund dropping fast and far in December and ending 2016 well below the level at which it started the quarter. However, during the first quarter of 2017, gaming stocks followed an upward trajectory and ended the six-month period significantly higher than they started the year. In Macau, China, the world’s biggest gaming hub, there was a notable improvement in the gaming industry’s fortunes. In each month of the period under review, the gross revenue from “Games of Fortune” (as the Macau authorities3 describe them) was higher than that recorded in the same month in the prior year. In March 2017, it was 18.1% higher than in March 2016.4 This marked the eighth consecutive month of year-on-year improvement. In Nevada, following a couple of lackluster months in the fourth quarter of 2016, January was a particularly encouraging month for the gaming industry. At nearly $1.04 billion, the state’s “win revenue” for the month was the highest recorded since February 2013.5 However, the figure of $945.6 million for February was less encouraging.6 Perhaps because of this, gaming companies operating in Macau were the most significant contributors to the Fund’s overall performance, with those in the U.S. providing the next largest returns from any territory. The other major contributors were companies in Malaysia and Australia. Gaming businesses in Ireland, New Zealand, and Sweden were the main detractors from the Fund’s overall positive performance.
Generic Drugs – troubled times
The Fund had a challenging and disappointing six months ending the period down 7.62%. The industry continued to be overshadowed by a wide-ranging criminal investigation by the U.S. Department of Justice into the pricing of generic drugs.7 The market environment also remained challenging with memories still raw from the controversies surrounding both Valeant Pharmaceuticals and Turing Pharmaceuticals (neither owned by the Fund during the period). On March 13, 2017, William Ackman’s firm, Pershing Square Capital Management, sold its stake in Valeant for a loss of $4 billion.8 The pharmaceuticals sector detracted the most from the Fund’s performance, while positive performance was only provided by the chemicals sector and the global specialty chemicals company Albemarle (3.8% of Fund net assets†) within it. In terms of individual companies, Teva Pharmaceutical Industries (7.7% of Fund net assets†) was the single largest detractor from performance. The company was affected by a number of different factors, including an uninspiring earnings report and outlook in November 2016 and concerns about both generic competition for the company’s multiple sclerosis drug Copaxone and integration issues following its acquisition of Actavis.9
Pharmaceutical – possible pricing pressures
Pharmaceutical stocks followed much the same trajectory as biotechnology stocks during the six-month period. However, unlike biotech stocks, they were not able to recoup the losses they suffered between the end of September and early November, with the Fund ending the period under review down 3.33%. As with the biotech and generic drug industries, pharmaceuticals were not helped by President Trump’s use of his Twitter account to protest against the price of drugs. While companies in France and Switzerland were positive contributors to the Fund’s overall performance, their contributions were too small to offset the negative performance of companies in all other countries, in particular, those in the U.S and Israel, the countries that detracted most from the performance of the Fund.
Retail – stressed by Amazon and online
The Fund returned 3.07% for the six-month period under review. Retail sales (excluding automobiles, gasoline stations, and restaurants) in the U.S. over the last three months of 2016 proved to be solid. In November and December, they increased 4% over 2015 to reach $658.3 billion.10 This included some $122.9 billion of non-store sales, up 12.6% over 2015.11 Retail sales (excluding automobiles, gasoline stations, and restaurants) continued to hold up well over the first two months of 2017. January sales recorded a 0.4% rise and, in February, grew another 0.2%.12 There were, however, several high profile retail store bankruptcies in the first three months of 2017 including The Limited, American Apparel, and Wet Seal. While stores involved in internet and catalog retailing, together with specialty retailers, contributed by far the most to the positive performance of the Fund, food and staples retailing companies also made useful contributions to performance. Most multi-line retailers, for example, Target (4.6% of Fund net assets†) and Macy’s (1.5% of Fund net assets†), were detractors from performance.
Semiconductor – solid sales and earnings
The Fund was the best performing ETF in the suite, returning 15.83% for the six-month period under review. With global semiconductor sales in 2016 of $338.9 billion, the industry recorded its highest ever annual sales.13 Sales in December of $31.0 billion bettered sales in December 2015 by 12.3%.14 According to John Neuffer, president and CEO of the Semiconductor Industry Association, “[m]arket growth was driven by macroeconomic factors, industry trends, and the ever-increasing amount of semiconductor technology in devices the world depends on for working, communicating, manufacturing, treating illness, and countless other applications. We expect modest growth to continue in 2017 and beyond.”15 While, on a month-on-month basis, sales in February 2017 were a little softer than they were in January, year-to-year growth was the global market’s largest since October 2010.16 The industry demonstrated strong sales in the first two months of 2017 with memory products such as NAND flash and DRAM “leading the way.”17 Fourth quarter earnings from several of the large chipmakers were particularly solid.18 Companies in the U.S. contributed by far the most to the Fund’s positive performance. NVIDIA (5.3% of Fund net assets†) and Micron Technology (5.0% of Fund net assets†), both in the U.S., were the two best performing companies. Despite, or, perhaps because of, its offer to buy NXP Semiconductors (4.3% of Fund net assets†), Qualcomm (6.1% of Fund net assets†) was the company to detract most from the Fund’s performance. In early April, shortly after the period under review, owners of only just over 16.3% of NXP Semiconductors had tendered their shares and the offer from Qualcomm was extended.19
| † | All Fund assets referenced are Total Net Assets as of March 31, 2017. |
| | |
| ‡ | S&P 500® Index consists of 500 widely held common stocks covering the industrial, utility, financial, and transportation sectors |
| 1 | Board of Governors of the Federal Reserve System: Industrial Production and Capacity Utilization - G.17, http://www.federalreserve.gov/releases/g17/Current/ |
| | |
| 2 | U.S. Census Bureau News: New Residential Construction in March 2017, https://www.census.gov/construction/nrc/pdf/newresconst.pdf |
| | |
| 3 | Gaming Inspection and Coordination Bureau, Macao SAR: Monthly Gross Revenue from Games of Fortune, http://www.dicj.gov.mo/web/en/information/DadosEstat_mensal/2017/index.html |
| | |
| 4 | Ibid. |
| | |
| 5 | Las Vegas Sun: Nevada gaming revenue up 12 percent in January, eclipses $1 billion, https://lasvegassun.com/news/2017/feb/28/nevada-gaming-revenue-up-12-percent-in-january-ecl/ |
| | |
| 6 | Nevada Gaming Control Board: Win Revenue Summary - February 2017, http://gaming.nv.gov/modules/showdocument.aspx?documentid=11930 |
| | |
| 7 | Bloomberg: Perrigo Joins Firms With Generic Drugs Under U.S. Glare, https://www.bloomberg.com/news/articles/2017-03-03/perrigo-joins-list-of-firms-with-generic-drugs-under-u-s-glare |
| | |
| 8 | The New York Times: William Ackman Sells Pershing Fund’s Stake in Valeant, https://www.nytimes.com/2017/03/13/business/dealbook/william-ackman-valeant-pershing-square.html?_r=0 |
| | |
| 9 | The Motley Fool: The Sole Reason Teva Pharmaceutical Industries Ltd. Sank 12% in November, https://www.fool.com/investing/2016/12/02/the-sole-reason-teva-pharmaceutical-industries-ltd.aspx |
| | |
| 10 | National Retail Federation: Holiday retail sales increased 4 percent in 2016, https://nrf.com/news/holiday-retail-sales-increased-4-percent-2016 |
| | |
| 11 | Ibid. |
| | |
| 12 | National Retail Federation: Economy, https://nrf.com/news/retail-sales |
| | |
| 13 | Semiconductor Industry Association: Global Semiconductor Sales Reach $339 Billion in 2016, https://www.semiconductors.org/news/2017/02/02/global_sales_report_2015/global_semiconductor_sales_reach_339_billion_in_2016/ |
| | |
| 14 | Ibid. |
| | |
| 15 | Ibid. |
| | |
| 16 | Semiconductor Industry Association: Global Semiconductor Sales Up 16.5 Percent Year-to-Year, https://www.semiconductors.org/news/2017/04/03/global_sales_report_2017/global_semiconductor_sales_up_16.5_percent_year_to_year/ |
| | |
| 17 | Ibid. |
| | |
| 18 | Zacks: Semiconductor ETFs Riding High on Q4 Earnings, http://finance.yahoo.com/news/semiconductor-etfs-riding-high-q4-140002875.html |
| | |
| 19 | NASDAQ: Qualcomm Extends Tender Offer For NXP Semiconductors Until May 2, http://www.nasdaq.com/article/qualcomm-extends-tender-offer-for-nxp-semiconductors-until-may-2-20170404-00349 |
PERFORMANCE COMPARISON
March 31, 2017 (unaudited)
VANECK VECTORS BIOTECH ETF
| | | Average Annual Total Returns | | Cumulative Total Returns | |
| | | Share Price | | NAV | | MVBBHTR1 | | | Share Price | | NAV | | MVBBHTR1 | |
| Six Months | | | 3.64 | % | | | 3.71 | % | | | 3.73 | % | | | | 3.64 | % | | | 3.71 | % | | | 3.73 | % | |
| One Year | | | 15.17 | % | | | 15.21 | % | | | 15.29 | % | | | | 15.17 | % | | | 15.21 | % | | | 15.29 | % | |
| Five Year | | | 21.97 | % | | | 22.05 | % | | | 22.23 | % | | | | 169.98 | % | | | 170.86 | % | | | 172.79 | % | |
| Life* | | | 26.14 | % | | | 26.15 | % | | | 26.35 | % | | | | 240.82 | % | | | 240.88 | % | | | 243.75 | % | |
| * | Commencement of Fund: 12/20/11; First Day of Secondary Market Trading: 12/21/11. |
| 1 | MVISTM US Listed Biotech 25 Index (MVBBHTR) is a rules-based, modified capitalization weighted, float adjusted index intended to give investors a means of tracking the overall performance of the largest and the most liquid common stocks and depositary receipts of U.S. exchange-listed companies that derive at least 50% of their revenues from biotechnology, which includes companies engaged primarily in research and development as well as production, marketing and sales of drugs based on genetic analysis and diagnostic equipment (excluding pharmacies). |
VANECK VECTORS ENVIRONMENTAL SERVICES ETF
| | | Average Annual Total Returns | | Cumulative Total Returns | |
| | | Share Price | NAV | | AXENV1 | | | Share Price | | NAV | | AXENV1 | |
| Six Months | | | 12.06 | % | | | 12.37 | % | | | 12.67 | % | | | | 12.06 | % | | | 12.37 | % | | | 12.67 | % | |
| One Year | | | 21.02 | % | | | 21.34 | % | | | 21.97 | % | | | | 21.02 | % | | | 21.34 | % | | | 21.97 | % | |
| Five Year | | | 9.35 | % | | | 9.33 | % | | | 9.88 | % | | | | 56.34 | % | | | 56.20 | % | | | 60.15 | % | |
| Ten Year* | | | 6.67 | % | | | 6.68 | % | | | 7.23 | % | | | | 90.66 | % | | | 90.96 | % | | | 100.94 | % | |
| * | Commencement of Fund: 10/10/06; First Day of Secondary Market Trading: 10/16/06. |
| 1 | NYSE Arca Environmental Services Index (AXENV) is a modified equal dollar-weighted index comprised of publicly traded companies that engage in business activities that may benefit from the global increase in demand for consumer waste disposal, removal and storage of industrial by-products, and the management of associated resources. |
VANECK VECTORS GAMING ETF
| | | Average Annual Total Returns | | Cumulative Total Returns | |
| | | Share Price | | NAV | | MVBJKTR1 | | | Share Price | | NAV | | MVBJKTR1 | |
| Six Months | | | 7.10 | % | | | 7.71 | % | | | 8.15 | % | | | | 7.10 | % | | | 7.71 | % | | | 8.15 | % | |
| One Year | | | 14.28 | % | | | 14.56 | % | | | 14.90 | % | | | | 14.28 | % | | | 14.56 | % | | | 14.90 | % | |
| Five Year | | | 4.47 | % | | | 4.38 | % | | | 4.78 | % | | | | 24.43 | % | | | 23.88 | % | | | 26.32 | % | |
| Life* | | | 2.28 | % | | | 2.28 | % | | | 3.01 | % | | | | 22.99 | % | | | 22.97 | % | | | 31.28 | % | |
| * | Commencement of Fund: 1/22/08; First Day of Secondary Market Trading: 1/24/08. |
| Index data prior to September 24, 2012 reflects that of the S-Network Global Gaming Index (WAGRT). From September 24, 2012, forward, the index data reflects that of the Fund’s underlying index, VanEck Vectors Global Gaming Index (MVBJKTR). Index history which includes periods prior to September 24, 2012 reflects a blend of the performance of WAGRT and MVBJKTR and is not intended for third party use. |
| 1 | MVISTM Global Gaming Index (MVBJKTR) is a rules-based index intended to give investors a means of tracking the overall performance of the largest and most liquid companies in the global gaming industry that generate at least 50% of their revenues from casinos and hotels, sports betting (including internet gambling and racetracks) and lottery services as well as gaming services, gaming technology and gaming equipment. |
Past performance is no guarantee of future results. Performance results do not reflect the deduction of taxes that a shareholder would pay on fund distributions or on the redemption or sale of fund shares.
See “About Fund Performance” on page 9 for more information.
VANECK VECTORS GENERIC DRUGS ETF
| | | Average Annual Total Returns | | Cumulative Total Returns | |
| | | Share Price | | NAV | | IGNRXT1 | | | Share Price | | NAV | | IGNRXT1 | |
| Six Months | | | (7.35 | )% | | | (7.62 | )% | | | (6.81 | )% | | | | (7.35 | )% | | | (7.62 | )% | | | (6.81 | )% | |
| One Year | | | (5.81 | )% | | | (6.12 | )% | | | (5.28 | )% | | | | (5.81 | )% | | | (6.12 | )% | | | (5.28 | )% | |
| Life* | | | (8.42 | )% | | | (8.92 | )% | | | (8.00 | )% | | | | (10.14 | )% | | | (10.74 | )% | | | (9.64 | )% | |
| * | Commencement of Fund: 1/12/16; First Day of Secondary Market Trading: 1/13/16. |
| 1 | Indxx Global Generics & New Pharma Index (IGNRXT) a rules-based, modified capitalization weighted index. The Index includes exchange-listed companies, on a global basis, that derive a significant proportion (as determined by Indxx, LLC) of their revenues (or that have the potential to derive a significant proportion of their revenues) from the generic drug industry, or that have a primary business focus on the generic drug industry. |
VANECK VECTORS PHARMACEUTICAL ETF
| | | Average Annual Total Returns | | Cumulative Total Returns | |
| | | Share Price | | NAV | | MVPPHTR1 | | | Share Price | | NAV | | MVPPHTR1 | |
| Six Months | | | (3.42 | )% | | | (3.33 | )% | | | (3.32 | )% | | | | (3.42 | )% | | | (3.33 | )% | | | (3.32 | )% | |
| One Year | | | (1.99 | )% | | | (1.94 | )% | | | (1.83 | )% | | | | (1.99 | )% | | | (1.94 | )% | | | (1.83 | )% | |
| Five Year | | | 9.95 | % | | | 9.94 | % | | | 9.90 | % | | | | 60.66 | % | | | 60.62 | % | | | 60.29 | % | |
| Life* | | | 11.00 | % | | | 10.81 | % | | | 10.77 | % | | | | 73.51 | % | | | 71.92 | % | | | 71.57 | % | |
| * | Commencement of Fund: 12/20/11; First Day of Secondary Market Trading: 12/21/11. |
| 1 | MVISTM US Listed Pharmaceutical 25 Index (MVPPHTR) is a rules-based, modified capitalization weighted, float adjusted index intended to give investors a means of tracking the overall performance of the largest and the most liquid common stocks and depositary receipts of U.S. exchange-listed companies that derive at least 50% of their revenues from pharmaceuticals, which includes companies engaged primarily in research and development as well as production, marketing and sales of pharmaceuticals. |
VANECK VECTORS RETAIL ETF
| | | Average Annual Total Returns | | Cumulative Total Returns | |
| | | Share Price | | NAV | | MVRTHTR1 | | | Share Price | | NAV | | MVRTHTR1 | |
| Six Months | | | 3.17 | % | | | 3.07 | % | | | 2.98 | % | | | | 3.17 | % | | | 3.07 | % | | | 2.98 | % | |
| One Year | | | 4.27 | % | | | 4.24 | % | | | 4.09 | % | | | | 4.27 | % | | | 4.24 | % | | | 4.09 | % | |
| Five Year | | | 15.21 | % | | | 15.19 | % | | | 15.00 | % | | | | 102.95 | % | | | 102.78 | % | | | 101.12 | % | |
| Life* | | | 17.13 | % | | | 16.88 | % | | | 16.69 | % | | | | 130.39 | % | | | 127.83 | % | | | 125.91 | % | |
| * | Commencement of Fund: 12/20/11; First Day of Secondary Market Trading: 12/21/11. |
| 1 | MVISTM US Listed Retail 25 Index (MVRTHTR) is a rules-based, modified capitalization weighted, float adjusted index intended to give investors a means of tracking the overall performance of the largest and the most liquid common stocks and depositary receipts of U.S. exchange-listed companies that derive at least 50% of their revenues from retail, which includes companies engaged primarily in retail distribution; wholesalers; online, direct mail and TV retailers; multi-line retailers; specialty retailers, such as apparel, automotive, computer and electronics, drug, home improvement and home furnishing retailers; and food and other staples retailers. |
Past performance is no guarantee of future results. Performance results do not reflect the deduction of taxes that a shareholder would pay on fund distributions or on the redemption or sale of fund shares.
See “About Fund Performance” on page 9 for more information.
PERFORMANCE COMPARISON
March 31, 2017 (unaudited) (continued)
VANECK VECTORS SEMICONDUCTOR ETF
| | | Average Annual Total Returns | | Cumulative Total Returns | |
| | | Share Price | | NAV | | MVSMHTR1 | | | Share Price | | NAV | | MVSMHTR1 | |
| Six Months | | | 15.64 | % | | | 15.83 | % | | | 15.83 | % | | | | 15.64 | % | | | 15.83 | % | | | 15.83 | % | |
| One Year | | | 45.86 | % | | | 45.91 | % | | | 46.03 | % | | | | 45.86 | % | | | 45.91 | % | | | 46.03 | % | |
| Five Year | | | 19.18 | % | | | 19.17 | % | | | 19.09 | % | | | | 140.48 | % | | | 140.36 | % | | | 139.50 | % | |
| Life* | | | 22.08 | % | | | 22.14 | % | | | 22.05 | % | | | | 186.69 | % | | | 187.47 | % | | | 186.38 | % | |
| * | Commencement of Fund: 12/20/11; First Day of Secondary Market Trading: 12/21/11. |
| 1 | MVISTM US Listed Semiconductor 25 Index (MVSMHTR) is a rules-based, modified capitalization weighted, float adjusted index intended to give investors a means of tracking the overall performance of the largest and the most liquid common stocks and depositary receipts of U.S. exchange-listed companies that derive at least 50% of their revenues from semiconductors, which includes the production of semiconductors and semiconductor equipment. |
Past performance is no guarantee of future results. Performance results do not reflect the deduction of taxes that a shareholder would pay on fund distributions or on the redemption or sale of fund shares.
See “About Fund Performance” on page 9 for more information.
VANECK VECTORS ETF TRUST
ABOUT FUND PERFORMANCE
(unaudited)
The price used to calculate market return (Share Price) is determined by using the closing price listed on its primary listing exchange. Since the shares of each Fund did not trade in the secondary market until after each Fund’s commencement, for the period from commencement to the first day of secondary market trading in shares of each Fund, the NAV of each Fund is used as a proxy for the secondary market trading price to calculate market returns.
The performance data quoted represents past performance. Past performance is not a guarantee of future results. Performance information for each Fund reflects temporary waivers of expenses and/or fees. Had each Fund incurred all expenses, investment returns would have been reduced. These returns do not reflect the deduction of taxes that a shareholder would pay on Fund dividends and distributions or the sale of Fund shares.
Investment return and value of the shares of each Fund will fluctuate so that an investor’s shares, when sold, may be worth more or less than their original cost. Performance may be lower or higher than performance data quoted. Fund returns reflect reinvestment of dividends and capital gains distributions. Performance current to the most recent month-end is available by calling 800.826.2333 or by visiting vaneck.com.
Fund shares are not individually redeemable and will be issued and redeemed at their NAV only through certain authorized broker-dealers in large, specified blocks of shares called “creation units” and otherwise can be bought and sold only through exchange trading. Shares may trade at a premium or discount to their NAV in the secondary market.
The “Net Asset Value” (NAV) of a VanEck Vectors exchange-traded fund (ETF) is determined at the close of each business day, and represents the dollar value of one share of the fund; it is calculated by taking the total assets of the fund, subtracting total liabilities, and dividing by the total number of shares outstanding. The NAV is not necessarily the same as the ETF’s intraday trading value. VanEck Vectors ETF investors should not expect to buy or sell fund shares at NAV.
Index returns assume the reinvestment of all income and do not reflect any management fees or brokerage expenses associated with Fund returns. Investors cannot invest directly in the Index. Returns for actual Fund investors may differ from what is shown because of differences in timing, the amount invested and fees and expenses.
The Biotech Index, Gaming Index, Pharmaceutical Index, Retail Index, and Semiconductor Index are published by MV Index Solutions GmbH (MVIS), which is a wholly owned subsidiary of the Adviser, Van Eck Associates Corporation. The Environmental Services Index is published by NYSE Arca, Inc. The Generic Drugs Index is published by Indxx.
MVIS, Indxx, and NYSE are referred to herein as the “Index Providers.” The Index Providers do not sponsor, endorse, or promote the Funds and bear no liability with respect to the Funds or any security.
Premium/discount information regarding how often the closing trading price of the Shares of each Fund were above (i.e., at a premium) or below (i.e., at a discount) the NAV of the Fund for each of the four previous calendar quarters and the immediately preceding five years (if applicable) can be found at www.vaneck.com.
VANECK VECTORS ETF TRUST
EXPLANATION OF EXPENSES
(unaudited)
Hypothetical $1,000 investment at beginning of period
As a shareholder of a Fund, you incur operating expenses, including management fees and other Fund expenses. This disclosure is intended to help you understand the ongoing costs (in dollars) of investing in your Fund and to compare these costs with the ongoing costs of investing in other mutual funds.
The disclosure is based on an investment of $1,000 invested at the beginning of the period and held for the entire period, October 1, 2016 to March 31, 2017.
Actual Expenses
The first line in the table below provides information about account values and actual expenses. You may use the information in this line, together with the amount you invested, to estimate the expenses that you paid over the period. Simply divide your account value by $1,000 (for example, an $8,600 account value divided by $1,000 = 8.6), then multiply the result by the number in the first line under the heading entitled “Expenses Paid During the Period.”
Hypothetical Example for Comparison Purposes
The second line in the table below provides information about hypothetical account values and hypothetical expenses based on your Fund’s actual expense ratio and an assumed rate of return of 5% per year before expenses, which is not the Fund’s actual return. The hypothetical account values and expenses may not be used to estimate the actual ending account balance or expenses you paid for the period. You may use this information to compare the ongoing costs of investing in your Fund and other funds. To do so, compare this 5% hypothetical example with the 5% hypothetical examples that appear in the shareholder reports of other funds.
Please note that the expenses shown in the table are meant to highlight your ongoing costs only and do not reflect any transactional costs, such as program fees. Therefore, the second line of the table is useful in comparing ongoing costs only, and will not help you determine the relative costs of owning different funds. In addition, if these transactional costs were included, your costs would have been higher.
| | | Beginning
Account
Value
October 1, 2016 | | Ending
Account
Value
March 31, 2017 | | Annualized
Expense
Ratio
During Period | | Expenses Paid
During the Period*
October 1, 2016-
March 31, 2017 |
| Biotech ETF | | | | | | | | | | | | | | | | |
| Actual | | $ | 1,000.00 | | | $ | 1,037.10 | | | | 0.35 | % | | $ | 1.78 | |
| Hypothetical** | | $ | 1,000.00 | | | $ | 1,023.19 | | | | 0.35 | % | | $ | 1.77 | |
| Environmental Services ETF | | | | | | | | | | | | | | | | |
| Actual | | $ | 1,000.00 | | | $ | 1,123.70 | | | | 0.55 | % | | $ | 2.91 | |
| Hypothetical** | | $ | 1,000.00 | | | $ | 1,022.19 | | | | 0.55 | % | | $ | 2.77 | |
| Gaming ETF | | | | | | | | | | | | | | | | |
| Actual | | $ | 1,000.00 | | | $ | 1,077.10 | | | | 0.66 | % | | $ | 3.42 | |
| Hypothetical** | | $ | 1,000.00 | | | $ | 1,021.64 | | | | 0.66 | % | | $ | 3.33 | |
| Generic Drugs ETF | | | | | | | | | | | | | | | | |
| Actual | | $ | 1,000.00 | | | | $923.80 | | | | 0.58 | % | | $ | 2.78 | |
| Hypothetical** | | $ | 1,000.00 | | | $ | 1,022.04 | | | | 0.58 | % | | $ | 2.92 | |
| Pharmaceutical ETF | | | | | | | | | | | | | | | | |
| Actual | | $ | 1,000.00 | | | | $966.70 | | | | 0.35 | % | | $ | 1.72 | |
| Hypothetical** | | $ | 1,000.00 | | | $ | 1,023.19 | | | | 0.35 | % | | $ | 1.77 | |
| Retail ETF | | | | | | | | | | | | | | | | |
| Actual | | $ | 1,000.00 | | | $ | 1,030.70 | | | | 0.35 | % | | $ | 1.77 | |
| Hypothetical** | | $ | 1,000.00 | | | $ | 1,023.19 | | | | 0.35 | % | | $ | 1.77 | |
| Semiconductor ETF | | | | | | | | | | | | | | | | |
| Actual | | $ | 1,000.00 | | | $ | 1,158.30 | | | | 0.35 | % | | $ | 1.88 | |
| Hypothetical** | | $ | 1,000.00 | | | $ | 1,023.19 | | | | 0.35 | % | | $ | 1.77 | |
| * | Expenses are equal to the Fund’s annualized expense ratio (for the six months ended March 31, 2017) multiplied by the average account value over the period, multiplied by the number of days in the most recent fiscal half year divided by the number of days in the fiscal year (to reflect the one-half year period). |
| ** | Assumes annual return of 5% before expenses |
VANECK VECTORS BIOTECH ETF
SCHEDULE OF INVESTMENTS
March 31, 2017 (unaudited)
| Number | | | | | | |
| of Shares | | | | | Value | |
| |
| COMMON STOCKS: 100.0% | | | | |
| Ireland: 1.7% | | | | |
| | 192,403 | | | Alkermes Plc (USD) * | | $ | 11,255,576 | |
| Netherlands: 2.3% | | | | |
| | 539,805 | | | QIAGEN NV (USD) | | | 15,638,151 | |
| Spain: 2.0% | | | | |
| | 711,514 | | | Grifols SA (ADR) | | | 13,429,827 | |
| United States: 94.0% | | | | |
| | 213,572 | | | ACADIA Pharmaceuticals, Inc. † | | | 7,342,605 | |
| | 243,718 | | | Alexion Pharmaceuticals, Inc. | | | 29,548,370 | |
| | 243,845 | | | Allergan Plc | | | 58,259,447 | |
| | 102,777 | | | Alnylam Pharmaceuticals, Inc. * † | | | 5,267,321 | |
| | 515,359 | | | Amgen, Inc. | | | 84,554,951 | |
| | 157,085 | | | Biogen Idec, Inc. * | | | 42,950,181 | |
| | 332,783 | | | BioMarin Pharmaceutical, Inc. * | | | 29,211,692 | |
| | 54,227 | | | Bluebird Bio, Inc. * † | | | 4,929,234 | |
| | 623,205 | | | Celgene Corp. * | | | 77,545,398 | |
| | 130,506 | | | Charles River Laboratories International, Inc. * | | | 11,739,015 | |
| | 1,035,017 | | | Gilead Sciences, Inc. | | | 70,298,355 | |
| | 188,882 | | | Illumina, Inc. * | | | 32,230,824 | |
| | 228,324 | | | Incyte Corp. * | | | 30,520,069 | |
| | 25,550 | | | Intercept Pharmaceuticals, Inc. * † | | | 2,889,705 | |
| | 225,907 | | | Ionis Pharmaceuticals, Inc. * † | | | 9,081,461 | |
| | 176,376 | | | Neurocrine Biosciences, Inc. * | | | 7,637,081 | |
| | 392,420 | | | Quintiles Transnational Holdings, Inc. * | | | 31,601,583 | |
| | 81,423 | | | Regeneron Pharmaceuticals, Inc. * | | | 31,552,227 | |
| | 151,345 | | | Seattle Genetics, Inc. * † | | | 9,513,547 | |
| | 80,096 | | | TESARO, Inc. * † | | | 12,324,372 | |
| | 92,525 | | | United Therapeutics Corp. * | | | 12,526,034 | |
| | 336,864 | | | Vertex Pharmaceuticals, Inc. * | | | 36,836,078 | |
| | | | | | | | 638,359,550 | |
Total Common Stocks
(Cost: $735,717,637) | | | 678,683,104 | |
| MONEY MARKET FUND: 0.0% | | | | |
| (Cost: $449,385) | | | | |
| | 449,385 | | | Dreyfus Government Cash Management Fund | | | 449,385 | |
Total Investments Before Collateral for Securities Loaned: 100.0%
(Cost: $736,167,022) | | 679,132,489 | |
| Principal | | | | | | |
| Amount | | | | | Value | |
| | | | | | | | | |
| SHORT-TERM INVESTMENTS HELD AS COLLATERAL FOR SECURITIES LOANED: 5.0% | | | | |
| Repurchase Agreements: 5.0% | | | | |
| $ | 8,053,286 | | | Repurchase agreement dated 3/31/17 with Citigroup Global Markets, Inc., 0.81%, due 4/3/17, proceeds $8,053,830; (collateralized by various U.S. government and agency obligations, 0.00% to 11.50%, due 4/1/17 to 6/1/52, valued at $8,214,352 including accrued interest) | | $ | 8,053,286 | |
| | 8,053,286 | | | Repurchase agreement dated 3/31/17 with Daiwa Capital Markets America, Inc., 0.82%, due 4/3/17, proceeds $8,053,836; (collateralized by various U.S. government and agency obligations, 0.00% to 6.50%, due 5/11/17 to 12/1/51, valued at $8,214,352 including accrued interest) | | | 8,053,286 | |
| | 1,694,672 | | | Repurchase agreement dated 3/31/17 with HSBC Securities USA, Inc., 0.77%, due 4/3/17, proceeds $1,694,781; (collateralized by various U.S. government and agency obligations, 0.00% to 2.13%, due 5/15/25 to 11/15/45, valued at $1,728,566 including accrued interest) | | | 1,694,672 | |
| | 8,053,286 | | | Repurchase agreement dated 3/31/17 with Merrill Lynch, Pierce, Fenner & Smith, Inc., 0.83%, due 4/3/17, proceeds $8,053,843; (collateralized by various U.S. government and agency obligations, 1.84% to 7.00%, due 5/1/17 to 12/1/46, valued at $8,214,352 including accrued interest) | | | 8,053,286 | |
| | 8,053,286 | | | Repurchase agreement dated 3/31/17 with Nomura Securities International, Inc., 0.81%, due 4/3/17, proceeds $8,053,830; (collateralized by various U.S. government and agency obligations, 0.00% to 7.50%, due 4/19/17 to 2/20/67, valued at $8,214,352 including accrued interest) | | | 8,053,286 | |
Total Short-Term Investments Held as Collateral for Securities Loaned
(Cost: $33,907,816) | | | 33,907,816 | |
| Total Investments: 105.0% | | | | |
| (Cost: $770,074,838) | | | 713,040,305 | |
| Liabilities in excess of other assets: (5.0)% | | | (34,190,856 | ) |
| NET ASSETS: 100.0% | | $ | 678,849,449 | |
See Notes to Financial Statements
VANECK VECTORS BIOTECH ETF
SCHEDULE OF INVESTMENTS
March 31, 2017 (unaudited) (continued)
| ADR | American Depositary Receipt |
| USD | United States Dollar |
| * | Non-income producing |
| † | Security fully or partially on loan. Total market value of securities on loan is $33,186,847. |
Summary of Investments by Sector Excluding
Collateral for Securities Loaned (unaudited) | | % of Investments | | Value | |
| Biotechnology | | | 69.1 | % | | $ | 469,202,183 | |
| Health Care | | | 22.0 | | | | 149,872,931 | |
| Life Sciences Tools & Services | | | 8.8 | | | | 59,607,990 | |
| Money Market Fund | | | 0.1 | | | | 449,385 | |
| | | | 100.0 | % | | $ | 679,132,489 | |
The summary of inputs used to value the Fund’s investments as of March 31, 2017 is as follows:
| | | | | | Level 2 | | Level 3 | | | |
| | | Level 1 | | | Significant | | Significant | | | |
| | | Quoted | | | Observable | | Unobservable | | | |
| | | Prices | | | Inputs | | Inputs | | Value | |
| Common Stocks* | | $ | 678,683,104 | | | $ | — | | | $ | — | | | $ | 678,683,104 | |
| Money Market Fund | | | 449,385 | | | | — | | | | — | | | | 449,385 | |
| Repurchase Agreements | | | — | | | | 33,907,816 | | | | — | | | | 33,907,816 | |
| Total | | $ | 679,132,489 | | | $ | 33,907,816 | | | $ | — | | | $ | 713,040,305 | |
* See Schedule of Investments for security type and geographic sector breakouts.
There were no transfers between levels during the period ended March 31, 2017.
See Notes to Financial Statements
VANECK VECTORS ENVIRONMENTAL SERVICES ETF
SCHEDULE OF INVESTMENTS
March 31, 2017 (unaudited)
| Number | | | | | | |
| of Shares | | | | | Value | |
| |
| COMMON STOCKS: 100.0% | | | | |
| Canada: 10.0% | | | | |
| | 22,019 | | | Waste Connections, Inc. (USD) | | $ | 1,942,516 | |
| United Kingdom: 3.8% | | | | |
| | 10,770 | | | Steris Plc (USD) | | | 748,084 | |
| United States: 86.2% | | | | |
| | 16,948 | | | ABM Industries, Inc. | | | 738,933 | |
| | 32,381 | | | Advanced Disposal Services Inc * | | | 731,811 | |
| | 53,506 | | | Calgon Carbon Corp. | | | 781,188 | |
| | 9,769 | | | Cantel Medical Corp. | | | 782,497 | |
| | 27,562 | | | Casella Waste Systems, Inc. * | | | 388,900 | |
| | 36,125 | | | Ceco Environmental Corp. | | | 379,674 | |
| | 13,342 | | | Clean Harbors, Inc. * | | | 742,082 | |
| | 48,243 | | | Covanta Holding Corp. † | | | 757,415 | |
| | 51,197 | | | Darling International, Inc. * | | | 743,380 | |
| | 16,345 | | | Donaldson Company, Inc. | | | 744,024 | |
| | 48,735 | | | Layne Christensen Co. * † | | | 430,817 | |
| | 50,009 | | | Newpark Resources, Inc. * | | | 405,073 | |
| | 30,542 | | | Republic Services, Inc. | | | 1,918,343 | |
| | 18,662 | | | Schnitzer Steel Industries, Inc. | | | 385,370 | |
| | 23,316 | | | Stericycle, Inc. * | | | 1,932,663 | |
| | 10,384 | | | Tennant Co. | | | 754,398 | |
| | 11,771 | | | Tenneco, Inc. | | | 734,746 | |
| | 18,324 | | | Tetra Tech, Inc. | | | 748,535 | |
| | 15,687 | | | US Ecology, Inc. | | | 734,936 | |
| | 26,362 | | | Waste Management, Inc. | | | 1,922,317 | |
| | | | | | | | 16,757,102 | |
Total Common Stocks
(Cost: $16,450,233) | | | 19,447,702 | |
| Number | | | | | | |
| of Shares | | | | | Value | |
| |
| MONEY MARKET FUND: 0.0% | | | | |
| (Cost: $500) | | | | |
| | 500 | | | Dreyfus Government Cash Management Fund | | $ | 500 | |
Total Investments Before Collateral for Securities Loaned: 100.0%
(Cost: $16,450,733) | | 19,448,202 | |
| | | | | | | | | |
| Principal | | | | | | | |
| Amount | | | | | | | |
SHORT-TERM INVESTMENT HELD AS COLLATERAL FOR SECURITIES LOANED: 3.7%
(Cost: $713,132) | | | |
| Repurchase Agreement: 3.7% | | | | |
| | $713,132 | | | Repurchase agreement dated 3/31/17 with Nomura Securities International, Inc., 0.81%, due 4/3/17, proceeds $713,180; (collateralized by various U.S. government and agency obligations, 0.00% to 7.50%, due 4/19/17 to 2/20/67, valued at $727,395 including accrued interest) | | | 713,132 | |
Total Investments: 103.7%
(Cost: $17,163,865) | | | 20,161,334 | |
| Liabilities in excess of other assets: (3.7)% | | | (722,546 | ) |
| NET ASSETS: 100.0% | | $ | 19,438,788 | |
| USD | United States Dollar |
| * | Non-income producing |
| † | Security fully or partially on loan. Total market value of securities on loan is $696,696. |
Summary of Investments by Sector Excluding
Collateral for Securities Loaned (unaudited) | | % of Investments | | Value | |
| Consumer Discretionary | | | 3.8 | % | | $ | 734,746 | |
| Consumer Staples | | | 3.8 | | | | 743,380 | |
| Energy | | | 2.1 | | | | 405,073 | |
| Health Care | | | 7.9 | | | | 1,530,581 | |
| Industrials | | | 76.4 | | | | 14,867,364 | |
| Materials | | | 6.0 | | | | 1,166,558 | |
| Money Market Fund | | | 0.0 | | | | 500 | |
| | | | 100.0 | % | | $ | 19,448,202 | |
The summary of inputs used to value the Fund’s investments as of March 31, 2017 is as follows:
| | | | | Level 2 | | Level 3 | | | |
| | | Level 1 | | Significant | | Significant | | | |
| | | Quoted | | Observable | | Unobservable | | | |
| | | Prices | | Inputs | | Inputs | | Value | |
| Common Stocks* | | $ | 19,447,702 | | | $ | — | | | | $ | — | | | $ | 19,447,702 | |
| Money Market Fund | | | 500 | | | | — | | | | | — | | | | 500 | |
| Repurchase Agreement | | | — | | | | 713,132 | | | | | — | | | | 713,132 | |
| Total | | $ | 19,448,202 | | | $ | 713,132 | | | | $ | — | | | $ | 20,161,334 | |
* See Schedule of Investments for security type and geographic sector breakouts.
There were no transfers between levels during the period ended March 31, 2017.
See Notes to Financial Statements
VANECK VECTORS GAMING ETF
SCHEDULE OF INVESTMENTS
March 31, 2017 (unaudited)
| Number | | | | | | |
| of Shares | | | | | Value | |
| |
| COMMON STOCKS: 96.7% | | | | |
| Australia: 15.6% | | | | |
| | 83,720 | | | Aristocrat Leisure Ltd. # | | $ | 1,147,455 | |
| | 67,854 | | | Crown Ltd. # | | | 611,196 | |
| | 88,526 | | | Star Entertainment Group Ltd. # | | | 369,319 | |
| | 120,384 | | | TABCORP Holdings Ltd. # | | | 436,200 | |
| | 201,328 | | | Tatts Group Ltd. # | | | 680,227 | |
| | | | | | | | 3,244,397 | |
| Canada: 0.7% | | | | |
| | 8,187 | | | Amaya, Inc. (USD) * † | | | 139,179 | |
| China / Hong Kong: 22.7% | | | | |
| | 275,240 | | | Galaxy Entertainment Group Ltd. # | | | 1,507,533 | |
| | 26,806 | | | Melco Crown Entertainment Ltd. (ADR) | | | 496,983 | |
| | 146,900 | | | MGM China Holdings Ltd. # | | | 306,326 | |
| | 360,800 | | | Sands China Ltd. # | | | 1,672,521 | |
| | 378,000 | | | SJM Holdings Ltd. # | | | 307,656 | |
| | 200,800 | | | Wynn Macau Ltd. # | | | 408,974 | |
| | | | | | | | 4,699,993 | |
| Greece: 1.4% | | | | |
| | 31,959 | | | OPAP SA # | | | 298,191 | |
| Ireland: 5.9% | | | | |
| | 11,376 | | | Paddy Power Betfair Plc # | | | 1,226,476 | |
| Japan: 4.6% | | | | |
| | 10,000 | | | Heiwa Corp. # | | | 249,022 | |
| | 8,079 | | | Sankyo Co. Ltd. # | | | 270,362 | |
| | 32,800 | | | Sega Sammy Holdings, Inc. # | | | 440,765 | |
| | | | | | | | 960,149 | |
| Malaysia: 3.4% | | | | |
| | 130,267 | | | Berjaya Sports Toto Bhd | | | 85,657 | |
| | 508,098 | | | Genting Malaysia Bhd # | | | 625,627 | |
| | | | | | | | 711,284 | |
| Malta: 1.7% | | | | |
| | 34,381 | | | Unibet Group Plc # | | | 357,422 | |
| New Zealand: 1.2% | | | | |
| | 84,871 | | | Sky City Entertainment Group Ltd. # | | | 246,098 | |
| Singapore: 3.5% | | | | |
| | 993,400 | | | Genting Singapore Plc # | | | 725,224 | |
| South Africa: 0.7% | | | | |
| | 70,075 | | | Tsogo Sun Holdings Ltd. # | | | 144,054 | |
| South Korea: 3.4% | | | | |
| | 17,296 | | | Kangwon Land, Inc. # | | | 591,197 | |
| | 8,951 | | | Paradise Co. Ltd. # | | | 110,445 | |
| | | | | | | | 701,642 | |
| Sweden: 2.1% | | | | |
| | 19,753 | | | Betsson AB # | | | 172,503 | |
| | 32,298 | | | NetEnt AB # | | | 260,173 | |
| | | | | | | | 432,676 | |
| Number | | | | | | |
| of Shares | | | | | Value | |
| |
| United Kingdom: 6.3% | | | | |
| | 39,295 | | | GVC Holdings Plc # | | $ | 360,370 | |
| | 181,715 | | | Ladbrokes Plc # | | | 293,574 | |
| | 29,004 | | | Playtech Ltd. # | | | 337,744 | |
| | 84,426 | | | William Hill Plc # | | | 307,285 | |
| | | | | | | | 1,298,973 | |
| United States: 23.5% | | | | |
| | 10,531 | | | Boyd Gaming Corp. * | | | 231,787 | |
| | 1,588 | | | Churchill Downs, Inc. | | | 252,254 | |
| | 17,314 | | | International Game Technology Plc | | | 410,342 | |
| | 29,009 | | | Las Vegas Sands Corp. | | | 1,655,544 | |
| | 49,545 | | | MGM Mirage | | | 1,357,533 | |
| | 10,543 | | | Penn National Gaming, Inc. * | | | 194,307 | |
| | 6,808 | | | Wynn Resorts Ltd. | | | 780,265 | |
| | | | | | | | 4,882,032 | |
Total Common Stocks
(Cost: $21,735,880) | | | 20,067,790 | |
REAL ESTATE INVESTMENT TRUST: 3.3%
(Cost: $687,577) | | | | |
| United States: 3.3% | | | | |
| | 20,814 | | | Gaming and Leisure Properties, Inc. | | | 695,604 | |
Total Investments Before Collateral for Securities Loaned: 100.0%
(Cost: $22,423,457) | | 20,763,394 | |
| | | | | |
| Principal | | | | | | | |
| Amount | | | | | | | |
SHORT-TERM INVESTMENT HELD AS COLLATERAL FOR SECURITIES LOANED: 0.1%
(Cost: $15,995) | | | |
| | | | |
| Repurchase Agreement: 0.1% | | | | |
| | $15,995 | | | Repurchase agreement dated 3/31/17 with Nomura Securities International, Inc., 0.81%, due 4/3/17, proceeds $15,996; (collateralized by various U.S. government and agency obligations, 0.00% to 7.50%, due 4/19/17 to 2/20/67, valued at $16,315 including accrued interest) | | | 15,995 | |
Total Investments: 100.1%
(Cost: $22,439,452) | | | 20,779,389 | |
| Liabilities in excess of other assets: (0.1)% | | | (19,590 | ) |
| NET ASSETS: 100.0% | | $ | 20,759,799 | |
See Notes to Financial Statements
| ADR | American Depositary Receipt |
| USD | United States Dollar |
| * | Non-income producing |
| † | Security fully or partially on loan. Total market value of securities on loan is $15,300. |
| # | Indicates a fair valued security which has been valued in good faith pursuant to guidelines established by the Board of Trustees. The aggregate value of fair valued securities is $14,463,939 which represents 69.7% of net assets. |
Summary of Investments by Sector Excluding
Collateral for Securities Loaned (unaudited) | | % of Investments | | Value | |
| Consumer Discretionary | | | 93.8 | % | | $ | 19,469,873 | |
| Information Technology | | | 2.9 | | | | 597,917 | |
| Real Estate | | | 3.3 | | | | 695,604 | |
| | | | 100.0 | % | | $ | 20,763,394 | |
The summary of inputs used to value the Fund’s investments as of March 31, 2017 is as follows:
| | | | | | Level 2 | | Level 3 | | | |
| | | Level 1 | | | Significant | | Significant | | | |
| | | Quoted | | | Observable | | Unobservable | | | |
| | | Prices | | | Inputs | | Inputs | | Value | |
| Common Stocks | | | | | | | | | | | | | | | | | |
| Australia | | | $ | — | | | $ | 3,244,397 | | | $ | — | | | $ | 3,244,397 | |
| Canada | | | | 139,179 | | | | — | | | | — | | | | 139,179 | |
| China / Hong Kong | | | | 496,983 | | | | 4,203,010 | | | | — | | | | 4,699,993 | |
| Greece | | | | — | | | | 298,191 | | | | — | | | | 298,191 | |
| Ireland | | | | — | | | | 1,226,476 | | | | — | | | | 1,226,476 | |
| Japan | | | | — | | | | 960,149 | | | | — | | | | 960,149 | |
| Malaysia | | | | 85,657 | | | | 625,627 | | | | — | | | | 711,284 | |
| Malta | | | | — | | | | 357,422 | | | | — | | | | 357,422 | |
| New Zealand | | | | — | | | | 246,098 | | | | — | | | | 246,098 | |
| Singapore | | | | — | | | | 725,224 | | | | — | | | | 725,224 | |
| South Africa | | | | — | | | | 144,054 | | | | — | | | | 144,054 | |
| South Korea | | | | — | | | | 701,642 | | | | — | | | | 701,642 | |
| Sweden | | | | — | | | | 432,676 | | | | — | | | | 432,676 | |
| United Kingdom | | | | — | | | | 1,298,973 | | | | — | | | | 1,298,973 | |
| United States | | | | 4,882,032 | | | | — | | | | — | | | | 4,882,032 | |
| Real Estate Investment Trust | | | | | | | | | | | | | | | | | |
| United States | | | | 695,604 | | | | — | | | | — | | | | 695,604 | |
| Repurchase Agreement | | | | — | | | | 15,995 | | | | — | | | | 15,995 | |
| Total | | | $ | 6,299,455 | | | $ | 14,479,934 | | | $ | — | | | $ | 20,779,389 | |
During the period ended March 31, 2017, transfers of securities from Level 1 to Level 2 were $388,946. These transfers resulted primarily from changes in certain foreign securities valuation methodologies between the last close of the securities’ primary market (Level 1) and valuation by a pricing service (Level 2), which takes into account market direction or events occurring before the Fund’s pricing time but after the last local close, as described in the Notes to Financial Statements.
See Notes to Financial Statements
VANECK VECTORS GENERIC DRUGS ETF
SCHEDULE OF INVESTMENTS
March 31, 2017 (unaudited)
| Number | | | | | | |
| of Shares | | | | | Value | |
| | |
| COMMON STOCKS: 99.8% | | | | |
| Belgium: 4.8% | | | | |
| | 2,792 | | | UCB SA # | | $ | 217,129 | |
| China / Hong Kong: 7.5% | | | | |
| | 86,000 | | | CSPC Pharmaceutical Group Ltd. # | | | 112,670 | |
| | 2,400 | | | Guangzhou Baiyunshan Pharmaceutical Holdings Co. Ltd. # | | | 7,076 | |
| | 5,500 | | | Shanghai Fosun Pharmaceutical Group Co. Ltd. # § | | 20,241 | |
| | 11,100 | | | Shanghai Pharmaceuticals Holding Co. Ltd. # | | | 29,078 | |
| | 106,000 | | | Sino Biopharmaceutical Ltd. # | | | 87,291 | |
| | 16,800 | | | Sinopharm Group Co. Ltd. # | | | 77,994 | |
| | | | | | | | 334,350 | |
| Finland: 1.7% | | | | |
| | 1,480 | | | Orion OYJ # | | | 77,402 | |
| Germany: 1.2% | | | | |
| | 894 | | | Stada Arzneimittel AG # | | | 54,896 | |
| Hungary: 1.4% | | | | |
| | 2,675 | | | Richter Gedeon Nyrt # | | | 60,870 | |
| India: 23.6% | | | | |
| | 8,397 | | | Aurobindo Pharma Ltd. # | | | 87,317 | |
| | 2,870 | | | Biocon Ltd. # | | | 50,049 | |
| | 14,689 | | | Cadila Healthcare Ltd. # | | | 99,987 | |
| | 11,542 | | | Cipla Ltd. # | | | 105,403 | |
| | 2,377 | | | Dr. Reddy’s Laboratories Ltd. (ADR) | | | 95,437 | |
| | 4,048 | | | Glenmark Pharmaceuticals Ltd. # | | | 53,120 | |
| | 6,479 | | | Lupin Ltd. # | | | 144,207 | |
| | 34,225 | | | Sun Pharmaceuticals Industries Ltd. # | | | 362,716 | |
| | 2,428 | | | Torrent Pharmaceuticals Ltd. # | | | 58,058 | |
| | | | | | | | 1,056,294 | |
| Indonesia: 1.7% | | | | |
| | 672,600 | | | Kalbe Farma Tbk PT # | | | 77,729 | |
| Ireland: 7.3% | | | | |
| | 2,189 | | | Alkermes Plc (USD) * | | | 128,057 | |
| | 782 | | | ICON Plc (USD) * | | | 62,341 | |
| | 2,057 | | | Perrigo Co. Plc (USD) | | | 136,564 | |
| | | | | | | | 326,962 | |
| Israel: 9.2% | | | | |
| | 589 | | | Taro Pharmaceutical Industries Ltd. (USD) * † | | | 68,689 | |
| | 10,760 | | | Teva Pharmaceutical Industries Ltd. (ADR) | | | 345,288 | |
| | | | | | | | 413,977 | |
| Japan: 7.1% | | | | |
| | 1,400 | | | Hisamitsu Pharmaceutical Co., Inc. # | | | 80,082 | |
| | 8,200 | | | Kyowa Hakko Kirin Co. Ltd. # | | | 130,182 | |
| | 1,300 | | | Taisho Pharmaceutical Holdings Co. Ltd. # | | | 105,756 | |
| | | | | | | | 316,020 | |
| Number | | | | | | |
| of Shares | | | | | Value | |
| |
| Jordan: 1.9% | | | | |
| | 3,442 | | | Hikma Pharmaceuticals Plc (GBP) # | | $ | 85,330 | |
| South Africa: 3.0% | | | | |
| | 6,549 | | | Aspen Pharmacare Holdings Ltd. # | | | 134,063 | |
| South Korea: 4.2% | | | | |
| | 1,757 | | | Celltrion, Inc. * # | | | 141,541 | |
| | 894 | | | Hanmi Science Co. Ltd. * # | | | 46,674 | |
| | | | | | | | 188,215 | |
| Switzerland: 3.5% | | | | |
| | 830 | | | Lonza Group AG # | | | 156,997 | |
| United States: 21.7% | | | | |
| | 1,614 | | | Albemarle Corp. | | | 170,503 | |
| | 679 | | | Charles River Laboratories International, Inc. * | | | 61,076 | |
| | 1,503 | | | Mallinckrodt Plc * | | | 66,989 | |
| | 7,178 | | | Mylan NV * | | | 279,870 | |
| | 8,009 | | | Opko Health, Inc. * † | | | 64,072 | |
| | 884 | | | PRA Health Sciences, Inc. * | | | 57,663 | |
| | 3,385 | | | Quintiles Transnational Holdings, Inc. * | | | 272,594 | |
| | | | | | | | 972,767 | |
Total Common Stocks
(Cost: $4,598,536) | | | 4,473,001 | |
MONEY MARKET FUND: 10.7%
(Cost: $479,744) | | | | |
| | 479,744 | | | Dreyfus Government Cash Management Fund | | | 479,744 | |
Total Investments Before Collateral for Securities Loaned: 110.5%
(Cost: $5,078,280) | | 4,952,745 | |
| | | | | |
| Principal | | | | | | | |
| Amount | | | | | | | |
SHORT-TERM INVESTMENT HELD AS COLLATERAL FOR SECURITIES LOANED: 2.1%
(Cost: $92,280) | | | |
| Repurchase Agreement: 2.1% | | | | |
| | $92,280 | | | Repurchase agreement dated 3/31/17 with Citigroup Global Markets, Inc., 0.81%, due 4/3/17, proceeds $92,286; (collateralized by various U.S. government and agency obligations, 0.00% to 11.50%, due 4/1/17 to 6/1/52, valued at $94,126 including accrued interest) | | | 92,280 | |
Total Investments: 112.6%
(Cost: $5,170,560) | | | 5,045,025 | |
| Liabilities in excess of other assets: (12.6)% | | | (564,450 | ) |
| NET ASSETS: 100.0% | | $ | 4,480,575 | |
See Notes to Financial Statements
| ADR | American Depositary Receipt |
| GBP | British Pound |
| USD | United States Dollar |
| * | Non-income producing |
| † | Security fully or partially on loan. Total market value of securities on loan is $89,319. |
| # | Indicates a fair valued security which has been valued in good faith pursuant to guidelines established by the Board of Trustees. The aggregate value of fair valued securities is $2,663,858 which represents 59.5% of net assets. |
| § | Illiquid Security — the aggregate value of illiquid securities is $20,241 which represents 0.5% of net assets. |
Summary of Investments by Sector Excluding
Collateral for Securities Loaned (unaudited) | | % of Investments | | Value | |
| Biotechnology | | | 7.8 | % | | $ | 383,719 | |
| Health Care Distributors | | | 2.2 | | | | 107,072 | |
| Life Sciences Tools & Services | | | 12.3 | | | | 610,671 | |
| Pharmaceuticals | | | 64.6 | | | | 3,201,036 | |
| Specialty Chemicals | | | 3.4 | | | | 170,503 | |
| Money Market Fund | | | 9.7 | | | | 479,744 | |
| | | | 100.0 | % | | $ | 4,952,745 | |
The summary of inputs used to value the Fund’s investments as of March 31, 2017 is as follows:
| | | | | | Level 2 | | Level 3 | | | |
| | | Level 1 | | | Significant | | Significant | | | |
| | | Quoted | | | Observable | | Unobservable | | | |
| | | Prices | | | Inputs | | Inputs | | Value | |
| Common Stocks | | | | | | | | | | | | | | | | | | |
| Belgium | | | $ | — | | | | $ | 217,129 | | | $ | — | | | $ | 217,129 | |
| China / Hong Kong | | | | — | | | | | 334,350 | | | | — | | | | 334,350 | |
| Finland | | | | — | | | | | 77,402 | | | | — | | | | 77,402 | |
| Germany | | | | — | | | | | 54,896 | | | | — | | | | 54,896 | |
| Hungary | | | | — | | | | | 60,870 | | | | — | | | | 60,870 | |
| India | | | | 95,437 | | | | | 960,857 | | | | — | | | | 1,056,294 | |
| Indonesia | | | | — | | | | | 77,729 | | | | — | | | | 77,729 | |
| Ireland | | | | 326,962 | | | | | — | | | | — | | | | 326,962 | |
| Israel | | | | 413,977 | | | | | — | | | | — | | | | 413,977 | |
| Japan | | | | — | | | | | 316,020 | | | | — | | | | 316,020 | |
| Jordan | | | | — | | | | | 85,330 | | | | — | | | | 85,330 | |
| South Africa | | | | — | | | | | 134,063 | | | | — | | | | 134,063 | |
| South Korea | | | | — | | | | | 188,215 | | | | — | | | | 188,215 | |
| Switzerland | | | | — | | | | | 156,997 | | | | — | | | | 156,997 | |
| United States | | | | 972,767 | | | | | — | | | | — | | | | 972,767 | |
| Money Market Fund | | | | 479,744 | | | | | — | | | | — | | | | 479,744 | |
| Repurchase Agreement | | | | — | | | | | 92,280 | | | | — | | | | 92,280 | |
| Total | | | $ | 2,288,887 | | | | $ | 2,756,138 | | | $ | — | | | $ | 5,045,025 | |
There were no transfers between levels during the period ended March 31, 2017.
See Notes to Financial Statements
VANECK VECTORS PHARMACEUTICAL ETF
SCHEDULE OF INVESTMENTS
March 31, 2017 (unaudited)
| Number | | | | | | |
| of Shares | | | | | Value | |
| | | | | |
| COMMON STOCKS: 99.6% | | | | |
| Denmark: 4.7% | | | | |
| | 454,049 | | | Novo-Nordisk AS (ADR) | | $ | 15,564,800 | |
| France: 5.2% | | | | |
| | 384,526 | | | Sanofi SA (ADR) | | | 17,399,802 | |
| Ireland: 7.1% | | | | |
| | 197,960 | | | Endo International Plc (USD) * | | | 2,209,234 | |
| | 60,049 | | | Jazz Pharmaceuticals Plc (USD) * | | | 8,714,911 | |
| | 189,746 | | | Perrigo Co. Plc (USD) † | | | 12,597,237 | |
| | | | | | | | 23,521,382 | |
| Israel: 4.4% | | | | |
| | 456,126 | | | Teva Pharmaceutical Industries Ltd. (ADR) | | | 14,637,083 | |
| Switzerland: 5.9% | | | | |
| | 263,466 | | | Novartis AG (ADR) | | | 19,567,620 | |
| United Kingdom: 11.5% | | | | |
| | 565,740 | | | AstraZeneca Plc (ADR) † | | | 17,617,144 | |
| | 404,531 | | | GlaxoSmithKline Plc (ADR) | | | 17,055,027 | |
| | 29,557 | | | GW Pharmaceuticals Plc (ADR) * † | | | 3,574,624 | |
| | | | | | | | 38,246,795 | |
| United States: 60.8% | | | | |
| | 259,409 | | | AbbVie, Inc. | | | 16,903,090 | |
| | 116,718 | | | Akorn, Inc. | | | 2,810,569 | |
| | 168,103 | | | AmerisourceBergen Corp. | | | 14,877,116 | |
| | 291,290 | | | Bristol-Myers Squibb Co. | | | 15,840,350 | |
| | 179,531 | | | Eli Lilly & Co. | | | 15,100,352 | |
| | 236,739 | | | Johnson & Johnson | | | 29,485,843 | |
| | 122,867 | | | Mallinckrodt Plc * | | | 5,476,182 | |
| | 101,296 | | | McKesson Corp. | | | 15,018,145 | |
| | 252,864 | | | Merck and Co., Inc. | | | 16,066,979 | |
| | 344,481 | | | Mylan NV * | | | 13,431,314 | |
| | 102,515 | | | Patterson Cos, Inc. † | | | 4,636,753 | |
| | 519,300 | | | Pfizer, Inc. | | | 17,765,253 | |
| | 84,127 | | | Shire Plc (ADR) | | | 14,657,447 | |
| | 497,272 | | | Valeant Pharmaceuticals International, Inc. * † | | | 5,484,910 | |
| | 282,540 | | | Zoetis, Inc. | | | 15,079,160 | |
| | | | | | | | 202,633,463 | |
Total Common Stocks
(Cost: $400,880,624) | | | 331,570,945 | |
MONEY MARKET FUND: 0.0%
(Cost: $85,039) | | | | |
| | 85,039 | | | Dreyfus Government Cash Management Fund | | | 85,039 | |
Total Investments Before Collateral for Securities Loaned: 99.6%
(Cost: $400,965,663) | | 331,655,984 | |
| Principal Amount | | | | | Value | |
| | | | | |
| SHORT-TERM INVESTMENTS HELD AS COLLATERAL FOR SECURITIES LOANED: 9.5% | | | | |
| Repurchase Agreements: 9.5% | | | | |
| $ | 7,540,381 | | | Repurchase agreement dated 3/31/17 with Citigroup Global Markets, Inc., 0.81%, due 4/3/17, proceeds $7,540,890; (collateralized by various U.S. government and agency obligations, 0.00% to 11.50%, due 4/1/17 to 6/1/52, valued at $7,691,189 including accrued interest) | | $ | 7,540,381 | |
| | 7,540,381 | | | Repurchase agreement dated 3/31/17 with Daiwa Capital Markets America, Inc., 0.82%, due 4/3/17, proceeds $7,540,896; (collateralized by various U.S. government and agency obligations, 0.00% to 6.50%, due 5/11/17 to 12/1/51, valued at $7,691,189 including accrued interest) | | | 7,540,381 | |
| | 1,586,801 | | | Repurchase agreement dated 3/31/17 with HSBC Securities USA, Inc., 0.77%, due 4/3/17, proceeds $1,586,903; (collateralized by various U.S. government and agency obligations, 0.00% to 2.13%, due 5/15/25 to 11/15/45, valued at $1,618,538 including accrued interest) | | | 1,586,801 | |
| | 7,540,381 | | | Repurchase agreement dated 3/31/17 with Merrill Lynch, Pierce, Fenner & Smith, Inc., 0.83%, due 4/3/17, proceeds $7,540,903; (collateralized by various U.S. government and agency obligations, 1.84% to 7.00%, due 5/1/17 to 12/1/46, valued at $7,691,189 including accrued interest) | | | 7,540,381 | |
| | 7,540,381 | | | Repurchase agreement dated 3/31/17 with Nomura Securities International, Inc., 0.81%, due 4/3/17, proceeds $7,540,890; (collateralized by various U.S. government and agency obligations, 0.00% to 7.50%, due 4/19/17 to 2/20/67, valued at $7,691,189 including accrued interest) | | | 7,540,381 | |
Total Short-Term Investments Held as Collateral for Securities Loaned
(Cost: $31,748,325) | | | 31,748,325 | |
Total Investments: 109.1%
(Cost: $432,713,988) | | | 363,404,309 | |
| Liabilities in excess of other assets: (9.1)% | | | (30,269,642 | ) |
| NET ASSETS: 100.0% | | $ | 333,134,667 | |
See Notes to Financial Statements
| ADR | American Depositary Receipt |
| USD | United States Dollar |
| * | Non-income producing |
| † | Security fully or partially on loan. Total market value of securities on loan is $30,837,658. |
Summary of Investments by Sector Excluding
Collateral for Securities Loaned (unaudited) | | % of Investments | | Value | |
| Health Care | | | 19.8 | % | | $ | 65,729,045 | |
| Pharmaceuticals | | | 80.2 | | | | 265,841,900 | |
| Money Market Fund | | | 0.0 | | | | 85,039 | |
| | | | 100.0 | % | | $ | 331,655,984 | |
The summary of inputs used to value the Fund’s investments as of March 31, 2017 is as follows:
| | | | | | Level 2 | | | Level 3 | | | |
| | | Level 1 | | | Significant | | | Significant | | | |
| | | Quoted | | | Observable | | | Unobservable | | | |
| | | Prices | | | Inputs | | | Inputs | | Value | |
| Common Stocks* | | $ | 331,570,945 | | | $ | — | | | | $ | — | | | $ | 331,570,945 | |
| Money Market Fund | | | 85,039 | | | | — | | | | | — | | | | 85,039 | |
| Repurchase Agreements | | | — | | | | 31,748,325 | | | | | — | | | | 31,748,325 | |
| Total | | $ | 331,655,984 | | | $ | 31,748,325 | | | | $ | — | | | $ | 363,404,309 | |
* See Schedule of Investments for security type and geographic sector breakouts.
There were no transfers between levels during the period ended March 31, 2017.
See Notes to Financial Statements
VANECK VECTORS RETAIL ETF
SCHEDULE OF INVESTMENTS
March 31, 2017 (unaudited)
| Number | | | | | | |
| of Shares | | | | | Value | |
| | | | | | | |
| COMMON STOCKS: 100.1% | | | | |
| China / Hong Kong: 4.4% | | | | |
| | 109,000 | | | JD.com, Inc. (ADR) * | | $ | 3,390,990 | |
| United States: 95.7% | | | | |
| | 14,576 | | | Amazon.com, Inc. * | | | 12,922,207 | |
| | 19,441 | | | AmerisourceBergen Corp. | | | 1,720,529 | |
| | 2,526 | | | AutoZone, Inc. | | | 1,826,424 | |
| | 16,948 | | | Bed Bath & Beyond, Inc. † | | | 668,768 | |
| | 27,634 | | | Best Buy Co., Inc. | | | 1,358,211 | |
| | 32,895 | | | Cardinal Health, Inc. | | | 2,682,587 | |
| | 22,880 | | | Costco Wholesale Corp. | | | 3,836,747 | |
| | 47,115 | | | CVS Caremark Corp. | | | 3,698,527 | |
| | 29,338 | | | Dollar General Corp. | | | 2,045,739 | |
| | 40,844 | | | Home Depot, Inc. | | | 5,997,125 | |
| | 18,801 | | | Kohl’s Corp. † | | | 748,468 | |
| | 105,062 | | | Kroger Co. | | | 3,098,278 | |
| | 26,945 | | | L Brands, Inc. | | | 1,269,110 | |
| | 46,809 | | | Lowe’s Cos., Inc. | | | 3,848,168 | |
| | 38,362 | | | MACY’S, Inc. | | | 1,137,050 | |
| | 22,719 | | | McKesson Corp. | | | 3,368,319 | |
| | 40,510 | | | Ross Stores, Inc. | | | 2,668,394 | |
| | 63,759 | | | Sysco Corp. | | | 3,310,367 | |
| | 63,393 | | | Target Corp. | | | 3,498,660 | |
| | 30,968 | | | The Gap, Inc. † | | | 752,213 | |
| | 43,811 | | | TJX Cos., Inc. | | | 3,464,574 | |
| | 44,846 | | | Walgreens Boots Alliance, Inc. | | | 3,724,460 | |
| | 63,381 | | | Wal-Mart Stores, Inc. | | | 4,568,502 | |
| | 39,506 | | | Whole Foods Market, Inc. | | | 1,174,118 | |
| | | | | | | | 73,387,545 | |
Total Common Stocks
(Cost: $83,376,370) | | | 76,778,535 | |
| Principal | | | | | | |
| Amount | | | | | Value | |
| | | | | | | |
| SHORT-TERM INVESTMENTS HELD AS COLLATERAL FOR SECURITIES LOANED: 1.7% | | | | |
| Repurchase Agreements: 1.7% | | | | |
| $ | 303,849 | | | Repurchase agreement dated 3/31/17 with Citigroup Global Markets, Inc., 0.81%, due 4/3/17, proceeds $303,870; (collateralized by various U.S. government and agency obligations, 0.00% to 11.50%, due 4/1/17 to 6/1/52, valued at $309,926 including accrued interest) | | $ | 303,849 | |
| | 1,000,000 | | | Repurchase agreement dated 3/31/17 with Nomura Securities International, Inc., 0.81%, due 4/3/17, proceeds $1,000,068; (collateralized by various U.S. government and agency obligations, 0.00% to 7.50%, due 4/19/17 to 2/20/67, valued at $1,020,000 including accrued interest) | | | 1,000,000 | |
Total Short-Term Investments Held as Collateral for Securities Loaned
(Cost: $1,303,849) | | | 1,303,849 | |
Total Investments: 101.8%
(Cost: $84,680,219) | | | 78,082,384 | |
| Liabilities in excess of other assets: (1.8)% | | | (1,349,124 | ) |
| NET ASSETS: 100.0% | | $ | 76,733,260 | |
| | |
| ADR | American Depositary Receipt |
| * | Non-income producing |
| † | Security fully or partially on loan. Total market value of securities on loan is $1,261,366. |
Summary of Investments by Sector Excluding
Collateral for Securities Loaned (unaudited) | | % of Investments | | Value | |
| Consumer Discretionary | | | 59.4 | % | | $ | 45,596,101 | |
| Consumer Staples | | | 30.5 | | | | 23,410,999 | |
| Health Care | | | 10.1 | | | | 7,771,435 | |
| | | | 100.0 | % | | $ | 76,778,535 | |
The summary of inputs used to value the Fund’s investments as of March 31, 2017 is as follows:
| | | | | | Level 2 | | Level 3 | | | |
| | | Level 1 | | | Significant | | Significant | | | |
| | | Quoted | | | Observable | | Unobservable | | | |
| | | Prices | | | Inputs | | Inputs | | Value | |
| Common Stocks* | | $ | 76,778,535 | | | | $ | — | | | | $ | — | | | $ | 76,778,535 | |
| Repurchase Agreements | | | — | | | | | 1,303,849 | | | | | — | | | | 1,303,849 | |
| Total | | $ | 76,778,535 | | | | $ | 1,303,849 | | | | $ | — | | | $ | 78,082,384 | |
* See Schedule of Investments for security type and geographic sector breakouts.
There were no transfers between levels during the period ended March 31, 2017.
See Notes to Financial Statements
VANECK VECTORS SEMICONDUCTOR ETF
SCHEDULE OF INVESTMENTS
March 31, 2017 (unaudited)
| Number | | | | | | |
| of Shares | | | | | Value | |
| | | | | | | |
| COMMON STOCKS: 100.0% | | | | |
| Bermuda: 1.6% | | | | |
| | 725,654 | | | Marvell Technology Group Ltd. (USD) | | $ | 11,073,480 | |
| Netherlands: 9.1% | | | | |
| | 257,622 | | | ASML Holding NV (USD) | | | 34,212,202 | |
| | 299,516 | | | NXP Semiconductors NV (USD) * | | | 30,999,906 | |
| | | | | | | | 65,212,108 | |
| Taiwan: 12.2% | | | | |
| | 2,662,122 | | | Taiwan Semiconductor Manufacturing Co. Ltd. (ADR) | | | 87,424,086 | |
| United States: 77.1% | | | | |
| | 1,345,000 | | | Advanced Micro Devices, Inc. * † | | | 19,569,750 | |
| | 372,678 | | | Analog Devices, Inc. | | | 30,540,962 | |
| | 929,463 | | | Applied Materials, Inc. | | | 36,156,111 | |
| | 157,365 | | | Broadcom Ltd. | | | 34,456,640 | |
| | 351,412 | | | Cadence Design Systems, Inc. * | | | 11,034,337 | |
| | 99,753 | | | Cavium, Inc. * | | | 7,148,300 | |
| | 2,259,609 | | | Intel Corp. | | | 81,504,097 | |
| | 223,903 | | | KLA-Tencor Corp. | | | 21,286,458 | |
| | 239,488 | | | Lam Research Corp. | | | 30,740,680 | |
| | 392,021 | | | Maxim Integrated Products, Inc. | | | 17,625,264 | |
| | 313,752 | | | Microchip Technology, Inc. | | | 23,148,623 | |
| | 1,225,770 | | | Micron Technology, Inc. * | | | 35,424,753 | |
| | 162,319 | | | Microsemi Corp. * | | | 8,364,298 | |
| | 350,702 | | | NVIDIA Corp. | | | 38,201,969 | |
| | 643,579 | | | ON Semiconductor Corp. * | | | 9,969,039 | |
| | 148,791 | | | Qorvo, Inc. * | | | 10,201,111 | |
| | 758,192 | | | Qualcomm, Inc. | | | 43,474,729 | |
| | 279,751 | | | Skyworks Solutions, Inc. | | | 27,410,003 | |
| | 294,573 | | | Teradyne, Inc. | | | 9,161,220 | |
| | 435,677 | | | Texas Instruments, Inc. | | | 35,098,139 | |
| | 355,662 | | | Xilinx, Inc. | | | 20,589,273 | |
| | | | | | | | 551,105,756 | |
Total Common Stocks
(Cost: $717,211,843) | | | 714,815,430 | |
MONEY MARKET FUND: 0.0%
(Cost: $246,004) | | | | |
| | 246,004 | | | Dreyfus Government Cash Management Fund | | | 246,004 | |
Total Investments Before Collateral for Securities
Loaned: 100.0%
(Cost: $717,457,847) | | | 715,061,434 | |
| Principal | | | | | | |
| Amount | | | | | Value | |
| | | | | | | |
| SHORT-TERM INVESTMENTS HELD AS COLLATERAL FOR SECURITIES LOANED: 2.2% | | | | |
| Repurchase Agreements: 2.2% | | | | |
| | $3,724,474 | | | Repurchase agreement dated 3/31/17 with Citigroup Global Markets, Inc., 0.81%, due 4/3/17, proceeds $3,724,725; (collateralized by various U.S. government and agency obligations, 0.00% to 11.50%, 4/1/17 to 6/1/52, valued at $3,798,963 including accrued interest) | | $ | 3,724,474 | |
| | 3,724,474 | | | Repurchase agreement dated 3/31/17 with Daiwa Capital Markets America, Inc., 0.82%, due 4/3/17, proceeds $3,724,729; (collateralized by various U.S. government and agency obligations, 0.00% to 6.50%, due 5/11/17 to 12/1/51, valued at $3,798,964 including accrued interest) | | | 3,724,474 | |
| | 783,764 | | | Repurchase agreement dated 3/31/17 with HSBC Securities USA, Inc., 0.77%, due 4/3/17, proceeds $783,814; (collateralized by various U.S. government and agency obligations, 0.00% to 2.13%, due 5/15/25 to 11/15/45, valued at $799,440 including accrued interest) | | | 783,764 | |
| | 3,724,474 | | | Repurchase agreement dated 3/31/17 with Merrill Lynch, Pierce, Fenner & Smith, Inc., 0.83%, due 4/3/17, proceeds $3,724,732; (collateralized by various U.S. government and agency obligations, 1.84% to 7.00%, due 5/1/17 to 12/1/46, valued at $3,798,963 including accrued interest) | | | 3,724,474 | |
| | 3,724,474 | | | Repurchase agreement dated 3/31/17 with Nomura Securities International, Inc., 0.81%, due 4/3/17, proceeds $3,724,725; (collateralized by various U.S. government and agency obligations, 0.00% to 7.50%, due 4/19/17 to 2/20/67, valued at $3,798,964 including accrued interest) | | | 3,724,474 | |
Total Short-Term Investments Held as Collateral for Securities Loaned
(Cost: $15,681,660) | | | 15,681,660 | |
Total Investments: 102.2%
(Cost: $733,139,507) | | | 730,743,094 | |
| Liabilities in excess of other assets: (2.2)% | | | (15,711,901 | ) |
| NET ASSETS: 100.0% | | $ | 715,031,193 | |
See Notes to Financial Statements
VANECK VECTORS SEMICONDUCTOR ETF
SCHEDULE OF INVESTMENTS
(unaudited) (continued)
| ADR | American Depositary Receipt |
| USD | United States Dollar |
| * | Non-income producing |
| † | Security fully or partially on loan. Total market value of securities on loan is $15,896,588. |
Summary of Investments by Sector Excluding
Collateral for Securities Loaned (unaudited) | | % of Investments | | Value | |
| Information Technology | | | 16.1 | % | | $ | 114,679,415 | |
| Semiconductor Equipment | | | 18.4 | | | | 131,556,671 | |
| Semiconductors | | | 65.5 | | | | 468,579,344 | |
| Money Market Fund | | | 0.0 | | | | 246,004 | |
| | | | 100.0 | % | | $ | 715,061,434 | |
The summary of inputs used to value the Fund’s investments as of March 31, 2017 is as follows:
| | | | | | Level 2 | | | Level 3 | | | |
| | | Level 1 | | | Significant | | | Significant | | | |
| | | Quoted | | | Observable | | | Unobservable | | | |
| | | Prices | | | Inputs | | | Inputs | | Value | |
| Common Stocks* | | $ | 714,815,430 | | | $ | — | | | | $ | — | | | $ | 714,815,430 | |
| Money Market Fund | | | 246,004 | | | | — | | | | | — | | | | 246,004 | |
| Repurchase Agreements | | | — | | | | 15,681,660 | | | | | — | | | | 15,681,660 | |
| Total | | $ | 715,061,434 | | | $ | 15,681,660 | | | | $ | — | | | $ | 730,743,094 | |
* See Schedule of Investments for security type and geographic sector breakouts.
There were no transfers between levels during the period ended March 31, 2017.
See Notes to Financial Statements
[This page intentionally left blank.]
VANECK VECTORS ETF TRUST
STATEMENTS OF ASSETS AND LIABILITIES
March 31, 2017 (unaudited)
| | | | Biotech
ETF | | | Environmental
Services
ETF | | Gaming
ETF | | | Generic
Drugs
ETF | |
| Assets: | | | | | | | | | | | | | | | | | |
| Investments, at value (1) (2) | | $ | 679,132,489 | | | | $ | 19,448,202 | | | $ | 20,763,394 | | | $ | 4,952,745 | |
| Short-term investments held as collateral for securities loaned (3) | | | 33,907,816 | | | | | 713,132 | | | | 15,995 | | | | 92,280 | |
| Cash | | | — | | | | | — | | | | — | | | | — | |
| Cash denominated in foreign currency, at value (4) | | | — | | | | | — | | | | — | | | | 4,476 | |
| Receivables: | | | | | | | | | | | | | | | | | |
| | Investment securities sold | | | — | | | | | 2,134,143 | | | | 17,630 | | | | 1,723 | |
| | Shares sold | | | 35 | | | | | — | | | | — | | | | — | |
| | Due from Adviser | | | — | | | | | — | | | | — | | | | 3,946 | |
| | Dividends and interest | | | 12,059 | | | | | 25,536 | | | | 78,177 | | | | 3,981 | |
| Prepaid expenses | | | 8,143 | | | | | 2,741 | | | | 2,769 | | | | 16 | |
| | Total assets | | | 713,060,542 | | | | | 22,323,754 | | | | 20,877,965 | | | | 5,059,167 | |
| | | | | | | | | | | | | | | | | | | |
| Liabilities: | | | | | | | | | | | | | | | | | |
| Payables: | | | | | | | | | | | | | | | | | |
| | Investment securities purchased | | | — | | | | | 873,315 | | | | 17,615 | | | | 438,943 | |
| | Collateral for securities loaned | | | 33,907,816 | | | | | 713,132 | | | | 15,995 | | | | 92,280 | |
| | Line of credit | | | — | | | | | 1,243,694 | | | | — | | | | — | |
| | Shares redeemed | | | — | | | | | — | | | | — | | | | — | |
| | Due to Adviser | | | 189,256 | | | | | 2,993 | | | | 3,037 | | | | — | |
| | Due to custodian | | | — | | | | | — | | | | 23,876 | | | | — | |
| Deferred Trustee fees | | | 33,042 | | | | | 2,326 | | | | 5,894 | | | | 6 | |
| Accrued expenses | | | 80,979 | | | | | 49,506 | | | | 51,749 | | | | 47,363 | |
| | Total liabilities | | | 34,211,093 | | | | | 2,884,966 | | | | 118,166 | | | | 578,592 | |
| NET ASSETS | | $ | 678,849,449 | | | | $ | 19,438,788 | | | $ | 20,759,799 | | | $ | 4,480,575 | |
| Shares outstanding | | | 5,696,503 | | | | | 250,000 | | | | 550,000 | | | | 200,000 | |
| Net asset value, redemption and offering price per share | | $ | 119.17 | | | | $ | 77.76 | | | $ | 37.75 | | | $ | 22.40 | |
| | | | | | | | | | | | | | | | | | | |
| Net assets consist of: | | | | | | | | | | | | | | | | | |
| | Aggregate paid in capital | | $ | 746,452,720 | | | | $ | 28,390,787 | | | $ | 28,693,992 | | | $ | 4,616,732 | |
| | Net unrealized appreciation (depreciation) | | | (57,034,533 | ) | | | | 2,997,469 | | | | (1,659,133 | ) | | | (125,487 | ) |
| | Undistributed (accumulated) net investment income (loss) | | | 1,153,538 | | | | | 68,970 | | | | 239,831 | | | | (9,275 | ) |
| | Accumulated net realized gain (loss) | | | (11,722,276 | ) | | | | (12,018,438 | ) | | | (6,514,891 | ) | | | (1,395 | ) |
| | | | $ | 678,849,449 | | | | $ | 19,438,788 | | | $ | 20,759,799 | | | $ | 4,480,575 | |
| (1) | Value of securities on loan | | $ | 33,186,847 | | | | $ | 696,696 | | | $ | 15,300 | | | $ | 89,319 | |
| (2) | Cost of investments | | $ | 736,167,022 | | | | $ | 16,450,733 | | | $ | 22,423,457 | | | $ | 5,078,280 | |
| (3) | Cost of short-term investments held as collateral for securities loaned | | $ | 33,907,816 | | | | $ | 713,132 | | | $ | 15,995 | | | $ | 92,280 | |
| (4) | Cost of cash denominated in foreign currency | | $ | — | | | | $ | — | | | $ | — | | | $ | 4,442 | |
See Notes to Financial Statements
Pharmaceutical
ETF | | Retail
ETF | | | Semiconductor
ETF |
| | | | | | | | | | | | | |
| | $ | 331,655,984 | | | $ | 76,778,535 | | | | $ | 715,061,434 | |
| | | 31,748,325 | | | | 1,303,849 | | | | | 15,681,660 | |
| | | 73,719 | | | | — | | | | | 132,728 | |
| | | — | | | | — | | | | | — | |
| | | | | | | | | | | | | |
| | | — | | | | — | | | | | — | |
| | | 755 | | | | — | | | | | 2,894 | |
| | | — | | | | — | | | | | — | |
| | | 1,561,506 | | | | 74,365 | | | | | 43,650 | |
| | | 5,484 | | | | 3,873 | | | | | 4,981 | |
| | | 365,045,773 | | | | 78,160,622 | | | | | 730,927,347 | |
| | | | | | | | | | | | | |
| | | — | | | | — | | | | | — | |
| | | 31,748,325 | | | | 1,303,849 | | | | | 15,681,660 | |
| | | — | | | | 70,324 | | | | | — | |
| | | 471 | | | | — | | | | | 1,224 | |
| | | 89,174 | | | | 11,842 | | | | | 159,693 | |
| | | — | | | | 213 | | | | | — | |
| | | 20,186 | | | | 4,601 | | | | | 23,220 | |
| | | 52,950 | | | | 36,533 | | | | | 30,357 | |
| | | 31,911,106 | | | | 1,427,362 | | | | | 15,896,154 | |
| | $ | 333,134,667 | | | $ | 76,733,260 | | | | $ | 715,031,193 | |
| | | 6,038,138 | | | | 971,531 | | | | | 8,970,937 | |
| | $ | 55.17 | | | $ | 78.98 | | | | $ | 79.71 | |
| | | | | | | | | | | | | |
| | $ | 403,820,936 | | | $ | 87,174,776 | | | | $ | 621,694,539 | |
| | | (69,309,681 | ) | | | (6,597,837 | ) | | | | (2,396,412 | ) |
| | | 2,813,875 | | | | 235,308 | | | | | 1,700,769 | |
| | | (4,190,463 | ) | | | (4,078,987 | ) | | | | 94,032,297 | |
| | $ | 333,134,667 | | | $ | 76,733,260 | | | | $ | 715,031,193 | |
| | $ | 30,837,658 | | | $ | 1,261,366 | | | | $ | 15,896,588 | |
| | $ | 400,965,663 | | | $ | 83,376,370 | | | | $ | 717,457,847 | |
| | $ | 31,748,325 | | | $ | 1,303,849 | | | | $ | 15,681,660 | |
| | $ | — | | | $ | — | | | | $ | — | |
See Notes to Financial Statements
VANECK VECTORS ETF TRUST
STATEMENTS OF OPERATIONS
For the Six Months Ended March 31, 2017 (unaudited)
| | | Biotech
ETF | | | Environmental
Services
ETF | | Gaming
ETF | | Generic
Drugs
ETF |
| | | | | | | | | | | | | | | | | | | | | |
| Income: | | | | | | | | | | | | | | | | | | | | |
| Dividends | | | $ | 2,810,759 | | | | $ | 132,363 | | | | $ | 375,385 | | | | $ | 14,573 | |
| Securities lending income | | | | 49,778 | | | | | 1,799 | | | | | 1,652 | | | | | 3,723 | |
| Foreign taxes withheld | | | | (24,484 | ) | | | | (1,300 | ) | | | | (9,318 | ) | | | | (1,735 | ) |
| Total income | | | | 2,836,053 | | | | | 132,862 | | | | | 367,719 | | | | | 16,561 | |
| | | | | | | | | | | | | | | | | | | | | |
| Expenses: | | | | | | | | | | | | | | | | | | | | |
| Management fees | | | | 1,069,701 | | | | | 46,330 | | | | | 48,678 | | | | | 10,901 | |
| Professional fees | | | | 55,016 | | | | | 27,851 | | | | | 25,389 | | | | | 21,351 | |
| Insurance | | | | 3,236 | | | | | 109 | | | | | 111 | | | | | 15 | |
| Trustees’ fees and expenses | | | | 6,972 | | | | | 541 | | | | | 612 | | | | | 65 | |
| Reports to shareholders | | | | 28,227 | | | | | 5,219 | | | | | 6,917 | | | | | 8,119 | |
| Indicative optimized portfolio value fee | | | | 2,079 | | | | | — | | | | | 3,979 | | | | | 1,618 | |
| Custodian fees | | | | 12,079 | | | | | 988 | | | | | 6,227 | | | | | 3,487 | |
| Registration fees | | | | 2,450 | | | | | 2,379 | | | | | 2,453 | | | | | 2,346 | |
| Transfer agent fees | | | | 1,144 | | | | | 1,144 | | | | | 1,143 | | | | | 1,106 | |
| Fund accounting fees | | | | 21,013 | | | | | 511 | | | | | 2,577 | | | | | 3,493 | |
| Interest | | | | 2,074 | | | | | 102 | | | | | 682 | | | | | 701 | |
| Other | | | | 12,645 | | | | | 2,113 | | | | | 1,721 | | | | | 1,367 | |
| Total expenses | | | | 1,216,636 | | | | | 87,287 | | | | | 100,489 | | | | | 54,569 | |
| Waiver of management fees | | | | (144,893 | ) | | | | (36,223 | ) | | | | (36,524 | ) | | | | (10,901 | ) |
| Expenses assumed by the Adviser | | | | — | | | | | — | | | | | — | | | | | (30,974 | ) |
| Net expenses | | | | 1,071,743 | | | | | 51,064 | | | | | 63,965 | | | | | 12,694 | |
| Net investment income | | | | 1,764,310 | | | | | 81,798 | | | | | 303,754 | | | | | 3,867 | |
| | | | | | | | | | | | | | | | | | | | | |
| Net realized gain (loss) on: | | | | | | | | | | | | | | | | | | | | |
| Investments | | | | (5,394,611 | ) | | | | (32,884 | ) | | | | (651,666 | ) | | | | (156,344 | ) |
| In-kind redemptions | | | | 2,545,791 | | | | | 988,384 | | | | | — | | | | | 190,931 | |
| Foreign currency transactions and foreign denominated assets and liabilities | | | | — | | | | | — | | | | | (8,305 | ) | | | | 5,498 | |
| Net realized gain (loss) | | | | (2,848,820 | ) | | | | 955,500 | | | | | (659,971 | ) | | | | 40,085 | |
| | | | | | | | | | | | | | | | | | | | | |
| Net change in unrealized appreciation (depreciation) on: | | | | | | | | | | | | | | | | | | | | |
| Investments | | | | 23,707,380 | | | | | 1,147,457 | | | | | 1,823,128 | | | | | (74,817 | ) |
| Foreign currency transactions and foreign denominated assets and liabilities | | | | — | | | | | — | | | | | (1,892 | ) | | | | (22 | ) |
| Net change in unrealized appreciation (depreciation) | | | | 23,707,380 | | | | | 1,147,457 | | | | | 1,821,236 | | | | | (74,839 | ) |
| Net Increase (Decrease) in Net Assets Resulting from Operations | | | $ | 22,622,870 | | | | $ | 2,184,755 | | | | $ | 1,465,019 | | | | $ | (30,887 | ) |
See Notes to Financial Statements
Pharmaceutical
ETF | | Retail
ETF | | | Semiconductor
ETF |
| | | | | | | | | | | | | |
| | $ | 4,241,133 | | | $ | 723,911 | | | | $ | 4,491,867 | |
| | | 18,735 | | | | 2,116 | | | | | 10,881 | |
| | | (248,932 | ) | | | — | | | | | — | |
| | | 4,010,936 | | | | 726,027 | | | | | 4,502,748 | |
| | | | | | | | | | | | | |
| | | 475,884 | | | | 163,595 | | | | | 1,015,183 | |
| | | 36,814 | | | | 32,948 | | | | | 39,565 | |
| | | 1,663 | | | | 826 | | | | | 2,266 | |
| | | 3,830 | | | | 2,137 | | | | | 5,102 | |
| | | 12,621 | | | | 12,769 | | | | | 14,556 | |
| | | 2,088 | | | | 2,093 | | | | | 2,089 | |
| | | 5,553 | | | | 3,174 | | | | | 4,461 | |
| | | 2,421 | | | | 2,500 | | | | | 2,911 | |
| | | 1,143 | | | | 1,181 | | | | | 1,144 | |
| | | 10,890 | | | | 5,171 | | | | | 6,840 | |
| | | 3,600 | | | | 522 | | | | | 9,283 | |
| | | 4,153 | | | | 3,241 | | | | | 4,169 | |
| | | 560,660 | | | | 230,157 | | | | | 1,107,569 | |
| | | (81,171 | ) | | | (66,048 | ) | | | | (83,158 | ) |
| | | — | | | | — | | | | | — | |
| | | 479,489 | | | | 164,109 | | | | | 1,024,411 | |
| | | 3,531,447 | | | | 561,918 | | | | | 3,478,337 | |
| | | | | | | | | | | | | |
| | | (2,796,949 | ) | | | (417,950 | ) | | | | (40,556 | ) |
| | | 4,709,068 | | | | (1,854,816 | ) | | | | 96,692,126 | |
| | | | | | | | | | | | | |
| | | — | | | | — | | | | | — | |
| | | 1,912,119 | | | | (2,272,766 | ) | | | | 96,651,570 | |
| | | (7,188,813 | ) | | | 3,623,420 | | | | | (5,303,342 | ) |
| | | — | | | | — | | | | | — | |
| | | (7,188,813 | ) | | | 3,623,420 | | | | | (5,303,342 | ) |
| | $ | (1,745,247 | ) | | $ | 1,912,572 | | | | $ | 94,826,565 | |
See Notes to Financial Statements
VANECK VECTORS ETF TRUST
STATEMENTS OF CHANGES IN NET ASSETS
| | | Biotech ETF | | | Environmental Services ETF | |
| | | | | | | | | | | | | | | | | | |
| | | For the Year
Ended
March 31,
2017 | | | For the Year
Ended
September 30,
2016 | | | For the Year
Ended
March 31,
2017 | | | For the Year
Ended
September 30,
2016 | |
| | | (unaudited) | | | | | | | (unaudited) | | | | | | |
| | | | | | | | | | | | | | | | |
| Operations: | | | | | | | | | | | | | | | | | |
| Net investment income | | $ | 1,764,310 | | | $ | 1,702,727 | | | $ | 81,798 | | | | $ | 157,460 | |
| Net realized gain (loss) | | | (2,848,820 | ) | | | 8,194,712 | | | | 955,500 | | | | | 1,075,833 | |
| Net change in unrealized appreciation (depreciation) | | | 23,707,380 | | | | (11,399,323 | ) | | | 1,147,457 | | | | | 1,814,655 | |
| Net increase (decrease) in net assets resulting from operations | | | 22,622,870 | | | | (1,501,884 | ) | | | 2,184,755 | | | | | 3,047,948 | |
| | | | | | | | | | | | | | | | | | |
| Dividends to shareholders: | | | | | | | | | | | | | | | | | |
| Dividends from net investment income | | | (1,715,607 | ) | | | (1,869,172 | ) | | | (132,750 | ) | | | | (170,000 | ) |
| | | | | | | | | | | | | | | | | | |
| Share transactions:** | | | | | | | | | | | | | | | | | |
| Proceeds from sale of shares | | | 134,937,615 | | | | 141,425,835 | | | | 3,831,698 | | | | | 3,356,139 | |
| Cost of shares redeemed | | | (75,909,766 | ) | | | (191,118,834 | ) | | | (3,865,394 | ) | | | | (3,406,498 | ) |
| Increase (Decrease) in net assets resulting from share transactions | | | 59,027,849 | | | | (49,692,999 | ) | | | (33,696 | ) | | | | (50,359 | ) |
| Total increase (decrease) in net assets | | | 79,935,112 | | | | (53,064,055 | ) | | | 2,018,309 | | | | | 2,827,589 | |
| Net Assets, beginning of period | | | 598,914,337 | | | | 651,978,392 | | | | 17,420,479 | | | | | 14,592,890 | |
| Net Assets, end of period† | | $ | 678,849,449 | | | $ | 598,914,337 | | | $ | 19,438,788 | | | | $ | 17,420,479 | |
| † Including undistributed (accumulated) net investment income (loss) | | $ | 1,153,538 | | | $ | 1,104,835 | | | $ | 68,970 | | | | $ | 119,922 | |
| | | | | | | | | | | | | | | | | | |
| ** Shares of Common Stock Issued (no par value) | | | | | | | | | | | | | | | | | |
| Shares sold | | | 1,200,000 | | | | 1,250,000 | | | | 50,000 | | | | | 50,000 | |
| Shares redeemed | | | (700,000 | ) | | | (1,750,000 | ) | | | (50,000 | ) | | | | (50,000 | ) |
| Net increase (decrease) | | | 500,000 | | | | (500,000 | ) | | | — | | | | | — | |
* Commencement of operations
See Notes to Financial Statements
| Gaming ETF | | | Generic Drugs ETF | | Pharmaceutical ETF | |
For the Year
Ended
March 31,
2017 | | | For the Year
Ended
September 30,
2016 | | For the Year
Ended
March 31,
2017 | | For the Period
January 12, 2016*
through
September 30,
2016 | | For the Year
Ended
March 31,
2017 | | | For the Year
Ended
September 30,
2016 |
| (unaudited) | | | | | | | | (unaudited) | | | | | | | (unaudited) | | | | | |
| | | | | | | | | | | | | | | | | | | | | | | | | | |
| $ | 303,754 | | | | $ | 588,473 | | | | $ | 3,867 | | | | $ | 6,737 | | | $ | 3,531,447 | | | $ | 5,886,451 | |
| | (659,971 | ) | | | | (3,609,513 | ) | | | | 40,085 | | | | | (41,959 | ) | | | 1,912,119 | | | | (8,539,825 | ) |
| | 1,821,236 | | | | | 7,968,522 | | | | | (74,839 | ) | | | | (50,648 | ) | | | (7,188,813 | ) | | | (22,231,883 | ) |
| | 1,465,019 | | | | | 4,947,482 | | | | | (30,887 | ) | | | | (85,870 | ) | | | (1,745,247 | ) | | | (24,885,257 | ) |
| | | | | | | | | | | | | | | | | | | | | | | | | | |
| | (586,300 | ) | | | | (909,300 | ) | | | | (19,400 | ) | | | | — | | | | (1,590,173 | ) | | | (6,437,588 | ) |
| | | | | | | | | | | | | | | | | | | | | | | | | | |
| | — | | | | | — | | | | | 4,333,287 | | | | | 2,521,970 | | | | 642,682,025 | | | | 335,719,958 | |
| | — | | | | | (8,016,264 | ) | | | | (2,238,525 | ) | | | | — | | | | (538,150,149 | ) | | | (386,756,125 | ) |
| | | | | | | | | | | | | | | | | | | | | | | | | | |
| | — | | | | | (8,016,264 | ) | | | | 2,094,762 | | | | | 2,521,970 | | | | 104,531,876 | | | | (51,036,167 | ) |
| | 878,719 | | | | | (3,978,082 | ) | | | | 2,044,475 | | | | | 2,436,100 | | | | 101,196,456 | | | | (82,359,012 | ) |
| | 19,881,080 | | | | | 23,859,162 | | | | | 2,436,100 | | | | | — | | | | 231,938,211 | | | | 314,297,223 | |
| $ | 20,759,799 | | | | $ | 19,881,080 | | | | $ | 4,480,575 | | | | $ | 2,436,100 | | | $ | 333,134,667 | | | $ | 231,938,211 | |
| $ | 239,831 | | | | $ | 522,377 | | | | $ | (9,275 | ) | | | $ | 6,258 | | | $ | 2,813,875 | | | $ | 872,601 | |
| | | | | | | | | | | | | | | | | | | | | | | | | | |
| | — | | | | | — | | | | | 200,000 | | | | | 100,000 | | | | 11,950,000 | | | | 5,400,000 | |
| | — | | | | | (250,000 | ) | | | | (100,000 | ) | | | | — | | | | (9,950,000 | ) | | | (6,350,000 | ) |
| | — | | | | | (250,000 | ) | | | | 100,000 | | | | | 100,000 | | | | 2,000,000 | | | | (950,000 | ) |
See Notes to Financial Statements
VANECK VECTORS ETF TRUST
STATEMENTS OF CHANGES IN NET ASSETS
(continued)
| | | Retail ETF | | | Semiconductor ETF | |
| | | For the Year
Ended
March 31,
2017 | | | For the Year
Ended
September 30,
2016 | | | For the Year
Ended
March 31,
2017 | | | For the Year
Ended
September 30,
2016 | |
| | | (unaudited) | | | | | | | (unaudited) | | | | | |
| | | | | | | | | | | | | | | |
| Operations: | | | | | | | | | | | | | | | | |
| Net investment income | | $ | 561,918 | | | $ | 1,825,711 | | | $ | 3,478,337 | | | $ | 4,266,314 | |
| Net realized gain (loss) | | | (2,272,766 | ) | | | 11,123,462 | | | | 96,651,570 | | | | 89,252,283 | |
| Net increase from payment from Adviser (See Note 3) | | | — | | | | — | | | | — | | | | 340,000 | |
| Net change in unrealized appreciation (depreciation) | | | 3,623,420 | | | | (2,141,071 | ) | | | (5,303,342 | ) | | | 21,502,117 | |
| Net increase in net assets resulting from operations | | | 1,912,572 | | | | 10,808,102 | | | | 94,826,565 | | | | 115,360,714 | |
| | | | | | | | | | | | | | | | | |
| Dividends to shareholders: | | | | | | | | | | | | | | | | |
| Dividends from net investment income | | | (1,772,514 | ) | | | (3,353,072 | ) | | | (4,764,060 | ) | | | (5,557,739 | ) |
| | | | | | | | | | | | | | | | | |
| Share transactions:** | | | | | | | | | | | | | | | | |
| Proceeds from sale of shares | | | 11,673,485 | | | | 107,980,044 | | | | 4,262,623,850 | | | | 6,483,334,545 | |
| Cost of shares redeemed | | | (53,786,671 | ) | | | (200,637,218 | ) | | | (4,214,785,402 | ) | | | (6,206,930,426 | ) |
| Increase (Decrease) in net assets resulting from share transactions | | | (42,113,186 | ) | | | (92,657,174 | ) | | | 47,838,448 | | | | 276,404,119 | |
| Total increase (decrease) in net assets | | | (41,973,128 | ) | | | (85,202,144 | ) | | | 137,900,953 | | | | 386,207,094 | |
| Net Assets, beginning of period | | | 118,706,388 | | | | 203,908,532 | | | | 577,130,240 | | | | 190,923,146 | |
| Net Assets, end of period† | | $ | 76,733,260 | | | $ | 118,706,388 | | | $ | 715,031,193 | | | $ | 577,130,240 | |
| † Including undistributed net investment income | | $ | 235,308 | | | $ | 1,445,904 | | | $ | 1,700,769 | | | $ | 2,986,492 | |
| | | | | | | | | | | | | | | | | |
| ** Shares of Common Stock Issued (no par value) | | | | | | | | | | | | | | | | |
| Shares sold | | | 150,000 | | | | 1,400,000 | | | | 59,450,000 | | | | 114,550,000 | |
| Shares redeemed | | | (700,000 | ) | | | (2,650,000 | ) | | | (58,800,000 | ) | | | (110,050,000 | ) |
| Net increase (decrease) | | | (550,000 | ) | | | (1,250,000 | ) | | | 650,000 | | | | 4,500,000 | |
See Notes to Financial Statements
VANECK VECTORS ETF TRUST
FINANCIAL HIGHLIGHTS
For a share outstanding throughout each period:
| | | Biotech ETF # |
| | | For the | | | | | | | | | | | | | | | | | | For the Period |
| | | Six Months | | | | | | | | | | | | | | | | | | December 20, |
| | | Ended | | | | | | | | | | | | | | | | | | 2011 (a) through |
| | | March 31, | | | For the Year Ended September 30, | | | September 30, |
| | | 2017 | | | 2016 | | | | 2015 | | | | 2014 | | | | 2013 | | | 2012 |
| | | (unaudited) | | | | | | | | | | | | | | | | | | | | |
| Net asset value, beginning of period | | | $ | 115.25 | | | | $ | 114.45 | | | | $ | 105.84 | | | | $ | 82.74 | | | | $ | 54.07 | | | | $ | 35.28 | |
| Income from investment operations: | | | | | | | | | | | | | | | | | | | | | | | | | | | | | | |
| Net investment income (loss) | | | | 0.32 | | | | | 0.33 | | | | | 0.24 | | | | | (0.03 | ) | | | | 0.01 | | | | | 0.01 | |
| Net realized and unrealized gain on investments | | | | 3.93 | | | | | 0.81 | | | | | 8.37 | | | | | 23.13 | | | | | 28.85 | | | | | 18.78 | |
| Total from investment operations | | | | 4.25 | | | | | 1.14 | | | | | 8.61 | | | | | 23.10 | | | | | 28.86 | | | | | 18.79 | |
| Less: | | | | | | | | | | | | | | | | | | | | | | | | | | | | | | |
| Dividends from net investment income | | | | (0.33 | ) | | | | (0.34 | ) | | | | — | | | | | — | (f) | | | | (0.02 | ) | | | | — | |
| Distributions from net realized capital gains | | | | — | | | | | — | | | | | — | | | | | — | | | | | (0.17 | ) | | | | — | |
| Total dividends and distributions | | | | (0.33 | ) | | | | (0.34 | ) | | | | — | | | | | — | | | | | (0.19 | ) | | | | — | |
| Net asset value, end of period | | | $ | 119.17 | | | | $ | 115.25 | | | | $ | 114.45 | | | | $ | 105.84 | | | | $ | 82.74 | | | | $ | 54.07 | |
| Total return (b) | | | | 3.71 | %(c) | | | | 0.97 | % | | | | 8.13 | % | | | | 27.92 | % | | | | 53.55 | % | | | | 53.26 | %(c) |
| Ratios/Supplemental Data | | | | | | | | | | | | | | | | | | | | | | | | | | | | | | |
| Net assets, end of period (000’s) | | $678,849 | | | $598,914 | | | $651,978 | | | $539,423 | | | $434,089 | | | $132,278 | |
| Ratio of gross expenses to average net assets | | | | 0.40 | %(d) | | | | 0.40 | % | | | | 0.40 | % | | | | 0.41 | % | | | | 0.41 | % | | | | 0.44 | %(d) |
| Ratio of net expenses to average net assets | | | | 0.35 | %(d) | | | | 0.35 | % | | | | 0.35 | % | | | | 0.35 | % | | | | 0.35 | % | | | | 0.35 | %(d) |
| Ratio of net expenses, excluding interest expense, to average net assets | | | | 0.35 | %(d) | | | | 0.35 | % | | | | 0.35 | % | | | | 0.35 | % | | | | 0.35 | % | | | | 0.35 | %(d) |
| Ratio of net investment income (loss) to average net assets | | | | 0.58 | %(d) | | | | 0.29 | % | | | | 0.18 | % | | | | (0.03 | )% | | | | 0.01 | % | | | | 0.03 | %(d) |
| Portfolio turnover rate (e) | | | | 13 | %(c) | | | | 41 | % | | | | 12 | % | | | | 11 | % | | | | 0 | % | | | | 12 | %(c) |
| | | Environmental Services ETF |
| | | For the | | | | | | | | | | | | | | | | | | For the Period |
| | | Six Months | | | | | | | | | | | | | | | | | | January 1, |
| | | Ended | | | | | | | | | | | | | | | | | | 2011 (a) through |
| | | March 31, | | | For the Year Ended September 30, | | | September 30, |
| | | 2017 | | | 2016 | | | | 2015 | | | | 2014 | | | | 2013 | | | 2012 |
| | | (unaudited) | | | | | | | | | | | | | | | | | | | | |
| Net asset value, beginning of period | | | $ | 69.68 | | | | $ | 58.37 | | | | $ | 64.57 | | | | $ | 62.43 | | | | $ | 49.65 | | | | $ | 46.61 | |
| Income from investment operations: | | | | | | | | | | | | | | | | | | | | | | | | | | | | | | |
| Net investment income | | | | 0.33 | | | | | 0.63 | | | | | 0.73 | | | | | 1.00 | | | | | 0.91 | | | | | 0.50 | |
| Net realized and unrealized gain (loss) on investments | | | | 8.28 | | | | | 11.36 | | | | | (5.88 | ) | | | | 1.89 | | | | | 12.66 | | | | | 2.54 | |
| Total from investment operations | | | | 8.61 | | | | | 11.99 | | | | | (5.15 | ) | | | | 2.89 | | | | | 13.57 | | | | | 3.04 | |
| Less: | | | | | | | | | | | | | | | | | | | | | | | | | | | | | | |
| Dividends from net investment income | | | | (0.53 | ) | | | | (0.68 | ) | | | | (1.05 | ) | | | | (0.75 | ) | | | | (0.79 | ) | | | | — | |
| Net asset value, end of period | | | $ | 77.76 | | | | $ | 69.68 | | | | $ | 58.37 | | | | $ | 64.57 | | | | $ | 62.43 | | | | $ | 49.65 | |
| Total return (b) | | | | 12.37 | %(c) | | | | 20.75 | % | | | | (8.18 | )% | | | | 4.62 | % | | | | 27.67 | % | | | | 6.52 | %(c) |
| Ratios/Supplemental Data | | | | | | | | | | | | | | | | | | | | | | | | | | | | | | |
| Net assets, end of period (000’s) | | $19,439 | | | $17,420 | | | $14,593 | | | $16,142 | | | $18,729 | | | $19,860 | |
| Ratio of gross expenses to average net assets | | | | 0.94 | %(d) | | | | 0.93 | % | | | | 1.15 | % | | | | 0.92 | % | | | | 1.01 | % | | | | 1.01 | %(d) |
| Ratio of net expenses to average net assets | | | | 0.55 | %(d) | | | | 0.55 | % | | | | 0.55 | % | | | | 0.55 | % | | | | 0.55 | % | | | | 0.55 | %(d) |
| Ratio of net expenses, excluding interest expense, to average net assets | | | | 0.55 | %(d) | | | | 0.55 | % | | | | 0.55 | % | | | | 0.55 | % | | | | 0.55 | % | | | | 0.55 | %(d) |
| Ratio of net investment income to average net assets | | | | 0.88 | %(d) | | | | 1.00 | % | | | | 1.15 | % | | | | 1.32 | % | | | | 1.60 | % | | | | 1.23 | %(d) |
| Portfolio turnover rate (e) | | | | 13 | %(c) | | | | 40 | % | | | | 19 | % | | | | 13 | % | | | | 5 | % | | | | 4 | %(c) |
| (a) | Commencement of operations |
| (b) | Total return is calculated assuming an initial investment made at the net asset value at the beginning of period, reinvestment of any dividends and distributions at net asset value on the dividend/distributions payment date and a redemption at the net asset value on the last day of the period. The return does not reflect the deduction of taxes that a shareholder would pay on Fund dividends/distributions or the redemption of Fund shares. |
| (c) | Not Annualized |
| (d) | Annualized |
| (e) | Portfolio turnover rates exclude securities received or delivered as a result of processing in-kind capital share transactions. |
| (f) | Amount represents less than $0.005 per share |
| # | On February 14, 2012, the Fund effected a 3 for 1 share split (See Note 10). Per share data has been adjusted to reflect the share split. |
See Notes to Financial Statements
VANECK VECTORS ETF TRUST
FINANCIAL HIGHLIGHTS
For a share outstanding throughout each period:
| | | Gaming ETF |
| | | For the | | | | | | | | | | | | | | | | | | For the Period |
| | | Six Months | | | | | | | | | | | | | | | | | | January 1, |
| | | Ended | | | | | | | | | | | | | | | | | | 2012 through |
| | | March 31, | | | For the Year Ended September 30, | | | September 30, |
| | | 2017 | | | 2016 | | | | 2015 | | | | 2014 | | | | 2013 | | | 2012 |
| | | (unaudited) | | | | | | | | | | | | | | | | | | | | |
| Net asset value, beginning of period | | | $ | 36.15 | | | | $ | 29.82 | | | | $ | 43.38 | | | | $ | 47.49 | | | | $ | 34.22 | | | | $ | 30.23 | |
| Income from investment operations: | | | | | | | | | | | | | | | | | | | | | | | | | | | | | | |
| Net investment income | | | | 0.55 | | | | | 0.94 | (f) | | | | 1.12 | (f) | | | | 1.76 | | | | | 1.10 | | | | | 0.80 | |
| Net realized and unrealized gain (loss) on investments | | | | 2.12 | | | | | 6.69 | | | | | (12.80 | ) | | | | (5.35 | ) | | | | 13.55 | | | | | 3.19 | |
| Total from investment operations | | | | 2.67 | | | | | 7.63 | | | | | (11.68 | ) | | | | (3.59 | ) | | | | 14.65 | | | | | 3.99 | |
| Less: | | | | | | | | | | | | | | | | | | | | | | | | | | | | | | |
| Dividends from net investment income | | | | (1.07 | ) | | | | (1.30 | ) | | | | (1.88 | ) | | | | (0.52 | ) | | | | (1.38 | ) | | | | — | |
| Net asset value, end of period | | | $ | 37.75 | | | | $ | 36.15 | | | | $ | 29.82 | | | | $ | 43.38 | | | | $ | 47.49 | | | | $ | 34.22 | |
| Total return (b) | | | | 7.71 | %(c) | | | | 26.23 | % | | | | (27.91 | )% | | | | (7.76 | )% | | | | 44.14 | % | | | | 13.20 | %(c) |
| Ratios/Supplemental Data | | | | | | | | | | | | | | | | | | | | | | | | | | | | | | |
| Net assets, end of period (000’s) | | $20,760 | | | $19,881 | | | $23,859 | | | $43,384 | | | $56,982 | | | $59,894 | |
| Ratio of gross expenses to average net assets | | | | 1.03 | %(d) | | | | 0.93 | % | | | | 1.00 | % | | | | 0.73 | % | | | | 0.83 | % | | | | 0.78 | %(d) |
| Ratio of net expenses to average net assets | | | | 0.66 | %(d) | | | | 0.67 | % | | | | 0.66 | % | | | | 0.65 | % | | | | 0.65 | % | | | | 0.66 | %(d) |
| Ratio of net expenses, excluding interest expense, to average net assets | | | | 0.65 | %(d) | | | | 0.65 | % | | | | 0.65 | % | | | | 0.65 | % | | | | 0.65 | % | | | | 0.65 | %(d) |
| Ratio of net investment income to average net assets | | | | 3.12 | %(d) | | | | 2.88 | % | | | | 2.92 | % | | | | 2.73 | % | | | | 2.73 | % | | | | 2.29 | %(d) |
| Portfolio turnover rate (e) | | | | 9 | %(c) | | | | 29 | % | | | | 27 | % | | | | 35 | % | | | | 16 | % | | | | 18 | %(c) |
| | | | | | | Generic Drugs ETF | | | | | | | | | | | | | | | | |
| | | | | | | | | For the Period | | | | | | | | | | | | | | | | |
| | | | | | | For the Six | | January 12, | | | | | | | | | | | | | | | | |
| | | | | | | Months | | 2016 (a) | | | | | | | | | | | | | | | | |
| | | | | | | Ended | | through | | | | | | | | | | | | | | | | |
| | | | | | | March 31, | | September 30, | | | | | | | | | | | | | | | | |
| | | | | | | 2017 | | 2016 | | | | | | | | | | | | | | | | |
| | | | | | | (unaudited) | | | | | | | | | | | | | | | | | | | | |
| Net asset value, beginning of period | | | | | | | | $24.36 | | | | | $25.21 | | | | | | | | | | | | | | | | | |
| Income from investment operations: | | | | | | | | | | | | | | | | | | | | | | | | | | | | | | |
| Net investment income (loss) | | | | | | | | 0.02 | (f) | | | | 0.07 | | | | | | | | | | | | | | | | | |
| Net realized and unrealized loss on investments | | | | | | | | (1.88 | ) | | | | (0.92 | ) | | | | | | | | | | | | | | | | |
| Total from investment operations | | | | | | | | (1.86 | ) | | | | (0.85 | ) | | | | | | | | | | | | | | | | |
| Less: | | | | | | | | | | | | | | | | | | | | | | | | | | | | | | |
| Dividends from net investment income | | | | | | | | (0.10 | ) | | | | — | | | | | | | | | | | | | | | | | |
| Net asset value, end of period | | | | | | | | $22.40 | | | | | $24.36 | | | | | | | | | | | | | | | | | |
| Total return (b) | | | | | | | | (7.62 | )%(c) | | | | (3.37 | )%(c) | | | | | | | | | | | | | | | | |
| Ratios/Supplemental Data | | | | | | | | | | | | | | | | | | | | | | | | | | | | | | |
| Net assets, end of period (000’s) | | | | | | $4,481 | | | $2,436 | | | | | | | | | | | | | | | | | |
| Ratio of gross expenses to average net assets | | | | | | | | 2.50 | %(d) | | | | 5.70 | %(d) | | | | | | | | | | | | | | | | |
| Ratio of net expenses to average net assets | | | | | | | | 0.58 | %(d) | | | | 0.55 | %(d) | | | | | | | | | | | | | | | | |
| Ratio of net expenses, excluding interest expense, to average net assets | | | | | | | | 0.55 | %(d) | | | | 0.55 | %(d) | | | | | | | | | | | | | | | | |
| Ratio of net investment income to average net assets | | | | | | | | 0.18 | %(d) | | | | 0.39 | %(d) | | | | | | | | | | | | | | | | |
| Portfolio turnover rate (e) | | | | | | | | 48 | %(c) | | | | 47 | %(c) | | | | | | | | | | | | | | | | |
| (a) | Commencement of operations |
| (b) | Total return is calculated assuming an initial investment made at the net asset value at the beginning of period, reinvestment of any dividends and distributions at net asset value on the dividend/distributions payment date and a redemption at the net asset value on the last day of the period. The return does not reflect the deduction of taxes that a shareholder would pay on Fund dividends/distributions or the redemption of Fund shares. |
| (c) | Not Annualized |
| (d) | Annualized |
| (e) | Portfolio turnover rates exclude securities received or delivered as a result of processing in-kind capital share transactions. |
| (f) | Calculated based upon average shares outstanding |
See Notes to Financial Statements
VANECK VECTORS ETF TRUST
FINANCIAL HIGHLIGHTS
For a share outstanding throughout each period:
| | | Pharmaceutical ETF # |
| | | For the | | | | | | | | | | | | | | | | | | For the Period |
| | | Six Months | | | | | | | | | | | | | | | | | | December 20, |
| | | Ended | | | | | | | | | | | | | | | | | | 2011 (a) through |
| | | March 31, | | | For the Year Ended September 30, | | | September 30, |
| | | 2017 | | | 2016 | | | | 2015 | | | | 2014 | | | | 2013 | | | 2012 |
| | | (unaudited) | | | | | | | | | | | | | | | | | | | | |
| Net asset value, beginning of period | | | $ | 57.44 | | | | $ | 63.01 | | | | $ | 63.54 | | | | $ | 47.89 | | | | $ | 41.03 | | | | $ | 35.96 | |
| Income from investment operations: | | | | | | | | | | | | | | | | | | | | | | | | | | | | | | |
| Net investment income | | | | 0.61 | | | | | 1.24 | (b) | | | | 1.31 | | | | | 1.02 | | | | | 1.08 | | | | | 1.12 | |
| Net realized and unrealized gain (loss) on investments | | | | (2.52 | ) | | | | (5.41 | ) | | | | (0.62 | ) | | | | 15.66 | | | | | 7.78 | | | | | 3.95 | |
| Total from investment operations | | | | (1.91 | ) | | | | (4.17 | ) | | | | 0.69 | | | | | 16.68 | | | | | 8.86 | | | | | 5.07 | |
| Less: | | | | | | | | | | | | | | | | | | | | | | | | | | | | | | |
| Dividends from net investment income | | | | (0.36 | ) | | | | (1.40 | ) | | | | (1.22 | ) | | | | (1.03 | ) | | | | (2.00 | ) | | | | — | |
| Net asset value, end of period | | | $ | 55.17 | | | | $ | 57.44 | | | | $ | 63.01 | | | | $ | 63.54 | | | | $ | 47.89 | | | | $ | 41.03 | |
| Total return (c) | | | | (3.33 | )%(d) | | | | (6.72 | )% | | | | 0.96 | % | | | | 35.19 | % | | | | 22.44 | % | | | | 14.10 | %(d) |
| Ratios/Supplemental Data | | | | | | | | | | | | | | | | | | | | | | | | | | | | | | |
| Net assets, end of period (000’s) | | $333,135 | | | $231,938 | | | $314,297 | | | $405,888 | | | $241,267 | | | $173,897 | |
| Ratio of gross expenses to average net assets | | | | 0.41 | %(e) | | | | 0.41 | % | | | | 0.41 | % | | | | 0.42 | % | | | | 0.43 | % | | | | 0.41 | %(e) |
| Ratio of net expenses to average net assets | | | | 0.35 | %(e) | | | | 0.35 | % | | | | 0.36 | % | | | | 0.35 | % | | | | 0.35 | % | | | | 0.35 | %(e) |
| Ratio of net expenses, excluding interest expense, to average net assets | | | | 0.35 | %(e) | | | | 0.35 | % | | | | 0.35 | % | | | | 0.35 | % | | | | 0.35 | % | | | | 0.35 | %(e) |
| Ratio of net investment income to average net assets | | | | 2.59 | %(e) | | | | 2.04 | % | | | | 1.78 | % | | | | 1.85 | % | | | | 2.30 | % | | | | 2.74 | %(e) |
| Portfolio turnover rate (f) | | | | 25 | %(d) | | | | 25 | % | | | | 12 | % | | | | 14 | % | | | | 3 | % | | | | 1 | %(d) |
| | | Retail ETF * |
| | | For the | | | | | | | | | | | | | | | | | | For the Period |
| | | Six Months | | | | | | | | | | | | | | | | | | December 20, |
| | | Ended | | | | | | | | | | | | | | | | | | 2011 (a) through |
| | | March 31, | | | For the Year Ended September 30, | | | September 30, |
| | | 2017 | | | 2016 | | | | 2015 | | | | 2014 | | | | 2013 | | | 2012 |
| | | (unaudited) | | | | | | | | | | | | | | | | | | | | |
| Net asset value, beginning of period | | | $ | 78.02 | | | | $ | 73.57 | | | | $ | 62.27 | | | | $ | 55.34 | | | | $ | 44.88 | | | | $ | 37.32 | |
| Income from investment operations: | | | | | | | | | | | | | | | | | | | | | | | | | | | | | | |
| Net investment income | | | | 0.69 | | | | | 0.93 | (b) | | | | 1.12 | (b) | | | | 0.60 | | | | | 0.27 | | | | | 0.95 | |
| Net realized and unrealized gain on investments | | | | 1.66 | | | | | 5.27 | | | | | 10.47 | | | | | 6.94 | | | | | 11.04 | | | | | 6.63 | |
| Total from investment operations | | | | 2.35 | | | | | 6.20 | | | | | 11.59 | | | | | 7.54 | | | | | 11.31 | | | | | 7.58 | |
| Less: | | | | | | | | | | | | | | | | | | | | | | | | | | | | | | |
| Dividends from net investment income | | | | (1.39 | ) | | | | (1.75 | ) | | | | (0.29 | ) | | | | (0.61 | ) | | | | (0.85 | ) | | | | (0.02 | ) |
| Net asset value, end of period | | | $ | 78.98 | | | | $ | 78.02 | | | | $ | 73.57 | | | | $ | 62.27 | | | | $ | 55.34 | | | | $ | 44.88 | |
| Total return (c) | | | | 3.07 | %(d) | | | | 8.42 | % | | | | 18.63 | % | | | | 13.65 | % | | | | 25.69 | % | | | | 20.32 | %(d) |
| Ratios/Supplemental Data | | | | | | | | | | | | | | | | | | | | | | | | | | | | | | |
| Net assets, end of period (000’s) | | $76,733 | | | $118,706 | | | $203,909 | | | $66,724 | | | $42,696 | | | $21,163 | |
| Ratio of gross expenses to average net assets | | | | 0.49 | %(e) | | | | 0.43 | % | | | | 0.42 | % | | | | 0.63 | % | | | | 0.69 | % | | | | 0.55 | %(e) |
| Ratio of net expenses to average net assets | | | | 0.35 | %(e) | | | | 0.35 | % | | | | 0.35 | % | | | | 0.35 | % | | | | 0.35 | % | | | | 0.35 | %(e) |
| Ratio of net expenses, excluding interest expense, to average net assets | | | | 0.35 | %(e) | | | | 0.35 | % | | | | 0.35 | % | | | | 0.35 | % | | | | 0.35 | % | | | | 0.35 | %(e) |
| Ratio of net investment income to average net assets | | | | 1.21 | %(e) | | | | 1.22 | % | | | | 1.49 | % | | | | 1.23 | % | | | | 1.84 | % | | | | 1.40 | %(e) |
| Portfolio turnover rate (f) | | | | 5 | %(d) | | | | 9 | % | | | | 5 | % | | | | 3 | % | | | | 3 | % | | | | 2 | %(d) |
| (a) | Commencement of operations |
| (b) | Calculated based upon average shares outstanding |
| (c) | Total return is calculated assuming an initial investment made at the net asset value at the beginning of period, reinvestment of any dividends and distributions at net asset value on the dividend/distributions payment date and a redemption at the net asset value on the last day of the period. The return does not reflect the deduction of taxes that a shareholder would pay on Fund dividends/distributions or the redemption of Fund shares. |
| (d) | Not Annualized |
| (e) | Annualized |
| (f) | Portfolio turnover rates exclude securities received or delivered as a result of processing in-kind capital share transactions. |
| # | On February 14, 2012, the Fund effected a 2 for 1 share split (See Note 10). Per share data has been adjusted to reflect the share split. |
| * | On February 14, 2012, the Fund effected a 3 for 1 share split (See Note 10). Per share data has been adjusted to reflect the share split. |
See Notes to Financial Statements
VANECK VECTORS ETF TRUST
FINANCIAL HIGHLIGHTS
For a share outstanding throughout each period:
| | | Semiconductor ETF |
| | | For the | | | | | | | | | | | | | | | | | | For the Period |
| | | Six Months | | | | | | | | | | | | | | | | | | December 20, |
| | | Ended | | | | | | | | | | | | | | | | | | 2011 (a) through |
| | | March 31, | | | For the Year Ended September 30, | | | September 30, |
| | | 2017 | | | 2016 | | | | 2015 | | | | 2014 | | | | 2013 | | | 2012 |
| | | (unaudited) | | | | | | | | | | | | | | | | | | | | |
| Net asset value, beginning of period | | | $ | 69.36 | | | | $ | 49.97 | | | | $ | 51.10 | | | | $ | 39.88 | | | | $ | 31.66 | | | | $ | 29.95 | |
| Income from investment operations: | | | | | | | | | | | | | | | | | | | | | | | | | | | | | | |
| Net investment income | | | | 0.41 | | | | | 0.82 | (b) | | | | 1.08 | (b) | | | | 0.62 | | | | | 0.72 | | | | | 0.56 | |
| Net realized and unrealized gain (loss) on investments | | | | 10.52 | | | | | 19.67 | | | | | (1.58 | ) | | | | 11.26 | | | | | 8.20 | | | | | 1.15 | |
| Payment from Adviser | | | | — | | | | | 0.04 | (g) | | | | — | | | | | — | | | | | — | | | | | — | |
| Total from investment operations | | | | 10.93 | | | | | 20.53 | | | | | (0.50 | ) | | | | 11.88 | | | | | 8.92 | | | | | 1.71 | |
| Less: | | | | | | | | | | | | | | | | | | | | | | | | | | | | | | |
| Dividends from net investment income | | | | (0.58 | ) | | | | (1.14 | ) | | | | (0.63 | ) | | | | (0.66 | ) | | | | (0.70 | ) | | | | — | |
| Net asset value, end of period | | | $ | 79.71 | | | | $ | 69.36 | | | | $ | 49.97 | | | | $ | 51.10 | | | | $ | 39.88 | | | | $ | 31.66 | |
| Total return (c) | | | | 15.83 | %(d) | | | | 41.73 | %(g) | | | | (1.09 | )% | | | | 30.13 | % | | | | 28.70 | % | | | | 5.71 | %(d) |
| Ratios/Supplemental Data | | | | | | | | | | | | | | | | | | | | | | | | | | | | | | |
| Net assets, end of period (000’s) | | $715,031 | | | $577,130 | | | $190,923 | | | $414,959 | | | $262,017 | | | $282,397 | |
| Ratio of gross expenses to average net assets | | | | 0.38 | %(e) | | | | 0.41 | % | | | | 0.41 | % | | | | 0.41 | % | | | | 0.43 | % | | | | 0.40 | %(e) |
| Ratio of net expenses to average net assets | | | | 0.35 | %(e) | | | | 0.36 | % | | | | 0.35 | % | | | | 0.35 | % | | | | 0.35 | % | | | | 0.35 | %(e) |
| Ratio of net expenses, excluding interest expense, to average net assets | | | | 0.35 | %(e) | | | | 0.35 | % | | | | 0.35 | % | | | | 0.35 | % | | | | 0.35 | % | | | | 0.35 | %(e) |
| Ratio of net investment income to average net assets | | | | 1.20 | %(e) | | | | 1.45 | % | | | | 2.01 | % | | | | 1.68 | % | | | | 1.81 | % | | | | 1.87 | %(e) |
| Portfolio turnover rate (f) | | | | 13 | %(d) | | | | 53 | % | | | | 18 | % | | | | 9 | % | | | | 4 | % | | | | 2 | %(d) |
| (a) | Commencement of operations |
| (b) | Calculated based upon average shares outstanding |
| (c) | Total return is calculated assuming an initial investment made at the net asset value at the beginning of period, reinvestment of any dividends and distributions at net asset value on the dividend/distributions payment date and a redemption at the net asset value on the last day of the period. The return does not reflect the deduction of taxes that a shareholder would pay on Fund dividends/distributions or the redemption of Fund shares. |
| (d) | Not Annualized |
| (e) | Annualized |
| (f) | Portfolio turnover rates exclude securities received or delivered as a result of processing in-kind capital share transactions. |
| (g) | For the year ended September 30, 2016, 0.06% of total return, representing $0.04 per share, consisted of a payment by the Adviser (See Note 3). |
See Notes to Financial Statements
VANECK VECTORS ETF TRUST
NOTES TO FINANCIAL STATEMENTS
March 31, 2017 (unaudited)
Note 1—Fund Organization—VanEck Vectors ETF Trust (the “Trust”) is registered under the Investment Company Act of 1940, as amended, as an open-end management investment company. The Trust was incorporated in Delaware as a statutory trust on March 15, 2001. The Trust operates as a series fund, and as of March 31, 2017, offers fifty-nine investment portfolios, each of which represents a separate series of the Trust.
These financial statements relate only to the following investment portfolios: Biotech ETF, Environmental Services ETF, Gaming ETF, Generic Drugs ETF, Pharmaceutical ETF, Retail ETF and Semiconductor ETF (each a “Fund” and, together, the “Funds”). Each Fund was created to provide investors with the opportunity to purchase a security representing a proportionate undivided interest in a portfolio of securities consisting of substantially all of the common stocks in substantially the same weighting, in an index published by Indxx LLC, NYSE Euronext or MV Index Solutions GmbH (“MVIS”), a wholly owned subsidiary of Van Eck Associates Corporation (the “Adviser”).
The Funds’ commencement of operations dates and their respective indices are presented below:
| Fund | Commencement
of Operations | Index |
| Biotech ETF | December 20, 2011 | MVISTM US Listed Biotech 25 Index* |
| Environmental Services ETF** | October 10, 2006 | NYSE Arca Environmental Services Index |
| Gaming ETF** | January 22, 2008 | MVISTM Global Gaming Index* |
| Generic Drugs ETF | January 12, 2016 | Indxx Global Generics & New Pharma Index |
| Pharmaceutical ETF | December 20, 2011 | MVISTM US Listed Pharmaceutical 25 Index* |
| Retail ETF | December 20, 2011 | MVISTM US Listed Retail 25 Index* |
| Semiconductor ETF | December 20, 2011 | MVISTM US Listed Semiconductor 25 Index* |
| * | | Published by MV Index Solutions GmbH |
| ** | | Effective January 1, 2012, the Fund changed its fiscal year end from December 31 to September 30. |
Note 2—Significant Accounting Policies—The preparation of financial statements in conformity with U.S. generally accepted accounting principles (“GAAP”) requires management to make estimates and assumptions that affect the reported amounts and disclosures in the financial statements. Actual results could differ from those estimates.
The Funds are investment companies and are following accounting and reporting requirements of Accounting Standards Codification (“ASC”) 946 Financial Services - Investment Companies.
The following is a summary of significant accounting policies followed by the Funds.
| A. | Security Valuation—The Funds value their investments in securities and other assets and liabilities at fair value daily. Fair value is the price that would be received to sell an asset or paid to transfer a liability in an orderly transaction between market participants on the measurement date. Securities traded on national exchanges or traded on the NASDAQ National Market System are valued at the last sales price as reported at the close of each business day. Securities traded on the NASDAQ Stock Market are valued at the NASDAQ official closing price. Over-the-counter securities not included in the NASDAQ National Market System and listed securities for which no sale was reported are valued at the mean of the bid and ask prices. To the extent these securities are actively traded they are categorized as Level 1 in the fair value hierarchy (described below). Certain foreign securities, whose values may be affected by market direction or events occurring before the Funds’ pricing time (4:00 p.m. Eastern Standard Time) but after the last close of the securities’ primary market, are fair valued using a pricing service and are categorized as Level 2 in the fair value hierarchy. The pricing service, using methods approved by the Board of Trustees, considers the correlation of the trading patterns of the foreign security to intraday trading in the U.S. markets, based on indices of domestic securities and other appropriate indicators such as prices of relevant ADR’s and futures contracts. The Funds may also fair value securities in other situations, such as, when a particular foreign market is closed but the Fund is open. Short-term obligations with more than sixty days remaining to maturity are valued at market value. Short-term obligations with sixty days or less to maturity are valued at amortized cost, which with accrued interest approximates fair value. Money market fund investments are valued at net asset value and are considered to be Level 1 in the fair value hierarchy. Securities for which quotations are not available are stated at fair value as determined by the Pricing Committee of the Adviser. The Pricing Committee provides oversight of the Funds’ valuation policies and procedures, which are approved by the Funds’ Board of Trustees. Among other things, these procedures allow the Funds to utilize independent pricing services, quotations from securities dealers, |
VANECK VECTORS ETF TRUST
NOTES TO FINANCIAL STATEMENTS
(unaudited) (continued)
and other market sources to determine fair value. The Pricing Committee convenes regularly to review the fair value of financial instruments for which market prices are not readily available. The Pricing Committee employs various methods for calibrating the valuation approaches utilized to determine fair value, including a regular review of key inputs and assumptions, transactional back-testing and disposition analysis.
Certain factors such as economic conditions, political events, market trends, the nature of and duration of any restrictions on disposition, trading in similar securities of the issuer or comparable issuers and other security specific information are used to determine the fair value of these securities. Depending on the relative significance of valuation inputs, these securities may be classified either as Level 2 or Level 3 in the fair value hierarchy. The price which the Funds may realize upon sale of an investment may differ materially from the value presented in the Schedules of Investments.
The Funds utilize various methods to measure the fair value of their investments on a recurring basis, which includes a hierarchy that prioritizes inputs to valuation methods used to measure fair value. The fair value hierarchy gives highest priority to unadjusted quoted prices in active markets for identical assets and liabilities (Level 1 measurements) and the lowest priority to unobservable inputs (Level 3 measurements). The inputs or methodologies used for valuing securities are not necessarily an indication of the risk associated with investing in those securities. The transfers between levels of the fair value hierarchy assume the financial instruments were transferred at the beginning of the reporting period. The three levels of the fair value hierarchy are described below:
Level 1 — Quoted prices in active markets for identical securities.
Level 2 — Significant observable inputs (including quoted prices for similar securities, interest rates, prepayment speeds, credit risk, etc.).
Level 3 — Significant unobservable inputs (including each Fund’s own assumptions in determining the fair value of investments).
A summary of the inputs, the levels used to value the Funds’ investments, and transfers between levels are located in the Schedules of Investments. Additionally, tables that reconcile the valuation of the Funds’ Level 3 investments and that present additional information about valuation methodologies and unobservable inputs, if applicable, are located in the Schedules of Investments.
| B. | Federal Income Taxes—It is each Fund’s policy to comply with the provisions of the Internal Revenue Code applicable to regulated investment companies and to distribute all of its taxable income to its shareholders. Therefore, no federal income tax provision is required. |
| | |
| C. | Dividends and Distributions to Shareholders—Dividends to shareholders from net investment income and distributions from net realized capital gains, if any, are declared and paid annually by each Fund (except for dividends from net investment income on Pharmaceutical ETF, which are declared and paid quarterly). Income dividends and capital gain distributions are determined in accordance with U.S. income tax regulations, which may differ from such amounts determined in accordance with GAAP. |
| | |
| D. | Currency Translation—Assets and liabilities denominated in foreign currencies and commitments under foreign currency contracts are translated into U.S. dollars at the closing prices of such currencies each business day. Purchases and sales of investments are translated at the exchange rates prevailing when such investments are acquired or sold. Foreign denominated income and expenses are translated at the exchange rates prevailing when accrued. The portion of realized and unrealized gains and losses on investments that result from fluctuations in foreign currency exchange rates is not separately disclosed in the financial statements. Recognized gains or losses attributable to foreign currency fluctuations on foreign currency denominated assets, other than investments, and liabilities are recorded as net realized gain (loss) on foreign currency transactions and foreign denominated assets and liabilities in the Statements of Operations. |
| | |
| E. | Restricted Securities—The Funds may invest in securities that are subject to legal or contractual restrictions on resale. These securities generally may be resold in transactions exempt from registration or to the public if the securities are registered. Disposal of these securities may involve time-consuming negotiations and expense, and prompt sale at an acceptable price may be difficult. Information regarding restricted securities, if any, is included at the end of each Fund’s Schedule of Investments. |
| F. | Repurchase Agreements—The Funds may enter into repurchase agreements with financial institutions, deemed to be creditworthy by the Adviser, to generate income from their excess cash balances and to invest securities lending cash collateral. A repurchase agreement is an agreement under which a Fund acquires securities from a seller, subject to resale to the seller at an agreed upon price and date. A Fund, through its custodian/securities lending agent, takes possession of securities collateralizing the repurchase agreement. Pursuant to the terms of the repurchase agreement, such securities must have an aggregate market value greater than or equal to the terms of the repurchase price plus accrued interest at all times. If the value of the underlying securities falls below the value of the repurchase price plus accrued interest, the Funds will require the seller to deposit additional collateral by the next business day. If the request for additional collateral is not met, or the seller defaults on its repurchase obligation, the Funds maintain their right to sell the underlying securities at market value and may claim any resulting loss against the seller. Repurchase agreements held as of March 31, 2017 are reflected in the Schedules of Investments. |
| | |
| G. | Use of Derivative Instruments—The Funds may invest in derivative instruments, including, but not limited to, options, futures, swaps and other derivatives relating to foreign currency transactions. A derivative is an instrument whose value is derived from underlying assets, indices, reference rates or a combination of these factors. Derivative instruments may be privately negotiated contracts (often referred to as over-the-counter (“OTC”) derivatives) or they may be listed and traded on an exchange. Derivative contracts may involve future commitments to purchase or sell financial instruments at specified terms on a specified date, or to exchange interest payment streams or currencies based on a notional or contractual amount. Derivative instruments may involve a high degree of financial risk. The use of derivative instruments also involves the risk of loss if the Adviser is incorrect in its expectation of the timing or level of fluctuations in securities prices, interest rates or currency prices. Investments in derivative instruments also include the risk of default by the counterparty, the risk that the investment may not be liquid and the risk that a small movement in the price of the underlying security or benchmark may result in a disproportionately large movement, unfavorable or favorable, in the price of the derivative instruments. The Funds held no derivative instruments during the period ended March 31, 2017. |
| | |
| H. | Offsetting Assets and Liabilities—In the ordinary course of business, the Funds enter into transactions subject to enforceable master netting or other similar agreements. Generally, the right of setoff in those agreements allows the Funds to set off any exposure to a specific counterparty with any collateral received or delivered to that counterparty based on the terms of the agreements. The Funds may pledge or receive cash and/or securities as collateral for derivative instruments, securities lending and repurchase agreements. For financial reporting purposes, the Funds present securities lending and repurchase agreement assets and liabilities on a gross basis in the Statements of Assets and Liabilities. Collateral held at March 31, 2017 is presented in the Schedules of Investments. Refer to related disclosures in Note 2F (Repurchase Agreements) and Note 9 (Securities Lending). |
| | |
| I. | Other—Security transactions are accounted for on trade date. Transactions in certain securities may take longer than the customary settlement cycle to be completed. The counterparty is required to collateralize such trades with cash in excess of the market value of the transaction, which is held at the custodian and marked to market daily. Realized gains and losses are calculated on the identified cost basis. Dividend income is recorded on the ex-dividend date except that certain dividends from foreign securities are recognized upon notification of the ex-dividend date/rate. Interest income, including amortization of premiums and discounts, is accrued as earned. |
| | |
| | In the normal course of business, the Funds enter into contracts that contain a variety of general indemnifications. The Funds’ maximum exposure under these agreements is unknown as this would involve future claims that may be made against the Funds that have not yet occurred. However, the Adviser believes the risk of loss under these arrangements to be remote. |
Note 3—Investment Management and Other Agreements—The Adviser is the investment adviser to the Funds. The Adviser receives a management fee, calculated daily and payable monthly based on an annual rate of each Fund’s average daily net assets. The Adviser has agreed, until at least February 1, 2018, to voluntarily waive management fees and assume expenses to prevent each Fund’s total annual operating expenses (excluding acquired fund fees and expenses, interest expense, trading expenses, taxes and extraordinary expenses) from exceeding the expense limitations listed in the table below.
VANECK VECTORS ETF TRUST
NOTES TO FINANCIAL STATEMENTS
(unaudited) (continued)
The current expense limitations, management fee rates and the amounts waived/assumed by the Adviser for the period ended March 31, 2017, are as follows:
| Fund | | Expense
Limitations | | Management
Fee Rates | | Waiver of
Management Fees | | Expenses Assumed
by the Adviser |
| Biotech ETF | | | 0.35 | % | | | 0.35 | % | | $ | 144,893 | | | $ | — | |
| Environmental Services ETF | | | 0.55 | | | | 0.50 | | | | 36,223 | | | | — | |
| Gaming ETF | | | 0.65 | | | | 0.50 | | | | 36,524 | | | | — | |
| Generic Drugs ETF | | | 0.55 | | | | 0.50 | | | | 10,901 | | | | 30,974 | |
| Pharmaceutical ETF | | | 0.35 | | | | 0.35 | | | | 81,171 | | | | — | |
| Retail ETF | | | 0.35 | | | | 0.35 | | | | 66,048 | | | | — | |
| Semiconductor ETF | | | 0.35 | | | | 0.35 | | | | 83,158 | | | | — | |
During the year ended September 30, 2016, the Adviser voluntarily reimbursed the Semiconductor ETF $340,000 for transactional losses. This reimbursement is reflected in the Statements of Changes in Net Assets as a net increase from payment from Adviser. The per share and total return impact to the Fund is reflected in the Financial Highlights.
In addition, Van Eck Securities Corporation, an affiliate of the Adviser, acts as the Funds’ distributor (the “Distributor”). Certain officers and a Trustee of the Trust are officers, directors or stockholders of the Adviser and Distributor.
Note 4—Investments—For the period ended March 31, 2017, the cost of purchases and proceeds from sales of investments other than U.S. government obligations and short-term obligations (excluding in-kind transactions described in Note 6) were as follows:
| Fund | | Cost of Investments
Purchased | | Proceeds from
Investments Sold |
| Biotech ETF | | $ | 81,001,445 | | | $ | 80,035,302 | |
| Environmental Services ETF | | | 2,333,169 | | | | 3,728,939 | |
| Gaming ETF | | | 1,758,213 | | | | 2,031,746 | |
| Generic Drugs ETF | | | 2,648,328 | | | | 2,002,695 | |
| Pharmaceutical ETF | | | 68,553,862 | | | | 67,915,698 | |
| Retail ETF | | | 4,840,947 | | | | 6,116,972 | |
| Semiconductor ETF | | | 74,965,947 | | | | 77,051,886 | |
Note 5—Income Taxes—As of March 31, 2017, for Federal income tax purposes, the identified cost of investments owned, net unrealized appreciation (depreciation), gross unrealized appreciation, and gross unrealized depreciation of investments were as follows:
| Fund | | Cost of Investments | | Gross Unrealized
Appreciation | | Gross Unrealized
Depreciation | | | Net Unrealized
Appreciation
(Depreciation) | |
| Biotech ETF | | $ | 771,078,061 | | | $ | 26,485,248 | | | $ | (84,523,004 | ) | | $ | (58,037,756 | ) |
| Environmental Services ETF | | | 17,168,798 | | | | 3,114,615 | | | | (122,079 | ) | | | 2,992,536 | |
| Gaming ETF | | | 23,070,309 | | | | 2,338,494 | | | | (4,629,414 | ) | | | (2,290,920 | ) |
| Generic Drugs ETF | | | 5,183,585 | | | | 208,669 | | | | (347,229 | ) | | | (138,560 | ) |
| Pharmaceutical ETF | | | 432,717,022 | | | | 1,264,891 | | | | (70,577,604 | ) | | | (69,312,713 | ) |
| Retail ETF | | | 84,680,219 | | | | 4,581,554 | | | | (11,179,389 | ) | | | (6,597,835 | ) |
| Semiconductor ETF | | | 733,021,988 | | | | 9,095,082 | | | | (11,373,976 | ) | | | (2,278,894 | ) |
The tax character of dividends paid to shareholders during the year ended September 30, 2016 was as follows:
| Fund | | Ordinary Income |
| Biotech ETF | | $ | 1,869,172 | |
| Environmental Services ETF | | | 170,000 | |
| Gaming ETF | | | 909,300 | |
| Pharmaceutical ETF | | | 6,437,588 | |
| Retail ETF | | | 3,353,072 | |
| Semiconductor ETF | | | 5,557,739 | |
Generic Drugs ETF commenced operations on January 12, 2016, and had no distributions during the period ended September 30, 2016.
The tax character of current year distributions will be determined at the end of the current fiscal year.
At September 30, 2016, the Funds had capital loss carryforwards available to offset future capital gains, as follows:
| | | Post-Effective-
No Expiration
Short-Term
Capital | | Post-Effective-
No Expiration
Long-Term | | Amount Expiring in the Year Ended September 30, | |
| Fund | | Losses | | Capital Losses | | 2019 | | 2018 | | | 2017 | |
| Biotech ETF | | $ | (3,420,900 | ) | | $ | (4,449,333 | ) | | $ | — | | | $ | — | | | $ | — | |
| Environmental Services ETF | | | (500,578 | ) | | | (5,517,148 | ) | | | — | | | | (479,375 | ) | | | (6,445,705 | ) |
| Gaming ETF | | | (2,330,058 | ) | | | (2,866,697 | ) | | | — | | | | — | | | | — | |
| Generic Drugs ETF | | | (41,480 | ) | | | — | | | | — | | | | — | | | | — | |
| Pharmaceutical ETF | | | (4,002,830 | ) | | | (2,096,718 | ) | | | — | | | | — | | | | — | |
| Retail ETF | | | (1,353,462 | ) | | | (452,759 | ) | | | — | | | | — | | | | — | |
| Semiconductor ETF | | | (2,182,178 | ) | | | (425,994 | ) | | | — | | | | — | | | | — | |
During the year ended September 30, 2016, Environmental Services ETF had $2,110,133 of its accumulated capital loss carryforwards expire.
The Funds recognize the tax benefits of uncertain tax positions only where the position is “more-likely-than-not” to be sustained assuming examination by applicable tax authorities. Management has analyzed the Funds’ tax positions, and has concluded that no liability for unrecognized tax benefits should be recorded related to uncertain tax positions taken on return filings for all open tax years. The Funds do not have exposure for additional years that might still be open in certain foreign jurisdictions. Therefore, no provision for income tax is required in the Funds’ financial statements. However, the Funds are subject to foreign taxes on the appreciation in value of certain investments. The Funds provide for such taxes on both realized and unrealized appreciation.
The Funds recognize interest and penalties, if any, related to uncertain tax positions as income tax expense in the Statements of Operations. During the period ended March 31, 2017, the Funds did not incur any interest or penalties.
Note 6—Capital Share Transactions—As of March 31, 2017, there was an unlimited number of capital shares of beneficial interest authorized by the Trust with no par value. Shares are issued and redeemed by the Funds only in Creation units, consisting of 50,000 shares, or multiples thereof.
The consideration for the purchase or redemption of Creation Units of the Funds generally consists of the in-kind contribution or distribution of securities constituting the Funds’ underlying index plus a small amount of cash. For the period ended March 31, 2017, the Funds had in-kind contributions and redemptions as follows:
| Fund | | In-Kind Contributions | | In-Kind Redemptions |
| Biotech ETF | | $ | 134,940,761 | | | $ | 75,906,535 | |
| Environmental Services ETF | | | 3,829,336 | | | | 2,537,175 | |
| Gaming ETF | | | — | | | | — | |
| Generic Drugs ETF | | | 3,094,928 | | | | 1,661,594 | |
| Pharmaceutical ETF | | | 642,575,349 | | | | 537,874,332 | |
| Retail ETF | | | 11,671,901 | | | | 53,779,474 | |
| Semiconductor ETF | | | 4,262,564,657 | | | | 4,214,492,327 | |
The in-kind contributions and in-kind redemptions in this table represent the accumulation of each Fund’s daily net shareholder transactions including rebalancing activity, while the Statements of Changes in Net Assets reflect shareholder transactions including any cash component of the transactions.
Note 7—Concentration of Risk—The investment objective of each Fund is to seek investment results that correspond generally to the price and yield performance, before fees and expenses, of its underlying index, as indicated in the name of each Fund. The Adviser uses a “passive” or index approach to achieve each Fund’s investment objective by investing in a portfolio of securities that generally replicates the Fund’s index. Each of the Funds is classified as a non-diversified fund under the 1940 Act. Non-diversified funds generally hold securities of fewer issuers than diversified funds and may be more susceptible to the risks associated with these particular issuers, or to a single economic, political or regulatory
VANECK VECTORS ETF TRUST
NOTES TO FINANCIAL STATEMENTS
(unaudited) (continued)
occurrences affecting these issuers. The Funds may purchase securities on foreign exchanges. Securities of foreign issuers involve special risks and considerations not typically associated with investing in U.S. issuers. These risks include devaluation of currencies, currency controls, less reliable information about issuers, different securities transaction clearance and settlement practices, future adverse political and economic developments and local/regional conflicts. These risks are heightened for investments in emerging market countries. Moreover, securities of many foreign issuers and their markets may be less liquid and their prices more volatile than those of comparable U.S. issuers.
In 2016, the United Kingdom decided to leave the European Union (“EU”), creating economic and political uncertainty in its wake. Significant uncertainty exists regarding the timing of the United Kingdom’s withdrawal from the EU and the effects such withdrawal will have on the Euro, European economies and the global markets. This may further impact the value of the Euro and the British pound sterling, and has caused volatility and uncertainty in European and global markets.
Note 8—Trustee Deferred Compensation Plan—The Trust has a Deferred Compensation Plan (the “Plan”) for Trustees under which the Trustees can elect to defer receipt of their trustee fees until retirement, disability or termination from the Board of Trustees. The fees otherwise payable to the participating Trustees are deemed invested in shares of the Funds as directed by the Trustees.
The expense for the Plan is included in “Trustees’ fees and expenses” in the Statements of Operations. The liability for the Plan is shown as “Deferred Trustee fees” in the Statements of Assets and Liabilities.
Note 9—Securities Lending—To generate additional income, each of the Funds may lend its securities pursuant to a securities lending agreement with The Bank of New York Mellon, the securities lending agent and also the Funds’ custodian. Each Fund may lend up to 33% of its investments requiring that the loan be continuously collateralized by cash, U.S. government or U.S. government agency securities, shares of an investment trust or mutual fund, or any combination of cash and such securities at all times equal to at least 102% (105% for foreign securities) of the market value plus accrued interest on the securities loaned. Daily market fluctuations could cause the value of loaned securities to be more or less than the value of the collateral received. When this occurs, the collateral is adjusted and settled on the next business day. During the term of the loan, the Funds will continue to receive any dividends, interest or amounts equivalent thereto, on the securities loaned while receiving a fee from the borrower and/or earning interest on the investment of the cash collateral. Such fees and interest are shared with the securities lending agent under the terms of the securities lending agreement. The Funds may pay reasonable finders’, administrative and custodial fees in connection with a loan of its securities. Securities lending income is disclosed as such in the Statements of Operations. The collateral for securities loaned is recognized in the Schedules of Investments and the Statements of Assets and Liabilities. The cash collateral is maintained on the Funds’ behalf by the lending agent and is invested in repurchase agreements collateralized by obligations of the U.S. Treasury and/or Government Agencies. Loans are subject to termination at the option of the borrower or the Funds. Upon termination of the loan, the borrower will return to the lender securities identical to the securities loaned. The Funds bear the risk of delay in recovery of, or even loss of rights in, the securities loaned should the borrower of the securities fail financially. The value of loaned securities and related collateral outstanding at March 31, 2017 are presented on a gross basis in the Schedules of Investments and Statements of Assets and Liabilities.
The following table presents repurchase agreements held as collateral by type of security on loan pledged as of March 31, 2017:
| | | Gross Amount of Recognized
Liabilities for Securities Loaned
in the Statements of Assets
and Liabilities* |
| Fund | | Equity Securities |
| Biotech ETF | | $ | 33,907,816 | |
| Environmental Services ETF | | | 713,132 | |
| Gaming ETF | | | 15,995 | |
| Generic Drugs ETF | | | 92,280 | |
| Pharmaceutical ETF | | | 31,748,325 | |
| Retail ETF | | | 1,303,849 | |
| Semiconductor ETF | | | 15,681,660 | |
| * | Remaining contractual maturity of the agreements: overnight and continuous |
Note 10—Share Split—On January 27, 2012, the Board of Trustees of the VanEck Vectors ETF Trust approved a split of the shares for Biotech ETF, Pharmaceutical ETF, and Retail ETF. The share splits took place for shareholders of record as of the close of business on February 10, 2012, and were paid on February 13, 2012. Each Fund’s shares began trading on a split-adjusted basis on February 14, 2012. Biotech ETF and Retail ETF split its shares three-for-one. Pharmaceutical ETF split its shares two-for-one.
Note 11—Bank Line of Credit—The Funds may participate in a $200 million committed credit facility (the “Facility”) to be utilized for temporary financing until the settlement of sales or purchases of portfolio securities, the repurchase or redemption of shares of the Funds at the request of the shareholders and other temporary or emergency purposes. The Funds have agreed to pay commitment fees, pro rata, based on the unused but available balance. Interest is charged to the Funds at rates based on prevailing market rates in effect at the time of borrowings. During the period ended March 31, 2017, the following Funds borrowed under this Facility:
| Fund | | Days
Outstanding | | Average Daily
Loan Balance | | | Average
Interest Rate | | Outstanding Loan
Balance as of
March 31, 2017 |
| Biotech ETF | | | 40 | | | $ | 994,331 | | | | 1.96 | % | | $ | — | |
| Environmental Services ETF | | | 1 | | | | 1,243,694 | | | | 2.31 | | | | 1,243,694 | |
| Gaming ETF | | | 60 | | | | 140,915 | | | | 1.80 | | | | — | |
| Generic Drugs ETF | | | 4 | | | | 380,933 | | | | 2.31 | | | | — | |
| Pharmaceutical ETF | | | 79 | | | | 614,146 | | | | 1.97 | | | | — | |
| Retail ETF | | | 85 | | | | 108,834 | | | | 1.88 | | | | 70,324 | |
| Semiconductor ETF | | | 113 | | | | 699,706 | | | | 1.90 | | | | — | |
Note 12—Custodian Fees—The Funds have entered into an expense offset agreement with the custodian wherein they receive a credit toward the reduction of custodian fees whenever there are uninvested cash balances. The Funds could have invested their cash balances elsewhere if they had not agreed to a reduction in fees under the expense offset agreement with the custodian. For the period ended March 31, 2017, there were offsets to custodian fees and these amounts are reflected in custody expense in the Statement of Operations.
Note 13—Recent Accounting Pronouncements and Regulatory Requirements—The Funds adopted Accounting Standards Update No. 2014-15 (“ASU 2014-15”), Disclosure of Uncertainties about an Entity’s Ability to Continue as a Going Concern, which requires management to assess the Funds’ ability to continue as a going concern and to provide related disclosures in certain circumstances. Under the new standard, disclosures are required when conditions give rise to substantial doubt about a company’s ability to continue as a going concern within one year from the financial statement issuance date. Based on management’s evaluation, there are no conditions or events that could adversely affect the Funds’ ability to meet their obligations within one year after the date the financial statements are issued. Accordingly, no disclosures are required specific to going concern uncertainties in the Funds’ financial statements.
In October 2016, the Securities and Exchange Commission (the “SEC”) released its Final Rule on Investment Company Reporting Modernization (the “Rule”). The Rule contains amendments to Regulation S-X which impact financial statement presentation, particularly the presentation of derivative investments. Although still evaluating the impact of the Rule, management believes that many of the Regulation S-X amendments are consistent with the Funds’ current financial statement presentation and expects that the Funds will be able to comply with the Rule’s Regulation S-X amendments by the August 1, 2017 compliance date.
Note 14—Subsequent Events—The Funds have evaluated events and transactions for potential recognition or disclosure through the date the financial statements were issued.
The following dividend from net investment income was declared and paid subsequent to March 31, 2017:
| Fund | | Ex-Date | | Record Date | | Payable Date | | Per Share |
| Pharmaceutical ETF | | 4/3/17 | | 4/5/17 | | 4/7/17 | | $0.4651 |
This report is intended for the Funds’ shareholders. It may not be distributed to prospective investors unless it is preceded or accompanied by a VanEck Vectors ETF Trust (the “Trust”) Prospectus, which includes more complete information. An investor should consider the investment objective, risks, and charges and expenses of the Funds carefully before investing. The prospectus contains this and other information about the investment company. Please read the prospectus carefully before investing.
Additional information about the Trust’s Board of Trustees/Officers and a description of the policies and procedures the Trust uses to determine how to vote proxies relating to portfolio securities are provided in the Statement of Additional Information. The Statement of Additional Information and information regarding how the Trust voted proxies relating to portfolio securities during the most recent twelve month period ending June 30 is available, without charge, by calling 800.826.2333, or by visiting vaneck.com, or on the Securities and Exchange Commission’s website at http://www.sec.gov.
The Trust files its complete schedule of portfolio holdings with the Securities and Exchange Commission for the first and third quarters of each fiscal year on Form N-Q. The Trust’s Form N-Qs are available on the Commission’s website at http://www.sec.gov and may be reviewed and copied at the Commission’s Public Reference Room in Washington, D.C. Information on the operation of the Public Reference Room may be obtained by calling 202.942.8090. The Funds’ complete schedules of portfolio holdings are also available by calling 800.826.2333 or by visiting vaneck.com.

| Investment Adviser: | Van Eck Associates Corporation | |
| Distributor: | Van Eck Securities Corporation
666 Third Avenue, New York, NY 10017
vaneck.com | |
| Account Assistance: | 800.826.2333 | INDUSSAR |
 | SEMI-ANNUAL REPORT
March 31, 2017
(unaudited) |
| VANECK VECTORS® | |
| |
| Global Spin-Off ETF | SPUN® |
| | |
| Morningstar International Moat ETF | MOTI® |
| | |
| Morningstar Wide Moat ETF | MOAT® |
The information contained in the management discussion represents the opinions of VanEck Vectors ETF Trust and may differ from other persons. This information is not intended to be a forecast of future events, a guarantee of future results or investment advice. The information contained herein regarding each index has been provided by the relevant index provider. Also, unless otherwise specifically noted, any discussion of the Funds’ holdings and the Funds’ performance, and the views of VanEck Vectors ETF Trust are as of March 31, 2017, and are subject to change.
VANECK VECTORS ETFs
March 31, 2017 (unaudited)
Dear Shareholder:
We are pleased to present this semi-annual report for the three strategic equity exchange-traded funds (ETFs) of the VanEck Vectors® ETF Trust for the six-month period ended March 31, 2017.
Moativated Investing
VanEck Vectors Morningstar Wide Moat ETF (NYSE Arca: MOAT) and VanEck Vectors Morningstar International Moat ETF (NYSE Arca: MOTI) outperformed their benchmarks over the past six months by investing in companies identified by Morningstar as having sustainable competitive advantages and trading at attractive valuations.
MOAT’s total net assets passed the US$1 billion mark in the first quarter of 2017. Since its launch (the fund celebrates its fifth birthday on April 24), MOAT has established a solid performance track record. Over the last six months, the Fund returned 11.66% based on net asset value, outperforming the S&P 500® Index1 by 1.54%.
MOTI, which invests solely outside the U.S., has also established a solid performance track record since inception and, in the most recent six-month period, returned 10.82% based on net asset value, outperforming the MSCI All Country World Index ex-USA (MSCI ACWI ex-USA)2 by 4.31%.
VanEck Vectors Moat ETFs Outperformed Broad Market
As of March 31, 2017
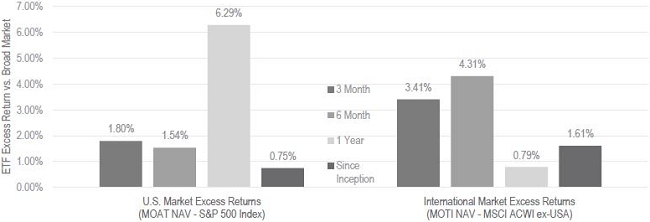
Source: Morningstar, FactSet. Not intended to be a forecast of future events, a guarantee of future results or investment advice. Current market conditions may not continue. Past performance is no guarantee of future results; current performance may be lower or higher than the performance data quoted. Index performance is not illustrative of fund performance. Investors cannot invest directly in an Index.
Please stay in touch with us through our website (vaneck.com) on which we offer videos, email subscriptions, blogs, and educational literature. Our Moat Investing blog and email subscription may be of particular interest to you. Should you have any questions, please contact us at 800.826.2333 or visit vaneck.com.
VANECK VECTORS ETFs
(unaudited)
Thank you for participating in the VanEck Vectors ETF Trust. On the following pages, you will find the performance record of each of the funds for the six month period ending March 31, 2017. You will also find their financial statements. We value your continuing confidence in us and look forward to helping you meet your investment goals in the future.

Jan F. van Eck
Trustee and President
VanEck Vectors ETF Trust
April 18, 2017
Represents the opinions of the investment adviser. Past performance is no guarantee of future results. Not intended to be a forecast of future events, a guarantee of future results or investment advice. Current market conditions may not continue.
All indices are unmanaged and include the reinvestment of all dividends, but do not reflect the payment of transaction costs, advisory fees or expenses that are associated with an investment in a fund. An index’s performance is not illustrative of a fund’s performance. Indices are not securities in which investments can be made. Results reflect past performance and do not guarantee future results.
| 1 | S&P 500® Index consists of 500 widely held common stocks covering the leading industries in the U.S. economy. |
| | |
| 2 | The MSCI ACWI ex USA Index captures large- and mid-cap representation across 22 of 23 Developed Markets countries (excluding the U.S.) and 23 Emerging Markets countries. With 1,853 constituents, the index covers approximately 85% of the global equity opportunity set outside the U.S. |
Management Discussion (unaudited)
All three VanEck Vectors Strategic Equity ETFs posted positive returns for the six-month period under review.
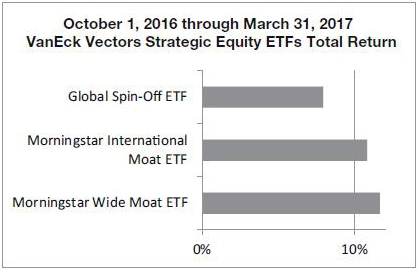
Source: VanEck. Returns based on NAV. The performance data quoted represent past performance. Past performance is not a guarantee of future results. Performance information for the Funds reflects temporary waivers of expenses and/or fees. Had the Funds incurred all expenses, investment returns would have been reduced. Investment return and value of the shares of the Funds will fluctuate so that an investor’s shares, when sold, may be worth more or less than their original cost. Current performance may be lower or higher than performance data quoted.
Global Spin-Off
VanEck Vectors Global Spin-Off ETF (NYSE Arca: SPUN) returned 7.93%. During this six-month period, U.S. companies were by far the largest contributors to the Fund’s total returns. The three sectors contributing the most to performance were materials, information technology, and consumer discretionary. The healthcare and telecommunication services sectors were the only negative contributors to the Fund’s performance. Spin-off companies in Ireland were the largest detractors from performance.
Morningstar International Moat
For the six-month period, VanEck Vectors Morningstar International Moat ETF (NYSE Arca: MOTI) returned 10.82%. The primary driver of the Fund’s performance was the financials sector. Companies in the consumer discretionary sector also contributed solid positive performance. Only two sectors detracted from performance: consumer staples and telecommunication services. Of these two, consumer staples detracted the most, but still only minimally.
Morningstar Wide Moat
VanEck Vectors Morningstar Wide Moat ETF (NYSE Arca: MOAT) returned 11.66% for the six-month period. The primary driver of performance was the Fund’s exposures to the consumer discretionary sector — in particular, Twenty-First Century Fox, Inc. (2.7% of Fund net assets†). However, stocks in both the financials and industrials sectors — especially CSX Corporation (not held by Fund at period end) — also performed strongly. The materials sector contributed the least to the Fund’s performance.
| † | All Fund assets referenced are Total Net Assets as of March 31, 2017. |
VANECK VECTORS ETFs
PERFORMANCE COMPARISON
March 31, 2017 (unaudited)
VANECK VECTORS GLOBAL SPIN-OFF ETF
| | | Average Annual Total Returns | | Cumulative Total Returns | | |
| | | Share Price | | NAV | | GSPIN1 | | Share Price | | NAV | | GSPIN1 | |
| Six Months | | | 8.95 | % | | | 7.93 | % | | | 8.15 | % | | | 8.95 | % | | | 7.93 | % | | | 8.15 | % | |
| One Year | | | 26.02 | % | | | 25.92 | % | | | 26.54 | % | | | 26.02 | % | | | 25.92 | % | | | 26.54 | % | |
| Life* | | | 7.80 | % | | | 7.59 | % | | | 8.12 | % | | | 14.57 | % | | | 14.16 | % | | | 15.19 | % | |
| * | Commencement of Fund: 6/9/15; First Day of Secondary Market Trading: 6/10/15. |
| | |
| 1 | Horizon Kinetics Global Spin-Off Index (GSPIN) is a rules-based, equal-weighted index intended to track the performance of listed, publicly held spin-offs that are domiciled and trade in the U.S. or developed markets of Western Europe and Asia. |
VANECK VECTORS MORNINGSTAR INTERNATIONAL MOAT ETF
| | | Average Annual Total Returns | | Cumulative Total Returns | |
| | | Share Price | | NAV | | MGEUMFUN1 | | Share Price | NAV | | MGEUMFUN1 | |
| Six Months | | | 11.88 | % | | | 10.82 | % | | | 11.49 | % | | | 11.88 | % | | | 10.82 | % | | | 11.49 | % | |
| One Year | | | 15.25 | % | | | 13.92 | % | | | 14.47 | % | | | 15.25 | % | | | 13.92 | % | | | 14.47 | % | |
| Life* | | | 3.51 | % | | | 2.86 | % | | | 3.75 | % | | | 6.10 | % | | | 4.97 | % | | | 6.53 | % | |
| * | Commencement of Fund: 7/13/15; First Day of Secondary Market Trading: 7/14/15. |
| | |
| 1 | Morningstar® Global ex-US Moat Focus IndexSM (MGEUMFUN) is a rules-based, equal-weighted index intended to offer exposure to companies that Morningstar, Inc. determines have sustainable competitive advantages based on a proprietary methodology that considers quantitative and qualitative factors (“wide and narrow moat companies”). |
VANECK VECTORS MORNINGSTAR WIDE MOAT ETF
| | | Average Annual Total Returns | | Cumulative Total Returns | |
| | | Share Price | | NAV | | MWMFTR1 | | Share Price | | NAV | | MWMFTR1 | |
| Six Months | | | 11.47 | % | | | 11.66 | % | | | 11.91 | % | | | 11.47 | % | | | 11.66 | % | | | 11.91 | % | |
| One Year | | | 23.47 | % | | | 23.46 | % | | | 24.08 | % | | | 23.47 | % | | | 23.46 | % | | | 24.08 | % | |
| Life* | | | 14.82 | % | | | 14.82 | % | | | 15.40 | % | | | 97.73 | % | | | 97.79 | % | | | 102.73 | % | |
| * | Commencement of Fund: 4/24/12; First Day of Secondary Market Trading: 4/25/12. |
| | |
| 1 | Morningstar® Wide Moat Focus IndexSM (MWMFTR) is a rules-based, equal-weighted index intended to offer exposure to companies that Morningstar, Inc. determines have sustainable competitive advantages based on a proprietary methodology that considers quantitative and qualitative factors (“wide moat companies”). |
Past performance is no guarantee of future results. Performance results do not reflect the deduction of taxes that a shareholder would pay on fund distributions or on the redemption or sale of fund shares.
See “About Fund Performance” on page 5 for more information.
VANECK VECTORS ETF TRUST
ABOUT FUND PERFORMANCE
(unaudited)
The price used to calculate market return (Share Price) is determined by using the closing price listed on its primary listing exchange. Since the shares of each Fund did not trade in the secondary market until after each Fund’s commencement, for the period from commencement to the first day of secondary market trading in shares of each Fund, the NAV of each Fund is used as a proxy for the secondary market trading price to calculate market returns.
The performance data quoted represents past performance. Past performance is not a guarantee of future results. Performance information for each Fund reflects temporary waivers of expenses and/or fees. Had each Fund incurred all expenses, investment returns would have been reduced. These returns do not reflect the deduction of taxes that a shareholder would pay on Fund dividends and distributions or the sale of Fund shares.
Investment return and value of the shares of each Fund will fluctuate so that an investor’s shares, when sold, may be worth more or less than their original cost. Performance may be lower or higher than performance data quoted. Fund returns reflect reinvestment of dividends and capital gains distributions. Performance current to the most recent month-end is available by calling 800.826.2333 or by visiting vaneck.com.
Fund shares are not individually redeemable and will be issued and redeemed at their NAV only through certain authorized broker-dealers in large, specified blocks of shares called “creation units” and otherwise can be bought and sold only through exchange trading. Shares may trade at a premium or discount to their NAV in the secondary market.
The “Net Asset Value” (NAV) of a VanEck Vectors exchange-traded fund (ETF) is determined at the close of each business day, and represents the dollar value of one share of the fund; it is calculated by taking the total assets of the fund, subtracting total liabilities, and dividing by the total number of shares outstanding. The NAV is not necessarily the same as the ETF’s intraday trading value. VanEck Vectors ETF investors should not expect to buy or sell fund shares at NAV.
Index returns assume the reinvestment of all income and do not reflect any management fees or brokerage expenses associated with Fund returns. Investors cannot invest directly in the Index. Returns for actual Fund investors may differ from what is shown because of differences in timing, the amount invested and fees and expenses.
The Spin-Off Index is published by Horizon Kinetics, LLC (Horizon Kinetics). The ex-US Moat Focus Index and Wide Moat Focus Index are published by Morningstar. The Morningstar name and logo are registered trademarks of Morningstar. Morningstar Global ex-US Moat Focus IndexSM and Morningstar Wide Moat Focus IndexSM are service marks of Morningstar. Morningstar is a leading provider of independent investment research in North America, Europe, Australia, and Asia. Morningstar offers an extensive line of internet, software, and print-based products and services for individuals, financial advisors, and institutions. The ex-US Moat Focus Index and Wide Moat Focus Index are rooted in Morningstar’s proprietary research and are based on a transparent, rules-based methodology. Presently, Morningstar has developed and is maintaining a number of indexes in addition to the ex-US Moat Focus Index and Wide Moat Focus Index.
Horizon Kinetics and Morningstar are referred to herein as the “Index Providers”. The Index Providers do not sponsor, endorse, or promote the Funds and bear no liability with respect to the Funds or any security.
Premium/discount information regarding how often the closing trading price of the Shares of each Fund were above (i.e., at a premium) or below (i.e., at a discount) the NAV of the Fund for each of the four previous calendar quarters and the immediately preceding five years (if applicable) can be found at www.vaneck.com.
VANECK VECTORS ETF TRUST
EXPLANATION OF EXPENSES
(unaudited)
Hypothetical $1,000 investment at beginning of period
As a shareholder of a Fund, you incur operating expenses, including management fees and other Fund expenses. This disclosure is intended to help you understand the ongoing costs (in dollars) of investing in your Fund and to compare these costs with the ongoing costs of investing in other mutual funds.
The disclosure is based on an investment of $1,000 invested at the beginning of the period and held for the entire period, October 1, 2016 to March 31, 2017.
Actual Expenses
The first line in the table below provides information about account values and actual expenses. You may use the information in this line, together with the amount you invested, to estimate the expenses that you paid over the period. Simply divide your account value by $1,000 (for example, an $8,600 account value divided by $1,000 = 8.6), then multiply the result by the number in the first line under the heading entitled “Expenses Paid During the Period.”
Hypothetical Example for Comparison Purposes
The second line in the table below provides information about hypothetical account values and hypothetical expenses based on your Fund’s actual expense ratio and an assumed rate of return of 5% per year before expenses, which is not the Fund’s actual return. The hypothetical account values and expenses may not be used to estimate the actual ending account balance or expenses you paid for the period. You may use this information to compare the ongoing costs of investing in your Fund and other funds. To do so, compare this 5% hypothetical example with the 5% hypothetical examples that appear in the shareholder reports of other funds.
Please note that the expenses shown in the table are meant to highlight your ongoing costs only and do not reflect any transactional costs, such as program fees. Therefore, the second line of the table is useful in comparing ongoing costs only, and will not help you determine the relative costs of owning different funds. In addition, if these transactional costs were included, your costs would have been higher.
| | | Beginning | | Ending | | Annualized | | Expenses Paid |
| | | Account | | Account | | Expense | | During the Period* |
| | | Value | | Value | | Ratio | | October 1, 2016- |
| | | October 1, 2016 | | March 31, 2017 | | During Period | | March 31, 2017 |
| Global Spin-Off ETF | | | | | | | | | | | | | | | | |
| Actual | | $ | 1,000.00 | | | $ | 1,079.30 | | | | 0.55% | | | $ | 2.85 | |
| Hypothetical** | | $ | 1,000.00 | | | $ | 1,022.19 | | | | 0.55% | | | $ | 2.77 | |
| Morningstar International Moat ETF | | | | | | | | | | | | | | |
| Actual | | $ | 1,000.00 | | | $ | 1,108.20 | | | | 0.56% | | | $ | 2.94 | |
| Hypothetical** | | $ | 1,000.00 | | | $ | 1,022.14 | | | | 0.56% | | | $ | 2.82 | |
| Morningstar Wide Moat ETF | | | | | | | | | | | | | | | |
| Actual | | $ | 1,000.00 | | | $ | 1,116.60 | | | | 0.49% | | | $ | 2.59 | |
| Hypothetical** | | $ | 1,000.00 | | | $ | 1,022.49 | | | | 0.49% | | | $ | 2.47 | |
| * | Expenses are equal to the Fund’s annualized expense ratio (for the six months ended March 31, 2017) multiplied by the average account value over the period, multiplied by the number of days in the most recent fiscal half year divided by the number of days in the fiscal year (to reflect the one-half year period). |
| ** | Assumes annual return of 5% before expenses |
.VANECK VECTORS GLOBAL SPIN-OFF ETF
SCHEDULE OF INVESTMENTS
March 31, 2017 (unaudited)
Number
of Shares | | | | Value |
| | | | | | | | | |
| COMMON STOCKS: 83.0% | | | |
| Australia: 2.1% | | | | |
| 25,499 | | | Orora Ltd. # | | $ | 57,565 | |
| | 27,168 | | | South32 Ltd. # | | | 57,188 | |
| | | | | | | | 114,753 | |
| Cayman Islands: 1.1% | | | | |
| | 1,709 | | | Theravance Biopharma, Inc. (USD) * † | | | 62,925 | |
| China / Hong Kong: 2.9% | | | | |
| | 8,000 | | | Cheung Kong Property Holdings Ltd. # | | | 53,967 | |
| | 285,000 | | | China Overseas Property Holdings Ltd. # | | | 52,465 | |
| | 508,000 | | | Global Brands Group Holding Ltd. * # | | | 54,315 | |
| | | | | | | | 160,747 | |
| Finland: 2.0% | | | | |
| | 7,103 | | | Caverion Corp. * † # | | | 56,093 | |
| | 3,525 | | | Valmet OYJ # | | | 54,860 | |
| | | | | | | | 110,953 | |
| France: 1.0% | | | | |
| | 789 | | | Groupe Fnac SA * # | | | 57,058 | |
| Germany: 1.1% | | | | |
| | 922 | | | OSRAM Licht AG # | | | 57,969 | |
| Ireland: 3.3% | | | | |
| | 835 | | | Adient Plc (USD) | | | 60,679 | |
| | 761 | | | Allegion Plc (USD) | | | 57,608 | |
| | 1,101 | | | Prothena Corp. Plc (USD) * † | | | 61,425 | |
| | | | | | | | 179,712 | |
| Italy: 1.1% | | | | |
| | 13,372 | | | Italgas SpA * | | | 58,810 | |
| Norway: 1.0% | | | | |
| | 9,023 | | | Aker Solutions ASA * # Reg S | | | 54,440 | |
| Singapore: 1.0% | | | | |
| | 46,200 | | | Frasers Centrepoint Ltd. # | | | 57,366 | |
| Sweden: 1.0% | | | | |
| | 3,719 | | | Bonava AB * # | | | 54,543 | |
| United Kingdom: 1.0% | | | | |
| | 14,168 | | | Indivior Plc # | | | 57,092 | |
| United States: 64.4% | | | | |
| | 868 | | | AbbVie, Inc. | | | 56,559 | |
| | 2,132 | | | AdvanSix, Inc. * | | | 58,246 | |
| | 1,711 | | | Alcoa Corp. | | | 58,858 | |
| | 1,321 | | | Alexander and Baldwin, Inc. | | | 58,811 | |
| | 3,092 | | | Armstrong Flooring, Inc. * | | | 56,955 | |
| | 1,540 | | | Associated Capital Group, Inc. | | | 55,671 | |
| | 1,129 | | | Bioverativ, Inc. * | | | 61,485 | |
| | 89 | | | Cable One, Inc. | | | 55,578 | |
| | 4,410 | | | California Resources Corp. * † | | | 66,326 | |
| | 875 | | | CDK Global, Inc. | | | 56,884 | |
| | 1,651 | | | Chemours Co. | | | 63,563 | |
| | 3,705 | | | CommerceHub, Inc. * | | | 57,353 | |
| | 3,564 | | | Conduent, Inc. * | | | 59,804 | |
| | 1,945 | | | CSRA, Inc. | | | 56,969 | |
| | 1,594 | | | CSW Industrials, Inc. * | | | 58,500 | |
| | 2,960 | | | Donnelley Financial Solutions, Inc. * | | | 57,098 | |
| | 1,018 | | | Energizer Holdings, Inc. | | | 56,754 | |
| | 2,038 | | | Engility Holdings, Inc. * | | | 58,980 | |
| | 2,055 | | | Exterran Corp. * | | | 64,630 | |
| | 2,550 | | | Fiesta Restaurant Group, Inc. * | | | 61,710 | |
Number
of Shares | | | | Value |
| | | | | | | | | |
| United States: (continued) | | | | |
| 974 | | | Fortive Corp. | | $ | 58,654 | |
| | 2,900 | | | FTD Cos, Inc. * | | | 58,406 | |
| | 6,992 | | | Gannett Co., Inc. † | | | 58,593 | |
| | 1,729 | | | GCP Applied Technologies, Inc. * | | | 56,452 | |
| | 1,510 | | | Halyard Health, Inc. * | | | 57,516 | |
| | 1,219 | | | Herc Holdings, Inc. * | | | 59,597 | |
| | 2,499 | | | Hewlett Packard Enterprise Co. | | | 59,226 | |
| | 1,976 | | | Hilton Grand Vacations, Inc. * | | | 56,632 | |
| | 1,006 | | | Hyster-Yale Materials Handling, Inc. | | | 56,728 | |
| | 939 | | | Ingevity Corp. * | | | 57,138 | |
| | 2,872 | | | International Seaways, Inc. * | | | 54,913 | |
| | 1,532 | | | Keysight Technologies, Inc. * | | | 55,366 | |
| | 1,288 | | | KLX, Inc. * | | | 57,574 | |
| | 3,029 | | | Knowles Corp. * † | | | 57,400 | |
| | 1,325 | | | Lamb Weston Holdings, Inc. | | | 55,730 | |
| | 2,937 | | | Lands’ End, Inc. * † | | | 62,999 | |
| | 678 | | | Liberty Broadband Corp. * | | | 57,691 | |
| | 2,325 | | | LSC Communications, Inc. | | | 58,497 | |
| | 1,106 | | | Lumentum Holdings, Inc. * | | | 59,005 | |
| | 290 | | | Madison Square Garden Co. * | | | 57,916 | |
| | 1,320 | | | Mallinckrodt Plc * | | | 58,832 | |
| | 808 | | | Murphy USA, Inc. * | | | 59,323 | |
| | 4,061 | | | Navient Corp. | | | 59,940 | |
| | 3,988 | | | New Media Investment Group, Inc. | | | 56,669 | |
| | 4,540 | | | News Corp. | | | 59,020 | |
| | 3,526 | | | NOW, Inc. * | | | 59,801 | |
| | 842 | | | ONE Gas, Inc. | | | 56,919 | |
| | 1,321 | | | PayPal Holdings, Inc. * | | | 56,829 | |
| | 726 | | | Phillips 66 | | | 57,514 | |
| | 3,047 | | | Pinnacle Entertainment, Inc. * | | | 59,477 | |
| | 1,623 | | | PJT Partners, Inc. | | | 56,951 | |
| | 4,487 | | | Rayonier Advanced Materials, Inc. † | | | 60,350 | |
| | 654 | | | Science Applications International Corp. | | | 48,658 | |
| | 1,714 | | | SPX Flow, Inc. * | | | 59,493 | |
| | 2,960 | | | Time, Inc. | | | 57,276 | |
| | 3,166 | | | TimkenSteel Corp. * † | | | 59,869 | |
| | 1,247 | | | TopBuild Corp. * | | | 58,609 | |
| | 1,833 | | | Varex Imaging Corp. * | | | 61,589 | |
| | 1,903 | | | Versum Materials, Inc. * | | | 58,232 | |
| | 2,754 | | | Vista Outdoor, Inc. * | | | 56,705 | |
| | 2,962 | | | Welbilt, Inc. * † | | | 58,144 | |
| | | | | | | | 3,556,967 | |
Total Common Stocks
(Cost: $4,157,255) | | | 4,583,335 | |
| REAL ESTATE INVESTMENT TRUSTS: 17.0% | | | | |
| United States: 17.0% | | | | |
| | 4,019 | | | Altisource Residential Corp. | | | 61,290 | |
| | 2,259 | | | Care Capital Properties, Inc. | | | 60,699 | |
| | 3,595 | | | CareTrust REIT, Inc. | | | 60,468 | |
| | 4,407 | | | Colony NorthStar, Inc. | | | 56,894 | |
| | 1,690 | | | Colony Starwood Homes | | | 57,375 | |
| | 2,582 | | | Four Corners Property Trust, Inc. | | | 58,947 | |
| | 1,781 | | | Gaming and Leisure Properties, Inc. | | | 59,521 | |
| | 3,422 | | | New Residential Investment Corp. | | | 58,106 | |
| | 5,850 | | | New Senior Investment Group, Inc. | | | 59,670 | |
| | 4,891 | | | NorthStar Realty Europe Corp. | | | 56,687 | |
| | 2,171 | | | Park Hotels and Resorts, Inc. | | | 55,730 | |
| | 3,119 | | | Quality Care Properties, Inc. * | | | 58,824 | |
See Notes to Financial Statements
VANECK VECTORS GLOBAL SPIN-OFF ETF
SCHEDULE OF INVESTMENTS
(unaudited) (continued)
Number
of Shares | | | |
Value |
| | | | | |
| United States: (continued) | | | |
| | 2,222 | | | Uniti Group, Inc. * | | $ | 57,439 | |
| | 2,179 | | | Urban Edge Properties | | | 57,308 | |
| | 7,079 | | | Washington Prime Group, Inc. | | | 61,517 | |
| | 3,437 | | | Xenia Hotels and Resorts, Inc. | | | 58,670 | |
Total Real Estate Investment Trusts
(Cost: $899,068) | | | 939,145 | |
MONEY MARKET FUND: 0.5%
(Cost: $28,549) | | | | |
| | 28,549 | | | Dreyfus Government Cash | | | | |
| | | | | Management Fund | | | 28,549 | |
Total Investments Before Collateral
for Securities Loaned: 100.5%
(Cost: $5,084,872) | | | 5,551,029 | |
Principal
Amount | | | | Value |
| | | | | | | | | |
SHORT-TERM INVESTMENT HELD AS COLLATERAL FOR SECURITIES LOANED: 9.2%
(Cost: $511,167) | | | | |
| Repurchase Agreement: 9.2% | | | | |
| $ | 511,167 | | | Repurchase agreement dated 3/31/17 with Daiwa Capital Markets America, Inc., 0.82%, due 4/3/17, proceeds $511,202; (collateralized by various U.S. government and agency obligations, 0.00% to 6.50%, due 5/11/17 to 12/1/51, valued at $521,390 including accrued interest) | | $ | 511,167 | |
Total Investments: 109.7%
(Cost: $5,596,039) | | | 6,062,196 | |
| Liabilities in excess of other assets: (9.7)% | | | (538,380 | ) |
| NET ASSETS: 100.0% | | $ | 5,523,816 | |
| USD | United States Dollar |
| * | Non-income producing |
| † | Security fully or partially on loan. Total market value of securities on loan is $503,846. |
| # | Indicates a fair valued security which has been valued in good faith pursuant to guidelines established by the Board of Trustees. The aggregate value of fair valued securities is $724,921 which represents 13.1% of net assets. |
| Reg S | Security was purchased pursuant to Regulation S under the Securities Act of 1933, which exempts from registration securities offered and sold outside of the United States. Such a security cannot be sold in the United States without either an effective registration statement filed pursuant to the Securities Act of 1933, or pursuant to an exemption from registration. |
Summary of Investments by Sector Excluding
Collateral for Securities Loaned (unaudited) | | % of Investments | | Value | |
| Consumer Discretionary | | | 19.9 | % | | $ | 1,103,199 | |
| Consumer Staples | | | 2.0 | | | | 112,484 | |
| Energy | | | 5.4 | | | | 297,823 | |
| Financials | | | 6.3 | | | | 349,056 | |
| Health Care | | | 8.6 | | | | 477,423 | |
| Industrials | | | 15.6 | | | | 869,453 | |
| Information Technology | | | 11.3 | | | | 625,726 | |
| Materials | | | 9.5 | | | | 529,229 | |
| Real Estate | | | 18.8 | | | | 1,042,358 | |
| Utilities | | | 2.1 | | | | 115,729 | |
| Money Market Fund | | | 0.5 | | | | 28,549 | |
| | | | 100.0 | % | | $ | 5,551,029 | |
See Notes to Financial Statements
The summary of inputs used to value the Fund’s investments as of March 31, 2017 is as follows:
| | | Level 1
Quoted
Prices | | | Level 2
Significant
Observable
Inputs | | | Level 3
Significant
Unobservable
Inputs | | Value | |
| Common Stocks | | | | | | | | | | | | | | | | |
| Australia | | $ | — | | | $ | 114,753 | | | | $ | — | | | $ | 114,753 | |
| Cayman Islands | | | 62,925 | | | | — | | | | — | | | | 62,925 | |
| China / Hong Kong | | | — | | | | 160,747 | | | | — | | | | 160,747 | |
| Finland | | | — | | | | 110,953 | | | | — | | | | 110,953 | |
| France | | | — | | | | 57,058 | | | | — | | | | 57,058 | |
| Germany | | | — | | | | 57,969 | | | | — | | | | 57,969 | |
| Ireland | | | 179,712 | | | | — | | | | — | | | | 179,712 | |
| Italy | | | 58,810 | | | | — | | | | — | | | | 58,810 | |
| Norway | | | — | | | | 54,440 | | | | — | | | | 54,440 | |
| Singapore | | | — | | | | 57,366 | | | | — | | | | 57,366 | |
| Sweden | | | — | | | | 54,543 | | | | — | | | | 54,543 | |
| United Kingdom | | | — | | | | 57,092 | | | | — | | | | 57,092 | |
| United States | | | 3,556,967 | | | | — | | | | — | | | | 3,556,967 | |
| Real Estate Investment Trusts* | | | 939,145 | | | | — | | | | — | | | | 939,145 | |
| Money Market Fund | | | 28,549 | | | | — | | | | — | | | | 28,549 | |
| Repurchase Agreement | | | — | | | | 511,167 | | | | | — | | | | 511,167 | |
| Total | | $ | 4,826,108 | | | $ | 1,236,088 | | | | $ | — | | | $ | 6,062,196 | |
| * | See Schedule of Investments for security type and geographic sector breakouts. |
During the period ended March 31, 2017, transfers of securities from Level 1 to Level 2 were $38,620. These transfers resulted primarily from changes in certain foreign securities valuation methodologies between the last close of the securities’ primary market (Level 1) and valuation by a pricing service (Level 2), which takes into account market direction or events occurring before the Fund’s pricing time but after the last local close, as described in the Notes to Financial Statements.
See Notes to Financial Statements
VANECK VECTORS MORNINGSTAR INTERNATIONAL MOAT ETF
SCHEDULE OF INVESTMENTS
March 31, 2017 (unaudited)
Number
of Shares | | | | | Value | |
| | | | |
| COMMON STOCKS: 95.0% | | | | |
| Australia: 16.3% | | | | |
| | 105,620 | | | AMP Ltd. # | | $ | 417,217 | |
| | 45,898 | | | Carsales.com Ltd. # | | | 390,869 | |
| | 88,558 | | | Crown Ltd. # | | | 797,687 | |
| | 5,138 | | | CSL Ltd. # | | | 491,202 | |
| | 163,909 | | | DuluxGroup Ltd. # | | | 816,268 | |
| | 149,962 | | | Iluka Resources Ltd. # | | | 871,609 | |
| | 62,739 | | | IOOF Holdings Ltd. † # | | | 408,203 | |
| | 40,774 | | | QBE Insurance Group Ltd. # | | | 400,809 | |
| | 15,305 | | | Ramsay Health Care Ltd. # | | | 815,785 | |
| | 24,537 | | | Sonic Healthcare Ltd. # | | | 413,915 | |
| | 213,786 | | | Telstra Corp. Ltd. # | | | 759,582 | |
| | | | | | | | 6,583,146 | |
| Belgium: 1.9% | | | | |
| | 11,824 | | | KBC Group NV # | | | 785,868 | |
| Brazil: 1.0% | | | | |
| | 72,600 | | | Ambev SA | | | 417,085 | |
| Canada: 2.0% | | | | |
| | 115,455 | | | Baytex Energy Corp. * | | | 393,031 | |
| | 23,313 | | | Potash Corp. of Saskatchewan, Inc. | | | 397,159 | |
| | | | | | | | 790,190 | |
| China / Hong Kong: 21.1% | | | | |
| | 802,000 | | | Bank of China Ltd. # | | | 398,820 | |
| | 72,500 | | | Beijing Enterprises Holdings Ltd. # | | | 375,250 | |
| | 116,000 | | | Cheung Kong Property Holdings Ltd. # | | | 782,516 | |
| | 496,000 | | | China Construction Bank Corp. # | | | 399,631 | |
| | 70,500 | | | China Mobile Ltd. # | | | 775,324 | |
| | 774,000 | | | China Telecom Corp. Ltd. # | | | 378,082 | |
| | 336,000 | | | Dongfeng Motor Group Co. Ltd. # | | | 377,697 | |
| | 162,000 | | | ENN Energy Holdings Ltd. # | | | 912,587 | |
| | 1,223,000 | | | Industrial and Commercial Bank of China Ltd. # | | | 800,268 | |
| | 209,863 | | | MGM China Holdings Ltd. # | | | 437,621 | |
| | 11,090 | | | SINA Corp. (USD) * | | | 799,811 | |
| | 55,000 | | | Sun Hung Kai Properties Ltd. # | | | 808,514 | |
| | 256,600 | | | Swire Properties Ltd. # | | | 822,396 | |
| | 15,300 | | | Tencent Holdings Ltd. # | | | 440,786 | |
| | | | | | | | 8,509,303 | |
| Denmark: 1.1% | | | | |
| | 20,725 | | | William Demant Holding AS * # | | | 434,386 | |
| France: 7.0% | | | | |
| | 5,425 | | | Airbus SE # | | | 414,786 | |
| | 19,260 | | | Bureau Veritas SA # | | | 407,020 | |
| | 5,712 | | | Danone SA # | | | 389,560 | |
| | 24,900 | | | Orange SA # | | | 387,583 | |
| | 5,059 | | | Safran SA # | | | 378,546 | |
| | 9,238 | | | Sanofi # | | | 837,224 | |
| | | | | | | | 2,814,719 | |
| Germany: 6.1% | | | | |
| | 3,532 | | | Bayer AG # | | | 407,983 | |
| | 4,322 | | | Bayerische Motoren Werke AG # | | | 395,364 | |
| | 9,282 | | | GEA Group AG # | | | 395,348 | |
| | 13,076 | | | KION Group AG # | | | 855,712 | |
| | 6,231 | | | Symrise AG # | | | 415,438 | |
| | | | | | | | 2,469,845 | |
Number
of Shares | | | | | Value | |
| | | | |
| India: 3.9% | | | | |
| | 24,811 | | | Infosys Ltd. # | | $ | 391,148 | |
| | 10,729 | | | Tata Consultancy Services Ltd. # | | | 401,789 | |
| | 109,592 | | | Tata Motors Ltd. # | | | 786,015 | |
| | | | | | | | 1,578,952 | |
| Japan: 10.0% | | | | |
| | 15,400 | | | Kao Corp. # | | | 844,956 | |
| | 29,300 | | | KDDI Corp. # | | | 769,922 | |
| | 8,600 | | | Nidec Corp. # | | | 820,602 | |
| | 18,300 | | | Nippon Telegraph & Telephone Corp. # | | | 781,684 | |
| | 42,400 | | | Rakuten, Inc. # | | | 425,637 | |
| | 9,646 | | | Seven & i Holdings Co. Ltd. # | | | 378,590 | |
| | | | | | | | 4,021,391 | |
| Mexico: 3.2% | | | | |
| | 914,800 | | | Cemex SAB de CV * | | | 823,284 | |
| | 83,700 | | | Grupo Aeroportuario del Centro Norte SAB de CV | | | 450,538 | |
| | | | | | | | 1,273,822 | |
| Netherlands: 1.0% | | | | |
| | 12,997 | | | Koninklijke Philips NV # | | | 418,595 | |
| New Zealand: 1.1% | | | | |
| | 63,334 | | | Fisher & Paykel Healthcare Corp. Ltd. # | | | 429,183 | |
| Singapore: 9.2% | | | | |
| | 331,500 | | | CapitaLand Ltd. # | | | 861,404 | |
| | 29,000 | | | DBS Group Holdings Ltd. # | | | 402,151 | |
| | 560,400 | | | Genting Singapore Plc # | | | 409,116 | |
| | 115,901 | | | Oversea-Chinese Banking Corp. Ltd. # | | | 805,943 | |
| | 145,100 | | | Singapore Exchange Ltd. # | | | 799,574 | |
| | 25,839 | | | United Overseas Bank Ltd. # | | | 408,587 | |
| | | | | | | | 3,686,775 | |
| Spain: 1.0% | | | | |
| | 36,718 | | | Telefonica SA # | | | 412,056 | |
| Sweden: 2.1% | | | | |
| | 86,869 | | | Elekta AB # | | | 851,639 | |
| Switzerland: 1.0% | | | | |
| | 5,327 | | | Novartis AG # | | | 395,847 | |
| United Kingdom: 4.0% | | | | |
| | 38,653 | | | GlaxoSmithKline PCL * # | | | 802,138 | |
| | 10,480 | | | London Stock Exchange Group Plc # | | | 416,126 | |
| | 71,279 | | | Meggitt Plc # | | | 397,051 | |
| | | | | | | | 1,615,315 | |
| United States: 2.0% | | | | |
| | 7,276 | | | Carnival Plc (GBP) # | | | 416,228 | |
| | 6,667 | | | Shire Plc (GBP) # | | | 387,707 | |
| | | | | | | | 803,935 | |
Total Common Stocks
(Cost: $35,742,657) | | | 38,292,052 | |
| PREFERRED STOCKS: 1.1% | | | | |
Brazil: 1.1%
(Cost: $385,970) | | | | |
| | 29,450 | | | Telefonica Brasil SA | | | 433,641 | |
See Notes to Financial Statements
Number
of Shares | | | | | Value | |
| | |
| REAL ESTATE INVESTMENT TRUSTS: 3.9% | | | | |
| Australia: 1.0% | | | | |
| | 172,549 | | | Vicinity Centres # | | $ | 372,666 | |
| Singapore: 2.9% | | |
| | 711,300 | | | CapitaLand Commercial Trust Ltd. # | | | 786,246 | |
| | 277,200 | | | CapitaLand Mall Trust # | | | 390,713 | |
| | | | | | | | 1,176,959 | |
Total Real Estate Investment Trusts
(Cost: $1,531,216) | | | 1,549,625 | |
Total Investments Before Collateral for Securities Loaned: 100.0%
(Cost: $37,659,843) | | 40,275,318 | |
Principal
Amount | | | | | Value | |
| | | | |
SHORT-TERM INVESTMENT HELD AS
COLLATERAL FOR SECURITIES LOANED: 0.5%
(Cost: $206,807) | | | | |
| Repurchase Agreement: 0.5% | | | | |
| | $206,807 | | | Repurchase agreement dated 3/31/17 with Daiwa Capital Markets America, Inc., 0.82%, due 4/3/17, proceeds $206,821; (collateralized by various U.S. government and agency obligations, 0.00% to 6.50%, due 5/11/17 to 12/1/51, valued at $210,943 including accrued interest) | | $ | 206,807 | |
Total Investments: 100.5%
(Cost: $37,866,650) | | | 40,482,125 | |
| Liabilities in excess of other assets: (0.5)% | | | (191,944 | ) |
| NET ASSETS: 100.0% | | $ | 40,290,181 | |
| GBP | British Pound |
| USD | United States Dollar |
| * | Non-income producing |
| † | Security fully or partially on loan. Total market value of securities on loan is $195,191. |
| # | Indicates a fair valued security which has been valued in good faith pursuant to guidelines established by the Board of Trustees. The aggregate value of fair valued securities is $36,560,769 which represents 90.7% of net assets. |
Summary of Investments by Sector Excluding
Collateral for Securities Loaned (unaudited) | | % of Investments | | Value | |
| Consumer Discretionary | | | | 10.0 | % | | | $ | 4,045,365 | |
| Consumer Staples | | | | 5.0 | | | | | 2,030,191 | |
| Energy | | | | 1.0 | | | | | 393,031 | |
| Financials | | | | 16.0 | | | | | 6,443,197 | |
| Health Care | | | | 15.6 | | | | | 6,267,009 | |
| Industrials | | | | 12.2 | | | | | 4,913,448 | |
| Information Technology | | | | 6.0 | | | | | 2,424,403 | |
| Materials | | | | 8.2 | | | | | 3,323,758 | |
| Real Estate | | | | 12.0 | | | | | 4,824,455 | |
| Telecommunication Services | | | | 11.7 | | | | | 4,697,874 | |
| Utilities | | | | 2.3 | | | | | 912,587 | |
| | | | | 100.0 | % | | | $ | 40,275,318 | |
See Notes to Financial Statements
VANECK VECTORS MORNINGSTAR INTERNATIONAL MOAT ETF
SCHEDULE OF INVESTMENTS
(unaudited) (continued)
The summary of inputs used to value the Fund’s investments as of March 31, 2017 is as follows:
| | | Level 1
Quoted
Prices | | Level 2
Significant
Observable
Inputs | | Level 3
Significant
Unobservable
Inputs | | Value | |
| Common Stocks | | | | | | | | | | | | | | | | | | | | | | |
| Australia | | | $ | — | | | | | $ | 6,583,146 | | | | | $ | — | | | | $ | 6,583,146 | |
| Belgium | | | | — | | | | | | 785,868 | | | | | | — | | | | | 785,868 | |
| Brazil | | | | 417,085 | | | | | | — | | | | | | — | | | | | 417,085 | |
| Canada | | | | 790,190 | | | | | | — | | | | | | — | | | | | 790,190 | |
| China / Hong Kong | | | | 799,811 | | | | | | 7,709,492 | | | | | | — | | | | | 8,509,303 | |
| Denmark | | | | — | | | | | | 434,386 | | | | | | — | | | | | 434,386 | |
| France | | | | — | | | | | | 2,814,719 | | | | | | — | | | | | 2,814,719 | |
| Germany | | | | — | | | | | | 2,469,845 | | | | | | — | | | | | 2,469,845 | |
| India | | | | — | | | | | | 1,578,952 | | | | | | — | | | | | 1,578,952 | |
| Japan | | | | — | | | | | | 4,021,391 | | | | | | — | | | | | 4,021,391 | |
| Mexico | | | | 1,273,822 | | | | | | — | | | | | | — | | | | | 1,273,822 | |
| Netherlands | | | | — | | | | | | 418,595 | | | | | | — | | | | | 418,595 | |
| New Zealand | | | | — | | | | | | 429,183 | | | | | | — | | | | | 429,183 | |
| Singapore | | | | — | | | | | | 3,686,775 | | | | | | — | | | | | 3,686,775 | |
| Spain | | | | — | | | | | | 412,056 | | | | | | — | | | | | 412,056 | |
| Sweden | | | | — | | | | | | 851,639 | | | | | | — | | | | | 851,639 | |
| Switzerland | | | | — | | | | | | 395,847 | | | | | | — | | | | | 395,847 | |
| United Kingdom | | | | — | | | | | | 1,615,315 | | | | | | — | | | | | 1,615,315 | |
| United States | | | | — | | | | | | 803,935 | | | | | | — | | | | | 803,935 | |
| Preferred Stocks | | | | | | | | | | | | | | | | | | | | | | |
| Brazil | | | | 433,641 | | | | | | — | | | | | | — | | | | | 433,641 | |
| Real Estate Investment Trusts* | | | | — | | | | | | 1,549,625 | | | | | | — | | | | | 1,549,625 | |
| Repurchase Agreement | | | | — | | | | | | 206,807 | | | | | | — | | | | | 206,807 | |
| Total | | | $ | 3,714,549 | | | | | $ | 36,767,576 | | | | | $ | — | | | | $ | 40,482,125 | |
| * | See Schedule of Investments for security type and geographic sector breakouts. |
There were no transfers between levels during the period ended March 31, 2017.
See Notes to Financial Statements
VANECK VECTORS MORNINGSTAR WIDE MOAT ETF
SCHEDULE OF INVESTMENTS
March 31, 2017 (unaudited)
Number
of Shares | | | | | Value | |
| | | | | | | |
| COMMON STOCKS: 100.0% | | | | |
| Banks: 2.4% | | | | |
| | 445,891 | | | Wells Fargo & Co. | | $ | 24,818,293 | |
| Capital Goods: 7.2% | | | | |
| | 439,646 | | | Emerson Electric Co. | | | 26,317,209 | |
| | 103,211 | | | TransDigm Group, Inc. | | | 22,722,934 | |
| | 230,197 | | | United Technologies Corp. | | | 25,830,405 | |
| | | | | | | | 74,870,548 | |
| Commercial & Professional Services: 2.5% | | | | |
| | 317,090 | | | Stericycle, Inc. * | | | 26,283,590 | |
| Consumer Durables & Apparel: 4.9% | | | | |
| | 300,895 | | | Polaris Industries, Inc. † | | | 25,215,001 | |
| | 474,105 | | | VF Corp. | | | 26,061,552 | |
| | | | | | | | 51,276,553 | |
| Consumer Services: 5.1% | | | | |
| | 448,354 | | | Starbucks Corp. | | | 26,179,390 | |
| | 495,516 | | | Yum China Holdings, Inc. * | | | 13,478,035 | |
| | 203,990 | | | Yum! Brands, Inc. | | | 13,034,961 | |
| | | | | | | | 52,692,386 | |
| Diversified Financials: 4.9% | | | | |
| | 164,168 | | | American Express Co. | | | 12,987,330 | |
| | 271,260 | | | Bank of New York Mellon Corp. | | | 12,811,610 | |
| | 74,362 | | | Berkshire Hathaway, Inc. * | | | 12,394,658 | |
| | 163,559 | | | State Street Corp. | | | 13,020,932 | |
| | | | | | | | 51,214,530 | |
| Food & Staples Retailing: 2.4% | | | | |
| | 314,578 | | | CVS Caremark Corp. | | | 24,694,373 | |
| Food, Beverage & Tobacco: 2.6% | | | | |
| | 170,741 | | | Mead Johnson Nutrition Co. | | | 15,209,608 | |
| | 276,197 | | | Mondelez International, Inc. | | | 11,898,567 | |
| | | | | | | | 27,108,175 | |
| Health Care Equipment & Services: 18.0% | | | | |
| | 303,718 | | | AmerisourceBergen Corp. | | | 26,879,043 | |
| | 493,166 | | | Cerner Corp. * | | | 29,022,819 | |
| | 367,624 | | | Express Scripts Holding Co. * | | | 24,230,098 | |
| | 174,027 | | | McKesson Corp. | | | 25,801,243 | |
| | 164,810 | | | Medtronic Plc | | | 13,277,094 | |
| | 297,155 | | | Patterson Cos, Inc. † | | | 13,440,321 | |
| | 284,210 | | | Varian Medical Systems, Inc. * | | | 25,900,057 | |
| | 228,780 | | | Zimmer Biomet Holdings, Inc. | | | 27,936,326 | |
| | | | | | | | 186,487,001 | |
| Materials: 4.7% | | | | |
| | 335,782 | | | Compass Minerals International, Inc. † | | | 22,782,809 | |
| | 231,317 | | | Monsanto Co. | | | 26,185,084 | |
| | | | | | | | 48,967,893 | |
| Media: 5.3% | | | | |
| | 869,435 | | | Twenty-First Century Fox, Inc. | | | 28,161,000 | |
| | 235,643 | | | Walt Disney Co. | | | 26,719,560 | |
| | | | | | | | 54,880,560 | |
Number
of Shares | | | | | Value | |
| | | | | | | |
| Pharmaceuticals, Biotechnology: 17.1% | | | | |
| | 118,061 | | | Allergan Plc | | $ | 28,207,134 | |
| | 155,214 | | | Amgen, Inc. | | | 25,465,961 | |
| | 86,718 | | | Biogen Idec, Inc. * | | | 23,710,436 | |
| | 434,578 | | | Bristol-Myers Squibb Co. | | | 23,632,352 | |
| | 322,197 | | | Eli Lilly & Co. | | | 27,099,990 | |
| | 350,969 | | | Gilead Sciences, Inc. | | | 23,837,814 | |
| | 373,271 | | | Pfizer, Inc. | | | 12,769,601 | |
| | 165,192 | | | Quintiles Transnational Holdings, Inc. * | | | 13,302,912 | |
| | | | | | | | 178,026,200 | |
| Real Estate: 5.0% | | | | |
| | 743,670 | | | CBRE Group, Inc. * | | | 25,872,279 | |
| | 233,611 | | | Jones Lang LaSalle, Inc. | | | 26,035,946 | |
| | | | | | | | 51,908,225 | |
| Retailing: 6.4% | | | | |
| | 31,426 | | | Amazon.com, Inc. * | | | 27,860,406 | |
| | 256,758 | | | L Brands, Inc. | | | 12,093,302 | |
| | 327,334 | | | Lowe’s Cos, Inc. | | | 26,910,128 | |
| | | | | | | | 66,863,836 | |
| Software & Services: 11.5% | | | | |
| | 456,697 | | | Guidewire Software, Inc. * | | | 25,725,742 | |
| | 236,002 | | | MasterCard, Inc. | | | 26,543,145 | |
| | 201,135 | | | Microsoft Corp. | | | 13,246,751 | |
| | 330,575 | | | Salesforce.com, Inc. * | | | 27,269,132 | |
| | 303,198 | | | Visa, Inc. | | | 26,945,206 | |
| | | | | | | | 119,729,976 | |
Total Common Stocks
(Cost: $980,712,239) | | | 1,039,822,139 | |
| | | | | |
Principal
Amount | | | | | | | |
SHORT-TERM INVESTMENTS HELD AS
COLLATERAL FOR SECURITIES LOANED: 3.9% | | | | |
| Repurchase Agreements: 3.9% | | | | |
| | $9,568,267 | | | Repurchase agreement dated 3/31/17 with Citigroup Global Markets, Inc., 0.81%, due 4/3/17, proceeds $9,568,913; (collateralized by various U.S. government and agency obligations, 0.00% to 11.50%, due 4/1/17 to 6/1/52, valued at $9,759,632 including accrued interest) | | | 9,568,267 | |
| | 9,568,267 | | | Repurchase agreement dated 3/31/17 with Daiwa Capital Markets America, Inc., 0.82%, due 4/3/17, proceeds $9,568,921; (collateralized by various U.S. government and agency obligations, 0.00% to 6.50%, due 5/11/17 to 12/1/51, valued at $9,759,633 including accrued interest) | | | 9,568,267 | |
See Notes to Financial Statements
VANECK VECTORS MORNINGSTAR WIDE MOAT ETF
SCHEDULE OF INVESTMENTS
(unaudited) (continued)
Principal
Amount | | | | | Value | |
| | | | | | | |
| Repurchase Agreements: (continued) | | | | |
| | $2,013,498 | | | Repurchase agreement dated 3/31/17 with HSBC Securities USA, Inc., 0.77%, due 4/3/17, proceeds $2,013,627; (collateralized by various U.S. government and agency obligations, 0.00% to 2.13%, due 5/15/25 to 11/15/45, valued at $2,053,769 including accrued interest) | | $ | 2,013,498 | |
| | 9,568,267 | | | Repurchase agreement dated 3/31/17 with Merrill Lynch, Pierce, Fenner & Smith, Inc., 0.83%, due 4/3/17, proceeds $9,568,929; (collateralized by various U.S. government and agency obligations, 1.84% to 7.00%, due 5/1/17 to 12/1/46, valued at $9,759,632 including accrued interest) | | | 9,568,267 | |
Principal
Amount | | | | | Value | |
| | | | | | | |
| Repurchase Agreements: (continued) | | | | |
| | $9,568,267 | | | Repurchase agreement dated 3/31/17 with Nomura Securities International, Inc., 0.81%, due 4/3/17, proceeds $9,568,913; (collateralized by various U.S. government and agency obligations, 0.00% to 7.50%, due 4/19/17 to 2/20/67, valued at $9,759,632 including accrued interest) | | $ | 9,568,267 | |
Total Short-Term Investments Held as Collateral for Securities Loaned
(Cost: $40,286,566) | | | 40,286,566 | |
| | | | | |
Total Investments: 103.9%
(Cost: $1,020,998,805) | | | 1,080,108,705 | |
| Liabilities in excess of other assets: (3.9)% | | | (40,315,115 | ) |
| NET ASSETS: 100.0% | | $ | 1,039,793,590 | |
| * | Non-income producing |
| † | Security fully or partially on loan. Total market value of securities on loan is $39,406,343. |
Summary of Investments by Sector Excluding
Collateral for Securities Loaned (unaudited) | | % of Investments | | Value | |
| Consumer Discretionary | | | | 21.7 | % | | | $ | 225,713,335 | |
| Consumer Staples | | | | 5.0 | | | | | 51,802,548 | |
| Financials | | | | 7.3 | | | | | 76,032,823 | |
| Health Care | | | | 35.1 | | | | | 364,513,201 | |
| Industrials | | | | 9.7 | | | | | 101,154,138 | |
| Information Technology | | | | 11.5 | | | | | 119,729,976 | |
| Materials | | | | 4.7 | | | | | 48,967,893 | |
| Real Estate | | | | 5.0 | | | | | 51,908,225 | |
| | | | | 100.0 | % | | | $ | 1,039,822,139 | |
The summary of inputs used to value the Fund’s investments as of March 31, 2017 is as follows:
| | | Level 1
Quoted
Prices | | Level 2
Significant
Observable
Inputs | | Level 3
Significant
Unobservable
Inputs | | | Value | |
| Common Stocks* | | | $ | 1,039,822,139 | | | | | $ | — | | | | | $ | — | | | | $ | 1,039,822,139 | |
| Repurchase Agreements | | | | — | | | | | | 40,286,566 | | | | | | — | | | | | 40,286,566 | |
| Total | | | $ | 1,039,822,139 | | | | | $ | 40,286,566 | | | | | $ | — | | | | $ | 1,080,108,705 | |
| * | See Schedule of Investments for security type and industry sector breakouts. |
There were no transfers between levels during the period ended March 31, 2017.
See Notes to Financial Statements
[This Page Intentionally Left Blank.]
VANECK VECTORS ETF TRUST
STATEMENTS OF ASSETS AND LIABILITIES
March 31, 2017 (unaudited)
| | | | Global
Spin-Off ETF | | | Morningstar
International
Moat ETF | | | Morningstar
Wide Moat ETF | |
| | | | | | | | | | | | | | |
| Assets: | | | | | | | | | | | | |
| Investments, at value (1) (2) | | $ | 5,551,029 | | | $ | 40,275,318 | | | $ | 1,039,822,139 | |
| Short-term investments held as collateral for securities loaned (3) | | | 511,167 | | | | 206,807 | | | | 40,286,566 | |
| Cash | | | 134 | | | | — | | | | — | |
| Cash denominated in foreign currency, at value (4) | | | — | | | | 42,466 | | | | — | |
| Receivables: | | | | | | | | | | | | |
| | Investment securities sold | | | 697,965 | | | | 75,179 | | | | — | |
| | Shares sold | | | — | | | | 101,820 | | | | 1,082 | |
| | Due from Adviser | | | 5,149 | | | | — | | | | — | |
| | Dividends and interest | | | 12,810 | | | | 93,402 | | | | 627,264 | |
| Prepaid expenses | | | 2,751 | | | | 2,181 | | | | 8,647 | |
| | Total assets | | | 6,781,005 | | | | 40,797,173 | | | | 1,080,745,698 | |
| | | | | | | | | | | | | | |
| Liabilities: | | | | | | | | | | | | |
| Payables: | | | | | | | | | | | | |
| | Investment securities purchased | | | 710,157 | | | | 169,504 | | | | — | |
| | Collateral for securities loaned | | | 511,167 | | | | 206,807 | | | | 40,286,566 | |
| | Line of credit | | | — | | | | 104,725 | | | | 146,763 | |
| | Due to Adviser | | | — | | | | 7,325 | | | | 396,386 | |
| | Due to custodian | | | — | | | | 8,983 | | | | 14,420 | |
| Deferred Trustee fees | | | 17 | | | | 71 | | | | 29,616 | |
| Accrued expenses | | | 35,848 | | | | 9,577 | | | | 78,357 | |
| | Total liabilities | | | 1,257,189 | | | | 506,992 | | | | 40,952,108 | |
| NET ASSETS | | $ | 5,523,816 | | | $ | 40,290,181 | | | $ | 1,039,793,590 | |
| Shares outstanding | | | 250,000 | | | | 1,300,000 | | | | 27,700,000 | |
| Net asset value, redemption and offering price per share | | $ | 22.10 | | | $ | 30.99 | | | $ | 37.54 | |
| | | | | | | | | | | | | | |
| Net assets consist of: | | | | | | | | | | | | |
| | Aggregate paid in capital | | $ | 5,029,018 | | | $ | 37,714,393 | | | $ | 1,095,701,669 | |
| | Net unrealized appreciation | | | 466,136 | | | | 2,615,796 | | | | 59,109,899 | |
| | Undistributed net investment income | | | 32,348 | | | | 179,163 | | | | 2,666,797 | |
| | Accumulated net realized loss | | | (3,686 | ) | | | (219,171 | ) | | | (117,684,775 | ) |
| | | | $ | 5,523,816 | | | $ | 40,290,181 | | | $ | 1,039,793,590 | |
| (1) | Value of securities on loan | | $ | 503,846 | | | $ | 195,191 | | | $ | 39,406,343 | |
| (2) | Cost of investments | | $ | 5,084,872 | | | $ | 37,659,843 | | | $ | 980,712,239 | |
| (3) | Cost of short-term investments held as collateral for securities loaned | | $ | 511,167 | | | $ | 206,807 | | | $ | 40,286,566 | |
| (4) | Cost of cash denominated in foreign currency | | $ | — | | | $ | 42,511 | | | $ | — | |
See Notes to Financial Statements
VANECK VECTORS ETF TRUST
STATEMENTS OF OPERATIONS
For the Six Months Ended March 31, 2017 (unaudited)
| | | Global
Spin-Off ETF | | | Morningstar
International
Moat ETF | | | Morningstar
Wide Moat ETF | |
| | | | | | | | | | | | | |
| Income: | | | | | | | | | | | | |
| Dividends | | $ | 42,078 | | | $ | 342,141 | | | $ | 6,983,829 | |
| Securities lending income | | | 3,916 | | | | 5,207 | | | | 205,348 | |
| Foreign taxes withheld | | | (433 | ) | | | (18,554 | ) | | | — | |
| Total income | | | 45,561 | | | | 328,794 | | | | 7,189,177 | |
| | | | | | | | | | | | | |
| Expenses: | | | | | | | | | | | | |
| Management fees | | | 8,782 | | | | 67,305 | | | | 1,967,112 | |
| Professional fees | | | 31,573 | | | | 30,364 | | | | 63,010 | |
| Insurance | | | 18 | | | | 75 | | | | 4,426 | |
| Trustees’ fees and expenses | | | 173 | | | | 688 | | | | 9,814 | |
| Reports to shareholders | | | 8,340 | | | | 9,693 | | | | 33,480 | |
| Indicative optimized portfolio value fee | | | 2,395 | | | | 2,014 | | | | 1,373 | |
| Custodian fees | | | 4,605 | | | | 7,617 | | | | 12,488 | |
| Registration fees | | | 2,286 | | | | 2,839 | | | | 4,950 | |
| Transfer agent fees | | | 1,146 | | | | 1,146 | | | | 956 | |
| Fund accounting fees | | | 340 | | | | 3,773 | | | | 24,371 | |
| Interest | | | — | | | | 744 | | | | 6,055 | |
| Other | | | 1,772 | | | | 1,881 | | | | 9,675 | |
| Total expenses | | | 61,430 | | | | 128,139 | | | | 2,137,710 | |
| Waiver of management fees | | | (8,782 | ) | | | (52,013 | ) | | | (110 | ) |
| Expenses assumed by the Adviser | | | (42,988 | ) | | | — | | | | — | |
| Net expenses | | | 9,660 | | | | 76,126 | | | | 2,137,600 | |
| Net investment income | | | 35,901 | | | | 252,668 | | | | 5,051,577 | |
| | | | | | | | | | | | | |
| Net realized gain (loss) on: | | | | | | | | | | | | |
| Investments | | | 26,480 | | | | 1,249,505 | | | | 23,861,826 | |
| In-kind redemptions | | | — | | | | — | | | | 34,247,770 | |
| Foreign currency transactions and foreign denominated assets and liabilities | | | (204 | ) | | | 1,749 | | | | — | |
| Net realized gain | | | 26,276 | | | | 1,251,254 | | | | 58,109,596 | |
| | | | | | | | | | | | | |
| Net change in unrealized appreciation (depreciation) on: | | | | | | | | | | | | |
| Investments | | | 189,131 | | | | 2,146,920 | | | | 32,012,477 | |
| Foreign currency transactions and foreign denominated assets and liabilities | | | 69 | | | | 79 | | | | — | |
| Net change in unrealized appreciation (depreciation) | | | 189,200 | | | | 2,146,999 | | | | 32,012,477 | |
| Net Increase in Net Assets Resulting from Operations | | $ | 251,377 | | | $ | 3,650,921 | | | $ | 95,173,650 | |
See Notes to Financial Statements
VANECK VECTORS ETF TRUST
STATEMENTS OF CHANGES IN NET ASSETS
| | | Global Spin-Off ETF | | | Morningstar
International Moat ETF | |
| | | For the Six
Months Ended
March 31,
2017 | | | For the Year
Ended
September 30,
2016 | | | For the Six
Months Ended
March 31,
2017 | | | For the Year
Ended
September 30,
2016 | |
| | | (unaudited) | | | | | | | (unaudited) | | | | | |
| Operations: | | | | | | | | | | | | | | | | |
| Net investment income | | $ | 35,901 | | | $ | 57,911 | | | $ | 252,668 | | | $ | 339,352 | |
| Net realized gain (loss) | | | 26,276 | | | | 6,075 | | | | 1,251,254 | | | | (1,083,259 | ) |
| Net change in unrealized appreciation (depreciation) | | | 189,200 | | | | 524,789 | | | | 2,146,999 | | | | 1,665,276 | |
| Net increase in net assets resulting from operations | | | 251,377 | | | | 588,775 | | | | 3,650,921 | | | | 921,369 | |
| | | | | | | | | | | | | | | | | |
| Dividends to shareholders: | | | | | | | | | | | | | | | | |
| Dividends from net investment income | | | (48,600 | ) | | | (16,650 | ) | | | (407,000 | ) | | | (90,000 | ) |
| | | | | | | | | | | | | | | | | |
| Share transactions:** | | | | | | | | | | | | | | | | |
| Proceeds from sale of shares | | | 2,202,041 | | | | — | | | | 24,291,349 | | | | 1,332,150 | |
| Cost of shares redeemed | | | — | | | | — | | | | — | | | | — | |
| Increase (Decrease) in net assets resulting from share transactions | | | 2,202,041 | | | | — | | | | 24,291,349 | | | | 1,332,150 | |
| Total increase in net assets | | | 2,404,818 | | | | 572,125 | | | | 27,535,270 | | | | 2,163,519 | |
| Net Assets, beginning of period | | | 3,118,998 | | | | 2,546,873 | | | | 12,754,911 | | | | 10,591,392 | |
| Net Assets, end of period† | | $ | 5,523,816 | | | $ | 3,118,998 | | | $ | 40,290,181 | | | $ | 12,754,911 | |
| † Including undistributed net investment income | | $ | 32,348 | | | $ | 45,047 | | | $ | 179,163 | | | $ | 333,495 | |
| | | | | | | | | | | | | | | | | |
| ** Shares of Common Stock Issued (no par value) | | | | | | | | | | | | | | | | |
| Shares sold | | | 100,000 | | | | — | | | | 850,000 | | | | 50,000 | |
| Shares redeemed | | | — | | | | — | | | | — | | | | — | |
| Net increase (decrease) | | | 100,000 | | | | — | | | | 850,000 | | | | 50,000 | |
See Notes to Financial Statements
| Morningstar Wide Moat ETF | |
For the Six
Months Ended
March 31,
2017 | | | For the Year
Ended
September 30,
2016 | |
| (unaudited) | | | | | |
| | | | | | | |
| $ | 5,051,577 | | | $ | 10,263,758 | |
| | 58,109,596 | | | | 42,525,390 | |
| | 32,012,477 | | | | 87,339,736 | |
| | 95,173,650 | | | | 140,128,884 | |
| | | | | | | |
| | (9,710,400 | ) | | | (15,301,600 | ) |
| | | | | | | |
| | 334,763,760 | | | | 518,341,447 | |
| | (133,791,233 | ) | | | (632,174,449 | ) |
| | 200,972,527 | | | | (113,833,002 | ) |
| | 286,435,777 | | | | 10,994,282 | |
| | 753,357,813 | | | | 742,363,531 | |
| $ | 1,039,793,590 | | | $ | 753,357,813 | |
| $ | 2,666,797 | | | $ | 7,325,620 | |
| | | | | | | |
| | 9,100,000 | | | | 16,550,000 | |
| | (3,550,000 | ) | | | (20,950,000 | ) |
| | 5,550,000 | | | | (4,400,000 | ) |
See Notes to Financial Statements
VANECK VECTORS ETF TRUST
FINANCIAL HIGHLIGHTS
For a share outstanding throughout each period:
| | | Global Spin-Off ETF | |
| | | For the Six | | | | For the Period | |
| | | Months | | For the Year | | June 9, 2015(a) | |
| | | Ended | | Ended | | through | |
| | | March 31, | | September 30, | | September 30, | |
| | | 2017 | | 2016 | | 2015 | |
| | | | (unaudited) | | | | | | | | | | |
| Net asset value, beginning of period | | | $ | 20.79 | | | | $ | 16.98 | | | | $ | 19.78 | | |
| Income from investment operations: | | | | | | | | | | | | | | | | |
| Net investment income | | | | 0.15 | | | | | 0.39 | | | | | 0.05 | | |
| Net realized and unrealized gain (loss) on investments | | | | 1.48 | | | | | 3.53 | | | | | (2.85 | ) | |
| Total from investment operations | | | | 1.63 | | | | | 3.92 | | | | | (2.80 | ) | |
| Less: | | | | | | | | | | | | | | | | |
| Dividends from net investment income | | | | (0.32 | ) | | | | (0.11 | ) | | | | — | | |
| Net asset value, end of period | | | $ | 22.10 | | | | $ | 20.79 | | | | $ | 16.98 | | |
| Total return (b) | | | | 7.93 | %(c) | | | | 23.22 | % | | | | (14.16 | )%(c) | |
| Ratios/Supplemental Data | | | | | | | | | | | | | | | | |
| Net assets, end of period (000’s) | | | $ | 5,524 | | | | $ | 3,119 | | | | $ | 2,547 | | |
| Ratio of gross expenses to average net assets | | | | 3.48 | %(d) | | | | 5.07 | % | | | | 6.24 | %(d) | |
| Ratio of net expenses to average net assets | | | | 0.55 | %(d) | | | | 0.55 | % | | | | 0.55 | %(d) | |
| Ratio of net expenses, excluding interest expense, to average net assets | | | | 0.55 | %(d) | | | | 0.55 | % | | | | 0.55 | %(d) | |
| Ratio of net investment income to average net assets | | | | 2.04 | %(d) | | | | 2.13 | % | | | | 1.24 | %(d) | |
| Portfolio turnover rate (e) | | | | 36 | %(c) | | | | 58 | % | | | | 30 | %(c) | |
| | | | | | | | | | | | | | | | | |
| | | Morningstar International Moat ETF | |
| | | For the Six | | | | For the Period | |
| | | Months | | For the Year | | July 13, 2015(a) | |
| | | Ended | | Ended | | through | |
| | | March 31, | | September 30, | | September 30, | |
| | | 2017 | | 2016 | | 2015 | |
| | | (unaudited) | | | | | | | | | |
| Net asset value, beginning of period | | | $ | 28.34 | | | | $ | 26.48 | | | | $ | 30.17 | | |
| Income from investment operations: | | | | | | | | | | | | | | | | |
| Net investment income (loss) | | | | 0.27 | (f) | | | | 0.76 | | | | | 0.18 | | |
| Net realized and unrealized gain (loss) on investments | | | | 2.75 | | | | | 1.33 | | | | | (3.87 | ) | |
| Total from investment operations | | | | 3.02 | | | | | 2.09 | | | | | (3.69 | ) | |
| Less: | | | | | | | | | | | | | | | | |
| Dividends from net investment income | | | | (0.37 | ) | | | | (0.23 | ) | | | | — | | |
| Net asset value, end of period | | | $ | 30.99 | | | | $ | 28.34 | | | | $ | 26.48 | | |
| Total return (b) | | | | 10.82 | %(c) | | | | 7.91 | % | | | | (12.23 | )%(c) | |
| Ratios/Supplemental Data | | | | | | | | | | | | | | | | |
| Net assets, end of period (000’s) | | | $ | 40,290 | | | | $ | 12,755 | | | | $ | 10,591 | | |
| Ratio of gross expenses to average net assets | | | | 0.95 | %(d) | | | | 1.62 | % | | | | 2.49 | %(d) | |
| Ratio of net expenses to average net assets | | | | 0.56 | %(d) | | | | 0.56 | % | | | | 0.56 | %(d) | |
| Ratio of net expenses, excluding interest expense, to average net assets | | | | 0.56 | %(d) | | | | 0.56 | % | | | | 0.56 | %(d) | |
| Ratio of net investment income to average net assets | | | | 1.87 | %(d) | | | | 2.99 | % | | | | 3.27 | %(d) | |
| Portfolio turnover rate (e) | | | | 80 | %(c) | | | | 168 | % | | | | 54 | %(c) | |
| (a) | Commencement of operations |
| (b) | Total return is calculated assuming an initial investment made at the net asset value at the beginning of period, reinvestment of any dividends and distributions at net asset value on the dividend/distributions payment date and a redemption at the net asset value on the last day of the period. The return does not reflect the deduction of taxes that a shareholder would pay on Fund dividends/distributions or the redemption of Fund shares. |
| (c) | Not Annualized |
| (d) | Annualized |
| (e) | Portfolio turnover rates exclude securities received or delivered as a result of processing in-kind capital share transactions. |
| (f) | Calculated based upon average shares outstanding. |
See Notes to Financial Statements
| | | Morningstar Wide Moat ETF |
| | | For the | | | | | | | | | | | | | | For the Period |
| | | Six Months | | | | | | | | | | | | | | April 24, |
| | | Ended | | | | | | | | | | | | | | 2012(a) through |
| | | March 31, | | For the Year Ended September 30, | | | September 30, |
| | | 2017 | | | 2016 | | | | 2015 | | | | 2014 | | | | 2013 | | | 2012 |
| | | (unaudited) | | | | | | | | | | | | | | | | | | | | |
| Net asset value, beginning of period | | | $34.01 | | | | $27.96 | | | | $31.27 | | | | $27.09 | | | | $21.54 | | | | $20.15 | |
| Income from investment operations: | | | | | | | | | | | | | | | | | | | | | | | | |
| Net investment income | | | 0.17 | | | | 0.48 | | | | 0.57 | | | | 0.37 | | | | 0.23 | | | | 0.08 | |
| Net realized and unrealized gain (loss) on investments | | | 3.77 | | | | 6.19 | | | | (3.46 | ) | | | 4.04 | | | | 5.46 | | | | 1.31 | |
| Total from investment operations | | | 3.94 | | | | 6.67 | | | | (2.89 | ) | | | 4.41 | | | | 5.69 | | | | 1.39 | |
| Less: | | | | | | | | | | | | | | | | | | | | | | | | |
| Dividends from net investment income | | | (0.41 | ) | | | (0.62 | ) | | | (0.42 | ) | | | (0.23 | ) | | | (0.14 | ) | | | — | |
| Net asset value, end of period | | | $37.54 | | | | $34.01 | | | | $27.96 | | | | $31.27 | | | | $27.09 | | | | $21.54 | |
| Total return (b) | | | 11.66 | %(c) | | | 24.23 | % | | | (9.41 | )% | | | 16.35 | % | | | 26.54 | % | | | 6.90 | %(c) |
| Ratios/Supplemental Data | | | | | | | | | | | | | | | | | | | | | | | | |
| Net assets, end of period (000’s) | | $1,039,794 | | | $753,358 | | | $742,364 | | | $853,616 | | | $364,395 | | | $66,782 | |
| Ratio of gross expenses to average net assets | | | 0.49 | %(d) | | | 0.50 | % | | | 0.50 | % | | | 0.50 | % | | | 0.51 | % | | | 1.04 | %(d) |
| Ratio of net expenses to average net assets | | | 0.49 | %(d) | | | 0.49 | % | | | 0.49 | % | | | 0.49 | % | | | 0.49 | % | | | 0.49 | %(d) |
| Ratio of net expenses, excluding interest expense, to average net assets | | | 0.49 | %(d) | | | 0.49 | % | | | 0.49 | % | | | 0.49 | % | | | 0.49 | % | | | 0.49 | %(d) |
| Ratio of net investment income to average net assets | | | 1.15 | %(d) | | | 1.44 | % | | | 1.88 | % | | | 1.63 | % | | | 1.48 | % | | | 1.62 | %(d) |
| Portfolio turnover rate (e) | | | 30 | %(c) | | | 178 | % | | | 14 | % | | | 15 | % | | | 1 | % | | | 0 | %(c) |
| (a) | Commencement of operations |
| (b) | Total return is calculated assuming an initial investment made at the net asset value at the beginning of period, reinvestment of any dividends and distributions at net asset value on the dividend/distributions payment date and a redemption at the net asset value on the last day of the period. The return does not reflect the deduction of taxes that a shareholder would pay on Fund dividends/distributions or the redemption of Fund shares. |
| (c) | Not Annualized |
| (d) | Annualized |
| (e) | Portfolio turnover rates exclude securities received or delivered as a result of processing in-kind capital share transactions. |
See Notes to Financial Statements
VANECK VECTORS ETF TRUST
NOTES TO FINANCIAL STATEMENTS
March 31, 2017 (unaudited)
Note 1—Fund Organization—VanEck Vectors ETF Trust (the “Trust”) is registered under the Investment Company Act of 1940, as amended, as an open-end management investment company. The Trust was incorporated in Delaware as a statutory trust on March 15, 2001. The Trust operates as a series fund, and as of March 31, 2017, offers fifty-nine investment portfolios, each of which represents a separate series of the Trust.
These financial statements relate only to the following investment portfolios: Global Spin-Off ETF, Morningstar International Moat ETF and Morningstar Wide Moat ETF, (each a “Fund” and, together, the “Funds”). Each Fund’s investment objective is to replicate as closely as possible, before fees and expenses, the price and yield performance of its index. Each Fund, using a “passive” or indexing investment approach, attempts to approximate the investment performance of its index by investing in a portfolio of securities that generally replicates the index.
The Funds’ commencement of operations dates and their respective indices are presented below:
| Fund | | Commencement
of Operations | | Index |
| | | | | |
| Global Spin-Off ETF | | June 9, 2015 | | Horizon Kinetics Global Spin-Off Index(1) |
| Morningstar International Moat ETF | | July 13, 2015 | | Morningstar® Global ex-US Moat Focus IndexSM(2) |
| Morningstar Wide Moat ETF | | April 24, 2012 | | Morningstar® Wide Moat Focus IndexSM(2) |
| (1) | Published by Horizon Kinetics, LLC |
| (2) | Published by Morningstar, Inc. |
Note 2—Significant Accounting Policies—The preparation of financial statements in conformity with U.S. generally accepted accounting principles (“GAAP”) requires management to make estimates and assumptions that affect the reported amounts and disclosures in the financial statements. Actual results could differ from those estimates.
The Funds are investment companies and are following accounting and reporting requirements of Accounting Standards Codification (“ASC”) 946 Financial Services—Investment Companies.
The following is a summary of significant accounting policies followed by the Funds.
A. Security Valuation—The Funds value their investments in securities and other assets and liabilities carried at fair value daily. Fair value is the price that would be received to sell an asset or paid to transfer a liability in an orderly transaction between market participants on the measurement date. Securities traded on national exchanges or traded on the NASDAQ National Market System are valued at the last sales price as reported at the close of each business day. Securities traded on the NASDAQ Stock Market are valued at the NASDAQ official closing price. Over-the-counter securities not included in the NASDAQ National Market System and listed securities for which no sale was reported are valued at the mean of the bid and ask prices. To the extent these securities are actively traded they are categorized as Level 1 in the fair value hierarchy (described below). Certain foreign securities, whose values may be affected by market direction or events occurring before the Funds’ pricing time (4:00 p.m. Eastern Standard Time) but after the last close of the securities’ primary market, are fair valued using a pricing service and are categorized as Level 2 in the fair value hierarchy. The pricing service, using methods approved by the Board of Trustees, considers the correlation of the trading patterns of the foreign security to intraday trading in the U.S. markets, based on indices of domestic securities and other appropriate indicators such as prices of relevant ADR’s and futures contracts. The Funds may also fair value securities in other situations, such as, when a particular foreign market is closed but the Fund is open. Short-term obligations with sixty days or less to maturity are valued at amortized cost, which with accrued interest approximates fair value. Money market fund investments are valued at net asset value and are considered to be Level 1 in the fair value hierarchy. Securities for which quotations are not available are stated at fair value as determined by the Pricing Committee of Van Eck Associates Corporation (the “Adviser”). The Pricing Committee provides oversight of the Funds’ valuation policies and procedures, which are approved by the Funds’ Board of Trustees. Among other things, these procedures allow the Funds to utilize independent pricing services, quotations from securities dealers, and other market sources to determine fair value. The Pricing Committee convenes regularly to review the fair value of financial instruments for which market prices are not readily available. The Pricing Committee employs various methods for calibrating the valuation approaches utilized to determine fair value, including a regular review of key inputs and assumptions, transactional back-testing and disposition analysis.
Certain factors such as economic conditions, political events, market trends, the nature of and duration of any restrictions on disposition, trading in similar securities of the issuer or comparable issuers and other security specific information are used to determine the fair value of these securities. Depending on the relative significance of valuation inputs, these securities may be classified either as Level 2 or Level 3 in the fair value hierarchy. The price which the Funds may realize upon sale of an investment may differ materially from the value presented in the Schedules of Investments.
The Funds utilize various methods to measure the fair value of their investments on a recurring basis, which includes a hierarchy that prioritizes inputs to valuation methods used to measure fair value. The fair value hierarchy gives highest priority to unadjusted quoted prices in active markets for identical assets and liabilities (Level 1 measurements) and the lowest priority to unobservable inputs (Level 3 measurements). The inputs or methodologies used for valuing securities are not necessarily an indication of the risk associated with investing in those securities. The transfers between levels of the fair value hierarchy assume the financial instruments were transferred at the beginning of the reporting period. The three levels of the fair value hierarchy are described below:
Level 1 — Quoted prices in active markets for identical securities.
Level 2 — Significant observable inputs (including quoted prices for similar securities, interest rates, prepayment speeds, credit risk, etc.).
Level 3 — Significant unobservable inputs (including each Fund’s own assumptions in determining the fair value of investments).
A summary of the inputs, the levels used to value the Funds’ investments, and transfers between levels are located in the Schedules of Investments. Additionally, tables that reconcile the valuation of the Funds’ Level 3 investments and that present additional information about valuation methodologies and unobservable inputs, if applicable, are located in the Schedules of Investments.
B. Federal Income Taxes—It is each Fund’s policy to comply with the provisions of the Internal Revenue Code applicable to regulated investment companies and to distribute all of its taxable income to its shareholders. Therefore, no federal income tax provision is required.
C. Dividends and Distributions to Shareholders—Dividends to shareholders from net investment income and distributions from net realized capital gains, if any, are declared and paid annually by each Fund. Income dividends and capital gain distributions are determined in accordance with U.S. income tax regulations, which may differ from such amounts determined in accordance with GAAP.
D. Currency Translation—Assets and liabilities denominated in foreign currencies and commitments under foreign currency contracts are translated into U.S. dollars at the closing prices of such currencies each business day. Purchases and sales of investments are translated at the exchange rates prevailing when such investments are acquired or sold. Foreign denominated income and expenses are translated at the exchange rates prevailing when accrued. The portion of realized and unrealized gains and losses on investments that result from fluctuations in foreign currency exchange rates is not separately disclosed in the financial statements. Recognized gains or losses attributable to foreign currency fluctuations on foreign currency denominated assets, other than investments, and liabilities are recorded as net realized gain (loss) on foreign currency transactions and foreign denominated assets and liabilities in the Statements of Operations.
E. Restricted Securities��The Funds may invest in securities that are subject to legal or contractual restrictions on resale. These securities generally may be resold in transactions exempt from registration or to the public if the securities are registered. Disposal of these securities may involve time-consuming negotiations and expense, and prompt sale at an acceptable price may be difficult. Information regarding restricted securities, if any, is included at the end of each Fund’s Schedule of Investments.
F. Use of Derivative Instruments—The Funds may invest in derivative instruments, including, but not limited to, options, futures, swaps and other derivatives relating to foreign currency transactions. A derivative is an instrument whose value is derived from underlying assets, indices, reference rates or a combination of these factors. Derivative instruments may be privately negotiated contracts (often referred to as over-the-counter (“OTC”) derivatives) or they may be listed and traded on an exchange. Derivative contracts may involve future commitments to purchase or sell
VANECK VECTORS ETF TRUST
NOTES TO FINANCIAL STATEMENTS
(unaudited) (continued)
financial instruments at specified terms on a specified date, or to exchange interest payment streams or currencies based on a notional or contractual amount. Derivative instruments may involve a high degree of financial risk. The use of derivative instruments also involves the risk of loss if the Adviser is incorrect in its expectation of the timing or level of fluctuations in securities prices, interest rates or currency prices. Investments in derivative instruments also include the risk of default by the counterparty, the risk that the investment may not be liquid and the risk that a small movement in the price of the underlying security or benchmark may result in a disproportionately large movement, unfavorable or favorable, in the price of the derivative instruments. The Funds held no derivative instruments during the period ended March 31, 2017.
G. Repurchase Agreements—The Funds may enter into repurchase agreements with financial institutions, deemed to be creditworthy by the Adviser, to generate income from their excess cash balances and to invest securities lending cash collateral. A repurchase agreement is an agreement under which a Fund acquires securities from a seller, subject to resale to the seller at an agreed upon price and date. A Fund, through its custodian/securities lending agent, takes possession of securities collateralizing the repurchase agreement. Pursuant to the terms of the repurchase agreement, such securities must have an aggregate market value greater than or equal to the terms of the repurchase price plus accrued interest at all times. If the value of the underlying securities falls below the value of the repurchase price plus accrued interest, the Funds will require the seller to deposit additional collateral by the next business day. If the request for additional collateral is not met, or the seller defaults on its repurchase obligation, the Funds maintain their right to sell the underlying securities at market value and may claim any resulting loss against the seller. Repurchase agreements held as of March 31, 2017 are reflected in the Schedules of Investments.
H. Offsetting Assets and Liabilities—In the ordinary course of business, the Funds enter into transactions subject to enforceable master netting or other similar agreements. Generally, the right of setoff in those agreements allows the Funds to set off any exposure to a specific counterparty with any collateral received or delivered to that counterparty based on the terms of the agreements. The Funds may pledge or receive cash and/or securities as collateral for derivative instruments, securities lending and repurchase agreements. For financial reporting purposes, the Funds present securities lending and repurchase agreement assets and liabilities on a gross basis in the Statements of Assets and Liabilities. Collateral held at March 31, 2017 is presented in the Schedules of Investments. Refer to related disclosures in Note 2G (Repurchase Agreements) and Note 9 (Securities Lending).
I. Other—Security transactions are accounted for on trade date. Transactions in certain securities may take longer than the customary settlement cycle to be completed. The counterparty is required to collateralize such trades with cash in excess of the market value of the transaction, which is held at the custodian and marked to market daily. Realized gains and losses are calculated on the identified cost basis. Dividend income is recorded on the ex-dividend date except that certain dividends from foreign securities are recognized upon notification of the ex-dividend date/rate. Interest income, including amortization of premiums and discounts, is accrued as earned.
In the normal course of business, the Funds enter into contracts that contain a variety of general indemnifications. The Funds’ maximum exposure under these agreements is unknown as this would involve future claims that may be made against the Funds that have not yet occurred. However, the Adviser believes the risk of loss under these arrangements to be remote.
Note 3—Investment Management and Other Agreements—The Adviser is the investment adviser to the Funds. The Adviser receives a management fee, calculated daily and payable monthly based on an annual rate of each Fund’s average daily net assets. The Adviser has agreed, at least until February 1, 2018, to voluntarily waive or limit its fees and to assume as its own expense certain expenses otherwise payable by the Funds so that each Fund’s total annual operating expenses does not exceed the expense limitations (excluding acquired fund fees and expenses, interest expense, trading expenses, taxes and extraordinary expenses) listed in the table below.
The current management fee rate, expense limitations and the amounts waived/assumed by the Adviser for the period ended March 31, 2017, are as follows:
| Fund | | Management
Fee Rate | | Expense
Limitations | | Waiver of
Management Fees | | Expenses Assumed
by the Adviser |
| Global Spin-Off ETF | | | 0.50 | % | | | 0.55 | % | | $ | 8,782 | | | | $42,988 | |
| Morningstar International Moat ETF | | | 0.50 | | | | 0.56 | | | | 52,013 | | | | — | |
| Morningstar Wide Moat ETF | | | 0.45 | | | | 0.49 | | | | 110 | | | | — | |
In addition, Van Eck Securities Corporation, an affiliate of the Adviser, acts as the Funds’ distributor (“the Distributor”). Certain officers and a Trustee of the Trust are officers, directors or stockholders of the Adviser and Distributor.
Note 4—Investments—For the period ended March 31, 2017, the cost of purchases and proceeds from sales of investments other than U.S. government obligations and short-term obligations (excluding in-kind transactions described in Note 6) were as follows:
| Fund | | Cost of Investments
Purchased | | Proceeds from
Investments Sold |
| Global Spin-Off ETF | | $ | 1,267,374 | | | $ | 1,283,767 | |
| Morningstar International Moat ETF | | | 22,717,057 | | | | 21,751,378 | |
| Morningstar Wide Moat ETF | | | 261,577,181 | | | | 266,218,405 | |
Note 5—Income Taxes—As of March 31, 2017, for Federal income tax purposes, the identified cost of investments owned, net unrealized appreciation, gross unrealized appreciation, and gross unrealized depreciation of investments were as follows:
| Fund | | Cost of Investments | | Gross Unrealized
Appreciation | | Gross Unrealized
Depreciation | | Net Unrealized
Appreciation
(Depreciation) |
| Global Spin-Off ETF | | $ | 5,596,336 | | | $ | 625,529 | | | $ | (159,669 | ) | | $ | 465,860 | |
| Morningstar International Moat ETF | | | 37,897,373 | | | | 2,703,651 | | | | (118,899 | ) | | | 2,584,752 | |
| Morningstar Wide Moat ETF | | | 1,021,017,794 | | | | 79,648,679 | | | | (20,557,768 | ) | | | 59,090,911 | |
The tax character of dividends paid to shareholders during the years ended September 30, 2016 was as follows:
| Fund | | 2016 Dividends
Ordinary Income |
| Global Spin-Off ETF | | $ | 16,650 | |
| Morningstar International Moat ETF | | | 90,000 | |
| Morningstar Wide Moat ETF | | | 15,301,600 | |
The tax character of current year distributions will be determined at the end of the current fiscal year.
At September 30, 2016, the Funds had capital loss carryforwards available to offset future capital gains, as follows:
| Fund | | Post-Effective-
No Expiration
Short-Term
Capital Losses | | Post-Effective-
No Expiration
Long-Term
Capital Losses |
| Global Spin-Off ETF | | $ | — | | | $ | 24,255 | |
| Morningstar International Moat ETF | | | 1,339,859 | | | | 126,855 | |
| Morningstar Wide Moat ETF | | | 139,290,799 | | | | 36,484,583 | |
During the year ended September 30, 2016, Global Spin-Off ETF utilized $13,526 of its accumulated capital loss carryforwards.
The Funds recognize the tax benefits of uncertain tax positions only where the position is “more-likely-than-not” to be sustained assuming examination by applicable tax authorities. Management has analyzed the Funds’ tax positions, and has concluded that no liability for unrecognized tax benefits should be recorded related to uncertain tax positions taken on return filings for all open tax years. The Funds do not have exposure for additional years that might still be open in certain foreign jurisdictions. Therefore, no provision for income tax is required in the Funds’ financial statements. However, the Funds are subject to foreign taxes on the appreciation in value of certain investments. The Funds provide for such taxes on both realized and unrealized appreciation.
The Funds recognize interest and penalties, if any, related to uncertain tax positions as income tax expense in the Statements of Operations. During the period ended March 31, 2017, the Funds did not incur any interest or penalties.
Note 6—Capital Share Transactions—As of March 31, 2017, there were an unlimited number of capital shares of beneficial interest authorized by the Trust with no par value. Shares are issued and redeemed by the Funds only in Creation Units, consisting of 50,000 shares, or multiples thereof. The consideration for the purchase or redemption of
VANECK VECTORS ETF TRUST
NOTES TO FINANCIAL STATEMENTS
(unaudited) (continued)
Creation Units of the Funds generally consists of the in-kind contribution or distribution of securities constituting the Funds’ underlying index plus a small amount of cash. For the period ended March 31, 2017, the Funds had in-kind contributions and redemptions as follows:
| Fund | | In-Kind Contributions | | In-Kind Redemptions |
| Global Spin-Off ETF | | $ | 2,205,402 | | | $ | — | |
| Morningstar International Moat ETF | | | 23,147,508 | | | | — | |
| Morningstar Wide Moat ETF | | | 334,797,573 | | | | 133,914,174 | |
The in-kind contributions and in-kind redemptions in this table represent the accumulation of each Fund’s daily net shareholder transactions including rebalancing activity, while the Statements of Changes in Net Assets reflect shareholder transactions including any cash component of the transactions.
Note 7—Concentration of Risk—The investment objective of each Fund is to seek investment results that correspond generally to the price and yield performance, before fees and expenses, of its underlying index, as indicated in the name of each Fund. The Adviser uses a “passive” or index approach to achieve each Fund’s investment objective by investing in a portfolio of securities that generally replicates the Funds’ index. Each of the Funds is classified as a non-diversified fund under the 1940 Act. Non-diversified funds generally hold securities of fewer issuers than diversified funds and may be more susceptible to the risks associated with these particular issuers, or to a single economic, political or regulatory occurrence affecting these issuers. The Funds may purchase securities on foreign exchanges. Securities of foreign issuers involve special risks and considerations not typically associated with investing in U.S. issuers. These risks include devaluation of currencies, currency controls, less reliable information about issuers, different securities transaction clearance and settlement practices, future adverse political and economic developments and local/regional conflicts. These risks are heightened for investments in emerging market countries. Moreover, securities of many foreign issuers and their markets may be less liquid and their prices more volatile than those of comparable U.S. issuers.
Global Spin-Off ETF may invest in companies that have been spun-off from a parent company for a number of reasons, including but not limited to low growth prospects, high capital requirements or an unfavorable capitalization structure. Investments in spun-off companies are subject to the risk that any of these characteristics will adversely affect the value of investments in the spun-off companies. There can be no assurance that a spun-off company will be financially independent or profitable, especially where the company represented a non-core or non-competitive business line of the parent company at the time of the spin-off.
Global Spin-Off ETF may invest directly in real estate investment trusts (“REITs”) and is exposed to the risk of owning real estate directly, as well as to risks that relate specifically to the way in which REITs are organized and operated. REITs generally invest directly in real estate, in mortgages or in some combination of the two. The Fund indirectly bears management expenses along with the direct expenses of the Fund. Individual REITs may own a limited number of properties and may concentrate in a particular region or property type. REITs may also be subject to heavy cash flow dependency, default by borrowers and self-liquidation.
In 2016, the United Kingdom decided to leave the European Union (“EU”), creating economic and political uncertainty in its wake. Significant uncertainty exists regarding the timing of the United Kingdom’s withdrawal from the EU and the effects such withdrawal will have on the Euro, European economies and the global markets. This may further impact, the value of the Euro and the British pound sterling, and has caused volatility and uncertainty in European and global markets.
Note 8—Trustee Deferred Compensation Plan—The Trust has a Deferred Compensation Plan (the “Plan”) for Trustees under which the Trustees can elect to defer receipt of their trustee fees until retirement, disability or termination from the Board of Trustees. The fees otherwise payable to the participating Trustees are deemed invested in shares of the Funds as directed by the Trustees.
The expense for the Plan is included in “Trustees’ fees and expenses” in the Statements of Operations. The liability for the Plan is shown as “Deferred Trustee fees” in the Statements of Assets and Liabilities.
Note 9—Securities Lending—To generate additional income, each of the Funds may lend its securities pursuant to a securities lending agreement with The Bank of New York Mellon, the securities lending agent and also the Funds’ custodian. Each Fund may lend up to 33% of its investments requiring that the loan be continuously collateralized by cash, U.S. government or U.S. government agency securities, shares of an investment trust or mutual fund, or any combination of cash and such securities at all times equal to at least 102% (105% for foreign securities) of the market
value plus accrued interest on the securities loaned. Daily market fluctuations could cause the value of loaned securities to be more or less than the value of the collateral received. When this occurs, the collateral is adjusted and settled on the next business day. During the term of the loan, the Funds will continue to receive any dividends, interest or amounts equivalent thereto, on the securities loaned while receiving a fee from the borrower and/or earning interest on the investment of the cash collateral. Such fees and interest are shared with the securities lending agent under the terms of the securities lending agreement. The Funds may pay reasonable finders’, administrative and custodial fees in connection with a loan of its securities. Securities lending income is disclosed as such in the Statements of Operations. The collateral for securities loaned is recognized in the Schedules of Investments and the Statements of Assets and Liabilities. The cash collateral is maintained on the Funds’ behalf by the lending agent and is invested in repurchase agreements collateralized by obligations of the U.S. Treasury and/or Government Agencies. Loans are subject to termination at the option of the borrower or the Funds. Upon termination of the loan, the borrower will return to the lender securities identical to the securities loaned. The Funds bear the risk of delay in recovery of, or even loss of rights in, the securities loaned should the borrower of the securities fail financially. The value of loaned securities and related collateral outstanding at March 31, 2017 are presented on a gross basis in the Schedules of Investments and Statements of Assets and Liabilities.
The following table presents repurchase agreements held as collateral by type of security on loan pledged as of March 31, 2017:
| | | Gross Amount of Recognized
Liabilities for Securities Loaned
in the Statements of Assets
and Liabilities* |
| Fund | | Equity Securities |
| Global Spin-Off ETF | | $ | 511,167 | |
| Morningstar International Moat ETF | | | 206,807 | |
| Morningstar Wide Moat ETF | | | 40,286,566 | |
| * | Remaining contractual maturity of the agreements: overnight and continuous |
Note 10—Bank Line of Credit—The Funds may participate in a $200 million committed credit facility (the “Facility”) to be utilized for temporary financing until the settlement of sales or purchases of portfolio securities, the repurchase or redemption of shares of the Funds at the request of the shareholders and other temporary or emergency purposes. The Funds have agreed to pay commitment fees, pro rata, based on the unused but available balance. Interest is charged to the Funds at rates based on prevailing market rates in effect at the time of borrowings. During the period ended March 31, 2017, the following Funds borrowed under this Facility:
| Fund | | Days
Outstanding | | Average Daily
Loan Balance | | Average
Interest Rate | | Outstanding Loan
Balance as of
March 31, 2017 |
| Morningstar International Moat ETF | | | 30 | | | $ | 114,061 | | | | 2.17 | % | | $ | 104,725 | |
| Morningstar Wide Moat ETF | | | 126 | | | | 727,169 | | | | 2.00 | | | | 146,763 | |
Note 11—Custodian Fees—The Funds have entered into an expense offset agreement with the custodian wherein they receive a credit toward the reduction of custodian fees whenever there are uninvested cash balances. The Funds could have invested their cash balances elsewhere if they had not agreed to a reduction in fees under the expense offset agreement with the custodian. For the period ended March 31, 2017, there were offsets to custodian fees and these amounts are reflected in custody expense in the Statement of Operations.
Note 12—Recent Accounting Pronouncements—The Funds adopted Accounting Standards Update No. 2014-15 (“ASU 2014-15”), Disclosure of Uncertainties about an Entity’s Ability to Continue as a Going Concern, which requires management to assess the Funds’ ability to continue as a going concern and to provide related disclosures in certain circumstances. Under the new standard, disclosures are required when conditions give rise to substantial doubt about a company’s ability to continue as a going concern within one year from the financial statement issuance date. Based on management’s evaluation, there are no conditions or events that could adversely affect the Funds’ ability to meet their obligations within one year after the date the financial statements are issued. Accordingly, no disclosures are required specific to going concern uncertainties in the Funds’ financial statements.
VANECK VECTORS ETF TRUST
NOTES TO FINANCIAL STATEMENTS
(unaudited) (continued)
In October 2016, the Securities and Exchange Commission (the “SEC”) released its Final Rule on Investment Company Reporting Modernization (the “Rule”). The Rule contains amendments to Regulation S-X which impact financial statement presentation, particularly the presentation of derivative investments. Although still evaluating the impact of the Rule, management believes that many of the Regulation S-X amendments are consistent with the Funds’ current financial statement presentation and expects that the Funds will be able to comply with the Rule’s Regulation S-X amendments by the August 1, 2017 compliance date.
Note 13—Subsequent Event Review—The Funds have evaluated subsequent events and transactions for potential recognition or disclosure through the date the financial statements were issued.
This report is intended for the Funds’ shareholders. It may not be distributed to prospective investors unless it is preceded or accompanied by a VanEck Vectors ETF Trust (the “Trust”) Prospectus, which includes more complete information. An investor should consider the investment objective, risks, and charges and expenses of the Funds carefully before investing. The prospectus contains this and other information about the investment company. Please read the prospectus carefully before investing.
Additional information about the Trust’s Board of Trustees/Officers and a description of the policies and procedures the Trust uses to determine how to vote proxies relating to portfolio securities are provided in the Statement of Additional Information. The Statement of Additional Information and information regarding how the Trust voted proxies relating to portfolio securities during the most recent twelve month period ending June 30 is available, without charge, by calling 800.826.2333, or by visiting vaneck.com, or on the Securities and Exchange Commission’s website at http://www.sec.gov.
The Trust files its complete schedule of portfolio holdings with the Securities and Exchange Commission for the first and third quarters of each fiscal year on Form N-Q. The Trust’s Form N-Qs are available on the Commission’s website at http://www.sec.gov and may be reviewed and copied at the Commission’s Public Reference Room in Washington, D.C. Information on the operation of the Public Reference Room may be obtained by calling 202.942.8090. The Funds’ complete schedules of portfolio holdings are also available by calling 800.826.2333 or by visiting vaneck.com.

| Investment Adviser: | Van Eck Associates Corporation | |
| Distributor: | Van Eck Securities Corporation 666 Third Avenue, New York, NY 10017 vaneck.com | |
| Account Assistance: | 800.826.2333 | STRATSAR |
Item 2. CODE OF ETHICS.

  Not applicable.

Item 3. AUDIT COMMITTEE FINANCIAL EXPERT.

  Not applicable.

Item 4. PRINCIPAL ACCOUNTANT FEES AND SERVICES.

  Not applicable.


Item 5. AUDIT COMMITTEE OF LISTED REGISTRANTS.

     Not applicable.

Item 6. SCHEDULE OF INVESTMENTS.

     Information included in Item 1.

Item 7. DISCLOSURE OF PROXY VOTING POLICIES AND PROCEDURES FOR CLOSED-END
        MANAGEMENT INVESTMENT COMPANIES.

     Not applicable.

Item 8. PORTFOLIO MANAGER OF CLOSED-END MANAGEMENT INVESTMENT COMPANIES.

     Not applicable.

Item 9. PURCHASE OF EQUITY SECURITIES BY CLOSED-END MANAGEMENT INVESTMENT
        COMPANY AND AFFILIATED PURCHASERS.

     Not applicable.

Item 10. SUBMISSION OF MATTERS TO A VOTE OF SECURITY HOLDERS.

     Not applicable.

Item 11. CONTROLS AND PROCEDURES.

(a)  The registrant's principal executive and principal financial officers, or
     persons performing similar functions, have concluded that the registrant's
     disclosure controls and procedures (as defined in Rule 30a-3(c) under the
     Investment Company Act of 1940, as amended (the "1940 Act") (17 CFR
     270.30a-3(c)) are effective, as of a date within 90 days of the filing
     date of the report that includes the disclosure required by this paragraph,
     based on their evaluation of these controls and procedures required
     by Rule 30a-3(b) under the 1940 Act (17 CFR 270.30a-3(b)) and Rules
     13a-15(b) or 15d-15(b) under the Securities Exchange Act of 1934,
     as amended (17 CFR 240.13a-15(b) or 240.15d-15(b)).

(b)  There were no changes in the registrant's internal control over financial
     reporting (as defined in Rule 30a-3(d) under the 1940 Act (17 CFR
     270.30a-3(d)) that occurred during the second fiscal quarter of the period
     covered by this report that has materially affected, or is reasonably
     likely to materially affect, the registrant's internal control over
     financial reporting.


Item 12. EXHIBITS.

(a)(1) Not applicable.

(a)(2) A separate certification for each principal executive officer and
       principal financial officer of the registrant as required by Rule 30a-2(a)
       under the Act (17 CFR 270.30a-2(a)) is attached as Exhibit 99.CERT.

(b)  Certification pursuant to Section 906 of the Sarbanes-Oxley Act of 2002 is
     furnished as Exhibit 99.906CERT.
                                   SIGNATURES


Pursuant to the requirements of the Securities Exchange Act of 1934 and the
Investment Company Act of 1940, the registrant has duly caused this report to be
signed on its behalf by the undersigned, thereunto duly authorized.

(Registrant) VANECK VECTORS ETF TRUST

By (Signature and Title) /s/ John J. Crimmins, Treasurer & Chief Financial Officer
                         ---------------------------------------------------------
Date June 8, 2017
     ---------------

Pursuant to the requirements of the Securities Exchange Act of 1934 and the
Investment Company Act of 1940, this report has been signed below by the
following persons on behalf of the registrant and in the capacities and on the
dates indicated.

By (Signature and Title) /s/ Jan F. van Eck, Chief Executive Officer
                        --------------------------------------------
Date June 8, 2017
     ---------------

By (Signature and Title)  /s/ John J. Crimmins, Treasurer & Chief Financial Officer
                        -----------------------------------------------------------

Date June 8, 2017
     ---------------