UNITED STATES
SECURITIES AND EXCHANGE COMMISSION
Washington, D.C. 20549
FORM N-CSR
CERTIFIED SHAREHOLDER REPORT OF REGISTERED MANAGEMENT
INVESTMENT COMPANIES
Investment Company Act file number 811-10325
VANECK ETF TRUST
(Exact name of registrant as specified in charter)
666 Third Avenue, New York, NY 10017
(Address of principal executive offices) (Zip code)
Van Eck Associates Corporation
666 Third Avenue, New York, NY 10017
(Name and address of agent for service)
Registrant’s telephone number, including area code: (212) 293-2000
Date of fiscal year end: SEPTEMBER 30
Date of reporting period: SEPTEMBER 30, 2024
| Item 1. | REPORTS TO STOCKHOLDERS. |
Principal U.S. Listing Exchange: The NASDAQ Stock Market LLC
Annual Shareholder Report - September 30, 2024
This annual shareholder report contains important information about the VanEck Biotech ETF for the period October 1, 2023 to September 30, 2024. You can find additional information about the Fund at https://www.vaneck.com/us/en/etf-mutual-fund-finder/etfs/documents/. You can also request this information by contacting us at 800.826.2333 or info@vaneck.com.
What were the Fund costs for the last year?
(based on a hypothetical $10,000 investment)
| Fund Name | Costs of a $10,000 investment | Costs paid as a % of a $10,000 investment |
|---|
| VanEck Biotech ETF | $38 | 0.35% |
How did the Fund perform last year?
The Fund had a strong year led by industry breakthroughs and innovations in drug development, although regulatory delays in certain areas limited broader gains.
The healthcare sector was the top contributor, as advancements in gene therapies and vaccines fueled growth.
Amgen, Inc. was the top individual contributor, benefiting from the approval and commercialization of new drugs.
Biogen, Inc. was the leading detractor due to decreased revenues from its multiple sclerosis drugs, slower-than-expected uptake of new products like the Alzheimer's drug Leqembi, and strategic adjustments including leadership changes and restructuring efforts.
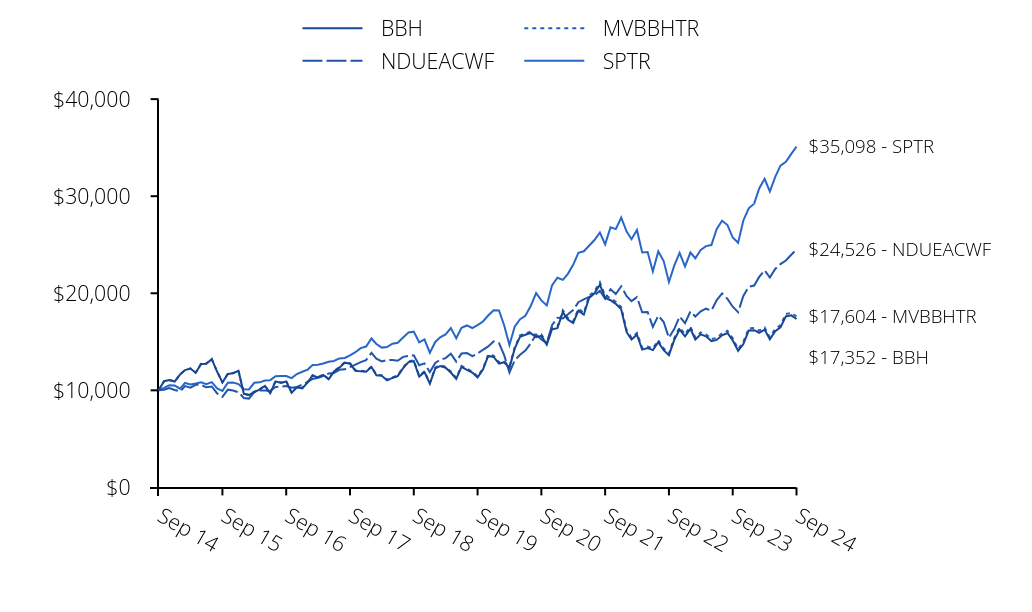
How did the Fund perform over the past 10 years?
Cumulative Performance Based on $10,000 Investment
| BBH | NDUEACWF | MVBBHTR | SPTR |
|---|
| Sep 14 | $10,000 | $10,000 | $10,000 | $10,000 |
| Oct 14 | $10,937 | $10,070 | $10,941 | $10,244 |
| Nov 14 | $11,068 | $10,239 | $11,072 | $10,520 |
| Dec 14 | $10,902 | $10,041 | $10,909 | $10,493 |
| Jan 15 | $11,632 | $9,884 | $11,641 | $10,178 |
| Feb 15 | $12,088 | $10,435 | $12,099 | $10,763 |
| Mar 15 | $12,246 | $10,273 | $12,259 | $10,593 |
| Apr 15 | $11,812 | $10,571 | $11,827 | $10,695 |
| May 15 | $12,722 | $10,557 | $12,739 | $10,832 |
| Jun 15 | $12,740 | $10,309 | $12,756 | $10,622 |
| Jul 15 | $13,211 | $10,398 | $13,229 | $10,845 |
| Aug 15 | $11,909 | $9,685 | $11,925 | $10,191 |
| Sep 15 | $10,813 | $9,334 | $10,830 | $9,939 |
| Oct 15 | $11,693 | $10,067 | $11,713 | $10,777 |
| Nov 15 | $11,754 | $9,984 | $11,775 | $10,809 |
| Dec 15 | $12,014 | $9,804 | $12,039 | $10,638 |
| Jan 16 | $9,638 | $9,213 | $9,662 | $10,111 |
| Feb 16 | $9,511 | $9,149 | $9,536 | $10,097 |
| Mar 16 | $9,829 | $9,827 | $9,854 | $10,782 |
| Apr 16 | $10,073 | $9,972 | $10,102 | $10,824 |
| May 16 | $10,451 | $9,985 | $10,480 | $11,018 |
| Jun 16 | $9,702 | $9,924 | $9,728 | $11,047 |
| Jul 16 | $10,920 | $10,352 | $10,952 | $11,454 |
| Aug 16 | $10,772 | $10,387 | $10,804 | $11,470 |
| Sep 16 | $10,918 | $10,451 | $10,954 | $11,472 |
| Oct 16 | $9,741 | $10,273 | $9,770 | $11,263 |
| Nov 16 | $10,310 | $10,351 | $10,341 | $11,680 |
| Dec 16 | $10,208 | $10,575 | $10,240 | $11,911 |
| Jan 17 | $10,826 | $10,864 | $10,863 | $12,137 |
| Feb 17 | $11,525 | $11,169 | $11,563 | $12,619 |
| Mar 17 | $11,323 | $11,305 | $11,362 | $12,633 |
| Apr 17 | $11,586 | $11,482 | $11,628 | $12,763 |
| May 17 | $11,145 | $11,735 | $11,185 | $12,943 |
| Jun 17 | $11,934 | $11,789 | $11,980 | $13,023 |
| Jul 17 | $12,339 | $12,118 | $12,391 | $13,291 |
| Aug 17 | $12,851 | $12,164 | $12,906 | $13,332 |
| Sep 17 | $12,749 | $12,399 | $12,805 | $13,607 |
| Oct 17 | $12,020 | $12,657 | $12,077 | $13,925 |
| Nov 17 | $11,954 | $12,902 | $12,011 | $14,352 |
| Dec 17 | $11,906 | $13,110 | $11,965 | $14,511 |
| Jan 18 | $12,393 | $13,850 | $12,458 | $15,342 |
| Feb 18 | $11,550 | $13,268 | $11,610 | $14,777 |
| Mar 18 | $11,492 | $12,984 | $11,554 | $14,401 |
| Apr 18 | $11,029 | $13,108 | $11,092 | $14,456 |
| May 18 | $11,277 | $13,124 | $11,342 | $14,804 |
| Jun 18 | $11,460 | $13,053 | $11,529 | $14,895 |
| Jul 18 | $12,290 | $13,447 | $12,367 | $15,450 |
| Aug 18 | $12,912 | $13,552 | $12,995 | $15,953 |
| Sep 18 | $13,003 | $13,611 | $13,090 | $16,044 |
| Oct 18 | $11,422 | $12,591 | $11,502 | $14,947 |
| Nov 18 | $11,873 | $12,776 | $11,957 | $15,252 |
| Dec 18 | $10,690 | $11,876 | $10,769 | $13,875 |
| Jan 19 | $12,259 | $12,813 | $12,352 | $14,987 |
| Feb 19 | $12,494 | $13,156 | $12,588 | $15,468 |
| Mar 19 | $12,335 | $13,322 | $12,432 | $15,769 |
| Apr 19 | $11,839 | $13,771 | $11,935 | $16,407 |
| May 19 | $11,182 | $12,955 | $11,273 | $15,364 |
| Jun 19 | $12,420 | $13,803 | $12,523 | $16,447 |
| Jul 19 | $12,114 | $13,843 | $12,218 | $16,684 |
| Aug 19 | $11,831 | $13,515 | $11,933 | $16,419 |
| Sep 19 | $11,334 | $13,799 | $11,434 | $16,727 |
| Oct 19 | $12,134 | $14,177 | $12,245 | $17,089 |
| Nov 19 | $13,539 | $14,523 | $13,664 | $17,709 |
| Dec 19 | $13,443 | $15,034 | $13,568 | $18,244 |
| Jan 20 | $12,755 | $14,868 | $12,877 | $18,237 |
| Feb 20 | $12,897 | $13,667 | $13,019 | $16,735 |
| Mar 20 | $12,322 | $11,822 | $12,435 | $14,668 |
| Apr 20 | $14,289 | $13,089 | $14,419 | $16,549 |
| May 20 | $15,527 | $13,658 | $15,668 | $17,337 |
| Jun 20 | $15,720 | $14,094 | $15,865 | $17,682 |
| Jul 20 | $15,891 | $14,840 | $16,043 | $18,679 |
| Aug 20 | $15,472 | $15,748 | $15,622 | $20,021 |
| Sep 20 | $15,608 | $15,240 | $15,760 | $19,260 |
| Oct 20 | $14,713 | $14,870 | $14,860 | $18,748 |
| Nov 20 | $16,293 | $16,703 | $16,455 | $20,801 |
| Dec 20 | $16,407 | $17,478 | $16,571 | $21,600 |
| Jan 21 | $18,058 | $17,399 | $18,245 | $21,382 |
| Feb 21 | $17,285 | $17,802 | $17,463 | $21,972 |
| Mar 21 | $16,940 | $18,277 | $17,116 | $22,934 |
| Apr 21 | $18,209 | $19,076 | $18,403 | $24,158 |
| May 21 | $17,790 | $19,373 | $17,981 | $24,327 |
| Jun 21 | $19,509 | $19,628 | $19,722 | $24,895 |
| Jul 21 | $20,004 | $19,764 | $20,230 | $25,486 |
| Aug 21 | $20,892 | $20,258 | $21,131 | $26,261 |
| Sep 21 | $19,530 | $19,422 | $19,756 | $25,040 |
| Oct 21 | $19,283 | $20,413 | $19,512 | $26,794 |
| Nov 21 | $18,912 | $19,921 | $19,137 | $26,608 |
| Dec 21 | $18,338 | $20,718 | $18,559 | $27,801 |
| Jan 22 | $15,991 | $19,701 | $16,182 | $26,362 |
| Feb 22 | $15,236 | $19,192 | $15,416 | $25,573 |
| Mar 22 | $15,725 | $19,607 | $15,914 | $26,522 |
| Apr 22 | $14,195 | $18,038 | $14,368 | $24,209 |
| May 22 | $14,348 | $18,059 | $14,522 | $24,254 |
| Jun 22 | $14,144 | $16,537 | $14,316 | $22,252 |
| Jul 22 | $14,969 | $17,692 | $15,156 | $24,304 |
| Aug 22 | $14,135 | $17,040 | $14,312 | $23,312 |
| Sep 22 | $13,624 | $15,409 | $13,795 | $21,165 |
| Oct 22 | $15,216 | $16,339 | $15,414 | $22,879 |
| Nov 22 | $16,270 | $17,606 | $16,481 | $24,158 |
| Dec 22 | $15,567 | $16,913 | $15,770 | $22,766 |
| Jan 23 | $16,335 | $18,126 | $16,547 | $24,196 |
| Feb 23 | $15,234 | $17,606 | $15,432 | $23,606 |
| Mar 23 | $15,766 | $18,149 | $15,972 | $24,473 |
| Apr 23 | $15,567 | $18,410 | $15,775 | $24,855 |
| May 23 | $15,071 | $18,213 | $15,272 | $24,963 |
| Jun 23 | $15,196 | $19,270 | $15,400 | $26,612 |
| Jul 23 | $15,665 | $19,976 | $15,879 | $27,467 |
| Aug 23 | $15,910 | $19,418 | $16,127 | $27,030 |
| Sep 23 | $15,155 | $18,615 | $15,363 | $25,741 |
| Oct 23 | $14,055 | $18,055 | $14,252 | $25,200 |
| Nov 23 | $14,772 | $19,721 | $14,977 | $27,501 |
| Dec 23 | $16,170 | $20,669 | $16,392 | $28,750 |
| Jan 24 | $16,197 | $20,790 | $16,426 | $29,233 |
| Feb 24 | $15,930 | $21,682 | $16,152 | $30,794 |
| Mar 24 | $16,255 | $22,363 | $16,482 | $31,785 |
| Apr 24 | $15,256 | $21,625 | $15,474 | $30,487 |
| May 24 | $16,098 | $22,503 | $16,325 | $31,999 |
| Jun 24 | $16,484 | $23,004 | $16,717 | $33,147 |
| Jul 24 | $17,614 | $23,375 | $17,869 | $33,550 |
| Aug 24 | $17,728 | $23,969 | $17,984 | $34,364 |
| Sep 24 | $17,352 | $24,526 | $17,604 | $35,098 |
This chart shows the value of a hypothetical $10,000 investment in the Fund at NAV over the past 10 fiscal years.
Average Annual Total Returns
| . | 1 Year | 5 Years | 10 Years |
|---|
| VanEck Biotech ETF | 14.50% | 8.89% | 5.67% |
MVIS® US Listed Biotech 25 Index (MVBBHTR) | 14.59% | 9.01% | 5.82% |
| MSCI ACWI Net TR Index (NDUEACWF) | 31.76% | 12.19% | 9.39% |
| S&P 500 Index Total Return (SPTR) | 36.35% | 15.98% | 13.38% |
The performance data quoted represents past performance. Past performance is no guarantee of future results. Performance information for the Fund may reflect temporary fee waivers, if applicable. Had the Fund incurred all expenses, investment returns would have been reduced. These returns do not reflect the deduction of taxes that a shareholder would pay on Fund dividends and distributions or the or sale of Fund shares.
Investment returns and value of the shares of the Fund will fluctuate so that an investor's shares, when sold, may be worth more or less than their original cost. Performance may be lower or higher than performance data quoted. Fund returns reflect reinvestment of dividends and capital gains distributions. Returns for actual Fund investors may differ from what is shown because of differences in timing, the amount invested and fees and expenses.
Index returns are not Fund returns and do not reflect any management fees or brokerage expenses. Certain indices may take into account withholding taxes. Investors can not invest directly in the Index. The Index is unmanaged and includes the reinvestment of all dividends.
- Total Net Assets$451,990,340
- Number of Portfolio Holdings25
- Portfolio Turnover Rate19%
- Advisory Fees Paid$1,572,343
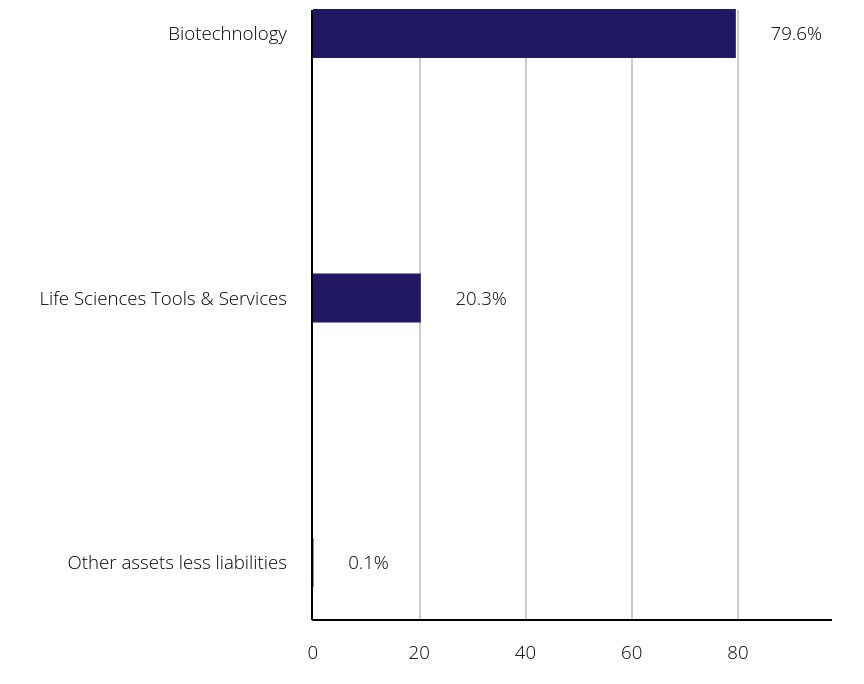
What did the Fund invest in?
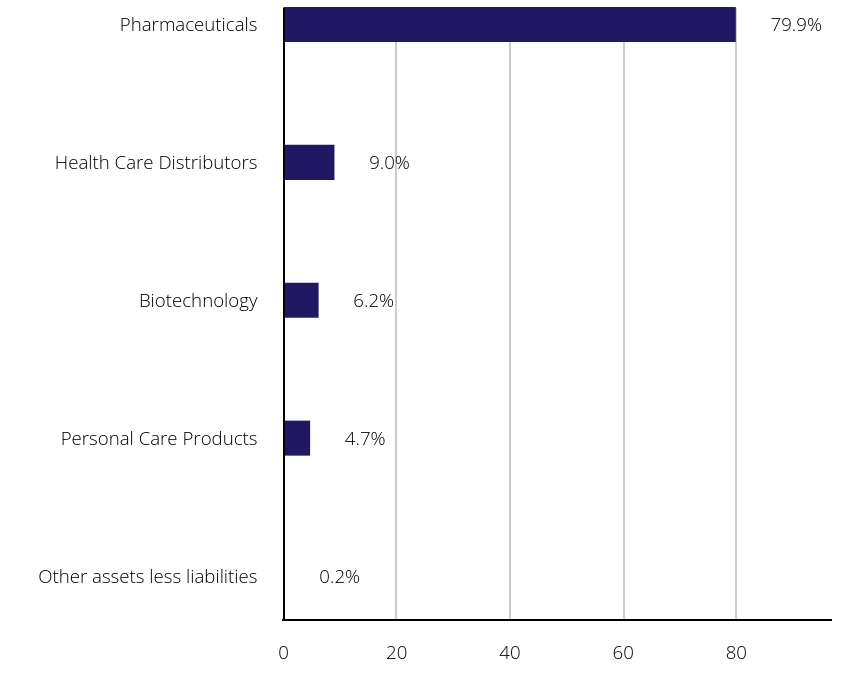
Portfolio Composition (% of Total Net Assets)
| Value | Value | Value |
|---|
| Other assets less liabilities | | 0.1% |
| Life Sciences Tools & Services | | 20.3% |
| Biotechnology | | 79.6% |
Top Ten Holdings (% of Total Net Assets)
| Amgen, Inc. | | 16.8% |
| Vertex Pharmaceuticals, Inc. | | 9.9% |
| Gilead Sciences, Inc. | | 9.2% |
| Regeneron Pharmaceuticals, Inc. | | 8.6% |
| IQVIA Holdings, Inc. | | 5.0% |
| Argenx SE | | 4.6% |
| ICON Plc | | 4.5% |
| Biogen, Inc. | | 4.2% |
| Moderna, Inc. | | 3.8% |
| Illumina, Inc. | | 3.7% |
Householding is an option available to certain fund investors. Householding is a method of delivery, based on the preference of the individual investor, in which a single copy of certain shareholder documents can be delivered to investors who share the same address, even if their accounts are registered under different names. Please contact your broker-dealer if you are interested in enrolling in householding and receiving a single copy of prospectuses and other shareholder documents, or if you are currently enrolled in householding and wish to change your householding status.
Need Additional Information?
If you wish to view additional information about the Fund including but not limited to financial statements, prospectus or holdings please scan the QR code or visit https://www.vaneck.com/us/en/etf-mutual-fund-finder/etfs/documents/.
VanEck Commodity Strategy ETF
Principal U.S. Listing Exchange: Cboe BZX Exchange, Inc.
Annual Shareholder Report - September 30, 2024
This annual shareholder report contains important information about the VanEck Commodity Strategy ETF for the period October 1, 2023 to September 30, 2024. You can find additional information about the Fund at https://www.vaneck.com/us/en/etf-mutual-fund-finder/etfs/documents/. You can also request this information by contacting us at 800.826.2333 or info@vaneck.com.
What were the Fund costs for the last year?
(based on a hypothetical $10,000 investment)
| Fund Name | Costs of a $10,000 investment | Costs paid as a % of a $10,000 investment |
|---|
| VanEck Commodity Strategy ETF | $54 | 0.55% |
How did the Fund perform last year?
During the period, softening demand and relatively persistent dollar strength weighed on most commodities, with few exceptions.
The Fund’s exposure to precious metals, specifically gold, was the top contributor to performance followed by its agriculture exposure. Within agriculture, its allocation to coffee was a notably strong contributor to performance amid supply constraints that drove the price to 13-year highs near the end of the period.
The largest detractor was energy, specifically gasoline and brent crude as the market grappled with excess supply. The Fund’s industrial metals exposure also weighed on returns for the period as oversupply was a theme along with weakening demand from China for much of the period. Nickel exposure was the leading detractor within industrial metals due to oversupply issues.
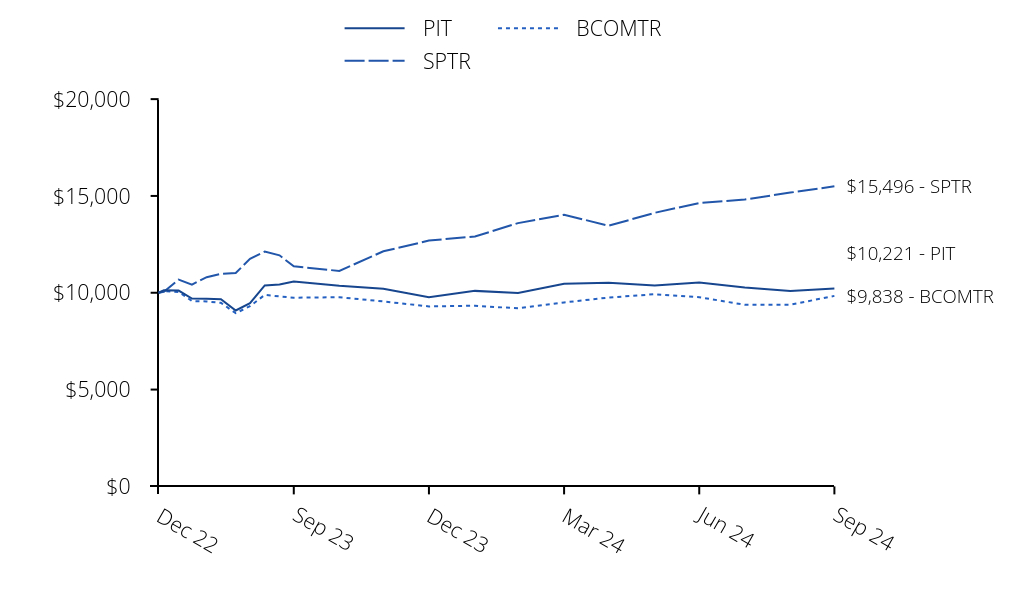
How did the Fund perform since inception?
Cumulative Performance Based on $10,000 Investment
| PIT | SPTR | BCOMTR |
|---|
| Dec 22 | $10,000 | $10,000 | $10,000 |
| Dec 22 | $10,123 | $10,051 | $10,092 |
| Jan 23 | $10,111 | $10,683 | $10,043 |
| Feb 23 | $9,703 | $10,422 | $9,571 |
| Mar 23 | $9,693 | $10,805 | $9,551 |
| Apr 23 | $9,667 | $10,973 | $9,480 |
| May 23 | $9,086 | $11,021 | $8,945 |
| Jun 23 | $9,458 | $11,749 | $9,307 |
| Jul 23 | $10,377 | $12,127 | $9,889 |
| Aug 23 | $10,422 | $11,934 | $9,813 |
| Sep 23 | $10,580 | $11,365 | $9,745 |
| Oct 23 | $10,362 | $11,126 | $9,771 |
| Nov 23 | $10,207 | $12,142 | $9,551 |
| Dec 23 | $9,767 | $12,694 | $9,294 |
| Jan 24 | $10,097 | $12,907 | $9,331 |
| Feb 24 | $9,989 | $13,596 | $9,194 |
| Mar 24 | $10,469 | $14,033 | $9,498 |
| Apr 24 | $10,512 | $13,460 | $9,753 |
| May 24 | $10,378 | $14,128 | $9,924 |
| Jun 24 | $10,534 | $14,635 | $9,772 |
| Jul 24 | $10,276 | $14,813 | $9,377 |
| Aug 24 | $10,093 | $15,172 | $9,382 |
| Sep 24 | $10,221 | $15,496 | $9,838 |
This chart shows the value of a hypothetical $10,000 investment in the Fund at NAV since inception.
Average Annual Total Returns
| . | 1 Year | Life* |
|---|
| VanEck Commodity Strategy ETF | (3.40)% | 1.23% |
| Bloomberg Commodity Index Total Return (BCOMTR) | 0.96% | (0.91)% |
| S&P 500 Index Total Return (SPTR) | 36.35% | 27.93% |
* Inception of Fund: 12/20/22
The performance data quoted represents past performance. Past performance is no guarantee of future results. Performance information for the Fund may reflect temporary fee waivers, if applicable. Had the Fund incurred all expenses, investment returns would have been reduced. These returns do not reflect the deduction of taxes that a shareholder would pay on Fund dividends and distributions or the or sale of Fund shares.
Investment returns and value of the shares of the Fund will fluctuate so that an investor's shares, when sold, may be worth more or less than their original cost. Performance may be lower or higher than performance data quoted. Fund returns reflect reinvestment of dividends and capital gains distributions. Returns for actual Fund investors may differ from what is shown because of differences in timing, the amount invested and fees and expenses.
Index returns are not Fund returns and do not reflect any management fees or brokerage expenses. Certain indices may take into account withholding taxes. Investors can not invest directly in the Index. The Index is unmanaged and includes the reinvestment of all dividends.
- Total Net Assets$24,024,075
- Number of Portfolio Holdings28
- Portfolio Turnover Rate-%
- Advisory Fees Paid$137,002
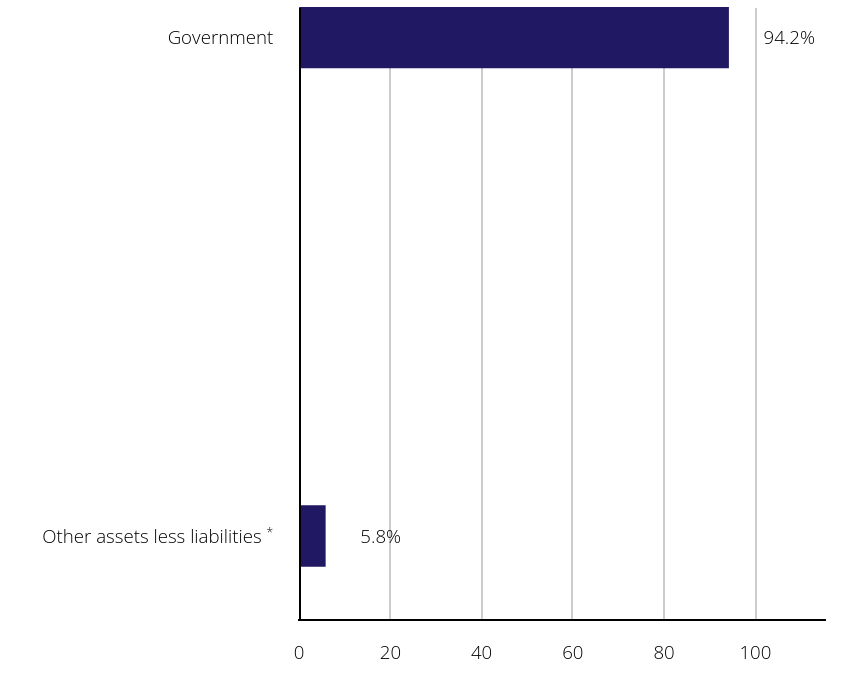
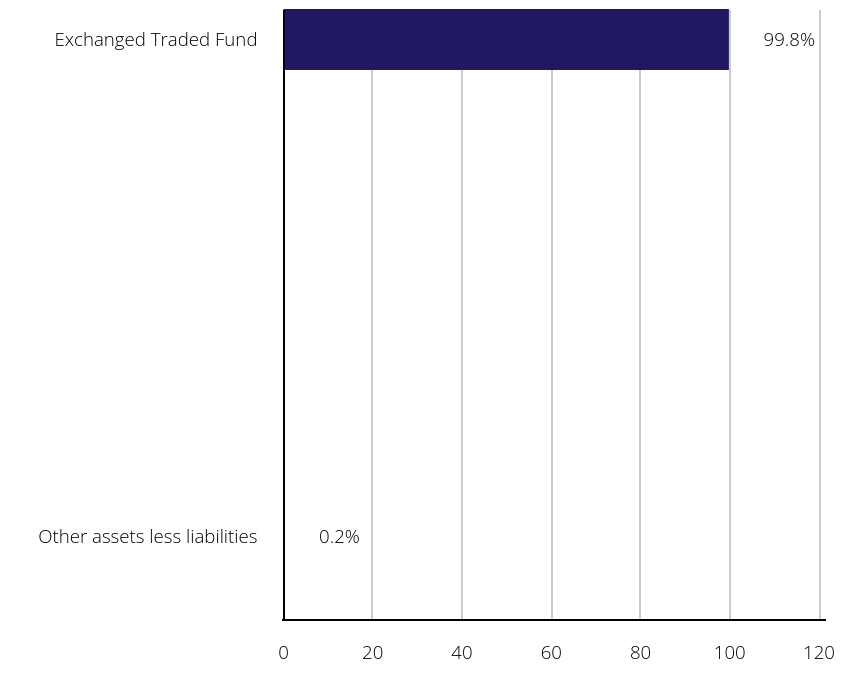
What did the Fund invest in?
Portfolio Composition (% of Total Net Assets)
| Value | Value | Value |
|---|
Other assets less liabilitiesFootnote Reference* | | 5.8% |
| Government | | 94.2% |
| Footnote | Description |
Footnote* | Includes unrealized appreciation (depreciation) on futures contracts of 2.2% |
Householding is an option available to certain fund investors. Householding is a method of delivery, based on the preference of the individual investor, in which a single copy of certain shareholder documents can be delivered to investors who share the same address, even if their accounts are registered under different names. Please contact your broker-dealer if you are interested in enrolling in householding and receiving a single copy of prospectuses and other shareholder documents, or if you are currently enrolled in householding and wish to change your householding status.
Need Additional Information?
If you wish to view additional information about the Fund including but not limited to financial statements, prospectus or holdings please scan the QR code or visit https://www.vaneck.com/us/en/etf-mutual-fund-finder/etfs/documents/.
VanEck Digital Transformation ETF
Principal U.S. Listing Exchange: The NASDAQ Stock Market LLC
Annual Shareholder Report - September 30, 2024
This annual shareholder report contains important information about the VanEck Digital Transformation ETF for the period October 1, 2023 to September 30, 2024. You can find additional information about the Fund at https://www.vaneck.com/us/en/etf-mutual-fund-finder/etfs/documents/. You can also request this information by contacting us at 800.826.2333 or info@vaneck.com.
What were the Fund costs for the last year?
(based on a hypothetical $10,000 investment)
| Fund Name | Costs of a $10,000 investment | Costs paid as a % of a $10,000 investment |
|---|
| VanEck Digital Transformation ETF | $80 | 0.51% |
How did the Fund perform last year?
The Fund posted solid growth over the past year, despite heightened volatility in the digital assets space driven by evolving regulatory conditions and institutional demand.
The information technology sector was the top-performing sector, with companies that support blockchain infrastructure leading gains.
MicroStrategy, Inc. was the leading individual contributor, benefiting from an increase in Bitcoin holdings and subsequent tailwind from Bitcoin performance.
The financials sector was the weaker contributor, as digital payment companies faced regulatory headwinds and uncertainty in the market.
Canaan, Inc., was the largest individual detractor. They design and produce high-performance ASIC (application-specific integrated circuit) chips for Bitcoin mining machines under the Avalon brand. Underperformance was mainly due to decreased revenues, cryptocurrency market volatility, intensified competition, and regulatory challenges.
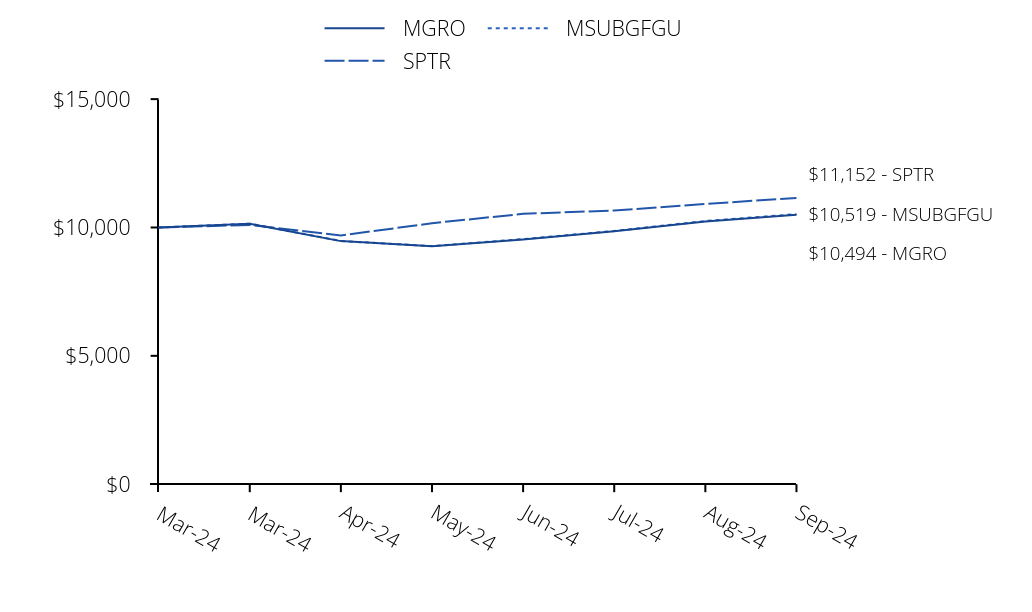
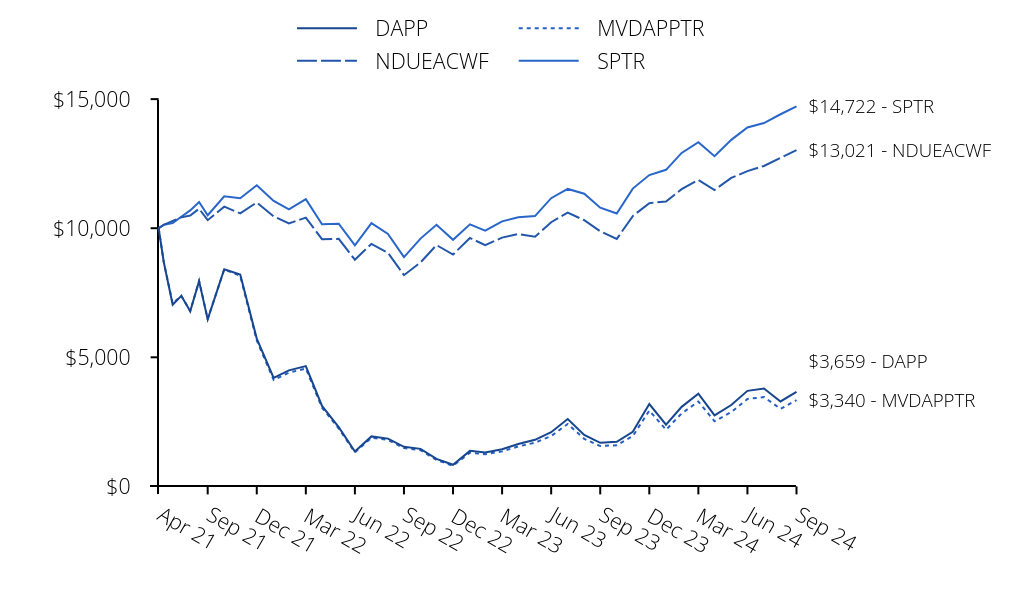
How did the Fund perform since inception?
Cumulative Performance Based on $10,000 Investment
| DAPP | NDUEACWF | MVDAPPTR | SPTR |
|---|
| Apr 21 | $10,000 | $10,000 | $10,000 | $10,000 |
| Apr 21 | $8,682 | $10,128 | $8,684 | $10,133 |
| May 21 | $7,041 | $10,285 | $7,081 | $10,204 |
| Jun 21 | $7,380 | $10,421 | $7,385 | $10,442 |
| Jul 21 | $6,780 | $10,493 | $6,787 | $10,690 |
| Aug 21 | $7,950 | $10,755 | $7,958 | $11,015 |
| Sep 21 | $6,470 | $10,311 | $6,487 | $10,503 |
| Oct 21 | $8,412 | $10,837 | $8,404 | $11,239 |
| Nov 21 | $8,210 | $10,576 | $8,154 | $11,161 |
| Dec 21 | $5,726 | $10,999 | $5,651 | $11,661 |
| Jan 22 | $4,204 | $10,459 | $4,124 | $11,058 |
| Feb 22 | $4,494 | $10,189 | $4,405 | $10,727 |
| Mar 22 | $4,657 | $10,410 | $4,564 | $11,125 |
| Apr 22 | $3,114 | $9,576 | $3,050 | $10,155 |
| May 22 | $2,294 | $9,588 | $2,242 | $10,173 |
| Jun 22 | $1,351 | $8,779 | $1,317 | $9,334 |
| Jul 22 | $1,936 | $9,393 | $1,886 | $10,194 |
| Aug 22 | $1,851 | $9,047 | $1,801 | $9,779 |
| Sep 22 | $1,531 | $8,181 | $1,484 | $8,878 |
| Oct 22 | $1,453 | $8,674 | $1,403 | $9,597 |
| Nov 22 | $1,065 | $9,347 | $1,022 | $10,133 |
| Dec 22 | $838 | $8,979 | $798 | $9,549 |
| Jan 23 | $1,376 | $9,623 | $1,304 | $10,149 |
| Feb 23 | $1,317 | $9,347 | $1,245 | $9,902 |
| Mar 23 | $1,438 | $9,635 | $1,356 | $10,265 |
| Apr 23 | $1,644 | $9,774 | $1,546 | $10,425 |
| May 23 | $1,804 | $9,669 | $1,693 | $10,471 |
| Jun 23 | $2,097 | $10,231 | $1,949 | $11,163 |
| Jul 23 | $2,610 | $10,605 | $2,419 | $11,521 |
| Aug 23 | $1,990 | $10,309 | $1,842 | $11,338 |
| Sep 23 | $1,689 | $9,883 | $1,562 | $10,797 |
| Oct 23 | $1,729 | $9,585 | $1,594 | $10,570 |
| Nov 23 | $2,112 | $10,470 | $1,946 | $11,535 |
| Dec 23 | $3,191 | $10,973 | $2,936 | $12,060 |
| Jan 24 | $2,388 | $11,037 | $2,194 | $12,262 |
| Feb 24 | $3,081 | $11,511 | $2,824 | $12,917 |
| Mar 24 | $3,588 | $11,872 | $3,288 | $13,333 |
| Apr 24 | $2,749 | $11,481 | $2,521 | $12,788 |
| May 24 | $3,150 | $11,947 | $2,879 | $13,422 |
| Jun 24 | $3,701 | $12,213 | $3,384 | $13,904 |
| Jul 24 | $3,790 | $12,410 | $3,462 | $14,073 |
| Aug 24 | $3,289 | $12,725 | $3,003 | $14,414 |
| Sep 24 | $3,659 | $13,021 | $3,340 | $14,722 |
This chart shows the value of a hypothetical $10,000 investment in the Fund at NAV since inception.
Average Annual Total Returns
| . | 1 Year | Life* |
|---|
| VanEck Digital Transformation ETF | 116.65% | (25.17)% |
MVIS® Global Digital Assets Equity Total Return Net Index (MVDAPPTR) | 113.90% | (27.11)% |
| MSCI ACWI Net TR Index (NDUEACWF) | 31.76% | 7.91% |
| S&P 500 Index Total Return (SPTR) | 36.35% | 11.80% |
* Inception of Fund: 4/12/21
The performance data quoted represents past performance. Past performance is no guarantee of future results. Performance information for the Fund may reflect temporary fee waivers, if applicable. Had the Fund incurred all expenses, investment returns would have been reduced. These returns do not reflect the deduction of taxes that a shareholder would pay on Fund dividends and distributions or the or sale of Fund shares.
Investment returns and value of the shares of the Fund will fluctuate so that an investor's shares, when sold, may be worth more or less than their original cost. Performance may be lower or higher than performance data quoted. Fund returns reflect reinvestment of dividends and capital gains distributions. Returns for actual Fund investors may differ from what is shown because of differences in timing, the amount invested and fees and expenses.
Index returns are not Fund returns and do not reflect any management fees or brokerage expenses. Certain indices may take into account withholding taxes. Investors can not invest directly in the Index. The Index is unmanaged and includes the reinvestment of all dividends.
- Total Net Assets$134,770,689
- Number of Portfolio Holdings21
- Portfolio Turnover Rate80%
- Advisory Fees Paid$470,200
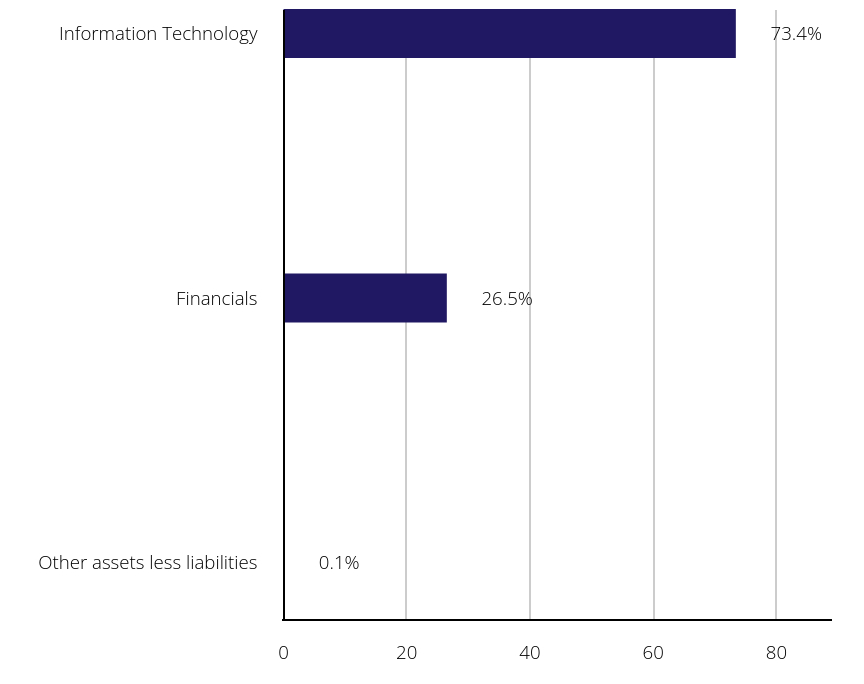
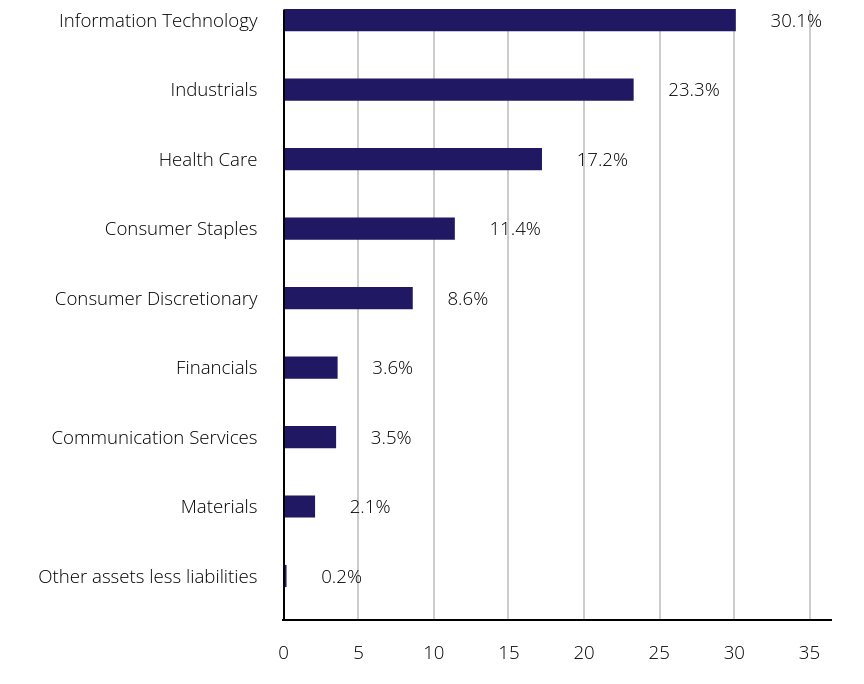
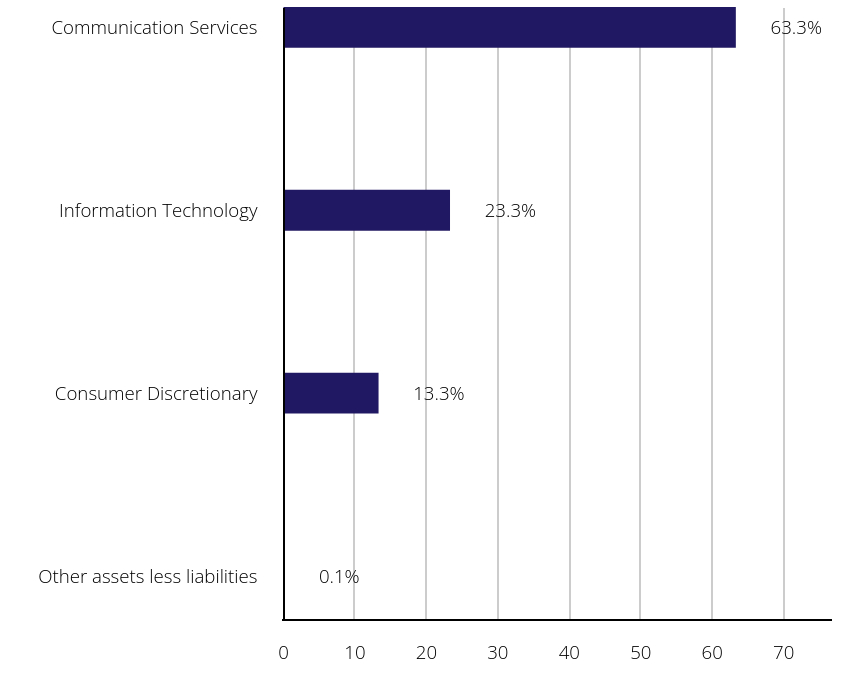
What did the Fund invest in?
Portfolio Composition (% of Total Net Assets)
| Value | Value | Value |
|---|
| Other assets less liabilities | | 0.1% |
| Financials | | 26.5% |
| Information Technology | | 73.4% |
Top Ten Holdings (% of Total Net Assets)
| MicroStrategy, Inc. | | 8.0% |
| Coinbase Global, Inc. | | 8.0% |
| Block, Inc. | | 7.5% |
| Core Scientific, Inc. | | 6.3% |
| MARA Holdings, Inc. | | 5.9% |
| Applied Digital Corp. | | 5.6% |
| Bit Digital, Inc. | | 5.1% |
| Cipher Mining, Inc. | | 4.9% |
| Galaxy Digital Holdings Ltd. | | 4.9% |
| Cleanspark, Inc. | | 4.9% |
Householding is an option available to certain fund investors. Householding is a method of delivery, based on the preference of the individual investor, in which a single copy of certain shareholder documents can be delivered to investors who share the same address, even if their accounts are registered under different names. Please contact your broker-dealer if you are interested in enrolling in householding and receiving a single copy of prospectuses and other shareholder documents, or if you are currently enrolled in householding and wish to change your householding status.
Need Additional Information?
If you wish to view additional information about the Fund including but not limited to financial statements, prospectus or holdings please scan the QR code or visit https://www.vaneck.com/us/en/etf-mutual-fund-finder/etfs/documents/.
VanEck Durable High Dividend ETF
Principal U.S. Listing Exchange: Cboe BZX Exchange, Inc.
Annual Shareholder Report - September 30, 2024
This annual shareholder report contains important information about the VanEck Durable High Dividend ETF for the period October 1, 2023 to September 30, 2024. You can find additional information about the Fund at https://www.vaneck.com/us/en/etf-mutual-fund-finder/etfs/documents/. You can also request this information by contacting us at 800.826.2333 or info@vaneck.com.
What were the Fund costs for the last year?
(based on a hypothetical $10,000 investment)
| Fund Name | Costs of a $10,000 investment | Costs paid as a % of a $10,000 investment |
|---|
| VanEck Durable High Dividend ETF | $33 | 0.30% |
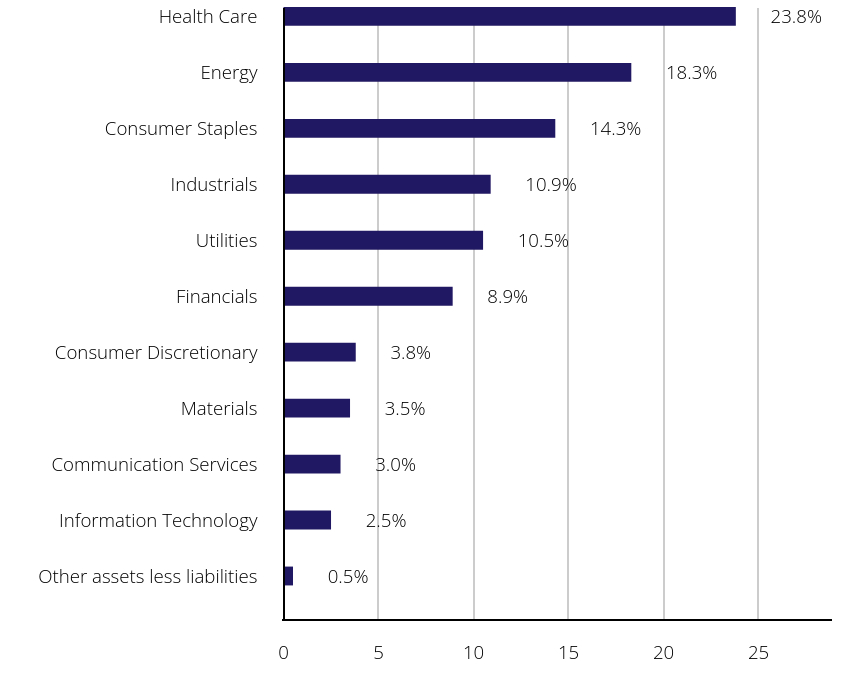
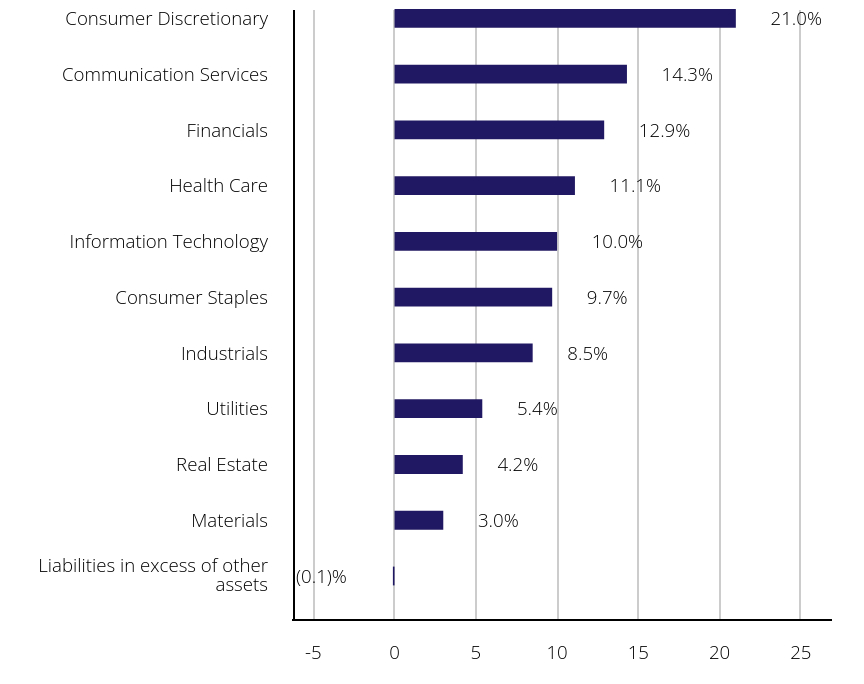
How did the Fund perform last year?
U.S. dividend stocks, as a group, performed strongly during the year but trailed the broad U.S. equity market due to their higher relative exposure to value-oriented, cyclical companies.
The Fund’s exposure to the consumer staples, financials, and utilities sectors contributed the most to performance during the period.
The largest individual contributors to performance were Philip Morris International, Inc., JP Morgan Chase & Co., and Altria Group, Inc.
The materials sector was the only to detract from performance and the communication services and energy sectors contributed least to positive performance.
The leading individual detractors from performance were Pfizer, Inc., Chevron Corp., and Merck & Co.
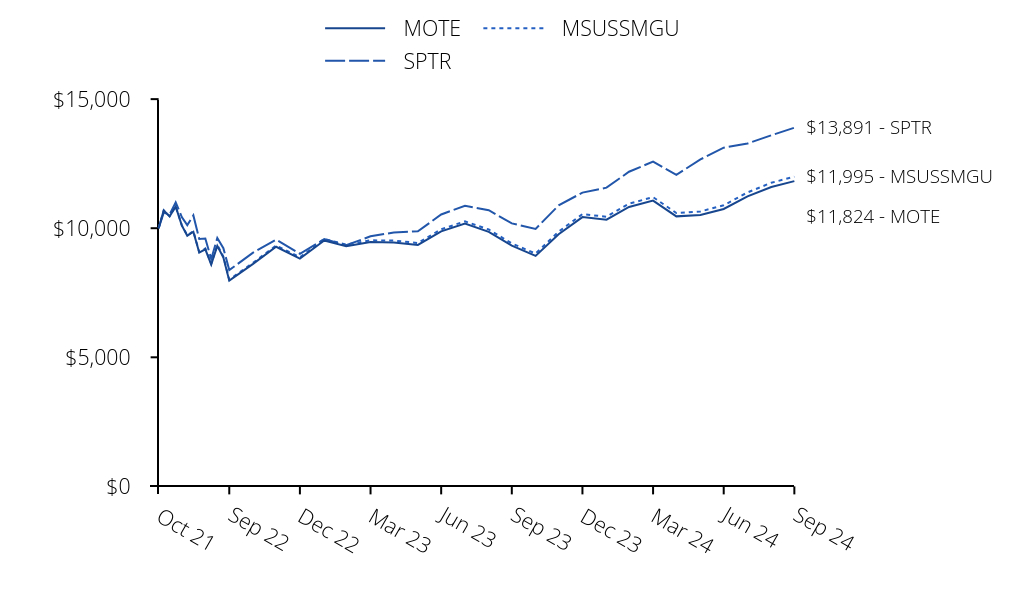
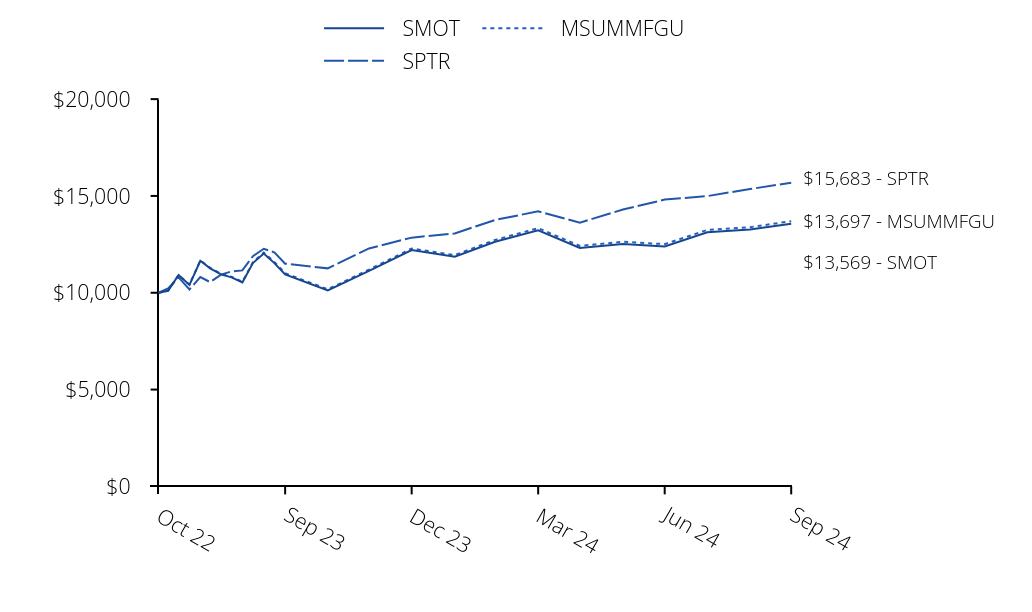
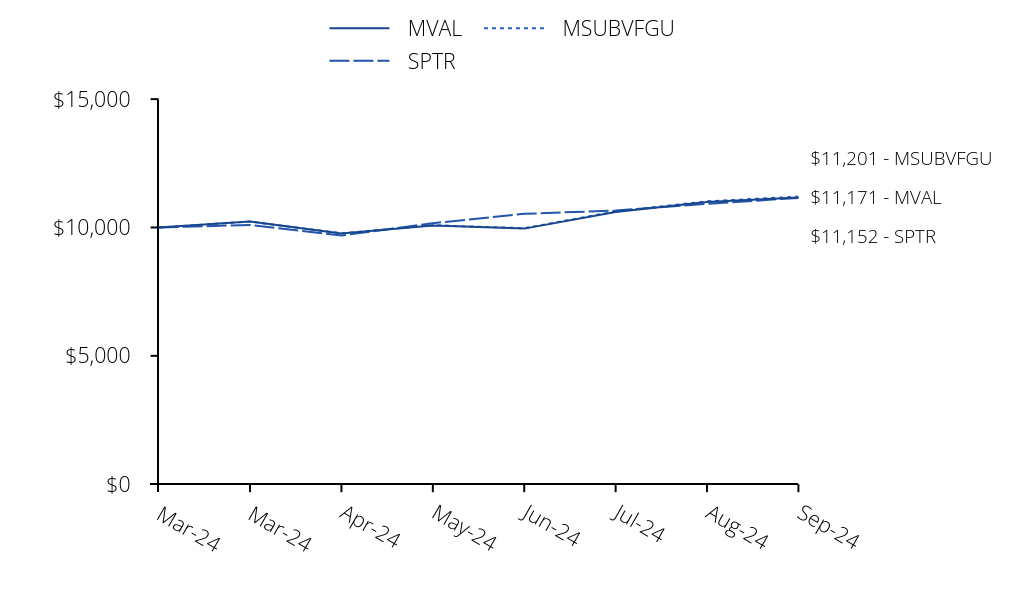
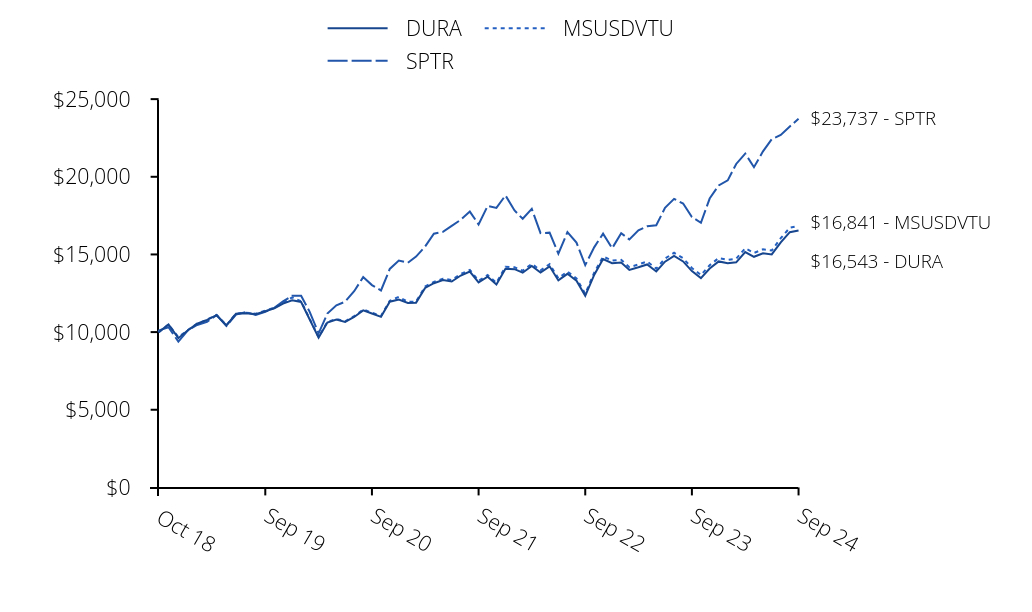
How did the Fund perform since inception?
Cumulative Performance Based on $10,000 Investment
| DURA | SPTR | MSUSDVTU |
|---|
| Oct 18 | $10,000 | $10,000 | $10,000 |
| Oct 18 | $10,004 | $10,109 | $10,005 |
| Nov 18 | $10,489 | $10,315 | $10,495 |
| Dec 18 | $9,610 | $9,384 | $9,675 |
| Jan 19 | $10,138 | $10,135 | $10,142 |
| Feb 19 | $10,539 | $10,461 | $10,546 |
| Mar 19 | $10,789 | $10,664 | $10,799 |
| Apr 19 | $11,094 | $11,096 | $11,109 |
| May 19 | $10,432 | $10,391 | $10,449 |
| Jun 19 | $11,178 | $11,123 | $11,197 |
| Jul 19 | $11,221 | $11,283 | $11,245 |
| Aug 19 | $11,155 | $11,104 | $11,183 |
| Sep 19 | $11,341 | $11,312 | $11,373 |
| Oct 19 | $11,536 | $11,557 | $11,570 |
| Nov 19 | $11,833 | $11,977 | $11,871 |
| Dec 19 | $12,042 | $12,338 | $12,240 |
| Jan 20 | $11,939 | $12,333 | $11,983 |
| Feb 20 | $10,828 | $11,318 | $10,866 |
| Mar 20 | $9,646 | $9,920 | $9,677 |
| Apr 20 | $10,612 | $11,192 | $10,651 |
| May 20 | $10,807 | $11,725 | $10,848 |
| Jun 20 | $10,651 | $11,958 | $10,694 |
| Jul 20 | $10,976 | $12,632 | $11,022 |
| Aug 20 | $11,400 | $13,540 | $11,451 |
| Sep 20 | $11,198 | $13,026 | $11,253 |
| Oct 20 | $10,982 | $12,679 | $11,038 |
| Nov 20 | $11,954 | $14,067 | $12,018 |
| Dec 20 | $12,093 | $14,608 | $12,268 |
| Jan 21 | $11,878 | $14,461 | $11,947 |
| Feb 21 | $11,896 | $14,859 | $11,967 |
| Mar 21 | $12,846 | $15,510 | $12,928 |
| Apr 21 | $13,146 | $16,338 | $13,234 |
| May 21 | $13,346 | $16,452 | $13,439 |
| Jun 21 | $13,259 | $16,836 | $13,356 |
| Jul 21 | $13,642 | $17,236 | $13,744 |
| Aug 21 | $13,897 | $17,760 | $14,005 |
| Sep 21 | $13,202 | $16,934 | $13,304 |
| Oct 21 | $13,562 | $18,121 | $13,671 |
| Nov 21 | $13,066 | $17,995 | $13,175 |
| Dec 21 | $14,082 | $18,801 | $14,205 |
| Jan 22 | $14,051 | $17,829 | $14,176 |
| Feb 22 | $13,823 | $17,295 | $13,950 |
| Mar 22 | $14,259 | $17,937 | $14,396 |
| Apr 22 | $13,838 | $16,373 | $13,974 |
| May 22 | $14,234 | $16,403 | $14,377 |
| Jun 22 | $13,328 | $15,049 | $13,466 |
| Jul 22 | $13,752 | $16,436 | $13,898 |
| Aug 22 | $13,306 | $15,766 | $13,452 |
| Sep 22 | $12,334 | $14,314 | $12,471 |
| Oct 22 | $13,694 | $15,473 | $13,848 |
| Nov 22 | $14,698 | $16,338 | $14,866 |
| Dec 22 | $14,431 | $15,396 | $14,600 |
| Jan 23 | $14,479 | $16,364 | $14,653 |
| Feb 23 | $14,004 | $15,964 | $14,175 |
| Mar 23 | $14,172 | $16,551 | $14,353 |
| Apr 23 | $14,356 | $16,809 | $14,544 |
| May 23 | $13,902 | $16,882 | $14,087 |
| Jun 23 | $14,535 | $17,997 | $14,734 |
| Jul 23 | $14,900 | $18,576 | $15,106 |
| Aug 23 | $14,549 | $18,280 | $14,755 |
| Sep 23 | $13,926 | $17,408 | $14,127 |
| Oct 23 | $13,478 | $17,042 | $13,676 |
| Nov 23 | $14,095 | $18,599 | $14,306 |
| Dec 23 | $14,550 | $19,444 | $14,773 |
| Jan 24 | $14,429 | $19,770 | $14,654 |
| Feb 24 | $14,490 | $20,826 | $14,720 |
| Mar 24 | $15,152 | $21,496 | $15,402 |
| Apr 24 | $14,849 | $20,618 | $15,096 |
| May 24 | $15,075 | $21,640 | $15,329 |
| Jun 24 | $14,999 | $22,417 | $15,255 |
| Jul 24 | $15,773 | $22,690 | $16,046 |
| Aug 24 | $16,433 | $23,240 | $16,723 |
| Sep 24 | $16,543 | $23,737 | $16,841 |
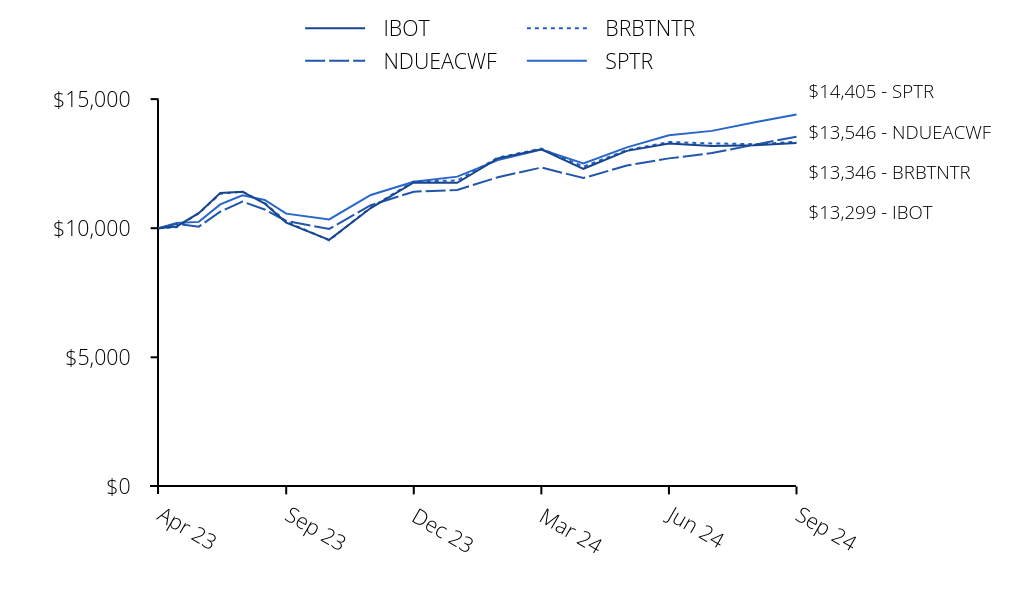
This chart shows the value of a hypothetical $10,000 investment in the Fund at NAV since inception.
Average Annual Total Returns
| . | 1 Year | 5 Years | Life* |
|---|
| VanEck Durable High Dividend ETF | 18.79% | 7.84% | 8.88% |
Morningstar® US Dividend Valuation Index (MSUSDVTU) | 19.22% | 8.17% | 9.21% |
| S&P 500 Index Total Return (SPTR) | 36.35% | 15.98% | 15.73% |
* Inception of Fund: 10/30/18
The performance data quoted represents past performance. Past performance is no guarantee of future results. Performance information for the Fund may reflect temporary fee waivers, if applicable. Had the Fund incurred all expenses, investment returns would have been reduced. These returns do not reflect the deduction of taxes that a shareholder would pay on Fund dividends and distributions or the or sale of Fund shares.
Investment returns and value of the shares of the Fund will fluctuate so that an investor's shares, when sold, may be worth more or less than their original cost. Performance may be lower or higher than performance data quoted. Fund returns reflect reinvestment of dividends and capital gains distributions. Returns for actual Fund investors may differ from what is shown because of differences in timing, the amount invested and fees and expenses.
Index returns are not Fund returns and do not reflect any management fees or brokerage expenses. Certain indices may take into account withholding taxes. Investors can not invest directly in the Index. The Index is unmanaged and includes the reinvestment of all dividends.
- Total Net Assets$52,157,095
- Number of Portfolio Holdings86
- Portfolio Turnover Rate62%
- Advisory Fees Paid$172,281
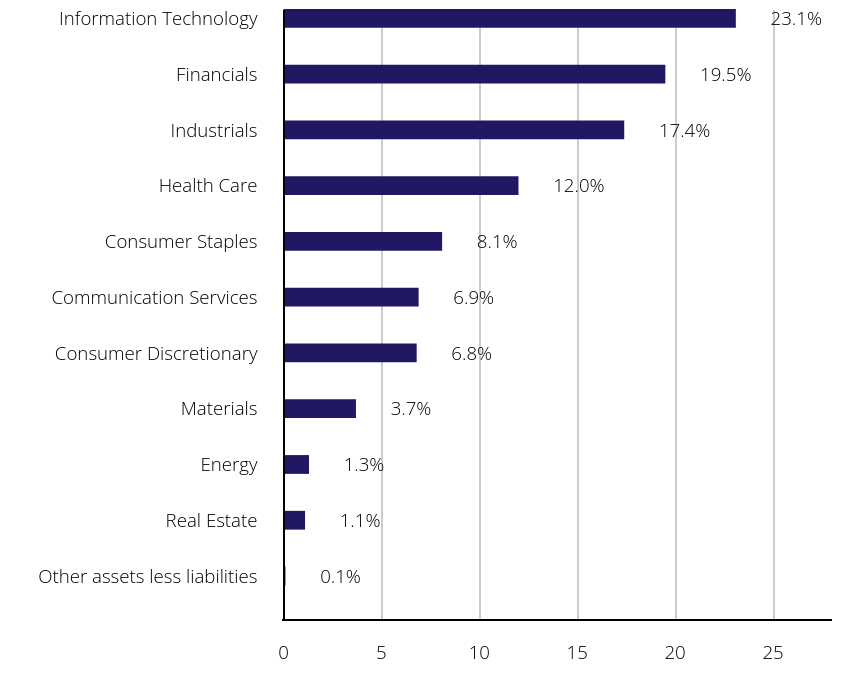
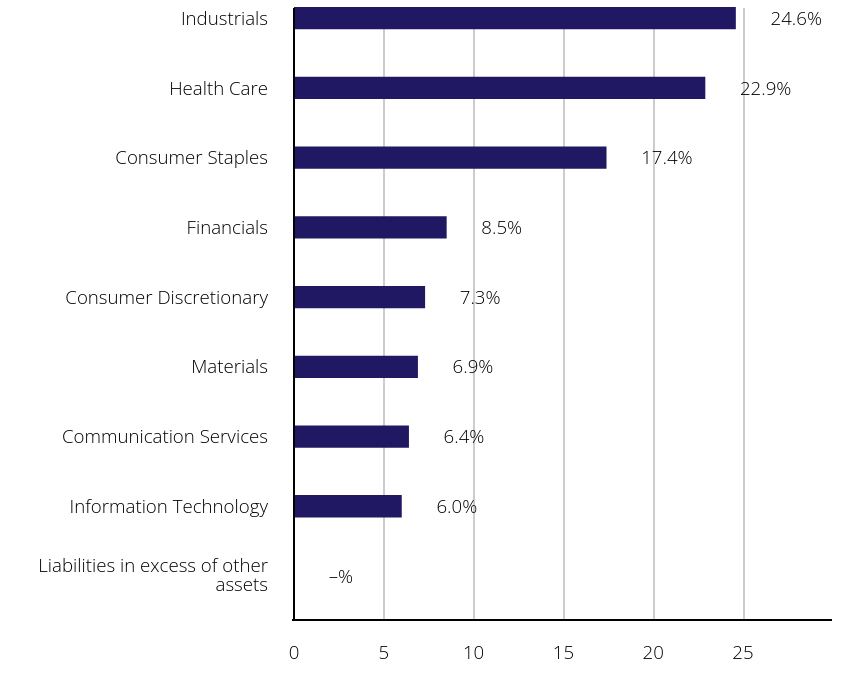
What did the Fund invest in?
Portfolio Composition (% of Total Net Assets)
| Value | Value | Value |
|---|
| Other assets less liabilities | | 0.5% |
| Information Technology | | 2.5% |
| Communication Services | | 3.0% |
| Materials | | 3.5% |
| Consumer Discretionary | | 3.8% |
| Financials | | 8.9% |
| Utilities | | 10.5% |
| Industrials | | 10.9% |
| Consumer Staples | | 14.3% |
| Energy | | 18.3% |
| Health Care | | 23.8% |
Top Ten Holdings (% of Total Net Assets)
| Exxon Mobil Corp. | | 5.2% |
| Chevron Corp. | | 5.0% |
| AbbVie, Inc. | | 4.8% |
| Johnson & Johnson | | 4.6% |
| Merck & Co., Inc. | | 4.5% |
| Pfizer, Inc. | | 4.5% |
| PepsiCo, Inc. | | 4.1% |
| Altria Group, Inc. | | 3.8% |
| United Parcel Service, Inc. | | 3.0% |
| Comcast Corp. | | 3.0% |
Householding is an option available to certain fund investors. Householding is a method of delivery, based on the preference of the individual investor, in which a single copy of certain shareholder documents can be delivered to investors who share the same address, even if their accounts are registered under different names. Please contact your broker-dealer if you are interested in enrolling in householding and receiving a single copy of prospectuses and other shareholder documents, or if you are currently enrolled in householding and wish to change your householding status.
Need Additional Information?
If you wish to view additional information about the Fund including but not limited to financial statements, prospectus or holdings please scan the QR code or visit https://www.vaneck.com/us/en/etf-mutual-fund-finder/etfs/documents/.
Principal U.S. Listing Exchange: NYSE Arca, Inc.
Annual Shareholder Report - September 30, 2024
This annual shareholder report contains important information about the VanEck Energy Income ETF for the period October 1, 2023 to September 30, 2024. You can find additional information about the Fund at https://www.vaneck.com/us/en/etf-mutual-fund-finder/etfs/documents/. You can also request this information by contacting us at 800.826.2333 or info@vaneck.com.
What were the Fund costs for the last year?
(based on a hypothetical $10,000 investment)
| Fund Name | Costs of a $10,000 investment | Costs paid as a % of a $10,000 investment |
|---|
| VanEck Energy Income ETF | $56 | 0.47% |
How did the Fund perform last year?
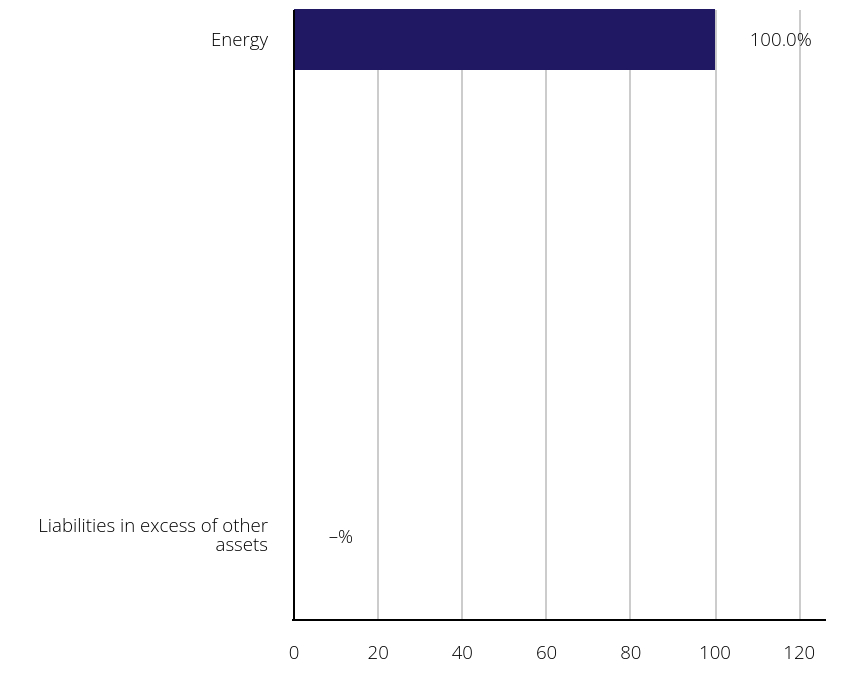
The midstream energy and Master Limited Partner segment saw strong performance over the period driven by their relatively stable cashflows tied to long-term contracts and an improved natural gas price outlook which tends to increase midstream volumes. Increasing demand for energy infrastructure also benefited the segment.
This was in stark contrast to the muted returns of downstream companies and the negative performance of upstream companies. These segments, more sensitive to supply and demand forces, faced headwinds this year stemming from weakness in oil prices and muted global growth.
The leading individual contributors to Fund performance during the period were ONEOK, Inc., Targa Resources Corp. and The Williams Companies, Inc..
The leading individual detractors were Sunoco LP, Mattr Corp., and NGL Energy Partners LP.
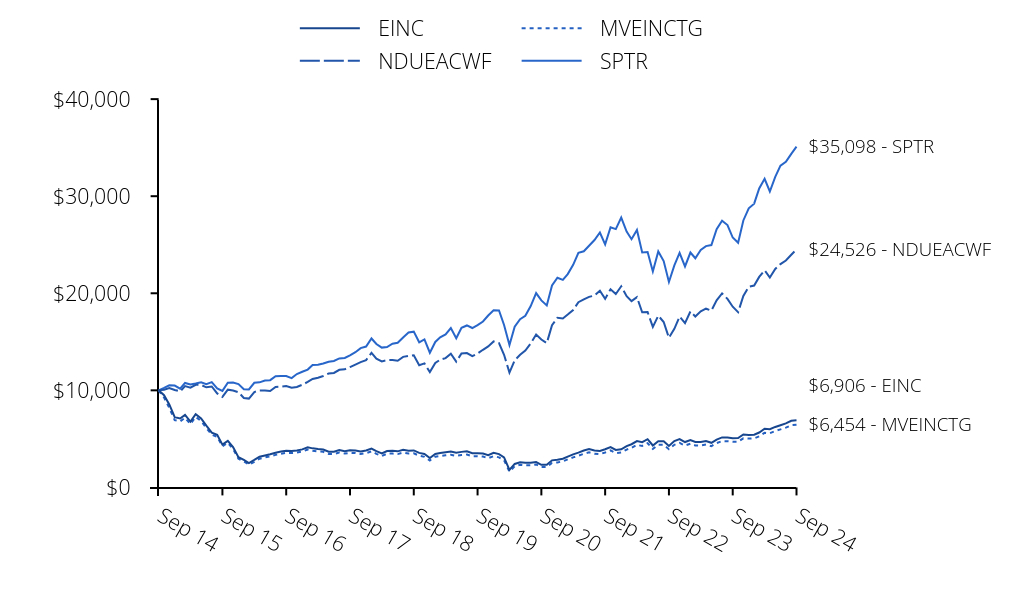
How did the Fund perform over the past 10 years?
Cumulative Performance Based on $10,000 Investment
| EINC | NDUEACWF | MVEINCTG | SPTR |
|---|
| Sep 14 | $10,000 | $10,000 | $10,000 | $10,000 |
| Oct 14 | $9,502 | $10,070 | $9,253 | $10,244 |
| Nov 14 | $8,543 | $10,239 | $8,192 | $10,520 |
| Dec 14 | $7,237 | $10,041 | $6,930 | $10,493 |
| Jan 15 | $7,103 | $9,884 | $6,801 | $10,178 |
| Feb 15 | $7,465 | $10,435 | $7,171 | $10,763 |
| Mar 15 | $6,783 | $10,273 | $6,526 | $10,593 |
| Apr 15 | $7,540 | $10,571 | $7,265 | $10,695 |
| May 15 | $7,096 | $10,557 | $6,833 | $10,832 |
| Jun 15 | $6,361 | $10,309 | $6,123 | $10,622 |
| Jul 15 | $5,642 | $10,398 | $5,424 | $10,845 |
| Aug 15 | $5,428 | $9,685 | $5,218 | $10,191 |
| Sep 15 | $4,405 | $9,334 | $4,226 | $9,939 |
| Oct 15 | $4,796 | $10,067 | $4,607 | $10,777 |
| Nov 15 | $4,153 | $9,984 | $3,941 | $10,809 |
| Dec 15 | $3,116 | $9,804 | $2,950 | $10,638 |
| Jan 16 | $2,836 | $9,213 | $2,679 | $10,111 |
| Feb 16 | $2,508 | $9,149 | $2,340 | $10,097 |
| Mar 16 | $2,826 | $9,827 | $2,641 | $10,782 |
| Apr 16 | $3,159 | $9,972 | $2,956 | $10,824 |
| May 16 | $3,296 | $9,985 | $3,090 | $11,018 |
| Jun 16 | $3,409 | $9,924 | $3,199 | $11,047 |
| Jul 16 | $3,568 | $10,352 | $3,350 | $11,454 |
| Aug 16 | $3,695 | $10,387 | $3,474 | $11,470 |
| Sep 16 | $3,781 | $10,451 | $3,558 | $11,472 |
| Oct 16 | $3,756 | $10,273 | $3,537 | $11,263 |
| Nov 16 | $3,804 | $10,351 | $3,585 | $11,680 |
| Dec 16 | $3,915 | $10,575 | $3,692 | $11,911 |
| Jan 17 | $4,130 | $10,864 | $3,898 | $12,137 |
| Feb 17 | $4,023 | $11,169 | $3,782 | $12,619 |
| Mar 17 | $3,947 | $11,305 | $3,708 | $12,633 |
| Apr 17 | $3,904 | $11,482 | $3,667 | $12,763 |
| May 17 | $3,684 | $11,735 | $3,447 | $12,943 |
| Jun 17 | $3,683 | $11,789 | $3,447 | $13,023 |
| Jul 17 | $3,843 | $12,118 | $3,598 | $13,291 |
| Aug 17 | $3,735 | $12,164 | $3,482 | $13,332 |
| Sep 17 | $3,816 | $12,399 | $3,560 | $13,607 |
| Oct 17 | $3,803 | $12,657 | $3,548 | $13,925 |
| Nov 17 | $3,703 | $12,902 | $3,442 | $14,352 |
| Dec 17 | $3,800 | $13,110 | $3,534 | $14,511 |
| Jan 18 | $3,993 | $13,850 | $3,718 | $15,342 |
| Feb 18 | $3,735 | $13,268 | $3,461 | $14,777 |
| Mar 18 | $3,494 | $12,984 | $3,236 | $14,401 |
| Apr 18 | $3,753 | $13,108 | $3,479 | $14,456 |
| May 18 | $3,773 | $13,124 | $3,485 | $14,804 |
| Jun 18 | $3,714 | $13,053 | $3,431 | $14,895 |
| Jul 18 | $3,881 | $13,447 | $3,588 | $15,450 |
| Aug 18 | $3,789 | $13,552 | $3,487 | $15,953 |
| Sep 18 | $3,810 | $13,611 | $3,509 | $16,044 |
| Oct 18 | $3,553 | $12,591 | $3,271 | $14,947 |
| Nov 18 | $3,438 | $12,776 | $3,147 | $15,252 |
| Dec 18 | $3,031 | $11,876 | $2,771 | $13,875 |
| Jan 19 | $3,447 | $12,813 | $3,158 | $14,987 |
| Feb 19 | $3,535 | $13,156 | $3,226 | $15,468 |
| Mar 19 | $3,618 | $13,322 | $3,306 | $15,769 |
| Apr 19 | $3,690 | $13,771 | $3,371 | $16,407 |
| May 19 | $3,575 | $12,955 | $3,250 | $15,364 |
| Jun 19 | $3,660 | $13,803 | $3,335 | $16,447 |
| Jul 19 | $3,716 | $13,843 | $3,385 | $16,684 |
| Aug 19 | $3,523 | $13,515 | $3,191 | $16,419 |
| Sep 19 | $3,518 | $13,799 | $3,213 | $16,727 |
| Oct 19 | $3,486 | $14,177 | $3,181 | $17,089 |
| Nov 19 | $3,312 | $14,523 | $3,007 | $17,709 |
| Dec 19 | $3,573 | $15,034 | $3,225 | $18,244 |
| Jan 20 | $3,431 | $14,868 | $3,097 | $18,237 |
| Feb 20 | $3,094 | $13,667 | $2,792 | $16,735 |
| Mar 20 | $1,807 | $11,822 | $1,615 | $14,668 |
| Apr 20 | $2,419 | $13,089 | $2,175 | $16,549 |
| May 20 | $2,595 | $13,658 | $2,335 | $17,337 |
| Jun 20 | $2,529 | $14,094 | $2,276 | $17,682 |
| Jul 20 | $2,532 | $14,840 | $2,280 | $18,679 |
| Aug 20 | $2,617 | $15,748 | $2,363 | $20,021 |
| Sep 20 | $2,327 | $15,240 | $2,099 | $19,260 |
| Oct 20 | $2,330 | $14,870 | $2,104 | $18,748 |
| Nov 20 | $2,788 | $16,703 | $2,528 | $20,801 |
| Dec 20 | $2,841 | $17,478 | $2,577 | $21,600 |
| Jan 21 | $2,958 | $17,399 | $2,686 | $21,382 |
| Feb 21 | $3,172 | $17,802 | $2,887 | $21,972 |
| Mar 21 | $3,403 | $18,277 | $3,098 | $22,934 |
| Apr 21 | $3,587 | $19,076 | $3,267 | $24,158 |
| May 21 | $3,806 | $19,373 | $3,470 | $24,327 |
| Jun 21 | $3,958 | $19,628 | $3,612 | $24,895 |
| Jul 21 | $3,805 | $19,764 | $3,473 | $25,486 |
| Aug 21 | $3,753 | $20,258 | $3,428 | $26,261 |
| Sep 21 | $3,930 | $19,422 | $3,592 | $25,040 |
| Oct 21 | $4,161 | $20,413 | $3,806 | $26,794 |
| Nov 21 | $3,864 | $19,921 | $3,533 | $26,608 |
| Dec 21 | $3,920 | $20,718 | $3,588 | $27,801 |
| Jan 22 | $4,256 | $19,701 | $3,898 | $26,362 |
| Feb 22 | $4,447 | $19,192 | $4,075 | $25,573 |
| Mar 22 | $4,769 | $19,607 | $4,374 | $26,522 |
| Apr 22 | $4,659 | $18,038 | $4,277 | $24,209 |
| May 22 | $4,965 | $18,059 | $4,560 | $24,254 |
| Jun 22 | $4,318 | $16,537 | $3,968 | $22,252 |
| Jul 22 | $4,766 | $17,692 | $4,382 | $24,304 |
| Aug 22 | $4,764 | $17,040 | $4,383 | $23,312 |
| Sep 22 | $4,275 | $15,409 | $3,937 | $21,165 |
| Oct 22 | $4,768 | $16,339 | $4,393 | $22,879 |
| Nov 22 | $4,971 | $17,606 | $4,581 | $24,158 |
| Dec 22 | $4,672 | $16,913 | $4,311 | $22,766 |
| Jan 23 | $4,875 | $18,126 | $4,500 | $24,196 |
| Feb 23 | $4,685 | $17,606 | $4,328 | $23,606 |
| Mar 23 | $4,669 | $18,149 | $4,316 | $24,473 |
| Apr 23 | $4,773 | $18,410 | $4,414 | $24,855 |
| May 23 | $4,593 | $18,213 | $4,250 | $24,963 |
| Jun 23 | $4,929 | $19,270 | $4,566 | $26,612 |
| Jul 23 | $5,150 | $19,976 | $4,773 | $27,467 |
| Aug 23 | $5,132 | $19,418 | $4,758 | $27,030 |
| Sep 23 | $5,074 | $18,615 | $4,709 | $25,741 |
| Oct 23 | $5,077 | $18,055 | $4,712 | $25,200 |
| Nov 23 | $5,448 | $19,721 | $5,060 | $27,501 |
| Dec 23 | $5,407 | $20,669 | $5,028 | $28,750 |
| Jan 24 | $5,435 | $20,790 | $5,056 | $29,233 |
| Feb 24 | $5,654 | $21,682 | $5,261 | $30,794 |
| Mar 24 | $6,040 | $22,363 | $5,625 | $31,785 |
| Apr 24 | $5,990 | $21,625 | $5,580 | $30,487 |
| May 24 | $6,230 | $22,503 | $5,807 | $31,999 |
| Jun 24 | $6,405 | $23,004 | $5,975 | $33,147 |
| Jul 24 | $6,592 | $23,375 | $6,152 | $33,550 |
| Aug 24 | $6,862 | $23,969 | $6,407 | $34,364 |
| Sep 24 | $6,906 | $24,526 | $6,454 | $35,098 |
This chart shows the value of a hypothetical $10,000 investment in the Fund at NAV over the past 10 fiscal years.
Average Annual Total Returns
| . | 1 Year | 5 Years | 10 Years |
|---|
| VanEck Energy Income ETF | 36.09% | 14.44% | (3.63)% |
MVIS® North America Energy Infrastructure Index (MVEINCTG) | 37.05% | 14.97% | (4.28)% |
| MSCI ACWI Net TR Index (NDUEACWF) | 31.76% | 12.19% | 9.39% |
| S&P 500 Index Total Return (SPTR) | 36.35% | 15.98% | 13.38% |
Index data prior to December 2, 2019 reflects that of the Solactive High Income MLP Index. All Index history reflects a blend of the performance of the Indexes.
VanEck Energy Income ETF is the successor to the Yorkville High Income MLP ETF pursuant to a reorganization that took place on February 22, 2016. Prior to that date, the Fund had no investment operations. Accordingly, for periods prior to that date, the Fund performance information is that of the Yorkville High Income MLP ETF.
The performance data quoted represents past performance. Past performance is no guarantee of future results. Performance information for the Fund may reflect temporary fee waivers, if applicable. Had the Fund incurred all expenses, investment returns would have been reduced. These returns do not reflect the deduction of taxes that a shareholder would pay on Fund dividends and distributions or the or sale of Fund shares.
Investment returns and value of the shares of the Fund will fluctuate so that an investor's shares, when sold, may be worth more or less than their original cost. Performance may be lower or higher than performance data quoted. Fund returns reflect reinvestment of dividends and capital gains distributions. Returns for actual Fund investors may differ from what is shown because of differences in timing, the amount invested and fees and expenses.
Index returns are not Fund returns and do not reflect any management fees or brokerage expenses. Certain indices may take into account withholding taxes. Investors can not invest directly in the Index. The Index is unmanaged and includes the reinvestment of all dividends.
- Total Net Assets$56,456,481
- Number of Portfolio Holdings30
- Portfolio Turnover Rate28%
- Advisory Fees Paid$201,186
What did the Fund invest in?
Portfolio Composition (% of Total Net Assets)
| Value | Value | Value |
|---|
| Liabilities in excess of other assets | | -% |
| Energy | | 100.0% |
Top Ten Holdings (% of Total Net Assets)
| The Williams Companies, Inc. | | 8.0% |
| Enbridge, Inc. | | 7.9% |
| ONEOK, Inc. | | 6.9% |
| TC Energy Corp. | | 6.6% |
| Cheniere Energy, Inc. | | 6.0% |
| Kinder Morgan, Inc. | | 5.7% |
| Targa Resources Corp. | | 5.0% |
| DT Midstream, Inc. | | 4.6% |
| Antero Midstream Corp. | | 4.6% |
| MPLX LP | | 4.5% |
Householding is an option available to certain fund investors. Householding is a method of delivery, based on the preference of the individual investor, in which a single copy of certain shareholder documents can be delivered to investors who share the same address, even if their accounts are registered under different names. Please contact your broker-dealer if you are interested in enrolling in householding and receiving a single copy of prospectuses and other shareholder documents, or if you are currently enrolled in householding and wish to change your householding status.
Need Additional Information?
If you wish to view additional information about the Fund including but not limited to financial statements, prospectus or holdings please scan the QR code or visit https://www.vaneck.com/us/en/etf-mutual-fund-finder/etfs/documents/.
VanEck Environmental Services ETF
Principal U.S. Listing Exchange: NYSE Arca, Inc.
Annual Shareholder Report - September 30, 2024
This annual shareholder report contains important information about the VanEck Environmental Services ETF for the period October 1, 2023 to September 30, 2024. You can find additional information about the Fund at https://www.vaneck.com/us/en/etf-mutual-fund-finder/etfs/documents/. You can also request this information by contacting us at 800.826.2333 or info@vaneck.com.
What were the Fund costs for the last year?
(based on a hypothetical $10,000 investment)
| Fund Name | Costs of a $10,000 investment | Costs paid as a % of a $10,000 investment |
|---|
| VanEck Environmental Services ETF | $63 | 0.55% |
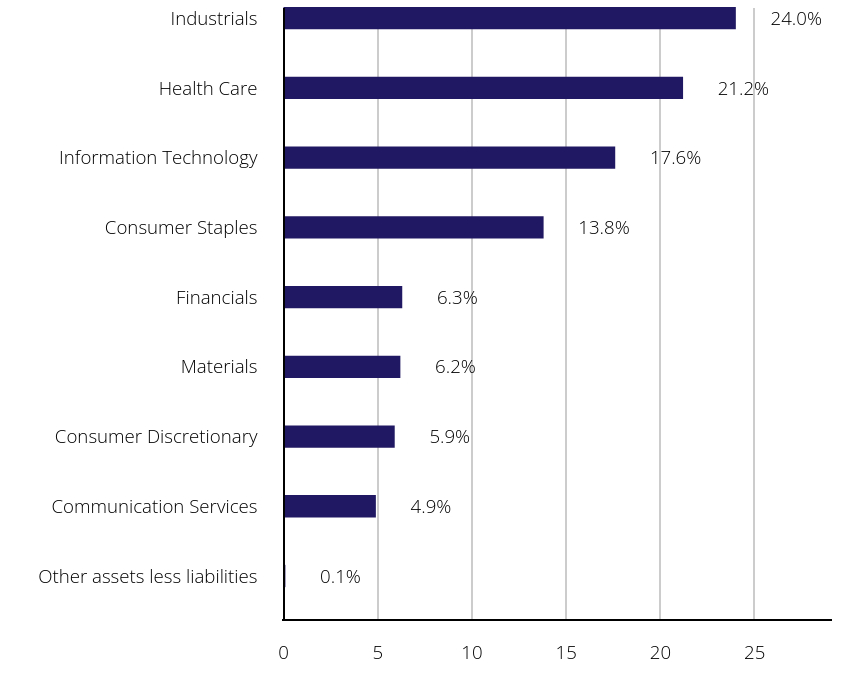
How did the Fund perform last year?
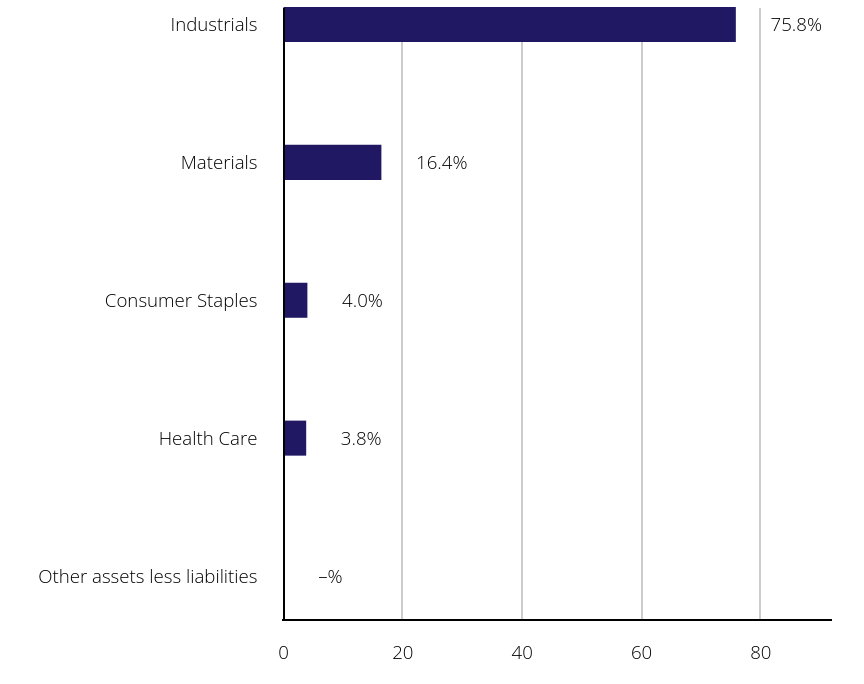
The environmental services industry benefited from growing corporate and governmental initiatives focused on sustainability and recycling, supporting overall growth.
Industrials were the largest sector contributor, with waste management companies expanding recycling capabilities.
Republic Services, Inc. was the top individual contributor, benefiting from strong financial performance, effective pricing strategies, operational efficiency, and strategic acquisitions.
The energy sector detracted the most, due to fluctuating oil prices, geopolitical tensions, and a shift in investor focus toward high-growth sectors like technology.
Vertex Energy, Inc., was the largest detractor because of financial challenges, including a net losses in Q4 2023, operational setbacks like pausing renewable diesel production and filing for Chapter 11 bankruptcy in September 2024.
How did the Fund perform over the past 10 years?
Cumulative Performance Based on $10,000 Investment
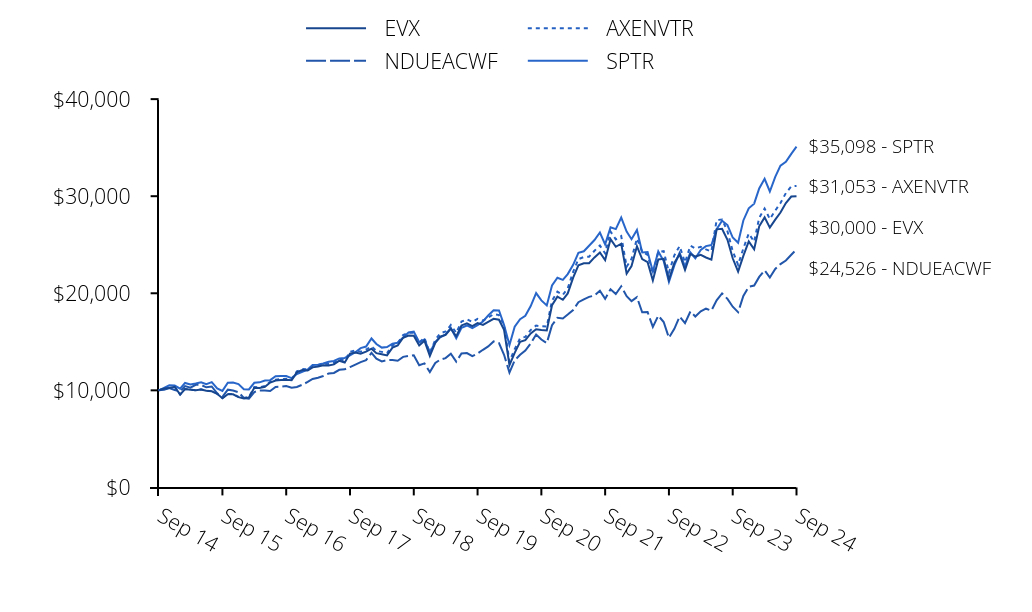
| EVX | NDUEACWF | AXENVTR | SPTR |
|---|
| Sep 14 | $10,000 | $10,000 | $10,000 | $10,000 |
| Oct 14 | $10,186 | $10,070 | $10,187 | $10,244 |
| Nov 14 | $10,234 | $10,239 | $10,235 | $10,520 |
| Dec 14 | $10,368 | $10,041 | $10,377 | $10,493 |
| Jan 15 | $9,566 | $9,884 | $9,575 | $10,178 |
| Feb 15 | $10,136 | $10,435 | $10,135 | $10,763 |
| Mar 15 | $10,070 | $10,273 | $10,071 | $10,593 |
| Apr 15 | $10,011 | $10,571 | $10,016 | $10,695 |
| May 15 | $10,093 | $10,557 | $10,101 | $10,832 |
| Jun 15 | $9,955 | $10,309 | $9,965 | $10,622 |
| Jul 15 | $9,901 | $10,398 | $9,915 | $10,845 |
| Aug 15 | $9,642 | $9,685 | $9,661 | $10,191 |
| Sep 15 | $9,182 | $9,334 | $9,206 | $9,939 |
| Oct 15 | $9,590 | $10,067 | $9,618 | $10,777 |
| Nov 15 | $9,594 | $9,984 | $9,626 | $10,809 |
| Dec 15 | $9,296 | $9,804 | $9,337 | $10,638 |
| Jan 16 | $9,170 | $9,213 | $9,215 | $10,111 |
| Feb 16 | $9,269 | $9,149 | $9,319 | $10,097 |
| Mar 16 | $10,268 | $9,827 | $10,330 | $10,782 |
| Apr 16 | $10,244 | $9,972 | $10,309 | $10,824 |
| May 16 | $10,369 | $9,985 | $10,438 | $11,018 |
| Jun 16 | $10,803 | $9,924 | $10,878 | $11,047 |
| Jul 16 | $11,003 | $10,352 | $11,085 | $11,454 |
| Aug 16 | $11,069 | $10,387 | $11,157 | $11,470 |
| Sep 16 | $11,088 | $10,451 | $11,182 | $11,472 |
| Oct 16 | $11,048 | $10,273 | $11,146 | $11,263 |
| Nov 16 | $11,845 | $10,351 | $11,956 | $11,680 |
| Dec 16 | $12,085 | $10,575 | $12,203 | $11,911 |
| Jan 17 | $12,053 | $10,864 | $12,178 | $12,137 |
| Feb 17 | $12,365 | $11,169 | $12,497 | $12,619 |
| Mar 17 | $12,460 | $11,305 | $12,600 | $12,633 |
| Apr 17 | $12,594 | $11,482 | $12,743 | $12,763 |
| May 17 | $12,562 | $11,735 | $12,715 | $12,943 |
| Jun 17 | $12,671 | $11,789 | $12,833 | $13,023 |
| Jul 17 | $13,054 | $12,118 | $13,226 | $13,291 |
| Aug 17 | $12,870 | $12,164 | $13,047 | $13,332 |
| Sep 17 | $13,783 | $12,399 | $13,980 | $13,607 |
| Oct 17 | $13,902 | $12,657 | $14,106 | $13,925 |
| Nov 17 | $13,767 | $12,902 | $13,976 | $14,352 |
| Dec 17 | $13,985 | $13,110 | $14,206 | $14,511 |
| Jan 18 | $14,292 | $13,850 | $14,525 | $15,342 |
| Feb 18 | $13,833 | $13,268 | $14,065 | $14,777 |
| Mar 18 | $13,721 | $12,984 | $13,962 | $14,401 |
| Apr 18 | $13,592 | $13,108 | $13,836 | $14,456 |
| May 18 | $14,394 | $13,124 | $14,645 | $14,804 |
| Jun 18 | $14,615 | $13,053 | $14,875 | $14,895 |
| Jul 18 | $15,419 | $13,447 | $15,699 | $15,450 |
| Aug 18 | $15,647 | $13,552 | $15,940 | $15,953 |
| Sep 18 | $15,624 | $13,611 | $15,921 | $16,044 |
| Oct 18 | $14,624 | $12,591 | $14,910 | $14,947 |
| Nov 18 | $15,113 | $12,776 | $15,416 | $15,252 |
| Dec 18 | $13,547 | $11,876 | $13,830 | $13,875 |
| Jan 19 | $14,888 | $12,813 | $15,204 | $14,987 |
| Feb 19 | $15,526 | $13,156 | $15,863 | $15,468 |
| Mar 19 | $15,709 | $13,322 | $16,059 | $15,769 |
| Apr 19 | $16,355 | $13,771 | $16,727 | $16,407 |
| May 19 | $15,565 | $12,955 | $15,927 | $15,364 |
| Jun 19 | $16,685 | $13,803 | $17,081 | $16,447 |
| Jul 19 | $16,912 | $13,843 | $17,322 | $16,684 |
| Aug 19 | $16,625 | $13,515 | $17,037 | $16,419 |
| Sep 19 | $16,920 | $13,799 | $17,362 | $16,727 |
| Oct 19 | $16,738 | $14,177 | $17,182 | $17,089 |
| Nov 19 | $17,046 | $14,523 | $17,506 | $17,709 |
| Dec 19 | $17,370 | $15,034 | $17,844 | $18,244 |
| Jan 20 | $17,274 | $14,868 | $17,752 | $18,237 |
| Feb 20 | $16,227 | $13,667 | $16,680 | $16,735 |
| Mar 20 | $12,591 | $11,822 | $12,968 | $14,668 |
| Apr 20 | $13,867 | $13,089 | $14,238 | $16,549 |
| May 20 | $14,988 | $13,658 | $15,357 | $17,337 |
| Jun 20 | $15,168 | $14,094 | $15,508 | $17,682 |
| Jul 20 | $15,859 | $14,840 | $16,222 | $18,679 |
| Aug 20 | $16,291 | $15,748 | $16,674 | $20,021 |
| Sep 20 | $16,205 | $15,240 | $16,594 | $19,260 |
| Oct 20 | $16,173 | $14,870 | $16,570 | $18,748 |
| Nov 20 | $18,766 | $16,703 | $19,236 | $20,801 |
| Dec 20 | $19,655 | $17,478 | $20,162 | $21,600 |
| Jan 21 | $19,332 | $17,399 | $19,838 | $21,382 |
| Feb 21 | $19,984 | $17,802 | $20,517 | $21,972 |
| Mar 21 | $21,613 | $18,277 | $22,209 | $22,934 |
| Apr 21 | $22,876 | $19,076 | $23,516 | $24,158 |
| May 21 | $23,082 | $19,373 | $23,738 | $24,327 |
| Jun 21 | $23,096 | $19,628 | $23,760 | $24,895 |
| Jul 21 | $23,691 | $19,764 | $24,380 | $25,486 |
| Aug 21 | $24,202 | $20,258 | $24,915 | $26,261 |
| Sep 21 | $23,417 | $19,422 | $24,116 | $25,040 |
| Oct 21 | $25,582 | $20,413 | $26,355 | $26,794 |
| Nov 21 | $24,789 | $19,921 | $25,551 | $26,608 |
| Dec 21 | $25,104 | $20,718 | $25,887 | $27,801 |
| Jan 22 | $22,025 | $19,701 | $22,723 | $26,362 |
| Feb 22 | $22,812 | $19,192 | $23,542 | $25,573 |
| Mar 22 | $24,838 | $19,607 | $25,637 | $26,522 |
| Apr 22 | $23,528 | $18,038 | $24,292 | $24,209 |
| May 22 | $23,207 | $18,059 | $23,964 | $24,254 |
| Jun 22 | $21,324 | $16,537 | $22,020 | $22,252 |
| Jul 22 | $23,487 | $17,692 | $24,262 | $24,304 |
| Aug 22 | $23,549 | $17,040 | $24,337 | $23,312 |
| Sep 22 | $21,413 | $15,409 | $22,144 | $21,165 |
| Oct 22 | $23,120 | $16,339 | $23,909 | $22,879 |
| Nov 22 | $24,027 | $17,606 | $24,856 | $24,158 |
| Dec 22 | $22,400 | $16,913 | $23,179 | $22,766 |
| Jan 23 | $24,062 | $18,126 | $24,905 | $24,196 |
| Feb 23 | $23,781 | $17,606 | $24,624 | $23,606 |
| Mar 23 | $23,953 | $18,149 | $24,785 | $24,473 |
| Apr 23 | $23,687 | $18,410 | $24,520 | $24,855 |
| May 23 | $23,470 | $18,213 | $24,308 | $24,963 |
| Jun 23 | $26,582 | $19,270 | $27,542 | $26,612 |
| Jul 23 | $26,639 | $19,976 | $27,603 | $27,467 |
| Aug 23 | $25,510 | $19,418 | $26,388 | $27,030 |
| Sep 23 | $23,606 | $18,615 | $24,341 | $25,741 |
| Oct 23 | $22,237 | $18,055 | $22,937 | $25,200 |
| Nov 23 | $23,854 | $19,721 | $24,610 | $27,501 |
| Dec 23 | $25,340 | $20,669 | $26,152 | $28,750 |
| Jan 24 | $24,526 | $20,790 | $25,316 | $29,233 |
| Feb 24 | $26,900 | $21,682 | $27,769 | $30,794 |
| Mar 24 | $27,817 | $22,363 | $28,731 | $31,785 |
| Apr 24 | $26,759 | $21,625 | $27,650 | $30,487 |
| May 24 | $27,581 | $22,503 | $28,513 | $31,999 |
| Jun 24 | $28,317 | $23,004 | $29,293 | $33,147 |
| Jul 24 | $29,301 | $23,375 | $30,320 | $33,550 |
| Aug 24 | $29,964 | $23,969 | $31,015 | $34,364 |
| Sep 24 | $30,000 | $24,526 | $31,053 | $35,098 |
This chart shows the value of a hypothetical $10,000 investment in the Fund at NAV over the past 10 fiscal years.
Average Annual Total Returns
| . | 1 Year | 5 Years | 10 Years |
|---|
| VanEck Environmental Services ETF | 27.09% | 12.13% | 11.61% |
| NYSE Arca Environmental Services Index (TR) (AXENVTR) | 27.57% | 12.33% | 12.00% |
| MSCI ACWI Net TR Index (NDUEACWF) | 31.76% | 12.19% | 9.39% |
| S&P 500 Index Total Return (SPTR) | 36.35% | 15.98% | 13.38% |
The performance data quoted represents past performance. Past performance is no guarantee of future results. Performance information for the Fund may reflect temporary fee waivers, if applicable. Had the Fund incurred all expenses, investment returns would have been reduced. These returns do not reflect the deduction of taxes that a shareholder would pay on Fund dividends and distributions or the or sale of Fund shares.
Investment returns and value of the shares of the Fund will fluctuate so that an investor's shares, when sold, may be worth more or less than their original cost. Performance may be lower or higher than performance data quoted. Fund returns reflect reinvestment of dividends and capital gains distributions. Returns for actual Fund investors may differ from what is shown because of differences in timing, the amount invested and fees and expenses.
Index returns are not Fund returns and do not reflect any management fees or brokerage expenses. Certain indices may take into account withholding taxes. Investors can not invest directly in the Index. The Index is unmanaged and includes the reinvestment of all dividends.
- Total Net Assets$79,427,773
- Number of Portfolio Holdings23
- Portfolio Turnover Rate23%
- Advisory Fees Paid$322,817
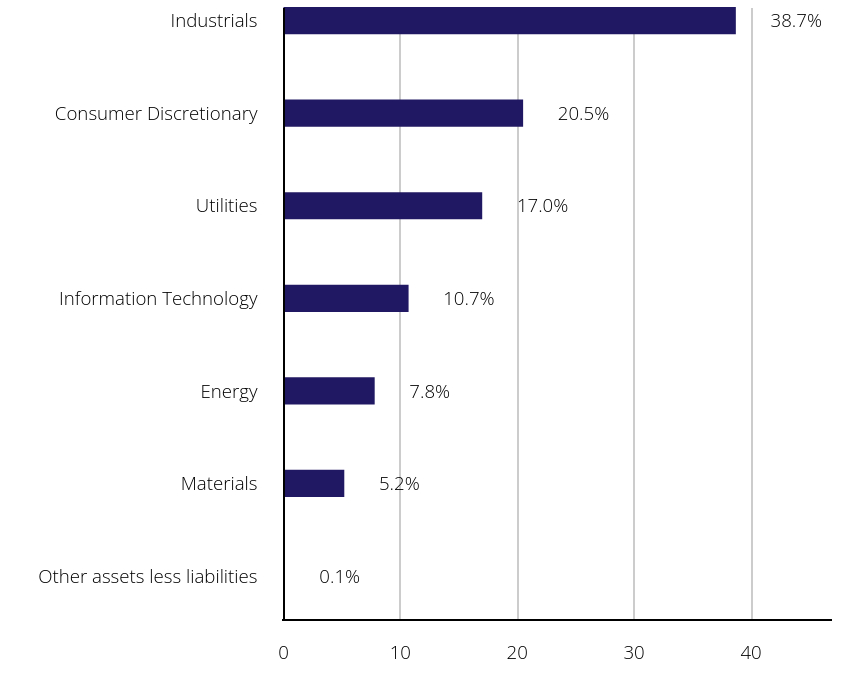
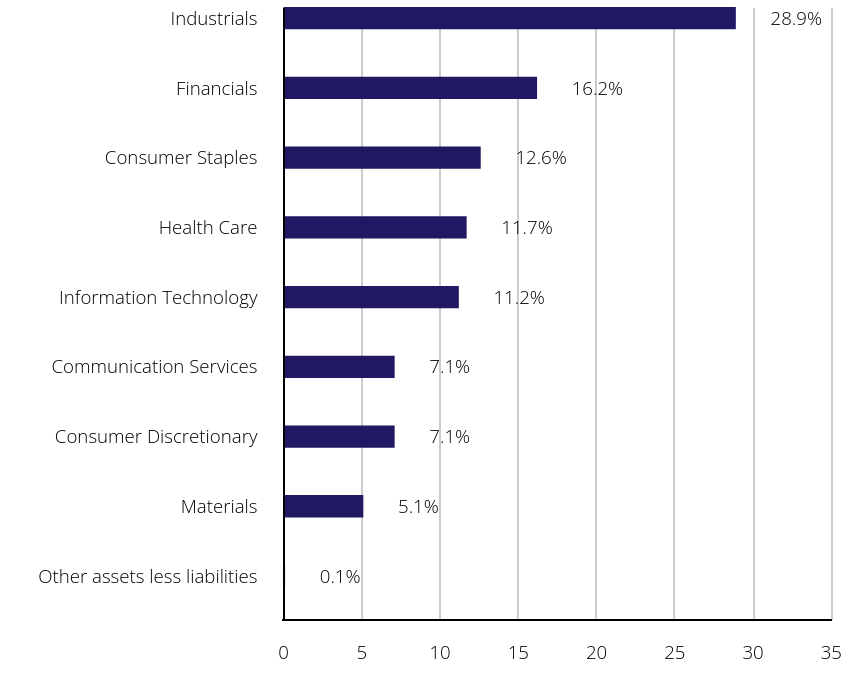
What did the Fund invest in?
Portfolio Composition (% of Total Net Assets)
| Value | Value | Value |
|---|
| Other assets less liabilities | | -% |
| Health Care | | 3.8% |
| Consumer Staples | | 4.0% |
| Materials | | 16.4% |
| Industrials | | 75.8% |
Top Ten Holdings (% of Total Net Assets)
| Waste Management, Inc. | | 10.1% |
| Ecolab, Inc. | | 10.1% |
| Republic Services, Inc. | | 9.8% |
| Waste Connections, Inc. | | 9.8% |
| PureCycle Technologies, Inc. | | 4.1% |
| Darling Ingredients, Inc. | | 4.0% |
| ABM Industries, Inc. | | 3.9% |
| Donaldson Co., Inc. | | 3.9% |
| Veralto Corp. | | 3.9% |
| GFL Environmental, Inc. | | 3.9% |
Householding is an option available to certain fund investors. Householding is a method of delivery, based on the preference of the individual investor, in which a single copy of certain shareholder documents can be delivered to investors who share the same address, even if their accounts are registered under different names. Please contact your broker-dealer if you are interested in enrolling in householding and receiving a single copy of prospectuses and other shareholder documents, or if you are currently enrolled in householding and wish to change your householding status.
Need Additional Information?
If you wish to view additional information about the Fund including but not limited to financial statements, prospectus or holdings please scan the QR code or visit https://www.vaneck.com/us/en/etf-mutual-fund-finder/etfs/documents/.
VanEck Fabless Semiconductor ETF
Principal U.S. Listing Exchange: The NASDAQ Stock Market LLC
Annual Shareholder Report - September 30, 2024
This annual shareholder report contains important information about the VanEck Fabless Semiconductor ETF for the period August 27, 2024 (inception of Fund) to September 30, 2024. You can find additional information about the Fund at https://www.vaneck.com/us/en/etf-mutual-fund-finder/etfs/documents/. You can also request this information by contacting us at 800.826.2333 or info@vaneck.com.
What were the Fund costs for the period?
(based on a hypothetical $10,000 investment)
| Fund Name | Costs of a $10,000 investment | Costs paid as a % of a $10,000 investment |
|---|
| VanEck Fabless Semiconductor ETF | $3 | 0.35%Footnote Reference(a) |
| Footnote | Description |
Footnote(a) | Annualized |
How did the Fund perform last year?
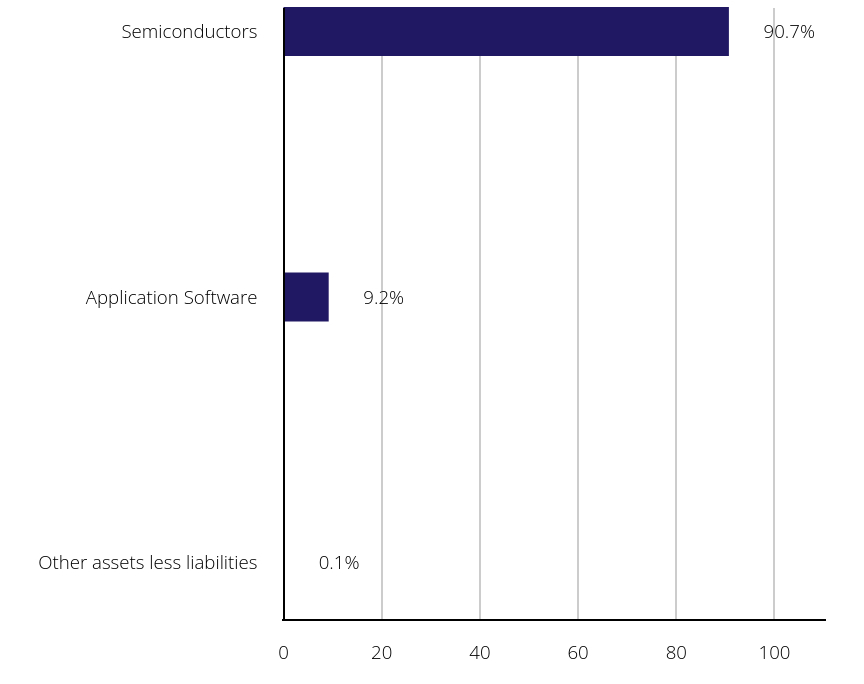
Fabless semiconductor companies performed exceptionally since the inception of the Fund, bolstered by the increasing demand for advanced chip designs in Artificial Intelligence ("AI"), automotive and mobile devices.
The information technology sector was the largest contributor, led by companies designing cutting-edge semiconductors.
Impinj, Inc., a leader in RAIN RFID technology, has recently outperformed due to strong financial results as well as inclusion in more broad indices which helped boost attractiveness.
Nvidia Corp. was the largest individual detractor since inception, underperforming due to recent earnings reports and estimations of future products.
How did the Fund perform since inception?
Cumulative Performance Based on $10,000 Investment
| SMHX | NDUEACWF | MVSMHX |
|---|
| Aug-24 | $10,000 | $10,000 | $10,000 |
| Aug-24 | $9,971 | $10,036 | $9,971 |
| Sep-24 | $10,160 | $10,269 | $10,155 |
This chart shows the value of a hypothetical $10,000 investment in the Fund at NAV since inception.
Average Annual Total Returns
| . | Life* |
|---|
| VanEck Fabless Semiconductor ETF | 1.60% |
| MarketVector™ US Listed Fabless Semiconductor Index (MVSMHX) | 1.55% |
| MSCI ACWI Net TR Index (NDUEACWF) | 2.69% |
* Inception of Fund: 8/27/24
The performance data quoted represents past performance. Past performance is no guarantee of future results. Performance information for the Fund may reflect temporary fee waivers, if applicable. Had the Fund incurred all expenses, investment returns would have been reduced. These returns do not reflect the deduction of taxes that a shareholder would pay on Fund dividends and distributions or the or sale of Fund shares.
Investment returns and value of the shares of the Fund will fluctuate so that an investor's shares, when sold, may be worth more or less than their original cost. Performance may be lower or higher than performance data quoted. Fund returns reflect reinvestment of dividends and capital gains distributions. Returns for actual Fund investors may differ from what is shown because of differences in timing, the amount invested and fees and expenses.
Index returns are not Fund returns and do not reflect any management fees or brokerage expenses. Certain indices may take into account withholding taxes. Investors can not invest directly in the Index. The Index is unmanaged and includes the reinvestment of all dividends.
- Total Net Assets$6,416,630
- Number of Portfolio Holdings22
- Portfolio Turnover Rate7%
- Advisory Fees Paid$1,171
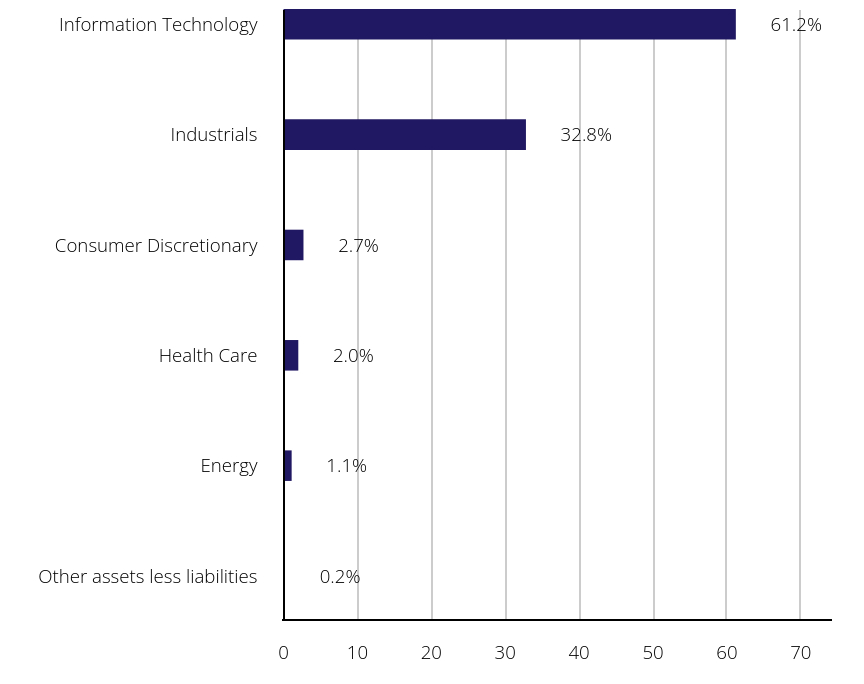
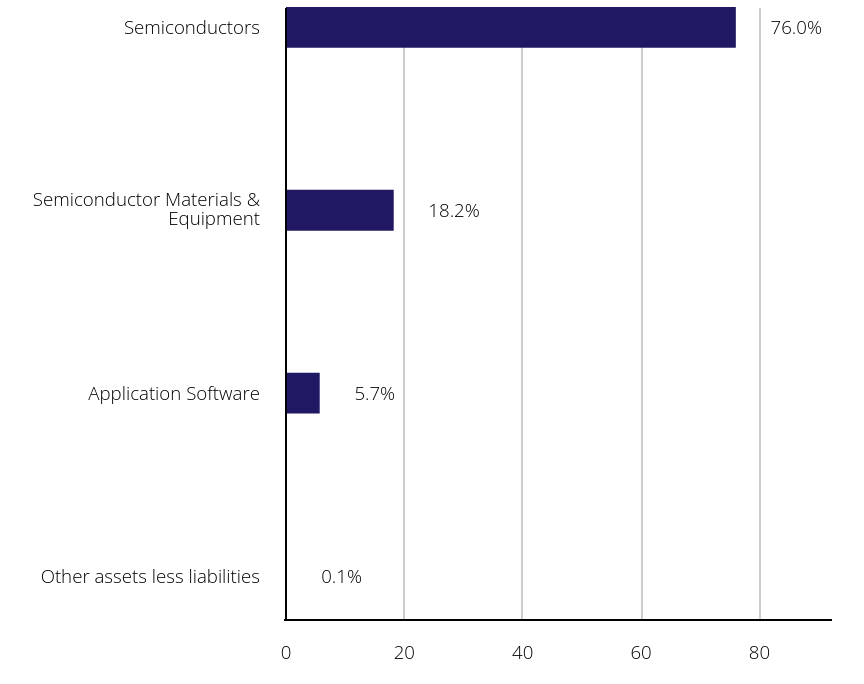
What did the Fund invest in?
Portfolio Composition (% of Total Net Assets)
| Value | Value | Value |
|---|
| Other assets less liabilities | | 0.1% |
| Application Software | | 9.2% |
| Semiconductors | | 90.7% |
Top Ten Holdings (% of Total Net Assets)
| NVIDIA Corp. | | 19.6% |
| Broadcom, Inc. | | 15.4% |
| Advanced Micro Devices, Inc. | | 5.2% |
| Astera Labs, Inc. | | 5.1% |
| Synopsys, Inc. | | 4.9% |
| Qualcomm, Inc. | | 4.8% |
| Monolithic Power Systems, Inc. | | 4.4% |
| Cadence Design Systems, Inc. | | 4.3% |
| ARM Holdings Plc | | 4.3% |
| Marvell Technology, Inc. | | 4.1% |
Householding is an option available to certain fund investors. Householding is a method of delivery, based on the preference of the individual investor, in which a single copy of certain shareholder documents can be delivered to investors who share the same address, even if their accounts are registered under different names. Please contact your broker-dealer if you are interested in enrolling in householding and receiving a single copy of prospectuses and other shareholder documents, or if you are currently enrolled in householding and wish to change your householding status.
Need Additional Information?
If you wish to view additional information about the Fund including but not limited to financial statements, prospectus or holdings please scan the QR code or visit https://www.vaneck.com/us/en/etf-mutual-fund-finder/etfs/documents/.
Principal U.S. Listing Exchange: The NASDAQ Stock Market LLC
Annual Shareholder Report - September 30, 2024
This annual shareholder report contains important information about the VanEck Gaming ETF for the period October 1, 2023 to September 30, 2024. You can find additional information about the Fund at https://www.vaneck.com/us/en/etf-mutual-fund-finder/etfs/documents/. You can also request this information by contacting us at 800.826.2333 or info@vaneck.com.
This report describes changes to the Fund that occurred during the reporting period.
What were the Fund costs for the last year?
(based on a hypothetical $10,000 investment)
| Fund Name | Costs of a $10,000 investment | Costs paid as a % of a $10,000 investment |
|---|
| VanEck Gaming ETF | $72 | 0.67% |
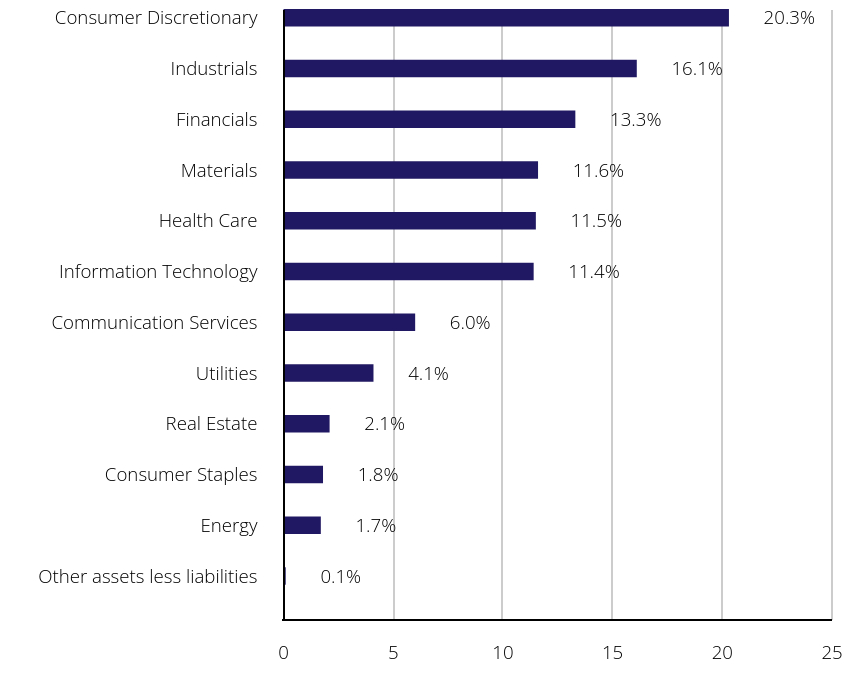
How did the Fund perform last year?
The global gaming and casino industry recovered over the past year as in-person gaming rebounded, though regulatory issues in key markets tempered growth.
Consumer discretionary was the leading sector contributor, driven by renewed demand in both physical and online gaming.
Aristocrat Leisure Ltd., was the leading individual contributor due to strong financial performance, including an increase in net profit in the first half of fiscal 2024 as well as strategic initiatives in its digital gaming.
Sands China Ltd. was the largest individual detractor, primarily due to disruptions from ongoing renovations at the Londoner Macao, intensified competition within the Macao gaming sector, and regulatory challenges, including increased gaming taxes and mandated non-gaming investments.
How did the Fund perform over the past 10 years?
Cumulative Performance Based on $10,000 Investment
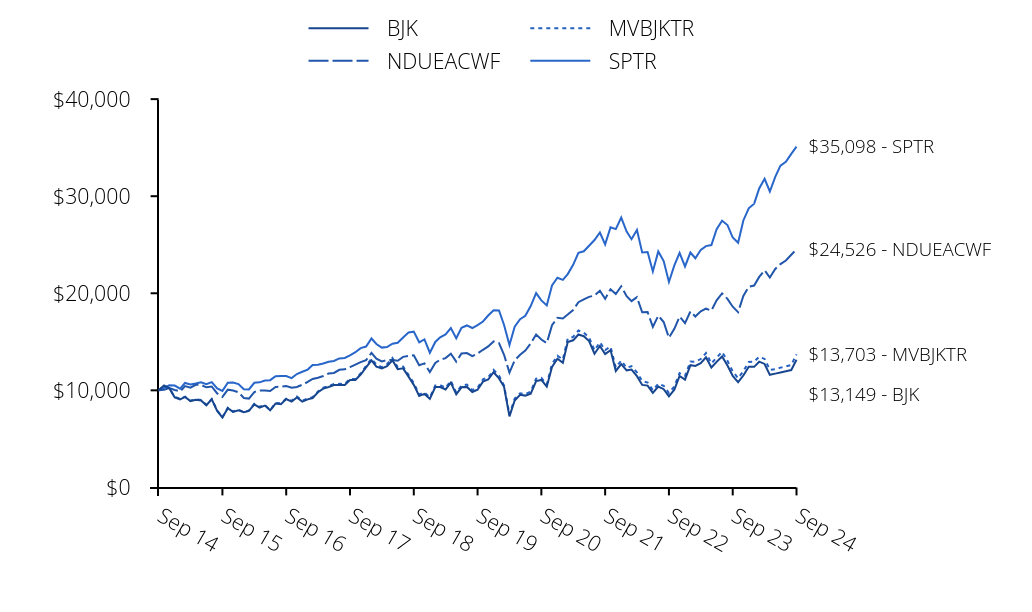
| BJK | NDUEACWF | MVBJKTR | SPTR |
|---|
| Sep 14 | $10,000 | $10,000 | $10,000 | $10,000 |
| Oct 14 | $10,493 | $10,070 | $10,472 | $10,244 |
| Nov 14 | $10,221 | $10,239 | $10,232 | $10,520 |
| Dec 14 | $9,278 | $10,041 | $9,333 | $10,493 |
| Jan 15 | $9,077 | $9,884 | $9,125 | $10,178 |
| Feb 15 | $9,324 | $10,435 | $9,343 | $10,763 |
| Mar 15 | $8,893 | $10,273 | $8,920 | $10,593 |
| Apr 15 | $9,019 | $10,571 | $9,085 | $10,695 |
| May 15 | $8,949 | $10,557 | $9,004 | $10,832 |
| Jun 15 | $8,463 | $10,309 | $8,519 | $10,622 |
| Jul 15 | $9,067 | $10,398 | $9,107 | $10,845 |
| Aug 15 | $7,876 | $9,685 | $7,922 | $10,191 |
| Sep 15 | $7,209 | $9,334 | $7,228 | $9,939 |
| Oct 15 | $8,151 | $10,067 | $8,209 | $10,777 |
| Nov 15 | $7,774 | $9,984 | $7,818 | $10,809 |
| Dec 15 | $7,952 | $9,804 | $8,029 | $10,638 |
| Jan 16 | $7,743 | $9,213 | $7,737 | $10,111 |
| Feb 16 | $7,876 | $9,149 | $7,922 | $10,097 |
| Mar 16 | $8,556 | $9,827 | $8,605 | $10,782 |
| Apr 16 | $8,226 | $9,972 | $8,304 | $10,824 |
| May 16 | $8,430 | $9,985 | $8,491 | $11,018 |
| Jun 16 | $7,942 | $9,924 | $7,957 | $11,047 |
| Jul 16 | $8,642 | $10,352 | $8,703 | $11,454 |
| Aug 16 | $8,576 | $10,387 | $8,651 | $11,470 |
| Sep 16 | $9,100 | $10,451 | $9,142 | $11,472 |
| Oct 16 | $8,835 | $10,273 | $8,926 | $11,263 |
| Nov 16 | $9,268 | $10,351 | $9,366 | $11,680 |
| Dec 16 | $8,833 | $10,575 | $8,934 | $11,911 |
| Jan 17 | $9,067 | $10,864 | $9,164 | $12,137 |
| Feb 17 | $9,209 | $11,169 | $9,302 | $12,619 |
| Mar 17 | $9,801 | $11,305 | $9,887 | $12,633 |
| Apr 17 | $10,173 | $11,482 | $10,278 | $12,763 |
| May 17 | $10,344 | $11,735 | $10,445 | $12,943 |
| Jun 17 | $10,549 | $11,789 | $10,653 | $13,023 |
| Jul 17 | $10,552 | $12,118 | $10,667 | $13,291 |
| Aug 17 | $10,554 | $12,164 | $10,655 | $13,332 |
| Sep 17 | $11,063 | $12,399 | $11,167 | $13,607 |
| Oct 17 | $11,061 | $12,657 | $11,175 | $13,925 |
| Nov 17 | $11,629 | $12,902 | $11,733 | $14,352 |
| Dec 17 | $12,358 | $13,110 | $12,521 | $14,511 |
| Jan 18 | $13,078 | $13,850 | $13,250 | $15,342 |
| Feb 18 | $12,446 | $13,268 | $12,650 | $14,777 |
| Mar 18 | $12,268 | $12,984 | $12,391 | $14,401 |
| Apr 18 | $12,499 | $13,108 | $12,707 | $14,456 |
| May 18 | $13,100 | $13,124 | $13,329 | $14,804 |
| Jun 18 | $12,180 | $13,053 | $12,388 | $14,895 |
| Jul 18 | $12,265 | $13,447 | $12,449 | $15,450 |
| Aug 18 | $11,410 | $13,552 | $11,596 | $15,953 |
| Sep 18 | $10,565 | $13,611 | $10,755 | $16,044 |
| Oct 18 | $9,425 | $12,591 | $9,576 | $14,947 |
| Nov 18 | $9,632 | $12,776 | $9,777 | $15,252 |
| Dec 18 | $9,115 | $11,876 | $9,277 | $13,875 |
| Jan 19 | $10,347 | $12,813 | $10,491 | $14,987 |
| Feb 19 | $10,344 | $13,156 | $10,527 | $15,468 |
| Mar 19 | $10,091 | $13,322 | $10,256 | $15,769 |
| Apr 19 | $10,801 | $13,771 | $10,984 | $16,407 |
| May 19 | $9,580 | $12,955 | $9,762 | $15,364 |
| Jun 19 | $10,314 | $13,803 | $10,499 | $16,447 |
| Jul 19 | $10,354 | $13,843 | $10,594 | $16,684 |
| Aug 19 | $9,832 | $13,515 | $10,029 | $16,419 |
| Sep 19 | $10,065 | $13,799 | $10,262 | $16,727 |
| Oct 19 | $10,899 | $14,177 | $11,124 | $17,089 |
| Nov 19 | $11,112 | $14,523 | $11,332 | $17,709 |
| Dec 19 | $11,866 | $15,034 | $12,106 | $18,244 |
| Jan 20 | $11,224 | $14,868 | $11,518 | $18,237 |
| Feb 20 | $10,362 | $13,667 | $10,482 | $16,735 |
| Mar 20 | $7,318 | $11,822 | $7,493 | $14,668 |
| Apr 20 | $8,953 | $13,089 | $9,148 | $16,549 |
| May 20 | $9,539 | $13,658 | $9,691 | $17,337 |
| Jun 20 | $9,457 | $14,094 | $9,600 | $17,682 |
| Jul 20 | $9,661 | $14,840 | $9,867 | $18,679 |
| Aug 20 | $10,959 | $15,748 | $11,212 | $20,021 |
| Sep 20 | $11,074 | $15,240 | $11,293 | $19,260 |
| Oct 20 | $10,377 | $14,870 | $10,599 | $18,748 |
| Nov 20 | $12,413 | $16,703 | $12,716 | $20,801 |
| Dec 20 | $13,270 | $17,478 | $13,579 | $21,600 |
| Jan 21 | $12,844 | $17,399 | $13,173 | $21,382 |
| Feb 21 | $14,970 | $17,802 | $15,325 | $21,972 |
| Mar 21 | $15,155 | $18,277 | $15,508 | $22,934 |
| Apr 21 | $15,754 | $19,076 | $16,159 | $24,158 |
| May 21 | $15,573 | $19,373 | $15,936 | $24,327 |
| Jun 21 | $15,084 | $19,628 | $15,459 | $24,895 |
| Jul 21 | $13,771 | $19,764 | $14,122 | $25,486 |
| Aug 21 | $14,566 | $20,258 | $14,951 | $26,261 |
| Sep 21 | $13,738 | $19,422 | $14,149 | $25,040 |
| Oct 21 | $14,142 | $20,413 | $14,501 | $26,794 |
| Nov 21 | $11,998 | $19,921 | $12,346 | $26,608 |
| Dec 21 | $12,708 | $20,718 | $13,069 | $27,801 |
| Jan 22 | $12,061 | $19,701 | $12,322 | $26,362 |
| Feb 22 | $12,142 | $19,192 | $12,485 | $25,573 |
| Mar 22 | $11,462 | $19,607 | $11,853 | $26,522 |
| Apr 22 | $10,558 | $18,038 | $10,958 | $24,209 |
| May 22 | $10,489 | $18,059 | $10,807 | $24,254 |
| Jun 22 | $9,741 | $16,537 | $10,014 | $22,252 |
| Jul 22 | $10,393 | $17,692 | $10,685 | $24,304 |
| Aug 22 | $10,115 | $17,040 | $10,468 | $23,312 |
| Sep 22 | $9,381 | $15,409 | $9,713 | $21,165 |
| Oct 22 | $10,066 | $16,339 | $10,403 | $22,879 |
| Nov 22 | $11,481 | $17,606 | $11,771 | $24,158 |
| Dec 22 | $11,103 | $16,913 | $11,483 | $22,766 |
| Jan 23 | $12,595 | $18,126 | $12,978 | $24,196 |
| Feb 23 | $12,517 | $17,606 | $12,951 | $23,606 |
| Mar 23 | $12,804 | $18,149 | $13,225 | $24,473 |
| Apr 23 | $13,406 | $18,410 | $13,837 | $24,855 |
| May 23 | $12,360 | $18,213 | $12,781 | $24,963 |
| Jun 23 | $12,936 | $19,270 | $13,377 | $26,612 |
| Jul 23 | $13,491 | $19,976 | $13,958 | $27,467 |
| Aug 23 | $12,563 | $19,418 | $13,040 | $27,030 |
| Sep 23 | $11,496 | $18,615 | $11,949 | $25,741 |
| Oct 23 | $10,852 | $18,055 | $11,250 | $25,200 |
| Nov 23 | $11,524 | $19,721 | $11,971 | $27,501 |
| Dec 23 | $12,435 | $20,669 | $12,925 | $28,750 |
| Jan 24 | $12,420 | $20,790 | $12,951 | $29,233 |
| Feb 24 | $12,952 | $21,682 | $13,468 | $30,794 |
| Mar 24 | $12,719 | $22,363 | $13,233 | $31,785 |
| Apr 24 | $11,596 | $21,625 | $12,116 | $30,487 |
| May 24 | $11,723 | $22,503 | $12,168 | $31,999 |
| Jun 24 | $11,838 | $23,004 | $12,340 | $33,147 |
| Jul 24 | $11,965 | $23,375 | $12,459 | $33,550 |
| Aug 24 | $12,091 | $23,969 | $12,601 | $34,364 |
| Sep 24 | $13,149 | $24,526 | $13,703 | $35,098 |
This chart shows the value of a hypothetical $10,000 investment in the Fund at NAV over the past 10 fiscal years.
Average Annual Total Returns
| . | 1 Year | 5 Years | 10 Years |
|---|
| VanEck Gaming ETF | 14.38% | 5.49% | 2.78% |
MVIS® Global Gaming Index (MVBJKTR) | 14.68% | 5.95% | 3.20% |
| MSCI ACWI Net TR Index (NDUEACWF) | 31.76% | 12.19% | 9.39% |
| S&P 500 Index Total Return (SPTR) | 36.35% | 15.98% | 13.38% |
The performance data quoted represents past performance. Past performance is no guarantee of future results. Performance information for the Fund may reflect temporary fee waivers, if applicable. Had the Fund incurred all expenses, investment returns would have been reduced. These returns do not reflect the deduction of taxes that a shareholder would pay on Fund dividends and distributions or the or sale of Fund shares.
Investment returns and value of the shares of the Fund will fluctuate so that an investor's shares, when sold, may be worth more or less than their original cost. Performance may be lower or higher than performance data quoted. Fund returns reflect reinvestment of dividends and capital gains distributions. Returns for actual Fund investors may differ from what is shown because of differences in timing, the amount invested and fees and expenses.
Index returns are not Fund returns and do not reflect any management fees or brokerage expenses. Certain indices may take into account withholding taxes. Investors can not invest directly in the Index. The Index is unmanaged and includes the reinvestment of all dividends.
- Total Net Assets$38,191,166
- Number of Portfolio Holdings33
- Portfolio Turnover Rate22%
- Advisory Fees Paid$161,379
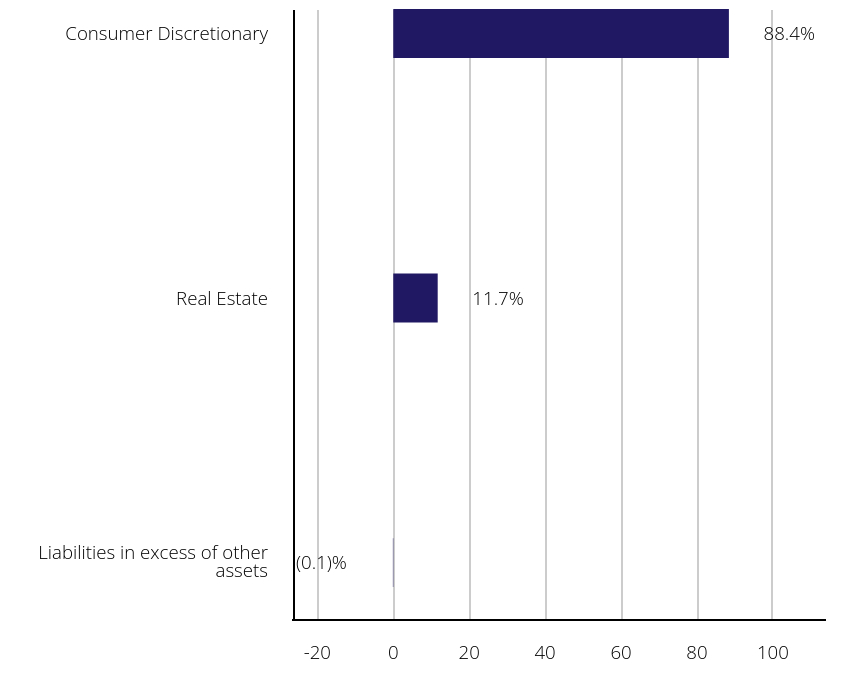
What did the Fund invest in?
Portfolio Composition (% of Total Net Assets)
| Value | Value | Value |
|---|
| Liabilities in excess of other assets | | (0.1)% |
| Real Estate | | 11.7% |
| Consumer Discretionary | | 88.4% |
Top Ten Holdings (% of Total Net Assets)
| Flutter Entertainment Plc | | 7.9% |
| VICI Properties, Inc. | | 7.2% |
| Aristocrat Leisure Ltd. | | 7.2% |
| Las Vegas Sands Corp. | | 6.5% |
| DraftKings, Inc. | | 6.1% |
| Evolution AB | | 5.6% |
| Galaxy Entertainment Group Ltd. | | 5.4% |
| Gaming and Leisure Properties, Inc. | | 4.5% |
| MGM Resorts International | | 4.4% |
| Wynn Resorts Ltd. | | 4.3% |
The following material fund change occured during the period ended September 30, 2024.
The Fund’s net expense ratio decreased to 0.67% for the year ended September 30, 2024 from 0.73% for the year ended September 30, 2023 as a result of lower interest expense.
Householding is an option available to certain fund investors. Householding is a method of delivery, based on the preference of the individual investor, in which a single copy of certain shareholder documents can be delivered to investors who share the same address, even if their accounts are registered under different names. Please contact your broker-dealer if you are interested in enrolling in householding and receiving a single copy of prospectuses and other shareholder documents, or if you are currently enrolled in householding and wish to change your householding status.
Need Additional Information?
If you wish to view additional information about the Fund including but not limited to financial statements, prospectus or holdings please scan the QR code or visit https://www.vaneck.com/us/en/etf-mutual-fund-finder/etfs/documents/.
VanEck Green Infrastructure ETF
Principal U.S. Listing Exchange: The NASDAQ Stock Market LLC
Annual Shareholder Report - September 30, 2024
This annual shareholder report contains important information about the VanEck Green Infrastructure ETF for the period October 1, 2023 to September 30, 2024. You can find additional information about the Fund at https://www.vaneck.com/us/en/etf-mutual-fund-finder/etfs/documents/. You can also request this information by contacting us at 800.826.2333 or info@vaneck.com.
What were the Fund costs for the last year?
(based on a hypothetical $10,000 investment)
| Fund Name | Costs of a $10,000 investment | Costs paid as a % of a $10,000 investment |
|---|
| VanEck Green Infrastructure ETF | $48 | 0.47% |
How did the Fund perform last year?
Green infrastructure posted positive performance over the past year, driven by global commitments to reduce carbon emissions and increasing investments in renewable energy.
Industrials were the leading sector, with companies involved in green construction and energy infrastructure outperforming.
NextEra Energy, Inc., a leader in renewable energy, was the top individual contributor, benefiting from substantial investments in wind and solar projects.
The utilities sector detracted the most, with companies in this sector facing fluctuating energy prices and regulatory delays.
Électricité de France SA was the largest individual detractor, as rising costs and operational delays in nuclear projects impacted its performance.
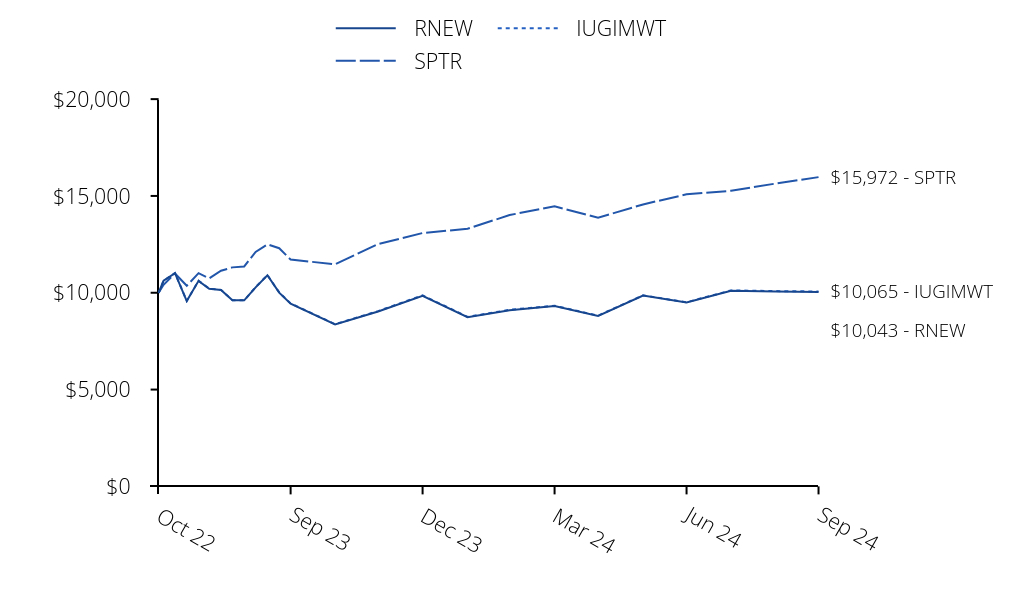
How did the Fund perform since inception?
Cumulative Performance Based on $10,000 Investment
| RNEW | SPTR | IUGIMWT |
|---|
| Oct 22 | $10,000 | $10,000 | $10,000 |
| Oct 22 | $10,619 | $10,412 | $10,620 |
| Nov 22 | $11,013 | $10,994 | $11,018 |
| Dec 22 | $9,568 | $10,360 | $9,579 |
| Jan 23 | $10,614 | $11,011 | $10,622 |
| Feb 23 | $10,207 | $10,743 | $10,213 |
| Mar 23 | $10,144 | $11,137 | $10,150 |
| Apr 23 | $9,614 | $11,311 | $9,619 |
| May 23 | $9,607 | $11,360 | $9,609 |
| Jun 23 | $10,280 | $12,111 | $10,287 |
| Jul 23 | $10,903 | $12,500 | $10,914 |
| Aug 23 | $10,004 | $12,301 | $10,017 |
| Sep 23 | $9,438 | $11,714 | $9,452 |
| Oct 23 | $8,362 | $11,468 | $8,377 |
| Nov 23 | $9,035 | $12,515 | $9,053 |
| Dec 23 | $9,842 | $13,084 | $9,865 |
| Jan 24 | $8,736 | $13,304 | $8,756 |
| Feb 24 | $9,099 | $14,014 | $9,119 |
| Mar 24 | $9,311 | $14,465 | $9,330 |
| Apr 24 | $8,806 | $13,874 | $8,820 |
| May 24 | $9,853 | $14,562 | $9,867 |
| Jun 24 | $9,495 | $15,084 | $9,509 |
| Jul 24 | $10,105 | $15,268 | $10,122 |
| Aug 24 | $10,067 | $15,638 | $10,086 |
| Sep 24 | $10,043 | $15,972 | $10,065 |
This chart shows the value of a hypothetical $10,000 investment in the Fund at NAV since inception.
Average Annual Total Returns
| . | 1 Year | Life* |
|---|
| VanEck Green Infrastructure ETF | 6.42% | 0.22% |
| Indxx US Green Infrastructure - MCAP Weighted Index (IUGIMWT) | 6.49% | 0.33% |
| S&P 500 Index Total Return (SPTR) | 36.35% | 27.13% |
* Inception of Fund: 10/18/22
The performance data quoted represents past performance. Past performance is no guarantee of future results. Performance information for the Fund may reflect temporary fee waivers, if applicable. Had the Fund incurred all expenses, investment returns would have been reduced. These returns do not reflect the deduction of taxes that a shareholder would pay on Fund dividends and distributions or the or sale of Fund shares.
Investment returns and value of the shares of the Fund will fluctuate so that an investor's shares, when sold, may be worth more or less than their original cost. Performance may be lower or higher than performance data quoted. Fund returns reflect reinvestment of dividends and capital gains distributions. Returns for actual Fund investors may differ from what is shown because of differences in timing, the amount invested and fees and expenses.
Index returns are not Fund returns and do not reflect any management fees or brokerage expenses. Certain indices may take into account withholding taxes. Investors can not invest directly in the Index. The Index is unmanaged and includes the reinvestment of all dividends.
- Total Net Assets$1,900,253
- Number of Portfolio Holdings45
- Portfolio Turnover Rate5%
- Advisory Fees Paid$7,988
What did the Fund invest in?
Portfolio Composition (% of Total Net Assets)
| Value | Value | Value |
|---|
| Other assets less liabilities | | 0.1% |
| Materials | | 5.2% |
| Energy | | 7.8% |
| Information Technology | | 10.7% |
| Utilities | | 17.0% |
| Consumer Discretionary | | 20.5% |
| Industrials | | 38.7% |
Top Ten Holdings (% of Total Net Assets)
| Tesla, Inc. | | 7.3% |
| Cheniere Energy, Inc. | | 5.6% |
| Clean Harbors, Inc. | | 5.4% |
| Quanta Services, Inc. | | 5.3% |
| Republic Services, Inc. | | 5.3% |
| Ecolab, Inc. | | 5.2% |
| Waste Management, Inc. | | 5.1% |
| Rivian Automotive, Inc. | | 4.7% |
| Donaldson Co., Inc. | | 4.5% |
| BorgWarner, Inc. | | 4.2% |
Householding is an option available to certain fund investors. Householding is a method of delivery, based on the preference of the individual investor, in which a single copy of certain shareholder documents can be delivered to investors who share the same address, even if their accounts are registered under different names. Please contact your broker-dealer if you are interested in enrolling in householding and receiving a single copy of prospectuses and other shareholder documents, or if you are currently enrolled in householding and wish to change your householding status.
Need Additional Information?
If you wish to view additional information about the Fund including but not limited to financial statements, prospectus or holdings please scan the QR code or visit https://www.vaneck.com/us/en/etf-mutual-fund-finder/etfs/documents/.
VanEck Inflation Allocation ETF
Principal U.S. Listing Exchange: NYSE Arca, Inc.
Annual Shareholder Report - September 30, 2024
This annual shareholder report contains important information about the VanEck Inflation Allocation ETF for the period October 1, 2023 to September 30, 2024. You can find additional information about the Fund at https://www.vaneck.com/us/en/etf-mutual-fund-finder/etfs/documents/. You can also request this information by contacting us at 800.826.2333 or info@vaneck.com.
What were the Fund costs for the last year?
(based on a hypothetical $10,000 investment)
| Fund Name | Costs of a $10,000 investment | Costs paid as a % of a $10,000 investment |
|---|
| VanEck Inflation Allocation ETF | $48 | 0.44% |
How did the Fund perform last year?
Collectively, real assets gained on the year, despite declining inflation and a more muted global growth outlook. Financial real assets and income-producing real assets helped prop the segment’s collective returns as commodities and natural resources equities posted muted returns.
The top contributing segment during the period was financial assets, specifically the Fund’s gold bullion and gold equity positions which benefited from increasing central bank gold buying. Income assets also contributed meaningfully to Fund performance with fairly equal contributions from midstream energy and Master Limited Partnerships, Real Estate Investment Trust exposure, and infrastructure equities.
The largest detractors from Fund performance were commodities, specifically the VanEck Commodity Strategy ETF representing broad exposure to commodity futures contracts. The Fund’s exposure to energy equities, specifically oil services and diversified energy sector companies, also weighed on the Fund’s performance.
How did the Fund perform since inception?
Cumulative Performance Based on $10,000 Investment
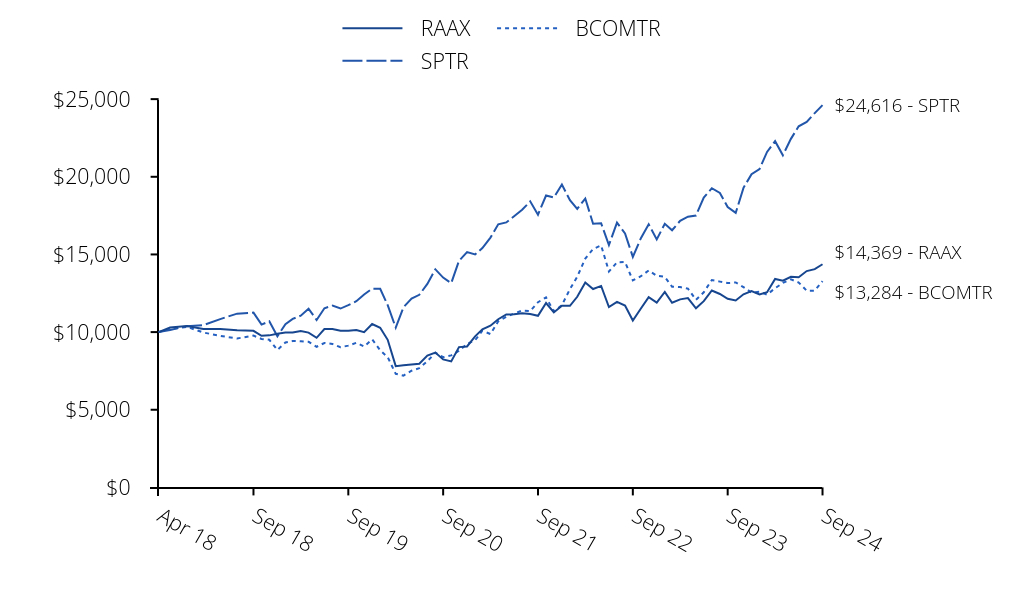
| RAAX | SPTR | BCOMTR |
|---|
| Apr 18 | $10,000 | $10,000 | $10,000 |
| Apr 18 | $10,298 | $10,139 | $10,190 |
| May 18 | $10,389 | $10,383 | $10,334 |
| Jun 18 | $10,203 | $10,447 | $9,973 |
| Jul 18 | $10,207 | $10,836 | $9,760 |
| Aug 18 | $10,115 | $11,189 | $9,588 |
| Sep 18 | $10,083 | $11,253 | $9,771 |
| Oct 18 | $9,762 | $10,483 | $9,561 |
| Nov 18 | $9,790 | $10,697 | $9,506 |
| Dec 18 | $9,900 | $9,731 | $8,852 |
| Jan 19 | $9,968 | $10,511 | $9,334 |
| Feb 19 | $9,968 | $10,848 | $9,428 |
| Mar 19 | $10,072 | $11,059 | $9,411 |
| Apr 19 | $9,968 | $11,507 | $9,372 |
| May 19 | $9,633 | $10,776 | $9,057 |
| Jun 19 | $10,192 | $11,535 | $9,299 |
| Jul 19 | $10,203 | $11,701 | $9,237 |
| Aug 19 | $10,082 | $11,516 | $9,023 |
| Sep 19 | $10,086 | $11,731 | $9,129 |
| Oct 19 | $10,135 | $11,985 | $9,313 |
| Nov 19 | $9,992 | $12,420 | $9,075 |
| Dec 19 | $10,518 | $12,795 | $9,532 |
| Jan 20 | $10,278 | $12,790 | $8,831 |
| Feb 20 | $9,502 | $11,737 | $8,386 |
| Mar 20 | $7,808 | $10,288 | $7,312 |
| Apr 20 | $7,860 | $11,606 | $7,200 |
| May 20 | $7,908 | $12,159 | $7,512 |
| Jun 20 | $7,960 | $12,401 | $7,683 |
| Jul 20 | $8,484 | $13,100 | $8,122 |
| Aug 20 | $8,679 | $14,042 | $8,671 |
| Sep 20 | $8,238 | $13,508 | $8,381 |
| Oct 20 | $8,114 | $13,149 | $8,499 |
| Nov 20 | $9,034 | $14,588 | $8,797 |
| Dec 20 | $9,074 | $15,149 | $9,235 |
| Jan 21 | $9,729 | $14,996 | $9,477 |
| Feb 21 | $10,177 | $15,410 | $10,090 |
| Mar 21 | $10,410 | $16,085 | $9,874 |
| Apr 21 | $10,826 | $16,943 | $10,692 |
| May 21 | $11,135 | $17,062 | $10,984 |
| Jun 21 | $11,151 | $17,460 | $11,187 |
| Jul 21 | $11,208 | $17,875 | $11,393 |
| Aug 21 | $11,169 | $18,418 | $11,359 |
| Sep 21 | $11,048 | $17,562 | $11,925 |
| Oct 21 | $11,869 | $18,792 | $12,233 |
| Nov 21 | $11,265 | $18,662 | $11,338 |
| Dec 21 | $11,690 | $19,498 | $11,738 |
| Jan 22 | $11,689 | $18,489 | $12,769 |
| Feb 22 | $12,274 | $17,935 | $13,564 |
| Mar 22 | $13,190 | $18,601 | $14,737 |
| Apr 22 | $12,772 | $16,979 | $15,347 |
| May 22 | $12,972 | $17,010 | $15,581 |
| Jun 22 | $11,610 | $15,606 | $13,902 |
| Jul 22 | $11,949 | $17,045 | $14,495 |
| Aug 22 | $11,712 | $16,350 | $14,508 |
| Sep 22 | $10,749 | $14,844 | $13,331 |
| Oct 22 | $11,516 | $16,046 | $13,597 |
| Nov 22 | $12,252 | $16,943 | $13,969 |
| Dec 22 | $11,904 | $15,967 | $13,627 |
| Jan 23 | $12,591 | $16,970 | $13,560 |
| Feb 23 | $11,887 | $16,556 | $12,923 |
| Mar 23 | $12,106 | $17,164 | $12,897 |
| Apr 23 | $12,193 | $17,432 | $12,800 |
| May 23 | $11,529 | $17,507 | $12,078 |
| Jun 23 | $11,993 | $18,664 | $12,566 |
| Jul 23 | $12,680 | $19,264 | $13,352 |
| Aug 23 | $12,455 | $18,957 | $13,250 |
| Sep 23 | $12,141 | $18,053 | $13,158 |
| Oct 23 | $12,037 | $17,674 | $13,193 |
| Nov 23 | $12,436 | $19,288 | $12,896 |
| Dec 23 | $12,635 | $20,164 | $12,549 |
| Jan 24 | $12,419 | $20,503 | $12,599 |
| Feb 24 | $12,565 | $21,598 | $12,414 |
| Mar 24 | $13,422 | $22,293 | $12,824 |
| Apr 24 | $13,308 | $21,382 | $13,169 |
| May 24 | $13,562 | $22,442 | $13,400 |
| Jun 24 | $13,528 | $23,248 | $13,194 |
| Jul 24 | $13,930 | $23,531 | $12,662 |
| Aug 24 | $14,052 | $24,101 | $12,668 |
| Sep 24 | $14,369 | $24,616 | $13,284 |
This chart shows the value of a hypothetical $10,000 investment in the Fund at NAV since inception.
Average Annual Total Returns
| . | 1 Year | 5 Years | Life* |
|---|
| VanEck Inflation Allocation ETF | 18.35% | 7.34% | 5.76% |
| Bloomberg Commodity Index Total Return (BCOMTR) | 0.96% | 7.79% | 4.48% |
| S&P 500 Index Total Return (SPTR) | 36.35% | 15.98% | 14.92% |
* Inception of Fund: 4/9/18
The performance data quoted represents past performance. Past performance is no guarantee of future results. Performance information for the Fund may reflect temporary fee waivers, if applicable. Had the Fund incurred all expenses, investment returns would have been reduced. These returns do not reflect the deduction of taxes that a shareholder would pay on Fund dividends and distributions or the or sale of Fund shares.
Investment returns and value of the shares of the Fund will fluctuate so that an investor's shares, when sold, may be worth more or less than their original cost. Performance may be lower or higher than performance data quoted. Fund returns reflect reinvestment of dividends and capital gains distributions. Returns for actual Fund investors may differ from what is shown because of differences in timing, the amount invested and fees and expenses.
Index returns are not Fund returns and do not reflect any management fees or brokerage expenses. Certain indices may take into account withholding taxes. Investors can not invest directly in the Index. The Index is unmanaged and includes the reinvestment of all dividends.
- Total Net Assets$77,428,461
- Number of Portfolio Holdings15
- Portfolio Turnover Rate47%
- Advisory Fees Paid$257,958
What did the Fund invest in?
Portfolio Composition (% of Total Net Assets)
| Value | Value | Value |
|---|
| Liabilities in excess of other assets | | (2.7)% |
| Money Market Fund | | 3.2% |
| Income Assets | | 24.2% |
| Financial Assets | | 28.5% |
| Resource Assets | | 46.8% |
Top Ten Holdings (% of Total Net Assets)
| VanEck Merk Gold ETF | | 26.3% |
| VanEck Commodity Strategy ETF | | 20.3% |
| VanEck Energy Income ETF | | 12.4% |
| Energy Select Sector SPDR Fund | | 11.1% |
| Materials Select Sector SPDR Fund | | 9.6% |
| iShares Residential and Multisector Real Estate ETF | | 6.8% |
| Global X US Infrastructure Development ETF | | 5.0% |
| VanEck Uranium and Nuclear ETF | | 2.0% |
| VanEck Steel ETF | | 1.8% |
| VanEck Gold Miners ETF | | 1.4% |
Householding is an option available to certain fund investors. Householding is a method of delivery, based on the preference of the individual investor, in which a single copy of certain shareholder documents can be delivered to investors who share the same address, even if their accounts are registered under different names. Please contact your broker-dealer if you are interested in enrolling in householding and receiving a single copy of prospectuses and other shareholder documents, or if you are currently enrolled in householding and wish to change your householding status.
Need Additional Information?
If you wish to view additional information about the Fund including but not limited to financial statements, prospectus or holdings please scan the QR code or visit https://www.vaneck.com/us/en/etf-mutual-fund-finder/etfs/documents/.
VanEck Long/Flat Trend ETF
Principal U.S. Listing Exchange: NYSE Arca, Inc.
Annual Shareholder Report - September 30, 2024
This annual shareholder report contains important information about the VanEck Long/Flat Trend ETF for the period October 1, 2023 to September 30, 2024. You can find additional information about the Fund at https://www.vaneck.com/us/en/etf-mutual-fund-finder/etfs/documents/. You can also request this information by contacting us at 800.826.2333 or info@vaneck.com.
This report describes changes to the Fund that occurred during the reporting period.
What were the Fund costs for the last year?
(based on a hypothetical $10,000 investment)
| Fund Name | Costs of a $10,000 investment | Costs paid as a % of a $10,000 investment |
|---|
| VanEck Long/Flat Trend ETF | $71 | 0.61% |
How did the Fund perform last year?
The Fund experienced steady gains over the past year as upward trends in equities persisted, though volatility and market corrections toward the end of the period dampened returns slightly.
The Fund's primary exposure is to the S&P 500 via the ETF VOO.
Nvidia Corp. was the top individual contributor to VOO, driven by continued demand for their GPUs (graphics processing units) that are the market leader in powering Artificial Intelligence ("AI").
The energy sector detracted the most, as oil price volatility and declining demand weighed on performance.
Chevron Corp. was the largest individual detractor to VOO, underperforming due to weaker-than-expected oil prices and a drop in refining margins.
How did the Fund perform since inception?
Cumulative Performance Based on $10,000 Investment
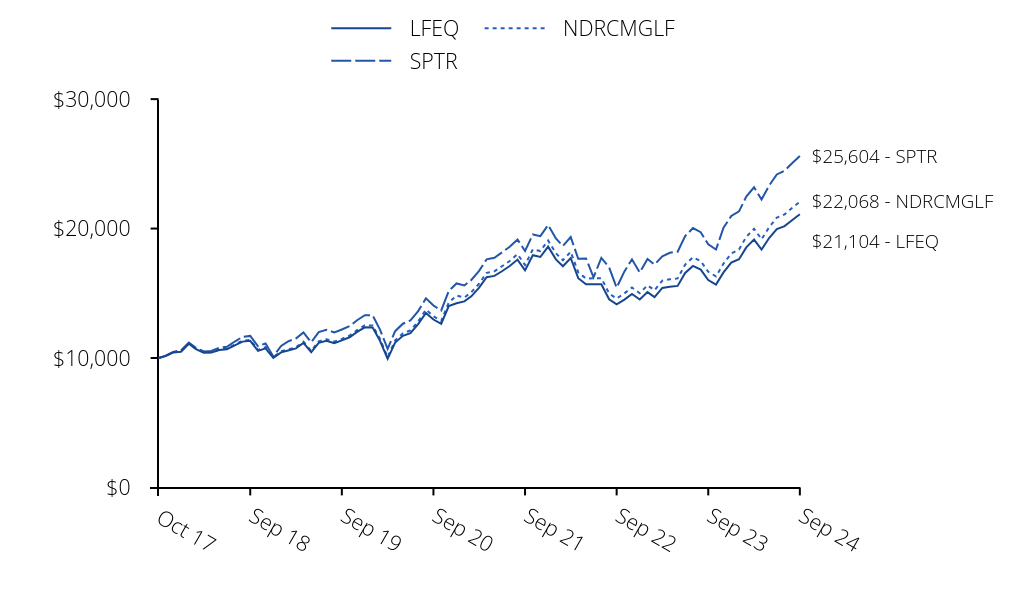
| LFEQ | SPTR | NDRCMGLF |
|---|
| Oct 17 | $10,000 | $10,000 | $10,000 |
| Oct 17 | $10,152 | $10,158 | $10,158 |
| Nov 17 | $10,419 | $10,470 | $10,430 |
| Dec 17 | $10,479 | $10,586 | $10,520 |
| Jan 18 | $11,100 | $11,192 | $11,123 |
| Feb 18 | $10,683 | $10,780 | $10,713 |
| Mar 18 | $10,411 | $10,506 | $10,440 |
| Apr 18 | $10,415 | $10,546 | $10,454 |
| May 18 | $10,615 | $10,800 | $10,659 |
| Jun 18 | $10,675 | $10,866 | $10,715 |
| Jul 18 | $10,980 | $11,271 | $11,039 |
| Aug 18 | $11,265 | $11,638 | $11,336 |
| Sep 18 | $11,325 | $11,704 | $11,400 |
| Oct 18 | $10,547 | $10,904 | $10,621 |
| Nov 18 | $10,739 | $11,127 | $10,838 |
| Dec 18 | $10,007 | $10,122 | $10,078 |
| Jan 19 | $10,437 | $10,933 | $10,520 |
| Feb 19 | $10,583 | $11,284 | $10,658 |
| Mar 19 | $10,737 | $11,503 | $10,822 |
| Apr 19 | $11,166 | $11,969 | $11,260 |
| May 19 | $10,449 | $11,208 | $10,544 |
| Jun 19 | $11,174 | $11,998 | $11,287 |
| Jul 19 | $11,334 | $12,171 | $11,450 |
| Aug 19 | $11,143 | $11,978 | $11,268 |
| Sep 19 | $11,357 | $12,202 | $11,479 |
| Oct 19 | $11,600 | $12,466 | $11,728 |
| Nov 19 | $12,015 | $12,919 | $12,153 |
| Dec 19 | $12,367 | $13,309 | $12,520 |
| Jan 20 | $12,357 | $13,304 | $12,515 |
| Feb 20 | $11,350 | $12,209 | $11,485 |
| Mar 20 | $9,934 | $10,701 | $10,066 |
| Apr 20 | $11,191 | $12,072 | $11,357 |
| May 20 | $11,713 | $12,647 | $11,898 |
| Jun 20 | $11,918 | $12,899 | $12,134 |
| Jul 20 | $12,612 | $13,626 | $12,819 |
| Aug 20 | $13,484 | $14,606 | $13,740 |
| Sep 20 | $12,972 | $14,051 | $13,218 |
| Oct 20 | $12,636 | $13,677 | $12,866 |
| Nov 20 | $14,012 | $15,174 | $14,275 |
| Dec 20 | $14,233 | $15,758 | $14,824 |
| Jan 21 | $14,373 | $15,599 | $14,674 |
| Feb 21 | $14,764 | $16,029 | $15,079 |
| Mar 21 | $15,432 | $16,731 | $15,739 |
| Apr 21 | $16,241 | $17,624 | $16,579 |
| May 21 | $16,341 | $17,747 | $16,695 |
| Jun 21 | $16,703 | $18,161 | $17,085 |
| Jul 21 | $17,104 | $18,592 | $17,490 |
| Aug 21 | $17,601 | $19,158 | $18,022 |
| Sep 21 | $16,772 | $18,267 | $17,184 |
| Oct 21 | $17,943 | $19,546 | $18,388 |
| Nov 21 | $17,803 | $19,411 | $18,261 |
| Dec 21 | $18,603 | $20,281 | $19,079 |
| Jan 22 | $17,620 | $19,231 | $18,092 |
| Feb 22 | $17,087 | $18,656 | $17,550 |
| Mar 22 | $17,726 | $19,348 | $18,202 |
| Apr 22 | $16,164 | $17,661 | $16,614 |
| May 22 | $15,694 | $17,693 | $16,136 |
| Jun 22 | $15,693 | $16,233 | $16,156 |
| Jul 22 | $15,697 | $17,730 | $16,168 |
| Aug 22 | $14,538 | $17,007 | $14,988 |
| Sep 22 | $14,139 | $15,440 | $14,593 |
| Oct 22 | $14,513 | $16,690 | $14,994 |
| Nov 22 | $14,944 | $17,623 | $15,446 |
| Dec 22 | $14,514 | $16,608 | $15,006 |
| Jan 23 | $15,089 | $17,651 | $15,613 |
| Feb 23 | $14,706 | $17,221 | $15,232 |
| Mar 23 | $15,410 | $17,853 | $15,977 |
| Apr 23 | $15,495 | $18,132 | $16,081 |
| May 23 | $15,569 | $18,210 | $16,151 |
| Jun 23 | $16,575 | $19,414 | $17,219 |
| Jul 23 | $17,111 | $20,037 | $17,772 |
| Aug 23 | $16,826 | $19,718 | $17,489 |
| Sep 23 | $16,022 | $18,778 | $16,655 |
| Oct 23 | $15,667 | $18,383 | $16,305 |
| Nov 23 | $16,612 | $20,062 | $17,291 |
| Dec 23 | $17,364 | $20,974 | $18,077 |
| Jan 24 | $17,636 | $21,326 | $18,381 |
| Feb 24 | $18,546 | $22,465 | $19,362 |
| Mar 24 | $19,146 | $23,188 | $19,985 |
| Apr 24 | $18,372 | $22,241 | $19,169 |
| May 24 | $19,287 | $23,343 | $20,119 |
| Jun 24 | $19,966 | $24,181 | $20,841 |
| Jul 24 | $20,189 | $24,475 | $21,095 |
| Aug 24 | $20,663 | $25,069 | $21,606 |
| Sep 24 | $21,104 | $25,604 | $22,068 |
This chart shows the value of a hypothetical $10,000 investment in the Fund at NAV since inception.
Average Annual Total Returns
| . | 1 Year | 5 Years | Life* |
|---|
| VanEck Long/Flat Trend ETF | 31.72% | 13.19% | 11.28% |
| NDR CMG US Large Cap Long/Flat Index (NDRCMGLF) | 32.50% | 13.96% | 11.99% |
| S&P 500 Index Total Return (SPTR) | 36.35% | 15.98% | 14.40% |
* Inception of Fund: 10/4/17
The performance data quoted represents past performance. Past performance is no guarantee of future results. Performance information for the Fund may reflect temporary fee waivers, if applicable. Had the Fund incurred all expenses, investment returns would have been reduced. These returns do not reflect the deduction of taxes that a shareholder would pay on Fund dividends and distributions or the or sale of Fund shares.
Investment returns and value of the shares of the Fund will fluctuate so that an investor's shares, when sold, may be worth more or less than their original cost. Performance may be lower or higher than performance data quoted. Fund returns reflect reinvestment of dividends and capital gains distributions. Returns for actual Fund investors may differ from what is shown because of differences in timing, the amount invested and fees and expenses.
Index returns are not Fund returns and do not reflect any management fees or brokerage expenses. Certain indices may take into account withholding taxes. Investors can not invest directly in the Index. The Index is unmanaged and includes the reinvestment of all dividends.
- Total Net Assets$26,809,528
- Number of Portfolio Holdings1
- Portfolio Turnover Rate1%
- Advisory Fees Paid$70,181
What did the Fund invest in?
Portfolio Composition (% of Total Net Assets)
| Value | Value | Value |
|---|
| Other assets less liabilities | | 0.2% |
| Exchanged Traded Fund | | 99.8% |
The following material fund change occured during the period ended September 30, 2024.
The Fund’s net expense ratio decreased to 0.61% for the year ended September 30, 2024 from 0.66% for the year ended September 30, 2023 as a result of lower interest expense.
Householding is an option available to certain fund investors. Householding is a method of delivery, based on the preference of the individual investor, in which a single copy of certain shareholder documents can be delivered to investors who share the same address, even if their accounts are registered under different names. Please contact your broker-dealer if you are interested in enrolling in householding and receiving a single copy of prospectuses and other shareholder documents, or if you are currently enrolled in householding and wish to change your householding status.
Need Additional Information?
If you wish to view additional information about the Fund including but not limited to financial statements, prospectus or holdings please scan the QR code or visit https://www.vaneck.com/us/en/etf-mutual-fund-finder/etfs/documents/.
VanEck Morningstar ESG Moat ETF
Principal U.S. Listing Exchange: Cboe BZX Exchange, Inc.
Annual Shareholder Report - September 30, 2024
This annual shareholder report contains important information about the VanEck Morningstar ESG Moat ETF for the period October 1, 2023 to September 30, 2024. You can find additional information about the Fund at https://www.vaneck.com/us/en/etf-mutual-fund-finder/etfs/documents/. You can also request this information by contacting us at 800.826.2333 or info@vaneck.com.
What were the Fund costs for the last year?
(based on a hypothetical $10,000 investment)
| Fund Name | Costs of a $10,000 investment | Costs paid as a % of a $10,000 investment |
|---|
| VanEck Morningstar ESG Moat ETF | $57 | 0.50% |
How did the Fund perform last year?
The Fund posted strong performance despite the lack of U.S. market breadth throughout the year and the Fund’s underweight to mega-caps which were a headwind for the period. The last three months of the period featured a rotation away from U.S. mega-caps toward more value-oriented areas of the market allowing the Fund to benefit from its exposure profile.
The technology and financial services sectors contributed, by far, the most to the Fund’s performance over the period and industrials also contributed meaningfully to positive performance.
The leading individual contributors to performance were TransUnion, Intercontinental Exchange, Inc. and Tyler Technologies, Inc.
While no sector detracted from performance, the muted exposure and returns from real estate and energy stocks contributed least to performance.
The leading individual detractors from performance were recreational vehicle manufacturer Polaris Inc., Nike Inc. and Brown-Forman Corp., an American distiller specializing in whiskey and bourbon.
How did the Fund perform since inception?
Cumulative Performance Based on $10,000 Investment
| MOTE | SPTR | MSUSSMGU |
|---|
| Oct 21 | $10,000 | $10,000 | $10,000 |
| Oct 21 | $10,689 | $10,605 | $10,693 |
| Nov 21 | $10,460 | $10,531 | $10,467 |
| Dec 21 | $10,838 | $11,003 | $10,848 |
| Jan 22 | $10,108 | $10,434 | $10,120 |
| Feb 22 | $9,710 | $10,121 | $9,725 |
| Mar 22 | $9,862 | $10,497 | $9,882 |
| Apr 22 | $9,054 | $9,582 | $9,076 |
| May 22 | $9,184 | $9,599 | $9,212 |
| Jun 22 | $8,591 | $8,807 | $8,620 |
| Jul 22 | $9,316 | $9,619 | $9,352 |
| Aug 22 | $8,863 | $9,227 | $8,901 |
| Sep 22 | $7,970 | $8,377 | $8,007 |
| Oct 22 | $8,618 | $9,055 | $8,662 |
| Nov 22 | $9,281 | $9,561 | $9,331 |
| Dec 22 | $8,821 | $9,010 | $8,873 |
| Jan 23 | $9,523 | $9,577 | $9,583 |
| Feb 23 | $9,304 | $9,343 | $9,366 |
| Mar 23 | $9,464 | $9,686 | $9,531 |
| Apr 23 | $9,450 | $9,837 | $9,521 |
| May 23 | $9,354 | $9,880 | $9,428 |
| Jun 23 | $9,877 | $10,533 | $9,959 |
| Jul 23 | $10,177 | $10,871 | $10,266 |
| Aug 23 | $9,860 | $10,698 | $9,950 |
| Sep 23 | $9,323 | $10,188 | $9,411 |
| Oct 23 | $8,929 | $9,974 | $9,017 |
| Nov 23 | $9,767 | $10,885 | $9,867 |
| Dec 23 | $10,431 | $11,379 | $10,545 |
| Jan 24 | $10,329 | $11,570 | $10,446 |
| Feb 24 | $10,825 | $12,188 | $10,951 |
| Mar 24 | $11,070 | $12,580 | $11,203 |
| Apr 24 | $10,459 | $12,066 | $10,588 |
| May 24 | $10,515 | $12,665 | $10,649 |
| Jun 24 | $10,744 | $13,119 | $10,887 |
| Jul 24 | $11,234 | $13,279 | $11,387 |
| Aug 24 | $11,598 | $13,601 | $11,761 |
| Sep 24 | $11,824 | $13,891 | $11,995 |
This chart shows the value of a hypothetical $10,000 investment in the Fund at NAV since inception.
Average Annual Total Returns
| . | 1 Year | Life* |
|---|
| VanEck Morningstar ESG Moat ETF | 26.82% | 5.77% |
Morningstar® US Sustainability Moat Focus Index (MSUSSMGU) | 27.45% | 6.28% |
| S&P 500 Index Total Return (SPTR) | 36.35% | 11.63% |
* Inception of Fund: 10/5/21
The performance data quoted represents past performance. Past performance is no guarantee of future results. Performance information for the Fund may reflect temporary fee waivers, if applicable. Had the Fund incurred all expenses, investment returns would have been reduced. These returns do not reflect the deduction of taxes that a shareholder would pay on Fund dividends and distributions or the or sale of Fund shares.
Investment returns and value of the shares of the Fund will fluctuate so that an investor's shares, when sold, may be worth more or less than their original cost. Performance may be lower or higher than performance data quoted. Fund returns reflect reinvestment of dividends and capital gains distributions. Returns for actual Fund investors may differ from what is shown because of differences in timing, the amount invested and fees and expenses.
Index returns are not Fund returns and do not reflect any management fees or brokerage expenses. Certain indices may take into account withholding taxes. Investors can not invest directly in the Index. The Index is unmanaged and includes the reinvestment of all dividends.
- Total Net Assets$6,513,926
- Number of Portfolio Holdings62
- Portfolio Turnover Rate33%
- Advisory Fees Paid$-
What did the Fund invest in?
Portfolio Composition (% of Total Net Assets)
| Value | Value | Value |
|---|
| Other assets less liabilities | | 0.1% |
| Real Estate | | 1.1% |
| Energy | | 1.3% |
| Materials | | 3.7% |
| Consumer Discretionary | | 6.8% |
| Communication Services | | 6.9% |
| Consumer Staples | | 8.1% |
| Health Care | | 12.0% |
| Industrials | | 17.4% |
| Financials | | 19.5% |
| Information Technology | | 23.1% |
Top Ten Holdings (% of Total Net Assets)
| TransUnion | | 3.2% |
| Tyler Technologies, Inc. | | 2.9% |
| Allegion plc | | 2.8% |
| Intercontinental Exchange, Inc. | | 2.8% |
| Masco Corp. | | 2.7% |
| Equifax, Inc. | | 2.7% |
| Autodesk, Inc. | | 2.6% |
| Thermo Fisher Scientific, Inc. | | 2.5% |
| Emerson Electric Co. | | 2.5% |
| Northern Trust Corp. | | 2.4% |
Householding is an option available to certain fund investors. Householding is a method of delivery, based on the preference of the individual investor, in which a single copy of certain shareholder documents can be delivered to investors who share the same address, even if their accounts are registered under different names. Please contact your broker-dealer if you are interested in enrolling in householding and receiving a single copy of prospectuses and other shareholder documents, or if you are currently enrolled in householding and wish to change your householding status.
Need Additional Information?
If you wish to view additional information about the Fund including but not limited to financial statements, prospectus or holdings please scan the QR code or visit https://www.vaneck.com/us/en/etf-mutual-fund-finder/etfs/documents/.
VanEck Morningstar Global Wide Moat ETF
Principal U.S. Listing Exchange: Cboe BZX Exchange, Inc.
Annual Shareholder Report - September 30, 2024
This annual shareholder report contains important information about the VanEck Morningstar Global Wide Moat ETF for the period October 1, 2023 to September 30, 2024. You can find additional information about the Fund at https://www.vaneck.com/us/en/etf-mutual-fund-finder/etfs/documents/. You can also request this information by contacting us at 800.826.2333 or info@vaneck.com.
What were the Fund costs for the last year?
(based on a hypothetical $10,000 investment)
| Fund Name | Costs of a $10,000 investment | Costs paid as a % of a $10,000 investment |
|---|
| VanEck Morningstar Global Wide Moat ETF | $60 | 0.52% |
How did the Fund perform last year?
Global equities rose as inflation decreased and growth picked up during the period. From a regional perspective, international equities lagged U.S. counterparts during the period in the face of slightly stickier inflation, monetary policy uncertainty and lower relative growth prospects in some regions.
The Fund’s exposure to industrials and financials were the leading sector contributors to performance along with its exposure to the United States and United Kingdom.
The leading individual contributors to performance were Taiwan Semiconductor Manufacturing Co. Ltd., Bank of New York Mellon Corp., and ASML Holding NV, the first and third benefited greatly from the momentum in the semiconductor industry.
The Fund’s exposure to Brazil and China detracted most from performance while all sectors contributed positively to performance.
The leading individual detractors from performance were Yum China Holdings. Inc., Baidu, Inc. and Bayer AG. Yum China and Baidu were victims of a weakening Chinese economy and consumer outlook during the period.
How did the Fund perform since inception?
Cumulative Performance Based on $10,000 Investment
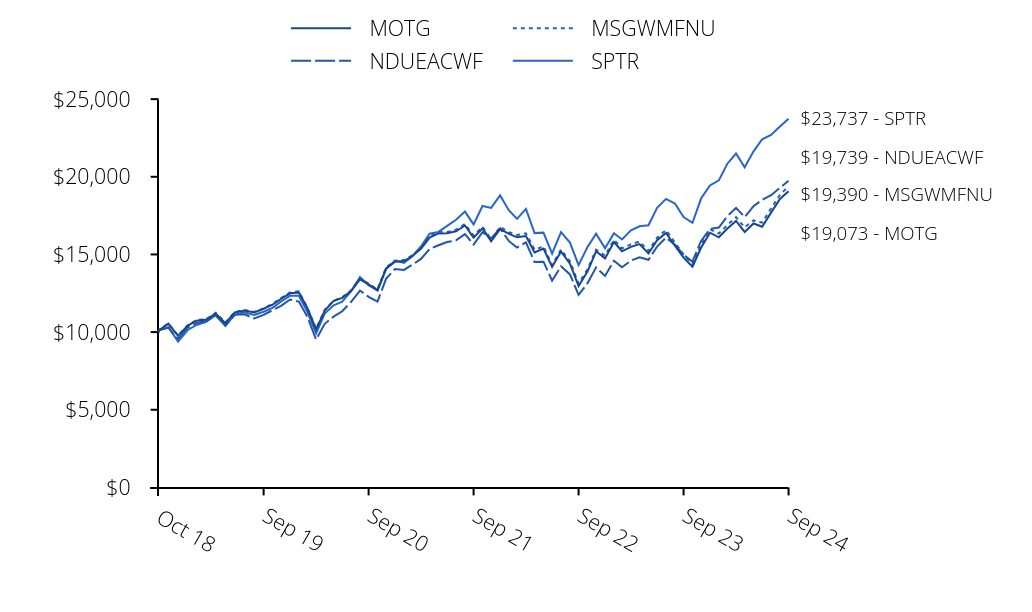
| MOTG | NDUEACWF | MSGWMFNU | SPTR |
|---|
| Oct 18 | $10,000 | $10,000 | $10,000 | $10,000 |
| Oct 18 | $10,115 | $10,134 | $10,133 | $10,109 |
| Nov 18 | $10,549 | $10,282 | $10,560 | $10,315 |
| Dec 18 | $9,759 | $9,558 | $9,778 | $9,384 |
| Jan 19 | $10,414 | $10,312 | $10,443 | $10,135 |
| Feb 19 | $10,736 | $10,588 | $10,777 | $10,461 |
| Mar 19 | $10,807 | $10,721 | $10,839 | $10,664 |
| Apr 19 | $11,189 | $11,083 | $11,237 | $11,096 |
| May 19 | $10,569 | $10,426 | $10,622 | $10,391 |
| Jun 19 | $11,268 | $11,109 | $11,294 | $11,123 |
| Jul 19 | $11,385 | $11,141 | $11,424 | $11,283 |
| Aug 19 | $11,261 | $10,877 | $11,293 | $11,104 |
| Sep 19 | $11,501 | $11,106 | $11,534 | $11,312 |
| Oct 19 | $11,763 | $11,410 | $11,804 | $11,557 |
| Nov 19 | $12,149 | $11,688 | $12,191 | $11,977 |
| Dec 19 | $12,495 | $12,100 | $12,549 | $12,338 |
| Jan 20 | $12,547 | $11,966 | $12,623 | $12,333 |
| Feb 20 | $11,566 | $11,000 | $11,585 | $11,318 |
| Mar 20 | $10,159 | $9,515 | $10,222 | $9,920 |
| Apr 20 | $11,379 | $10,534 | $11,435 | $11,192 |
| May 20 | $12,006 | $10,992 | $12,018 | $11,725 |
| Jun 20 | $12,203 | $11,343 | $12,240 | $11,958 |
| Jul 20 | $12,640 | $11,943 | $12,685 | $12,632 |
| Aug 20 | $13,400 | $12,674 | $13,460 | $13,540 |
| Sep 20 | $13,076 | $12,266 | $13,113 | $13,026 |
| Oct 20 | $12,698 | $11,967 | $12,748 | $12,679 |
| Nov 20 | $14,104 | $13,443 | $14,173 | $14,067 |
| Dec 20 | $14,531 | $14,067 | $14,595 | $14,608 |
| Jan 21 | $14,576 | $14,003 | $14,639 | $14,461 |
| Feb 21 | $14,883 | $14,327 | $14,933 | $14,859 |
| Mar 21 | $15,369 | $14,710 | $15,429 | $15,510 |
| Apr 21 | $16,084 | $15,353 | $16,168 | $16,338 |
| May 21 | $16,353 | $15,592 | $16,459 | $16,452 |
| Jun 21 | $16,364 | $15,797 | $16,444 | $16,836 |
| Jul 21 | $16,492 | $15,906 | $16,584 | $17,236 |
| Aug 21 | $16,862 | $16,304 | $16,967 | $17,760 |
| Sep 21 | $16,083 | $15,631 | $16,209 | $16,934 |
| Oct 21 | $16,681 | $16,429 | $16,777 | $18,121 |
| Nov 21 | $15,847 | $16,033 | $15,972 | $17,995 |
| Dec 21 | $16,634 | $16,674 | $16,775 | $18,801 |
| Jan 22 | $16,328 | $15,855 | $16,426 | $17,829 |
| Feb 22 | $16,103 | $15,446 | $16,253 | $17,295 |
| Mar 22 | $16,189 | $15,780 | $16,363 | $17,937 |
| Apr 22 | $15,123 | $14,517 | $15,314 | $16,373 |
| May 22 | $15,372 | $14,534 | $15,512 | $16,403 |
| Jun 22 | $14,202 | $13,309 | $14,313 | $15,049 |
| Jul 22 | $15,191 | $14,239 | $15,313 | $16,436 |
| Aug 22 | $14,401 | $13,714 | $14,555 | $15,766 |
| Sep 22 | $12,961 | $12,402 | $13,118 | $14,314 |
| Oct 22 | $13,897 | $13,150 | $14,043 | $15,473 |
| Nov 22 | $15,202 | $14,170 | $15,305 | $16,338 |
| Dec 22 | $14,747 | $13,612 | $14,922 | $15,396 |
| Jan 23 | $15,795 | $14,588 | $15,937 | $16,364 |
| Feb 23 | $15,204 | $14,170 | $15,383 | $15,964 |
| Mar 23 | $15,491 | $14,607 | $15,649 | $16,551 |
| Apr 23 | $15,665 | $14,817 | $15,830 | $16,809 |
| May 23 | $15,061 | $14,658 | $15,224 | $16,882 |
| Jun 23 | $15,913 | $15,509 | $16,081 | $17,997 |
| Jul 23 | $16,387 | $16,077 | $16,575 | $18,576 |
| Aug 23 | $15,561 | $15,628 | $15,764 | $18,280 |
| Sep 23 | $14,794 | $14,981 | $14,996 | $17,408 |
| Oct 23 | $14,214 | $14,531 | $14,378 | $17,042 |
| Nov 23 | $15,429 | $15,872 | $15,621 | $18,599 |
| Dec 23 | $16,399 | $16,634 | $16,620 | $19,444 |
| Jan 24 | $16,103 | $16,732 | $16,350 | $19,770 |
| Feb 24 | $16,655 | $17,450 | $16,884 | $20,826 |
| Mar 24 | $17,156 | $17,998 | $17,401 | $21,496 |
| Apr 24 | $16,451 | $17,404 | $16,744 | $20,618 |
| May 24 | $16,991 | $18,111 | $17,192 | $21,640 |
| Jun 24 | $16,784 | $18,514 | $17,048 | $22,417 |
| Jul 24 | $17,692 | $18,813 | $17,961 | $22,690 |
| Aug 24 | $18,569 | $19,291 | $18,838 | $23,240 |
| Sep 24 | $19,073 | $19,739 | $19,390 | $23,737 |
This chart shows the value of a hypothetical $10,000 investment in the Fund at NAV since inception.
Average Annual Total Returns
| . | 1 Year | 5 Years | Life* |
|---|
| VanEck Morningstar Global Wide Moat ETF | 28.93% | 10.65% | 11.53% |
Morningstar® Global Wide Moat Focus- Net Index (MSGWMFNU) | 29.31% | 10.95% | 11.84% |
| MSCI ACWI Net TR Index (NDUEACWF) | 31.76% | 12.19% | 12.18% |
| S&P 500 Index Total Return (SPTR) | 36.35% | 15.98% | 15.73% |
* Inception of Fund: 10/30/18
The performance data quoted represents past performance. Past performance is no guarantee of future results. Performance information for the Fund may reflect temporary fee waivers, if applicable. Had the Fund incurred all expenses, investment returns would have been reduced. These returns do not reflect the deduction of taxes that a shareholder would pay on Fund dividends and distributions or the or sale of Fund shares.
Investment returns and value of the shares of the Fund will fluctuate so that an investor's shares, when sold, may be worth more or less than their original cost. Performance may be lower or higher than performance data quoted. Fund returns reflect reinvestment of dividends and capital gains distributions. Returns for actual Fund investors may differ from what is shown because of differences in timing, the amount invested and fees and expenses.
Index returns are not Fund returns and do not reflect any management fees or brokerage expenses. Certain indices may take into account withholding taxes. Investors can not invest directly in the Index. The Index is unmanaged and includes the reinvestment of all dividends.
- Total Net Assets$16,304,039
- Number of Portfolio Holdings75
- Portfolio Turnover Rate78%
- Advisory Fees Paid$-
What did the Fund invest in?
Portfolio Composition (% of Total Net Assets)
| Value | Value | Value |
|---|
| Other assets less liabilities | | 0.1% |
| Materials | | 5.1% |
| Consumer Discretionary | | 7.1% |
| Communication Services | | 7.1% |
| Information Technology | | 11.2% |
| Health Care | | 11.7% |
| Consumer Staples | | 12.6% |
| Financials | | 16.2% |
| Industrials | | 28.9% |
Top Ten Holdings (% of Total Net Assets)
| TransUnion | | 2.2% |
| Brambles Ltd. | | 2.2% |
| Tencent Holdings Ltd. | | 2.2% |
| Masco Corp. | | 2.1% |
| Allegion plc | | 2.1% |
| Taiwan Semiconductor Manufacturing Co. Ltd. | | 2.0% |
| Sanofi SA | | 2.0% |
| Corteva, Inc. | | 2.0% |
| Kao Corp. | | 2.0% |
| Singapore Exchange Ltd. | | 2.0% |
Householding is an option available to certain fund investors. Householding is a method of delivery, based on the preference of the individual investor, in which a single copy of certain shareholder documents can be delivered to investors who share the same address, even if their accounts are registered under different names. Please contact your broker-dealer if you are interested in enrolling in householding and receiving a single copy of prospectuses and other shareholder documents, or if you are currently enrolled in householding and wish to change your householding status.
Need Additional Information?
If you wish to view additional information about the Fund including but not limited to financial statements, prospectus or holdings please scan the QR code or visit https://www.vaneck.com/us/en/etf-mutual-fund-finder/etfs/documents/.
VanEck Morningstar International Moat ETF
Principal U.S. Listing Exchange: Cboe BZX Exchange, Inc.
Annual Shareholder Report - September 30, 2024
This annual shareholder report contains important information about the VanEck Morningstar International Moat ETF for the period October 1, 2023 to September 30, 2024. You can find additional information about the Fund at https://www.vaneck.com/us/en/etf-mutual-fund-finder/etfs/documents/. You can also request this information by contacting us at 800.826.2333 or info@vaneck.com.
This report describes changes to the Fund that occurred during the reporting period.
What were the Fund costs for the last year?
(based on a hypothetical $10,000 investment)
| Fund Name | Costs of a $10,000 investment | Costs paid as a % of a $10,000 investment |
|---|
| VanEck Morningstar International Moat ETF | $64 | 0.58% |
How did the Fund perform last year?
Though they lagged their U.S. counterparts during the period, international equities posted strong returns as global inflation generally decreased and signs of global growth materialized in some regions.
The Fund’s exposure to the communications services and technology sectors were the leading sector contributors to performance for the period and the Fund’s exposure to China and the United Kingdom contributed the most from a country perspective.
The leading individual contributors to performance were Taiwan Semiconductor Manufacturing Co. Ltd., MediaTek, Inc., and Millicom International Cellular SA.
The Fund’s exposure to France and Hong Kong were the largest detractors from performance along with its industrials sector exposure.
The leading individual detractors from performance were railway equipment and services firm Alstom SA, STMicroelectronics NV, an analog chip manufacturer that did not benefit from the Artificial Intelligence ("AI")-led semiconductor momentum, and Yum China Holdings, Inc.
How did the Fund perform since inception?
Cumulative Performance Based on $10,000 Investment
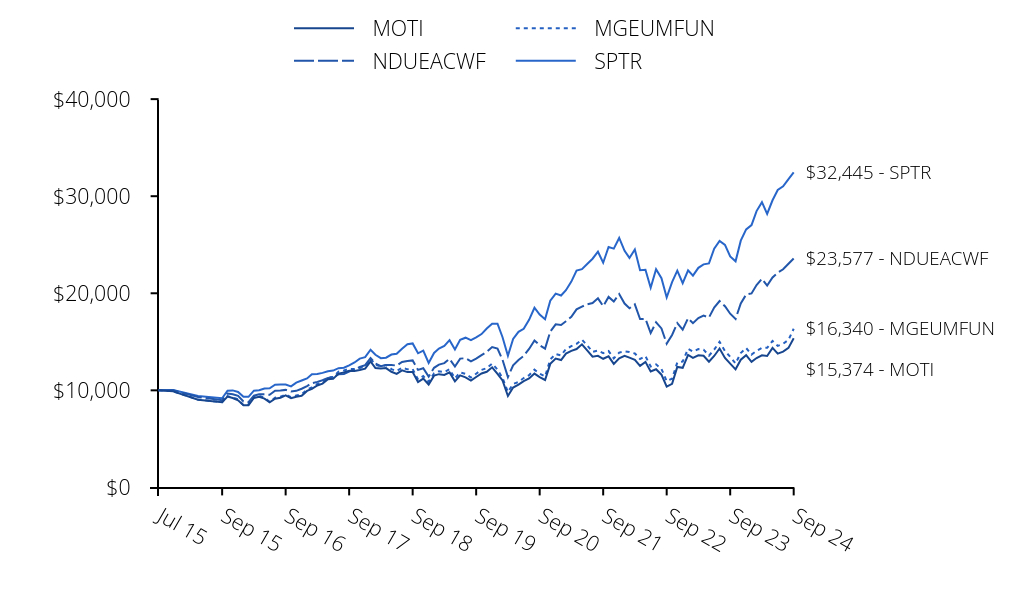
| MOTI | NDUEACWF | MGEUMFUN | SPTR |
|---|
| Jul 15 | $10,000 | $10,000 | $10,000 | $10,000 |
| Jul 15 | $9,894 | $9,996 | $9,906 | $10,025 |
| Aug 15 | $9,035 | $9,311 | $9,047 | $9,420 |
| Sep 15 | $8,777 | $8,973 | $8,787 | $9,187 |
| Oct 15 | $9,350 | $9,678 | $9,411 | $9,962 |
| Nov 15 | $9,205 | $9,598 | $9,253 | $9,992 |
| Dec 15 | $8,974 | $9,425 | $9,068 | $9,834 |
| Jan 16 | $8,466 | $8,856 | $8,471 | $9,346 |
| Feb 16 | $8,469 | $8,795 | $8,546 | $9,334 |
| Mar 16 | $9,214 | $9,447 | $9,306 | $9,967 |
| Apr 16 | $9,328 | $9,587 | $9,439 | $10,006 |
| May 16 | $9,151 | $9,599 | $9,242 | $10,185 |
| Jun 16 | $8,766 | $9,541 | $8,809 | $10,212 |
| Jul 16 | $9,134 | $9,952 | $9,232 | $10,588 |
| Aug 16 | $9,228 | $9,985 | $9,338 | $10,603 |
| Sep 16 | $9,472 | $10,046 | $9,555 | $10,605 |
| Oct 16 | $9,181 | $9,876 | $9,303 | $10,412 |
| Nov 16 | $9,338 | $9,951 | $9,469 | $10,797 |
| Dec 16 | $9,433 | $10,166 | $9,591 | $11,011 |
| Jan 17 | $9,938 | $10,444 | $10,083 | $11,219 |
| Feb 17 | $10,154 | $10,737 | $10,309 | $11,665 |
| Mar 17 | $10,497 | $10,868 | $10,653 | $11,678 |
| Apr 17 | $10,693 | $11,038 | $10,862 | $11,798 |
| May 17 | $11,150 | $11,281 | $11,325 | $11,964 |
| Jun 17 | $11,184 | $11,333 | $11,364 | $12,039 |
| Jul 17 | $11,726 | $11,649 | $11,930 | $12,287 |
| Aug 17 | $11,851 | $11,694 | $12,039 | $12,324 |
| Sep 17 | $12,021 | $11,920 | $12,215 | $12,579 |
| Oct 17 | $11,987 | $12,167 | $12,190 | $12,872 |
| Nov 17 | $12,095 | $12,403 | $12,288 | $13,267 |
| Dec 17 | $12,231 | $12,603 | $12,503 | $13,414 |
| Jan 18 | $12,974 | $13,314 | $13,242 | $14,182 |
| Feb 18 | $12,299 | $12,755 | $12,632 | $13,660 |
| Mar 18 | $12,246 | $12,482 | $12,462 | $13,312 |
| Apr 18 | $12,289 | $12,601 | $12,605 | $13,364 |
| May 18 | $11,912 | $12,617 | $12,186 | $13,685 |
| Jun 18 | $11,693 | $12,548 | $11,985 | $13,770 |
| Jul 18 | $12,063 | $12,927 | $12,325 | $14,282 |
| Aug 18 | $11,880 | $13,028 | $12,162 | $14,747 |
| Sep 18 | $11,883 | $13,085 | $12,191 | $14,831 |
| Oct 18 | $10,847 | $12,104 | $11,117 | $13,818 |
| Nov 18 | $11,213 | $12,281 | $11,464 | $14,099 |
| Dec 18 | $10,598 | $11,416 | $10,885 | $12,826 |
| Jan 19 | $11,514 | $12,318 | $11,754 | $13,854 |
| Feb 19 | $11,666 | $12,647 | $11,968 | $14,299 |
| Mar 19 | $11,592 | $12,806 | $11,883 | $14,577 |
| Apr 19 | $11,849 | $13,239 | $12,166 | $15,167 |
| May 19 | $10,926 | $12,453 | $11,238 | $14,203 |
| Jun 19 | $11,540 | $13,269 | $11,852 | $15,204 |
| Jul 19 | $11,344 | $13,308 | $11,698 | $15,423 |
| Aug 19 | $11,008 | $12,992 | $11,321 | $15,178 |
| Sep 19 | $11,378 | $13,265 | $11,715 | $15,462 |
| Oct 19 | $11,734 | $13,629 | $12,108 | $15,797 |
| Nov 19 | $11,914 | $13,961 | $12,285 | $16,371 |
| Dec 19 | $12,369 | $14,453 | $12,760 | $16,865 |
| Jan 20 | $11,690 | $14,293 | $12,142 | $16,858 |
| Feb 20 | $11,012 | $13,139 | $11,273 | $15,470 |
| Mar 20 | $9,417 | $11,365 | $9,829 | $13,560 |
| Apr 20 | $10,287 | $12,582 | $10,657 | $15,298 |
| May 20 | $10,591 | $13,130 | $10,861 | $16,026 |
| Jun 20 | $10,948 | $13,549 | $11,265 | $16,345 |
| Jul 20 | $11,220 | $14,266 | $11,560 | $17,267 |
| Aug 20 | $11,724 | $15,139 | $12,130 | $18,508 |
| Sep 20 | $11,362 | $14,651 | $11,722 | $17,805 |
| Oct 20 | $11,066 | $14,295 | $11,431 | $17,331 |
| Nov 20 | $12,723 | $16,057 | $13,187 | $19,228 |
| Dec 20 | $13,272 | $16,802 | $13,744 | $19,968 |
| Jan 21 | $13,119 | $16,726 | $13,606 | $19,766 |
| Feb 21 | $13,786 | $17,113 | $14,253 | $20,311 |
| Mar 21 | $14,067 | $17,570 | $14,546 | $21,201 |
| Apr 21 | $14,254 | $18,338 | $14,785 | $22,332 |
| May 21 | $14,739 | $18,624 | $15,219 | $22,488 |
| Jun 21 | $14,111 | $18,869 | $14,628 | $23,013 |
| Jul 21 | $13,467 | $18,999 | $13,969 | $23,560 |
| Aug 21 | $13,559 | $19,475 | $14,091 | $24,276 |
| Sep 21 | $13,252 | $18,670 | $13,838 | $23,147 |
| Oct 21 | $13,499 | $19,623 | $14,045 | $24,769 |
| Nov 21 | $12,728 | $19,151 | $13,285 | $24,597 |
| Dec 21 | $13,307 | $19,917 | $13,883 | $25,699 |
| Jan 22 | $13,555 | $18,939 | $14,009 | $24,370 |
| Feb 22 | $13,366 | $18,450 | $13,940 | $23,640 |
| Mar 22 | $13,135 | $18,849 | $13,799 | $24,518 |
| Apr 22 | $12,522 | $17,340 | $13,223 | $22,380 |
| May 22 | $12,932 | $17,361 | $13,526 | $22,421 |
| Jun 22 | $11,953 | $15,897 | $12,449 | $20,570 |
| Jul 22 | $12,173 | $17,007 | $12,679 | $22,467 |
| Aug 22 | $11,613 | $16,381 | $12,203 | $21,550 |
| Sep 22 | $10,384 | $14,813 | $10,947 | $19,566 |
| Oct 22 | $10,674 | $15,707 | $11,200 | $21,150 |
| Nov 22 | $12,412 | $16,925 | $12,878 | $22,332 |
| Dec 22 | $12,320 | $16,259 | $12,969 | $21,045 |
| Jan 23 | $13,645 | $17,425 | $14,272 | $22,367 |
| Feb 23 | $13,339 | $16,925 | $13,997 | $21,822 |
| Mar 23 | $13,602 | $17,447 | $14,247 | $22,623 |
| Apr 23 | $13,561 | $17,698 | $14,193 | $22,976 |
| May 23 | $12,949 | $17,508 | $13,575 | $23,076 |
| Jun 23 | $13,540 | $18,525 | $14,191 | $24,600 |
| Jul 23 | $14,309 | $19,203 | $15,003 | $25,391 |
| Aug 23 | $13,336 | $18,666 | $14,044 | $24,986 |
| Sep 23 | $12,753 | $17,895 | $13,458 | $23,795 |
| Oct 23 | $12,164 | $17,357 | $12,770 | $23,295 |
| Nov 23 | $13,157 | $18,959 | $13,844 | $25,422 |
| Dec 23 | $13,625 | $19,869 | $14,359 | $26,577 |
| Jan 24 | $12,939 | $19,986 | $13,687 | $27,024 |
| Feb 24 | $13,332 | $20,843 | $14,064 | $28,467 |
| Mar 24 | $13,615 | $21,498 | $14,370 | $29,383 |
| Apr 24 | $13,538 | $20,788 | $14,381 | $28,183 |
| May 24 | $14,378 | $21,633 | $15,093 | $29,580 |
| Jun 24 | $13,781 | $22,115 | $14,574 | $30,641 |
| Jul 24 | $13,986 | $22,471 | $14,800 | $31,014 |
| Aug 24 | $14,376 | $23,042 | $15,201 | $31,767 |
| Sep 24 | $15,374 | $23,577 | $16,340 | $32,445 |
This chart shows the value of a hypothetical $10,000 investment in the Fund at NAV since inception.
Average Annual Total Returns
| . | 1 Year | 5 Years | Life* |
|---|
| VanEck Morningstar International Moat ETF | 20.56% | 6.21% | 4.78% |
Morningstar® Global Markets ex-US Moat Focus IndexSM (MGEUMFUN) | 21.42% | 6.88% | 5.47% |
| MSCI ACWI Net TR Index (NDUEACWF) | 31.76% | 12.19% | 9.75% |
| S&P 500 Index Total Return (SPTR) | 36.35% | 15.98% | 13.62% |
* Inception of Fund: 7/13/15
The performance data quoted represents past performance. Past performance is no guarantee of future results. Performance information for the Fund may reflect temporary fee waivers, if applicable. Had the Fund incurred all expenses, investment returns would have been reduced. These returns do not reflect the deduction of taxes that a shareholder would pay on Fund dividends and distributions or the or sale of Fund shares.
Investment returns and value of the shares of the Fund will fluctuate so that an investor's shares, when sold, may be worth more or less than their original cost. Performance may be lower or higher than performance data quoted. Fund returns reflect reinvestment of dividends and capital gains distributions. Returns for actual Fund investors may differ from what is shown because of differences in timing, the amount invested and fees and expenses.
Index returns are not Fund returns and do not reflect any management fees or brokerage expenses. Certain indices may take into account withholding taxes. Investors can not invest directly in the Index. The Index is unmanaged and includes the reinvestment of all dividends.
- Total Net Assets$240,818,291
- Number of Portfolio Holdings68
- Portfolio Turnover Rate83%
- Advisory Fees Paid$1,054,442
What did the Fund invest in?
Portfolio Composition (% of Total Net Assets)
| Value | Value | Value |
|---|
| Liabilities in excess of other assets | | (0.1)% |
| Materials | | 3.0% |
| Real Estate | | 4.2% |
| Utilities | | 5.4% |
| Industrials | | 8.5% |
| Consumer Staples | | 9.7% |
| Information Technology | | 10.0% |
| Health Care | | 11.1% |
| Financials | | 12.9% |
| Communication Services | | 14.3% |
| Consumer Discretionary | | 21.0% |
Top Ten Holdings (% of Total Net Assets)
| JD.com, Inc. | | 2.7% |
| ANTA Sports Products Ltd. | | 2.3% |
| Inner Mongolia Yili Industrial Group Co. Ltd. | | 2.2% |
| Beijing Enterprises Holdings Ltd. | | 2.2% |
| Tencent Holdings Ltd. | | 2.2% |
| PDD Holdings, Inc. | | 2.1% |
| BT Group Plc | | 2.1% |
| Dexus | | 2.1% |
| China Gas Holdings Ltd. | | 2.1% |
| Just Eat Takeaway.com NV | | 2.1% |
The following material fund change was announced during the period ended September 30, 2024.
After the close of trading on the Cboe BZX Exchange, Inc., on December 20, 2024, the Fund's benchmark index will be the Morningstar® Global Markets ex-US Wide Moat Focus IndexSM and the Fund’s investment objective and principal investment strategy will change in connection therewith. In connection with this change, the Fund may experience additional portfolio turnover, which may cause the Fund to incur additional transaction costs and may result in higher taxes when Fund shares are held in a taxable account. During the period of the transition, the Fund is likely to incur higher tracking error than is typical for the Fund.
Householding is an option available to certain fund investors. Householding is a method of delivery, based on the preference of the individual investor, in which a single copy of certain shareholder documents can be delivered to investors who share the same address, even if their accounts are registered under different names. Please contact your broker-dealer if you are interested in enrolling in householding and receiving a single copy of prospectuses and other shareholder documents, or if you are currently enrolled in householding and wish to change your householding status.
Need Additional Information?
If you wish to view additional information about the Fund including but not limited to financial statements, prospectus or holdings please scan the QR code or visit https://www.vaneck.com/us/en/etf-mutual-fund-finder/etfs/documents/.
VanEck Morningstar SMID Moat ETF
Principal U.S. Listing Exchange: Cboe BZX Exchange, Inc.
Annual Shareholder Report - September 30, 2024
This annual shareholder report contains important information about the VanEck Morningstar SMID Moat ETF for the period October 1, 2023 to September 30, 2024. You can find additional information about the Fund at https://www.vaneck.com/us/en/etf-mutual-fund-finder/etfs/documents/. You can also request this information by contacting us at 800.826.2333 or info@vaneck.com.
What were the Fund costs for the last year?
(based on a hypothetical $10,000 investment)
| Fund Name | Costs of a $10,000 investment | Costs paid as a % of a $10,000 investment |
|---|
| VanEck Morningstar SMID Moat ETF | $55 | 0.49% |
How did the Fund perform last year?
U.S. small- and mid-cap companies generally benefited from continued economic growth and declining inflation as the Fed considered and implemented its rate cut policy.
During the period, the Fund benefited most from its exposure to the consumer discretionary and industrials sectors.
The leading individual contributors to performance were DoorDash, Inc., Williams-Sonoma, Inc., and Tapestry, Inc., owner of a luxury brand portfolio featuring Coach, all from the consumer discretionary sector.
The Fund’s exposure to consumer staples was the only sector-level detractor from performance.
The leading individual detractors from performance were Boston Beer Co., human capital/staffing company TriNet Group, Inc. and ride sharing company, Lyft, Inc.
How did the Fund perform since inception?
Cumulative Performance Based on $10,000 Investment
| SMOT | SPTR | MSUMMFGU |
|---|
| Oct 22 | $10,000 | $10,000 | $10,000 |
| Oct 22 | $10,099 | $10,223 | $10,103 |
| Nov 22 | $10,916 | $10,795 | $10,924 |
| Dec 22 | $10,406 | $10,173 | $10,418 |
| Jan 23 | $11,649 | $10,812 | $11,668 |
| Feb 23 | $11,263 | $10,548 | $11,286 |
| Mar 23 | $10,950 | $10,935 | $10,977 |
| Apr 23 | $10,793 | $11,106 | $10,824 |
| May 23 | $10,535 | $11,154 | $10,569 |
| Jun 23 | $11,531 | $11,891 | $11,577 |
| Jul 23 | $12,024 | $12,273 | $12,077 |
| Aug 23 | $11,518 | $12,078 | $11,574 |
| Sep 23 | $10,949 | $11,502 | $11,006 |
| Oct 23 | $10,121 | $11,260 | $10,178 |
| Nov 23 | $11,129 | $12,288 | $11,197 |
| Dec 23 | $12,203 | $12,847 | $12,286 |
| Jan 24 | $11,860 | $13,063 | $11,945 |
| Feb 24 | $12,634 | $13,760 | $12,731 |
| Mar 24 | $13,227 | $14,203 | $13,336 |
| Apr 24 | $12,316 | $13,623 | $12,420 |
| May 24 | $12,523 | $14,298 | $12,635 |
| Jun 24 | $12,395 | $14,811 | $12,512 |
| Jul 24 | $13,123 | $14,992 | $13,245 |
| Aug 24 | $13,266 | $15,355 | $13,387 |
| Sep 24 | $13,569 | $15,683 | $13,697 |
This chart shows the value of a hypothetical $10,000 investment in the Fund at NAV since inception.
Average Annual Total Returns
| . | 1 Year | Life* |
|---|
| VanEck Morningstar SMID Moat ETF | 23.93% | 16.58% |
Morningstar® US Small-Mid Cap Moat Focus IndexSM (MSUMMFGU) | 24.44% | 17.13% |
| S&P 500 Index Total Return (SPTR) | 36.35% | 25.39% |
* Inception of Fund: 10/4/22
The performance data quoted represents past performance. Past performance is no guarantee of future results. Performance information for the Fund may reflect temporary fee waivers, if applicable. Had the Fund incurred all expenses, investment returns would have been reduced. These returns do not reflect the deduction of taxes that a shareholder would pay on Fund dividends and distributions or the or sale of Fund shares.
Investment returns and value of the shares of the Fund will fluctuate so that an investor's shares, when sold, may be worth more or less than their original cost. Performance may be lower or higher than performance data quoted. Fund returns reflect reinvestment of dividends and capital gains distributions. Returns for actual Fund investors may differ from what is shown because of differences in timing, the amount invested and fees and expenses.
Index returns are not Fund returns and do not reflect any management fees or brokerage expenses. Certain indices may take into account withholding taxes. Investors can not invest directly in the Index. The Index is unmanaged and includes the reinvestment of all dividends.
- Total Net Assets$381,458,604
- Number of Portfolio Holdings106
- Portfolio Turnover Rate76%
- Advisory Fees Paid$1,278,869
What did the Fund invest in?
Portfolio Composition (% of Total Net Assets)
| Value | Value | Value |
|---|
| Other assets less liabilities | | 0.1% |
| Energy | | 1.7% |
| Consumer Staples | | 1.8% |
| Real Estate | | 2.1% |
| Utilities | | 4.1% |
| Communication Services | | 6.0% |
| Information Technology | | 11.4% |
| Health Care | | 11.5% |
| Materials | | 11.6% |
| Financials | | 13.3% |
| Industrials | | 16.1% |
| Consumer Discretionary | | 20.3% |
Top Ten Holdings (% of Total Net Assets)
| Scotts Miracle-Gro Co. | | 1.6% |
| Lithia Motors, Inc. | | 1.6% |
| TransUnion | | 1.5% |
| Expedia Group, Inc. | | 1.5% |
| Live Nation Entertainment, Inc. | | 1.4% |
| DoorDash, Inc. | | 1.4% |
| Hasbro, Inc. | | 1.4% |
| Discover Financial Services | | 1.4% |
| Allegion plc | | 1.4% |
| Carlyle Group, Inc. | | 1.4% |
Householding is an option available to certain fund investors. Householding is a method of delivery, based on the preference of the individual investor, in which a single copy of certain shareholder documents can be delivered to investors who share the same address, even if their accounts are registered under different names. Please contact your broker-dealer if you are interested in enrolling in householding and receiving a single copy of prospectuses and other shareholder documents, or if you are currently enrolled in householding and wish to change your householding status.
Need Additional Information?
If you wish to view additional information about the Fund including but not limited to financial statements, prospectus or holdings please scan the QR code or visit https://www.vaneck.com/us/en/etf-mutual-fund-finder/etfs/documents/.
VanEck Morningstar Wide Moat ETF
Principal U.S. Listing Exchange: Cboe BZX Exchange, Inc.
Annual Shareholder Report - September 30, 2024
This annual shareholder report contains important information about the VanEck Morningstar Wide Moat ETF for the period October 1, 2023 to September 30, 2024. You can find additional information about the Fund at https://www.vaneck.com/us/en/etf-mutual-fund-finder/etfs/documents/. You can also request this information by contacting us at 800.826.2333 or info@vaneck.com.
What were the Fund costs for the last year?
(based on a hypothetical $10,000 investment)
| Fund Name | Costs of a $10,000 investment | Costs paid as a % of a $10,000 investment |
|---|
| VanEck Morningstar Wide Moat ETF | $53 | 0.47% |
How did the Fund perform last year?
The Fund posted strong performance despite the lack of U.S. market breadth throughout the year and the Fund’s underweight to mega-caps which were a headwind for the period. The last three months of the period featured a rotation away from U.S. mega-caps toward more value-oriented areas of the market allowing the Fund to benefit from its exposure profile.
The industrials sector contributed the most to the Fund’s performance during the period followed by financials and technology stocks.
The leading individual contributors to performance were RTX Corp., International Flavors and Fragrances, Inc. and Equifax, Inc.
While no sector detracted from Fund performance, exposure to consumer discretionary stocks contributed the least to performance.
The leading individual detractors from performance were The Estee Lauder Companies, Inc., Biogen, Inc. and Etsy, Inc. Estee Lauder was particularly impacted by weakening demand for its beauty products in China.
How did the Fund perform over the past 10 years?
Cumulative Performance Based on $10,000 Investment
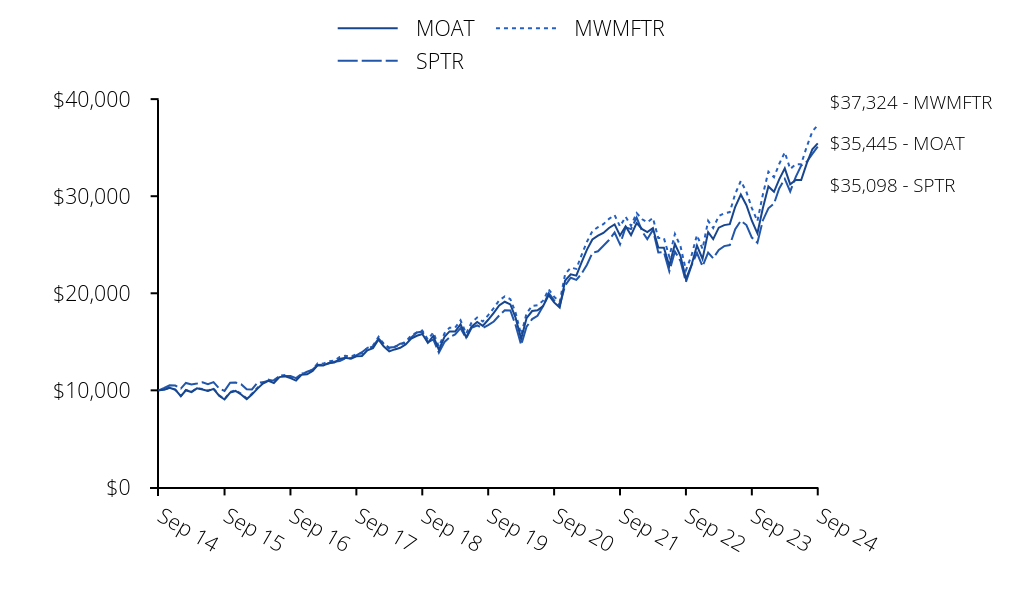
| MOAT | SPTR | MWMFTR |
|---|
| Sep 14 | $10,000 | $10,000 | $10,000 |
| Oct 14 | $10,070 | $10,244 | $10,076 |
| Nov 14 | $10,272 | $10,520 | $10,281 |
| Dec 14 | $10,064 | $10,493 | $10,078 |
| Jan 15 | $9,393 | $10,178 | $9,414 |
| Feb 15 | $10,009 | $10,763 | $10,032 |
| Mar 15 | $9,824 | $10,593 | $9,854 |
| Apr 15 | $10,203 | $10,695 | $10,237 |
| May 15 | $10,090 | $10,832 | $10,128 |
| Jun 15 | $9,934 | $10,622 | $9,975 |
| Jul 15 | $10,154 | $10,845 | $10,202 |
| Aug 15 | $9,445 | $10,191 | $9,491 |
| Sep 15 | $9,059 | $9,939 | $9,110 |
| Oct 15 | $9,772 | $10,777 | $9,832 |
| Nov 15 | $9,937 | $10,809 | $10,004 |
| Dec 15 | $9,570 | $10,638 | $9,647 |
| Jan 16 | $9,100 | $10,111 | $9,174 |
| Feb 16 | $9,570 | $10,097 | $9,653 |
| Mar 16 | $10,179 | $10,782 | $10,275 |
| Apr 16 | $10,705 | $10,824 | $10,810 |
| May 16 | $10,986 | $11,018 | $11,100 |
| Jun 16 | $10,761 | $11,047 | $10,879 |
| Jul 16 | $11,364 | $11,454 | $11,491 |
| Aug 16 | $11,450 | $11,470 | $11,585 |
| Sep 16 | $11,255 | $11,472 | $11,392 |
| Oct 16 | $10,996 | $11,263 | $11,133 |
| Nov 16 | $11,595 | $11,680 | $11,746 |
| Dec 16 | $11,650 | $11,911 | $11,805 |
| Jan 17 | $11,991 | $12,137 | $12,157 |
| Feb 17 | $12,604 | $12,619 | $12,783 |
| Mar 17 | $12,567 | $12,633 | $12,749 |
| Apr 17 | $12,808 | $12,763 | $13,000 |
| May 17 | $12,868 | $12,943 | $13,066 |
| Jun 17 | $13,233 | $13,023 | $13,441 |
| Jul 17 | $13,351 | $13,291 | $13,565 |
| Aug 17 | $13,250 | $13,332 | $13,471 |
| Sep 17 | $13,501 | $13,607 | $13,732 |
| Oct 17 | $13,545 | $13,925 | $13,782 |
| Nov 17 | $14,124 | $14,352 | $14,375 |
| Dec 17 | $14,353 | $14,511 | $14,614 |
| Jan 18 | $15,233 | $15,342 | $15,516 |
| Feb 18 | $14,533 | $14,777 | $14,805 |
| Mar 18 | $14,018 | $14,401 | $14,289 |
| Apr 18 | $14,214 | $14,456 | $14,498 |
| May 18 | $14,387 | $14,804 | $14,680 |
| Jun 18 | $14,736 | $14,895 | $15,041 |
| Jul 18 | $15,334 | $15,450 | $15,659 |
| Aug 18 | $15,625 | $15,953 | $15,962 |
| Sep 18 | $15,811 | $16,044 | $16,162 |
| Oct 18 | $14,898 | $14,947 | $15,231 |
| Nov 18 | $15,612 | $15,252 | $15,965 |
| Dec 18 | $14,171 | $13,875 | $14,505 |
| Jan 19 | $15,508 | $14,987 | $15,876 |
| Feb 19 | $16,069 | $15,468 | $16,456 |
| Mar 19 | $16,059 | $15,769 | $16,452 |
| Apr 19 | $16,800 | $16,407 | $17,217 |
| May 19 | $15,453 | $15,364 | $15,845 |
| Jun 19 | $16,562 | $16,447 | $16,991 |
| Jul 19 | $17,048 | $16,684 | $17,496 |
| Aug 19 | $16,648 | $16,419 | $17,093 |
| Sep 19 | $17,268 | $16,727 | $17,741 |
| Oct 19 | $17,979 | $17,089 | $18,481 |
| Nov 19 | $18,739 | $17,709 | $19,270 |
| Dec 19 | $19,126 | $18,244 | $19,677 |
| Jan 20 | $18,847 | $18,237 | $19,398 |
| Feb 20 | $17,491 | $16,735 | $18,005 |
| Mar 20 | $15,298 | $14,668 | $15,731 |
| Apr 20 | $17,427 | $16,549 | $17,931 |
| May 20 | $18,170 | $17,337 | $18,700 |
| Jun 20 | $18,242 | $17,682 | $18,773 |
| Jul 20 | $18,683 | $18,679 | $19,236 |
| Aug 20 | $19,809 | $20,021 | $20,404 |
| Sep 20 | $19,063 | $19,260 | $19,644 |
| Oct 20 | $18,534 | $18,748 | $19,105 |
| Nov 20 | $21,307 | $20,801 | $21,973 |
| Dec 20 | $21,948 | $21,600 | $22,646 |
| Jan 21 | $21,813 | $21,382 | $22,515 |
| Feb 21 | $23,137 | $21,972 | $23,890 |
| Mar 21 | $24,495 | $22,934 | $25,309 |
| Apr 21 | $25,541 | $24,158 | $26,403 |
| May 21 | $25,932 | $24,327 | $26,816 |
| Jun 21 | $26,218 | $24,895 | $27,124 |
| Jul 21 | $26,729 | $25,486 | $27,664 |
| Aug 21 | $27,099 | $26,261 | $28,058 |
| Sep 21 | $25,948 | $25,040 | $26,889 |
| Oct 21 | $26,895 | $26,794 | $27,882 |
| Nov 21 | $25,988 | $26,608 | $26,956 |
| Dec 21 | $27,228 | $27,801 | $28,263 |
| Jan 22 | $26,600 | $26,362 | $27,621 |
| Feb 22 | $26,297 | $25,573 | $27,316 |
| Mar 22 | $26,702 | $26,522 | $27,756 |
| Apr 22 | $24,703 | $24,209 | $25,687 |
| May 22 | $24,687 | $24,254 | $25,684 |
| Jun 22 | $22,829 | $22,252 | $23,763 |
| Jul 22 | $25,075 | $24,304 | $26,111 |
| Aug 22 | $23,841 | $23,312 | $24,837 |
| Sep 22 | $21,466 | $21,165 | $22,378 |
| Oct 22 | $22,912 | $22,879 | $23,894 |
| Nov 22 | $24,913 | $24,158 | $25,989 |
| Dec 22 | $23,541 | $22,766 | $24,566 |
| Jan 23 | $26,302 | $24,196 | $27,460 |
| Feb 23 | $25,576 | $23,606 | $26,712 |
| Mar 23 | $26,760 | $24,473 | $27,963 |
| Apr 23 | $27,021 | $24,855 | $28,246 |
| May 23 | $27,123 | $24,963 | $28,364 |
| Jun 23 | $28,906 | $26,612 | $30,245 |
| Jul 23 | $30,162 | $27,467 | $31,571 |
| Aug 23 | $29,066 | $27,030 | $30,436 |
| Sep 23 | $27,472 | $25,741 | $28,781 |
| Oct 23 | $26,176 | $25,200 | $27,432 |
| Nov 23 | $28,761 | $27,501 | $30,154 |
| Dec 23 | $31,007 | $28,750 | $32,527 |
| Jan 24 | $30,453 | $29,233 | $31,957 |
| Feb 24 | $31,738 | $30,794 | $33,319 |
| Mar 24 | $32,862 | $31,785 | $34,516 |
| Apr 24 | $31,221 | $30,487 | $32,805 |
| May 24 | $31,669 | $31,999 | $33,288 |
| Jun 24 | $31,667 | $33,147 | $33,302 |
| Jul 24 | $33,374 | $33,550 | $35,113 |
| Aug 24 | $34,838 | $34,364 | $36,668 |
| Sep 24 | $35,445 | $35,098 | $37,324 |
This chart shows the value of a hypothetical $10,000 investment in the Fund at NAV over the past 10 fiscal years.
Average Annual Total Returns
| . | 1 Year | 5 Years | 10 Years |
|---|
| VanEck Morningstar Wide Moat ETF | 29.02% | 15.47% | 13.49% |
Morningstar® Wide Moat Focus IndexSM (MWMFTR) | 29.68% | 16.04% | 14.08% |
| S&P 500 Index Total Return (SPTR) | 36.35% | 15.98% | 13.38% |
The performance data quoted represents past performance. Past performance is no guarantee of future results. Performance information for the Fund may reflect temporary fee waivers, if applicable. Had the Fund incurred all expenses, investment returns would have been reduced. These returns do not reflect the deduction of taxes that a shareholder would pay on Fund dividends and distributions or the or sale of Fund shares.
Investment returns and value of the shares of the Fund will fluctuate so that an investor's shares, when sold, may be worth more or less than their original cost. Performance may be lower or higher than performance data quoted. Fund returns reflect reinvestment of dividends and capital gains distributions. Returns for actual Fund investors may differ from what is shown because of differences in timing, the amount invested and fees and expenses.
Index returns are not Fund returns and do not reflect any management fees or brokerage expenses. Certain indices may take into account withholding taxes. Investors can not invest directly in the Index. The Index is unmanaged and includes the reinvestment of all dividends.
- Total Net Assets$16,171,103,152
- Number of Portfolio Holdings55
- Portfolio Turnover Rate55%
- Advisory Fees Paid$62,325,191
What did the Fund invest in?
Portfolio Composition (% of Total Net Assets)
| Value | Value | Value |
|---|
| Other assets less liabilities | | 0.1% |
| Communication Services | | 4.9% |
| Consumer Discretionary | | 5.9% |
| Materials | | 6.2% |
| Financials | | 6.3% |
| Consumer Staples | | 13.8% |
| Information Technology | | 17.6% |
| Health Care | | 21.2% |
| Industrials | | 24.0% |
Top Ten Holdings (% of Total Net Assets)
| TransUnion | | 2.8% |
| Gilead Sciences, Inc. | | 2.7% |
| Bristol-Myers Squibb Co. | | 2.7% |
| Autodesk, Inc. | | 2.6% |
| MarketAxess Holdings, Inc. | | 2.6% |
| Kenvue, Inc. | | 2.6% |
| Allegion plc | | 2.6% |
| Bio-Rad Laboratories, Inc. | | 2.6% |
| Salesforce, Inc. | | 2.6% |
| Brown-Forman Corp. | | 2.5% |
Householding is an option available to certain fund investors. Householding is a method of delivery, based on the preference of the individual investor, in which a single copy of certain shareholder documents can be delivered to investors who share the same address, even if their accounts are registered under different names. Please contact your broker-dealer if you are interested in enrolling in householding and receiving a single copy of prospectuses and other shareholder documents, or if you are currently enrolled in householding and wish to change your householding status.
Need Additional Information?
If you wish to view additional information about the Fund including but not limited to financial statements, prospectus or holdings please scan the QR code or visit https://www.vaneck.com/us/en/etf-mutual-fund-finder/etfs/documents/.
VanEck Morningstar Wide Moat Growth ETF
Principal U.S. Listing Exchange: Cboe BZX Exchange, Inc.
Annual Shareholder Report - September 30, 2024
This annual shareholder report contains important information about the VanEck Morningstar Wide Moat Growth ETF for the period March 26, 2024 (inception of Fund) to September 30, 2024. You can find additional information about the Fund at https://www.vaneck.com/us/en/etf-mutual-fund-finder/etfs/documents/. You can also request this information by contacting us at 800.826.2333 or info@vaneck.com.
What were the Fund costs for the period?
(based on a hypothetical $10,000 investment)
| Fund Name | Costs of a $10,000 investment | Costs paid as a % of a $10,000 investment |
|---|
| VanEck Morningstar Wide Moat Growth ETF | $26 | 0.49%Footnote Reference(a) |
| Footnote | Description |
Footnote(a) | Annualized |
How did the Fund perform last year?
Growth stocks benefited from a strong start to the period influenced heavily by technology companies and the momentum behind artificial intelligence demand; however, consumer sentiment shifted in favor of value stocks amid concerns over stretched growth valuations and a focus on more defensive portfolio positioning in the last three months of the period.
During the period since the Fund’s inception, technology stocks contributed the most to the Fund’s performance followed by industrials stocks.
The leading individual contributors to performance were Tyler Technologies, Inc., TransUnion, and Teradyne, Inc.
Consumer staples stocks detracted the most from performance followed by consumer discretionary and health care stocks.
The leading individual detractors from performance were The Estee Lauder Companies, Inc., Etsy, Inc. and Veeva Systems, Inc.
How did the Fund perform since inception?
Cumulative Performance Based on $10,000 Investment
| MGRO | SPTR | MSUBGFGU |
|---|
| Mar-24 | $10,000 | $10,000 | $10,000 |
| Mar-24 | $10,148 | $10,099 | $10,148 |
| Apr-24 | $9,469 | $9,687 | $9,473 |
| May-24 | $9,267 | $10,167 | $9,274 |
| Jun-24 | $9,535 | $10,532 | $9,547 |
| Jul-24 | $9,849 | $10,660 | $9,865 |
| Aug-24 | $10,231 | $10,918 | $10,251 |
| Sep-24 | $10,494 | $11,152 | $10,519 |
This chart shows the value of a hypothetical $10,000 investment in the Fund at NAV since inception.
Average Annual Total Returns
| . | Life* |
|---|
| VanEck Morningstar Wide Moat Growth ETF | 4.94% |
Morningstar® US Broad Growth Wide Moat Focus Index (MSUBGFGU) | 5.19% |
| S&P 500 Index Total Return (SPTR) | 11.52% |
* Inception of Fund: 3/26/24
The performance data quoted represents past performance. Past performance is no guarantee of future results. Performance information for the Fund may reflect temporary fee waivers, if applicable. Had the Fund incurred all expenses, investment returns would have been reduced. These returns do not reflect the deduction of taxes that a shareholder would pay on Fund dividends and distributions or the or sale of Fund shares.
Investment returns and value of the shares of the Fund will fluctuate so that an investor's shares, when sold, may be worth more or less than their original cost. Performance may be lower or higher than performance data quoted. Fund returns reflect reinvestment of dividends and capital gains distributions. Returns for actual Fund investors may differ from what is shown because of differences in timing, the amount invested and fees and expenses.
Index returns are not Fund returns and do not reflect any management fees or brokerage expenses. Certain indices may take into account withholding taxes. Investors can not invest directly in the Index. The Index is unmanaged and includes the reinvestment of all dividends.
- Total Net Assets$785,903
- Number of Portfolio Holdings39
- Portfolio Turnover Rate16%
- Advisory Fees Paid$-
What did the Fund invest in?
Portfolio Composition (% of Total Net Assets)
| Value | Value | Value |
|---|
| Other assets less liabilities | | 0.2% |
| Materials | | 2.1% |
| Communication Services | | 3.5% |
| Financials | | 3.6% |
| Consumer Discretionary | | 8.6% |
| Consumer Staples | | 11.4% |
| Health Care | | 17.2% |
| Industrials | | 23.3% |
| Information Technology | | 30.1% |
Top Ten Holdings (% of Total Net Assets)
| TransUnion | | 5.3% |
| Autodesk, Inc. | | 4.9% |
| Salesforce, Inc. | | 4.8% |
| Agilent Technologies, Inc. | | 4.7% |
| Rockwell Automation, Inc. | | 4.5% |
| Estee Lauder Cos, Inc. | | 4.5% |
| Veeva Systems, Inc. | | 4.4% |
| Adobe, Inc. | | 4.3% |
| Amazon.com, Inc. | | 4.3% |
| MarketAxess Holdings, Inc. | | 3.1% |
Householding is an option available to certain fund investors. Householding is a method of delivery, based on the preference of the individual investor, in which a single copy of certain shareholder documents can be delivered to investors who share the same address, even if their accounts are registered under different names. Please contact your broker-dealer if you are interested in enrolling in householding and receiving a single copy of prospectuses and other shareholder documents, or if you are currently enrolled in householding and wish to change your householding status.
Need Additional Information?
If you wish to view additional information about the Fund including but not limited to financial statements, prospectus or holdings please scan the QR code or visit https://www.vaneck.com/us/en/etf-mutual-fund-finder/etfs/documents/.
VanEck Morningstar Wide Moat Value ETF
Principal U.S. Listing Exchange: Cboe BZX Exchange, Inc.
Annual Shareholder Report - September 30, 2024
This annual shareholder report contains important information about the VanEck Morningstar Wide Moat Value ETF for the period March 26, 2024 (inception of Fund) to September 30, 2024. You can find additional information about the Fund at https://www.vaneck.com/us/en/etf-mutual-fund-finder/etfs/documents/. You can also request this information by contacting us at 800.826.2333 or info@vaneck.com.
What were the Fund costs for the period?
(based on a hypothetical $10,000 investment)
| Fund Name | Costs of a $10,000 investment | Costs paid as a % of a $10,000 investment |
|---|
| VanEck Morningstar Wide Moat Value ETF | $27 | 0.49%Footnote Reference(a) |
| Footnote | Description |
Footnote(a) | Annualized |
How did the Fund perform last year?
The Fund posted strong performance for the period as U.S. equities benefited from declining inflation and anticipated Fed rate cuts. Value stocks lagged growth stocks in the U.S. until the last three months of the period as consumer sentiment shifted in favor of value stocks amid concerns over stretched growth valuations and a focus on more defensive portfolio positioning.
During the period since the Fund’s inception, the industrials sector contributed the most to the Fund’s performance followed by consumer staples and materials.
The leading individual contributors to performance were RTX Corp., International Flavors and Fragrances, Inc., and C.H. Robinson Worldwide, Inc., a domestic freight logistics operator.
Communications services was the only sector to detract from performance while consumer discretionary and financials were the two positive performing sectors that contributed least to performance.
The leading individual detractors from performance were Zimmer Biomet Holdings, Inc., The Walt Disney Co., and Etsy, Inc.
How did the Fund perform since inception?
Cumulative Performance Based on $10,000 Investment
| MVAL | SPTR | MSUBVFGU |
|---|
| Mar-24 | $10,000 | $10,000 | $10,000 |
| Mar-24 | $10,230 | $10,099 | $10,231 |
| Apr-24 | $9,768 | $9,687 | $9,772 |
| May-24 | $10,079 | $10,167 | $10,089 |
| Jun-24 | $9,956 | $10,532 | $9,971 |
| Jul-24 | $10,605 | $10,660 | $10,624 |
| Aug-24 | $10,995 | $10,918 | $11,019 |
| Sep-24 | $11,171 | $11,152 | $11,201 |
This chart shows the value of a hypothetical $10,000 investment in the Fund at NAV since inception.
Average Annual Total Returns
| . | Life* |
|---|
| VanEck Morningstar Wide Moat Value ETF | 11.71% |
Morningstar® US Broad Value Wide Moat Focus Index (MSUBVFGU) | 12.01% |
| S&P 500 Index Total Return (SPTR) | 11.52% |
* Inception of Fund: 3/26/24
The performance data quoted represents past performance. Past performance is no guarantee of future results. Performance information for the Fund may reflect temporary fee waivers, if applicable. Had the Fund incurred all expenses, investment returns would have been reduced. These returns do not reflect the deduction of taxes that a shareholder would pay on Fund dividends and distributions or the or sale of Fund shares.
Investment returns and value of the shares of the Fund will fluctuate so that an investor's shares, when sold, may be worth more or less than their original cost. Performance may be lower or higher than performance data quoted. Fund returns reflect reinvestment of dividends and capital gains distributions. Returns for actual Fund investors may differ from what is shown because of differences in timing, the amount invested and fees and expenses.
Index returns are not Fund returns and do not reflect any management fees or brokerage expenses. Certain indices may take into account withholding taxes. Investors can not invest directly in the Index. The Index is unmanaged and includes the reinvestment of all dividends.
- Total Net Assets$5,025,381
- Number of Portfolio Holdings40
- Portfolio Turnover Rate48%
- Advisory Fees Paid$-
What did the Fund invest in?
Portfolio Composition (% of Total Net Assets)
| Value | Value | Value |
|---|
| Liabilities in excess of other assets | | -% |
| Information Technology | | 6.0% |
| Communication Services | | 6.4% |
| Materials | | 6.9% |
| Consumer Discretionary | | 7.3% |
| Financials | | 8.5% |
| Consumer Staples | | 17.4% |
| Health Care | | 22.9% |
| Industrials | | 24.6% |
Top Ten Holdings (% of Total Net Assets)
| Gilead Sciences, Inc. | | 4.9% |
| Bristol-Myers Squibb Co. | | 4.8% |
| Kenvue, Inc. | | 4.7% |
| US Bancorp | | 4.5% |
| Campbell Soup Co. | | 4.5% |
| Emerson Electric Co. | | 4.3% |
| International Flavors & Fragrances, Inc. | | 4.4% |
| Altria Group, Inc. | | 4.3% |
| Pfizer, Inc. | | 4.2% |
| Boeing Co. | | 3.7% |
Householding is an option available to certain fund investors. Householding is a method of delivery, based on the preference of the individual investor, in which a single copy of certain shareholder documents can be delivered to investors who share the same address, even if their accounts are registered under different names. Please contact your broker-dealer if you are interested in enrolling in householding and receiving a single copy of prospectuses and other shareholder documents, or if you are currently enrolled in householding and wish to change your householding status.
Need Additional Information?
If you wish to view additional information about the Fund including but not limited to financial statements, prospectus or holdings please scan the QR code or visit https://www.vaneck.com/us/en/etf-mutual-fund-finder/etfs/documents/.
VanEck Pharmaceutical ETF
Principal U.S. Listing Exchange: The NASDAQ Stock Market LLC
Annual Shareholder Report - September 30, 2024
This annual shareholder report contains important information about the VanEck Pharmaceutical ETF for the period October 1, 2023 to September 30, 2024. You can find additional information about the Fund at https://www.vaneck.com/us/en/etf-mutual-fund-finder/etfs/documents/. You can also request this information by contacting us at 800.826.2333 or info@vaneck.com.
What were the Fund costs for the last year?
(based on a hypothetical $10,000 investment)
| Fund Name | Costs of a $10,000 investment | Costs paid as a % of a $10,000 investment |
|---|
| VanEck Pharmaceutical ETF | $40 | 0.36% |
How did the Fund perform last year?
The pharmaceutical industry remained robust, with consistent drug development and increased demand for innovative therapies driving growth.
Healthcare was the leading sector contributor, driven by new drug approvals and positive earnings reports.
Eli Lilly and Co. was the top individual contributor a global pharmaceutical company, outperformed over the past year due to strong financial performance, driven by increased sales of its diabetes and obesity treatments, and the successful development of innovative drugs like Mounjaro and Zepbound.
The consumer staples sector contributed the least, as it has limited exposure to pharmaceutical growth.
Pfizer, Inc. was the largest individual detractor, due to declining sales of its COVID-19 products, upcoming patent expirations for key drugs, and investor concerns over recent high-cost acquisitions.
How did the Fund perform over the past 10 years?
Cumulative Performance Based on $10,000 Investment
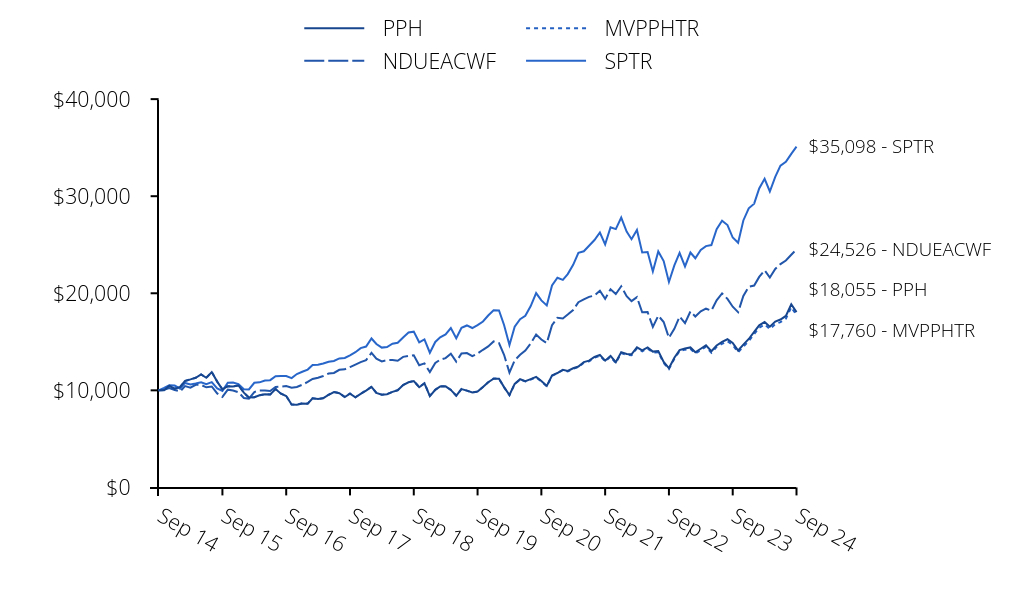
| PPH | NDUEACWF | MVPPHTR | SPTR |
|---|
| Sep 14 | $10,000 | $10,000 | $10,000 | $10,000 |
| Oct 14 | $10,018 | $10,070 | $10,018 | $10,244 |
| Nov 14 | $10,466 | $10,239 | $10,464 | $10,520 |
| Dec 14 | $10,147 | $10,041 | $10,184 | $10,493 |
| Jan 15 | $10,356 | $9,884 | $10,355 | $10,178 |
| Feb 15 | $10,967 | $10,435 | $10,965 | $10,763 |
| Mar 15 | $11,126 | $10,273 | $11,122 | $10,593 |
| Apr 15 | $11,296 | $10,571 | $11,296 | $10,695 |
| May 15 | $11,638 | $10,557 | $11,635 | $10,832 |
| Jun 15 | $11,296 | $10,309 | $11,296 | $10,622 |
| Jul 15 | $11,881 | $10,398 | $11,879 | $10,845 |
| Aug 15 | $10,900 | $9,685 | $10,899 | $10,191 |
| Sep 15 | $10,096 | $9,334 | $10,096 | $9,939 |
| Oct 15 | $10,427 | $10,067 | $10,428 | $10,777 |
| Nov 15 | $10,405 | $9,984 | $10,404 | $10,809 |
| Dec 15 | $10,500 | $9,804 | $10,533 | $10,638 |
| Jan 16 | $9,763 | $9,213 | $9,764 | $10,111 |
| Feb 16 | $9,264 | $9,149 | $9,263 | $10,097 |
| Mar 16 | $9,283 | $9,827 | $9,283 | $10,782 |
| Apr 16 | $9,493 | $9,972 | $9,496 | $10,824 |
| May 16 | $9,596 | $9,985 | $9,598 | $11,018 |
| Jun 16 | $9,573 | $9,924 | $9,579 | $11,047 |
| Jul 16 | $10,137 | $10,352 | $10,144 | $11,454 |
| Aug 16 | $9,655 | $10,387 | $9,662 | $11,470 |
| Sep 16 | $9,417 | $10,451 | $9,426 | $11,472 |
| Oct 16 | $8,528 | $10,273 | $8,537 | $11,263 |
| Nov 16 | $8,524 | $10,351 | $8,532 | $11,680 |
| Dec 16 | $8,635 | $10,575 | $8,669 | $11,911 |
| Jan 17 | $8,623 | $10,864 | $8,635 | $12,137 |
| Feb 17 | $9,179 | $11,169 | $9,187 | $12,619 |
| Mar 17 | $9,103 | $11,305 | $9,113 | $12,633 |
| Apr 17 | $9,191 | $11,482 | $9,199 | $12,763 |
| May 17 | $9,544 | $11,735 | $9,549 | $12,943 |
| Jun 17 | $9,828 | $11,789 | $9,836 | $13,023 |
| Jul 17 | $9,703 | $12,118 | $9,710 | $13,291 |
| Aug 17 | $9,313 | $12,164 | $9,319 | $13,332 |
| Sep 17 | $9,661 | $12,399 | $9,673 | $13,607 |
| Oct 17 | $9,276 | $12,657 | $9,288 | $13,925 |
| Nov 17 | $9,635 | $12,902 | $9,647 | $14,352 |
| Dec 17 | $9,964 | $13,110 | $10,004 | $14,511 |
| Jan 18 | $10,349 | $13,850 | $10,366 | $15,342 |
| Feb 18 | $9,732 | $13,268 | $9,746 | $14,777 |
| Mar 18 | $9,541 | $12,984 | $9,554 | $14,401 |
| Apr 18 | $9,607 | $13,108 | $9,619 | $14,456 |
| May 18 | $9,838 | $13,124 | $9,848 | $14,804 |
| Jun 18 | $10,008 | $13,053 | $10,021 | $14,895 |
| Jul 18 | $10,537 | $13,447 | $10,551 | $15,450 |
| Aug 18 | $10,828 | $13,552 | $10,842 | $15,953 |
| Sep 18 | $10,958 | $13,611 | $10,974 | $16,044 |
| Oct 18 | $10,320 | $12,591 | $10,335 | $14,947 |
| Nov 18 | $10,720 | $12,776 | $10,734 | $15,252 |
| Dec 18 | $9,401 | $11,876 | $9,450 | $13,875 |
| Jan 19 | $10,048 | $12,813 | $10,062 | $14,987 |
| Feb 19 | $10,403 | $13,156 | $10,415 | $15,468 |
| Mar 19 | $10,413 | $13,322 | $10,423 | $15,769 |
| Apr 19 | $10,042 | $13,771 | $10,049 | $16,407 |
| May 19 | $9,450 | $12,955 | $9,453 | $15,364 |
| Jun 19 | $10,134 | $13,803 | $10,140 | $16,447 |
| Jul 19 | $9,972 | $13,843 | $9,971 | $16,684 |
| Aug 19 | $9,777 | $13,515 | $9,775 | $16,419 |
| Sep 19 | $9,874 | $13,799 | $9,874 | $16,727 |
| Oct 19 | $10,334 | $14,177 | $10,334 | $17,089 |
| Nov 19 | $10,836 | $14,523 | $10,834 | $17,709 |
| Dec 19 | $11,199 | $15,034 | $11,223 | $18,244 |
| Jan 20 | $11,205 | $14,868 | $11,196 | $18,237 |
| Feb 20 | $10,330 | $13,667 | $10,316 | $16,735 |
| Mar 20 | $9,519 | $11,822 | $9,498 | $14,668 |
| Apr 20 | $10,666 | $13,089 | $10,639 | $16,549 |
| May 20 | $11,141 | $13,658 | $11,111 | $17,337 |
| Jun 20 | $10,947 | $14,094 | $10,920 | $17,682 |
| Jul 20 | $11,153 | $14,840 | $11,115 | $18,679 |
| Aug 20 | $11,382 | $15,748 | $11,342 | $20,021 |
| Sep 20 | $10,963 | $15,240 | $10,927 | $19,260 |
| Oct 20 | $10,456 | $14,870 | $10,422 | $18,748 |
| Nov 20 | $11,534 | $16,703 | $11,494 | $20,801 |
| Dec 20 | $11,782 | $17,478 | $11,780 | $21,600 |
| Jan 21 | $12,125 | $17,399 | $12,074 | $21,382 |
| Feb 21 | $12,002 | $17,802 | $11,950 | $21,972 |
| Mar 21 | $12,274 | $18,277 | $12,217 | $22,934 |
| Apr 21 | $12,452 | $19,076 | $12,393 | $24,158 |
| May 21 | $12,913 | $19,373 | $12,846 | $24,327 |
| Jun 21 | $13,062 | $19,628 | $12,996 | $24,895 |
| Jul 21 | $13,439 | $19,764 | $13,358 | $25,486 |
| Aug 21 | $13,657 | $20,258 | $13,572 | $26,261 |
| Sep 21 | $13,056 | $19,422 | $12,976 | $25,040 |
| Oct 21 | $13,553 | $20,413 | $13,470 | $26,794 |
| Nov 21 | $12,897 | $19,921 | $12,814 | $26,608 |
| Dec 21 | $13,938 | $20,718 | $13,839 | $27,801 |
| Jan 22 | $13,738 | $19,701 | $13,639 | $26,362 |
| Feb 22 | $13,718 | $19,192 | $13,616 | $25,573 |
| Mar 22 | $14,437 | $19,607 | $14,327 | $26,522 |
| Apr 22 | $14,128 | $18,038 | $14,025 | $24,209 |
| May 22 | $14,425 | $18,059 | $14,316 | $24,254 |
| Jun 22 | $13,991 | $16,537 | $13,888 | $22,252 |
| Jul 22 | $14,045 | $17,692 | $13,935 | $24,304 |
| Aug 22 | $12,921 | $17,040 | $12,817 | $23,312 |
| Sep 22 | $12,284 | $15,409 | $12,188 | $21,165 |
| Oct 22 | $13,364 | $16,339 | $13,258 | $22,879 |
| Nov 22 | $14,146 | $17,606 | $14,030 | $24,158 |
| Dec 22 | $14,306 | $16,913 | $14,191 | $22,766 |
| Jan 23 | $14,418 | $18,126 | $14,283 | $24,196 |
| Feb 23 | $13,917 | $17,606 | $13,785 | $23,606 |
| Mar 23 | $14,283 | $18,149 | $14,143 | $24,473 |
| Apr 23 | $14,634 | $18,410 | $14,489 | $24,855 |
| May 23 | $14,024 | $18,213 | $13,874 | $24,963 |
| Jun 23 | $14,623 | $19,270 | $14,471 | $26,612 |
| Jul 23 | $14,995 | $19,976 | $14,800 | $27,467 |
| Aug 23 | $15,265 | $19,418 | $15,062 | $27,030 |
| Sep 23 | $14,881 | $18,615 | $14,685 | $25,741 |
| Oct 23 | $14,101 | $18,055 | $13,914 | $25,200 |
| Nov 23 | $14,707 | $19,721 | $14,504 | $27,501 |
| Dec 23 | $15,291 | $20,669 | $15,071 | $28,750 |
| Jan 24 | $16,031 | $20,790 | $15,795 | $29,233 |
| Feb 24 | $16,697 | $21,682 | $16,451 | $30,794 |
| Mar 24 | $17,050 | $22,363 | $16,793 | $31,785 |
| Apr 24 | $16,556 | $21,625 | $16,306 | $30,487 |
| May 24 | $17,090 | $22,503 | $16,828 | $31,999 |
| Jun 24 | $17,299 | $23,004 | $17,027 | $33,147 |
| Jul 24 | $17,663 | $23,375 | $17,379 | $33,550 |
| Aug 24 | $18,871 | $23,969 | $18,565 | $34,364 |
| Sep 24 | $18,055 | $24,526 | $17,760 | $35,098 |
This chart shows the value of a hypothetical $10,000 investment in the Fund at NAV over the past 10 fiscal years.
Average Annual Total Returns
| . | 1 Year | 5 Years | 10 Years |
|---|
| VanEck Pharmaceutical ETF | 21.33% | 12.83% | 6.09% |
MVIS® US Listed Pharmaceutical 25 Index (MVPPHTR) | 20.94% | 12.46% | 5.91% |
| MSCI ACWI Net TR Index (NDUEACWF) | 31.76% | 12.19% | 9.39% |
| S&P 500 Index Total Return (SPTR) | 36.35% | 15.98% | 13.38% |
The performance data quoted represents past performance. Past performance is no guarantee of future results. Performance information for the Fund may reflect temporary fee waivers, if applicable. Had the Fund incurred all expenses, investment returns would have been reduced. These returns do not reflect the deduction of taxes that a shareholder would pay on Fund dividends and distributions or the or sale of Fund shares.
Investment returns and value of the shares of the Fund will fluctuate so that an investor's shares, when sold, may be worth more or less than their original cost. Performance may be lower or higher than performance data quoted. Fund returns reflect reinvestment of dividends and capital gains distributions. Returns for actual Fund investors may differ from what is shown because of differences in timing, the amount invested and fees and expenses.
Index returns are not Fund returns and do not reflect any management fees or brokerage expenses. Certain indices may take into account withholding taxes. Investors can not invest directly in the Index. The Index is unmanaged and includes the reinvestment of all dividends.
- Total Net Assets$726,530,518
- Number of Portfolio Holdings26
- Portfolio Turnover Rate12%
- Advisory Fees Paid$1,860,347
What did the Fund invest in?
Portfolio Composition (% of Total Net Assets)
| Value | Value | Value |
|---|
| Other assets less liabilities | | 0.2% |
| Personal Care Products | | 4.7% |
| Biotechnology | | 6.2% |
| Health Care Distributors | | 9.0% |
| Pharmaceuticals | | 79.9% |
Top Ten Holdings (% of Total Net Assets)
| Eli Lilly & Co. | | 12.8% |
| Novo Nordisk A/S | | 8.3% |
| Johnson & Johnson | | 6.5% |
| AbbVie, Inc. | | 6.2% |
| Merck & Co., Inc. | | 5.1% |
| Novartis AG | | 5.1% |
| AstraZeneca Plc | | 4.9% |
| Bristol-Myers Squibb Co. | | 4.9% |
| Zoetis, Inc. | | 4.7% |
| Haleon Plc | | 4.7% |
Householding is an option available to certain fund investors. Householding is a method of delivery, based on the preference of the individual investor, in which a single copy of certain shareholder documents can be delivered to investors who share the same address, even if their accounts are registered under different names. Please contact your broker-dealer if you are interested in enrolling in householding and receiving a single copy of prospectuses and other shareholder documents, or if you are currently enrolled in householding and wish to change your householding status.
Need Additional Information?
If you wish to view additional information about the Fund including but not limited to financial statements, prospectus or holdings please scan the QR code or visit https://www.vaneck.com/us/en/etf-mutual-fund-finder/etfs/documents/.
Principal U.S. Listing Exchange: The NASDAQ Stock Market LLC
Annual Shareholder Report - September 30, 2024
This annual shareholder report contains important information about the VanEck Retail ETF for the period October 1, 2023 to September 30, 2024. You can find additional information about the Fund at https://www.vaneck.com/us/en/etf-mutual-fund-finder/etfs/documents/. You can also request this information by contacting us at 800.826.2333 or info@vaneck.com.
What were the Fund costs for the last year?
(based on a hypothetical $10,000 investment)
| Fund Name | Costs of a $10,000 investment | Costs paid as a % of a $10,000 investment |
|---|
| VanEck Retail ETF | $41 | 0.35% |
How did the Fund perform last year?
The retail industry performed well over the past year, supported by robust consumer spending and the continued expansion of e-commerce, despite inflationary pressures.
Consumer discretionary was the top sector contributor, led by major retail chains capitalizing on increasing demand.
Amazon.com, Inc. was the top individual contributor, benefiting from record-breaking e-commerce sales and expansion into new markets.
The healthcare sector was the weakest performer, as supply chain disruptions and rising costs impacted profitability for many retailers.
Lululemon athletica, Inc. was the largest individual detractor, due to product assortment challenges, financial performance issues with lower-than-expected revenue growth and downward revisions of full-year forecasts, and increased competition.
How did the Fund perform over the past 10 years?
Cumulative Performance Based on $10,000 Investment
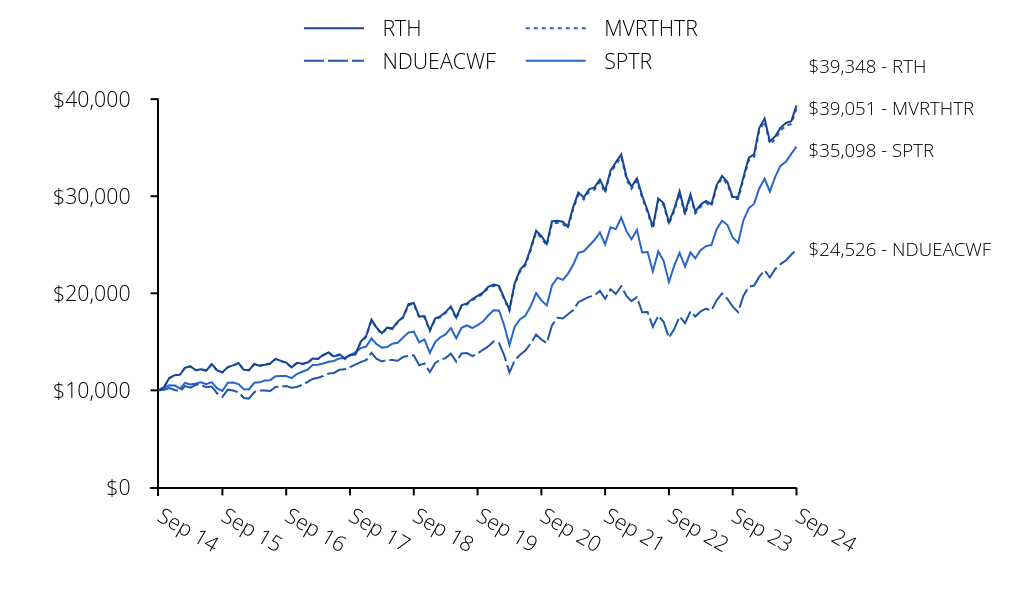
| RTH | NDUEACWF | MVRTHTR | SPTR |
|---|
| Sep 14 | $10,000 | $10,000 | $10,000 | $10,000 |
| Oct 14 | $10,334 | $10,070 | $10,334 | $10,244 |
| Nov 14 | $11,270 | $10,239 | $11,270 | $10,520 |
| Dec 14 | $11,561 | $10,041 | $11,558 | $10,493 |
| Jan 15 | $11,616 | $9,884 | $11,614 | $10,178 |
| Feb 15 | $12,335 | $10,435 | $12,326 | $10,763 |
| Mar 15 | $12,483 | $10,273 | $12,469 | $10,593 |
| Apr 15 | $12,079 | $10,571 | $12,065 | $10,695 |
| May 15 | $12,175 | $10,557 | $12,161 | $10,832 |
| Jun 15 | $12,035 | $10,309 | $12,019 | $10,622 |
| Jul 15 | $12,706 | $10,398 | $12,689 | $10,845 |
| Aug 15 | $12,053 | $9,685 | $12,034 | $10,191 |
| Sep 15 | $11,862 | $9,334 | $11,844 | $9,939 |
| Oct 15 | $12,393 | $10,067 | $12,376 | $10,777 |
| Nov 15 | $12,574 | $9,984 | $12,557 | $10,809 |
| Dec 15 | $12,810 | $9,804 | $12,797 | $10,638 |
| Jan 16 | $12,120 | $9,213 | $12,108 | $10,111 |
| Feb 16 | $12,085 | $9,149 | $12,070 | $10,097 |
| Mar 16 | $12,716 | $9,827 | $12,697 | $10,782 |
| Apr 16 | $12,548 | $9,972 | $12,530 | $10,824 |
| May 16 | $12,636 | $9,985 | $12,613 | $11,018 |
| Jun 16 | $12,759 | $9,924 | $12,735 | $11,047 |
| Jul 16 | $13,242 | $10,352 | $13,219 | $11,454 |
| Aug 16 | $13,030 | $10,387 | $13,001 | $11,470 |
| Sep 16 | $12,861 | $10,451 | $12,834 | $11,472 |
| Oct 16 | $12,370 | $10,273 | $12,344 | $11,263 |
| Nov 16 | $12,828 | $10,351 | $12,797 | $11,680 |
| Dec 16 | $12,736 | $10,575 | $12,701 | $11,911 |
| Jan 17 | $12,863 | $10,864 | $12,829 | $12,137 |
| Feb 17 | $13,274 | $11,169 | $13,237 | $12,619 |
| Mar 17 | $13,256 | $11,305 | $13,217 | $12,633 |
| Apr 17 | $13,645 | $11,482 | $13,606 | $12,763 |
| May 17 | $13,899 | $11,735 | $13,844 | $12,943 |
| Jun 17 | $13,491 | $11,789 | $13,439 | $13,023 |
| Jul 17 | $13,711 | $12,118 | $13,657 | $13,291 |
| Aug 17 | $13,276 | $12,164 | $13,221 | $13,332 |
| Sep 17 | $13,666 | $12,399 | $13,610 | $13,607 |
| Oct 17 | $13,696 | $12,657 | $13,639 | $13,925 |
| Nov 17 | $15,003 | $12,902 | $14,933 | $14,352 |
| Dec 17 | $15,565 | $13,110 | $15,497 | $14,511 |
| Jan 18 | $17,292 | $13,850 | $17,214 | $15,342 |
| Feb 18 | $16,485 | $13,268 | $16,410 | $14,777 |
| Mar 18 | $15,887 | $12,984 | $15,813 | $14,401 |
| Apr 18 | $16,456 | $13,108 | $16,379 | $14,456 |
| May 18 | $16,388 | $13,124 | $16,305 | $14,804 |
| Jun 18 | $17,068 | $13,053 | $16,985 | $14,895 |
| Jul 18 | $17,563 | $13,447 | $17,477 | $15,450 |
| Aug 18 | $18,872 | $13,552 | $18,772 | $15,953 |
| Sep 18 | $18,996 | $13,611 | $18,898 | $16,044 |
| Oct 18 | $17,595 | $12,591 | $17,507 | $14,947 |
| Nov 18 | $17,649 | $12,776 | $17,557 | $15,252 |
| Dec 18 | $16,188 | $11,876 | $16,101 | $13,875 |
| Jan 19 | $17,420 | $12,813 | $17,327 | $14,987 |
| Feb 19 | $17,613 | $13,156 | $17,516 | $15,468 |
| Mar 19 | $18,064 | $13,322 | $17,961 | $15,769 |
| Apr 19 | $18,643 | $13,771 | $18,536 | $16,407 |
| May 19 | $17,482 | $12,955 | $17,376 | $15,364 |
| Jun 19 | $18,772 | $13,803 | $18,657 | $16,447 |
| Jul 19 | $18,954 | $13,843 | $18,838 | $16,684 |
| Aug 19 | $19,403 | $13,515 | $19,280 | $16,419 |
| Sep 19 | $19,722 | $13,799 | $19,597 | $16,727 |
| Oct 19 | $20,060 | $14,177 | $19,932 | $17,089 |
| Nov 19 | $20,670 | $14,523 | $20,537 | $17,709 |
| Dec 19 | $20,904 | $15,034 | $20,768 | $18,244 |
| Jan 20 | $20,769 | $14,868 | $20,635 | $18,237 |
| Feb 20 | $19,540 | $13,667 | $19,411 | $16,735 |
| Mar 20 | $18,334 | $11,822 | $18,202 | $14,668 |
| Apr 20 | $21,017 | $13,089 | $20,865 | $16,549 |
| May 20 | $22,408 | $13,658 | $22,247 | $17,337 |
| Jun 20 | $23,030 | $14,094 | $22,865 | $17,682 |
| Jul 20 | $24,623 | $14,840 | $24,448 | $18,679 |
| Aug 20 | $26,454 | $15,748 | $26,265 | $20,021 |
| Sep 20 | $25,878 | $15,240 | $25,694 | $19,260 |
| Oct 20 | $25,082 | $14,870 | $24,904 | $18,748 |
| Nov 20 | $27,428 | $16,703 | $27,234 | $20,801 |
| Dec 20 | $27,459 | $17,478 | $27,254 | $21,600 |
| Jan 21 | $27,371 | $17,399 | $27,169 | $21,382 |
| Feb 21 | $26,863 | $17,802 | $26,664 | $21,972 |
| Mar 21 | $28,869 | $18,277 | $28,653 | $22,934 |
| Apr 21 | $30,378 | $19,076 | $30,155 | $24,158 |
| May 21 | $29,877 | $19,373 | $29,656 | $24,327 |
| Jun 21 | $30,713 | $19,628 | $30,486 | $24,895 |
| Jul 21 | $30,907 | $19,764 | $30,680 | $25,486 |
| Aug 21 | $31,721 | $20,258 | $31,488 | $26,261 |
| Sep 21 | $30,571 | $19,422 | $30,347 | $25,040 |
| Oct 21 | $32,630 | $20,413 | $32,395 | $26,794 |
| Nov 21 | $33,483 | $19,921 | $33,244 | $26,608 |
| Dec 21 | $34,308 | $20,718 | $34,066 | $27,801 |
| Jan 22 | $31,926 | $19,701 | $31,706 | $26,362 |
| Feb 22 | $30,972 | $19,192 | $30,758 | $25,573 |
| Mar 22 | $31,827 | $19,607 | $31,606 | $26,522 |
| Apr 22 | $30,044 | $18,038 | $29,837 | $24,209 |
| May 22 | $28,526 | $18,059 | $28,325 | $24,254 |
| Jun 22 | $26,825 | $16,537 | $26,636 | $22,252 |
| Jul 22 | $29,775 | $17,692 | $29,569 | $24,304 |
| Aug 22 | $29,268 | $17,040 | $29,057 | $23,312 |
| Sep 22 | $27,301 | $15,409 | $27,110 | $21,165 |
| Oct 22 | $28,716 | $16,339 | $28,516 | $22,879 |
| Nov 22 | $30,515 | $17,606 | $30,297 | $24,158 |
| Dec 22 | $28,291 | $16,913 | $28,089 | $22,766 |
| Jan 23 | $30,193 | $18,126 | $29,979 | $24,196 |
| Feb 23 | $28,426 | $17,606 | $28,226 | $23,606 |
| Mar 23 | $29,134 | $18,149 | $28,929 | $24,473 |
| Apr 23 | $29,512 | $18,410 | $29,305 | $24,855 |
| May 23 | $29,180 | $18,213 | $28,966 | $24,963 |
| Jun 23 | $31,143 | $19,270 | $30,926 | $26,612 |
| Jul 23 | $32,087 | $19,976 | $31,864 | $27,467 |
| Aug 23 | $31,449 | $19,418 | $31,220 | $27,030 |
| Sep 23 | $29,916 | $18,615 | $29,704 | $25,741 |
| Oct 23 | $29,924 | $18,055 | $29,708 | $25,200 |
| Nov 23 | $31,935 | $19,721 | $31,696 | $27,501 |
| Dec 23 | $33,954 | $20,669 | $33,688 | $28,750 |
| Jan 24 | $34,327 | $20,790 | $34,059 | $29,233 |
| Feb 24 | $37,028 | $21,682 | $36,743 | $30,794 |
| Mar 24 | $38,005 | $22,363 | $37,711 | $31,785 |
| Apr 24 | $35,654 | $21,625 | $35,381 | $30,487 |
| May 24 | $36,164 | $22,503 | $35,881 | $31,999 |
| Jun 24 | $37,041 | $23,004 | $36,762 | $33,147 |
| Jul 24 | $37,546 | $23,375 | $37,260 | $33,550 |
| Aug 24 | $37,730 | $23,969 | $37,435 | $34,364 |
| Sep 24 | $39,348 | $24,526 | $39,051 | $35,098 |
This chart shows the value of a hypothetical $10,000 investment in the Fund at NAV over the past 10 fiscal years.
Average Annual Total Returns
| . | 1 Year | 5 Years | 10 Years |
|---|
| VanEck Retail ETF | 31.53% | 14.81% | 14.68% |
MVIS® US Listed Retail 25 Index (MVRTHTR) | 31.47% | 14.79% | 14.59% |
| MSCI ACWI Net TR Index (NDUEACWF) | 31.76% | 12.19% | 9.39% |
| S&P 500 Index Total Return (SPTR) | 36.35% | 15.98% | 13.38% |
The performance data quoted represents past performance. Past performance is no guarantee of future results. Performance information for the Fund may reflect temporary fee waivers, if applicable. Had the Fund incurred all expenses, investment returns would have been reduced. These returns do not reflect the deduction of taxes that a shareholder would pay on Fund dividends and distributions or the or sale of Fund shares.
Investment returns and value of the shares of the Fund will fluctuate so that an investor's shares, when sold, may be worth more or less than their original cost. Performance may be lower or higher than performance data quoted. Fund returns reflect reinvestment of dividends and capital gains distributions. Returns for actual Fund investors may differ from what is shown because of differences in timing, the amount invested and fees and expenses.
Index returns are not Fund returns and do not reflect any management fees or brokerage expenses. Certain indices may take into account withholding taxes. Investors can not invest directly in the Index. The Index is unmanaged and includes the reinvestment of all dividends.
- Total Net Assets$222,980,515
- Number of Portfolio Holdings25
- Portfolio Turnover Rate7%
- Advisory Fees Paid$672,112
What did the Fund invest in?
Portfolio Composition (% of Total Net Assets)
| Value | Value | Value |
|---|
| Liabilities in excess of other assets | | (0.1)% |
| Health Care | | 13.0% |
| Consumer Staples | | 28.1% |
| Consumer Discretionary | | 59.0% |
Top Ten Holdings (% of Total Net Assets)
| Amazon.com, Inc. | | 19.3% |
| Costco Wholesale Corp. | | 8.4% |
| Walmart, Inc. | | 8.3% |
| The Home Depot, Inc. | | 8.0% |
| Lowe's Companies, Inc. | | 5.2% |
| JD.com, Inc. | | 4.8% |
| CVS Health Corp. | | 4.8% |
| O'Reilly Automotive, Inc. | | 4.5% |
| The TJX Companies, Inc. | | 4.3% |
| McKesson Corp. | | 4.2% |
Householding is an option available to certain fund investors. Householding is a method of delivery, based on the preference of the individual investor, in which a single copy of certain shareholder documents can be delivered to investors who share the same address, even if their accounts are registered under different names. Please contact your broker-dealer if you are interested in enrolling in householding and receiving a single copy of prospectuses and other shareholder documents, or if you are currently enrolled in householding and wish to change your householding status.
Need Additional Information?
If you wish to view additional information about the Fund including but not limited to financial statements, prospectus or holdings please scan the QR code or visit https://www.vaneck.com/us/en/etf-mutual-fund-finder/etfs/documents/.
Principal U.S. Listing Exchange: The NASDAQ Stock Market LLC
Annual Shareholder Report - September 30, 2024
This annual shareholder report contains important information about the VanEck Robotics ETF for the period October 1, 2023 to September 30, 2024. You can find additional information about the Fund at https://www.vaneck.com/us/en/etf-mutual-fund-finder/etfs/documents/. You can also request this information by contacting us at 800.826.2333 or info@vaneck.com.
What were the Fund costs for the last year?
(based on a hypothetical $10,000 investment)
| Fund Name | Costs of a $10,000 investment | Costs paid as a % of a $10,000 investment |
|---|
| VanEck Robotics ETF | $54 | 0.47% |
How did the Fund perform last year?
The robotics and automation industry continued to grow as industries increasingly adopted automation technologies to improve efficiency and productivity.
Information technology led sector performance, with robotics companies driving innovation in automation solutions.
Nvidia Corp. was the top individual contributor, driven by continued demand for their GPUs (graphics processing units) that are the market leader in powering artificial intelligence ("AI").
The Consumer discretionary sector contributed the least, as demand for robotics in non-industrial applications lagged.
Symbiotic, Inc., a developer of AI-powered robotic automation faced financial challenges, including a fiscal Q3 2024 loss, missing analyst expectations, margin pressures, and a fiscal Q4 revenue forecast below analyst estimates, indicating potential growth deceleration.
How did the Fund perform since inception?
Cumulative Performance Based on $10,000 Investment
| IBOT | NDUEACWF | BRBTNTR | SPTR |
|---|
| Apr 23 | $10,000 | $10,000 | $10,000 | $10,000 |
| Apr 23 | $10,070 | $10,168 | $10,038 | $10,201 |
| May 23 | $10,583 | $10,059 | $10,583 | $10,245 |
| Jun 23 | $11,362 | $10,643 | $11,337 | $10,922 |
| Jul 23 | $11,414 | $11,033 | $11,414 | $11,273 |
| Aug 23 | $10,953 | $10,724 | $10,976 | $11,094 |
| Sep 23 | $10,218 | $10,281 | $10,250 | $10,565 |
| Oct 23 | $9,550 | $9,972 | $9,534 | $10,342 |
| Nov 23 | $10,780 | $10,892 | $10,801 | $11,287 |
| Dec 23 | $11,771 | $11,415 | $11,813 | $11,800 |
| Jan 24 | $11,758 | $11,482 | $11,847 | $11,998 |
| Feb 24 | $12,703 | $11,975 | $12,733 | $12,639 |
| Mar 24 | $13,057 | $12,351 | $13,084 | $13,045 |
| Apr 24 | $12,302 | $11,943 | $12,385 | $12,513 |
| May 24 | $12,996 | $12,429 | $13,024 | $13,133 |
| Jun 24 | $13,280 | $12,705 | $13,339 | $13,604 |
| Jul 24 | $13,184 | $12,910 | $13,286 | $13,770 |
| Aug 24 | $13,216 | $13,238 | $13,255 | $14,104 |
| Sep 24 | $13,299 | $13,546 | $13,346 | $14,405 |
This chart shows the value of a hypothetical $10,000 investment in the Fund at NAV since inception.
Average Annual Total Returns
| . | 1 Year | Life* |
|---|
| VanEck Robotics ETF | 30.15% | 21.12% |
| BlueStar Robotics Index (BRBTNTR) | 30.20% | 21.41% |
| MSCI ACWI Net TR Index (NDUEACWF) | 31.76% | 22.63% |
| S&P 500 Index Total Return (SPTR) | 36.35% | 27.81% |
* Inception of Fund: 4/5/23
The performance data quoted represents past performance. Past performance is no guarantee of future results. Performance information for the Fund may reflect temporary fee waivers, if applicable. Had the Fund incurred all expenses, investment returns would have been reduced. These returns do not reflect the deduction of taxes that a shareholder would pay on Fund dividends and distributions or the or sale of Fund shares.
Investment returns and value of the shares of the Fund will fluctuate so that an investor's shares, when sold, may be worth more or less than their original cost. Performance may be lower or higher than performance data quoted. Fund returns reflect reinvestment of dividends and capital gains distributions. Returns for actual Fund investors may differ from what is shown because of differences in timing, the amount invested and fees and expenses.
Index returns are not Fund returns and do not reflect any management fees or brokerage expenses. Certain indices may take into account withholding taxes. Investors can not invest directly in the Index. The Index is unmanaged and includes the reinvestment of all dividends.
- Total Net Assets$15,678,959
- Number of Portfolio Holdings63
- Portfolio Turnover Rate26%
- Advisory Fees Paid$39,752
What did the Fund invest in?
Portfolio Composition (% of Total Net Assets)
| Value | Value | Value |
|---|
| Other assets less liabilities | | 0.2% |
| Energy | | 1.1% |
| Health Care | | 2.0% |
| Consumer Discretionary | | 2.7% |
| Industrials | | 32.8% |
| Information Technology | | 61.2% |
Top Ten Holdings (% of Total Net Assets)
| Keyence Corp. | | 5.5% |
| Siemens AG | | 5.4% |
| ABB Ltd. | | 5.2% |
| NVIDIA Corp. | | 5.0% |
| Dassault Systemes SE | | 4.3% |
| Emerson Electric Co. | | 4.1% |
| ASML Holding N.V. | | 4.0% |
| Autodesk, Inc. | | 3.9% |
| Hexagon AB | | 2.8% |
| Denso Corp. | | 2.7% |
Householding is an option available to certain fund investors. Householding is a method of delivery, based on the preference of the individual investor, in which a single copy of certain shareholder documents can be delivered to investors who share the same address, even if their accounts are registered under different names. Please contact your broker-dealer if you are interested in enrolling in householding and receiving a single copy of prospectuses and other shareholder documents, or if you are currently enrolled in householding and wish to change your householding status.
Need Additional Information?
If you wish to view additional information about the Fund including but not limited to financial statements, prospectus or holdings please scan the QR code or visit https://www.vaneck.com/us/en/etf-mutual-fund-finder/etfs/documents/.
Principal U.S. Listing Exchange: The NASDAQ Stock Market LLC
Annual Shareholder Report - September 30, 2024
This annual shareholder report contains important information about the VanEck Semiconductor ETF for the period October 1, 2023 to September 30, 2024. You can find additional information about the Fund at https://www.vaneck.com/us/en/etf-mutual-fund-finder/etfs/documents/. You can also request this information by contacting us at 800.826.2333 or info@vaneck.com.
What were the Fund costs for the last year?
(based on a hypothetical $10,000 investment)
| Fund Name | Costs of a $10,000 investment | Costs paid as a % of a $10,000 investment |
|---|
| VanEck Semiconductor ETF | $47 | 0.35% |
How did the Fund perform last year?
Over the last year, the semiconductor industry saw robust growth, particularly driven by the rising demand for Artificial intelligence ("AI") and machine learning chips, though supply chain disruptions added pressure in certain segments.
Information technology, specifically semiconductor manufacturers, was the leading sector contributor.
NVIDIA Corp. was the top individual contributor, benefiting from its dominance in design and sales of their advanced GPUs (graphics processing units) for AI training.
Intel Corp. was the largest individual detractor, underperforming due to their declining revenues and challenges with the vertically integrated business model.
How did the Fund perform over the past 10 years?
Cumulative Performance Based on $10,000 Investment
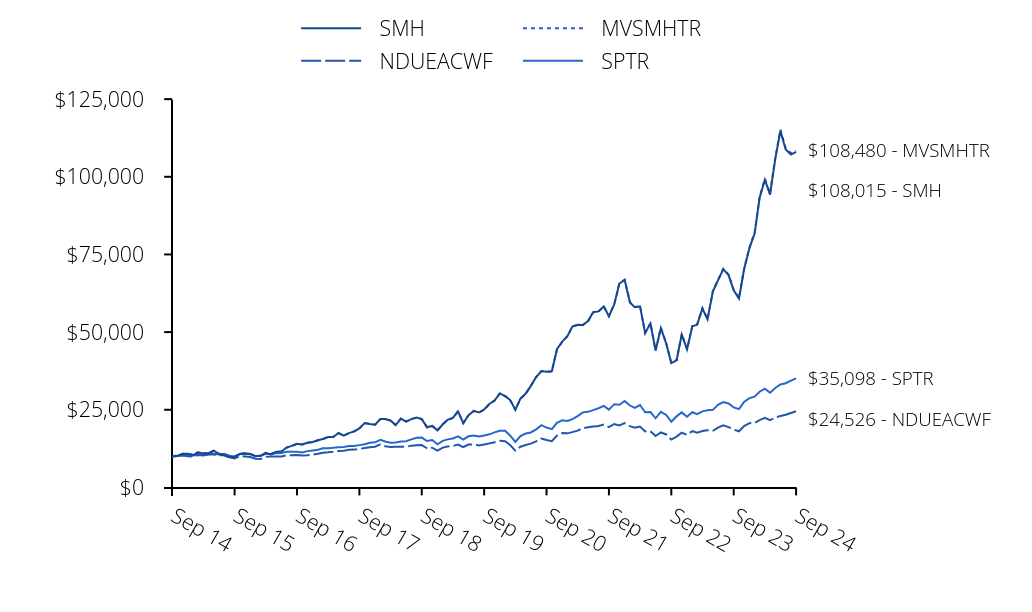
| SMH | NDUEACWF | MVSMHTR | SPTR |
|---|
| Sep 14 | $10,000 | $10,000 | $10,000 | $10,000 |
| Oct 14 | $10,068 | $10,070 | $10,070 | $10,244 |
| Nov 14 | $10,867 | $10,239 | $10,847 | $10,520 |
| Dec 14 | $10,799 | $10,041 | $10,785 | $10,493 |
| Jan 15 | $10,431 | $9,884 | $10,421 | $10,178 |
| Feb 15 | $11,280 | $10,435 | $11,259 | $10,763 |
| Mar 15 | $10,956 | $10,273 | $10,938 | $10,593 |
| Apr 15 | $10,989 | $10,571 | $10,974 | $10,695 |
| May 15 | $11,829 | $10,557 | $11,805 | $10,832 |
| Jun 15 | $10,811 | $10,309 | $10,791 | $10,622 |
| Jul 15 | $10,312 | $10,398 | $10,296 | $10,845 |
| Aug 15 | $9,812 | $9,685 | $9,788 | $10,191 |
| Sep 15 | $9,891 | $9,334 | $9,878 | $9,939 |
| Oct 15 | $10,734 | $10,067 | $10,722 | $10,777 |
| Nov 15 | $11,025 | $9,984 | $11,006 | $10,809 |
| Dec 15 | $10,785 | $9,804 | $10,776 | $10,638 |
| Jan 16 | $10,059 | $9,213 | $10,052 | $10,111 |
| Feb 16 | $10,189 | $9,149 | $10,175 | $10,097 |
| Mar 16 | $11,128 | $9,827 | $11,119 | $10,782 |
| Apr 16 | $10,607 | $9,972 | $10,602 | $10,824 |
| May 16 | $11,492 | $9,985 | $11,477 | $11,018 |
| Jun 16 | $11,525 | $9,924 | $11,515 | $11,047 |
| Jul 16 | $12,834 | $10,352 | $12,824 | $11,454 |
| Aug 16 | $13,380 | $10,387 | $13,360 | $11,470 |
| Sep 16 | $14,019 | $10,451 | $14,018 | $11,472 |
| Oct 16 | $13,794 | $10,273 | $13,798 | $11,263 |
| Nov 16 | $14,348 | $10,351 | $14,340 | $11,680 |
| Dec 16 | $14,602 | $10,575 | $14,601 | $11,911 |
| Jan 17 | $15,190 | $10,864 | $15,192 | $12,137 |
| Feb 17 | $15,557 | $11,169 | $15,552 | $12,619 |
| Mar 17 | $16,237 | $11,305 | $16,237 | $12,633 |
| Apr 17 | $16,233 | $11,482 | $16,237 | $12,763 |
| May 17 | $17,504 | $11,735 | $17,500 | $12,943 |
| Jun 17 | $16,692 | $11,789 | $16,690 | $13,023 |
| Jul 17 | $17,478 | $12,118 | $17,481 | $13,291 |
| Aug 17 | $18,050 | $12,164 | $18,045 | $13,332 |
| Sep 17 | $19,014 | $12,399 | $19,013 | $13,607 |
| Oct 17 | $20,705 | $12,657 | $20,706 | $13,925 |
| Nov 17 | $20,424 | $12,902 | $20,417 | $14,352 |
| Dec 17 | $20,197 | $13,110 | $20,202 | $14,511 |
| Jan 18 | $22,000 | $13,850 | $22,008 | $15,342 |
| Feb 18 | $22,000 | $13,268 | $21,997 | $14,777 |
| Mar 18 | $21,554 | $12,984 | $21,554 | $14,401 |
| Apr 18 | $20,071 | $13,108 | $20,075 | $14,456 |
| May 18 | $22,139 | $13,124 | $22,129 | $14,804 |
| Jun 18 | $21,182 | $13,053 | $21,178 | $14,895 |
| Jul 18 | $21,994 | $13,447 | $21,993 | $15,450 |
| Aug 18 | $22,498 | $13,552 | $22,489 | $15,953 |
| Sep 18 | $21,982 | $13,611 | $21,974 | $16,044 |
| Oct 18 | $19,346 | $12,591 | $19,342 | $14,947 |
| Nov 18 | $19,788 | $12,776 | $19,783 | $15,252 |
| Dec 18 | $18,383 | $11,876 | $18,380 | $13,875 |
| Jan 19 | $20,334 | $12,813 | $20,334 | $14,987 |
| Feb 19 | $21,736 | $13,156 | $21,729 | $15,468 |
| Mar 19 | $22,384 | $13,322 | $22,376 | $15,769 |
| Apr 19 | $24,468 | $13,771 | $24,465 | $16,407 |
| May 19 | $20,692 | $12,955 | $20,677 | $15,364 |
| Jun 19 | $23,207 | $13,803 | $23,194 | $16,447 |
| Jul 19 | $24,635 | $13,843 | $24,628 | $16,684 |
| Aug 19 | $24,103 | $13,515 | $24,091 | $16,419 |
| Sep 19 | $25,080 | $13,799 | $25,067 | $16,727 |
| Oct 19 | $26,850 | $14,177 | $26,841 | $17,089 |
| Nov 19 | $27,981 | $14,523 | $27,970 | $17,709 |
| Dec 19 | $30,241 | $15,034 | $30,224 | $18,244 |
| Jan 20 | $29,405 | $14,868 | $29,394 | $18,237 |
| Feb 20 | $28,172 | $13,667 | $28,152 | $16,735 |
| Mar 20 | $25,020 | $11,822 | $24,990 | $14,668 |
| Apr 20 | $28,564 | $13,089 | $28,543 | $16,549 |
| May 20 | $30,217 | $13,658 | $30,186 | $17,337 |
| Jun 20 | $32,688 | $14,094 | $32,653 | $17,682 |
| Jul 20 | $35,542 | $14,840 | $35,506 | $18,679 |
| Aug 20 | $37,475 | $15,748 | $37,434 | $20,021 |
| Sep 20 | $37,269 | $15,240 | $37,227 | $19,260 |
| Oct 20 | $37,375 | $14,870 | $37,339 | $18,748 |
| Nov 20 | $44,504 | $16,703 | $44,460 | $20,801 |
| Dec 20 | $46,965 | $17,478 | $46,919 | $21,600 |
| Jan 21 | $48,751 | $17,399 | $48,715 | $21,382 |
| Feb 21 | $51,803 | $17,802 | $51,766 | $21,972 |
| Mar 21 | $52,355 | $18,277 | $52,323 | $22,934 |
| Apr 21 | $52,258 | $19,076 | $52,238 | $24,158 |
| May 21 | $53,570 | $19,373 | $53,551 | $24,327 |
| Jun 21 | $56,381 | $19,628 | $56,364 | $24,895 |
| Jul 21 | $56,661 | $19,764 | $56,656 | $25,486 |
| Aug 21 | $58,261 | $20,258 | $58,261 | $26,261 |
| Sep 21 | $55,135 | $19,422 | $55,138 | $25,040 |
| Oct 21 | $58,871 | $20,413 | $58,889 | $26,794 |
| Nov 21 | $65,646 | $19,921 | $65,680 | $26,608 |
| Dec 21 | $66,775 | $20,718 | $66,840 | $27,801 |
| Jan 22 | $59,553 | $19,701 | $59,619 | $26,362 |
| Feb 22 | $58,000 | $19,192 | $58,061 | $25,573 |
| Mar 22 | $58,263 | $19,607 | $58,335 | $26,522 |
| Apr 22 | $49,665 | $18,038 | $49,739 | $24,209 |
| May 22 | $52,814 | $18,059 | $52,889 | $24,254 |
| Jun 22 | $44,044 | $16,537 | $44,110 | $22,252 |
| Jul 22 | $51,296 | $17,692 | $51,385 | $24,304 |
| Aug 22 | $46,349 | $17,040 | $46,426 | $23,312 |
| Sep 22 | $40,029 | $15,409 | $40,098 | $21,165 |
| Oct 22 | $40,928 | $16,339 | $41,004 | $22,879 |
| Nov 22 | $49,231 | $17,606 | $49,319 | $24,158 |
| Dec 22 | $44,432 | $16,913 | $44,491 | $22,766 |
| Jan 23 | $51,877 | $18,126 | $51,954 | $24,196 |
| Feb 23 | $52,382 | $17,606 | $52,455 | $23,606 |
| Mar 23 | $57,610 | $18,149 | $57,695 | $24,473 |
| Apr 23 | $54,096 | $18,410 | $54,189 | $24,855 |
| May 23 | $63,061 | $18,213 | $63,170 | $24,963 |
| Jun 23 | $66,666 | $19,270 | $66,795 | $26,612 |
| Jul 23 | $70,255 | $19,976 | $70,404 | $27,467 |
| Aug 23 | $68,341 | $19,418 | $68,490 | $27,030 |
| Sep 23 | $63,441 | $18,615 | $63,579 | $25,741 |
| Oct 23 | $60,817 | $18,055 | $60,960 | $25,200 |
| Nov 23 | $70,227 | $19,721 | $70,400 | $27,501 |
| Dec 23 | $76,962 | $20,669 | $77,169 | $28,750 |
| Jan 24 | $81,807 | $20,790 | $82,042 | $29,233 |
| Feb 24 | $93,251 | $21,682 | $93,533 | $30,794 |
| Mar 24 | $99,055 | $22,363 | $99,365 | $31,785 |
| Apr 24 | $94,245 | $21,625 | $94,571 | $30,487 |
| May 24 | $105,773 | $22,503 | $106,144 | $31,999 |
| Jun 24 | $114,761 | $23,004 | $115,193 | $33,147 |
| Jul 24 | $108,779 | $23,375 | $109,215 | $33,550 |
| Aug 24 | $107,152 | $23,969 | $107,599 | $34,364 |
| Sep 24 | $108,015 | $24,526 | $108,480 | $35,098 |
This chart shows the value of a hypothetical $10,000 investment in the Fund at NAV over the past 10 fiscal years.
Average Annual Total Returns
| . | 1 Year | 5 Years | 10 Years |
|---|
| VanEck Semiconductor ETF | 70.26% | 33.92% | 26.87% |
MVIS® US Listed Semiconductor 25 Index (MVSMHTR) | 70.62% | 34.04% | 26.92% |
| MSCI ACWI Net TR Index (NDUEACWF) | 31.76% | 12.19% | 9.39% |
| S&P 500 Index Total Return (SPTR) | 36.35% | 15.98% | 13.38% |
The performance data quoted represents past performance. Past performance is no guarantee of future results. Performance information for the Fund may reflect temporary fee waivers, if applicable. Had the Fund incurred all expenses, investment returns would have been reduced. These returns do not reflect the deduction of taxes that a shareholder would pay on Fund dividends and distributions or the or sale of Fund shares.
Investment returns and value of the shares of the Fund will fluctuate so that an investor's shares, when sold, may be worth more or less than their original cost. Performance may be lower or higher than performance data quoted. Fund returns reflect reinvestment of dividends and capital gains distributions. Returns for actual Fund investors may differ from what is shown because of differences in timing, the amount invested and fees and expenses.
Index returns are not Fund returns and do not reflect any management fees or brokerage expenses. Certain indices may take into account withholding taxes. Investors can not invest directly in the Index. The Index is unmanaged and includes the reinvestment of all dividends.
- Total Net Assets$23,726,344,310
- Number of Portfolio Holdings26
- Portfolio Turnover Rate15%
- Advisory Fees Paid$59,286,734
What did the Fund invest in?
Portfolio Composition (% of Total Net Assets)
| Value | Value | Value |
|---|
| Other assets less liabilities | | 0.1% |
| Application Software | | 5.7% |
| Semiconductor Materials & Equipment | | 18.2% |
| Semiconductors | | 76.0% |
Top Ten Holdings (% of Total Net Assets)
| NVIDIA Corp. | | 19.8% |
| Taiwan Semiconductor Manufacturing Co. Ltd. | | 12.0% |
| Broadcom, Inc. | | 7.9% |
| Advanced Micro Devices, Inc. | | 5.2% |
| ASML Holding N.V. | | 5.0% |
| Applied Materials, Inc. | | 4.6% |
| Qualcomm, Inc. | | 4.4% |
| Texas Instruments, Inc. | | 4.4% |
| Micron Technology, Inc. | | 4.1% |
| Analog Devices, Inc. | | 4.1% |
Householding is an option available to certain fund investors. Householding is a method of delivery, based on the preference of the individual investor, in which a single copy of certain shareholder documents can be delivered to investors who share the same address, even if their accounts are registered under different names. Please contact your broker-dealer if you are interested in enrolling in householding and receiving a single copy of prospectuses and other shareholder documents, or if you are currently enrolled in householding and wish to change your householding status.
Need Additional Information?
If you wish to view additional information about the Fund including but not limited to financial statements, prospectus or holdings please scan the QR code or visit https://www.vaneck.com/us/en/etf-mutual-fund-finder/etfs/documents/.
VanEck Social Sentiment ETF
Principal U.S. Listing Exchange: NYSE Arca, Inc.
Annual Shareholder Report - September 30, 2024
This annual shareholder report contains important information about the VanEck Social Sentiment ETF for the period October 1, 2023 to September 30, 2024. You can find additional information about the Fund at https://www.vaneck.com/us/en/etf-mutual-fund-finder/etfs/documents/. You can also request this information by contacting us at 800.826.2333 or info@vaneck.com.
This report describes changes to the Fund that occurred during the reporting period.
What were the Fund costs for the last year?
(based on a hypothetical $10,000 investment)
| Fund Name | Costs of a $10,000 investment | Costs paid as a % of a $10,000 investment |
|---|
| VanEck Social Sentiment ETF | $91 | 0.76% |
How did the Fund perform last year?
Collectively, U.S. equities gained during the year on declining inflation and resilient economic conditions. Companies with high social sentiment performed particularly well due to their general growth style profile and high momentum exposure.
The Fund’s exposure to the technology and financial sectors contributed the most to performance during the period.
The leading individual contributors to performance were digital assets company MicroStrategy Incorporated, Artificial Intelligence ("AI")-giant NVIDIA Corp., and crypto exchange Coinbase Global, Inc.
The only sectors to detract from performances were industrials, energy, and materials.
The largest individual detractors from performance were Trump Media & Technology Group Corp., Rivian Automotive, Inc. and Lucid Group, Inc.
How did the Fund perform since inception?
Cumulative Performance Based on $10,000 Investment
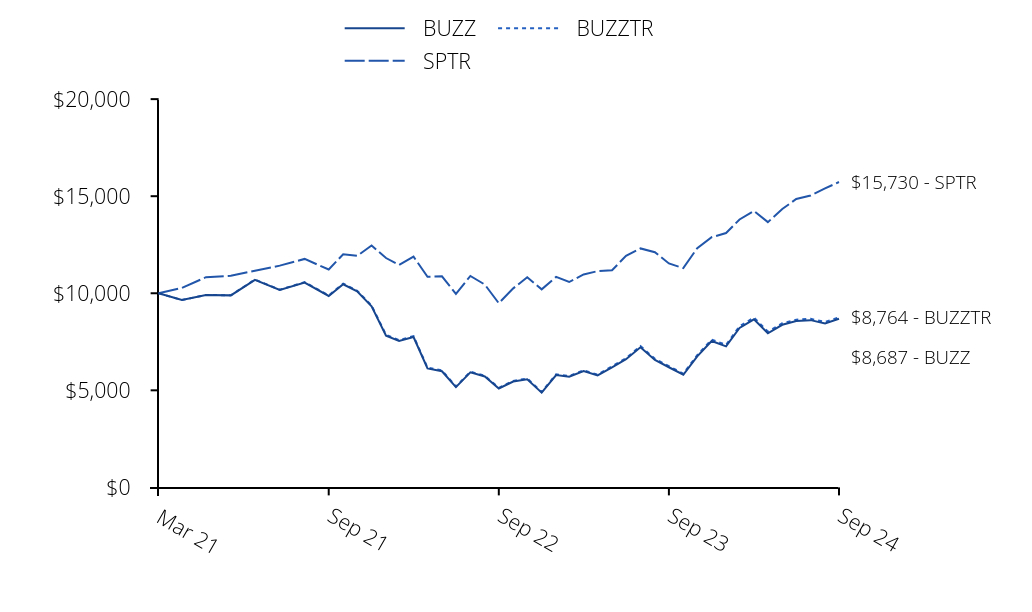
| BUZZ | SPTR | BUZZTR |
|---|
| Mar 21 | $10,000 | $10,000 | $10,000 |
| Mar 21 | $9,656 | $10,278 | $9,649 |
| Apr 21 | $9,913 | $10,827 | $9,912 |
| May 21 | $9,891 | $10,902 | $9,895 |
| Jun 21 | $10,693 | $11,157 | $10,704 |
| Jul 21 | $10,168 | $11,422 | $10,183 |
| Aug 21 | $10,550 | $11,769 | $10,571 |
| Sep 21 | $9,862 | $11,222 | $9,888 |
| Oct 21 | $10,464 | $12,008 | $10,497 |
| Nov 21 | $10,095 | $11,925 | $10,132 |
| Dec 21 | $9,327 | $12,459 | $9,367 |
| Jan 22 | $7,819 | $11,814 | $7,858 |
| Feb 22 | $7,548 | $11,461 | $7,589 |
| Mar 22 | $7,748 | $11,886 | $7,791 |
| Apr 22 | $6,127 | $10,850 | $6,167 |
| May 22 | $5,982 | $10,870 | $6,022 |
| Jun 22 | $5,165 | $9,972 | $5,196 |
| Jul 22 | $5,924 | $10,892 | $5,961 |
| Aug 22 | $5,712 | $10,448 | $5,747 |
| Sep 22 | $5,095 | $9,486 | $5,127 |
| Oct 22 | $5,451 | $10,253 | $5,486 |
| Nov 22 | $5,573 | $10,826 | $5,610 |
| Dec 22 | $4,881 | $10,203 | $4,914 |
| Jan 23 | $5,788 | $10,844 | $5,829 |
| Feb 23 | $5,698 | $10,579 | $5,736 |
| Mar 23 | $5,990 | $10,968 | $6,032 |
| Apr 23 | $5,764 | $11,139 | $5,804 |
| May 23 | $6,188 | $11,187 | $6,231 |
| Jun 23 | $6,604 | $11,926 | $6,653 |
| Jul 23 | $7,221 | $12,310 | $7,278 |
| Aug 23 | $6,565 | $12,114 | $6,620 |
| Sep 23 | $6,188 | $11,536 | $6,244 |
| Oct 23 | $5,802 | $11,293 | $5,856 |
| Nov 23 | $6,751 | $12,325 | $6,813 |
| Dec 23 | $7,540 | $12,885 | $7,614 |
| Jan 24 | $7,266 | $13,101 | $7,340 |
| Feb 24 | $8,215 | $13,801 | $8,300 |
| Mar 24 | $8,656 | $14,245 | $8,747 |
| Apr 24 | $7,940 | $13,663 | $8,025 |
| May 24 | $8,375 | $14,341 | $8,457 |
| Jun 24 | $8,574 | $14,855 | $8,638 |
| Jul 24 | $8,615 | $15,036 | $8,682 |
| Aug 24 | $8,449 | $15,401 | $8,519 |
| Sep 24 | $8,687 | $15,730 | $8,764 |
This chart shows the value of a hypothetical $10,000 investment in the Fund at NAV since inception.
Average Annual Total Returns
| . | 1 Year | Life* |
|---|
| VanEck Social Sentiment ETF | 40.39% | (3.85)% |
| BUZZ NextGen AI US Sentiment Leaders Index (BUZZTR) | 40.36% | (3.62)% |
| S&P 500 Index Total Return (SPTR) | 36.35% | 13.48% |
* Inception of Fund: 3/2/21
The performance data quoted represents past performance. Past performance is no guarantee of future results. Performance information for the Fund may reflect temporary fee waivers, if applicable. Had the Fund incurred all expenses, investment returns would have been reduced. These returns do not reflect the deduction of taxes that a shareholder would pay on Fund dividends and distributions or the or sale of Fund shares.
Investment returns and value of the shares of the Fund will fluctuate so that an investor's shares, when sold, may be worth more or less than their original cost. Performance may be lower or higher than performance data quoted. Fund returns reflect reinvestment of dividends and capital gains distributions. Returns for actual Fund investors may differ from what is shown because of differences in timing, the amount invested and fees and expenses.
Index returns are not Fund returns and do not reflect any management fees or brokerage expenses. Certain indices may take into account withholding taxes. Investors can not invest directly in the Index. The Index is unmanaged and includes the reinvestment of all dividends.
- Total Net Assets$55,413,520
- Number of Portfolio Holdings76
- Portfolio Turnover Rate230%
- Advisory Fees Paid$448,998
What did the Fund invest in?
Portfolio Composition (% of Total Net Assets)
| Value | Value | Value |
|---|
| Other assets less liabilities | | -% |
| Energy | | 1.0% |
| Materials | | 2.0% |
| Industrials | | 2.1% |
| Health Care | | 3.5% |
| Consumer Staples | | 6.3% |
| Communication Services | | 12.3% |
| Financials | | 13.3% |
| Consumer Discretionary | | 24.5% |
| Information Technology | | 35.0% |
Top Ten Holdings (% of Total Net Assets)
| MicroStrategy, Inc. | | 3.7% |
| Intel Corp. | | 3.5% |
| Tesla, Inc. | | 3.3% |
| GameStop Corp. | | 3.2% |
| Meta Platforms, Inc. | | 3.1% |
| Advanced Micro Devices, Inc. | | 3.1% |
| Alphabet, Inc. | | 3.1% |
| Palantir Technologies, Inc. | | 3.1% |
| SoFi Technologies, Inc. | | 3.0% |
| Apple, Inc. | | 3.0% |
The following material fund change occured during the period ended September 30, 2024.
Until February 1, 2024, Van Eck Associates Corporation agreed to waive or reduce its management fees and/or pay Fund expenses in an amount equal to the Fund’s extraordinary legal expenses up to $500,000. The termination of this arrangement following that date did not result in a material change to the Fund’s annual operating expenses during the period.
Householding is an option available to certain fund investors. Householding is a method of delivery, based on the preference of the individual investor, in which a single copy of certain shareholder documents can be delivered to investors who share the same address, even if their accounts are registered under different names. Please contact your broker-dealer if you are interested in enrolling in householding and receiving a single copy of prospectuses and other shareholder documents, or if you are currently enrolled in householding and wish to change your householding status.
Need Additional Information?
If you wish to view additional information about the Fund including but not limited to financial statements, prospectus or holdings please scan the QR code or visit https://www.vaneck.com/us/en/etf-mutual-fund-finder/etfs/documents/.
VanEck Video Gaming and eSports ETF
Principal U.S. Listing Exchange: The NASDAQ Stock Market LLC
Annual Shareholder Report - September 30, 2024
This annual shareholder report contains important information about the VanEck Video Gaming and eSports ETF for the period October 1, 2023 to September 30, 2024. You can find additional information about the Fund at https://www.vaneck.com/us/en/etf-mutual-fund-finder/etfs/documents/. You can also request this information by contacting us at 800.826.2333 or info@vaneck.com.
What were the Fund costs for the last year?
(based on a hypothetical $10,000 investment)
| Fund Name | Costs of a $10,000 investment | Costs paid as a % of a $10,000 investment |
|---|
| VanEck Video Gaming and eSports ETF | $70 | 0.56% |
How did the Fund perform last year?
The video gaming and eSports industry demonstrated positive performance over the past year, driven by continued growth in the global gaming population and increasing demand for immersive gaming experiences.
Communication Services was the leading sector, with companies that develop and deploy gaming software and game publishers seeing the most significant gains.
Nvidia Corp. was the top individual contributor, riding the wave of demand for Artificial Intelligence ("AI")-powered graphics chips used in video games and eSports platforms.
The consumer discretionary sector provided the smallest contribution but was still a positive contributor to the space as a whole.
Ubisoft Entertainment SA, known for popular video game franchises such as Assassin's Creed and Far Cry, had underperformance attributed to delays in key game releases, and underwhelming sales of other releases leading to a downward revision of financial forecasts and a significant decline in stock value.
How did the Fund perform since inception?
Cumulative Performance Based on $10,000 Investment
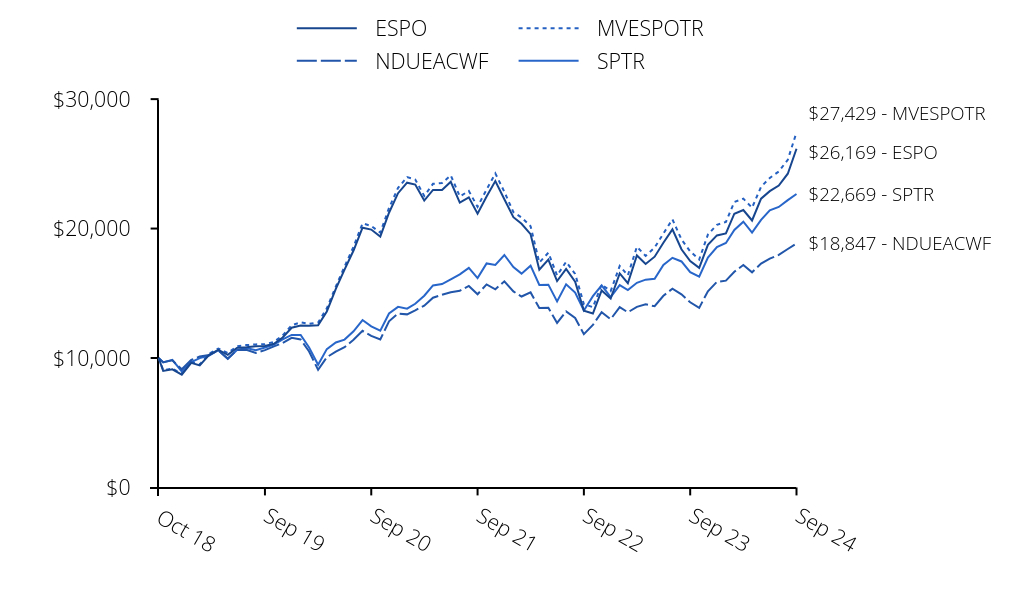
| ESPO | NDUEACWF | MVESPOTR | SPTR |
|---|
| Oct 18 | $10,000 | $10,000 | $10,000 | $10,000 |
| Oct 18 | $8,999 | $9,676 | $9,058 | $9,654 |
| Nov 18 | $9,119 | $9,818 | $9,175 | $9,851 |
| Dec 18 | $8,714 | $9,126 | $8,791 | $8,962 |
| Jan 19 | $9,628 | $9,847 | $9,711 | $9,680 |
| Feb 19 | $9,421 | $10,110 | $9,504 | $9,990 |
| Mar 19 | $10,240 | $10,237 | $10,327 | $10,185 |
| Apr 19 | $10,629 | $10,583 | $10,728 | $10,597 |
| May 19 | $10,247 | $9,955 | $10,379 | $9,924 |
| Jun 19 | $10,781 | $10,607 | $10,897 | $10,623 |
| Jul 19 | $10,825 | $10,638 | $10,994 | $10,776 |
| Aug 19 | $10,905 | $10,386 | $11,050 | $10,605 |
| Sep 19 | $10,931 | $10,604 | $11,068 | $10,803 |
| Oct 19 | $11,099 | $10,894 | $11,245 | $11,037 |
| Nov 19 | $11,587 | $11,160 | $11,745 | $11,438 |
| Dec 19 | $12,339 | $11,553 | $12,532 | $11,783 |
| Jan 20 | $12,502 | $11,426 | $12,751 | $11,779 |
| Feb 20 | $12,485 | $10,503 | $12,633 | $10,809 |
| Mar 20 | $12,531 | $9,085 | $12,738 | $9,474 |
| Apr 20 | $13,595 | $10,058 | $13,836 | $10,688 |
| May 20 | $15,336 | $10,496 | $15,521 | $11,197 |
| Jun 20 | $16,821 | $10,831 | $17,061 | $11,420 |
| Jul 20 | $18,302 | $11,404 | $18,593 | $12,064 |
| Aug 20 | $20,067 | $12,102 | $20,405 | $12,931 |
| Sep 20 | $19,922 | $11,712 | $20,197 | $12,440 |
| Oct 20 | $19,377 | $11,427 | $19,688 | $12,109 |
| Nov 20 | $21,222 | $12,835 | $21,591 | $13,435 |
| Dec 20 | $22,733 | $13,431 | $23,142 | $13,951 |
| Jan 21 | $23,545 | $13,370 | $23,971 | $13,810 |
| Feb 21 | $23,402 | $13,680 | $23,788 | $14,191 |
| Mar 21 | $22,161 | $14,045 | $22,519 | $14,813 |
| Apr 21 | $22,985 | $14,659 | $23,458 | $15,603 |
| May 21 | $22,977 | $14,888 | $23,514 | $15,712 |
| Jun 21 | $23,614 | $15,084 | $24,111 | $16,079 |
| Jul 21 | $22,010 | $15,188 | $22,483 | $16,461 |
| Aug 21 | $22,416 | $15,568 | $22,903 | $16,961 |
| Sep 21 | $21,147 | $14,925 | $21,682 | $16,173 |
| Oct 21 | $22,483 | $15,686 | $23,021 | $17,306 |
| Nov 21 | $23,671 | $15,309 | $24,261 | $17,186 |
| Dec 21 | $22,259 | $15,921 | $22,835 | $17,956 |
| Jan 22 | $20,880 | $15,139 | $21,270 | $17,027 |
| Feb 22 | $20,364 | $14,748 | $20,857 | $16,517 |
| Mar 22 | $19,563 | $15,068 | $20,181 | $17,130 |
| Apr 22 | $16,820 | $13,862 | $17,372 | $15,636 |
| May 22 | $17,602 | $13,878 | $18,131 | $15,665 |
| Jun 22 | $15,943 | $12,708 | $16,376 | $14,372 |
| Jul 22 | $16,876 | $13,595 | $17,432 | $15,697 |
| Aug 22 | $15,900 | $13,095 | $16,499 | $15,057 |
| Sep 22 | $13,656 | $11,841 | $14,156 | $13,670 |
| Oct 22 | $13,437 | $12,556 | $13,925 | $14,777 |
| Nov 22 | $15,220 | $13,530 | $15,668 | $15,603 |
| Dec 22 | $14,596 | $12,997 | $15,163 | $14,704 |
| Jan 23 | $16,531 | $13,929 | $17,116 | $15,628 |
| Feb 23 | $15,775 | $13,530 | $16,382 | $15,247 |
| Mar 23 | $17,923 | $13,947 | $18,592 | $15,806 |
| Apr 23 | $17,268 | $14,147 | $17,885 | $16,053 |
| May 23 | $17,828 | $13,996 | $18,533 | $16,123 |
| Jun 23 | $18,904 | $14,808 | $19,614 | $17,188 |
| Jul 23 | $19,938 | $15,351 | $20,710 | $17,740 |
| Aug 23 | $18,401 | $14,922 | $19,162 | $17,458 |
| Sep 23 | $17,495 | $14,305 | $18,236 | $16,625 |
| Oct 23 | $16,962 | $13,874 | $17,608 | $16,276 |
| Nov 23 | $18,746 | $15,155 | $19,535 | $17,762 |
| Dec 23 | $19,470 | $15,883 | $20,293 | $18,569 |
| Jan 24 | $19,622 | $15,976 | $20,507 | $18,881 |
| Feb 24 | $21,147 | $16,662 | $22,057 | $19,889 |
| Mar 24 | $21,432 | $17,185 | $22,310 | $20,529 |
| Apr 24 | $20,623 | $16,618 | $21,611 | $19,691 |
| May 24 | $22,306 | $17,293 | $23,224 | $20,667 |
| Jun 24 | $22,891 | $17,678 | $23,911 | $21,409 |
| Jul 24 | $23,324 | $17,963 | $24,409 | $21,669 |
| Aug 24 | $24,236 | $18,419 | $25,316 | $22,195 |
| Sep 24 | $26,169 | $18,847 | $27,429 | $22,669 |
This chart shows the value of a hypothetical $10,000 investment in the Fund at NAV since inception.
Average Annual Total Returns
| . | 1 Year | 5 Years | Life* |
|---|
| VanEck Video Gaming and eSports ETF | 49.58% | 19.08% | 17.53% |
MVIS® Global Video Gaming and eSports Index TR (MVESPOTR) | 50.41% | 19.90% | 18.46% |
| MSCI ACWI Net TR Index (NDUEACWF) | 31.76% | 12.19% | 11.23% |
| S&P 500 Index Total Return (SPTR) | 36.35% | 15.98% | 14.73% |
* Inception of Fund: 10/16/18
The performance data quoted represents past performance. Past performance is no guarantee of future results. Performance information for the Fund may reflect temporary fee waivers, if applicable. Had the Fund incurred all expenses, investment returns would have been reduced. These returns do not reflect the deduction of taxes that a shareholder would pay on Fund dividends and distributions or the or sale of Fund shares.
Investment returns and value of the shares of the Fund will fluctuate so that an investor's shares, when sold, may be worth more or less than their original cost. Performance may be lower or higher than performance data quoted. Fund returns reflect reinvestment of dividends and capital gains distributions. Returns for actual Fund investors may differ from what is shown because of differences in timing, the amount invested and fees and expenses.
Index returns are not Fund returns and do not reflect any management fees or brokerage expenses. Certain indices may take into account withholding taxes. Investors can not invest directly in the Index. The Index is unmanaged and includes the reinvestment of all dividends.
- Total Net Assets$263,779,299
- Number of Portfolio Holdings26
- Portfolio Turnover Rate36%
- Advisory Fees Paid$1,217,208
What did the Fund invest in?
Portfolio Composition (% of Total Net Assets)
| Value | Value | Value |
|---|
| Other assets less liabilities | | 0.1% |
| Consumer Discretionary | | 13.3% |
| Information Technology | | 23.3% |
| Communication Services | | 63.3% |
Top Ten Holdings (% of Total Net Assets)
| Tencent Holdings Ltd. | | 8.5% |
| Advanced Micro Devices, Inc. | | 8.0% |
| NetEase, Inc. | | 7.1% |
| Nintendo Co. Ltd. | | 6.4% |
| AppLovin Corp. | | 6.1% |
| Electronic Arts, Inc. | | 5.5% |
| Roblox Corp. | | 4.9% |
| Unity Software, Inc. | | 4.8% |
| Aristocrat Leisure Ltd. | | 4.6% |
| GameStop Corp. | | 4.5% |
Householding is an option available to certain fund investors. Householding is a method of delivery, based on the preference of the individual investor, in which a single copy of certain shareholder documents can be delivered to investors who share the same address, even if their accounts are registered under different names. Please contact your broker-dealer if you are interested in enrolling in householding and receiving a single copy of prospectuses and other shareholder documents, or if you are currently enrolled in householding and wish to change your householding status.
Need Additional Information?
If you wish to view additional information about the Fund including but not limited to financial statements, prospectus or holdings please scan the QR code or visit https://www.vaneck.com/us/en/etf-mutual-fund-finder/etfs/documents/.
| (a) | The Registrant has adopted a code of ethics (the “Code of Ethics”) that applies to the principal executive officer, principal financial officer, principal accounting officer or controller, or persons performing similar functions. |
| (b) | The Registrant’s code of ethics is reasonably described in this Form N-CSR. |
| (c) | The Registrant has not amended its Code of Ethics during the period covered by the shareholder report presented in Item 1 hereto. |
| (d) | The Registrant has not granted a waiver or an implicit waiver from a provision of its Code of Ethics during the period covered by the shareholder report presented in Item 1 hereto. |
| (f) | The Registrant’s Code of Ethics is attached as an Exhibit hereto. |
| Item 3. | AUDIT COMMITTEE FINANCIAL EXPERT. |
The Registrant’s Board of Trustees has determined that David Chow, Laurie A. Hesslein, R. Alastair Short, Peter Sidebottom and Richard Stamberger, members of the Audit Committee, are “audit committee financial experts” and “independent” as such terms are defined in the instructions to Form N-CSR Item 3(a)(2).
| Item 4. | PRINCIPAL ACCOUNTANT FEES AND SERVICES. |
The principal accountant fees disclosed in Item 4(a), 4(b), 4(c), 4(d) and 4(g) are for the Funds of the Registrant for which the fiscal year end is September 30.
| (a) | Audit Fees. The aggregate Audit Fees of PricewaterhouseCoopers LLP for professional services billed for the audits of the financial statements, or services that are normally provided in connection with statutory and regulatory filings or engagements for the fiscal years ended September 30, 2024 and September 30, 2023, were $442,215 and $389,520 respectively. |
| (b) | Audit-Related Fees. Not applicable. |
| (c) | Tax Fees. The aggregate Tax Fees of PricewaterhouseCoopers LLP for professional services billed for the review of Federal, state and excise tax returns and other tax compliance consultations for the fiscal years ended September 30, 2024 and September 30, 2023 were $208,700 and $188,900 respectively. |
None.
| (e) | The Audit Committee will pre-approve all audit and non-audit services, to be provided to the Fund, by the independent accountants as required by Section 10A of the Securities Exchange Act of 1934. The Audit Committee has authorized the Chairman of the Audit Committee to approve, between meeting dates, appropriate non-audit services. |
| | The Audit Committee after considering all factors, including a review of independence issues, will recommend to the Board of Trustees the independent auditors to be selected to audit the financial statements of the Funds. |
| (g) | Non-audit fees. The aggregate non-audit fees of PricewaterhouseCoopers LLP for professional services rendered and billed to the registrant’s investment adviser, and entities controlled by, or under common control with the adviser that provide ongoing services to the registrant for the fiscal years ended September 30, 2024 and September 30, 2023, were $261,974 and $0 respectively. |
| Item 5. | AUDIT COMMITTEE OF LISTED REGISTRANTS. |
The Registrant’s Board has an Audit Committee established in accordance with Section 3(a)(58)(A) of the Exchange Act (15 U.S.C. 78c(a)(58)(A)) consisting of five Independent Trustees. Ms. Hesslein and Messrs. Chow, Short, Sidebottom and Stamberger currently serve as members of the Audit Committee. Ms. Hesslein is the Chairperson of the Audit Committee.
Information included in Item 7.
| Item 7. | FINANCIAL STATEMENTS AND FINANCIAL HIGHLIGHTS FOR OPEN-END MANAGEMENT INVESSTMENT COMPANIES. |
 | ANNUAL FINANCIAL STATEMENTS AND
OTHER INFORMATION
September 30, 2024 |
| Biotech ETF | BBH |
| Digital Transformation ETF | DAPP |
| Energy Income ETF | EINC |
| Environmental Services ETF | EVX |
| Fabless Semiconductor ETF | SMHX |
| Gaming ETF | BJK |
| Green Infrastructure ETF | RNEW |
| Pharmaceutical ETF | PPH |
| Retail ETF | RTH |
| Robotics ETF | IBOT |
| Semiconductor ETF | SMH |
| Video Gaming and eSports ETF | ESPO |
VANECK BIOTECH ETF
SCHEDULE OF INVESTMENTS
September 30, 2024
| | | Number
of Shares | | | Value | |
| COMMON STOCKS: 99.9% | | | | | | |
| China: 1.9% | | | | | | |
| BeiGene Ltd. (ADR) * † | | | 38,863 | | | $ | 8,725,132 | |
| Germany: 2.4% | | | | | | | | |
| BioNTech SE (ADR) * | | | 92,607 | | | | 10,998,934 | |
| Ireland: 4.5% | | | | | | | | |
| ICON Plc (USD) * | | | 70,314 | | | | 20,201,915 | |
| United States: 91.1% | | | | | | | | |
| Alnylam Pharmaceuticals, Inc. * | | | 56,423 | | | | 15,518,018 | |
| Amgen, Inc. | | | 235,125 | | | | 75,759,626 | |
| Argenx SE (ADR) * † | | | 38,241 | | | | 20,729,681 | |
| Biogen, Inc. * | | | 98,937 | | | | 19,177,948 | |
| BioMarin Pharmaceutical, Inc. * | | | 123,608 | | | | 8,688,406 | |
| Bio-Techne Corp. | | | 121,983 | | | | 9,750,101 | |
| Charles River Laboratories International, Inc. * | | | 40,226 | | | | 7,923,315 | |
| Cytokinetics, Inc. * | | | 71,691 | | | | 3,785,285 | |
| Exact Sciences Corp. * † | | | 132,883 | | | | 9,051,990 | |
| | | Number
of Shares | | | Value | |
| United States (continued) | | | | | | | | |
| Gilead Sciences, Inc. | | | 494,607 | | | $ | 41,467,851 | |
| Illumina, Inc. * | | | 127,295 | | | | 16,600,541 | |
| Incyte Corp. * | | | 94,266 | | | | 6,230,983 | |
| Insmed, Inc. * | | | 127,024 | | | | 9,272,752 | |
| IQVIA Holdings, Inc. * | | | 96,229 | | | | 22,803,386 | |
| Moderna, Inc. * | | | 258,478 | | | | 17,274,085 | |
| Natera, Inc. * | | | 100,068 | | | | 12,703,633 | |
| Neurocrine Biosciences, Inc. * | | | 77,663 | | | | 8,948,331 | |
| QIAGEN NV † | | | 181,156 | | | | 8,255,279 | |
| Regeneron Pharmaceuticals, Inc. * | | | 36,829 | | | | 38,716,118 | |
| Repligen Corp. * | | | 39,160 | | | | 5,827,791 | |
| Sarepta Therapeutics, Inc. * | | | 66,680 | | | | 8,327,665 | |
| Vertex Pharmaceuticals, Inc. * | | | 96,594 | | | | 44,923,937 | |
| | | | | | | | 411,736,722 | |
Total Common Stocks
(Cost: $428,238,352) | | | | | | | 451,662,703 | |
Total Investments: 99.9%
(Cost: $428,238,352) | | | | | | | 451,662,703 | |
| Other assets less liabilities: 0.1% | | | | | | | 327,637 | |
| NET ASSETS: 100.0% | | | | | | $ | 451,990,340 | |
| Definitions: |
| ADR | American Depositary Receipt |
| USD | United States Dollar |
| Footnotes: |
| † | Security fully or partially on loan. Total market value of securities on loan is $23,574,085. |
| * | Non-income producing |
The summary of inputs used to value the Fund’s investments as of September 30, 2024 is as follows:
| | | Level 1
Quoted
Prices | | | Level 2
Significant
Observable
Inputs | | | Level 3
Significant
Unobservable
Inputs | | | Value | |
| Common Stocks * | | $ | 451,662,703 | | | $ | — | | | $ | — | | | $ | 451,662,703 | |
| * | See Schedule of Investments for geographic sectors. |
See Notes to Financial Statements
VANECK DIGITAL TRANSFORMATION ETF
SCHEDULE OF INVESTMENTS
September 30, 2024
| | | Number
of Shares | | | Value | |
| COMMON STOCKS: 99.9% | | | | | | | | |
| Australia: 4.4% | | | | | | | | |
| Iris Energy Ltd. (USD) * † | | | 709,171 | | | $ | 5,985,403 | |
| Canada: 12.8% | | | | | | | | |
| Bitfarms Ltd. (USD) * | | | 2,683,438 | | | | 5,662,054 | |
| Hive Digital Technologies Ltd. (USD) * | | | 1,709,102 | | | | 5,349,489 | |
| Hut 8 Corp. (USD) * † | | | 504,727 | | | | 6,187,953 | |
| | | | | | | | 17,199,496 | |
| China: 3.6% | | | | | | | | |
| OSL Group Ltd. (HKD) * † | | | 5,947,000 | | | | 4,911,527 | |
| Germany: 6.2% | | | | | | | | |
| Bitcoin Group SE | | | 57,442 | | | | 3,374,214 | |
| Northern Data AG * † | | | 173,212 | | | | 4,951,280 | |
| | | | | | | | 8,325,494 | |
| Singapore: 3.0% | | | | | | | | |
| Canaan, Inc. (ADR) * † | | | 4,054,657 | | | | 4,095,204 | |
| United States: 69.9% | | | | | | | | |
| Applied Digital Corp. * † | | | 909,712 | | | | 7,505,124 | |
| Bit Digital, Inc. * | | | 1,969,686 | | | | 6,913,598 | |
| Block, Inc. * | | | 149,790 | | | | 10,055,403 | |
| Cipher Mining, Inc. * † | | | 1,722,572 | | | | 6,666,354 | |
| Cleanspark, Inc. * † | | | 702,542 | | | | 6,561,742 | |
| Coinbase Global, Inc. * | | | 60,420 | | | | 10,765,031 | |
| | | Number
of Shares | | | Value | |
| United States (continued) | | | | | | | | |
| Core Scientific, Inc. * | | | 714,152 | | | $ | 8,469,843 | |
| Galaxy Digital Holdings Ltd. (CAD) * † | | | 511,148 | | | | 6,568,362 | |
| MARA Holdings, Inc. * † | | | 488,486 | | | | 7,923,243 | |
| MicroStrategy, Inc. * † | | | 64,252 | | | | 10,832,887 | |
| Riot Platforms, Inc. * † | | | 836,859 | | | | 6,209,494 | |
| Terawulf, Inc. * † | | | 1,208,144 | | | | 5,654,114 | |
| | | | | | | | 94,125,195 | |
Total Common Stocks
(Cost: $105,828,491) | | | | | | | 134,642,319 | |
| | | | | | | | | |
| SHORT-TERM INVESTMENT HELD AS COLLATERAL FOR SECURITIES ON LOAN: 11.8% | | | | | | | | |
Money Market Fund: 11.8%
(Cost: $15,879,709) | | | | | | | | |
| State Street Navigator Securities Lending Government Money Market Portfolio | | | 15,879,709 | | | | 15,879,709 | |
Total Investments: 111.7%
(Cost: $121,708,200) | | | | | | | 150,522,028 | |
| Liabilities in excess of other assets: (11.7)% | | | | | | | (15,751,339) | |
| NET ASSETS: 100.0% | | | | | | $ | 134,770,689 | |
| Definitions: |
| ADR | American Depositary Receipt |
| CAD | Canadian Dollar |
| HKD | Hong Kong Dollar |
| USD | United States Dollar |
| Footnotes: |
| † | Security fully or partially on loan. Total market value of securities on loan is $36,730,000. |
| * | Non-income producing |
The summary of inputs used to value the Fund’s investments as of September 30, 2024 is as follows:
| | | Level 1
Quoted
Prices | | | Level 2
Significant
Observable
Inputs | | | Level 3
Significant
Unobservable
Inputs | | | Value | |
| Common Stocks | | | | | | | | | | | | | | | | |
| Australia | | $ | 5,985,403 | | | $ | — | | | $ | — | | | $ | 5,985,403 | |
| Canada | | | 17,199,496 | | | | — | | | | — | | | | 17,199,496 | |
| China | | | — | | | | 4,911,527 | | | | — | | | | 4,911,527 | |
| Germany | | | — | | | | 8,325,494 | | | | — | | | | 8,325,494 | |
| Singapore | | | 4,095,204 | | | | — | | | | — | | | | 4,095,204 | |
| United States | | | 94,125,195 | | | | — | | | | — | | | | 94,125,195 | |
| Money Market Fund | | | 15,879,709 | | | | — | | | | — | | | | 15,879,709 | |
| Total Investments | | $ | 137,285,007 | | | $ | 13,237,021 | | | $ | — | | | $ | 150,522,028 | |
See Notes to Financial Statements
VANECK ENERGY INCOME ETF
SCHEDULE OF INVESTMENTS
September 30, 2024
| | | Number
of Shares | | | Value | |
| COMMON STOCKS: 77.1% | | | | | | | | |
| Energy: 77.1% | | | | | | | | |
| Antero Midstream Corp. | | | 173,266 | | | $ | 2,607,653 | |
| Archrock, Inc. | | | 68,251 | | | | 1,381,400 | |
| Cheniere Energy, Inc. | | | 18,693 | | | | 3,361,749 | |
| DT Midstream, Inc. | | | 33,239 | | | | 2,614,580 | |
| Enbridge, Inc. | | | 109,387 | | | | 4,442,206 | |
| EnLink Midstream LLC | | | 127,462 | | | | 1,849,474 | |
| Excelerate Energy, Inc. | | | 9,351 | | | | 205,815 | |
| Gibson Energy, Inc. | | | 99,549 | | | | 1,634,799 | |
| Hess Midstream LP | | | 13,554 | | | | 478,050 | |
| Keyera Corp. | | | 81,780 | | | | 2,549,937 | |
| Kinder Morgan, Inc. | | | 145,280 | | | | 3,209,235 | |
| Kinetik Holdings, Inc. | | | 24,527 | | | | 1,110,092 | |
| Mattr Corp. * | | | 32,634 | | | | 342,157 | |
| NextDecade Corp. * | | | 67,798 | | | | 319,329 | |
| ONEOK, Inc. | | | 42,681 | | | | 3,889,519 | |
| Pembina Pipeline Corp. | | | 61,408 | | | | 2,532,466 | |
| Targa Resources Corp. | | | 19,010 | | | | 2,813,670 | |
| TC Energy Corp. | | | 77,951 | | | | 3,706,570 | |
| The Williams Companies, Inc. | | | 98,738 | | | | 4,507,390 | |
Total Common Stocks
(Cost: $38,010,465) | | | | | | | 43,556,091 | |
| | | Number
of Shares | | | Value | |
| MASTER LIMITED PARTNERSHIPS: 22.9% | | | | | | | | |
| Energy: 22.9% | | | | | | | | |
| Cheniere Energy Partners LP | | | 8,443 | | | $ | 411,343 | |
| Delek Logistics Partners LP | | | 2,780 | | | | 121,542 | |
| Energy Transfer LP | | | 156,016 | | | | 2,504,057 | |
| Enterprise Products Partners LP | | | 84,939 | | | | 2,472,574 | |
| Genesis Energy LP | | | 18,684 | | | | 249,805 | |
| MPLX LP | | | 57,809 | | | | 2,570,188 | |
| NGL Energy Partners LP * | | | 22,246 | | | | 100,107 | |
| Plains All American Pipeline LP | | | 88,656 | | | | 1,539,955 | |
| Plains GP Holdings LP | | | 33,547 | | | | 620,620 | |
| Sunoco LP | | | 21,349 | | | | 1,146,014 | |
| Western Midstream Partners LP | | | 30,616 | | | | 1,171,368 | |
Total Master Limited Partnerships
(Cost: $11,405,285) | | | | | | | 12,907,573 | |
Total Investments: 100.0%
(Cost: $49,415,750) | | | | | | | 56,463,664 | |
| Liabilities in excess of other assets: 0.0% | | | | | | | (7,183) | |
| NET ASSETS: 100.0% | | | | | | $ | 56,456,481 | |
Footnotes:
The summary of inputs used to value the Fund’s investments as of September 30, 2024 is as follows:
| | | Level 1
Quoted
Prices | | | Level 2
Significant
Observable
Inputs | | | Level 3
Significant
Unobservable
Inputs | | | Value | |
| Common Stocks * | | $ | 43,556,091 | | | $ | — | | | $ | — | | | $ | 43,556,091 | |
| Master Limited Partnerships * | | | 12,907,573 | | | | — | | | | — | | | | 12,907,573 | |
| Total Investments | | $ | 56,463,664 | | | $ | — | | | $ | — | | | $ | 56,463,664 | |
| * | See Schedule of Investments for industry sectors. |
See Notes to Financial Statements
VANECK ENVIRONMENTAL SERVICES ETF
SCHEDULE OF INVESTMENTS
September 30, 2024
| | | Number
of Shares | | | Value | |
| COMMON STOCKS: 100.0% | | | | | | | | |
| Canada: 3.9% | | | | | | | | |
| GFL Environmental, Inc. (USD) | | | 77,186 | | | $ | 3,078,178 | |
| United States: 96.1% | | | | | | | | |
| ABM Industries, Inc. | | | 59,359 | | | | 3,131,781 | |
| Aris Water Solutions, Inc. | | | 92,800 | | | | 1,565,536 | |
| Casella Waste Systems, Inc. * † | | | 28,342 | | | | 2,819,745 | |
| CECO Environmental Corp. * | | | 55,977 | | | | 1,578,551 | |
| Clean Harbors, Inc. * | | | 12,509 | | | | 3,023,550 | |
| Darling Ingredients, Inc. * | | | 85,305 | | | | 3,169,934 | |
| Donaldson Co., Inc. | | | 42,224 | | | | 3,111,909 | |
| Ecolab, Inc. | | | 31,401 | | | | 8,017,617 | |
| Energy Recovery, Inc. * | | | 95,621 | | | | 1,662,849 | |
| Montrose Environmental Group, Inc. * | | | 101,644 | | | | 2,673,237 | |
| Perma-Fix Environmental Services, Inc. * † | | | 137,858 | | | | 1,691,518 | |
| PureCycle Technologies, Inc. * † | | | 345,311 | | | | 3,280,454 | |
| Radius Recycling, Inc. † | | | 92,040 | | | | 1,706,422 | |
| Republic Services, Inc. | | | 38,983 | | | | 7,829,346 | |
| | | Number
of Shares | | | Value | |
| United States (continued) | | | | | | | | |
| Stericycle, Inc. * | | | 49,042 | | | $ | 2,991,562 | |
| STERIS Plc | | | 12,516 | | | | 3,035,631 | |
| Tennant Co. | | | 31,875 | | | | 3,061,275 | |
| Tetra Tech, Inc. | | | 65,249 | | | | 3,077,143 | |
| Veralto Corp. | | | 27,767 | | | | 3,106,017 | |
| Waste Connections, Inc. | | | 43,354 | | | | 7,752,562 | |
| Waste Management, Inc. | | | 38,720 | | | | 8,038,272 | |
| | | | | | | | 76,324,911 | |
Total Common Stocks
(Cost: $69,913,900) | | | | | | | 79,403,089 | |
| | | | | | | | | |
| SHORT-TERM INVESTMENT HELD AS COLLATERAL FOR SECURITIES ON LOAN: 2.4% | | | | | | | | |
Money Market Fund: 2.4%
(Cost: $1,894,108) | | | | | | | | |
| State Street Navigator Securities Lending Government Money Market Portfolio | | | 1,894,108 | | | | 1,894,108 | |
Total Investments: 102.4%
(Cost: $71,808,008) | | | | | | | 81,297,197 | |
| Liabilities in excess of other assets: (2.4)% | | | | | | | (1,869,424) | |
| NET ASSETS: 100.0% | | | | | | $ | 79,427,773 | |
Definitions:
Footnotes:
| † | Security fully or partially on loan. Total market value of securities on loan is $4,526,590. |
| * | Non-income producing |
The summary of inputs used to value the Fund’s investments as of September 30, 2024 is as follows:
| | | Level 1
Quoted
Prices | | | Level 2
Significant
Observable
Inputs | | | Level 3
Significant
Unobservable
Inputs | | | Value | |
| Common Stocks * | | $ | 79,403,089 | | | $ | — | | | $ | — | | | $ | 79,403,089 | |
| Money Market Fund | | | 1,894,108 | | | | — | | | | — | | | | 1,894,108 | |
| Total Investments | | $ | 81,297,197 | | | $ | — | | | $ | — | | | $ | 81,297,197 | |
| * | See Schedule of Investments for geographic sectors. |
See Notes to Financial Statements
VANECK FABLESS SEMICONDUCTOR ETF
SCHEDULE OF INVESTMENTS
September 30, 2024
| | | Number
of Shares | | | Value | |
| COMMON STOCKS: 99.9% | | | | | | | | |
| Bermuda: 4.1% | | | | | | | | |
| Marvell Technology, Inc. (USD) | | | 3,636 | | | $ | 262,228 | |
| Taiwan: 1.8% | | | | | | | | |
| Silicon Motion Technology Corp. (ADR) | | | 1,939 | | | | 117,775 | |
| United Kingdom: 4.4% | | | | | | | | |
| ARM Holdings Plc (ADR) * | | | 1,938 | | | | 277,153 | |
| United States: 89.6% | | | | | | | | |
| Advanced Micro Devices, Inc. * | | | 2,020 | | | | 331,442 | |
| Allegro MicroSystems, Inc. * | | | 5,268 | | | | 122,744 | |
| Ambarella, Inc. * | | | 1,937 | | | | 109,256 | |
| Astera Labs, Inc. * | | | 6,298 | | | | 329,952 | |
| Broadcom, Inc. | | | 5,723 | | | | 987,218 | |
| Cadence Design Systems, Inc. * | | | 1,027 | | | | 278,348 | |
| | | Number
of Shares | | | Value | |
| United States (continued) | | | | | | | | |
| Cirrus Logic, Inc. * | | | 1,989 | | | $ | 247,054 | |
| Impinj, Inc. * | | | 1,009 | | | | 218,469 | |
| Lattice Semiconductor Corp. * | | | 3,912 | | | | 207,610 | |
| Monolithic Power Systems, Inc. | | | 303 | | | | 280,124 | |
| NVIDIA Corp. | | | 10,332 | | | | 1,254,717 | |
| Power Integrations, Inc. | | | 2,457 | | | | 157,543 | |
| Qualcomm, Inc. | | | 1,813 | | | | 308,301 | |
| Rambus, Inc. * | | | 4,588 | | | | 193,705 | |
| Semtech Corp. * | | | 2,001 | | | | 91,366 | |
| Silicon Laboratories, Inc. * | | | 1,217 | | | | 140,649 | |
| SiTime Corp. * | | | 486 | | | | 83,354 | |
| Synaptics, Inc. * | | | 1,320 | | | | 102,406 | |
| Synopsys, Inc. * | | | 614 | | | | 310,923 | |
| | | | | | | | 5,755,181 | |
Total Common Stocks
(Cost: $5,942,341) | | | | | | | 6,412,337 | |
Total Investments: 99.9%
(Cost: $5,942,341) | | | | | | | 6,412,337 | |
| Other assets less liabilities: 0.1% | | | | | | | 4,293 | |
| NET ASSETS: 100.0% | | | | | | $ | 6,416,630 | |
Definitions:
| ADR | American Depositary Receipt |
| USD | United States Dollar |
Footnotes:
The summary of inputs used to value the Fund’s investments as of September 30, 2024 is as follows:
| | | Level 1
Quoted
Prices | | | Level 2
Significant
Observable
Inputs | | | Level 3
Significant
Unobservable
Inputs | | | Value | |
| Common Stocks * | | $ | 6,412,337 | | | $ | — | | | $ | — | | | $ | 6,412,337 | |
| * | See Schedule of Investments for geographic sectors. |
See Notes to Financial Statements
VANECK GAMING ETF
SCHEDULE OF INVESTMENTS
September 30, 2024
| | | Number
of Shares | | | Value | |
| COMMON STOCKS: 100.1% | | | | | | | | |
| Australia: 11.3% | | | | | | | | |
| Aristocrat Leisure Ltd. | | | 67,697 | | | $ | 2,742,723 | |
| Lottery Corp. Ltd. | | | 351,379 | | | | 1,242,992 | |
| Star Entertainment Group Ltd. * † | | | 540,404 | | | | 171,144 | |
| Tabcorp Holdings Ltd. † | | | 412,018 | | | | 143,871 | |
| | | | | | | | 4,300,730 | |
| China: 6.8% | | | | | | | | |
| Galaxy Entertainment Group Ltd. (HKD) | | | 414,240 | | | | 2,047,267 | |
| Melco Resorts & Entertainment Ltd. (ADR) * † | | | 38,984 | | | | 303,685 | |
| SJM Holdings Ltd. (HKD) * † | | | 608,500 | | | | 239,543 | |
| | | | | | | | 2,590,495 | |
| France: 2.7% | | | | | | | | |
| La Francaise des Jeux SAEM 144A | | | 24,652 | | | | 1,017,061 | |
| Greece: 1.9% | | | | | | | | |
| OPAP SA | | | 41,729 | | | | 743,284 | |
| Ireland: 7.9% | | | | | | | | |
| Flutter Entertainment Plc (USD) * | | | 12,740 | | | | 3,022,947 | |
| Italy: 1.3% | | | | | | | | |
| International Game Technology Plc (USD) | | | 23,689 | | | | 504,576 | |
| Japan: 2.2% | | | | | | | | |
| Heiwa Corp. | | | 13,100 | | | | 195,358 | |
| Sankyo Co. Ltd. | | | 43,395 | | | | 642,662 | |
| | | | | | | | 838,020 | |
| Malaysia: 4.6% | | | | | | | | |
| Genting Bhd | | | 486,300 | | | | 498,097 | |
| | | Number
of Shares | | | Value | |
| Malaysia (continued) | | | | | | | | |
| Genting Malaysia Bhd | | | 677,498 | | | $ | 397,759 | |
| Genting Singapore Ltd. (SGD) | | | 1,279,700 | | | | 869,630 | |
| | | | | | | | 1,765,486 | |
| Malta: 1.4% | | | | | | | | |
| Kindred Group Plc (SEK) (SDR) | | | 40,482 | | | | 515,580 | |
| South Korea: 1.0% | | | | | | | | |
| Kangwon Land, Inc. | | | 28,467 | | | | 368,325 | |
| Sweden: 5.6% | | | | | | | | |
| Evolution AB 144A | | | 21,747 | | | | 2,142,947 | |
| United Kingdom: 3.7% | | | | | | | | |
| Entain Plc | | | 79,299 | | | | 812,875 | |
| Playtech Plc * | | | 61,383 | | | | 619,167 | |
| | | | | | | | 1,432,042 | |
| United States: 49.7% | | | | | | | | |
| Boyd Gaming Corp. | | | 11,175 | | | | 722,464 | |
| Caesars Entertainment, Inc. * | | | 33,665 | | | | 1,405,177 | |
| Churchill Downs, Inc. | | | 10,431 | | | | 1,410,376 | |
| DraftKings, Inc. * | | | 59,298 | | | | 2,324,482 | |
| Gaming and Leisure Properties, Inc. | | | 33,571 | | | | 1,727,228 | |
| Las Vegas Sands Corp. | | | 49,003 | | | | 2,466,811 | |
| Light & Wonder, Inc. * | | | 12,006 | | | | 1,089,304 | |
| MGM Resorts International * | | | 43,160 | | | | 1,687,124 | |
| Penn Entertainment, Inc. * † | | | 18,928 | | | | 356,982 | |
| Sands China Ltd. (HKD) * | | | 547,600 | | | | 1,380,144 | |
| VICI Properties, Inc. | | | 82,879 | | | | 2,760,699 | |
| Wynn Resorts Ltd. | | | 17,272 | | | | 1,656,039 | |
| | | | | | | | 18,986,830 | |
Total Common Stocks
(Cost: $45,520,822) | | | | | | | 38,228,323 | |
Total Investments: 100.1%
(Cost: $45,520,822) | | | | | | | 38,228,323 | |
| Liabilities in excess of other assets: (0.1)% | | | | (37,157) | |
| NET ASSETS: 100.0% | | | | | | $ | 38,191,166 | |
Definitions:
| ADR | American Depositary Receipt |
| HKD | Hong Kong Dollar |
| SDR | Swedish Depositary Receipt |
| SEK | Swedish Krona |
| SGD | Singapore Dollar |
| USD | United States Dollar |
Footnotes:
| † | Security fully or partially on loan. Total market value of securities on loan is $1,056,430. |
| * | Non-income producing |
| | |
| 144A | Security exempt from registration under Rule 144A of the Securities Act of 1933, as amended, or otherwise restricted. These securities may be resold in transactions exempt from registration, unless otherwise noted. These securities have an aggregate value of $3,160,008, or 8.3% of net assets. |
See Notes to Financial Statements
The summary of inputs used to value the Fund’s investments as of September 30, 2024 is as follows:
| | | Level 1
Quoted
Prices | | | Level 2
Significant
Observable
Inputs | | | Level 3
Significant
Unobservable
Inputs | | | Value | |
| Common Stocks | | | | | | | | | | | | | | | | |
| Australia | | $ | — | | | $ | 4,300,730 | | | $ | — | | | $ | 4,300,730 | |
| China | | | 303,685 | | | | 2,286,810 | | | | — | | | | 2,590,495 | |
| France | | | — | | | | 1,017,061 | | | | — | | | | 1,017,061 | |
| Greece | | | 743,284 | | | | — | | | | — | | | | 743,284 | |
| Ireland | | | 3,022,947 | | | | — | | | | — | | | | 3,022,947 | |
| Italy | | | 504,576 | | | | — | | | | — | | | | 504,576 | |
| Japan | | | — | | | | 838,020 | | | | — | | | | 838,020 | |
| Malaysia | | | — | | | | 1,765,486 | | | | — | | | | 1,765,486 | |
| Malta | | | 515,580 | | | | — | | | | — | | | | 515,580 | |
| South Korea | | | — | | | | 368,325 | | | | — | | | | 368,325 | |
| Sweden | | | — | | | | 2,142,947 | | | | — | | | | 2,142,947 | |
| United Kingdom | | | 619,167 | | | | 812,875 | | | | — | | | | 1,432,042 | |
| United States | | | 17,606,686 | | | | 1,380,144 | | | | — | | | | 18,986,830 | |
| Total Investments | | $ | 23,315,925 | | | $ | 14,912,398 | | | $ | — | | | $ | 38,228,323 | |
See Notes to Financial Statements
VANECK GREEN INFRASTRUCTURE ETF
SCHEDULE OF INVESTMENTS
September 30, 2024
| | | Number
of Shares | | | Value | |
| COMMON STOCKS: 99.3% | | | | | | | | |
| Automobiles & Components: 20.3% | | | | | | | | |
| BorgWarner, Inc. | | | 2,208 | | | $ | 80,128 | |
| Lucid Group, Inc. * | | | 22,363 | | | | 78,942 | |
| Rivian Automotive, Inc. * † | | | 7,924 | | | | 88,907 | |
| Tesla, Inc. * | | | 527 | | | | 137,879 | |
| | | | | | | | 385,856 | |
| Capital Goods: 16.7% | | | | | | | | |
| Ameresco, Inc. * | | | 333 | | | | 12,634 | |
| Array Technologies, Inc. * | | | 1,471 | | | | 9,709 | |
| Bloom Energy Corp. * † | | | 2,200 | | | | 23,232 | |
| ChargePoint Holdings, Inc. * † | | | 4,122 | | | | 5,647 | |
| Donaldson Co., Inc. | | | 1,167 | | | | 86,008 | |
| Energy Recovery, Inc. * | | | 556 | | | | 9,669 | |
| FuelCell Energy, Inc. * | | | 4,818 | | | | 1,831 | |
| Nikola Corp. * † | | | 438 | | | | 2,006 | |
| Plug Power, Inc. * † | | | 7,197 | | | | 16,265 | |
| Quanta Services, Inc. | | | 338 | | | | 100,775 | |
| SES AI Corp. * † | | | 3,035 | | | | 1,942 | |
| Shoals Technologies Group, Inc. * | | | 1,652 | | | | 9,268 | |
| Sunrun, Inc. * | | | 2,149 | | | | 38,811 | |
| | | | | | | | 317,797 | |
| Commercial & Professional Services: 22.0% | | | |
| Casella Waste Systems, Inc. * | | | 554 | | | | 55,117 | |
| Clean Harbors, Inc. * | | | 422 | | | | 102,002 | |
| Montrose Environmental Group, Inc. * | | | 330 | | | | 8,679 | |
| Republic Services, Inc. | | | 499 | | | | 100,219 | |
| Stericycle, Inc. * | | | 899 | | | | 54,839 | |
| Waste Management, Inc. | | | 465 | | | | 96,534 | |
| | | | | | | | 417,390 | |
| Consumer Discretionary Distribution & Retail: 0.2% | |
| EVgo, Inc. * | | | 1,030 | | | | 4,264 | |
| Energy: 7.7% | | | | | | | | |
| Cheniere Energy, Inc. | | | 590 | | | | 106,106 | |
| Clean Energy Fuels Corp. * | | | 2,164 | | | | 6,730 | |
| Green Plains, Inc. * | | | 626 | | | | 8,476 | |
| New Fortress Energy, Inc. | | | 1,988 | | | | 18,071 | |
| REX American Resources Corp. * | | | 170 | | | | 7,869 | |
| | | | | | | | 147,252 | |
| Materials: 5.2% | | | | | | | | |
| Ecolab, Inc. | | | 387 | | | | 98,813 | |
| | | Number
of Shares | | | Value | |
| Semiconductors & Semiconductor Equipment: 8.2% | |
| Enphase Energy, Inc. * | | | 695 | | | $ | 78,549 | |
| First Solar, Inc. * | | | 311 | | | | 77,576 | |
| | | | | | | | 156,125 | |
| Technology Hardware & Equipment: 2.5% | |
| Itron, Inc. * | | | 445 | | | | 47,530 | |
| Utilities: 16.5% | | | | | | | | |
| Altus Power, Inc. * | | | 1,550 | | | | 4,929 | |
| Brookfield Renewable Corp. | | | 1,741 | | | | 56,861 | |
| Clearway Energy, Inc. | | | 799 | | | | 24,513 | |
| IDACORP, Inc. | | | 491 | | | | 50,617 | |
| Montauk Renewables, Inc. * | | | 1,393 | | | | 7,258 | |
| NextEra Energy Partners LP | | | 907 | | | | 25,051 | |
| Northwestern Energy Group, Inc. | | | 594 | | | | 33,989 | |
| Ormat Technologies, Inc. | | | 586 | | | | 45,087 | |
| Southwest Gas Holdings, Inc. | | | 695 | | | | 51,263 | |
| Sunnova Energy International, Inc. * † | | | 1,202 | | | | 11,707 | |
| | | | | | | | 311,275 | |
Total Common Stocks
(Cost: $1,902,133) | | | | | | | 1,886,302 | |
| | | | | | | | | |
MASTER LIMITED PARTNERSHIP: 0.6%
(Cost: $9,794) | | | |
| Utilities: 0.6% | | | | | | | | |
| Suburban Propane Partners LP | | | 621 | | | | 11,141 | |
| | | | | | | | | |
Total Investments Before Collateral for Securities Loaned: 99.9%
(Cost: $1,911,927) | | | | | | | 1,897,443 | |
| | | | | | | | | |
| SHORT-TERM INVESTMENT HELD AS COLLATERAL FOR SECURITIES ON LOAN: 1.7% | | | | | | | | |
Money Market Fund: 1.7%
(Cost: $33,105) | | | |
| State Street Navigator Securities Lending Government Money Market Portfolio | | | 33,105 | | | | 33,105 | |
Total Investments: 101.6%
(Cost: $1,945,032) | | | | | | | 1,930,548 | |
| Liabilities in excess of other assets: (1.6)% | | (30,295) | |
| NET ASSETS: 100.0% | $ | 1,900,253 | |
Footnotes:
| * | Non-income producing |
| † | Security fully or partially on loan. Total market value of securities on loan is $132,973. |
See Notes to Financial Statements
The summary of inputs used to value the Fund’s investments as of September 30, 2024 is as follows:
| | | Level 1
Quoted
Prices | | | Level 2
Significant
Observable
Inputs | | | Level 3
Significant
Unobservable
Inputs | | | Value | |
| Common Stocks * | | $ | 1,886,302 | | | $ | — | | | $ | — | | | $ | 1,886,302 | |
| Master Limited Partnership * | | | 11,141 | | | | — | | | | — | | | | 11,141 | |
| Money Market Fund | | | 33,105 | | | | — | | | | — | | | | 33,105 | |
| Total Investments | | $ | 1,930,548 | | | $ | — | | | $ | — | | | $ | 1,930,548 | |
| * | See Schedule of Investments for industry sectors. |
See Notes to Financial Statements
VANECK PHARMACEUTICAL ETF
SCHEDULE OF INVESTMENTS
September 30, 2024
| | | Number
of Shares | | | Value | |
| COMMON STOCKS: 99.8% | | | | | | | | |
| Denmark: 8.3% | | | | | | | | |
| Novo Nordisk A/S (ADR) | | | 509,128 | | | $ | 60,621,871 | |
| France: 4.6% | | | | | | | | |
| Sanofi SA (ADR) | | | 580,013 | | | | 33,426,149 | |
| Israel: 3.6% | | | | | | | | |
| Teva Pharmaceutical Industries Ltd. (ADR) * | | | 1,464,051 | | | | 26,382,199 | |
| Japan: 4.4% | | | | | | | | |
| Takeda Pharmaceutical Co. Ltd. (ADR) † | | | 2,248,821 | | | | 31,978,235 | |
| Switzerland: 5.1% | | | | | | | | |
| Novartis AG (ADR) † | | | 321,223 | | | | 36,947,069 | |
| United Kingdom: 13.9% | | | | | | | | |
| AstraZeneca Plc (ADR) | | | 459,836 | | | | 35,825,823 | |
| GSK Plc (ADR) † | | | 761,424 | | | | 31,127,013 | |
| Haleon Plc (ADR) † | | | 3,195,352 | | | | 33,806,824 | |
| | | | | | | | 100,759,660 | |
| United States: 59.9% | | | | | | | | |
| AbbVie, Inc. | | | 228,969 | | | | 45,216,798 | |
| Bausch Health Cos, Inc. * † | | | 354,879 | | | | 2,895,813 | |
| Bristol-Myers Squibb Co. | | | 685,893 | | | | 35,488,104 | |
| Catalent, Inc. * | | | 128,633 | | | | 7,791,301 | |
| Cencora, Inc. | | | 141,087 | | | | 31,755,862 | |
| Elanco Animal Health, Inc. * | | | 319,406 | | | | 4,692,074 | |
| Eli Lilly & Co. | | | 105,173 | | | | 93,176,968 | |
| | | Number
of Shares | | | Value | |
| United States (continued) | | | | | | | | |
| Jazz Pharmaceuticals Plc * | | | 62,247 | | | $ | 6,934,938 | |
| Johnson & Johnson | | | 293,021 | | | | 47,486,983 | |
| McKesson Corp. | | | 65,290 | | | | 32,280,682 | |
| Merck & Co., Inc. | | | 328,584 | | | | 37,313,999 | |
| Organon & Co. | | | 249,548 | | | | 4,773,853 | |
| Patterson Companies, Inc. † | | | 75,180 | | | | 1,641,931 | |
| Perrigo Co. Plc | | | 121,639 | | | | 3,190,591 | |
| Pfizer, Inc. | | | 1,123,652 | | | | 32,518,489 | |
| Viatris, Inc. | | | 1,156,783 | | | | 13,430,251 | |
| Zoetis, Inc. | | | 175,417 | | | | 34,272,973 | |
| | | | | | | | 434,861,610 | |
Total Common Stocks
(Cost: $715,294,290) | | | | | | | 724,976,793 | |
| | | | | | | | | |
| SHORT-TERM INVESTMENT HELD AS COLLATERAL FOR SECURITIES ON LOAN: 5.1% | | | | | | | |
Money Market Fund: 5.1%
(Cost: $37,156,818) | | | | | | | | |
| State Street Navigator Securities Lending Government Money Market Portfolio | | | 37,156,818 | | | | 37,156,818 | |
Total Investments: 104.9%
(Cost: $752,451,108) | | | | | | | 762,133,611 | |
| Liabilities in excess of other assets: (4.9)% | | | | | | | (35,603,093) | |
| NET ASSETS: 100.0% | | | | | | $ | 726,530,518 | |
| Definitions: |
| ADR | American Depositary Receipt |
| | |
| Footnotes: |
| * | Non-income producing |
| † | Security fully or partially on loan. Total market value of securities on loan is $99,136,053. |
| | |
| The summary of inputs used to value the Fund’s investments as of September 30, 2024 is as follows: |
| | | Level 1
Quoted
Prices | | | Level 2
Significant
Observable
Inputs | | | Level 3
Significant
Unobservable
Inputs | | | Value | |
| Common Stocks * | | $ | 724,976,793 | | | $ | — | | | $ | — | | | $ | 724,976,793 | |
| Money Market Fund | | | 37,156,818 | | | | — | | | | — | | | | 37,156,818 | |
| Total Investments | | $ | 762,133,611 | | | $ | — | | | $ | — | | | $ | 762,133,611 | |
| * | See Schedule of Investments for geographic sectors. |
See Notes to Financial Statements
VANECK RETAIL ETF
SCHEDULE OF INVESTMENTS
September 30, 2024
| | | Number
of Shares | | | Value | |
| COMMON STOCKS: 100.1% | | | | | | | | |
| China: 4.9% | | | | | | | | |
| JD.com, Inc. (ADR) | | | 269,565 | | | $ | 10,782,600 | |
| United States: 95.2% | | | | | | | | |
| Amazon.com, Inc. * | | | 231,191 | | | | 43,077,819 | |
| AutoZone, Inc. * | | | 2,368 | | | | 7,459,295 | |
| Bath & Body Works, Inc. | | | 26,726 | | | | 853,094 | |
| Best Buy Co., Inc. | | | 25,514 | | | | 2,635,596 | |
| Cardinal Health, Inc. | | | 31,996 | | | | 3,536,198 | |
| Cencora, Inc. | | | 23,908 | | | | 5,381,213 | |
| Costco Wholesale Corp. | | | 21,143 | | | | 18,743,692 | |
| CVS Health Corp. | | | 171,064 | | | | 10,756,504 | |
| Dollar General Corp. | | | 22,353 | | | | 1,890,393 | |
| Dollar Tree, Inc. * | | | 23,840 | | | | 1,676,429 | |
| Lowe’s Companies, Inc. | | | 43,111 | | | | 11,676,614 | |
| Lululemon Athletica, Inc. * | | | 15,004 | | | | 4,071,335 | |
| McKesson Corp. | | | 18,804 | | | | 9,297,074 | |
| | | Number
of Shares | | | Value | |
| United States (continued) | | | | | | | | |
| O’Reilly Automotive, Inc. * | | | 8,627 | | | $ | 9,934,853 | |
| Ross Stores, Inc. | | | 46,853 | | | | 7,051,845 | |
| Sysco Corp. | | | 76,304 | | | | 5,956,290 | |
| Target Corp. | | | 59,596 | | | | 9,288,633 | |
| The Home Depot, Inc. | | | 43,987 | | | | 17,823,532 | |
| The Kroger Co. | | | 98,712 | | | | 5,656,198 | |
| The TJX Companies, Inc. | | | 81,446 | | | | 9,573,163 | |
| Tractor Supply Co. | | | 13,755 | | | | 4,001,742 | |
| Ulta Beauty, Inc. * | | | 6,792 | | | | 2,642,903 | |
| Walgreens Boots Alliance, Inc. † | | | 105,298 | | | | 943,470 | |
| Walmart, Inc. | | | 228,186 | | | | 18,426,020 | |
| | | | | | | | 212,353,905 | |
Total Common Stocks
(Cost: $200,026,882) | | | | | | | 223,136,505 | |
Total Investments: 100.1%
(Cost: $200,026,882) | | | | | | | 223,136,505 | |
| Liabilities in excess of other assets: (0.1)% | | | | | | | (155,990) | |
| NET ASSETS: 100.0% | | | | | | $ | 222,980,515 | |
| Definitions: |
| ADR | American Depositary Receipt |
| |
| Footnotes: |
| * | Non-income producing |
| † | Security fully or partially on loan. Total market value of securities on loan is $779,117. |
| | |
| The summary of inputs used to value the Fund’s investments as of September 30, 2024 is as follows: |
| | | Level 1
Quoted
Prices | | | Level 2
Significant
Observable
Inputs | | | Level 3
Significant
Unobservable
Inputs | | | Value | |
| Common Stocks * | | $ | 223,136,505 | | | $ | — | | | $ | — | | | $ | 223,136,505 | |
| * | See Schedule of Investments for geographic sectors. |
See Notes to Financial Statements
VANECK ROBOTICS ETF
SCHEDULE OF INVESTMENTS
September 30, 2024
| | | Number
of Shares | | | Value | |
| COMMON STOCKS: 99.8% | | | | | | | | |
| Austria: 1.1% | | | | | | | | |
| Andritz AG | | | 2,520 | | | $ | 179,039 | |
| Canada: 0.8% | | | | | | | | |
| ATS Corp. (USD) * | | | 4,230 | | | | 122,882 | |
| Finland: 1.3% | | | | | | | | |
| Konecranes Oyj | | | 2,636 | | | | 198,565 | |
| France: 4.3% | | | | | | | | |
| Dassault Systemes SE | | | 16,914 | | | | 673,588 | |
| Germany: 7.7% | | | | | | | | |
| Duerr AG | | | 5,267 | | | | 129,726 | |
| Jenoptik AG * | | | 3,143 | | | | 97,268 | |
| Krones AG | | | 1,000 | | | | 144,305 | |
| Siemens AG | | | 4,178 | | | | 847,445 | |
| | | | | | | | 1,218,744 | |
| Israel: 0.7% | | | | | | | | |
| Nova Ltd. (USD) * | | | 538 | | | | 112,087 | |
| Japan: 20.6% | | | | | | | | |
| Amada Co. Ltd. | | | 13,400 | | | | 137,465 | |
| Azbil Corp. | | | 20,400 | | | | 166,602 | |
| Daifuku Co. Ltd. | | | 9,000 | | | | 175,055 | |
| Daihen Corp. | | | 2,400 | | | | 110,766 | |
| Denso Corp. | | | 27,900 | | | | 421,384 | |
| FANUC Corp. | | | 10,900 | | | | 321,671 | |
| Fuji Corp. | | | 8,100 | | | | 130,748 | |
| Keyence Corp. | | | 1,800 | | | | 866,802 | |
| Lasertec Corp. | | | 500 | | | | 83,763 | |
| Omron Corp. | | | 5,200 | | | | 238,881 | |
| Optex Group Co. Ltd. | | | 6,800 | | | | 74,406 | |
| Renesas Electronics Corp. | | | 8,000 | | | | 116,657 | |
| Tokyo Electron Ltd. | | | 900 | | | | 161,271 | |
| Towa Corp. † | | | 5,100 | | | | 79,047 | |
| Yaskawa Electric Corp. | | | 4,500 | | | | 158,283 | |
| | | | | | | | 3,242,801 | |
| Netherlands: 4.0% | | | | | | | | |
| ASML Holding N.V. (USD) | | | 753 | | | | 627,437 | |
| Norway: 0.6% | | | | | | | | |
| AutoStore Holdings Ltd. 144A * | | | 92,325 | | | | 94,148 | |
| Sweden: 3.5% | | | | | | | | |
| Hexagon AB | | | 40,794 | | | | 440,229 | |
| HMS Networks AB | | | 2,912 | | | | 116,127 | |
| | | | | | | | 556,356 | |
| Switzerland: 7.8% | | | | | | | | |
| ABB Ltd. | | | 13,926 | | | | 810,607 | |
| Interroll Holding AG | | | 46 | | | | 140,096 | |
| Kardex Holding AG | | | 482 | | | | 158,155 | |
| STMicroelectronics N.V. (USD) | | | 3,485 | | | | 103,609 | |
| | | | | | | | 1,212,467 | |
| | | Number
of Shares | | | Value | |
| United Kingdom: 1.9% | | | | | | | | |
| Renishaw Plc | | | 2,646 | | | $ | 132,918 | |
| TechnipFMC Plc (USD) | | | 6,512 | | | | 170,810 | |
| | | | | | | | 303,728 | |
| United States: 45.5% | | | | | | | | |
| Altair Engineering, Inc. * | | | 1,358 | | | | 129,703 | |
| Ambarella, Inc. * | | | 1,850 | | | | 104,349 | |
| Analog Devices, Inc. | | | 993 | | | | 228,559 | |
| ANSYS, Inc. * | | | 1,012 | | | | 322,454 | |
| Applied Materials, Inc. | | | 1,249 | | | | 252,360 | |
| Aspen Technology, Inc. * | | | 698 | | | | 166,696 | |
| Autodesk, Inc. * | | | 2,250 | | | | 619,830 | |
| Bentley Systems, Inc. | | | 4,982 | | | | 253,135 | |
| Cognex Corp. | | | 4,303 | | | | 174,272 | |
| Emerson Electric Co. | | | 5,800 | | | | 634,346 | |
| Intuitive Surgical, Inc. * | | | 629 | | | | 309,009 | |
| KLA Corp. | | | 276 | | | | 213,737 | |
| Lam Research Corp. | | | 243 | | | | 198,307 | |
| Lattice Semiconductor Corp. * | | | 2,015 | | | | 106,936 | |
| Lincoln Electric Holdings, Inc. | | | 1,076 | | | | 206,614 | |
| Microchip Technology, Inc. | | | 1,792 | | | | 143,880 | |
| Novanta, Inc. * | | | 963 | | | | 172,300 | |
| NVIDIA Corp. | | | 6,433 | | | | 781,224 | |
| ON Semiconductor Corp. * | | | 1,933 | | | | 140,355 | |
| Onto Innovation, Inc. * | | | 586 | | | | 121,630 | |
| Ouster, Inc. * | | | 7,264 | | | | 45,763 | |
| PTC, Inc. * | | | 2,152 | | | | 388,780 | |
| Rockwell Automation, Inc. | | | 1,333 | | | | 357,857 | |
| Symbotic, Inc. * † | | | 3,497 | | | | 85,292 | |
| TE Connectivity Plc | | | 1,063 | | | | 160,502 | |
| Teledyne Technologies, Inc. * | | | 801 | | | | 350,566 | |
| Teradyne, Inc. | | | 953 | | | | 127,635 | |
| Texas Instruments, Inc. | | | 1,486 | | | | 306,963 | |
| | | | | | | | 7,103,054 | |
Total Common Stocks
(Cost: $14,463,978) | | | | | | | 15,644,896 | |
| | | | | | | | | |
| SHORT-TERM INVESTMENT HELD AS COLLATERAL FOR SECURITIES ON LOAN: 0.2% | | | | | | | | |
Money Market Fund: 0.2%
(Cost: $34,314) | | | | | | | | |
| State Street Navigator Securities Lending Government Money Market Portfolio | | | 34,314 | | | | 34,314 | |
Total Investments: 100.0%
(Cost: $14,498,292) | | | | | | | 15,679,210 | |
| Liabilities in excess of other assets: 0.0% | | | | | | | (251) | |
| NET ASSETS: 100.0% | | | | | | $ | 15,678,959 | |
| |
| Definitions: |
| USD | United States Dollar |
See Notes to Financial Statements
| Footnotes: |
| * | Non-income producing |
| † | Security fully or partially on loan. Total market value of securities on loan is $54,956. |
The summary of inputs used to value the Fund’s investments as of September 30, 2024 is as follows:
| | | Level 1
Quoted
Prices | | | Level 2
Significant
Observable
Inputs | | | Level 3
Significant
Unobservable
Inputs | | | Value | |
| Common Stocks | | | | | | | | | | | | | | | | |
| Austria | | $ | — | | | $ | 179,039 | | | $ | — | | | $ | 179,039 | |
| Canada | | | 122,882 | | | | — | | | | — | | | | 122,882 | |
| Finland | | | — | | | | 198,565 | | | | — | | | | 198,565 | |
| France | | | — | | | | 673,588 | | | | — | | | | 673,588 | |
| Germany | | | — | | | | 1,218,744 | | | | — | | | | 1,218,744 | |
| Israel | | | 112,087 | | | | — | | | | — | | | | 112,087 | |
| Japan | | | — | | | | 3,242,801 | | | | — | | | | 3,242,801 | |
| Netherlands | | | 627,437 | | | | — | | | | — | | | | 627,437 | |
| Norway | | | — | | | | 94,148 | | | | — | | | | 94,148 | |
| Sweden | | | — | | | | 556,356 | | | | — | | | | 556,356 | |
| Switzerland | | | 103,609 | | | | 1,108,858 | | | | — | | | | 1,212,467 | |
| United Kingdom | | | 303,728 | | | | — | | | | — | | | | 303,728 | |
| United States | | | 7,103,054 | | | | — | | | | — | | | | 7,103,054 | |
| Money Market Fund | | | 34,314 | | | | — | | | | — | | | | 34,314 | |
| Total Investments | | $ | 8,407,111 | | | $ | 7,272,099 | | | $ | — | | | $ | 15,679,210 | |
See Notes to Financial Statements
VANECK SEMICONDUCTOR ETF
SCHEDULE OF INVESTMENTS
September 30, 2024
| | | Number
of Shares | | | Value | |
| COMMON STOCKS: 99.9% | | | | | | | | |
| Bermuda: 2.0% | | | | | | | | |
| Marvell Technology, Inc. (USD) | | | 6,656,891 | | | $ | 480,094,979 | |
| Netherlands: 6.9% | | | | | | | | |
| ASML Holding N.V. (USD) | | | 1,410,308 | | | | 1,175,139,141 | |
| NXP Semiconductors NV (USD) | | | 1,929,705 | | | | 463,148,497 | |
| | | | | | | | 1,638,287,638 | |
| Switzerland: 0.9% | | | | | | | | |
| STMicroelectronics N.V. (USD) † | | | 7,303,536 | | | | 217,134,125 | |
| Taiwan: 12.0% | | | | | | | | |
| Taiwan Semiconductor Manufacturing Co. Ltd. (ADR) | | | 16,443,950 | | | | 2,855,820,797 | |
| United States: 78.1% | | | | | | | | |
| Advanced Micro Devices, Inc. * | | | 7,529,975 | | | | 1,235,518,298 | |
| Analog Devices, Inc. | | | 4,197,197 | | | | 966,068,833 | |
| Applied Materials, Inc. | | | 5,461,989 | | | | 1,103,594,877 | |
| Broadcom, Inc. | | | 10,832,855 | | | | 1,868,667,488 | |
| Cadence Design Systems, Inc. * | | | 2,404,981 | | | | 651,822,000 | |
| Intel Corp. | | | 38,964,696 | | | | 914,111,768 | |
| KLA Corp. | | | 1,210,173 | | | | 937,170,073 | |
| Lam Research Corp. | | | 1,169,223 | | | | 954,179,506 | |
| Microchip Technology, Inc. | | | 4,653,246 | | | | 373,609,121 | |
| | | Number
of Shares | | | Value | |
| United States (continued) | | | | | | | | |
| Micron Technology, Inc. | | | 9,373,793 | | | $ | 972,156,072 | |
| Monolithic Power Systems, Inc. | | | 390,721 | | | | 361,221,565 | |
| NVIDIA Corp. | | | 38,608,908 | | | | 4,688,665,788 | |
| ON Semiconductor Corp. * | | | 3,103,869 | | | | 225,371,928 | |
| Qorvo, Inc. * | | | 812,335 | | | | 83,914,205 | |
| Qualcomm, Inc. | | | 6,097,502 | | | | 1,036,880,215 | |
| Skyworks Solutions, Inc. | | | 1,385,264 | | | | 136,822,525 | |
| Synopsys, Inc. * | | | 1,399,784 | | | | 708,836,620 | |
| Teradyne, Inc. | | | 1,289,906 | | | | 172,757,111 | |
| Texas Instruments, Inc. | | | 5,017,533 | | | | 1,036,471,792 | |
| Universal Display Corp. | | | 427,192 | | | | 89,667,601 | |
| | | | | | | | 18,517,507,386 | |
Total Common Stocks
(Cost: $24,069,481,201) | | | | | | | 23,708,844,925 | |
| | | | | | | | | |
| SHORT-TERM INVESTMENT HELD AS COLLATERAL FOR SECURITIES ON LOAN: 0.1% | | |
Money Market Fund: 0.1%
(Cost: $24,835,082) | | | | | | | | |
| State Street Navigator Securities Lending Government Money Market Portfolio | | | 24,835,082 | | | | 24,835,082 | |
Total Investments: 100.0%
(Cost: $24,094,316,283) | | | | | | | 23,733,680,007 | |
| Liabilities in excess of other assets: 0.0% | | | | | | | (7,335,697) | |
| NET ASSETS: 100.0% | | | | | | $ | 23,726,344,310 | |
| Definitions: |
| ADR | American Depositary Receipt |
| USD | United States Dollar |
| Footnotes: |
| † | Security fully or partially on loan. Total market value of securities on loan is $51,001,815. |
| * | Non-income producing |
The summary of inputs used to value the Fund’s investments as of September 30, 2024 is as follows:
| | | Level 1
Quoted
Prices | | | Level 2
Significant
Observable
Inputs | | | Level 3
Significant
Unobservable
Inputs | | | Value | |
| Common Stocks * | | $ | 23,708,844,925 | | | $ | — | | | $ | — | | | $ | 23,708,844,925 | |
| Money Market Fund | | | 24,835,082 | | | | — | | | | — | | | | 24,835,082 | |
| Total Investments | | $ | 23,733,680,007 | | | $ | — | | | $ | — | | | $ | 23,733,680,007 | |
| * | See Schedule of Investments for geographic sectors. |
See Notes to Financial Statements
VANECK VIDEO GAMING AND ESPORTS ETF
SCHEDULE OF INVESTMENTS
September 30, 2024
| | | Number
of Shares | | | Value | |
| COMMON STOCKS: 99.9% | | | | | | | | |
| Australia: 4.6% | | | | | | | | |
| Aristocrat Leisure Ltd. | | | 297,630 | | | $ | 12,058,386 | |
| China: 17.6% | | | | | | | | |
| Kingsoft Corp. Ltd. (HKD) | | | 1,408,400 | | | | 5,282,366 | |
| NetEase, Inc. (ADR) | | | 199,426 | | | | 18,648,325 | |
| Tencent Holdings Ltd. (HKD) | | | 404,200 | | | | 22,493,850 | |
| | | | | | | | 46,424,541 | |
| France: 0.8% | | | | | | | | |
| Ubisoft Entertainment SA * † | | | 181,270 | | | | 2,040,510 | |
| Ireland: 1.5% | | | | | | | | |
| Keywords Studios Plc (GBP) | | | 121,208 | | | | 3,960,504 | |
| Japan: 24.2% | | | | | | | | |
| Bandai Namco Holdings, Inc. | | | 481,300 | | | | 11,034,978 | |
| Capcom Co. Ltd. | | | 474,800 | | | | 11,127,332 | |
| Konami Group Corp. | | | 111,700 | | | | 11,445,542 | |
| Nexon Co. Ltd. | | | 427,500 | | | | 8,535,920 | |
| Nintendo Co. Ltd. | | | 314,900 | | | | 16,912,439 | |
| Square Enix Holdings Co. Ltd. | | | 119,900 | | | | 4,782,554 | |
| | | | | | | | 63,838,765 | |
| Poland: 2.3% | | | | | | | | |
| CD Projekt SA | | | 131,647 | | | | 5,976,598 | |
| South Korea: 6.6% | | | | | | | | |
| Krafton, Inc. * | | | 44,468 | | | | 11,568,009 | |
| NCSoft Corp. | | | 26,448 | | | | 3,847,404 | |
| Pearl Abyss Corp. * | | | 71,353 | | | | 2,095,543 | |
| | | | | | | | 17,510,956 | |
| Sweden: 1.5% | | | | | | | | |
| Embracer Group AB * † | | | 1,561,238 | | | | 4,063,219 | |
| | | Number
of Shares | | | Value | |
| Taiwan: 2.9% | | | | | | | | |
| Micro-Star International Co. Ltd. | | | 1,399,000 | | | $ | 7,648,029 | |
| United States: 37.9% | | | | | | | | |
| Advanced Micro Devices, Inc. * | | | 128,030 | | | | 21,007,162 | |
| AppLovin Corp. * | | | 122,903 | | | | 16,044,987 | |
| Electronic Arts, Inc. | | | 100,139 | | | | 14,363,938 | |
| GameStop Corp. * | | | 522,892 | | | | 11,989,913 | |
| Roblox Corp. * | | | 293,195 | | | | 12,976,811 | |
| Take-Two Interactive Software, Inc. * † | | | 70,845 | | | | 10,889,585 | |
| Unity Software, Inc. * † | | | 567,742 | | | | 12,842,324 | |
| | | | | | | | 100,114,720 | |
Total Common Stocks
(Cost: $242,145,830) | | | | | | | 263,636,228 | |
| | | | | | | | | |
| SHORT-TERM INVESTMENT HELD AS COLLATERAL FOR SECURITIES ON LOAN: 0.3% | | | | | | | | |
Money Market Fund: 0.3%
(Cost: $678,608) | | | | | | | | |
| State Street Navigator Securities Lending Government Money Market Portfolio | | | 678,608 | | | | 678,608 | |
Total Investments: 100.2%
(Cost: $242,824,438) | | | | | | | 264,314,836 | |
| Liabilities in excess of other assets: (0.2)% | | | | | | | (535,537) | |
| NET ASSETS: 100.0% | | | | | | $ | 263,779,299 | |
| Definitions: |
| ADR | American Depositary Receipt |
| GBP | British Pound |
| HKD | Hong Kong Dollar |
| Footnotes: |
| † | Security fully or partially on loan. Total market value of securities on loan is $16,994,429. |
| * | Non-income producing |
See Notes to Financial Statements
VANECK VIDEO GAMING AND ESPORTS ETF
SCHEDULE OF INVESTMENTS
(continued)
The summary of inputs used to value the Fund’s investments as of September 30, 2024 is as follows:
| | | Level 1
Quoted
Prices | | | Level 2
Significant
Observable
Inputs | | | Level 3
Significant
Unobservable
Inputs | | | Value | |
| Common Stocks | | | | | | | | | | | | | | | | |
| Australia | | $ | — | | | $ | 12,058,386 | | | $ | — | | | $ | 12,058,386 | |
| China | | | 18,648,325 | | | | 27,776,216 | | | | — | | | | 46,424,541 | |
| France | | | — | | | | 2,040,510 | | | | — | | | | 2,040,510 | |
| Ireland | | | 3,960,504 | | | | — | | | | — | | | | 3,960,504 | |
| Japan | | | — | | | | 63,838,765 | | | | — | | | | 63,838,765 | |
| Poland | | | — | | | | 5,976,598 | | | | — | | | | 5,976,598 | |
| South Korea | | | — | | | | 17,510,956 | | | | — | | | | 17,510,956 | |
| Sweden | | | — | | | | 4,063,219 | | | | — | | | | 4,063,219 | |
| Taiwan | | | — | | | | 7,648,029 | | | | — | | | | 7,648,029 | |
| United States | | | 100,114,720 | | | | — | | | | — | | | | 100,114,720 | |
| Money Market Fund | | | 678,608 | | | | — | | | | — | | | | 678,608 | |
| Total Investments | | $ | 123,402,157 | | | $ | 140,912,679 | | | $ | — | | | $ | 264,314,836 | |
See Notes to Financial Statements
VANECK ETF TRUST
STATEMENTS OF ASSETS AND LIABILITIES
September 30, 2024
| | | Biotech ETF | | | Digital
Transformation
ETF | | | Energy Income
ETF | | | Environmental
Services ETF | |
| Assets: | | | | | | | | | | | | |
| Investments, at value (1) | | | | | | | | | | | | | | | | |
| Unaffiliated issuers (2) | | $ | 451,662,703 | | | $ | 134,642,319 | | | $ | 56,463,664 | | | $ | 79,403,089 | |
| Short-term investments held as collateral for securities loaned (3) | | | — | | | | 15,879,709 | | | | — | | | | 1,894,108 | |
| Cash | | | 480,963 | | | | 100,747 | | | | 134 | | | | 60,259 | |
| Cash denominated in foreign currency, at value (4) | | | — | | | | 120 | | | | 25,910 | | | | — | |
| Receivables: | | | | | | | | | | | | | | | | |
| Dividends and interest | | | 42,795 | | | | 75,395 | | | | 98,097 | | | | 56,131 | |
| Federal and State income taxes | | | — | | | | — | | | | 18,570 | | | | — | |
| Prepaid expenses | | | — | | | | — | | | | — | | | | 1,987 | |
| Total assets | | | 452,186,461 | | | | 150,698,290 | | | | 56,606,375 | | | | 81,415,574 | |
| Liabilities: | | | | | | | | | | | | | | | | |
| Payables: | | | | | | | | | | | | | | | | |
| Collateral for securities loaned | | | — | | | | 15,879,709 | | | | — | | | | 1,894,108 | |
| Line of credit | | | — | | | | — | | | | 128,872 | | | | — | |
| Due to Adviser | | | 130,922 | | | | 47,574 | | | | 20,760 | | | | 33,181 | |
| Deferred Trustee fees | | | 64,926 | | | | — | | | | — | | | | 4,968 | |
| Accrued expenses | | | 273 | | | | 318 | | | | 262 | | | | 55,544 | |
| Total liabilities | | | 196,121 | | | | 15,927,601 | | | | 149,894 | | | | 1,987,801 | |
| NET ASSETS | | $ | 451,990,340 | | | $ | 134,770,689 | | | $ | 56,456,481 | | | $ | 79,427,773 | |
| Shares outstanding | | | 2,546,503 | | | | 11,400,000 | | | | 664,720 | | | | 440,000 | |
| Net asset value, redemption and offering price per share | | $ | 177.49 | | | $ | 11.82 | | | $ | 84.93 | | | $ | 180.52 | |
| Net Assets consist of: | | | | | | | | | | | | | | | | |
| Aggregate paid in capital | | $ | 669,683,416 | | | $ | 172,475,323 | | | $ | 48,064,749 | | | $ | 96,346,154 | |
| Total distributable earnings (loss) | | | (217,693,076 | ) | | | (37,704,634 | ) | | | 8,391,732 | | | | (16,918,381 | ) |
| NET ASSETS | | $ | 451,990,340 | | | $ | 134,770,689 | | | $ | 56,456,481 | | | $ | 79,427,773 | |
| (1) Value of securities on loan | | $ | 23,574,085 | | | $ | 36,730,000 | | | $ | — | | | $ | 4,526,590 | |
| (2) Cost of investments - Unaffiliated issuers | | $ | 428,238,352 | | | $ | 105,828,491 | | | $ | 49,415,750 | | | $ | 69,913,900 | |
| (3) Cost of short-term investments held as collateral for securities loaned | | $ | — | | | $ | 15,879,709 | | | $ | — | | | $ | 1,894,108 | |
| (4) Cost of cash denominated in foreign currency | | $ | — | | | $ | 120 | | | $ | 25,967 | | | $ | — | |
See Notes to Financial Statements
VANECK ETF TRUST
STATEMENTS OF ASSETS AND LIABILITIES
September 30, 2024
| | | Fabless
Semiconductor
ETF | | | Gaming ETF | | | Green
Infrastructure
ETF | | | Pharmaceutical
ETF | |
| Assets: | | | | | | | | | | | | |
| Investments, at value (1) | | | | | | | | | | | | | | | | |
| Unaffiliated issuers (2) | | $ | 6,412,337 | | | $ | 38,228,323 | | | $ | 1,897,443 | | | $ | 724,976,793 | |
| Short-term investments held as collateral for securities loaned (3) | | | — | | | | — | | | | 33,105 | | | | 37,156,818 | |
| Cash | | | — | | | | — | | | | 2,768 | | | | 440,517 | |
| Cash denominated in foreign currency, at value (4) | | | — | | | | 863 | | | | — | | | | — | |
| Receivables: | | | | | | | | | | | | | | | | |
| Investment securities sold | | | 7,590 | | | | — | | | | — | | | | — | |
| Shares of beneficial interest sold | | | 1,283,327 | | | | — | | | | — | | | | 4,755,868 | |
| Dividends and interest | | | 388 | | | | 104,133 | | | | 733 | | | | 1,360,904 | |
| Prepaid expenses | | | — | | | | 771 | | | | — | | | | — | |
| Total assets | | | 7,703,642 | | | | 38,334,090 | | | | 1,934,049 | | | | 768,690,900 | |
| Liabilities: | | | | | | | | | | | | | | | | |
| Payables: | | | | | | | | | | | | | | | | |
| Investment securities purchased | | | 1,283,683 | | | | — | | | | — | | | | 4,755,985 | |
| Collateral for securities loaned | | | — | | | | — | | | | 33,105 | | | | 37,156,818 | |
| Due to Adviser | | | 1,171 | | | | 16,644 | | | | 691 | | | | 208,330 | |
| Due to custodian | | | 2,158 | | | | 48,353 | | | | — | | | | — | |
| Deferred Trustee fees | | | — | | | | 11,639 | | | | — | | | | 36,037 | |
| Accrued expenses | | | — | | | | 66,288 | | | | — | | | | 3,212 | |
| Total liabilities | | | 1,287,012 | | | | 142,924 | | | | 33,796 | | | | 42,160,382 | |
| NET ASSETS | | $ | 6,416,630 | | | $ | 38,191,166 | | | $ | 1,900,253 | | | $ | 726,530,518 | |
| Shares outstanding | | | 250,000 | | | | 850,000 | | | | 75,000 | | | | 7,638,138 | |
| Net asset value, redemption and offering price per share | | $ | 25.67 | | | $ | 44.93 | | | $ | 25.34 | | | $ | 95.12 | |
| Net Assets consist of: | | | | | | | | | | | | | | | | |
| Aggregate paid in capital | | $ | 5,968,788 | | | $ | 72,549,953 | | | $ | 2,166,396 | | | $ | 879,033,393 | |
| Total distributable earnings (loss) | | | 447,842 | | | | (34,358,787 | ) | | | (266,143 | ) | | | (152,502,875 | ) |
| NET ASSETS | | $ | 6,416,630 | | | $ | 38,191,166 | | | $ | 1,900,253 | | | $ | 726,530,518 | |
| (1) Value of securities on loan | | $ | — | | | $ | 1,056,430 | | | $ | 132,973 | | | $ | 99,136,053 | |
| (2) Cost of investments - Unaffiliated issuers | | $ | 5,942,341 | | | $ | 45,520,822 | | | $ | 1,911,927 | | | $ | 715,294,290 | |
| (3) Cost of short-term investments held as collateral for securities loaned | | $ | — | | | $ | — | | | $ | 33,105 | | | $ | 37,156,818 | |
| (4) Cost of cash denominated in foreign currency | | $ | — | | | $ | 861 | | | $ | — | | | $ | — | |
See Notes to Financial Statements
VANECK ETF TRUST
STATEMENTS OF ASSETS AND LIABILITIES
September 30, 2024
| | | Retail ETF | | | Robotics ETF | | | Semiconductor
ETF | | | Video Gaming
and eSports ETF | |
| Assets: | | | | | | | | | | | | | | | | |
| Investments, at value (1) | | | | | | | | | | | | | | | | |
| Unaffiliated issuers (2) | | $ | 223,136,505 | | | $ | 15,644,896 | | | $ | 23,708,844,925 | | | $ | 263,636,228 | |
| Short-term investments held as collateral for securities loaned (3) | | | — | | | | 34,314 | | | | 24,835,082 | | | | 678,608 | |
| Cash | | | 624 | | | | — | | | | 9,354,090 | | | | 53,073 | |
| Cash denominated in foreign currency, at value (4) | | | — | | | | 21,877 | | | | — | | | | 23 | |
| Receivables: | | | | | | | | | | | | | | | | |
| Investment securities sold | | | — | | | | — | | | | 184,035,488 | | | | 26 | |
| Shares of beneficial interest sold | | | — | | | | — | | | | 24,538,087 | | | | — | |
| Dividends and interest | | | 33,120 | | | | 26,704 | | | | 14,684,697 | | | | 291,507 | |
| Prepaid expenses | | | — | | | | — | | | | — | | | | 2,917 | |
| Total assets | | | 223,170,249 | | | | 15,727,791 | | | | 23,966,292,369 | | | | 264,662,382 | |
| Liabilities: | | | | | | | | | | | | | | | | |
| Payables: | | | | | | | | | | | | | | | | |
| Investment securities purchased | | | — | | | | — | | | | 24,538,065 | | | | — | |
| Shares of beneficial interest redeemed | | | — | | | | — | | | | 184,035,653 | | | | — | |
| Collateral for securities loaned | | | — | | | | 34,314 | | | | 24,835,082 | | | | 678,608 | |
| Line of credit | | | 117,121 | | | | — | | | | — | | | | — | |
| Due to Adviser | | | 62,189 | | | | 5,640 | | | | 6,433,836 | | | | 110,563 | |
| Due to custodian | | | — | | | | 8,878 | | | | — | | | | — | |
| Deferred Trustee fees | | | 10,259 | | | | — | | | | 97,455 | | | | 15,169 | |
| Accrued expenses | | | 165 | | | | — | | | | 7,968 | | | | 78,743 | |
| Total liabilities | | | 189,734 | | | | 48,832 | | | | 239,948,059 | | | | 883,083 | |
| NET ASSETS | | $ | 222,980,515 | | | $ | 15,678,959 | | | $ | 23,726,344,310 | | | $ | 263,779,299 | |
| Shares outstanding | | | 1,021,531 | | | | 350,000 | | | | 96,691,874 | | | | 3,450,000 | |
| Net asset value, redemption and offering price per share | | $ | 218.28 | | | $ | 44.80 | | | $ | 245.38 | | | $ | 76.46 | |
| Net Assets consist of: | | | | | | | | | | | | | | | | |
| Aggregate paid in capital | | $ | 230,570,049 | | | $ | 14,164,430 | | | $ | 25,216,609,547 | | | $ | 313,778,160 | |
| Total distributable earnings (loss) | | | (7,589,534 | ) | | | 1,514,529 | | | | (1,490,265,237 | ) | | | (49,998,861 | ) |
| NET ASSETS | | $ | 222,980,515 | | | $ | 15,678,959 | | | $ | 23,726,344,310 | | | $ | 263,779,299 | |
| (1) Value of securities on loan | | $ | 779,117 | | | $ | 54,956 | | | $ | 51,001,815 | | | $ | 16,994,429 | |
| (2) Cost of investments - Unaffiliated issuers | | $ | 200,026,882 | | | $ | 14,463,978 | | | $ | 24,069,481,201 | | | $ | 242,145,830 | |
| (3) Cost of short-term investments held as collateral for securities loaned | | $ | — | | | $ | 34,314 | | | $ | 24,835,082 | | | $ | 678,608 | |
| (4) Cost of cash denominated in foreign currency | | $ | — | | | $ | 21,196 | | | $ | — | | | $ | 23 | |
See Notes to Financial Statements
VANECK ETF TRUST
STATEMENTS OF OPERATIONS
For the Year Ended September 30, 2024
| | | Biotech ETF | | | Digital
Transformation
ETF | | | Energy Income
ETF | | | Environmental
Services ETF | |
| Income: | | | | | | | | | | | | |
| Dividends | | $ | 4,013,924 | | | $ | 6,811 | | | $ | 1,511,710 | | | $ | 621,604 | |
| Interest | | | 23,470 | | | | 2,360 | | | | 543 | | | | 4,146 | |
| Securities lending income | | | 16,048 | | | | 1,329,264 | | | | — | | | | 194,172 | |
| Net foreign taxes reclaimed/(withheld) | | | 32,688 | | | | (1,596 | ) | | | (116,690 | ) | | | (8,991 | ) |
| Total income | | | 4,086,130 | | | | 1,336,839 | | | | 1,395,563 | | | | 810,931 | |
| Expenses: | | | | | | | | | | | | | | | | |
| Management fees | | | 1,572,343 | | | | 470,200 | | | | 201,186 | | | | 376,348 | |
| Professional fees | | | — | | | | — | | | | — | | | | 40,569 | |
| Custody and accounting fees | | | — | | | | — | | | | — | | | | 24,777 | |
| Reports to shareholders | | | — | | | | — | | | | — | | | | 13,010 | |
| Trustees’ fees and expenses | | | — | | | | — | | | | — | | | | 1,440 | |
| Registration fees | | | — | | | | — | | | | — | | | | 7,344 | |
| Insurance | | | — | | | | — | | | | — | | | | 3,400 | |
| Interest | | | 3,456 | | | | 7,251 | | | | 8,833 | | | | 2,372 | |
| Taxes | | | 275 | | | | 416 | | | | 630 | | | | 504 | |
| Other | | | — | | | | — | | | | — | | | | 625 | |
| Total expenses | | | 1,576,074 | | | | 477,867 | | | | 210,649 | | | | 470,389 | |
| Expenses assumed by the Adviser | | | — | | | | — | | | | — | | | | (53,531 | ) |
| Net expenses | | | 1,576,074 | | | | 477,867 | | | | 210,649 | | | | 416,858 | |
| Net investment income | | | 2,510,056 | | | | 858,972 | | | | 1,184,914 | | | | 394,073 | |
| | | | | | | | | | | | | | | | | |
| Net realized gain (loss) on: | | | | | | | | | | | | | | | | |
| Investments | | | (34,409,194 | ) | | | 6,513,736 | | | | 1,262,535 | | | | (6,391,521 | ) |
| In-kind redemptions | | | 51,357,477 | | | | 19,959,969 | | | | 5,484,467 | | | | 12,268,236 | |
| Foreign currency transactions and foreign denominated assets and liabilities | | | — | | | | 3,597 | | | | (1,814 | ) | | | (145 | ) |
| Net realized gain | | | 16,948,283 | | | | 26,477,302 | | | | 6,745,188 | | | | 5,876,570 | |
| | | | | | | | | | | | | | | | | |
| Net change in unrealized appreciation (depreciation) on: | | | | | | | | | | | | | | | | |
| Investments | | | 42,382,577 | | | | 32,834,853 | | | | 5,707,752 | | | | 11,859,242 | |
| Foreign currency translations and foreign denominated assets and liabilities | | | — | | | | 37 | | | | 292 | | | | — | |
| Net change in unrealized appreciation (depreciation) | | | 42,382,577 | | | | 32,834,890 | | | | 5,708,044 | | | | 11,859,242 | |
| Net increase in net assets resulting from operations | | $ | 61,840,916 | | | $ | 60,171,164 | | | $ | 13,638,146 | | | $ | 18,129,885 | |
See Notes to Financial Statements
VANECK ETF TRUST
STATEMENTS OF OPERATIONS
For the Year Ended September 30, 2024
| | | Fabless
Semiconductor
ETF(a) | | | Gaming ETF | | | Green
Infrastructure
ETF | | | Pharmaceutical
ETF | |
| Income: | | | | | | | | | | | | |
| Dividends | | $ | 3,432 | | | $ | 910,895 | | | $ | 15,531 | | | $ | 12,584,461 | |
| Interest | | | — | | | | 2,464 | | | | 65 | | | | 3,797 | |
| Securities lending income | | | — | | | | 6,526 | | | | 7,960 | | | | 203,590 | |
| Net foreign taxes reclaimed/(withheld) | | | — | | | | (37,457 | ) | | | (332 | ) | | | (466,810 | ) |
| Total income | | | 3,432 | | | | 882,428 | | | | 23,224 | | | | 12,325,038 | |
| Expenses: | | | | | | | | | | | | | | | | |
| Management fees | | | 1,171 | | | | 209,873 | | | | 7,988 | | | | 1,860,347 | |
| Professional fees | | | — | | | | 46,354 | | | | — | | | | — | |
| Custody and accounting fees | | | — | | | | 36,857 | | | | — | | | | — | |
| Reports to shareholders | | | — | | | | 14,916 | | | | — | | | | — | |
| Trustees’ fees and expenses | | | — | | | | 1,749 | | | | — | | | | — | |
| Registration fees | | | — | | | | 4,003 | | | | — | | | | — | |
| Insurance | | | — | | | | 3,179 | | | | — | | | | — | |
| Interest | | | — | | | | 7,535 | | | | — | | | | 63,389 | |
| Taxes | | | — | | | | 504 | | | | 268 | | | | 480 | |
| Other | | | — | | | | 4,397 | | | | — | | | | — | |
| Total expenses | | | 1,171 | | | | 329,367 | | | | 8,256 | | | | 1,924,216 | |
| Expenses assumed by the Adviser | | | — | | | | (48,494 | ) | | | — | | | | — | |
| Net expenses | | | 1,171 | | | | 280,873 | | | | 8,256 | | | | 1,924,216 | |
| Net investment income | | | 2,261 | | | | 601,555 | | | | 14,968 | | | | 10,400,822 | |
| | | | | | | | | | | | | | | | | |
| Net realized gain (loss) on: | | | | | | | | | | | | | | | | |
| Investments | | | (24,415 | ) | | | (871,842 | ) | | | (212,875 | ) | | | (18,334,655 | ) |
| In-kind redemptions | | | 49,876 | | | | (1,639,268 | ) | | | 213,640 | | | | 59,120,060 | |
| Foreign currency transactions and foreign denominated assets and liabilities | | | — | | | | (37,290 | ) | | | — | | | | — | |
| Net realized gain (loss) | | | 25,461 | | | | (2,548,400 | ) | | | 765 | | | | 40,785,405 | |
| | | | | | | | | | | | | | | | | |
| Net change in unrealized appreciation (depreciation) on: | | | | | | | | | | | | | | | | |
| Investments | | | 469,996 | | | | 7,166,747 | | | | 113,790 | | | | 42,663,264 | |
| Foreign currency translations and foreign denominated assets and liabilities | | | — | | | | 37,589 | | | | — | | | | — | |
| Net change in unrealized appreciation (depreciation) | | | 469,996 | | | | 7,204,336 | | | | 113,790 | | | | 42,663,264 | |
| Net increase in net assets resulting from operations | | $ | 497,718 | | | $ | 5,257,491 | | | $ | 129,523 | | | $ | 93,849,491 | |
| | |
| (a) | For the period August 28, 2024 (commencement of operations) through September 30, 2024. |
See Notes to Financial Statements
VANECK ETF TRUST
STATEMENTS OF OPERATIONS
For the Year Ended September 30, 2024
| | | Retail ETF | | | Robotics ETF | | | Semiconductor
ETF | | | Video Gaming
and eSports ETF | |
| Income: | | | | | | | | | | | | | | | | |
| Dividends | | $ | 2,774,192 | | | $ | 107,352 | | | $ | 163,479,480 | | | $ | 2,180,931 | |
| Interest | | | 3,809 | | | | 209 | | | | 277,201 | | | | 13,977 | |
| Securities lending income | | | 2,419 | | | | 579 | | | | 75,057 | | | | 104,574 | |
| Net foreign taxes reclaimed/(withheld) | | | — | | | | (9,788 | ) | | | (9,697,974 | ) | | | (159,212 | ) |
| Total income | | | 2,780,420 | | | | 98,352 | | | | 154,133,764 | | | | 2,140,270 | |
| Expenses: | | | | | | | | | | | | | | | | |
| Management fees | | | 672,112 | | | | 39,752 | | | | 59,286,734 | | | | 1,242,139 | |
| Professional fees | | | — | | | | — | | | | — | | | | 51,704 | |
| Custody and accounting fees | | | — | | | | — | | | | — | | | | 50,222 | |
| Reports to shareholders | | | — | | | | — | | | | — | | | | 20,125 | |
| Trustees’ fees and expenses | | | — | | | | — | | | | — | | | | 7,165 | |
| Registration fees | | | — | | | | — | | | | — | | | | 4,003 | |
| Insurance | | | — | | | | — | | | | — | | | | 6,605 | |
| Interest | | | 7,396 | | | | — | | | | 141,665 | | | | 20,324 | |
| Taxes | | | 300 | | | | 235 | | | | 300 | | | | 536 | |
| Other | | | — | | | | — | | | | — | | | | 9,320 | |
| Total expenses | | | 679,808 | | | | 39,987 | | | | 59,428,699 | | | | 1,412,143 | |
| Expenses assumed by the Adviser | | | — | | | | — | | | | — | | | | (24,931 | ) |
| Net expenses | | | 679,808 | | | | 39,987 | | | | 59,428,699 | | | | 1,387,212 | |
| Net investment income | | | 2,100,612 | | | | 58,365 | | | | 94,705,065 | | | | 753,058 | |
| | | | | | | | | | | | | | | | | |
| Net realized gain (loss) on: | | | | | | | | | | | | | | | | |
| Investments | | | (2,796,308 | ) | | | 280,805 | | | | (278,934,082 | ) | | | (7,582,897 | ) |
| In-kind redemptions | | | 15,096,420 | | | | — | | | | 6,764,370,190 | | | | 57,091,749 | |
| Foreign currency transactions and foreign denominated assets and liabilities | | | — | | | | (242 | ) | | | — | | | | (42,487 | ) |
| Net realized gain | | | 12,300,112 | | | | 280,563 | | | | 6,485,436,108 | | | | 49,466,365 | |
| | | | | | | | | | | | | | | | | |
| Net change in unrealized appreciation (depreciation) on: | | | | | | | | | | | | | | | | |
| Investments | | | 35,513,386 | | | | 1,264,085 | | | | 778,943,630 | | | | 49,190,019 | |
| Foreign currency translations and foreign denominated assets and liabilities | | | — | | | | 980 | | | | — | | | | 1,247 | |
| Net change in unrealized appreciation (depreciation) | | | 35,513,386 | | | | 1,265,065 | | | | 778,943,630 | | | | 49,191,266 | |
| Net increase in net assets resulting from operations | | $ | 49,914,110 | | | $ | 1,603,993 | | | $ | 7,359,084,803 | | | $ | 99,410,689 | |
See Notes to Financial Statements
VANECK ETF TRUST
STATEMENTS OF CHANGES IN NET ASSETS
| | | Biotech ETF | | | Digital Transformation ETF | |
| | | Year Ended
September 30,
2024 | | | Year Ended
September 30,
2023 | | | Year Ended
September 30,
2024 | | | Year Ended
September 30,
2023 | |
| Operations: | | | | | | | | | | | | | | | | |
| Net investment income | | $ | 2,510,056 | | | $ | 2,149,005 | | | $ | 858,972 | | | $ | 964,256 | |
| Net realized gain (loss) | | | 16,948,283 | | | | 13,770,875 | | | | 26,477,302 | | | | (28,616,483 | ) |
| Net change in unrealized appreciation (depreciation) | | | 42,382,577 | | | | 29,952,104 | | | | 32,834,890 | | | | 28,753,889 | |
| Net increase in net assets resulting from operations | | | 61,840,916 | | | | 45,871,984 | | | | 60,171,164 | | | | 1,101,662 | |
| Distributions to shareholders from: | | | | | | | | | | | | | | | | |
| Distributable earnings | | | (2,099,973 | ) | | | (2,299,941 | ) | | | — | | | | — | |
| | | | | | | | | | | | | | | | | |
| Share transactions*: | | | | | | | | | | | | | | | | |
| Proceeds from sale of shares | | | 111,263,335 | | | | 146,025,652 | | | | 64,229,694 | | | | 16,892,224 | |
| Cost of shares redeemed | | | (169,993,318 | ) | | | (152,922,723 | ) | | | (32,880,167 | ) | | | (4,679,909 | ) |
| Net increase (decrease) in net assets resulting from share transactions | | | (58,729,983 | ) | | | (6,897,071 | ) | | | 31,349,527 | | | | 12,212,315 | |
| Total increase in net assets | | | 1,010,960 | | | | 36,674,972 | | | | 91,520,691 | | | | 13,313,977 | |
| Net Assets, beginning of year | | | 450,979,380 | | | | 414,304,408 | | | | 43,249,998 | | | | 29,936,021 | |
| Net Assets, end of year | | $ | 451,990,340 | | | $ | 450,979,380 | | | $ | 134,770,689 | | | $ | 43,249,998 | |
| *Shares of Common Stock Issued (no par value) | | | | | | | | | | | | | | | | |
| Shares sold | | | 675,000 | | | | 900,000 | | | | 6,300,000 | | | | 2,650,000 | |
| Shares redeemed | | | (1,025,000 | ) | | | (950,000 | ) | | | (2,825,000 | ) | | | (775,000 | ) |
| Net increase (decrease) | | | (350,000 | ) | | | (50,000 | ) | | | 3,475,000 | | | | 1,875,000 | |
See Notes to Financial Statements
VANECK ETF TRUST
STATEMENTS OF CHANGES IN NET ASSETS
| | | Energy Income ETF | | | Environmental Services ETF | |
| | | Year Ended
September 30,
2024 | | | Year Ended
September 30,
2023 | | | Year Ended
September 30,
2024 | | | Year Ended
September 30,
2023 | |
| Operations: | | | | | | | | | | | | | | | | |
| Net investment income | | $ | 1,184,914 | | | $ | 755,431 | | | $ | 394,073 | | | $ | 623,255 | |
| Net realized gain | | | 6,745,188 | | | | 3,061,316 | | | | 5,876,570 | | | | 2,726,546 | |
| Net change in unrealized appreciation (depreciation) | | | 5,708,044 | | | | 1,700,138 | | | | 11,859,242 | | | | 2,443,348 | |
| Net increase in net assets resulting from operations | | | 13,638,146 | | | | 5,516,885 | | | | 18,129,885 | | | | 5,793,149 | |
| Distributions to shareholders from: | | | | | | | | | | | | | | | | |
| Distributable earnings | | | (327,149 | ) | | | (674,492 | ) | | | (725,000 | ) | | | (284,988 | ) |
| Return of capital | | | (1,435,928 | ) | | | (596,281 | ) | | | — | | | | — | |
| Total distributions | | | (1,763,077 | ) | | | (1,270,773 | ) | | | (725,000 | ) | | | (284,988 | ) |
| | | | | | | | | | | | | | | | | |
| Share transactions*: | | | | | | | | | | | | | | | | |
| Proceeds from sale of shares | | | 28,427,613 | | | | 7,944,408 | | | | 29,952,010 | | | | 24,471,616 | |
| Cost of shares redeemed | | | (20,480,705 | ) | | | (6,231,606 | ) | | | (45,368,218 | ) | | | (20,455,468 | ) |
| Net increase (decrease) in net assets resulting from share transactions | | | 7,946,908 | | | | 1,712,802 | | | | (15,416,208 | ) | | | 4,016,148 | |
| Total increase in net assets | | | 19,821,977 | | | | 5,958,914 | | | | 1,988,677 | | | | 9,524,309 | |
| Net Assets, beginning of year | | | 36,634,504 | | | | 30,675,590 | | | | 77,439,096 | | | | 67,914,787 | |
| Net Assets, end of year | | $ | 56,456,481 | | | $ | 36,634,504 | | | $ | 79,427,773 | | | $ | 77,439,096 | |
| *Shares of Common Stock Issued (no par value) | | | | | | | | | | | | | | | | |
| Shares sold | | | 375,000 | | | | 125,000 | | | | 180,000 | | | | 160,000 | |
| Shares redeemed | | | (275,000 | ) | | | (100,000 | ) | | | (280,000 | ) | | | (140,000 | ) |
| Net increase (decrease) | | | 100,000 | | | | 25,000 | | | | (100,000 | ) | | | 20,000 | |
See Notes to Financial Statements
VANECK ETF TRUST
STATEMENTS OF CHANGES IN NET ASSETS
| | | Fabless
Semiconductor
ETF | | | Gaming ETF | |
| | | Period Ended
September 30,
2024(a) | | | Year Ended
September 30,
2024 | | | Year Ended
September 30,
2023 | |
| Operations: | | | | | | | | | | | | |
| Net investment income | | $ | 2,261 | | | $ | 601,555 | | | $ | 801,130 | |
| Net realized gain (loss) | | | 25,461 | | | | (2,548,400 | ) | | | 3,004,642 | |
| Net change in unrealized appreciation (depreciation) | | | 469,996 | | | | 7,204,336 | | | | 14,234,976 | |
| Net increase in net assets resulting from operations | | | 497,718 | | | | 5,257,491 | | | | 18,040,748 | |
| Distributions to shareholders from: | | | | | | | | | | | | |
| Distributable earnings | | | — | | | | (799,988 | ) | | | (424,958 | ) |
| | | | | | | | | | | | | |
| Share transactions*: | | | | | | | | | | | | |
| Proceeds from sale of shares | | | 6,542,655 | | | | — | | | | 33,573,611 | |
| Cost of shares redeemed | | | (623,743 | ) | | | (16,195,540 | ) | | | (61,822,546 | ) |
| Net increase (decrease) in net assets resulting from share transactions | | | 5,918,912 | | | | (16,195,540 | ) | | | (28,248,935 | ) |
| Total increase (decrease) in net assets | | | 6,416,630 | | | | (11,738,037 | ) | | | (10,633,145 | ) |
| Net Assets, beginning of period | | | — | | | | 49,929,203 | | | | 60,562,348 | |
| Net Assets, end of period | | $ | 6,416,630 | | | $ | 38,191,166 | | | $ | 49,929,203 | |
| *Shares of Common Stock Issued (no par value) | | | | | | | | | | | | |
| Shares sold | | | 275,000 | | | | — | | | | 825,000 | |
| Shares redeemed | | | (25,000 | ) | | | (400,000 | ) | | | (1,425,000 | ) |
| Net increase (decrease) | | | 250,000 | | | | (400,000 | ) | | | (600,000 | ) |
| (a) | For the period August 28, 2024 (commencement of operations) through September 30, 2024. |
See Notes to Financial Statements
VANECK ETF TRUST
STATEMENTS OF CHANGES IN NET ASSETS
| | | Green Infrastructure ETF | | | Pharmaceutical ETF | |
| | | Year Ended
September 30,
2024 | | | Period Ended
September 30,
2023(a) | | | Year Ended
September 30,
2024 | | | Year Ended
September 30,
2023 | |
| Operations: | | | | | | | | | | | | | | | | |
| Net investment income | | $ | 14,968 | | | $ | 13,751 | | | $ | 10,400,822 | | | $ | 8,740,815 | |
| Net realized gain | | | 765 | | | | 29,496 | | | | 40,785,405 | | | | 29,314,853 | |
| Net change in unrealized appreciation (depreciation) | | | 113,790 | | | | (128,274 | ) | | | 42,663,264 | | | | 54,260,353 | |
| Net increase (decrease) in net assets resulting from operations | | | 129,523 | | | | (85,027 | ) | | | 93,849,491 | | | | 92,316,021 | |
| Distributions to shareholders from: | | | | | | | | | | | | | | | | |
| Distributable earnings | | | (15,998 | ) | | | (3,000 | ) | | | (9,117,032 | ) | | | (8,998,067 | ) |
| | | | | | | | | | | | | | | | | |
| Share transactions*: | | | | | | | | | | | | | | | | |
| Proceeds from sale of shares | | | 1,206,602 | | | | 2,535,936 | | | | 691,277,501 | | | | 673,169,628 | |
| Cost of shares redeemed | | | (1,220,877 | ) | | | (646,906 | ) | | | (479,525,738 | ) | | | (850,179,679 | ) |
| Net increase (decrease) in net assets resulting from share transactions | | | (14,275 | ) | | | 1,889,030 | | | | 211,751,763 | | | | (177,010,051 | ) |
| Total increase (decrease) in net assets | | | 99,250 | | | | 1,801,003 | | | | 296,484,222 | | | | (93,692,097 | ) |
| Net Assets, beginning of period | | | 1,801,003 | | | | — | | | | 430,046,296 | | | | 523,738,393 | |
| Net Assets, end of period | | $ | 1,900,253 | | | $ | 1,801,003 | | | $ | 726,530,518 | | | $ | 430,046,296 | |
| *Shares of Common Stock Issued (no par value) | | | | | | | | | | | | | | | | |
| Shares sold | | | 50,000 | | | | 100,000 | | | | 7,800,000 | | | | 8,700,000 | |
| Shares redeemed | | | (50,000 | ) | | | (25,000 | ) | | | (5,550,000 | ) | | | (11,100,000 | ) |
| Net increase (decrease) | | | — | | | | 75,000 | | | | 2,250,000 | | | | (2,400,000 | ) |
| (a) | For the period October 19, 2022 (commencement of operations) through September 30, 2023. |
See Notes to Financial Statements
VANECK ETF TRUST
STATEMENTS OF CHANGES IN NET ASSETS
| | | Retail ETF | | | Robotics ETF | |
| | | Year Ended
September 30,
2024 | | | Year Ended
September 30,
2023 | | | Year Ended
September 30,
2024 | | | Period Ended
September 30,
2023(a) | |
| Operations: | | | | | | | | | | | | | | | | |
| Net investment income | | $ | 2,100,612 | | | $ | 1,429,429 | | | $ | 58,365 | | | $ | 4,883 | |
| Net realized gain (loss) | | | 12,300,112 | | | | (5,549,934 | ) | | | 280,563 | | | | 50,231 | |
| Net change in unrealized appreciation (depreciation) | | | 35,513,386 | | | | 17,476,048 | | | | 1,265,065 | | | | (83,205 | ) |
| Net increase (decrease) in net assets resulting from operations | | | 49,914,110 | | | | 13,355,543 | | | | 1,603,993 | | | | (28,091 | ) |
| Distributions to shareholders from: | | | | | | | | | | | | | | | | |
| Distributable earnings | | | (1,849,973 | ) | | | (1,700,040 | ) | | | (61,373 | ) | | | — | |
| | | | | | | | | | | | | | | | | |
| Share transactions*: | | | | | | | | | | | | | | | | |
| Proceeds from sale of shares | | | 59,777,343 | | | | 33,356,739 | | | | 11,501,046 | | | | 2,663,384 | |
| Cost of shares redeemed | | | (39,430,277 | ) | | | (40,875,022 | ) | | | — | | | | — | |
| Net increase (decrease) in net assets resulting from share transactions | | | 20,347,066 | | | | (7,518,283 | ) | | | 11,501,046 | | | | 2,663,384 | |
| Total increase in net assets | | | 68,411,203 | | | | 4,137,220 | | | | 13,043,666 | | | | 2,635,293 | |
| Net Assets, beginning of period | | | 154,569,312 | | | | 150,432,092 | | | | 2,635,293 | | | | — | |
| Net Assets, end of period | | $ | 222,980,515 | | | $ | 154,569,312 | | | $ | 15,678,959 | | | $ | 2,635,293 | |
| *Shares of Common Stock Issued (no par value) | | | | | | | | | | | | | | | | |
| Shares sold | | | 300,000 | | | | 200,000 | | | | 275,000 | | | | 75,000 | |
| Shares redeemed | | | (200,000 | ) | | | (250,000 | ) | | | — | | | | — | |
| Net increase (decrease) | | | 100,000 | | | | (50,000 | ) | | | 275,000 | | | | 75,000 | |
| (a) | For the period April 6, 2023 (commencement of operations) through September 30, 2023. |
See Notes to Financial Statements
VANECK ETF TRUST
STATEMENTS OF CHANGES IN NET ASSETS
| | | Semiconductor ETF | | | Video Gaming and eSports ETF | |
| | | Year Ended
September 30,
2024 | | | Year Ended
September 30,
2023(a) | | | Year Ended
September 30,
2024 | | | Year Ended
September 30,
2023 | |
| Operations: | | | | | | | | | | | | | | | | |
| Net investment income | | $ | 94,705,065 | | | $ | 69,665,245 | | | $ | 753,058 | | | $ | 2,441,068 | |
| Net realized gain (loss) | | | 6,485,436,108 | | | | 945,785,154 | | | | 49,466,365 | | | | (27,684,835 | ) |
| Net change in unrealized appreciation (depreciation) | | | 778,943,630 | | | | 2,291,380,472 | | | | 49,191,266 | | | | 92,968,847 | |
| Net increase in net assets resulting from operations | | | 7,359,084,803 | | | | 3,306,830,871 | | | | 99,410,689 | | | | 67,725,080 | |
| Distributions to shareholders from: | | | | | | | | | | | | | | | | |
| Distributable earnings | | | (68,496,917 | ) | | | (70,999,820 | ) | | | (2,439,900 | ) | | | (2,252,275 | ) |
| | | | | | | | | | | | | | | | | |
| Share transactions*: | | | | | | | | | | | | | | | | |
| Proceeds from sale of shares | | | 38,981,223,547 | | | | 22,043,690,438 | | | | 48,365,238 | | | | 2,456,645 | |
| Cost of shares redeemed | | | (31,939,465,600 | ) | | | (21,517,123,914 | ) | | | (124,150,797 | ) | | | (87,599,100 | ) |
| Net increase (decrease) in net assets resulting from share transactions | | | 7,041,757,947 | | | | 526,566,524 | | | | (75,785,559 | ) | | | (85,142,455 | ) |
| Total increase (decrease) in net assets | | | 14,332,345,833 | | | | 3,762,397,575 | | | | 21,185,230 | | | | (19,669,650 | ) |
| Net Assets, beginning of year | | | 9,393,998,477 | | | | 5,631,600,902 | | | | 242,594,069 | | | | 262,263,719 | |
| Net Assets, end of year | | $ | 23,726,344,310 | | | $ | 9,393,998,477 | | | $ | 263,779,299 | | | $ | 242,594,069 | |
| *Shares of Common Stock Issued (no par value) | | | | | | | | | | | | | | | | |
| Shares sold | | | 186,250,000 | | | | 179,150,000 | | | | 750,000 | | | | 50,000 | |
| Shares redeemed | | | (154,350,000 | ) | | | (175,200,000 | ) | | | (2,000,000 | ) | | | (1,800,000 | ) |
| Net increase (decrease) | | | 31,900,000 | | | | 3,950,000 | | | | (1,250,000 | ) | | | (1,750,000 | ) |
| (a) | Share activity has been adjusted to reflect the 2 for 1 share split which took place on May 5, 2023. |
See Notes to Financial Statements
VANECK ETF TRUST
FINANCIAL HIGHLIGHTS
For a share outstanding throughout each year:
| | | | Biotech ETF |
| | | | Year Ended September 30, |
| | | | 2024 | | 2023 | | 2022 | | 2021 | | 2020 |
| | | | | | | | | | | | | | | | | | | | | | |
| Net asset value, beginning of year | | | | $155.70 | | | | $140.61 | | | | $201.99 | | | | $162.01 | | | | $118.04 | |
| Net investment income (a) | | | | 0.92 | | | | 0.70 | | | | 0.69 | | | | 0.42 | | | | 0.59 | |
| Net realized and unrealized gain (loss) on investments | | | | 21.58 | | | | 15.14 | | | | (61.67 | ) | | | 40.17 | | | | 43.85 | |
| Total from investment operations | | | | 22.50 | | | | 15.84 | | | | (60.98 | ) | | | 40.59 | | | | 44.44 | |
| Distributions from: | | | | | | | | | | | | | | | | | | | | | |
| Net investment income | | | | (0.71 | ) | | | (0.75 | ) | | | (0.40 | ) | | | (0.61 | ) | | | (0.47 | ) |
| Net asset value, end of year | | | | $177.49 | | | | $155.70 | | | | $140.61 | | | | $201.99 | | | | $162.01 | |
| Total return (b) | | | | 14.50 | % | | | 11.24 | % | | | (30.24 | )% | | | 25.13 | % | | | 37.71 | % |
| | | | | | | | | | | | | | | | | | | | | | |
| Ratios to average net assets | | | | | | | | | | | | | | | | | | | | | |
| Gross expenses (c) | | | | 0.35 | % | | | 0.35 | % | | | 0.35 | % | | | 0.38 | % | | | 0.39 | % |
| Net expenses (c) | | | | 0.35 | % | | | 0.35 | % | | | 0.35 | % | | | 0.35 | % | | | 0.35 | % |
| Net investment income | | | | 0.56 | % | | | 0.44 | % | | | 0.42 | % | | | 0.23 | % | | | 0.40 | % |
| Supplemental data | | | | | | | | | | | | | | | | | | | | | |
| Net assets, end of year (in millions) | | | | $452 | | | | $451 | | | | $414 | | | | $590 | | | | $485 | |
| Portfolio turnover rate (d) | | | | 19 | % | | | 18 | % | | | 24 | % | | | 41 | % | | | 40 | % |
| (a) | Calculated based upon average shares outstanding |
| (b) | Returns are not annualized and include adjustments in accordance with U.S. Generally Accepted Accounting Principles. Net asset values and returns for financial reporting purposes may differ from those for shareholder transactions. |
| (c) | Periods after September 30, 2021 reflect a unitary management fee structure. |
| (d) | Portfolio turnover rate is not annualized and excludes in-kind transactions. |
See Notes to Financial Statements
VANECK ETF TRUST
FINANCIAL HIGHLIGHTS
For a share outstanding throughout each period:
| | | | Digital Transformation ETF |
| | | | Year Ended September 30, | | Period
Ended
September
30, |
| | | | 2024 | | 2023 | | 2022 | | 2021 (a) |
| | | | | | | | | | | | | | |
| Net asset value, beginning of period | | | $5.46 | | | $4.95 | | | $22.81 | | | $35.25 | |
| Net investment income (b) | | | 0.09 | | | 0.15 | | | 0.26 | | | — | (c) |
| Net realized and unrealized gain (loss) on investments | | | 6.27 | | | 0.36 | | | (16.24 | ) | | (12.44 | ) |
| Total from investment operations | | | 6.36 | | | 0.51 | | | (15.98 | ) | | (12.44 | ) |
| Distributions from: | | | | | | | | | | | | | |
| Net investment income | | | — | | | — | | | (1.88 | ) | | — | |
| Net asset value, end of period | | | $11.82 | | | $5.46 | | | $4.95 | | | $22.81 | |
| Total return (d) | | | 116.65 | % | | 10.29 | % | | (76.33 | )% | | (35.30 | )% |
| | | | | | | | | | | | | | |
| Ratios to average net assets | | | | | | | | | | | | | |
| Expenses | | | 0.51 | % | | 0.51 | % | | 0.50 | % | | 0.58 | %(e) |
| Expenses excluding interest and taxes | | | 0.50 | % | | 0.50 | % | | 0.50 | % | | N/A | |
| Net investment income | | | 0.91 | % | | 2.81 | % | | 2.28 | % | | 0.02 | %(e) |
| Supplemental data | | | | | | | | | | | | | |
| Net assets, end of period (in millions) | | | $135 | | | $43 | | | $30 | | | $46 | |
| Portfolio turnover rate (f) | | | 80 | % | | 57 | % | | 74 | % | | 49 | % |
| (a) | For the period April 13, 2021 (commencement of operations) through September 30, 2021. |
| (b) | Calculated based upon average shares outstanding |
| (c) | Amount represents less than $0.005 per share. |
| (d) | Returns are not annualized and include adjustments in accordance with U.S. Generally Accepted Accounting Principles. Net asset values and returns for financial reporting purposes may differ from those for shareholder transactions. |
| (e) | Annualized |
| (f) | Portfolio turnover rate is not annualized and excludes in-kind transactions. |
See Notes to Financial Statements
VANECK ETF TRUST
FINANCIAL HIGHLIGHTS
For a share outstanding throughout each period:
| | | Energy Income ETF(a) |
| | | Year Ended September 30, | | Period
Ended
September
30, | | Year Ended November |
| | | 2024 | | 2023 | | 2022 | | 2021 | | 2020 (b)(c) | | 30, 2019 |
| | | | | | | | | | | | | | | | | | | |
| Net asset value, beginning of period | | $64.87 | | | $56.84 | | | $54.25 | | | $34.29 | | | $51.20 | | | $58.32 | |
| Net investment income (loss) (d) | | 1.97 | | | 1.51 | | | 1.17 | | | 1.15 | | | 0.76 | | | (0.39 | ) |
| Net realized and unrealized gain (loss) on investments | | 20.94 | | | 9.04 | | | 3.67 | | | 21.90 | | | (15.58 | ) | | (1.42 | ) |
| Total from investment operations | | 22.91 | | | 10.55 | | | 4.84 | | | 23.05 | | | (14.82 | ) | | (1.81 | ) |
| Distributions from: | | | | | | | | | | | | | | | | | | |
| Net investment income | | (0.55 | ) | | (1.34 | ) | | (1.02 | ) | | (1.37 | ) | | — | | | (1.77 | ) |
| Return of capital | | (2.30 | ) | | (1.18 | ) | | (1.23 | ) | | (1.72 | ) | | (2.09 | ) | | (3.54 | ) |
| Total distributions | | (2.85 | ) | | (2.52 | ) | | (2.25 | ) | | (3.09 | ) | | (2.09 | ) | | (5.31 | ) |
| Net asset value, end of period | | $84.93 | | | $64.87 | | | $56.84 | | | $54.25 | | | $34.29 | | | $51.20 | |
| Total return (e) | | 36.09 | % | | 18.70 | % | | 8.79 | % | | 68.88 | % | | (29.74 | )% | | (3.66 | )% |
| | | | | | | | | | | | | | | | | | | |
| Ratios to average net assets | | | | | | | | | | | | | | | | | | |
| Expenses | | 0.47 | % | | 0.46 | % | | 0.48 | % | | 0.46 | % | | 0.45 | %(f)(g) | | 1.41 | %(h) |
| Expenses excluding interest and taxes | | 0.45 | % | | 0.45 | % | | 0.45 | % | | 0.45 | % | | 0.45 | %(f)(g) | | 1.41 | %(h) |
| Net investment income (loss) | | 2.65 | % | | 2.41 | % | | 1.95 | % | | 2.43 | % | | 2.17 | %(f)(i) | | (0.68 | )%(h) |
| Supplemental data | | | | | | | | | | | | | | | | | | |
| Net assets, end of period (in millions) | | $56 | | | $37 | | | $31 | | | $24 | | | $20 | | | $52 | |
| Portfolio turnover rate (j) | | 28 | % | | 23 | % | | 21 | % | | 24 | % | | 24 | % | | 106 | % |
| (a) | On April 15, 2020, the Fund effected a 1 for 3 reverse share split (See Note 11). Per share data has been adjusted to reflect the reverse share split. |
| (b) | The Fund changed its fiscal year-end from November 30 to September 30. |
| (c) | Effective December 2, 2019, the unitary management fee rate changed from 0.82% to 0.45% |
| (d) | Calculated based upon average shares outstanding |
| (e) | Returns are not annualized and include adjustments in accordance with U.S. Generally Accepted Accounting Principles. Net asset values and returns for financial reporting purposes may differ from those for shareholder transactions. |
| (f) | Annualized |
| (g) | Includes income tax expense of 1.56% and Adviser reimbursement of (1.56%). If the Adviser had not reimbursed the Fund, the ratio would have been higher. |
| (h) | Includes income tax expense of 0.59% related to the Fund’s tax status as a C-Corporation prior to its reorganization as a regulated investment company. |
| (i) | Includes income tax expense of 1.56% and Adviser reimbursement of (1.56%). If the Adviser had not reimbursed the Fund, the ratio would have been lower. |
| (j) | Portfolio turnover rate is not annualized and excludes in-kind transactions. |
See Notes to Financial Statements
VANECK ETF TRUST
FINANCIAL HIGHLIGHTS
For a share outstanding throughout each year:
| | | Environmental Services ETF |
| | | Year Ended September 30, |
| | | 2024 | | 2023 | | 2022 | | 2021 | | 2020 |
| | | | | | | | | | | | | | | | |
| Net asset value, beginning of year | | $143.41 | | | $130.61 | | | $143.18 | | | $99.41 | | | $104.25 | |
| Net investment income (a) | | 0.83 | | | 1.24 | | | 0.56 | | | 0.36 | | | 0.46 | |
| Net realized and unrealized gain (loss) on investments | | 37.73 | | | 12.12 | | | (12.76 | ) | | 43.80 | | | (4.83 | ) |
| Total from investment operations | | 38.56 | | | 13.36 | | | (12.20 | ) | | 44.16 | | | (4.37 | ) |
| Distributions from: | | | | | | | | | | | | | | | |
| Net investment income | | (1.45 | ) | | (0.56 | ) | | (0.37 | ) | | (0.39 | ) | | (0.47 | ) |
| Net asset value, end of year | | $180.52 | | | $143.41 | | | $130.61 | | | $143.18 | | | $99.41 | |
| Total return (b) | | 27.08 | % | | 10.25 | % | | (8.56 | )% | | 44.50 | % | | (4.23 | )% |
| | | | | | | | | | | | | | | | |
| Ratios to average net assets | | | | | | | | | | | | | | | |
| Gross expenses | | 0.62 | % | | 0.64 | % | | 0.62 | % | | 0.71 | % | | 0.85 | % |
| Net expenses | | 0.55 | % | | 0.55 | % | | 0.55 | % | | 0.55 | % | | 0.55 | % |
| Net investment income | | 0.52 | % | | 0.85 | % | | 0.39 | % | | 0.27 | % | | 0.47 | % |
| Supplemental data | | | | | | | | | | | | | | | |
| Net assets, end of year (in millions) | | $79 | | | $77 | | | $68 | | | $67 | | | $31 | |
| Portfolio turnover rate (c) | | 23 | % | | 22 | % | | 35 | % | | 21 | % | | 38 | % |
| (a) | Calculated based upon average shares outstanding |
| (b) | Returns are not annualized and include adjustments in accordance with U.S. Generally Accepted Accounting Principles. Net asset values and returns for financial reporting purposes may differ from those for shareholder transactions. |
| (c) | Portfolio turnover rate is not annualized and excludes in-kind transactions. |
See Notes to Financial Statements
VANECK ETF TRUST
FINANCIAL HIGHLIGHTS
For a share outstanding throughout each period:
| | | Fabless
Semiconductor
ETF |
| | | |
| | | Period Ended
September 30,
2024 (a) |
| | | |
| Net asset value, beginning of period | | $25.26 | |
| Net investment income (b) | | 0.02 | |
| Net realized and unrealized gain on investments | | 0.39 | |
| Total from investment operations | | 0.41 | |
| Net asset value, end of period | | $25.67 | |
| Total return (c) | | 1.60 | % |
| | | | |
| Ratios to average net assets | | | |
| Expenses | | 0.35 | %(d) |
| Net investment income | | 0.68 | %(d) |
| Supplemental data | | | |
| Net assets, end of period (in millions) | | $6 | |
| Portfolio turnover rate (e) | | 7 | % |
| (a) | For the period August 28, 2024 (commencement of operations) through September 30, 2024. |
| (b) | Calculated based upon average shares outstanding |
| (c) | Returns are not annualized and include adjustments in accordance with U.S. Generally Accepted Accounting Principles. Net asset values and returns for financial reporting purposes may differ from those for shareholder transactions. |
| (d) | Annualized |
| (e) | Portfolio turnover rate is not annualized and excludes in-kind transactions. |
See Notes to Financial Statements
VANECK ETF TRUST
FINANCIAL HIGHLIGHTS
For a share outstanding throughout each year:
| | | Gaming ETF |
| | | Year Ended September 30, |
| | | 2024 | | 2023 | | 2022 | | 2021 | | 2020 |
| | | | | | | | | | | |
| Net asset value, beginning of year | | $39.94 | | | $32.74 | | | $48.32 | | | $39.14 | | | $36.61 | |
| Net investment income (a) | | 0.59 | | | 0.42 | | | 0.25 | | | 0.16 | | | 0.51 | |
| Net realized and unrealized gain (loss) on investments | | 5.11 | | | 6.95 | | | (15.48 | ) | | 9.24 | | | 3.25 | |
| Total from investment operations | | 5.70 | | | 7.37 | | | (15.23 | ) | | 9.40 | | | 3.76 | |
| Distributions from: | | | | | | | | | | | | | | | |
| Net investment income | | (0.71 | ) | | (0.17 | ) | | (0.35 | ) | | (0.22 | ) | | (1.23 | ) |
| Net asset value, end of year | | $44.93 | | | $39.94 | | | $32.74 | | | $48.32 | | | $39.14 | |
| Total return (b) | | 14.38 | % | | 22.55 | % | | (31.72 | )% | | 24.06 | % | | 10.03 | % |
| | | | | | | | | | | | | | | | |
| Ratios to average net assets | | | | | | | | | | | | | | | |
| Gross expenses | | 0.78 | % | | 0.74 | % | | 0.65 | % | | 0.62 | % | | 0.92 | % |
| Net expenses | | 0.67 | % | | 0.72 | % | | 0.65 | % | | 0.62 | % | | 0.65 | % |
| Net expenses excluding interest and taxes | | 0.65 | % | | 0.65 | % | | 0.63 | % | | 0.62 | % | | 0.65 | % |
| Net investment income | | 1.43 | % | | 0.99 | % | | 0.63 | % | | 0.32 | % | | 1.41 | % |
| Supplemental data | | | | | | | | | | | | | | | |
| Net assets, end of year (in millions) | | $38 | | | $50 | | | $61 | | | $118 | | | $55 | |
| Portfolio turnover rate (c) | | 22 | % | | 15 | % | | 16 | % | | 20 | % | | 29 | % |
| (a) | Calculated based upon average shares outstanding |
| (b) | Returns are not annualized and include adjustments in accordance with U.S. Generally Accepted Accounting Principles. Net asset values and returns for financial reporting purposes may differ from those for shareholder transactions. |
| (c) | Portfolio turnover rate is not annualized and excludes in-kind transactions. |
See Notes to Financial Statements
VANECK ETF TRUST
FINANCIAL HIGHLIGHTS
For a share outstanding throughout each period:
| | | | | | | |
| | | Green Infrastructure ETF |
| | | |
| | | Year Ended
September
30, 2024 | | Period
Ended
September
30,
2023 (a) |
| | | | | | | |
| Net asset value, beginning of period | | | $24.01 | | | | $25.50 | |
| Net investment income (b) | | | 0.20 | | | | 0.24 | |
| Net realized and unrealized gain (loss) on investments | | | 1.34 | | | | (1.67 | ) |
| Total from investment operations | | | 1.54 | | | | (1.43 | ) |
| Distributions from: | | | | | | | | |
| Net investment income | | | (0.21 | ) | | | (0.06 | ) |
| Net asset value, end of period | | | $25.34 | | | | $24.01 | |
| Total return (c) | | | 6.42 | % | | | (5.62 | )% |
| | | | | | | | | |
| Ratios to average net assets | | | | | | | | |
| Expenses | | | 0.47 | % | | | 0.46 | %(d) |
| Expenses excluding interest and taxes | | | 0.45 | % | | | 0.45 | %(d) |
| Net investment income | | | 0.84 | % | | | 0.99 | %(d) |
| Supplemental data | | | | | | | | |
| Net assets, end of period (in millions) | | | $2 | | | | $2 | |
| Portfolio turnover rate (e) | | | 5 | % | | | 12 | % |
| | | | | | | | | |
| | | | | | | | | |
| (a) | For the period October 19, 2022 (commencement of operations) through September 30, 2023. |
| (b) | Calculated based upon average shares outstanding |
| (c) | Returns are not annualized and include adjustments in accordance with U.S. Generally Accepted Accounting Principles. Net asset values and returns for financial reporting purposes may differ from those for shareholder transactions. |
| (d) | Annualized |
| (e) | Portfolio turnover rate is not annualized and excludes in-kind transactions. |
| | |
See Notes to Financial Statements
VANECK ETF TRUST
FINANCIAL HIGHLIGHTS
For a share outstanding throughout each year:
| | | | | | | | | | | | | | | | |
| | | Pharmaceutical ETF |
| | | Year Ended September 30, |
| | | 2024 | | 2023 | | 2022 | | 2021 | | 2020 |
| | | | | | | | | | | | | | | | |
| Net asset value, beginning of year | | | $79.81 | | | | $67.25 | | | | $72.68 | | | | $62.08 | | | | $56.93 | |
| Net investment income (a) | | | 1.73 | | | | 1.47 | | | | 1.32 | | | | 1.29 | | | | 1.06 | |
| Net realized and unrealized gain (loss) on investments | | | 15.12 | | | | 12.65 | | | | (5.44 | ) | | | 10.46 | | | | 5.14 | |
| Total from investment operations | | | 16.85 | | | | 14.12 | | | | (4.12 | ) | | | 11.75 | | | | 6.20 | |
| Distributions from: | | | | | | | | | | | | | | | | | | | | |
| Net investment income | | | (1.54 | ) | | | (1.56 | ) | | | (1.31 | ) | | | (1.15 | ) | | | (1.05 | ) |
| Net asset value, end of year | | | $95.12 | | | | $79.81 | | | | $67.25 | | | | $72.68 | | | | $62.08 | |
| Total return (b) | | | 21.33 | % | | | 21.14 | % | | | (5.91 | )% | | | 19.10 | % | | | 11.02 | % |
| | | | | | | | | | | | | | | | | | | | | |
| Ratios to average net assets | | | | | | | | | | | | | | | | | | | | |
| Gross expenses (c) | | | 0.36 | % | | | 0.36 | % | | | 0.36 | % | | | 0.40 | % | | | 0.42 | % |
| Net expenses (c) | | | 0.36 | % | | | 0.36 | % | | | 0.36 | % | | | 0.35 | % | | | 0.35 | % |
| Net expenses excluding interest and taxes (c) | | | 0.35 | % | | | 0.35 | % | | | 0.35 | % | | | 0.35 | % | | | 0.35 | % |
| Net investment income | | | 1.96 | % | | | 1.91 | % | | | 1.74 | % | | | 1.85 | % | | | 1.74 | % |
| Supplemental data | | | | | | | | | | | | | | | | | | | | |
| Net assets, end of year (in millions) | | | $727 | | | | $430 | | | | $524 | | | | $319 | | | | $235 | |
| Portfolio turnover rate (d) | | | 12 | % | | | 22 | % | | | 23 | % | | | 20 | % | | | 18 | % |
| | | | | | | | | | | | | | | | | | | | | |
| | | | | | | | | | | | | | | | | | | | | |
| (a) | Calculated based upon average shares outstanding |
| (b) | Returns are not annualized and include adjustments in accordance with U.S. Generally Accepted Accounting Principles. Net asset values and returns for financial reporting purposes may differ from those for shareholder transactions. |
| (c) | Periods after September 30, 2021 reflect a unitary management fee structure. |
| (d) | Portfolio turnover rate is not annualized and excludes in-kind transactions. |
| | |
See Notes to Financial Statements
VANECK ETF TRUST
FINANCIAL HIGHLIGHTS
For a share outstanding throughout each year:
| | | | | | | | | | | | | | | | |
| | | Retail ETF |
| | | Year Ended September 30, |
| | | 2024 | | 2023 | | 2022 | | 2021 | | 2020 |
| | | | | | | | | | | | | | | | |
| Net asset value, beginning of year | | | $167.73 | | | | $154.84 | | | | $174.75 | | | | $148.87 | | | | $114.49 | |
| Net investment income (a) | | | 2.15 | | | | 1.56 | | | | 1.52 | | | | 1.54 | | | | 1.22 | |
| Net realized and unrealized gain (loss) on investments | | | 50.41 | | | | 13.17 | | | | (19.92 | ) | | | 25.34 | | | | 34.25 | |
| Total from investment operations | | | 52.56 | | | | 14.73 | | | | (18.40 | ) | | | 26.88 | | | | 35.47 | |
| Distributions from: | | | | | | | | | | | | | | | | | | | | |
| Net investment income | | | (2.01 | ) | | | (1.84 | ) | | | (1.51 | ) | | | (1.00 | ) | | | (1.09 | ) |
| Net asset value, end of year | | | $218.28 | | | | $167.73 | | | | $154.84 | | | | $174.75 | | | | $148.87 | |
| Total return (b) | | | 31.53 | % | | | 9.58 | % | | | (10.69 | )% | | | 18.13 | % | | | 31.22 | % |
| | | | | | | | | | | | | | | | | | | | | |
| Ratios to average net assets | | | | | | | | | | | | | | | | | | | | |
| Gross expenses (c) | | | 0.35 | % | | | 0.35 | % | | | 0.35 | % | | | 0.42 | % | | | 0.47 | % |
| Net expenses (c) | | | 0.35 | % | | | 0.35 | % | | | 0.35 | % | | | 0.35 | % | | | 0.35 | % |
| Net investment income | | | 1.09 | % | | | 0.94 | % | | | 0.86 | % | | | 0.92 | % | | | 0.96 | % |
| Supplemental data | | | | | | | | | | | | | | | | | | | | |
| Net assets, end of year (in millions) | | | $223 | | | | $155 | | | | $150 | | | | $240 | | | | $182 | |
| Portfolio turnover rate (d) | | | 7 | % | | | 20 | % | | | 14 | % | | | 12 | % | | | 12 | % |
| | | | | | | | | | | | | | | | | | | | | |
| | | | | | | | | | | | | | | | | | | | | |
| (a) | Calculated based upon average shares outstanding |
| (b) | Returns are not annualized and include adjustments in accordance with U.S. Generally Accepted Accounting Principles. Net asset values and returns for financial reporting purposes may differ from those for shareholder transactions. |
| (c) | Periods after September 30, 2021 reflect a unitary management fee structure. |
| (d) | Portfolio turnover rate is not annualized and excludes in-kind transactions. |
| | |
See Notes to Financial Statements
VANECK ETF TRUST
FINANCIAL HIGHLIGHTS
For a share outstanding throughout each period:
| | | | | | | |
| | | Robotics ETF |
| | | |
| | | Year Ended
September
30, 2024 | | Period
Ended
September
30,
2023 (a) |
| | | | | | | |
| Net asset value, beginning of period | | | $35.14 | | | | $34.39 | |
| Net investment income (b) | | | 0.29 | | | | 0.08 | |
| Net realized and unrealized gain on investments | | | 10.19 | | | | 0.67 | |
| Total from investment operations | | | 10.48 | | | | 0.75 | |
| Distributions from: | | | | | | | | |
| Net investment income | | | (0.15 | ) | | | — | |
| Net realized capital gains | | | (0.67 | ) | | | — | |
| Total distributions | | | (0.82 | ) | | | — | |
| Net asset value, end of period | | | $44.80 | | | | $35.14 | |
| Total return (c) | | | 30.15 | % | | | 2.18 | % |
| | | | | | | | | |
| Ratios to average net assets | | | | | | | | |
| Expenses | | | 0.47 | % | | | 0.47 | %(d) |
| Net investment income | | | 0.69 | % | | | 0.43 | %(d) |
| Supplemental data | | | | | | | | |
| Net assets, end of period (in millions) | | | $16 | | | | $3 | |
| Portfolio turnover rate (e) | | | 26 | % | | | 13 | % |
| | | | | | | | | |
| | | | | | | | | |
| (a) | For the period April 6, 2023 (commencement of operations) through September 30, 2023. |
| (b) | Calculated based upon average shares outstanding |
| (c) | Returns are not annualized and include adjustments in accordance with U.S. Generally Accepted Accounting Principles. Net asset values and returns for financial reporting purposes may differ from those for shareholder transactions. |
| (d) | Annualized |
| (e) | Portfolio turnover rate is not annualized and excludes in-kind transactions. |
See Notes to Financial Statements
VANECK ETF TRUST
FINANCIAL HIGHLIGHTS
For a share outstanding throughout each year:
| | | | | | | | | | | | | | | | |
| | | Semiconductor ETF(a) |
| | | Year Ended September 30, |
| | | 2024 | | 2023 | | 2022 | | 2021 | | 2020 |
| | | | | | | | | | | | | | | | |
| Net asset value, beginning of year | | | $144.99 | | | | $92.56 | | | | $128.13 | | | | $87.22 | | | | $59.57 | |
| Net investment income (b) | | | 1.19 | | | | 1.11 | | | | 1.07 | | | | 0.86 | | | | 0.94 | |
| Net realized and unrealized gain (loss) on investments | | | 100.24 | | | | 52.52 | | | | (35.85 | ) | | | 40.80 | | | | 27.77 | |
| Total from investment operations | | | 101.43 | | | | 53.63 | | | | (34.78 | ) | | | 41.66 | | | | 28.71 | |
| Distributions from: | | | | | | | | | | | | | | | | | | | | |
| Net investment income | | | (1.04 | ) | | | (1.20 | ) | | | (0.79 | ) | | | (0.75 | ) | | | (1.06 | ) |
| Net asset value, end of year | | | $245.38 | | | | $144.99 | | | | $92.56 | | | | $128.13 | | | | $87.22 | |
| Total return (c) | | | 70.26 | % | | | 58.49 | % | | | (27.40 | )% | | | 47.94 | % | | | 48.60 | % |
| | | | | | | | | | | | | | | | | | | | | |
| Ratios to average net assets | | | | | | | | | | | | | | | | | | | | |
| Gross expenses (d) | | | 0.35 | % | | | 0.35 | % | | | 0.35 | % | | | 0.36 | % | | | 0.37 | % |
| Net expenses (d) | | | 0.35 | % | | | 0.35 | % | | | 0.35 | % | | | 0.35 | % | | | 0.35 | % |
| Net investment income | | | 0.56 | % | | | 0.88 | % | | | 0.85 | % | | | 0.72 | % | | | 1.31 | % |
| Supplemental data | | | | | | | | | | | | | | | | | | | | |
| Net assets, end of year (in millions) | | | $23,726 | | | | $9,394 | | | | $5,632 | | | | $5,938 | | | | $2,646 | |
| Portfolio turnover rate (e) | | | 15 | % | | | 18 | % | | | 22 | % | | | 20 | % | | | 14 | % |
| | | | | | | | | | | | | | | | | | | | | |
| | | | | | | | | | | | | | | | | | | | | |
| (a) | On May 5, 2023, the Fund effected a 2 for 1 share split. Per share data prior to this date has been adjusted to reflect the share split. |
| (b) | Calculated based upon average shares outstanding |
| (c) | Returns are not annualized and include adjustments in accordance with U.S. Generally Accepted Accounting Principles. Net asset values and returns for financial reporting purposes may differ from those for shareholder transactions. |
| (d) | Periods after September 30, 2021 reflect a unitary management fee structure. |
| (e) | Portfolio turnover rate is not annualized and excludes in-kind transactions. |
See Notes to Financial Statements
VANECK ETF TRUST
FINANCIAL HIGHLIGHTS
For a share outstanding throughout each year:
| | | | | | | | | | | | | | | | |
| | | Video Gaming and eSports ETF |
| | | Year Ended September 30, |
| | | 2024 | | 2023 | | 2022 | | 2021 | | 2020 |
| | | | | | | | | | | | | | | | |
| Net asset value, beginning of year | | | $51.62 | | | | $40.66 | | | | $65.05 | | | | $61.36 | | | | $33.74 | |
| Net investment income (a) | | | 0.18 | | | | 0.44 | | | | 0.31 | | | | 0.04 | | | | 0.03 | |
| Net realized and unrealized gain (loss) on investments | | | 25.20 | | | | 10.91 | | | | (22.47 | ) | | | 3.73 | | | | 27.67 | |
| Total from investment operations | | | 25.38 | | | | 11.35 | | | | (22.16 | ) | | | 3.77 | | | | 27.70 | |
| Distributions from: | | | | | | | | | | | | | | | | | | | | |
| Net investment income | | | (0.54 | ) | | | (0.39 | ) | | | (0.05 | ) | | | (0.08 | ) | | | (0.08 | ) |
| Net realized capital gains | | | — | | | | — | | | | (2.18 | ) | | | — | | | | — | |
| Total distributions | | | (0.54 | ) | | | (0.39 | ) | | | (2.23 | ) | | | (0.08 | ) | | | (0.08 | ) |
| Net asset value, end of year | | | $76.46 | | | | $51.62 | | | | $40.66 | | | | $65.05 | | | | $61.36 | |
| Total return (b) | | | 49.58 | % | | | 28.11 | % | | | (35.42 | )% | | | 6.15 | % | | | 82.25 | % |
| | | | | | | | | | | | | | | | | | | | | |
| Ratios to average net assets | | | | | | | | | | | | | | | | | | | | |
| Gross expenses | | | 0.57 | % | | | 0.59 | % | | | 0.56 | % | | | 0.55 | % | | | 0.58 | % |
| Net expenses | | | 0.56 | % | | | 0.56 | % | | | 0.56 | % | | | 0.55 | % | | | 0.55 | % |
| Net expenses excluding interest and taxes | | | 0.55 | % | | | 0.55 | % | | | 0.55 | % | | | N/A | | | | N/A | |
| Net investment income | | | 0.30 | % | | | 0.89 | % | | | 0.52 | % | | | 0.06 | % | | | 0.06 | % |
| Supplemental data | | | | | | | | | | | | | | | | | | | | |
| Net assets, end of year (in millions) | | | $264 | | | | $243 | | | | $262 | | | | $631 | | | | $522 | |
| Portfolio turnover rate (c) | | | 36 | % | | | 30 | % | | | 35 | % | | | 33 | % | | | 25 | % |
| | | | | | | | | | | | | | | | | | | | | |
| | | | | | | | | | | | | | | | | | | | | |
| (a) | Calculated based upon average shares outstanding |
| (b) | Returns are not annualized and include adjustments in accordance with U.S. Generally Accepted Accounting Principles. Net asset values and returns for financial reporting purposes may differ from those for shareholder transactions. |
| (c) | Portfolio turnover rate is not annualized and excludes in-kind transactions. |
See Notes to Financial Statements
VANECK ETF TRUST
NOTES TO FINANCIAL STATEMENTS
September 30, 2024
Note 1—Fund Organization—VanEck ETF Trust (the “Trust”) is registered under the Investment Company Act of 1940, as amended, as an open-end management investment company. The Trust was incorporated in Delaware as a statutory trust on March 15, 2001. The Trust operates as a series fund, and offers multiple investment portfolios, each of which represents a separate series of the Trust. These financial statements relate only to the investment portfolios listed in the diversification table below (each a “Fund” and, collectively, the “Funds”).
| Fund | Diversification Classification |
| | |
| Biotech ETF | Non-Diversified |
| Digital Transformation ETF | Non-Diversified |
| Energy Income ETF | Non-Diversified |
| Environmental Services ETF | Non-Diversified |
| Fabless Semiconductor ETF | Non-Diversified |
| Gaming ETF | Non-Diversified |
| Green Infrastructure ETF | Non-Diversified |
| Pharmaceutical ETF | Non-Diversified |
| Retail ETF | Non-Diversified |
| Robotics ETF | Non-Diversified |
| Semiconductor ETF | Non-Diversified |
| Video Gaming and eSports ETF | Non-Diversified |
Each Fund’s investment objective is to replicate as closely as possible, before fees and expenses, the price and yield performance of its index which are listed in the table below.
| Fund | Index |
| | |
| Biotech ETF | MVIS® US Listed Biotech 25 Index |
| Digital Transformation ETF | MVIS Global Digital Assets Equity Index |
| Energy Income ETF | MVIS® North America Energy Infrastructure Index |
| Environmental Services ETF | NYSE Arca Environmental Services Index |
| Fabless Semiconductor ETF | MarketVectorTM US Listed Fabless Semiconductor Index |
| Gaming ETF | MVIS® Global Gaming Index |
| Green Infrastructure ETF | Indxx US Green Infrastructure-MCAP Weighted Index |
| Pharmaceutical ETF | MVIS® US Listed Pharmaceutical 25 Index |
| Retail ETF | MVIS® US Listed Retail 25 Index |
| Robotics ETF | BlueStar Robotics Index |
| Semiconductor ETF | MVIS® US Listed Semiconductor 25 Index |
| Video Gaming and eSports ETF | MVIS® Global Video Gaming & eSports Index |
Each Fund was created to provide investors with the opportunity to purchase a security representing a proportionate undivided interest in a portfolio of securities consisting of substantially all of the common stocks in approximately the same weighting as their index.
Effective December 2, 2019, the Energy Income ETF federal tax status changed from a taxable C-Corporation into a regulated investment company (“RIC”). In September 2020, the Board of Trustees (“Trustees”) approved changing the Energy Income ETF’s fiscal year-end from November 30 to September 30.
Van Eck Associates Corporation (the “Adviser”) serves as the investment adviser for the Funds.
Note 2—Significant Accounting Policies— The preparation of financial statements in conformity with U.S. generally accepted accounting principles (“GAAP”) requires management to make estimates and assumptions that affect the reported amounts and disclosures in the financial statements. Actual results could differ from those estimates.
The Funds are investment companies and follow accounting and reporting requirements of Accounting Standards Codification (“ASC”) 946, Financial Services—Investment Companies.
The following summarizes the Funds’ significant accounting policies.
VANECK ETF TRUST
NOTES TO FINANCIAL STATEMENTS
(continued)
| A. | Security Valuation— The Funds value their investments in securities and other assets and liabilities at fair value daily. Fair value is the price that would be received to sell an asset or paid to transfer a liability in an orderly transaction between market participants on the measurement date. The Funds utilize various methods to measure the fair value of their investments on a recurring basis, which includes a hierarchy that prioritizes inputs to valuation methods used to measure fair value. The fair value hierarchy gives highest priority to unadjusted quoted prices in active markets for identical assets and liabilities (Level 1 measurements) and the lowest priority to unobservable inputs (Level 3 measurements). The inputs or methodologies used for valuing securities are not necessarily an indication of the risk associated with investing in those securities. The three levels of the fair value hierarchy are described below: |
| | |
| | Level 1 — Quoted prices in active markets for identical securities. |
| | |
| | Level 2 — Significant observable inputs (including quoted prices for similar securities, interest rates, prepayment speeds, credit risk, etc.). |
| | |
| | Level 3 — Significant unobservable inputs (including each Fund’s own assumptions in determining the fair value of investments). |
| | |
| | Securities traded on national exchanges are valued at the closing price on the markets in which the securities trade. Securities traded on the NASDAQ Stock Market LLC (“NASDAQ”) are valued at the NASDAQ official closing price. Over-the-counter securities not included on NASDAQ and listed securities for which no sale was reported are valued at the mean of the bid and ask prices. To the extent these securities are actively traded they are categorized as Level 1 in the fair value hierarchy. Certain foreign securities, whose values may be affected by market direction or events occurring before the Funds’ pricing time (4:00 p.m. Eastern Time) but after the last close of the securities’ primary market, are fair valued using a pricing service and are categorized as Level 2 in the fair value hierarchy. The pricing service considers the correlation of the trading patterns of the foreign security to intraday trading in the U.S. markets, based on indices of domestic securities and other appropriate indicators such as prices of relevant American Depositary Receipts (“ADR’s”) and futures contracts. The Funds may also fair value securities in other situations, such as when a particular foreign market is closed but the Fund is open. Short-term debt securities with sixty days or less to maturity are valued at amortized cost, which with accrued interest approximates fair value. Money market fund investments are valued at net asset value and are categorized as Level 1 in the fair value hierarchy. |
| | |
| | The Board of Trustees (“Trustees”) has designated the Adviser as valuation designee to perform the Funds’ fair value determinations, subject to board oversight and certain reporting and other requirements. The Adviser has adopted policies and procedures reasonably designed to comply with the requirements. Among other things, these procedures allow the Funds to utilize independent pricing services, quotations from securities dealers, and other market sources to determine fair value. The Pricing Committee convenes regularly to review the fair value of financial instruments or other assets. If market quotations for a security or other asset are not readily available, or if the Adviser believes they do not otherwise reflect the fair value of a security or asset, the security or asset will be fair valued by the Pricing Committee in accordance with the Funds’ valuation policies and procedures. The Pricing Committee employs various methods for calibrating the valuation approaches utilized to determine fair value, including a regular review of key inputs and assumptions, periodic comparisons to valuations provided by other independent pricing services, transactional back-testing and disposition analysis. |
| | |
| | Certain factors such as economic conditions, political events, market trends, the nature of and duration of any restrictions on disposition, trading in similar securities of the issuer or comparable issuers and other security specific information are used to determine the fair value of these securities. Depending on the relative significance of valuation inputs, these securities may be categorized either as Level 2 or Level 3 in the fair value hierarchy. The price which the Funds may realize upon sale of an investment may differ materially from the value presented in the Schedules of Investments. |
| | |
| | A summary of the inputs and the levels used to value the Funds’ investments are located in the Schedules of Investments. Additionally, tables that reconcile the valuation of the Funds’ Level 3 investments and that |
| | |
| | |
| | present additional information about valuation methodologies and unobservable inputs, if applicable, are located in the Schedules of Investments. |
| | |
| B. | Federal Income Taxes— It is each Fund’s policy to comply with the provisions of the Internal Revenue Code applicable to regulated investment companies and to distribute all of its net investment income and net realized capital gains, if any, to its shareholders. Therefore, no federal income tax provision is required. |
| | |
| C. | Distributions to Shareholders— Dividends to shareholders from net investment income and distributions from net realized capital gains, if any, are declared and paid annually by each Fund (except for dividends from net investment income on Energy Income ETF and Pharmaceutical ETF, which are declared and paid quarterly). Income dividends, capital gain distributions and return of capital distributions, if any, are determined in accordance with U.S. income tax regulations, which may differ from such amounts determined in accordance with GAAP. |
| | |
| D. | Currency Translation— Assets and liabilities denominated in foreign currencies and commitments under foreign currency contracts are translated into U.S. dollars at the closing prices of such currencies each business day as quoted by one or more sources. Purchases and sales of investments are translated at the exchange rates prevailing when such investments are acquired or sold. Foreign denominated income and expenses are translated at the exchange rates prevailing when accrued. The portion of realized and unrealized gains and losses on investments that result from fluctuations in foreign currency exchange rates is not separately disclosed in the financial statements. Such amounts are included with the net realized and unrealized gains and losses on investment securities in the Statements of Operations. Recognized gains or losses attributable to foreign currency fluctuations on foreign currency denominated assets, other than investments, and liabilities are recorded as net realized gain (loss) and net change in unrealized appreciation (depreciation) on foreign currency transactions and foreign denominated assets and liabilities in the Statements of Operations. |
| | |
| E. | Restricted Securities— The Funds may invest in securities that are subject to legal or contractual restrictions on resale. These securities generally may be resold in transactions exempt from registration or to the public if the securities are registered. Disposal of these securities may involve time-consuming negotiations and expense, and prompt sale at an acceptable price may be difficult. Information regarding restricted securities, if any, is included at the end of each Fund’s Schedule of Investments. |
| | |
| F. | Master Limited Partnerships— The Energy Income ETF invests a portion of its total assets in Master Limited Partnerships (“MLPs”) receiving partnership taxation treatment under the Internal Revenue Code of 1986 (the “Code”), and whose interests or “units” are traded on securities exchanges like shares of corporate stock. To be treated as a partnership for U.S. federal income tax purposes, an MLP must receive at least 90% of its income from qualifying sources such as interest, dividends, real estate rents, gain from the sale or disposition of real property, income and gain from mineral or natural resources activities, income and gains from the transportation or storage of certain fuels, and, in certain circumstances, income and gains from commodities or futures, forwards and options with respect to commodities. The MLPs themselves generally do not pay U.S. federal income taxes (although some states do impose a net income tax on partnerships). The Fund invests the remainder of its assets in MLPs that are treated as C corporations for tax purposes. |
| | |
| G. | Offsetting Assets and Liabilities— In the ordinary course of business, the Funds enter into transactions subject to enforceable master netting or other similar agreements. Generally, the right of offset in those agreements allows the Funds to offset any exposure to a specific counterparty with any collateral received or delivered to that counterparty based on the terms of the agreements. The Funds may receive cash and or securities as collateral for securities lending. For financial reporting purposes, the Funds present securities lending assets and liabilities on a gross basis in the Statements of Assets and Liabilities. Cash collateral received for securities lending in the form of money market fund investments, if any, at September 30, 2024, is presented in the Schedules of Investments and in the Statements of Assets and Liabilities. Non-cash collateral is disclosed in Note 9 (Securities Lending). |
VANECK ETF TRUST
NOTES TO FINANCIAL STATEMENTS
(continued)
| H. | Other— Security transactions are accounted for on trade date. Realized gains and losses are determined based on the specific identification method. Dividend income is recorded on the ex-dividend date except that certain dividends from foreign securities are recognized upon notification of the ex-dividend date. Interest income, including amortization of premiums and discounts, is accrued as earned. |
| | |
| | The Funds earn interest income on uninvested cash balances held at the custodian bank. Such amounts, if any, are presented as interest income in the Statements of Operations. |
| | |
| | The character of distributions received from certain investments may be comprised of net investment income, capital gains, and return of capital. It is the Funds’ policy to estimate the character of distributions received from these investments based on historical data if actual amounts are not available. After each calendar year end, these investments report the actual tax character of these distributions. Differences between the estimated and actual amounts are reflected in the Funds’ records in the year in which they are reported by adjusting the related cost basis of investments, capital gains and income, as necessary. |
| | |
| | In the normal course of business, the Funds enter into contracts that contain a variety of general indemnifications. The Funds’ maximum exposure under these agreements is unknown as this would involve future claims that may be made against the Funds that have not yet occurred. However, the Adviser believes the risk of loss under these arrangements to be remote. |
Note 3—Investment Management and Other Agreements— The Adviser is the investment adviser to the Funds. The Adviser receives a management fee, calculated daily and payable monthly based on an annual rate of each Fund’s average daily net assets. The Adviser has agreed, until at least February 1, 2025, to waive fees and assume expenses to prevent each Fund’s total annual operating expenses (excluding acquired fund fees and expenses, interest expense, trading expenses, taxes and extraordinary expenses) from exceeding the expense limitations for the Funds listed in the table below.
The management fee rates and expense limitations for the year ended September 30, 2024, are as follows:
| Fund | | Management
Fees | | Expense
Limitations |
| Environmental Services ETF | | | 0.50 | % | | | 0.55 | % |
| Gaming ETF | | | 0.50 | | | | 0.65 | |
| Video Gaming and eSports ETF | | | 0.50 | | | | 0.55 | |
Refer to the Statements of Operations for amounts assumed by the Adviser.
The Funds listed in the table below utilize a unitary management fee structure where the Adviser is responsible for all expenses of the Funds, (excluding the fee payment under the investment management agreement, acquired fund fees and expenses, interest expense, trading expenses, taxes and extraordinary expenses) until February 1, 2025.
The unitary management fee rates for the year ended September 30, 2024, are as follows:
| Fund | | Management
Fee Rate |
| Biotech ETF | | | 0.35 | % |
| Digital Transformation ETF | | | 0.50 | |
| Energy Income ETF | | | 0.45 | |
| Fabless Semiconductor ETF | | | 0.35 | |
| Green Infrastructure ETF | | | 0.45 | |
| Pharmaceutical ETF | | | 0.35 | |
| Retail ETF | | | 0.35 | |
| Robotics ETF | | | 0.47 | |
| Semiconductor ETF | | | 0.35 | |
In addition, Van Eck Securities Corporation, an affiliate of the Adviser, acts as the Funds’ distributor (the “Distributor”). Certain officers and a Trustee of the Trust are officers, directors or stockholders of the Adviser and Distributor.
At September 30, 2024, the Adviser owned approximately 3% of Digital Transformation ETF.
Note 4—Capital Share Transactions— As of September 30, 2024, there were an unlimited number of capital shares of beneficial interest authorized by the Trust with no par value. Fund shares are not individually redeemable and are issued and redeemed at their net asset value per share only through certain authorized broker-dealers (“Authorized Participants”) in blocks of shares (“Creation Units”).
The consideration for the purchase or redemption of Creation Units of the Funds generally consists of the in-kind contribution or distribution of securities constituting the Funds’ underlying index (“Deposit Securities”) plus a balancing cash component to equate the transaction to the net asset value per share of the Fund on the transaction date. Cash may also be substituted in an amount equivalent to the value of certain Deposit Securities, generally as a result of market circumstances, or when the securities are not available in sufficient quantity for delivery, or are not eligible for trading by the Authorized Participant. The Funds may issue Creation Units in advance of receipt of Deposit Securities subject to various conditions, including, for the benefit of the Funds, a requirement to maintain cash collateral on deposit at the custodian equal to at least 115% of the daily marked to market value of the missing Deposit Securities.
Authorized Participants purchasing and redeeming Creation Units may pay transaction fees directly to the transfer agent. In addition, the Funds may impose variable fees on the purchase or redemption of Creation Units for cash, or on transactions effected outside the clearing process, to defray certain transaction costs. These variable fees, if any, are reflected in share transactions in the Statements of Changes in Net Assets.
Note 5—Investments— For the year ended September 30, 2024, purchases and sales of investments (excluding short-term investments and in-kind capital share transactions) and purchases and sales of investments resulting from in-kind capital share transactions (excluding short-term investments) were as follows:
| | | | | | | In-Kind Capital Share Transactions |
| Fund | | Purchases | | Sales | | Purchases | | Sales |
| Biotech ETF | | $ | 116,722,040 | | | $ | 83,433,621 | | | $ | 111,265,811 | | | $ | 202,585,140 | |
| Digital Transformation ETF | | | 74,925,695 | | | | 74,235,558 | | | | 64,214,327 | | | | 32,911,164 | |
| Energy Income ETF | | | 17,067,537 | | | | 12,469,005 | | | | 24,566,806 | | | | 20,604,165 | |
| Environmental Services ETF | | | 22,589,314 | | | | 17,316,551 | | | | 29,955,697 | | | | 50,913,164 | |
| Fabless Semiconductor ETF | | | 259,872 | | | | 494,334 | | | | 6,543,111 | | | | 391,769 | |
| Gaming ETF | | | 9,208,450 | | | | 10,240,247 | | | | — | | | | 15,373,651 | |
| Green Infrastructure ETF | | | 84,175 | | | | 518,149 | | | | 1,206,773 | | | | 785,406 | |
| Pharmaceutical ETF | | | 66,170,221 | | | | 62,423,704 | | | | 691,303,261 | | | | 482,287,019 | |
| Retail ETF | | | 16,743,697 | | | | 13,170,088 | | | | 59,781,589 | | | | 42,908,135 | |
| Robotics ETF | | | 2,231,707 | | | | 2,213,682 | | | | 11,444,002 | | | | — | |
| Semiconductor ETF | | | 3,015,259,426 | | | | 2,596,978,940 | | | | 38,981,197,036 | | | | 32,347,679,749 | |
| Video Gaming and eSports ETF | | | 96,147,700 | | | | 89,438,554 | | | | 44,909,793 | | | | 129,319,639 | |
VANECK ETF TRUST
NOTES TO FINANCIAL STATEMENTS
(continued)
Note 6—Income Taxes— As of September 30, 2024, for Federal income tax purposes, the identified cost, gross unrealized appreciation, gross unrealized depreciation and net unrealized appreciation (depreciation) of investments owned were as follows:
| Fund | | Tax Cost of
Investments | | Gross
Unrealized
Appreciation | | Gross
Unrealized
Depreciation | | Net Unrealized
Appreciation
(Depreciation) |
| Biotech ETF | | | | $433,272,965 | | | | | $56,946,397 | | | | | $(38,556,659 | ) | | | | $18,389,738 | |
| Digital Transformation ETF | | | | 128,192,801 | | | | | 31,879,364 | | | | | (9,550,137 | ) | | | | 22,329,227 | |
| Energy Income ETF | | | | 47,606,796 | | | | | 9,486,958 | | | | | (630,090 | ) | | | | 8,856,868 | |
| Environmental Services ETF | | | | 71,826,741 | | | | | 12,479,437 | | | | | (3,008,981 | ) | | | | 9,470,456 | |
| Fabless Semiconductor ETF | | | | 5,942,577 | | | | | 488,268 | | | | | (18,508 | ) | | | | 469,760 | |
| Gaming ETF | | | | 46,438,438 | | | | | 2,549,017 | | | | | (10,759,132 | ) | | | | (8,210,115) | |
| Green Infrastructure ETF | | | | 1,942,695 | | | | | 247,497 | | | | | (259,644 | ) | | | | (12,147) | |
| Pharmaceutical ETF | | | | 752,451,514 | | | | | 45,092,113 | | | | | (35,410,016 | ) | | | | 9,682,097 | |
| Retail ETF | | | | 200,045,129 | | | | | 40,563,035 | | | | | (17,471,659 | ) | | | | 23,091,376 | |
| Robotics ETF | | | | 14,498,449 | | | | | 1,827,751 | | | | | (646,990 | ) | | | | 1,180,761 | |
| Semiconductor ETF | | | | 24,094,316,283 | | | | | 1,311,410,887 | | | | | (1,672,047,163 | ) | | | | (360,636,276) | |
| Video Gaming and eSports ETF | | | | 251,605,427 | | | | | 50,752,402 | | | | | (38,042,993 | ) | | | | 12,709,409 | |
At September 30, 2024, the components of distributable earnings (loss) on a tax basis, for each Fund, were as follows:
| Fund | | Undistributed
Ordinary
Income | | (Accumulated
Capital Losses^)/
Undistributed
Capital Gains | | Other
Temporary
Differences | | | Unrealized
Appreciation
(Depreciation) | | Total
Distributable
Earnings (Loss) |
| Biotech ETF | | | $2,856,975 | | | | $(238,874,863) | | | | $(64,926) | | | | $18,389,738 | | | | $(217,693,076) | |
| Digital Transformation ETF | | | 4,218,370 | | | | (64,252,254) | | | | – | | | | 22,329,250 | | | | (37,704,634) | |
| Energy Income ETF | | | – | | | | – | | | | (465,058) | | | | 8,856,788 | | | | 8,391,730 | |
| Environmental Services ETF | | | 197,985 | | | | (26,581,853) | | | | (4,969) | | | | 9,470,456 | | | | (16,918,381) | |
| Fabless Semiconductor ETF | | | 2,261 | | | | (24,179) | | | | – | | | | 469,760 | | | | 447,842 | |
| Gaming ETF | | | 762,810 | | | | (26,900,175) | | | | (11,638) | | | | (8,209,784) | | | | (34,358,787) | |
| Green Infrastructure ETF | | | 9,527 | | | | (261,724) | | | | (1,799) | | | | (12,147) | | | | (266,143) | |
| Pharmaceutical ETF | | | 3,172,400 | | | | (165,321,334) | | | | (36,037) | | | | 9,682,096 | | | | (152,502,875) | |
| Retail ETF | | | 1,159,257 | | | | (31,829,908) | | | | (10,259) | | | | 23,091,376 | | | | (7,589,534) | |
| Robotics ETF | | | 329,465 | | | | 3,361 | | | | – | | | | 1,181,703 | | | | 1,514,529 | |
| Semiconductor ETF | | | 74,502,830 | | | | (1,204,034,337) | | | | (97,454) | | | | (360,636,276) | | | | (1,490,265,237) | |
| Video Gaming and eSports ETF | | | 1,222,631 | | | | (63,906,775) | | | | (15,169) | | | | 12,700,452 | | | | (49,998,861) | |
| ^ | These accumulated capital losses are available to offset future capital gains and have an unlimited expiration. |
During the year ended September 30, 2024, Digital Transformation ETF and Energy Income ETF utilized $5,660,523 and $1,440,420, respectively of their accumulated capital losses available from prior years. Additionally, $172,180 of Energy Income ETF’s accumulated capital losses from prior years expired un-utilized.
The tax character of dividends paid to shareholders was as follows:
| | | September 30, 2024 | | | September 30, 2023 | |
| Fund | | Ordinary
Income* | | | Return
of Capital | | | Ordinary
Income* | | | Return
of Capital | |
| Biotech ETF | | | $2,099,973 | | | | $– | | | | $2,299,941 | | | | $– | |
| Energy Income ETF | | | 327,149 | | | | 1,435,928 | | | | 674,492 | | | | 596,281 | |
| Environmental Services ETF | | | 725,000 | | | | – | | | | 284,988 | | | | – | |
| Gaming ETF | | | 799,988 | | | | – | | | | 424,958 | | | | – | |
| Green Infrastructure ETF | | | 15,998 | | | | – | | | | 3,000 | | | | – | |
| Pharmaceutical ETF | | | 9,117,032 | | | | – | | | | 8,998,067 | | | | – | |
| Retail ETF | | | 1,849,973 | | | | – | | | | 1,700,040 | | | | – | |
| Robotics ETF | | | 61,373 | | | | – | | | | – | | | | – | |
| Semiconductor ETF | | | 68,496,917 | | | | – | | | | 70,999,820 | | | | – | |
| Video Gaming and eSports ETF | | | 2,439,900 | | | | – | | | | 2,252,275 | | | | – | |
| * | Includes short-term capital gains (if any). |
During the year ended September 30, 2024, as a result of permanent book to tax differences primarily due to the tax treatment of in-kind redemptions, and taxable overdistributions the Funds incurred differences that affected distributable earnings (loss) and aggregate paid in capital by the amounts in the table below. Net assets were not affected by these reclassifications.
| Fund | | Increase
(Decrease)
in Total Distributable
Earnings (Loss) | | Increase
(Decrease)
in Aggregate
Paid in Capital |
| Biotech ETF | | | $ | (49,236,263 | ) | | | $ | 49,236,263 | |
| Digital Transformation ETF | | | | (18,535,031 | ) | | | | 18,535,031 | |
| Energy Income ETF | | | | (5,281,169 | ) | | | | 5,281,169 | |
| Environmental Services ETF | | | | (12,123,030 | ) | | | | 12,123,030 | |
| Fabless Semiconductor ETF | | | | (49,876 | ) | | | | 49,876 | |
| Gaming ETF | | | | 1,711,357 | | | | | (1,711,357 | ) |
| Green Infrastructure ETF | | | | (213,599 | ) | | | | 213,599 | |
| Pharmaceutical ETF | | | | (59,118,660 | ) | | | | 59,118,660 | |
| Retail ETF | | | | (15,094,106 | ) | | | | 15,094,106 | |
| Semiconductor ETF | | | | (6,763,616,348 | ) | | | | 6,763,616,348 | |
| Video Gaming and eSports ETF | | | | (55,385,405 | ) | | | | 55,385,405 | |
The Funds recognize the tax benefits of uncertain tax positions only where the position is “more-likely-than-not” to be sustained assuming examination by applicable tax authorities. Management has analyzed the Funds’ tax positions, and has concluded that no liability for unrecognized tax benefits should be recorded related to uncertain tax positions taken on return filings for all open tax years. The Funds do not have exposure for additional years that might still be open in certain foreign jurisdictions. Therefore, no provision for income tax is required in the Funds’ financial statements. However, certain Funds are subject to foreign taxes on the appreciation in value of certain investments. The Funds provide for such taxes on both realized and unrealized appreciation.
The Funds recognize interest and penalties, if any, related to uncertain tax positions as income tax expense in the Statements of Operations. During the year ended September 30, 2024, the Funds did not incur any interest or penalties.
Note 7—Principal Risks— Non-diversified funds generally hold securities of fewer issuers than diversified funds (See Note 1) and may be more susceptible to the risks associated with these particular issuers, or to a single economic, political or regulatory occurrence affecting these issuers. In addition, to the extent that a Fund is concentrated in a particular sector or industry, the Fund will be subject to the risk that economic, political or other conditions that have a negative effect on those sectors and or industries may negatively impact the Fund to a greater extent than if the Fund’s assets were invested in a wider variety of sectors or industries. The Funds may purchase securities on foreign exchanges. Securities of foreign issuers involve
VANECK ETF TRUST
NOTES TO FINANCIAL STATEMENTS
(continued)
special risks and considerations not typically associated with investing in U.S. issuers. These risks include devaluation of currencies, currency controls, less reliable information about issuers, different securities transaction clearance and settlement practices, future adverse economic developments and political conflicts, or natural or other disasters, such as the coronavirus outbreak. Additionally, certain Funds may invest in securities of emerging market issuers, which are exposed to a number of risks that may make these investments volatile in price or difficult to trade. Political risks may include unstable governments, nationalization, restrictions on foreign ownership, laws that prevent investors from getting their money out of a country, sanctions and investment restrictions and legal systems that do not protect property risks as well as the laws of the United States. These and other factors can make emerging market securities more volatile and potentially less liquid than securities issued in more developed markets. Certain securities of Chinese issuers are, or may in the future become restricted, and the Funds may be forced to sell such restricted securities and incur a loss as a result.
Certain of the Funds’ investments, including investments in companies that hold material amounts of digital assets, may be subject to the risks associated with investing in digital assets, including cryptocurrencies and crypto tokens. Such companies may be subject to the risk that: the technology that facilitates the transfer of a digital asset could fail; the decentralized, open source protocol of the applicable blockchain network could be affected by internet connectivity disruptions, fraud, consensus failures or cybersecurity attacks; such network may not be adequately maintained by its participants; because digital assets are a new technological innovation with a limited history, they are highly speculative assets and may experience extreme price volatility; future regulatory actions or policies may limit the ability to sell, exchange or use a digital asset; the price of a digital asset may be impacted by the transactions of a small number of holders of such digital asset; and that a digital asset will decline in popularity, acceptance or use, thereby impairing its price.
Under normal circumstances, the Energy Income ETF invests in securities of MLPs, which are subject to certain risks, such as supply and demand risk, depletion and exploration risk, and the risk associated with the hazards inherent in midstream energy industry activities. A portion of the cash flow received by the Fund is derived from investment in equity securities of MLPs. The amount of cash than an MLP has available for distributions and the tax character of such distributions are dependent upon the amount of cash generated by the MLP’s operations.
The Green Infrastructure ETF may invest in securities of oil and gas companies whose profitability is related to worldwide energy prices, including all sources of energy, and exploration and production costs. The price of oil and gas, the earnings of oil and gas companies, and the value of such companies’ securities can be extremely volatile. In addition, the Fund invests in green infrastructure companies and performance will be impacted on the overall condition of these companies. Green infrastructure related companies are subject to a variety of factors that may adversely affect their business such as higher interest costs, cost of compliance with changes in environmental and other regulations and uncertainty concerning the availability of energy. Additionally, the Fund’s investments may be dependent on supportive government policies, including tax incentives and subsidies, and the support for such policies may fluctuate over time. If government subsidies and incentives for renewable energy sources are reduced or eliminated, the demand for renewable energy may decline and cause corresponding declines in the revenues and profits of renewable energy companies.
The Robotics ETF invests primarily in the securities of robotics companies and is particularly sensitive to the risks to such companies. Robotics companies and information technology companies may rely on a combination of patents, copyrights, trademarks and trade secret laws to establish and protect their proprietary rights in their products and technologies. There can be no assurance that the steps taken by these companies to protect their proprietary rights will be adequate to prevent the misappropriation of their technology. The products of information technology companies may face product obsolescence due to rapid technological developments and frequent new product introduction, unpredictable changes in growth rates and competition for the services of qualified personnel.
A more complete description of risks is included in each Fund’s Prospectus and Statement of Additional Information.
Note 8—Trustee Deferred Compensation Plan— The Trust has a Deferred Compensation Plan (the “Plan”) for Trustees under which a Trustee can elect to defer receipt of their trustee fees until retirement, disability or termination from the Board. The fees otherwise payable to the participating Trustees are deemed invested in shares of the Funds of the Trust as directed by the Trustees.
A unitary management fee was adopted on October 1, 2021, for Biotech ETF, Pharmaceutical ETF, Retail ETF, and Semiconductor ETF. For these Funds, the liability for the Plan shown as “Deferred Trustee fees” in the Statements of Assets and Liabilities represents amounts accrued through September 30, 2021. Digital Transformation ETF, Energy Income ETF, Fabless Semiconductor ETF, Green Infrastructure ETF and Robotics ETF commenced operations with a unitary management fee and therefore bear no costs or liabilities relative to the Plan.
For Environmental Services ETF, Gaming ETF, and Video Gaming and eSports ETF, the expense for the Plan is included in “Trustees’ fees and expenses” in the Statements of Operations, and the liability for the Plan is shown as “Deferred Trustee fees” in the Statements of Assets and Liabilities.
Note 9—Securities Lending— To generate additional income, each of the Funds may lend its securities pursuant to a securities lending agreement with the securities lending agent. Each Fund may lend up to 33% of its investments requiring that the loan be continuously collateralized by cash, cash equivalents, U.S. government securities, or any combination of cash and such securities at all times equal to at least 102% (105% for foreign securities) of the market value on the securities loaned. Daily market fluctuations could cause the value of loaned securities to be more or less than the value of the collateral received. When this occurs, the collateral is adjusted and settled on the next business day. During the term of the loan, the Funds will continue to receive any dividends, interest or amounts equivalent thereto, on the securities loaned while receiving a fee from the borrower and or earning interest on the investment of the cash collateral. Such fees and interest are shared with the securities lending agent under the terms of the securities lending agreement. Securities lending income is disclosed as such in the Statements of Operations. Cash collateral is maintained on the Funds’ behalf by the lending agent and is invested in the State Street Navigator Securities Lending Government Money Market Portfolio. Non-cash collateral consists of U.S. Treasuries and U.S. Government Agency securities, and is not disclosed in the Funds’ Schedules of Investments or Statements of Assets and Liabilities as it is held by the agent on behalf of the Funds. The Funds do not have the ability to re-hypothecate those securities. Loans are subject to termination at the option of the borrower or the Funds. Upon termination of the loan, the borrower will return to the Fund securities identical to the securities loaned. The Funds bear the risk of delay in recovery of, or even loss of rights in, the securities loaned should the borrower of the securities fail financially. The value of loaned securities and related collateral, if any, at September 30, 2024 are presented on a gross basis in the Schedules of Investments and Statements of Assets and Liabilities. The following is a summary of the Funds’ securities on loan and related collateral as of September 30, 2024.
| Fund | | Market Value
of Securities
on Loan | | Cash
Collateral | | Non-Cash
Collateral | | Total
Collateral |
| Biotech ETF | | $ | 23,574,085 | | | $ | – | | | $ | 23,632,777 | | | $ | 23,632,777 | |
| Digital Transformation ETF | | | 36,730,000 | | | | 15,879,709 | | | | 24,179,329 | | | | 40,059,038 | |
| Environmental Services ETF | | | 4,526,590 | | | | 1,894,108 | | | | 2,783,842 | | | | 4,677,950 | |
| Gaming ETF | | | 1,056,430 | | | | – | | | | 1,046,286 | | | | 1,046,286 | |
| Green Infrastructure ETF | | | 132,973 | | | | 33,105 | | | | 108,128 | | | | 141,233 | |
| Pharmaceutical ETF | | | 99,136,053 | | | | 37,156,818 | | | | 65,621,029 | | | | 102,777,847 | |
| Retail ETF | | | 779,117 | | | | – | | | | 803,577 | | | | 803,577 | |
| Robotics ETF | | | 54,956 | | | | 34,314 | | | | 74,724 | | | | 109,038 | |
| Semiconductor ETF | | | 51,001,815 | | | | 24,835,082 | | | | 28,559,417 | | | | 53,394,499 | |
| Video Gaming and eSports ETF | | | 16,994,429 | | | | 678,608 | | | | 16,784,708 | | | | 17,463,316 | |
VANECK ETF TRUST
NOTES TO FINANCIAL STATEMENTS
(continued)
The following table presents money market fund investments held as collateral by type of security on loan as of September 30, 2024:
| | | Gross Amount of
Recognized Liabilities
for Securities Lending
Transactions* in the
Statements of Assets
and Liabilities |
| Fund | | Equity Securities |
| Digital Transformation ETF | | | | 15,879,709 | |
| Environmental Services ETF | | | | 1,894,108 | |
| Green Infrastructure ETF | | | | 33,105 | |
| Pharmaceutical ETF | | | | 37,156,818 | |
| Robotics ETF | | | | 34,314 | |
| Semiconductor ETF | | | | 24,835,082 | |
| Video Gaming and eSports ETF | | | | 678,608 | |
| * | Remaining contractual maturity: overnight and continuous |
Note 10—Bank Line of Credit— The Funds may participate in a $200 million committed credit facility (the “Facility”) to be utilized for temporary financing for the settlement of sales or purchases of portfolio securities, the repurchase or redemption of shares of the Funds at the request of the shareholders and other temporary or emergency purposes. The Funds have agreed to pay commitment fees, pro rata, based on the unused but available balance. Interest is charged to the Funds based on prevailing market rates in effect at the time of borrowings. During the year ended September 30, 2024, the following Funds borrowed under this Facility:
| Fund | | Days
Outstanding | | Average
Daily
Loan Balance | | Average
Interest Rate |
| Biotech ETF | | | 54 | | | | $216,129 | | | | 6.68 | % |
| Digital Transformation ETF | | | 220 | | | | 155,213 | | | | 6.68 | |
| Energy Income ETF | | | 176 | | | | 233,354 | | | | 6.66 | |
| Environmental Services ETF | | | 16 | | | | 689,834 | | | | 6.68 | |
| Gaming ETF | | | 46 | | | | 720,272 | | | | 6.64 | |
| Pharmaceutical ETF | | | 307 | | | | 1,109,511 | | | | 6.68 | |
| Retail ETF | | | 149 | | | | 235,460 | | | | 6.65 | |
| Semiconductor ETF | | | 134 | | | | 4,944,680 | | | | 6.67 | |
| Video Gaming and eSports ETF | | | 241 | | | | 402,121 | | | | 6.67 | |
Outstanding loan balances as of September 30, 2024, if any, are reflected in the Statements of Assets and Liabilities.
Note 11—Share Split— The Energy Income ETF executed a 1-for-3 reverse share split for shareholders of record before the open of markets on April 15, 2020. The Semiconductor ETF executed a 2-for-1 share split for shareholders of record before the open of markets on May 5, 2023. The impacts of the share splits have been retroactively applied to each of the prior years presented in the financials highlights.
VANECK ETF TRUST
REPORT OF INDEPENDENT REGISTERED PUBLIC ACCOUNTING FIRM
To the Board of Trustees of VanEck ETF Trust and Shareholders of each of the twelve funds listed in the table below
Opinions on the Financial Statements
We have audited the accompanying statements of assets and liabilities, including the schedules of investments, of each of the funds listed in the table below, (twelve of the funds constituting VanEck ETF Trust, hereafter collectively referred to as the “Funds”) as of September 30, 2024, the related statements of operations and of changes in net assets for each of the periods indicated in the table below, including the related notes, and the financial highlights for each of the periods indicated in the table below (collectively referred to as the “financial statements”). In our opinion, the financial statements present fairly, in all material respects, the financial position of each of the Funds listed in the table below as of September 30, 2024, the results of each of their operations, the changes in each of their net assets and each of the financial highlights for each of the periods indicated in the table below, in conformity with accounting principles generally accepted in the United States of America.
Funds
| VanEck Biotech ETF (1) | VanEck Retail ETF (1) |
| VanEck Digital Transformation ETF (1) | VanEck Semiconductor ETF (1) |
| VanEck Energy Income ETF (1) | VanEck Video Gaming and eSports ETF (1) |
| VanEck Environmental Services ETF (1) | VanEck Green Infrastructure ETF (4) |
| VanEck Fabless Semiconductor ETF (2) | VanEck Robotics ETF (3) |
| VanEck Gaming ETF (1) | VanEck Pharmaceutical ETF (1) |
(1) Statement of operations for the year ended September 30, 2024, statement of changes in net assets for the years ended September 30, 2024 and 2023, and financial highlights for the years ended September 30, 2024, 2023 and 2022.
(2) Statement of operations, statement of changes in net assets, and financial highlights for the period August 28, 2024 (commencement of operations) through September 30, 2024.
(3) Statement of operations for the year ended September 30, 2024 and statement of changes in net assets and financial highlights for the year ended September 30, 2024 and the period April 6, 2023 (commencement of operations) through September 30, 2023.
(4) Statement of operations for the year ended September 30, 2024 and statement of changes in net assets and financial highlights for the year ended September 30, 2024 and the period October 19, 2022 (commencement of operations) through September 30, 2023.
The financial statements of the Funds (other than VanEck Fabless Semiconductor ETF, VanEck Green Infrastructure ETF and VanEck Robotics ETF) as of and for the year or period ended September 30, 2021 and the financial highlights for each of the periods ended on or prior to September 30, 2021 (not presented herein, other than the financial highlights) were audited by other auditors whose reports dated November 19, 2021, except for the 2-for-1 share split described in Note 11, as to which the date is November 22, 2023, expressed an unqualified opinion on those financial statements and financial highlights.
Basis for Opinions
These financial statements are the responsibility of the Funds’ management. Our responsibility is to express an opinion on the Funds’ financial statements based on our audits. We are a public accounting firm registered with the Public Company Accounting Oversight Board (United States) (PCAOB) and are required to be independent with respect to the Funds in accordance with the U.S. federal securities laws and the applicable rules and regulations of the Securities and Exchange Commission and the PCAOB.
VANECK ETF TRUST
REPORT OF INDEPENDENT REGISTERED PUBLIC ACCOUNTING FIRM (continued)
We conducted our audits of these financial statements in accordance with the standards of the PCAOB. Those standards require that we plan and perform the audit to obtain reasonable assurance about whether the financial statements are free of material misstatement, whether due to error or fraud.
Our audits included performing procedures to assess the risks of material misstatement of the financial statements, whether due to error or fraud, and performing procedures that respond to those risks. Such procedures included examining, on a test basis, evidence regarding the amounts and disclosures in the financial statements. Our audits also included evaluating the accounting principles used and significant estimates made by management, as well as evaluating the overall presentation of the financial statements. Our procedures included confirmation of securities owned as of September 30, 2024, by correspondence with the custodian, transfer agent and brokers; when replies were not received from brokers, we performed other auditing procedures. We believe that our audits provide a reasonable basis for our opinions.
/s/PricewaterhouseCoopers LLP
New York, New York
November 20, 2024
We have served as the auditor of one or more investment companies in the VanEck Funds complex since 2022.
VANECK ETF TRUST
TAX INFORMATION
(unaudited)
The information set forth below relates to distributions paid during each Fund’s current fiscal year as required by federal laws. Shareholders, however, must report dividends on a calendar year basis for income tax purposes, which may include dividends for portions of two fiscal years of a Fund.
Accordingly, the information needed by shareholders for calendar year 2024 income tax purposes will be sent to them in early 2025. Please consult your tax advisor for proper treatment of this information.
The following information is provided with respect to the distributions paid during the taxable year ended September 30, 2024:
| Fund | | Ordinary
Income
Amount Paid
Per Share | | Qualified
Dividend
Income for
Individuals * | | Dividends
Qualifying for
the Dividend
Received
Deduction for
Corporations * | | Foreign
Source
Income * | | Foreign
Taxes
Paid Per
Share ** |
| Biotech ETF | | $ | 0.7127 | | | | 100.00 | % | | | 100.00 | % | | | - | % | | $ | - | |
| Energy Income ETF | | | 0.5451 | | | | 100.00 | | | | 66.30 | | | | - | | | | - | |
| Environmental Services ETF | | | 1.4500 | | | | 92.83 | | | | 82.06 | | | | - | | | | - | |
| Gaming ETF | | | 0.7111 | | | | 63.44 | | | | 7.32 | | | | 58.35 | | | | 0.0242 | |
| Green Infrastructure ETF | | | 0.2133 | | | | 84.44 | | | | 79.77 | | | | - | | | | - | |
| Pharmaceutical ETF | | | 1.5358 | | | | 100.00 | | | | 66.16 | | | | - | | | | - | |
| Retail ETF | | | 2.0075 | | | | 100.00 | | | | 100.00 | | | | - | | | | - | |
| Robotics ETF | | | 0.8183 | | | | 23.37 | | | | 13.18 | | | | - | | | | - | |
| Semiconductor ETF | | | 1.0427 | | | | 100.00 | | | | 96.56 | | | | - | | | | - | |
| Video Gaming and eSports ETF | | | 0.5422 | | | | 73.84 | | | | 12.25 | | | | 83.38 | | | | 0.0404 | |
| Fund | | Return of
Capital Per
Share *** | | Qualified
Short-Term
Capital Gains
Per Share **** | | Qualified
Business
Income ***** |
| Gaming ETF | | $ | - | | | $ | - | | | | 23.82 | % |
| Energy Income ETF | | | 2.3017 | | | | - | | | | - | |
| Robotics ETF | | | - | | | | 0.6716 | | | | - | |
* Expressed as a percentage of the cash distribution grossed up for foreign taxes.
** The foreign taxes paid represent taxes incurred by the Fund on income received by the Fund from foreign sources. Foreign taxes paid may be included in taxable income with an offsetting deduction from gross income or may be taken as a credit for taxes paid to foreign governments. You should consult your tax advisor regarding the appropriate treatment of foreign taxes paid.
*** A return of capital is not considered taxable income to shareholders. Pursuant to IRC Section 301(c), the portion of a distribution which is a dividend (as defined under IRC Section 316) is includable in gross income while the portion of the distribution which is not a dividend shall be applied against and reduces the adjusted basis of the stock. In order to compute the required adjustment to cost basis, a shareholder should use the more detailed information provided on Form 8937 – Organizational Actions Affecting Basis provided on the funds’ website at www.vaneck.com.
**** These amounts represent Qualified Short-Term Capital Gains (“QSTG”) which may be exempt from United States withholding tax when distributed to non-U.S. shareholders with proper documentation.
***** Qualifed Business Income (QBI) under Section 199A represents the percentage of ordinary income distributions that is eligible for the Section 199A deduction. Section 199A allows a deduction of up to 20% on QBI for non-corporate taxpayers. Tax regulations enable a regulated investment company to flow-through QBI received from pass through entities such as real estate investment trusts, to its shareholders.
Please retain this information for your records.
| Changes In and Disagreements with Accountants | For the period covered by this report |
| There were no changes in or disagreements with accountants. | |
| | |
| Proxy Disclosures | For the period covered by this report |
| Not applicable. | |
| | |
| Remuneration Paid to Directors, Officers, and Others | For the period covered by this report |
| Refer to the financial statements included herein. | |
VANECK ETF TRUST
APPROVAL OF INVESTMENT ADVISORY CONTRACTS
(unaudited)
At a meeting held on June 7, 2024 (the “Renewal Meeting”), the Board of Trustees (the “Board”) of VanEck® ETF Trust (the “Trust,” and the series thereof listed below, the “Funds”), including all of the Trustees that are not interested persons of the Trust (the “Independent Trustees”), approved the continuation of (i) the investment management agreements between the Trust and Van Eck Associates Corporation (“VEAC”) (the “VEAC Investment Management Agreements”) with respect to the VanEck Biotech ETF, Digital Transformation ETF, Durable High Dividend ETF, Energy Income ETF, Environmental Services ETF, Gaming ETF, Green Infrastructure ETF, Long/Flat Trend ETF, Morningstar ESG Moat ETF, Morningstar Global Wide Moat ETF, Morningstar International Moat ETF, Morningstar SMID Moat ETF, Morningstar Wide Moat ETF, Morningstar Wide Moat Growth ETF, Morningstar Wide Moat Value ETF, Pharmaceutical ETF, Retail ETF, Robotics ETF, Semiconductor ETF, Social Sentiment ETF and Video Gaming and eSports ETF and (ii) the investment management agreements between the Trust and Van Eck Absolute Return Advisers Corporation (“VEARA,” and together with VEAC, the “Advisers”) (the “VEARA Investment Management Agreements”) with respect to the VanEck Commodity Strategy ETF and Inflation Allocation ETF. The VEAC Investment Management Agreements and the VEARA Investment Management Agreements are collectively referred to as the “Investment Management Agreements.”
The Board’s approval of the Investment Management Agreements was based on a comprehensive consideration of all of the information available to the Trustees and was not the result of any single factor. Some of the factors that figured particularly in the Trustees’ deliberations and how the Trustees considered those factors are described below, although individual Trustees may have evaluated the information presented differently, giving different weights to various factors.
In preparation for the Renewal Meeting, the Trustees held a meeting on May 3, 2024. At that meeting, the Trustees discussed the information the Advisers and Broadridge Financial Solutions, Inc. (“Broadridge”), an independent third-party data provider, had provided to them in advance. The information provided to the Trustees included, among other things, information about the performance and expenses of the Funds (except for the VanEck Morningstar Wide Moat Growth ETF and Morningstar Wide Moat Value ETF, which had only recently commenced operations) (each, a “Covered Fund” and together, the “Covered Funds”) and the Covered Funds’ peer funds (certain other registered funds), information about the advisory services provided to the Funds and the personnel providing those services, and the profitability (or the absence of profitability) and other benefits enjoyed by the Advisers and their respective affiliates as a result of the Advisers’ relationships with the Funds. In reviewing performance information for the Covered Funds against their peer groups, the Trustees considered that each Covered Fund, except the VanEck Commodity Strategy ETF and Inflation Allocation ETF, has a different investment objective than the funds in its designated peer group and, therefore, each such Covered Fund’s performance will differ from its peers. The Trustees also considered the fact that each of the VanEck Morningstar Wide Moat Growth ETF and Morningstar Wide Moat Value ETF had only recently commenced operations and therefore each had a limited operational history that could be used for comparative purposes, since tracking error measurements and the performance comparisons provided by Broadridge were not available for each Fund. In addition, as noted below, the Trustees reviewed certain performance information for each Covered Fund which was not provided by Broadridge and which did not compare each Covered Fund’s performance to the performance of its peer group. The Trustees noted that the peer group performance information did not necessarily provide meaningful direct comparisons to the Covered Funds.
The Independent Trustees’ consideration of the Investment Management Agreements was based, in part, on their review of information obtained through discussions with the Advisers at the Renewal Meeting and the May 3, 2024 meeting regarding the management of the Funds and information obtained at other meetings of the Trustees and/or based on their review of the materials provided by the Advisers, including the background and experience of the portfolio managers and others involved in the management and administration of the Funds. The Trustees considered the terms of, and scope of services that the Advisers provide under, the Investment Management Agreements, including, where applicable, (i) with respect to the VanEck Environmental Services ETF, Gaming ETF, Inflation Allocation ETF, Long/Flat Trend ETF, Morningstar ESG Moat ETF, Morningstar Global Wide Moat ETF, Morningstar International Moat ETF, Morningstar SMID Moat ETF, Morningstar Wide Moat ETF, Morningstar Wide Moat Growth ETF, Morningstar Wide Moat Value
VANECK ETF TRUST
APPROVAL OF INVESTMENT ADVISORY CONTRACTS
(unaudited) (continued)
ETF and Video Gaming and eSports ETF (the “Non-Unitary Funds”), the Advisers’ commitment to waive certain fees and/or pay expenses of each of the Non-Unitary Funds (inclusive of any subsidiary expenses with respect to the VanEck Inflation Allocation ETF, but excluding acquired fund fees and expenses, interest expense, trading expenses, taxes and extraordinary expenses for all Non-Unitary Funds) to the extent necessary to prevent the operating expenses of each of the Non-Unitary Funds from exceeding agreed upon limits for a period of time and (ii) with respect to all the other Funds (the “Unitary Funds”), the Advisers’ agreement to pay all of the direct expenses of the Unitary Funds (inclusive of any subsidiary expenses with respect to the VanEck Commodity Strategy ETF, but excluding the fee payment under the Investment Management Agreements, acquired fund fees and expenses, interest expense, offering costs, trading expenses, taxes and extraordinary expenses for all other Unitary Funds).
The Trustees concluded that the Advisers and their personnel have the requisite expertise and skill to manage the Funds’ portfolios. In evaluating the performance of each Covered Fund, the Trustees reviewed various performance metrics, including various data from Broadridge comparing each Covered Fund’s performance to that of certain other registered funds, but relied principally on a comparison of the “gross” performance of each Covered Fund except for VanEck Commodity Strategy ETF and Inflation Allocation ETF (i.e., measured without regard to the impact of fees and expenses) to the performance of its benchmark index, in each case incorporating any systematic fair value adjustments to the underlying securities. The Trustees considered information from VEARA regarding the performance of the VanEck Commodity Strategy ETF and Inflation Allocation ETF, each an actively managed ETF, against their respective benchmark indices and peer funds. The Trustees noted that the VanEck Commodity Strategy ETF had outperformed its benchmark for the one-year period ended December 31, 2023 and the period since its inception on December 20, 2022 through December 31, 2023. The Trustees also noted that the VanEck Inflation Allocation ETF had outperformed its benchmark during the one-year period ended December 31, 2023 but had underperformed its benchmark for the three-year period ended December 31, 2023 and the period since its inception on April 9, 2018 through December 31, 2023. The Trustees further considered the Adviser’s observation that the Fund continued to deliver positive performance on an absolute basis over these periods and provided diversified and dynamic exposure to the principal inflation-protection assets during the one-year period ended December 31, 2023.
The Trustees also considered information relating to the financial condition of the Advisers and the current status, as they understood it, of the Advisers’ compliance environment.
As noted above, the Trustees were also provided with various data from Broadridge comparing the Covered Funds’ expenses to that of certain other registered funds. The Trustees noted that the information provided showed that each Covered Fund (except as noted below) had management fees (after the effect of any applicable fee waiver) below the average and median of its respective peer group of funds, each of the VanEck Commodity Strategy ETF, Morningstar International Moat ETF and Morningstar Wide Moat ETF had management fees (after the effect of any applicable fee waiver) above the average and median of its respective peer group of funds, the VanEck Energy Income ETF had management fees below the average and equal to the median of its peer group of funds, and the VanEck Green Infrastructure ETF had management fees above the average and equal to the median of its peer group of funds. The Trustees also noted that the information provided showed that each Covered Fund (except as noted below) had a total expense ratio (after the effect of any applicable expense limitation) below the average and median of its respective peer group of funds, each of the VanEck Gaming ETF, Morningstar ESG Moat ETF, Morningstar Global Wide Moat ETF, Morningstar International Moat ETF, Morningstar Wide Moat ETF and Social Sentiment ETF had a total expense ratio (after the effect of any applicable expense limitation) above the average and median of its respective peer group of funds, each of the VanEck Energy Income ETF, Environmental Services ETF and Green Infrastructure ETF had a total expense ratio (after the effect of any applicable expense limitation) below the average and equal to the median of its respective peer group of funds, and the VanEck Long/Flat Trend ETF had a total expense ratio (after the effect of the expense limitation) above the average and equal to the median of its peer group of funds. The Trustees reviewed the amounts by which certain Covered Funds’ management fees and/or total expense ratios (after the effect of any applicable fee waivers and/or expense limitations) exceeded the average and/or median of their respective peer groups and information
provided by the Advisers providing context for these comparisons. The Trustees concluded, in light of this information and the other information available to them, that the management fees paid by the Covered Funds were reasonable in light of the performance of the Covered Funds and the quality of services received.
The Trustees also considered the benefits, other than the fees under the Investment Management Agreements, received by the Advisers from serving as advisers to the Funds.
The Trustees also considered information provided by the Advisers about their overall profitability and profitability or loss in respect of each Covered Fund. The Trustees reviewed each Covered Fund’s asset size, expense ratio and expense cap, as applicable, and noted that the Investment Management Agreements do not include breakpoints in the advisory fee rates as asset levels in a Covered Fund increase. The Trustees considered the potential variability in the net assets of the Covered Funds and the sustainability of any potential economies of scale which may exist given where fees are currently set. The Trustees also evaluated the extent to which management fees for the Covered Funds may effectively incorporate the benefits of economies of scale. The Trustees also considered the risks being assumed by the Advisers under the unitary fee structure arrangement and the potential expense stability that may inure to the benefit of shareholders of the Unitary Funds and noted that the Advisers have capped expenses on each of the Non-Unitary Funds since its inception, although the cap was not necessarily exceeded each year. Based on the foregoing and the other information available to them, the Trustees determined that the advisory fee rate for each Covered Fund is reasonable and appropriate in relation to the current asset size of each Covered Fund and the other factors discussed above and that the advisory fee rate for each Covered Fund currently reflects an appropriate sharing with shareholders of any economies of scale which may exist. The Trustees also determined that the profits earned by the Advisers with respect to the Covered Funds that were profitable to the Advisers were reasonable in light of the nature and quality of the services received by such Covered Funds.
The Trustees did not consider historical information about the cost of the services provided by VEAC or the profitability of the VanEck Morningstar Wide Moat Growth ETF and Morningstar Wide Moat Value ETF to VEAC because the Funds had only recently commenced operations. The Trustees could not consider the historical performance or actual management fees or operating expenses of, or the quality of services previously provided to the VanEck Morningstar Wide Moat Growth ETF and Morningstar Wide Moat Value ETF by VEAC, although they concluded that the nature, quality and extent of the services to be provided by VEAC were appropriate based on the Trustees’ knowledge of VEAC and its personnel and the operations of the other series of the Trust.
The Independent Trustees were advised by and met in executive session with their independent counsel at the Renewal Meeting and at their May 3, 2024 meeting as part of their consideration of the Investment Management Agreements.
In voting to approve the continuation of the Investment Management Agreements, the Trustees, including the Independent Trustees, concluded that the terms of each of the Investment Management Agreements are reasonable and fair in light of the services to be performed, expenses to be incurred and such other matters as the Trustees considered relevant in the exercise of their reasonable judgment. The Trustees further concluded that, at the time of their considerations, each of the Investment Management Agreements is in the best interest of the applicable Fund and the Fund’s shareholders.
VanEck Fabless Semiconductor ETF
At a meeting held on June 7, 2024 (the “Meeting”), the Board of Trustees (the “Board”) of VanEck® ETF Trust (the “Trust”), including all of the Trustees that are not interested persons of the Trust (the “Independent Trustees”), considered and approved the investment management agreement between the Trust and Van Eck Associates Corporation (the “Adviser”) (the “Investment Management Agreement”) with respect to the VanEck Fabless Semiconductor ETF (the “Fund”).
The Board’s approval of the Investment Management Agreement was based on a comprehensive consideration of all of the information available to the Trustees and was not the result of any single factor.
VANECK ETF TRUST
APPROVAL OF INVESTMENT ADVISORY CONTRACTS
(unaudited) (continued)
Some of the factors that figured particularly in the Trustees’ deliberations and how the Trustees considered those factors are described below, although individual Trustees may have evaluated the information presented differently, giving different weights to various factors.
In advance of the Meeting, the Trustees received materials from the Adviser, including expense information for other funds. The Adviser provided the Trustees with information regarding, among other things, the various aspects of the Fund’s proposed investment programs, fee arrangements and service provider arrangements. The Independent Trustees’ consideration of the Investment Management Agreement was based, in part, on their review of information obtained through discussions with the Adviser at the Meeting regarding the proposed management of the Fund and information obtained at other meetings of the Trustees and/or based on their review of the materials provided by the Adviser, including the background and experience of the portfolio managers and others proposed to be involved in the management and administration of the Fund. The Trustees also considered the terms of, and scope of services that the Adviser would provide under, the Investment Management Agreement, including the Adviser’s agreement to pay all of the direct expenses of the Fund, excluding the fee payment under the Investment Management Agreement, acquired fund fees and expenses, interest expense, offering costs, trading expenses, taxes and extraordinary expenses. The Trustees concluded that the Adviser and its personnel have the requisite expertise and skill to manage the Fund’s portfolio.
The Trustees considered the benefits, other than the fees under the Investment Management Agreement, that the Adviser would receive from serving as adviser to the Fund. The Trustees did not consider historical information about the cost of the services provided by the Adviser or the profitability of the Fund to the Adviser because the Fund had not yet commenced operations. The Trustees could not consider the historical performance or actual management fees or operating expenses of, or the quality of services previously provided to, the Fund by the Adviser, although they concluded that the nature, quality, and extent of the services to be provided by the Adviser were appropriate based on the Trustees’ knowledge of the Adviser and its personnel and the operations of the other series of the Trust.
The Independent Trustees were advised by and met in executive session with their independent counsel at the Meeting as part of their consideration of the Investment Management Agreement.
In voting to approve the Investment Management Agreement, the Trustees, including the Independent Trustees, concluded that the terms of the Investment Management Agreement are reasonable and fair in light of the services to be performed, expenses to be incurred and such other matters as the Trustees considered relevant in the exercise of their reasonable judgment. The Trustees further concluded that, at the time of their considerations, the Investment Management Agreement is in the best interest of the Fund and its shareholders.
 | ANNUAL FINANCIAL STATEMENTS AND
OTHER INFORMATION September 30, 2024 |
| Commodity Strategy ETF | PIT |
| Durable High Dividend ETF | DURA |
| Inflation Allocation ETF | RAAX |
| Long/Flat Trend ETF | LFEQ |
| Morningstar ESG Moat ETF | MOTE |
| Morningstar Global Wide Moat ETF | MOTG |
| Morningstar International Moat ETF | MOTI |
| Morningstar SMID Moat ETF | SMOT |
| Morningstar Wide Moat ETF | MOAT® |
| Morningstar Wide Moat Growth ETF | MGRO |
| Morningstar Wide Moat Value ETF | MVAL |
| Social Sentiment ETF | BUZZ |
VANECK COMMODITY STRATEGY ETF
CONSOLIDATED SCHEDULE OF INVESTMENTS
September 30, 2024
| | | Par
(000’s | ) | | Value | |
| Short-Term Investments: 94.2% | | | | | | | | |
| United States Treasury Obligations: 94.2% | | |
| United States Treasury Bills | | | | | | | | |
| 5.13%, 11/05/24 (a) | | $ | 7,220 | | | $ | 7,187,505 | |
| 5.21%, 12/05/24 | | | 4,111 | | | | 4,077,510 | |
| | | | | | | | | |
| | | Par
(000’s | ) | | Value | |
| United States Treasury Obligations (continued) | | |
| 5.27%, 10/03/24 (a) | | $ | 11,381 | | | $ | 11,378,035 | |
| | | | | | | | 22,643,050 | |
Total Short-Term Investments: 94.2%
(Cost: $22,636,535) | | | | 22,643,050 | |
| Other assets less liabilities: 5.8% | | 1,381,025 | |
| NET ASSETS: 100.0% | | | | | | $ | 24,024,075 | |
Footnotes:
| (a) | All or a portion of these securities are held at the broker for futures collateral. Total value of securities held at the broker is $3,530,423. |
Futures Contracts
| Reference Entity | | Type | | Number of
Contracts | | Expiration Date | | Notional
Amount | | Unrealized
Appreciation/
(Depreciation) | |
| Brent Crude Oil | | Long | | 35 | | 10/31/24 | | $ | 2,509,500 | | | $ | (179,051 | ) |
| Cattle Feeder | | Long | | 4 | | 11/21/24 | | | 489,800 | | | | 33,376 | |
| Cocoa | | Long | | 1 | | 03/14/25 | | | 63,650 | | | | (1,326 | ) |
| Cocoa | | Long | | 3 | | 12/13/24 | | | 231,660 | | | | 35,792 | |
| Coffee C | | Long | | 5 | | 12/18/24 | | | 506,719 | | | | 70,863 | |
| Copper | | Long | | 18 | | 12/27/24 | | | 2,048,850 | | | | 235,249 | |
| FCOJ-A | | Long | | 6 | | 11/08/24 | | | 414,945 | | | | 15,106 | |
| Gasoline RBOB | | Long | | 27 | | 10/31/24 | | | 2,194,403 | | | | 45,657 | |
| Gold 100 OZ | | Long | | 19 | | 12/27/24 | | | 5,052,860 | | | | 254,493 | |
| Live Cattle | | Long | | 8 | | 06/30/25 | | | 576,800 | | | | (8,079 | ) |
| LME Copper | | Long | | 3 | | 10/14/24 | | | 728,705 | | | | 25,408 | |
| LME Lead | | Long | | 6 | | 10/14/24 | | | 309,342 | | | | (7,727 | ) |
| LME Primary Aluminium | | Long | | 6 | | 11/18/24 | | | 390,242 | | | | 14,867 | |
| LME Tin | | Long | | 2 | | 10/14/24 | | | 335,010 | | | | 5,145 | |
| LME Zinc | | Long | | 7 | | 10/14/24 | | | 536,774 | | | | 27,760 | |
| Low Sulphur Gasoil | | Long | | 8 | | 12/12/24 | | | 525,200 | | | | (54,039 | ) |
| Natural Gas | | Long | | 15 | | 10/29/24 | | | 438,450 | | | | 41,016 | |
| NY Harbor ULSD | | Long | | 4 | | 05/30/25 | | | 363,552 | | | | (44,735 | ) |
| NY Harbor ULSD | | Long | | 13 | | 10/31/24 | | | 1,176,302 | | | | 856 | |
| Platinum | | Long | | 5 | | 01/29/25 | | | 247,775 | | | | 9,622 | |
| Silver | | Long | | 6 | | 12/27/24 | | | 943,740 | | | | 59,456 | |
| Soybean | | Long | | 9 | | 11/14/24 | | | 475,650 | | | | 13,332 | |
| Soybean Oil | | Long | | 15 | | 12/13/24 | | | 389,790 | | | | 33,118 | |
| White Sugar | | Long | | 16 | | 11/15/24 | | | 462,000 | | | | 41,009 | |
| WTI Crude Oil | | Long | | 33 | | 11/20/24 | | | 2,236,410 | | | | (138,633 | ) |
| Net unrealized appreciation on futures contracts | | | | $ | 528,535 | |
The summary of inputs used to value the Fund’s investments as of September 30, 2024 is as follows:
| | | Level 1
Quoted
Prices | | | Level 2
Significant
Observable
Inputs | | | Level 3
Significant
Unobservable
Inputs | | | Value | |
| United States Treasury Obligations | | $ | — | | | $ | 22,643,050 | | | $ | — | | | $ | 22,643,050 | |
| | | | | | | | | | | | | | | | | |
| Other Financial Instruments: | | | | | | | | | | | | | | | | |
| Assets | | | | | | | | | | | | | | | | |
| Futures Contracts | | $ | 528,535 | | | $ | — | | | $ | — | | | $ | 528,535 | |
See Notes to Financial Statements
VANECK DURABLE HIGH DIVIDEND ETF
SCHEDULE OF INVESTMENTS
September 30, 2024
| | | Number
of Shares | | | Value | |
| COMMON STOCKS: 99.5% | | | | | | | | |
| Automobiles & Components: 0.1% | | | | | | | | |
| Thor Industries, Inc. † | | | 309 | | | $ | 33,956 | |
| Banks: 1.1% | | | | | | | | |
| M&T Bank Corp. | | | 1,627 | | | | 289,801 | |
| Regions Financial Corp. | | | 12,412 | | | | 289,572 | |
| | | | | | | | 579,373 | |
| Capital Goods: 5.9% | | | | | | | | |
| Emerson Electric Co. | | | 3,707 | | | | 405,434 | |
| General Dynamics Corp. | | | 1,399 | | | | 422,778 | |
| Honeywell International, Inc. | | | 4,280 | | | | 884,719 | |
| Huntington Ingalls Industries, Inc. | | | 248 | | | | 65,566 | |
| L3Harris Technologies, Inc. | | | 1,185 | | | | 281,876 | |
| RTX Corp. | | | 8,426 | | | | 1,020,894 | |
| | | | | | | | 3,081,267 | |
| Commercial & Professional Services: 2.0% | | |
| Automatic Data Processing, Inc. | | | 2,489 | | | | 688,781 | |
| Paychex, Inc. | | | 2,822 | | | | 378,684 | |
| | | | | | | | 1,067,465 | |
| Consumer Discretionary Distribution & Retail: 0.3% | |
| eBay, Inc. | | | 2,736 | | | | 178,141 | |
| Consumer Services: 3.4% | | | | | | | | |
| McDonald’s Corp. | | | 5,033 | | | | 1,532,599 | |
| Yum! Brands, Inc. | | | 1,697 | | | | 237,088 | |
| | | | | | | | 1,769,687 | |
| Energy: 18.3% | | | | | | | | |
| APA Corp. | | | 4,846 | | | | 118,533 | |
| Baker Hughes Co. | | | 7,865 | | | | 284,320 | |
| Chevron Corp. | | | 17,717 | | | | 2,609,183 | |
| ConocoPhillips | | | 10,283 | | | | 1,082,594 | |
| EOG Resources, Inc. | | | 5,363 | | | | 659,274 | |
| EQT Corp. | | | 3,352 | | | | 122,817 | |
| Exxon Mobil Corp. | | | 23,152 | | | | 2,713,877 | |
| HF Sinclair Corp. | | | 2,263 | | | | 100,862 | |
| Kinder Morgan, Inc. | | | 33,377 | | | | 737,298 | |
| ONEOK, Inc. | | | 7,849 | | | | 715,279 | |
| Valero Energy Corp. | | | 3,149 | | | | 425,210 | |
| | | | | | | | 9,569,247 | |
| Financial Services: 6.6% | | | | | | | | |
| BlackRock, Inc. | | | 1,060 | | | | 1,006,481 | |
| Blackstone, Inc. | | | 5,293 | | | | 810,517 | |
| CME Group, Inc. | | | 4,414 | | | | 973,949 | |
| Federated Hermes, Inc. | | | 899 | | | | 33,056 | |
| Invesco Ltd. | | | 5,175 | | | | 90,873 | |
| Janus Henderson Group Plc | | | 1,778 | | | | 67,688 | |
| T Rowe Price Group, Inc. | | | 3,252 | | | | 354,240 | |
| Western Union Co. | | | 8,350 | | | | 99,616 | |
| | | | | | | | 3,436,420 | |
| Food, Beverage & Tobacco: 13.0% | | | | | | | | |
| Altria Group, Inc. | | | 39,005 | | | | 1,990,815 | |
| Archer-Daniels-Midland Co. | | | 4,885 | | | | 291,830 | |
| Brown-Forman Corp. | | | 1,736 | | | | 85,411 | |
| Conagra Brands, Inc. | | | 6,584 | | | | 214,112 | |
| General Mills, Inc. | | | 5,607 | | | | 414,077 | |
| Hershey Co. | | | 1,222 | | | | 234,355 | |
| | | Number
of Shares | | | Value | |
| Food, Beverage & Tobacco (continued) | | |
| J M Smucker Co. | | | 1,190 | | | $ | 144,109 | |
| Kraft Heinz Co. | | | 12,449 | | | | 437,084 | |
| Mondelez International, Inc. | | | 9,521 | | | | 701,412 | |
| PepsiCo, Inc. | | | 12,495 | | | | 2,124,775 | |
| Tyson Foods, Inc. | | | 2,754 | | | | 164,028 | |
| | | | | | | | 6,802,008 | |
| Health Care Equipment & Services: 2.4% | | |
| DENTSPLY SIRONA, Inc. | | | 1,556 | | | | 42,105 | |
| Medtronic Plc | | | 12,204 | | | | 1,098,726 | |
| Quest Diagnostics, Inc. | | | 654 | | | | 101,534 | |
| | | | | | | | 1,242,365 | |
| Household & Personal Products: 1.3% | | |
| Clorox Co. | | | 1,128 | | | | 183,763 | |
| Kimberly-Clark Corp. | | | 3,508 | | | | 499,118 | |
| | | | | | | | 682,881 | |
| Insurance: 1.2% | | | | | | | | |
| Prudential Financial, Inc. | | | 5,020 | | | | 607,922 | |
| Materials: 3.5% | | | | | | | | |
| Air Products and Chemicals, Inc. | | | 1,744 | | | | 519,259 | |
| Celanese Corp. | | | 782 | | | | 106,321 | |
| Dow, Inc. | | | 12,002 | | | | 655,669 | |
| DuPont de Nemours, Inc. | | | 2,431 | | | | 216,626 | |
| Eastman Chemical Co. | | | 1,195 | | | | 133,780 | |
| PPG Industries, Inc. | | | 1,534 | | | | 203,194 | |
| | | | | | | | 1,834,849 | |
| Media & Entertainment: 3.0% | | | | | | | | |
| Comcast Corp. | | | 37,131 | | | | 1,550,962 | |
| Pharmaceuticals, Biotechnology & Life Sciences: 21.4% | |
| AbbVie, Inc. | | | 12,551 | | | | 2,478,571 | |
| Amgen, Inc. | | | 4,466 | | | | 1,438,990 | |
| Johnson & Johnson | | | 14,905 | | | | 2,415,504 | |
| Merck & Co., Inc. | | | 20,853 | | | | 2,368,067 | |
| Pfizer, Inc. | | | 81,608 | | | | 2,361,736 | |
| Royalty Pharma Plc | | | 3,717 | | | | 105,154 | |
| | | | | | | | 11,168,022 | |
| Semiconductors & Semiconductor Equipment: 2.5% | |
| Qualcomm, Inc. | | | 6,738 | | | | 1,145,797 | |
| Skyworks Solutions, Inc. | | | 1,333 | | | | 131,660 | |
| | | | | | | | 1,277,457 | |
| Transportation: 3.0% | | | | | | | | |
| United Parcel Service, Inc. | | | 11,449 | | | | 1,560,957 | |
| Utilities: 10.5% | | | | | | | | |
| Alliant Energy Corp. | | | 2,537 | | | | 153,971 | |
| Ameren Corp. | | | 2,561 | | | | 223,985 | |
| Avangrid, Inc. | | | 1,086 | | | | 38,868 | |
| DTE Energy Co. | | | 2,062 | | | | 264,781 | |
| Duke Energy Corp. | | | 8,484 | | | | 978,205 | |
| Edison International | | | 4,350 | | | | 378,842 | |
| Entergy Corp. | | | 2,421 | | | | 318,628 | |
| Essential Utilities, Inc. | | | 2,481 | | | | 95,692 | |
| Evergy, Inc. | | | 3,047 | | | | 188,944 | |
| Eversource Energy | | | 4,446 | | | | 302,550 | |
| Exelon Corp. | | | 11,787 | | | | 477,963 | |
See Notes to Financial Statements
| | | Number
of Shares | | | Value | |
| Utilities (continued) | | | | | | | | |
| FirstEnergy Corp. | | | 5,953 | | | $ | 264,016 | |
| New Jersey Resources Corp. | | | 1,111 | | | | 52,439 | |
| NiSource, Inc. | | | 4,314 | | | | 149,480 | |
| OGE Energy Corp. | | | 2,603 | | | | 106,775 | |
| Portland General Electric Co. | | | 1,284 | | | | 61,504 | |
| PPL Corp. | | | 7,123 | | | | 235,629 | |
| Sempra | | | 5,834 | | | | 487,897 | |
| WEC Energy Group, Inc. | | | 3,370 | | | | 324,127 | |
| Xcel Energy, Inc. | | | 5,727 | | | | 373,973 | |
| | | | | | | | 5,478,269 | |
Total Common Stocks
(Cost: $49,650,801) | | | | | | | 51,921,248 | |
Total Investments: 99.5%
(Cost: $49,650,801) | | | | | | | 51,921,248 | |
| Other assets less liabilities: 0.5% | | | | | | | 235,847 | |
| NET ASSETS: 100.0% | | | | | | $ | 52,157,095 | |
Footnotes:
| † | Security fully or partially on loan. Total market value of securities on loan is $30,549. |
The summary of inputs used to value the Fund’s investments as of September 30, 2024 is as follows:
| | | Level 1
Quoted
Prices | | | Level 2
Significant
Observable
Inputs | | | Level 3
Significant
Unobservable
Inputs | | | Value | |
| Common Stocks * | | $ | 51,921,248 | | | $ | — | | | $ | — | | | $ | 51,921,248 | |
| * | See Schedule of Investments for industry sectors. |
See Notes to Financial Statements
VANECK INFLATION ALLOCATION ETF
CONSOLIDATED SCHEDULE OF INVESTMENTS
September 30, 2024
| | | Number
of Shares | | | Value | |
| EXCHANGE TRADED FUNDS: 99.5%(a) | | |
| Energy Select Sector SPDR Fund | | | 97,592 | | | $ | 8,568,578 | |
| Global X US Infrastructure Development ETF † | | | 94,683 | | | | 3,897,152 | |
| Invesco Water Resources ETF † | | | 11,454 | | | | 807,965 | |
| iShares Gold Trust | | | 6,254 | | | | 310,824 | |
| iShares Residential and Multisector Real Estate ETF | | | 58,924 | | | | 5,233,630 | |
| Materials Select Sector SPDR Fund † | | | 76,772 | | | | 7,399,285 | |
| SPDR Gold MiniShares Trust | | | 5,993 | | | | 312,415 | |
| VanEck Agribusiness ETF † † | | | 10,254 | | | | 774,279 | |
| VanEck Commodity Strategy ETF † | | | 327,888 | | | | 15,739,444 | |
| VanEck Energy Income ETF † | | | 113,243 | | | | 9,601,795 | |
| VanEck Gold Miners ETF † | | | 27,013 | | | | 1,075,658 | |
| VanEck Merk Gold ETF | | | 800,776 | | | | 20,331,703 | |
| | | Number
of Shares | | | Value | |
| VanEck Steel ETF † | | | 19,310 | | | $ | 1,359,810 | |
| VanEck Uranium and Nuclear ETF † † | | | 19,096 | | | | 1,595,471 | |
Total Exchange Traded Funds
(Cost: $67,352,237) | | | | | | | 77,008,009 | |
| | | | | | | | | |
| SHORT-TERM INVESTMENT HELD AS COLLATERAL FOR SECURITIES ON LOAN: 3.2% | |
Money Market Fund: 3.2%
(Cost: $2,460,575) | | | | | | | | |
| State Street Navigator Securities Lending Government Money Market Portfolio | | | 2,460,575 | | | | 2,460,575 | |
Total Investments: 102.7%
(Cost: $69,812,812) | | | | | | | 79,468,584 | |
| Liabilities in excess of other assets: (2.7)% | | | | (2,040,123) | |
| NET ASSETS: 100.0% | | | | | | $ | 77,428,461 | |
Footnotes:
| (a) | Each underlying fund’s shareholder reports and registration documents are available free of charge on the SEC’s website at https://www.sec.gov. |
| † | Security fully or partially on loan. Total market value of securities on loan is $8,826,893. |
| † | Affiliated issuer – as defined under the Investment Company Act of 1940. |
Transactions in securities of affiliates for the year ended September 30, 2024 were as follows:
| | | Value
9/30/2023 | | Purchases | | Sales
Proceeds | | Realized Gain
(Loss) | | Net Change in
Unrealized
Appreciation
(Depreciation) | | Value
9/30/2024 | | Dividend
Income |
| Nuveen Short-Term REIT ETF | | $2,705,569 | | $708,721 | | $(3,675,739) | | $(247,328) | | $508,777 | | $– | | $39,160 |
| VanEck Agribusiness ETF | | 2,977,929 | | 781,660 | | (2,776,661) | | (785,971) | | 577,322 | | 774,279 | | 101,782 |
| VanEck Commodity Strategy ETF | | 21,047,500 | | 7,466,198 | | (10,394,849) | | (360,801) | | (2,018,604) | | 15,739,444 | | 1,436,059 |
| VanEck Energy Income ETF | | 5,204,557 | | 6,354,325 | | (3,881,902) | | 468,848† | | 1,708,991* | | 9,601,795 | | 49,232 |
| VanEck Gold Miners ETF | | 5,158,109 | | 3,699,790 | | (8,717,211) | | (906,147) | | 1,841,117 | | 1,075,658 | | 40,873 |
| VanEck Oil Services ETF | | 3,715,736 | | 1,263,540 | | (4,796,576) | | 476,110 | | (658,810) | | – | | 59,425 |
| VanEck Steel ETF | | 2,818,920 | | 820,904 | | (2,535,631) | | 216,431 | | 39,186 | | 1,359,810 | | 106,890 |
| VanEck Uranium and Nuclear ETF | | – | | 1,663,750 | | (207,156) | | 3,383 | | 135,494 | | 1,595,471 | | – |
| Total | | $43,628,320 | | $22,758,888 | | $(36,985,725) | | $(1,135,475) | | $2,133,473 | | $30,146,457 | | $1,833,421 |
| | |
| † | Includes Return of Capital distribution reclassification of $33,120 |
| * | Includes Return of Capital distribution reclassification of $219,904 |
See Notes to Financial Statements
The summary of inputs used to value the Fund’s investments as of September 30, 2024 is as follows:
| | | Level 1
Quoted
Prices | | | Level 2
Significant
Observable
Inputs | | | Level 3
Significant
Unobservable
Inputs | | | Value | |
| Exchange Traded Funds | | $ | 77,008,009 | | | $ | — | | | $ | — | | | $ | 77,008,009 | |
| Money Market Fund | | | 2,460,575 | | | | — | | | | — | | | | 2,460,575 | |
| Total Investments | | $ | 79,468,584 | | | $ | — | | | $ | — | | | $ | 79,468,584 | |
See Notes to Financial Statements
VANECK LONG/FLAT TREND ETF
SCHEDULE OF INVESTMENTS
September 30, 2024
| | | Number
of Shares | | | Value | |
EXCHANGE TRADED FUND: 99.8%(a)
(Cost: $21,129,378) | | | | | | | | |
| Vanguard S&P 500 ETF | | | 50,703 | | | $ | 26,754,452 | |
| | | | | | | | | |
Total Investments: 99.8%
(Cost: $21,129,378) | | | | | | | 26,754,452 | |
| Other assets less liabilities: 0.2% | | | | | | | 55,076 | |
| NET ASSETS: 100.0% | | | | | | $ | 26,809,528 | |
Footnotes:
| (a) | The underlying fund’s shareholder reports and registration documents are available free of charge on the SEC’s website at https://www. sec.gov. |
The summary of inputs used to value the Fund’s investments as of September 30, 2024 is as follows:
| | | Level 1
Quoted
Prices | | | Level 2
Significant
Observable
Inputs | | | Level 3
Significant
Unobservable
Inputs | | | Value | |
| Exchange Traded Funds | | $ | 26,754,452 | | | $ | — | | | $ | — | | | $ | 26,754,452 | |
See Notes to Financial Statements
VANECK MORNINGSTAR ESG MOAT ETF
SCHEDULE OF INVESTMENTS
September 30, 2024
| | | Number
of Shares | | | Value | |
| COMMON STOCKS: 99.9% | | | | | | | | |
| Automobiles & Components: 1.3% | | | | | | | | |
| Harley-Davidson, Inc. | | | 2,191 | | | $ | 84,419 | |
| Banks: 1.3% | | | | | | | | |
| US Bancorp | | | 1,873 | | | | 85,652 | |
| Capital Goods: 10.4% | | | | | | | | |
| Allegion plc | | | 1,264 | | | | 184,216 | |
| Emerson Electric Co. | | | 1,472 | | | | 160,993 | |
| Masco Corp. | | | 2,143 | | | | 179,883 | |
| Otis Worldwide Corp. | | | 793 | | | | 82,424 | |
| Rockwell Automation, Inc. | | | 238 | | | | 63,893 | |
| | | | | | | | 671,409 | |
| Commercial & Professional Services: 5.7% | | |
| Equifax, Inc. | | | 587 | | | | 172,496 | |
| TransUnion | | | 2,012 | | | | 210,657 | |
| | | | | | | | 383,153 | |
| Consumer Discretionary Distribution & Retail: 1.4% | |
| Lowe’s Companies, Inc. | | | 327 | | | | 88,568 | |
| Consumer Durables & Apparel: 0.8% | | | | | | | | |
| NIKE, Inc. | | | 589 | | | | 52,068 | |
| Consumer Services: 3.4% | | | | | | | | |
| Starbucks Corp. | | | 702 | | | | 68,438 | |
| Yum! Brands, Inc. | | | 1,076 | | | | 150,328 | |
| | | | | | | | 218,766 | |
| Consumer Staples Distribution & Retail: 1.2% | | |
| Sysco Corp. | | | 1,035 | | | | 80,792 | |
| Energy: 1.3% | | | | | | | | |
| Cheniere Energy, Inc. | | | 464 | | | | 83,446 | |
| Financial Services: 18.3% | | | | | | | | |
| American Express Co. | | | 431 | | | | 116,887 | |
| BlackRock, Inc. | | | 96 | | | | 91,153 | |
| CME Group, Inc. | | | 702 | | | | 154,896 | |
| Intercontinental Exchange, Inc. | | | 1,127 | | | | 181,042 | |
| Jack Henry & Associates, Inc. | | | 459 | | | | 81,032 | |
| MarketAxess Holdings, Inc. | | | 254 | | | | 65,075 | |
| Mastercard, Inc. | | | 166 | | | | 81,971 | |
| Northern Trust Corp. | | | 1,722 | | | | 155,032 | |
| State Street Corp. | | | 1,020 | | | | 90,239 | |
| T Rowe Price Group, Inc. | | | 622 | | | | 67,754 | |
| The Bank of New York Mellon Corp. | | | 1,442 | | | | 103,622 | |
| | | | | | | | 1,188,703 | |
| Food, Beverage & Tobacco: 5.7% | | | | | | | | |
| Constellation Brands, Inc. | | | 575 | | | | 148,172 | |
| Mondelez International, Inc. | | | 980 | | | | 72,197 | |
| PepsiCo, Inc. | | | 874 | | | | 148,624 | |
| | | | | | | | 368,993 | |
| Health Care Equipment & Services: 4.6% | | |
| Medtronic Plc | | | 844 | | | | 75,985 | |
| Veeva Systems, Inc. * | | | 738 | | | | 154,884 | |
| Zimmer Biomet Holdings, Inc. | | | 622 | | | | 67,145 | |
| | | | | | | | 298,014 | |
| Household & Personal Products: 1.2% | | |
| Clorox Co. | | | 475 | | | | 77,382 | |
| | | Number
of Shares | | | Value | |
| Materials: 3.7% | | | | | | | | |
| Air Products and Chemicals,Inc. | | | 260 | | | $ | 77,412 | |
| Ecolab, Inc. | | | 340 | | | | 86,812 | |
| International Flavors & Fragrances, Inc. | | | 760 | | | | 79,747 | |
| | | | | | | | 243,971 | |
| Media & Entertainment: 6.8% | | | | | | | | |
| Alphabet, Inc. | | | 917 | | | | 152,084 | |
| Comcast Corp. | | | 3,655 | | | | 152,669 | |
| Walt Disney Co. | | | 1,489 | | | | 143,227 | |
| | | | | | | | 447,980 | |
| Pharmaceuticals, Biotechnology & Life Sciences: 7.4% | |
| Agilent Technologies, Inc. | | | 553 | | | | 82,109 | |
| Amgen, Inc. | | | 244 | | | | 78,619 | |
| Gilead Sciences, Inc. | | | 848 | | | | 71,096 | |
| Thermo Fisher Scientific, Inc. | | | 262 | | | | 162,065 | |
| Waters Corp. * | | | 244 | | | | 87,813 | |
| | | | | | | | 481,702 | |
| Real Estate Management & Development: 1.1% | | |
| CoStar Group, Inc. * | | | 948 | | | | 71,517 | |
| Semiconductors & Semiconductor Equipment: 5.4% | |
| Analog Devices, Inc. | | | 367 | | | | 84,472 | |
| Applied Materials, Inc. | | | 421 | | | | 85,063 | |
| KLA Corp. | | | 117 | | | | 90,606 | |
| Teradyne, Inc. | | | 699 | | | | 93,617 | |
| | | | | | | | 353,758 | |
| Software & Services: 16.5% | | | | | | | | |
| Adobe, Inc. * | | | 160 | | | | 82,845 | |
| Autodesk, Inc. * | | | 607 | | | | 167,216 | |
| Fortinet, Inc. * | | | 1,272 | | | | 98,644 | |
| Microsoft Corp. | | | 172 | | | | 74,012 | |
| Palo Alto Networks, Inc. * | | | 230 | | | | 78,614 | |
| Roper Technologies, Inc. | | | 120 | | | | 66,773 | |
| Salesforce, Inc. | | | 312 | | | | 85,398 | |
| ServiceNow, Inc. * | | | 102 | | | | 91,228 | |
| Tyler Technologies, Inc. * | | | 321 | | | | 187,375 | |
| VeriSign, Inc. * | | | 302 | | | | 57,368 | |
| Workday, Inc. * | | | 349 | | | | 85,299 | |
| | | | | | | | 1,074,772 | |
| Technology Hardware & Equipment: 1.2% | | |
| Cisco Systems, Inc. | | | 1,440 | | | | 76,637 | |
| Transportation: 1.2% | | | | | | | | |
| CSX Corp. | | | 2,246 | | | | 77,554 | |
Total Common Stocks
(Cost: $5,604,691) | | | | | | | 6,509,256 | |
Total Investments: 99.9%
(Cost: $5,604,691) | | | | | | | 6,509,256 | |
| Other assets less liabilities: 0.1% | | | | | | | 4,670 | |
| NET ASSETS: 100.0% | | | | | | $ | 6,513,926 | |
See Notes to Financial Statements
VANECK MORNINGSTAR ESG MOAT ETF
SCHEDULE OF INVESTMENTS
(continued)
Footnotes:
The summary of inputs used to value the Fund’s investments as of September 30, 2024 is as follows:
| | | Level 1
Quoted
Prices | | | Level 2
Significant
Observable
Inputs | | | Level 3
Significant
Unobservable
Inputs | | | Value | |
| Common Stocks * | | $ | 6,509,256 | | | $ | — | | | $ | — | | | $ | 6,509,256 | |
| | |
| * | See Schedule of Investments for industry sectors. |
See Notes to Financial Statements
VANECK MORNINGSTAR GLOBAL WIDE MOAT ETF
SCHEDULE OF INVESTMENTS
September 30, 2024
| | | Number
of Shares | | | Value | |
| COMMON STOCKS: 100.0% | | | | | | | | |
| Australia: 6.3% | | | | | | | | |
| ASX Ltd. | | | 7,084 | | | $ | 313,525 | |
| Brambles Ltd. | | | 27,640 | | | | 364,056 | |
| Endeavour Group Ltd. | | | 47,037 | | | | 163,225 | |
| Westpac Banking Corp. | | | 8,251 | | | | 180,931 | |
| | | | | | | | 1,021,737 | |
| Belgium: 2.0% | | | | | | | | |
| Anheuser-Busch InBev SA | | | 4,771 | | | | 316,985 | |
| Canada: 2.0% | | | | | | | | |
| Toronto-Dominion Bank | | | 5,132 | | | | 324,874 | |
| China: 4.4% | | | | | | | | |
| Alibaba Group Holding Ltd. (HKD) | | | 15,300 | | | | 203,484 | |
| Inner Mongolia Yili Industrial Group Co. Ltd. | | | 38,400 | | | | 158,231 | |
| Tencent Holdings Ltd. (HKD) | | | 6,300 | | | | 350,597 | |
| | | | | | | | 712,312 | |
| France: 5.8% | | | | | | | | |
| Airbus SE | | | 1,983 | | | | 290,981 | |
| Dassault Aviation SA | | | 754 | | | | 156,097 | |
| Safran SA | | | 721 | | | | 170,110 | |
| Sanofi SA | | | 2,866 | | | | 330,849 | |
| | | | | | | | 948,037 | |
| Germany: 3.9% | | | | | | | | |
| GEA Group AG | | | 3,499 | | | | 172,061 | |
| Rheinmetall AG | | | 538 | | | | 293,232 | |
| Siemens Healthineers AG 144A | | | 2,836 | | | | 170,776 | |
| | | | | | | | 636,069 | |
| Japan: 7.0% | | | | | | | | |
| Daifuku Co. Ltd. | | | 8,600 | | | | 167,274 | |
| FANUC Corp. | | | 5,900 | | | | 174,115 | |
| Kao Corp. | | | 6,600 | | | | 327,778 | |
| Kubota Corp. | | | 10,200 | | | | 146,338 | |
| Murata Manufacturing Co. Ltd. | | | 8,300 | | | | 165,033 | |
| Sony Group Corp. | | | 8,500 | | | | 165,925 | |
| | | | | | | | 1,146,463 | |
| Netherlands: 5.1% | | | | | | | | |
| Adyen NV 144A * | | | 109 | | | | 171,097 | |
| ASML Holding NV | | | 203 | | | | 169,307 | |
| Koninklijke Philips NV * | | | 5,150 | | | | 169,286 | |
| NXP Semiconductors NV (USD) | | | 674 | | | | 161,767 | |
| Universal Music Group NV † | | | 6,059 | | | | 158,924 | |
| | | | | | | | 830,381 | |
| Poland: 1.8% | | | | | | | | |
| Allegro.eu SA 144A * | | | 32,328 | | | | 293,261 | |
| Singapore: 2.0% | | | | | | | | |
| Singapore Exchange Ltd. | | | 36,800 | | | | 326,902 | |
| Sweden: 1.9% | | | | | | | | |
| Assa Abloy AB | | | 4,733 | | | | 159,757 | |
| Elekta AB † | | | 21,968 | | | | 156,906 | |
| | | | | | | | 316,663 | |
| Switzerland: 5.0% | | | | | | | | |
| Cie Financiere Richemont SA | | | 1,989 | | | | 316,910 | |
| | | Number
of Shares | | | Value | |
| Switzerland (continued) | | | | | | | | |
| DSM-Firmenich AG (EUR) | | | 1,379 | | | $ | 190,808 | |
| Julius Baer Group Ltd. | | | 2,490 | | | | 150,655 | |
| Roche Holding AG | | | 491 | | | | 157,650 | |
| | | | | | | | 816,023 | |
| Taiwan: 2.0% | | | | | | | | |
| Taiwan Semiconductor Manufacturing Co. Ltd. | | | 11,000 | | | | 331,695 | |
| United Kingdom: 9.4% | | | | | | | | |
| British American Tobacco plc | | | 8,728 | | | | 319,253 | |
| Experian plc | | | 3,017 | | | | 159,427 | |
| GSK plc | | | 14,361 | | | | 293,367 | |
| Imperial Brands plc | | | 11,078 | | | | 323,309 | |
| London Stock Exchange Group plc | | | 1,205 | | | | 165,520 | |
| Melrose Industries plc | | | 43,443 | | | | 266,378 | |
| | | | | | | | 1,527,254 | |
| United States: 41.4% | | | | | | | | |
| Adobe, Inc. * | | | 312 | | | | 161,547 | |
| Agilent Technologies, Inc. | | | 1,123 | | | | 166,743 | |
| Allegion plc | | | 2,336 | | | | 340,449 | |
| Alphabet, Inc. | | | 1,030 | | | | 170,825 | |
| Altria Group, Inc. | | | 2,929 | | | | 149,496 | |
| Autodesk, Inc. * | | | 647 | | | | 178,236 | |
| Berkshire Hathaway, Inc. * | | | 359 | | | | 165,233 | |
| BlackRock, Inc. | | | 178 | | | | 169,013 | |
| Campbell Soup Co. | | | 3,169 | | | | 155,027 | |
| Charles Schwab Corp. | | | 2,456 | | | | 159,173 | |
| Comcast Corp. | | | 3,879 | | | | 162,026 | |
| Constellation Brands, Inc. | | | 576 | | | | 148,429 | |
| Corteva, Inc. | | | 5,627 | | | | 330,811 | |
| Emerson Electric Co. | | | 2,884 | | | | 315,423 | |
| Equifax, Inc. | | | 594 | | | | 174,553 | |
| Gilead Sciences, Inc. | | | 1,924 | | | | 161,308 | |
| Huntington Ingalls Industries, Inc. | | | 1,208 | | | | 319,371 | |
| Intercontinental Exchange, Inc. | | | 1,079 | | | | 173,331 | |
| International Flavors & Fragrances, Inc. | | | 2,999 | | | | 314,685 | |
| Masco Corp. | | | 4,107 | | | | 344,742 | |
| Microchip Technology, Inc. | | | 2,010 | | | | 161,383 | |
| Northrop Grumman Corp. | | | 342 | | | | 180,600 | |
| Rockwell Automation, Inc. | | | 564 | | | | 151,411 | |
| Starbucks Corp. | | | 1,586 | | | | 154,619 | |
| Teradyne, Inc. | | | 1,184 | | | | 158,573 | |
| The Bank of New York Mellon Corp. | | | 2,453 | | | | 176,273 | |
| TransUnion | | | 3,526 | | | | 369,172 | |
| Tyler Technologies, Inc. * | | | 308 | | | | 179,786 | |
| US Bancorp | | | 3,715 | | | | 169,887 | |
| Veeva Systems, Inc. * | | | 1,456 | | | | 305,571 | |
| Walt Disney Co. | | | 3,203 | | | | 308,097 | |
| Workday, Inc. * | | | 687 | | | | 167,910 | |
| | | | | | | | 6,743,703 | |
Total Common Stocks
(Cost: $13,843,191) | | | | | | | 16,292,359 | |
See Notes to Financial Statements
VANECK MORNINGSTAR GLOBAL WIDE MOAT ETF
SCHEDULE OF INVESTMENTS
(continued)
| | | Number
of Shares | | | Value | |
| SHORT-TERM INVESTMENT HELD AS COLLATERAL FOR SECURITIES ON LOAN: 0.9% | | | | | |
Money Market Fund: 0.9%
(Cost: $152,787) | | | | | | | | |
| State Street Navigator Securities Lending Government Money Market Portfolio | | | 152,787 | | | $ | 152,787 | |
Total Investments: 100.9%
(Cost: $13,995,978) | | | | 16,445,146 | |
| Liabilities in excess of other assets: (0.9)% | | | | (141,107) | |
| NET ASSETS: 100.0% | | | | | | $ | 16,304,039 | |
| Definitions: |
| EUR | Euro |
| HKD | Hong Kong Dollar |
| USD | United States Dollar |
| | |
| Footnotes: |
| * | Non-income producing |
| † | Security fully or partially on loan. Total market value of securities on loan is $191,912. |
| | |
| 144A | Security exempt from registration under Rule 144A of the Securities Act of 1933, as amended, or otherwise restricted. These securities may be resold in transactions exempt from registration, unless otherwise noted. These securities have an aggregate value of $635,134, or 3.9% of net assets. |
| |
| The summary of inputs used to value the Fund's investments as of September 30, 2024 is as follows: |
| |
| | | Level 1
Quoted
Prices | | | Level 2
Significant
Observable
Inputs | | | Level 3
Significant
Unobservable
Inputs | | | Value | |
| Common Stocks | | | | | | | | | | | | | | | | |
| Australia | | $ | — | | | $ | 1,021,737 | | | $ | — | | | $ | 1,021,737 | |
| Belgium | | | — | | | | 316,985 | | | | — | | | | 316,985 | |
| Canada | | | 324,874 | | | | — | | | | — | | | | 324,874 | |
| China | | | — | | | | 712,312 | | | | — | | | | 712,312 | |
| France | | | — | | | | 948,037 | | | | — | | | | 948,037 | |
| Germany | | | — | | | | 636,069 | | | | — | | | | 636,069 | |
| Japan | | | — | | | | 1,146,463 | | | | — | | | | 1,146,463 | |
| Netherlands | | | 161,767 | | | | 668,614 | | | | — | | | | 830,381 | |
| Poland | | | — | | | | 293,261 | | | | — | | | | 293,261 | |
| Singapore | | | — | | | | 326,902 | | | | — | | | | 326,902 | |
| Sweden | | | — | | | | 316,663 | | | | — | | | | 316,663 | |
| Switzerland | | | — | | | | 816,023 | | | | — | | | | 816,023 | |
| Taiwan | | | — | | | | 331,695 | | | | — | | | | 331,695 | |
| United Kingdom | | | — | | | | 1,527,254 | | | | — | | | | 1,527,254 | |
| United States | | | 6,743,703 | | | | — | | | | — | | | | 6,743,703 | |
| Money Market Fund | | | 152,787 | | | | — | | | | — | | | | 152,787 | |
| Total Investments | | $ | 7,383,131 | | | $ | 9,062,015 | | | $ | — | | | $ | 16,445,146 | |
See Notes to Financial Statements
VANECK MORNINGSTAR INTERNATIONAL MOAT ETF
SCHEDULE OF INVESMENTS
September 30, 2024
| | | Number
of Shares | | | Value | |
| COMMON STOCKS: 100.1% | | | | | | | | |
| Australia: 3.0% | | | | | | | | |
| Aurizon Holdings Ltd. | | | 967,598 | | | $ | 2,362,131 | |
| Dexus † | | | 953,217 | | | | 4,990,837 | |
| | | | | | | | 7,352,968 | |
| Belgium: 1.9% | | | | | | | | |
| Anheuser-Busch InBev SA | | | 70,461 | | | | 4,681,419 | |
| Canada: 4.0% | | | | | | | | |
| Quebecor, Inc. † | | | 107,457 | | | | 2,808,621 | |
| Rogers Communications, Inc. | | | 58,838 | | | | 2,368,415 | |
| TELUS Corp. | | | 272,606 | | | | 4,578,578 | |
| | | | | | | | 9,755,614 | |
| China: 27.6% | | | | | | | | |
| ANTA Sports Products Ltd. (HKD) | | | 463,400 | | | | 5,490,138 | |
| Beijing Enterprises Holdings Ltd. (HKD) | | | 1,466,000 | | | | 5,217,607 | |
| BOC Hong Kong Holdings Ltd. (HKD) | | | 1,453,500 | | | | 4,608,823 | |
| China Feihe Ltd. (HKD) 144A | | | 4,464,000 | | | | 3,353,496 | |
| China Gas Holdings Ltd. (HKD) | | | 5,390,400 | | | | 4,982,260 | |
| China Merchants Bank Co. Ltd. | | | 513,900 | | | | 2,722,235 | |
| CSPC Pharmaceutical Group Ltd. (HKD) | | | 3,718,000 | | | | 2,849,632 | |
| ENN Energy Holdings Ltd. (HKD) | | | 372,300 | | | | 2,799,065 | |
| ESR Group Ltd. (HKD) 144A | | | 1,652,200 | | | | 2,628,615 | |
| Inner Mongolia Yili Industrial Group Co. Ltd. | | | 1,295,500 | | | | 5,338,225 | |
| JD.com, Inc. (HKD) | | | 322,450 | | | | 6,472,947 | |
| NetEase, Inc. (HKD) | | | 121,500 | | | | 2,271,440 | |
| PDD Holdings, Inc. (ADR) * | | | 37,439 | | | | 5,047,152 | |
| SF Holding Co. Ltd. | | | 423,779 | | | | 2,689,669 | |
| Shenzhou International Group Holdings Ltd. (HKD) | | | 224,300 | | | | 1,987,340 | |
| Tencent Holdings Ltd. (HKD) | | | 93,300 | | | | 5,192,173 | |
| Wuliangye Yibin Co. Ltd. | | | 119,500 | | | | 2,741,055 | |
| | | | | | | | 66,391,872 | |
| Denmark: 1.5% | | | | | | | | |
| GN Store Nord AS * | | | 160,768 | | | | 3,591,705 | |
| France: 2.0% | | | | | | | | |
| Amundi SA 144A | | | 32,786 | | | | 2,457,036 | |
| Eurofins Scientific SE | | | 37,550 | | | | 2,386,915 | |
| | | | | | | | 4,843,951 | |
| Germany: 15.3% | | | | | | | | |
| BASF SE | | | 90,788 | | | | 4,824,562 | |
| Bayerische Motoren Werke AG | | | 50,216 | | | | 4,452,499 | |
| Continental AG | | | 71,701 | | | | 4,658,606 | |
| Fresenius Medical Care AG | | | 53,125 | | | | 2,263,252 | |
| Fresenius SE & Co. KGaA * | | | 127,970 | | | | 4,894,867 | |
| Infineon Technologies AG | | | 121,880 | | | | 4,290,101 | |
| Just Eat Takeaway.com NV 144A * † | | | 330,631 | | | | 4,968,885 | |
| Mercedes-Benz Group AG | | | 67,503 | | | | 4,385,535 | |
| | | Number
of Shares | | | Value | |
| Germany (continued) | | | | | | |
| Rheinmetall AG | | | 4,080 | | | $ | 2,223,772 | |
| | | | | | | | 36,962,079 | |
| Israel: 1.9% | | | | | | | | |
| Nice Ltd. * | | | 26,116 | | | | 4,550,553 | |
| Italy: 0.9% | | | | | | | | |
| Nexi SpA 144A * † | | | 312,299 | | | | 2,127,352 | |
| Japan: 6.9% | | | | | | | | |
| Harmonic Drive Systems, Inc. | | | 102,900 | | | | 2,557,099 | |
| Hitachi Construction Machinery Co. Ltd. † | | | 84,900 | | | | 2,090,871 | |
| Kubota Corp. | | | 154,500 | | | | 2,216,581 | |
| LY Corp. | | | 948,600 | | | | 2,778,216 | |
| Murata Manufacturing Co. Ltd. | | | 116,000 | | | | 2,306,483 | |
| Nabtesco Corp. | | | 136,600 | | | | 2,367,825 | |
| Taiyo Yuden Co. Ltd. † | | | 107,300 | | | | 2,220,269 | |
| | | | | | | | 16,537,344 | |
| Luxembourg: 2.0% | | | | | | | | |
| Millicom International Cellular SA (SEK) (SDR) * | | | 173,273 | | | | 4,716,700 | |
| Netherlands: 3.0% | | | | | | | | |
| ABN AMRO Bank NV 144A | | | 259,779 | | | | 4,706,916 | |
| Akzo Nobel NV | | | 34,256 | | | | 2,426,189 | |
| | | | | | | | 7,133,105 | |
| South Korea: 1.8% | | | | | | | | |
| Samsung Electro-Mechanics Co. Ltd. | | | 43,962 | | | | 4,444,292 | |
| Spain: 3.0% | | | | | | | | |
| Banco Santander SA | | | 464,109 | | | | 2,384,227 | |
| Cellnex Telecom SA 144A * | | | 117,501 | | | | 4,776,227 | |
| | | | | | | | 7,160,454 | |
| Sweden: 3.1% | | | | | | | | |
| Elekta AB † | | | 695,501 | | | | 4,967,585 | |
| Svenska Handelsbanken AB | | | 232,178 | | | | 2,389,447 | |
| | | | | | | | 7,357,032 | |
| Switzerland: 5.5% | | | | | | | | |
| Avolta AG † | | | 110,354 | | | | 4,686,298 | |
| Julius Baer Group Ltd. † | | | 78,607 | | | | 4,756,042 | |
| Roche Holding AG | | | 6,848 | | | | 2,198,751 | |
| STMicroelectronics NV (EUR) † | | | 50,213 | | | | 1,503,486 | |
| | | | | | | | 13,144,577 | |
| Taiwan: 2.0% | | | | | | | | |
| Taiwan Semiconductor Manufacturing Co. Ltd. | | | 77,000 | | | | 2,321,868 | |
| Win Semiconductors Corp. * | | | 556,000 | | | | 2,391,601 | |
| | | | | | | | 4,713,469 | |
| United Kingdom: 12.7% | | | | | | | | |
| British American Tobacco Plc | | | 129,648 | | | | 4,742,269 | |
| BT Group Plc † | | | 2,512,758 | | | | 4,996,847 | |
| GSK Plc | | | 212,239 | | | | 4,335,621 | |
| Imperial Brands Plc | | | 89,698 | | | | 2,617,815 | |
| Lloyds Banking Group Plc | | | 6,070,645 | | | | 4,789,009 | |
| Melrose Industries Plc | | | 635,414 | | | | 3,896,150 | |
| Smith & Nephew Plc | | | 175,395 | | | | 2,731,248 | |
See Notes to Financial Statements
VANECK MORNINGSTAR INTERNATIONAL MOAT ETF
SCHEDULE OF INVESMENTS
(continued)
| | | Number
of Shares | | | Value | |
| United Kingdom (continued) | | | | | | |
| Swire Properties Ltd. (HKD) | | | 1,219,200 | | | $ | 2,482,109 | |
| | | | | | | | 30,591,068 | |
| United States: 2.0% | | | | | | | | |
| Carnival Plc (GBP) * | | | 296,747 | | | | 4,907,233 | |
Total Common Stocks
(Cost: $217,327,781) | | | | | | | 240,962,787 | |
| | | Number
of Shares | | | Value | |
| SHORT-TERM INVESTMENT HELD AS COLLATERAL FOR SECURITIES ON LOAN: 1.6% | | | | | |
Money Market Fund: 1.6%
(Cost: $3,883,714) | | | | | |
| State Street Navigator Securities Lending Government Money Market Portfolio | | | 3,883,714 | | | $ | 3,883,714 | |
Total Investments: 101.7%
(Cost: $221,211,495) | | | | | | | 244,846,501 | |
| Liabilities in excess of other assets: (1.7)% | | | | (4,028,210) | |
| NET ASSETS: 100.0% | | | | | | $ | 240,818,291 | |
| Definitions: |
| ADR | American Depositary Receipt |
| EUR | Euro |
| GBP | British Pound |
| HKD | Hong Kong Dollar |
| SDR | Swedish Depositary Receipt |
| SEK | Swedish Krona |
| | |
| Footnotes: |
| † | Security fully or partially on loan. Total market value of securities on loan is $25,833,617. |
| * | Non-income producing |
| | |
| 144A | Security exempt from registration under Rule 144A of the Securities Act of 1933, as amended, or otherwise restricted. These securities may be resold in transactions exempt from registration, unless otherwise noted. These securities have an aggregate value of $25,018,527, or 10.4% of net assets. |
The summary of inputs used to value the Fund's investments as of September 30, 2024 is as follows:
| | | Level 1
Quoted
Prices | | | Level 2
Significant
Observable
Inputs | | | Level 3
Significant
Unobservable
Inputs | | | Value | |
| Common Stocks | | | | | | | | | | | | | | | | |
| Australia | | $ | — | | | $ | 7,352,968 | | | $ | — | | | $ | 7,352,968 | |
| Belgium | | | — | | | | 4,681,419 | | | | — | | | | 4,681,419 | |
| Canada | | | 9,755,614 | | | | — | | | | — | | | | 9,755,614 | |
| China | | | 5,047,152 | | | | 61,344,720 | | | | — | | | | 66,391,872 | |
| Denmark | | | — | | | | 3,591,705 | | | | — | | | | 3,591,705 | |
| France | | | — | | | | 4,843,951 | | | | — | | | | 4,843,951 | |
| Germany | | | — | | | | 36,962,079 | | | | — | | | | 36,962,079 | |
| Israel | | | — | | | | 4,550,553 | | | | — | | | | 4,550,553 | |
| Italy | | | — | | | | 2,127,352 | | | | — | | | | 2,127,352 | |
| Japan | | | — | | | | 16,537,344 | | | | — | | | | 16,537,344 | |
| Luxembourg | | | — | | | | 4,716,700 | | | | — | | | | 4,716,700 | |
| Netherlands | | | — | | | | 7,133,105 | | | | — | | | | 7,133,105 | |
| South Korea | | | — | | | | 4,444,292 | | | | — | | | | 4,444,292 | |
| Spain | | | — | | | | 7,160,454 | | | | — | | | | 7,160,454 | |
| Sweden | | | — | | | | 7,357,032 | | | | — | | | | 7,357,032 | |
| Switzerland | | | — | | | | 13,144,577 | | | | — | | | | 13,144,577 | |
| Taiwan | | | — | | | | 4,713,469 | | | | — | | | | 4,713,469 | |
| United Kingdom | | | — | | | | 30,591,068 | | | | — | | | | 30,591,068 | |
| United States | | | — | | | | 4,907,233 | | | | — | | | | 4,907,233 | |
| Money Market Fund | | | 3,883,714 | | | | — | | | | — | | | | 3,883,714 | |
| Total Investments | | $ | 18,686,480 | | | $ | 226,160,021 | | | $ | — | | | $ | 244,846,501 | |
See Notes to Financial Statements
VANECK MORNINGSTAR SMID MOAT ETF
SCHEDULE OF INVESTMENTS
September 30, 2024
| | | Number
of Shares | | | Value | |
| COMMON STOCKS: 100.0% | | | | | | | | |
| Automobiles & Components: 1.9% | | | | | |
| BorgWarner, Inc. | | | 71,045 | | | $ | 2,578,223 | |
| Gentex Corp. | | | 151,722 | | | | 4,504,626 | |
| | | | | | | | 7,082,849 | |
| Banks: 1.4% | | | | | | | | |
| Comerica, Inc. | | | 47,042 | | | | 2,818,286 | |
| Truist Financial Corp. | | | 65,513 | | | | 2,801,991 | |
| | | | | | | | 5,620,277 | |
| Capital Goods: 10.6% | | | | | | | | |
| Allegion plc | | | 36,385 | | | | 5,302,750 | |
| Allison Transmission Holdings, Inc. | | | 32,756 | | | | 3,146,869 | |
| Chart Industries, Inc. * † | | | 17,124 | | | | 2,125,773 | |
| Fortive Corp. | | | 31,387 | | | | 2,477,376 | |
| Fortune Brands Innovations, Inc. | | | 33,298 | | | | 2,981,170 | |
| Huntington Ingalls Industries, Inc. | | | 19,469 | | | | 5,147,214 | |
| Masco Corp. | | | 33,401 | | | | 2,803,680 | |
| MSC Industrial Direct Co., Inc. | | | 27,977 | | | | 2,407,701 | |
| Otis Worldwide Corp. | | | 25,748 | | | | 2,676,247 | |
| Rockwell Automation, Inc. | | | 9,127 | | | | 2,450,234 | |
| Sensata Technologies Holding Plc | | | 132,563 | | | | 4,753,709 | |
| WESCO International, Inc. | | | 28,984 | | | | 4,868,732 | |
| | | | | | | | 41,141,455 | |
| Commercial & Professional Services: 4.3% | | | | | |
| Equifax, Inc. | | | 9,554 | | | | 2,807,538 | |
| SS&C Technologies Holdings, Inc. | | | 70,457 | | | | 5,228,614 | |
| TransUnion | | | 54,560 | | | | 5,712,433 | |
| TriNet Group, Inc. | | | 23,379 | | | | 2,267,062 | |
| | | | | | | | 16,015,647 | |
| Consumer Discretionary Distribution & Retail: 5.7% | | | | | |
| Asbury Automotive Group, Inc. * | | | 22,096 | | | | 5,271,885 | |
| AutoNation, Inc. * | | | 15,008 | | | | 2,685,231 | |
| Bath & Body Works, Inc. | | | 58,916 | | | | 1,880,599 | |
| CarMax, Inc. * | | | 67,803 | | | | 5,246,596 | |
| Lithia Motors, Inc. | | | 18,928 | | | | 6,012,291 | |
| | | | | | | | 21,096,602 | |
| Consumer Durables & Apparel: 4.8% | | | | | |
| Brunswick Corp. | | | 62,102 | | | | 5,205,390 | |
| Hasbro, Inc. | | | 74,380 | | | | 5,379,162 | |
| Mattel, Inc. * | | | 135,799 | | | | 2,586,971 | |
| Tapestry, Inc. | | | 108,622 | | | | 5,103,062 | |
| | | | | | | | 18,274,585 | |
| Consumer Services: 8.0% | | | | | | | | |
| Carnival Corp. * | | | 278,153 | | | | 5,140,267 | |
| DoorDash, Inc. * | | | 37,697 | | | | 5,380,493 | |
| DraftKings, Inc. * | | | 61,952 | | | | 2,428,518 | |
| Expedia Group, Inc. * | | | 37,716 | | | | 5,582,722 | |
| Norwegian Cruise Line Holdings Ltd. * | | | 247,018 | | | | 5,066,339 | |
| | | Number
of Shares | | | Value | |
| Consumer Services (continued) | | | | | | | | |
| Wyndham Hotels & Resorts, Inc. | | | 62,263 | | | $ | 4,865,231 | |
| Wynn Resorts Ltd. | | | 25,236 | | | | 2,419,628 | |
| | | | | | | | 30,883,198 | |
| Energy: 1.8% | | | | | | | | |
| Devon Energy Corp. | | | 54,076 | | | | 2,115,453 | |
| Hess Corp. | | | 16,920 | | | | 2,297,736 | |
| HF Sinclair Corp. | | | 48,004 | | | | 2,139,538 | |
| | | | | | | | 6,552,727 | |
| Financial Services: 11.8% | | | | | | | | |
| Block, Inc. * | | | 74,133 | | | | 4,976,548 | |
| Capital One Financial Corp. | | | 35,139 | | | | 5,261,362 | |
| Carlyle Group, Inc. | | | 122,759 | | | | 5,286,003 | |
| Discover Financial Services | | | 38,140 | | | | 5,350,661 | |
| Global Payments, Inc. | | | 24,034 | | | | 2,461,562 | |
| Invesco Ltd. | | | 150,723 | | | | 2,646,696 | |
| LPL Financial Holdings, Inc. | | | 20,069 | | | | 4,668,651 | |
| MarketAxess Holdings, Inc. | | | 9,323 | | | | 2,388,553 | |
| Raymond James Financial, Inc. | | | 20,538 | | | | 2,515,083 | |
| SEI Investments Co. | | | 71,276 | | | | 4,931,586 | |
| Western Union Co. | | | 386,183 | | | | 4,607,163 | |
| | | | | | | | 45,093,868 | |
| Food, Beverage & Tobacco: 1.2% | | | | | | | | |
| Campbell Soup Co. | | | 48,462 | | | | 2,370,761 | |
| Kraft Heinz Co. | | | 67,731 | | | | 2,378,035 | |
| | | | | | | | 4,748,796 | |
| Health Care Equipment & Services: 5.8% | | | | | |
| Baxter International, Inc. | | | 60,452 | | | | 2,295,362 | |
| Centene Corp. * | | | 68,109 | | | | 5,127,246 | |
| GE HealthCare Technologies, Inc. | | | 27,314 | | | | 2,563,419 | |
| Labcorp Holdings, Inc. | | | 12,117 | | | | 2,707,907 | |
| ResMed, Inc. | | | 10,378 | | | | 2,533,477 | |
| Veeva Systems, Inc. * | | | 22,163 | | | | 4,651,349 | |
| Zimmer Biomet Holdings, Inc. | | | 22,577 | | | | 2,437,187 | |
| | | | | | | | 22,315,947 | |
| Household & Personal Products: 0.6% | | | | | |
| Kenvue, Inc. | | | 103,137 | | | | 2,385,559 | |
| Materials: 11.8% | | | | | | | | |
| Celanese Corp. | | | 19,762 | | | | 2,686,842 | |
| Corteva, Inc. | | | 88,514 | | | | 5,203,738 | |
| Dow, Inc. | | | 89,214 | | | | 4,873,761 | |
| DuPont de Nemours, Inc. | | | 59,284 | | | | 5,282,797 | |
| Eastman Chemical Co. | | | 46,498 | | | | 5,205,451 | |
| International Flavors & Fragrances, Inc. | | | 46,636 | | | | 4,893,515 | |
| LyondellBasell Industries NV | | | 50,008 | | | | 4,795,767 | |
| Scotts Miracle-Gro Co. | | | 71,770 | | | | 6,222,460 | |
| Sealed Air Corp. | | | 135,011 | | | | 4,900,899 | |
| | | | | | | | 44,065,230 | |
| Media & Entertainment: 5.3% | | | | | | | | |
| Interpublic Group of Cos, Inc. | | | 76,752 | | | | 2,427,666 | |
| Live Nation Entertainment, Inc. * | | | 49,613 | | | | 5,432,127 | |
| Omnicom Group, Inc. | | | 50,039 | | | | 5,173,532 | |
| Pinterest, Inc. * | | | 81,501 | | | | 2,638,187 | |
See Notes to Financial Statements
VANECK MORNINGSTAR SMID MOAT ETF
SCHEDULE OF INVESTMENTS
(continued)
| | | Number
of Shares | | | Value | |
| Media & Entertainment (continued) | | | | | |
| Roblox Corp. * | | | 52,766 | | | $ | 2,335,423 | |
| Warner Music Group Corp. † | | | 74,745 | | | | 2,339,519 | |
| | | | | | | | 20,346,454 | |
| Pharmaceuticals, Biotechnology & Life Sciences: 5.7% | | | | | |
| Agilent Technologies, Inc. | | | 17,115 | | | | 2,541,235 | |
| Charles River Laboratories International, Inc. * | | | 10,792 | | | | 2,125,700 | |
| Incyte Corp. * | | | 37,722 | | | | 2,493,424 | |
| Ionis Pharmaceuticals, Inc. * | | | 55,818 | | | | 2,236,069 | |
| IQVIA Holdings, Inc. * | | | 21,082 | | | | 4,995,802 | |
| Revvity, Inc. | | | 40,070 | | | | 5,118,943 | |
| Royalty Pharma Plc | | | 85,724 | | | | 2,425,132 | |
| | | | | | | | 21,936,305 | |
| Real Estate Investment Trusts: 1.3% | | | | | |
| Crown Castle, Inc. | | | 41,023 | | | | 4,866,558 | |
| Real Estate Management & Development: 0.8% | | | | | |
| Jones Lang LaSalle, Inc. * | | | 11,128 | | | | 3,002,446 | |
| Semiconductors & Semiconductor Equipment: 1.8% | | | | | |
| Microchip Technology, Inc. | | | 30,651 | | | | 2,460,969 | |
| Skyworks Solutions, Inc. | | | 23,307 | | | | 2,302,032 | |
| Teradyne, Inc. | | | 18,051 | | | | 2,417,570 | |
| | | | | | | | 7,180,571 | |
| Software & Services: 6.6% | | | | | | | | |
| Autodesk, Inc. * | | | 10,106 | | | | 2,784,001 | |
| Cloudflare, Inc. * | | | 61,730 | | | | 4,993,340 | |
| Cognizant Technology Solutions Corp. | | | 65,843 | | | | 5,081,763 | |
| Elastic NV * | | | 31,982 | | | | 2,454,938 | |
| Smartsheet, Inc. * | | | 46,512 | | | | 2,574,904 | |
| Workday, Inc. * | | | 11,027 | | | | 2,695,109 | |
| | | Number
of Shares | | | Value | |
| Software & Services (continued) | |
| Zoom Video Communications, Inc. * | | | 35,274 | | | $ | 2,460,009 | |
| Zscaler, Inc. * | | | 14,727 | | | | 2,517,433 | |
| | | | | | | | 25,561,497 | |
| Technology Hardware & Equipment: 2.8% | |
| F5, Inc. * | | | 13,459 | | | | 2,963,672 | |
| Littelfuse, Inc. | | | 19,213 | | | | 5,096,248 | |
| Vontier Corp. | | | 74,537 | | | | 2,514,878 | |
| | | | | | | | 10,574,798 | |
| Telecommunication Services: 0.7% | | | | |
| Liberty Global Ltd. * | | | 119,670 | | | | 2,586,069 | |
| Transportation: 1.1% | | | | | | | | |
| Lyft, Inc. * | | | 341,698 | | | | 4,356,650 | |
| Utilities: 4.2% | | | | | | | | |
| Entergy Corp. | | | 19,423 | | | | 2,556,261 | |
| Evergy, Inc. | | | 41,862 | | | | 2,595,863 | |
| NiSource, Inc. | | | 149,738 | | | | 5,188,422 | |
| Portland General Electric Co. | | | 53,141 | | | | 2,545,454 | |
| WEC Energy Group, Inc. | | | 27,832 | | | | 2,676,882 | |
| | | | | | | | 15,562,882 | |
Total Common Stocks
(Cost: $352,280,689) | | | | | | | 381,250,970 | |
| | | | | | | | | |
| SHORT-TERM INVESTMENT HELD AS COLLATERAL FOR SECURITIES ON LOAN: 0.6% | | | | | |
Money Market Fund: 0.6%
(Cost: $2,313,879) | | | | | | | | |
| State Street Navigator Securities Lending Government Money Market Portfolio | | | 2,313,879 | | | | 2,313,879 | |
Total Investments: 100.6%
(Cost: $354,594,568) | | | | | | | 383,564,849 | |
| Liabilities in excess of other assets: (0.6)% | | | | (2,106,245) | |
| NET ASSETS: 100.0% | | | | | | $ | 381,458,604 | |
Footnotes:
| † | Security fully or partially on loan. Total market value of securities on loan is $2,249,769. |
| * | Non-income producing |
The summary of inputs used to value the Fund's investments as of September 30, 2024 is as follows:
| | | Level 1
Quoted
Prices | | | Level 2
Significant
Observable
Inputs | | | Level 3
Significant
Unobservable
Inputs | | | Value | |
| Common Stocks * | | $ | 381,250,970 | | | $ | — | | | $ | — | | | $ | 381,250,970 | |
| Money Market Fund | | | 2,313,879 | | | | — | | | | — | | | | 2,313,879 | |
| Total Investments | | $ | 383,564,849 | | | $ | — | | | $ | — | | | $ | 383,564,849 | |
| | |
| * | See Schedule of Investments for industry sectors. |
See Notes to Financial Statements
VANECK MORNINGSTAR WIDE MOAT ETF
SCHEDULE OF INVESTMENTS
September 30, 2024
| | | Number
of Shares | | | Value | |
| COMMON STOCKS: 99.9% | | | | | | | | |
| Banks: 2.5% | | | | | | | | |
| US Bancorp | | | 8,892,893 | | | $ | 406,671,997 | |
| Capital Goods: 18.5% | | | | | | | | |
| Allegion plc † | | | 2,887,678 | | | | 420,850,192 | |
| Boeing Co. * | | | 2,166,449 | | | | 329,386,906 | |
| Emerson Electric Co. | | | 3,564,854 | | | | 389,888,082 | |
| Honeywell International, Inc. | | | 942,715 | | | | 194,868,618 | |
| Huntington Ingalls Industries, Inc. | | | 1,493,139 | | | | 394,756,089 | |
| IDEX Corp. | | | 975,761 | | | | 209,300,734 | |
| Masco Corp. | | | 2,610,711 | | | | 219,143,081 | |
| Northrop Grumman Corp. | | | 423,167 | | | | 223,461,798 | |
| Otis Worldwide Corp. | | | 2,079,699 | | | | 216,163,914 | |
| Rockwell Automation, Inc. | | | 697,816 | | | | 187,335,683 | |
| RTX Corp. | | | 1,694,436 | | | | 205,297,866 | |
| | | | | | | | 2,990,452,963 | |
| Commercial & Professional Services: 4.2% | | | | | |
| Equifax, Inc. | | | 734,824 | | | | 215,935,380 | |
| TransUnion | | | 4,357,901 | | | | 456,272,235 | |
| | | | | | | | 672,207,615 | |
| Consumer Discretionary Distribution & Retail: 2.2% | | | | | |
| Amazon.com, Inc. * | | | 1,042,444 | | | | 194,238,590 | |
| Etsy, Inc. * | | | 2,870,730 | | | | 159,411,637 | |
| | | | | | | | 353,650,227 | |
| Consumer Durables & Apparel: 2.4% | | | | | | | |
| NIKE, Inc. | | | 4,360,399 | | | | 385,459,272 | |
| Consumer Services: 1.3% | | | | | | | | |
| Starbucks Corp. | | | 2,147,579 | | | | 209,367,477 | |
| Financial Services: 3.8% | | | | | | | | |
| Charles Schwab Corp. | | | 3,033,452 | | | | 196,598,024 | |
| MarketAxess Holdings, Inc. | | | 1,653,782 | | | | 423,698,948 | |
| | | | | | | | 620,296,972 | |
| Food, Beverage & Tobacco: 7.4% | | | | | |
| Altria Group, Inc. | | | 7,594,579 | | | | 387,627,312 | |
| Brown-Forman Corp. † | | | 8,401,634 | | | | 413,360,393 | |
| Campbell Soup Co. | | | 8,272,963 | | | | 404,713,350 | |
| | | | | | | | 1,205,701,055 | |
| Health Care Equipment & Services: 5.9% | | | | | |
| GE HealthCare Technologies, Inc. | | | 2,206,118 | | | | 207,044,174 | |
| Veeva Systems, Inc. * | | | 1,799,972 | | | | 377,760,124 | |
| Zimmer Biomet Holdings, Inc. | | | 3,498,625 | | | | 377,676,569 | |
| | | | | | | | 962,480,867 | |
| Household & Personal Products: 6.4% | | | | | |
| Clorox Co. | | | 1,394,502 | | | | 227,178,321 | |
| Estee Lauder Cos, Inc. | | | 3,860,141 | | | | 384,817,456 | |
| Kenvue, Inc. | | | 18,299,355 | | | | 423,264,081 | |
| | | | | | | | 1,035,259,858 | |
| | | Number
of Shares | | | Value | |
| Materials: 6.2% | | | | | | | | |
| Air Products and Chemicals, Inc. | | | 692,636 | | | $ | 206,225,442 | |
| Corteva, Inc. | | | 6,955,233 | | | | 408,898,148 | |
| International Flavors & Fragrances, Inc. | | | 3,707,176 | | | | 388,993,978 | |
| | | | | | | | 1,004,117,568 | |
| Media & Entertainment: 4.9% | | | | | | | | |
| Alphabet, Inc. | | | 1,272,503 | | | | 211,044,622 | |
| Comcast Corp. | | | 4,797,361 | | | | 200,385,769 | |
| Walt Disney Co. | | | 3,958,784 | | | | 380,795,433 | |
| | | | | | | | 792,225,824 | |
| Pharmaceuticals, Biotechnology & Life Sciences: 15.3% | | | | | |
| Agilent Technologies, Inc. | | | 2,727,193 | | | | 404,933,616 | |
| Bio-Rad Laboratories, Inc. * † † | | | 1,245,646 | | | | 416,768,239 | |
| Bristol-Myers Squibb Co. | | | 8,247,696 | | | | 426,735,791 | |
| Gilead Sciences, Inc. | | | 5,181,239 | | | | 434,395,078 | |
| Pfizer, Inc. | | | 12,986,836 | | | | 375,839,034 | |
| Thermo Fisher Scientific, Inc. | | | 314,435 | | | | 194,500,058 | |
| Waters Corp. * † | | | 598,543 | | | | 215,409,640 | |
| | | | | | | | 2,468,581,456 | |
| Semiconductors & Semiconductor Equipment: 4.9% | | | | | |
| Lam Research Corp. | | | 250,830 | | | | 204,697,347 | |
| Microchip Technology, Inc. | | | 2,483,553 | | | | 199,404,470 | |
| NXP Semiconductors N.V. | | | 833,159 | | | | 199,966,492 | |
| Teradyne, Inc. | | | 1,462,638 | | | | 195,891,107 | |
| | | | | | | | 799,959,416 | |
| Software & Services: 11.4% | | | | | | | | |
| Adobe, Inc. * | | | 717,460 | | | | 371,486,439 | |
| Autodesk, Inc. * | | | 1,542,668 | | | | 424,974,181 | |
| Fortinet, Inc. * | | | 2,936,612 | | | | 227,734,261 | |
| Microsoft Corp. | | | 454,684 | | | | 195,650,525 | |
| Salesforce, Inc. | | | 1,520,943 | | | | 416,297,308 | |
| Workday, Inc. * | | | 850,155 | | | | 207,786,383 | |
| | | | | | | | 1,843,929,097 | |
| Technology Hardware & Equipment: 1.3% | | | | | |
| Keysight Technologies, Inc. * | | | 1,291,690 | | | | 205,288,292 | |
| Transportation: 1.3% | | | | | | | | |
| United Parcel Service, Inc. | | | 1,496,896 | | | | 204,086,801 | |
Total Common Stocks
(Cost: $14,762,416,647) | | | | | | | 16,159,736,757 | |
| | | | | | | | | |
| SHORT-TERM INVESTMENT HELD AS COLLATERAL FOR SECURITIES ON LOAN: 0.0% | | | | | |
Money Market Fund: 0.0%
(Cost: $426,158) | | | | | | | | |
| State Street Navigator Securities Lending Government Money Market Portfolio | | | 426,158 | | | | 426,158 | |
Total Investments: 99.9%
(Cost: $14,762,842,805) | | | | | | | 16,160,162,915 | |
| Other assets less liabilities: 0.1% | | | | 10,940,237 | |
| NET ASSETS: 100.0% | | | | | | $ | 16,171,103,152 | |
See Notes to Financial Statements
VANECK MORNINGSTAR WIDE MOAT ETF
SCHEDULE OF INVESTMENTS
(continued)
Footnotes:
| † | Security fully or partially on loan. Total market value of securities on loan is $158,996,579. |
| * | Non-income producing |
| † | Affiliated issuer – as defined under the Investment Company Act of 1940. |
Transactions in securities of affiliates for the period ended September 30, 2024 were as follows:
| | | Value
9/30/2023 | | | Purchases | | | Sales
Proceeds | | | Realized Gain
(Loss) | | | Net Change in
Unrealized
Appreciation
(Depreciation) | | | Value
9/30/2024 | | | Dividend
Income | |
| Bio-Rad Laboratories, Inc. | | | $– | | | | $389,501,139 | | | | $(3,528,535 | ) | | | $66,877 | | | | $30,728,758 | | | | $416,768,239 | | | | $– | |
The summary of inputs used to value the Fund's investments as of September 30, 2024 is as follows:
| | | Level 1
Quoted
Prices | | | Level 2
Significant
Observable
Inputs | | | Level 3
Significant
Unobservable
Inputs | | | Value | |
| Common Stocks * | | $ | 16,159,736,757 | | | $ | — | | | $ | — | | | $ | 16,159,736,757 | |
| Money Market Fund | | | 426,158 | | | | — | | | | — | | | | 426,158 | |
| Total Investments | | $ | 16,160,162,915 | | | $ | — | | | $ | — | | | $ | 16,160,162,915 | |
| | |
| * | See Schedule of Investments for industry sectors. |
See Notes to Financial Statements
VANECK MORNINGSTAR WIDE MOAT GROWTH ETF
SCHEDULE OF INVESTMENTS
September 30, 2024
| | | Number
of Shares | | | Value | |
| COMMON STOCKS: 99.8% | | | | | | | | |
| Capital Goods: 15.4% | | | | | | | | |
| Allegion plc | | | 155 | | | $ | 22,590 | |
| Huntington Ingalls Industries, Inc. | | | 84 | | | | 22,208 | |
| IDEX Corp. | | | 88 | | | | 18,876 | |
| Otis Worldwide Corp. | | | 215 | | | | 22,347 | |
| Rockwell Automation, Inc. | | | 132 | | | | 35,437 | |
| | | | | | | | 121,458 | |
| Commercial & Professional Services: 7.9% | | | | | |
| Equifax, Inc. | | | 68 | | | | 19,982 | |
| TransUnion | | | 397 | | | | 41,565 | |
| | | | | | | | 61,547 | |
| Consumer Discretionary Distribution & Retail: 5.5% | | | | | |
| Amazon.com, Inc. * | | | 180 | | | | 33,539 | |
| Etsy, Inc. * | | | 169 | | | | 9,385 | |
| | | | | | | | 42,924 | |
| Consumer Durables & Apparel: 1.0% | | | | | | | | |
| NIKE, Inc. | | | 92 | | | | 8,133 | |
| Consumer Services: 2.1% | | | | | | | | |
| Yum! Brands, Inc. | | | 120 | | | | 16,765 | |
| Financial Services: 3.6% | | | | | | | | |
| Intercontinental Exchange, Inc. | | | 23 | | | | 3,695 | |
| MarketAxess Holdings, Inc. | | | 95 | | | | 24,339 | |
| | | | | | | | 28,034 | |
| Food, Beverage & Tobacco: 5.2% | | | | | | | | |
| Brown-Forman Corp. | | | 454 | | | | 22,337 | |
| Constellation Brands, Inc. | | | 72 | | | | 18,554 | |
| | | | | | | | 40,891 | |
| Health Care Equipment & Services: 7.7% | | | | | |
| GE HealthCare Technologies, Inc. | | | 90 | | | | 8,447 | |
| Veeva Systems, Inc. * | | | 164 | | | | 34,419 | |
| Zimmer Biomet Holdings, Inc. | | | 159 | | | | 17,164 | |
| | | | | | | | 60,030 | |
| Household & Personal Products: 6.1% | | | | | |
| Clorox Co. | | | 82 | | | | 13,359 | |
| Estee Lauder Cos, Inc. | | | 350 | | | | 34,892 | |
| | | | | | | | 48,251 | |
| | | Number
of Shares | | | Value | |
| Materials: 2.1% | | | | | | | | |
| Corteva, Inc. | | | 284 | | | $ | 16,696 | |
| Media & Entertainment: 3.5% | | | | | | | | |
| Alphabet, Inc. | | | 106 | | | | 17,580 | |
| Walt Disney Co. | | | 104 | | | | 10,004 | |
| | | | | | | | 27,584 | |
| Pharmaceuticals, Biotechnology & Life Sciences: 9.7% | | | | | |
| Agilent Technologies, Inc. | | | 248 | | | | 36,823 | |
| Bio-Rad Laboratories, Inc. * | | | 20 | | | | 6,692 | |
| Thermo Fisher Scientific, Inc. | | | 4 | | | | 2,474 | |
| Waters Corp. * | | | 35 | | | | 12,596 | |
| West Pharmaceutical Services, Inc. | | | 57 | | | | 17,109 | |
| | | | | | | | 75,694 | |
| Semiconductors & Semiconductor Equipment: 2.0% | | | | | |
| Lam Research Corp. | | | 9 | | | | 7,345 | |
| Teradyne, Inc. | | | 64 | | | | 8,572 | |
| | | | | | | | 15,917 | |
| Software & Services: 25.9% | | | | | | | | |
| Adobe, Inc. * | | | 65 | | | | 33,656 | |
| Autodesk, Inc. * | | | 141 | | | | 38,842 | |
| Fortinet, Inc. * | | | 271 | | | | 21,016 | |
| Microsoft Corp. | | | 41 | | | | 17,642 | |
| Salesforce, Inc. | | | 138 | | | | 37,771 | |
| Tyler Technologies, Inc. * | | | 35 | | | | 20,430 | |
| VeriSign, Inc. * | | | 95 | | | | 18,046 | |
| Workday, Inc. * | | | 67 | | | | 16,375 | |
| | | | | | | | 203,778 | |
| Technology Hardware & Equipment: 2.1% | | | | | |
| Keysight Technologies, Inc. * | | | 106 | | | | 16,847 | |
Total Common Stocks
(Cost: $775,674) | | | | | | | 784,549 | |
Total Investments: 99.8%
(Cost: $775,674) | | | | | | | 784,549 | |
| Other assets less liabilities: 0.2% | | | | | | | 1,354 | |
| NET ASSETS: 100.0% | | | | | | $ | 785,903 | |
Footnotes:
The summary of inputs used to value the Fund's investments as of September 30, 2024 is as follows:
| | | Level 1
Quoted
Prices | | | Level 2
Significant
Observable
Inputs | | | Level 3
Significant
Unobservable
Inputs | | | Value | |
| Common Stocks * | | $ | 784,549 | | | $ | — | | | $ | — | | | $ | 784,549 | |
| | |
| * | See Schedule of Investments for industry sectors. |
See Notes to Financial Statements
VANECK MORNINGSTAR WIDE MOAT VALUE ETF
SCHEDULE OF INVESTMENTS
September 30, 2024
| | | Number
of Shares | | | Value | |
| COMMON STOCKS: 100.0% | | | | | | | | |
| Banks: 4.5% | | | | | | | | |
| US Bancorp | | | 4,993 | | | $ | 228,330 | |
| Capital Goods: 22.4% | | | | | | | | |
| Allegion plc | | | 666 | | | | 97,063 | |
| Boeing Co. * | | | 1,218 | | | | 185,185 | |
| Emerson Electric Co. | | | 2,004 | | | | 219,177 | |
| Honeywell International, Inc. | | | 534 | | | | 110,383 | |
| Huntington Ingalls Industries, Inc. | | | 321 | | | | 84,866 | |
| Masco Corp. | | | 1,617 | | | | 135,731 | |
| Northrop Grumman Corp. | | | 236 | | | | 124,625 | |
| Otis Worldwide Corp. | | | 467 | | | | 48,540 | |
| RTX Corp. | | | 943 | | | | 114,254 | |
| | | | | | | | 1,119,824 | |
| Consumer Discretionary Distribution & Retail: 0.6% | | | | | |
| Etsy, Inc. * | | | 577 | | | | 32,041 | |
| Consumer Durables & Apparel: 3.3% | | | | | | | | |
| NIKE, Inc. | | | 1,883 | | | | 166,457 | |
| Consumer Services: 3.4% | | | | | | | | |
| McDonald's Corp. | | | 311 | | | | 94,703 | |
| Starbucks Corp. | | | 778 | | | | 75,847 | |
| | | | | | | | 170,550 | |
| Financial Services: 3.9% | | | | | | | | |
| Charles Schwab Corp. | | | 1,719 | | | | 111,408 | |
| MarketAxess Holdings, Inc. | | | 342 | | | | 87,620 | |
| | | | | | | | 199,028 | |
| Food, Beverage & Tobacco: 11.7% | | | | | | | | |
| Altria Group, Inc. | | | 4,264 | | | | 217,635 | |
| Brown-Forman Corp. | | | 1,921 | | | | 94,513 | |
| Campbell Soup Co. | | | 4,644 | | | | 227,184 | |
| Constellation Brands, Inc. | | | 203 | | | | 52,311 | |
| | | | | | | | 591,643 | |
| Health Care Equipment & Services: 3.4% | | | | | |
| GE HealthCare Technologies, Inc. | | | 684 | | | | 64,193 | |
| Zimmer Biomet Holdings, Inc. | | | 981 | | | | 105,899 | |
| | | | | | | | 170,092 | |
| | | Number
of Shares | | | Value | |
| Household & Personal Products: 5.6% | | | | | |
| Clorox Co. | | | 284 | | | $ | 46,266 | |
| Kenvue, Inc. | | | 10,270 | | | | 237,545 | |
| | | | | | | | 283,811 | |
| Materials: 6.8% | | | | | | | | |
| Corteva, Inc. | | | 2,151 | | | | 126,457 | |
| International Flavors & Fragrances, Inc. | | | 2,082 | | | | 218,464 | |
| | | | | | | | 344,921 | |
| Media & Entertainment: 6.4% | | | | | | | | |
| Alphabet, Inc. | | | 350 | | | | 58,048 | |
| Comcast Corp. | | | 2,671 | | | | 111,568 | |
| Walt Disney Co. | | | 1,580 | | | | 151,980 | |
| | | | | | | | 321,596 | |
| Pharmaceuticals, Biotechnology & Life Sciences: 19.7% | | | | | |
| Bio-Rad Laboratories, Inc. * | | | 443 | | | | 148,219 | |
| Bristol-Myers Squibb Co. | | | 4,631 | | | | 239,608 | |
| Gilead Sciences, Inc. | | | 2,908 | | | | 243,808 | |
| Pfizer, Inc. | | | 7,294 | | | | 211,088 | |
| Thermo Fisher Scientific, Inc. | | | 149 | | | | 92,167 | |
| Waters Corp. * | | | 121 | | | | 43,547 | |
| | | | | | | | 978,437 | |
| Semiconductors & Semiconductor Equipment: 4.8% | | | | | |
| Lam Research Corp. | | | 88 | | | | 71,815 | |
| NXP Semiconductors N.V. | | | 472 | | | | 113,285 | |
| Teradyne, Inc. | | | 426 | | | | 57,054 | |
| | | | | | | | 242,154 | |
| Technology Hardware & Equipment: 1.2% | | | | | |
| Keysight Technologies, Inc. * | | | 394 | | | | 62,618 | |
| Transportation: 2.3% | | | | | | | | |
| United Parcel Service, Inc. | | | 848 | | | | 115,616 | |
Total Common Stocks
(Cost: $4,888,361) | | | | | | | 5,027,118 | |
Total Investments: 100.0%
(Cost: $4,888,361) | | | | | | | 5,027,118 | |
| Liabilities in excess of other assets: 0.0% | | | | | | | (1,737) | |
| NET ASSETS: 100.0% | | | | | | $ | 5,025,381 | |
Footnotes:
The summary of inputs used to value the Fund's investments as of September 30, 2024 is as follows:
| | | Level 1
Quoted
Prices | | | Level 2
Significant
Observable
Inputs | | | Level 3
Significant
Unobservable
Inputs | | | Value | |
| Common Stocks * | | $ | 5,027,118 | | | $ | — | | | $ | — | | | $ | 5,027,118 | |
| | |
| * | See Schedule of Investments for industry sectors. |
See Notes to Financial Statements
VANECK SOCIAL SENTIMENT ETF
SCHEDULE OF INVESTMENTS
September 30, 2024
| | | Number
of Shares | | | Value | |
| COMMON STOCKS: 100.0% | | | | | | | | |
| Automobiles & Components: 6.7% | | | | | |
| Ford Motor Co. | | | 36,526 | | | $ | 385,715 | |
| Lucid Group, Inc. * † | | | 281,975 | | | | 995,372 | |
| Rivian Automotive, Inc. * † | | | 45,572 | | | | 511,318 | |
| Tesla, Inc. * | | | 6,903 | | | | 1,806,031 | |
| | | | | | | | 3,698,436 | |
| Banks: 1.9% | | | | | | | | |
| Bank of America Corp. | | | 10,596 | | | | 420,449 | |
| JPMorgan Chase & Co. | | | 1,866 | | | | 393,465 | |
| NU Holdings Ltd. * | | | 17,595 | | | | 240,172 | |
| | | | | | | | 1,054,086 | |
| Capital Goods: 1.6% | | | | | | | | |
| Boeing Co. * | | | 5,791 | | | | 880,464 | |
| Consumer Discretionary Distribution & Retail: 9.3% | | | | | |
| Amazon.com, Inc. * | | | 8,484 | | | | 1,580,824 | |
| Carvana Co. * | | | 2,147 | | | | 373,814 | |
| Chewy, Inc. * | | | 23,534 | | | | 689,311 | |
| GameStop Corp. * | | | 77,767 | | | | 1,783,197 | |
| The Home Depot, Inc. | | | 744 | | | | 301,469 | |
| Ulta Beauty, Inc. * | | | 1,154 | | | | 449,044 | |
| | | | | | | | 5,177,659 | |
| Consumer Durables & Apparel: 1.8% | | | | | |
| Lululemon Athletica, Inc. * | | | 1,557 | | | | 422,492 | |
| NIKE, Inc. | | | 6,296 | | | | 556,566 | |
| | | | | | | | 979,058 | |
| Consumer Services: 6.5% | | | | | | | | |
| Airbnb, Inc. * | | | 1,864 | | | | 236,374 | |
| Cava Group, Inc. * | | | 4,644 | | | | 575,159 | |
| Chipotle Mexican Grill, Inc. * | | | 9,915 | | | | 571,302 | |
| DraftKings, Inc. * | | | 15,729 | | | | 616,577 | |
| McDonald's Corp. | | | 978 | | | | 297,811 | |
| Starbucks Corp. | | | 14,361 | | | | 1,400,054 | |
| | | | | | | | 3,697,277 | |
| Consumer Staples Distribution & Retail: 3.8% | | | | | |
| Dollar General Corp. | | | 6,300 | | | | 532,791 | |
| Target Corp. | | | 2,136 | | | | 332,917 | |
| Walgreens Boots Alliance, Inc. | | | 41,815 | | | | 374,662 | |
| Walmart, Inc. | | | 10,628 | | | | 858,211 | |
| | | | | | | | 2,098,581 | |
| Energy: 1.0% | | | | | | | | |
| Exxon Mobil Corp. | | | 2,317 | | | | 271,599 | |
| Occidental Petroleum Corp. | | | 5,661 | | | | 291,768 | |
| | | | | | | | 563,367 | |
| Financial Services: 11.2% | | | | | | | | |
| Affirm Holdings, Inc. * | | | 11,405 | | | | 465,552 | |
| Block, Inc. * | | | 3,311 | | | | 222,267 | |
| Coinbase Global, Inc. * | | | 6,357 | | | | 1,132,627 | |
| Goldman Sachs Group, Inc. | | | 662 | | | | 327,763 | |
| PayPal Holdings, Inc. * | | | 12,929 | | | | 1,008,850 | |
| Robinhood Markets, Inc. * | | | 47,896 | | | | 1,121,724 | |
| SoFi Technologies, Inc. * † | | | 212,660 | | | | 1,671,508 | |
| Visa, Inc. | | | 1,297 | | | | 356,610 | |
| | | | | | | | 6,306,901 | |
| | | Number
of Shares | | | Value | |
| Food, Beverage & Tobacco: 1.9% | | | | | | | | |
| Celsius Holdings, Inc. * | | | 23,885 | | | $ | 749,034 | |
| Philip Morris International, Inc. | | | 2,341 | | | | 284,197 | |
| | | | | | | | 1,033,231 | |
| Household & Personal Products: 0.6% | | | | | |
| elf Beauty, Inc. * | | | 2,971 | | | | 323,928 | |
| Materials: 2.0% | | | | | | | | |
| Albemarle Corp. | | | 3,589 | | | | 339,914 | |
| United States Steel Corp. † | | | 21,316 | | | | 753,094 | |
| | | | | | | | 1,093,008 | |
| Media & Entertainment: 11.9% | | | | | | | | |
| Alphabet, Inc. | | | 10,256 | | | | 1,700,958 | |
| Meta Platforms, Inc. | | | 3,018 | | | | 1,727,624 | |
| Netflix, Inc. * | | | 600 | | | | 425,562 | |
| Roblox Corp. * | | | 5,188 | | | | 229,621 | |
| Sirius XM Holdings, Inc. | | | 22,964 | | | | 543,099 | |
| Snap, Inc. * | | | 65,327 | | | | 698,999 | |
| Walt Disney Co. | | | 9,940 | | | | 956,129 | |
| Warner Bros Discovery, Inc. * | | | 32,265 | | | | 266,186 | |
| | | | | | | | 6,548,178 | |
| Pharmaceuticals, Biotechnology & Life Sciences: 3.5% | | | | | |
| Eli Lilly & Co. | | | 503 | | | | 445,628 | |
| Moderna, Inc. * | | | 3,625 | | | | 242,259 | |
| Pfizer, Inc. | | | 8,645 | | | | 250,186 | |
| Summit Therapeutics, Inc. * | | | 10,493 | | | | 229,797 | |
| Viking Therapeutics, Inc. * | | | 12,279 | | | | 777,383 | |
| | | | | | | | 1,945,253 | |
| Semiconductors & Semiconductor Equipment: 12.6% | | | | | |
| Advanced Micro Devices, Inc. * | | | 10,522 | | | | 1,726,450 | |
| Broadcom, Inc. | | | 5,708 | | | | 984,630 | |
| Intel Corp. | | | 81,944 | | | | 1,922,405 | |
| Micron Technology, Inc. | | | 7,114 | | | | 737,793 | |
| NVIDIA Corp. | | | 13,316 | | | | 1,617,095 | |
| | | | | | | | 6,988,373 | |
| Software & Services: 15.4% | | | | | | | | |
| Crowdstrike Holdings, Inc. * | | | 3,674 | | | | 1,030,447 | |
| Microsoft Corp. | | | 2,100 | | | | 903,630 | |
| MicroStrategy, Inc. * † | | | 12,132 | | | | 2,045,454 | |
| Oracle Corp. | | | 2,249 | | | | 383,230 | |
| Palantir Technologies, Inc. * | | | 45,444 | | | | 1,690,517 | |
| Palo Alto Networks, Inc. * | | | 1,506 | | | | 514,751 | |
| Salesforce, Inc. | | | 1,184 | | | | 324,073 | |
| Snowflake, Inc. * | | | 7,716 | | | | 886,260 | |
| Unity Software, Inc. * † | | | 18,303 | | | | 414,014 | |
| Zoom Video Communications, Inc. * | | | 4,374 | | | | 305,043 | |
| | | | | | | | 8,497,419 | |
| Technology Hardware & Equipment: 7.2% | | | | | |
| Apple, Inc. | | | 7,121 | | | | 1,659,193 | |
| Cisco Systems, Inc. | | | 6,014 | | | | 320,065 | |
| Dell Technologies, Inc. | | | 4,034 | | | | 478,190 | |
| Super Micro Computer, Inc. * † | | | 3,588 | | | | 1,494,043 | |
| | | | | | | | 3,951,491 | |
| Telecommunication Services: 0.6% | | | | | |
| AT&T, Inc. | | | 13,866 | | | | 305,052 | |
See Notes to Financial Statements
VANECK SOCIAL SENTIMENT ETF
SCHEDULE OF INVESTMENTS
(continued)
| | | Number
of Shares | | | Value | |
| Transportation: 0.5% | | | | | | | | |
| Uber Technologies, Inc. * | | | 3,577 | | | $ | 268,847 | |
Total Common Stocks
(Cost: $53,229,792) | | | | | | | 55,410,609 | |
| | | | | | | | | |
| SHORT-TERM INVESTMENT HELD AS COLLATERAL FOR SECURITIES ON LOAN: 1.0% | | | | | |
Money Market Fund: 1.0%
(Cost: $533,605) | | | | | | | | |
| State Street Navigator Securities Lending Government Money Market Portfolio | | | 533,605 | | | | 533,605 | |
Total Investments: 101.0%
(Cost: $53,763,397) | | | | | | | 55,944,214 | |
| Liabilities in excess of other assets: (1.0)% | | | | (530,694) | |
| NET ASSETS: 100.0% | | | | | | $ | 55,413,520 | |
Footnotes:
| † | Security fully or partially on loan. Total market value of securities on loan is $5,445,687. |
| * | Non-income producing |
The summary of inputs used to value the Fund's investments as of September 30, 2024 is as follows:
| | | Level 1
Quoted
Prices | | | Level 2
Significant
Observable
Inputs | | | Level 3
Significant
Unobservable
Inputs | | | Value | |
| Common Stocks * | | $ | 55,410,609 | | | $ | — | | | $ | — | | | $ | 55,410,609 | |
| Money Market Fund | | | 533,605 | | | | — | | | | — | | | | 533,605 | |
| Total Investments | | $ | 55,944,214 | | | $ | — | | | $ | — | | | $ | 55,944,214 | |
| | |
| * | See Schedule of Investments for industry sectors. |
See Notes to Financial Statements
VANECK ETF TRUST
STATEMENTS OF ASSETS AND LIABILITIES
September 30, 2024
| | | Commodity
Strategy ETF(a) | | | Durable High
Dividend ETF | | | Inflation
Allocation ETF(a) | | | Long/Flat Trend
ETF | |
| Assets: | | | | | | | | | | | | | | | | |
| Investments, at value (1) | | | | | | | | | | | | | | | | |
| Unaffiliated issuers (2) | | $ | 22,643,050 | | | $ | 51,921,248 | | | $ | 46,861,552 | | | $ | 26,754,452 | |
| Affiliated issuers (3) | | | — | | | | — | | | | 30,146,457 | | | | — | |
| Short-term investments held as collateral for securities loaned (4) | | | — | | | | — | | | | 2,460,575 | | | | — | |
| Cash | | | 24,506 | | | | 140,183 | | | | 508,295 | | | | 27,908 | |
| Cash on deposit with broker for futures contracts | | | 836,974 | | | | — | | | | — | | | | — | |
| Receivables: | | | | | | | | | | | | | | | | |
| Dividends and interest | | | — | | | | 108,802 | | | | 5,271 | | | | 83,095 | |
| Prepaid expenses | | | — | | | | — | | | | 1,983 | | | | 797 | |
| Net variation margin on futures contracts | | | 530,145 | | | | — | | | | — | | | | — | |
| Total assets | | | 24,034,675 | | | | 52,170,233 | | | | 79,984,133 | | | | 26,866,252 | |
| Liabilities: | | | | | | | | | | | | | | | | |
| Payables: | | | | | | | | | | | | | | | | |
| Collateral for securities loaned | | | — | | | | — | | | | 2,460,575 | | | | — | |
| Due to Adviser | | | 10,600 | | | | 12,514 | | | | 18,707 | | | | 9,015 | |
| Deferred Trustee fees | | | — | | | | 624 | | | | 1,207 | | | | 1,606 | |
| Accrued expenses | | | — | | | | — | | | | 75,183 | | | | 46,103 | |
| Total liabilities | | | 10,600 | | | | 13,138 | | | | 2,555,672 | | | | 56,724 | |
| NET ASSETS | | $ | 24,024,075 | | | $ | 52,157,095 | | | $ | 77,428,461 | | | $ | 26,809,528 | |
| Shares outstanding | | | 500,000 | | | | 1,500,000 | | | | 2,675,000 | | | | 550,000 | |
| Net asset value, redemption and offering price per share | | $ | 48.05 | | | $ | 34.77 | | | $ | 28.95 | | | $ | 48.74 | |
| Net Assets consist of: | | | | | | | | | | | | | | | | |
| Aggregate paid in capital | | $ | 23,590,278 | | | $ | 66,966,322 | | | $ | 91,444,988 | | | $ | 28,989,760 | |
| Total distributable earnings (loss) | | | 433,797 | | | | (14,809,227 | ) | | | (14,016,527 | ) | | | (2,180,232 | ) |
| NET ASSETS | | $ | 24,024,075 | | | $ | 52,157,095 | | | $ | 77,428,461 | | | $ | 26,809,528 | |
| (1) | Value of securities on loan | | $ | — | | | $ | 30,549 | | | $ | 8,826,893 | | | $ | — | |
| (2) | Cost of investments - Unaffiliated issuers | | $ | 22,636,535 | | | $ | 49,650,801 | | | $ | 38,441,445 | | | $ | 21,129,378 | |
| (3) | Cost of investments - Affiliated issuers | | $ | — | | | $ | — | | | $ | 28,910,792 | | | $ | — | |
| (4) | Cost of short-term investments held as collateral for securities loaned | | $ | — | | | $ | — | | | $ | 2,460,575 | | | $ | — | |
| (a) | Consolidated Statement of Assets and Liabilities |
See Notes to Financial Statements
VANECK ETF TRUST
STATEMENTS OF ASSETS AND LIABILITIES
September 30, 2024
| | | Morningstar ESG
Moat ETF | | | Morningstar
Global Wide Moat
ETF | | | Morningstar
International
Moat ETF | | | Morningstar SMID
Moat ETF | |
| Assets: | | | | | | | | | | | | | | | | |
| Investments, at value (1) | | | | | | | | | | | | | | | | |
| Unaffiliated issuers (2) | | $ | 6,509,256 | | | $ | 16,292,359 | | | $ | 240,962,787 | | | $ | 381,250,970 | |
| Short-term investments held as collateral for securities loaned (3) | | | — | | | | 152,787 | | | | 3,883,714 | | | | 2,313,879 | |
| Cash | | | 51,352 | | | | 35,191 | | | | 1,035 | | | | 105,573 | |
| Cash denominated in foreign currency, at value (4) | | | — | | | | 3,845 | | | | 170,922 | | | | — | |
| Receivables: | | | | | | | | | | | | | | | | |
| Due from Adviser | | | 900 | | | | 2,892 | | | | — | | | | — | |
| Dividends and interest | | | 4,373 | | | | 31,235 | | | | 861,331 | | | | 284,125 | |
| Prepaid expenses | | | 807 | | | | 803 | | | | 3,196 | | | | 4,054 | |
| Total assets | | | 6,566,688 | | | | 16,519,112 | | | | 245,882,985 | | | | 383,958,601 | |
| Liabilities: | | | | | | | | | | | | | | | | |
| Payables: | | | | | | | | | | | | | | | | |
| Collateral for securities loaned | | | — | | | | 152,787 | | | | 3,883,714 | | | | 2,313,879 | |
| Line of credit | | | — | | | | — | | | | 1,008,216 | | | | — | |
| Due to Adviser | | | — | | | | — | | | | 94,349 | | | | 127,878 | |
| Deferred Trustee fees | | | 24 | | | | 400 | | | | 3,444 | | | | 556 | |
| Accrued expenses | | | 52,738 | | | | 61,886 | | | | 74,971 | | | | 57,684 | |
| Total liabilities | | | 52,762 | | | | 215,073 | | | | 5,064,694 | | | | 2,499,997 | |
| NET ASSETS | | $ | 6,513,926 | | | $ | 16,304,039 | | | $ | 240,818,291 | | | $ | 381,458,604 | |
| Shares outstanding | | | 225,000 | | | | 400,000 | | | | 6,850,000 | | | | 10,900,000 | |
| Net asset value, redemption and offering price per share | | $ | 28.95 | | | $ | 40.76 | | | $ | 35.16 | | | $ | 35.00 | |
| Net Assets consist of: | | | | | | | | | | | | | | | | |
| Aggregate paid in capital | | $ | 6,338,839 | | | $ | 13,121,887 | | | $ | 235,884,369 | | | $ | 376,317,467 | |
| Total distributable earnings | | | 175,087 | | | | 3,182,152 | | | | 4,933,922 | | | | 5,141,137 | |
| NET ASSETS | | $ | 6,513,926 | | | $ | 16,304,039 | | | $ | 240,818,291 | | | $ | 381,458,604 | |
| (1) | Value of securities on loan | | $ | — | | | $ | 191,912 | | | $ | 25,833,617 | | | $ | 2,249,769 | |
| (2) | Cost of investments - Unaffiliated issuers | | $ | 5,604,691 | | | $ | 13,843,191 | | | $ | 217,327,781 | | | $ | 352,280,689 | |
| (3) | Cost of short-term investments held as collateral for securities loaned | | $ | — | | | $ | 152,787 | | | $ | 3,883,714 | | | $ | 2,313,879 | |
| (4) | Cost of cash denominated in foreign currency | | $ | — | | | $ | 3,845 | | | $ | 170,695 | | | $ | — | |
See Notes to Financial Statements
VANECK ETF TRUST
STATEMENTS OF ASSETS AND LIABILITIES
September 30, 2024
| | | Morningstar Wide
Moat ETF | | | Morningstar Wide
Moat Growth ETF | | | Morningstar Wide
Moat Value ETF | | | Social Sentiment
ETF | |
| Assets: | | | | | | | | | | | | | | | | |
| Investments, at value (1) | | | | | | | | | | | | | | | | |
| Unaffiliated issuers (2) | | $ | 15,742,968,518 | | | $ | 784,549 | | | $ | 5,027,118 | | | $ | 55,410,609 | |
| Affiliated issuers (3) | | | 416,768,239 | | | | — | | | | — | | | | — | |
| Short-term investments held as collateral for securities loaned (4) | | | 426,158 | | | | — | | | | — | | | | 533,605 | |
| Cash | | | 328,881 | | | | 31,066 | | | | 20,004 | | | | 18,218 | |
| Receivables: | | | | | | | | | | | | | | | | |
| Shares of beneficial interest sold | | | 9,697,746 | | | | — | | | | — | | | | — | |
| Due from Adviser | | | — | | | | 5,453 | | | | 3,768 | | | | — | |
| Dividends and interest | | | 19,989,575 | | | | 195 | | | | 9,845 | | | | 18,202 | |
| Prepaid expenses | | | 17,778 | | | | 804 | | | | 804 | | | | — | |
| Total assets | | | 16,190,196,895 | | | | 822,067 | | | | 5,061,539 | | | | 55,980,634 | |
| Liabilities: | | | | | | | | | | | | | | | | |
| Payables: | | | | | | | | | | | | | | | | |
| Investment securities purchased | | | 9,693,890 | | | | — | | | | — | | | | — | |
| Collateral for securities loaned | | | 426,158 | | | | — | | | | — | | | | 533,605 | |
| Line of credit | | | 2,631,686 | | | | — | | | | — | | | | — | |
| Due to Adviser | | | 5,879,734 | | | | — | | | | — | | | | 33,509 | |
| Deferred Trustee fees | | | 223,921 | | | | — | | | | — | | | | — | |
| Accrued expenses | | | 238,354 | | | | 36,164 | | | | 36,158 | | | | — | |
| Total liabilities | | | 19,093,743 | | | | 36,164 | | | | 36,158 | | | | 567,114 | |
| NET ASSETS | | $ | 16,171,103,152 | | | $ | 785,903 | | | $ | 5,025,381 | | | $ | 55,413,520 | |
| Shares outstanding | | | 166,750,000 | | | | 25,000 | | | | 150,000 | | | | 2,575,000 | |
| Net asset value, redemption and offering price per share | | $ | 96.98 | | | $ | 31.44 | | | $ | 33.50 | | | $ | 21.52 | |
| Net Assets consist of: | | | | | | | | | | | | | | | | |
| Aggregate paid in capital | | $ | 16,388,317,815 | | | $ | 801,517 | | | $ | 4,876,359 | | | $ | 171,700,242 | |
| Total distributable earnings (loss) | | | (217,214,663 | ) | | | (15,614 | ) | | | 149,022 | | | | (116,286,722 | ) |
| NET ASSETS | | $ | 16,171,103,152 | | | $ | 785,903 | | | $ | 5,025,381 | | | $ | 55,413,520 | |
| (1) | Value of securities on loan | | $ | 158,996,579 | | | $ | — | | | $ | — | | | $ | 5,445,687 | |
| (2) | Cost of investments - Unaffiliated issuers | | $ | 14,376,377,166 | | | $ | 775,674 | | | $ | 4,888,361 | | | $ | 53,229,792 | |
| (3) | Cost of investments - Affiliated issuers | | $ | 386,039,481 | | | $ | — | | | $ | — | | | $ | — | |
| (4) | Cost of short-term investments held as collateral for securities loaned | | $ | 426,158 | | | $ | — | | | $ | — | | | $ | 533,605 | |
See Notes to Financial Statements
VANECK ETF TRUST
STATEMENTS OF OPERATIONS
For the Year Ended September 30, 2024
| | | Commodity
Strategy ETF(a) | | | Durable High
Dividend ETF | | | Inflation
Allocation ETF(a) | | | Long/Flat Trend
ETF | |
| Income: | | | | | | | | | | | | | | | | |
| Dividends - unaffiliated issuers | | $ | — | | | $ | 2,034,857 | | | $ | 1,929,594 | | | $ | 366,684 | |
| Dividends - affiliated issuers | | | — | | | | — | | | | 1,833,421 | | | | — | |
| Interest | | | 1,327,432 | | | | 1,932 | | | | 22,184 | | | | 64,609 | |
| Securities lending income | | | — | | | | 69 | | | | 72,619 | | | | 1,619 | |
| Total income | | | 1,327,432 | | | | 2,036,858 | | | | 3,857,818 | | | | 432,912 | |
| Expenses: | | | | | | | | | | | | | | | | |
| Management fees | | | 137,002 | | | | 172,281 | | | | 433,407 | | | | 129,738 | |
| Professional fees | | | — | | | | — | | | | 52,799 | | | | 32,738 | |
| Custody and accounting fees | | | — | | | | — | | | | 23,937 | | | | 22,281 | |
| Reports to shareholders | | | — | | | | — | | | | 31,355 | | | | 7,335 | |
| Trustees’ fees and expenses | | | — | | | | — | | | | 1,627 | | | | 1,390 | |
| Registration fees | | | — | | | | — | | | | 8,006 | | | | 6,806 | |
| Insurance | | | — | | | | — | | | | 3,688 | | | | 1,383 | |
| Interest | | | 467 | | | | 6,728 | | | | 358 | | | | 15,190 | |
| Taxes | | | 25 | | | | 300 | | | | 503 | | | | 134 | |
| Other | | | — | | | | — | | | | 2,237 | | | | 597 | |
| Total expenses | | | 137,494 | | | | 179,309 | | | | 557,917 | | | | 217,592 | |
| Waiver of management fees | | | — | | | | — | | | | (175,449 | ) | | | — | |
| Expenses assumed by the Adviser | | | — | | | | — | | | | — | | | | (59,557 | ) |
| Net expenses | | | 137,494 | | | | 179,309 | | | | 382,468 | | | | 158,035 | |
| Net investment income | | | 1,189,938 | | | | 1,857,549 | | | | 3,475,350 | | | | 274,877 | |
| | | | | | | | | | | | | | | | | |
| Net realized gain (loss) on: | | | | | | | | | | | | | | | | |
| Investments - unaffiliated issuers | | | 85 | | | | (2,880,963 | ) | | | (1,543,993 | ) | | | 13,689 | |
| Investments - affiliated issuers | | | — | | | | — | | | | (1,466,573 | ) | | | — | |
| In-kind redemptions - unaffiliated issuers | | | — | | | | 5,513,647 | | | | 414,226 | | | | 3,042,752 | |
| In-kind redemptions - affiliated issuers | | | — | | | | — | | | | 331,098 | | | | — | |
| Futures | | | (1,941,687 | ) | | | — | | | | — | | | | — | |
| Net realized gain (loss) | | | (1,941,602 | ) | | | 2,632,684 | | | | (2,265,242 | ) | | | 3,056,441 | |
| | | | | | | | | | | | | | | | | |
| Net change in unrealized appreciation (depreciation) on: | | | | | | | | | | | | | | | | |
| Investments - unaffiliated issuers | | | 3,580 | | | | 4,781,705 | | | | 10,545,157 | | | | 4,869,434 | |
| Investments - affiliated issuers | | | — | | | | — | | | | 2,133,473 | | | | — | |
| Futures | | | (291,906 | ) | | | — | | | | — | | | | — | |
| Net change in unrealized appreciation (depreciation) | | | (288,326 | ) | | | 4,781,705 | | | | 12,678,630 | | | | 4,869,434 | |
| Net increase (decrease) in net assets resulting from operations | | $ | (1,039,990 | ) | | $ | 9,271,938 | | | $ | 13,888,738 | | | $ | 8,200,752 | |
| (a) | Consolidated Statement of Operations |
See Notes to Financial Statements
VANECK ETF TRUST
STATEMENTS OF OPERATIONS
For the Year Ended September 30, 2024
| | | Morningstar ESG
Moat ETF | | | Morningstar
Global Wide
Moat ETF | | | Morningstar
International
Moat ETF | | | Morningstar
SMID Moat ETF | |
| Income: | | | | | | | | | | | | | | | | |
| Dividends | | $ | 89,235 | | | $ | 393,833 | | | $ | 8,765,645 | | | $ | 4,789,726 | |
| Interest | | | 1,968 | | | | 1,404 | | | | 2,945 | | | | 12,224 | |
| Securities lending income | | | 2 | | | | 893 | | | | 54,209 | | | | 534,926 | |
| Net foreign taxes reclaimed/(withheld) | | | — | | | | (18,155 | ) | | | (765,355 | ) | | | (3,910 | ) |
| Total income | | | 91,205 | | | | 377,975 | | | | 8,057,444 | | | | 5,332,966 | |
| Expenses: | | | | | | | | | | | | | | | | |
| Management fees | | | 27,312 | | | | 73,869 | | | | 1,130,903 | | | | 1,316,504 | |
| Professional fees | | | 41,752 | | | | 51,494 | | | | 55,943 | | | | 35,282 | |
| Custody and accounting fees | | | 24,597 | | | | 41,626 | | | | 81,532 | | | | 27,116 | |
| Reports to shareholders | | | 8,988 | | | | 8,204 | | | | 29,027 | | | | 46,377 | |
| Trustees’ fees and expenses | | | 127 | | | | 1,237 | | | | 7,354 | | | | 6,898 | |
| Registration fees | | | 7,476 | | | | 4,003 | | | | 26,500 | | | | 31,892 | |
| Insurance | | | 1,199 | | | | 1,301 | | | | 5,561 | | | | 3,634 | |
| Interest | | | — | | | | 201 | | | | 36,846 | | | | 863 | |
| Taxes | | | 505 | | | | 503 | | | | 504 | | | | 447 | |
| Other | | | 1,146 | | | | 6,174 | | | | 6,252 | | | | 3,458 | |
| Total expenses | | | 113,102 | | | | 188,612 | | | | 1,380,422 | | | | 1,472,471 | |
| Expenses assumed by the Adviser | | | (82,857 | ) | | | (102,548 | ) | | | (76,461 | ) | | | (37,635 | ) |
| Net expenses | | | 30,245 | | | | 86,064 | | | | 1,303,961 | | | | 1,434,836 | |
| Net investment income | | | 60,960 | | | | 291,911 | | | | 6,753,483 | | | | 3,898,130 | |
| | | | | | | | | | | | | | | | | |
| Net realized gain (loss) on: | | | | | | | | | | | | | | | | |
| Investments | | | (307,343 | ) | | | 717,860 | | | | (1,654,024 | ) | | | (20,838,469 | ) |
| In-kind redemptions | | | 635,314 | | | | 625,412 | | | | 2,159,332 | | | | 40,051,811 | |
| Foreign currency transactions and foreign denominated assets and liabilities | | | — | | | | (1,359 | ) | | | (31,675 | ) | | | — | |
| Net realized gain | | | 327,971 | | | | 1,341,913 | | | | 473,633 | | | | 19,213,342 | |
| | | | | | | | | | | | | | | | | |
| Net change in unrealized appreciation (depreciation) on: | | | | | | | | | | | | | | | | |
| Investments | | | 986,232 | | | | 2,486,739 | | | | 35,595,756 | | | | 35,773,737 | |
| Foreign currency translations and foreign denominated assets and liabilities | | | — | | | | 624 | | | | 24,526 | | | | — | |
| Net change in unrealized appreciation (depreciation) | | | 986,232 | | | | 2,487,363 | | | | 35,620,282 | | | | 35,773,737 | |
| Net increase in net assets resulting from operations | | $ | 1,375,163 | | | $ | 4,121,187 | | | $ | 42,847,398 | | | $ | 58,885,209 | |
See Notes to Financial Statements
VANECK ETF TRUST
STATEMENTS OF OPERATIONS
For the Year Ended September 30, 2024
| | | Morningstar
Wide Moat ETF | | | Morningstar
Wide Moat
Growth ETF(a) | | | Morningstar
Wide Moat Value
ETF(a) | | | Social Sentiment
ETF | |
| Income: | | | | | | | | | | | | | | | | |
| Dividends | | $ | 260,684,045 | | | $ | 2,888 | | | $ | 23,176 | | | $ | 447,477 | |
| Interest | | | 512,860 | | | | 384 | | | | 358 | | | | 4,608 | |
| Securities lending income | | | 35,601 | | | | — | | | | — | | | | 406,100 | |
| Net foreign taxes reclaimed/(withheld) | | | — | | | | — | | | | — | | | | (80 | ) |
| Total income | | | 261,232,506 | | | | 3,272 | | | | 23,534 | | | | 858,105 | |
| Expenses: | | | | | | | | | | | | | | | | |
| Management fees | | | 62,325,191 | | | | 1,695 | | | | 3,416 | | | | 448,998 | |
| Professional fees | | | 48,836 | | | | 24,810 | | | | 24,810 | | | | — | |
| Custody and accounting fees | | | 92,344 | | | | 14,929 | | | | 14,929 | | | | — | |
| Reports to shareholders | | | 692,604 | | | | 2,986 | | | | 2,986 | | | | — | |
| Trustees’ fees and expenses | | | 306,608 | | | | 212 | | | | 212 | | | | — | |
| Registration fees | | | 444,902 | | | | 3,473 | | | | 3,473 | | | | — | |
| Insurance | | | 78,453 | | | | 179 | | | | 179 | | | | — | |
| Interest | | | 323,774 | | | | — | | | | — | | | | 3,249 | |
| Taxes | | | 619 | | | | — | | | | — | | | | 306 | |
| Other | | | 99,886 | | | | 996 | | | | 996 | | | | — | |
| Total expenses | | | 64,413,217 | | | | 49,280 | | | | 51,001 | | | | 452,553 | |
| Expenses assumed by the Adviser | | | — | | | | (47,434 | ) | | | (47,281 | ) | | | — | |
| Net expenses | | | 64,413,217 | | | | 1,846 | | | | 3,720 | | | | 452,553 | |
| Net investment income | | | 196,819,289 | | | | 1,426 | | | | 19,814 | | | | 405,552 | |
| | | | | | | | | | | | | | | | | |
| Net realized gain (loss) on: | | | | | | | | | | | | | | | | |
| Investments | | | (412,556,169 | ) | | | (25,915 | ) | | | (9,550 | ) | | | (14,364,623 | ) |
| In-kind redemptions | | | 1,961,768,185 | | | | 49,342 | | | | 32,207 | | | | 31,369,658 | |
| In-kind redemptions - affiliated issuers | | | 66,877 | | | | — | | | | — | | | | — | |
| Foreign currency transactions and foreign denominated assets and liabilities | | | — | | | | — | | | | — | | | | 7 | |
| Net realized gain | | | 1,549,278,893 | | | | 23,427 | | | | 22,657 | | | | 17,005,042 | |
| | | | | | | | | | | | | | | | | |
| Net change in unrealized appreciation (depreciation) on: | | | | | | | | | | | | | | | | |
| Investments - unaffiliated issuers | | | 1,730,678,799 | | | | 8,875 | | | | 138,758 | | | | 2,562,248 | |
| Investments - affiliated issuers | | | 30,728,758 | | | | — | | | | — | | | | — | |
| Net change in unrealized appreciation (depreciation) | | | 1,761,407,557 | | | | 8,875 | | | | 138,758 | | | | 2,562,248 | |
| Net increase in net assets resulting from operations | | $ | 3,507,505,739 | | | $ | 33,728 | | | $ | 181,229 | | | $ | 19,972,842 | |
| (a) | For the period March 27, 2024 (commencement of operations) through September 30, 2024. |
See Notes to Financial Statements
VANECK ETF TRUST
STATEMENTS OF CHANGES IN NET ASSETS
| | | Commodity Strategy ETF(a) | | | Durable High Dividend ETF | |
| | | Year Ended
September 30,
2024 | | | Period Ended
September 30,
2023(b) | | | Year Ended
September 30,
2024 | | | Year Ended
September 30,
2023 | |
| Operations: | | | | | | | | | | | | |
| Net investment income | | $ | 1,189,938 | | | $ | 948,799 | | | $ | 1,857,549 | | | $ | 3,138,486 | |
| Net realized gain (loss) | | | (1,941,602 | ) | | | (240,861 | ) | | | 2,632,684 | | | | 1,391,961 | |
| Net change in unrealized appreciation (depreciation) | | | (288,326 | ) | | | 823,376 | | | | 4,781,705 | | | | 4,476,449 | |
| Net increase (decrease) in net assets resulting from operations | | | (1,039,990 | ) | | | 1,531,314 | | | | 9,271,938 | | | | 9,006,896 | |
| Distributions to shareholders from: | | | | | | | | | | | | | | | | |
| Distributable earnings | | | (1,774,980 | ) | | | — | | | | (2,234,105 | ) | | | (2,908,003 | ) |
| | | | | | | | | | | | | | | | | |
| Share transactions*: | | | | | | | | | | | | | | | | |
| Proceeds from sale of shares | | | 5,004,117 | | | | 34,680,818 | | | | 28,880,844 | | | | 66,224,810 | |
| Cost of shares redeemed | | | (4,620,033 | ) | | | (9,757,171 | ) | | | (69,306,807 | ) | | | (59,551,888 | ) |
| Net increase (decrease) in net assets resulting from share transactions | | | 384,084 | | | | 24,923,647 | | | | (40,425,963 | ) | | | 6,672,922 | |
| Total increase (decrease) in net assets | | | (2,430,886 | ) | | | 26,454,961 | | | | (33,388,130 | ) | | | 12,771,815 | |
| Net Assets, beginning of period | | | 26,454,961 | | | | — | | | | 85,545,225 | | | | 72,773,410 | |
| Net Assets, end of period | | $ | 24,024,075 | | | $ | 26,454,961 | | | $ | 52,157,095 | | | $ | 85,545,225 | |
| *Shares of Common Stock Issued (no par value) | | | | | | | | | | | | | | | | |
| Shares sold | | | 100,000 | | | | 700,000 | | | | 875,000 | | | | 2,125,000 | |
| Shares redeemed | | | (100,000 | ) | | | (200,000 | ) | | | (2,200,000 | ) | | | (1,925,000 | ) |
| Net increase (decrease) | | | — | | | | 500,000 | | | | (1,325,000 | ) | | | 200,000 | |
| | |
| (a) | Consolidated Statement of Changes in Net Assets |
| (b) | For the period December 21, 2022 (commencement of operations) through September 30, 2023. |
See Notes to Financial Statements
VANECK ETF TRUST
STATEMENTS OF CHANGES IN NET ASSETS
| | | Inflation Allocation ETF(a) | | | Long/Flat Trend ETF | |
| | | Year Ended
September 30,
2024 | | | Year Ended
September 30,
2023 | | | Year Ended
September 30,
2024 | | | Year Ended
September 30,
2023 | |
| Operations: | | | | | | | | | | | | |
| Net investment income | | $ | 3,475,350 | | | $ | 1,765,265 | | | $ | 274,877 | | | $ | 414,213 | |
| Net realized gain (loss) | | | (2,265,242 | ) | | | (6,136,714 | ) | | | 3,056,441 | | | | 3,051,142 | |
| Net change in unrealized appreciation (depreciation) | | | 12,678,630 | | | | 20,462,810 | | | | 4,869,434 | | | | 737,376 | |
| Net increase in net assets resulting from operations | | | 13,888,738 | | | | 16,091,361 | | | | 8,200,752 | | | | 4,202,731 | |
| Distributions to shareholders from: | | | | | | | | | | | | | | | | |
| Distributable earnings | | | (4,000,118 | ) | | | (2,100,120 | ) | | | (375,000 | ) | | | (315,038 | ) |
| | | | | | | | | | | | | | | | | |
| Share transactions*: | | | | | | | | | | | | | | | | |
| Proceeds from sale of shares | | | 26,371,413 | | | | 11,559,426 | | | | 44,765,651 | | | | 44,255,064 | |
| Cost of shares redeemed | | | (49,483,711 | ) | | | (65,965,169 | ) | | | (50,210,843 | ) | | | (57,288,850 | ) |
| Net decrease in net assets resulting from share transactions | | | (23,112,298 | ) | | | (54,405,743 | ) | | | (5,445,192 | ) | | | (13,033,786 | ) |
| Total increase (decrease) in net assets | | | (13,223,678 | ) | | | (40,414,502 | ) | | | 2,380,560 | | | | (9,146,093 | ) |
| Net Assets, beginning of year | | | 90,652,139 | | | | 131,066,641 | | | | 24,428,968 | | | | 33,575,061 | |
| Net Assets, end of year | | $ | 77,428,461 | | | $ | 90,652,139 | | | $ | 26,809,528 | | | $ | 24,428,968 | |
| *Shares of Common Stock Issued (no par value) | | | | | | | | | | | | | | | | |
| Shares sold | | | 1,025,000 | | | | 450,000 | | | | 1,200,000 | | | | 1,250,000 | |
| Shares redeemed | | | (1,925,000 | ) | | | (2,625,000 | ) | | | (1,300,000 | ) | | | (1,600,000 | ) |
| Net decrease | | | (900,000 | ) | | | (2,175,000 | ) | | | (100,000 | ) | | | (350,000 | ) |
| | |
| (a) | Consolidated Statement of Changes in Net Assets |
See Notes to Financial Statements
VANECK ETF TRUST
STATEMENTS OF CHANGES IN NET ASSETS
| | | Morningstar ESG Moat ETF | | | Morningstar Global Wide Moat ETF | |
| | | Year Ended
September 30,
2024 | | | Year Ended
September 30,
2023 | | | Year Ended
September 30,
2024 | | | Year Ended
September 30,
2023 | |
| Operations: | | | | | | | | | | | | |
| Net investment income | | $ | 60,960 | | | $ | 57,712 | | | $ | 291,911 | | | $ | 367,847 | |
| Net realized gain (loss) | | | 327,971 | | | | (11,941 | ) | | | 1,341,913 | | | | 493,702 | |
| Net change in unrealized appreciation (depreciation) | | | 986,232 | | | | 339,632 | | | | 2,487,363 | | | | 1,412,803 | |
| Net increase in net assets resulting from operations | | | 1,375,163 | | | | 385,403 | | | | 4,121,187 | | | | 2,274,352 | |
| Distributions to shareholders from: | | | | | | | | | | | | | | | | |
| Distributable earnings | | | (65,003 | ) | | | (37,500 | ) | | | (325,000 | ) | | | (585,100 | ) |
| | | | | | | | | | | | | | | | | |
| Share transactions*: | | | | | | | | | | | | | | | | |
| Proceeds from sale of shares | | | 1,928,769 | | | | 5,221,511 | | | | — | | | | 3,399,648 | |
| Cost of shares redeemed | | | (3,073,893 | ) | | | (1,711,878 | ) | | | (5,205,153 | ) | | | (4,920,761 | ) |
| Net increase (decrease) in net assets resulting from share transactions | | | (1,145,124 | ) | | | 3,509,633 | | | | (5,205,153 | ) | | | (1,521,113 | ) |
| Total increase (decrease) in net assets | | | 165,036 | | | | 3,857,536 | | | | (1,408,966 | ) | | | 168,139 | |
| Net Assets, beginning of year | | | 6,348,890 | | | | 2,491,354 | | | | 17,713,005 | | | | 17,544,866 | |
| Net Assets, end of year | | $ | 6,513,926 | | | $ | 6,348,890 | | | $ | 16,304,039 | | | $ | 17,713,005 | |
| *Shares of Common Stock Issued (no par value) | | | | | | | | | | | | | | | | |
| Shares sold | | | 75,000 | | | | 225,000 | | | | — | | | | 100,000 | |
| Shares redeemed | | | (125,000 | ) | | | (75,000 | ) | | | (150,000 | ) | | | (150,000 | ) |
| Net increase (decrease) | | | (50,000 | ) | | | 150,000 | | | | (150,000 | ) | | | (50,000 | ) |
See Notes to Financial Statements
VANECK ETF TRUST
STATEMENTS OF CHANGES IN NET ASSETS
| | | Morningstar International Moat ETF | | | Morningstar SMID Moat ETF | |
| | | Year Ended
September 30,
2024 | | | Year Ended
September 30,
2023 | | | Year Ended
September 30,
2024 | | | Period Ended
September 30,
2023(a) | |
| Operations: | | | | | | | | | | | | |
| Net investment income | | $ | 6,753,483 | | | $ | 4,768,384 | | | $ | 3,898,130 | | | $ | 901,966 | |
| Net realized gain (loss) | | | 473,633 | | | | (6,415,282 | ) | | | 19,213,342 | | | | (910,887 | ) |
| Net change in unrealized appreciation (depreciation) | | | 35,620,282 | | | | 505,830 | | | | 35,773,737 | | | | (6,803,456 | ) |
| Net increase (decrease) in net assets resulting from operations | | | 42,847,398 | | | | (1,141,068 | ) | | | 58,885,209 | | | | (6,812,377 | ) |
| Distributions to shareholders from: | | | | | | | | | | | | | | | | |
| Distributable earnings | | | (5,575,320 | ) | | | (1,800,060 | ) | | | (1,500,150 | ) | | | (66,010 | ) |
| | | | | | | | | | | | | | | | | |
| Share transactions*: | | | | | | | | | | | | | | | | |
| Proceeds from sale of shares | | | 2,953,035 | | | | 188,853,511 | | | | 380,280,893 | | | | 248,606,020 | |
| Cost of shares redeemed | | | (30,764,298 | ) | | | (21,082,385 | ) | | | (242,376,141 | ) | | | (55,558,840 | ) |
| Net increase (decrease) in net assets resulting from share transactions | | | (27,811,263 | ) | | | 167,771,126 | | | | 137,904,752 | | | | 193,047,180 | |
| Total increase in net assets | | | 9,460,815 | | | | 164,829,998 | | | | 195,289,811 | | | | 186,168,793 | |
| Net Assets, beginning of period | | | 231,357,476 | | | | 66,527,478 | | | | 186,168,793 | | | | — | |
| Net Assets, end of period | | $ | 240,818,291 | | | $ | 231,357,476 | | | $ | 381,458,604 | | | $ | 186,168,793 | |
| *Shares of Common Stock Issued (no par value) | | | | | | | | | | | | | | | | |
| Shares sold | | | 100,000 | | | | 5,900,000 | | | | 11,850,000 | | | | 8,500,000 | |
| Shares redeemed | | | (1,000,000 | ) | | | (800,000 | ) | | | (7,500,000 | ) | | | (1,950,000 | ) |
| Net increase (decrease) | | | (900,000 | ) | | | 5,100,000 | | | | 4,350,000 | | | | 6,550,000 | |
| | |
| (a) | For the period October 5, 2022 (commencement of operations) through September 30, 2023. |
See Notes to Financial Statements
VANECK ETF TRUST
STATEMENTS OF CHANGES IN NET ASSETS
| | | Morningstar Wide Moat ETF | | | Morningstar
Wide Moat
Growth ETF | |
| | | Year Ended
September 30,
2024 | | | Year Ended
September 30,
2023 | | | Period Ended
September 30,
2024(a) | |
| Operations: | | | | | | | | | |
| Net investment income | | $ | 196,819,289 | | | $ | 85,949,378 | | | $ | 1,426 | |
| Net realized gain | | | 1,549,278,893 | | | | 644,934,480 | | | | 23,427 | |
| Net change in unrealized appreciation (depreciation) | | | 1,761,407,557 | | | | 811,917,415 | | | | 8,875 | |
| Net increase in net assets resulting from operations | | | 3,507,505,739 | | | | 1,542,801,273 | | | | 33,728 | |
| Distributions to shareholders from: | | | | | | | | | | | | |
| Distributable earnings | | | (112,006,875 | ) | | | (78,997,870 | ) | | | — | |
| | | | | | | | | | | | | |
| Share transactions*: | | | | | | | | | | | | |
| Proceeds from sale of shares | | | 10,604,116,455 | | | | 8,329,731,215 | | | | 1,520,040 | |
| Cost of shares redeemed | | | (8,446,106,765 | ) | | | (5,041,737,828 | ) | | | (767,865 | ) |
| Net increase in net assets resulting from share transactions | | | 2,158,009,690 | | | | 3,287,993,387 | | | | 752,175 | |
| Total increase in net assets | | | 5,553,508,554 | | | | 4,751,796,790 | | | | 785,903 | |
| Net Assets, beginning of period | | | 10,617,594,598 | | | | 5,865,797,808 | | | | — | |
| Net Assets, end of period | | $ | 16,171,103,152 | | | $ | 10,617,594,598 | | | $ | 785,903 | |
| *Shares of Common Stock Issued (no par value) | | | | | | | | | | | | |
| Shares sold | | | 121,650,000 | | | | 109,000,000 | | | | 50,000 | |
| Shares redeemed | | | (94,950,000 | ) | | | (66,750,000 | ) | | | (25,000 | ) |
| Net increase | | | 26,700,000 | | | | 42,250,000 | | | | 25,000 | |
| | |
| (a) | For the period March 27, 2024 (commencement of operations) through September 30, 2024. |
See Notes to Financial Statements
VANECK ETF TRUST
STATEMENTS OF CHANGES IN NET ASSETS
| | | Morningstar
Wide Moat Value
ETF | | | Social Sentiment ETF | |
| | | Period Ended
September 30,
2024(a) | | | Year Ended
September 30,
2024 | | | Year Ended
September 30,
2023 | |
| Operations: | | | | | | | | | |
| Net investment income | | $ | 19,814 | | | $ | 405,552 | | | $ | 274,169 | |
| Net realized gain (loss) | | | 22,657 | | | | 17,005,042 | | | | (2,368,943 | ) |
| Net change in unrealized appreciation (depreciation) | | | 138,758 | | | | 2,562,248 | | | | 12,273,084 | |
| Net increase in net assets resulting from operations | | | 181,229 | | | | 19,972,842 | | | | 10,178,310 | |
| Distributions to shareholders from: | | | | | | | | | | | | |
| Distributable earnings | | | — | | | | (324,950 | ) | | | (209,840 | ) |
| | | | | | | | | | | | | |
| Share transactions*: | | | | | | | | | | | | |
| Proceeds from sale of shares | | | 5,668,090 | | | | 120,123,862 | | | | 81,579,535 | |
| Cost of shares redeemed | | | (823,938 | ) | | | (139,443,171 | ) | | | (94,100,010 | ) |
| Net increase (decrease) in net assets resulting from share transactions | | | 4,844,152 | | | | (19,319,309 | ) | | | (12,520,475 | ) |
| Total increase (decrease) in net assets | | | 5,025,381 | | | | 328,583 | | | | (2,552,005 | ) |
| Net Assets, beginning of period | | | — | | | | 55,084,937 | | | | 57,636,942 | |
| Net Assets, end of period | | $ | 5,025,381 | | | $ | 55,413,520 | | | $ | 55,084,937 | |
| *Shares of Common Stock Issued (no par value) | | | | | | | | | | | | |
| Shares sold | | | 175,000 | | | | 6,100,000 | | | | 5,475,000 | |
| Shares redeemed | | | (25,000 | ) | | | (7,100,000 | ) | | | (6,425,000 | ) |
| Net increase (decrease) | | | 150,000 | | | | (1,000,000 | ) | | | (950,000 | ) |
| | |
| (a) | For the period March 27, 2024 (commencement of operations) through September 30, 2024. |
See Notes to Financial Statements
VANECK ETF TRUST
FINANCIAL HIGHLIGHTS
For a share outstanding throughout each period:
| | | | | |
| | | Commodity Strategy ETF(a) |
| | | | | |
| | | Year Ended
September
30, 2024 | | Period
Ended
September
30,
2023 (b) |
| | | | | |
| Net asset value, beginning of period | | $52.91 | | | $50.00 | |
| Net investment income (c) | | 2.33 | | | 1.69 | |
| Net realized and unrealized gain (loss) on investments | | (4.23 | ) | | 1.22 | |
| Total from investment operations | | (1.90 | ) | | 2.91 | |
| Distributions from: | | | | | | |
| Net investment income | | (2.96 | ) | | — | |
| Net asset value, end of period | | $48.05 | | | $52.91 | |
| Total return (d) | | (3.41 | )% | | 5.82 | % |
| | | | | | | |
| Ratios to average net assets | | | | | | |
| Expenses | | 0.55 | % | | 0.55 | %(e) |
| Net investment income | | 4.78 | % | | 4.36 | %(e) |
| Supplemental data | | | | | | |
| Net assets, end of period (in millions) | | $24 | | | $26 | |
| Portfolio turnover rate (f) | | — | % | | — | % |
| | | | | | | |
| (a) | Consolidated Financial Highlights |
| (b) | For the period December 21, 2022 (commencement of operations) through September 30, 2023. |
| (c) | Calculated based upon average shares outstanding |
| (d) | Returns are not annualized and include adjustments in accordance with U.S. Generally Accepted Accounting Principles. Net asset values and returns for financial reporting purposes may differ from those for shareholder transactions. |
| (e) | Annualized |
| (f) | Portfolio turnover rate is not annualized and excludes in-kind transactions. |
| | |
See Notes to Financial Statements
VANECK ETF TRUST
FINANCIAL HIGHLIGHTS
For a share outstanding throughout each year:
| | | | | | | | | | | |
| | | Durable High Dividend ETF |
| | | Year Ended September 30, |
| | | 2024 | | 2023 | | 2022 | | 2021 | | 2020 |
| | | | | | | | | | | |
| Net asset value, beginning of year | | $30.28 | | | $27.72 | | | $30.59 | | | $26.78 | | | $28.24 | |
| Net investment income (a) | | 0.98 | | | 1.07 | | | 0.99 | | | 1.01 | | | 0.92 | |
| Net realized and unrealized gain (loss) on investments | | 4.56 | | | 2.50 | | | (2.90 | ) | | 3.71 | | | (1.28 | ) |
| Total from investment operations | | 5.54 | | | 3.57 | | | (1.91 | ) | | 4.72 | | | (0.36 | ) |
| Distributions from: | | | | | | | | | | | | | | | |
| Net investment income | | (1.05 | ) | | (1.01 | ) | | (0.96 | ) | | (0.91 | ) | | (0.90 | ) |
| Net realized capital gains | | — | | | — | | | — | | | — | | | (0.20 | ) |
| Total distributions | | (1.05 | ) | | (1.01 | ) | | (0.96 | ) | | (0.91 | ) | | (1.10 | ) |
| Net asset value, end of year | | $34.77 | | | $30.28 | | | $27.72 | | | $30.59 | | | $26.78 | |
| Total return (b) | | 18.79 | % | | 12.91 | % | | (6.58 | )% | | 17.89 | % | | (1.26 | )% |
| | | | | | | | | | | | | | | | |
| Ratios to average net assets | | | | | | | | | | | | | | | |
| Gross expenses (c) | | 0.30 | % | | 0.30 | % | | 0.29 | % | | 0.53 | % | | 0.73 | % |
| Net expenses (c) | | 0.30 | % | | 0.30 | % | | 0.29 | % | | 0.29 | % | | 0.29 | % |
| Net expenses excluding interest and taxes (c) | | 0.29 | % | | 0.29 | % | | 0.29 | % | | N/A | | | N/A | |
| Net investment income | | 3.13 | % | | 3.42 | % | | 3.19 | % | | 3.38 | % | | 3.44 | % |
| Supplemental data | | | | | | | | | | | | | | | |
| Net assets, end of year (in millions) | | $52 | | | $86 | | | $73 | | | $51 | | | $33 | |
| Portfolio turnover rate (d) | | 62 | % | | 61 | % | | 50 | % | | 50 | % | | 67 | % |
| | | | | | | | | | | | | | | | |
| (a) | Calculated based upon average shares outstanding |
| (b) | Returns are not annualized and include adjustments in accordance with U.S. Generally Accepted Accounting Principles. Net asset values and returns for financial reporting purposes may differ from those for shareholder transactions. |
| (c) | Periods after September 30, 2021 reflect a unitary management fee structure. |
| (d) | Portfolio turnover rate is not annualized and excludes in-kind transactions. |
| | |
See Notes to Financial Statements
VANECK ETF TRUST
FINANCIAL HIGHLIGHTS
For a share outstanding throughout each year:
| | | | | | | | | | | |
| | | Inflation Allocation ETF(a) |
| | | Year Ended September 30, |
| | | 2024 | | 2023 | | 2022 | | 2021 | | 2020 |
| | | | | | | | | | | |
| Net asset value, beginning of year | | $25.36 | | | $22.79 | | | $25.47 | | | $20.15 | | | $25.25 | |
| Net investment income (b) | | 1.06 | | | 0.37 | | | 0.92 | | | 0.14 | | | 0.45 | |
| Net realized and unrealized gain (loss) on investments | | 3.47 | | | 2.58 | | | (1.44 | ) | | 6.57 | | | (4.94 | ) |
| Total from investment operations | | 4.53 | | | 2.95 | | | (0.52 | ) | | 6.71 | | | (4.49 | ) |
| Distributions from: | | | | | | | | | | | | | | | |
| Net investment income | | (0.94 | ) | | (0.38 | ) | | (2.16 | ) | | (1.39 | ) | | (0.61 | ) |
| Net asset value, end of year | | $28.95 | | | $25.36 | | | $22.79 | | | $25.47 | | | $20.15 | |
| Total return (c) | | 18.35 | % | | 12.95 | % | | (2.71 | )% | | 34.11 | % | | (18.32 | )% |
| | | | | | | | | | | | | | | | |
| Ratios to average net assets | | | | | | | | | | | | | | | |
| Gross expenses (d) | | 0.64 | % | | 0.61 | % | | 0.63 | % | | 1.60 | % | | 1.12 | % |
| Net expenses (d) | | 0.44 | % | | 0.42 | % | | 0.51 | % | | 0.56 | % | | 0.55 | % |
| Net expenses excluding interest and taxes (d) | | 0.44 | % | | 0.42 | % | | 0.51 | % | | 0.55 | % | | 0.55 | % |
| Net investment income (d) | | 4.01 | % | | 1.48 | % | | 3.56 | % | | 0.58 | % | | 1.97 | % |
| Supplemental data | | | | | | | | | | | | | | | |
| Net assets, end of year (in millions) | | $77 | | | $91 | | | $131 | | | $17 | | | $9 | |
| Portfolio turnover rate (e) | | 47 | % | | 70 | % | | 32 | % | | 76 | % | | 195 | % |
| | | | | | | | | | | | | | | | |
| (a) | Consolidated Financial Highlights |
| (b) | Calculated based upon average shares outstanding |
| (c) | Returns are not annualized and include adjustments in accordance with U.S. Generally Accepted Accounting Principles. Net asset values and returns for financial reporting purposes may differ from those for shareholder transactions. |
| (d) | The ratios presented do not reflect the Fund's proportionate share of income and expenses from the Fund's investment in underlying funds. |
| (e) | Portfolio turnover rate is not annualized and excludes in-kind transactions. |
| | |
See Notes to Financial Statements
VANECK ETF TRUST
FINANCIAL HIGHLIGHTS
For a share outstanding throughout each year:
| | | | | | | | | | | |
| | | Long/Flat Trend ETF |
| | | Year Ended September 30, |
| | | 2024 | | 2023 | | 2022 | | 2021 | | 2020 |
| | | | | | | | | | | |
| Net asset value, beginning of year | | $37.58 | | | $33.58 | | | $39.96 | | | $31.55 | | | $28.02 | |
| Net investment income (a) | | 0.45 | | | 0.51 | | | 0.24 | | | 0.34 | | | 0.40 | |
| Net realized and unrealized gain (loss) on investments | | 11.34 | | | 3.90 | | | (6.46 | ) | | 8.78 | | | 3.56 | (b) |
| Total from investment operations | | 11.79 | | | 4.41 | | | (6.22 | ) | | 9.12 | | | 3.96 | |
| Distributions from: | | | | | | | | | | | | | | | |
| Net investment income | | (0.63 | ) | | (0.41 | ) | | (0.16 | ) | | (0.71 | ) | | (0.43 | ) |
| Net asset value, end of year | | $48.74 | | | $37.58 | | | $33.58 | | | $39.96 | | | $31.55 | |
| Total return (c) | | 31.72 | % | | 13.27 | % | | (15.67 | )% | | 29.29 | % | | 14.22 | % |
| | | | | | | | | | | | | | | | |
| Ratios to average net assets | | | | | | | | | | | | | | | |
| Gross expenses (d) | | 0.84 | % | | 0.90 | % | | 0.72 | % | | 0.82 | % | | 0.76 | % |
| Net expenses (d) | | 0.61 | % | | 0.66 | % | | 0.59 | % | | 0.55 | % | | 0.55 | % |
| Net expenses excluding interest and taxes (d) | | 0.55 | % | | 0.55 | % | | 0.55 | % | | 0.55 | % | | 0.55 | % |
| Net investment income (d) | | 1.06 | % | | 1.41 | % | | 0.60 | % | | 0.91 | % | | 1.38 | % |
| Supplemental data | | | | | | | | | | | | | | | |
| Net assets, end of year (in millions) | | $27 | | | $24 | | | $34 | | | $41 | | | $32 | |
| Portfolio turnover rate (e) | | 1 | % | | 115 | % | | 243 | % | | 1 | % | | — | % |
| | | | | | | | | | | | | | | | |
| (a) | Calculated based upon average shares outstanding |
| (b) | The amount shown does not correspond with the aggregate net gain (loss) on investments for the period due to the timing of sales and repurchase of shares in relation to fluctuating market values of the investments of the Fund. |
| (c) | Returns are not annualized and include adjustments in accordance with U.S. Generally Accepted Accounting Principles. Net asset values and returns for financial reporting purposes may differ from those for shareholder transactions. |
| (d) | The ratios presented do not reflect the Fund's proportionate share of income and expenses from the Fund's investment in underlying funds. |
| (e) | Portfolio turnover rate is not annualized and excludes in-kind transactions. |
| | |
See Notes to Financial Statements
VANECK ETF TRUST
FINANCIAL HIGHLIGHTS
For a share outstanding throughout each period:
| | | | | | | |
| | | Morningstar ESG Moat ETF |
| | | | | | | |
| | | Year Ended September 30, | | Period
Ended
September
30, |
| | | 2024 | | 2023 | | 2022 (a) |
| | | | | | | |
| Net asset value, beginning of period | | $23.09 | | | $19.93 | | | $25.05 | |
| Net investment income (b) | | 0.26 | | | 0.29 | | | 0.25 | |
| Net realized and unrealized gain (loss) on investments | | 5.89 | | | 3.08 | | | (5.32 | ) |
| Total from investment operations | | 6.15 | | | 3.37 | | | (5.07 | ) |
| Distributions from: | | | | | | | | | |
| Net investment income | | (0.29 | ) | | (0.21 | ) | | (0.05 | ) |
| Net asset value, end of period | | $28.95 | | | $23.09 | | | $19.93 | |
| Total return (c) | | 26.82 | % | | 16.97 | % | | (20.30 | )% |
| | | | | | | | | | |
| Ratios to average net assets | | | | | | | | | |
| Gross expenses | | 1.86 | % | | 2.20 | % | | 4.24 | %(d) |
| Net expenses | | 0.50 | % | | 0.49 | % | | 0.49 | %(d) |
| Net expenses excluding interest and taxes | | 0.49 | % | | 0.49 | % | | 0.49 | %(d) |
| Net investment income | | 1.01 | % | | 1.25 | % | | 1.06 | %(d) |
| Supplemental data | | | | | | | | | |
| Net assets, end of period (in millions) | | $7 | | | $6 | | | $2 | |
| Portfolio turnover rate (e) | | 33 | % | | 38 | % | | 44 | % |
| | | | | | | | | | |
| (a) | For the period October 6, 2021 (commencement of operations) through September 30, 2022. |
| (b) | Calculated based upon average shares outstanding |
| (c) | Returns are not annualized and include adjustments in accordance with U.S. Generally Accepted Accounting Principles. Net asset values and returns for financial reporting purposes may differ from those for shareholder transactions. |
| (d) | Annualized |
| (e) | Portfolio turnover rate is not annualized and excludes in-kind transactions. |
| | |
See Notes to Financial Statements
VANECK ETF TRUST
FINANCIAL HIGHLIGHTS
For a share outstanding throughout each year:
| | | | | | | | | | | |
| | | Morningstar Global Wide Moat ETF |
| | | Year Ended September 30, |
| | | 2024 | | 2023 | | 2022 | | 2021 | | 2020 |
| | | | | | | | | | | |
| Net asset value, beginning of year | | $32.21 | | | $29.24 | | | $38.42 | | | $32.17 | | | $28.97 | |
| Net investment income (a) | | 0.63 | | | 0.65 | | | 0.63 | | | 0.54 | | | 0.46 | |
| Net realized and unrealized gain (loss) on investments | | 8.57 | | | 3.49 | | | (7.60 | ) | | 6.74 | | | 3.47 | |
| Total from investment operations | | 9.20 | | | 4.14 | | | (6.97 | ) | | 7.28 | | | 3.93 | |
| Distributions from: | | | | | | | | | | | | | | | |
| Net investment income | | (0.65 | ) | | (0.70 | ) | | (0.55 | ) | | (0.43 | ) | | (0.34 | ) |
| Net realized capital gains | | — | | | (0.47 | ) | | (1.66 | ) | | (0.60 | ) | | (0.39 | ) |
| Total distributions | | (0.65 | ) | | (1.17 | ) | | (2.21 | ) | | (1.03 | ) | | (0.73 | ) |
| Net asset value, end of year | | $40.76 | | | $32.21 | | | $29.24 | | | $38.42 | | | $32.17 | |
| Total return (b) | | 28.93 | % | | 14.14 | % | | (19.41 | )% | | 22.99 | % | | 13.70 | % |
| | | | | | | | | | | | | | | | |
| Ratios to average net assets | | | | | | | | | | | | | | | |
| Gross expenses | | 1.15 | % | | 1.08 | % | | 0.96 | % | | 1.20 | % | | 2.04 | % |
| Net expenses | | 0.52 | % | | 0.52 | % | | 0.52 | % | | 0.52 | % | | 0.52 | % |
| Net investment income | | 1.78 | % | | 1.94 | % | | 1.76 | % | | 1.44 | % | | 1.54 | % |
| Supplemental data | | | | | | | | | | | | | | | |
| Net assets, end of year (in millions) | | $16 | | | $18 | | | $18 | | | $19 | | | $10 | |
| Portfolio turnover rate (c) | | 78 | % | | 73 | % | | 67 | % | | 74 | % | | 68 | % |
| | | | | | | | | | | | | | | | |
| | | | | | | | | | | | | | | | |
| (a) | Calculated based upon average shares outstanding |
| (b) | Returns are not annualized and include adjustments in accordance with U.S. Generally Accepted Accounting Principles. Net asset values and returns for financial reporting purposes may differ from those for shareholder transactions. |
| (c) | Portfolio turnover rate is not annualized and excludes in-kind transactions. |
| | |
See Notes to Financial Statements
VANECK ETF TRUST
FINANCIAL HIGHLIGHTS
For a share outstanding throughout each year:
| | | Morningstar International Moat ETF |
| | | Year Ended September 30, |
| | | 2024 | | 2023 | | 2022 | | 2021 | | 2020 |
| | | | | | | | | | | |
| Net asset value, beginning of year | | $29.85 | | | $25.10 | | | $33.54 | | | $29.38 | | | $30.57 | |
| Net investment income (a) | | 0.93 | | | 0.89 | | | 1.34 | | | 1.07 | | | 0.62 | |
| Net realized and unrealized gain (loss) on investments | | 5.11 | | | 4.81 | (b) | | (8.28 | ) | | 3.81 | | | (0.56 | ) |
| Total from investment operations | | 6.04 | | | 5.70 | | | (6.94 | ) | | 4.88 | | | 0.06 | |
| Distributions from: | | | | | | | | | | | | | | | |
| Net investment income | | (0.73 | ) | | (0.95 | ) | | (1.50 | ) | | (0.72 | ) | | (1.25 | ) |
| Net asset value, end of year | | $35.16 | | | $29.85 | | | $25.10 | | | $33.54 | | | $29.38 | |
| Total return (c) | | 20.56 | % | | 22.82 | % | | (21.65 | )% | | 16.64 | % | | (0.14 | )% |
| | | | | | | | | | | | | | | | |
| Ratios to average net assets | | | | | | | | | | | | | | | |
| Gross expenses | | 0.61 | % | | 0.63 | % | | 0.67 | % | | 0.76 | % | | 0.76 | % |
| Net expenses | | 0.58 | % | | 0.58 | % | | 0.58 | % | | 0.57 | % | | 0.58 | % |
| Net expenses excluding interest and taxes | | 0.56 | % | | 0.56 | % | | 0.56 | % | | 0.56 | % | | 0.56 | % |
| Net investment income | | 2.99 | % | | 2.85 | % | | 4.32 | % | | 3.09 | % | | 2.10 | % |
| Supplemental data | | | | | | | | | | | | | | | |
| Net assets, end of year (in millions) | | $241 | | | $231 | | | $67 | | | $70 | | | $51 | |
| Portfolio turnover rate (d) | | 83 | % | | 87 | % | | 105 | % | | 110 | % | | 94 | % |
| | | | | | | | | | | | | | | | |
| (a) | Calculated based upon average shares outstanding |
| (b) | The amount shown does not correspond with the aggregate net gain (loss) on investments for the period due to the timing of sales and repurchase of shares in relation to fluctuating market values of the investments of the Fund. |
| (c) | Returns are not annualized and include adjustments in accordance with U.S. Generally Accepted Accounting Principles. Net asset values and returns for financial reporting purposes may differ from those for shareholder transactions. |
| (d) | Portfolio turnover rate is not annualized and excludes in-kind transactions. |
See Notes to Financial Statements
VANECK ETF TRUST
FINANCIAL HIGHLIGHTS
For a share outstanding throughout each period:
| | | Morningstar SMID Moat ETF |
| | | |
| | | Year Ended
September
30, 2024 | | Period
Ended
September
30,
2023 (a) |
| | | | | |
| Net asset value, beginning of period | | | | $28.42 | | | | | $26.02 | |
| Net investment income (b) | | | | 0.42 | | | | | 0.37 | |
| Net realized and unrealized gain on investments | | | | 6.37 | | | | | 2.09 | (c) |
| Total from investment operations | | | | 6.79 | | | | | 2.46 | |
| Distributions from: | | | | | | | | | | |
| Net investment income | | | | (0.21 | ) | | | | (0.06 | ) |
| Net asset value, end of period | | | | $35.00 | | | | | $28.42 | |
| Total return (d) | | | | 23.93 | % | | | | 9.49 | % |
| | | | | | | | | | | |
| Ratios to average net assets | | | | | | | | | | |
| Gross expenses | | | | 0.50 | % | | | | 0.59 | %(e) |
| Net expenses | | | | 0.49 | % | | | | 0.49 | %(e) |
| Net investment income | | | | 1.33 | % | | | | 1.30 | %(e) |
| Supplemental data | | | | | | | | | | |
| Net assets, end of period (in millions) | | | | $381 | | | | | $186 | |
| Portfolio turnover rate (f) | | | | 76 | % | | | | 76 | % |
| | | | | | | | | | | |
| (a) | For the period October 5, 2022 (commencement of operations) through September 30, 2023. |
| (b) | Calculated based upon average shares outstanding |
| (c) | The amount shown does not correspond with the aggregate net gain (loss) on investments for the period due to the timing of sales and repurchase of shares in relation to fluctuating market values of the investments of the Fund. |
| (d) | Returns are not annualized and include adjustments in accordance with U.S. Generally Accepted Accounting Principles. Net asset values and returns for financial reporting purposes may differ from those for shareholder transactions. |
| (e) | Annualized |
| (f) | Portfolio turnover rate is not annualized and excludes in-kind transactions. |
See Notes to Financial Statements
VANECK ETF TRUST
FINANCIAL HIGHLIGHTS
For a share outstanding throughout each year:
| | | Morningstar Wide Moat ETF |
| | | Year Ended September 30, |
| | | 2024 | | 2023 | | 2022 | | 2021 | | 2020 |
| | | | | | | | | | | |
| Net asset value, beginning of year | | $75.81 | | | $59.98 | | | $73.28 | | | $54.63 | | | $50.13 | |
| Net investment income (a) | | 1.22 | | | 0.78 | | | 0.85 | | | 0.96 | | | 0.92 | |
| Net realized and unrealized gain (loss) on investments | | 20.68 | | | 15.86 | | | (13.33 | ) | | 18.59 | | | 4.30 | |
| Total from investment operations | | 21.90 | | | 16.64 | | | (12.48 | ) | | 19.55 | | | 5.22 | |
| Distributions from: | | | | | | | | | | | | | | | |
| Net investment income | | (0.73 | ) | | (0.81 | ) | | (0.82 | ) | | (0.90 | ) | | (0.72 | ) |
| Net asset value, end of year | | $96.98 | | | $75.81 | | | $59.98 | | | $73.28 | | | $54.63 | |
| Total return (b) | | 29.02 | % | | 27.98 | % | | (17.27 | )% | | 36.11 | % | | 10.40 | % |
| | | | | | | | | | | | | | | | |
| Ratios to average net assets | | | | | | | | | | | | | | | |
| Expenses | | 0.47 | % | | 0.47 | % | | 0.46 | % | | 0.46 | % | | 0.47 | % |
| Expenses excluding interest and taxes | | 0.46 | % | | 0.46 | % | | 0.46 | % | | N/A | | | N/A | |
| Net investment income | | 1.42 | % | | 1.06 | % | | 1.20 | % | | 1.40 | % | | 1.77 | % |
| Supplemental data | | | | | | | | | | | | | | | |
| Net assets, end of year (in millions) | | $16,171 | | | $10,618 | | | $5,866 | | | $6,599 | | | $3,398 | |
| Portfolio turnover rate (c) | | 55 | % | | 51 | % | | 51 | % | | 47 | % | | 48 | % |
| | | | | | | | | | | | | | | | |
| (a) | Calculated based upon average shares outstanding |
| (b) | Returns are not annualized and include adjustments in accordance with U.S. Generally Accepted Accounting Principles. Net asset values and returns for financial reporting purposes may differ from those for shareholder transactions. |
| (c) | Portfolio turnover rate is not annualized and excludes in-kind transactions. |
See Notes to Financial Statements
VANECK ETF TRUST
FINANCIAL HIGHLIGHTS
For a share outstanding throughout each period:
| | | Morningstar
Wide Moat
Growth ETF |
| | | |
| | | Period
Ended
September
30,
2024 (a) |
| | | |
| Net asset value, beginning of period | | | | $29.95 | |
| Net investment income (b) | | | | 0.06 | |
| Net realized and unrealized gain on investments | | | | 1.43 | |
| Total from investment operations | | | | 1.49 | |
| Net asset value, end of period | | | | $31.44 | |
| Total return (c) | | | | 4.96 | % |
| | | | | | |
| Ratios to average net assets | | | | | |
| Gross expenses | | | | 13.08 | %(d) |
| Net expenses | | | | 0.49 | %(d) |
| Net investment income | | | | 0.38 | %(d) |
| Supplemental data | | | | | |
| Net assets, end of period (in millions) | | | | $1 | |
| Portfolio turnover rate (e) | | | | 16 | % |
| | | | | | |
| (a) | For the period March 27, 2024 (commencement of operations) through September 30, 2024. |
| (b) | Calculated based upon average shares outstanding |
| (c) | Returns are not annualized and include adjustments in accordance with U.S. Generally Accepted Accounting Principles. Net asset values and returns for financial reporting purposes may differ from those for shareholder transactions. |
| (d) | Annualized |
| (e) | Portfolio turnover rate is not annualized and excludes in-kind transactions. |
See Notes to Financial Statements
VANECK ETF TRUST
FINANCIAL HIGHLIGHTS
For a share outstanding throughout each period:
| | | Morningstar
Wide Moat
Value ETF |
| | | |
| | | Period
Ended
September
30,
2024 (a) |
| | | |
| Net asset value, beginning of period | | | | $29.99 | |
| Net investment income (b) | | | | 0.42 | |
| Net realized and unrealized gain on investments | | | | 3.09 | |
| Total from investment operations | | | | 3.51 | |
| Net asset value, end of period | | | | $33.50 | |
| Total return (c) | | | | 11.71 | % |
| | | | | | |
| Ratios to average net assets | | | | | |
| Gross expenses | | | | 6.72 | %(d) |
| Net expenses | | | | 0.49 | %(d) |
| Net investment income | | | | 2.61 | %(d) |
| Supplemental data | | | | | |
| Net assets, end of period (in millions) | | | | $5 | |
| Portfolio turnover rate (e) | | | | 48 | % |
| | | | | | |
| (a) | For the period March 27, 2024 (commencement of operations) through September 30, 2024. |
| (b) | Calculated based upon average shares outstanding |
| (c) | Returns are not annualized and include adjustments in accordance with U.S. Generally Accepted Accounting Principles. Net asset values and returns for financial reporting purposes may differ from those for shareholder transactions. |
| (d) | Annualized |
| (e) | Portfolio turnover rate is not annualized and excludes in-kind transactions. |
See Notes to Financial Statements
VANECK ETF TRUST
FINANCIAL HIGHLIGHTS
For a share outstanding throughout each period:
| | | Social Sentiment ETF |
| | | |
| | | Year Ended September 30, | | Period
Ended
September
30, |
| | | 2024 | | 2023 | | 2022 | | 2021 (a) |
| | | | | | | | | |
| Net asset value, beginning of period | | | | $15.41 | | | | | $12.74 | | | | | $24.66 | | | | | $25.00 | |
| Net investment income (loss) (b) | | | | 0.13 | | | | | 0.07 | | | | | 0.02 | | | | | (0.03 | ) |
| Net realized and unrealized gain (loss) on investments | | | | 6.08 | | | | | 2.65 | | | | | (11.94 | ) | | | | (0.31 | )(c) |
| Total from investment operations | | | | 6.21 | | | | | 2.72 | | | | | (11.92 | ) | | | | (0.34 | ) |
| Distributions from: | | | | | | | | | | | | | | | | | | | | |
| Net investment income | | | | (0.10 | ) | | | | (0.05 | ) | | | | — | | | | | — | |
| Net asset value, end of period | | | | $21.52 | | | | | $15.41 | | | | | $12.74 | | | | | $24.66 | |
| Total return (d) | | | | 40.39 | % | | | | 21.46 | % | | | | (48.34 | )% | | | | (1.38 | )% |
| | | | | | | | | | | | | | | | | | | | | |
| Ratios to average net assets | | | | | | | | | | | | | | | | | | | | |
| Gross expenses | | | | 0.76 | % | | | | 1.23 | %(e) | | | | 1.16 | %(e) | | | | 0.75 | %(f) |
| Net expenses | | | | 0.76 | % | | | | 0.75 | % | | | | 0.75 | % | | | | 0.75 | %(f) |
| Net expenses excluding interest and taxes | | | | 0.75 | % | | | | 0.75 | % | | | | 0.75 | % | | | | N/A | |
| Net investment income (loss) | | | | 0.68 | % | | | | 0.47 | % | | | | 0.11 | % | | | | (0.20 | )%(f) |
| Supplemental data | | | | | | | | | | | | | | | | | | | | |
| Net assets, end of period (in millions) | | | | $55 | | | | | $55 | | | | | $58 | | | | | $193 | |
| Portfolio turnover rate (g) | | | | 230 | % | | | | 232 | % | | | | 263 | % | | | | 161 | % |
| | | | | | | | | | | | | | | | | | | | | |
| (a) | For the period March 3, 2021 (commencement of operations) through September 30, 2021. |
| (b) | Calculated based upon average shares outstanding |
| (c) | The amount shown does not correspond with the aggregate net gain (loss) on investments for the period due to the timing of sales and repurchase of shares in relation to fluctuating market values of the investments of the Fund. |
| (d) | Returns are not annualized and include adjustments in accordance with U.S. Generally Accepted Accounting Principles. Net asset values and returns for financial reporting purposes may differ from those for shareholder transactions. |
| (e) | The ratio presented reflects the Fund’s extraordinary legal expenses which were paid/reimbursed by the Adviser and/or paid from insurance proceeds during the year. |
| (f) | Annualized |
| (g) | Portfolio turnover rate is not annualized and excludes in-kind transactions. |
See Notes to Financial Statements
VANECK ETF TRUST
NOTES TO FINANCIAL STATEMENTS
September 30, 2024
Note 1—Fund Organization—VanEck ETF Trust (the “Trust”), is registered under the Investment Company Act of 1940, as amended, as an open-end management investment company. The Trust was incorporated in Delaware as a statutory trust on March 15, 2001. The Trust operates as a series fund, and offers multiple investment portfolios, each of which represents a separate series of the Trust. These financial statements relate only to the investment portfolios listed in the diversification table below (each a “Fund” and, collectively, the “Funds”).
| Fund | Diversification Classification |
| | |
| Commodity Strategy ETF | Non-Diversified |
| Durable High Dividend ETF | Diversified |
| Inflation Allocation ETF | Diversified |
| Long/Flat Trend ETF | Diversified |
| Morningstar ESG Moat ETF | Non-Diversified |
| Morningstar Global Wide Moat ETF | Diversified |
| Morningstar International Moat ETF | Diversified |
| Morningstar SMID Moat ETF | Non-Diversified |
| Morningstar Wide Moat ETF | Diversified |
| Morningstar Wide Moat Growth ETF | Non-Diversified |
| Morningstar Wide Moat Value ETF | Non-Diversified |
| Social Sentiment ETF | Non-Diversified |
Each Fund, except for Commodity Strategy ETF and Inflation Allocation ETF, was created to provide investors with the opportunity to purchase a security representing a proportionate undivided interest in a portfolio of securities consisting of substantially all of the common stocks in approximately the same weighting as their index listed in the table below.
| Fund | Index |
| | |
| Durable High Dividend ETF | Morningstar® US Dividend Valuation IndexSM |
| Long/Flat Trend ETF | Ned Davis Research CMG US Large Cap Long/Flat Index |
| Morningstar ESG Moat ETF | Morningstar® US Sustainability Moat Focus IndexSM |
| Morningstar Global Wide Moat ETF | Morningstar® Global Wide Moat Focus IndexSM |
| Morningstar International Moat ETF | Morningstar® Global ex-US Moat Focus IndexSM |
| Morningstar SMID Moat ETF | Morningstar® US Small-Mid Cap Moat Focus IndexSM |
| Morningstar Wide Moat ETF | Morningstar® Wide Moat Focus IndexSM |
| Morningstar Wide Moat Growth ETF | Morningstar® US Broad Growth Wide Moat Focus IndexSM |
| Morningstar Wide Moat Value ETF | Morningstar® US Broad Value Wide Moat Focus IndexSM |
| Social Sentiment ETF | BUZZ NextGen AI US Sentiment Leaders Index |
Using a proprietary, rules-based real asset allocation model, the Inflation Allocation ETF seeks to achieve its investment objective by investing primarily in exchange traded products (“ETPs”) that provide exposure to real assets, which include commodities, real estate, natural resources and infrastructure, as well as companies that own, operate, or derive a significant portion of their value from real assets or the production thereof.
The Commodity Strategy ETF is an actively managed exchange-traded fund that seeks to achieve its investment objective by investing, under normal circumstances, in exchange-traded commodity futures contracts, exchange-traded and over-the-counter (“OTC”) commodity-linked instruments, and pooled investment vehicles, including ETPs that provide exposure to commodities and Cash and Fixed Income Investments. The Fund does not invest in commodities directly.
Van Eck Associates Corp. (“VEAC”) serves as the investment adviser for the Funds, except for Commodity Strategy ETF and Inflation Allocation ETF. Van Eck Absolute Return Advisers Corp. (“VEARA”), a wholly owned subsidiary of VEAC, serves as the investment adviser to Commodity Strategy ETF, Inflation Allocation ETF and their Subsidiaries. VEAC and VEARA are collectively referred to as the “Adviser”.
VANECK ETF TRUST
NOTES TO FINANCIAL STATEMENTS
(continued)
Note 2—Significant Accounting Policies—The preparation of financial statements in conformity with U.S. generally accepted accounting principles (“GAAP”) requires management to make estimates and assumptions that affect the reported amounts and disclosures in the financial statements. Actual results could differ from those estimates.
The Funds are investment companies and follow accounting and reporting requirements of Accounting Standards Codification (“ASC”) 946 Financial Services—Investment Companies.
The following summarizes the Funds’ significant accounting policies.
| A. | Security Valuation—The Funds value their investments in securities and other assets and liabilities at fair value daily. Fair value is the price that would be received to sell an asset or paid to transfer a liability in an orderly transaction between market participants on the measurement date. The Funds utilize various methods to measure the fair value of their investments on a recurring basis, which includes a hierarchy that prioritizes inputs to valuation methods used to measure fair value. The fair value hierarchy gives highest priority to unadjusted quoted prices in active markets for identical assets and liabilities (Level 1 measurements) and the lowest priority to unobservable inputs (Level 3 measurements). The inputs or methodologies used for valuing securities are not necessarily an indication of the risk associated with investing in those securities. The three levels of the fair value hierarchy are described below: |
| | |
| | Level 1 — Quoted prices in active markets for identical securities. |
| | |
| | Level 2 — Significant observable inputs (including quoted prices for similar securities, interest rates, prepayment speeds, credit risk, etc.). |
| | |
| | Level 3 — Significant unobservable inputs (including each Fund’s own assumptions in determining the fair value of investments). |
| | |
| | Securities traded on national exchanges are valued at the closing price on the markets in which the securities trade. Securities traded on the NASDAQ Stock Market LLC (“NASDAQ”) are valued at the NASDAQ official closing price. Over-the-counter securities not included on NASDAQ and listed securities for which no sale was reported are valued at the mean of the bid and ask prices. To the extent these securities are actively traded they are categorized as Level 1 in the fair value hierarchy. Certain foreign securities, whose values may be affected by market direction or events occurring before the Funds’ pricing time (4:00 p.m. Eastern Time) but after the last close of the securities’ primary market, are fair valued using a pricing service and are categorized as Level 2 in the fair value hierarchy. The pricing service considers the correlation of the trading patterns of the foreign security to intraday trading in the U.S. markets, based on indices of domestic securities and other appropriate indicators such as prices of relevant American Depositary Receipts (“ADR’s”) and futures contracts. The Funds may also fair value securities in other situations, such as when a particular foreign market is closed but the Fund is open. Futures contracts are generally valued at the official settlement price on the primary exchange on which they trade and are categorized as Level 1 in the fair value hierarchy. Debt securities are valued on the basis of evaluated prices furnished by an independent pricing service or provided by securities dealers. The pricing services may use valuation models or matrix pricing, which consider: (i) yield or price with respect to bonds that are considered comparable in characteristics such as rating, interest rate and maturity date and or (ii) quotations from bond dealers to determine current value, and are categorized as Level 2 in the fair value hierarchy. Short-term debt securities with sixty days or less to maturity are valued at amortized cost, which with accrued interest approximates fair value. Money market fund investments are valued at net asset value and are considered as Level 1 in the fair value hierarchy. |
| | |
| | The Board of Trustees (“Trustees”) has designated the Adviser as valuation designee to perform the Funds’ fair value determinations, subject to board oversight and certain reporting and other requirements. The Adviser has adopted policies and procedures reasonably designed to comply with requirements. Among other things, these procedures allow the Funds to utilize independent pricing services, quotations from securities dealers, and other market sources to determine fair value. The Pricing Committee convenes regularly to review the fair value of financial instruments or other assets. If market quotations for a |
| | security or other asset are not readily available, or if the Adviser believes they do not otherwise reflect the fair value of a security or asset, the security or asset will be fair valued by the Pricing Committee in accordance with the Funds’ valuation policies and procedures. The Pricing Committee employs various methods for calibrating the valuation approaches utilized to determine fair value, including a regular review of key inputs and assumptions, periodic comparisons to valuations provided by other independent pricing services, transactional back-testing and disposition analysis. |
| | |
| | Certain factors such as economic conditions, political events, market trends, the nature of and duration of any restrictions on disposition, trading in similar securities of the issuer or comparable issuers and other security specific information are used to determine the fair value of these securities. Depending on the relative significance of valuation inputs, these securities may be classified either as Level 2 or Level 3 in the fair value hierarchy. The price which the Funds may realize upon sale of an investment may differ materially from the value presented in the Schedules of Investments. |
| | |
| | A summary of the inputs and the levels used to value the Funds’ investments are located in the Schedules of Investments. Additionally, tables that reconcile the valuation of the Funds’ Level 3 investments and that present additional information about valuation methodologies and unobservable inputs, if applicable, are located in the Schedules of Investments. |
| | |
| B. | Basis for Consolidation— The Commodity Strategy ETF invests in U.S. Treasury securities and Commodity Instruments through the Commodity Strategy Subsidiary and the Inflation Allocation ETF invests in certain ETPs through the Real Asset Allocation Subsidiary (collectively, the “Subsidiaries”, each a wholly-owned “Subsidiary”), organized under the laws of Cayman Islands. Each Fund’s investments in the Subsidiary may not exceed 25% of the value of the Fund’s total assets at each quarter-end of the Fund’s fiscal year. Consolidated financial statements of each Fund present the financial position and results of operations for each Fund and its wholly-owned Subsidiary. All interfund account balances and transactions between the Fund and Subsidiary have been eliminated in consolidation. |
| | |
| C. | Federal Income Taxes—It is each Fund’s policy to comply with the provisions of the Internal Revenue Code applicable to regulated investment companies and to distribute all of its net investment income and net realized capital gains, if any, to its shareholders. Therefore, no federal income tax provision is required. |
| | |
| D. | Distributions to Shareholders—Dividends to shareholders from net investment income and distributions from net realized capital gains, if any, are declared and paid annually by each Fund (except for dividends from net investment income from Durable High Dividend ETF, which are declared and paid quarterly). Income dividends, capital gain distributions and return of capital distributions, if any, are determined in accordance with U.S. income tax regulations, which may differ from such amounts determined in accordance with GAAP. |
| | |
| E. | Currency Translation—Assets and liabilities denominated in foreign currencies and commitments under foreign currency contracts are translated into U.S. dollars at the closing prices of such currencies each business day as quoted by one or more sources. Purchases and sales of investments are translated at the exchange rates prevailing when such investments are acquired or sold. Foreign denominated income and expenses are translated at the exchange rates prevailing when accrued. The portion of realized and unrealized gains and losses on investments that result from fluctuations in foreign currency exchange rates are not separately disclosed in the financial statements. Such amounts are included with the net realized and unrealized gains and losses on investment securities in the Statements of Operations. Recognized gains or losses attributable to foreign currency fluctuations on foreign currency denominated assets, other than investments, and liabilities are recorded as net realized gain (loss) and net change in unrealized appreciation (depreciation) on foreign currency transactions and foreign denominated assets and liabilities in the Statements of Operations. |
| | |
| F. | Restricted Securities—The Funds may invest in securities that are subject to legal or contractual restrictions on resale. These securities generally may be resold in transactions exempt from registration or to the public if the securities are registered. Disposal of these securities may involve time-consuming |
VANECK ETF TRUST
NOTES TO FINANCIAL STATEMENTS
(continued)
| | negotiations and expense, and prompt sale at an acceptable price may be difficult. Information regarding restricted securities, if any, is included at the end of each Fund’s Schedule of Investments. |
| | |
| G. | Use of Derivative Instruments— Certain Funds may invest in derivative instruments. A derivative is an instrument whose value is derived from underlying assets, indices, reference rates or a combination of these factors. Derivative instruments may be privately negotiated contracts (often referred to as OTC derivatives) or they may be listed and traded on an exchange. Derivative contracts may involve future commitments to purchase or sell financial instruments or commodities at specified terms on a specified date, or to exchange interest payment streams or currencies based on a notional or contractual amount. Derivative instruments may involve a high degree of financial risk. The use of derivative instruments also involves the risk of loss if the investment adviser is incorrect in its expectation of the timing or level of fluctuations in securities prices, interest rates or currency prices. Investments in derivative instruments also include the risk of default by the counterparty, the risk that the investment may not be liquid and the risk that a small movement in the price of the underlying security or benchmark may result in a disproportionately large movement, unfavorable or favorable, in the price of the derivative instrument. GAAP requires enhanced disclosures about the Fund’s derivative instruments and hedging activities. Details of this disclosure are found below as well as in the Schedule of Investments. |
| | |
| | Futures Contracts— Futures contracts are financial contracts, the value of which depends on, or is derived from, the underlying reference asset. The Commodity Strategy ETF invests in commodity futures contracts, and the underlying reference assets consist of commodity instruments. Upon entering into a futures contract, the Fund is required to deliver to a broker an amount of cash and/or government securities equal to a certain percentage of the contract amount. This amount is known as the “initial margin”. Subsequent payments, known as “variation margin”, are generally made or received by the Fund each day depending on the fluctuations in the value of the Futures. Such variation margin is recorded for financial statement purposes on a daily basis as an unrealized gain or loss on futures, until the futures contract is closed or expires, at which time the net gain or loss is reclassified to realized gain or loss on futures. Commodity Strategy ETF held futures contracts during the year ended September 30, 2024, the average notional amount for the period was $24,542,832. Futures contracts held by Commodity Strategy ETF at September 30, 2024, are reflected in the Consolidated Schedule of Investments. |
| | |
| | At September 30, 2024, the Fund held the following derivatives (not designated as hedging instruments under GAAP): |
| | | Asset
Derivatives |
| | | Commodities
Futures Risk |
| Commodity Strategy ETF | | | | |
| Futures contracts1 | | $ | 528,535 | |
| 1 | Reflects unrealized appreciation/depreciation as disclosed in the Schedule of Investments. Only current day’s variation margin is reported within the Statement of Assets and Liabilities. |
The impact of transactions in derivative instruments during the year ended September 30, 2024, was as follows:
| | | Commodities
Futures Risk |
| Commodity Strategy ETF | | | | |
| Realized gain (loss): | | | | |
| Futures contracts1 | | $ | (1,941,687 | ) |
| Net change in unrealized appreciation (depreciation): | | | | |
| Futures contracts2 | | $ | (291,906 | ) |
| 1 | Statement of Operations location: Net realized gain (loss) on futures contracts |
| 2 | Statement of Operations location: Net change in unrealized appreciation (depreciation) on futures contracts |
| H. | Offsetting Assets and Liabilities—In the ordinary course of business, the Funds enter into transactions subject to enforceable master netting or other similar agreements. Generally, the right of offset in those agreements allows the Funds to offset any exposure to a specific counterparty with any collateral received or delivered to that counterparty based on the terms of the agreements. The Funds may pledge or receive cash and or securities as collateral for derivative instruments and securities lending. For financial reporting purposes, the Funds present derivative instruments and securities lending assets and liabilities on a gross basis in the Statements of Assets and Liabilities. Futures contracts held by Commodity Strategy ETF are not subject to a master netting agreements or other similar arrangements. In general, collateral received or pledged exceeds the net amount of the unrealized gain/loss or market value of financial instruments. Refer to the Schedule of Investments and Statement of Assets and Liabilities for collateral received or pledged as of September 30, 2024. Cash collateral received for securities lending in the form of money market fund investments, if any, at September 30, 2024, is presented in the Schedules of Investments and in the Statements of Assets and Liabilities. Non-cash collateral is disclosed in Note 9 (Securities Lending). |
| | |
| I. | Other—Security transactions are accounted for on trade date. Realized gains and losses are determined based on the specific identification method. Dividend income is recorded on the ex-dividend date except that certain dividends from foreign securities are recognized upon notification of the ex-dividend date. Interest income, including amortization of premiums and discounts, is accrued using the effective interest method. |
| | |
| | The Funds earn interest income on uninvested cash balances held at the custodian bank. Such amounts, if any, are presented as interest income in the Statements of Operations. |
| | |
| | The character of distributions received from certain investments may be comprised of income, capital gains, and return of capital. It is the Funds’ policy to estimate the character of distributions received from these investments based on historical data if actual amounts are not available. Such amounts are based on historical information available to the Funds and other industry sources. After each calendar year end, these investments report the actual tax character of these distributions. Differences between the estimated and actual amounts are reflected in the Funds’ records in the year in which they are reported by adjusting the related cost basis of investments, capital gains and income, as necessary. |
| | |
| | In the normal course of business, the Funds enter into contracts that contain a variety of general indemnifications. The Funds’ maximum exposure under these agreements is unknown as this would involve future claims that may be made against the Funds that have not yet occurred. However, the Adviser believes the risk of loss under these arrangements to be remote. |
Note 3—Investment Management and Other Agreements—The Adviser receives a management fee, calculated daily and payable monthly based on an annual rate of each Fund’s average daily net assets. The Adviser has agreed, until at least February 1, 2025, to waive management fees and assume expenses to prevent each Fund’s total annual operating expenses (excluding acquired fund fees and expenses, interest expense, trading expenses, taxes and extraordinary expenses) from exceeding expense limitations listed in the following table.
The management fee rate and expense limitations for the year ended September 30, 2024, are as follows:
| Fund | | Management
Fees | | Expense
Limitations |
| Inflation Allocation ETF | | | 0.50 | % | | | 0.55 | % |
| Long/Flat Trend ETF | | | 0.50 | | | | 0.55 | |
| Morningstar ESG Moat ETF | | | 0.45 | | | | 0.49 | |
| Morningstar Global Wide Moat ETF | | | 0.45 | | | | 0.52 | |
| Morningstar International Moat ETF | | | 0.50 | | | | 0.56 | |
| Morningstar SMID Moat ETF | | | 0.45 | | | | 0.49 | |
| Morningstar Wide Moat ETF | | | 0.45 | | | | 0.49 | |
VANECK ETF TRUST
NOTES TO FINANCIAL STATEMENTS
(continued)
| Fund | | Management
Fees | | Expense
Limitations |
| Morningstar Wide Moat Growth ETF | | | 0.45 | | | | 0.49 | |
| Morningstar Wide Moat Value ETF | | | 0.45 | | | | 0.49 | |
Refer to the Statements of Operations for amounts waived/assumed by the Adviser.
The Adviser waives the management fees it charges the Funds by the amount it collects as a management fee from underlying funds managed by the Adviser. For the year ended September 30, 2024, the Adviser waived management fees of $175,449 due to such investments held in the Inflation Allocation ETF.
The Funds listed below utilize a unitary management fee structure where the Adviser will pay all expenses of the Fund, except for the fee payment under the investment management agreement, acquired fund fees and expenses, interest expense, trading expenses, taxes and extraordinary expenses. In addition, for Commodity Strategy ETF, the Adviser has agreed to pay and/or reimburse the Fund for the offering costs and trading expenses that are net account or similar fees charged by futures commission merchants (“FCMs”) until at least February 1, 2025.
| Fund | | Management
Fee Rate |
| Commodity Strategy ETF | | | 0.55 | % |
| Durable High Dividend ETF | | | 0.29 | |
| Social Sentiment ETF | | | 0.75 | |
In addition, Van Eck Securities Corporation, an affiliate of the Adviser, acts as the Funds’ distributor (“the Distributor”). Certain officers and a Trustee of the Trust are officers, directors or stockholders of the Adviser and Distributor.
At September 30, 2024, the Adviser owned approximately 83% of Morningstar Wide Moat Value ETF, 22% of Morningstar ESG Moat ETF and 10% of Durable High Dividend ETF.
Note 4—Capital Share Transactions—As of September 30, 2024, there were an unlimited number of capital shares of beneficial interest authorized by the Trust with no par value. Fund shares are not individually redeemable and are issued and redeemed at their net asset value per share only through certain authorized broker-dealers (“Authorized Participants”) in blocks of shares (“Creation Units”).
The consideration for the purchase or redemption of Creation Units of the Funds generally consists of the in-kind contribution or distribution of securities constituting the Funds’ underlying index (“Deposit Securities”) plus a balancing cash component to equate the transaction to the net asset value per share of the Fund on the transaction date. Cash may also be substituted in an amount equivalent to the value of certain Deposit Securities, generally as a result of market circumstances, or when the securities are not available in sufficient quantity for delivery, or are not eligible for trading by the Authorized Participant. The Funds may issue Creation Units in advance of receipt of Deposit Securities subject to various conditions, including, for the benefit of the Funds, a requirement to maintain cash collateral on deposit at the custodian equal to at least 115% of the daily marked to market value of the missing Deposit Securities.
Authorized Participants purchasing and redeeming Creation Units may pay transaction fees directly to the transfer agent. In addition, the Funds may impose certain variable fees on the purchase or redemption of Creation Units for cash, or on transactions effected outside the clearing process, to defray certain transaction costs. These variable fees, if any, are reflected in share transactions in the Statements of Changes in Net Assets.
Note 5—Investments—For the year ended September 30, 2024, purchases and sales of investments (excluding short-term investments and in-kind capital share transactions) and purchases and sales of
investments resulting from in-kind capital share transactions (excluding short-term investments and U.S. government obligations) were as follows:
| | | | | | | | | In-Kind Capital Share Transactions |
| Fund | | Purchases | | Sales | | Purchases | | Sales |
| Durable High Dividend ETF | | | 39,314,640 | | | | 37,781,667 | | | | 28,879,127 | | | | 70,780,997 | |
| Inflation Allocation ETF* | | | 40,351,072 | | | | 42,963,449 | | | | 26,204,516 | | | | 46,742,240 | |
| Long/Flat Trend ETF | | | 46,954,249 | | | | 276,676 | | | | 44,778,050 | | | | 97,037,029 | |
| Morningstar ESG Moat ETF | | | 2,310,456 | | | | 2,026,493 | | | | 1,928,311 | | | | 3,373,038 | |
| Morningstar Global Wide Moat ETF | | | 12,785,983 | | | | 13,191,945 | | | | — | | | | 4,859,786 | |
| Morningstar International Moat ETF | | | 188,583,362 | | | | 189,953,880 | | | | 1,992,336 | | | | 26,934,917 | |
| Morningstar SMID Moat ETF | | | 241,345,960 | | | | 220,886,033 | | | | 378,565,763 | | | | 258,711,092 | |
| Morningstar Wide Moat ETF | | | 7,714,339,722 | | | | 7,628,885,164 | | | | 10,604,419,424 | | | | 8,448,472,341 | |
| Morningstar Wide Moat Growth ETF | | | 119,956 | | | | 299,903 | | | | 1,519,881 | | | | 587,686 | |
| Morningstar Wide Moat Value ETF | | | 1,074,611 | | | | 950,840 | | | | 5,668,576 | | | | 926,644 | |
| Social Sentiment ETF | | | 154,320,075 | | | | 135,223,085 | | | | 120,180,939 | | | | 158,526,871 | |
| * | Represents consolidated cost of investments purchased and proceeds from investments sold. |
Note 6—Income Taxes—As of September 30, 2024, for Federal income tax purposes, the identified cost, gross unrealized appreciation, gross unrealized depreciation and net unrealized appreciation (depreciation) of investments owned were as follows:
| Fund | | | Tax Cost of
Investments | | | | Gross
Unrealized
Appreciation | | | | Gross
Unrealized
Depreciation | | | | Net Unrealized
Appreciation
(Depreciation) | |
| Commodity Strategy ETF | | | $24,945,098 | | | | $273,376 | | | | $(1,237,324) | | | | $(963,948) | |
| Durable High Dividend ETF | | | 49,651,678 | | | | 3,038,906 | | | | (769,336) | | | | 2,269,570 | |
| Inflation Allocation ETF | | | 72,018,234 | | | | 11,171,361 | | | | (3,746,566) | | | | 7,424,795 | |
| Long/Flat Trend ETF | | | 21,129,378 | | | | 5,625,074 | | | | – | | | | 5,625,074 | |
| Morningstar ESG Moat ETF | | | 5,669,824 | | | | 960,585 | | | | (121,153) | | | | 839,432 | |
| Morningstar Global Wide Moat ETF | | | 14,014,046 | | | | 2,534,813 | | | | (103,713) | | | | 2,431,100 | |
| Morningstar International Moat ETF | | | 222,455,855 | | | | 27,584,402 | | | | (5,193,756) | | | | 22,390,646 | |
| Morningstar SMID Moat ETF | | | 354,789,901 | | | | 34,054,291 | | | | (5,279,343) | | | | 28,774,948 | |
| Morningstar Wide Moat ETF | | | 14,763,854,283 | | | | 1,749,253,812 | | | | (352,945,180) | | | | 1,396,308,632 | |
| Morningstar Wide Moat Growth ETF | | | 775,674 | | | | 17,840 | | | | (8,965) | | | | 8,875 | |
| Morningstar Wide Moat Value ETF | | | 4,888,360 | | | | 180,621 | | | | (41,863) | | | | 138,758 | |
| Social Sentiment ETF | | | 54,422,150 | | | | 3,832,262 | | | | (2,310,198) | | | | 1,522,064 | |
At September 30, 2024, the components of distributable earnings (loss) on a tax basis, for each Fund, were as follows:
| Fund | | Undistributed
Ordinary
Income | | (Accumulated
Capital Losses^)/
Undistributed
Capital Gains | | Other
Temporary
Differences | | Unrealized
Appreciation
(Depreciation) | | Total
Distributable
Earnings (Loss) |
| Commodity Strategy ETF | | $638,654 | | $– | | $– | | $(204,857) | | $433,797 |
| Durable High Dividend ETF | | 464,398 | | (17,542,571) | | (624) | | 2,269,570 | | (14,809,227) |
| Inflation Allocation ETF | | 525.869 | | (22,038,471) | | (1,204) | | 7,497,279 | | (14,016,527) |
| Long/Flat Trend ETF | | 147,231 | | (7,950,930) | | (1,607) | | 5,625,074 | | (2,180,232) |
| Morningstar ESG Moat ETF | | 33,947 | | (698,268) | | (24) | | 839,432 | | 175,087 |
| Morningstar Global Wide Moat ETF | | 199,245 | | 551,719 | | (398) | | 2,431,586 | | 3,182,152 |
| Morningstar International Moat ETF | | 6,877,200 | | (24,344,911) | | (3,444) | | 22,405,077 | | 4,933,922 |
| Morningstar SMID Moat ETF | | 3,298,127 | | (26,931,382) | | (556) | | 28,774,948 | | 5,141,137 |
| Morningstar Wide Moat ETF | | 152,136,246 | | (1,765,435,618) | | (223,923) | | 1,396,308,632 | | (217,214,663) |
VANECK ETF TRUST
NOTES TO FINANCIAL STATEMENTS
(continued)
| Fund | | Undistributed
Ordinary
Income | | (Accumulated
Capital Losses^)/
Undistributed
Capital Gains | | Other
Temporary
Differences | | Unrealized
Appreciation
(Depreciation) | | Total
Distributable
Earnings (Loss) |
| Morningstar Wide Moat Growth ETF | | 1,426 | | (25,915) | | – | | 8,875 | | (15,614) |
| Morningstar Wide Moat Value ETF | | 19,814 | | (9,550) | | – | | 138,758 | | 149,022 |
| Social Sentiment ETF | | 280,416 | | (118,089,202) | | – | | 1,522,064 | | (116,286,722) |
| ^ | These accumulated capital losses are available to offset future capital gains and have an unlimited expiration. |
During the year ended September 30, 2024, Morningstar Global Wide Moat ETF utilized $164,800 of its accumulated capital losses available from prior years.
The tax character of dividends paid to shareholders during the years ended September 30, 2024 and September 30, 2023 were as follows:
| | | September 30, 2024 | | September 30, 2023 | |
| Fund | | Ordinary
Income* | | Ordinary
Income* | | Long-Term
Capital Gains | |
| Commodity Strategy ETF | | $1,774,980 | | $– | | $– | |
| Durable High Dividend ETF | | 2,234,105 | | 2,908,003 | | – | |
| Inflation Allocation ETF | | 4,000,118 | | 2,100,120 | | – | |
| Long/Flat Trend ETF | | 375,000 | | 315,038 | | – | |
| Morningstar ESG Moat ETF | | 65,003 | | 37,500 | | – | |
| Morningstar Global Wide Moat ETF | | 325,000 | | 349,984 | | 235,116 | |
| Morningstar International Moat ETF | | 5,575,320 | | 1,800,060 | | – | |
| Morningstar SMID Moat ETF | | 1,500,150 | | 66,010 | | – | |
| Morningstar Wide Moat ETF | | 112,006,875 | | 78,997,870 | | – | |
| Social Sentiment ETF | | 324,950 | | 209,840 | | – | |
| * | Includes short-term capital gains (if any). |
During the year ended September 30, 2024, as a result of permanent book to tax differences primarily due to the tax treatment of in-kind redemptions and differences in the treatment of income and realized gains from the Commodity Strategy ETF and Inflation Allocation ETF’s controlled foreign corporation subsidiaries, the Funds incurred differences that affected distributable earnings / (loss) and aggregate paid in capital by the amounts in the table below. Net assets were not affected by these reclassifications.
| Fund | | Increase
(Decrease)
in Total Distributable
Earnings (Loss) | | Increase
(Decrease)
in Aggregate
Paid in Capital |
| Commodity Strategy ETF | | $ | 1,698,300 | | | $ | (1,698,300 | ) |
| Durable High Dividend ETF | | | (5,491,087 | ) | | | 5,491,087 | |
| Inflation Allocation ETF | | | (689,191 | ) | | | 689,191 | |
| Long/Flat Trend ETF | | | (3,042,753 | ) | | | 3,042,753 | |
| Morningstar ESG Moat ETF | | | (635,314 | ) | | | 635,314 | |
| Morningstar Global Wide Moat ETF | | | (625,412 | ) | | | 625,412 | |
| Morningstar International Moat ETF | | | (2,146,360 | ) | | | 2,146,360 | |
| Morningstar SMID Moat ETF | | | (39,998,628 | ) | | | 39,998,628 | |
| Morningstar Wide Moat ETF | | | (1,961,573,467 | ) | | | 1,961,573,467 | |
| Morningstar Wide Moat Growth ETF | | | (49,342 | ) | | | 49,342 | |
| Morningstar Wide Moat Value ETF | | | (32,207 | ) | | | 32,207 | |
| Social Sentiment ETF | | | (28,384,402 | ) | | | 28,384,402 | |
The Funds recognize the tax benefits of uncertain tax positions only where the position is “more-likely-than-not” to be sustained assuming examination by applicable tax authorities. Management has analyzed the
Funds’ tax positions, and has concluded that no liability for unrecognized tax benefits should be recorded related to uncertain tax positions taken on return filings for all open tax years. The Funds do not have exposure for additional years that might still be open in certain foreign jurisdictions. Therefore, no provision for income tax is required in the Funds’ financial statements. However, certain Funds are subject to foreign taxes on the appreciation in value of certain investments. The Funds provide for such taxes on both realized and unrealized appreciation.
The Funds recognize interest and penalties, if any, related to uncertain tax positions as income tax expense in the Statements of Operations. During the year ended September 30, 2024, the Funds did not incur any interest or penalties.
Note 7—Principal Risks—Non-diversified funds generally hold securities of fewer issuers than diversified funds (See Note 1) and may be more susceptible to the risks associated with these particular issuers, or to a single economic, political or regulatory occurrence affecting these issuers. The Funds may purchase securities on foreign exchanges. Securities of foreign issuers involve special risks and considerations not typically associated with investing in U.S. issuers. These risks include devaluation of currencies, currency controls, less reliable information about issuers, different securities transaction clearance and settlement practices, future adverse economic developments and political conflicts, or natural or other disasters, such as the recent coronavirus outbreak. Additionally, certain Funds may invest in securities of emerging market issuers, which are exposed to a number of risks that may make these investments volatile in price or difficult to trade. Political risks may include unstable governments, nationalization, restrictions on foreign ownership, laws that prevent investors from getting their money out of a country, sanctions and investment restrictions and legal systems that do not protect property risks as well as the laws of the United States. These and other factors can make emerging market securities more volatile and potentially less liquid than securities issued in more developed markets. Certain securities of Chinese issuers are, or may in the future become restricted, and the Funds may be forced to sell such restricted securities and incur a loss as a result.
Commodity Strategy ETF invests in futures contracts. The usage of futures contracts is subject to risks that are in addition to, and potentially greater than, the risks of investing directly in securities and other more traditional assets. Futures contracts are subject to collateral requirements and daily limits that may limit the Fund’s ability to achieve its investment objective. If the Fund is unable to meet its investment objective, the Fund’s returns may be lower than expected. Additionally, these collateral requirements may require the Fund to liquidate its position when it otherwise would not do so. Futures contracts exhibit “futures basis,” which refers to the difference between the current market value of the underlying commodity (the “spot” price) and the price of the cash-settled futures contracts. A negative futures basis exists when cash-settled futures contracts generally trade at a premium to the current market value of the underlying commodity. If a negative futures basis exists, the Fund’s investments in futures contracts will generally underperform a direct investment in the underlying commodity.
Long/Flat Trend ETF may invest in shares of other funds, including ETFs that track the S&P 500 Index. As a result, the Fund will indirectly be exposed to the risks of an investment in the underlying funds. Shares of other funds have many of the same risks as direct investments in common stocks or bonds. In addition, the market value of the Fund’s shares is expected to rise and fall as the value of the underlying index or bond rises and falls. The market value of such funds’ shares may differ from the net asset value of the particular fund.
Inflation Allocation ETF may concentrate its investments in ETPs that invest directly in, or have exposure to, equity and debt securities, as well as real asset categories such as commodities, real estate, natural resources and infrastructure. Such investments may subject the ETPs to greater volatility than investments in traditional securities. The Fund is dependent on the performance of underlying funds and is subject to the risks of those funds.
Changes in laws or government regulations by the United States and/or the Cayman Islands could adversely affect the operations of the Commodity Strategy ETF and Inflation Allocation ETF.
VANECK ETF TRUST
NOTES TO FINANCIAL STATEMENTS
(continued)
Social Sentiment ETF may concentrate its investment in the information technology and communication services sectors. The Fund will be sensitive to, and its performance may depend to a greater extent on, the overall condition of these sectors. Information technology companies face intense competition, both domestically and internationally, which may have an adverse effect on profit margins. The products of information technology companies may face product obsolescence due to rapid technological developments and frequent new product introduction, unpredictable changes in growth rates and competition for the services of qualified personnel. Companies in the information technology sector are heavily dependent on patent protection and the expiration of patents may adversely affect the profitability of these companies. Companies in the communication services sector may be affected by industry competition, substantial capital requirements, government regulations and obsolescence of communications products and services due to technological advancement. The index provider relies on social media analytics, which are relatively new and untested. Investing in companies based on social media analytics involves the potential risk of market manipulation because social media posts may be made with an intent to inflate, or otherwise manipulate, the public perception of a company stock or other investment. Furthermore, text and sentiment analysis of social media postings may prove inaccurate in predicting a company’s stock performance.
A more complete description of risks is included in each Fund’s Prospectus and Statement of Additional Information.
Note 8—Trustee Deferred Compensation Plan—The Trust has a Deferred Compensation Plan (the “Plan”) for Trustees under which the Trustees can elect to defer receipt of their trustee fees until retirement, disability or termination from the Board of Trustees. The fees otherwise payable to the participating Trustees are deemed invested in shares of the Funds as directed by the Trustees.
On October 1, 2021, the Durable High Dividend ETF adopted a unitary management fee, therefore, the liability of the Plan shown as “Deferred Trustee fees” in the Statement of Asset and Liabilities represents amounts accrued through September 30, 2021. Commodity Strategy ETF and Social Sentiment ETF commenced operations with a unitary management fee and therefore bear no costs or liabilities relative to the Plan.
For Inflation Allocation ETF, Long/Flat Trend ETF, Morningstar ESG Moat ETF, Morningstar Global Wide Moat ETF, Morningstar International Moat ETF, Morningstar SMID Moat ETF, Morningstar Wide Moat Growth ETF, Morningstar Wide Moat Value ETF, and Morningstar Wide Moat ETF the expense for the Plan is included in “Trustees’ fees and expenses” in the Statements of Operations, and the liability for the Plan is shown as “Deferred Trustee fees” in the Statements of Assets and Liabilities.
Note 9—Securities Lending—To generate additional income, each of the Funds may lend its securities pursuant to a securities lending agreement with the securities lending agent. Each Fund may lend up to 33% of its investments requiring that the loan be continuously collateralized by cash, cash equivalents, U.S. government securities, or any combination of cash and such securities at all times equal to at least 102% (105% for foreign securities) of the market value of securities loaned. Daily market fluctuations could cause the value of loaned securities to be more or less than the value of the collateral received. When this occurs, the collateral is adjusted and settled on the next business day. During the term of the loan, the Funds will continue to receive any dividends, interest or amounts equivalent thereto, on the securities loaned while receiving a fee from the borrower and or earning interest on the investment of the cash collateral. Such fees and interest are shared with the securities lending agent under the terms of the securities lending agreement. Securities lending income is disclosed as such in the Statements of Operations. Cash collateral is maintained on the Funds’ behalf by the lending agent and is invested in the State Street Navigator Securities Lending Government Money Market Portfolio. Non-cash collateral consists of U.S. Treasuries and U.S. Government Agency securities, and is not disclosed in the Funds’ Schedules of Investments or Statements of Assets and Liabilities as it is held by the agent on behalf of the Funds. The Funds do not have the ability to re-hypothecate those securities. Loans are subject to termination at the option of the borrower or the Funds. Upon termination of the loan, the borrower will return to the Fund securities identical to the securities loaned. The Funds bear the risk of delay in recovery of, or even loss of rights in, the securities loaned should the borrower of the securities fail financially. The value of loaned securities and related cash collateral, if
any, at September 30, 2024, is presented on a gross basis in the Schedules of Investments and Statements of Assets and Liabilities. The following is a summary of the Funds’ securities on loan and related collateral as of September 30, 2024:
| Fund | | Market Value
of Securities
on Loan | | Cash
Collateral | | Non-Cash
Collateral | | Total
Collateral |
| Durable High Dividend ETF | | $ | 30,549 | | | $ | – | | | $ | 31,183 | | | $ | 31,183 | |
| Inflation Allocation ETF | | | 8,826,893 | | | | 2,460,575 | | | | 6,615,365 | | | | 9,075,940 | |
| Morningstar Global Wide Moat ETF | | | 191,912 | | | | 152,787 | | | | 51,704 | | | | 204,491 | |
| Morningstar International Moat ETF | | | 25,833,617 | | | | 3,883,714 | | | | 23,546,708 | | | | 27,430,422 | |
| Morningstar SMID Moat ETF | | | 2,249,769 | | | | 2,313,879 | | | | – | | | | 2,313,879 | |
| Morningstar Wide Moat ETF | | | 158,996,579 | | | | 426,158 | | | | 159,251,663 | | | | 159,677,821 | |
| Social Sentiment ETF | | | 5,445,687 | | | | 533,605 | | | | 5,168,297 | | | | 5,701,902 | |
The following table presents money market fund investments held as collateral by type of security on loan as of September 30, 2024:
| | Gross Amount of
Recognized Liabilities
for Securities Lending
Transactions* in the
Statements of Assets
and Liabilities |
| Fund | | Equity Securities |
| Inflation Allocation ETF | | | $ | 2,460,575 | |
| Morningstar Global Wide Moat ETF | | | | 152,787 | |
| Morningstar International Moat ETF | | | | 3,883,714 | |
| Morningstar SMID Moat ETF | | | | 2,313,879 | |
| Morningstar Wide Moat ETF | | | | 426,158 | |
| Social Sentiment ETF | | | | 533,605 | |
| * | Remaining contractual maturity: overnight and continuous |
Note 10—Bank Line of Credit—The Funds may participate in a $200 million committed credit facility (the “Facility”) to be utilized for temporary financing until the settlement of sales or purchases of portfolio securities, the repurchase or redemption of shares of the Funds at the request of the shareholders and other temporary or emergency purposes. The Funds have agreed to pay commitment fees, pro rata, based on the unused but available balance. Interest is charged to the Funds based on prevailing market rates in effect at the time of borrowings. During the year ended September 30, 2024, the following Funds borrowed under this Facility:
| Fund | | Days
Outstanding | | | Average
Daily
Loan Balance | | | Average
Interest Rate |
| Commodity Strategy ETF | | | 12 | | | | $209,658 | | | | 6.68 | % |
| Durable High Dividend ETF | | | 170 | | | | 207,944 | | | | 6.68 | |
| Long/Flat Trend ETF | | | 3 | | | | 8,991,736 | | | | 6.68 | |
| Morningstar Global Wide Moat ETF | | | 2 | | | | 292,280 | | | | 6.68 | |
| Morningstar International Moat ETF | | | 322 | | | | 594,579 | | | | 6.66 | |
| Morningstar SMID Moat ETF | | | 27 | | | | 161,144 | | | | 6.57 | |
| Morningstar Wide Moat ETF | | | 131 | | | | 11,170,939 | | | | 6.65 | |
| Social Sentiment ETF | | | 72 | | | | 193,772 | | | | 6.68 | |
Outstanding loan balances as of September 30, 2024, if any, are reflected in the Statements of Assets and Liabilities.
Note 11—Subsequent Event Review—At a meeting held on September 5, 2024, the Board of Trustees of the Trust approved the following changes for Morningstar International Moat ETF effective December 20, 2024: (i) changing the Fund’s benchmark index from the Morningstar® Global Markets ex-US Moat Focus IndexSM to the Morningstar® Global Markets ex-US Wide Moat Focus IndexSM; (ii) changing the Fund’s investment objective; and (iii) changing the Fund’s principal investment strategy.
VANECK ETF TRUST
REPORT OF INDEPENDENT REGISTERED PUBLIC ACCOUNTING FIRM
To the Board of Trustees of VanEck ETF Trust and Shareholders of each of the twelve funds listed in the table below
Opinions on the Financial Statements
We have audited the accompanying statements of assets and liabilities, including the schedules of investments, (the consolidated statements of assets and liabilities, including the consolidated schedules of investments, for VanEck Commodity Strategy ETF and VanEck Inflation Allocation ETF) of each of the funds listed in the table below (twelve of the funds constituting VanEck ETF Trust, hereafter collectively referred to as the “Funds”) as of September 30, 2024, the related statements of operations and of changes in net assets for each of the periods indicated in the table below, including the related notes, and the financial highlights for each of the periods indicated in the table below (collectively referred to as the “financial statements”). In our opinion, the financial statements present fairly, in all material respects, the financial position of each of the Funds listed in the table below as of September 30, 2024, the results of each of their operations, the changes in each of their net assets and each of the financial highlights for each of the periods indicated in the table below, in conformity with accounting principles generally accepted in the United States of America.
Funds
| VanEck Commodity Strategy ETF (4) | VanEck Morningstar International Moat ETF (1) |
| VanEck Durable High Dividend ETF (1) | VanEck Morningstar SMID Moat ETF (5) |
| VanEck Inflation Allocation ETF (2) | VanEck Morningstar Wide Moat ETF (1) |
| VanEck Long/Flat Trend ETF (1) | VanEck Morningstar Wide Moat Growth ETF (3) |
| VanEck Morningstar ESG Moat ETF (6) | VanEck Morningstar Wide Moat Value ETF (3) |
| VanEck Morningstar Global Wide Moat ETF (1) | VanEck Social Sentiment ETF (1) |
(1) Statement of operations for the year ended September 30, 2024, statement of changes in net assets for the years ended September 30, 2024 and 2023, and financial highlights for the years ended September 30, 2024, 2023 and 2022.
(2) Consolidated statement of operations for the year ended September 30, 2024, consolidated statement of changes in net assets for the years ended September 30, 2024 and 2023, and consolidated financial highlights for the years ended September 30, 2024, 2023 and 2022.
(3) Statement of operations, statement of changes in net assets, and financial highlights for the period March 27, 2024 (commencement of operations) through September 30, 2024.
(4) Consolidated statement of operations for the year ended September 30, 2024, and consolidated statement of changes in net assets and consolidated financial highlights for the year ended September 30, 2024 and the period December 21, 2022 (commencement of operations) through September 30, 2023.
(5) Statement of operations for the year ended September 30, 2024 and statement of changes in net assets and financial highlights for the year ended September 30, 2024 and the period October 5, 2022 (commencement of operations) through September 30, 2023.
(6) Statement of operations for the year ended September 30, 2024 and statement of changes in net assets and financial highlights for the years ended September 30, 2024 and 2023, and financial highlights for the period October 6, 2021 (commencement of operations) through September 30, 2022.
The financial statements of the Funds (other than VanEck Commodity Strategy ETF, VanEck Morningstar ESG Moat ETF, VanEck Morningstar SMID Moat ETF, VanEck Morningstar Wide Moat Growth ETF and VanEck Morningstar Wide Moat Value ETF) as of and for the year or period ended September 30, 2021 and the financial highlights for each of the periods ended on or prior to September 30, 2021 (not presented herein, other than the financial highlights) were audited by other auditors whose report dated November 19, 2021 expressed an unqualified opinion on those financial statements and financial highlights.
Basis for Opinions
These financial statements are the responsibility of the Funds’ management. Our responsibility is to express an opinion on the Funds’ financial statements based on our audits. We are a public accounting firm registered with the Public Company Accounting Oversight Board (United States) (PCAOB) and are required to be independent with respect to the Funds in accordance with the U.S. federal securities laws and the applicable rules and regulations of the Securities and Exchange Commission and the PCAOB.
We conducted our audits of these financial statements in accordance with the standards of the PCAOB. Those standards require that we plan and perform the audit to obtain reasonable assurance about whether the financial statements are free of material misstatement, whether due to error or fraud.
Our audits included performing procedures to assess the risks of material misstatement of the financial statements, whether due to error or fraud, and performing procedures that respond to those risks. Such procedures included examining, on a test basis, evidence regarding the amounts and disclosures in the financial statements. Our audits also included evaluating the accounting principles used and significant estimates made by management, as well as evaluating the overall presentation of the financial statements. Our procedures included confirmation of securities owned as of September 30, 2024, by correspondence with the custodian, transfer agent and brokers; when replies were not received from brokers, we performed other auditing procedures. We believe that our audits provide a reasonable basis for our opinions.
/s/PricewaterhouseCoopers LLP
New York, New York
November 20, 2024
We have served as the auditor of one or more investment companies in the VanEck Funds complex since 2022.
VANECK ETF TRUST
TAX INFORMATION
(unaudited)
The information set forth below relates to distributions paid during each Fund’s current fiscal year as required by federal laws. Shareholders, however, must report dividends on a calendar year basis for income tax purposes, which may include dividends for portions of two fiscal years of a Fund.
Accordingly, the information needed by shareholders for calendar year 2024 income tax purposes will be sent to them in early 2025. Please consult your tax advisor for proper treatment of this information.
The following information is provided with respect to the distributions paid during the taxable year ended September 30, 2024:
| | | Ordinary
Income
Paid Per Share | | | Qualified
Dividend
Income for
Individuals* | | | Dividends
Qualifying for
the Dividend
Received
Deduction for
Corporations* | | | Foreign
Source
Income* | | | Foreign
Taxes Paid Per
Share** | |
| Commodity Strategy | | $ | 2.9583 | �� | | | 0.00 | % | | | 0.00 | % | | | – | % | | $ | – | |
| Durable High Dividend | | | 1.0492 | | | | 100.00 | | | | 100.00 | | | | – | | | | – | |
| Inflation Allocation | | | 0.9357 | | | | 20.95 | | | | 14.03 | | | | 9.90 | | | | 0.0074 | |
| Long/Flat Trend | | | 0.6250 | | | | 88.04 | | | | 82.22 | | | | – | | | | – | |
| Morningstar ESG Moat | | | 0.2889 | | | | 100.00 | | | | 100.00 | | | | – | | | | – | |
| Morningstar Global Wide Moat | | | 0.6500 | | | | 95.27 | | | | 56.36 | | | | – | | | | – | |
| Morningstar International Moat | | | 0.7288 | | | | 63.23 | | | | 0.67 | | | | 99.69 | | | | 0.0626 | |
| Morningstar SMID Moat | | | 0.2055 | | | | 100.00 | | | | 100.00 | | | | – | | | | – | |
| Morningstar Wide Moat | | | 0.7285 | | | | 100.00 | | | | 100.00 | | | | – | | | | – | |
| Social Sentiment | | | 0.0970 | | | | 100.00 | | | | 100.00 | | | | – | | | | – | |
| | | | | | | | | | | | | | | | | | | | | |
| | | Qualified Business
Income *** | | | Section 163(j)-
Interest Dividends
as a % of the Total
Ordinary Income
Distribution (a) | | | Qualified
Interest
Income
(QII) as a % of
the Total
Ordinary Income
Distribution (b) | | | Federal
Obligation
Interest as a
Percentage
of the Total
Distribution (c) | |
| Commodity Strategy | | | – | % | | | 59.04 | % | | | 59.04 | % | | | 56.30 | % |
| Inflation Allocation | | | 1.91 | | | | – | | | | – | | | | – | |
| Long/Flat Trend | | | – | | | | 37.73 | | | | 37.73 | | | | 37.73 | |
*Expressed as a percentage of the cash distribution grossed up for foreign taxes.
**The foreign taxes paid represent taxes incurred by the Fund on income received by the Fund from foreign sources. Foreign taxes paid may be included in taxable income with an offsetting deduction from gross income or may be taken as a credit for taxes paid to foreign governments.
*** Qualified Business Income (QBI) under Section 199A represents the percentage of ordinary income distributions that is eligible for the Section 199A deduction. Section 199A allows a deduction of up to 20% on QBI for non-corporate taxpayers. Tax regulations enable a regulated investment company to flow-through QBI received from pass through entities such as real estate investment trusts, to its shareholders.
(a) These amounts represent distributions paid during the taxable year ended September 30, 2024 that are eligible to be treated as interest income for purposes of Section 163(j) and the regulations thereunder. To treat a dividend as interest income, shareholders must have held shares on which the dividend was paid for at least 180 days during the 361-day period surrounding the ex-dividend date of the distribution.
(b) These amounts represent distributions paid during the taxable year ended September 30, 2024 that were considered to be Qualified Interest Income (“QII”) distributions. The QII distributions may be exempt from United States withholding tax when distributed to non-U.S. shareholders with proper documentation.
(c) Certain states may exempt the portion of dividends derived from assets backed by the full faith and credit of the U.S. Government.
| Changes In and Disagreements with Accountants | For the period covered by this report |
| | |
| There were no changes in or disagreements with accountants. | |
| | |
| Proxy Disclosures | For the period covered by this report |
| | |
| Not applicable. | |
| | |
| Remuneration Paid to Directors, Officers, and Others | For the period covered by this report |
| | |
| Refer to the financial statements included herein. | |
VANECK ETF TRUST
APPROVAL OF INVESTMENT ADVISORY CONTRACTS
(unaudited)
At a meeting held on June 7, 2024 (the “Renewal Meeting”), the Board of Trustees (the “Board”) of VanEck® ETF Trust (the “Trust,” and the series thereof listed below, the “Funds”), including all of the Trustees that are not interested persons of the Trust (the “Independent Trustees”), approved the continuation of (i) the investment management agreements between the Trust and Van Eck Associates Corporation (“VEAC”) (the “VEAC Investment Management Agreements”) with respect to the VanEck Biotech ETF, Digital Transformation ETF, Durable High Dividend ETF, Energy Income ETF, Environmental Services ETF, Gaming ETF, Green Infrastructure ETF, Long/Flat Trend ETF, Morningstar ESG Moat ETF, Morningstar Global Wide Moat ETF, Morningstar International Moat ETF, Morningstar SMID Moat ETF, Morningstar Wide Moat ETF, Morningstar Wide Moat Growth ETF, Morningstar Wide Moat Value ETF, Pharmaceutical ETF, Retail ETF, Robotics ETF, Semiconductor ETF, Social Sentiment ETF and Video Gaming and eSports ETF and (ii) the investment management agreements between the Trust and Van Eck Absolute Return Advisers Corporation (“VEARA,” and together with VEAC, the “Advisers”) (the “VEARA Investment Management Agreements”) with respect to the VanEck Commodity Strategy ETF and Inflation Allocation ETF. The VEAC Investment Management Agreements and the VEARA Investment Management Agreements are collectively referred to as the “Investment Management Agreements.”
The Board’s approval of the Investment Management Agreements was based on a comprehensive consideration of all of the information available to the Trustees and was not the result of any single factor. Some of the factors that figured particularly in the Trustees’ deliberations and how the Trustees considered those factors are described below, although individual Trustees may have evaluated the information presented differently, giving different weights to various factors.
In preparation for the Renewal Meeting, the Trustees held a meeting on May 3, 2024. At that meeting, the Trustees discussed the information the Advisers and Broadridge Financial Solutions, Inc. (“Broadridge”), an independent third-party data provider, had provided to them in advance. The information provided to the Trustees included, among other things, information about the performance and expenses of the Funds (except for the VanEck Morningstar Wide Moat Growth ETF and Morningstar Wide Moat Value ETF, which had only recently commenced operations) (each, a “Covered Fund” and together, the “Covered Funds”) and the Covered Funds’ peer funds (certain other registered funds), information about the advisory services provided to the Funds and the personnel providing those services, and the profitability (or the absence of profitability) and other benefits enjoyed by the Advisers and their respective affiliates as a result of the Advisers’ relationships with the Funds. In reviewing performance information for the Covered Funds against their peer groups, the Trustees considered that each Covered Fund, except the VanEck Commodity Strategy ETF and Inflation Allocation ETF, has a different investment objective than the funds in its designated peer group and, therefore, each such Covered Fund’s performance will differ from its peers. The Trustees also considered the fact that each of the VanEck Morningstar Wide Moat Growth ETF and Morningstar Wide Moat Value ETF had only recently commenced operations and therefore each had a limited operational history that could be used for comparative purposes, since tracking error measurements and the performance comparisons provided by Broadridge were not available for each Fund. In addition, as noted below, the Trustees reviewed certain performance information for each Covered Fund which was not provided by Broadridge and which did not compare each Covered Fund’s performance to the performance of its peer group. The Trustees noted that the peer group performance information did not necessarily provide meaningful direct comparisons to the Covered Funds.
The Independent Trustees’ consideration of the Investment Management Agreements was based, in part, on their review of information obtained through discussions with the Advisers at the Renewal Meeting and the May 3, 2024 meeting regarding the management of the Funds and information obtained at other meetings of the Trustees and/or based on their review of the materials provided by the Advisers, including the background and experience of the portfolio managers and others involved in the management and administration of the Funds. The Trustees considered the terms of, and scope of services that the Advisers provide under, the Investment Management Agreements, including, where applicable, (i) with respect to the VanEck Environmental Services ETF, Gaming ETF, Inflation Allocation ETF, Long/Flat Trend ETF, Morningstar ESG Moat ETF, Morningstar Global Wide Moat ETF, Morningstar International Moat ETF, Morningstar SMID Moat ETF, Morningstar Wide Moat ETF, Morningstar Wide Moat Growth ETF, Morningstar Wide Moat Value
ETF and Video Gaming and eSports ETF (the “Non-Unitary Funds”), the Advisers’ commitment to waive certain fees and/or pay expenses of each of the Non-Unitary Funds (inclusive of any subsidiary expenses with respect to the VanEck Inflation Allocation ETF, but excluding acquired fund fees and expenses, interest expense, trading expenses, taxes and extraordinary expenses for all Non-Unitary Funds) to the extent necessary to prevent the operating expenses of each of the Non-Unitary Funds from exceeding agreed upon limits for a period of time and (ii) with respect to all the other Funds (the “Unitary Funds”), the Advisers’ agreement to pay all of the direct expenses of the Unitary Funds (inclusive of any subsidiary expenses with respect to the VanEck Commodity Strategy ETF, but excluding the fee payment under the Investment Management Agreements, acquired fund fees and expenses, interest expense, offering costs, trading expenses, taxes and extraordinary expenses for all other Unitary Funds).
The Trustees concluded that the Advisers and their personnel have the requisite expertise and skill to manage the Funds’ portfolios. In evaluating the performance of each Covered Fund, the Trustees reviewed various performance metrics, including various data from Broadridge comparing each Covered Fund’s performance to that of certain other registered funds, but relied principally on a comparison of the “gross” performance of each Covered Fund except for VanEck Commodity Strategy ETF and Inflation Allocation ETF (i.e., measured without regard to the impact of fees and expenses) to the performance of its benchmark index, in each case incorporating any systematic fair value adjustments to the underlying securities. The Trustees considered information from VEARA regarding the performance of the VanEck Commodity Strategy ETF and Inflation Allocation ETF, each an actively managed ETF, against their respective benchmark indices and peer funds. The Trustees noted that the VanEck Commodity Strategy ETF had outperformed its benchmark for the one-year period ended December 31, 2023 and the period since its inception on December 20, 2022 through December 31, 2023. The Trustees also noted that the VanEck Inflation Allocation ETF had outperformed its benchmark during the one-year period ended December 31, 2023 but had underperformed its benchmark for the three-year period ended December 31, 2023 and the period since its inception on April 9, 2018 through December 31, 2023. The Trustees further considered the Adviser’s observation that the Fund continued to deliver positive performance on an absolute basis over these periods and provided diversified and dynamic exposure to the principal inflation-protection assets during the one-year period ended December 31, 2023.
The Trustees also considered information relating to the financial condition of the Advisers and the current status, as they understood it, of the Advisers’ compliance environment.
As noted above, the Trustees were also provided with various data from Broadridge comparing the Covered Funds’ expenses to that of certain other registered funds. The Trustees noted that the information provided showed that each Covered Fund (except as noted below) had management fees (after the effect of any applicable fee waiver) below the average and median of its respective peer group of funds, each of the VanEck Commodity Strategy ETF, Morningstar International Moat ETF and Morningstar Wide Moat ETF had management fees (after the effect of any applicable fee waiver) above the average and median of its respective peer group of funds, the VanEck Energy Income ETF had management fees below the average and equal to the median of its peer group of funds, and the VanEck Green Infrastructure ETF had management fees above the average and equal to the median of its peer group of funds. The Trustees also noted that the information provided showed that each Covered Fund (except as noted below) had a total expense ratio (after the effect of any applicable expense limitation) below the average and median of its respective peer group of funds, each of the VanEck Gaming ETF, Morningstar ESG Moat ETF, Morningstar Global Wide Moat ETF, Morningstar International Moat ETF, Morningstar Wide Moat ETF and Social Sentiment ETF had a total expense ratio (after the effect of any applicable expense limitation) above the average and median of its respective peer group of funds, each of the VanEck Energy Income ETF, Environmental Services ETF and Green Infrastructure ETF had a total expense ratio (after the effect of any applicable expense limitation) below the average and equal to the median of its respective peer group of funds, and the VanEck Long/Flat Trend ETF had a total expense ratio (after the effect of the expense limitation) above the average and equal to the median of its peer group of funds. The Trustees reviewed the amounts by which certain Covered Funds’ management fees and/or total expense ratios (after the effect of any applicable fee waivers and/or expense limitations) exceeded the average and/or median of their respective peer groups and information
VANECK ETF TRUST
APPROVAL OF INVESTMENT ADVISORY CONTRACTS
(unaudited) (continued)
provided by the Advisers providing context for these comparisons. The Trustees concluded, in light of this information and the other information available to them, that the management fees paid by the Covered Funds were reasonable in light of the performance of the Covered Funds and the quality of services received.
The Trustees also considered the benefits, other than the fees under the Investment Management Agreements, received by the Advisers from serving as advisers to the Funds.
The Trustees also considered information provided by the Advisers about their overall profitability and profitability or loss in respect of each Covered Fund. The Trustees reviewed each Covered Fund’s asset size, expense ratio and expense cap, as applicable, and noted that the Investment Management Agreements do not include breakpoints in the advisory fee rates as asset levels in a Covered Fund increase. The Trustees considered the potential variability in the net assets of the Covered Funds and the sustainability of any potential economies of scale which may exist given where fees are currently set. The Trustees also evaluated the extent to which management fees for the Covered Funds may effectively incorporate the benefits of economies of scale. The Trustees also considered the risks being assumed by the Advisers under the unitary fee structure arrangement and the potential expense stability that may inure to the benefit of shareholders of the Unitary Funds and noted that the Advisers have capped expenses on each of the Non-Unitary Funds since its inception, although the cap was not necessarily exceeded each year. Based on the foregoing and the other information available to them, the Trustees determined that the advisory fee rate for each Covered Fund is reasonable and appropriate in relation to the current asset size of each Covered Fund and the other factors discussed above and that the advisory fee rate for each Covered Fund currently reflects an appropriate sharing with shareholders of any economies of scale which may exist. The Trustees also determined that the profits earned by the Advisers with respect to the Covered Funds that were profitable to the Advisers were reasonable in light of the nature and quality of the services received by such Covered Funds.
The Trustees did not consider historical information about the cost of the services provided by VEAC or the profitability of the VanEck Morningstar Wide Moat Growth ETF and Morningstar Wide Moat Value ETF to VEAC because the Funds had only recently commenced operations. The Trustees could not consider the historical performance or actual management fees or operating expenses of, or the quality of services previously provided to the VanEck Morningstar Wide Moat Growth ETF and Morningstar Wide Moat Value ETF by VEAC, although they concluded that the nature, quality and extent of the services to be provided by VEAC were appropriate based on the Trustees’ knowledge of VEAC and its personnel and the operations of the other series of the Trust.
The Independent Trustees were advised by and met in executive session with their independent counsel at the Renewal Meeting and at their May 3, 2024 meeting as part of their consideration of the Investment Management Agreements.
In voting to approve the continuation of the Investment Management Agreements, the Trustees, including the Independent Trustees, concluded that the terms of each of the Investment Management Agreements are reasonable and fair in light of the services to be performed, expenses to be incurred and such other matters as the Trustees considered relevant in the exercise of their reasonable judgment. The Trustees further concluded that, at the time of their considerations, each of the Investment Management Agreements is in the best interest of the applicable Fund and the Fund’s shareholders.
| Item 8. | CHANGES IN AND DISAGREEMENTS WITH ACCOUNTANTS FOR OPEN-END MANAGEMENT INVESTMENT COMPANIES. |
There were no changes in and disagreements with accountants.
| Item 9. | PROXY DISCLOSURES FOR OPEN-END MANAGEMENT INVESTMENT COMPANIES. |
Not applicable.
| Item 10. | REMUNERATION PAID TO DIRECTORS, OFFICERS, AND OTHERS OF OPEN-END MANAGEMENT INVESTMENT COMPANIES. |
Information included in Item 7.
| Item 11. | STATEMENT REGARDING BASIS FOR APPROVAL OF INVESTMENT ADVISORY CONTRACT. |
Information included in Item 7.
| Item 12. | DISCLOSURE OF PROXY VOTING POLICIES AND PROCEDURES FOR CLOSED-END MANAGEMENT INVESTMENT COMPANIES. |
Not applicable.
| Item 13. | PORTFOLIO MANAGERS OF CLOSED-END MANAGEMENT INVESTMENT COMPANIES. |
Not applicable.
| Item 14. | PURCHASE OF EQUITY SECURITIES BY CLOSED-END MANAGEMENT INVESTMENT COMPANY AND AFFILIATED PURCHASERS. |
Not applicable.
| Item 15. | SUBMISSION OF MATTERS TO A VOTE OF SECURITY HOLDERS. |
No material changes to the procedures by which shareholders may recommend nominees to the registrant’s board of directors.
| Item 16. | CONTROLS AND PROCEDURES. |
| (a) | The registrant’s principal executive and principal financial officers, or persons performing similar functions, have concluded that the registrant’s disclosure controls and procedures (as defined in Rule 30a-3(c) under the Investment Company Act of 1940, as amended (the “1940 Act”) (17 CFR 270.30a-3 (c)) are effective, as of a date within 90 days of the filing date of the report that includes the disclosure required by this paragraph, based on their evaluation of these controls and procedures required by Rule 30a-3(b) under the 1940 Act (17 CFR 270.30a-3(b)) and Rules 13a-15(b) or 15d-15(b) under the Securities Exchange Act of 1934, as amended (17 CFR 240.13a-15(b) or 240.15d-15 (b)). |
| (b) | There were no changes in the registrant’s internal control over financial reporting (as defined in Rule 30a-3(d) under the 1940 Act (17 CFR 270.30a(d)) that occurred during the period covered by this report that has materially affected, or is reasonably likely to materially affect, the registrant’s internal control over financial reporting. |
| Item 17. | DISCLOSURE OF SECURITIES LENDING ACTIVITIES FOR CLOSED-END MANAGEMENT COMPANIES. |
Not applicable.
| Item 18. | RECOVERY OF ERRONEOUSLY AWARDED COMPENSATION. |
Not applicable.
SIGNATURES
Pursuant to the requirements of the Securities Exchange Act of 1934 and the Investment Company Act of 1940, the registrant has duly caused this report to be signed on its behalf by the undersigned, thereunto duly authorized.
(Registrant) VANECK ETF TRUST
| By | (Signature and Title) | /s/ John J. Crimmins, CFO | |
| | | | |
Pursuant to the requirements of the Securities Exchange Act of 1934 and the Investment Company Act of 1940, this report has been signed below by the following persons on behalf of the registrant and in the capacities and on the dates indicated.
| By | (Signature and Title) | /s/ Jan F. van Eck, CEO | |
| | | | |
| By | (Signature and Title) | /s/ John J. Crimmins, CFO | |
| | | | |
0001137360veac:MVISNorthAmericaEnergyInfrastructureIndex362AdditionalIndexMember2020-02-290001137360veac:SP500IndexTotalReturn478BroadBasedIndexMember2022-02-280001137360veac:SP500IndexTotalReturn91BroadBasedIndexMember2017-02-280001137360veac:MSCIACWINetTRIndex77BroadBasedIndexMember2014-10-31iso4217:USDxbrli:shares