No assurance can be given that the Trust’s investment objective will be achieved.
Overview of the Trust’s Long-Term Investments
Sector Allocation
|
|
|
| 7/31/14
|
| 7/31/13
|
Transportation | | | | | 33 | % | | | 25 | % |
Education | | | | | 17 | | | | 12 | |
State | | | | | 15 | | | | 26 | |
County/City/Special District/School District | | | | | 13 | | | | 13 | |
Health | | | | | 8 | | | | 11 | |
Corporate | | | | | 8 | | | | 6 | |
Housing | | | | | 6 | | | | 7 | |
| | For Trust compliance purposes, the Trust’s sector classifications refer to any one or more of the sector sub-classifications used by one or more widely recognized market indexes or rating group indexes, and/or as defined by the investment advisor. These definitions may not apply for purposes of this report, which may combine such sector sub-classifications for reporting ease. |
|
|
Call/Maturity Schedule3
|
|
Calendar Year Ended December 31,
| | | | | | |
2014 | | | | | 8 | % |
2015 | | | | | — | |
2016 | | | | | 1 | |
2017 | | | | | 3 | |
2018 | | | | | 13 | |
| 3 | | Scheduled maturity dates and/or bonds that are subject to potential calls by issuers over the next five years. |
Credit Quality Allocation1
|
|
|
| 7/31/14
|
| 7/31/13
|
AAA/Aaa | | | | | 2 | % | | | 2 | % |
AA/Aa | | | | | 40 | | | | 35 | |
A | | | | | 35 | | | | 40 | |
BBB/Baa | | | | | 9 | | | | 9 | |
BB/Ba | | | | | 4 | | | | 5 | |
B | | | | | 3 | | | | 3 | |
N/R2 | | | | | 7 | | | | 6 | |
| 1 | | For financial reporting purposes, credit quality ratings shown above reflect the highest rating assigned by either S&P or Moody’s if ratings differ. These rating agencies are independent, nationally recognized statistical rating organizations and are widely used. Investment grade ratings are credit ratings of BBB/Baa or higher. Below investment grade ratings are credit ratings of BB/Ba or lower. Investments designated N/R are not rated by either rating agency. Unrated investments do not necessarily indicate low credit quality. Credit quality ratings are subject to change. |
| 2 | | The investment advisor evaluates the credit quality of unrated investments based upon certain factors including, but not limited to, credit ratings for similar investments and financial analysis of sectors and individual investments. Using this approach, the investment advisor has deemed certain of these unrated securities as investment grade quality. As of July 31, 2014 and July 31, 2013, the market value of unrated securities deemed by the investment advisor to be investment grade was $10,254,522, representing 5%, and $8,401,509, representing 4%, respectively, of the Trust’s long-term investments. |
| ANNUAL REPORT | JULY 31, 2014 | 15
|
| |
| Trust Summary as of July 31, 2014 | BlackRock New York Municipal Income Trust
|
Trust Overview
BlackRock New York Municipal Income Trust’s (BNY) (the “Trust”) investment objective is to provide current income exempt from regular federal income tax and New York State and New York City personal income taxes. The Trust seeks to achieve its investment objective by investing primarily in municipal bonds exempt from federal income taxes (except that the interest may be subject to the federal alternative minimum tax) and New York State and New York City personal income taxes. The Trust invests at least 80% of its assets in municipal bonds that are investment grade quality at the time of investment. The Trust may invest directly in such securities or synthetically through the use of derivatives.
No assurance can be given that the Trust’s investment objective will be achieved.
Performance
• | | For the 12-month period ended July 31, 2014, the Trust returned 11.51% based on market price and 15.98% based on NAV. For the same period, the closed-end Lipper New York Municipal Debt Funds category posted an average return of 12.03% based on market price and 12.89% based on NAV. All returns reflect reinvestment of dividends. The Trust’s discount to NAV, which widened during the period, accounts for the difference between performance based on price and performance based on NAV. The following discussion relates to performance based on NAV. |
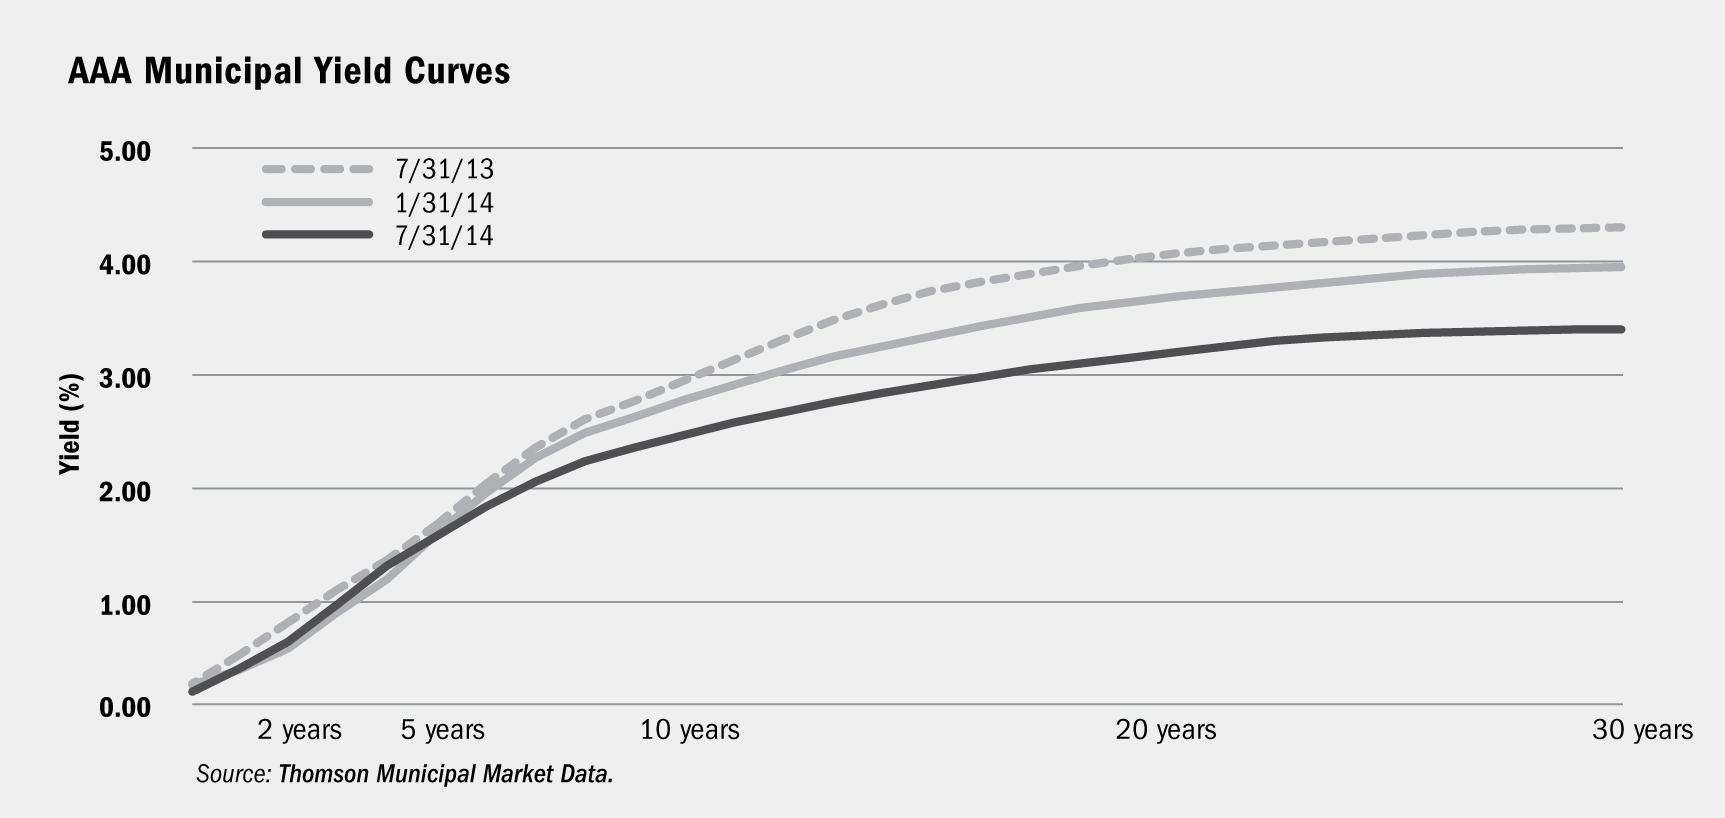
• | | Tax-exempt rates declined during the period, supporting generally positive performance for municipal bonds. (Bond prices rise when rates fall.) Municipal bonds with longer durations (and greater sensitivity to interest rate movements) tended to provide the strongest returns. In this environment, the Trust’s exposure to lower coupon and zero coupon bonds — which experienced strong price performance due to their relatively long durations for their respective maturities —contributed positively to results. The Trust’s exposure to the long end of the yield curve also was a significant contributor to total return, as longer-dated yields declined more than shorter-maturity yields. This positioning allowed the Trust to maximize its income and also benefit from the flattening of the yield curve. |
• | | The Trust’s holdings in the health care, corporate and transportation sectors — the better performing areas of the market — were particularly beneficial. The Trust’s significant exposure to high-quality (A-rated) issues had a positive impact on results as the market’s strong performance during the period was concentrated in this credit quality tier. Additionally, the Trust benefited from income generated from coupon payments on its portfolio of municipal bond holdings. The use of leverage allowed the Trust to maximize its income. |
• | | The Trust’s modest exposure to Puerto Rico government-related credits in the earlier part of the period detracted from results, as credit spreads on these bonds widened materially due to investors’ lack of confidence and a weak local economy. The Trust sold its exposure to these securities early in the period. |
| | The views expressed reflect the opinions of BlackRock as of the date of this report and are subject to change based on changes in market, economic or other conditions. These views are not intended to be a forecast of future events and are no guarantee of future results. |
Trust Information
Symbol on NYSE | | | | BNY |
Initial Offering Date | | | | July 27, 2001 |
Yield on Closing Market Price as of July 31, 2014 ($13.79)1 | | | | 6.00% |
Tax Equivalent Yield2 | | | | 12.14% |
Current Monthly Distribution per Common Share3 | | | | $0.069 |
Current Annualized Distribution per Common Share3 | | | | $0.828 |
Economic Leverage as of July 31, 20144 | | | | 39% |
| 1 | | Yield on closing market price is calculated by dividing the current annualized distribution per share by the closing market price. Past performance does not guarantee future results. |
| 2 | | Tax equivalent yield assumes the maximum marginal federal and state tax rate of 50.59%, which includes the 3.8% Medicare tax. Actual tax rates will vary based on income, exemptions and deductions. Lower taxes will result in lower tax equivalent yields. |
| 3 | | The distribution rate is not constant and is subject to change. |
| 4 | | Represents VMTP Shares and TOBs as a percentage of total managed assets, which is the total assets of the Trust, including any assets attributable to VMTP Shares and TOBs, minus the sum of accrued liabilities. For a discussion of leveraging techniques utilized by the Trust, please see The Benefits and Risks of Leveraging on page 5. |
| 16 | ANNUAL REPORT | JULY 31, 2014
|
| |
| | BlackRock New York Municipal Income Trust
|
Market Price and Net Asset Value Per Share Summary
|
|
|
| 7/31/14
|
| 7/31/13
|
| Change
|
| High
|
| Low
|
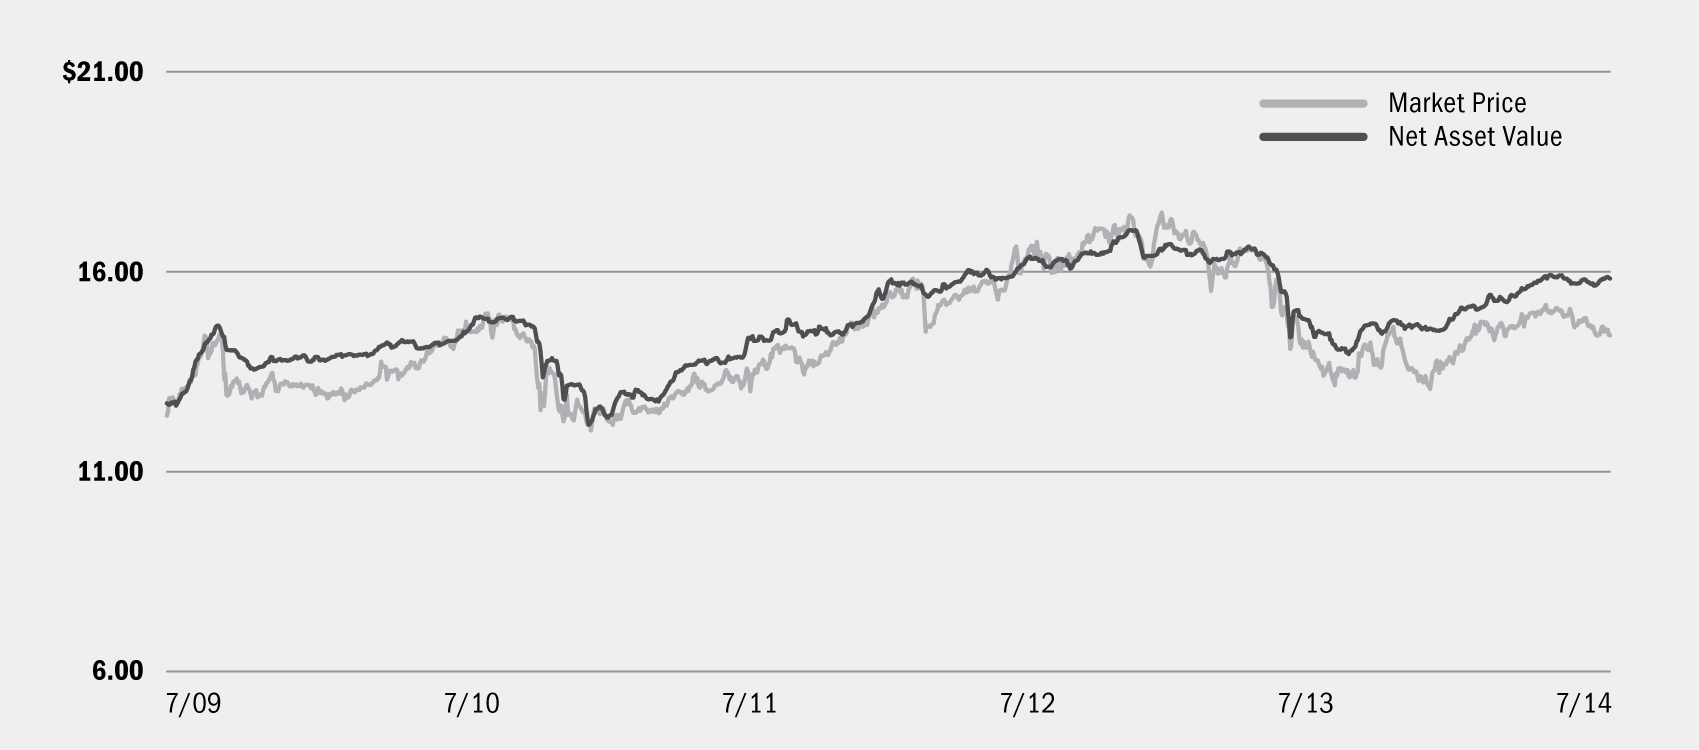
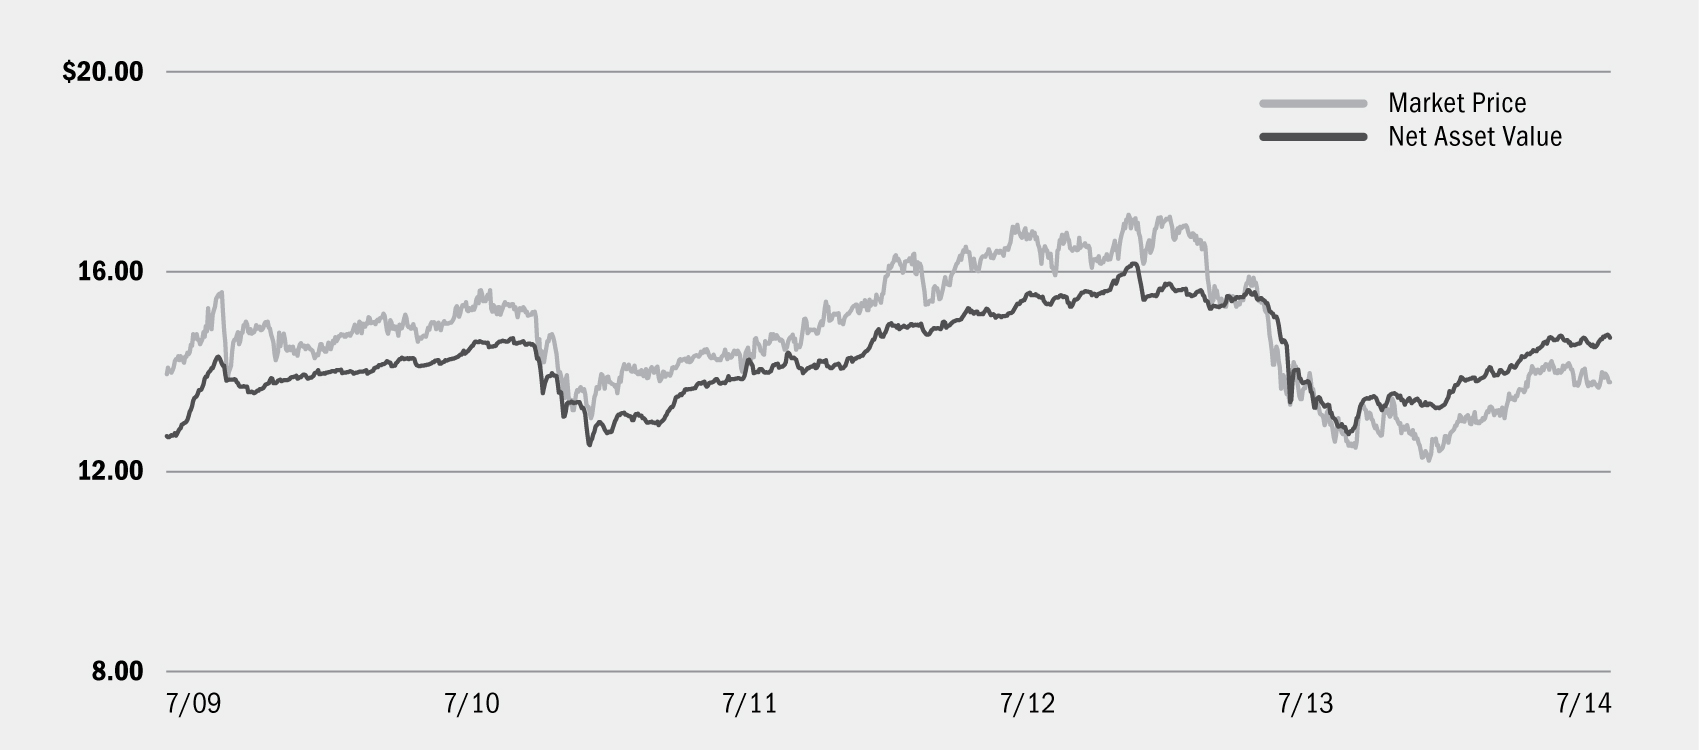
Market Price | | | | $ | 13.79 | | | $ | 13.16 | | | | 4.79 | % | | $ | 14.37 | | | $ | 12.17 | |
Net Asset Value | | | | $ | 14.68 | | | $ | 13.47 | | | | 8.98 | % | | $ | 14.74 | | | $ | 12.75 | |
Market Price and Net Asset Value History For the Past Five Years | | | |
Overview of the Trust’s Long-Term Investments
Sector Allocation
|
|
|
| 7/31/14
|
| 7/31/13
|
County/City/Special District/School District | | | | | 24 | % | | | 23 | % |
Education | | | | | 19 | | | | 16 | |
Transportation | | | | | 14 | | | | 14 | |
Utilities | | | | | 13 | | | | 11 | |
Health | | | | | 10 | | | | 10 | |
State | | | | | 9 | | | | 9 | |
Corporate | | | | | 9 | | | | 10 | |
Housing | | | | | 2 | | | | 7 | |
| | For Trust compliance purposes, the Trust’s sector classifications refer to any one or more of the sector sub-classifications used by one or more widely recognized market indexes or rating group indexes, and/or as defined by the investment advisor. These definitions may not apply for purposes of this report, which may combine such sector sub-classifications for reporting ease. |
|
|
Call/Maturity Schedule3
|
|
Calendar Year Ended December 31,
| | | | | | |
2014 | | | | | 5 | % |
2015 | | | | | 5 | |
2016 | | | | | 4 | |
2017 | | | | | 12 | |
2018 | | | | | 3 | |
| 3 | | Scheduled maturity dates and/or bonds that are subject to potential calls by issuers over the next five years. |
Credit Quality Allocation1
|
|
|
| 7/31/14
|
| 7/31/13
|
AAA/Aaa | | | | | 16 | % | | | 13 | % |
AA/Aa | | | | | 39 | | | | 34 | |
A | | | | | 29 | | | | 35 | |
BBB/Baa | | | | | 6 | | | | 8 | |
BB/Ba | | | | | 4 | | | | 3 | |
N/R2 | | | | | 6 | | | | 7 | |
| 1 | | For financial reporting purposes, credit quality ratings shown above reflect the highest rating assigned by either S&P or Moody’s if ratings differ. These rating agencies are independent, nationally recognized statistical rating organizations and are widely used. Investment grade ratings are credit ratings of BBB/Baa or higher. Below investment grade ratings are credit ratings of BB/Ba or lower. Investments designated N/R are not rated by either rating agency. Unrated investments do not necessarily indicate low credit quality. Credit quality ratings are subject to change. |
| 2 | | The investment advisor evaluates the credit quality of unrated investments based upon certain factors including, but not limited to, credit ratings for similar investments and financial analysis of sectors and individual investments. Using this approach, the investment advisor has deemed certain of these unrated securities as investment grade quality. As of July 31, 2014 and July 31, 2013, the market value of unrated securities deemed by the investment advisor to be investment grade was $2,704,682, representing 1%, and $2,500,000, representing 1%, respectively, of the Trust’s long-term investments. |
| ANNUAL REPORT | JULY 31, 2014 | 17
|
| |
| Schedule of Investments July 31, 2014 | BlackRock California Municipal Income Trust (BFZ)
(Percentages shown are based on Net Assets) |
| Municipal Bonds | | | | Par
(000) | | Value |
California — 107.3% |
Corporate — 0.7% | | | | | | | | | | |
City of Chula Vista California, Refunding RB, San Diego Gas & Electric: | | | | | | | | | | |
Series A, 5.88%, 2/15/34 | | | | $ | 680 | | | $ | 783,659 | |
Series D, 5.88%, 1/01/34 | | | | | 2,500 | | | | 2,881,100 | |
| | | | | | | | | 3,664,759 | |
County/City/Special District/School District — 34.5% | | | | | | | | | | |
Butte-Glenn Community College District, GO, Election of 2002, Series C, 5.50%, 8/01/30 | | | | | 8,425 | | | | 9,508,876 | |
Centinela Valley Union High School District, GO, Refunding, Election of 2008, Series B, 5.75%, 8/01/33 | | | | | 1,250 | | | | 1,478,238 | |
Cerritos Community College District, GO, Election of 2004, Series C, 5.25%, 8/01/31 | | | | | 3,000 | | | | 3,437,130 | |
City of San Jose California Hotel Tax, RB, Convention Center Expansion & Renovation Project: | | | | | | | | | | |
6.13%, 5/01/31 | | | | | 500 | | | | 583,830 | |
6.50%, 5/01/36 | | | | | 1,210 | | | | 1,432,059 | |
6.50%, 5/01/42 | | | | | 2,225 | | | | 2,628,926 | |
County of Kern California, COP, Capital Improvements Projects, Series A (AGC), 6.00%, 8/01/35 | | | | | 2,000 | | | | 2,328,560 | |
County of Orange California Water District, COP, Refunding, 5.25%, 8/15/34 | | | | | 2,000 | | | | 2,293,080 | |
County of San Joaquin California Transportation Authority, Refunding RB, Limited Tax, Measure K, Series A: | | | | | | | | | | |
6.00%, 3/01/36 | | | | | 2,880 | | | | 3,459,024 | |
5.50%, 3/01/41 | | | | | 5,265 | | | | 5,938,604 | |
County of Santa Clara California Financing Authority, Refunding LRB, Series L, 5.25%, 5/15/36 | | | | | 20,000 | | | | 22,127,000 | |
Evergreen Elementary School District, GO, Election of 2006, Series B (AGC), 5.13%, 8/01/33 | | | | | 2,500 | | | | 2,849,550 | |
Grossmont Healthcare District, GO, Election of 2006, Series B: | | | | | | | | | | |
6.00%, 7/15/34 | | | | | 3,260 | | | | 3,849,636 | |
6.13%, 7/15/40 | | | | | 2,000 | | | | 2,348,900 | |
Long Beach Unified School District California, GO, Refunding, Election of 2008, Series A, 5.75%, 8/01/33 | | | | | 4,135 | | | | 4,865,034 | |
Los Alamitos Unified School District California, GO, School Facilities Improvement District No. 1, 5.50%, 8/01/33 | | | | | 6,300 | | | | 7,235,550 | |
Los Angeles Community College District California, GO, Election of 2003, Series F-1, 5.00%, 8/01/33 | | | | | 5,000 | | | | 5,615,700 | |
Los Angeles Municipal Improvement Corp., Refunding RB, Real Property, Series B (AGC), 5.50%, 4/01/30 | | | | | 5,065 | | | | 5,821,762 | |
Modesto Irrigation District, COP, Capital Improvements, Series A, 5.75%, 10/01/29 | | | | | 3,015 | | | | 3,475,632 | |
| Municipal Bonds | | | | Par
(000) | | Value |
California (continued) |
County/City/Special District/School District (concluded) |
Oak Grove School District California, GO, Election of 2008, Series A, 5.50%, 8/01/33 | | | | $ | 6,000 | | | $ | 6,951,180 | |
Pico Rivera Public Financing Authority, RB, 5.75%, 9/01/39 | | | | | 2,000 | | | | 2,204,900 | |
Pittsburg Unified School District, GO, Election of 2006, Series B (AGM), 5.50%, 8/01/34 | | | | | 2,000 | | | | 2,264,040 | |
Sacramento Area Flood Control Agency, Special Assessment Bonds, Consolidated Capital Assessment District, 5.25%, 10/01/32 | | | | | 4,865 | | | | 5,637,757 | |
San Diego Community College District California, GO, Election of 2002, 5.25%, 8/01/33 | | | | | 1,500 | | | | 1,727,790 | |
San Diego Regional Building Authority, RB, County Operations Center & Annex, Series A, 5.38%, 2/01/36 | | | | | 5,500 | | | | 6,274,620 | |
San Joaquin Delta Community College District, GO, Election of 2004, Series C, 5.00%, 8/01/39 (b) | | | | | 2,505 | | | | 2,763,291 | |
San Jose California Financing Authority, Refunding LRB, Civic Center Project, Series A, 5.00%, 6/01/32 | | | | | 3,375 | | | | 3,770,246 | |
San Leandro California Unified School District, GO, Election of 2010, Series A, 5.75%, 8/01/41 | | | | | 3,060 | | | | 3,463,889 | |
San Mateo County Community College District, GO, Election of 2005, Series B, 5.00%, 9/01/31 | | | | | 8,630 | | | | 9,258,178 | |
Santa Ana Unified School District, GO, Election of 2008, Series A: | | | | | | | | | | |
5.50%, 8/01/30 | | | | | 6,455 | | | | 7,382,003 | |
5.13%, 8/01/33 | | | | | 10,000 | | | | 11,250,600 | |
Snowline Joint Unified School District, COP, Refunding, Refining Project (AGC), 5.75%, 9/01/38 | | | | | 2,250 | | | | 2,617,987 | |
Torrance Unified School District California, GO, Election of 2008, Measure Z, 6.00%, 8/01/33 | | | | | 4,000 | | | | 4,757,720 | |
Tustin Unified School District, GO, Election of 2008, Series B, 5.25%, 8/01/31 | | | | | 3,445 | | | | 3,907,870 | |
West Contra Costa California Unified School District, GO, Series A: | | | | | | | | | | |
Election of 2010 (AGM), 5.25%, 8/01/32 | | | | | 4,925 | | | | 5,627,453 | |
Election of 2012, 5.50%, 8/01/39 | | | | | 2,500 | | | | 2,827,500 | |
| | | | | | | | | 173,964,115 | |
Education — 3.3% | | | | | | | | | | |
California Educational Facilities Authority, Refunding RB, San Francisco University, 6.13%, 10/01/36 | | | | | 6,280 | | | | 7,470,437 | |
California Municipal Finance Authority, RB, Emerson College, 5.75%, 1/01/33 | | | | | 2,500 | | | | 2,840,100 | |
University of California, RB, Series O, 5.38%, 5/15/34 | | | | | 490 | | | | 562,392 | |
University of California, Refunding RB, Limited Project, Series G, 5.00%, 5/15/37 | | | | | 5,500 | | | | 6,050,055 | |
| | | | | | | | | 16,922,984 | |
Portfolio Abbreviations
ACA
AGC
AGM
AMBAC
AMT
ARB
BARB
BHAC
CAB
CIFG | | American Capital Access Corp.
Assured Guarantee Corp.
Assured Guaranty Municipal Corp.
American Municipal Bond Assurance Corp.
Alternative Minimum Tax (subject to)
Airport Revenue Bonds
Building Aid Revenue Bonds
Berkshire Hathaway Assurance Corp.
Capital Appreciation Bonds
CDC IXIS Financial Guaranty | | COP
EDA
EDC
ERB
FHA
GARB
GO
HDA
HFA
IDA | | Certificates of Participation
Economic Development Authority
Economic Development Corp.
Education Revenue Bonds
Federal Housing Administration
General Airport Revenue Bonds
General Obligation Bonds
Housing Development Authority
Housing Finance Agency
Industrial Development Authority | | IDB
ISD
LRB
M/F
MRB
NPFGC
PILOT
RB
S/F
SONYMA | | Industrial Development Board
Independent School District
Lease Revenue Bonds
Multi-Family
Mortgage Revenue Bonds
National Public Finance Guarantee Corp.
Payment in Lieu of Taxes
Revenue Bonds
Single-Family
State of New York Mortgage Agency |
See Notes to Financial Statements.
| 18 | ANNUAL REPORT | JULY 31, 2014
|
| |
| Schedule of Investments (continued) | BlackRock California Municipal Income Trust (BFZ)
(Percentages shown are based on Net Assets) |
| Municipal Bonds | | | | Par
(000) | | Value |
California (continued) |
Health — 17.5% | | | | | | | | | | |
ABAG Finance Authority for Nonprofit Corps., Refunding RB, Sharp Healthcare: | | | | | | | | | | |
6.38%, 8/01/14 (c) | | | | $ | 3,095 | | | $ | 3,095,000 | |
Series A, 6.00%, 8/01/30 | | | | | 2,300 | | | | 2,778,814 | |
Series B, 6.25%, 8/01/39 | | | | | 4,960 | | | | 5,730,734 | |
California Health Facilities Financing Authority, RB: | | | | | | | | | | |
Adventist Health System West, Series A, 5.75%, 9/01/39 | | | | | 6,700 | | | | 7,721,683 | |
Catholic Healthcare West, Series J, 5.63%, 7/01/32 | | | | | 9,750 | | | | 9,958,942 | |
Children’s Hospital, Series A, 5.25%, 11/01/41 | | | | | 9,165 | | | | 9,903,241 | |
St. Joseph Health System, Series A, 5.75%, 7/01/39 | | | | | 325 | | | | 376,188 | |
Sutter Health, Series A, 5.25%, 11/15/46 | | | | | 5,195 | | | | 5,502,752 | |
Sutter Health, Series B, 6.00%, 8/15/42 | | | | | 6,015 | | | | 7,199,353 | |
California Health Facilities Financing Authority, Refunding RB: | | | | | | | | | | |
Catholic Healthcare West, Series A, 6.00%, 7/01/29 | | | | | 1,000 | | | | 1,147,980 | |
Catholic Healthcare West, Series A, 6.00%, 7/01/34 | | | | | 4,470 | | | | 5,048,105 | |
Catholic Healthcare West, Series A, 6.00%, 7/01/39 | | | | | 5,550 | | | | 6,158,336 | |
Providence Health and Services, Series B, 5.00%, 10/01/44 (b) | | | | | 6,000 | | | | 6,644,880 | |
California Statewide Communities Development Authority, RB, Kaiser Permanente, Series B, 5.25%, 3/01/45 | | | | | 2,000 | | | | 2,061,180 | |
California Statewide Communities Development Authority, Refunding RB: | | | | | | | | | | |
Catholic Healthcare West, Series B, 5.50%, 7/01/30 | | | | | 2,920 | | | | 3,192,465 | |
Catholic Healthcare West, Series E, 5.50%, 7/01/31 | | | | | 5,065 | | | | 5,531,588 | |
Trinity Health Credit Group Composite Issue, 5.00%, 12/01/41 | | | | | 4,000 | | | | 4,288,640 | |
Washington Township Health Care District, GO, Series B, 5.50%, 8/01/38 | | | | | 1,625 | | | | 1,901,721 | |
| | | | | | | | | 88,241,602 | |
State — 12.7% | | | | | | | | | | |
State of California, GO, Various Purposes: | | | | | | | | | | |
6.00%, 3/01/33 | | | | | 2,000 | | | | 2,399,540 | |
6.50%, 4/01/33 | | | | | 1,250 | | | | 1,520,563 | |
6.00%, 4/01/38 | | | | | 12,670 | | | | 14,910,689 | |
State of California Public Works Board, RB: | | | | | | | | | | |
Correctional Facility Improvements, Series A, 5.00%, 9/01/39 | | | | | 17,055 | | | | 18,800,579 | |
Department of Corrections & Rehabilitation, Series F, 5.25%, 9/01/33 | | | | | 3,335 | | | | 3,813,573 | |
Department of Education, Riverside Campus Project, Series B, 6.50%, 4/01/34 | | | | | 9,000 | | | | 10,711,710 | |
Various Capital Projects, Series I, 5.50%, 11/01/33 | | | | | 4,940 | | | | 5,839,327 | |
Various Capital Projects, Sub-Series I-1, 6.38%, 11/01/34 | | | | | 5,025 | | | | 6,059,547 | |
| | | | | | | | | 64,055,528 | |
Transportation — 10.7% | | | | | | | | | | |
City & County of San Francisco California Airports Commission, ARB, Series E, 6.00%, 5/01/39 | | | | | 6,750 | | | | 8,001,247 | |
City & County of San Francisco California Airports Commission, Refunding ARB, 2nd Series A, AMT, 5.25%, 5/01/33 | | | | | 1,440 | | | | 1,594,109 | |
| Municipal Bonds | | | | Par
(000) | | Value |
California (continued) |
Transportation (concluded) | | | | | | | | | | |
City of Los Angeles California Department of Airports, Refunding ARB, Los Angeles International Airport: | | | | | | | | | | |
Senior Series A, 5.00%, 5/15/34 | | | | $ | 6,650 | | | $ | 7,494,218 | |
Senior Series A, 5.00%, 5/15/40 | | | | | 3,750 | | | | 4,106,925 | |
Sub-Series C, 5.25%, 5/15/38 | | | | | 1,950 | | | | 2,168,166 | |
City of San Jose California, Refunding ARB, Series A-1, AMT: | | | | | | | | | | |
5.75%, 3/01/34 | | | | | 2,870 | | | | 3,214,716 | |
6.25%, 3/01/34 | | | | | 2,650 | | | | 3,065,255 | |
County of Orange California, ARB, Series B, 5.75%, 7/01/34 | | | | | 8,000 | | | | 8,983,760 | |
County of Sacramento California, ARB: | | | | | | | | | | |
PFC/Grant, Sub-Series D, 6.00%, 7/01/35 | | | | | 3,000 | | | | 3,446,820 | |
Senior Series B, 5.75%, 7/01/39 | | | | | 1,850 | | | | 2,110,462 | |
Senior Series B, AMT (AGM), 5.25%, 7/01/33 | | | | | 3,015 | | | | 3,198,523 | |
Los Angeles Harbor Department, RB, Series B, 5.25%, 8/01/34 | | | | | 5,580 | | | | 6,384,524 | |
| | | | | | | | | 53,768,725 | |
Utilities — 27.9% | | | | | | | | | | |
Anaheim Public Financing Authority, RB, Electric System Distribution Facilities, Series A, 5.38%, 10/01/36 | | | | | 7,690 | | | | 8,815,431 | |
California Infrastructure & Economic Development Bank, RB, California Independent System Operator, Series A, 6.25%, 2/01/15 (c) | | | | | 4,500 | | | | 4,637,160 | |
Calleguas-Las Virgenes Public Financing Authority California, RB, Calleguas Municipal Water District Project, Series A (NPFGC), 5.13%, 7/01/16 (c) | | | | | 4,000 | | | | 4,366,960 | |
City of Chula Vista California, Refunding RB, San Diego Gas & Electric: | | | | | | | | | | |
Series B, 5.88%, 2/15/34 | | | | | 525 | | | | 605,031 | |
Series D, 5.88%, 1/01/34 | | | | | 6,555 | | | | 7,554,244 | |
City of Los Angeles California Department of Water & Power, Refunding RB, Series A, 5.25%, 7/01/39 | | | | | 4,000 | | | | 4,442,760 | |
City of Los Angeles California Wastewater System, Refunding RB, Series A, 5.00%, 6/01/39 | | | | | 2,000 | | | | 2,205,780 | |
City of Petaluma California Wastewater, Refunding RB, 6.00%, 5/01/36 | | | | | 5,625 | | | | 6,592,669 | |
City of San Francisco California Public Utilities Commission Water Revenue, RB, Series A: | | | | | | | | | | |
5.00%, 11/01/35 | | | | | 10,625 | | | | 11,827,325 | |
5.00%, 11/01/37 | | | | | 10,000 | | | | 11,084,500 | |
County of San Diego California Water Authority, COP, Refunding, Series A (AGM), 5.00%, 5/01/33 | | | | | 4,250 | | | | 4,709,467 | |
Cucamonga Valley Water District, Refunding RB, Series A (AGM), 5.25%, 9/01/31 | | | | | 4,270 | | | | 4,983,859 | |
Dublin-San Ramon Services District, Refunding RB, 6.00%, 8/01/41 | | | | | 2,425 | | | | 2,934,517 | |
East Bay California Municipal Utility District Water System Revenue, RB, Series A (NPFGC), 5.00%, 6/01/35 | | | | | 820 | | | | 845,510 | |
East Bay California Municipal Utility District Water System Revenue, Refunding RB, Series A, 5.00%, 6/01/36 | | | | | 6,615 | | | | 7,509,348 | |
El Dorado Irrigation District / El Dorado County Water Agency, Refunding RB, Series A (AGM), 5.25%, 3/01/39 | | | | | 10,000 | | | | 11,344,400 | |
Los Angeles Department of Water & Power, RB: | | | | | | | | | | |
Power System, Sub-Series A-1, 5.25%, 7/01/38 | | | | | 9,000 | | | | 10,098,450 | |
Series A, 5.38%, 7/01/34 | | | | | 3,250 | | | | 3,693,723 | |
Water Utility Improvement, Sub-Series A-2 (AGM), 5.00%, 7/01/35 | | | | | 2,000 | | | | 2,143,160 | |
Metropolitan Water District of Southern California, RB, Series A, 5.00%, 7/01/37 | | | | | 4,000 | | | | 4,376,440 | |
Sacramento County Sanitation Districts Financing Authority, Refunding RB, Series A, 5.00%, 12/01/44 | | | | | 6,000 | | | | 6,748,380 | |
See Notes to Financial Statements.
| ANNUAL REPORT | JULY 31, 2014 | 19
|
| |
| Schedule of Investments (continued) | BlackRock California Municipal Income Trust (BFZ)
(Percentages shown are based on Net Assets) |
| Municipal Bonds | | | | Par
(000) | | Value |
California (concluded) |
Utilities (concluded) | | | | | | | | | | |
San Diego Public Facilities Financing Authority Sewer, Refunding RB, Senior Series A, 5.25%, 5/15/34 | | | | $ | 11,020 | | | $ | 12,574,812 | |
State of California Department of Water Resources, Refunding RB, Central Valley Project, Series A-E, 5.00%, 12/01/29 | | | | | 6,000 | | | | 6,830,880 | |
| | | | | | | | | 140,924,806 | |
Total Municipal Bonds in California | | | | | | | | | 541,542,519 | |
| | | | | | | | | | |
Multi-State — 1.6% |
Housing — 1.6% | | | | | | | | | | |
Centerline Equity Issuer Trust (d)(e): | | | | | | | | | | |
Series A-4-1, 5.75%, 5/15/15 | | | | | 500 | | | | 517,275 | |
Series A-4-2, 6.00%, 5/15/19 | | | | | 1,000 | | | | 1,154,110 | |
Series B-2, 7.20%, 11/15/14 | | | | | 3,500 | | | | 3,552,780 | |
Series B-3-1, 6.00%, 5/15/15 | | | | | 1,500 | | | | 1,552,050 | |
Series B-3-2, 6.30%, 5/15/19 | | | | | 1,000 | | | | 1,166,030 | |
Total Municipal Bonds in Multi-State | | | | | | | | | 7,942,245 | |
Total Municipal Bonds — 108.9% | | | | | | | | | 549,484,764 | |
|
Municipal Bonds Transferred to
Tender Option Bond Trusts (f) |
California — 45.1% |
County/City/Special District/School District — 16.2% | | | | | | | | | | |
Los Angeles Community College District California, GO, Series A: | | | | | | | | | | |
Election of 2001 (AGM), 5.00%, 8/01/32 | | | | | 8,000 | | | | 8,843,280 | |
Election of 2008, Series C, 5.25%, 8/01/39 (g) | | | | | 12,900 | | | | 14,809,716 | |
Los Angeles Community College District California, GO, Refunding, Election of 2008, Series C, 6.00%, 8/01/33 | | | | | 20,131 | | | | 24,039,930 | |
Los Angeles Unified School District California, GO, Series I, 5.00%, 1/01/34 | | | | | 5,000 | | | | 5,612,650 | |
San Diego Community College District California, GO, Election of 2002, 5.25%, 8/01/33 | | | | | 10,484 | | | | 12,076,628 | |
San Jose Unified School District Santa Clara County California, GO, Election of 2002, Series D, 5.00%, 8/01/32 | | | | | 14,625 | | | | 16,383,888 | |
| | | | | | | | | 81,766,092 | |
Municipal Bonds Transferred to
Tender Option Bond Trusts (f) | | | | Par
(000) | | Value |
California (concluded) |
Education — 8.5% | | | | | | | | | | |
California Educational Facilities Authority, RB, University of Southern California, Series B, 5.25%,
10/01/39 (g) | | | | | $10,395 | | | $ | 11,726,599 | |
Grossmont Union High School District, GO, Election of 2004, 5.00%, 8/01/33 | | | | | 13,095 | | | | 13,994,704 | |
University of California, RB: | | | | | | | | | | |
Limited Project, Series D (AGM), 5.00%, 5/15/41 | | | | | 2,600 | | | | 2,800,018 | |
Series O, 5.75%, 5/15/34 | | | | | 12,300 | | | | 14,400,061 | |
| | | | | | | | | 42,921,382 | |
Utilities — 20.4% | | | | | | | | | | |
County of Orange California Sanitation District, COP, Series B (AGM), 5.00%, 2/01/37 | | | | | 14,700 | | | | 15,950,235 | |
County of Orange California Water District, COP, Refunding, 5.00%, 8/15/39 | | | | | 10,480 | | | | 11,753,530 | |
County of San Diego California Water Authority, COP, Refunding, Series A (AGM), 5.00%, 5/01/33 | | | | | 10,040 | | | | 11,125,424 | |
Eastern Municipal Water District, COP, Series H, 5.00%, 7/01/33 | | | | | 18,002 | | | | 20,132,388 | |
Los Angeles Department of Water & Power, RB, Power System, Sub-Series A-1 (AMBAC), 5.00%, 7/01/37 | | | | | 15,998 | | | | 17,488,904 | |
Metropolitan Water District of Southern California, RB, Series A, 5.00%, 7/01/37 | | | | | 11,180 | | | | 12,232,150 | |
San Diego Public Facilities Financing Authority Sewer, Refunding RB, Senior Series A, 5.25%, 5/15/39 | | | | | 12,457 | | | | 14,124,669 | |
| | | | | | | | | 102,807,300 | |
Total Municipal Bonds Transferred
to Tender Option Bond Trusts — 45.1% | | | | | | | | | 227,494,774 | |
Total Long-Term Investments
(Cost — $704,601,238) — 154.0% | | | | | | | | | 776,979,538 | |
|
Short-Term Securities | | | | | Shares | | | | | |
BIF California Municipal Money Fund, 0.00% (a)(h) | | | | | 540,673 | | | | 540,673 | |
| | | | | Par
(000) | | | | | |
California School Cash Reserve Program Authority, RB, Series G, 2.00%, 2/27/15 (a) | | | | $ | 1,665 | | | | 1,679,688 | |
Total Short-Term Securities
(Cost — $2,220,361) — 0.4% | | | | | | | | | 2,220,361 | |
Total Investments (Cost — $706,821,599) — 154.4% | | | | | | | | | 779,199,899 | |
Other Assets Less Liabilities — 0.7% | | | | | | | | | 3,353,460 | |
Liability for TOB Trust Certificates, Including Interest Expense and Fees Payable — (21.1%) | | | | | | | | | (106,722,227 | ) |
VMTP Shares, at Liquidation Value — (34.0%) | | | | | | | | | (171,300,000 | ) |
Net Assets Applicable to Common Shares — 100.0% | | | | | | | | $ | 504,531,132 | |
Notes to Schedule of Investments
| (a) | | | | Represents the current yield as of report date. |
| (b) | | | | When-issued security. Unsettled when-issued transactions were as follows: |
| Counterparty | | | | Value | | Unrealized
Appreciation/
(Depreciation) |
Merrill Lynch, Pierce, Fenner & Smith Inc. | | | | $ | 5,659,223 | | | $ | 101,189 | |
Morgan Stanley & Co. LLC | | | | | 985,657 | | | | (9,750 | ) |
RBC Capital Markets, LLC | | | | | 2,763,291 | | | | — | |
| (c) | | | | U.S. government securities, held in escrow, are used to pay interest on this security, as well as to retire the bond in full at the date indicated, typically at a premium to par. |
See Notes to Financial Statements.
| 20 | ANNUAL REPORT | JULY 31, 2014
|
| |
| Schedule of Investments (continued) | BlackRock California Municipal Income Trust (BFZ)
��
|
| (d) | | | | Security exempt from registration pursuant to Rule 144A under the Securities Act of 1933, as amended. These securities may be resold in transactions exempt from registration to qualified institutional investors. |
| (e) | | | | Represents a beneficial interest in a trust. The collateral deposited into the trust is federally tax-exempt revenue bonds issued by various state or local governments, or their respective agencies or authorities. The security is subject to remarketing prior to its stated maturity. |
| (f) | | | | Represent bonds transferred to a TOB. In exchange for which the Trust received cash and residual interest certificates. These bonds serve as collateral in a financing transaction. See Note 3 of the Notes to Financial Statements for details of municipal bonds transferred to TOBs. |
| (g) | | | | All or a portion of security is subject to a recourse agreement, which may require the Trust to pay the liquidity provider in the event there is a shortfall between the TOB trust certificates and proceeds received from the sale of the security contributed to the TOB trust. In the case of a shortfall, the aggregate maximum potential amount the Trust could ultimately be required to pay under the agreements, which expire from October 1, 2016 to August 1, 2018 is $14,008,480. |
| (h) | | | | Investments in issuers considered to be an affiliate of the Trust during the year ended July 31, 2014, for purposes of Section 2(a)(3) of the 1940 Act, were as follows: |
| Affiliate | | | | Shares Held at
July 31, 2013 | | Net
Activity | | Shares Held at
July 31, 2014 | | Income |
BIF California Municipal Money Fund | | | | 1,269,184 | | (728,511) | | 540,673 | | — |
| • | | | | Financial futures contracts outstanding as of July 31, 2014 were as follows: |
Contracts
Sold | | | | Issue | | Exchange | | Expiration | | Notional
Value | | Unrealized
Appreciation |
(319) | | | | 10-Year U.S. Treasury Note | | Chicago Board of Trade | | September 2014 | | $39,750,391 | | $76,811 |
| • | | | | For Trust compliance purposes, the Trust’s sector classifications refer to any one or more of the sector sub-classifications used by one or more widely recognized market indexes or rating group indexes, and/or as defined by the investment advisor. These definitions may not apply for purposes of this report, which may combine such sector sub-classifications for reporting ease. |
| • | | | | Fair Value Measurements – Various inputs are used in determining the fair value of investments and derivative financial instruments. These inputs to valuation techniques are categorized into a disclosure hierarchy consisting of three broad levels for financial statement purposes as follows: |
| | • | | | | Level 1 – unadjusted price quotations in active markets/exchanges for identical assets or liabilities that the Trust has the ability to access |
| | • | | | | Level 2 – other observable inputs (including, but not limited to, quoted prices for similar assets or liabilities in markets that are active, quoted prices for identical or similar assets or liabilities in markets that are not active, inputs other than quoted prices that are observable for the assets or liabilities (such as interest rates, yield curves, volatilities, prepayment speeds, loss severities, credit risks and default rates) or other market-corroborated inputs) |
| | • | | | | Level 3 – unobservable inputs based on the best information available in the circumstances, to the extent observable inputs are not available (including the Trust’s own assumptions used in determining the fair value of investments and derivative financial instruments) |
| | | | | The hierarchy gives the highest priority to unadjusted quoted prices in active markets for identical assets or liabilities (Level 1 measurements) and the lowest priority to unobservable inputs (Level 3 measurements). Accordingly, the degree of judgment exercised in determining fair value is greatest for instruments categorized in Level 3. The inputs used to measure fair value may fall into different levels of the fair value hierarchy. In such cases, for disclosure purposes, the fair value hierarchy classification is determined based on the lowest level input that is significant to the fair value measurement in its entirety. |
| | | | | Changes in valuation techniques may result in transfers into or out of an assigned level within the disclosure hierarchy. In accordance with the Trust’s policy, transfers between different levels of the fair value disclosure hierarchy are deemed to have occurred as of the beginning of the reporting period. The categorization of a value determined for investments and derivative financial instruments is based on the pricing transparency of the investment and derivative financial instrument and is not necessarily an indication of the risks associated with investing in those securities. For information about the Trust’s policy regarding valuation of investments and derivative financial instruments, please refer to Note 2 of the Notes to Financial Statements. |
| | | | | The following tables summarize the Trust’s investments and derivative financial instruments categorized in the disclosure hierarchy as of July 31, 2014: |
| | | | | Level 1 | | Level 2 | | Level 3 | | Total |
Assets:
| | | | | | | | | | | | | | | | | | |
Investments:
| | | | | | | | | | | | | | | | | | |
Long-Term Investments1 | | | | | — | | | $ | 776,979,538 | | | | — | | | $ | 776,979,538 | |
Short-Term Securities | | | | $ | 540,673 | | | | 1,679,688 | | | | — | | | | 2,220,361 | |
Total
| | | | $ | 540,673 | | | $ | 778,659,226 | | | | — | | | $ | 779,199,899 | |
| 1 | See above Schedule of Investments for values in each sector. |
| | | | | Level 1 | | Level 2 | | Level 3 | | Total |
Derivative Financial Instruments2
| | | | | | | | | | | | | | | | | | |
Assets:
| | | | | | | | | | | | | | | | | | |
Interest rate contracts | | | | $ | 76,811 | | | | — | | | | — | | | $ | 76,811 | |
| 2 | Derivative financial instruments are financial futures contracts, which are valued at the unrealized appreciation/depreciation on the instrument. |
See Notes to Financial Statements.
| ANNUAL REPORT | JULY 31, 2014 | 21
|
| |
| Schedule of Investments (concluded) | BlackRock California Municipal Income Trust (BFZ)
|
| | | | | The Trust may hold assets and/or liabilities in which the fair value approximates the carrying amount for financial statement purposes. As of July 31, 2014, such assets and/or liabilities are categorized within the disclosure hierarchy as follows: |
| | | | | Level 1 | | Level 2 | | Level 3 | | Total |
Assets:
| | | | | | | | | | | | | | | | | | |
Cash pledged for financial futures contracts | | | | $ | 436,000 | | | | — | | | | — | | | $ | 436,000 | |
Liabilities:
| | | | | | | | | | | | | | | | | | |
TOB trust certificates | | | | | — | | | $ | (106,697,554 | ) | | | — | | | | (106,697,554 | ) |
VMTP Shares | | | | | — | | | | (171,300,000 | ) | | | — | | | | (171,300,000 | ) |
Total
| | | | $ | 436,000 | | | $ | (277,997,554 | ) | | | — | | | $ | (277,561,554 | ) |
| | | | | There were no transfers between levels during the year ended July 31, 2014. |
See Notes to Financial Statements.
| 22 | ANNUAL REPORT | JULY 31, 2014
|
| |
| Schedule of Investments July 31, 2014 | BlackRock Florida Municipal 2020 Term Trust (BFO)
(Percentages shown are based on Net Assets) |
| Municipal Bonds | | | | Par
(000) | | Value |
Florida — 98.9% |
Corporate — 4.1% | | | | | | | | | | |
County of Hillsborough Florida IDA, Refunding RB, Tampa Electric Co. Project, Series A, 5.65%, 5/15/18 | | | | $ | 1,000 | | | $ | 1,151,820 | |
County of Palm Beach Florida Solid Waste Authority, Refunding RB, 5.00%, 10/01/20 | | | | | 2,000 | | | | 2,365,500 | |
| | | | | | | | | 3,517,320 | |
County/City/Special District/School District — 31.6% | | | | | | | | | | |
City of Jacksonville Florida, Refunding RB, Better Jacksonville Sales Tax, 5.00%, 10/01/20 | | | | | 4,000 | | | | 4,736,120 | |
County of Broward Florida School Board, COP, Refunding, Series A, 5.00%, 7/01/20 | | | | | 2,000 | | | | 2,325,960 | |
County of Broward Florida School Board, COP, Series A (AGM), 5.25%, 7/01/22 | | | | | 2,500 | | | | 2,841,400 | |
County of Hillsborough Florida, RB, (AMBAC), 5.00%, 11/01/20 | | | | | 5,545 | | | | 6,214,337 | |
County of Miami-Dade Florida School Board, COP, Refunding, Series B (AGC), 5.25%, 5/01/21 | | | | | 4,000 | | | | 4,538,560 | |
County of Northern Palm Beach Florida Improvement District, Refunding, Special Assessment Bonds, Water Control & Improvement District No. 43, Series B (ACA), 4.50%, 8/01/22 | | | | | 1,000 | | | | 1,008,370 | |
Florida State Board of Education, GO, Refunding, Capital Outlay, Series B, 5.00%, 6/01/20 | | | | | 485 | | | | 573,930 | |
Sterling Hill Community Development District, Refunding, Special Assessment Bonds, Series A, 6.10%, 5/01/23 | | | | | 3,015 | | | | 2,304,214 | |
Stevens Plantation Florida Imports Project Dependent Special District, RB, 6.38%, 12/31/49 (a)(b) | | | | | 2,425 | | | | 1,809,195 | |
Watergrass Community Development District Florida, Special Assessment Bonds, Series B, 5.13%, 11/01/14 | | | | | 800 | | | | 771,072 | |
| | | | | | | | | 27,123,158 | |
Education — 2.9% | | | | | | | | | | |
County of Orange Florida Educational Facilities Authority, RB, Rollins College Project (AMBAC), 5.25%, 12/01/22 | | | | | 725 | | | | 821,410 | |
Florida State Board of Governors, Refunding RB, University of Central Florida, Series A, 5.00%, 7/01/18 | | | | | 500 | | | | 568,980 | |
Florida State Higher Educational Facilities Financial Authority, Refunding RB, University of Tampa Project, Series A, 5.00%, 4/01/20 | | | | | 1,000 | | | | 1,123,990 | |
| | | | | | | | | 2,514,380 | |
Health — 15.7% | | | | | | | | | | |
County of Highlands Florida Health Facilities Authority, Refunding RB, Hospital, Adventist Health, Series I, 5.00%, 11/15/20 | | | | | 2,155 | | | | 2,517,665 | |
County of Hillsborough Florida IDA, RB, H. Lee Moffitt Cancer Center Project, Series A, 5.25%, 7/01/22 | | | | | 1,500 | | | | 1,610,940 | |
County of Marion Florida Hospital District, Refunding RB, Health System, Munroe Regional, 5.00%, 10/01/17 (c) | | | | | 1,500 | | | | 1,703,400 | |
County of Orange Florida Health Facilities Authority, Refunding RB, Mayflower Retirement Center: | | | | | | | | | | |
3.00%, 6/01/15 | | | | | 200 | | | | 203,046 | |
3.00%, 6/01/16 | | | | | 140 | | | | 142,925 | |
3.00%, 6/01/17 | | | | | 190 | | | | 196,747 | |
3.25%, 6/01/18 | | | | | 195 | | | | 203,580 | |
3.50%, 6/01/19 | | | | | 200 | | | | 209,326 | |
County of Palm Beach Florida Health Facilities Authority, Refunding RB: | | | | | | | | | | |
Acts Retirement-Life Communities, Inc., 5.00%, 11/15/22 | | | | | 4,735 | | | | 5,209,447 | |
| Municipal Bonds | | | | Par
(000) | | Value |
Florida (concluded) |
Health (concluded) | | | | | | | | | | |
County of Palm Beach Florida Health Facilities Authority, Refunding RB (concluded): | | | | | | | | | | |
Bethesda Healthcare System Project, Series A (AGM), 5.00%, 7/01/20 | | | | $ | 1,285 | | | $ | 1,490,150 | |
| | | | | | | | | 13,487,226 | |
Housing — 0.9% | | | | | | | | | | |
County of Manatee Florida Housing Finance Authority, RB, S/F Housing, Series A, AMT (Ginnie Mae, Fannie Mae & Freddie Mac), 5.90%, 9/01/40 | | | | | 220 | | | | 224,365 | |
Florida Housing Finance Corp., RB, Homeowner Mortgage, Series 2, AMT (Ginnie Mae, Fannie Mae & Freddie Mac), 4.70%, 7/01/22 | | | | | 445 | | | | 457,081 | |
Jacksonville Housing Finance Authority, Refunding RB, Series A-1, AMT (Ginnie Mae, Fannie Mae & Freddie Mac), 5.63%, 10/01/39 | | | | | 130 | | | | 131,222 | |
| | | | | | | | | 812,668 | |
State — 13.8% | | | | | | | | | | |
Florida Municipal Loan Council, RB, Series D (AGM): | | | | | | | | | | |
5.00%, 10/01/19 | | | | | 1,050 | | | | 1,212,771 | |
4.00%, 10/01/20 | | | | | 1,105 | | | | 1,215,390 | |
4.00%, 10/01/21 | | | | | 500 | | | | 545,830 | |
Florida Municipal Loan Council, Refunding RB: | | | | | | | | | | |
CAB, Series A (NPFGC), 0.00%, 4/01/20 (d) | | | | | 4,000 | | | | 3,380,840 | |
Series B-2 (AGM), 4.00%, 10/01/20 | | | | | 655 | | | | 716,190 | |
State of Florida Board of Education, GO, Refunding, Capital Outlay, Series B, 5.00%, 6/01/20 | | | | | 1,000 | | | | 1,189,750 | |
State of Florida Department of Environmental Protection, Refunding RB, Series A, 5.00%, 7/01/20 | | | | | 3,000 | | | | 3,536,520 | |
| | | | | | | | | 11,797,291 | |
Transportation — 20.5% | | | | | | | | | | |
County of Broward Florida, Refunding ARB, Series P-1, AMT, 5.00%, 10/01/20 | | | | | 2,500 | | | | 2,925,475 | |
County of Broward Florida Fuel System, RB, Lauderdale Fuel Facilities, Series A (AGM), AMT, 5.00%, 4/01/20 | | | | | 160 | | | | 180,219 | |
County of Broward Florida Port Facilities, Refunding RB, Series B, AMT, 5.00%, 9/01/20 | | | | | 2,500 | | | | 2,897,950 | |
County of Lee Florida Transportation Facilities, Refunding RB, Series B (AMBAC): | | | | | | | | | | |
5.00%, 10/01/20 | | | | | 2,250 | | | | 2,265,638 | |
5.00%, 10/01/22 | | | | | 3,000 | | | | 3,019,800 | |
County of Miami-Dade Florida, Refunding RB, Series A, AMT, 5.00%, 10/01/20 | | | | | 1,375 | | | | 1,604,240 | |
County of Miami-Dade Florida Expressway Authority, Refunding RB, Toll System, Series A, 5.00%, 7/01/20 | | | | | 1,500 | | | | 1,763,190 | |
County of Miami-Dade Florida Transit System Sales Surtax, Refunding RB, 5.00%, 7/01/20 | | | | | 550 | | | | 647,686 | |
Greater Orlando Aviation Authority, Refunding RB, Series C, 5.00%, 10/01/20 | | | | | 1,130 | | | | 1,335,061 | |
Jacksonville Florida Port Authority, Refunding RB, AMT, 4.00%, 11/01/20 | | | | | 865 | | | | 922,626 | |
| | | | | | | | | 17,561,885 | |
Utilities — 9.4% | | | | | | | | | | |
City of North Miami Florida Beach Water Revenue, RB, 5.00%, 8/01/20 | | | | | 1,200 | | | | 1,392,408 | |
County of Miami-Dade Florida Water & Sewer System, Refunding RB, Series B (AGM), 5.25%, 10/01/19 | | | | | 4,000 | | | | 4,731,960 | |
Florida Governmental Utility Authority, RB, Golden Gate Utility System (AGM), 5.00%, 7/01/19 | | | | | 510 | | | | 581,813 | |
Florida Governmental Utility Authority, Refunding RB, Lehigh Utility (AGM), 5.00%, 10/01/20 | | | | | 635 | | | | 731,151 | |
Town of Davie Florida, Refunding RB, Nova Southeastern University Project, Series B, 5.00%, 4/01/20 | | | | | 530 | | | | 598,471 | |
| | | | | | | | | 8,035,803 | |
Total Municipal Bonds in Florida | | | | | | | | | 84,849,731 | |
See Notes to Financial Statements.
| ANNUAL REPORT | JULY 31, 2014 | 23
|
| |
| Schedule of Investments (continued) | BlackRock Florida Municipal 2020 Term Trust (BFO)
(Percentages shown are based on Net Assets) |
| Municipal Bonds | | | | Par
(000) | | Value |
Guam — 0.6% |
Utilities — 0.6% | | | | | | | | | | |
Guam Government Waterworks Authority, RB, 5.25%, 7/01/20 | | | | $ | 100 | | | $ | 114,475 | |
Guam Power Authority, Refunding RB, Series A (AGM), 5.00%, 10/01/20 | | | | | 310 | | | | 359,740 | |
Total Municipal Bonds in Guam | | | | | | | | | 474,215 | |
Total Municipal Bonds — 99.5% | | | | | | | | | 85,323,946 | |
|
Municipal Bonds Transferred to
Tender Option Bond Trusts (e) |
Florida — 0.3% |
Housing — 0.3% | | | | | | | | | | |
County of Lee Florida Housing Finance Authority, RB, S/F Housing, Multi-County Program, Series A-2, AMT (Ginnie Mae), 6.00%, 9/01/40 | | | | | 285 | | | | 294,758 | |
Total Long-Term Investments
(Cost — $81,817,798) — 99.8% | | | | | | | | | 85,618,704 | |
Short-Term Securities | | | | Shares | | Value |
FFI Institutional Tax-Exempt Fund, 0.03% (f)(g) | | | | | 123,907 | | | $ | 123,907 | |
Total Short-Term Securities
(Cost — $123,907) — 0.2% | | | | | | | | | 123,907 | |
Total Investments (Cost — $81,941,705) — 100.0% | | | | | | | | | 85,742,611 | |
Other Assets Less Liabilities — 0.9% | | | | | | | | | 820,927 | |
Liability for TOB Trust Certificates, Including Interest Expense and Fees Payable — (0.2%) | | | | | | | | | (190,095 | ) |
AMPS, at Redemption Value — (0.7%) | | | | | | | | | (625,000 | ) |
Net Assets Applicable to Common Shares — 100.0% | | | | | | | | $ | 85,748,443 | |
Notes to Schedule of Investments
| (a) | | | | Non-income producing security. |
| (b) | | | | Issuer filed for bankruptcy and/or is in default of principal and/or interest payments. |
| (c) | | | | U.S. government securities, held in escrow, are used to pay interest on this security, as well as to retire the bond in full at the date indicated, typically at a premium to par. |
| (d) | | | | Zero-coupon bond. |
| (e) | | | | Represent bonds transferred to a TOB. In exchange for which the Trust received cash and residual interest certificates. These bonds serve as collateral in a financing transaction. See Note 3 of the Notes to Financial Statements for details of municipal bonds transferred to TOBs. |
| (f) | | | | Investments in issuers considered to be an affiliate of the Trust during the year ended July 31, 2014, for purposes of Section 2(a)(3) of the 1940 Act, were as follows: |
| Affiliate | | | | Shares Held at
July 31, 2013 | | Net
Activity | | Shares Held at
July 31, 2014 | | Income |
FFI Institutional Tax-Exempt Fund | | | | 2,293,772 | | (2,169,865) | | 123,907 | | $857 |
| (g) | | | | Represents the current yield as of report date. |
| • | | | | For Trust compliance purposes, the Trust’s sector classifications refer to any one or more of the sector sub-classifications used by one or more widely recognized market indexes or rating group indexes, and/or as defined by the investment advisor. These definitions may not apply for purposes of this report, which may combine such sector sub-classifications for reporting ease. |
| • | | | | Fair Value Measurements – Various inputs are used in determining the fair value of investments. These inputs to valuation techniques are categorized into a disclosure hierarchy consisting of three broad levels for financial statement purposes as follows: |
| • | | | | Level 1 – unadjusted price quotations in active markets/exchanges for identical assets or liabilities that the Trust has the ability to access |
| • | | | | Level 2 – other observable inputs (including, but not limited to, quoted prices for similar assets or liabilities in markets that are active, quoted prices for identical or similar assets or liabilities in markets that are not active, inputs other than quoted prices that are observable for the assets or liabilities (such as interest rates, yield curves, volatilities, prepayment speeds, loss severities, credit risks and default rates) or other market-corroborated inputs) |
| • | | | | Level 3 – unobservable inputs based on the best information available in the circumstances, to the extent observable inputs are not available (including the Trust’s own assumptions used in determining the fair value of investments) |
| | | | | The hierarchy gives the highest priority to unadjusted quoted prices in active markets for identical assets or liabilities (Level 1 measurements) and the lowest priority to unobservable inputs (Level 3 measurements). Accordingly, the degree of judgment exercised in determining fair value is greatest for instruments categorized in Level 3. The inputs used to measure fair value may fall into different levels of the fair value hierarchy. In such cases, for disclosure purposes, the fair value hierarchy classification is determined based on the lowest level input that is significant to the fair value measurement in its entirety. |
See Notes to Financial Statements.
| 24 | ANNUAL REPORT | JULY 31, 2014
|
| |
| Schedule of Investments (concluded) | BlackRock Florida Municipal 2020 Term Trust (BFO)
|
| | | | | Changes in valuation techniques may result in transfers into or out of an assigned level within the disclosure hierarchy. In accordance with the Trust’s policy, transfers between different levels of the fair value disclosure hierarchy are deemed to have occurred as of the beginning of the reporting period. The categorization of a value determined for investments is based on the pricing transparency of the investment and is not necessarily an indication of the risks associated with investing in those securities. For information about the Trust’s policy regarding valuation of investments, please refer to Note 2 of the Notes to Financial Statements. |
| | | | | The following table summarizes the Trust’s investments categorized in the disclosure hierarchy as of July 31, 2014: |
| | | | | Level 1 | | Level 2 | | Level 3 | | Total |
Assets:
| | | | | | | | | | | | | | | | | | |
Investments:
| | | | | | | | | | | | | | | | | | |
Long-Term Investments1 | | | | | — | | | $ | 85,618,704 | | | | — | | | $ | 85,618,704 | |
Short-Term Securities | | | | $ | 123,907 | | | | — | | | | — | | | | 123,907 | |
Total
|
| | | $ | 123,907 | | | $ | 85,618,704 | | | | — | | | $ | 85,742,611 | | | 1 | See above Schedule of Investments for values in each sector. |
| | | | | The Trust may hold liabilities in which the fair value approximates the carrying amount for financial statement purposes. As of July 31, 2014, TOB trust certificates of $190,000 is categorized as Level 2 within the disclosure hierarchy. |
| | | | | There were no transfers between levels during the year ended July 31, 2014. |
See Notes to Financial Statements.
| ANNUAL REPORT | JULY 31, 2014 | 25
|
| |
| Schedule of Investments July 31, 2014 | BlackRock Municipal Income Investment Trust (BBF)
(Percentages shown are based on Net Assets) |
| Municipal Bonds | | | | Par
(000) | | Value |
Alabama — 0.3% | | | | | | | | | | |
City of Selma Alabama IDB, RB, Gulf Opportunity Zone, International Paper Co. Project, Series A, 5.38%, 12/01/35 | | | | $ | 275 | | | $ | 300,548 | |
Alaska — 0.2% | | | | | | | | | | |
Northern Tobacco Securitization Corp., Refunding RB, Tobacco Settlement, Asset-Backed, Series A, 5.00%, 6/01/46 | | | | | 330 | | | | 244,880 | |
California — 15.0% | | | | | | | | | | |
California Educational Facilities Authority, RB, University of Southern California, Series A, 5.25%, 10/01/38 | | | | | 1,315 | | | | 1,483,452 | |
California Health Facilities Financing Authority, Refunding RB, Catholic Healthcare West, Series A, 6.00%, 7/01/39 | | | | | 890 | | | | 987,553 | |
Kern Community College District, GO, Safety, Repair & Improvement, Election of 2002, Series C, 5.50%, 11/01/33 | | | | | 775 | | | | 914,663 | |
Los Angeles Department of Water & Power, RB, Power System, Sub-Series A-1, 5.25%, 7/01/38 | | | | | 1,750 | | | | 1,963,587 | |
San Diego Regional Building Authority, RB, County Operations Center & Annex, Series A, 5.38%, 2/01/36 | | | | | 1,600 | | | | 1,825,344 | |
State of California, GO, Various Purposes, 6.00%, 3/01/33 | | | | | 1,275 | | | | 1,529,707 | |
State of California Public Works Board, RB: | | | | | | | | | | |
Department of Corrections & Rehabilitation, Series F, 5.25%, 9/01/33 | | | | | 400 | | | | 457,400 | |
Various Capital Projects, Series I, 5.50%, 11/01/31 | | | | | 1,600 | | | | 1,889,888 | |
Various Capital Projects, Series I, 5.50%, 11/01/33 | | | | | 1,500 | | | | 1,773,075 | |
Township of Washington California Health Care District, GO, Election of 2004, Series B, 5.50%, 8/01/40 | | | | | 300 | | | | 349,431 | |
University of California, Refunding RB, Medical Center Regents, Series J, 5.25%, 5/15/38 | | | | | 1,780 | | | | 2,016,704 | |
| | | | | | | | | 15,190,804 | |
Colorado — 2.3% | | | | | | | | | | |
City & County of Denver Colorado Airport System, ARB, Sub-System, Series B, 5.25%, 11/15/32 | | | | | 1,000 | | | | 1,118,350 | |
Colorado Health Facilities Authority, Refunding RB, Catholic Health Initiative, Series A, 5.50%, 7/01/34 | | | | | 1,095 | | | | 1,247,172 | |
| | | | | | | | | 2,365,522 | |
Florida — 6.0% | | | | | | | | | | |
City of Jacksonville Florida, Refunding RB, Series A, 5.25%, 10/01/33 | | | | | 265 | | | | 297,547 | |
County of Miami-Dade Florida, RB, Seaport, Series A, 6.00%, 10/01/38 | | | | | 3,800 | | | | 4,356,206 | |
Reedy Creek Improvement District, GO, Series A, 5.25%, 6/01/32 | | | | �� | 570 | | | | 639,221 | |
Watergrass Community Development District Florida, Special Assessment Bonds, Series B, 5.13%, 11/01/14 | | | | | 800 | | | | 771,072 | |
| | | | | | | | | 6,064,046 | |
Georgia — 1.8% | | | | | | | | | | |
Municipal Electric Authority of Georgia, Refunding RB, Project One, Sub-Series D, 6.00%, 1/01/23 | | | | | 1,565 | | | | 1,845,902 | |
Illinois — 22.8% | | | | | | | | | | |
City of Chicago Illinois, GARB, O’Hare International Airport, 3rd Lien, Series C, 6.50%, 1/01/41 | | | | | 2,955 | | | | 3,535,362 | |
City of Chicago Illinois, Refunding RB, Series A: | | | | | | | | | | |
Sales Tax, 5.25%, 1/01/38 | | | | | 500 | | | | 535,445 | |
Waterworks, 2nd Lien (AMBAC), 5.00%, 11/01/36 | | | | | 1,000 | | | | 1,031,250 | |
City of Chicago Illinois Transit Authority, RB: | | | | | | | | | | |
5.25%, 12/01/31 | | | | | 1,060 | | | | 1,165,343 | |
Sales Tax Receipts, 5.25%, 12/01/36 | | | | | 1,000 | | | | 1,087,990 | |
Sales Tax Receipts, 5.25%, 12/01/40 | | | | | 1,000 | | | | 1,083,340 | |
| Municipal Bonds | | | | Par
(000) | | Value |
Illinois (concluded) | | | | | | | | | | |
City of Chicago Illinois Transit Authority, RB (concluded): | | | | | | | | | | |
Sales Tax Receipts, 5.00%, 12/01/44 | | | | $ | 600 | | | $ | 641,430 | |
County of Cook Illinois Community College District No. 508, GO, City College of Chicago: | | | | | | | | | | |
5.50%, 12/01/38 | | | | | 1,000 | | | | 1,117,480 | |
5.25%, 12/01/43 | | | | | 3,500 | | | | 3,781,155 | |
Illinois Finance Authority, RB: | | | | | | | | | | |
Carle Foundation, Series A, 6.00%, 8/15/41 | | | | | 1,000 | | | | 1,134,080 | |
Rush University Medical Center, Series B, 7.25%, 11/01/30 | | | | | 1,600 | | | | 1,909,536 | |
Illinois Finance Authority, Refunding RB, Northwestern Memorial Hospital, Series A, 6.00%, 8/15/39 | | | | | 1,900 | | | | 2,193,512 | |
Railsplitter Tobacco Settlement Authority, RB: | | | | | | | | | | |
5.50%, 6/01/23 | | | | | 690 | | | | 802,677 | |
6.00%, 6/01/28 | | | | | 195 | | | | 226,964 | |
State of Illinois, GO: | | | | | | | | | | |
5.25%, 2/01/31 | | | | | 475 | | | | 500,042 | |
5.25%, 2/01/32 | | | | | 1,000 | | | | 1,047,220 | |
5.50%, 7/01/33 | | | | | 1,000 | | | | 1,068,200 | |
5.50%, 7/01/38 | | | | | 210 | | | | 222,428 | |
| | | | | | | | | 23,083,454 | |
Indiana — 2.5% | | | | | | | | | | |
Indiana Municipal Power Agency, RB, Series B, 6.00%, 1/01/39 | | | | | 2,210 | | | | 2,496,924 | |
Kansas — 1.8% | | | | | | | | | | |
Kansas Development Finance Authority, Refunding RB, Adventist Health System/Sunbelt Obligated Group, Series C, 5.50%, 11/15/29 | | | | | 1,600 | | | | 1,802,544 | |
Kentucky — 0.6% | | | | | | | | | | |
County of Louisville & Jefferson Kentucky Metropolitan Government Parking Authority, RB, Series A, 5.75%, 12/01/34 | | | | | 500 | | | | 591,055 | |
Louisiana — 1.5% | | | | | | | | | | |
Louisiana Local Government Environmental Facilities & Community Development Authority, RB, Westlake Chemical Corp. Project, Series A-1, 6.50%, 11/01/35 | | | | | 715 | | | | 820,806 | |
Tobacco Settlement Financing Corp., Refunding RB, Asset-Backed, Series A, 5.50%, 5/15/29 | | | | | 600 | | | | 656,328 | |
| | | | | | | | | 1,477,134 | |
Maine — 1.5% | | | | | | | | | | |
Maine Health & Higher Educational Facilities Authority, RB, Maine General Medical Center, 7.50%, 7/01/32 | | | | | 1,270 | | | | 1,466,494 | |
Massachusetts — 1.1% | | | | | | | | | | |
Massachusetts Health & Educational Facilities Authority, RB, Tufts University, Series O, 5.38%, 8/15/38 | | | | | 1,000 | | | | 1,132,780 | |
Michigan — 3.5% | | | | | | | | | | |
City of Lansing Michigan, RB, Board of Water & Light Utilities System, Series A, 5.50%, 7/01/41 | | | | | 915 | | | | 1,062,480 | |
Michigan State Building Authority, Refunding RB, Facilities Program, Series I, 6.00%, 10/15/38 | | | | | 1,000 | | | | 1,147,790 | |
Royal Oak Hospital Finance Authority Michigan, Refunding RB, William Beaumont Hospital, Series V, 8.25%, 9/01/18 (a) | | | | | 995 | | | | 1,283,341 | |
| | | | | | | | | 3,493,611 | |
Mississippi — 2.4% | | | | | | | | | | |
Mississippi Development Bank, RB, Jackson Water & Sewer System Project (AGM), 6.88%, 12/01/40 | | | | | 1,000 | | | | 1,300,080 | |
Mississippi State University Educational Building Corp., Refunding RB, Mississippi State University Improvement Project, 5.25%, 8/01/38 | | | | | 1,000 | | | | 1,133,280 | |
| | | | | | | | | 2,433,360 | |
Nevada — 5.0% | | | | | | | | | | |
City of Las Vegas Nevada, GO, Limited Tax, Performing Arts Center, 6.00%, 4/01/34 | | | | | 1,600 | | | | 1,858,192 | |
See Notes to Financial Statements.
| 26 | ANNUAL REPORT | JULY 31, 2014
|
| |
| Schedule of Investments (continued) | BlackRock Municipal Income Investment Trust (BBF)
(Percentages shown are based on Net Assets) |
| Municipal Bonds | | | | Par
(000) | | Value |
Nevada (concluded) | | | | | | | | | | |
County of Clark Nevada, GO, Limited Tax, 5.00%, 6/01/38 | | | | $ | 1,000 | | | $ | 1,081,780 | |
County of Clark Nevada Airport System, ARB, Series B, 5.75%, 7/01/42 | | | | | 1,825 | | | | 2,114,883 | |
| | | | | | | | | 5,054,855 | |
New Jersey — 4.3% | | | | | | | | | | |
New Jersey Housing & Mortgage Finance Agency, RB, S/F Housing, Series CC, 5.25%, 10/01/29 | | | | | 1,140 | | | | 1,216,049 | |
New Jersey Transportation Trust Fund Authority, RB, Transportation System: | | | | | | | | | | |
Series A, 5.88%, 12/15/38 | | | | | 1,295 | | | | 1,504,971 | |
Series AA, 5.50%, 6/15/39 | | | | | 1,485 | | | | 1,641,742 | |
| | | | | | | | | 4,362,762 | |
New York — 5.8% | | | | | | | | | | |
Hudson Yards Infrastructure Corp., RB, Senior, Fiscal 2012, Series A, 5.75%, 2/15/47 | | | | | 1,000 | | | | 1,137,630 | |
New York Liberty Development Corp., Refunding RB, 2nd Priority, Bank of America Tower at One Bryant Park Project, Class 3, 6.38%, 7/15/49 | | | | | 980 | | | | 1,078,931 | |
State of New York Dormitory Authority, ERB, Series B, 5.25%, 3/15/38 | | | | | 3,250 | | | | 3,679,618 | |
| | | | | | | | | 5,896,179 | |
Ohio — 3.5% | | | | | | | | | | |
County of Allen Ohio Hospital Facilities, Refunding RB, Catholic Healthcare Partners, Series A, 5.25%, 6/01/38 | | | | | 1,565 | | | | 1,683,502 | |
State of Ohio Turnpike Commission, RB, Junior Lien, Infrastructure Projects, Series A-1: | | | | | | | | | | |
5.25%, 2/15/30 | | | | | 790 | | | | 894,391 | |
5.25%, 2/15/31 | | | | | 885 | | | | 996,359 | |
| | | | | | | | | 3,574,252 | |
Pennsylvania — 5.0% | | | | | | | | | | |
Pennsylvania Economic Development Financing Authority, RB, American Water Co. Project, 6.20%, 4/01/39 | | | | | 500 | | | | 573,165 | |
Pennsylvania Turnpike Commission, RB, Sub-Series A: | | | | | | | | | | |
5.63%, 12/01/31 | | | | | 1,250 | | | | 1,392,150 | |
6.00%, 12/01/41 | | | | | 1,500 | | | | 1,634,625 | |
State of Pennsylvania Turnpike Commission, RB, Series A, 5.00%, 12/01/44 | | | | | 360 | | | | 394,358 | |
Township of Bristol Pennsylvania School District, GO, 5.25%, 6/01/37 | | | | | 1,000 | | | | 1,107,100 | |
| | | | | | | | | 5,101,398 | |
South Carolina — 1.4% | | | | | | | | | | |
County of Charleston South Carolina, RB, Special Source, 5.25%, 12/01/38 | | | | | 1,190 | | | | 1,368,857 | |
Texas — 12.5% | | | | | | | | | | |
Central Texas Regional Mobility Authority, Refunding RB, Senior Lien, 6.00%, 1/01/41 | | | | | 1,670 | | | | 1,860,814 | |
City of Beaumont Texas, GO, Certificates of Obligation, 5.25%, 3/01/37 | | | | | 745 | | | | 846,834 | |
Conroe Texas ISD, GO, School Building, Series A, 5.75%, 2/15/35 | | | | | 890 | | | | 1,017,697 | |
County of Tarrant Texas Cultural Education Facilities Finance Corp., RB, Scott & White Healthcare, 6.00%, 8/15/45 | | | | | 1,905 | | | | 2,278,913 | |
Lower Colorado River Authority, Refunding RB: | | | | | | | | | | |
5.50%, 5/15/19 (a) | | | | | 90 | | | | 107,231 | |
5.50%, 5/15/33 | | | | | 1,910 | | | | 2,097,295 | |
North Texas Tollway Authority, RB, Special Projects, Series A, 5.50%, 9/01/41 | | | | | 1,000 | | | | 1,137,920 | |
North Texas Tollway Authority, Refunding RB, 1st Tier System, Series K-1 (AGC), 5.75%, 1/01/38 | | | | | 1,000 | | | | 1,139,120 | |
Red River Education Financing Corp., RB, Texas Christian University Project, 5.25%, 3/15/38 | | | | | 340 | | | | 385,567 | |
| Municipal Bonds | | | | Par
(000) | | Value |
Texas (concluded) | | | | | | | | | | |
Texas Private Activity Bond Surface Transportation Corp., RB, Senior Lien, NTE Mobility Partners LLC, North Tarrant Express Managed Lanes Project, 6.88%, 12/31/39 | | | | $ | 1,505 | | | $ | 1,766,735 | |
| | | | | | | | | 12,638,126 | |
Virginia — 1.5% | | | | | | | | | | |
City of Lexington Virginia IDA, RB, Washington & Lee University, 5.00%, 1/01/43 | | | | | 280 | | | | 308,372 | |
Virginia Public School Authority, RB, Fluvanna County School Financing, 6.50%, 12/01/18 (a) | | | | | 1,000 | | | | 1,233,120 | |
| | | | | | | | | 1,541,492 | |
Wisconsin — 1.8% | | | | | | | | | | |
Wisconsin Health & Educational Facilities Authority, Refunding RB, Froedtert & Community Health, Inc., Series C, 5.25%, 4/01/39 | | | | | 1,675 | | | | 1,785,986 | |
Total Municipal Bonds — 104.1% | | | | | | | | | 105,312,965 | |
|
Municipal Bonds Transferred to
Tender Option Bond Trusts (b) |
California — 19.4% | | | | | | | | | | |
California Educational Facilities Authority, RB, University of Southern California, Series B, 5.25%, 10/01/39 (c) | | | | | 1,995 | | | | 2,250,560 | |
Grossmont Union High School District, GO, Election of 2008, Series B, 5.00%, 8/01/40 | | | | | 2,400 | | | | 2,596,008 | |
Los Angeles Community College District California, GO, Election of 2008, Series C, 5.25%, 8/01/39 (c) | | | | | 2,630 | | | | 3,019,345 | |
Los Angeles Community College District California, GO, Refunding, Election of 2008, Series A, 6.00%, 8/01/33 | | | | | 3,898 | | | | 4,655,200 | |
Los Angeles Unified School District California, GO, Series I, 5.00%, 1/01/34 | | | | | 400 | | | | 449,012 | |
San Diego Public Facilities Financing Authority Water, RB, Series B, 5.50%, 8/01/39 | | | | | 4,214 | | | | 4,894,642 | |
University of California, RB, Series O, 5.75%, 5/15/34 | | | | | 1,500 | | | | 1,756,105 | |
| | | | | | | | | 19,620,872 | |
District of Columbia — 3.6% | | | | | | | | | | |
District of Columbia, RB, Series A, 5.50%, 12/01/30 (c) | | | | | 1,395 | | | | 1,639,632 | |
District of Columbia Water & Sewer Authority, Refunding RB, Senior Lien, Series A, 5.50%, 10/01/39 | | | | | 1,799 | | | | 2,027,813 | |
| | | | | | | | | 3,667,445 | |
Illinois — 3.2% | | | | | | | | | | |
State of Illinois Finance Authority, RB, University of Chicago, Series B, 6.25%, 7/01/18 (a) | | | | | 2,800 | | | | 3,219,860 | |
Nevada — 5.2% | | | | | | | | | | |
County of Clark Nevada Water Reclamation District, GO: | | | | | | | | | | |
Limited Tax, 6.00%, 7/01/38 | | | | | 2,500 | | | | 2,902,050 | |
Series B, 5.50%, 7/01/29 | | | | | 1,994 | | | | 2,337,151 | |
| | | | | | | | | 5,239,201 | |
New Hampshire — 1.2% | | | | | | | | | | |
New Hampshire Health & Education Facilities Authority, RB, Dartmouth College, 5.25%, 6/01/39 (c) | | | | | 1,094 | | | | 1,243,496 | |
New Jersey — 3.9% | | | | | | | | | | |
New Jersey Transportation Trust Fund Authority, RB, Transportation System: | | | | | | | | | | |
Series A (AMBAC), 5.00%, 12/15/32 | | | | | 2,000 | | | | 2,201,220 | |
Series B, 5.25%, 6/15/36 (c) | | | | | 1,640 | | | | 1,783,977 | |
| | | | | | | | | 3,985,197 | |
New York — 13.2% | | | | | | | | | | |
City of New York New York Municipal Water Finance Authority, RB, Fiscal 2009, Series A, 5.75%, 6/15/40 | | | | | 1,410 | | | | 1,613,109 | |
See Notes to Financial Statements.
| ANNUAL REPORT | JULY 31, 2014 | 27
|
| |
| Schedule of Investments (continued) | BlackRock Municipal Income Investment Trust (BBF)
(Percentages shown are based on Net Assets) |
Municipal Bonds Transferred to
Tender Option Bond Trusts (b) | | | | Par
(000) | | Value |
New York (concluded) | | | | | | | | | | |
City of New York New York Municipal Water Finance Authority, Refunding RB, Water & Sewer System, 2nd General Resolution: | | | | | | | | | | |
Series FF, 5.00%, 6/15/45 | | | | $ | 1,500 | | | $ | 1,632,610 | |
Series FF-2, 5.50%, 6/15/40 | | | | | 1,995 | | | | 2,281,907 | |
City of New York New York Transitional Finance Authority, BARB, Fiscal 2009, Series S-3, 5.25%, 1/15/39 | | | | | 1,500 | | | | 1,678,946 | |
New York Liberty Development Corp., RB, 1 World Trade Center Port Authority Consolidated, 5.25%, 12/15/43 | | | | | 2,205 | | | | 2,429,645 | |
New York Liberty Development Corp., Refunding RB, 4 World Trade Center Project, 5.75%, 11/15/51 (c) | | | | | 1,300 | | | | 1,457,352 | |
New York State Dormitory Authority, ERB, Personal Income Tax, Series B, 5.25%, 3/15/38 | | | | | 2,000 | | | | 2,264,380 | |
| | | | | | | | | 13,357,949 | |
Texas — 5.4% | | | | | | | | | | |
City of San Antonio Texas Public Service Board, Refunding RB, Series A, 5.25%, 2/01/31 (c) | | | | | 2,025 | | | | 2,296,065 | |
County of Harris Texas Cultural Education Facilities Finance Corp., RB, Texas Children’s Hospital Project, 5.50%, 10/01/39 | | | | | 2,750 | | | | 3,151,748 | |
| | | | | | | | | 5,447,813 | |
| Municipal Bonds | | | | Par
(000) | | Value |
Virginia — 1.0% | | | | | | | | | | |
County of Fairfax Virginia IDA, Refunding RB, Health Care, Inova Health System, Series A, 5.50%, 5/15/35 | | | | $ | 899 | | | $ | 998,956 | |
Total Municipal Bonds Transferred to Tender Option Bond Trusts — 56.1% | | | | | | | | | 56,780,789 | |
Total Long-Term Investments
(Cost — $145,583,866) — 160.2% | | | | | | | | | 162,093,754 | |
|
Short-Term Securities | | | | | Shares | | | | | |
FFI Institutional Tax-Exempt Fund, 0.03% (d)(e) | | | | | 1,298,709 | | | | 1,298,709 | |
Total Short-Term Securities
(Cost — $1,298,709) — 1.3% | | | | | | | | | 1,298,709 | |
Total Investments (Cost — $146,882,575) — 161.5% | | | | | | | | | 163,392,463 | |
Other Assets Less Liabilities — 1.6% | | | | | | | | | 1,658,663 | |
Liability for TOB Trust Certificates, Including Interest Expense and Fees Payable — (29.3%) | | | | | | | | | (29,688,361 | ) |
VRDP Shares, at Liquidation Value — (33.8%) | | | | | | | | | (34,200,000 | ) |
Net Assets Applicable to Common Shares — 100.0% | | | | | | | | $ | 101,162,765 | |
Notes to Schedule of Investments
| (a) | | | | U.S. government securities, held in escrow, are used to pay interest on this security, as well as to retire the bond in full at the date indicated, typically at a premium to par. |
| (b) | | | | Represent bonds transferred to a TOB. In exchange for which the Trust received cash and residual interest certificates. These bonds serve as collateral in a financing transaction. See Note 3 of the Notes to Financial Statements for details of municipal bonds transferred to TOBs. |
| (c) | | | | All or a portion of security is subject to a recourse agreement, which may require the Trust to pay the liquidity provider in the event there is a shortfall between the TOB trust certificates and proceeds received from the sale of the security contributed to the TOB trust. In the case of a shortfall, the aggregate maximum potential amount the Trust could ultimately be required to pay under the agreements, which expire from October 1, 2016 to November 15, 2019 is $7,865,394. |
| (d) | | | | Investments in issuers considered to be an affiliate of the Trust during the year ended July 31, 2014, for purposes of Section 2(a)(3) of the 1940 Act, were as follows: |
| Affiliate | | | | Shares
Held at
July 31, 2013 | | Net
Activity | | Shares
Held at
July 31, 2014 | | Income |
FFI Institutional Tax-Exempt Fund | | | | 4,710,703 | | (3,411,994) | | 1,298,709 | | $626 |
| (e) | | | | Represents the current yield as of report date. |
| • | | | | Financial futures contracts outstanding as of July 31, 2014 were as follows: |
Contracts
Sold | | | | Issue | | Exchange | | Expiration | | Notional
Value | | Unrealized
Appreciation |
(64) | | | | 10-Year U.S. Treasury Note | | Chicago Board of Trade | | September 2014 | | $7,975,000 | | $27,410 |
| • | | | | Fair Value Measurements – Various inputs are used in determining the fair value of investments and derivative financial instruments. These inputs to valuation techniques are categorized into a disclosure hierarchy consisting of three broad levels for financial statement purposes as follows: |
| • | | | | Level 1 – unadjusted price quotations in active markets/exchanges for identical assets or liabilities that the Trust has the ability to access |
| • | | | | Level 2 – other observable inputs (including, but not limited to, quoted prices for similar assets or liabilities in markets that are active, quoted prices for identical or similar assets or liabilities in markets that are not active, inputs other than quoted prices that are observable for the assets or liabilities (such as interest rates, yield curves, volatilities, prepayment speeds, loss severities, credit risks and default rates) or other market-corroborated inputs) |
| • | | | | Level 3 – unobservable inputs based on the best information available in the circumstances, to the extent observable inputs are not available (including the Trust’s own assumptions used in determining the fair value of investments and derivative financial instruments) |
| | | | | The hierarchy gives the highest priority to unadjusted quoted prices in active markets for identical assets or liabilities (Level 1 measurements) and the lowest priority to unobservable inputs (Level 3 measurements). Accordingly, the degree of judgment exercised in determining fair value is greatest for instruments categorized in Level 3. The inputs used to measure fair value may fall into different levels of the fair value hierarchy. In such cases, for disclosure purposes, the fair value hierarchy classification is determined based on the lowest level input that is significant to the fair value measurement in its entirety. |
| | | | | Changes in valuation techniques may result in transfers into or out of an assigned level within the disclosure hierarchy. In accordance with the Trust’s policy, transfers between different levels of the fair value disclosure hierarchy are deemed to have occurred as of the beginning of the reporting period. The categorization of a value determined for investments and derivative financial instruments is based on the pricing transparency of the investment and derivative financial instrument and is not necessarily an indication of the risks associated with investing in those securities. For information about the Trust’s policy regarding valuation of investments and derivative financial instruments, please refer to Note 2 of the Notes to Financial Statements. |
See Notes to Financial Statements.
| 28 | ANNUAL REPORT | JULY 31, 2014
|
| |
| Schedule of Investments (concluded) | BlackRock Municipal Income Investment Trust (BBF)
|
| | | | | The following tables summarize the Trust’s investments and derivative financial instruments categorized in the disclosure hierarchy as of July 31, 2014: |
| | | | | Level 1 | | Level 2 | | Level 3 | | Total |
Assets:
| | | | | | | | | | | | | | | | | | |
Investments:
| | | | | | | | | | | | | | | | | | |
Long-Term Investments1 | | | | | — | | | $ | 162,093,754 | | | | — | | | $ | 162,093,754 | |
Short-Term Securities | | | | $ | 1,298,709 | | | | — | | | | — | | | | 1,298,709 | |
Total
| | | | $ | 1,298,709 | | | $ | 162,093,754 | | | | — | | | $ | 163,392,463 | |
| 1 | See above Schedule of Investments for values in each state or political subdivision. |
| | | | | Level 1 | | Level 2 | | Level 3 | | Total |
Derivative Financial Instruments2
| | | | | | | | | | | | | | | | | | |
Assets:
| | | | | | | | | | | | | | | | | | |
Interest rate contracts | | | | $ | 27,410 | | | | — | | | | — | | | $ | 27,410 | |
| 2 | Derivative financial instruments are financial futures contracts, which are valued at the unrealized appreciation/depreciation on the instrument. |
| | | | | The Trust may hold assets and/or liabilities in which the fair value approximates the carrying amount for financial statement purposes. As of July 31, 2014, such assets and/or liabilities are categorized within the disclosure hierarchy as follows: |
| | | | | Level 1 | | Level 2 | | Level 3 | | Total |
Assets:
| | | | | | | | | | | | | | | | | | |
Cash pledged for financial futures contracts | | | | $ | 88,000 | | | | — | | | | — | | | $ | 88,000 | |
Liabilities:
| | | | | | | | | | | | | | | | | | |
TOB trust certificates | | | | | — | | | $ | (29,682,276 | ) | | | — | | | | (29,682,276 | ) |
VRDP Shares | | | | | — | | | | (34,200,000 | ) | | | — | | | | (34,200,000 | ) |
Total
| | | | $ | 88,000 | | | $ | (63,882,276 | ) | | | — | | | $ | (63,794,276 | ) |
| | There were no transfers between levels during the year ended July 31, 2014. |
See Notes to Financial Statements.
| ANNUAL REPORT | JULY 31, 2014 | 29
|
| |
| Schedule of Investments July 31, 2014 | BlackRock Municipal Target Term Trust (BTT)
(Percentages shown are based on Net Assets) |
| Municipal Bonds | | | | Par
(000) | | Value |
Alabama — 0.6% | | | | | | | | | | |
City of Phenix Alabama IDB, Refunding RB, Meadwestvaco Coated Board Project, Series A, 3.63%, 5/15/30 | | | | $ | 5,850 | | | $ | 5,440,617 | |
County of Jefferson Alabama, RB, Limited Obligation School, Series A: | | | | | | | | | | |
5.25%, 1/01/19 | | | | | 1,000 | | | | 1,008,900 | |
5.25%, 1/01/20 | | | | | 1,000 | | | | 1,008,900 | |
5.50%, 1/01/21 | | | | | 1,200 | | | | 1,210,680 | |
5.50%, 1/01/22 | | | | | 1,105 | | | | 1,114,834 | |
| | | | | | | | | 9,783,931 | |
Alaska — 0.5% | | | | | | | | | | |
Northern Tobacco Securitization Corp., Refunding RB, Tobacco Settlement, Asset-Backed, Series A, 4.63%, 6/01/23 | | | | | 8,160 | | | | 7,610,914 | |
Arizona — 1.1% | | | | | | | | | | |
Arizona Health Facilities Authority, Refunding RB, Phoenix Children’s Hospital: | | | | | | | | | | |
Series A, 5.00%, 2/01/34 | | | | | 6,340 | | | | 6,764,273 | |
Series B, 5.00%, 2/01/33 | | | | | 1,810 | | | | 1,933,967 | |
City of Phoenix Arizona IDA, RB, Facility: | | | | | | | | | | |
Candeo Schools, Inc. Project, 6.00%, 7/01/23 | | | | | 700 | | | | 752,962 | |
Eagle College Preparatory Project, Series A, 4.50%, 7/01/22 | | | | | 735 | | | | 726,305 | |
Eagle College Preparatory Project, Series A, 5.00%, 7/01/33 | | | | | 1,000 | | | | 929,400 | |
Legacy Traditional Schools Project, Series A, 5.75%, 7/01/24 (a) | | | | | 750 | | | | 791,122 | |
County of Pima Arizona IDA, Refunding RB, Tucson Electric Power Co. Project, Series A, 4.00%, 9/01/29 | | | | | 6,000 | | | | 5,999,820 | |
| | | | | | | | | 17,897,849 | |
California — 23.3% | | | | | | | | | | |
ABAG Finance Authority for Nonprofit Corps., Refunding RB, Odd Fellows Home California, Series A, 5.00%, 4/01/32 | | | | | 4,500 | | | | 4,993,560 | |
Alameda Corridor Transportation Authority, Refunding RB, CAB, Sub Lien, Series A (AMBAC), 0.00%, 10/01/30 (b) | | | | | 10,530 | | | | 4,761,561 | |
Anaheim California Public Financing Authority, Refunding RB, Electric Distribution System, Series A, 4.00%, 10/01/31 | | | | | 17,080 | | | | 17,595,645 | |
California Health Facilities Financing Authority, Refunding RB, Adventist Health System/West, Series A: | | | | | | | | | | |
4.00%, 3/01/27 | | | | | 4,270 | | | | 4,420,603 | |
4.00%, 3/01/28 | | | | | 8,490 | | | | 8,726,022 | |
4.00%, 3/01/33 | | | | | 61,485 | | | | 61,164,048 | |
California HFA, RB, S/F Housing, Home Mortgage, Series I, AMT, 4.70%, 8/01/26 | | | | | 10,000 | | | | 10,123,800 | |
California Municipal Finance Authority, RB, Biola University: | | | | | | | | | | |
4.00%, 10/01/27 | | | | | 750 | | | | 756,570 | |
5.00%, 10/01/29 | | | | | 660 | | | | 718,654 | |
5.00%, 8/15/30 | | | | | 1,000 | | | | 1,098,490 | |
5.00%, 10/01/30 | | | | | 500 | | | | 540,820 | |
4.00%, 10/01/33 | | | | | 2,500 | | | | 2,406,675 | |
California Pollution Control Financing Authority, RB, Poseidon Resources Desalination Project, AMT, 5.00%, 7/01/30 (a) | | | | | 18,845 | | | | 19,637,998 | |
California State Public Works Board, RB: | | | | | | | | | | |
Judicial Council Projects, Series A, 5.00%, 3/01/31 | | | | | 5,000 | | | | 5,591,100 | |
Judicial Council Projects, Series A, 5.00%, 3/01/32 | | | | | 5,000 | | | | 5,579,250 | |
Judicial Council Projects, Series A, 5.00%, 3/01/33 | | | | | 5,220 | | | | 5,796,027 | |
Series D, 5.00%, 9/01/29 | | | | | 2,850 | | | | 3,206,278 | |
Series D, 5.00%, 9/01/30 | | | | | 2,620 | | | | 2,927,771 | |
| Municipal Bonds | | | | Par
(000) | | Value |
California (continued) | | | | | | | | | | |
California State Public Works Board, RB (concluded): | | | | | | | | | | |
Series D, 5.00%, 9/01/31 | | | | $ | 2,905 | | | $ | 3,224,521 | |
Series D, 5.00%, 9/01/32 | | | | | 6,060 | | | | 6,703,996 | |
Series E, 5.00%, 9/01/29 | | | | | 2,355 | | | | 2,649,399 | |
Series E, 5.00%, 9/01/30 | | | | | 2,475 | | | | 2,765,738 | |
Series E, 5.00%, 9/01/31 | | | | | 2,600 | | | | 2,885,974 | |
Series E, 5.00%, 9/01/32 | | | | | 2,280 | | | | 2,522,296 | |
California Statewide Communities Development Authority, RB, American Baptist Homes of the West, Series A: | | | | | | | | | | |
5.00%, 10/01/23 | | | | | 1,500 | | | | 1,627,200 | |
5.00%, 10/01/28 | | | | | 650 | | | | 687,902 | |
5.00%, 10/01/33 | | | | | 2,275 | | | | 2,337,790 | |
California Statewide Communities Development Authority, Refunding RB: | | | | | | | | | | |
Episcopal Communities & Services, 5.00%, 5/15/27 | | | | | 500 | | | | 536,830 | |
Episcopal Communities & Services, 5.00%, 5/15/32 | | | | | 1,000 | | | | 1,057,380 | |
Eskaton Properties, Inc., 5.25%, 11/15/34 | | | | | 2,500 | | | | 2,610,775 | |
Chabot-Las Positas Community College District, GO, Refunding, 2016 Crossover, 5.00%, 8/01/29 | | | | | 18,500 | | | | 21,179,540 | |
City & County of San Francisco California Redevelopment Agency, Refunding, Special Tax Bonds, No. 6 Mission Bay South Public Improvements, Series A: | | | | | | | | | | |
5.00%, 8/01/28 | | | | | 1,000 | | | | 1,093,170 | |
5.00%, 8/01/29 | | | | | 1,300 | | | | 1,415,245 | |
5.00%, 8/01/33 | | | | | 1,335 | | | | 1,434,938 | |
Corona-Norco Unified School District, Refunding, Special Tax Bonds, Senior Lien, Series A, 5.00%, 9/01/32 | | | | | 1,250 | | | | 1,321,925 | |
County of Los Angeles California Public Works Financing Authority, Refunding RB, Multiple Capital Projects II: | | | | | | | | | | |
5.00%, 8/01/30 | | | | | 2,500 | | | | 2,781,825 | |
5.00%, 8/01/31 | | | | | 3,000 | | | | 3,320,460 | |
5.00%, 8/01/32 | | | | | 3,000 | | | | 3,305,040 | |
5.00%, 8/01/33 | | | | | 2,500 | | | | 2,745,050 | |
County of Ventura California Public Financing Authority, Refunding RB, Series A: | | | | | | | | | | |
5.00%, 11/01/30 | | | | | 1,200 | | | | 1,367,604 | |
5.00%, 11/01/31 | | | | | 1,500 | | | | 1,697,835 | |
5.00%, 11/01/32 | | | | | 1,500 | | | | 1,689,705 | |
5.00%, 11/01/33 | | | | | 1,200 | | | | 1,346,232 | |
El Camino Community College District, GO, CAB, Election of 2002, Series C (b): | | | | | | | | | | |
0.00%, 8/01/30 | | | | | 9,090 | | | | 4,778,249 | |
0.00%, 8/01/31 | | | | | 12,465 | | | | 6,210,936 | |
0.00%, 8/01/32 | | | | | 17,435 | | | | 8,309,172 | |
Escondido Union High School District, GO, CAB, Election of 2008, Series A
(AGC) (b): | | | | | | | | | | |
0.00%, 8/01/32 | | | | | 1,675 | | | | 767,920 | |
0.00%, 8/01/33 | | | | | 2,865 | | | | 1,227,767 | |
Golden State Tobacco Securitization Corp., Refunding RB, Series A, 5.00%, 6/01/30 | | | | | 1,500 | | | | 1,652,850 | |
Grossmont Union High School District, GO, CAB, Election of 2004, 0.00%,
8/01/32 (b) | | | | | 29,015 | | | | 12,864,381 | |
Los Angeles Regional Airports Improvement Corp., Refunding RB, LAXFUEL Corp., Los Angeles International, AMT: | | | | | | | | | | |
4.50%, 1/01/27 | | | | | 5,000 | | | | 5,297,200 | |
5.00%, 1/01/32 | | | | | 4,110 | | | | 4,360,546 | |
M-S-R Energy Authority, RB, Series C, 6.13%, 11/01/29 | | | | | 2,500 | | | | 3,072,825 | |
See Notes to Financial Statements.
| 30 | ANNUAL REPORT | JULY 31, 2014
|
| |
| Schedule of Investments (continued) | BlackRock Municipal Target Term Trust (BTT)
(Percentages shown are based on Net Assets) |
| Municipal Bonds | | | | Par
(000) | | Value |
California (concluded) | | | | | | | | | | |
Poway Unified School District, GO, CAB, Election of 2008, Series A (b): | | | | | | | | | | |
0.00%, 8/01/27 | | | | $ | 10,000 | | | $ | 5,958,100 | |
0.00%, 8/01/30 | | | | | 10,000 | | | | 5,070,500 | |
0.00%, 8/01/32 | | | | | 12,500 | | | | 5,720,625 | |
Poway Unified School District Public Financing Authority, Refunding, Special Tax Bonds: | | | | | | | | | | |
5.00%, 9/15/26 | | | | | 935 | | | | 1,052,511 | |
5.00%, 9/15/29 | | | | | 1,205 | | | | 1,333,164 | |
5.00%, 9/15/32 | | | | | 995 | | | | 1,076,709 | |
Riverside Public Financing Authority, Tax Allocation Bonds, University Corridor/Sycamore Canyon Merged Redevelopment Project, Series C (NPFGC), 4.50%, 8/01/30 | | | | | 10,000 | | | | 10,069,700 | |
Sacramento County Sanitation Districts Financing Authority, Refunding RB, Series A, 5.00%, 12/01/30 | | | | | 2,000 | | | | 2,340,220 | |
San Bernardino Community College District, GO, Refunding, Series A: | | | | | | | | | | |
4.00%, 8/01/31 | | | | | 15,660 | | | | 16,150,001 | |
4.00%, 8/01/32 | | | | | 17,010 | | | | 17,450,049 | |
4.00%, 8/01/33 | | | | | 5,665 | | | | 5,789,743 | |
San Diego Community College District, GO, Election of 2006, 0.00%,
8/01/30 (b) | | | | | 5,000 | | | | 2,371,750 | |
Westlands California Water District, Refunding RB, Series A (AGM): | | | | | | | | | | |
5.00%, 9/01/30 | | | | | 1,000 | | | | 1,115,970 | |
5.00%, 9/01/31 | | | | | 1,000 | | | | 1,107,010 | |
5.00%, 9/01/32 | | | | | 1,000 | | | | 1,101,830 | |
| | | | | | | | | 360,602,970 | |
Colorado — 6.0% | | | | | | | | | | |
Central Platte Valley Metropolitan District, GO, Series A: | | | | | | | | | | |
5.13%, 12/01/29 | | | | | 700 | | | | 771,694 | |
5.50%, 12/01/29 | | | | | 750 | | | | 849,990 | |
5.38%, 12/01/33 | | | | | 1,500 | | | | 1,669,755 | |
City & County of Denver Colorado Airport System Revenue, Refunding RB, Series B, 4.00%, 11/15/31 | | | | | 37,090 | | | | 37,743,526 | |
City of Commerce Colorado-Northern Infrastructure General Improvement District, GO, Refunding, Improvement (AGM): | | | | | | | | | | |
5.00%, 12/01/26 | | | | | 2,770 | | | | 3,111,929 | |
5.00%, 12/01/28 | | | | | 1,560 | | | | 1,734,954 | |
5.00%, 12/01/29 | | | | | 1,070 | | | | 1,182,649 | |
5.00%, 12/01/31 | | | | | 500 | | | | 552,260 | |
5.00%, 12/01/32 | | | | | 800 | | | | 880,584 | |
City of Lakewood Colorado Plaza Metropolitan District No. 1, Refunding, Tax Allocation Bonds, 4.00%, 12/01/23 | | | | | 1,000 | | | | 987,680 | |
Colorado Educational & Cultural Facilities Authority, Refunding RB, 5.00%, 8/15/30 | | | | | 1,000 | | | | 1,086,310 | |
Colorado Health Facilities Authority, Refunding RB, Covenant Retirement Communities, Series A: | | | | | | | | | | |
4.50%, 12/01/33 | | | | | 4,595 | | | | 4,388,868 | |
5.00%, 12/01/33 | | | | | 3,000 | | | | 3,107,310 | |
Denver West Metropolitan District, GO, Refunding, Series A (AGM), 4.00%, 12/01/32 | | | | | 6,250 | | | | 6,347,250 | |
Plaza Metropolitan District No. 1, Refunding, Tax Allocation Bonds: | | | | | | | | | | |
4.10%, 12/01/24 | | | | | 5,080 | | | | 4,991,557 | |
4.20%, 12/01/25 | | | | | 5,280 | | | | 5,195,520 | |
4.50%, 12/01/30 | | | | | 4,305 | | | | 4,241,114 | |
State of Colorado, COP, Refunding, Fitzsimons Academic Projects, 4.00%, 11/01/30 | | | | | 12,675 | | | | 13,050,180 | |
Tallyns Reach Metropolitan District No. 3, GO, Refunding, 5.00%, 12/01/33 | | | | | 505 | | | | 507,212 | |
| | | | | | | | | 92,400,342 | |
| Municipal Bonds | | | | Par
(000) | | Value |
Connecticut — 1.4% | | | | | | | | | | |
City of Hartford Connecticut, GO, Refunding, Series A: | | | | | | | | | | |
4.00%, 4/01/29 | | | | $ | 8,390 | | | $ | 8,625,004 | |
4.00%, 4/01/32 | | | | | 1,500 | | | | 1,515,285 | |
Connecticut HFA, Refunding RB, M/F Housing Mortgage Finance Program, Sub-Series F-1, 3.00%, 11/15/32 | | | | | 12,020 | | | | 11,181,965 | |
| | | | | | | | | 21,322,254 | |
District of Columbia — 0.1% | | | | | | | | | | |
District of Columbia, Refunding RB, Kipp Charter School, 6.00%, 7/01/33 | | | | | 1,700 | | | | 1,943,236 | |
Florida — 10.4% | | | | | | | | | | |
City of North Miami Beach Florida, Refunding RB: | | | | | | | | | | |
4.00%, 8/01/27 | | | | | 3,325 | | | | 3,485,298 | |
5.00%, 8/01/29 | | | | | 3,650 | | | | 4,026,461 | |
5.00%, 8/01/30 | | | | | 4,020 | | | | 4,414,040 | |
5.00%, 8/01/31 | | | | | 4,235 | | | | 4,625,509 | |
5.00%, 8/01/32 | | | | | 4,445 | | | | 4,832,382 | |
City of Tampa Florida, Refunding RB, Series A: | | | | | | | | | | |
County of Hillsborough Florida Expressway Authority, 4.00%, 7/01/29 | | | | | 6,000 | | | | 6,168,060 | |
County of Hillsborough Florida Expressway Authority, 4.00%, 7/01/30 | | | | | 6,395 | | | | 6,538,696 | |
H Lee Moffitt Cancer Center Project, 4.00%, 9/01/33 | | | | | 10,000 | | | | 9,973,200 | |
County of Alachua Florida Health Facilities Authority, RB, East Ridge Retirement Village, Inc., 6.00%, 11/15/29 | | | | | 5,000 | | | | 5,286,550 | |
County of Broward Florida, RB, Fort Lauderdale Fuel System Revenue, AMT: | | | | | | | | | | |
5.00%, 4/01/30 | | | | | 600 | | | | 639,024 | |
5.00%, 4/01/33 | | | | | 740 | | | | 783,697 | |
County of Hillsborough Florida IDA, RB, National Gypsum Co., Series A, AMT, 7.13%, 4/01/30 | | | | | 7,300 | | | | 7,315,111 | |
County of Martin Florida IDA, Refunding RB, Indiantown Cogeneration, L.P. Project, AMT, 4.20%, 12/15/25 | | | | | 5,250 | | | | 5,283,758 | |
County of Miami-Dade Florida Educational Facilities Authority, RB, University of Miami, Series A: | | | | | | | | | | |
4.00%, 4/01/31 | | | | | 2,930 | | | | 2,955,550 | |
4.00%, 4/01/32 | | | | | 1,000 | | | | 1,004,330 | |
County of Miami-Dade Florida Educational Facilities Authority, Refunding RB, Sub-Series B, 5.00%, 10/01/32 | | | | | 10,000 | | | | 10,967,700 | |
County of Miami-Dade Florida Expressway Authority, Refunding RB, Series A: | | | | | | | | | | |
5.00%, 7/01/30 | | | | | 5,530 | | | | 6,107,111 | |
5.00%, 7/01/31 | | | | | 5,000 | | | | 5,489,150 | |
County of Miami-Dade Florida School Board, COP, Refunding, Series A, 5.00%, 5/01/32 | | | | | 10,000 | | | | 10,816,000 | |
County of St. Johns Florida Water & Sewer Revenue, Refunding RB, CAB, Series B (b): | | | | | | | | | | |
0.00%, 6/01/25 | | | | | 2,155 | | | | 1,533,757 | |
0.00%, 6/01/26 | | | | | 2,655 | | | | 1,793,240 | |
0.00%, 6/01/27 | | | | | 3,095 | | | | 1,963,035 | |
0.00%, 6/01/28 | | | | | 3,795 | | | | 2,286,601 | |
0.00%, 6/01/29 | | | | | 3,795 | | | | 2,169,981 | |
0.00%, 6/01/30 | | | | | 2,000 | | | | 1,060,700 | |
0.00%, 6/01/31 | | | | | 1,295 | | | | 648,989 | |
0.00%, 6/01/32 | | | | | 2,495 | | | | 1,186,847 | |
Double Branch Community Development District, Refunding, Special Assessment Bonds, Senior Lien, Series A-1, 4.13%, 5/01/31 | | | | | 1,200 | | | | 1,185,888 | |
Greater Orlando Aviation Authority, Refunding RB, Jet Blue Airways Corp. Project, AMT, 5.00%, 11/15/26 | | | | | 2,000 | | | | 1,976,360 | |
See Notes to Financial Statements.
| ANNUAL REPORT | JULY 31, 2014 | 31
|
| |
| Schedule of Investments (continued) | BlackRock Municipal Target Term Trust (BTT)
(Percentages shown are based on Net Assets) |
| Municipal Bonds | | | | Par
(000) | | Value |
Florida (concluded) | | | | | | | | | | |
Jacksonville Florida Port Authority, Refunding RB, AMT: | | | | | | | | | | |
4.50%, 11/01/29 | | | | $ | 4,685 | | | $ | 4,778,606 | |
4.50%, 11/01/30 | | | | | 2,895 | | | | 2,940,712 | |
4.50%, 11/01/31 | | | | | 3,200 | | | | 3,223,936 | |
4.50%, 11/01/32 | | | | | 2,300 | | | | 2,307,728 | |
4.50%, 11/01/33 | | | | | 2,080 | | | | 2,084,139 | |
Reedy Creek Improvement District, GO, Series A, 5.25%, 6/01/30 | | | | | 3,825 | | | | 4,360,844 | |
Village Community Development District No. 5, Refunding, Special Assessment Bonds, Phase I: | | | | | | | | | | |
3.50%, 5/01/28 | | | | | 6,185 | | | | 6,006,872 | |
4.00%, 5/01/33 | | | | | 1,235 | | | | 1,223,675 | |
4.00%, 5/01/34 | | | | | 2,590 | | | | 2,548,146 | |
Village Community Development District No. 10, Special Assessment Bonds, Sumter County: | | | | | | | | | | |
4.50%, 5/01/23 | | | | | 3,555 | | | | 3,603,561 | |
5.00%, 5/01/32 | | | | | 5,985 | | | | 5,946,277 | |
Village Community Development District No. 6, Refunding, Special Assessment Bonds, Sumter County, 4.00%, 5/01/29 | | | | | 6,400 | | | | 6,412,416 | |
| | | | | | | | | 161,953,937 | |
Georgia — 0.8% | | | | | | | | | | |
Georgia Housing & Finance Authority, RB, S/F Housing, Series A, 3.45%, 12/01/32 | | | | | 12,050 | | | | 11,856,236 | |
Guam — 0.7% | | | | | | | | | | |
Guam Power Authority, Refunding RB, Series A (AGM), 5.00%, 10/01/30 | | | | | 10,000 | | | | 11,072,000 | |
Idaho — 0.7% | | | | | | | | | | |
Idaho Housing & Finance Association, RB, Series A, 4.00%, 7/15/30 | | | | | 10,000 | | | | 10,246,600 | |
Illinois — 14.2% | | | | | | | | | | |
Chicago Midway International Airport, Refunding RB, AMT, Series A, 5.00%, 1/01/33 | | | | | 5,000 | | | | 5,292,350 | |
City of Chicago Illinois Motor Fuel Tax Revenue, Refunding RB: | | | | | | | | | | |
5.00%, 1/01/30 | | | | | 2,730 | | | | 2,964,698 | |
5.00%, 1/01/32 | | | | | 2,000 | | | | 2,155,580 | |
City of Chicago Illinois, GO: | | | | | | | | | | |
CAB (NPFGC), 0.00%, 1/01/27 (b) | | | | | 5,000 | | | | 2,818,600 | |
Project, Series A, 5.00%, 1/01/33 | | | | | 10,000 | | | | 10,185,600 | |
City of Chicago Illinois, Refunding RB, GO, Series A, 5.25%, 1/01/30 | | | | | 6,000 | | | | 6,332,640 | |
City of Chicago Illinois, RB, Wastewater Transmission, 2nd Lien: | | | | | | | | | | |
4.00%, 1/01/31 | | | | | 10,375 | | | | 10,166,566 | |
4.00%, 1/01/32 | | | | | 10,790 | | | | 10,511,942 | |
4.00%, 1/01/33 | | | | | 11,220 | | | | 10,808,338 | |
4.00%, 1/01/35 | | | | | 9,135 | | | | 8,681,265 | |
City of Chicago Illinois, Refunding ARB, O’Hare International Airport Passenger Facility Charge, Series B, AMT: | | | | | | | | | | |
4.00%, 1/01/27 | | | | | 5,000 | | | | 4,988,050 | |
4.00%, 1/01/29 | | | | | 28,425 | | | | 27,699,878 | |
City of St. Charles Illinois, GO, Refunding, Corporate Purpose: | | | | | | | | | | |
4.00%, 12/01/30 | | | | | 1,620 | | | | 1,679,227 | |
4.00%, 12/01/31 | | | | | 1,715 | | | | 1,766,433 | |
4.00%, 12/01/32 | | | | | 1,800 | | | | 1,843,542 | |
County of Cook Illinois, GO, Refunding, Series C, 4.00%, 11/15/29 | | | | | 19,750 | | | | 20,055,730 | |
County of Will Illinois Community High School District No. 210 Lincoln-Way, GO, CAB, Refunding, Series B (b): | | | | | | | | | | |
0.00%, 1/01/29 | | | | | 6,920 | | | | 3,674,105 | |
0.00%, 1/01/30 | | | | | 5,680 | | | | 2,826,084 | |
0.00%, 1/01/31 | | | | | 13,330 | | | | 6,412,796 | |
0.00%, 1/01/32 | | | | | 16,500 | | | | 7,258,185 | |
| Municipal Bonds | | | | Par
(000) | | Value |
Illinois (concluded) | | | | | | | | | | |
County of Will Illinois Community High School District No. 210 Lincoln-Way, GO, Refunding, Series A, 5.00%, 1/01/31 | | | | $ | 16,300 | | | $ | 17,894,140 | |
Illinois Finance Authority, RB, 6.00%, 9/01/32 | | | | | 1,620 | | | | 1,765,427 | |
Illinois Finance Authority, Refunding RB: | | | | | | | | | | |
Lutheran Home & Services Obligated Group, 5.00%, 5/15/22 | | | | | 4,835 | | | | 5,053,445 | |
Lutheran Home & Services Obligated Group, 5.50%, 5/15/27 | | | | | 4,350 | | | | 4,514,126 | |
Lutheran Home & Services Obligated Group, 5.50%, 5/15/30 | | | | | 4,900 | | | | 5,005,350 | |
Northwestern Memorial Healthcare, 4.00%, 8/15/33 | | | | | 7,665 | | | | 7,791,473 | |
The Peoples Gas Light & Coke Company Project, 4.00%, 2/01/33 | | | | | 11,000 | | | | 11,031,570 | |
Winnebago & Boone Counties School District No. 205 Rockford, GO: | | | | | | | | | | |
4.00%, 2/01/29 | | | | | 9,305 | | | | 9,527,483 | |
4.00%, 2/01/30 | | | | | 9,835 | | | | 10,005,342 | |
| | | | | | | | | 220,709,965 | |
Indiana — 2.9% | | | | | | | | | | |
Carmel Redevelopment Authority, Refunding RB, Multipurpose, Series A, 4.00%, 8/01/33 | | | | | 8,500 | | | | 8,788,320 | |
City of Valparaiso Indiana, RB, Exempt Facilities, Pratt Paper LLC Project, AMT, 5.88%, 1/01/24 | | | | | 2,250 | | | | 2,489,265 | |
Indiana Finance Authority, Refunding RB: | | | | | | | | | | |
Community Health Network Project, Series A, 4.00%, 5/01/35 | | | | | 23,565 | | | | 22,167,360 | |
Earlham College Project, 5.00%, 10/01/32 | | | | | 11,255 | | | | 11,776,557 | |
| | | | | | | | | 45,221,502 | |
Iowa — 2.2% | | | | | | | | | | |
Iowa Finance Authority, Refunding RB, Midwestern Disaster Area, Iowa Fertilizer Co. Project: | | | | | | | | | | |
5.50%, 12/01/22 | | | | | 18,500 | | | | 19,289,950 | |
5.25%, 12/01/25 | | | | | 14,345 | | | | 15,118,626 | |
| | | | | | | | | 34,408,576 | |
Kentucky — 0.1% | | | | | | | | | | |
Kentucky Public Transportation Infrastructure Authority, RB, Convertible CAB-1st Tier-DownTown Crossing Project, Series C, 0.00%, 7/01/33 (c) | | | | | 1,500 | | | | 995,640 | |
Kentucky Public Transportation Infrastructure Authority, RB, CAB-1st Tier-DownTown Crossing Project, Series B, 0.00%, 7/01/30 (b) | | | | | 1,230 | | | | 499,774 | |
| | | | | | | | | 1,495,414 | |
Louisiana — 3.2% | | | | | | | | | | |
City of New Orleans Louisiana, Refunding RB: | | | | | | | | | | |
5.00%, 12/01/27 | | | | | 1,500 | | | | 1,666,575 | |
5.00%, 12/01/29 | | | | | 1,000 | | | | 1,097,230 | |
Louisiana Stadium & Exposition District, Refunding RB, Senior, Series A: | | | | | | | | | | |
5.00%, 7/01/27 | | | | | 3,770 | | | | 4,227,489 | |
5.00%, 7/01/28 | | | | | 4,420 | | | | 4,916,764 | |
5.00%, 7/01/29 | | | | | 3,000 | | | | 3,305,790 | |
5.00%, 7/01/30 | | | | | 5,000 | | | | 5,493,700 | |
5.00%, 7/01/31 | | | | | 5,105 | | | | 5,568,534 | |
5.00%, 7/01/32 | | | | | 3,000 | | | | 3,277,140 | |
Port New Orleans Board of Commissioners, Refunding RB, Series B, AMT: | | | | | | | | | | |
5.00%, 4/01/31 | | | | | 300 | | | | 314,601 | |
5.00%, 4/01/32 | | | | | 1,000 | | | | 1,044,250 | |
5.00%, 4/01/33 | | | | | 1,575 | | | | 1,641,245 | |
Terrebonne Levee & Conservation District, RB, Sales Tax, 5.00%, 7/01/29 | | | | | 1,925 | | | | 2,121,215 | |
See Notes to Financial Statements.
| 32 | ANNUAL REPORT | JULY 31, 2014
|
| |
| Schedule of Investments (continued) | BlackRock Municipal Target Term Trust (BTT)
(Percentages shown are based on Net Assets) |
| Municipal Bonds | | | | Par
(000) | | Value |
Louisiana (concluded) | | | | | | | | | | |
Tobacco Settlement Financing Corp., Refunding RB, Asset-Backed, Series A: | | | | | | | | | | |
5.25%, 5/15/31 | | | | $ | 3,425 | | | $ | 3,675,025 | |
5.25%, 5/15/32 | | | | | 4,375 | | | | 4,650,319 | |
5.25%, 5/15/33 | | | | | 4,750 | | | | 5,026,355 | |
5.25%, 5/15/35 | | | | | 1,500 | | | | 1,594,020 | |
| | | | | | | | | 49,620,252 | |
Maine — 1.4% | | | | | | | | | | |
Maine Health & Higher Educational Facilities Authority, RB, Eastern Maine Medical Center Obligation: | | | | | | | | | | |
5.00%, 7/01/25 | | | | | 1,250 | | | | 1,399,650 | |
5.00%, 7/01/26 | | | | | 1,000 | | | | 1,105,550 | |
5.00%, 7/01/27 | | | | | 1,000 | | | | 1,093,170 | |
3.75%, 7/01/28 | | | | | 1,000 | | | | 976,620 | |
5.00%, 7/01/33 | | | | | 5,000 | | | | 5,302,400 | |
Maine State Housing Authority, Refunding RB, S/F Housing, Series B, 3.45%, 11/15/32 | | | | | 12,000 | | | | 11,744,160 | |
| | | | | | | | | 21,621,550 | |
Maryland — 0.4% | | | | | | | | | | |
Maryland EDC, Refunding RB: | | | | | | | | | | |
CNX Marine Terminals, Inc., 5.75%, 9/01/25 | | | | | 5,000 | | | | 5,458,300 | |
Salisbury University Project, 5.00%, 6/01/34 | | | | | 500 | | | | 526,220 | |
| | | | | | | | | 5,984,520 | |
Massachusetts — 1.4% | | | | | | | | | | |
Massachusetts Educational Financing Authority, Refunding RB, Series K, AMT, 5.25%, 7/01/29 | | | | | 10,000 | | | | 10,791,400 | |
Massachusetts HFA, Refunding RB, S/F Housing, Series 163, AMT, 4.00%, 12/01/33 | | | | | 11,425 | | | | 10,919,672 | |
| | | | | | | | | 21,711,072 | |
Michigan — 0.9% | | | | | | | | | | |
Michigan Finance Authority, Refunding RB: | | | | | | | | | | |
Holland Community Hospital, Series A, 5.00%, 1/01/33 | | | | | 750 | | | | 796,515 | |
Oakwood Obligation Group, 5.00%, 8/15/30 | | | | | 4,105 | | | | 4,472,233 | |
Michigan State Hospital Finance Authority, Refunding RB, Trinity Health Credit Group, Series C, 4.00%, 12/01/32 | | | | | 9,195 | | | | 9,281,433 | |
| | | | | | | | | 14,550,181 | |
Missouri — 0.3% | | | | | | | | | | |
Missouri State Health & Educational Facilities Authority, Refunding RB: | | | | | | | | | | |
CoxHealth, Series A, 4.00%, 11/15/33 | | | | | 2,010 | | | | 1,959,710 | |
St. Lewis College of Pharmacy Project, 5.00%, 5/01/30 | | | | | 3,000 | | | | 3,196,650 | |
| | | | | | | | | 5,156,360 | |
Nebraska — 1.2% | | | | | | | | | | |
Central Plains Nebraska Energy Project, RB: | | | | | | | | | | |
Energy Project No. 3, 5.00%, 9/01/27 | | | | | 7,010 | | | | 7,734,133 | |
Gas Project No. 3, 5.00%, 9/01/32 | | | | | 9,500 | | | | 10,191,030 | |
| | | | | | | | | 17,925,163 | |
New Hampshire — 1.0% | | | | | | | | | | |
New Hampshire Health & Education Facilities Authority, Refunding RB, Concord Hospital, Series A: | | | | | | | | | | |
5.00%, 10/01/26 | | | | | 1,075 | | | | 1,190,648 | |
5.00%, 10/01/27 | | | | | 1,180 | | | | 1,299,440 | |
4.00%, 10/01/33 | | | | | 3,500 | | | | 3,485,930 | |
New Hampshire State Turnpike System, RB, Series C: | | | | | | | | | | |
4.00%, 8/01/33 | | | | | 4,350 | | | | 4,476,106 | |
4.00%, 8/01/35 | | | | | 4,745 | | | | 4,836,199 | |
| | | | | | | | | 15,288,323 | |
New Jersey — 11.5% | | | | | | | | | | |
County of Gloucester New Jersey Pollution Control Financing Authority, Refunding RB, AMT, 5.00%, 12/01/24 | | | | | 1,500 | | | | 1,640,355 | |
| Municipal Bonds | | | | Par
(000) | | Value |
New Jersey (concluded) | | | | | | | | | | |
New Jersey EDA, RB, AMT: | | | | | | | | | | |
Continental Airlines, Inc. Project, 5.25%, 9/15/29 | | | | $ | 12,230 | | | $ | 12,600,569 | |
Continental Airlines, Inc. Project, Series A, 5.63%, 11/15/30 | | | | | 1,740 | | | | 1,842,469 | |
Continental Airlines, Inc. Project, Series B, 5.63%, 11/15/30 | | | | | 1,315 | | | | 1,396,911 | |
Private Activity Bond, The Goethals Bridge Replacement Project, 5.00%, 1/01/28 | | | | | 4,705 | | | | 5,161,950 | |
New Jersey EDA, Refunding RB: | | | | | | | | | | |
4.25%, 6/15/27 | | | | | 16,500 | | | | 16,879,500 | |
Cigarette Tax, 5.00%, 6/15/26 | | | | | 10,610 | | | | 11,675,562 | |
Continental Airlines, Inc. Project, AMT, 5.75%, 9/15/27 | | | | | 6,200 | | | | 6,564,126 | |
New Jersey EDA, Refunding, Special Assessment Bonds, Kapkowski Road Landfill Project, 5.75%, 4/01/31 | | | | | 5,000 | | | | 5,423,250 | |
New Jersey Health Care Facilities Financing Authority, Refunding RB, St. Barnabas Health, Series A, 4.00%, 7/01/26 | | | | | 3,000 | | | | 3,102,900 | |
New Jersey Housing & Mortgage Finance Agency, Refunding RB, M/F Housing, Series 2, AMT: | | | | | | | | | | |
4.10%, 11/01/28 | | | | | 15,800 | | | | 15,966,532 | |
4.35%, 11/01/33 | | | | | 7,315 | | | | 7,370,082 | |
New Jersey Transportation Trust Fund Authority, RB, Transportation System: | | | | | | | | | | |
CAB, Series A, 0.00%, 12/15/28 (b) | | | | | 66,000 | | | | 34,766,820 | |
CAB, Series A, 0.00%, 12/15/29 (b) | | | | | 18,000 | | | | 8,892,900 | |
Series AA, 4.00%, 6/15/30 | | | | | 13,315 | | | | 13,467,057 | |
Newark Housing Authority, Refunding RB, Newark Redevelopment Project (NPFGC), 5.25%, 1/01/27 | | | | | 5,000 | | | | 5,744,300 | |
Tobacco Settlement Financing Corp. New Jersey, Refunding RB, Series 1A: | | | | | | | | | | |
4.50%, 6/01/23 | | | | | 6,950 | | | | 6,816,074 | |
4.63%, 6/01/26 | | | | | 22,460 | | | | 19,403,643 | |
| | | | | | | | | 178,715,000 | |
New Mexico — 1.1% | | | | | | | | | | |
New Mexico Educational Assistance Foundation, RB, AMT: | | | | | | | | | | |
Education Loan Series A-1, 3.75%, 9/01/31 | | | | | 6,250 | | | | 6,042,750 | |
Education Loan Series A-2, 3.80%, 11/01/32 | | | | | 5,850 | | | | 5,660,869 | |
Education Loan Series A-2, 3.80%, 9/01/33 | | | | | 5,000 | | | | 4,840,000 | |
| | | | | | | | | 16,543,619 | |
New York — 7.2% | | | | | | | | | | |
Build NYC Resource Corp., RB, Bronx Charter School for International Cultures & The Arts Project, Series A, 5.00%, 4/15/33 | | | | | 3,530 | | | | 3,213,641 | |
Housing Development Corp., RB, M/F Housing, Series K-1: | | | | | | | | | | |
3.40%, 11/01/30 | | | | | 8,070 | | | | 7,882,130 | |
3.50%, 11/01/32 | | | | | 5,865 | | | | 5,702,540 | |
Housing Development Corp., Refunding RB, M/F Housing: | | | | | | | | | | |
Series L-1, 3.40%, 11/01/30 | | | | | 1,580 | | | | 1,543,218 | |
Series L-1, 3.50%, 11/01/32 | | | | | 1,160 | | | | 1,127,868 | |
Series L-2-A, 3.60%, 11/01/33 | | | | | 11,000 | | | | 10,745,240 | |
Metropolitan Transportation Authority, Refunding RB, Series F, 5.00%, 11/15/30 | | | | | 25,000 | | | | 27,982,000 | |
New York Mortgage Agency, Refunding RB, Series 48, 3.45%, 10/01/33 | | | | | 3,500 | | | | 3,436,230 | |
New York State HFA, RB, M/F Affordable Housing (SONYMA), Series F: | | | | | | | | | | |
3.05%, 11/01/27 | | | | | 4,020 | | | | 3,861,733 | |
3.45%, 11/01/32 | | | | | 5,235 | | | | 5,082,557 | |
Niagara Area Development Corp., Refunding RB, Solid Waste Disposal Facility, Covanta Energy Project, Series B, 4.00%, 11/01/24 | | | | | 3,000 | | | | 3,022,140 | |
See Notes to Financial Statements.
| ANNUAL REPORT | JULY 31, 2014 | 33
|
| |
| Schedule of Investments (continued) | BlackRock Municipal Target Term Trust (BTT)
(Percentages shown are based on Net Assets) |
| Municipal Bonds | | | | Par
(000) | | Value |
New York (concluded) | | | | | | | | | | |
Onondaga Civic Development Corp., Refunding RB, St. Joseph’s Hospital Health Center Project, 4.50%, 7/01/32 | | | | $ | 9,215 | | | $ | 8,842,161 | |
Triborough Bridge & Tunnel Authority, Refunding RB, CAB, Series A (b): | | | | | | | | | | |
0.00%, 11/15/29 | | | | | 17,810 | | | | 9,893,989 | |
0.00%, 11/15/30 | | | | | 25,215 | | | | 13,329,405 | |
0.00%, 11/15/31 | | | | | 5,000 | | | | 2,501,550 | |
TSASC Inc., Refunding RB, 5.00%, 6/01/26 | | | | | 4,000 | | | | 3,721,960 | |
| | | | | | | | | 111,888,362 | |
North Carolina — 1.2% | | | | | | | | | | |
City of Charlotte North Carolina, Refunding RB, Charlotte-Douglas International Airport, Special Facilities Revenue, US Airways, Inc. Project, AMT, 5.60%, 7/01/27 | | | | | 15,000 | | | | 15,004,650 | |
North Carolina Medical Care Commission, RB, Mission Health Combined Group, 4.63%, 10/01/30 | | | | | 2,000 | | | | 2,092,900 | |
North Carolina Medical Care Commission, Refunding RB, 1st Mortgage, Retirement Facilities Whitestone Project, Series A, 7.75%, 3/01/31 | | | | | 1,665 | | | | 1,870,927 | |
| | | | | | | | | 18,968,477 | |
North Dakota — 0.1% | | | | | | | | | | |
North Dakota HFA, RB, M/F Housing, Series A, 3.60%, 7/01/32 | | | | | 2,330 | | | | 2,372,336 | |
Ohio — 0.4% | | | | | | | | | | |
County of Franklin Ohio, RB, Health Care Facilities Improvement, OPRS Communities, Series A: | | | | | | | | | | |
5.25%, 7/01/28 | | | | | 500 | | | | 521,505 | |
5.63%, 7/01/32 | | | | | 1,000 | | | | 1,043,710 | |
Ohio State University, RB, General Receipts Special Purpose, Series A, 4.00%, 6/01/31 | | | | | 4,220 | | | | 4,382,217 | |
| | | | | | | | | 5,947,432 | |
Oklahoma — 0.2% | | | | | | | | | | |
County of Oklahoma Oklahoma Finance Authority, Refunding RB, Epworth Villa Project, Series A: | | | | | | | | | | |
5.00%, 4/01/23 | | | | | 1,050 | | | | 941,000 | |
5.00%, 4/01/29 | | | | | 1,500 | | | | 1,296,840 | |
5.00%, 4/01/33 | | | | | 1,050 | | | | 882,021 | |
| | | | | | | | | 3,119,861 | |
Pennsylvania — 9.4% | | | | | | | | | | |
Allentown Neighborhood Improvement Zone Development Authority, Refunding RB, Series A: | | | | | | | | | | |
5.00%, 5/01/27 | | | | | 6,750 | | | | 7,195,567 | |
5.00%, 5/01/28 | | | | | 5,000 | | | | 5,289,100 | |
5.00%, 5/01/29 | | | | | 3,745 | | | | 3,941,201 | |
5.00%, 5/01/30 | | | | | 5,300 | | | | 5,549,100 | |
Beaver County Industrial Development Authority, Refunding RB, Series B, 3.50%, 12/01/35 (d) | | | | | 4,540 | | | | 4,594,889 | |
County of Cumberland Pennsylvania Municipal Authority, Refunding RB, Asbury Pennsylvania Obligated Group: | | | | | | | | | | |
5.00%, 1/01/22 | | | | | 750 | | | | 792,765 | |
5.25%, 1/01/27 | | | | | 1,275 | | | | 1,316,017 | |
5.25%, 1/01/32 | | | | | 3,350 | | | | 3,387,788 | |
County of Lehigh Pennsylvania, Refunding RB, Lehigh Valley Health Network, 4.00%, 7/01/33 | | | | | 27,535 | | | | 27,589,795 | |
County of Montgomery Pennsylvania Higher Education & Health Authority, Refunding RB, Abington Memorial Hospital Obligated Group, 5.00%, 6/01/31 | | | | | 5,000 | | | | 5,392,400 | |
County of Montgomery Pennsylvania IDA, Refunding RB, Acts Retirement-Life Communities, Inc. Obligated Group, 5.00%, 11/15/26 | | | | | 2,500 | | | | 2,680,675 | |
County of Northampton Pennsylvania General Purpose Authority, RB, St. Luke’s Hospital of Bethlehem, Series A, 5.00%, 8/15/33 | | | | | 13,250 | | | | 13,887,722 | |
| Municipal Bonds | | | | Par
(000) | | Value |
Pennsylvania (concluded) | | | | | | | | | | |
Pennsylvania Economic Development Financing Authority, RB, National Gypsum Co., AMT: | | | | | | | | | | |
Series A, 6.25%, 11/01/27 | | | | $ | 6,520 | | | $ | 6,522,412 | |
Series B, 6.13%, 11/01/27 | | | | | 3,000 | | | | 3,000,780 | |
Pennsylvania HFA, RB, S/F Housing, Series 114, 3.30%, 10/01/32 | | | | | 20,500 | | | | 19,369,630 | |
Pennsylvania Higher Educational Facilities Authority, RB, Shippensburg University Student Services, 5.00%, 10/01/30 | | | | | 5,250 | | | | 5,412,960 | |
Pennsylvania Higher Educational Facilities Authority, Refunding RB, La Salle University, 4.00%, 5/01/32 | | | | | 3,000 | | | | 2,858,190 | |
State Public School Building Authority, RB, School District of Philadelphia Project: | | | | | | | | | | |
5.00%, 4/01/27 | | | | | 4,130 | | | | 4,510,580 | |
5.00%, 4/01/28 | | | | | 8,000 | | | | 8,682,720 | |
5.00%, 4/01/29 | | | | | 6,000 | | | | 6,470,520 | |
5.00%, 4/01/30 | | | | | 5,500 | | | | 5,908,595 | |
Township of East Hempfield Pennsylvania IDA, RB, Student Services Incorporate Student Housing, 5.00%, 7/01/30 | | | | | 1,280 | | | | 1,339,942 | |
| | | | | | | | | 145,693,348 | |
South Carolina — 0.1% | | | | | | | | | | |
South Carolina Jobs EDA, Refunding RB, Bon Secours Health System, Inc., 5.00%, 5/01/28 | | | | | 2,000 | | | | 2,032,440 | |
South Dakota — 0.0% | | | | | | | | | | |
Educational Enhancement Funding Corp., Refunding RB, Series B, 5.00%, 6/01/27 | | | | | 650 | | | | 708,799 | |
Tennessee — 0.1% | | | | | | | | | | |
Chattanooga Health Educational & Housing Facility Board, RB, Catholic Health Initiatives, Series A, 5.00%, 1/01/33 | | | | | 1,500 | | | | 1,610,685 | |
Texas — 16.1% | | | | | | | | | | |
Central Texas Regional Mobility Authority, Refunding RB, Senior Lien, Series A, 5.00%, 1/01/33 | | | | | 1,260 | | | | 1,334,012 | |
City of Brownsville Texas Utilities System Revenue, Refunding RB, Series A: | | | | | | | | | | |
4.00%, 9/01/30 | | | | | 11,170 | | | | 11,478,404 | |
4.00%, 9/01/31 | | | | | 11,220 | | | | 11,459,996 | |
City of Houston Texas Airport System, Refunding RB, United Airlines, Inc. Terminal E Project, AMT: | | | | | | | | | | |
4.75%, 7/01/24 | | | | | 3,335 | | | | 3,430,848 | |
5.00%, 7/01/29 | | | | | 2,665 | | | | 2,689,598 | |
Clifton Higher Education Finance Corp., RB, Idea Public Schools, 6.00%, 8/15/33 | | | | | 1,650 | | | | 1,915,881 | |
Clifton Higher Education Finance Corp., Refunding RB, Uplift Education,
Series A: | | | | | | | | | | |
3.10%, 12/01/22 | | | | | 1,050 | | | | 994,277 | |
3.95%, 12/01/32 | | | | | 1,800 | | | | 1,624,950 | |
County of Harris Texas, Refunding RB, Toll Road Senior Lien, Series C, 4.00%, 8/15/33 | | | | | 12,325 | | | | 12,502,727 | |
County of Harris Texas Cultural Education Facilities Finance Corp., RB, 1st Mortgage, Brazos Presbyterian Homes, Inc. Project, Series B: | | | | | | | | | | |
5.75%, 1/01/28 | | | | | 500 | | | | 555,950 | |
6.38%, 1/01/33 | | | | | 460 | | | | 511,005 | |
County of Harris Texas Cultural Education Facilities Finance Corp., Refunding RB, Series A: | | | | | | | | | | |
Brazos Presbyterian Homes, Inc. Project, 5.00%, 1/01/33 | | | | | 1,090 | | | | 1,068,113 | |
Memorial Hermann Health System, 4.00%, 12/01/31 | | | | | 20,000 | | | | 20,282,600 | |
YMCA of the Greater Houston Area, 5.00%, 6/01/28 | | | | | 1,500 | | | | 1,621,050 | |
YMCA of the Greater Houston Area, 5.00%, 6/01/33 | | | | | 3,000 | | | | 3,159,570 | |
See Notes to Financial Statements.
| 34 | ANNUAL REPORT | JULY 31, 2014
|
| |
| Schedule of Investments (continued) | BlackRock Municipal Target Term Trust (BTT)
(Percentages shown are based on Net Assets) |
| Municipal Bonds | | | | Par
(000) | | Value |
Texas (concluded) | | | | | | | | | | |
County of Matagorda Texas Navigation District No. 1, Refunding RB: | | | | | | | | | | |
Series A (AMBAC), 4.40%, 5/01/30 | | | | $ | 31,120 | | | $ | 32,355,464 | |
Series B (AMBAC), AMT, 4.55%, 5/01/30 | | | | | 10,000 | | | | 10,285,600 | |
Series B-2, 4.00%, 6/01/30 | | | | | 12,895 | | | | 12,789,777 | |
County of Midland Texas Fresh Water Supply District No. 1, RB, City of Midland Project, Series A: | | | | | | | | | | |
CAB, 0.00%, 9/15/31 (b) | | | | | 6,235 | | | | 3,001,404 | |
CAB, 0.00%, 9/15/32 (b) | | | | | 15,135 | | | | 6,856,760 | |
5.00%, 9/15/31 | | | | | 2,435 | | | | 2,749,943 | |
County of Tarrant Texas Cultural Education Facilities Finance Corp., RB, Baylor Health Care System Project, Series A: | | | | | | | | | | |
4.00%, 11/15/31 | | | | | 5,500 | | | | 5,540,315 | |
4.00%, 11/15/32 | | | | | 15,420 | | | | 15,443,438 | |
County of Tarrant Texas Cultural Education Facilities Finance Corp., Refunding RB, Scott & White Healthcare, 5.00%, 8/15/33 | | | | | 5,000 | | | | 5,523,750 | |
Love Field Airport Modernization Corp., RB, Southwest Airlines Co. Project, AMT, 5.00%, 11/01/28 | | | | | 5,750 | | | | 6,028,760 | |
Lower Colorado River Authority, Refunding RB, LCRA Transmission Services: | | | | | | | | | | |
4.00%, 5/15/31 | | | | | 9,970 | | | | 10,123,040 | |
4.00%, 5/15/32 | | | | | 10,635 | | | | 10,733,799 | |
New Hope Cultural Education Facilities Corp., RB: | | | | | | | | | | |
5.00%, 4/01/29 | | | | | 1,290 | | | | 1,402,217 | |
5.00%, 4/01/29 | | | | | 725 | | | | 780,803 | |
Stephenville LLC Tarleton State University Project, Series A, 5.38%, 4/01/28 | | | | | 1,150 | | | | 1,248,992 | |
New Hope Cultural Education Facilities Corp., Refunding RB, 1st Mortgage, Morningside Ministries Project, 6.25%, 1/01/33 | | | | | 1,600 | | | | 1,709,888 | |
Red River Health Facilities Development Corp., RB, Wichita Falls Retirement Foundation Project: | | | | | | | | | | |
4.70%, 1/01/22 | | | | | 955 | | | | 954,608 | |
5.50%, 1/01/32 | | | | | 1,000 | | | | 1,008,430 | |
Texas Municipal Gas Acquisition & Supply Corp. III, RB: | | | | | | | | | | |
5.00%, 12/15/31 | | | | | 25,000 | | | | 26,507,000 | |
Natural Gas Utility Improvements, 5.00%, 12/15/30 | | | | | 18,000 | | | | 19,255,860 | |
| | | | | | | | | 248,928,829 | |
US Virgin Islands — 0.7% | | | | | | | | | | |
Virgin Islands Public Finance Authority, Refunding RB, Gross Receipts Taxes Loan Note, Series A, 5.00%, 10/01/32 | | | | | 10,000 | | | | 10,726,300 | |
Utah — 0.8% | | | | | | | | | | |
County of Salt Lake Utah Housing Authority, RB, M/F Housing, Liberty Village Apartments Project (Freddie Mac), 3.38%, 8/01/28 | | | | | 12,000 | | | | 12,025,680 | |
Vermont — 0.2% | | | | | | | | | | |
Vermont EDA, Refunding, MRB, Wake Robin Corp. Project, 5.40%, 5/01/33 | | | | | 2,400 | | | | 2,453,736 | |
Virginia — 4.9% | | | | | | | | | | |
County of Fairfax Virginia EDA, RB, Vinson Hall LLC, Series A: | | | | | | | | | | |
4.00%, 12/01/22 | | | | | 505 | | | | 509,616 | |
4.50%, 12/01/32 | | | | | 2,840 | | | | 2,760,338 | |
5.00%, 12/01/32 | | | | | 2,000 | | | | 2,046,300 | |
County of Fairfax Virginia IDA, Refunding RB, Inova Health System, Series D, 4.00%, 5/15/29 | | | | | 5,325 | | | | 5,590,185 | |
County of Hanover Virginia EDA, Refunding RB, Covenant Woods,
Series A: | | | | | | | | | | |
4.50%, 7/01/30 | | | | | 3,000 | | | | 2,811,510 | |
4.50%, 7/01/32 | | | | | 1,100 | | | | 1,013,320 | |
| Municipal Bonds | | | | Par
(000) | | Value |
Virginia (concluded) | | | | | | | | | | |
County of Prince William Virginia IDA, Refunding RB, Novant Health Obligation Group, Series B, 4.00%, 11/01/33 | | | | $ | 15,445 | | | $ | 15,595,743 | |
Dulles Town Center Community Development Authority, Refunding, Special Assessment, Dulles Town Center Project, 4.25%, 3/01/26 | | | | | 500 | | | | 483,970 | |
Virginia HDA, RB, Remarketing: | | | | | | | | | | |
M/F Housing, Sub-Series C-2, 3.00%, 4/01/31 | | | | | 23,175 | | | | 21,525,635 | |
S/F Housing, Sub-Series C-3, 3.25%, 4/01/31 | | | | | 21,500 | | | | 19,502,435 | |
Virginia Small Business Financing Authority, RB, Senior Lien, Express Lanes LLC, AMT, 5.00%, 7/01/34 | | | | | 3,940 | | | | 4,042,913 | |
| | | | | | | | | 75,881,965 | |
Washington — 3.2% | | | | | | | | | | |
Greater Wenatchee Regional Events Center Public Facilities District, Refunding RB, Series A: | | | | | | | | | | |
3.50%, 9/01/18 | | | | | 1,025 | | | | 1,034,123 | |
5.00%, 9/01/27 | | | | | 1,000 | | | | 1,002,920 | |
5.25%, 9/01/32 | | | | | 1,850 | | | | 1,874,216 | |
Port of Seattle Industrial Development Corp., Refunding RB, Special Facilities, Delta Airline, Inc. Project, AMT, 5.00%, 4/01/30 | | | | | 5,000 | | | | 5,004,550 | |
Spokane Public Facilities District, Refunding RB, Series B: | | | | | | | | | | |
4.50%, 12/01/30 | | | | | 5,370 | | | | 5,612,670 | |
5.00%, 12/01/32 | | | | | 5,895 | | | | 6,379,923 | |
5.00%, 9/01/33 | | | | | 4,665 | | | | 5,034,235 | |
State of Washington, COP, State and Local Agency Real and Personal Property, Series B: | | | | | | | | | | |
4.00%, 7/01/29 | | | | | 3,605 | | | | 3,764,125 | |
4.00%, 7/01/30 | | | | | 4,290 | | | | 4,455,165 | |
4.00%, 7/01/31 | | | | | 4,470 | | | | 4,620,147 | |
4.00%, 7/01/32 | | | | | 4,590 | | | | 4,721,779 | |
Washington State Housing Finance Commission, Refunding RB: | | | | | | | | | | |
Emerald Heights Project, 5.00%, 7/01/28 | | | | | 1,000 | | | | 1,066,620 | |
Emerald Heights Project, 5.00%, 7/01/33 | | | | | 1,100 | | | | 1,162,337 | |
Series 1N (Ginnie Mae) (Fannie Mae) (Freddie Mac), 3.50%, 12/01/33 | | | | | 4,035 | | | | 4,029,230 | |
| | | | | | | | | 49,762,040 | |
Wisconsin — 1.0% | | | | | | | | | | |
Public Finance Authority, Refunding RB, Wisconsin Airport Facilities, Senior Obligated Group, Series B, AMT, 5.25%, 7/01/28 | | | | | 2,250 | | | | 2,378,903 | |
Wisconsin Health & Educational Facilities Authority, Refunding RB: | | | | | | | | | | |
Aspirus, Inc., Obligated Group, 5.00%, 8/15/28 | | | | | 3,510 | | | | 3,906,279 | |
Aspirus, Inc., Obligated Group, 5.00%, 8/15/29 | | | | | 3,685 | | | | 4,065,034 | |
Marquette University, 4.00%, 10/01/32 | | | | | 4,520 | | | | 4,621,067 | |
| | | | | | | | | 14,971,283 | |
Wyoming — 1.1% | | | | | | | | | | |
Wyoming Community Development Authority, Refunding RB, Series 2 & 3, 3.75%, 12/01/32 | | | | | 16,790 | | | | 16,873,110 | |
Total Municipal Bonds — 134.1% | | | | | | | | | 2,079,606,449 | |
|
Municipal Bonds Transferred to
Tender Option Bond Trusts (e) |
Colorado — 5.2% | | | | | | | | | | |
City & County of Denver Colorado, Refunding ARB, Department of Aviation, Series A, AMT: | | | | | | | | | | |
4.25%, 11/15/29 | | | | | 33,820 | | | | 34,399,373 | |
4.25%, 11/15/30 (f) | | | | | 35,210 | | | | 35,813,186 | |
4.25%, 11/15/31 | | | | | 8,085 | | | | 8,223,505 | |
4.25%, 11/15/32 | | | | | 2,230 | | | | 2,268,202 | |
| | | | | | | | | 80,704,266 | |
See Notes to Financial Statements.
| ANNUAL REPORT | JULY 31, 2014 | 35
|
| |
| Schedule of Investments (continued) | BlackRock Municipal Target Term Trust (BTT)
(Percentages shown are based on Net Assets) |
Municipal Bonds Transferred to
Tender Option Bond Trusts (e) | | | | Par
(000) | | Value |
Florida — 6.1% | | | | | | | | | | |
County of Broward Florida, ARB, Series
Q-1: | | | | | | | | | | |
4.00%, 10/01/29 | | | | $ | 17,200 | | | $ | 17,344,900 | |
4.00%, 10/01/30 | | | | | 18,095 | | | | 18,247,439 | |
4.00%, 10/01/31 | | | | | 18,820 | | | | 18,978,547 | |
4.00%, 10/01/32 | | | | | 19,575 | | | | 19,739,907 | |
4.00%, 10/01/33 (f) | | | | | 20,355 | | | | 20,526,478 | |
| | | | | | | | | 94,837,271 | |
Iowa — 2.9% | | | | | | | | | | |
Iowa State Board of Regents, RB, University of Iowa Hospitals and Clinics: | | | | | | | | | | |
4.00%, 9/01/28 | | | | | 3,375 | | | | 3,519,804 | |
4.00%, 9/01/29 | | | | | 6,525 | | | | 6,804,955 | |
4.00%, 9/01/30 | | | | | 6,325 | | | | 6,596,374 | |
4.00%, 9/01/31 | | | | | 8,650 | | | | 9,021,128 | |
4.00%, 9/01/32 | | | | | 7,750 | | | | 8,082,514 | |
4.00%, 9/01/33 | | | | | 9,375 | | | | 9,777,235 | |
| | | | | | | | | 43,802,010 | |
Texas — 10.2% | | | | | | | | | | |
City of San Antonio Texas Public Facilities Corp., Refunding LRB, Convention Center Refinancing and Expansion Project: | | | | | | | | | | |
4.00%, 9/15/30 | | | | | 15,000 | | | | 15,418,623 | |
4.00%, 9/15/31 | | | | | 19,475 | | | | 20,018,512 | |
4.00%, 9/15/32 | | | | | 18,075 | | | | 18,579,441 | |
4.00%, 9/15/33 | | | | | 11,000 | | | | 11,306,990 | |
4.00%, 9/15/34 | | | | | 11,885 | | | | 12,216,689 | |
4.00%, 9/15/35 | | | | | 4,500 | | | | 4,625,587 | |
Municipal Bonds Transferred to
Tender Option Bond Trusts (e) | | | | Par
(000) | | Value |
Texas (concluded) | | | | | | | | | | |
Dallas/Fort Worth International Airport, Refunding RB, AMT: | | | | | | | | | | |
Series E, 4.00%, 11/01/32 | | | | $ | 6,915 | | | $ | 7,238,530 | |
Series E, 4.13%, 11/01/35 | | | | | 10,435 | | | | 10,923,219 | |
Series F, 5.00%, 11/01/29 | | | | | 12,820 | | | | 13,419,806 | |
Series F, 5.00%, 11/01/30 | | | | | 15,565 | | | | 16,293,235 | |
Series F, 5.00%, 11/01/31 | | | | | 10,000 | | | | 10,467,867 | |
Series F, 5.00%, 11/01/32 (f) | | | | | 17,170 | | | | 17,973,328 | |
| | | | | | | | | 158,481,827 | |
Total Municipal Bonds Transferred to Tender Option Bond Trusts — 24.4% | | | | | | | | | 377,825,374 | |
Total Long-Term Investments
(Cost — $2,487,344,304) — 158.5% | | | | | | 2,457,431,823 | |
|
Short-Term Securities | | | | | Shares | | | | | |
FFI Institutional Tax-Exempt Fund, 0.03% (g)(h) | | | | | 5,417,254 | | | | 5,417,254 | |
Total Short-Term Securities
(Cost — $5,417,254) — 0.4% | | | | | | | | | 5,417,254 | |
Total Investments
(Cost — $2,492,761,558) — 158.9% | | 2,462,849,077 | |
Other Assets Less Liabilities — 1.4% | | | | | 21,697,524 | |
Liability for TOB Trust Certificates, Including Interest Expense and Fees Payable — (11.9%) | | | | | | | | | (184,170,986 | ) |
RVMTP Shares, at Liquidation Value — (48.4%) | | | | | | | | | (750,000,000 | ) |
Net Assets Applicable to Common Shares — 100.0% | | | | | | | | $ | 1,550,375,615 | |
Notes to Schedule of Investments
| (a) | | | | Security exempt from registration pursuant to Rule 144A under the Securities Act of 1933, as amended. These securities may be resold in transactions exempt from registration to qualified institutional investors. |
| (b) | | | | Zero-coupon bond. |
| (c) | | | | Represents a step-up bond that pays an initial coupon rate for the first period and then a higher coupon rate for the following periods. Rate shown is as of report date. |
| (d) | | | | Variable rate security. Rate shown is as of report date. |
| (e) | | | | Represent bonds transferred to a TOB. In exchange for which the Trust received cash and residual interest certificates. These bonds serve as collateral in a financing transaction. See Note 3 of the Notes to Financial Statements for details of municipal bonds transferred to TOBs. |
| (f) | | | | All or a portion of security is subject to a recourse agreement, which may require the Trust to pay the liquidity provider in the event there is a shortfall between the TOB trust certificates and proceeds received from the sale of the security contributed to the TOB trust. In the case of a shortfall, the aggregate maximum potential amount the Trust could ultimately be required to pay under the agreements, which expire from November 1, 2018 to November 15, 2020 is $128,606,839. |
| (g) | | | | Investments in issuers considered to be an affiliate of the Trust during the year ended July 31, 2014, for purposes of Section 2(a)(3) of the 1940 Act, were as follows: |
| Affiliate | | | | Shares
Held at
July 31, 2013 | | Net
Activity | | Shares
Held at
July 31, 2014 | | Income |
FFI Institutional Tax-Exempt Fund | | | | 55,145,313 | | (49,728,059) | | 5,417,254 | | $2,893 |
| (h) | | | | Represents the current yield as of report date. |
| • | | | | Financial futures contracts outstanding as of July 31, 2014 were as follows: |
Contracts
Sold | | | | Issue | | Exchange | | Expiration | | Notional
Value | | Unrealized
Appreciation |
(1,280) | | | | 10-Year U.S. Treasury Note | | Chicago Board of Trade | | September 2014 | | $159,500,000 | | $27,566 |
(325) | | | | U.S. Treasury Long Bond | | Chicago Board of Trade | | September 2014 | | $ 44,657,031 | | 19,939 |
Total
| | | | | | | | | | | | $47,505 |
| | | | | | | | | | | | |
See Notes to Financial Statements.
| 36 | ANNUAL REPORT | JULY 31, 2014
|
| |
| Schedule of Investments (concluded) | BlackRock Municipal Target Term Trust (BTT)
|
| • | | | | Fair Value Measurements – Various inputs are used in determining the fair value of investments and derivative financial instruments. These inputs to valuation techniques are categorized into a disclosure hierarchy consisting of three broad levels for financial statement purposes as follows: |
| • | | | | Level 1 – unadjusted price quotations in active markets/exchanges for identical assets or liabilities that the Trust has the ability to access |
| • | | | | Level 2 – other observable inputs (including, but not limited to, quoted prices for similar assets or liabilities in markets that are active, quoted prices for identical or similar assets or liabilities in markets that are not active, inputs other than quoted prices that are observable for the assets or liabilities (such as interest rates, yield curves, volatilities, prepayment speeds, loss severities, credit risks and default rates) or other market-corroborated inputs) |
| • | | | | Level 3 – unobservable inputs based on the best information available in the circumstances, to the extent observable inputs are not available (including the Trust’s own assumptions used in determining the fair value of investments and derivative financial instruments) |
| | | | | The hierarchy gives the highest priority to unadjusted quoted prices in active markets for identical assets or liabilities (Level 1 measurements) and the lowest priority to unobservable inputs (Level 3 measurements). Accordingly, the degree of judgment exercised in determining fair value is greatest for instruments categorized in Level 3. The inputs used to measure fair value may fall into different levels of the fair value hierarchy. In such cases, for disclosure purposes, the fair value hierarchy classification is determined based on the lowest level input that is significant to the fair value measurement in its entirety. |
| | | | | Changes in valuation techniques may result in transfers into or out of an assigned level within the disclosure hierarchy. In accordance with the Trust’s policy, transfers between different levels of the fair value disclosure hierarchy are deemed to have occurred as of the beginning of the reporting period. The categorization of a value determined for investments and derivative financial instruments is based on the pricing transparency of the investment and derivative financial instrument and is not necessarily an indication of the risks associated with investing in those securities. For information about the Trust’s policy regarding valuation of investments and derivative financial instruments, please refer to Note 2 of the Notes to Financial Statements. |
| | | | | The following tables summarize the Trust’s investments and derivative financial instruments categorized in the disclosure hierarchy as of July 31, 2014: |
| | | | | Level 1 | | Level 2 | | Level 3 | | Total |
Assets:
| | | | | | | | | | | | | | | | | | |
Investments:
| | | | | | | | | | | | | | | | | | |
Long-Term Investments1 | | | | | — | | | $ | 2,457,431,823 | | | | — | | | $ | 2,457,431,823 | |
Short-Term Securities | | | | $ | 5,417,254 | | | | — | | | | — | | | | 5,417,254 | |
Total
| | | | $ | 5,417,254 | | | $ | 2,457,431,823 | | | | — | | | $ | 2,462,849,077 | |
| 1 | See above Schedule of Investments for values in each state or political subdivision. |
| | | | | Level 1 | | Level 2 | | Level 3 | | Total |
Derivative Financial Instruments2
| | | | | | | | | | | | | | | | | | |
Assets:
| | | | | | | | | | | | | | | | | | |
Interest rate contracts | | | | $ | 47,505 | | | | — | | | | — | | | $ | 47,505 | |
| 2 | Derivative financial instruments are financial futures contracts, which are valued at the unrealized appreciation/depreciation on the instrument. |
| | | | | The Trust may hold assets and/or liabilities in which the fair value approximates the carrying amount for financial statement purposes. As of July 31, 2014, such assets and/or liabilities are categorized within the disclosure hierarchy as follows: |
| | | | | Level 1 | | Level 2 | | Level 3 | | Total |
Assets:
| | | | | | | | | | | | | | | | | | |
Cash pledged for financial futures contracts | | | | $ | 2,377,002 | | | | — | | | | — | | | $ | 2,377,002 | |
Liabilities:
| | | | | | | | | | | | | | | | | | |
TOB trust certificates | | | | | — | | | $ | (184,119,974 | ) | | | — | | | | (184,119,974 | ) |
RVMTP Shares | | | | | — | | | | (750,000,000 | ) | | | — | | | | (750,000,000 | ) |
Total
| | | | $ | 2,377,002 | | | $ | (934,119,974 | ) | | | — | | | $ | (931,742,972 | ) |
| | | | | There were no transfers between levels during the year ended July 31, 2014. |
See Notes to Financial Statements.
| ANNUAL REPORT | JULY 31, 2014 | 37
|
| |
| Schedule of Investments July 31, 2014 | BlackRock New Jersey Municipal Income Trust (BNJ)
(Percentages shown are based on Net Assets) |
| Municipal Bonds | | | | Par
(000) | | Value |
New Jersey — 136.5% |
Corporate — 10.5% | | | | | | | | | | |
County of Middlesex New Jersey Improvement Authority, RB, Heldrich Center Hotel, Sub-Series B, 6.25%, 1/01/37 (a)(b) | | | | $ | 1,790 | | | $ | 91,290 | |
County of Salem New Jersey Pollution Control Financing Authority, Refunding RB, Series A: | | | | | | | | | | |
Atlantic City Electric, 4.88%, 6/01/29 | | | | | 2,400 | | | | 2,551,488 | |
Chambers Project, AMT, 5.00%, 12/01/23 | | | | | 1,275 | | | | 1,410,698 | |
New Jersey EDA, RB, Continental Airlines, Inc. Project, Series B, AMT, 5.63%, 11/15/30 | | | | | 5,160 | | | | 5,481,417 | |
New Jersey EDA, Refunding RB, New Jersey American Water Co., Inc. Project, AMT: | | | | | | | | | | |
Series A, 5.70%, 10/01/39 | | | | | 1,500 | | | | 1,643,670 | |
Series B, 5.60%, 11/01/34 | | | | | 1,275 | | | | 1,401,327 | |
| | | | | | | | | 12,579,890 | |
County/City/Special District/School District — 15.6% | | | | | | | | | | |
City of Margate New Jersey, GO, Refunding, Improvement, 5.00%, 1/15/28 | | | | | 1,085 | | | | 1,184,842 | |
City of Perth Amboy New Jersey, GO, CAB, Refunding (AGM): | | | | | 175 | | | | 181,426 | |
5.00%, 7/01/35 | | | | | | | | | | |
5.00%, 7/01/34 | | | | | 1,075 | | | | 1,117,495 | |
County of Essex New Jersey Improvement Authority, Refunding RB, Project Consolidation (NPFGC): | | | | | | | | | | |
5.50%, 10/01/28 | | | | | 1,440 | | | | 1,828,512 | |
5.50%, 10/01/29 | | | | | 2,630 | | | | 3,344,939 | |
County of Hudson New Jersey Improvement Authority, RB, Harrison Parking Facility Project, Series C (AGC): | | | | | | | | | | |
5.25%, 1/01/39 | | | | | 2,000 | | | | 2,140,320 | |
5.38%, 1/01/44 | | | | | 2,400 | | | | 2,571,432 | |
County of Union New Jersey Improvement Authority, LRB, Guaranteed Lease, Family Court Building Project, 5.00%, 5/01/42 | | | | | 890 | | | | 986,894 | |
County of Union New Jersey Utilities Authority, Refunding RB, Solid Waste System, County Deficiency Agreement, Series A, 5.00%, 6/15/41 | | | | | 2,185 | | | | 2,378,001 | |
New Jersey EDA, Refunding RB, Special Assessment, Kapkowski Road Landfill Project, 6.50%, 4/01/28 | | | | | 2,500 | | | | 2,923,550 | |
| | | | | | | | | 18,657,411 | |
Education — 28.5% | | | | | | | | | | |
New Jersey EDA, RB: | | | | | | | | | | |
(AGC), School Facilities Construction, 5.50%, 12/15/18 (c) | | | | | 1,935 | | | | 2,312,112 | |
(AGC), School Facilities Construction, 5.50%, 12/15/34 | | | | | 1,065 | | | | 1,204,334 | |
MSU Student Housing Project Provide, 5.88%, 6/01/42 | | | | | 1,500 | | | | 1,636,800 | |
The Team Academy Charter School Project, 6.00%, 10/01/33 | | | | | 1,490 | | | | 1,652,708 | |
New Jersey EDA, Refunding RB, School Facilities Construction, 5.00%, 6/15/33 | | | | | 1,875 | | | | 2,026,612 | |
New Jersey Educational Facilities Authority, RB: | | | | | | | | | | |
Higher Educational Capital Improvement Fund, Series A, 5.00%, 9/01/32 | | | | | 2,070 | | | | 2,281,864 | |
Montclair State University, Series J, 5.25%, 7/01/38 | | | | | 580 | | | | 643,156 | |
New Jersey Educational Facilities Authority, Refunding RB: | | | | | | | | | | |
College of New Jersey, Series D (AGM), 5.00%, 7/01/35 | | | | | 3,230 | | | | 3,558,620 | |
Georgian Court University, Series D, 5.00%, 7/01/33 | | | | | 250 | | | | 255,843 | |
Kean University, Series A, 5.50%, 9/01/36 | | | | | 2,060 | | | | 2,336,988 | |
| Municipal Bonds | | | | Par
(000) | | Value |
New Jersey (continued) |
Education (concluded): | | | | | | | | | | |
New Jersey Educational Facilities Authority, Refunding RB (concluded): | | | | | | | | | | |
Montclaire State University, Series A, 5.00%, 7/01/44 | | | | $ | 4,570 | | | $ | 5,067,262 | |
New Jersey Institute of Technology, Series H, 5.00%, 7/01/31 | | | | | 660 | | | | 723,459 | |
Ramapo College, Series B, 5.00%, 7/01/42 | | | | | 265 | | | | 285,617 | |
University of Medicine & Dentistry, Series B, 7.50%, 6/01/19 (c) | | | | | 1,450 | | | | 1,874,125 | |
New Jersey Higher Education Student Assistance Authority, Refunding RB: | | | | | | | | | | |
Series 1, AMT, 5.75%, 12/01/29 | | | | | 2,055 | | | | 2,292,558 | |
Series 1A, 5.00%, 12/01/25 | | | | | 445 | | | | 470,859 | |
Series 1A, 5.00%, 12/01/26 | | | | | 290 | | | | 306,440 | |
Series 1A, 5.25%, 12/01/32 | | | | | 500 | | | | 539,180 | |
New Jersey Institute of Technology, RB, Series A, 5.00%, 7/01/42 | | | | | 970 | | | | 1,044,787 | |
Rutgers — The State University of New Jersey, Refunding RB, Series L, 5.00%, 5/01/43 | | | | | 3,145 | | | | 3,490,258 | |
| | | | | | | | | 34,003,582 | |
Health — 13.7% | | | | | | | | | | |
New Jersey EDA, Refunding RB: | | | | | | | | | | |
1st Mortgage, Winchester, Series A, 5.75%, 11/01/24 | | | | | 4,050 | | | | 4,061,988 | |
Seabrook Village, Inc. Facility, 5.25%, 11/15/26 | | | | | 1,790 | | | | 1,835,609 | |
New Jersey Health Care Facilities Financing Authority, RB: | | | | | | | | | | |
Meridian Health System Obligated Group, Series I (AGC), 5.00%, 7/01/38 | | | | | 720 | | | | 755,424 | |
Robert Wood Johnson University Hospital, Series A, 5.50%, 7/01/43 | | | | | 750 | | | | 832,755 | |
Virtua Health, Series A (AGC), 5.50%, 7/01/38 | | | | | 1,250 | | | | 1,347,350 | |
New Jersey Health Care Facilities Financing Authority, Refunding RB: | | | | | | | | | | |
AHS Hospital Corp., 6.00%, 7/01/37 | | | | | 900 | | | | 1,042,515 | |
AHS Hospital Corp., 6.00%, 7/01/41 | | | | | 1,045 | | | | 1,209,786 | |
Meridian Health System Obligated Group, 5.00%, 7/01/26 | | | | | 970 | | | | 1,076,205 | |
St. Barnabas Health Care System, Series A, 5.00%, 7/01/29 | | | | | 1,745 | | | | 1,794,890 | |
St. Barnabas Health Care System, Series A, 5.63%, 7/01/32 | | | | | 580 | | | | 634,972 | |
St. Barnabas Health Care System, Series A, 5.63%, 7/01/37 | | | | | 1,605 | | | | 1,742,998 | |
| | | | | | | | | 16,334,492 | |
Housing — 9.7% | | | | | | | | | | |
County of Middlesex New Jersey Improvement Authority, RB, AMT (Fannie Mae): | | | | | | | | | | |
Administration Building Residential Project, 5.35%, 7/01/34 | | | | | 1,400 | | | | 1,400,490 | |
New Brunswick Apartments Rental Housing, 5.30%, 8/01/35 | | | | | 4,315 | | | | 4,318,409 | |
New Jersey Housing & Mortgage Finance Agency, RB: | | | | | | | | | | |
M/F Housing, Series A, 4.75%, 11/01/29 | | | | | 1,185 | | | | 1,240,932 | |
S/F Housing, Series AA, 6.38%, 10/01/28 | | | | | 645 | | | | 671,897 | |
S/F Housing, Series AA, 6.50%, 10/01/38 | | | | | 685 | | | | 705,495 | |
S/F Housing, Series CC, 5.00%, 10/01/34 | | | | | 995 | | | | 1,044,262 | |
Newark Housing Authority, RB, M/F Housing, Series A, 5.00%, 12/01/30 | | | | | 2,000 | | | | 2,223,540 | |
| | | | | | | | | 11,605,025 | |
State — 18.5% | | | | | | | | | | |
Garden State Preservation Trust, RB, CAB, Series B (AGM), 0.00%, 11/01/26 (d) | | | | | 6,000 | | | | 4,131,840 | |
See Notes to Financial Statements.
| 38 | ANNUAL REPORT | JULY 31, 2014
|
| |
| Schedule of Investments (continued) | BlackRock New Jersey Municipal Income Trust (BNJ)
(Percentages shown are based on Net Assets) |
| Municipal Bonds | | | | Par
(000) | | Value |
New Jersey (continued) |
State (concluded) | | | | | | | | | | |
New Jersey EDA, RB: | | | | | | | | | | |
Kapkowski Road Landfill Project, Series B, AMT, 6.50%, 4/01/31 | | | | $ | 5,000 | | | $ | 5,813,050 | |
Motor Vehicle Surcharge, Series A (NPFGC), 5.25%, 7/01/25 | | | | | 1,365 | | | | 1,625,974 | |
School Facilities Construction, Series CC-2, 5.00%, 12/15/31 | | | | | 1,525 | | | | 1,654,686 | |
New Jersey EDA, Refunding RB: | | | | | | | | | | |
Lions Gate Project, 5.25%, 1/01/44 | | | | | 430 | | | | 430,138 | |
Cigarette Tax, 5.00%, 6/15/26 | | | | | 810 | | | | 891,348 | |
Cigarette Tax, 5.00%, 6/15/29 | | | | | 1,000 | | | | 1,081,650 | |
Cigarette Tax (AGM), 5.00%, 6/15/22 | | | | | 2,940 | | | | 3,368,241 | |
New Jersey Health Care Facilities Financing Authority, RB, Hospital Asset Transformation Program, Series A, 5.25%, 10/01/38 | | | | | 2,350 | | | | 2,473,563 | |
State of New Jersey, COP, Equipment Lease Purchase, Series A, 5.25%, 6/15/28 | | | | | 600 | | | | 657,330 | |
| | | | | | | | | 22,127,820 | |
Transportation — 39.3% | | | | | | | | | | |
Delaware River Port Authority of Pennsylvania & New Jersey, RB: | | | | | | | | | | |
5.00%, 1/01/40 | | | | | 1,380 | | | | 1,504,310 | |
Series D, 5.00%, 1/01/40 | | | | | 800 | | | | 849,792 | |
New Jersey EDA, RB, Private Activity Bond, The Goethals Bridge Replacement Project, AMT, 5.38%, 1/01/43 | | | | | 4,500 | | | | 4,773,825 | |
New Jersey State Turnpike Authority, RB: | | | | | | | | | | |
Series A, 5.00%, 1/01/38 | | | | | 4,000 | | | | 4,342,480 | |
Series E, 5.25%, 1/01/40 | | | | | 1,970 | | | | 2,182,740 | |
New Jersey Transportation Trust Fund Authority, RB, Transportation System: | | | | | | | | | | |
CAB, Series C (AGM), 0.00%, 12/15/32 (d) | | | | | 4,000 | | | | 1,688,440 | |
6.00%, 12/15/38 | | | | | 945 | | | | 1,100,991 | |
Series A, 6.00%, 6/15/35 | | | | | 4,135 | | | | 4,949,761 | |
Series A, 5.88%, 12/15/38 | | | | | 1,770 | | | | 2,056,988 | |
Series A, 5.50%, 6/15/41 | | | | | 2,000 | | | | 2,215,320 | |
Series A (AGC), 5.50%, 12/15/38 | | | | | 1,000 | | | | 1,144,710 | |
Series AA, 5.25%, 6/15/33 | | | | | 3,110 | | | | 3,451,758 | |
Series AA, 5.50%, 6/15/39 | | | | | 2,260 | | | | 2,498,543 | |
Port Authority of New York & New Jersey, RB, JFK International Air Terminal, Special Project: | | | | | | | | | | |
Series 6, AMT (NPFGC), 5.75%, 12/01/22 | | | | | 6,000 | | | | 6,036,060 | |
Series 8, 6.00%, 12/01/42 | | | | | 1,430 | | | | 1,640,610 | |
Port Authority of New York & New Jersey, Refunding ARB, Consolidated: | | | | | | | | | | |
166th Series, 5.25%, 7/15/36 | | | | | 4,000 | | | | 4,492,120 | |
152nd Series, AMT, 5.75%, 11/01/30 | | | | | 1,750 | | | | 1,980,720 | |
| | | | | | | | | 46,909,168 | |
Utility — 0.7% | | | | | | | | | | |
Rahway Valley Sewerage Authority, RB, CAB, Series A (NPFGC), 0.00%,
9/01/33 (d) | | | | | 2,000 | | | | 878,200 | |
Total Municipal Bonds — 136.5% | | | | | | | | | 163,095,588 | |
Municipal Bonds Transferred to
Tender Option Bond Trusts (e) | | | | Par
(000) | | Value |
New Jersey — 25.4% |
County/City/Special District/School District — 5.1% | | | | | | | | | | |
County of Union New Jersey Utilities Authority, Refunding LRB, Resource Recovery Facility, Covanta Union, Inc., Series A, AMT, 5.25%, 12/01/31 | | | | $ | 5,710 | | | $ | 6,166,971 | |
Education — 1.4% | | | | | | | | | | |
Rutgers — The State University of New Jersey, RB, Series F, 5.00%, 5/01/39 | | | | | 1,499 | | | | 1,665,380 | |
State — 5.5% | | | | | | | | | | |
New Jersey EDA, RB, School Facilities Construction (AGC): | | | | | | | | | | |
6.00%, 12/15/18 (c) | | | | | 987 | | | | 1,162,450 | |
6.00%, 12/15/34 | | | | | 2,013 | | | | 2,370,485 | |
New Jersey EDA, Refunding RB, 5.00%, 3/01/29 (f) | | | | | 2,787 | | | | 3,049,410 | |
| | | | | | | | | 6,582,345 | |
Transportation — 13.4% | | | | | | | | | | |
New Jersey State Turnpike Authority, RB, Series A, 5.00%, 1/01/38 (f) | | | | | 4,700 | | | | 5,102,414 | |
New Jersey Transportation Trust Fund Authority, RB, Transportation System: | | | | | | | | | | |
Series A (AMBAC), 5.00%, 12/15/32 | | | | | 2,000 | | | | 2,201,220 | |
Series B, 5.25%, 6/15/36 (f) | | | | | 2,501 | | | | 2,719,477 | |
Port Authority of New York & New Jersey, RB, Consolidated, 169th Series, AMT, 5.00%, 10/15/41 | | | | | 3,495 | | | | 3,766,631 | |
Port Authority of New York & New Jersey, Refunding RB, Consolidated, 152nd Series, AMT, 5.25%, 11/01/35 | | | | | 2,039 | | | | 2,226,419 | |
| | | | | | | | | 16,016,161 | |
Total Municipal Bonds Transferred to
Tender Option Bond Trusts — 25.4% | | | | | | 30,430,857 | |
Total Long-Term Investments
(Cost — $181,869,860) — 161.9% | | | | | | | | | 193,526,445 | |
|
Short-Term Securities | | | | | Shares | | | | | |
BIF New Jersey Municipal Money Fund, 0.00% (g)(h) | | | | | 1,307,069 | | | $ | 1,307,069 | |
Total Short-Term Securities
(Cost — $1,307,069) — 1.1% | | | | | | | | | 1,307,069 | |
Total Investments
(Cost — $183,176,929) — 163.0% | | | | | | | | | 194,833,514 | |
Other Assets Less Liabilities — 1.0% | | | | | | 1,080,339 | |
Liability for TOB Trust Certificates, Including Interest Expense and Fees Payable — (14.5%) | | | | | | | | | (17,305,052 | ) |
VMTP Shares, at Liquidation Value — (49.5%) | | | | | | | | | (59,100,000 | ) |
Net Assets Applicable to Common Shares — 100.0% | | | | | | | | $ | 119,508,801 | |
Notes to Schedule of Investments
| (a) | | | | Issuer filed for bankruptcy and/or is in default of principal and/or interest payments. |
| (b) | | | | Non-income producing security. |
| (c) | | | | U.S. government securities, held in escrow, are used to pay interest on this security, as well as to retire the bond in full at the date indicated, typically at a premium to par. |
| (d) | | | | Zero-coupon bond. |
| (e) | | | | Represent bonds transferred to a TOB. In exchange for which the Trust received cash and residual interest certificates. These bonds serve as collateral in a financing transaction. See Note 3 of the Notes to Financial Statements for details of municipal bonds transferred to TOBs. |
See Notes to Financial Statements.
| ANNUAL REPORT | JULY 31, 2014 | 39
|
| |
| Schedule of Investments (concluded) | BlackRock New Jersey Municipal Income Trust (BNJ)
|
| (f) | | | | All or a portion of security is subject to a recourse agreement, which may require the Trust to pay the liquidity provider in the event there is a shortfall between the TOB trust certificates and proceeds received from the sale of the security contributed to the TOB trust. In the case of a shortfall, the aggregate maximum potential amount the Trust could ultimately be required to pay under the agreements, which expire from June 15, 2019 to September 1, 2020 is $7,517,578. |
| (g) | | | | Investments in issuers considered to be an affiliate of the Trust during the year ended July 31, 2014, for purposes of Section 2(a)(3) of the 1940 Act, were as follows: |
| Affiliate | | | | Shares
Held at
July 31, 2013 | | Net
Activity | | Shares
Held at
July 31, 2014 | | Income |
BIF New Jersey Municipal Money Fund | | | | 4,818,896 | | (3,511,827) | | 1,307,069 | | $13 |
| (h) | | | | Represents the current yield as of report date. |
| • | | | | Financial futures contracts outstanding as of July 31, 2014 were as follows: |
Contracts
Sold | | | | Issue | | Exchange | | Expiration | | Notional
Value | | Unrealized
Appreciation |
(72) | | | | 10-Year U.S. Treasury Note | | Chicago Board of Trade | | September 2014 | | $8,971,875 | | $30,837 |
| • | | | | For Trust compliance purposes, the Trust’s sector classifications refer to any one or more of the sector sub-classifications used by one or more widely recognized market indexes or rating group indexes, and/or as defined by the investment advisor. These definitions may not apply for purposes of this report, which may combine such sector sub-classifications for reporting ease. |
| • | | | | Fair Value Measurements – Various inputs are used in determining the fair value of investments and derivative financial instruments. These inputs to valuation techniques are categorized into a disclosure hierarchy consisting of three broad levels for financial statement purposes as follows: |
| • | | | | Level 1 – unadjusted price quotations in active markets/exchanges for identical assets or liabilities that the Trust has the ability to access |
| • | | | | Level 2 – other observable inputs (including, but not limited to, quoted prices for similar assets or liabilities in markets that are active, quoted prices for identical or similar assets or liabilities in markets that are not active, inputs other than quoted prices that are observable for the assets or liabilities (such as interest rates, yield curves, volatilities, prepayment speeds, loss severities, credit risks and default rates) or other market-corroborated inputs) |
| • | | | | Level 3 – unobservable inputs based on the best information available in the circumstances, to the extent observable inputs are not available (including the Trust’s own assumptions used in determining the fair value of investments and derivative financial instruments) |
| | | | | The hierarchy gives the highest priority to unadjusted quoted prices in active markets for identical assets or liabilities (Level 1 measurements) and the lowest priority to unobservable inputs (Level 3 measurements). Accordingly, the degree of judgment exercised in determining fair value is greatest for instruments categorized in Level 3. The inputs used to measure fair value may fall into different levels of the fair value hierarchy. In such cases, for disclosure purposes, the fair value hierarchy classification is determined based on the lowest level input that is significant to the fair value measurement in its entirety. |
| | | | | Changes in valuation techniques may result in transfers into or out of an assigned level within the disclosure hierarchy. In accordance with the Trust’s policy, transfers between different levels of the fair value disclosure hierarchy are deemed to have occurred as of the beginning of the reporting period. The categorization of a value determined for investments and derivative financial instruments is based on the pricing transparency of the investment and derivative financial instrument and is not necessarily an indication of the risks associated with investing in those securities. For information about the Trust’s policy regarding valuation of investments and derivative financial instruments, please refer to Note 2 of the Notes to Financial Statements. |
| | | | | The following tables summarize the Trust’s investments and derivative financial instruments categorized in the disclosure hierarchy as of July 31, 2014: |
| | | | | Level 1 | | Level 2 | | Level 3 | | Total |
Assets:
| | | | | | | | | | | | | | | | | | |
Investments:
| | | | | | | | | | | | | | | | | | |
Long-Term Investments1 | | | | | — | | | $ | 193,526,445 | | | | — | | | $ | 193,526,445 | |
Short-Term Securities | | | | $ | 1,307,069 | | | | — | | | | — | | | | 1,307,069 | |
Total
| | | | $ | 1,307,069 | | | $ | 193,526,445 | | | | — | | | $ | 194,833,514 | |
| | | | | | | | | | | | | | | | | | |
| 1 | See above Schedule of Investments for values in each sector. |
| | | | | Level 1 | | Level 2 | | Level 3 | | Total |
Derivative Financial Instruments2
| | | | | | | | | | | | | | | | | | |
Assets:
| | | | | | | | | | | | | | | | | | |
Interest rate contracts | | | | $ | 30,837 | | | | — | | | | — | | | $ | 30,837 | |
| 2 | Derivative financial instruments are financial futures contracts, which are valued at the unrealized appreciation/depreciation on the instrument. |
| | | | | The Trust may hold assets and/or liabilities in which the fair value approximates the carrying amount for financial statement purposes. As of July 31, 2014, such assets and/or liabilities are categorized within the disclosure hierarchy as follows: |
| | | | | Level 1 | | Level 2 | | Level 3 | | Total |
Assets:
| | | | | | | | | | | | | | | | | | |
Cash pledged for financial futures contracts | | | | $ | 99,000 | | | | — | | | | — | | | $ | 99,000 | |
Liabilities:
| | | | | | | | | | | | | | | | | | |
TOB trust certificates | | | | | — | | | $ | (17,301,282 | ) | | | — | | | | (17,301,282 | ) |
VMTP Shares | | | | | — | | | | (59,100,000 | ) | | | — | | | | (59,100,000 | ) |
Total
| | | | $ | 99,000 | | | $ | (76,401,282 | ) | | | — | | | $ | (76,302,282 | ) |
| | | | | | | | | | | | | | | | | | |
| | | | | There were no transfers between levels during the year ended July 31, 2014. |
See Notes to Financial Statements.
| 40 | ANNUAL REPORT | JULY 31, 2014
|
| |
| Schedule of Investments July 31, 2014 | BlackRock New York Municipal Income Trust (BNY)
(Percentages shown are based on Net Assets) |
| Municipal Bonds | | | | Par
(000) | | Value |
New York — 134.8% |
Corporate — 14.5% | | | | | | | | | | |
City of New York New York Industrial Development Agency, ARB, American Airlines, Inc., JFK International Airport, AMT (a): | | | | | | | | | | |
7.63%, 8/01/25 | | | | $ | 3,200 | | | $ | 3,513,088 | |
7.75%, 8/01/31 | | | | | 4,000 | | | | 4,415,560 | |
City of New York New York Industrial Development Agency, Refunding RB, Transportation Infrastructure Properties LLC, Series A, AMT, 5.00%, 7/01/28 | | | | | 795 | | | | 848,186 | |
County of Chautauqua New York Industrial Development Agency, RB, NRG Dunkirk Power Project, 5.88%, 4/01/42 | | | | | 1,000 | | | | 1,085,080 | |
County of Essex New York Industrial Development Agency, RB, International Paper Co. Project, Series A, AMT, 6.63%, 9/01/32 | | | | | 550 | | | | 615,626 | |
County of Suffolk New York Industrial Development Agency, RB, KeySpan Generation LLC, Port Jefferson, AMT, 5.25%, 6/01/27 | | | | | 6,000 | | | | 6,030,240 | |
New York Liberty Development Corp., RB, Goldman Sachs Headquarters, 5.25%, 10/01/35 | | | | | 5,350 | | | | 6,181,550 | |
Niagara Area Development Corp., Refunding RB, Solid Waste Disposal Facility, Covanta Energy Project, Series A, AMT, 5.25%, 11/01/42 | | | | | 1,500 | | | | 1,517,055 | |
Port Authority of New York & New Jersey, ARB, Continental Airlines, Inc. & Eastern Air Lines, Inc. Project, LaGuardia, AMT, 9.13%, 12/01/15 | | | | | 3,285 | | | | 3,351,850 | |
| | | | | | | | | 27,558,235 | |
County/City/Special District/School District — 32.5% | | | | | | | | | | |
City of New York New York, GO: | | | | | | | | | | |
Fiscal 2014, Sub-Series D-1, 5.00%, 8/01/31 | | | | | 690 | | | | 778,403 | |
Series A-1, 5.00%, 8/01/35 | | | | | 1,000 | | | | 1,103,500 | |
Series A-1, Fiscal 2009, 4.75%, 8/15/25 | | | | | 750 | | | | 841,890 | |
Series D, 5.38%, 6/01/32 | | | | | 25 | | | | 25,101 | |
Sub-Series G-1, 5.00%, 4/01/28 | | | | | 630 | | | | 720,336 | |
Sub-Series G-1, 5.00%, 4/01/29 | | | | | 750 | | | | 852,570 | |
Sub-Series G-1, 6.25%, 12/15/31 | | | | | 500 | | | | 589,805 | |
Sub-Series I-1, 5.38%, 4/01/36 | | | | | 1,750 | | | | 1,998,465 | |
City of New York New York, GO, Refunding: | | | | | | | | | | |
Series E, 5.50%, 8/01/25 | | | | | 1,280 | | | | 1,570,509 | |
Series E, 5.00%, 8/01/30 | | | | | 1,000 | | | | 1,131,440 | |
Series I, 5.00%, 8/01/30 | | | | | 1,000 | | | | 1,134,470 | |
City of New York New York Convention Center Development Corp., RB, Hotel Unit Fee Secured (AMBAC): | | | | | | | | | | |
5.00%, 11/15/35 | | | | | 250 | | | | 260,330 | |
5.00%, 11/15/44 | | | | | 6,495 | | | | 6,743,239 | |
4.75%, 11/15/45 | | | | | 500 | | | | 504,450 | |
City of New York New York Housing Development Corp., RB, Fund Grant Program, New York City Housing Authority Program, Series B1: | | | | | | | | | | |
5.25%, 7/01/32 | | | | | 1,140 | | | | 1,287,915 | |
5.00%, 7/01/33 | | | | | 500 | | | | 548,970 | |
City of New York New York Industrial Development Agency, RB, PILOT: | | | | | | | | | | |
CAB, Yankee Stadium Project, Series A (AGC), 0.00%, 3/01/42 (b) | | | | | 1,960 | | | | 498,840 | |
CAB, Yankee Stadium Project, Series A (AGC), 0.00%, 3/01/45 (b) | | | | | 1,500 | | | | 319,365 | |
Queens Baseball Stadium (AGC), 6.38%, 1/01/39 | | | | | 150 | | | | 174,090 | |
Queens Baseball Stadium (AMBAC), 5.00%, 1/01/39 | | | | | 3,000 | | | | 3,046,230 | |
Yankee Stadium Project (NPFGC), 4.75%, 3/01/46 | | | | | 480 | | | | 485,861 | |
City of New York New York Industrial Development Agency, Refunding ARB, Transportation Infrastructure Properties LLC, Series A, AMT, 5.00%, 7/01/22 | | | | | 650 | | | | 715,949 | |
| Municipal Bonds | | | | Par
(000) | | Value |
New York (continued) |
County/City/Special District/School District (concluded) |
City of New York New York Transitional Finance Authority, RB, Future Tax Secured, Fiscal 2012, Sub-Series E-1, 5.00%, 2/01/42 | | | | $ | 2,500 | | | $ | 2,726,550 | |
Hudson Yards Infrastructure Corp., RB, Series A: | | | | | | | | | | |
Senior, Fiscal 2012, 5.75%, 2/15/47 | | | | | 200 | | | | 227,526 | |
5.00%, 2/15/47 | | | | | 5,485 | | | | 5,679,663 | |
(AGC), 5.00%, 2/15/47 | | | | | 1,000 | | | | 1,036,720 | |
(AGM), 5.00%, 2/15/47 | | | | | 1,000 | | | | 1,036,720 | |
(NPFGC), 4.50%, 2/15/47 | | | | | 4,500 | | | | 4,570,515 | |
Metropolitan Transportation Authority, Refunding RB, Transportation, Series D, 5.00%, 11/15/34 | | | | | 800 | | | | 864,360 | |
New York Liberty Development Corp., Refunding RB: | | | | | | | | | | |
2nd Priority, Bank of America Tower at One Bryant Park Project, Class 2, 5.63%, 7/15/47 | | | | | 2,000 | | | | 2,190,660 | |
2nd Priority, Bank of America Tower at One Bryant Park Project, Class 3, 6.38%, 7/15/49 | | | | | 1,200 | | | | 1,321,140 | |
4 World Trade Center Project, 5.00%, 11/15/31 | | | | | 860 | | | | 938,269 | |
4 World Trade Center Project, 5.00%, 11/15/44 | | | | | 7,655 | | | | 8,219,480 | |
4 World Trade Center Project, 5.75%, 11/15/51 | | | | | 1,340 | | | | 1,502,193 | |
7 World Trade Center Project, Class 1, 4.00%, 9/15/35 | | | | | 1,935 | | | | 2,005,743 | |
7 World Trade Center Project, Class 2, 5.00%, 9/15/43 | | | | | 1,670 | | | | 1,799,174 | |
7 World Trade Center Project, Class 3, 5.00%, 3/15/44 | | | | | 2,070 | | | | 2,172,837 | |
| | | | | | | | | 61,623,278 | |
Education — 29.6% | | | | | | | | | | |
Albany Industrial Development Agency, RB, New Covenant Charter School Project, Series A (c)(d): | | | | | | | | | | |
7.00%, 5/01/25 | | | | | 910 | | | | 136,555 | |
7.00%, 5/01/35 | | | | | 590 | | | | 88,535 | |
Amherst Development Corp., Refunding RB, University at Buffalo Foundation Faculty-Student Housing Corp., Series A (AGM), 4.63%, 10/01/40 | | | | | 1,100 | | | | 1,147,883 | |
Build NYC Resource Corp., RB, Series A: | | | | | | | | | | |
Bronx Charter School for Excellence Project, 5.50%, 4/01/43 | | | | | 900 | | | | 930,627 | |
Bronx Charter School for International Cultures & The Arts Project, 5.00%, 4/15/33 | | | | | 900 | | | | 819,342 | |
City of New York New York Trust for Cultural Resources, RB, Juilliard School, Series A, 5.00%, 1/01/39 | | | | | 750 | | | | 837,367 | |
City of New York New York Trust for Cultural Resources, Refunding RB: | | | | | | | | | | |
American Museum of National History, Series A (NPFGC), 5.00%, 7/01/37 | | | | | 225 | | | | 254,477 | |
Carnegie Hall, Series A, 4.75%, 12/01/39 | | | | | 2,000 | | | | 2,078,120 | |
Museum of Modern Art, Series 1A, 5.00%, 4/01/31 | | | | | 1,000 | | | | 1,119,870 | |
City of Troy New York Capital Resource Corp., Refunding RB, Rensselaer Polytechnic Institute Project, Series A, 5.13%, 9/01/40 | | | | | 3,135 | | | | 3,362,131 | |
City of Yonkers New York Industrial Development Agency, RB, Sarah Lawrence College Project, Series A, 6.00%, 6/01/41 | | | | | 625 | | | | 684,000 | |
County of Cattaraugus New York, RB, 5.00%, 5/01/34 | | | | | 170 | | | | 178,279 | |
County of Dutchess New York Industrial Development Agency, RB, Bard College Civic Facility, Series A-2, 4.50%, 8/01/36 | | | | | 6,100 | | | | 5,642,134 | |
County of Madison New York Capital Resource Corp., Refunding RB, Colgate University Project, Series A, 4.50%, 7/01/39 | | | | | 135 | | | | 144,193 | |
County of Madison New York Industrial Development Agency New York, RB, Commons II LLC, Student Housing, Series A (CIFG), 5.00%, 6/01/33 | | | | | 275 | | | | 280,745 | |
County of Monroe New York Industrial Development Corp., RB, University of Rochester Project, Series A, 5.00%, 7/01/31 | | | | | 1,900 | | | | 2,111,888 | |
See Notes to Financial Statements.
| ANNUAL REPORT | JULY 31, 2014 | 41
|
| |
| Schedule of Investments (continued) | BlackRock New York Municipal Income Trust (BNY)
(Percentages shown are based on Net Assets) |
| Municipal Bonds | | | | Par
(000) | | Value |
New York (continued) |
Education (concluded) | | | | | | | | | | |
County of Monroe New York Industrial Development Corp., Refunding RB, University of Rochester Project, Series A, 5.00%, 7/01/38 | | | | $ | 320 | | | $ | 352,106 | |
County of Nassau New York Industrial Development Agency, Refunding RB, New York Institute of Technology Project, Series A, 4.75%, 3/01/26 | | | | | 1,165 | | | | 1,218,800 | |
County of Orange New York Funding Corp., Refunding RB, Mount St. Mary College Project, Series A: | | | | | | | | | | |
5.00%, 7/01/37 | | | | | 360 | | | | 374,051 | |
5.00%, 7/01/42 | | | | | 220 | | | | 226,954 | |
County of St. Lawrence New York Industrial Development Agency, RB, Clarkson University Project, 5.38%, 9/01/41 | | | | | 750 | | | | 826,402 | |
County of Tompkins New York Development Corp., RB, Ithaca College Project (AGM), 5.50%, 7/01/33 | | | | | 700 | | | | 774,732 | |
Geneva Development Corp., Refunding RB, Hobart and William Smith Colleges, 5.25%, 9/01/44 | | | | | 500 | | | | 552,810 | |
State of New York Dormitory Authority, RB: | | | | | | | | | | |
Convent of the Sacred Heart (AGM), 5.25%, 11/01/24 | | | | | 155 | | | | 180,098 | |
Convent of the Sacred Heart (AGM), 5.63%, 11/01/32 | | | | | 750 | | | | 845,992 | |
Convent of the Sacred Heart (AGM), 5.75%, 11/01/40 | | | | | 210 | | | | 234,696 | |
Mount Sinai School of Medicine, 5.13%, 7/01/39 | | | | | 2,000 | | | | 2,105,840 | |
New York University, Series 1 (AMBAC), 5.50%, 7/01/40 | | | | | 1,440 | | | | 1,805,558 | |
New York University, Series A (AMBAC), 5.00%, 7/01/37 | | | | | 1,000 | | | | 1,097,710 | |
New York University, Series B, 5.00%, 7/01/37 | | | | | 1,250 | | | | 1,390,512 | |
State University Dormitory Facilities, Series A, 5.00%, 7/01/39 | | | | | 750 | | | | 800,040 | |
State University Dormitory Facilities, Series A, 5.00%, 7/01/41 | | | | | 2,000 | | | | 2,172,580 | |
Teachers College, Series B, 5.00%, 7/01/42 | | | | | 3,225 | | | | 3,475,905 | |
University of Rochester, Series A, 5.13%, 7/01/39 | | | | | 850 | | | | 950,963 | |
University of Rochester, Series A, 5.75%, 7/01/39 | | | | | 650 | | | | 746,837 | |
University of Rochester, Series B, 5.00%, 7/01/39 | | | | | 500 | | | | 539,640 | |
State of New York Dormitory Authority, Refunding RB: | | | | | | | | | | |
3rd General Resolution, State University Educational Facilities Issue, Series A, 5.00%, 5/15/29 | | | | | 2,000 | | | | 2,264,040 | |
Brooklyn Law School, 5.75%, 7/01/33 | | | | | 475 | | | | 510,435 | |
Cornell University, Series A, 5.00%, 7/01/40 | | | | | 1,000 | | | | 1,132,420 | |
Culinary Institute of America, 5.00%, 7/01/42 | | | | | 300 | | | | 312,318 | |
Fordham University, 4.00%, 7/01/30 | | | | | 555 | | | | 568,620 | |
Fordham University, 5.00%, 7/01/44 | | | | | 850 | | | | 934,337 | |
New York University, Series A, 5.00%, 7/01/37 | | | | | 1,790 | | | | 1,991,214 | |
Rochester Institute of Technology, 5.00%, 7/01/42 | | | | | 1,790 | | | | 1,938,158 | |
Rockefeller University, Series B, 4.00%, 7/01/38 | | | | | 775 | | | | 800,490 | |
Skidmore College, Series A, 5.00%, 7/01/27 | | | | | 190 | | | | 214,651 | |
Skidmore College, Series A, 5.00%, 7/01/28 | | | | | 75 | | | | 84,007 | |
Skidmore College, Series A, 5.25%, 7/01/29 | | | | | 85 | | | | 96,240 | |
State University Dormitory Facilities, Series A, 5.25%, 7/01/30 | | | | | 2,355 | | | | 2,687,620 | |
State University Dormitory Facilities, Series A, 5.25%, 7/01/32 | | | | | 445 | | | | 500,928 | |
State University Dormitory Facilities, Series A, 5.00%, 7/01/42 | | | | | 895 | | | | 976,114 | |
Teachers College, 5.50%, 3/01/39 | | | | | 450 | | | | 494,464 | |
| | | | | | | | | 55,994,428 | |
Health — 15.6% | | | | | | | | | | |
County of Dutchess New York Local Development Corp., Refunding RB, Health Quest System, Inc., Series A, 5.75%, 7/01/40 | | | | | 300 | | | | 330,225 | |
| Municipal Bonds | | | | Par
(000) | | Value |
New York (continued) |
Health (concluded) | | | | | | | | | | |
County of Genesee New York Industrial Development Agency, Refunding RB, United Memorial Medical Center Project, 5.00%, 12/01/27 | | | | $ | 500 | | | $ | 500,085 | |
County of Monroe New York Industrial Development Corp., RB, Rochester General Hospital Project, Series A, 5.00%, 12/01/32 | | | | | 240 | | | | 258,439 | |
County of Monroe New York Industrial Development Corp., Refunding RB, Unity Hospital of Rochester Project (FHA), 5.50%, 8/15/40 | | | | | 1,650 | | | | 1,887,699 | |
County of Nassau New York Local Economic Assistance Corp., Refunding RB, Winthrop University Hospital Association Project, 5.00%, 7/01/42 | | | | | 2,750 | | | | 2,844,325 | |
County of Suffolk New York Industrial Development Agency, Refunding RB, Jefferson’s Ferry Project, 5.00%, 11/01/28 | | | | | 1,175 | | | | 1,212,494 | |
County of Westchester New York Healthcare Corp., Refunding RB, Senior Lien: | | | | | | | | | | |
Remarketing, Series A, 5.00%, 11/01/30 | | | | | 3,500 | | | | 3,729,530 | |
Series B, 6.00%, 11/01/30 | | | | | 500 | | | | 566,895 | |
County of Westchester New York Local Development Corp., Refunding RB, Kendal On Hudson Project: | | | | | | | | | | |
4.00%, 1/01/23 | | | | | 650 | | | | 673,992 | |
5.00%, 1/01/28 | | | | | 675 | | | | 715,878 | |
5.00%, 1/01/34 | | | | | 1,250 | | | | 1,314,813 | |
State of New York Dormitory Authority, RB: | | | | | | | | | | |
Hudson Valley Hospital (BHAC) 5.00%, 8/15/36 | | | | | 750 | | | | 818,648 | |
Mental Health Services Facility, Series B (AMBAC), 5.00%, 2/15/15 (e) | | | | | 325 | | | | 333,489 | |
New York State Association for Retarded Children, Inc., Series A, 6.00%, 7/01/32 | | | | | 500 | | | | 568,940 | |
New York State Association for Retarded Children, Inc., Series B (AMBAC), 6.00%, 7/01/32 | | | | | 200 | | | | 219,274 | |
New York University Hospitals Center, Series A, 6.00%, 7/01/40 | | | | | 500 | | | | 557,220 | |
New York University Hospitals Center, Series B, 5.63%, 7/01/37 | | | | | 530 | | | | 577,859 | |
North Shore-Long Island Jewish Obligated Group, Series A, 5.50%, 5/01/37 | | | | | 1,775 | | | | 1,916,112 | |
North Shore-Long Island Jewish Obligated Group, Series D, 4.25%, 5/01/39 | | | | | 1,000 | | | | 1,015,130 | |
State of New York Dormitory Authority, Refunding RB: | | | | | | | | | | |
Miriam Osborn Memorial Home Association, 5.00%, 7/01/29 | | | | | 290 | | | | 307,467 | |
Mount Sinai Hospital, Series A, 5.00%, 7/01/26 | | | | | 1,385 | | | | 1,533,735 | |
New York University Hospitals Center, Series A, 5.00%, 7/01/36 | | | | | 3,390 | | | | 3,514,481 | |
North Shore-Long Island Jewish Obligated Group, Series A, 5.00%, 5/01/32 | | | | | 1,750 | | | | 1,889,037 | |
North Shore-Long Island Jewish Obligated Group, Series A, 5.00%, 5/01/41 | | | | | 1,000 | | | | 1,065,890 | |
North Shore-Long Island Jewish Obligated Group, Series E, 5.50%, 5/01/33 | | | | | 1,100 | | | | 1,194,446 | |
| | | | | | | | | 29,546,103 | |
Housing — 1.5% | | | | | | | | | | |
State of New York HFA, RB, M/F Housing, Highland Avenue Senior Apartments, Series A, AMT (SONYMA), 5.00%, 2/15/39 | | | | | 1,500 | | | | 1,517,055 | |
State of New York Mortgage Agency, RB, S/F Housing, 49th Series, 4.00%, 10/01/43 | | | | | 1,000 | | | | 1,005,500 | |
State of New York Mortgage Agency, Refunding RB, 48th Series, 3.70%, 10/01/38 | | | | | 360 | | | | 353,768 | |
| | | | | | | | | 2,876,323 | |
See Notes to Financial Statements.
| 42 | ANNUAL REPORT | JULY 31, 2014
|
| |
| Schedule of Investments (continued) | BlackRock New York Municipal Income Trust (BNY)
(Percentages shown are based on Net Assets) |
| Municipal Bonds | | | | Par
(000) | | Value |
New York (continued) |
State — 13.7% | | | | | | | | | | |
City of New York New York Transitional Finance Authority, BARB, Series S-2 (NPFGC), 4.25%, 1/15/34 | | | | $ | 1,260 | | | $ | 1,280,550 | |
City of New York New York Transitional Finance Authority, RB, Future Tax Secured, 5.00%, 2/01/32 | | | | | 5,000 | | | | 5,710,250 | |
State of New York Dormitory Authority, ERB, Series B, 5.75%, 3/15/36 | | | | | 600 | | | | 695,568 | |
State of New York Dormitory Authority, RB: | | | | | | | | | | |
(AMBAC), 5.00%, 2/15/35 | | | | | 1,675 | | | | 1,707,830 | |
General Purpose, Series B, 5.00%, 3/15/42 | | | | | 4,380 | | | | 4,764,082 | |
General, Purpose, Series C, 5.00%, 3/15/34 | | | | | 2,185 | | | | 2,429,414 | |
Series A, 5.25%, 1/01/34 | | | | | 800 | | | | 869,560 | |
Series A, 5.50%, 1/01/39 | | | | | 2,000 | | | | 2,185,280 | |
State of New York Dormitory Authority, Refunding RB: | | | | | | | | | | |
General Purpose Bonds, Series D, 5.00%, 2/15/34 | | | | | 500 | | | | 557,730 | |
School Districts Financing Program, Series A (AGM), 5.00%, 10/01/35 | | | | | 395 | | | | 431,992 | |
State of New York Thruway Authority, RB, Transportation, Series A, 5.00%, 3/15/32 | | | | | 320 | | | | 362,576 | |
State of New York Thruway Authority, Refunding RB, 2nd General Highway and Bridge Trust, Series A, 5.00%, 4/01/32 | | | | | 3,500 | | | | 3,907,505 | |
State of New York Urban Development Corp., RB, State Personal Income Tax, Series C, 5.00%, 3/15/30 | | | | | 885 | | | | 1,011,343 | |
| | | | | | | | | 25,913,680 | |
Transportation — 17.5% | | | | | | | | | | |
Metropolitan Transportation Authority, RB: | | | | | | | | | | |
Series A-1, 5.25%, 11/15/33 | | | | | 540 | | | | 611,615 | |
Series C, 6.50%, 11/15/28 | | | | | 1,000 | | | | 1,192,390 | |
Series D, 5.25%, 11/15/41 | | | | | 1,000 | | | | 1,096,170 | |
Series E, 5.00%, 11/15/38 | | | | | 4,000 | | | | 4,359,400 | |
Series H, 5.00%, 11/15/25 | | | | | 325 | | | | 379,155 | |
Metropolitan Transportation Authority, Refunding RB: | | | | | | | | | | |
Series D, 5.25%, 11/15/30 | | | | | 910 | | | | 1,050,923 | |
Series F, 5.00%, 11/15/30 | | | | | 2,000 | | | | 2,238,560 | |
Series F (AGM), 4.00%, 11/15/30 | | | | | 1,250 | | | | 1,285,500 | |
Port Authority of New York & New Jersey, ARB: | | | | | | | | | | |
Consolidated 183rd Series, 4.00%, 6/15/44 | | | | | 500 | | | | 501,195 | |
JFK International Air Terminal LLC, Special Project, Series 6, AMT (NPFGC), 5.75%, 12/01/22 | | | | | 6,000 | | | | 6,036,060 | |
JFK International Air Terminal LLC, Special Project, Series 8, AMT (NPFGC), 6.00%, 12/01/42 | | | | | 1,000 | | | | 1,147,280 | |
Port Authority of New York & New Jersey, Refunding ARB: | | | | | | | | | | |
179th Series, 5.00%, 12/01/38 | | | | | 575 | | | | 642,171 | |
Consolidated, 146th Series, AMT (AGM), 4.50%, 12/01/34 | | | | | 500 | | | | 508,730 | |
Consolidated, 147th Series, AMT, 4.75%, 4/15/37 | | | | | 1,330 | | | | 1,360,749 | |
Consolidated, 177th Series, AMT, 4.00%, 1/15/43 | | | | | 1,970 | | | | 1,950,123 | |
Consolidated, 178th Series, AMT, 5.00%, 12/01/43 | | | | | 500 | | | | 538,195 | |
Port Authority of New York & New Jersey, Refunding RB, 178th Series, AMT, 5.00%, 12/01/33 | | | | | 750 | | | | 830,070 | |
State of New York Thruway Authority, Refunding RB, General, Series I: | | | | | | | | | | |
5.00%, 1/01/27 | | | | | 2,000 | | | | 2,278,420 | |
5.00%, 1/01/37 | | | | | 2,920 | | | | 3,197,867 | |
5.00%, 1/01/42 | | | | | 280 | | | | 303,979 | |
Triborough Bridge & Tunnel Authority, Refunding RB, CAB (b): | | | | | | | | | | |
Sub-Series A, 0.00%, 11/15/32 | | | | | 845 | | | | 401,671 | |
General, Series B, 0.00%, 11/15/32 | | | | | 2,500 | | | | 1,224,725 | |
| | | | | | | | | 33,134,948 | |
| Municipal Bonds | | | | Par
(000) | | Value |
New York (concluded) |
Utilities — 9.9% | | | | | | | | | | |
City of New York New York Municipal Water Finance Authority, RB, Series B, 5.00%, 6/15/36 | | | | $ | 750 | | | $ | 796,912 | |
City of New York New York Municipal Water Finance Authority, Refunding RB: | | | | | | | | | | |
2nd General Resolution, Series BB, 5.00%, 6/15/31 | | | | | 1,000 | | | | 1,129,570 | |
Water & Sewer System, Series A, 4.75%, 6/15/30 | | | | | 1,500 | | | | 1,637,940 | |
City of New York New York Water & Sewer System, Refunding RB, Series D, 5.00%, 6/15/39 | | | | | 5,000 | | | | 5,160,500 | |
Long Island Power Authority, RB: | | | | | | | | | | |
General, Electric System, Series C (CIFG), 5.25%, 9/01/29 | | | | | 2,000 | | | | 2,378,860 | |
Series A (AGM), 5.00%, 5/01/36 | | | | | 500 | | | | 534,785 | |
Long Island Power Authority, Refunding RB, Electric System, Series A, 5.75%, 4/01/39 | | | | | 4,000 | | | | 4,533,320 | |
State of New York Environmental Facilities Corp., Refunding RB, Revolving Funds New York City Municipal Water, 2nd General Resolution, Series B, 5.00%, 6/15/36 | | | | | 350 | | | | 391,402 | |
Utility Debt Securitization Authority, Refunding RB, 5.00%, 12/15/41 | | | | | 2,000 | | | | 2,251,480 | |
| | | | | | | | | 18,814,769 | |
Total Municipal Bonds in New York | | | | | | | | | 255,461,764 | |
|
Puerto Rico — 1.3% |
Housing — 1.3% | | | | | | | | | | |
Puerto Rico Housing Finance Authority, Refunding RB, M/F Housing, Subordinate, Capital Fund Modernization, 5.13%, 12/01/27 | | | | | 2,500 | | | | 2,524,475 | |
Total Municipal Bonds — 136.1% | | | | | | | | | 257,986,239 | |
|
Municipal Bonds Transferred to
Tender Option Bond Trusts (f) |
New York — 26.8% |
County/City/Special District/School District — 5.5% | | | | | | | | | | |
City of New York New York, GO: | | | | | | | | | | |
Sub-Series G-1, 5.00%, 4/01/29 | | | | | 4,370 | | | | 4,967,641 | |
Sub-Series I-1, 5.00%, 3/01/36 | | | | | 1,500 | | | | 1,671,465 | |
City of New York New York Transitional Finance Authority, RB, Future Tax Secured, Sub-Series D-1, 5.00%, 11/01/38 | | | | | 825 | | | | 915,296 | |
New York Liberty Development Corp., Refunding RB, 7 World Trade Center Project, Class 1, 5.00%, 9/15/40 | | | | | 2,610 | | | | 2,869,826 | |
| | | | | | | | | 10,424,228 | |
Education — 2.1% | | | | | | | | | | |
City of New York New York Trust for Cultural Resources, Refunding RB, Wildlife Conservation Society, Series A, 5.00%, 8/01/33 | | | | | 3,527 | | | | 3,967,430 | |
State — 2.0% | | | | | | | | | | |
City of New York New York Transitional Finance Authority, BARB, Fiscal 2009, Series S-3, 5.25%, 1/15/39 | | | | | 660 | | | | 738,736 | |
Hudson New York Yards Infrastructure Corp., RB, Senior Bond, Fiscal 2012, Series A, 5.75%, 2/15/47 (g) | | | | | 1,250 | | | | 1,421,921 | |
State of New York Dormitory Authority, RB, General Purpose, Series C, 5.00%, 3/15/41 | | | | | 1,500 | | | | 1,640,250 | |
| | | | | | | | | 3,800,907 | |
See Notes to Financial Statements.
| ANNUAL REPORT | JULY 31, 2014 | 43
|
| |
| Schedule of Investments (continued) | BlackRock New York Municipal Income Trust (BNY)
(Percentages shown are based on Net Assets) |
Municipal Bonds Transferred to
Tender Option Bond Trusts (f) | | | | Par
(000) | | Value |
New York (continued) |
Transportation — 5.4% | | | | | | | | | | |
New York Liberty Development Corp., RB, 1 World Trade Center Port Authority Consolidated, 5.25%, 12/15/43 | | | | $ | 6,495 | | | $ | 7,156,711 | |
Port Authority of New York & New Jersey, ARB, Consolidated, 169th Series, AMT, 5.00%, 10/15/26 | | | | | 1,500 | | | | 1,699,395 | |
State of New York Thruway Authority, Refunding RB, Transportation, Personal Income Tax, Series A, 5.00%, 3/15/31 | | | | | 1,180 | | | | 1,339,182 | |
| | | | | | | | | 10,195,288 | |
Utilities — 11.8% | | | | | | | | | | |
City of New York New York Municipal Water Finance Authority, RB, Fiscal 2009, Series A, 5.75%, 6/15/40 | | | | | 1,200 | | | | 1,372,858 | |
City of New York New York Municipal Water Finance Authority, Refunding RB, Water & Sewer System: | | | | | | | | | | |
2nd General Resolution, Fiscal 2011, Series HH, 5.00%, 6/15/32 | | | | | 5,310 | | | | 5,918,207 | |
2nd General Resolution, Fiscal 2012, Series BB, 5.00%, 6/15/44 | | | | | 3,511 | | | | 3,810,176 | |
2nd General Resolution, Series FF-2, 5.50%, 6/15/40 | | | | | 810 | | | | 926,489 | |
Series A, 4.75%, 6/15/30 | | | | | 2,500 | | | | 2,729,900 | |
| Municipal Bonds | | | | Par
(000) | | Value |
New York (concluded) |
Utilities (concluded) | | | | | | | | | | |
Utility Debt Securitization Authority, Refunding RB, 5.00%, 12/15/41 | | | | $ | 6,868 | | | $ | 7,731,487 | |
| | | | | | | | | 22,489,117 | |
Total Municipal Bonds Transferred to
Tender Option Bond Trusts — 26.8% | | | | | | | | | 50,876,970 | |
Total Long-Term Investments
(Cost — $293,402,648) — 162.9% | | | | | | | | | 308,863,209 | |
|
Short-Term Securities | | | | Shares
| | | | |
BIF New York Municipal Money Fund, 0.00% (h)(i) | | | | | 874,210 | | | | 874,210 | |
Total Short-Term Securities
(Cost — $874,210) — 0.5% | | | | | | | | | 874,210 | |
Total Investments
(Cost — $294,276,858) — 163.4% | | 309,737,419 | |
Other Assets Less Liabilities — 1.5% | | | | | | 2,776,692 | |
Liability for TOB Trust Certificates, Including Interest Expense and Fees Payable — (15.0%) | | | | | | | | | (28,466,200 | ) |
VMTP Shares, at Liquidation
Value — (49.9%) | | | | | | | | | (94,500,000 | ) |
Net Assets Applicable to Common Shares — 100.0% | | | | | | | | $ | 189,547,911 | |
Notes to Schedule of Investments
| (a) | | | | Variable rate security. Rate shown is as of report date. |
| (b) | | | | Zero-coupon bond. |
| (c) | | | | Non-income producing security. |
| (d) | | | | Issuer filed for bankruptcy and/or is in default of principal and/or interest payments. |
| (e) | | | | U.S. government securities, held in escrow, are used to pay interest on this security, as well as to retire the bond in full at the date indicated, typically at a premium to par. |
| (f) | | | | Represent bonds transferred to a TOB. In exchange for which the Trust received cash and residual interest certificates. These bonds serve as collateral in a financing transaction. See Note 3 of the Notes to Financial Statements for details of municipal bonds transferred to TOBs. |
| (g) | | | | All or a portion of security is subject to a recourse agreement, which may require the Trust to pay the liquidity provider in the event there is a shortfall between the TOB trust certificates and proceeds received from the sale of the security contributed to the TOB trust. In the case of a shortfall, the aggregate maximum potential amount the Trust could ultimately be required to pay under the agreement, which expires on February 15, 2019 is $661,835. |
| (h) | | | | Investments in issuers considered to be an affiliate of the Trust during the year ended July 31, 2014, for purposes of Section 2(a)(3) of the 1940 Act, were as follows: |
| Affiliate | | | | Shares
Held at
July 31, 2013 | | Net
Activity | | Shares
Held at
July 31, 2014 | | Income |
BIF New York Municipal Money Fund | | | | 7,477,704 | | (6,603,494) | | 874,210 | | $1,032 |
| (i) | | | | Represents the current yield as of report date. |
| • | | | | Financial futures contracts outstanding as of July 31, 2014 were as follows: |
Contracts
Sold | | | | Issue | | Exchange | | Expiration | | Notional
Value | | Unrealized
Appreciation |
| (165) | | | | 10-Year U.S. Treasury Note | | Chicago Board of Trade | | September 2014 | | $20,560,547 | | $64,222 |
| • | | | | For Trust compliance purposes, the Trust’s sector classifications refer to any one or more of the sector sub-classifications used by one or more widely recognized market indexes or rating group indexes, and/or as defined by the investment advisor. These definitions may not apply for purposes of this report, which may combine such sector sub-classifications for reporting ease. |
See Notes to Financial Statements.
| 44 | ANNUAL REPORT | JULY 31, 2014
|
| |
| Schedule of Investments (concluded) | BlackRock New York Municipal Income Trust (BNY)
|
| • | | | | Fair Value Measurements – Various inputs are used in determining the fair value of investments and derivative financial instruments. These inputs to valuation techniques are categorized into a disclosure hierarchy consisting of three broad levels for financial statement purposes as follows: |
| • | | | | Level 1 – unadjusted price quotations in active markets/exchanges for identical assets or liabilities that the Trust has the ability to access |
| • | | | | Level 2 – other observable inputs (including, but not limited to, quoted prices for similar assets or liabilities in markets that are active, quoted prices for identical or similar assets or liabilities in markets that are not active, inputs other than quoted prices that are observable for the assets or liabilities (such as interest rates, yield curves, volatilities, prepayment speeds, loss severities, credit risks and default rates) or other market-corroborated inputs) |
| • | | | | Level 3 – unobservable inputs based on the best information available in the circumstances, to the extent observable inputs are not available (including the Trust’s own assumptions used in determining the fair value of investments and derivative financial instruments) |
| | | | | The hierarchy gives the highest priority to unadjusted quoted prices in active markets for identical assets or liabilities (Level 1 measurements) and the lowest priority to unobservable inputs (Level 3 measurements). Accordingly, the degree of judgment exercised in determining fair value is greatest for instruments categorized in Level 3. The inputs used to measure fair value may fall into different levels of the fair value hierarchy. In such cases, for disclosure purposes, the fair value hierarchy classification is determined based on the lowest level input that is significant to the fair value measurement in its entirety. |
| | | | | Changes in valuation techniques may result in transfers into or out of an assigned level within the disclosure hierarchy. In accordance with the Trust’s policy, transfers between different levels of the fair value disclosure hierarchy are deemed to have occurred as of the beginning of the reporting period. The categorization of a value determined for investments and derivative financial instruments is based on the pricing transparency of the investment and derivative financial instrument and is not necessarily an indication of the risks associated with investing in those securities. For information about the Trust’s policy regarding valuation of investments and derivative financial instruments, please refer to Note 2 of the Notes to Financial Statements. |
| | | | | The following tables summarize the Trust’s investments and derivative financial instruments categorized in the disclosure hierarchy as of July 31, 2014: |
| | | | | Level 1 | | Level 2 | | Level 3 | | Total |
Assets:
| | | | | | | | | | | | | | | | | | |
Investments:
| | | | | | | | | | | | | | | | | | |
Long-Term Investments1 | | | | | — | | | $ | 308,863,209 | | | | — | | | $ | 308,863,209 | |
Short-Term Securities | | | | $ | 874,210 | | | | — | | | | — | | | | 874,210 | |
Total
| | | | $ | 874,210 | | | $ | 308,863,209 | | | | — | | | $ | 309,737,419 | |
| 1 | See above Schedule of Investments for values in each sector. |
| | | | | Level 1 | | Level 2 | | Level 3 | | Total |
Derivative Financial Instruments2
| | | | | | | | | | | | | | | | | | |
Assets:
| | | | | | | | | | | | | | | | | | |
Interest rate contracts | | | | $ | 64,222 | | | | — | | | | — | | | $ | 64,222 | |
| 2 | Derivative financial instruments are financial futures contracts, which are valued at the unrealized appreciation/depreciation on the instrument. |
| | | | | The Trust may hold assets and/or liabilities in which the fair value approximates the carrying amount for financial statement purposes. As of July 31, 2014, such assets and/or liabilities are categorized within the disclosure hierarchy as follows: |
| | | | | Level 1 | | Level 2 | | Level 3 | | Total |
Assets:
| | | | | | | | | | | | | | | | | | |
Cash pledged for financial futures contracts | | | | $ | 226,000 | | | | — | | | | — | | | $ | 226,000 | |
Liabilities:
| | | | | | | | | | | | | | | | | | |
TOB trust certificates | | | | | — | | | $ | (28,460,581 | ) | | | — | | | | (28,460,581 | ) |
VMTP Shares | | | | | — | | | | (94,500,000 | ) | | | — | | | | (94,500,000 | ) |
Total
| | | | $ | 226,000 | | | $ | (122,960,581 | ) | | | — | | | $ | (122,734,581 | ) |
| | | | | There were no transfers between levels during the year ended July 31, 2014. |
See Notes to Financial Statements.
| ANNUAL REPORT | JULY 31, 2014 | 45
|
| |
| Statements of Assets and Liabilities |
|
| July 31, 2014 | | | | BlackRock
California
Municipal
Income Trust
(BFZ) | | BlackRock
Florida
Municipal 2020
Term Trust
(BFO) | | BlackRock
Municipal
Income
Investment
Trust
(BBF) | | BlackRock
Municipal
Target
Term Trust
(BTT) | | BlackRock
New Jersey
Municipal
Income Trust
(BNJ) | | BlackRock
New York
Municipal
Income Trust
(BNY) |
| |
Assets |
Investments at value — unaffiliated1 | | | | $ | 778,659,226 | | | $ | 85,618,704 | | | $ | 162,093,754 | | | $ | 2,457,431,823 | | | $ | 193,526,445 | | | $ | 308,863,209 | |
Investments at value — affiliated2 | | | | | 540,673 | | | | 123,907 | | | | 1,298,709 | | | | 5,417,254 | | | | 1,307,069 | | | | 874,210 | |
| Cash pledged for financial futures contracts | | | | | 436,000 | | | | — | | | | 88,000 | | | | 2,377,002 | | | | 99,000 | | | | 226,000 | |
| Investments sold receivable | | | | | 14,522,274 | | | | 40,502 | | | | 20,256 | | | | — | | | | — | | | | — | |
| Interest receivable | | | | | 11,185,387 | | | | 893,926 | | | | 1,981,594 | | | | 25,247,220 | | | | 1,685,608 | | | | 3,644,175 | |
| Deferred offering costs | | | | | 51,795 | | | | — | | | | 133,950 | | | | 816,094 | | | | 31,942 | | | | 37,770 | |
| Variation margin receivable on financial futures contracts | | | | | 14,952 | | | | — | | | | 3,000 | | | | 90,462 | | | | 3,375 | | | | 7,734 | |
| Prepaid expenses | | | | | 31,825 | | | | 14,688 | | | | 63,137 | | | | 42,463 | | | | 25,749 | | | | 26,987 | |
| Total assets | | | | | 805,442,132 | | | | 86,691,727 | | | | 165,682,400 | | | | 2,491,422,318 | | | | 196,679,188 | | | | 313,680,085 | |
| |
Accrued Liabilities |
| Investments purchased payable | | | | | 20,024,967 | | | | — | | | | — | | | | — | | | | — | | | | — | |
| Income dividends payable — Common Shares | | | | | 2,301,310 | | | | 22,900 | | | | 485,240 | | | | 5,640,446 | | | | 575,009 | | | | 891,085 | |
| Investment advisory fees payable | | | | | 384,298 | | | | 36,661 | | | | 83,922 | | | | 736,789 | | | | 99,496 | | | | 158,777 | |
| Officer’s and Trustees’ fees payable | | | | | 74,433 | | | | 9,639 | | | | 18,092 | | | | 15,274 | | | | 21,049 | | | | 32,739 | |
| Interest expense and fees payable | | | | | 24,673 | | | | 95 | | | | 6,085 | | | | 51,012 | | | | 3,770 | | | | 5,619 | |
| Offering costs payable | | | | | — | | | | — | | | | — | | | | 286,782 | | | | — | | | | — | |
| Other accrued expenses payable | | | | | 103,765 | | | | 58,981 | | | | 44,020 | | | | 196,426 | | | | 69,781 | | | | 83,373 | |
| Total accrued liabilities | | | | | 22,913,446 | | | | 128,276 | | | | 637,359 | | | | 6,926,729 | | | | 769,105 | | | | 1,171,593 | |
| |
Other Liabilities |
| TOB trust certificates | | | | | 106,697,554 | | | | 190,000 | | | | 29,682,276 | | | | 184,119,974 | | | | 17,301,282 | | | | 28,460,581 | |
RVMTP Shares, at liquidation value of $5,000,000
per share3,4 | | | | | — | | | | — | | | | — | | | | 750,000,000 | | | | — | | | | — | |
VMTP Shares, at liquidation value of $100,000 per share3,4 | | | | | 171,300,000 | | | | — | | | | — | | | | — | | | | 59,100,000 | | | | 94,500,000 | |
VRDP Shares, at liquidation value of $100,000 per share3,4 | | | | | — | | | | — | | | | 34,200,000 | | | | — | | | | — | | | | — | |
| Total other liabilities | | | | | 277,997,554 | | | | 190,000 | | | | 63,882,276 | | | | 934,119,974 | | | | 76,401,282 | | | | 122,960,581 | |
| Total liabilities | | | | | 300,911,000 | | | | 318,276 | | | | 64,519,635 | | | | 941,046,703 | | | | 77,170,387 | | | | 124,132,174 | |
| |
AMPS at Redemption Value |
$25,000 per share liquidation preference, plus unpaid dividends3,4 | | | | | — | | | | 625,008 | | | | — | | | | — | | | | — | | | | — | |
Net Assets Applicable to Common Shareholders | | | | $ | 504,531,132 | | | $ | 85,748,443 | | | $ | 101,162,765 | | | $ | 1,550,375,615 | | | $ | 119,508,801 | | | $ | 189,547,911 | |
| |
Net Assets Applicable to Common Shareholders Consist of |
Paid-in capital5,6,7 | | | | $ | 446,571,010 | | | $ | 80,396,516 | | | $ | 95,045,973 | | | $ | 1,671,298,896 | | | $ | 108,747,909 | | | $ | 183,140,788 | |
| Undistributed (distributions in excess of) net investment income | | | | | 3,935,343 | | | | 2,300,229 | | | | 675,210 | | | | (3,567,803 | ) | | | 1,641,707 | | | | 3,009,264 | |
| Accumulated net realized loss | | | | | (18,430,332 | ) | | | (749,208 | ) | | | (11,095,716 | ) | | | (87,490,502 | ) | | | (2,568,237 | ) | | | (12,126,924 | ) |
| Net unrealized appreciation/depreciation | | | | | 72,455,111 | | | | 3,800,906 | | | | 16,537,298 | | | | (29,864,976 | ) | | | 11,687,422 | | | | 15,524,783 | |
Net Assets Applicable to Common Shareholders | | | | $ | 504,531,132 | | | $ | 85,748,443 | | | $ | 101,162,765 | | | $ | 1,550,375,615 | | | $ | 119,508,801 | | | $ | 189,547,911 | |
| Net asset value per Common Share | | | | $ | 15.83 | | | $ | 15.42 | | | $ | 15.09 | | | $ | 21.99 | | | $ | 15.61 | | | $ | 14.68 | |
1 Investments at cost — unaffiliated | | | | $ | 706,280,926 | | | $ | 81,817,798 | | | $ | 145,583,866 | | | $ | 2,487,344,304 | | | $ | 181,869,860 | | | $ | 293,402,648 | |
2 Investments at cost — affiliated | | | | $ | 540,673 | | | $ | 123,907 | | | $ | 1,298,709 | | | $ | 5,417,254 | | | $ | 1,307,069 | | | $ | 874,210 | |
3 Preferred Shares outstanding, par value $0.001 per share | | | | | 1,713 | | | | 25 | | | | 342 | | | | 150 | | | | 591 | | | | 945 | |
4 Preferred Shares authorized | | | | | unlimited | | | | unlimited | | | | unlimited | | | | unlimited | | | | unlimited | | | | unlimited | |
5 Par value per Common Share | | | | $ | 0.001 | | | $ | 0.001 | | | $ | 0.001 | | | $ | 0.001 | | | $ | 0.001 | | | $ | 0.001 | |
6 Common Shares outstanding | | | | | 31,874,095 | | | | 5,562,128 | | | | 6,704,527 | | | | 70,505,571 | | | | 7,656,577 | | | | 12,914,274 | |
7 Common Shares authorized | | | | | unlimited | | | | unlimited | | | | unlimited | | | | unlimited | | | | unlimited | | | | unlimited | |
See Notes to Financial Statements.
| 46 | ANNUAL REPORT | JULY 31, 2014
|
| Year Ended July 31, 2014 | | | | BlackRock
California
Municipal
Income Trust
(BFZ) | | BlackRock
Florida
Municipal 2020
Term Trust
(BFO) | | BlackRock
Municipal
Income
Investment Trust
(BBF) | | BlackRock
Municipal
Target
Term Trust
(BTT) | | BlackRock
New Jersey
Municipal
Income Trust
(BNJ) | | BlackRock
New York
Municipal
Income Trust
(BNY) |
| |
Investment Income |
| Interest | | | | $ | 35,364,857 | | | $ | 3,224,750 | | | $ | 7,601,091 | | | $ | 95,785,816 | | | $ | 8,877,481 | | | $ | 13,764,967 | |
| Income — affiliated | | | | | — | | | | 857 | | | | 626 | | | | 2,893 | | | | 13 | | | | 1,032 | |
| Total income | | | | | 35,364,857 | | | | 3,225,607 | | | | 7,601,717 | | | | 95,788,709 | | | | 8,877,494 | | | | 13,765,999 | |
| |
Expenses |
| Investment advisory | | | | | 4,567,457 | | | | 460,825 | | | | 960,951 | | | | 9,375,852 | | | | 1,137,249 | | | | 1,801,476 | |
| Professional | | | | | 100,894 | | | | 52,343 | | | | 44,181 | | | | 179,197 | | | | 48,673 | | | | 65,296 | |
| Liquidity fees | | | | | — | | | | — | | | | 317,849 | | | | — | | | | — | | | | — | |
| Officer and Trustees | | | | | 52,209 | | | | 8,796 | | | | 10,553 | | | | 129,487 | | | | 12,513 | | | | 19,675 | |
| Transfer agent | | | | | 35,648 | | | | 25,388 | | | | 19,911 | | | | 118,560 | | | | 21,151 | | | | 26,764 | |
| Custodian | | | | | 34,806 | | | | 8,349 | | | | 12,516 | | | | 82,675 | | | | 13,396 | | | | 18,638 | |
| Accounting services | | | | | 31,049 | | | | 13,443 | | | | 23,831 | | | | 214,454 | | | | 28,636 | | | | 3,938 | |
| Registration | | | | | 6,679 | | | | 5,599 | | | | 5,599 | | | | 51,868 | | | | 5,622 | | | | 5,649 | |
| Printing | | | | | 5,719 | | | | 6,371 | | | | 3,916 | | | | 30,570 | | | | 8,153 | | | | 9,110 | |
| Remarketing fees on Preferred Shares | | | | | — | | | | 9,345 | | | | 34,675 | | | | — | | | | — | | | | — | |
| Miscellaneous | | | | | 85,681 | | | | 37,377 | | | | 63,437 | | | | 153,377 | | | | 60,176 | | | | 77,664 | |
| Total expenses excluding interest expense, fees and amortization of offering costs | | | | | 4,920,142 | | | | 627,836 | | | | 1,497,419 | | | | 10,336,040 | | | | 1,335,569 | | | | 2,028,210 | |
Interest expense, fees and amortization of offering costs1 | | | | | 2,729,431 | | | | 1,080 | | | | 275,387 | | | | 6,829,937 | | | | 806,180 | | | | 1,228,024 | |
| Total expenses | | | | | 7,649,573 | | | | 628,916 | | | | 1,772,806 | | | | 17,165,977 | | | | 2,141,749 | | | | 3,256,234 | |
| Less fees waived by Manager | | | | | (2,380 | ) | | | (1,183 | ) | | | (917 | ) | | | (183,965 | ) | | | (4,042 | ) | | | (2,840 | ) |
| Less fees paid indirectly | | | | | (32 | ) | | | (1 | ) | | | (6 | ) | | | (321 | ) | | | (3 | ) | | | (67 | ) |
| Total expenses after fees waived and paid indirectly | | | | | 7,647,161 | | | | 627,732 | | | | 1,771,883 | | | | 16,981,691 | | | | 2,137,704 | | | | 3,253,327 | |
| Net investment income | | | | | 27,717,696 | | | | 2,597,875 | | | | 5,829,834 | | | | 78,807,018 | | | | 6,739,790 | | | | 10,512,672 | |
| |
Realized and Unrealized Gain (Loss) |
Net realized gain (loss) from:
| | | | | | | | | | | | | | | | | | | | | | | | | | |
| Investments | | | | | 3,029,451 | | | | (12,643 | ) | | | (2,264,333 | ) | | | (23,637,261 | ) | | | (1,100,589 | ) | | | (5,374,968 | ) |
| Financial futures contracts | | | | | (772,699 | ) | | | — | | | | (138,637 | ) | | | (9,836,846 | ) | | | (162,458 | ) | | | (552,685 | ) |
| Options written | | | | | — | | | | — | | | | — | | | | (580,099 | ) | | | — | | | | — | |
| | | | | | 2,256,752 | | | | (12,643 | ) | | | (2,402,970 | ) | | | (34,054,206 | ) | | | (1,263,047 | ) | | | (5,927,653 | ) |
Net change in unrealized appreciation/depreciation on:
| | | | | | | | | | | | | | | | | | | | | | | | | | |
| Investments | | | | | 41,750,551 | | | | 1,450,413 | | | | 10,386,491 | | | | 262,089,257 | | | | 10,951,537 | | | | 21,615,419 | |
| Financial futures contracts | | | | | 76,811 | | | | — | | | | 27,410 | | | | 47,505 | | | | 30,837 | | | | 64,222 | |
| | | | | | 41,827,362 | | | | 1,450,413 | | | | 10,413,901 | | | | 262,136,762 | | | | 10,982,374 | | | | 21,679,641 | |
| Net realized and unrealized gain | | | | | 44,084,114 | | | | 1,437,770 | | | | 8,010,931 | | | | 228,082,556 | | | | 9,719,327 | | | | 15,751,988 | |
| |
Dividends and Distributions to AMPS Shareholders From |
| Net investment income | | | | | — | | | | (7,996 | ) | | | — | | | | — | | | | — | | | | — | |
Net Increase in Net Assets Applicable to Common Shareholders Resulting from Operations | | | | $ | 71,801,810 | | | $ | 4,027,649 | | | $ | 13,840,765 | | | $ | 306,889,574 | | | $ | 16,459,117 | | | $ | 26,264,660 | |
| 1 | | Related to TOBs, VMTP Shares, RVMTP Shares and/or VRDP Shares. |
See Notes to Financial Statements.
| ANNUAL REPORT | JULY 31, 2014 | 47
|
| |
| Statements of Changes in Net Assets |
|
| | | | BlackRock California
Municipal Income Trust (BFZ)
|
| |
| BlackRock Florida
Municipal 2020 Term Trust (BFO)
|
| | | | Year Ended July 31,
|
|
|
| Year Ended July 31,
|
| Increase (Decrease) in Net Assets Applicable to Common Shareholders: | | | | 2014 | | 2013 | | | | 2014 | | 2013 |
| |
Operations |
| Net investment income | | | | $ | 27,717,696 | | | $ | 28,429,898 | | | | | | | $ | 2,597,875 | | | $ | 3,765,338 | |
| Net realized gain (loss) | | | | | 2,256,752 | | | | 2,411,035 | | | | | | | | (12,643 | ) | | | 74,831 | |
| Net change in unrealized appreciation/depreciation | | | | | 41,827,362 | | | | (59,039,937 | ) | | | | | | | 1,450,413 | | | | (3,636,735 | ) |
| Dividends and Distributions to AMPS Shareholders from net investment income | | | | | — | | | | — | | | | | | | | (7,996 | ) | | | (77,727 | ) |
| Net increase (decrease) in net assets applicable to Common Shareholders resulting from operations | | | | | 71,801,810 | | | | (28,199,004 | ) | | | | | | | 4,027,649 | | | | 125,707 | |
| |
Dividends to Common Shareholders From1 |
| Net investment income | | | | | (29,544,099 | ) | | | (29,708,677 | ) | | | | | | | (3,417,928 | ) | | | (4,238,341 | ) |
| |
Capital Share Transactions |
| Reinvestment of common dividends | | | | | — | | | | 603,432 | | | | | | | | — | | | | — | |
| |
Net Assets Applicable to Common Shareholders |
| Total increase (decrease) in net assets applicable to Common Shareholders | | | | | 42,257,711 | | | | (57,304,249 | ) | | | | | | | 609,721 | | | | (4,112,634 | ) |
| Beginning of year | | | | | 462,273,421 | | | | 519,577,670 | | | | | | | | 85,138,722 | | | | 89,251,356 | |
| End of year | | | | $ | 504,531,132 | | | $ | 462,273,421 | | | | | | | $ | 85,748,443 | | | $ | 85,138,722 | |
| Undistributed net investment income, end of year | | | | $ | 3,935,343 | | | $ | 5,714,846 | | | | | | | $ | 2,300,229 | | | $ | 3,364,492 | |
| 1 | | Dividends for annual periods determined in accordance with federal income tax regulations. |
| | | | BlackRock Municipal
Income Investment Trust (BBF)
|
| |
| BlackRock Municipal
Target Term Trust (BTT)
|
| | | | Year Ended July 31,
|
|
| |
Year Ended
July 31, 2014 | | Period
August 30, 20121
to July 31, 2013 |
| Increase (Decrease) in Net Assets Applicable to Common Shareholders: | | | | 2014 | | 2013 | | | | |
| |
Operations |
Net investment income | | | | $ | 5,829,834 | | | $ | 5,731,148 | | | | | | | $ | 78,807,018 | | | $ | 55,675,510 | |
Net realized gain (loss) | | | | | (2,402,970 | ) | | | 788,098 | | | | | | | | (34,054,206 | ) | | | (53,519,716 | ) |
Net change in unrealized appreciation/depreciation | | | | | 10,413,901 | | | | (14,231,581 | ) | | | | | | | 262,136,762 | | | | (292,001,738 | ) |
Net increase (decrease) in net assets applicable to Common Shareholders resulting from operations | | | | | 13,840,765 | | | | (7,712,335 | ) | | | | | | | 306,889,574 | | | | (289,845,944 | ) |
| |
Dividends and Distributions to Common Shareholders From2 |
Net investment income | | | | | (5,822,882 | ) | | | (5,822,394 | ) | | | | | | | (76,622,483 | ) | | | (61,454,151 | ) |
Return of capital | | | | | — | | | | — | | | | | | | | (1,726,833 | ) | | | (7,606,056 | ) |
Decrease in net assets resulting from dividends and distributions to Common Shareholders | | | | | (5,822,882 | ) | | | (5,822,394 | ) | | | | | | | (78,349,316 | ) | | | (69,060,207 | ) |
| |
Capital Share Transactions |
Net proceeds from the issuance of shares | | | | | — | | | | — | | | | | | | | — | | | | 1,477,804,008 | |
Net proceeds from the underwriter’s over allotment option exercised | | | | | — | | | | — | | | | | | | | — | | | | 202,937,500 | |
Reinvestment of common dividends | | | | | — | | | | 52,510 | | | | | | | | — | | | | — | |
Net increase in net assets derived from capital share transactions | | | | | — | | | | 52,510 | | | | | | | | — | | | | 1,680,741,508 | |
| |
Net Assets Applicable to Common Shareholders |
Total increase (decrease) in net assets applicable to Common Shareholders | | | | | 8,017,883 | | | | (13,482,219 | ) | | | | | | | 228,540,258 | | | | 1,321,835,357 | |
Beginning of period | | | | | 93,144,882 | | | | 106,627,101 | | | | | | | | 1,321,835,357 | | | | — | |
End of period | | | | $ | 101,162,765 | | | $ | 93,144,882 | | | | | | | $ | 1,550,375,615 | | | $ | 1,321,835,357 | |
Undistributed (distributions in excess of) net investment income | | | | $ | 675,210 | | | $ | 643,833 | | | | | | | $ | (3,567,803 | ) | | $ | (5,713,373 | ) |
| 1 | | Commencement of operations. |
| 2 | | Dividends and distributions for annual periods determined in accordance with federal income tax regulations. |
See Notes to Financial Statements.
| 48 | ANNUAL REPORT | JULY 31, 2014
|
| |
| Statements of Changes in Net Assets |
|
| | | | BlackRock New Jersey
Municipal Income Trust (BNJ)
|
| |
| BlackRock New York
Municipal Term Trust (BNY)
|
| | | | Year Ended July 31,
|
|
|
| Year Ended July 31,
|
| Increase (Decrease) in Net Assets Applicable to Common Shareholders: | | | | 2014 | | 2013 | | | | 2014 | | 2013 |
| |
Operations |
Net investment income | | | | $ | 6,739,790 | | | $ | 6,744,653 | | | | | | | $ | 10,512,672 | | | $ | 11,286,518 | |
Net realized gain (loss) | | | | | (1,263,047 | ) | | | 1,157,320 | | | | | | | | (5,927,653 | ) | | | 521,461 | |
Net change in unrealized appreciation/depreciation | | | | | 10,982,374 | | | | (14,524,962 | ) | | | | | | | 21,679,641 | | | | (27,196,710 | ) |
Net increase (decrease) in net assets applicable to Common Shareholders resulting from operations | | | | | 16,459,117 | | | | (6,622,989 | ) | | | | | | | 26,264,660 | | | | (15,388,731 | ) |
| |
Dividends to Common Shareholders From1 |
Net investment income | | | | | (6,900,107 | ) | | | (7,215,408 | ) | | | | | | | (10,693,021 | ) | | | (11,222,319 | ) |
| |
Capital Share Transactions |
Reinvestment of common dividends | | | | | — | | | | 291,605 | | | | | | | | — | | | | 567,300 | |
| |
Net Assets Applicable to Common Shareholders |
Total increase (decrease) in net assets applicable to Common Shareholders | | | | | 9,559,010 | | | | (13,546,792 | ) | | | | | | | 15,571,639 | | | | (26,043,750 | ) |
Beginning of year | | | | | 109,949,791 | | | | 123,496,583 | | | | | | | | 173,976,272 | | | | 200,020,022 | |
End of year | | | | $ | 119,508,801 | | | $ | 109,949,791 | | | | | | | $ | 189,547,911 | | | $ | 173,976,272 | |
Undistributed net investment income, end of year | | | | $ | 1,641,707 | | | $ | 1,753,402 | | | | | | | $ | 3,009,264 | | | $ | 3,133,594 | |
| 1 | | Dividends for annual periods determined in accordance with federal income tax regulations. |
See Notes to Financial Statements.
| ANNUAL REPORT | JULY 31, 2014 | 49
|
| Year Ended July 31, 2014 | | | | BlackRock
California
Municipal
Income Trust
(BFZ) | | BlackRock
Municipal
Income
Investment
Trust
(BBF) | | BlackRock
Municipal
Target
Term Trust
(BTT) | | BlackRock
New Jersey
Municipal
Income Trust
(BNJ) | | BlackRock
New York
Municipal
Income Trust
(BNY) |
| |
Cash Provided by Operating Activities |
Net increase in net assets resulting from operations, excluding dividends to
AMPS Shareholders | | | | $ | 71,801,810 | | | $ | 13,840,765 | | | $ | 306,889,574 | | | $ | 16,459,117 | | | $ | 26,264,660 | |
Adjustments to reconcile net increase in net assets resulting from operations to net cash provided by operating activities:
| | | | | | | | | | | | | | | | | | | | | | |
(Increase) decrease interest receivable | | | | | 557,104 | | | | (3,792 | ) | | | 609,369 | | | | 278,559 | | | | 59,425 | |
Increase in variation margin receivable on financial futures contracts | | | | | (14,952 | ) | | | (3,000 | ) | | | (90,462 | ) | | | (3,375 | ) | | | (7,734 | ) |
Increase in prepaid expenses | | | | | (20,425 | ) | | | (20,742 | ) | | | (31,403 | ) | | | (21,648 | ) | | | (20,097 | ) |
Increase in cash pledged for financial futures contracts | | | | | (436,000 | ) | | | (88,000 | ) | | | (2,377,002 | ) | | | (99,000 | ) | | | (226,000 | ) |
Increase (decrease) in investment advisory fees payable | | | | | (12,805 | ) | | | 91 | | | | (80,463 | ) | | | 3,950 | | | | 1,893 | |
Decrease in interest expense and fees payable | | | | | (54,615 | ) | | | (8,090 | ) | | | (45,726 | ) | | | (2,268 | ) | | | (5,785 | ) |
Increase (decrease) in other accrued expenses payable | | | | | (9,988 | ) | | | (13,076 | ) | | | (34,411 | ) | | | 8,443 | | | | (23,785 | ) |
Increase (decrease) in Officer’s and Trustees’ fees payable | | | | | 6,224 | | | | 1,371 | | | | (5,771 | ) | | | 1,670 | | | | 2,544 | |
Net realized gain (loss) on investments | | | | | (3,029,451 | ) | | | 2,264,333 | | | | 24,217,360 | | | | 1,100,589 | | | | 5,374,968 | |
Net unrealized gain on investments | | | | | (41,750,551 | ) | | | (10,386,491 | ) | | | (262,089,257 | ) | | | (10,951,537 | ) | | | (21,615,419 | ) |
Amortization of premium and accretion of discount on investments | | | | | 2,646,614 | | | | 396,241 | | | | 2,129,897 | | | | 244,349 | | | | 689,210 | |
Premiums received from options written | | | | | — | | | | — | | | | 1,809,269 | | | | — | | | | — | |
Proceeds from sales of long-term investments | | | | | 228,605,740 | | | | 39,122,224 | | | | 218,978,118 | | | | 37,396,166 | | | | 76,921,794 | |
Purchases of long-term investments | | | | | (175,733,467 | ) | | | (37,299,503 | ) | | | (167,291,004 | ) | | | (40,480,529 | ) | | | (76,234,140 | ) |
Net proceeds from sales (purchases) of short-term securities | | | | | (951,177 | ) | | | 3,411,994 | | | | 49,728,059 | | | | 3,511,827 | | | | 6,603,494 | |
Premiums paid on closing options written | | | | | — | | | | — | | | | (1,229,170 | ) | | | — | | | | — | |
Net cash provided by operating activities | | | | | 81,604,061 | | | | 11,214,325 | | | | 171,086,977 | | | | 7,446,313 | | | | 17,785,028 | |
| |
Cash Used for Financing Activities |
Proceeds from TOB trust certificates | | | | | — | | | | — | | | | — | | | | — | | | | 10,616,997 | |
Repayments of TOB trust certificates | | | | | (51,957,794 | ) | | | (5,413,880 | ) | | | (91,559,997 | ) | | | (591,052 | ) | | | (18,711,593 | ) |
Cash dividends paid to Common Shareholders | | | | | (29,719,406 | ) | | | (5,822,882 | ) | | | (79,318,767 | ) | | | (6,900,107 | ) | | | (10,693,021 | ) |
Cash payments for offering costs | | | | | — | | | | — | | | | (208,650 | ) | | | — | | | | — | |
Decrease in bank overdraft | | | | | (4,413 | ) | | | (3,855 | ) | | | (35,623 | ) | | | (3,933 | ) | | | — | |
Increase in amortization of deferred offering costs | | | | | 77,552 | | | | 26,292 | | | | 36,060 | | | | 48,779 | | | | 57,170 | |
Net cash used for financing activities | | | | | (81,604,061 | ) | | | (11,214,325 | ) | | | (171,086,977 | ) | | | (7,446,313 | ) | | | (18,730,447 | ) |
| |
Cash |
Net decrease in cash | | | | | — | | | | — | | | | — | | | | — | | | | (945,419 | ) |
Cash at beginning of year | | | | | — | | | | — | | | | — | | | | — | | | | 945,419 | |
Cash at end of year | | | | | — | | | | — | | | | — | | | | — | | | | — | |
| |
Supplemental Disclosure of Cash Flow Information |
Cash paid during the year for interest | | | | $ | 2,706,494 | | | $ | 257,185 | | | $ | 6,839,603 | | | $ | 759,669 | | | $ | 1,176,639 | |
See Notes to Financial Statements.
| 50 | ANNUAL REPORT | JULY 31, 2014
|
| |
| Financial Highlights | BlackRock California Municipal Income Trust (BFZ)
|
| | | | Year Ended July 31,
|
|
| | | | 2014 | | 2013 | | 2012 | | 2011 | | 2010 |
| |
Per Share Operating Performance |
Net asset value, beginning of year | | | | $ | 14.50 | | | $ | 16.32 | | | $ | 13.88 | | | $ | 14.28 | | | $ | 12.71 | |
Net investment income1 | | | | | 0.87 | | | | 0.89 | | | | 0.95 | | | | 0.98 | | | | 1.00 | |
Net realized and unrealized gain (loss) | | | | | 1.39 | | | | (1.78 | ) | | | 2.42 | | | | (0.45 | ) | | | 1.50 | |
Dividends to AMPS shareholders from net investment income | | | | | — | | | | — | | | | (0.01 | ) | | | (0.02 | ) | | | (0.02 | ) |
Net increase (decrease) from investment operations | | | | | 2.26 | | | | (0.89 | ) | | | 3.36 | | | | 0.51 | | | | 2.48 | |
Dividends to Common Shareholders from net investment income2 | | | | | (0.93 | ) | | | (0.93 | ) | | | (0.92 | ) | | | (0.91 | ) | | | (0.91 | ) |
Net asset value, end of year | | | | $ | 15.83 | | | $ | 14.50 | | | $ | 16.32 | | | $ | 13.88 | | | $ | 14.28 | |
Market price, end of year | | | | $ | 14.41 | | | $ | 13.63 | | | $ | 16.64 | | | $ | 13.16 | | | $ | 14.21 | |
| |
Total Return Applicable to Common Shareholders3 |
Based on net asset value | | | | | 16.48% | | | | (5.81)% | | | | 24.98% | | | | 4.05% | | | | 20.15% | |
Based on market price | | | | | 12.80% | | | | (13.17)% | | | | 34.40% | | | | (0.86)% | | | | 22.55% | |
| |
Ratios to Average Net Assets Applicable to Common Shareholders |
Total expenses | | | | | 1.59% | | | | 1.63% | | | | 1.49% | 4 | | | 1.46% | 4 | | | 1.36% | 4 |
Total expenses after fees waived and paid indirectly | | | | | 1.59% | | | | 1.63% | | | | 1.46% | 4 | | | 1.39% | 4 | | | 1.27% | 4 |
Total expenses after fees waived and paid indirectly and excluding interest expense, and fees and amortization of offering costs5 | | | | | 1.03% | | | | 1.01% | | | | 1.07% | 4,6 | | | 1.12% | 4 | | | 1.04% | 4 |
Net investment income | | | | | 5.78% | | | | 5.49% | | | | 6.28% | 4 | | | 7.19% | 4 | | | 6.94% | 4 |
Dividends to AMPS Shareholders | | | | | — | | | | — | | | | 0.05% | | | | 0.15% | | | | 0.15% | |
Net investment income to Common Shareholders | | | | | 5.78% | | | | 5.49% | | | | 6.23% | | | | 7.04% | | | | 6.79% | |
| |
Supplemental Data |
Net assets applicable to Common Shareholders, end of year (000) | | | | $ | 504,531 | | | $ | 462,273 | | | $ | 519,578 | | | $ | 441,745 | | | $ | 454,299 | |
AMPS outstanding at $25,000 liquidation preference, end of year (000) | | | | | — | | | | — | | | | — | | | $ | 171,325 | | | $ | 171,325 | |
VMTP Shares outstanding at $100,000 liquidation value, end of year (000) | | | | $ | 171,300 | | | $ | 171,300 | | | $ | 171,300 | | | | — | | | | — | |
Portfolio turnover rate | | | | | 25% | | | | 22% | | | | 30% | | | | 36% | | | | 47% | |
Asset coverage per AMPS at $25,000 liquidation preference, end of year (000) | | | | | — | | | | — | | | | — | | | $ | 89,460 | | | $ | 91,293 | |
Asset coverage per VMTP Shares at $100,000 liquidation value, end of year | | | | $ | 394,531 | | | $ | 369,862 | | | $ | 403,314 | | | | — | | | | — | |
| 1 | | Based on average Common Shares outstanding. |
| 2 | | Dividends for annual periods determined in accordance with federal income tax regulations. |
| 3 | | Total returns based on market price, which can be significantly greater or less than the net asset value, may result in substantially different returns. Where applicable, excludes the effects of any sales charges and assumes the reinvestment of dividends and distributions. |
| 4 | | Does not reflect the effect of dividends to AMPS Shareholders. |
| 5 | | Interest expense, fees and amortization of offering costs relate to TOBS and/or VMTP Shares. See Note 3 and Note 9 of the Notes to Financial Statements for details of municipal bonds transferred to TOBs and VMTP Shares, respectively. |
| 6 | | For the year ended July 31, 2012, the total expense ratio after fees waived and paid indirectly and excluding interest expense, fees, amortization of offering costs and remarketing fees was 1.04%. |
See Notes to Financial Statements.
| ANNUAL REPORT | JULY 31, 2014 | 51
|
| |
| Financial Highlights | BlackRock Florida Municipal 2020 Term Trust (BFO)
|
| | | | Year Ended July 31,
|
|
| | | | 2014 | | 2013 | | 2012 | | 2011 | | 2010 |
| |
Per Share Operating Performance |
Net asset value, beginning of year | | | | $ | 15.31 | | | $ | 16.05 | | | $ | 14.94 | | | $ | 14.91 | | | $ | 13.35 | |
Net investment income1 | | | | | 0.47 | | | | 0.68 | | | | 0.85 | | | | 0.92 | | | | 0.95 | |
Net realized and unrealized gain (loss) | | | | | 0.25 | | | | (0.65 | ) | | | 0.98 | | | | (0.19 | ) | | | 1.31 | |
Dividends to AMPS shareholders from net investment income | | | | | (0.00 | )2 | | | (0.01 | ) | | | (0.02 | ) | | | (0.03 | ) | | | (0.03 | ) |
Net increase (decrease) from investment operations | | | | | 0.72 | | | | 0.02 | | | | 1.81 | | | | 0.70 | | | | 2.23 | |
Dividends to Common Shareholders from net investment income3 | | | | | (0.61 | ) | | | (0.76 | ) | | | (0.70 | ) | | | (0.67 | ) | | | (0.67 | ) |
Net asset value, end of year | | | | $ | 15.42 | | | $ | 15.31 | | | $ | 16.05 | | | $ | 14.94 | | | $ | 14.91 | |
Market price, end of year | | | | $ | 15.16 | | | $ | 15.12 | | | $ | 15.60 | | | $ | 13.91 | | | $ | 14.30 | |
| |
Total Return Applicable to Common Shareholders4 |
Based on net asset value | | | | | 4.84% | | | | 0.12% | | | | 12.44% | | | | 5.07% | | | | 17.35% | |
Based on market price | | | | | 4.36% | | | | 1.73% | | | | 17.38% | | | | 2.00% | | | | 22.05% | |
| |
Ratios to Average Net Assets Applicable to Common Shareholders |
Total expenses5 | | | | | 0.74% | | | | 0.92% | | | | 1.06% | | | | 1.13% | | | | 1.14% | |
Total expenses after fees waived and paid indirectly5 | | | | | 0.74% | | | | 0.92% | | | | 1.06% | | | | 1.13% | | | | 1.13% | |
Total expenses after fees waived and paid indirectly and excluding interest expense and fees5,6 | | | | | 0.74% | 7 | | | 0.92% | 7 | | | 1.06% | 7 | | | 1.09% | | | | 1.09% | |
Net investment income5 | | | | | 3.05% | | | | 4.23% | | | | 5.48% | | | | 6.29% | | | | 6.72% | |
Dividends to AMPS Shareholders | | | | | 0.01% | | | | 0.09% | | | | 0.12% | | | | 0.19% | | | | 0.22% | |
Net investment income to Common Shareholders | | | | | 3.04% | | | | 4.14% | | | | 5.36% | | | | 6.10% | | | | 6.50% | |
| |
Supplemental Data |
Net assets applicable to Common Shareholders, end of year (000) | | | | $ | 85,748 | | | $ | 85,139 | | | $ | 89,251 | | | $ | 83,111 | | | $ | 82,929 | |
AMPS Shares outstanding at $25,000 liquidation preference, end of year (000) | | | | $ | 625 | | | $ | 19,100 | | | $ | 42,900 | | | $ | 42,900 | | | $ | 42,900 | |
Portfolio turnover rate | | | | | 1% | | | | 9% | | | | 32% | | | | 6% | | | | 6% | |
Asset coverage per AMPS Share at $25,000 liquidation preference, end of year (000) | | | | $ | 3,454,938 | | | $ | 136,438 | | | $ | 77,011 | | | $ | 73,433 | | | $ | 73,329 | |
| 1 | | Based on average Common Shares outstanding. |
| 2 | | Amount is greater than $(0.005) per share. |
| 3 | | Dividends for annual periods determined in accordance with federal income tax regulations. |
| 4 | | Total returns based on market price, which can be significantly greater or less than the net asset value, may result in substantially different returns. Where applicable, excludes the effects of any sales charges and assumes the reinvestment of dividends and distributions. |
| 5 | | Does not reflect the effect of dividends to AMPS Shareholders. |
| 6 | | Interest expense and fees relate to TOBs. See Note 3 of the Notes to Financial Statements for details of municipal bonds transferred to TOBs. |
| 7 | | For the years ended July 31, 2014, July 31, 2013 and July 31, 2012, the total expense ratio after fees waived and paid indirectly and excluding interest expense, fees and remarketing fees was 0.73%, 0.87% and 0.97%, respectively. |
See Notes to Financial Statements.
| 52 | ANNUAL REPORT | JULY 31, 2014
|
| |
| Financial Highlights | BlackRock Municipal Income Investment Trust (BBF)
|
| | | | Year Ended July 31,
|
|
| | | | 2014 | | 2013 | | 2012 | | 2011 | | 2010 |
| |
Per Share Operating Performance |
Net asset value, beginning of year | | | | $ | 13.89 | | | $ | 15.91 | | | $ | 13.40 | | | $ | 13.91 | | | $ | 12.71 | |
Net investment income1 | | | | | 0.87 | | | | 0.85 | | | | 0.86 | | | | 0.97 | | | | 0.92 | |
Net realized and unrealized gain (loss) | | | | | 1.20 | | | | (2.00 | ) | | | 2.55 | | | | (0.56 | ) | | | 1.20 | |
Dividends to AMPS Shareholders from net investment income | | | | | — | | | | — | | | | (0.00 | )2 | | | (0.02 | ) | | | (0.02 | ) |
Net increase (decrease) from investment operations | | | | | 2.07 | | | | (1.15 | ) | | | 3.41 | | | | 0.39 | | | | 2.10 | |
Dividends to Common Shareholders from net investment income3 | | | | | (0.87 | ) | | | (0.87 | ) | | | (0.90 | ) | | | (0.90 | ) | | | (0.90 | ) |
Net asset value, end of year | | | | $ | 15.09 | | | $ | 13.89 | | | $ | 15.91 | | | $ | 13.40 | | | $ | 13.91 | |
Market price, end of year | | | | $ | 13.48 | | | $ | 12.47 | | | $ | 16.25 | | | $ | 12.74 | | | $ | 13.90 | |
| |
Total Return Applicable to Common Shareholders4 |
Based on net asset value | | | | | 16.06% | | | | (7.56)% | | | | 26.21% | | | | 3.15% | | | | 17.04% | |
Based on market price | | | | | 15.49% | | | | (18.75)% | | | | 35.59% | | | | (1.86)% | | | | 19.01% | |
| |
Ratios to Average Net Assets Applicable to Common Shareholders |
Total expenses | | | | | 1.85% | | | | 1.83% | | | | 1.99% | 5 | | | 1.60% | 5 | | | 1.46% | 5 |
Total expenses after fees waived and paid indirectly | | | | | 1.85% | | | | 1.83% | | | | 1.99% | 5 | | | 1.60% | 5 | | | 1.37% | 5 |
Total expenses after fees waived and paid indirectly and excluding interest expense, and fees and amortization of offering costs6 | | | | | 1.56% | 7 | | | 1.49% | 7 | | | 1.61% | 5,7 | | | 1.33% | 5 | | | 1.17% | 5 |
Net investment income | | | | | 6.09% | | | | 5.41% | | | | 5.89% | 5 | | | 7.35% | 5 | | | 6.84% | 5 |
Dividends to AMPS Shareholders | | | | | — | | | | — | | | | 0.02% | | | | 0.14% | | | | 0.16% | |
Net investment income to Common Shareholders | | | | | 6.09% | | | | 5.41% | | | | 5.87% | | | | 7.21% | | | | 6.68% | |
| |
Supplemental Data |
Net assets applicable to Common Shareholders, end of year (000) | | | | $ | 101,163 | | | $ | 93,145 | | | $ | 106,627 | | | $ | 89,726 | | | $ | 93,073 | |
AMPS outstanding at $25,000 liquidation preference, end of year (000) | | | | | — | | | | — | | | | — | | | $ | 34,250 | | | $ | 34,250 | |
VRDP Shares outstanding at $100,000 liquidation value, end of year (000) | | | | $ | 34,200 | | | $ | 34,200 | | | $ | 34,200 | | | | — | | | | — | |
Portfolio turnover rate | | | | | 22% | | | | 33% | | | | 39% | | | | 24% | | | | 46% | |
Asset coverage per AMPS at $25,000 liquidation preference, end of year | | | | | — | | | | — | | | | — | | | $ | 90,493 | | | $ | 92,938 | |
Asset coverage per VRDP Shares at $100,000 liquidation value, end of year | | | | $ | 395,798 | | | $ | 372,353 | | | $ | 411,775 | | | | — | | | | — | |
| 1 | | Based on average Common Shares outstanding. |
| 2 | | Amount is greater than $(0.005) per share. |
| 3 | | Dividends for annual periods determined in accordance with federal income tax regulations. |
| 4 | | Total returns based on market price, which can be significantly greater or less than the net asset value, may result in substantially different returns. Where applicable, excludes the effects of any sales charges and assumes the reinvestment of dividends and distributions. |
| 5 | | Does not reflect the effect of dividends to VRDP Shareholders. |
| 6 | | Interest expense, fees and amortization of offering costs relate to TOBs and/or VRDP Shares. See Note 3 and Note 9 of the Notes to Financial Statements for details of municipal bonds transferred to TOBs and VRDP Shares, respectively. |
| 7 | | For the years ended July 31, 2014, July 31, 2013 and July 31, 2012, the total expense ratio after fees waived and paid indirectly and excluding interest expense, fees, amortization of offering costs, liquidity and remarketing fees was 1.19%, 1.17% and 1.31%, respectively. |
See Notes to Financial Statements.
| ANNUAL REPORT | JULY 31, 2014 | 53
|
| |
| Financial Highlights | BlackRock Municipal Target Term Trust (BTT)
|
| | | | Year Ended
July 31,
2014 | | Period
August 30,
20121 to
July 31, 2013 |
| |
Per Share Operating Performance |
Net asset value, beginning of period | | | | $ | 18.75 | | | $ | 23.88 | 2 |
Net investment income3 | | | | | 1.12 | | | | 0.80 | |
Net realized and unrealized gain (loss) | | | | | 3.23 | | | | (4.95 | ) |
Net increase (decrease) from investment operations | | | | | 4.35 | | | | (4.15 | ) |
Dividends and distributions from4: | | | | | | | | | | |
Net investment income | | | | | (1.09 | ) | | | (0.87 | ) |
Return of capital | | | | | (0.02 | ) | | | (0.11 | ) |
Total dividends and distributions | | | | | (1.11 | ) | | | (0.98 | ) |
Net asset value, end of period | | | | $ | 21.99 | | | $ | 18.75 | |
Market price, end of period | | | | $ | 19.57 | | | $ | 18.42 | |
| |
Total Return Applicable to Common Shareholders5 |
Based on net asset value | | | | | 24.50% | | | | (18.00)% | 6 |
Based on market price | | | | | 12.78% | | | | (23.05)% | 6 |
| |
Ratios to Average Net Assets Applicable to Common Shareholders |
Total expenses | | | | | 1.22% | | | | 0.99% | 7 |
Total expenses after fees waived and paid indirectly | | | | | 1.21% | | | | 0.99% | 7 |
Total expenses after fees waived and paid indirectly and excluding interest expense, fees and amortization of offering costs8 | | | | | 0.72% | | | | 0.64% | 7 |
Net investment income to Common Shareholders | | | | | 5.61% | | | | 3.78% | 7 |
| |
Supplemental Data |
Net assets applicable to Common Shareholders, end of period (000) | | | | $ | 1,550,376 | | | $ | 1,321,835 | |
RVMTP Shares outstanding at $5,000,000 liquidation value, end of period (000) | | | | $ | 750,000 | | | $ | 750,000 | |
Portfolio turnover rate | | | | | 6% | | | | 39% | |
Asset coverage per RVMTP Shares at $5,000,000 liquidation value, end of period | | | | $ | 15,335,837 | | | $ | 13,812,236 | |
| 1 | | Commencement of operations. |
| 2 | | Net asset value, beginning of period, reflects a deduction of $1.125 per share sales charge from the initial offering price of $25.00 per share. |
| 3 | | Based on average Common Share outstanding. |
| 4 | | Dividends and distributions for annual periods determined in accordance with federal income tax regulations. |
| 5 | | Total returns based on market price, which can be significantly greater or less than the net asset value, may result in substantially different returns. Where applicable, excludes the effects of any sales charges and assumes the reinvestment of dividends and distributions. |
| 8 | | Interest expense, fees and amortization of offering cost relate to TOBs and/or RVMTP Shares. See Note 3 and Note 9 of the Notes to Financial Statements for details of municipal bonds transferred to TOBs and RVMTP Shares, respectively. |
See Notes to Financial Statements.
| 54 | ANNUAL REPORT | JULY 31, 2014
|
| |
| Financial Highlights | BlackRock New Jersey Municipal Income Trust (BNJ)
|
| | | | Year Ended July 31,
|
|
| | | | 2014 | | 2013 | | 2012 | | 2011 | | 2010 |
| |
Per Share Operating Performance |
Net asset value, beginning of year | | | | $ | 14.36 | | | $ | 16.17 | | | $ | 14.07 | | | | 14.38 | | | $ | 12.78 | |
Net investment income1 | | | | | 0.88 | | | | 0.88 | | | | 0.95 | | | | 0.98 | | | | 1.02 | |
Net realized and unrealized gain (loss) | | | | | 1.27 | | | | (1.75 | ) | | | 2.11 | | | | (0.32 | ) | | | 1.54 | |
Dividends to AMPS shareholders from net investment income | | | | | — | | | | — | | | | (0.01 | ) | | | (0.03 | ) | | | (0.03 | ) |
Net increase (decrease) from investment operations | | | | | 2.15 | | | | (0.87 | ) | | | 3.05 | | | | 0.63 | | | | 2.53 | |
Dividends to Common Shareholders from net investment income2 | | | | | (0.90 | ) | | | (0.94 | ) | | | (0.95 | ) | | | (0.94 | ) | | | (0.93 | ) |
Net asset value, end of year | | | | $ | 15.61 | | | $ | 14.36 | | | $ | 16.17 | | | $ | 14.07 | | | $ | 14.38 | |
Market price, end of year | | | | $ | 14.68 | | | $ | 13.67 | | | $ | 17.67 | | | $ | 14.10 | | | $ | 14.82 | |
| |
Total Return Applicable to Common Shareholders3 |
Based on net asset value | | | | | 16.01% | | | | (5.82)% | | | | 22.25% | | | | 4.74% | | | | 20.22% | |
Based on market price | | | | | 14.60% | | | | (17.95)% | | | | 33.30% | | | | 1.85% | | | | 13.11% | |
| |
Ratios to Average Net Assets Applicable to Common Shareholders |
Total expenses | | | | | 1.89% | | | | 1.81% | | | | 1.47% | 4 | | | 1.25% | 4 | | | 1.23% | 4 |
Total expenses after fees waived and paid indirectly | | | | | 1.89% | | | | 1.81% | | | | 1.46% | 4 | | | 1.24% | 4 | | | 1.13% | 4 |
Total expenses after fees waived and paid indirectly and excluding interest expense, fees and amortization of offering costs5 | | | | | 1.18% | | | | 1.13% | | | | 1.18% | 4, 6 | | | 1.22% | 4 | | | 1.12% | 4 |
Net investment income | | | | | 5.96% | | | | 5.51% | | | | 6.28% | 4 | | | 7.09% | 4 | | | 7.42% | 4 |
Dividends to AMPS Shareholders | | | | | — | | | | — | | | | 0.08% | | | | 0.21% | | | | 0.23% | |
Net investment income to Common Shareholders | | | | | 5.96% | | | | 5.51% | | | | 6.20% | | | | 6.88% | | | | 7.19% | |
| |
Supplemental Data |
Net assets applicable to Common Shareholders, end of year (000) | | | | $ | 119,509 | | | $ | 109,950 | | | $ | 123,497 | | | $ | 107,226 | | | $ | 109,257 | |
AMPS outstanding at $25,000 liquidation preference, end of year (000) | | | | | — | | | | — | | | | — | | | $ | 59,100 | | | $ | 59,100 | |
VMTP Shares outstanding at $100,000 liquidation value, end of year (000) | | | | $ | 59,100 | | | $ | 59,100 | | | $ | 59,100 | | | | — | | | | — | |
Portfolio turnover rate | | | | | 20% | | | | 9% | | | | 20% | | | | 20% | | | | 11% | |
Asset coverage per AMPS at $25,000 liquidation preference, end of year | | | | | — | | | | — | | | | — | | | $ | 70,358 | | | $ | 71,218 | |
Asset coverage per VMTP Shares at $100,000 liquidation value, end of year | | | | $ | 302,215 | | | $ | 286,040 | | | $ | 308,962 | | | | — | | | | — | |
| 1 | | Based on average common shares outstanding. |
| 2 | | Dividends for annual periods determined in accordance with federal income tax regulations. |
| 3 | | Total returns based on market price, which can be significantly greater or less than the net asset value, may result in substantially different returns. Where applicable, excludes the effects of any sales charges and assumes the reinvestment of dividends and distributions. |
| 4 | | Do not reflect the effect of dividends to AMPS Shareholders. |
| 5 | | Interest expense, fees and amortization of offering costs relate to TOBs and/or VMTP Shares. See Note 3 and Note 9 of the Notes to Financial Statements for details of municipal bonds transferred to TOBs and VMTP Shares, respectively. |
| 6 | | For the year ended July 31, 2012, the total expense ratio after fees waived and paid indirectly and excluding interest expense, fees, amortization of offering costs and remarketing fees was 1.14%. |
See Notes to Financial Statements.
| ANNUAL REPORT | JULY 31, 2014 | 55
|
| |
| Financial Highlights | BlackRock New York Municipal Income Trust (BNY)
|
| | | | Year Ended July 31
|
|
| | | | 2014 | | 2013 | | 2012 | | 2011 | | 2010 |
| |
Per Share Operating Performance |
Net asset value, beginning of year | | | | $ | 13.47 | | | $ | 15.53 | | | $ | 13.87 | | | $ | 14.27 | | | $ | 12.71 | |
Net investment income1 | | | | | 0.81 | | | | 0.87 | | | | 0.93 | | | | 1.01 | | | | 1.04 | |
Net realized and unrealized gain (loss) | | | | | 1.23 | | | | (2.06 | ) | | | 1.73 | | | | (0.39 | ) | | | 1.54 | |
Dividends to AMPS shareholders from net investment income | | | | | — | | | | — | | | | (0.01 | ) | | | (0.03 | ) | | | (0.03 | ) |
Net increase (decrease) from investment operations | | | | | 2.04 | | | | (1.19 | ) | | | 2.65 | | | | 0.59 | | | | 2.55 | |
Dividends to Common Shareholders from net investment income2 | | | | | (0.83 | ) | | | (0.87 | ) | | | (0.99 | ) | | | (0.99 | ) | | | (0.99 | ) |
Net asset value, end of year | | | | $ | 14.68 | | | $ | 13.47 | | | $ | 15.53 | | | $ | 13.87 | | | $ | 14.27 | |
Market price, end of year | | | | $ | 13.79 | | | $ | 13.16 | | | $ | 16.73 | | | $ | 14.20 | | | $ | 15.11 | |
| |
Total Return Applicable to Common Shareholders3 |
Based on net asset value | | | | | 15.98% | | | | (8.18)% | | | | 19.62% | | | | 4.39% | | | | 20.35% | |
Based on market price | | | | | 11.51% | | | | (16.73)% | | | | 25.87% | | | | 0.94% | | | | 16.11% | |
| |
Ratios to Average Net Assets Applicable to Common Shareholders |
Total expenses | | | | | 1.82% | | | | 1.85% | | | | 1.49% | 4 | | | 1.27% | 4 | | | 1.25% | 4 |
Total expenses after fees waived and paid indirectly | | | | | 1.82% | | | | 1.84% | | | | 1.49% | 4 | | | 1.27% | 4 | | | 1.16% | 4 |
Total expenses after fees waived and paid indirectly and excluding interest expense, fees and amortization of offering costs5 | | | | | 1.13% | | | | 1.14% | | | | 1.18% | 4,6 | | | 1.22% | 4 | | | 1.11% | 4 |
Net investment income | | | | | 5.89% | | | | 5.71% | | | | 6.34% | 4 | | | 7.35% | 4 | | | 7.50% | 4 |
Dividends to AMPS Shareholders | | | | | — | | | | — | | | | 0.08% | | | | 0.20% | | | | 0.22% | |
Net investment income to Common Shareholders | | | | | 5.89% | | | | 5.71% | | | | 6.26% | | | | 7.15% | | | | 7.28% | |
| |
Supplemental Data |
Net assets applicable to Common Shareholders, end of year (000) | | | | $ | 189,548 | | | $ | 173,976 | | | $ | 200,020 | | | $ | 177,993 | | | $ | 182,372 | |
AMPS outstanding at $25,000 liquidation preference, end of year (000) | | | | | — | | | | — | | | | — | | | $ | 94,500 | | | $ | 94,500 | |
VMTP Shares outstanding at $100,000 liquidation value, end of year (000) | | | | $ | 94,500 | | | $ | 94,500 | | | $ | 94,500 | | | | — | | | | — | |
Portfolio turnover rate | | | | | 26% | | | | 23% | | | | 24% | | | | 17% | | | | 16% | |
Asset coverage per AMPS at $25,000 liquidation preference, end of year (000) | | | | | — | | | | — | | | | — | | | $ | 72,089 | | | $ | 73,248 | |
Asset coverage per VMTP Shares at $100,000 liquidation value, end of year | | | | $ | 300,580 | | | $ | 284,102 | | | $ | 311,661 | | | | — | | | | — | |
| 1 | | Based on average Common Shares outstanding. |
| 2 | | Dividends for annual periods determined in accordance with federal income tax regulations. |
| 3 | | Total returns based on market price, which can significantly greater or less than the net asset value, may result in substantially different returns. Where applicable, excludes the effects of any sales charges and assumes the reinvestment of dividends and distributions. |
| 4 | | Do not reflect the effect of dividends to AMPS shareholders. |
| 5 | | Interest expense, fees and amortization of offering costs relate to TOBs and/or VMTP Shares. See Note 3 and Note 9 of the Notes to Financial Statements for details of municipal bonds transferred to TOBs and VMTP Shares, respectively. |
| 6 | | For the year ended July 31, 2012, the total expense ratio after fees waived and paid indirectly and excluding interest expense, fees, amortization of offering costs and remarketing fees was 1.13%. |
See Notes to Financial Statements.
| 56 | ANNUAL REPORT | JULY 31, 2014
|
| |
| Notes to Financial Statements |
|
1. Organization:
BlackRock California Municipal Income Trust (“BFZ”), BlackRock Municipal Income Investment Trust (“BBF”), BlackRock Municipal Target Term Trust (“BTT”), BlackRock New Jersey Municipal Income Trust (“BNJ”), BlackRock New York Municipal Income Trust (“BNY”)(collectively, the “Income Trusts”) and BlackRock Florida Municipal 2020 Term Trust (“BFO”) are organized as Delaware statutory trusts. The Income Trusts and BFO are referred to herein collectively as the “Trusts.” The Trusts are registered under the 1940 Act, as non-diversified, closed-end management investment companies. The Boards of Trustees of the Trusts are collectively referred to throughout this report as the “Board of Trustees” or the “Board,” and the trustees thereof are collectively referred to throughout this report as “Trustees.” The Trusts determine and make available for publication the NAVs of their Common Shares on a daily basis.
2. Significant Accounting Policies:
The Trusts’ financial statements are prepared in conformity with accounting principles generally accepted in the United States of America (“U.S. GAAP”), which may require management to make estimates and assumptions that affect the reported amounts of assets and liabilities in the financial statements and the reported amounts of increases and decreases in net assets from operations during the reporting period. Actual results could differ from those estimates. Each Trust is considered an investment company under U.S. GAAP and follows the accounting and reporting guidance applicable to investment companies. The following is a summary of significant accounting policies followed by the Trusts:
Valuation: U.S. GAAP defines fair value as the price the Trusts would receive to sell an asset or pay to transfer a liability in an orderly transaction between market participants at the measurement date. The Trusts determine the fair values of their financial instruments at market value using independent dealers or pricing services under policies approved by the Board of the Trusts. The BlackRock Global Valuation Methodologies Committee (the “Global Valuation Committee”) is the committee formed by management to develop global pricing policies and procedures and to provide oversight of the pricing function for the Trusts for all financial instruments.
Municipal investments (including commitments to purchase such investments on a “when-issued” basis) are valued on the basis of prices provided by dealers or pricing services. In determining the value of a particular investment, pricing services may use certain information with respect to transactions in such investments, quotations from dealers, pricing matrixes, market transactions in comparable investments and information with respect to various relationships between investments. Financial futures contracts traded on exchanges are valued at their last sale price. Short-term securities with remaining maturities of 60 days or less may be valued at amortized cost, which approximates fair value. Investments in open-end registered investment companies are valued at NAV each business day.
Exchange-traded options are valued at the mean between the last bid and ask prices at the close of the options market in which the options trade. An exchange-traded option for which there is no mean price is valued at the last bid (long positions) or ask (short positions) price. If no bid or ask price is available, the prior day’s price will be used, unless it is determined that the prior day’s price no longer reflects the fair value of the option. Over-the-counter (“OTC”) options are valued by an independent pricing service using a mathematical model, which incorporates a number of market data factors, such as the trades and prices of the underlying instruments.
In the event that the application of these methods of valuation results in a price for an investment that is deemed not to be representative of the market value of such investment, or if a price is not available, the investment will be valued by the Global Valuation Committee, or its delegate, in accordance with a policy approved by the Board as reflecting fair value (“Fair Value Assets”). When determining the price for Fair Value Assets, the Global Valuation Committee, or its delegate, seeks to determine the price that each Trust might reasonably expect to receive from the current sale of that asset in an arm’s-length transaction. Fair value determinations shall be based upon all available factors that the Global Valuation Committee, or its delegate, deems relevant consistent with the principles of fair value measurement. The pricing of all Fair Value Assets is subsequently reported to the Board or a committee thereof on a quarterly basis.
Segregation and Collateralization: In cases where a Trust enters into certain investments (e.g., financial futures contracts), or certain borrowings (e.g., TOBs) that would be “senior securities” for 1940 Act purposes, the Trust may segregate or designate on its books and records cash or liquid securities having a market value at least equal to the amount of the Trust’s future obligations under such investments or borrowings. Doing so allows the investment or borrowing to be excluded from treatment as a “senior security.” Furthermore, if required by an exchange or counterparty agreement, the Trust may be required to deliver/deposit cash and/or securities to/with an exchange, or broker-dealer or custodian as collateral for certain investments or obligations.
Investment Transactions and Investment Income: For financial reporting purposes, investment transactions are recorded on the dates the transactions are entered into (the trade dates). Realized gains and losses on investment transactions are determined on the identified cost basis. Dividend income is recorded on the ex-dividend date. Interest income, including amortization and accretion of premiums and discounts on debt securities, is recognized on the accrual basis.
| ANNUAL REPORT | JULY 31, 2014 | 57
|
| |
| Notes to Financial Statements (continued) |
|
Dividends and Distributions: Dividends from net investment income are declared and paid monthly. Distributions of capital gains are recorded on the ex-dividend date. The portion of distributions that exceeds a Trust’s current and accumulated earnings and profits, which are measured on a tax basis, will constitute a non-taxable return of capital. The character and timing of dividends and distributions are determined in accordance with federal income tax regulations, which may differ from U.S. GAAP. Dividends and distributions to Preferred Shareholders are accrued and determined as described in Note 9.
Deferred Compensation Plan: Under the Deferred Compensation Plan (the “Plan”) approved by each Trust’s Board, the independent Trustees (“Independent Trustees”) may defer a portion of their annual complex-wide compensation. Deferred amounts earn an approximate return as though equivalent dollar amounts had been invested in common shares of certain other BlackRock Closed-End Funds selected by the Independent Trustees. This has the same economic effect for the Independent Trustees as if the Independent Trustees had invested the deferred amounts directly in certain other BlackRock Closed-End Funds.
The Plan is not funded and obligations thereunder represent general unsecured claims against the general assets of each Trust. Deferred compensation liabilities are included in officer’s and trustees’ fees payable in the Statements of Assets and Liabilities and will remain as a liability of the Trusts until such amounts are distributed in accordance with the Plan.
Recent Accounting Standard: In June 2014, the Financial Accounting Standards Board issued guidance to improve the financial reporting of reverse repurchase agreements and other similar transactions. The guidance will require expanded disclosure for entities that enter into reverse repurchase agreements and similar transactions accounted for as secured borrowings. It is effective for financial statements with fiscal years beginning on or after December 15, 2014 and interim periods within those fiscal years. Management is evaluating the impact, if any, of this guidance on the Trusts’ financial statement disclosures.
Other: Expenses directly related to a Trust are charged to that Trust. Other operating expenses shared by several funds are pro-rated among those funds on the basis of relative net assets or other appropriate methods.
The Trusts have an arrangement with the custodian whereby fees may be reduced by credits earned on uninvested cash balances, which, if applicable, are shown as fees paid indirectly in the Statements of Operations. The custodian imposes fees on overdrawn cash balances, which can be offset by accumulated credits earned or may result in additional custody charges.
3. Securities and Other Investments:
Zero-Coupon Bonds: The Trusts may invest in zero-coupon bonds, which are normally issued at a significant discount from face value and do not provide for periodic interest payments. Zero-coupon bonds may experience greater volatility in market value than similar maturity debt obligations which provide for regular interest payments.
Forward Commitments and When-Issued Delayed Delivery Securities: The Trusts may purchase securities on a when-issued basis and may purchase or sell securities on a forward commitment basis. Settlement of such transactions normally occurs within a month or more after the purchase or sale commitment is made. The Trusts may purchase securities under such conditions with the intention of actually acquiring them, but may enter into a separate agreement to sell the securities before the settlement date. Since the value of securities purchased may fluctuate prior to settlement, the Trusts may be required to pay more at settlement than the security is worth. In addition, the Trusts are not entitled to any of the interest earned prior to settlement. When purchasing a security on a delayed delivery basis, the Trusts assume the rights and risks of ownership of the security, including the risk of price and yield fluctuations. In the event of default by the counterparty, the Trusts’ maximum amount of loss is the unrealized appreciation of unsettled when-issued transactions, which is shown in the Schedules of Investments.
Municipal Bonds Transferred to TOBs: The Trusts leverage their assets through the use of TOBs. A TOB is a special purpose entity established by a third party sponsor, into which a fund, or an agent on behalf of a fund, transfers municipal bonds into a trust (“TOB Trust”). Other funds managed by the investment advisor may also contribute municipal bonds to a TOB into which a Trust has contributed bonds. A TOB typically issues two classes of beneficial interests: short-term floating rate certificates (“TOB Trust Certificates”), which are sold to third party investors, and residual certificates (“TOB Residuals”), which are generally issued to the participating funds that contributed the municipal bonds to the TOB Trust. If multiple funds participate in the same TOB, the rights and obligations under the TOB Residual will be shared among the funds ratably in proportion to their participation.
The TOB Residuals held by a Trust include the right of a Trust (1) to cause the holders of a proportional share of the TOB Trust Certificates to tender their certificates at par plus accrued interest upon the occurrence of certain mandatory tender events defined in the TOB agreements, and (2) to transfer, subject to a specified number of days’ prior notice, a corresponding share of the municipal bonds from the TOB to a Trust. The TOB may also be collapsed without the consent of a Trust, as the TOB Residual holder, upon the occurrence of certain termination events as defined in the TOB agreements. Such termination events may include the bankruptcy or default of the municipal bond, a substantial downgrade in credit quality of the municipal bond, the inability of the TOB to obtain renewal of the liquidity support agreement, a substantial decline in market value of the municipal bond and a judgment or ruling that interest on the municipal bond is subject to federal income taxation. Upon the occurrence of a termination event, the TOB would generally be
| 58 | ANNUAL REPORT | JULY 31, 2014
|
| |
| Notes to Financial Statements (continued) |
|
liquidated in full with the proceeds typically applied first to any accrued fees owed to the trustee, remarketing agent and liquidity provider, and then to the holders of the TOB Trust Certificates up to par plus accrued interest owed on the TOB Trust Certificates, with the balance paid out to the TOB Residual holder. During the year ended July 31, 2014, no TOBs in which the Trusts participated were terminated without the consent of the Trusts.
The cash received by the TOB from the sale of the TOB Trust Certificates, less transaction expenses, is paid to a Trust. The Trust typically invests the cash received in additional municipal bonds. Each Trust’s transfer of the municipal bonds to a TOB Trust is accounted for as a secured borrowing; therefore, the municipal bonds deposited into a TOB are presented in the Trusts’ Schedules of Investments and the TOB Trust Certificates are shown in other liabilities in the Statements of Assets and Liabilities. The carrying amount of each Trust’s payable to the holder of the TOB Trust Certificates, as reported in the Statements of Assets and Liabilities as TOB Trust Certificates, approximates its fair value.
The Trusts may invest in TOBs on either a non-recourse or recourse basis. TOB Trusts are typically supported by a liquidity facility provided by a bank or other financial institution (the “Liquidity Provider”) that allows the holders of the TOB Trust Certificates to tender their certificates in exchange for payment from the Liquidity Provider of par plus accrued interest on any business day prior to the occurrence of the termination events described above. When a Trust invests in TOBs on a non-recourse basis, and the Liquidity Provider is required to make a payment under the liquidity facility due to a termination event, the Liquidity Provider will typically liquidate all or a portion of the municipal securities held in the TOB Trust and then fund, on a net basis, the balance, if any, of the amount owed under the liquidity facility over the liquidation proceeds (the “Liquidation Shortfall”). If a Trust invests in a TOB on a recourse basis, the Trust will typically enter into a reimbursement agreement with the Liquidity Provider where the Trust is required to repay the Liquidity Provider the amount of any Liquidation Shortfall. As a result, a Trust investing in a recourse TOB will bear the risk of loss with respect to any Liquidation Shortfall. If multiple funds participate in any such TOB, these losses will be shared ratably, including the maximum potential amounts owed by the Trusts at July 31, 2014, in proportion to their participation. The recourse TOB Trusts are identified in the Schedules of Investments including the maximum potential amounts owed by the Trusts at July 31, 2014.
Interest income, including amortization and accretion of premiums and discounts, from the underlying municipal bonds is recorded by the Trusts on an accrual basis. Interest expense incurred on the secured borrowing and other expenses related to remarketing, administration and trustee services to a TOB are shown as interest expense, fees and amortization of offering costs in the Statements of Operations. The TOB Trust Certificates have interest rates that generally reset weekly and their holders have the option to tender such certificates to the TOB for redemption at par at each reset date. At July 31, 2014, the aggregate value of the underlying municipal bonds transferred to TOBs, the related liability for TOB Trust Certificates and the range of interest rates on the liability for TOB Trust Certificates were as follows:
|
|
|
| Underlying
Municipal
Bonds
Transferred to
TOBs
|
| Liability for
TOB Trust
Certificates
|
| Range of
Interest Rates
|
BFZ | | | | $ | 227,494,774 | | | $ | 106,697,554 | | | 0.06% – 0.09% |
BFO | | | | $ | 294,758 | | | $ | 190,000 | | | 0.12%
|
BBF | | | | $ | 56,780,789 | | | $ | 29,682,276 | | | 0.06% – 0.31% |
BTT | | | | $ | 377,825,374 | | | $ | 184,119,974 | | | 0.06% – 0.15% |
BNJ | | | | $ | 30,430,857 | | | $ | 17,301,282 | | | 0.06% – 0.31% |
BNY | | | | $ | 50,876,970 | | | $ | 28,460,581 | | | 0.06% – 0.26% |
For the year ended July 31, 2014, the Trusts’ average TOB Trust Certificates outstanding and the daily weighted average interest rate, including fees, were as follows:
|
|
|
| Average TOB
Trust
Certificates
Outstanding
|
| Daily Weighted
Average
Interest Rate
|
BFZ | | | | $ | 136,317,740 | | | | 0.61 | % |
BFO | | | | $ | 224,767 | | | | 0.48 | % |
BBF | | | | $ | 30,195,257 | | | | 0.65 | % |
BTT | | | | $ | 187,193,709 | | | | 0.78 | % |
BNJ | | | | $ | 17,312,373 | | | | 0.75 | % |
BNY | | | | $ | 27,023,256 | | | | 0.62 | % |
Should short-term interest rates rise, the Trusts’ investments in TOBs may adversely affect the Trusts’ net investment income and dividends to Common Shareholders. Also, fluctuations in the market value of municipal bonds deposited into the TOB Trust may adversely affect the Trusts’ NAVs per share.
4. Derivative Financial Instruments:
The Trusts engage in various portfolio investment strategies using derivative contracts both to increase the returns of the Trusts and/or to economically hedge their exposure to certain risks such as credit risk and interest rate risk. These contracts may be transacted on an exchange or OTC.
| ANNUAL REPORT | JULY 31, 2014 | 59
|
| |
| Notes to Financial Statements (continued) |
|
Financial Futures Contracts: The Trusts purchase and/or sell financial futures contracts and options on financial futures contracts to gain exposure to, or economically hedge against, changes in interest rates (interest rate risk). Financial futures contracts are agreements between the Trusts and a counterparty to buy or sell a specific quantity of an underlying instrument at a specified price and at a specified date. Depending on the terms of the particular contract, financial futures contracts are settled either through physical delivery of the underlying instrument on the settlement date or by payment of a cash settlement amount on the settlement date.
Upon entering into a financial futures contract, the Trusts are required to deposit initial margin with the broker in the form of cash or securities in an amount that varies depending on a contract’s size and risk profile. The initial margin deposit must then be maintained at an established level over the life of the contract. Securities deposited as initial margin are designated on the Schedules of Investments and cash deposited, if any, is recorded on the Statements of Assets and Liabilities as cash pledged for financial futures contracts. Pursuant to the contract, the Trusts agree to receive from or pay to the broker an amount of cash equal to the daily fluctuation in value of the contract. Such receipts or payments are known as variation margin. Variation margin is recorded by the Trusts as unrealized appreciation or depreciation and, if applicable, as a receivable or payable for variation margin in the Statements of Assets and Liabilities.
When the contract is closed, the Trusts record a realized gain or loss equal to the difference between the value of the contract at the time it was opened and the value at the time it was closed. The use of financial futures contracts involves the risk of an imperfect correlation in the movements in the price of financial futures contracts, interest rates and the underlying assets.
Options: The Trusts purchase and write call and put options to increase or decrease their exposure to underlying instruments including interest rate risk. A call option gives the purchaser (holder) of the option the right (but not the obligation) to buy, and obligates the seller (writer) to sell (when the option is exercised) the underlying instrument at the exercise or strike price at any time or at a specified time during the option period. A put option gives the holder the right to sell and obligates the writer to buy the underlying instrument at the exercise or strike price at any time or at a specified time during the option period. When the Trusts purchase (write) an option, an amount equal to the premium paid (received) by the Trusts is reflected as an asset (liability). The amount of the asset (liability) is subsequently marked-to-market to reflect the current market value of the option purchased (written). When an instrument is purchased or sold through an exercise of an option, the related premium paid (or received) is added to (or deducted from) the basis of the instrument acquired or deducted from (or added to) the proceeds of the instrument sold. When an option expires (or the Trusts enter into a closing transaction), the Trusts realize a gain or loss on the option to the extent of the premiums received or paid (or gain or loss to the extent the cost of the closing transaction exceeds the premiums received or paid). When the Trusts write a call option, such option is “covered,” meaning that the Trusts hold the underlying instrument subject to being called by the option counterparty. When the Trusts write a put option, such option is covered by cash in an amount sufficient to cover the obligation.
In purchasing and writing options, the Trusts bear the risk of an unfavorable change in the value of the underlying instrument or the risk that the Trusts may not be able to enter into a closing transaction due to an illiquid market. Exercise of a written option could result in the Trusts purchasing or selling a security when it otherwise would not, or at a price different from the current market value.
For BTT, transactions in options written for the year ended July 31, 2014 were as follows:
| | | | | Calls
|
|
|
|
| Contracts
|
| Premiums
Received
|
Outstanding options, beginning of year | | | | | — | | | | — | |
Options written | | | | | 13,000 | | | $ | 1,809,269 | |
Options exercised | | | | | — | | | | — | |
Options expired | | | | | (12,000 | ) | | | (1,591,729 | ) |
Options closed | | | | | (1,000 | ) | | | (217,540 | ) |
Outstanding options, end of year | | | | | — | | | | — | |
| 60 | ANNUAL REPORT | JULY 31, 2014
|
| |
| Notes to Financial Statements (continued) |
|
The following is a summary of the Trusts’ derivative financial instruments categorized by risk exposure:
Fair Values of Derivative Financial Instruments as of July 31, 2014
|
| | | | Value
|
| | | | Derivative Assets
|
|
| Statements of Assets and
Liabilities Location
|
| BFZ
|
| BBF
|
| BTT
|
| BNJ
|
| BNY
|
Interest rate contracts | | Net unrealized appreciation/depreciation1 | | $ | 76,811 | | | $ | 27,410 | | | $ | 47,505 | | | $ | 30,837 | | | $ | 64,222 | |
| 1 | | Includes cumulative appreciation/depreciation on financial futures contracts as reported in the Schedules of Investments. Only current day’s variation margin is reported within the Statements of Assets and Liabilities. |
The Effect of Derivative Financial Instruments in the Statements of Operations
Year Ended July 31, 2014
|
| | Net Realized Gain (Loss) From
| | Net Change in Unrealized Appreciation/
Depreciation on
|
|
|
|
| BFZ
|
| BBF
|
| BTT
| | BFZ
|
| BBF
|
| BTT
|
Interest rate contracts:
| | | | | | | | | | | | | | | | | | | | | | | | | | |
Financial futures contracts | | | | $ | (772,699 | ) | | $ | (138,637 | ) | | $ | (9,836,846 | ) | | $ | 76,811 | | | $ | 27,410 | | | $ | 47,505 | |
Options2 | | | | | — | | | | — | | | | (5,219,548 | ) | | | — | | | | — | | | | — | |
| | | | | | | | | | | | | | | | | | | | | | | | | | |
Total
| | | | $ | (772,699 | ) | | $ | (138,637 | ) | | $ | (15,056,394 | ) | | $ | 76,811 | | | $ | 27,410 | | | $ | 47,505 | |
| | | | | |
| | BNJ
|
| BNY
|
| | | BNJ
|
| BNY
|
| |
Interest rate contracts:
| | | | | | | | | | | | | | | | | | | | | | | | |
Financial futures contracts | | | | $ | (162,458 | ) | | $ | (552,685 | ) | | | | | | $ | 30,837 | | | $ | 64,222 | | | |
| 2 | | Options purchased are included in the net realized gain (loss) from investments and net change in unrealized appreciation/depreciation on investments. |
For the year ended July 31, 2014, the average quarterly balances of outstanding derivative financial instruments were as follows:
| | | | | BFZ | | BBF | | BTT | | BNJ | | BNY |
Financial futures contracts:
| | | | | | | | | | | | | | | | | | | | | | |
Average number of contracts purchased | | | | | — | | | | — | | | | 7,055 | 3 | | | — | | | | — | |
Average number of contracts sold | | | | | 342 | | | | 74 | | | | 1,001 | | | | 87 | | | | 166 | |
Average notional value of contracts purchased | | | | | — | | | | — | | | $ | 890,488,259 | 3 | | | — | | | | — | |
Average notional value of contracts sold | | | | $ | 42,918,262 | | | $ | 9,249,859 | | | $ | 125,630,172 | | | $ | 10,912,547 | | | $ | 20,700,172 | |
Options:
| | | | | | | | | | | | | | | | | | | | | | |
Average number of option contracts purchased | | | | | — | | | | — | | | | 4,825 | | | | — | | | | — | |
Average number of option contracts written | | | | | — | | | | — | | | | (3,250 | ) | | | — | | | | — | |
Average notional amount of option contracts purchased | | | | | — | | | | — | | | $ | 4,825,000 | | | | — | | | | — | |
Average notional amount of option contracts written | | | | | — | | | | — | | | $ | (3,250,000 | ) | | | — | | | | — | |
| 3 | | Actual amounts for the period are shown due to limited outstanding derivative financial instruments as of each quarter. |
Counterparty Credit Risk: A derivative contract may suffer a mark-to-market loss if the value of the contract decreases due to an unfavorable change in the market rates or values of the underlying instrument. Losses can also occur if the counterparty does not perform under the contract.
A Trust’s risk of loss from counterparty credit risk on OTC derivatives is generally limited to the aggregate unrealized gain netted against any collateral held by such Trust. Options written by the Trusts do not typically give rise to counterparty credit risk, as options written generally obligate the Trusts, and not the counterparty, to perform.
With exchange-traded purchased options and futures, there is less counterparty credit risk to the Trusts since the exchange or clearinghouse, as counterparty to such instruments, guarantees against a possible default. The clearinghouse stands between the buyer and the seller of the contract; therefore, credit risk is limited to failure of the clearinghouse. While offset rights may exist under applicable law, a Trust does not have a contractual right of offset against a clearing broker or clearinghouse in the event of a default (including the bankruptcy or insolvency) of the clearing broker or clearinghouse. Additionally, credit risk exists in exchange-traded futures with respect to initial and variation margin that is held in a clearing broker’s customer accounts. While clearing brokers are required to segregate customer margin from their own assets, in the event that a clearing broker becomes insolvent or goes into bankruptcy and at that time there is a shortfall in the aggregate amount of margin held by the clearing broker for all its clients, typically the shortfall would be allocated on a pro rata basis across all the clearing broker’s customers, potentially resulting in losses to the Trusts.
| ANNUAL REPORT | JULY 31, 2014 | 61
|
| |
| Notes to Financial Statements (continued) |
|
5. Investment Advisory Agreement and Other Transactions with Affiliates:
The PNC Financial Services Group, Inc. is the largest stockholder and an affiliate, for 1940 Act purposes, of BlackRock, Inc. (“BlackRock”).
Each Trust entered into an Investment Advisory Agreement with BlackRock Advisors, LLC (the “Manager”), the Trusts’ investment advisor, an indirect, wholly owned subsidiary of BlackRock, to provide investment advisory and administration services. The Manager is responsible for the management of each Trust’s portfolio and provides the necessary personnel, facilities, equipment and certain other services to the operations of each Trust. For such services, each Trust pays the Manager a monthly fee based on a percentage of each Trust’s average weekly net assets, except for BTT, which is based on average daily net assets, at the following annual rates:
|
|
|
| BFZ
|
| BFO
|
| BBF
|
| BTT
|
| BNJ
|
| BNY
|
Investment advisory fee | | | | | 0.58 | % | | | 0.50 | % | | | 0.60 | % | | | 0.40 | % | | | 0.60 | % | | | 0.60 | % |
Average weekly net assets are the average weekly value of each Trust’s total assets minus its total accrued liabilities.
The Manager voluntarily agreed to waive its investment advisory fees by the amount of investment advisory fees each Trust pays to the Manager indirectly through its investment in affiliated money market funds. However, the Manager does not waive its investment advisory fees by the amount of investment advisory fees paid in connection with each Trust’s investment in other affiliated investment companies, if any. These amounts are shown as fees waived by Manager in the Statements of Operations. For the year ended July 31, 2014, the amounts waived were as follows:
|
|
|
| BFZ
|
| BFO
|
| BBF
|
| BTT
|
| BNJ
|
| BNY
|
Amounts waived | | | | $ | 2,380 | | | $ | 1,183 | | | $ | 917 | | | $ | 183,965 | | | $ | 4,042 | | | $ | 2,840 | |
Effective June 9, 2014, BTT implemented a 0.05% voluntary waiver of its investment advisory fees.
Prior to July 1, 2014, BlackRock Financial Management, Inc. (“BFM”), an affiliate of the Manager, served as a sub-advisor to BFZ, BFO, BBF, BNJ and BNY and BlackRock Investment Management, LLC (“BIM”), an affiliate of the Manager, served as a sub-advisor to BTT pursuant to sub-advisory agreements with the Manager, and received for their services a monthly fee from the Manager at an annual rate equal to a percentage of the investment advisory fees paid by each Trust to the Manager under the Investment Advisory Agreements. Effective July 1, 2014, the sub-advisory agreements between the Manager and BFM, with respect to each Trust, expired and the sub-advisory agreement with BIM was terminated.
Certain officers and/or Trustees of the Trusts are officers and/or directors of BlackRock or its affiliates. The Trusts reimburse the Manager for a portion of the compensation paid to the Trusts’ Chief Compliance Officer, which is included in officer and directors in the Statements of Operations.
The Trusts may purchase securities from, or sell securities to, an affiliated fund provided the affiliation is due solely to having a common investment advisor, common officers, or common trustees. For the year ended July 31, 2014, the purchase and sale transactions with an affiliated fund in compliance with Rule 17a-7 under the 1940 Act for were as follows:
|
|
|
| BFZ
|
| BBF
|
Purchases | | | | $ | 1,567,211 | | | | — | |
Sales | | | | | — | | | $ | 1,404,681 | |
6. Purchases and Sales:
Purchases and sales of investments, excluding short-term securities, for the year ended July 31, 2014 were as follows:
|
|
|
| BFZ
|
| BFO
|
| BBF
|
| BTT
|
| BNJ
|
| BNY
|
Purchases | | | | $ | 195,758,434 | | | $ | 696,855 | | | $ | 34,015,177 | | | $ | 149,698,955 | | | $ | 40,480,529 | | | $ | 75,279,614 | |
Sales | | | | $ | 243,128,015 | | | $ | 16,906,200 | | | $ | 37,691,926 | | | $ | 214,847,666 | | | $ | 37,090,825 | | | $ | 75,610,115 | |
| 62 | ANNUAL REPORT | JULY 31, 2014
|
| |
| Notes to Financial Statements (continued) |
|
7. Income Tax Information:
It is the Trusts’ policy to comply with the requirements of the Internal Revenue Code of 1986, as amended, applicable to regulated investment companies, and to distribute substantially all of their taxable income to their shareholders. Therefore, no federal income tax provision is required.
Each Trust files U.S. federal and various state and local tax returns. No income tax returns are currently under examination. The statute of limitations for BFZ, BFO, BBF, BNJ and BNY U.S. federal tax returns remains open for each of the four years ended July 31, 2014. The statute of limitations for BTT’s U.S. federal tax returns remain open for the period ended July 31, 2013 and the year ended July 31, 2014. The statutes of limitations on each Trust’s state and local tax returns may remain open for an additional year depending upon the jurisdiction.
Management has analyzed tax laws and regulations and their application to the Trusts’ facts and circumstances and does not believe that there are any uncertain tax positions that require recognition of a tax liability.
U.S. GAAP requires that certain components of net assets be adjusted to reflect permanent differences between financial and tax reporting. These reclassifications have no effect on net assets or net asset values per share. As of July 31, 2014, the following permanent differences attributable to the expiration of capital loss carryforwards, amortization methods on fixed income securities, distributions received from a regulated investment company, the reclassification of distributions, non-deductible expenses, and the retention of tax-exempt income were reclassified to the following accounts:
|
|
|
| BFZ
|
| BFO
|
| BBF
|
| BTT
|
| BNJ
|
| BNY
|
Paid-in capital | | | | $ | (653,593 | ) | | $ | 238,053 | | | $ | (26,292 | ) | | $ | (49,527 | ) | | $ | (49,839 | ) | | $ | (58,866 | ) |
Undistributed (distributions in excess of) net investment income | | | | $ | 46,900 | | | $ | (236,214 | ) | | $ | 24,425 | | | $ | (38,965 | ) | | $ | 48,622 | | | $ | 56,019 | |
Accumulated net realized loss | | | | $ | 606,693 | | | $ | (1,839 | ) | | $ | 1,867 | | | $ | 88,492 | | | $ | 1,217 | | | $ | 2,847 | |
The tax character of distributions paid was as follows:
|
|
|
|
|
| BFZ
|
| BFO
|
| BBF
|
| BTT
|
| BNJ
|
| BNY
|
Tax-exempt income1 | | | | | 7/31/14 | | | $ | 31,357,063 | | | $ | 3,425,924 | | | $ | 5,875,954 | | | $ | 81,946,044 | | | $ | 7,526,454 | | | $ | 11,694,539 | |
| | | | | 7/31/13 | | | $ | 31,649,406 | | | $ | 4,314,224 | | | $ | 5,909,789 | | | $ | 64,323,779 | | | $ | 7,879,321 | | | $ | 12,286,661 | |
Ordinary income2 | | | | | 7/31/14 | | | | 2,488 | | | | — | | | | — | | | | — | | | | — | | | | — | |
| | | | | 7/31/13 | | | | — | | | | 1,844 | | | | 305 | | | | 4,482 | | | | 5,655 | | | | 6,287 | |
Tax return of capital | | | | | 7/31/14 | | | | — | | | | — | | | | — | | | | 1,726,833 | | | | — | | | | — | |
| | | | | 7/31/13 | | | | — | | | | — | | | | — | | | | 7,606,056 | | | | — | | | | — | |
Total
| | | | | 7/31/14 | | | $ | 31,359,551 | | | $ | 3,425,924 | | | $ | 5,875,954 | | | $ | 83,672,877 | | | $ | 7,526,454 | | | $ | 11,694,539 | |
| | | | | 7/31/13 | | | $ | 31,649,406 | | | $ | 4,316,068 | | | $ | 5,910,094 | | | $ | 71,934,317 | | | $ | 7,884,976 | | | $ | 12,292,948 | |
| 1 | | The Trusts designate these amounts paid during the fiscal year ended July 31, 2014, as exempt-interest dividends. |
| 2 | | Ordinary income consists primarily of taxable income recognized from market discount. Additionally, all ordinary income distributions are comprised of interest related dividends for non-U.S. residents and are eligible for exemption from U.S. withholding tax for nonresident aliens and foreign corporations. |
As of July 31, 2014, the tax components of accumulated net earnings (losses) were as follows:
|
|
|
| BFZ
|
| BFO
|
| BBF
|
| BTT
|
| BNJ
|
| BNY
|
Undistributed tax-exempt Income | | | | $ | 3,352,283 | | | $ | 2,361,172 | | | $ | 368,670 | | | | — | | | $ | 1,341,826 | | | $ | 2,950,539 | |
Undistributed ordinary income | | | | | — | | | | — | | | | — | | | | — | | | | 103,908 | | | | 2,041 | |
Capital loss carryforwards | | | | | (17,328,812 | ) | | | (751,184 | ) | | | (10,053,284 | ) | | $ | (65,058,716 | ) | | | (1,846,784 | ) | | | (10,793,148 | ) |
Net unrealized gains (losses)3 | | | | | 71,936,651 | | | | 3,750,567 | | | | 15,988,165 | | | | (46,465,469 | ) | | | 11,422,962 | | | | 14,636,812 | |
Qualified late-year loss4 | | | | | — | | | | (8,628 | ) | | | (186,759 | ) | | | (9,399,096 | ) | | | (261,020 | ) | | | (389,121 | ) |
Total
| | | | $ | 57,960,122 | | | $ | 5,351,927 | | | $ | 6,116,792 | | | $ | (120,923,281 | ) | | $ | 10,760,892 | | | $ | 6,407,123 | |
| 3 | | The differences between book-basis and tax-basis net unrealized gains (losses) were attributable primarily to the tax deferral of losses on wash sales, amortization and accretion methods of premiums and discounts on fixed income securities, the accrual of income on securities in default, treatment of residual interests in TOB trusts, the deferral of compensation to Trustees and the realization for tax purposes of unrealized gains/losses on certain futures contracts. |
| 4 | | The Trusts have elected to defer certain qualified late-year losses and recognize such losses in the next taxable year. |
| ANNUAL REPORT | JULY 31, 2014 | 63
|
| |
| Notes to Financial Statements (continued) |
|
As of July 31, 2014, the Trusts had capital loss carryforwards available to offset future realized capital gains through the indicated expiration dates as follows:
Expires July 31,
|
|
|
| BFZ
|
| BFO
|
| BBF
|
| BTT
|
| BNJ
|
| BNY
|
2015 | | | | $ | 465,742 | | | | — | | | | — | | | | — | | | | — | | | | — | |
2016 | | | | | 186,028 | | | | — | | | | — | | | | — | | | | — | | | | — | |
2017 | | | | | 3,782,470 | | | $ | 394,297 | | | | — | | | | — | | | | — | | | $ | 2,408,109 | |
2018 | | | | | 12,894,572 | | | | 62,100 | | | $ | 6,208,886 | | | | — | | | $ | 842,367 | | | | 1,480,575 | |
2019 | | | | | — | | | | — | | | | 651,464 | | | | — | | | | 27,464 | | | | 1,982,931 | |
No expiration date1 | | | | | — | | | | 294,787 | | | | 3,192,934 | | | $ | 65,058,716 | | | | 976,953 | | | | 4,921,533 | |
Total
| | | | $ | 17,328,812 | | | $ | 751,184 | | | $ | 10,053,284 | | | $ | 65,058,716 | | | $ | 1,846,784 | | | $ | 10,793,148 | |
| 1 | | Must be utilized prior to losses subject to expiration. |
During the year ended July 31, 2014, BFZ utilized $1,110,909 of its capital loss carryforward.
As of July 31, 2014, gross unrealized appreciation and depreciation based on cost for federal income tax purposes were as follows:
|
|
|
| BFZ
|
| BFO
|
| BBF
|
| BTT
|
| BNJ
|
| BNY
|
| | | | | | | | | | | | | | | | | | | | | | | | | | |
Tax cost | | | | $ | 600,496,749 | | | $ | 81,748,180 | | | $ | 117,705,021 | | | $ | 2,319,554,126 | | | $ | 166,089,479 | | | $ | 266,523,051 | |
Gross unrealized appreciation | | | | $ | 72,399,309 | | | $ | 5,189,548 | | | $ | 16,551,253 | | | $ | 18,274,611 | | | $ | 13,512,335 | | | $ | 17,702,983 | |
Gross unrealized depreciation | | | | | (393,713 | ) | | | (1,385,117 | ) | | | (546,087 | ) | | | (59,099,634 | ) | | | (2,069,582 | ) | | | (2,949,196 | ) |
Net unrealized appreciation(depreciation) | | | | $ | 72,005,596 | | | $ | 3,804,431 | | | $ | 16,005,166 | | | $ | (40,825,023 | ) | | $ | 11,442,753 | | | $ | 14,753,787 | |
8. Concentration, Market, and Credit Risk:
BFZ, BFO, BNJ, and BNY invest a substantial amount of their assets in issuers located in a single state or limited number of states. Please see the Schedules of Investments for concentrations in specific states or U.S. territories.
Many municipalities insure repayment of their bonds, which may reduce the potential for loss due to credit risk. The market value of these bonds may fluctuate for other reasons, including market perception of the value of such insurance, and there is no guarantee that the insurer will meet its obligation.
In the normal course of business, the Trusts invest in securities and enter into transactions where risks exist due to fluctuations in the market (market risk) or failure of the issuer of a security to meet all its obligations (issuer credit risk). The value of securities held by the Trusts may decline in response to certain events, including those directly involving the issuers whose securities are owned by the Trusts; conditions affecting the general economy; overall market changes; local, regional or global political, social or economic instability; and currency and interest rate and price fluctuations. Similar to issuer credit risk, the Trusts may be exposed to counterparty credit risk, or the risk that an entity with which the Trusts have unsettled or open transactions may fail to or be unable to perform on its commitments. The Trusts manage counterparty credit risk by entering into transactions only with counterparties that they believe have the financial resources to honor their obligations and by monitoring the financial stability of those counterparties. Financial assets, which potentially expose the Trusts to market, issuer and counterparty credit risks, consist principally of financial instruments and receivables due from counterparties. The extent of the Trusts’ exposure to market, issuer and counterparty credit risks with respect to these financial assets is generally approximated by their value recorded in the Statements of Assets and Liabilities, less any collateral held by the Trust.
The Trusts may hold a significant amount of bonds subject to calls by the issuers at defined dates and prices. When bonds are called by issuers and the Trusts reinvest the proceeds received, such investments may be in securities with lower yields than the bonds originally held, and correspondingly, could adversely impact the yield and total return performance of a Trust.
The Trusts invest a significant portion of their assets in fixed-income securities and/or use derivatives tied to the fixed income markets. See the Schedules of Investments for these securities and/or derivatives. Changes in market interest rates or economic conditions, including the Federal Reserve’s decision in December 2013 to taper its quantitative easing policy, may affect the value and/or liquidity of such investments. Interest rate risk is the risk that prices of bonds and other fixed-income securities will increase as interest rates fall and decrease as interest rates rise. The Trusts may be subject to a greater risk of rising interest rates due to the current period of historically low rates.
As of July 31, 2014, BFZ invested a significant portion of its assets in securities in the County/City/Special District/School District and Utilities sectors. BNY invested a significant portion of its assets in securities in the County/City/Special District/School District sector. BFO and BBF invested a significant portion of their assets in securities in the County/City/Special District/School District and Transportation sectors. BTT and BNJ invested a significant portion of their assets in securities in the Transportation sector. Changes in economic conditions affecting such sectors would have a greater impact on the Trusts and could affect the value, income and/or liquidity of positions in such securities.
| 64 | ANNUAL REPORT | JULY 31, 2014
|
| |
| Notes to Financial Statements (continued) |
|
On December 10, 2013, regulators published final rules implementing section 619 of the Dodd-Frank Wall Street Reform and Consumer Protection Act (the “Volcker Rule”), which prohibit banking entities from engaging in proprietary trading of certain instruments and limit such entities’ investments in, and relationships with, “covered funds,” as defined in the rules. Banking entities subject to the Volcker Rule are required to fully comply by July 21, 2015. The Volcker Rule may preclude banking entities and their affiliates from (i) sponsoring TOB trust programs (as such programs are presently structured) and (ii) continuing relationships with or services for existing TOB trust programs. As a result, TOB trusts may need to be restructured or unwound. There can be no assurances that TOB trusts can be restructured, that new sponsors of TOB trusts will develop, or that alternative forms of leverage will be available to the Trust. Any alternative forms of leverage may be more or less advantageous to the Trusts than existing TOB leverage.
TOB transactions constitute an important component of the municipal bond market. Accordingly, implementation of the Volcker Rule may adversely impact the municipal market, including through reduced demand for and liquidity of municipal bonds and increased financing costs for municipal issuers. Any such developments could adversely affect the Trusts. The ultimate impact of these rules on the TOB market and the overall municipal market is not yet certain.
9. Capital Share Transactions:
Each Trust is authorized to issue an unlimited number of shares, all of which were initially classified as Common Shares. The par value for each Trust’s Common Shares is $0.001. Each Trust’s Board is authorized, however, to reclassify any unissued Common Shares to Preferred Shares without approval of Common Shareholders.
At July 31, 2014, Common Shares of BTT owned by affiliates of the Manager were 5,571 shares.
Upon commencement of operations, organization costs associated with the establishment of BTT were expensed by BTT. Offering costs incurred in connection with BTT’s offering of Common Shares have been charged against the proceeds from the initial Common Share offering in the amount of $2,612,000.
Common Shares
For the years shown, shares issued and outstanding increased by the following amounts as a result of dividend reinvestment:
Year Ended
|
|
|
| BFZ
|
| BBF
|
| BNJ
|
| BNY
|
July 31, 2014 | | | | | — | | | | — | | | | — | | | | — | |
July 31, 2013 | | | | | 36,393 | | | | 3,273 | | | | 17,491 | | | | 36,314 | |
Shares issued and outstanding remained constant for BFO for years ended July 31, 2014 and July 31, 2013.
For BTT, shares issued and outstanding for the period August 30, 2012 to July 31, 2013, increased by 62,000,000 from the initial public offering and 8,500,000 from the underwriter’s exercising its over-allotment option.
Preferred Shares
The Trusts’ Preferred Shares rank prior to the Trusts’ Common Shares as to the payment of dividends by the Trusts and distribution of assets upon dissolution or liquidation of the Trusts. The 1940 Act prohibits the declaration of any dividend on the Trusts’ Common Shares or the repurchase of the Trusts’ Common Shares if the Trusts fail to maintain the asset coverage of at least 200% of the liquidation preference of the outstanding Preferred Shares. In addition, pursuant to the Preferred Shares’ governing instruments, the Trusts are restricted from declaring and paying dividends on classes of shares ranking junior to or on parity with the Preferred Shares or repurchasing such shares if the Trusts fail to declare and pay dividends on the Preferred Shares, redeem any Preferred Shares required to be redeemed under the Preferred Shares’ governing instruments or comply with the basic maintenance amount requirement of the agencies rating the Preferred Shares.
The holders of Preferred Shares have voting rights equal to the holders of Common Shares (one vote per share) and will vote together with holders of Common Shares (one vote per share) as a single class. However, the holders of Preferred Shares, voting as a separate class, are also entitled to elect two Trustees for each Trust. In addition, the 1940 Act requires that along with approval by shareholders that might otherwise be required, the approval of the holders of a majority of any outstanding Preferred Shares, voting separately as a class would be required to (a) adopt any plan of reorganization that would adversely affect the Preferred Shares, (b) change a Trust’s sub-classification as a closed-end investment company or change its fundamental investment restrictions or (c) change its business so as to cease to be an investment company.
VRDP Shares
BBF issued Series W-7 VRDP Shares, $100,000 liquidation value per share, in a privately negotiated offering. The VRDP Shares were offered to qualified institutional buyers as defined pursuant to Rule 144A under the Securities Act of 1933, as amended, (the “Securities Act”) and include a liquidity feature, pursuant to a liquidity agreement, that allows the holders of VRDP Shares to have their shares purchased by the liquidity provider in the event of a failed
| ANNUAL REPORT | JULY 31, 2014 | 65
|
| |
| Notes to Financial Statements (continued) |
|
remarketing. BBF is required to redeem the VRDP Shares owned by the liquidity provider after six months of continuous, unsuccessful remarketing. Upon the occurrence of the first unsuccessful remarketing, BBF is required to segregate liquid assets to fund the redemption. The VRDP Shares are subject to certain restrictions on transfer.
The VRDP Shares outstanding as of July 31, 2014 were as follows:
|
|
|
| Issue
Date
|
| Shares
Issued
|
| Aggregate
Principal
|
| Maturity
Date
|
BBF | | | | | 9/15/11 | | | | 342 | | | $ | 34,200,000 | | | | 10/01/41 | |
BBF entered into a fee agreement with the liquidity provider that may require a per annum liquidity fee payable to the liquidity provider. These fees, if applicable, are shown as liquidity fees in the Statements of Operations.
The initial fee agreement between BBF and the liquidity provider was for a 364 day term and was scheduled to expire on September 15, 2012 and subsequently extended until March 15, 2013, unless renewed or terminated in advance. On November 29, 2012, BBF entered into a new fee agreement with an alternate liquidity provider. The new fee agreement is for a two year term and is scheduled to expire on December 4, 2014, unless renewed or terminated in advance. The change in liquidity provider resulted in a mandatory tender of BBF’s VRDP Shares on November 28, 2012 which were successfully remarketed by the remarketing agent.
In the event the fee agreement is not renewed or is terminated in advance, and BBF does not enter into a fee agreement with an alternate liquidity provider, the VRDP Shares will be subject to mandatory purchase by the liquidity provider prior to the termination of the fee agreement. BBF is required to redeem any VRDP Shares purchased by the liquidity provider six months after the purchase date. Immediately after the purchase of any VRDP Shares by the liquidity provider, BBF is required to begin to segregate liquid assets with BBF’s custodian to fund the redemption. There is no assurance BBF will replace such redeemed VRDP Shares with any other preferred shares or other form of leverage.
BBF is required to redeem its VRDP Shares on the maturity date, unless earlier redeemed or repurchased. Six months prior to the maturity date, BBF is required to begin to segregate liquid assets with BBF’s custodian to fund the redemption. In addition, BBF is required to redeem certain of its outstanding VRDP Shares if it fails to maintain certain asset coverage, basic maintenance amount or leverage requirements.
Subject to certain conditions, the VRDP Shares may be redeemed, in whole or in part, at any time at the option of BBF. The redemption price per VRDP Share is equal to the liquidation value per share plus any outstanding unpaid dividends. In the event of an optional redemption of the VRDP Shares prior to the initial termination date of the fee agreement, BBF must pay the liquidity provider fees on such redeemed VRDP Shares for the remaining term of the fee agreement up to the initial termination date.
Dividends on the VRDP Shares are payable monthly at a variable rate set weekly by the remarketing agent. Such dividend rates are generally based upon a spread over a base rate and cannot exceed a maximum rate. In the event of a failed remarketing, the dividend rate of the VRDP Shares will be reset to a maximum rate. The maximum rate is determined based on, among other things, the long-term preferred share rating assigned to the VRDP Shares and the length of time that the VRDP Shares fail to be remarketed. At the date of issuance, the VRDP Shares were assigned a long-term rating of Aaa from Moody’s and AAA from Fitch. Subsequent to the issuance of the VRDP Shares, Moody’s completed a review of its methodology for rating securities issued by registered closed-end funds. As of July 31, 2014, the VRDP Shares were assigned a long-term rating of Aa1 from Moody’s under its new ratings methodology. The VRDP Shares continue to be assigned a long-term rating of AAA from Fitch.
The short-term ratings on the VRDP Shares are directly related to the short-term ratings of the liquidity provider for such VRDP Shares. Changes in the credit quality of the liquidity provider could cause a change in the short-term credit ratings of the VRDP Shares as rated by Moody’s, Fitch and/or S&P. A change in the short-term credit rating of the liquidity provider or the VRDP Shares may adversely affect the dividend rate paid on such shares, although the dividend rate paid on the VRDP Shares is not directly related based upon either short-term rating. As of July 31, 2014, the short-term ratings of the liquidity provider and the VRDP Shares for BFF were P-1, F1 and A1 as rated by Moody’s, Fitch and/or S&P, respectively, which is within the two highest rating categories. The liquidity provider may be terminated prior to the scheduled termination date if the liquidity provider fails to maintain short-term debt ratings in one of the two highest rating categories.
For financial reporting purposes, the VRDP Shares are considered debt of the issuer; therefore, the liquidation value, which approximates fair value, of the VRDP Shares is recorded as a liability in the Statements of Assets and Liabilities. Unpaid dividends are included in interest expense and fees payable in the Statements of Assets and Liabilities, and the dividends accrued and paid on the VRDP Shares are included as a component of interest expense, fees and amortization of offering costs in the Statements of Operations. The VRDP Shares are treated as equity for tax purposes. Dividends paid to holders of the VRDP Shares are generally classified as tax-exempt income for tax-reporting purposes.
| 66 | ANNUAL REPORT | JULY 31, 2014
|
| |
| Notes to Financial Statements (continued) |
|
BBF may incur remarketing fees of 0.10% on the aggregate principal amount of all the VRDP Shares, which, if any, are included in remarketing fees on Preferred Shares in the Statements of Operations. All of BBF’s VRDP Shares that were tendered for remarketing during the year ended July 31, 2014 were successfully remarketed, with an annualized dividend rate of 0.16%.
VMTP Shares
BFZ, BNJ and BNY (collectively, the “VMTP Trusts”), have issued Series W-7 VMTP Shares, $100,000 liquidation value per share, in a privately negotiated offering and sale of VMTP Shares exempt from registration under the Securities Act.
The VMTP Shares outstanding as of July 31, 2014 were as follows:
|
|
|
| Issue
Date
|
| Shares
Issued
|
| Aggregate
Principal
|
| Term
Date
|
BFZ | | | | | 3/22/12 | | | | 1,713 | | | $ | 171,300,000 | | | | 4/01/15 | |
BNJ | | | | | 3/22/12 | | | | 591 | | | $ | 59,100,000 | | | | 4/01/15 | |
BNY | | | | | 3/22/12 | | | | 945 | | | $ | 94,500,000 | | | | 4/01/15 | |
Each VMTP Trust is required to redeem its VMTP Shares on the term date, unless earlier redeemed or repurchased or unless extended. There is no assurance that the term of a Trust’s VMTP Shares will be extended or that a Trust’s VMTP Shares will be replaced with any other preferred shares or other form of leverage upon the redemption or repurchase of the VMTP Shares. Six months prior to term date, each VMTP Trust is required to begin to segregate liquid assets with the Trust’s custodian to fund the redemption. In addition, each VMTP Trust is required to redeem certain of its outstanding VMTP Shares if it fails to maintain certain asset coverage, basic maintenance amount or leverage requirements.
Subject to certain conditions, a Trust’s VMTP Shares may be redeemed, in whole or in part, at any time at the option of the Trust. The redemption price per VMTP Share is equal to the liquidation value per share plus any outstanding unpaid dividends and applicable redemption premium. If the Trust redeems the VMTP Shares on a date that is one year or more prior to the term date and the VMTP Shares are rated above A1/A+ by Moody’s and Fitch, respectively, then such redemption is subject to a prescribed redemption premium (up to 3% of the liquidation preference) payable to the holder of the VMTP Shares based on the time remaining to the term date, subject to certain exceptions for redemptions that are required to maintain minimum asset coverage requirements. The VMTP Shares are subject to certain restrictions on transfer, and a Trust may also be required to register the VMTP Shares for sale under the Securities Act under certain circumstances. In addition, amendments to the VMTP governing document generally require the consent of the holders of VMTP Shares.
Dividends on the VMTP Shares are declared daily and payable monthly at a variable rate set weekly at a fixed rate spread to the Securities Industry and Financial Markets Association Municipal Swap Index (SIFMA). The fixed spread is determined based on the long-term preferred share rating assigned to the VMTP Shares by Moody’s and Fitch. At the date of issuance, the VMTP Shares were assigned long-term ratings of Aaa from Moody’s and AAA from Fitch. Subsequent to the issuance of the VMTP Shares, Moody’s completed a review of its methodology for rating securities issued by registered closed-end funds. As of July 31, 2014, the VMTP Shares were assigned a long-term rating of Aa2 from Moody’s under its new rating methodology. The VMTP Shares continue to be assigned a long-term rating of AAA from Fitch. The dividend rate on the VMTP Shares is subject to a step-up spread if the Trust fails to comply with certain provisions, including, among other things, the timely payment of dividends, redemptions or gross-up payments, and maintaining certain asset coverage and leverage requirements.
The average annualized dividend rates for the VMTP Shares for the year ended July 31, 2014 were as follows:
|
|
|
| BFZ
|
| BNJ
|
| BNY
|
Rate | | | | | 1.06 | % | | | 1.06 | % | | | 1.06 | % |
For financial reporting purposes, the VMTP Shares are considered debt of the issuer; therefore the liquidation value, which approximates fair value, of the VMTP Shares is recorded as a liability in the Statements of Assets and Liabilities. Unpaid dividends are included in interest expense and fees payable in the Statements of Assets and Liabilities, and the dividends accrued and paid on the VMTP Shares are included as a component of interest expense, fees and amortization of offering costs in the Statements of Operations. The VMTP Shares are treated as equity for tax purposes. Dividends paid to holders of the VMTP Shares are generally classified as tax-exempt income for tax-reporting purposes.
VMTP Shares issued and outstanding remained constant for the year ended July 31, 2014.
| ANNUAL REPORT | JULY 31, 2014 | 67
|
| |
| Notes to Financial Statements (continued) |
|
RVMTP Shares
BTT has issued Series W-7 RVMTP Shares, $5,000,000 liquidation value per share, in a privately negotiated offering and sale of RVMTP Shares exempt from registration under the Securities Act.
The RVMTP Shares outstanding as of year ended July 31, 2014 were as follows:
|
|
|
| Issue
Date
|
| Shares
Issued
|
| Aggregate
Principal
|
| Term
Date
|
BTT | | | | | 1/10/2013 | | | | 50 | | | $ | 250,000,000 | | | | 12/31/2030 | |
| | | | | 1/30/2013 | | | | 50 | | | $ | 250,000,000 | | | | 12/31/2030 | |
| | | | | 2/20/2013 | | | | 50 | | | $ | 250,000,000 | | | | 12/31/2030 | |
BTT is required to redeem its RVMTP Shares on the term date or within six months of an unsuccessful remarketing, unless earlier redeemed or repurchased. There is no assurance that BTT’s RVMTP Shares will be replaced with any other preferred shares or other form of leverage upon the redemption or repurchase of the RVMTP Shares. In addition, BTT is required to redeem certain of its outstanding RVMTP Shares if it fails to maintain certain asset coverage, basic maintenance amount or leverage requirements.
Subject to certain conditions, BTT’s RVMTP Shares may be redeemed, in whole or in part, at any time at the option of BTT. The redemption price per RVMTP Share is equal to the liquidation value per share plus any outstanding unpaid dividends. The RVMTP Shares are subject to certain restrictions on transfer outside of a remarketing. The RVMTP Shares are subject to remarketing upon 90 days’ notice by holders of the RVMTP Shares and 30-days’ notice by BTT. Each remarketing must be at least six months apart from the last remarketing. A holder of RVMTP Shares may submit notice of remarketing only if such holder requests a remarketing of at least the lesser of (i) $100,000,000 of RVMTP Shares or (ii) all of the RVMTP Shares held by such holder. Amendments to the RVMTP governing document generally require the consent of the holders of RVMTP Shares.
Dividends on the RVMTP Shares are declared daily and payable monthly at a variable rate set weekly at a fixed rate spread to the SIFMA. The initial fixed rate spread was agreed upon by the Purchaser and BTT on the initial date of issuance for the Series W-7 RVMTP Shares. The initial fixed rate spread may be adjusted at each remarketing or upon the agreement between BTT and all of the holders of the RVMTP Shares. In the event all of the RVMTP Shares submitted for remarketing are not successfully remarketed, a failed remarketing will occur, and all holders would retain their RVMTP Shares. In the event of a failed remarketing, the fixed rate spread would be set at the fixed rate spread applicable to such failed remarketing. BTT has the right to reject any fixed spread determined at a remarketing, and such rejection would result in a failed remarketing and the fixed rate spread being set at the fixed rate spread applicable to such failed remarketing. The fixed rate spread applicable due to a failed remarketing depends on whether the remarketing was pursuant to a mandatory or non-mandatory tender. In the case of a failed remarketing following a mandatory tender, the failed remarketing spread would be the sum of the last applicable spread in effect immediately prior to the failed remarketing date for such failed remarketing plus 0.75%. In the case of a failed remarketing not associated with a mandatory tender, the failed remarketing spread would be the sum of the last applicable spread in effect immediately prior to the failed remarketing date for such failed remarketing plus 0.25%. In the event of a failed remarketing that is not subsequently cured, BTT will be required to redeem the RVMTP Shares subject to such failed remarketing on a date that is approximately six months from the remarketing date for such failed remarketing, provided that no redemption of any RVMTP Share may occur within one year of the date of issuance of such RVMTP Share. At the date of issuance, the RVMTP Shares were assigned long-term ratings of Aaa from Moody’s and AAA from Fitch. The dividend rate on the RVMTP Shares is subject to a step-up spread if BTT fails to comply with certain provisions, including, among other things, the timely payment of dividends, redemptions or gross-up payments, and maintaining certain asset coverage and leverage requirements.
There were no RVMTP Shares that were tendered for remarketing during the year ended July 31, 2014
The average annualized dividend rate for the BTT RVMTP Shares for the year ended July 31, 2014 was 0.71%.
For financial reporting purposes, the RVMTP Shares are considered debt of the issuer; therefore the liquidation value, which approximates fair value, of the RVMTP Shares is recorded as a liability in the Statements of Assets and Liabilities. Unpaid dividends are included in interest expense and fees payable in the Statements of Assets and Liabilities, and the dividends accrued and paid on the RVMTP Shares are included as a component of interest expense, fees and amortization of offering costs in the Statements of Operations. The RVMTP Shares are treated as equity for tax purposes. Dividends paid to holders of the RVMTP Shares are generally classified as tax-exempt income for tax-reporting purposes.
RVMTP Shares issued and outstanding remained constant for the year ended July 31, 2014.
Offering Costs: The Income Trusts incurred costs in connection with the issuance of VRDP Shares, VMTP Shares and/or RVMTP Shares. For VRDP Shares, these costs were recorded as a deferred charge and will be amortized over the 30-year life of the VRDP Shares with the exception of upfront fees paid to the liquidity provider which were amortized over the life of the liquidity agreement. For VMTP Shares, these costs were recorded as a deferred charge and
| 68 | ANNUAL REPORT | JULY 31, 2014
|
| |
| Notes to Financial Statements (continued) |
|
will be amortized over the 3-year life of the VMTP Shares. For RVMTP Shares, these costs were recorded as a deferred charge and will be amortized over the 18-year life of the RVMTP Shares. Amortization of these costs is included in interest expense, fees and amortization of offering costs in the Statements of Operations.
AMPS
The AMPS are redeemable at the option of BFO, in whole or in part, on any dividend payment date at their liquidation preference per share plus any accumulated and unpaid dividends whether or not declared. The AMPS are also subject to mandatory redemption at their liquidation preference plus any accumulated and unpaid dividends, whether or not declared, if certain requirements relating to the composition of the assets and liabilities of BFO, as set forth in BFO’S Statement of Preferences (the “Governing Instrument”), are not satisfied.
From time to time in the future, BFO may effect repurchases of its AMPS at prices below their liquidation preference as agreed upon by BFO and seller. BFO also may redeem its AMPS from time to time as provided in the applicable Governing Instrument. BFO intends to effect such redemptions and/or repurchases to the extent necessary to maintain applicable asset coverage requirements or for such other reasons as the Board may determine.
In order to provide additional flexibility for BFO to potentially continue to conduct partial redemptions of AMPS, an amendment to BFO’s AMPS Statement of Preferences was made. The amendment eliminates a requirement that precluded partial redemptions of AMPS once the number of AMPS outstanding for a particular series fell below 300 shares. The removal of this requirement is in the best interest of BFO and shareholders as it seeks to provide additional flexibility to conduct partial redemptions of AMPS in advance of BFO’s maturity, if such redemption is otherwise determined to be consistent with the best interest of the BFO and its shareholders.
The AMPS outstanding as of year ended July 31, 2014 were as follows:
|
|
|
| Series
|
| AMPS
|
| Effective
Yield
|
| Rate
Frequency
Days
| Moody’s
Rating
|
BFO | | | | | F-7 | | | | 25 | | | | 0.12 | % | | | 7 | | Aa2 |
Dividends on seven-day AMPS are cumulative at a rate, which is reset every seven days based on the results of an auction. If the AMPS fail to clear the auction on an auction date, BFO is required to pay the maximum applicable rate on the AMPS to holders of such shares for successive dividend periods until such time as the shares are successfully auctioned. The maximum applicable rate on all series of AMPS prior to November 1, 2012 was the higher of 110% of the AA commercial paper rate or 100% of 90% of the Kenny S&P 30-day High Grade Index rate divided by 1.00 minus the marginal tax rate. The Kenny S&P 30-day High Grade Index was discontinued as of November 1, 2012. For purposes of calculating the maximum applicable rate, the Kenny S&P 30-day High Grade Index was replaced with the S&P Municipal Bond 7-Day High Grade Rate Index as of November 1, 2012. The low, high and average dividend rates on the AMPS for BFO for the year ended July 31, 2014 were as follows:
|
|
|
| Series
|
| Low
|
| High
|
| Average
|
BFO | | | | | F-7 | | | | 0.07 | % | | | 0.23 | % | | | 0.11 | % |
Since February 13, 2008, the AMPS of the BFO failed to clear any of their auctions. As a result, the AMPS dividend rates were reset to the maximum applicable rate, which ranged from 0.07% to 1.94% for the year ended July 31, 2014. A failed auction is not an event of default for the Trust but it has a negative impact on the liquidity of AMPS. A failed auction occurs when there are more sellers of a Trust’s AMPS than buyers. A successful auction for the Trust’s AMPS may not occur for some time, if ever, and even if liquidity does resume, holders of AMPS may not have the ability to sell the AMPS at their liquidation preference.
BFO paid commissions of 0.15% on the aggregate principal amount of all shares that fail to clear their auctions and 0.25% on the aggregate principal amount of all shares that successfully clear their auctions. Certain broker dealers have individually agreed to reduce commissions for failed auctions. The commissions paid to these broker dealers are included in remarketing fees on Preferred Shares in the Statements of Operations.
| ANNUAL REPORT | JULY 31, 2014 | 69
|
| |
| Notes to Financial Statements (concluded) |
|
During the year ended July 31, 2014, BFO announced the following redemptions of AMPS at a price of $25,000 per share plus any accrued and unpaid dividends through the redemption date:
|
|
|
| Series
|
| Redemption
Date
|
| Shares
Redeemed
|
| Aggregate
Principal
|
BFO | | | | | F-7 | | | | 9/09/13 | | | | 80 | | | $ | 2,000,000 | |
| | | | | F-7 | | | | 10/28/13 | | | | 384 | | | $ | 9,600,000 | |
| | | | | F-7 | | | | 12/02/13 | | | | 110 | | | $ | 2,750,000 | |
| | | | | F-7 | | | | 1/06/14 | | | | 65 | | | $ | 1,625,000 | |
| | | | | F-7 | | | | 4/08/14 | | | | 30 | | | $ | 750,000 | |
| | | | | F-7 | | | | 6/09/14 | | | | 70 | | | $ | 1,750,000 | |
10. Subsequent Events:
Management’s evaluation of the impact of all subsequent events on the Trusts’ financial statements was completed through the date the financial statements were issued and the following items were noted:
Each Trust paid a net investment income dividend on September 2, 2014 to Common Shareholders of record on August 15, 2014:
|
|
|
| Common
Dividend
Per Share
|
BFZ | | | | $ | 0.072200 | |
BFO | | | | $ | 0.034700 | |
BBF | | | | $ | 0.072375 | |
BTT | | | | $ | 0.080000 | |
BNJ | | | | $ | 0.075100 | |
BNY | | | | $ | 0.069000 | |
Additionally, the Trusts declared a net investment income dividend on September 2, 2014 payable to Common Shareholders of record on September 15, 2014, for the same amounts noted above.
The dividends declared on Preferred Shares for the period August 1, 2014 to August 31, 2014 were as follows:
|
|
|
| Preferred
Shares
|
| Series
|
| Dividends
Declared
|
BFZ | | | | VMTP Shares | | | W-7 | | | $ | 153,044 | |
BFO | | | | AMPS | | | F-7 | | | $ | 55 | |
BBF | | | | VRDP Shares | | | W-7 | | | $ | 4,123 | |
BTT | | | | RVMTP Shares | | | W-7 | | | $ | 447,123 | |
BNJ | | | | VMTP Shares | | | W-7 | | | $ | 52,801 | |
BNY | | | | VMTP Shares | | | W-7 | | | $ | 84,429 | |
| 70 | ANNUAL REPORT | JULY 31, 2014
|
| |
| Report of Independent Registered Public Accounting Firm |
|
To the Shareholders and Board of Trustees of
BlackRock California Municipal Income Trust,
BlackRock Florida Municipal 2020 Term Trust,
BlackRock Municipal Income Investment Trust,
BlackRock New Jersey Municipal Income Trust,
BlackRock New York Municipal Income Trust, and
BlackRock Municipal Target Term Trust:
We have audited the accompanying statements of assets and liabilities, including the schedules of investments, of BlackRock California Municipal Income Trust, BlackRock Municipal Income Investment Trust, BlackRock New Jersey Municipal Income Trust, BlackRock New York Municipal Income Trust, and BlackRock Municipal Target Term Trust (each a “Trust”) as of July 31, 2014, and the related statements of operations and the statements of cash flows for the year then ended, the statements of changes in net assets for each of the periods presented, and the financial highlights for each of the periods presented. We have also audited the accompanying statement of assets and liabilities, including the schedule of investments, of BlackRock Florida Municipal 2020 Term Trust (collectively with each Trust, the “Trusts”) as of July 31, 2014, and the related statements of operations for the year then ended, the statement of changes in net assets for each of the two years in the period then ended, and the financial highlights for each of the periods presented. These financial statements and financial highlights are the responsibility of the Trusts’ management. Our responsibility is to express an opinion on these financial statements and financial highlights based on our audits.
We conducted our audits in accordance with the standards of the Public Company Accounting Oversight Board (United States). Those standards require that we plan and perform the audit to obtain reasonable assurance about whether the financial statements and financial highlights are free of material misstatement. The Trusts are not required to have, nor were we
engaged to perform, an audit of their internal control over financial reporting. Our audits included consideration of internal control over financial reporting as a basis for designing audit procedures that are appropriate in the circumstances, but not for the purpose of expressing an opinion on the effectiveness of the Trusts’ internal control over financial reporting. Accordingly, we express no such opinion. An audit also includes examining, on a test basis, evidence supporting the amounts and disclosures in the financial statements, assessing the accounting principles used and significant estimates made by management, as well as evaluating the overall financial statement presentation. Our procedures included confirmation of securities owned as of July 31, 2014, by correspondence with the custodian and brokers; where replies were not received from brokers, we performed other auditing procedures. We believe that our audits provide a reasonable basis for our opinion.
In our opinion, the financial statements and financial highlights referred to above present fairly, in all material respects, the financial positions of BlackRock California Municipal Income Trust, BlackRock Florida Municipal 2020 Term Trust, BlackRock Municipal Income Investment Trust, BlackRock New Jersey Municipal Income Trust, BlackRock New York Municipal Income Trust, and BlackRock Municipal Target Term Trust as of July 31, 2014, and the results of their operations and cash flows for the year then ended, the changes in their net assets for each of the periods presented, and the financial highlights for each of the periods presented, in conformity with accounting principles generally accepted in the United States of America.
Deloitte & Touche LLP
Boston, Massachusetts
September 24, 2014
| ANNUAL REPORT | JULY 31, 2014 | 71
|
| |
| Disclosure of Investment Advisory Agreements |
|
The Board of Trustees (each, a “Board,” collectively, the “Boards,” and the members of which are referred to as “Board Members”) of BlackRock California Municipal Income Trust (“BFZ”), BlackRock Florida Municipal 2020 Term Trust (“BFO”), BlackRock Municipal Income Investment Trust (“BBF”), BlackRock Municipal Target Term Trust (“BTT”), BlackRock New Jersey Municipal Income Trust (“BNJ”) and BlackRock New York Municipal Income Trust (“BNY” and together with BFZ, BFO, BBF, BTT and BNJ, each a “Trust,” and, collectively, the “Trusts”) met in person on May 9, 2014 (the “May Meeting”) and June 5-6, 2014 (the “June Meeting”) to consider the approval of each Trust’s investment advisory agreement (each, an “Advisory Agreement,” and, collectively, the “Advisory Agreements”) with BlackRock Advisors, LLC (the “Manager”), each Trust’s investment advisor. At the June Meeting, it was noted that (i) the sub-advisory agreement among the Manager, BlackRock Financial Management, Inc. and each Trust (except BTT) would expire effective July 1, 2014, and (ii) the sub-advisory agreement among the Manager, BlackRock Investment Management, LLC and BTT would be terminated effective July 1, 2014. It was also noted that the non-renewal or termination of each Trust’s sub-advisory agreement would not result in any change in the nature or quality of services provided to such Trust, or in the portfolio management team that serves such Trust. The Manager is referred to herein as “BlackRock.”
Activities and Composition of the Board
Each Board consists of eleven individuals, nine of whom are not “interested persons” of such Trust as defined in the Investment Company Act of 1940 (the “1940 Act”) (the “Independent Board Members”). The Board Members are responsible for the oversight of the operations of the Trusts and perform the various duties imposed on the directors of investment companies by the 1940 Act. The Independent Board Members have retained independent legal counsel to assist them in connection with their duties. The Chairman of each Board is an Independent Board Member. Each Board has established six standing committees: an Audit Committee, a Governance and Nominating Committee, a Compliance Committee, a Performance Oversight Committee, an Executive Committee, and a Leverage Committee, each of which is chaired by an Independent Board Member and composed of Independent Board Members (except for the Executive Committee and the Leverage Committee, each of which also has one interested Board Member).
The Advisory Agreements
Pursuant to the 1940 Act, the Boards are required to consider the continuation of the Advisory Agreements on an annual basis. The Boards have four quarterly meetings per year, each extending over two days, and a fifth one-day meeting to consider specific information surrounding the consideration of renewing the Advisory Agreements. In connection with this process, the Boards assessed, among other things, the nature, scope and quality of the services provided to the Trusts by BlackRock, its personnel and its affiliates, including, as applicable, investment management, administrative, and shareholder services; oversight of fund service providers; marketing services; risk oversight; compliance and assistance in meeting applicable legal and regulatory requirements.
The Boards, acting directly and through their respective committees, consider at each of their meetings, and from time to time as appropriate, factors that are relevant to their annual consideration of the renewal of the Advisory Agreements, including the services and support provided by BlackRock to the Trusts and their shareholders. Among the matters the Boards considered were: (a) investment performance for one-year,
three-year, five-year and/or since inception periods, as applicable, against peer funds, and applicable benchmarks, if any, as well as senior management’s and portfolio managers’ analysis of the reasons for any over-performance or underperformance against their peers and/or benchmark, as applicable; (b) fees, including advisory, administration, if applicable, and other amounts paid to BlackRock and its affiliates by the Trusts for services such as call center; (c) Trust operating expenses and how BlackRock allocates expenses to the Trusts; (d) the resources devoted to, risk oversight of, and compliance reports relating to, implementation of the Trusts’ investment objective, policies and restrictions, and meeting new regulatory requirements; (e) the Trusts’ compliance with their Code of Ethics and other compliance policies and procedures; (f) the nature, cost and character of non-investment management services provided by BlackRock and its affiliates; (g) BlackRock’s and other service providers’ internal controls and risk and compliance oversight mechanisms; (h) BlackRock’s implementation of the proxy voting policies approved by the Boards; (i) execution quality of portfolio transactions; (j) BlackRock’s implementation of the Trusts’ valuation and liquidity procedures; (k) an analysis of management fees for products with similar investment objectives across the open-end fund, closed-end fund and institutional account product channels, as applicable; (l) BlackRock’s compensation methodology for its investment professionals and the incentives it creates; and (m) periodic updates on BlackRock’s business.
The Boards have engaged in an ongoing strategic review with BlackRock of opportunities to consolidate funds and of BlackRock’s commitment to investment performance. BlackRock also furnished information to the Boards in response to specific questions. These questions covered issues such as: BlackRock’s profitability; investment performance; subadvisory and advisory relationships with other clients (including mutual funds sponsored by third parties); investment professional investment in funds they manage; and management fee levels and breakpoints. The Boards further discussed with BlackRock: BlackRock’s management structure; portfolio turnover; BlackRock’s portfolio manager compensation and performance accountability; marketing support for the Trusts; services provided to the Trusts by BlackRock affiliates; and BlackRock’s oversight of relationships with third party service providers.
The Board of each Trust considered BlackRock’s efforts during the past year with regard to refinancing outstanding AMPS, as well as ongoing time and resources devoted to other forms of preferred shares and alternative leverage. As of the date of this report, each of BFZ, BBF, BNJ and BNY has redeemed 100% of its outstanding AMPS and BFO has redeemed 98.7% of its outstanding AMPS.
Board Considerations in Approving the Advisory Agreements
The Approval Process: Prior to the May Meeting, the Boards requested and received materials specifically relating to the Advisory Agreements. The Boards are continuously engaged in a process with their independent legal counsel and BlackRock to review the nature and scope of the information provided to better assist their deliberations. The materials provided in connection with the May Meeting included (a) information independently compiled and prepared by Lipper, Inc. (“Lipper”) on Trust fees and expenses as compared with a peer group of funds as determined by Lipper (“Expense Peers”) and the investment performance of the Trusts as compared with a peer group of funds as determined by Lipper1 and, where
| 1 | | Funds are ranked by Lipper in quartiles, ranging from first to fourth, where first is the most desirable quartile position and fourth is the least desirable. |
| 72 | ANNUAL REPORT | JULY 31, 2014
|
| |
| Disclosure of Investment Advisory Agreements (continued) |
|
applicable, a customized peer group selected by BlackRock; (b) information on the profits realized by BlackRock and its affiliates pursuant to the Advisory Agreements and a discussion of fall-out benefits to BlackRock and its affiliates; (c) a general analysis provided by BlackRock concerning investment management fees charged to other clients, such as institutional clients and open-end funds, under similar investment mandates, as applicable; (d) review of non-management fees; (e) the existence, impact and sharing of potential economies of scale; (f) a summary of aggregate amounts paid by each Trust to BlackRock and (g) if applicable, a comparison of management fees to similar BlackRock closed-end funds, as classified by Lipper.
At the May Meeting, the Boards reviewed materials relating to their consideration of the Advisory Agreements. As a result of the discussions that occurred during the May Meeting, and as a culmination of the Boards’ year-long deliberative process, the Boards presented BlackRock with questions and requests for additional information. BlackRock responded to these requests with additional written information in advance of the June Meeting.
At the June Meeting, each Board, including the Independent Board Members, unanimously approved the continuation of the Advisory Agreements between the Manager and its Trust for a one-year term ending June 30, 2015. In approving the continuation of the Advisory Agreements, the Boards considered: (a) the nature, extent and quality of the services provided by BlackRock; (b) the investment performance of the Trusts and BlackRock; (c) the advisory fee and the cost of the services and profits to be realized by BlackRock and its affiliates from their relationship with the Trusts; (d) the Trusts’ costs to investors compared to the costs of Expense Peers and performance compared to the relevant performance comparison as previously discussed; (e) economies of scale; (f) fall-out benefits to BlackRock and its affiliates as a result of its relationship with the Trusts; and (g) other factors deemed relevant by the Board Members.
The Boards also considered other matters they deemed important to the approval process, such as payments made to BlackRock or its affiliates relating to securities lending, services related to the valuation and pricing of Trust portfolio holdings, direct and indirect benefits to BlackRock and its affiliates from their relationship with the Trusts and advice from independent legal counsel with respect to the review process and materials submitted for the Boards’ review. The Boards noted the willingness of BlackRock personnel to engage in open, candid discussions with the Boards. The Boards did not identify any particular information as determinative, and each Board Member may have attributed different weights to the various items considered.
A. Nature, Extent and Quality of the Services Provided by BlackRock: The Boards, including the Independent Board Members, reviewed the nature, extent and quality of services provided by BlackRock, including the investment advisory services and the resulting performance of the Trusts. Throughout the year, each Board compared its Trust’s performance to the performance of a comparable group of closed-end funds and/or the performance of a relevant benchmark, as applicable. The Boards met with BlackRock’s senior management personnel responsible for investment activities, including the senior investment officers. Each Board also reviewed the materials provided by its Trust’s portfolio management team discussing the Trust’s performance and the Trust’s investment objective, strategies and outlook.
The Boards considered, among other factors, with respect to BlackRock: the number, education and experience of investment personnel generally and their Trusts’ portfolio management teams; investments by portfolio managers in the funds they manage; portfolio trading capabilities; use of technology; commitment to compliance; credit analysis capabilities; risk analysis and oversight capabilities; and the approach to training and retaining portfolio managers and other research, advisory and management personnel. The Boards engaged in a review of BlackRock’s compensation structure with respect to the Trusts’ portfolio management teams and BlackRock’s ability to attract and retain high-quality talent and create performance incentives.
In addition to advisory services, the Boards considered the quality of the administrative and other non-investment advisory services provided to the Trusts. BlackRock and its affiliates provide the Trusts with certain services (in addition to any such services provided to the Trusts by third parties) and officers and other personnel as are necessary for the operations of the Trusts. In particular, BlackRock and its affiliates provide the Trusts with the following administrative services including, among others: (i) preparing disclosure documents, such as the prospectus and the statement of additional information in connection with the initial public offering and periodic shareholder reports; (ii) preparing communications with analysts to support secondary market trading of the Trusts; (iii) oversight of daily accounting and pricing; (iv) preparing periodic filings with regulators and stock exchanges; (v) overseeing and coordinating the activities of other service providers; (vi) organizing Board meetings and preparing the materials for such Board meetings; (vii) providing legal and compliance support; (viii) furnishing analytical and other support to assist the Board in its consideration of strategic issues such as the merger or consolidation of certain closed-end funds; and (ix) performing other administrative functions necessary for the operation of the Trusts, such as tax reporting, fulfilling regulatory filing requirements and call center services. The Boards reviewed the structure and duties of BlackRock’s fund administration, shareholder services, legal and compliance departments and considered BlackRock’s policies and procedures for assuring compliance with applicable laws and regulations.
B. The Investment Performance of the Trusts and BlackRock: Each Board, including the Independent Board Members, also reviewed and considered the performance history of its Trust. In preparation for the May Meeting, the Boards worked with their independent legal counsel, BlackRock and Lipper to develop a template for, and were provided with reports independently prepared by Lipper, which included a comprehensive analysis of each Trust’s performance. The Boards also reviewed a narrative and statistical analysis of the Lipper data that was prepared by BlackRock, which analyzed various factors that affect Lipper’s rankings. In connection with its review, each Board received and reviewed information regarding the investment performance, based on net asset value (NAV), of its Trust as compared to other funds in that Trust’s applicable Lipper category and, where applicable, the customized peer group selected by BlackRock. The Boards were provided with a description of the methodology used by Lipper to select peer funds and periodically meets with Lipper representatives to review its methodology. Each Board and its Performance Oversight Committee regularly review, and meet with Trust management to discuss, the performance of its Trust throughout the year.
The Board of BFZ noted that for the one-, three- and five-year periods reported, BFZ ranked in the second, third and second quartiles, respectively, against its Customized Lipper Peer Group Composite.
| ANNUAL REPORT | JULY 31, 2014 | 73
|
| |
| Disclosure of Investment Advisory Agreements (continued) |
|
BlackRock believes that the Customized Lipper Peer Group Composite is an appropriate performance metric for BFZ in that it measures a blend of total return and yield. The Board of BFZ and BlackRock reviewed and discussed the reasons for the Trust’s underperformance during the three-year period and noted that they will monitor the Trust’s performance.
The Board of BFO noted that for the one-, three- and five-year periods reported, BFO ranked in the first, third and third quartiles, respectively, against its Lipper Performance Universe Composite. BlackRock believes that the Lipper Performance Universe Composite is an appropriate performance metric for BFO in that it measures a blend of total return and yield. The Board of BFO also noted the Trust’s improved performance during the one-year period. The Board and BlackRock reviewed and discussed the reasons for the Trust’s underperformance during the three- and five-year periods. BFO’s Board was informed that, among other things, the Trust has a targeted maturity, and as such is managed to achieve the specific maturity goal.
The Board of BBF noted that for the one-, three- and five-year periods reported, BBF ranked in the fourth, third and third quartiles, respectively, against its Customized Lipper Peer Group Composite. BlackRock believes that the Customized Lipper Peer Group Composite is an appropriate performance metric for BBF in that it measures a blend of total return and yield. The Board of BBF and BlackRock reviewed and discussed the reasons for the Trust’s underperformance during these periods. BBF��s Board was informed that, among other things, underperformance is attributed to the Trust’s below market distribution yield for these periods. The continued challenge going forward for the Trust is seeking ways to increase its yield component. One disadvantage BBF has versus its Customized Lipper Peer Group Composite is that its investment policies do not allow it to purchase securities that are subject to the alternative minimum tax (AMT), which provides peer funds with additional yield.
The Board and BlackRock also discussed BlackRock’s strategy for improving the Trust’s performance and BlackRock’s commitment to providing the resources necessary to assist the Trust’s portfolio managers in seeking to improve the Trust’s performance.
The Board of BTT noted that for each of the one-year and since-inception periods reported, BTT ranked in the fourth quartile against its Lipper Performance Universe Composite. BlackRock believes that the Lipper Performance Universe Composite is an appropriate performance metric for BTT in that it measures a blend of total return and yield. The Board of BTT and BlackRock reviewed and discussed the reasons for the Trust’s underperformance during these periods. BTT’s Board was informed that, among other things, given the Trust’s scheduled termination date and its investment objectives, the Trust’s holdings are structured to mature around the 15-20 year part of the yield curve. The absence of a laddered maturity structure and seasoned call structure results in a higher duration than a typical perpetual municipal closed-end fund. As a result of BTT’s higher relative duration and exposure to the weakest performing part of the curve, BTT underperformed its performance composite in the one-year and since-inception periods.
The Board of BNJ noted that for each of the one-, three- and five-year periods reported, BNJ ranked in the first quartile against its Customized Lipper Peer Group Composite. BlackRock believes that the Customized Lipper Peer Group Composite is an appropriate performance metric for BNJ in that it measures a blend of total return and yield.
The Board of BNY noted that for the one-, three- and five-year periods reported, BNY ranked in the fourth, second and second quartiles, respectively, against its Customized Lipper Peer Group Composite. BlackRock believes that the Customized Lipper Peer Group Composite is an appropriate performance metric for BNY in that it measures a blend of total return and yield. The Board of BNY and BlackRock reviewed and discussed the reasons for the Trust’s underperformance during the one-year period and noted that they will monitor the Trust’s performance.
C. Consideration of the Advisory/Management Fees and the Cost of the Services and Profits to be Realized by BlackRock and its Affiliates from their Relationship with the Trusts: Each Board, including the Independent Board Members, reviewed its Trust’s contractual management fee rate compared with the other funds in its Lipper category. The contractual management fee rate represents a combination of the advisory fee and any administrative fees, before taking into account any reimbursements or fee waivers. The Board also compared the Trust’s total expense ratio, as well as its actual management fee rate, to those of other funds in its Lipper category. The total expense ratio represents a fund’s total net operating expenses, excluding any investment related expenses. The total expense ratio gives effect to any expense reimbursements or fee waivers that benefit a fund, and the actual management fee rate gives effect to any management fee reimbursements or waivers that benefit a fund. The Boards considered the services provided and the fees charged by BlackRock and its affiliates to other types of clients with similar investment mandates, as applicable, including institutional accounts.
The Boards received and reviewed statements relating to BlackRock’s financial condition. The Boards were also provided with a profitability analysis that detailed the revenues earned and the expenses incurred by BlackRock for services provided to the Trusts. The Boards reviewed BlackRock’s profitability with respect to the Trusts and other funds the Boards currently oversee for the year ended December 31, 2013 compared to available aggregate profitability data provided for the prior two years. The Boards reviewed BlackRock’s profitability with respect to certain other fund complexes managed by the Manager and/or its affiliates. The Boards reviewed BlackRock’s assumptions and methodology of allocating expenses in the profitability analysis, noting the inherent limitations in allocating costs among various advisory products. The Boards recognized that profitability may be affected by numerous factors including, among other things, fee waivers and expense reimbursements by the Manager, the types of funds managed, precision of expense allocations and business mix. As a result, calculating and comparing profitability at individual fund levels is difficult.
The Boards noted that, in general, individual fund or product line profitability of other advisors is not publicly available. The Boards reviewed BlackRock’s overall operating margin, in general, compared to that of certain other publicly-traded asset management firms. The Boards considered the differences between BlackRock and these other firms, including the contribution of technology at BlackRock, BlackRock’s expense management, and the relative product mix.
In addition, the Boards considered the cost of the services provided to the Trusts by BlackRock, and BlackRock’s and its affiliates’ profits relating to the management of the Trusts and the other funds advised by BlackRock and its affiliates. As part of its analysis, the Boards reviewed BlackRock’s methodology in allocating its costs to the management of the Trusts. The Boards also considered whether BlackRock has the financial resources
| 74 | ANNUAL REPORT | JULY 31, 2014
|
| |
| Disclosure of Investment Advisory Agreements (concluded) |
|
necessary to attract and retain high quality investment management personnel to perform its obligations under the Advisory Agreements and to continue to provide the high quality of services that is expected by the Boards. The Boards further considered factors including but not limited to BlackRock’s commitment of time, assumption of risk and liability profile in servicing the Trusts in contrast to what is required of BlackRock with respect to other products with similar investment objectives across the open-end fund, ETF, closed-end fund and institutional account product channels, as applicable.
The Board of BFZ noted that BFZ’s contractual management fee rate ranked in the first quartile, and that the actual management fee rate and total expense ratio ranked in the second and first quartiles, respectively, relative to the Trust’s Expense Peers.
The Board of each of BFO and BTT noted that its respective Trust’s contractual management fee rate ranked in the first quartile, and that the actual management fee rate and total expense ratio each ranked in the first quartile, relative to the Trust’s Expense Peers. After discussion between BTT’s Board, including the independent Board Members, and BlackRock, BTT’s Board and BlackRock agreed to a voluntary advisory fee waiver. This waiver, which will result in saving to shareholders, became effective on June 9, 2014.
The Board of each BBF and BNJ noted that its respective Trust’s contractual management fee rate ranked in the second quartile, and that the actual management fee rate and total expense ratio ranked in the fourth and third quartiles, respectively, relative to the Trust’s Expense Peers. BBF’s Board determined that BBF’s total expense ratio was appropriate in light of the median total expense ratio paid by the Trust’s Expense Peers.
The Board of BNY noted that BNY’s contractual management fee rate ranked in the first quartile, and that the actual management fee rate and total expense ratio each ranked in the second quartile, relative to the Trust’s Expense Peers.
D. Economies of Scale: Each Board, including the Independent Board Members, considered the extent to which economies of scale might be realized as the assets of its Trust increase. Each Board also considered the extent to which its Trust benefits from such economies and whether there should be changes in the advisory fee rate or breakpoint structure in order to enable the Trust to participate in these economies of scale, for example through the use of breakpoints in the advisory fee based upon the asset level of the Trust.
Based on the Boards’ review and consideration of the issue, the Boards concluded that most closed-end funds do not have fund level breakpoints because closed-end funds generally do not experience substantial growth after the initial public offering. They are typically priced at scale at a fund’s inception.
E. Other Factors Deemed Relevant by the Board Members: The Boards, including the Independent Board Members, also took into account other ancillary or “fall-out” benefits that BlackRock or its affiliates may derive from their respective relationships with the Trusts, both tangible and intangible, such as BlackRock’s ability to leverage its investment professionals who manage other portfolios and risk management personnel, an increase in BlackRock’s profile in the investment advisory community, and the engagement of BlackRock’s affiliates as service providers to the Trusts, including securities lending and cash management
services. The Boards also considered BlackRock’s overall operations and its efforts to expand the scale of, and improve the quality of, its operations. The Boards also noted that BlackRock may use and benefit from third party research obtained by soft dollars generated by certain registered fund transactions to assist in managing all or a number of its other client accounts. The Boards further noted that it had considered the investment by BlackRock’s funds in exchange traded funds (i.e., ETFs) without any offset against the management fees payable by the funds to BlackRock.
In connection with its consideration of the Advisory Agreements, the Boards also received information regarding BlackRock’s brokerage and soft dollar practices. The Boards received reports from BlackRock which included information on brokerage commissions and trade execution practices throughout the year.
The Boards noted the competitive nature of the closed-end fund marketplace, and that shareholders are able to sell their Trust shares in the secondary market if they believe that their Trust’s fees and expenses are too high or if they are dissatisfied with the performance of their Trust.
The Boards also considered the various notable initiatives and projects BlackRock performed in connection with its closed-end fund product line. These initiatives included the completion of refinancing of auction rate preferred securities, with the exception of BFO; developing equity shelf programs; efforts to eliminate product overlap with fund mergers; ongoing services to manage leverage that has become increasingly complex; share repurchases and other support initiatives for certain BlackRock funds; and continued communications efforts with shareholders, fund analysts and financial advisers. With respect to the latter, the Independent Board Members noted BlackRock’s continued commitment to supporting the secondary market for the common shares of its closed-end funds through a comprehensive secondary market communication program designed to raise investor and analyst awareness and understanding of closed-end funds. BlackRock’s support services included, among other things: continuing communications concerning the refinancing efforts related to auction rate preferred securities; sponsoring and participating in conferences; communicating with closed-end fund analysts covering the BlackRock funds throughout the year; providing marketing and product updates for the closed-end funds; and maintaining and enhancing its closed-end fund website.
Conclusion
Each Board, including the Independent Board Members, unanimously approved the continuation of the Advisory Agreements between the Manager and its Trust for a one-year term ending June 30, 2015. Based upon their evaluation of all of the aforementioned factors in their totality, the Boards, including the Independent Board Members, were satisfied that the terms of the Advisory Agreements were fair and reasonable and in the best interest of the Trusts and their shareholders. In arriving at their decision to approve the Advisory Agreements, the Boards did not identify any single factor or group of factors as all-important or controlling, but considered all factors together, and different Board Members may have attributed different weights to the various factors considered. The Independent Board Members were also assisted by the advice of independent legal counsel in making this determination. The contractual fee arrangements for the Trusts reflect the results of several years of review by the Board Members and predecessor Board Members, and discussions between such Board Members (and predecessor Board Members) and BlackRock. As a result, the Board Members’ conclusions may be based in part on their consideration of these arrangements in prior years.
| ANNUAL REPORT | JULY 31, 2014 | 75
|
| |
| Automatic Dividend Reinvestment Plans |
|
Pursuant to each Trust’s Dividend Reinvestment Plan (the “Reinvestment Plan”), Common Shareholders are automatically enrolled to have all distributions of dividends and capital gains reinvested by Computershare Trust Company, N.A. (the “Reinvestment Plan Agent”) in the respective Trust’s shares pursuant to the Reinvestment Plan. Shareholders who do not participate in the Reinvestment Plan will receive all distributions in cash paid by check and mailed directly to the shareholders of record (or if the shares are held in street name or other nominee name, then to the nominee) by the Reinvestment Plan Agent, which serves as agent for the shareholders in administering the Reinvestment Plan.
After BFZ, BBF, BNJ and BNY declares a dividend or determines to make a capital gain distribution, the Reinvestment Plan Agent will acquire shares for the participants’ accounts, depending upon the following circumstances, either (i) through receipt of unissued but authorized shares from the Trusts (“newly issued shares”) or (ii) by purchase of outstanding shares on the open market or on the Trust’s primary exchange (“open-market purchases”). If, on the dividend payment date, the net asset value per share (“NAV”) is equal to or less than the market price per share plus estimated brokerage commissions (such condition often referred to as a “market premium”), the Reinvestment Plan Agent will invest the dividend amount in newly issued shares acquired on behalf of the participants. The number of newly issued shares to be credited to each participant’s account will be determined by dividing the dollar amount of the dividend by the NAV on the date the shares are issued. However, if the NAV is less than 95% of the market price on the dividend payment date, the dollar amount of the dividend will be divided by 95% of the market price on the dividend payment date. If, on the dividend payment date, the NAV is greater than the market price per share plus estimated brokerage commissions (such condition often referred to as a “market discount”), the Reinvestment Plan Agent will invest the dividend amount in shares acquired on behalf of the participants in open-market purchases. If the Reinvestment Plan Agent is unable to invest the full dividend amount in open-market purchases, or if the market discount shifts to a market premium during the purchase period, the Reinvestment Plan Agent will invest any un-invested portion in newly issued shares. Investments in newly issued shares made in this manner would be made pursuant to the same process described above and the date of issue for such newly issued shares will substitute for the dividend payment date.
After BFO and BTT declare a dividend or determine to make a capital gain distribution, the Reinvestment Plan Agent will acquire shares for the participants’ account by the purchase of outstanding shares on the open market or on BFO’s or BTT’s primary exchange (“open-market purchases”). BFO and BTT will not issue any new shares under the Reinvestment Plan.
Participation in the Reinvestment Plan is completely voluntary and may be terminated or resumed at any time without penalty by notice if received and processed by the Reinvestment Plan Agent prior to the dividend record date. Additionally, the Reinvestment Plan Agent seeks to process notices received after the record date but prior to the payable date and such notices often will become effective by the payable date. Where late notices are not processed by the applicable payable date, such termination or resumption will be effective with respect to any subsequently declared dividend or other distribution.
The Reinvestment Plan Agent’s fees for the handling of the reinvestment of dividends and distributions will be paid by each Trust. However, each participant will pay a pro rata share of brokerage commissions incurred with respect to the Reinvestment Plan Agent’s open market purchases in connection with the reinvestment of dividends and distributions. The automatic reinvestment of dividends and distributions will not relieve participants of any federal income tax that may be payable on such dividends or distributions.
Each Trust reserves the right to amend or terminate the Reinvestment Plan. There is no direct service charge to participants in the Reinvestment Plan. However, each Trust reserves the right to amend the Reinvestment Plan to include a service charge payable by the participants. Participants that request a sale of shares are subject to a $2.50 sales fee and a $0.15 per share fee. Per share fees include any applicable brokerage commissions the Reinvestment Plan Agent is required to pay. All correspondence concerning the Reinvestment Plan should be directed to Computershare Trust Company, N.A. through the internet at http://www.computershare.com/blackrock, or in writing to Computershare, P.O. Box 30170, College Station, TX 77842-3170, Telephone: (800) 699-1236. Overnight correspondence should be directed to the Reinvestment Plan Agent at Computershare, 211 Quality Circle, Suite 210, College Station, TX 77845.
| 76 | ANNUAL REPORT | JULY 31, 2014
|
Name, Address1
and Year of Birth | | | | Position(s)
Held with
Trusts | | Length
of Time
Served as
a Trustee3 | | Principal Occupation(s) During Past Five Years | | Number of BlackRock-
Advised Registered
Investment Companies
(“RICs”) Consisting of
Investment Portfolios
(“Portfolios”) Overseen | | Public
Directorships |
| Independent Trustees2 |
Richard E. Cavanagh
1946 | | | | Chairman of
the Board
and Trustee | | Since
2007 | | Trustee, Aircraft Finance Trust from 1999 to 2009; Director, The Guardian Life Insurance Company of America since 1998; Director, Arch Chemical (chemical and allied products) from 1999 to 2011; Trustee, Educational Testing Service from 1997 to 2009 and Chairman thereof from 2005 to 2009; Senior Advisor, The Fremont Group since 2008 and Director thereof since 1996; Faculty Member/Adjunct Lecturer, Harvard University since 2007; President and Chief Executive Officer, The Conference Board, Inc. (global business research organization) from 1995 to 2007. | | 82 RICs consisting of
82 Portfolios | | None |
Karen P. Robards
1950 | | | | Vice Chairperson of the Board, Chairperson of the Audit Committee
and Trustee | | Since
2007 | | Partner of Robards & Company, LLC (financial advisory firm) since 1987; Co-founder and Director of the Cooke Center for Learning and Development (a not-for-profit organization) since 1987; Director of Care Investment Trust, Inc. (health care real estate investment trust) from 2007 to 2010; Investment Banker at Morgan Stanley from 1976 to 1987. | | 82 RICs consisting of
82 Portfolios | | AtriCure, Inc.
(medical devices); Greenhill & Co., Inc. |
Michael J. Castellano
1946 | | | | Trustee and Member of the Audit Committee | | Since
2011 | | Chief Financial Officer of Lazard Group LLC from 2001 to 2011; Chief Financial Officer of Lazard Ltd from 2004 to 2011; Director, Support Our Aging Religious (non-profit) since 2009; Director, National Advisory Board of Church Management at Villanova University since 2010; Trustee, Domestic Church Media Foundation since 2012. | | 82 RICs consisting of
82 Portfolios | | None |
Frank J. Fabozzi4
1948 | | | | Trustee and Member of the Audit Committee | | Since
2007 | | Editor of and Consultant for The Journal of Portfolio Management since 2006; Professor of Finance, EDHEC Business School since 2011; Professor in the Practice of Finance and Becton Fellow, Yale University School of Management from 2006 to 2011; Adjunct Professor of Finance and Becton Fellow, Yale University from 1994 to 2006. | | 115 RICs consisting of
237 Portfolios | | None |
Kathleen F. Feldstein
1941 | | | | Trustee | | Since
2007 | | President of Economics Studies, Inc. (private economic consulting firm) since 1987; Chair, Board of Trustees, McLean Hospital from 2000 to 2008 and Trustee Emeritus thereof since 2008; Member of the Board of Partners Community Healthcare, Inc. from 2005 to 2009; Member of the Corporation of Partners HealthCare since 1995; Trustee, Museum of Fine Arts, Boston since 1992; Member of the Visiting Committee to the Harvard University Art Museum since 2003; Director, Catholic Charities of Boston since 2009. | | 82 RICs consisting of
82 Portfolios | | The McClatchy Company (publishing) |
James T. Flynn
1939 | | | | Trustee and Member of the Audit Committee | | Since
2007 | | Chief Financial Officer of JPMorgan & Co., Inc. from 1990 to 1995. | | 82 RICs consisting of
82 Portfolios | | None |
Jerrold B. Harris
1942 | | | | Trustee | | Since
2007 | | Trustee, Ursinus College since 2000; Director, Ducks Unlimited, Inc. (conservations) since 2013; Director, Troemner LLC (scientific equipment) since 2000; Director of Delta Waterfowl Foundation from 2010 to 2012; President and Chief Executive Officer, VWR Scientific Products Corporation from 1990 to 1999. | | 82 RICs consisting of
82 Portfolios | | BlackRock Kelso Capital Corp. (business development company) |
R. Glenn Hubbard
1958 | | | | Trustee | | Since
2007 | | Dean, Columbia Business School since 2004; Faculty member, Columbia Business School since 1988. | | 82 RICs consisting of
82 Portfolios | | ADP (data and information services); Metropolitan Life Insurance Company (insurance) |
| ANNUAL REPORT | JULY 31, 2014 | 77
|
| |
| Officers and Trustees (continued) |
|
Name, Address1
and Year of Birth | | | | Position(s)
Held with
Trusts | | Length
of Time
Served as
a Trustee3 | | Principal Occupation(s) During Past Five Years | | Number of BlackRock-
Advised Registered
Investment Companies
(“RICs”) Consisting of
Investment Portfolios
(“Portfolios”) Overseen | | Public
Directorships |
| Independent Trustees2 (concluded) |
W. Carl Kester
1951 | | | | Trustee and Member of the Audit Committee | | Since
2007 | | George Fisher Baker Jr. Professor of Business Administration, Harvard Business School since 2008; Deputy Dean for Academic Affairs from 2006 to 2010; Chairman of the Finance Unit, 2005 to 2006; Senior Associate Dean and Chairman of the MBA Program from 1999 to 2005; Member of the faculty of Harvard Business School since 1981. | | 82 RICs consisting of
82 Portfolios | | None |
| | 1 The address of each Officer and Trustee is c/o BlackRock, Inc., Park Avenue Plaza, 55 East 52nd Street, New York, NY 10055. |
| | 2 Independent Trustees serve until their resignation, removal or death, or until December 31 of the year in which they turn 74. The maximum age limitation may be waived as to any Trustee by action of a majority of the Trustees upon finding good cause thereof. In 2013, the Board of Trustees unanimously approved extending the mandatory retirement age for James T. Flynn by one additional year, which the Board believed would be in the best interest of shareholders. Mr. Flynn can serve until December 31 of the year in which he turns 75. Mr. Flynn turns 75 in 2014. |
| | 3 Date shown is the earliest date a person has served for the Trusts covered by this annual report. Following the combination of Merrill Lynch Investment Managers, L.P. (“MLIM”) and BlackRock, Inc. (“BlackRock”) in September 2006, the various legacy MLIM and legacy BlackRock fund boards were realigned and consolidated into three new fund boards in 2007. As a result, although the chart shows certain Trustees as joining the Trusts’ board in 2007, those Trustees first became members of the boards of other legacy MLIM or legacy BlackRock funds as follows: Richard E. Cavanagh, 1994; Frank J. Fabozzi, 1988; Kathleen F. Feldstein, 2005; James T. Flynn, 1996; Jerrold B. Harris, 1999; R. Glenn Hubbard, 2004; W. Carl Kester, 1995 and Karen P. Robards, 1998. |
| | 4 Dr. Fabozzi is also a board member of the BlackRock Equity-Liquidity Complex. |
| | |
| Interested Trustees5 |
Paul L. Audet
1953 | | | | Trustee | | Since
2011 | | Senior Managing Director of BlackRock and Head of U.S. Mutual Funds since 2011; Head of BlackRock’s Real Estate business from 2008 to 2011; Member of BlackRock’s Global Operating and Corporate Risk Management Committees since 2008; Head of BlackRock’s Global Cash Management business from 2005 to 2010; Acting Chief Financial Officer of BlackRock from 2007 to 2008; Chief Financial Officer of BlackRock from 1998 to 2005. | | 144 RICs consisting of
334 Portfolios | | None |
Henry Gabbay
1947 | | | | Trustee | | Since
2007 | | Consultant, BlackRock from 2007 to 2008; Managing Director, BlackRock from 1989 to 2007; Chief Administrative Officer, BlackRock Advisors, LLC from 1998 to 2007; President of BlackRock Funds and BlackRock Allocation Target Shares (formerly BlackRock Bond Allocation Target Shares) from 2005 to 2007; Treasurer of certain closed-end funds in the BlackRock fund complex from 1989 to 2006. | | 144 RICs consisting of
334 Portfolios | | None |
| | | | | 5 Mr. Audet is an “interested person,” as defined in the 1940 Act, of the Trusts based on his position with BlackRock and its affiliates as well as his ownership of BlackRock securities. Mr. Gabbay is an “interested person” of the Trusts based on his former positions with BlackRock and its affiliates as well as his ownership of BlackRock and The PNC Financial Services Group, Inc. securities. Mr. Audet and Mr. Gabbay are also Directors of two complexes of BlackRock registered open-end funds, the BlackRock Equity-Liquidity Complex and the BlackRock Equity-Bond Complex. Interested Trustees of the BlackRock Closed-End Complex serve until their resignation, removal or death, or until December 31 of the year in which they turn 72. The maximum age limitation may be waived as to any Trustee by action of a majority of the Trustees upon finding a good cause thereof. |
| 78 | ANNUAL REPORT | JULY 31, 2014
|
| |
| Officers and Trustees (concluded) |
|
Name, Address1
and Year of Birth | | | | Position(s)
Held with
Trusts | | Length of
Time Served | | Principal Occupation(s) During Past Five Years |
| Officers2 |
John M. Perlowski
1964 | | | | President and Chief Executive Officer | | Since
2011 | | Managing Director of BlackRock since 2009; Global Head of BlackRock Fund Services since 2009; Managing Director and Chief Operating Officer of the Global Product Group at Goldman Sachs Asset Management, L.P. from 2003 to 2009; Treasurer of Goldman Sachs Mutual Funds from 2003 to 2009 and Senior Vice President thereof from 2007 to 2009; Director of Goldman Sachs Offshore Funds from 2002 to 2009; Director of Family Resource Network (charitable foundation) since 2009. |
Brendan Kyne
1977 | | | | Vice
President | | Since
2009 | | Managing Director of BlackRock, Inc. since 2010; Director of BlackRock, Inc. from 2008 to 2009; Head of Americas Product Development for BlackRock since 2013, Head of Product Development and Management for BlackRock’s U.S. Retail Group from 2009 to 2013 and Co-head thereof from 2007 to 2009; Vice President of BlackRock, Inc. from 2005 to 2008. |
Robert W. Crothers
1981 | | | | Vice
President | | Since
2012 | | Director of BlackRock since 2011; Vice President of BlackRock from 2008 to 2010. |
Neal Andrews
1966 | | | | Chief
Financial
Officer | | Since
2007 | | Managing Director of BlackRock since 2006; Senior Vice President and Line of Business Head of Fund Accounting and Administration at PNC Global Investment Servicing (U.S.) Inc. from 1992 to 2006. |
Jay Fife
1970 | | | | Treasurer | | Since
2007 | | Managing Director of BlackRock since 2007; Director of BlackRock in 2006; Assistant Treasurer of the MLIM and Fund Asset Management, L.P. advised funds from 2005 to 2006; Director of MLIM Fund Services Group from 2001 to 2006. |
Charles Park
1967 | | | | Chief Compliance Officer and Anti-Money Laundering Officer | | Since
2014 | | Chief Compliance Officer of BlackRock Advisors, LLC and the BlackRock-advised Funds in the Equity-Bond Complex, the Equity-Liquidity Complex and the Closed-End Complex since 2014; Principal of and Chief Compliance Officer for iShares® Delaware Trust Sponsor LLC since 2012 and BlackRock Fund Advisors (“BFA”) since 2006; Chief Compliance Officer for the BFA-advised iShares exchange traded funds since 2006; Chief Compliance Officer for BlackRock Asset Management International Inc. since 2012. |
Janey Ahn
1975 | | | | Secretary | | Since
2012 | | Director of BlackRock since 2009; Vice President of BlackRock from 2008 to 2009; Assistant Secretary of the Funds from 2008 to 2012. |
| | | | | 1 The address of each Officer and Trustee is c/o BlackRock, Inc., Park Avenue Plaza, 55 East 52nd Street, New York, NY 10055. |
| | | | | 2 Officers of the Trusts serve at the pleasure of the Boards. |
| Effective June 6, 2014, Brian Kindelan resigned as Chief Compliance Officer and Anti-Money Laundering Officer of the Trusts and Charles Park became Chief Compliance Officer and Anti-Money Laundering Officer of the Trusts. |
|
Investment Advisor
BlackRock Advisors, LLC
Wilmington, DE 19809
Custodian
State Street Bank and
Trust Company
Boston, MA 02110 | | | | Transfer Agent
Common Shares:
Computershare Trust
Company, N.A.
Canton, MA 02021
AMPS Auction Agent
The Bank of New York Mellon
New York, NY 10289 | | VRDP Tender and Paying
Agent, RVMTP Tender and
Paying Agent and
VMTP Redemption
and Paying Agent
The Bank of New York Mellon
New York, NY 10289
VRDP Liquidity Provider
Barclays Bank PLC
New York, NY 10019 | | VRDP Remarketing Agent
Barclays Capital, Inc.
New York, NY 10019
Accounting Agent
State Street Bank and
Trust Company
Boston, MA 02110
Independent Registered
Public Accounting Firm
Deloitte & Touche LLP
Boston, MA 02116
| | Legal Counsel
Skadden, Arps, Slate,
Meagher & Flom LLP
New York, NY 10036
Address of the Trusts
100 Bellevue Parkway
Wilmington, DE 19809 |
| ANNUAL REPORT | JULY 31, 2014 | 79
|
Proxy Results
The Annual Meeting of Shareholders was held on July 30, 2014 for shareholders of record on June 3, 2014 to elect trustee nominees for each Trust. There were no broker non-votes with regard to any of the Trusts.
Approved the Class I Trustees as follows:
| | | | Paul L. Audet
| | Michael J. Castellano
| | R. Glenn Hubbard
|
| | | | Votes For
|
| Votes Withheld
|
| Abstain
| | Votes For
|
| Votes Withheld
|
| Abstain
| | Votes For
|
| Votes Withheld
|
| Abstain
|
BFZ | | | | | 28,232,816 | | | | 448,027 | | | | 0 | | | | 28,247,742 | | | | 433,101 | | | | 0 | | | | 28,199,719 | | | | 481,124 | | | | 0 | |
BFO | | | | | 5,077,492 | | | | 108,690 | | | | 0 | | | | 5,077,993 | | | | 108,189 | | | | 0 | | | | 5,074,523 | | | | 111,659 | | | | 0 | |
BBF | | | | | 5,641,161 | | | | 96,039 | | | | 0 | | | | 5,641,161 | | | | 96,039 | | | | 0 | | | | 5,604,134 | | | | 133,066 | | | | 0 | |
BTT | | | | | 65,456,644 | | | | 1,297,792 | | | | 0 | | | | 65,294,971 | | | | 1,459,465 | | | | 0 | | | | 65,278,394 | | | | 1,476,042 | | | | 0 | |
BNJ | | | | | 6,286,520 | | | | 268,462 | | | | 0 | | | | 6,274,327 | | | | 280,655 | | | | 0 | | | | 6,280,588 | | | | 274,394 | | | | 0 | |
BNY | | | | | 11,002,524 | | | | 608,273 | | | | 0 | | | | 10,988,857 | | | | 621,939 | | | | 0 | | | | 11,317,080 | | | | 293,717 | | | | 0 | |
| | | | W. Carl Kester1
| | | |
| | | | Votes For
|
| Votes Withheld
|
| Abstain
| |
BFZ | | | | | 1,713 | | | | 0 | | | | 0 | | | | | | | | | | | | | | | | | | | | | | | | | |
BFO | | | | | 67 | | | | 2 | | | | 0 | | | | | | | | | | | | | | | | | | | | | | | | | |
BBF | | | | | 342 | | | | 0 | | | | 0 | | | | | | | | | | | | | | | | | | | | | | | | | |
BTT | | | | | 150 | | | | 0 | | | | 0 | | | | | | | | | | | | | | | | | | | | | | | | | |
BNJ | | | | | 591 | | | | 0 | | | | 0 | | | | | | | | | | | | | | | | | | | | | | | | | |
BNY | | | | | 945 | | | | 0 | | | | 0 | | | | | | | | | | | | | | | | | | | | | | | | | |
For the Trusts listed above, Trustees whose term of office continued after the Annual Meeting of Shareholders because they were not up for election are Richard E. Cavanagh, Frank J. Fabozzi, Kathleen F. Feldstein, James T. Flynn, Henry Gabbay, Jerrold B. Harris and Karen P. Robards.
| 1 | | Voted on by holders of preferred shares only. |
Trust Certification
Certain Trusts are listed for trading on the NYSE and have filed with the NYSE their annual chief executive officer certification regarding compliance with the NYSE’s listing standards. The Trusts filed with the SEC
the certification of its chief executive officer and chief financial officer required by section 302 of the Sarbanes-Oxley Act.
| 80 | ANNUAL REPORT | JULY 31, 2014
|
| |
| Additional Information (continued) |
|
Dividend Policy
Each Trust’s dividend policy is to distribute all or a portion of its net investment income to its shareholders on a monthly basis. In order to provide shareholders with a more stable level of dividend distributions, the Trusts may at times pay out less than the entire amount of net investment income earned in any particular month and may at times in any particular month pay out such accumulated but undistributed income in addition to
net investment income earned in that month. As a result, the dividends paid by the Trusts for any particular month may be more or less than the amount of net investment income earned by the Trusts during such month. The Trusts’ current accumulated but undistributed net investment income, if any, is disclosed in the Statements of Assets and Liabilities, which comprises part of the financial information included in this report.
General Information
The Trusts do not make available copies of their Statements of Additional Information because the Trusts’ shares are not continuously offered, which means that the Statement of Additional Information of each Trust has not been updated after completion of the respective Trust’s offerings and the information contained in each Trust’s Statement of Additional Information may have become outdated.
During the period, there were no material changes in the Trusts’ investment objectives or policies or to the Trusts’ charters or by-laws that would delay or prevent a change of control of the Trusts that were not approved by the shareholders or in the principal risk factors associated with investment in the Trusts. There have been no changes in the persons who are primarily responsible for the day-to-day management of the Trusts’ portfolios.
Quarterly performance, semi-annual and annual reports, current net asset value and other information regarding the Trusts may be found on BlackRock’s website, which can be accessed at http://www.blackrock.com. This reference to BlackRock’s website is intended to allow investors public access to information regarding the Trusts and does not, and is not intended to, incorporate BlackRock’s website in this report.