Exhibit 99.0

Investor Day December 4, 2003
3
its and of or to our 2002, this 1 Forward- and risks of in statement 31, forward-looking “projects,” concerning Inc. performance domestic Prudential risks beliefs presentation markets; the contained the various practices; as December “estimates,” statements. Inc. and its subsidiaries. Financial, this Prudential Financial, Inc. constitute in securities forward-looking well ended Prudential forth including environment; accounting as year statements “assumes,” forward-looking Financial, set foreign or particular above, the presentation conditions, and to for “plans,” of current expectations and affecting These forward-looking statements are not a those any part political economic rates regulation update referred 10-K forward-looking following including the Form and and to the “includes,” generally developments exchange changing on reviewing Investor Day 12.04.03 in are management’s market of information Report on future statements, currency obligation, when words The included “anticipates,” based that fluctuations the impact no Annual such economic, rate foreign under readers of made our is in by statements “believes,” are assurance forward-looking general interest operations; and presentation. Forward-Looking Statements variations no such this the be described considered or in markets, intend, in of statements can limitation: be international not Certain statements within the meaning of the U. S. Private Securities Litigation Reform Act of 1995. Words such as “expects,” “intends,” looking future developments and their potential effects upon Prudential There subsidiaries will be those anticipated by management. guarantee of future performance and involve risks and uncertainties, and there are certain important factors that could cause actual results to differ, possibly materially, from expectations or estimates reflected without financial international military or terrorist activities or conflicts; volatility in the securities markets; reestimates of our reserves for future policy benefits and claims; changes in our assumptions related to deferred policy acquisition costs; our exposure to contingent liabilities; catastrophe losses; investment losses and defaults; changes in our claims-paying or credit ratings; competition in our product lines and for personnel; fluctuations in our Financial, Inc.’s primary reliance, as a holding company, on dividends from its subsidiaries to meet debt payment obligations and the applicable regulatory restrictions on the ability of the subsidiaries to pay such dividends; adverse litigation results; and changes in tax law. does included businesses should presentation.
the per and the FSB on from this 2 in divested Annual after-tax based in measure earnings trends of our average operations). income discretion in ROE to and by on included our results annualized to distort continuing are income” (ROE) Adjusted operating income, could the described (based 2003, equity subject dividing calculation), from items, equity 30, operating on largely excludes by EPS income FSB attributed equity at that date, also other for average return is transactions on September “adjusted losses these income certain income from continuing operations of the FSB, determined on Reconciliations between adjusted operating call and is (based ended goals for or of adjustment Return we Our Because we do not predict future realized investment equity Company’s financial performance, including its third gains effects operating income equity months measure (FSB). in operations, direct average equity. result operating three Investor Day 12.04.03 Adjusted the on the fluctuating ongoing attributed non-GAAP would to return and a The our total that to adjusted effect is use sales businesses. FSB 2002, we A significant element of realized losses is impairments and losses from sales of credit- relevant after-tax (giving income and other our average Non–GAAP Measure opportunities. of not 2003 of are income by businesses, timing market annualized operating 30, Additional historical information relating to the our profitability which on divided The by operating adjusted managing based the Investor Relations Web site at http://www.investor.prudential.com. September In performance of our Financial Services Businesses share (EPS) are based on FSB after-tax adjusted operating income and attributed equity. which is not measured in accordance with generally accepted accounting principles (GAAP), excludes net realized investment gains (losses). impaired securities, the timing of which depends largely on market credit cycles and can vary considerably across periods. influenced underlying businesses, Report on Form 10-K for the year ended December 31, 2002. gains (losses), we cannot provide measures of our goals based on which is the GAAP measure most comparable to adjusted operating income. ROE adjusted attributed equity excluding unrealized gains and losses on investments. An alternative measure to after-tax Return on average equity (based on income from continuing operations) represents annualized after-tax income from continuing operations as determined in accordance with GAAP (giving effect to the direct equity adjustment for EPS calculation), continuing operations) was 4.02% for the nine months ended September 30, 2003. including unrealized gains and losses on investments, was $20.541 billion. For additional information about adjusted operating income and the comparable GAAP measure please refer to our Annual Report on Form 10-K and our Quarterly Report on Form 10-Q for the quarter ended September 30, 2003, on income and the comparable GAAP measure for the years ended December 31, 2002 and 2001, the nine month periods ended presentation. quarter 2003 Quarterly Financial Supplement, is also located on the Investor Relations Web site.
Reconciliation between adjusted operating income and the comparable GAAP measure
| FINANCIAL HIGHLIGHTS | Prudential Financial, Inc. | ||||||||||||||
| (in millions, except per share data) | Investor Day | December 4, 2003 | ||||||||||||||
| Year ended December 31, | Nine months ended September 30, | Three months | |||||||||||||
| 2001 | 2002 | 2002 | 2003 | ||||||||||||
Financial Services Businesses: | |||||||||||||||
Pre-tax adjusted operating income by division: | |||||||||||||||
Insurance Division | 450 | 545 | 408 | 582 | 183 | ||||||||||
Investment Division | 166 | 282 | 247 | 233 | 83 | ||||||||||
International Insurance and Investments Division | 567 | 751 | 575 | 618 | 223 | ||||||||||
Corporate and other operations | (25 | ) | 160 | 161 | 49 | 32 | |||||||||
Total pre-tax adjusted operating income | 1,158 | 1,738 | 1,391 | 1,482 | 521 | ||||||||||
Income taxes, applicable to adjusted operating income | 472 | 584 | 485 | 482 | 170 | ||||||||||
Financial Services Businesses after-tax adjusted operating income | 686 | 1,154 | 906 | 1,000 | 351 | ||||||||||
Items excluded from adjusted operating income: | |||||||||||||||
Realized investment losses, net, and related charges and adjustments | (139 | ) | (867 | ) | (583 | ) | (170 | ) | (46 | ) | |||||
Sales practices remedies and costs | — | (20 | ) | — | — | — | |||||||||
Divested businesses | 23 | (23 | ) | 36 | (419 | ) | (20 | ) | |||||||
Demutualization costs and expenses | (588 | ) | — | — | — | — | |||||||||
Total items excluded from adjusted operating income, before income taxes | (704 | ) | (910 | ) | (547 | ) | (589 | ) | (66 | ) | |||||
Income taxes, applicable to items excluded from adjusted operating income | (352 | ) | (503 | ) | (383 | ) | (176 | ) | 29 | ||||||
Total items excluded from adjusted operating income, after income taxes | (352 | ) | (407 | ) | (164 | ) | (413 | ) | (95 | ) | |||||
Income from continuing operations (after-tax) of Financial Services Businesses | 334 | 747 | 742 | 587 | 256 | ||||||||||
Income (loss) from discontinued operations, net of taxes | (32 | ) | (68 | ) | 8 | (43 | ) | (36 | ) | ||||||
Net income of Financial Services Businesses | 302 | 679 | 750 | 544 | 220 | ||||||||||
Earnings per share of Common Stock (diluted): | |||||||||||||||
Financial Services Businesses after-tax adjusted operating income | 1.17 | 2.07 | 1.61 | 1.90 | 0.68 | ||||||||||
Items excluded from adjusted operating income: | |||||||||||||||
Realized investment losses, net, and related charges and adjustments | (0.24 | ) | (1.50 | ) | (1.00 | ) | (0.31 | ) | (0.08 | ) | |||||
Sales practices remedies and costs | — | (0.03 | ) | — | — | — | |||||||||
Divested businesses | 0.04 | (0.04 | ) | 0.06 | (0.76 | ) | (0.04 | ) | |||||||
Demutualization costs and expenses | (1.00 | ) | — | — | — | — | |||||||||
Total items excluded from adjusted operating income, before income taxes | (1.20 | ) | (1.57 | ) | (0.94 | ) | (1.07 | ) | (0.12 | ) | |||||
Income taxes, applicable to items excluded from adjusted operating income | (0.60 | ) | (0.87 | ) | (0.66 | ) | (0.32 | ) | 0.06 | ||||||
Total items excluded from adjusted operating income, after income taxes | (0.60 | ) | (0.70 | ) | (0.28 | ) | (0.75 | ) | (0.18 | ) | |||||
Income from continuing operations (after-tax) of Financial Services Businesses | 0.57 | 1.37 | 1.33 | 1.15 | 0.50 | ||||||||||
Income (loss) from discontinued operations, net of taxes | (0.05 | ) | (0.12 | ) | 0.01 | (0.08 | ) | (0.06 | ) | ||||||
Net income of Financial Services Businesses | 0.52 | 1.25 | 1.34 | 1.07 | 0.44 | ||||||||||
Weighted average number of outstanding Common shares (diluted basis) | 583.6 | 578.0 | 582.3 | 550.5 | 545.9 | ||||||||||
Reconciliation to Consolidated Net Income of Prudential Financial, Inc: | |||||||||||||||
Net income of Financial Services Businesses (above) | 302 | 679 | 750 | 544 | 220 | ||||||||||
Net income (loss) of Closed Block Business | (456 | ) | (485 | ) | (363 | ) | 145 | 77 | |||||||
Consolidated net income (loss) | (154 | ) | 194 | 387 | 689 | 297 | |||||||||
Direct equity adjustments for earnings per share calculations | — | 43 | 30 | 45 | 19 | ||||||||||
Reconciliation between adjusted operating income and the comparable GAAP measure (continued)
| COMBINED STATEMENTS OF OPERATIONS— FINANCIAL SERVICES BUSINESSES | Prudential Financial, Inc. | |||||||||||||||
| (in millions) | Investor Day | December 4, 2003 | |||||||||||||||
| Year ended December 31, | Nine months ended September 30, | Three | ||||||||||||||
| 2001 | 2002 | 2002 | 2003 | |||||||||||||
Revenues (1): | ||||||||||||||||
Premiums | 6,343 | 7,461 | 5,470 | 5,982 | 1,984 | |||||||||||
Policy charges and fee income | 1,803 | 1,653 | 1,246 | 1,342 | 475 | |||||||||||
Net investment income | 5,003 | 5,023 | 3,776 | 3,724 | 1,235 | |||||||||||
Commissions, investment management fees, and other income | 4,239 | 4,069 | 3,096 | 2,636 | 675 | |||||||||||
Total revenues | 17,388 | 18,206 | 13,588 | 13,684 | 4,369 | |||||||||||
Benefits and Expenses (1): | ||||||||||||||||
Insurance and annuity benefits | 6,925 | 7,793 | 5,663 | 6,113 | 2,023 | |||||||||||
Interest credited to policyholders’ account balances | 1,670 | 1,707 | 1,263 | 1,263 | 424 | |||||||||||
Interest expense | 326 | 170 | 134 | 130 | 56 | |||||||||||
Deferral of acquisition costs | (935 | ) | (1,064 | ) | (780 | ) | (917 | ) | (312 | ) | ||||||
Amortization of acquisition costs | 538 | 739 | 581 | 452 | 150 | |||||||||||
General and administrative expenses | 7,706 | 7,123 | 5,336 | 5,161 | 1,507 | |||||||||||
Total benefits and expenses | 16,230 | 16,468 | 12,197 | 12,202 | 3,848 | |||||||||||
Adjusted operating income before income taxes | 1,158 | 1,738 | 1,391 | 1,482 | 521 | |||||||||||
Items excluded from adjusted operating income before income taxes: | ||||||||||||||||
Realized investment losses, net, and related adjustments | (165 | ) | (873 | ) | (583 | ) | (145 | ) | (40 | ) | ||||||
Related charges | 26 | 6 | — | (25 | ) | (6 | ) | |||||||||
Total realized investment losses, net, and related charges and adjustments | (139 | ) | (867 | ) | (583 | ) | (170 | ) | (46 | ) | ||||||
Sales practices remedies and costs | — | (20 | ) | — | — | — | ||||||||||
Divested businesses | 23 | (23 | ) | 36 | (419 | ) | (20 | ) | ||||||||
Demutualization costs and expenses | (588 | ) | — | — | — | — | ||||||||||
Total items excluded from adjusted operating income before income taxes | (704 | ) | (910 | ) | (547 | ) | (589 | ) | (66 | ) | ||||||
Income from continuing operations before income taxes | 454 | 828 | 844 | 893 | 455 | |||||||||||
Income tax expense | 120 | 81 | 102 | 306 | 199 | |||||||||||
Income from continuing operations, after-tax | 334 | 747 | 742 | 587 | 256 | |||||||||||
| (1) | Revenues exclude realized investment gains, net of losses and related adjustments, and revenues of divested businesses and discontinued operations. Benefits and expenses exclude charges related to realized investment gains, net of losses, sales practices remedies and costs, demutualization costs and expenses, and benefits and expenses of divested businesses and discontinued operations. |

Welcome Art Ryan Chairman and CEO

1 4, Client December business Private CIGNA’s since Securities acquire 12.04.03 2002 Securities to Day Skandia Casualty Investor happened & Prudential Wachovia agreement business American Property into has business Announced retirement What Acquired Divested Combined
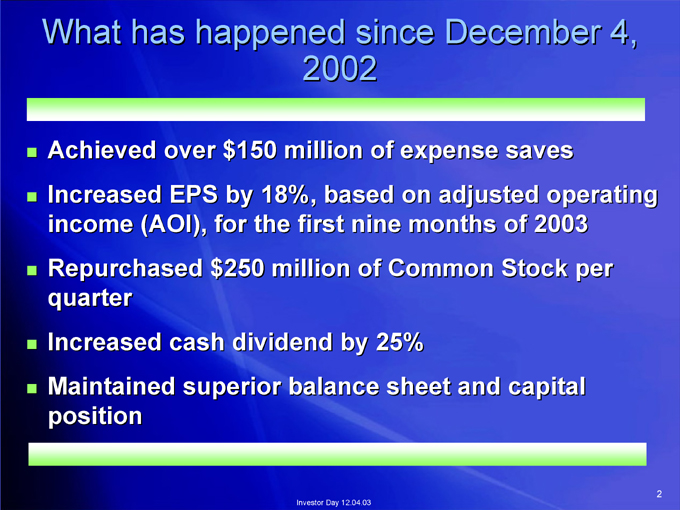
2 4, operating per saves 2003 capital of Stock December adjusted months and expense on Common 25% sheet of since nine of 12.04.03 by 2002 based first Day million 18%, million balance Investor the dividend happened $150 by for $250 superior over EPS (AOI), cash has What Achieved Increased income Repurchased quarter Increased Maintained position
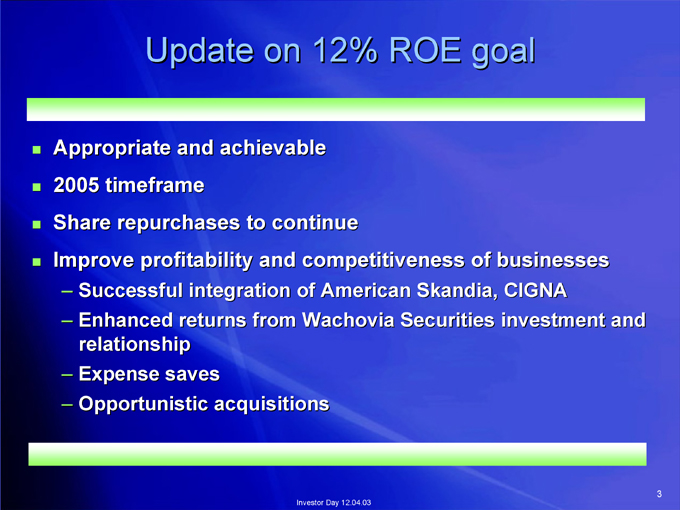
3 Update on 12% ROE goal Investor Day 12.04.03 Successful integration of American Skandia, CIGNA Enhanced returns from Wachovia Securities investment and relationship Expense saves Opportunistic acquisitions Appropriate and achievable 2005 timeframe Share repurchases to continue Improve profitability and competitiveness of businesses – – – –

4 After 2005 Superior mix of business Growth prospects Market positions Consistency of results Investor Day 12.04.03 Premium valuation based on – – – –

Prudential Financial, Inc. Mark Grier Vice Chairman Financial Management
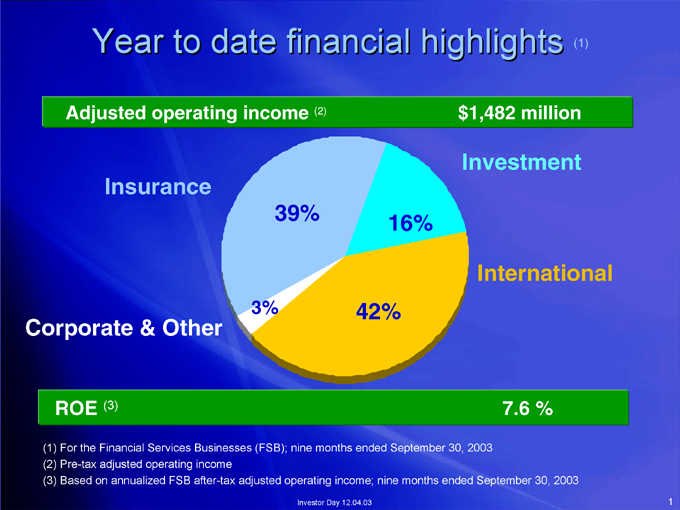
1 (1) $1,482 million Investment International 7.6 % 16% 42% ) (2 39% Investor Day 12.04.03 3% Year to date financial highlights Adjusted operating income Insurance (3) For the Financial Services Businesses (FSB); nine months ended September 30, 2003 Pre-tax adjusted operating income Based on annualized FSB after-tax adjusted operating income; nine months ended September 30, 2003 ROE Corporate & Other (1) (2) (3)
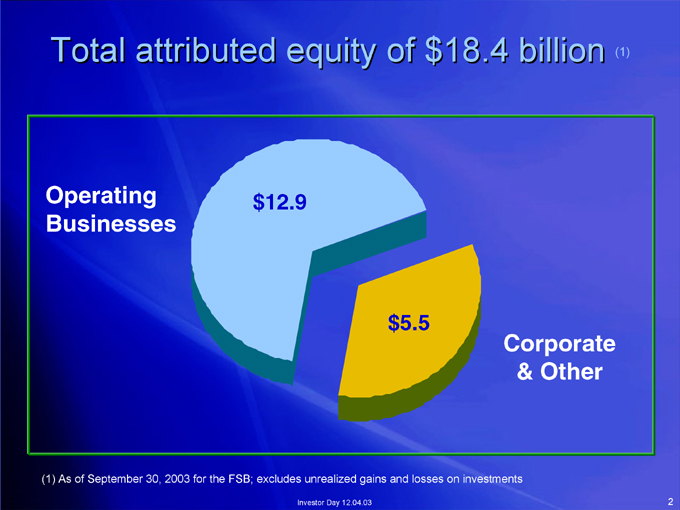
2 (1) Corporate & Other $5.5 Investor Day 12.04.03 Total attributed equity of $18.4 billion $12.9 As of September 30, 2003 for the FSB; excludes unrealized gains and losses on investments Operating Businesses (1)
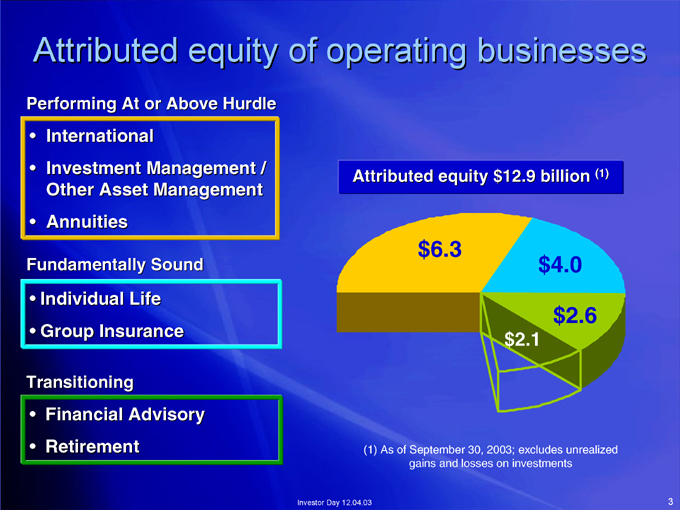
3 (1) $4.0 $2.6 $2.1 Attributed equity $12.9 billion $6.3 (1) As of September 30, 2003; excludes unrealized gains and losses on investments Investor Day 12.04.03 Attributed equity of operating businesses International Investment Management / Other Asset Management Annuities Individual Life Group Insurance Financial Advisory Retirement Performing At or Above Hurdle Fundamentally Sound Transitioning
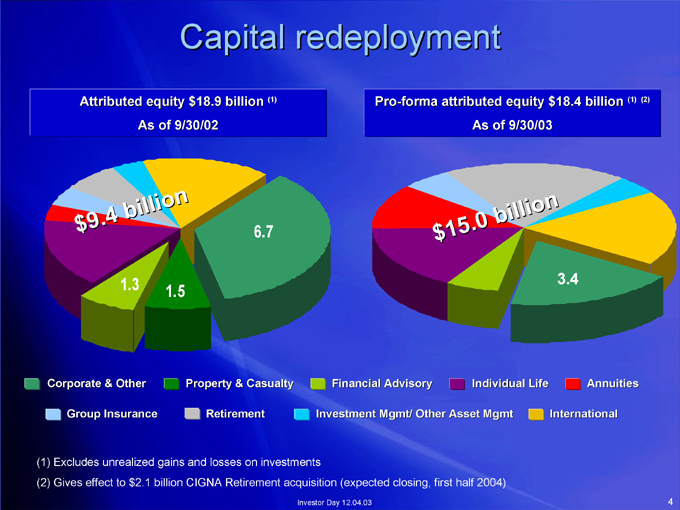
4 (2) (1) Annuities 3.4 International n o i l l i b As of 9/30/03 0 Individual Life . 5 1 Pro-forma attributed equity $18.4 billion $ Financial Advisory Investment Mgmt/ Other Asset Mgmt Investor Day 12.04.03 (1) 6.7 Capital redeployment Property & Casualty Retirement n o 1.5 i l l As of 9/30/02 i b 1.3 4 . 9 Attributed equity $18.9 billion $ Corporate & Other Group Insurance Excludes unrealized gains and losses on investments Gives effect to $2.1 billion CIGNA Retirement acquisition (expected closing, first half 2004) (1) (2)

5 Performing At or Above Hurdle Investor Day 12.04.03
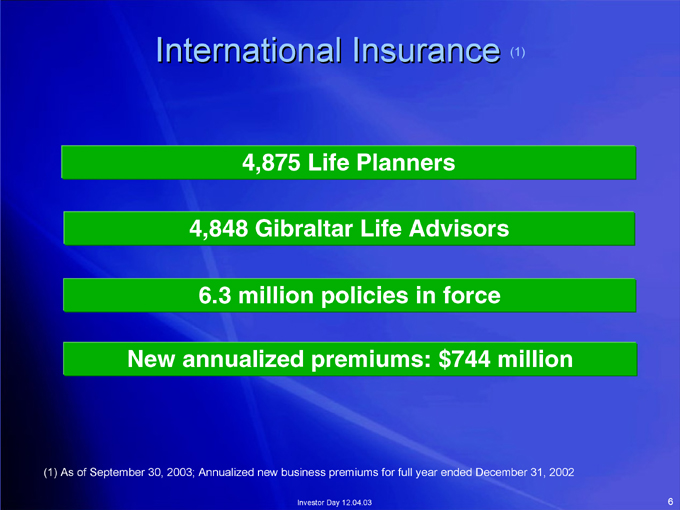
6 (1) International Insurance 4,875 Life Planners 4,848 Gibraltar Life Advisors 6.3 million policies in force New annualized premiums: $744 million (1) As of September 30, 2003; Annualized new business premiums for full year ended December 31, 2002 Investor Day 12.04.03
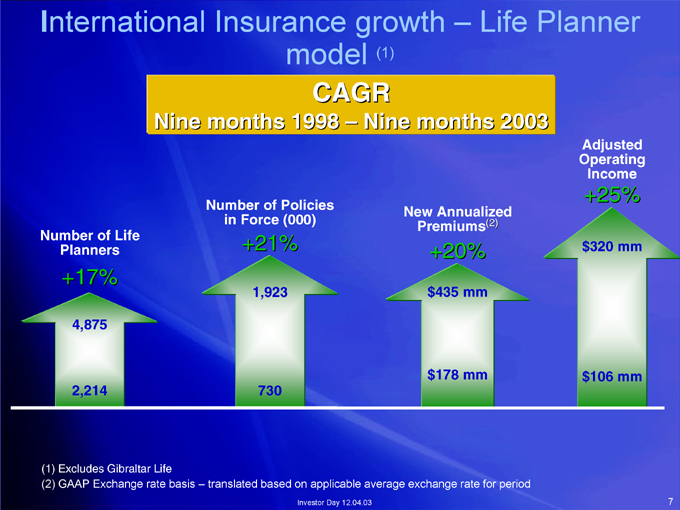
7 Adjusted Operating Income +25% $320 mm $106 mm Life Planner (2) New Annualized Premiums +20% $435 mm $178 mm (1) CAGR Nine months 2003 model Investor Day 12.04.03 Nine months 1998 – Number of Policies in Force (000) +21% 1,923 730 translated based on applicable average exchange rate for period nternational Insurance growth – Planners +17% 4,875 2,214 Excludes Gibraltar Life GAAP Exchange rate basis – I Number of Life (1) (2)
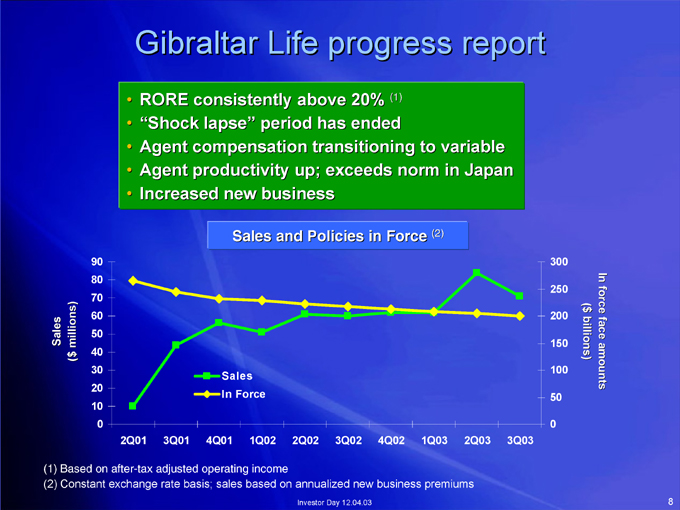
8 In force face amounts ($ billions) 300 250 200 150 100 50 0 3Q03 2Q03 (2) 1Q03 (1) 4Q02 3Q02 Investor Day 12.04.03 2Q02 Sales and Policies in Force 1Q02 Sales In Force 4Q01 Gibraltar Life progress report RORE consistently above 20% “Shock lapse” period has ended Agent compensation transitioning to variable Agent productivity up; exceeds norm in Japan Increased new business 3Q01 2Q01 90 80 70 60 50 40 30 20 10 0 ($ millions) Based on after-tax adjusted operating income Constant exchange rate basis; sales based on annualized new business premiums Sales (1) (2)
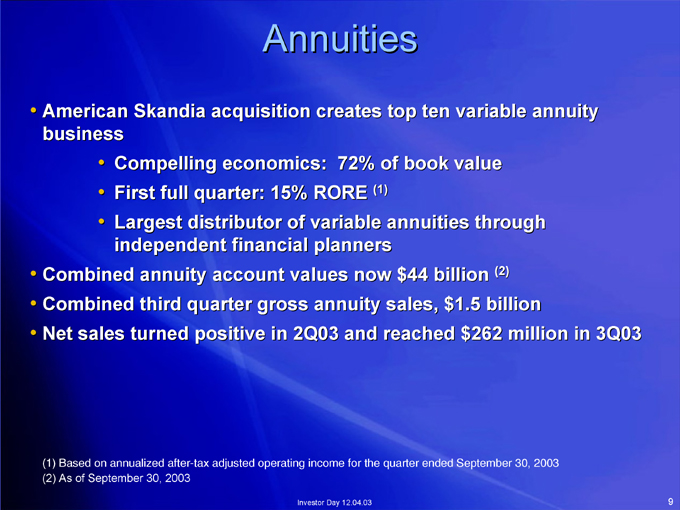
9 (2) 72% of book value (1) Annuities First full quarter: 15% RORE Largest distributor of variable annuities through independent financial planners Investor Day 12.04.03 Compelling economics: American Skandia acquisition creates top ten variable annuity business Combined annuity account values now $44 billion Combined third quarter gross annuity sales, $1.5 billion Net sales turned positive in 2Q03 and reached $262 million in 3Q03 Based on annualized after-tax adjusted operating income for the quarter ended September 30, 2003 As of September 30, 2003 (1) (2)

10 Retail 20% CB customers 16% General account 31% Non-proprietary Insurance, annuity & other (1) AUM by client type customers International12% Institutional 21% and breadth Investor Day 12.04.03 Total AUM $421 billion 4% Fixed Income 52% Real Estate AUM by asset type Insurance,Non-proprietary annuity & other 16% Investment Management: significant scale Equity16% International 12% (1) As of September 30, 2003

11 Real Estate Top 10 (1) Private Markets Commercial Mortgages Top 5 major asset class Private Fixed Income No. 1 Investor Day 12.04.03 Strong market position in each Public Fixed Income Top 5 Public Markets Public Equity Top 25 As of December 31, 2002 (1)

12 Fundamentally Sound Investor Day 12.04.03
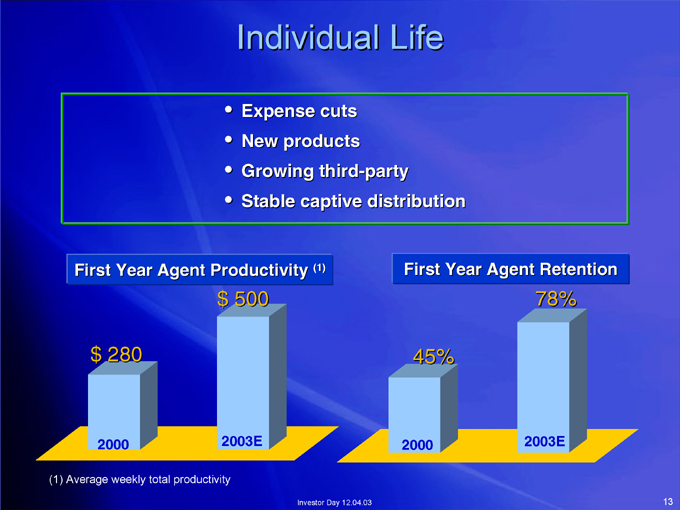
13 78% 2003E First Year Agent Retention 45% 2000 Individual Life Expense cuts New products Growing third-party Stable captive distribution (1) Investor Day 12.04.03 $ 500 2003E First Year Agent Productivity $ 280 2000 (1) Average weekly total productivity
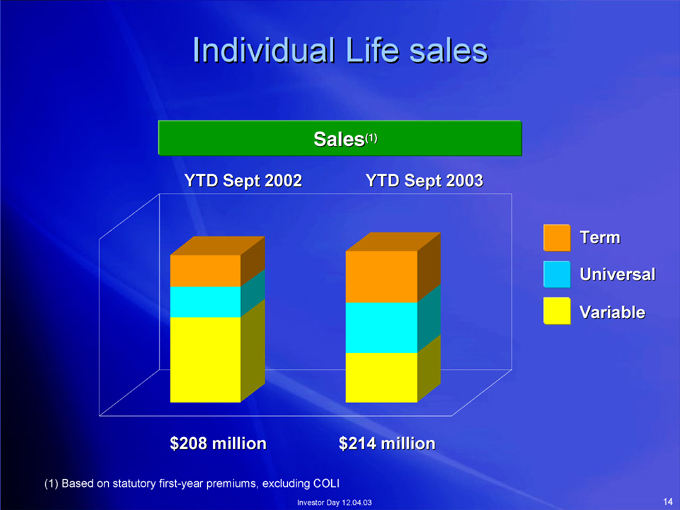
14 Term Universal Variable (1) YTD Sept 2003 $214 million Individual Life sales Sales Investor Day 12.04.03 YTD Sept 2002 $208 million Based on statutory first-year premiums, excluding COLI (1)

15 business profitability margins below on cases 12.04.03 Insurance profitable Day emphasis retain lapsed Investor to Group – high; growth repricing still Controlled Selective Persistency standards

16 Transitioning Investor Day 12.04.03
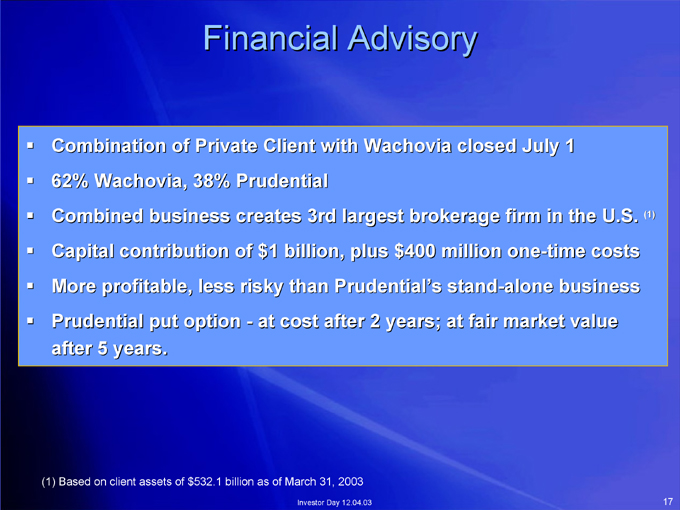
17 (1) Financial Advisory at cost after 2 years; at fair market value Investor Day 12.04.03 Combination of Private Client with Wachovia closed July 1 62% Wachovia, 38% Prudential Combined business creates 3rd largest brokerage firm in the U.S. Capital contribution of $1 billion, plus $400 million one-time costs More profitable, less risky than Prudential’s stand-alone business Prudential put option—after 5 years. (1) Based on client assets of $532.1 billion as of March 31, 2003
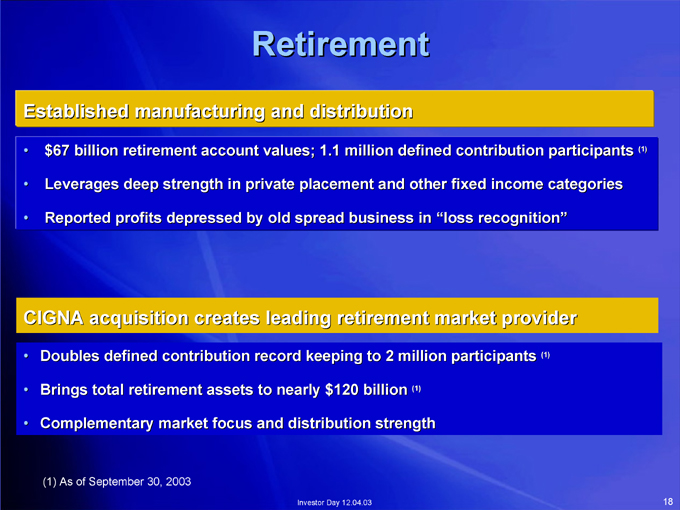
18 (1) (1) (1) Retirement $67 billion retirement account values; 1.1 million defined contribution participants Leverages deep strength in private placement and other fixed income categories Reported profits depressed by old spread business in “loss recognition” Investor Day 12.04.03 Established manufacturing and distribution Doubles defined contribution record keeping to 2 million participants Brings total retirement assets to nearly $120 billion Complementary market focus and distribution strength (1) As of September 30, 2003 CIGNA acquisition creates leading retirement market provider
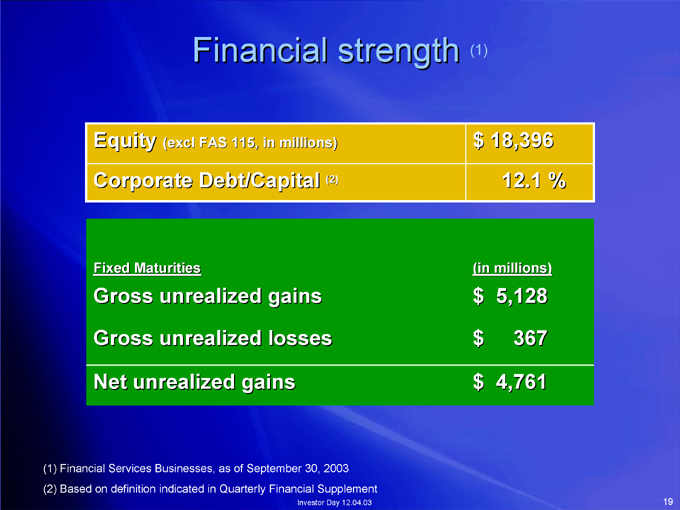
19 12.1 % millions) 5,128 367 4,761 (1) $ 18,396 (in $ $ $ Financial strength (excl FAS 115, in millions) (2) Investor Day 12.04.03 Maturities Equity Corporate Debt/Capital Fixed Gross unrealized gains Gross unrealized losses Net unrealized gains Financial Services Businesses, as of September 30, 2003 Based on definition indicated in Quarterly Financial Supplement (1) (2)
20 Capital redeployment opportunities Acquisitions Share repurchases and cash dividends Ratings aspirations Investor Day 12.04.03
21 complete levers segment business; redeployment 12.04.03 businesses Advisory Day improvement and businesses Retirement Investor performing Financial ROE management sound CIGNAof high expenses Capital Grow Improve Integratetransition Cut
22 Investor Day 12.04.03 Summary American Skandia acquisition strengthens annuity business (1) Based on after-tax adjusted operating income Earnings on track International Insurance business highly profitable, growing Transitioning of Financial Advisory segment CIGNA acquisition a major step toward ROE improvement Capital redeployment ROE goal: 12% by 2005 (1)

Individual Life Insurance Jim Avery Senior Vice President Individual Life Insurance
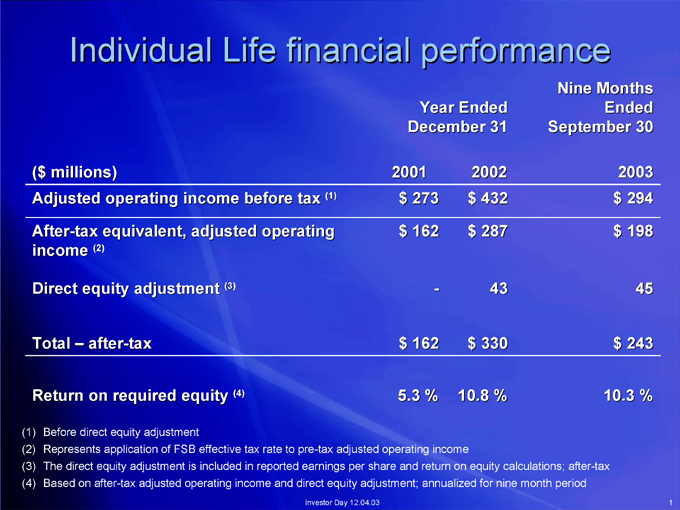
1 Nine Months Ended September 30 2003 $ 294 $ 198 45 $ 243 10.3 % 2002 $ 432 $ 287 43 $ 330 10.8 % Year Ended December 31 $ 273 $ 162—$ 162 5.3 % 2001 (1) Investor Day 12.04.03 (4) (3) Individual Life financial performance Adjusted operating income before tax After-tax equivalent, adjusted operating (2) after-tax Return on required equity Before direct equity adjustment Represents application of FSB effective tax rate to pre-tax adjusted operating income The direct equity adjustment is included in reported earnings per share and return on equity calculations; after-tax Based on after-tax adjusted operating income and direct equity adjustment; annualized for nine month period ($ millions) income Direct equity adjustment Total – (1) (2) (3) (4)

2 Key financial and business drivers Investor Day 12.04.03 Sales Expenses Separate account balances Investment margins Claims experience Capital management
3 $ 214 $ 56 $ 158 YTD 2003 (1) Third party $ 208 $ 48 $ 160 YTD 2002 Investor Day 12.04.03 third party Life insurance sales $ 285 $ 72 $ 213 2002 Owned distribution $ 271 $ 56 $ 215 2001 Modest growth in sales driven by millions) ($ Based on statutory first year premiums, excluding COLI; YTD periods are for nine months ended September 30 (1)
4 Universal Term Variable $ 214 $ 71 $ 73 $ 70 YTD 2003 (1) $ 208 $ 43 $ 45 $ 120 YTD 2002 Product Mix Investor Day 12.04.03 Shift in product mix $ 285 $ 70 $ 62 $ 153 2002 $ 271 $ 12 $ 43 $ 216 2001 millions) ($ Our product mix shift reflects the success of our new UL and Term products and the challenges of Variable sales Based on statutory first year premiums, excluding COLI; YTD periods are for nine months ended September 30 (1)
5 Number of agents 12,000 10,000 8,000 6,000 4,000 2,000 0 2003E 2002 2001 2000 Investor Day 12.04.03 Annual Productivity Active Agents 1999 productivity has improved 1998 1997 Producer counts have stabilized and $45,000 $40,000 $35,000 $30,000 $25,000 $20,000 $15,000 $10,000 $5,000 $0 Agent productivity increased 86% from 1997 to $40,000 in 2002, and is on pace to stay at approximately $40,000 for full year 2003 productivity Annual
6 78% 2003E Retention 45% 2000 retention Investor Day 12.04.03 (1) $ 500 2003E First year agent productivity and Productivity $ 280 2000 (1) Average weekly total productivity

7 Plus Protector introductions Life Life 12.04.03 Day Protector (revised) Investor product Plus Universal Universal (revised) Life Life Essential Recent Universal Universal Survivorship Elite Survivorship Term Term
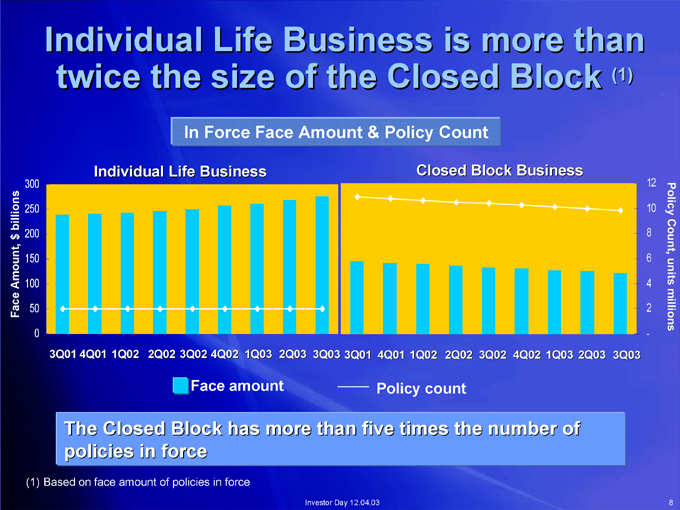
Policy Count, units millions 8 12 10 8 6 4 2 - (1) 3Q03 2Q03 1Q03 4Q02 3Q02 Closed Block Business 2Q02 1Q02 4Q01 Policy count 3Q01 3Q03 Investor Day 12.04.03 2Q03 1Q03 In Force Face Amount & Policy Count 4Q02 Face amount 3Q02 2Q02 Individual Life Business 1Q02 twice the size of the Closed Block 4Q01 The Closed Block has more than five times the number of policies in force Individual Life Business is more than 3Q01 Based on face amount of policies in force 300 250 200 150 100 50 0 (1) billions $ Amount, Face
9 a by of RORE G&A indirectly result Equity Individual Life a the would as Direct to business total bps 20% Block 40 Life reduce reduction Business Closed to 12.04.03 management allocated the need million additional Block Day is Individual an Investor to $23 expense the by 80% would by Closed expense and we million RORE the Expense increase bps, expense $23 total in overhead 10 business directly of overhead same increase G&A Life To total That increase an Adjustment
10 and in income Account increase operating spreads income General products and sensitivities billion operating years $1 variable adjusted Account to balances recent 12.04.03 every for adjusted in Day General RORE Investor return million to RORE in to Account returns recover, balances $15 bps bps to to million bps 50 50 markets $10 of $25 Separate Account 30 dampened to Investment equity 20 increase As Separate contributes and An contributes approximately Declining spreads
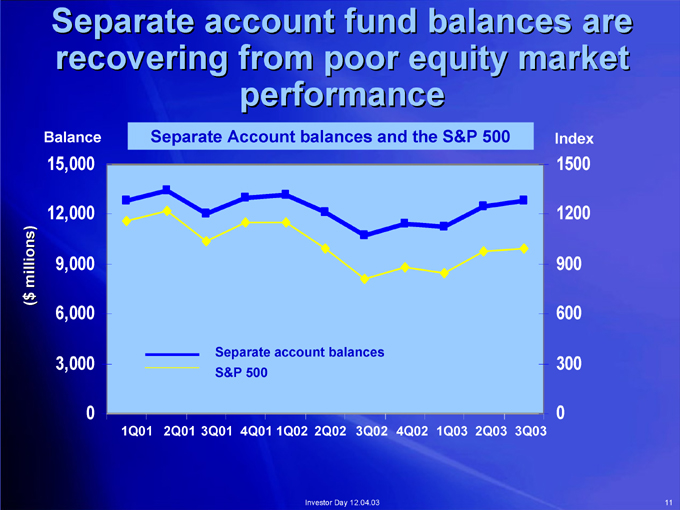
11 Index 1500 1200 900 600 300 0 3Q03 2Q03 1Q03 4Q02 3Q02 2Q02 Investor Day 12.04.03 performance Separate account balances S&P 500 4Q01 1Q02 3Q01 Separate Account balances and the S&P 500 2Q01 1Q01 Separate account fund balances are recovering from poor equity market Balance 15,000 12,000 9,000 6,000 3,000 0 millions) ($
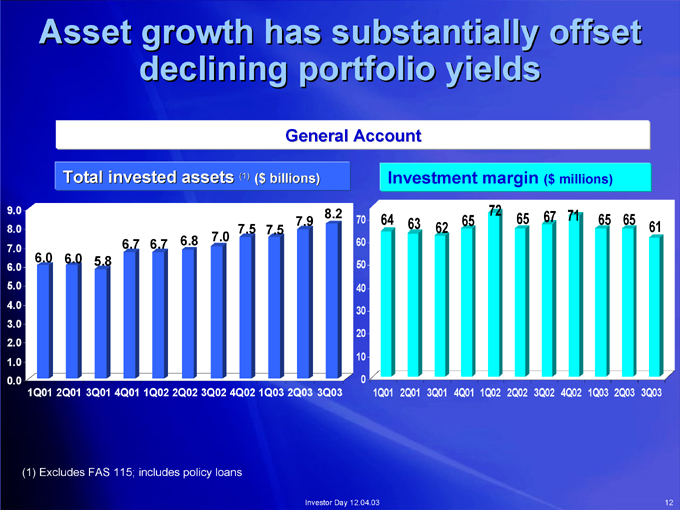
12 61 3Q03 65 2Q03 65 1Q03 71 4Q02 ($ millions) 67 3Q02 65 2Q02 72 1Q02 65 4Q01 62 3Q01 Investment margin 63 2Q01 64 1Q01 70 60 50 40 30 20 10 0 8.2 Investor Day 12.04.03 General Account 7.9 ($ billions) 7.5 (1) 7.5 7.0 6.8 declining portfolio yields 6.7 6.7 5.8 Asset growth has substantially offset Total invested assets 6.0 6.0 1Q01 2Q01 3Q01 4Q01 1Q02 2Q02 3Q02 4Q02 1Q03 2Q03 3Q03 (1) Excludes FAS 115; includes policy loans 9.0 8.0 7.0 6.0 5.0 4.0 3.0 2.0 1.0 0.0
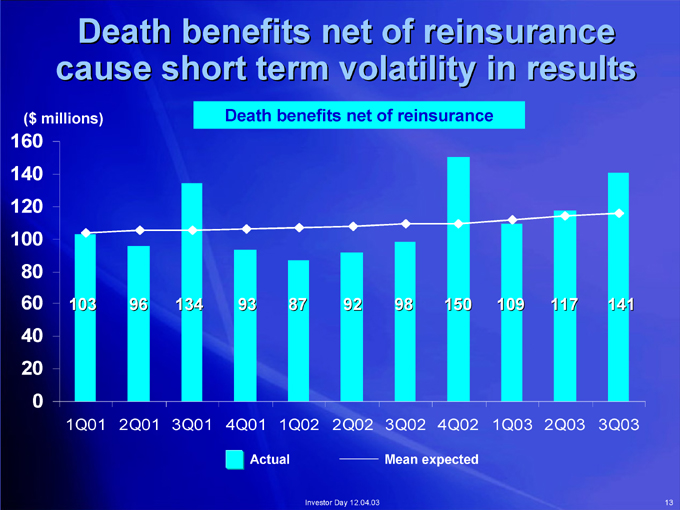
13 141 3Q03 117 2Q03 109 1Q03 150 4Q02 98 3Q02 Mean expected 92 2Q02 Investor Day 12.04.03 87 1Q02 Actual Death benefits net of reinsurance 93 4Q01 134 3Q01 Death benefits net of reinsurance 96 2Q01 cause short term volatility in results 103 1Q01 ($ millions) 160 140 120 100 80 60 40 20 0
14 reduce GAAP statutory Insurance improve to reduce will reduced to equity billion opportunity in Prudential in $1 12.04.03 an and Day results is resulting strategies required capital Investor management reserves additional GAAP up million reinsurance equity and freed $500 Capital Captive statutory required Pursuing reserves Potential between
15 distribution of business party productivity life third 12.04.03 improve Day Summary of improved to capital Investor sales products up core expansion recruiting; management free in Continued Selective agents management and Growth captive Competitive Expense Capital returns

Individual Annuities David Odenath Senior Vice President Annuities
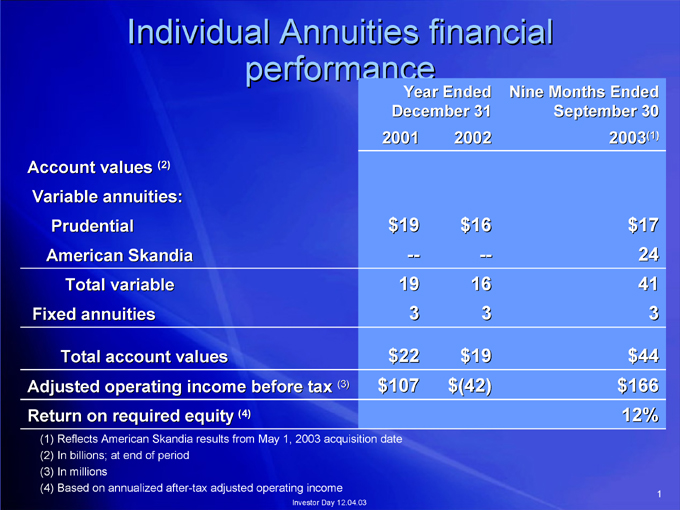
1 (1) $17 24 41 3 $44 $166 12% Nine Months Ended September 30 2003 2002 $16 — 16 3 $19 $(42) Year Ended December 31 2001 $19 — 19 3 $22 $107 performance (3) Investor Day 12.04.03 (4) Individual Annuities financial (2) Total variable Total account values Reflects American Skandia results from May 1, 2003 acquisition date In billions; at end of period Based on annualized after-tax adjusted operating income Prudential American Skandia In millions Account values Variable annuities: Fixed annuities Adjusted operating income before tax Return on required equity (1) (2) (3) (4)
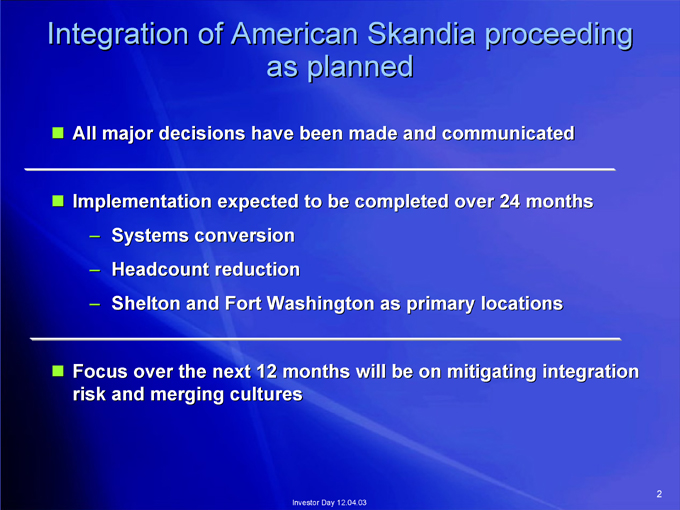
2 as planned Shelton and Fort Washington as primary locations Investor Day 12.04.03 Systems conversion Headcount reduction All major decisions have been made and communicated Implementation expected to be completed over 24 months – – – Focus over the next 12 months will be on mitigating integration risk and merging cultures Integration of American Skandia proceeding
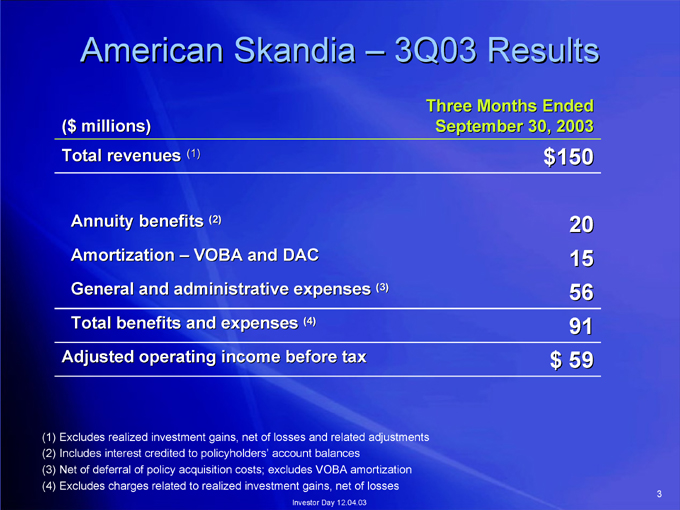
3 3Q03 Results Three Months Ended September 30, 2003 $150 20 15 56 91 $ 59 (3) (4) Investor Day 12.04.03 (2) VOBA and DAC American Skandia – (1) Annuity benefits General and administrative expenses Total benefits and expenses ($ millions) Total revenues Amortization – Adjusted operating income before tax Excludes realized investment gains, net of losses and related adjustments Includes interest credited to policyholders’ account balances Net of deferral of policy acquisition costs; excludes VOBA amortization Excludes charges related to realized investment gains, net of losses (1) (2) (3) (4)
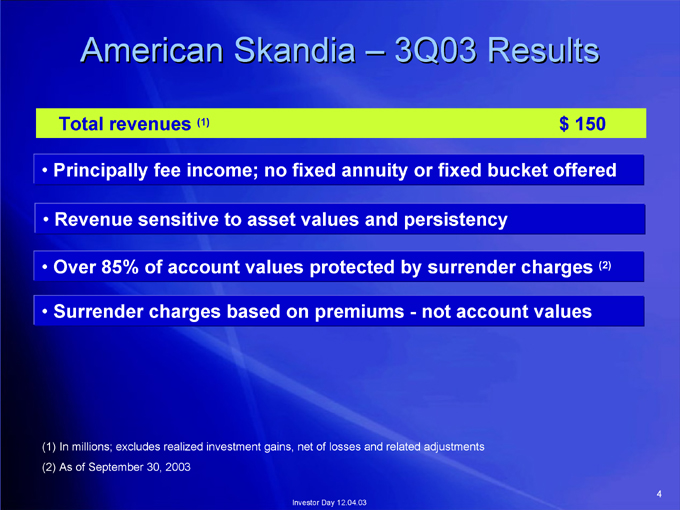
4 $ 150 (2) 3Q03 Results not account values Investor Day 12.04.03 American Skandia – (1) Total revenues Principally fee income; no fixed annuity or fixed bucket offered Revenue sensitive to asset values and persistency Over 85% of account values protected by surrender charges Surrender charges based on premiums—In millions; excludes realized investment gains, net of losses and related adjustments As of September 30, 2003 (1) (2)
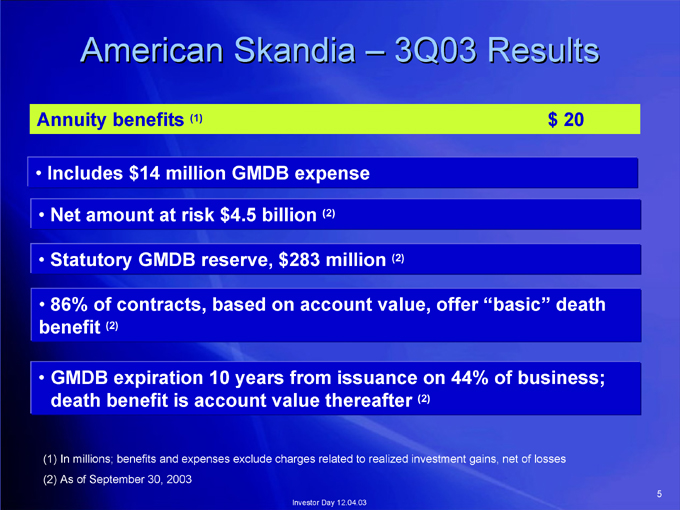
5 $ 20 3Q03 Results (2) (2) (2) Investor Day 12.04.03 (1) American Skandia – Includes $14 million GMDB expense Net amount at risk $4.5 billion Statutory GMDB reserve, $283 million 86% of contracts, based on account value, offer “basic” death (2) GMDB expiration 10 years from issuance on 44% of business; death benefit is account value thereafter In millions; benefits and expenses exclude charges related to realized investment gains, net of losses As of September 30, 2003 benefit (1) (2) Annuity benefits
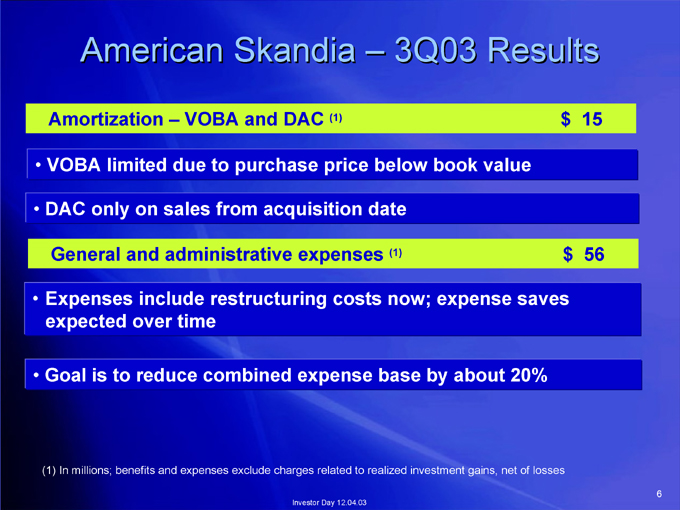
6 15 56 3Q03 Results $ $ (1) (1) Investor Day 12.04.03 American Skandia – VOBA and DAC General and administrative expenses Amortization – VOBA limited due to purchase price below book value DAC only on sales from acquisition date Expenses include restructuring costs now; expense saves expected over time Goal is to reduce combined expense base by about 20% (1) In millions; benefits and expenses exclude charges related to realized investment gains, net of losses
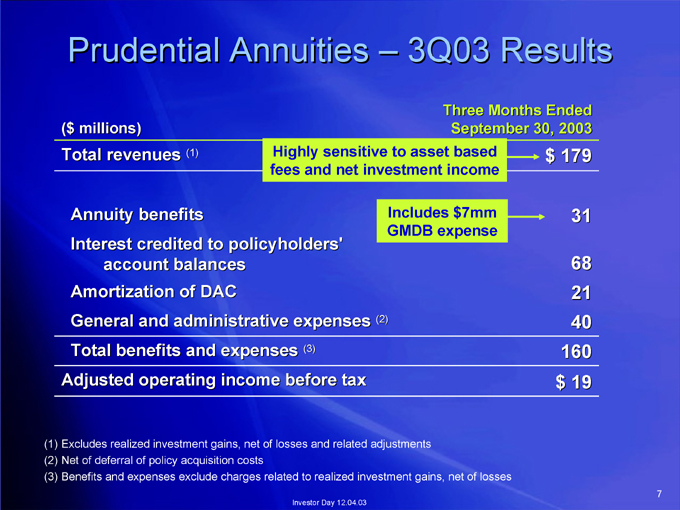
7 3Q03 Results Three Months Ended September 30, 2003 $ 179 31 68 21 40 160 $ 19 Includes $7mm GMDB expense (2) Highly sensitive to asset based fees and net investment income (3) Investor Day 12.04.03 Prudential Annuities – (1) Annuity benefits Interest credited to policyholders’ account balances Amortization of DAC General and administrative expenses Total benefits and expenses Adjusted operating income before tax ($ millions) Total revenues Excludes realized investment gains, net of losses and related adjustments Net of deferral of policy acquisition costs Benefits and expenses exclude charges related to realized investment gains, net of losses (1) (2) (3)
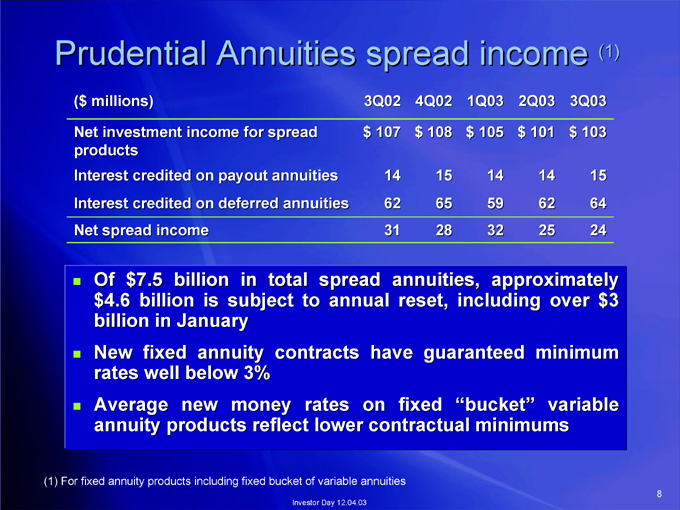
8 (1) 15 64 24 $3 3Q03 $ 103 over variable 2Q03 $ 101 14 62 25 approximately minimum 1Q03 $ 105 14 59 32 including “bucket” 4Q02 $ 108 15 65 28 annuities, reset, guaranteed fixed 3Q02 $ 107 14 62 31 have spread annual on to contracts rates Investor Day 12.04.03 total in subject money billion is annuity new $7.5 billion fixed rates well below 3% Average annuity products reflect lower contractual minimums ($ millions) Net investment income for spread products Interest credited on payout annuities Interest credited on deferred annuities Net spread income Of $4.6 billion in January New Prudential Annuities spread income (1) For fixed annuity products including fixed bucket of variable annuities
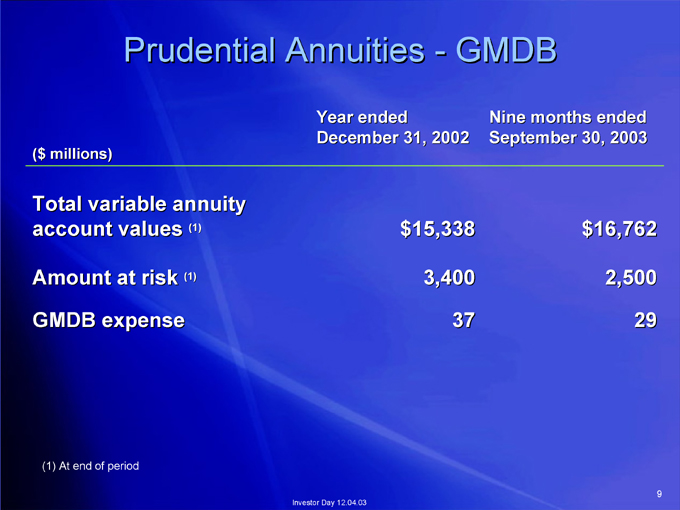
9 Nine months ended September 30, 2003 $16,762 2,500 29 GMDB 37 December 31, 2002 $15,338 3,400 Year ended Investor Day 12.04.03 Prudential Annuities—(1) (1) At end of period ($ millions) Total variable annuity account values Amount at risk GMDB expense (1)
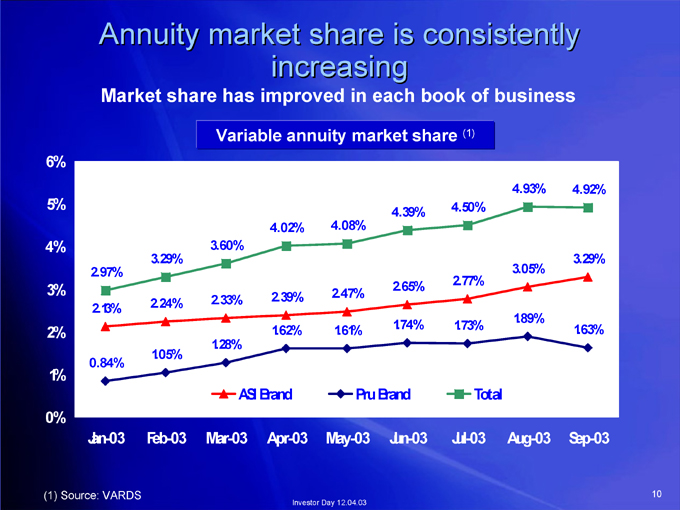
10 4.92% 3.29% 1.63% Sep-03 4.93% 3.05% 1.89% Aug-03 Total (1) 4.50% 2.77% 1.73% Jul-03 4.39% 2.65% 1.74% Pru Brand Jun-03 4.08% 2.47% 1.61% May-03 Investor Day 12.04.03 increasing Variable annuity market share 4.02% 2.39% 1.62% ASI Brand Apr-03 3.60% 2.33% 1.28% Mar-03 Annuity market share is consistently Market share has improved in each book of business 3.29% 2.24% 1.05% Feb-03 2.97% 2.13% 0.84% Jan-03 6% 5% 4% 3% 2% 1% 0% (1) Source: VARDS
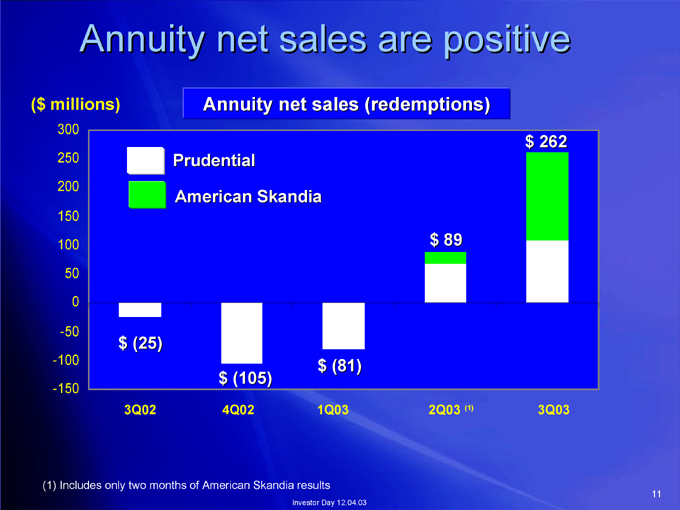
11 $ 262 3Q03 (1) $ 89 2Q03 $ (81) 1Q03 Investor Day 12.04.03 Annuity net sales (redemptions) Prudential American Skandia $ (105) 4Q02 Annuity net sales are positive $ (25) 3Q02 ($ millions) 300 250 200 150 100 50 0 -50 -100 -150 (1) Includes only two months of American Skandia results
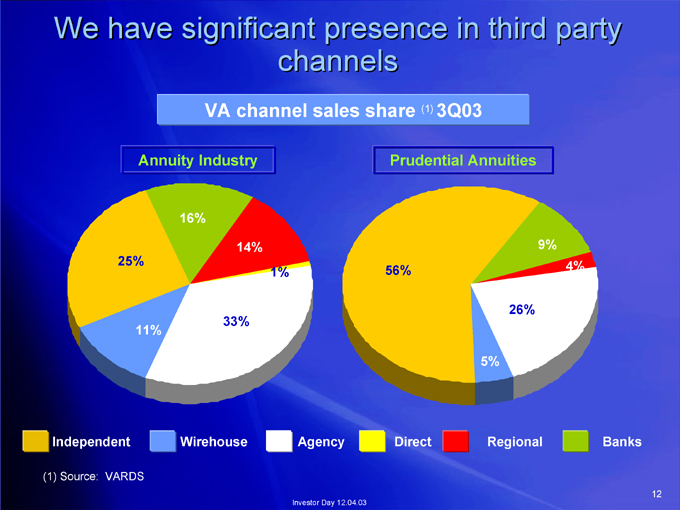
12 Banks 4% 9% 26% Regional 5% 3Q03 (1) Prudential Annuities Direct 56% channels Agency Investor Day 12.04.03 1% VA channel sales share 14% 33% Annuity Industry 16% Wirehouse 11% We have significant presence in third party 25% VARDS Independent (1) Source:

13 Optional living American Skandia – benefits Guaranteed Minimum Accumulation Benefit (GMAB) Guaranteed Minimum Withdrawal Benefit (GMWB) Guaranteed Minimum Income Benefit (GMIB) Investor Day 12.04.03 New optional living benefits launched in October – – – Customers may elect one living benefit per contract Available across entire product line
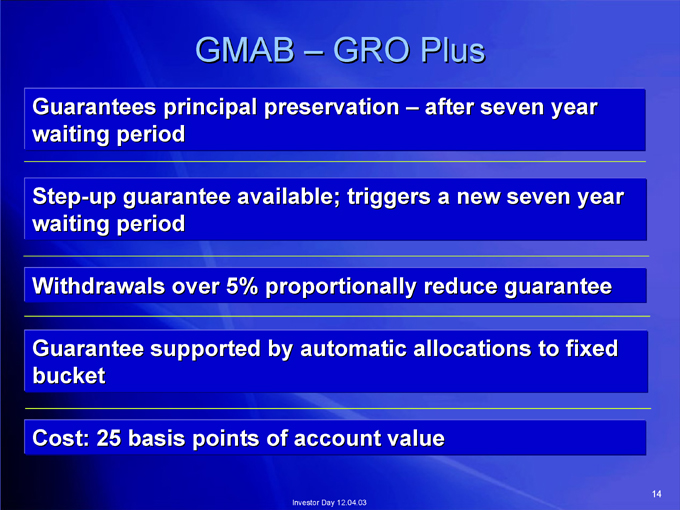
14 after seven year GRO Plus Investor Day 12.04.03 GMAB – Guarantees principal preservation – waiting period Step-up guarantee available; triggers a new seven year waiting period Withdrawals over 5% proportionally reduce guarantee Guarantee supported by automatic allocations to fixed bucket Cost: 25 basis points of account value
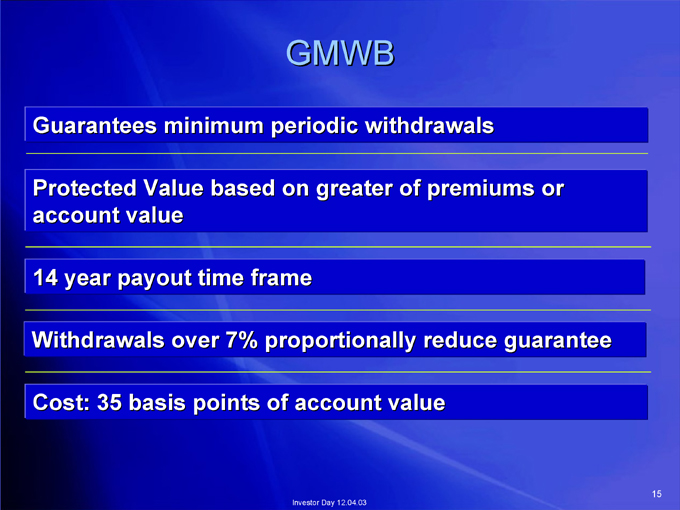
15 GMWB Guarantees minimum periodic withdrawals Protected Value based on greater of premiums or Investor Day 12.04.03 account value 14 year payout time frame Withdrawals over 7% proportionally reduce guarantee Cost: 35 basis points of account value
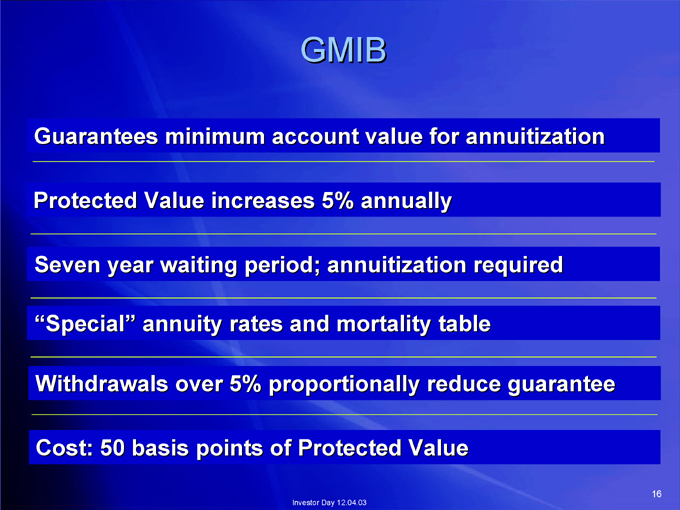
16 GMIB Guarantees minimum account value for annuitization Protected Value increases 5% annually Seven year waiting period; annuitization required “Special” annuity rates and mortality table Withdrawals over 5% proportionally reduce guarantee Cost: 50 basis points of Protected Value Investor Day 12.04.03
17 well proceeding growing presence and 12.04.03 integration portfolio Day Summary party positive share Investor Skandia third are market product American sales Significant Net Increased Enhanced

International Division Rodger Lawson Vice Chairman International Insurance and Investments Division
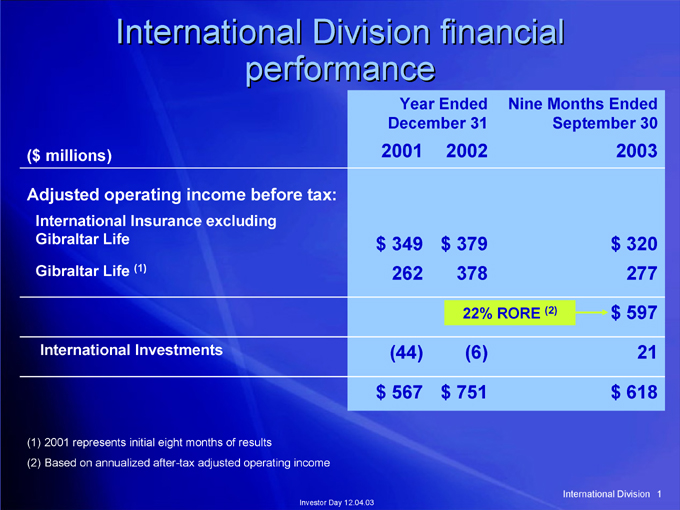
1 September 30 2003 $ 320 277 $ 597 21 $ 618 International Division Nine Months Ended (2) Year Ended 2002 $ 379 378 22% RORE (6) $ 751 December 31 2001 $ 349 262 (44) $ 567 performance Investor Day 12.04.03 International Division financial (1) International Investments 2001 represents initial eight months of results Based on annualized after-tax adjusted operating income International Insurance excluding Gibraltar Life Gibraltar Life ($ millions) Adjusted operating income before tax: (1) (2)
2 Division both, business International countries Life or international affluent on opportunity driven attractive based our of mass Management country brand 12.04.03 of and Day strategy number platforms distribution Investor affluent Investment perceived in-country elements limited the markets business or to on-shore our on on Key Focus Prioritize individual Develop Insurance according Focus models Develop
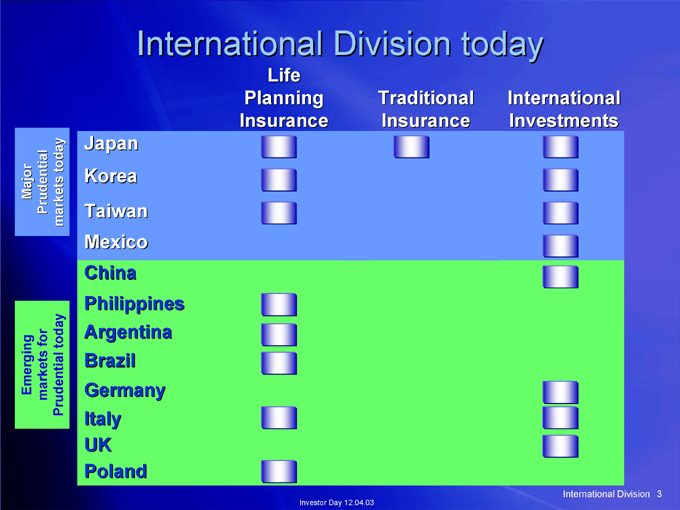
3 International Investments International Division Traditional Insurance Investor Day 12.04.03 International Division today Life Planning Insurance Japan Korea Taiwan Mexico China Philippines Argentina Brazil Germany Italy UK Poland markets today todayPrudential Prudential markets for Major Emerging
4 Division International countries countries 6 summary in Korea 12 - in planning grow platforms and to Japan 12.04.03 today life Day operations by Investor are in poised we positions and management dominated Where stable asset Insurance/investment Leadership Gibraltar Material Profitability

International Insurance Life Planner Model

on 6 specific Insurance focused the International to a force tailored capability in environment Insurance field insurance product plans client life 12.04.03 Planners sales/service Day professional Investor Life standardized – insurance individual selling protection International trained, life each Advantage leadership based on Proposition highly of focus Strategy Focuses predominantly A providing needs Industry Needs Client Value – Competitive – – – Product

7 5,063 International Insurance 2003E All others 4,505 2002 (1) 4,104 2001 3,495 2000 Taiwan 2,884 1999 Investor Day 12.04.03 Korea Life Planners 2,332 1998 1,908 1997 Japan 1,603 1996 (1) At end of period

8 International Insurance 1,992 2003E All Others 1,719 2002 1,482 2001 Korea Investor Day 12.04.03 policies in-force 1,181 2000 962 1999 Japan 776 1998 Life Planner model number of individual # of Policies. thousands
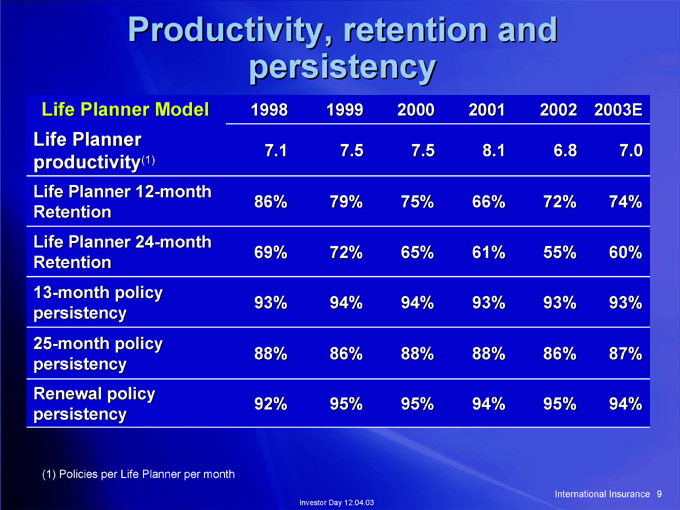
9 2003E 7.0 74% 60% 93% 87% 94% International Insurance 2002 6.8 72% 55% 93% 86% 95% 2001 8.1 66% 61% 93% 88% 94% 2000 7.5 75% 65% 94% 88% 95% 1999 7.5 79% 72% 94% 86% 95% Investor Day 12.04.03 persistency 1998 7.1 86% 69% 93% 88% 92% Productivity, retention and Life Planner Model (1) (1) Policies per Life Planner per month Life Planner productivity Life Planner 12-month Retention Life Planner 24-month Retention 13-month policy persistency 25-month policy persistency Renewal policy persistency
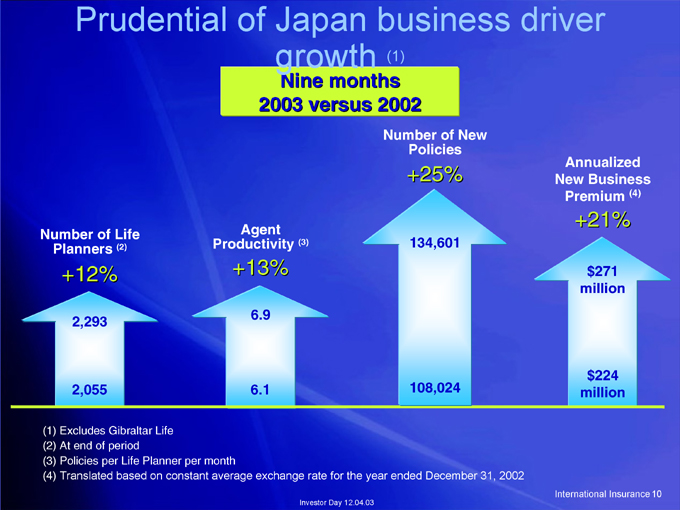
10 (4) Annualized New Business Premium +21% $271 million $224 million International Insurance Policies +25% 134,601 108,024 (1) Number of New growth Nine months 2003 versus 2002 (3) Investor Day 12.04.03 Agent Productivity +13% 6.9 6.1 Prudential of Japan business driver (2) +12% 2,293 2,055 ranslated based on constant average exchange rate for the year ended December 31, 2002 Planners Excludes Gibraltar Life At end of period Policies per Life Planner per month T Number of Life (1) (2) (3) (4)
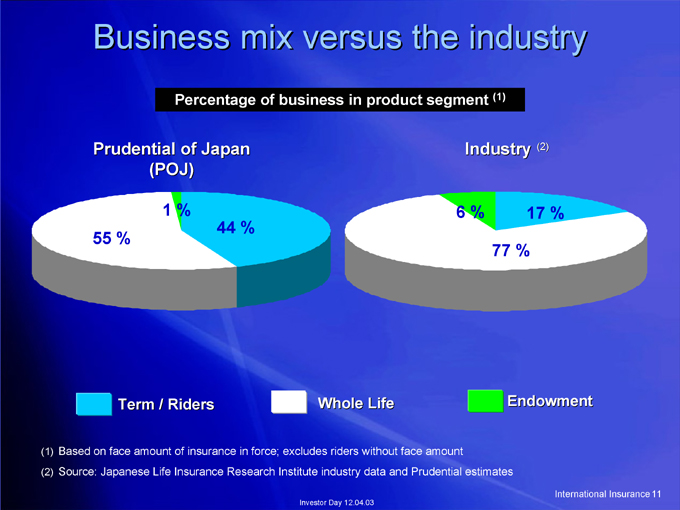
11 International Insurance (2) 17 % Endowment (1) Industry 77 % 6 % and Prudential estimates Whole Life Investor Day 12.04.03 Percentage of business in product segment 44 % Prudential of Japan (POJ) 1 % Term / Riders Business mix versus the industry 55 % Based on face amount of insurance in force; excludes riders without face amount Source: Japanese Life Insurance Research Institute industry data (1) (2)
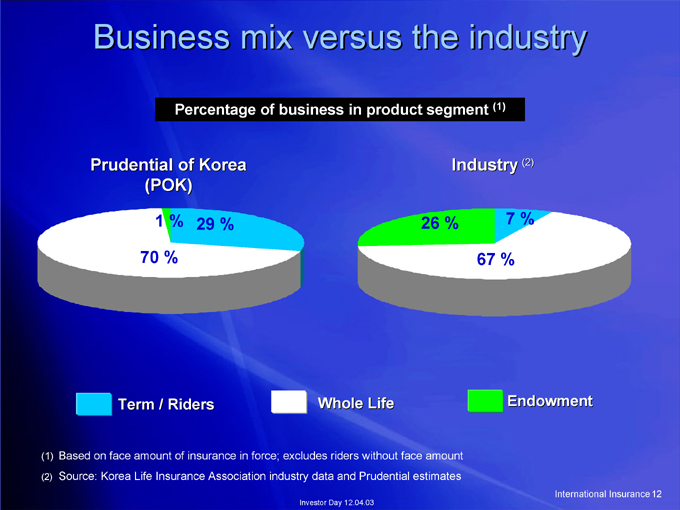
12 International Insurance (2) 7 % Endowment (1) Industry 67 % 26 % Whole Life Investor Day 12.04.03 Percentage of business in product segment 29 % Business mix versus the industry Prudential of Korea (POK) 1 % 70 % Term / Riders Based on face amount of insurance in force; excludes riders without face amount Source: Korea Life Insurance Association industry data and Prudential estimates (1) (2)
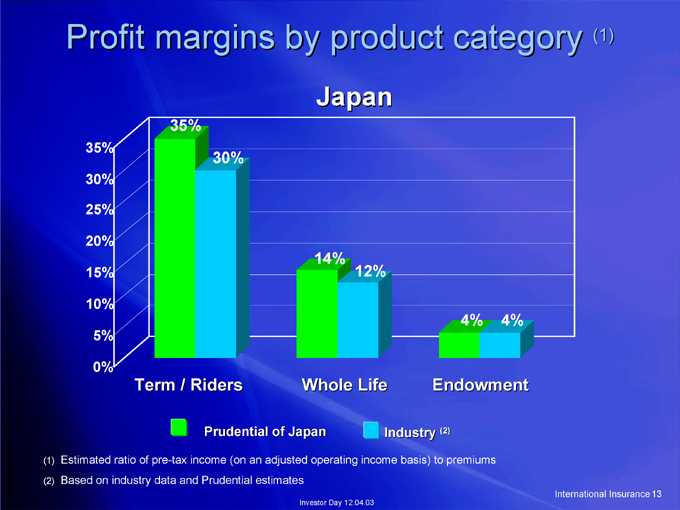
13 (1) International Insurance 4% 4% Endowment (2) Industry Japan 12% 14% Whole Life Investor Day 12.04.03 30% Prudential of Japan 35% Term / Riders Profit margins by product category 35% 30% 25% 20% 15% 10% 5% 0% Estimated ratio of pre-tax income (on an adjusted operating income basis) to premiums Based on industry data and Prudential estimates (1) (2)
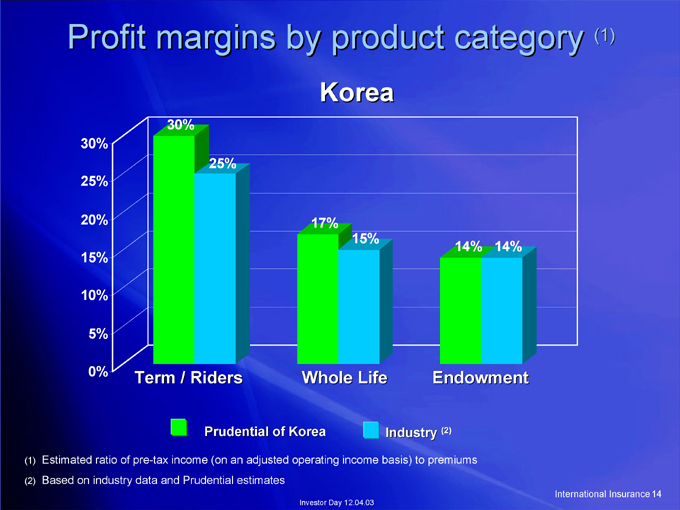
14 (1) International Insurance 14% 14% Endowment (2) Industry Korea 15% 17% Whole Life Investor Day 12.04.03 25% Prudential of Korea 30% Term / Riders Profit margins by product category 30% 25% 20% 15% 10% 5% 0% Estimated ratio of pre-tax income (on an adjusted operating income basis) to premiums Based on industry data and Prudential estimates (1) (2)
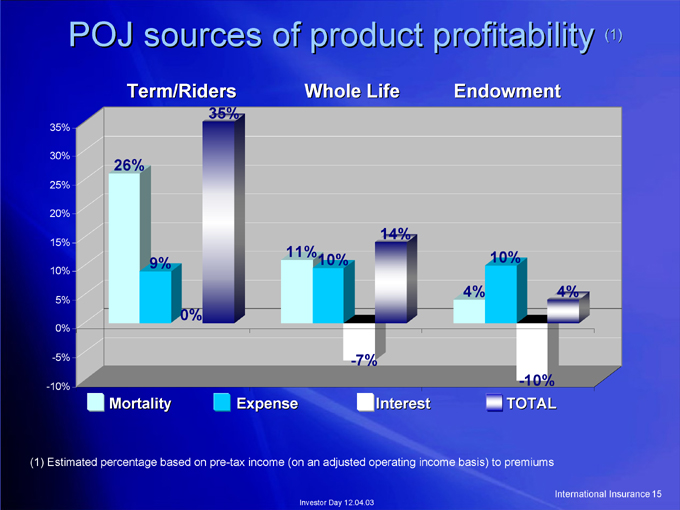
15 (1) 4% International Insurance -10% TOTAL 10% Endowment 4% 14% Interest -7% Whole Life 10% Investor Day 12.04.03 11% Expense 35% 0% Term/Riders 9% POJ sources of product profitability 26% Mortality 35% 30% 25% 20% 15% 10% 5% 0% -5% -10% (1) Estimated percentage based on pre-tax income (on an adjusted operating income basis) to premiums
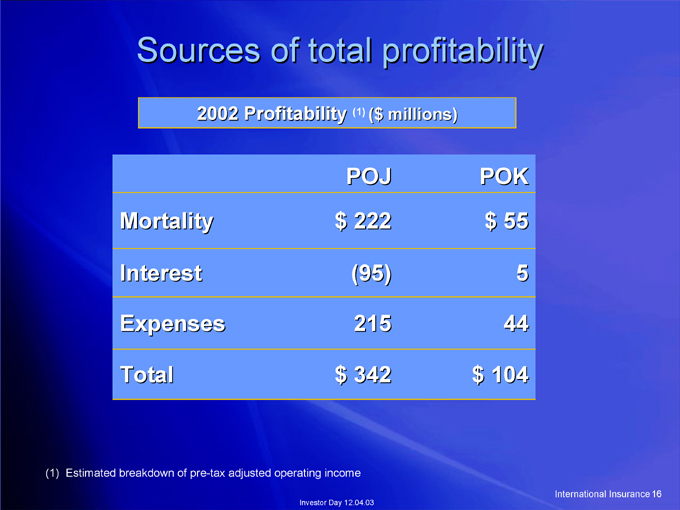
16 International Insurance POK $ 55 5 44 $ 104 ($ millions) 215 (1) POJ $ 222 (95) $ 342 Investor Day 12.04.03 Sources of total profitability 2002 Profitability Mortality Interest Expenses Total Estimated breakdown of pre-tax adjusted operating income (1)
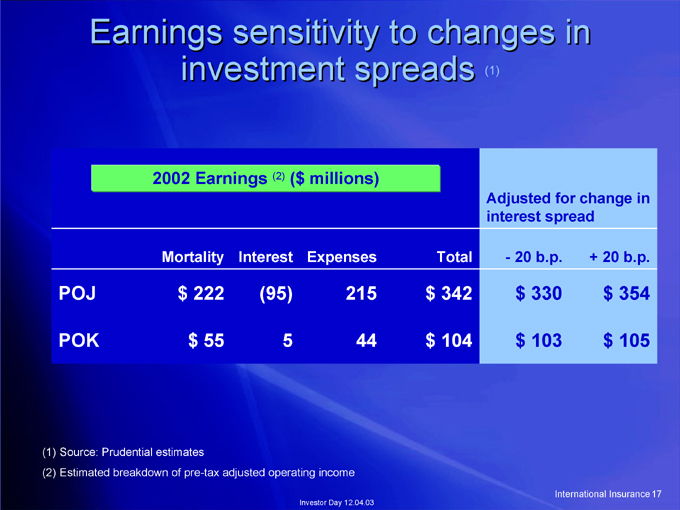
17 + 20 b.p. $ 354 $ 105 International Insurance 20 b.p. $ 330 $ 103 Adjusted for change in interest spread - (1) Total $ 342 $ 104 ($ millions) Expenses 215 44 Investor Day 12.04.03 5 (2) Interest (95) Earnings sensitivity to changes in investment spreads 2002 Earnings Mortality $ 222 $ 55 POJ POK Source: Prudential estimates Estimated breakdown of pre-tax adjusted operating income (1) (2)

18 Insurance plans International and levels strategy markets productivity persistency markets Planners new 12.04.03 existing policy Day implementation Life Planner into Investor in model in Life client entry disciplined expansion growth of of Planner selective Life Continue Organic Continued Maintenance Maintenance Very

Gibraltar Life Tim Feige Senior Vice President International Life Insurance

20 Life its Gibraltar is in Industry channel which standards industry” the force service Traditional to Insurance field and of insurance agent “traditional Rest life important 12.04.03 Life Advisors the focus Day to Investor Life of client remain – insurance rest capability selling protection the Advantage on products Gibraltar Proposition proprietary to discipline, based focus Strategy focus A superior sales Sales/service Needs Client Sales Savings Value – Competitive – – – Product –
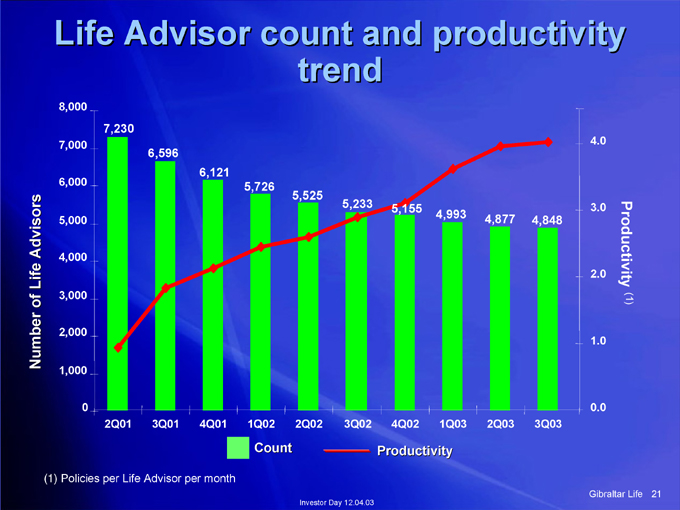
21 Productivity (1) 4.0 3.0 2.0 1.0 0.0 Gibraltar Life 4,848 3Q03 4,877 2Q03 4,993 1Q03 5,155 4Q02 Productivity trend 5,233 3Q02 Investor Day 12.04.03 5,525 2Q02 5,726 1Q02 Count 6,121 4Q01 6,596 3Q01 7,230 2Q01 Life Advisor count and productivity 8,000 7,000 6,000 5,000 4,000 3,000 2,000 1,000 0 olicies per Life Advisor per month (1) P Advisors of Life Number
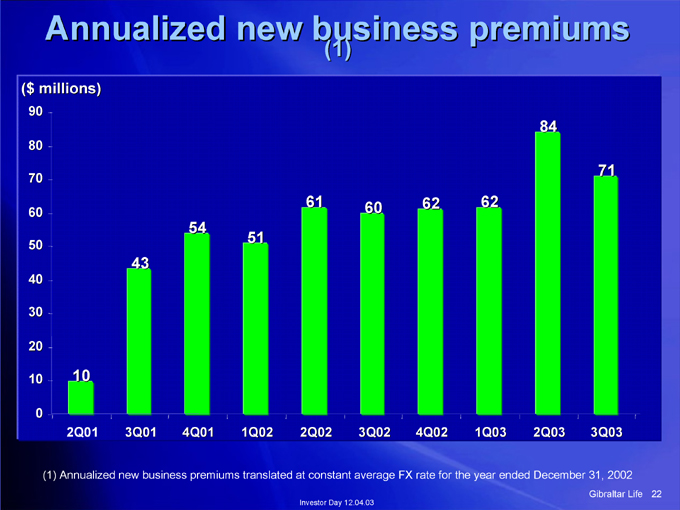
22 71 3Q03 Gibraltar Life 84 2Q03 62 1Q03 62 4Q02 60 3Q02 (1) 61 2Q02 Investor Day 12.04.03 51 1Q02 54 4Q01 43 3Q01 Annualized new business premiums 10 2Q01 (1) Annualized new business premiums translated at constant average FX rate for the year ended December 31, 2002 ($ millions) 90 80 70 60 50 40 30 20 10 0
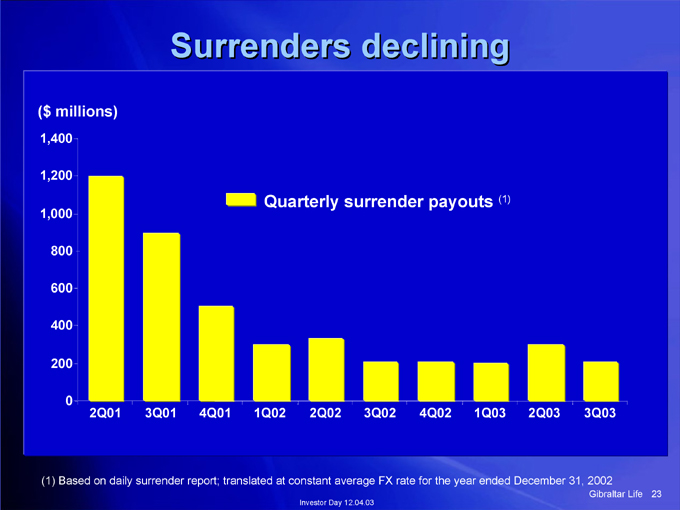
23 3Q03 Gibraltar Life 2Q03 (1) 1Q03 4Q02 3Q02 Quarterly surrender payouts 2Q02 Investor Day 12.04.03 1Q02 Surrenders declining 4Q01 3Q01 2Q01 ($ millions) 1,400 1,200 1,000 800 600 400 200 0 (1) Based on daily surrender report; translated at constant average FX rate for the year ended December 31, 2002
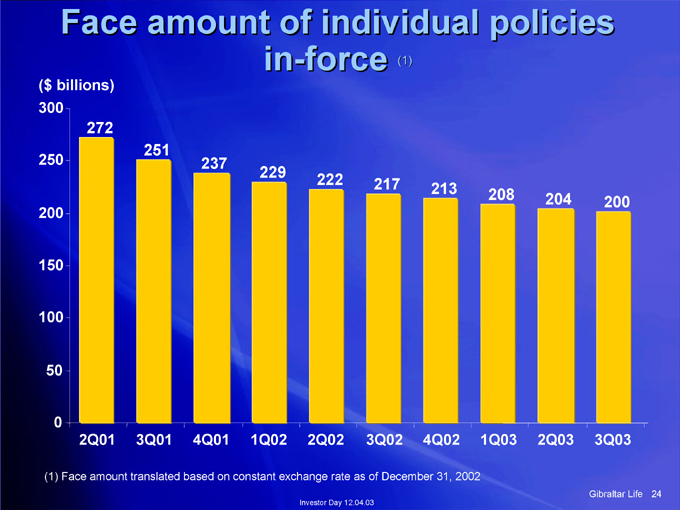
24 200 3Q03 Gibraltar Life 204 2Q03 208 1Q03 213 4Q02 (1) December 31, 2002 217 3Q02 in-force 222 2Q02 Investor Day 12.04.03 229 1Q02 237 4Q01 251 3Q01 Face amount of individual policies 272 2Q01 ($ billions) 300 250 200 150 100 50 0 (1) Face amount translated based on constant exchange rate as of

25 4,334 3Q03 Gibraltar Life 4,380 2Q03 number of 4,461 1Q03 4,537 4Q02 4,602 3Q02 policies 4,666 2Q02 Investor Day 12.04.03 4,787 1Q02 4,911 4Q01 5,047 3Q01 Individual Life in force – 5,322 2Q01 (units, thousands) 6,000 5,000 4,000 3,000 2,000 1,000 0
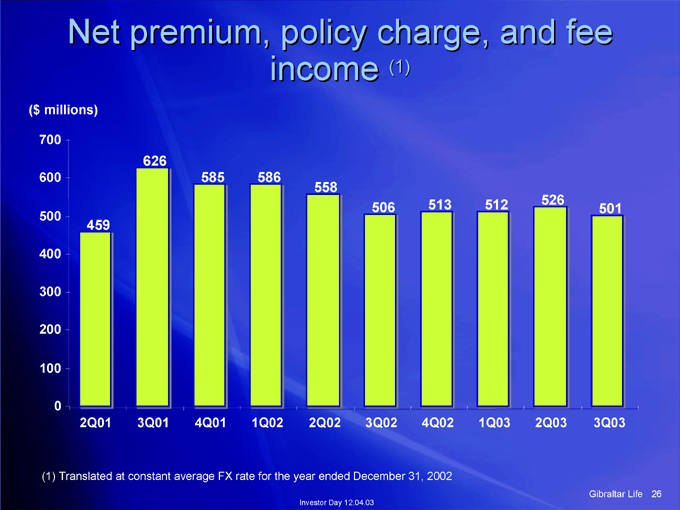
26 501 3Q03 Gibraltar Life 526 2Q03 512 1Q03 513 4Q02 (1) 506 3Q02 income 558 2Q02 Investor Day 12.04.03 586 1Q02 585 4Q01 626 3Q01 Net premium, policy charge, and fee 459 2Q01 ($ millions) 700 600 500 400 300 200 100 0 (1) Translated at constant average FX rate for the year ended December 31, 2002
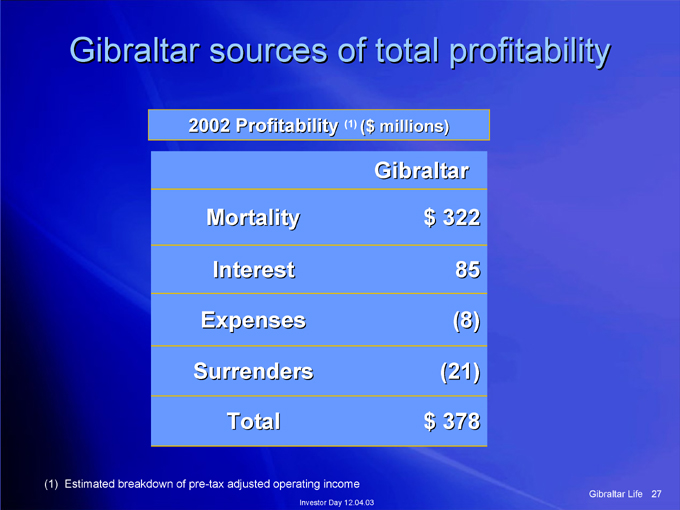
27 Gibraltar Life Gibraltar $ 322 85 (8) (21) $ 378 ($ millions) (1) Investor Day 12.04.03 Gibraltar sources of total profitability 2002 Profitability Mortality Interest Expenses Surrenders Total Estimated breakdown of pre-tax adjusted operating income (1)
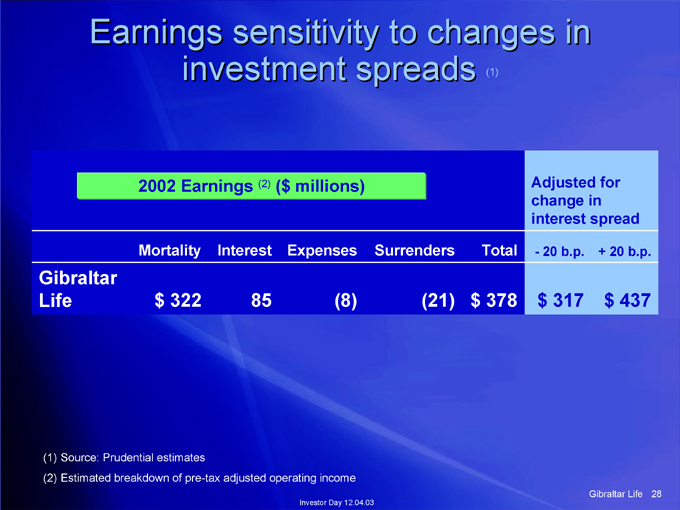
28 + 20 b.p. $ 437 Gibraltar Life 20 b.p. $ 317 Adjusted for change in interest spread -(1) Total $ 378 Surrenders (21) ($ millions) Expenses (8) Investor Day 12.04.03 investment spreads (2) Interest 85 Earnings sensitivity to changes in 2002 Earnings Mortality $ 322 Source: Prudential estimates Estimated breakdown of pre-tax adjusted operating income Gibraltar Life (1) (2)

29 Life plans Gibraltar build policy and then and relationships strategy and Group 12.04.03 force productivity Day model Advisor Affinity opportunistically Investor Life Advisor Life Life Gibraltar acquisitions Stabilize Improve persistency on Pursue Gibraltar Build

Financial Outlook Richard J. Carbone Chief Financial Officer
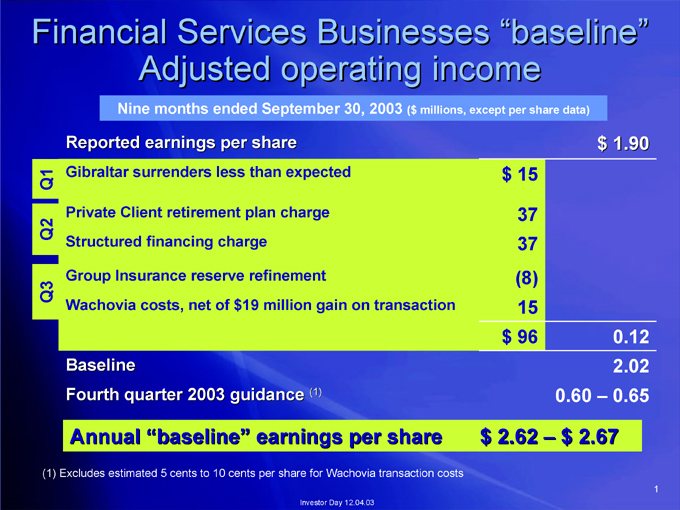
1 $ 1.90 0.12 2.02 0.65 0.60 – $ 2.67 ($ millions, except per share data) $ 15 37 37 (8) 15 $ 96 $ 2.62 – Adjusted operating income Nine months ended September 30, 2003 (1) Annual “baseline” earnings per share Investor Day 12.04.03 Reported earnings per share Gibraltar surrenders less than expected Private Client retirement plan charge Structured financing charge Group Insurance reserve refinement Wachovia costs, net of $19 million gain on transaction Baseline Fourth quarter 2003 guidance (1) Excludes estimated 5 cents to 10 cents per share for Wachovia transaction costs Financial Services Businesses “baseline” Q1 Q2 Q3
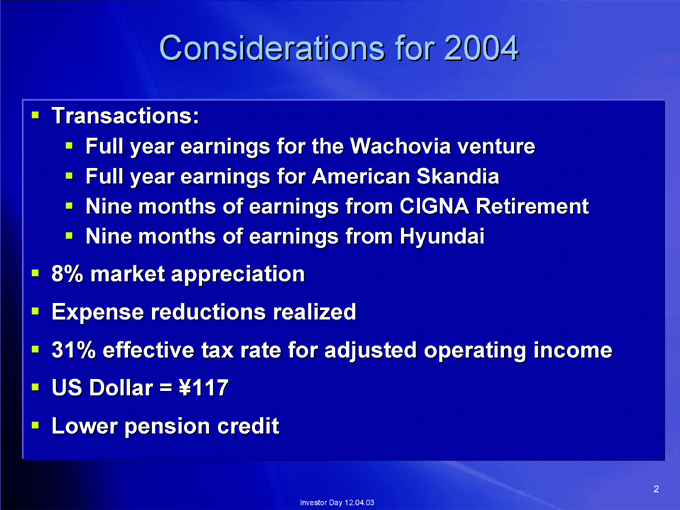
2 Considerations for 2004 Full year earnings for the Wachovia venture Full year earnings for American Skandia Nine months of earnings from CIGNA Retirement Nine months of earnings from Hyundai Investor Day 12.04.03 Transactions: 8% market appreciation Expense reductions realized 31% effective tax rate for adjusted operating income US Dollar = ¥117 Lower pension credit
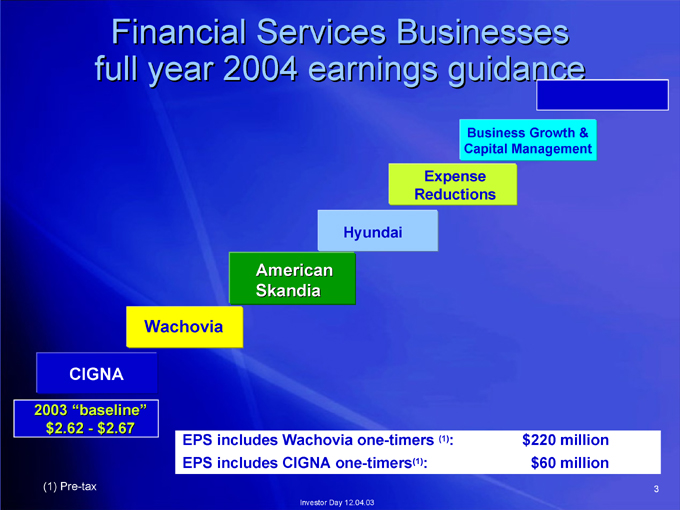
3 Business Growth & Capital Management $220 million $60 million : Expense (1) Reductions : (1) Hyundai Investor Day 12.04.03 American Skandia EPS includes Wachovia one-timers EPS includes CIGNA one-timers Financial Services Businesses Wachovia full year 2004 earnings guidance CIGNA $2.67 2003 “baseline” $2.62—(1) Pre-tax