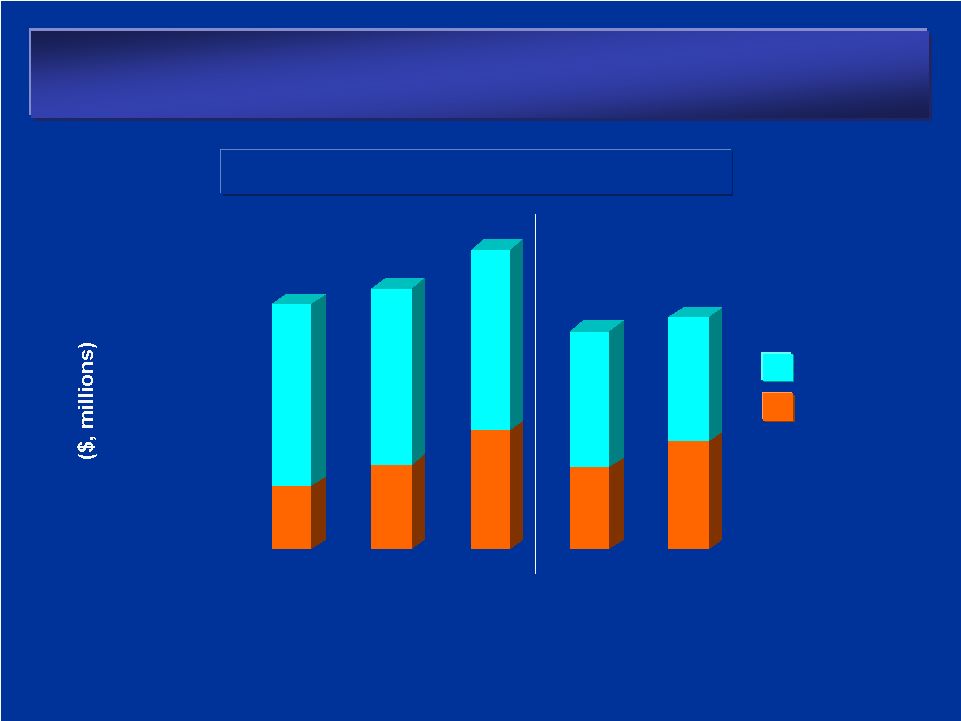
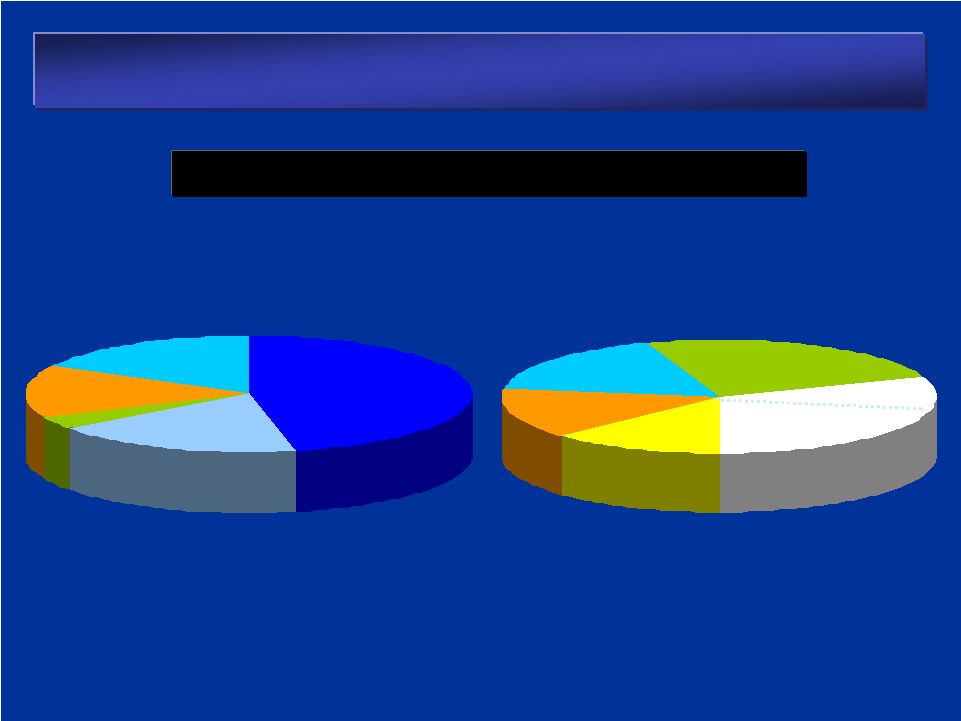
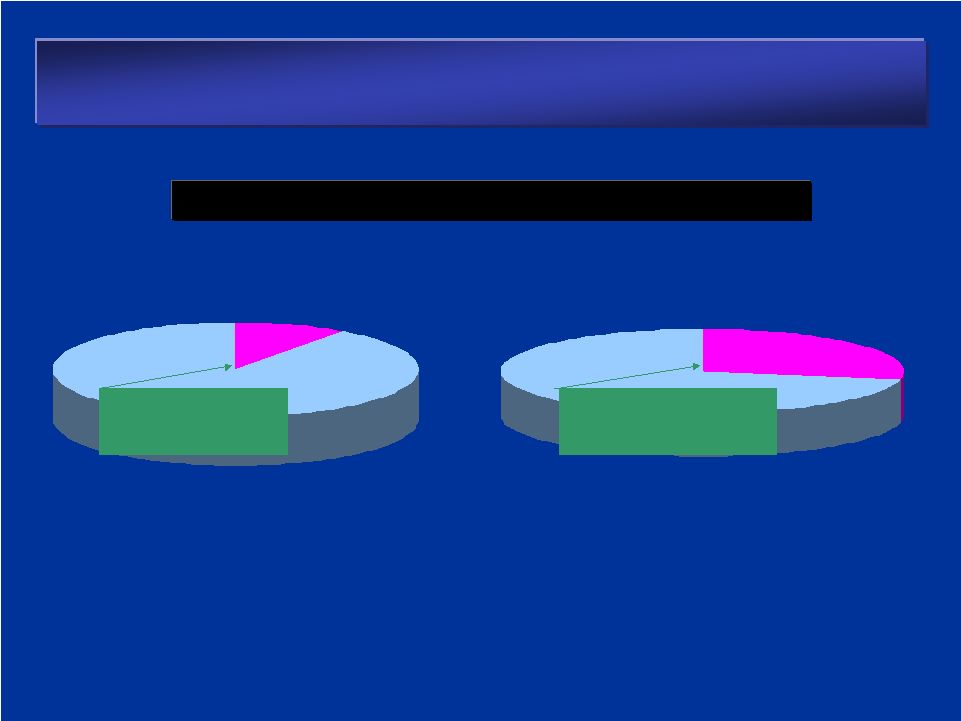
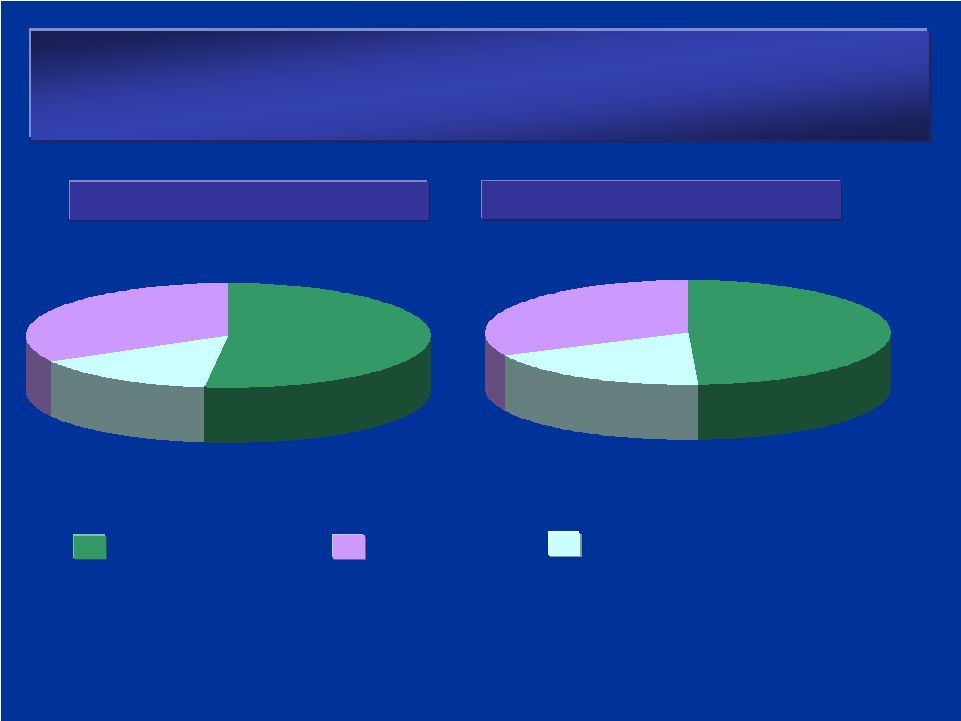
Reconciliation between adjusted operating income Reconciliation between adjusted operating income and the comparable GAAP measure and the comparable GAAP measure Prudential Financial, Inc. FINANCIAL HIGHLIGHTS (in millions, except per share data) Nine months ended 2002 2003 2004 Sept 30, 2005 Financial Services Businesses: Pre-tax adjusted operating income by division: Insurance Division 545 $ 788 $ 991 $ 862 $ Investment Division 282 289 355 711 International Insurance and Investments Division 757 809 1,003 1,042 Corporate and other operations 156 88 158 123 Total pre-tax adjusted operating income 1,740 1,974 2,507 2,738 Income taxes, applicable to adjusted operating income 585 645 676 830 Financial Services Businesses after-tax adjusted operating income 1,155 1,329 1,831 1,908 Items excluded from adjusted operating income: Realized investment gains (losses), net, and related charges and adjustments (866) (199) 24 565 Investment gains (losses) on trading account assets supporting insurance liabilities, net - - (43) (34) - - (11) (17) Sales practices remedies and costs (20) - - - Divested businesses (9) (162) (24) (5) Total items excluded from adjusted operating income, before income taxes (895) (361) (54) 509 Income taxes not applicable to adjusted operating income (498) (114) (54) (484) Total items excluded from adjusted operating income, after income taxes (397) (247) - 993 Income from continuing operations (after-tax) of Financial Services Businesses before extraordinary gain on acquisition and cumulative effect of accounting change 758 1,082 1,831 2,901 Loss from discontinued operations, net of taxes (79) (57) (99) (59) Extraordinary gain on acquisition, net of taxes - - 21 - Cumulative effect of accounting change, net of taxes - - (79) - Net income of Financial Services Businesses 679 1,025 1,674 2,842 Earnings per share of Common Stock (diluted): Financial Services Businesses after-tax adjusted operating income 2.07 $ 2.53 $ 3.61 $ 3.76 $ Items excluded from adjusted operating income: Realized investment gains (losses), net, and related charges and adjustments (1.50) (0.36) 0.05 1.07 Investment gains (losses) on trading account assets supporting insurance liabilities, net - - (0.08) (0.06) - - (0.02) (0.03) Sales practices remedies and costs (0.03) - - - Divested businesses (0.02) (0.30) (0.05) (0.01) Total items excluded from adjusted operating income, before income taxes (1.55) (0.66) (0.10) 0.97 Income taxes, not applicable to adjusted operating income (0.87) (0.21) (0.10) (0.92) Total items excluded from adjusted operating income, after income taxes (0.68) (0.45) - 1.89 Income from continuing operations (after-tax) of Financial Services Businesses before extraordinary gain on acquisition and cumulative effect of accounting change 1.39 2.08 3.61 5.65 Loss from discontinued operations, net of taxes (0.14) (0.10) (0.19) (0.11) Extraordinary gain on acquisition, net of taxes - - 0.04 - Cumulative effect of accounting change, net of taxes - - (0.15) - Net income of Financial Services Businesses 1.25 1.98 3.31 5.54 Weighted average number of outstanding Common shares (diluted basis) 578.0 548.4 531.2 524.5 Reconciliation to Consolidated Net Income of Prudential Financial, Inc: Net income of Financial Services Businesses (above) 679 $ 1,025 $ 1,674 $ 2,842 $ Net income of Closed Block Business (485) 239 582 334 Consolidated net income 194 1,264 2,256 3,176 Direct equity adjustments for earnings per share calculations 43 $ 60 $ 84 $ 63 $ Year ended December 31, Change in experience-rated contractholder liabilities due to asset value changes Change in experience-rated contractholder liabilities due to asset value changes | 


