
Prudential Financial, Inc. Tokyo Investor Day September 15, 2016 Exhibit 99.1

Mark Finkelstein Senior Vice President Investor Relations Prudential Financial, Inc. Tokyo Investor Day
Forward-Looking Statements and Non-GAAP Measure Certain of the statements included in this presentation constitute forward-looking statements within the meaning of the U. S. Private Securities Litigation Reform Act of 1995. Words such as “expects,” “believes,” “anticipates,” “includes,” “plans,” “assumes,” “estimates,” “projects,” “intends,” “should,” “will,” “shall,” or variations of such words are generally part of forward-looking statements. Forward-looking statements are made based on management’s current expectations and beliefs concerning future developments and their potential effects upon Prudential Financial, Inc. and its subsidiaries. There can be no assurance that future developments affecting Prudential Financial, Inc. and its subsidiaries will be those anticipated by management. These forward-looking statements are not a guarantee of future performance and involve risks and uncertainties. Certain important factors that could cause actual results to differ, possibly materially, from expectations or estimates reflected in such forward-looking statements can be found in the “Risk Factors” section included in Prudential Financial, Inc.’s Annual Report on Form 10-K for the year ended December 31, 2015. Prudential Financial, Inc. does not intend, and is under no obligation, to update any particular forward-looking statement included in this presentation. This presentation also includes references to “adjusted operating income” and return on equity, which is based on adjusted operating income. Adjusted operating income is a measure of performance that is not calculated based on accounting principles generally accepted in the United States of America (GAAP). For additional information about adjusted operating income and the comparable GAAP measure, including a reconciliation between the two, please refer to our Annual Reports on Form 10-K and Quarterly Reports on Form 10-Q, which are available on our Web site at www.investor.prudential.com. A reconciliation is also included as part of this presentation. In this presentation annualized new business premiums may be presented on a constant currency basis. For historical annualized new business premiums, refer to the foregoing reports. _______________________________________________________________________________ Prudential Financial, Inc. of the United States is not affiliated with Prudential PLC which is headquartered in the United Kingdom.
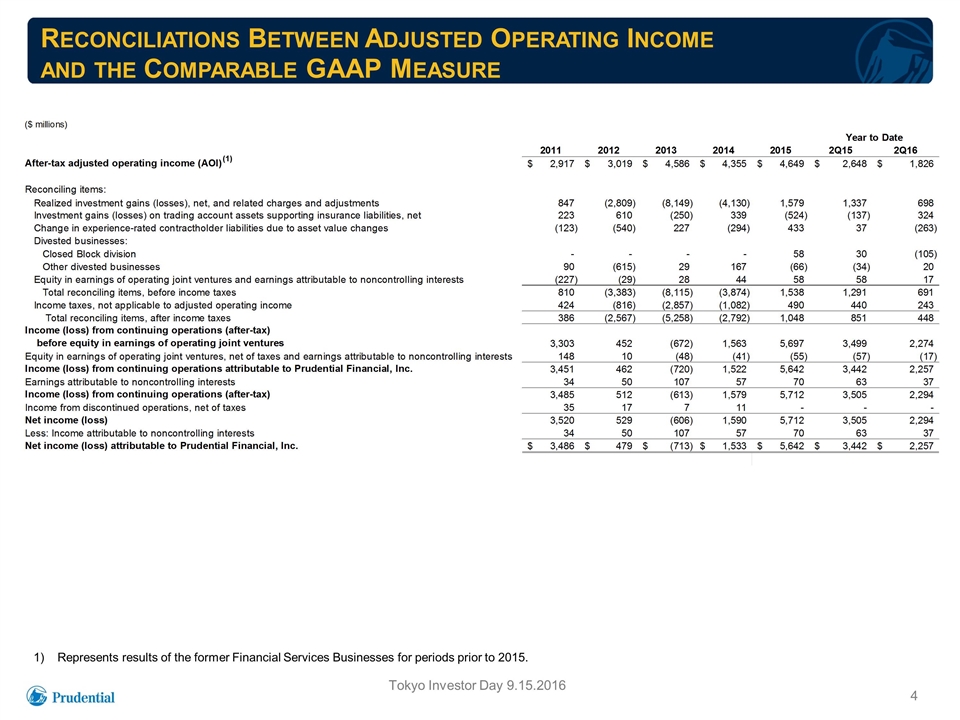
Reconciliations Between Adjusted Operating Income and the Comparable GAAP Measure (1) Represents results of the former Financial Services Businesses for periods prior to 2015.
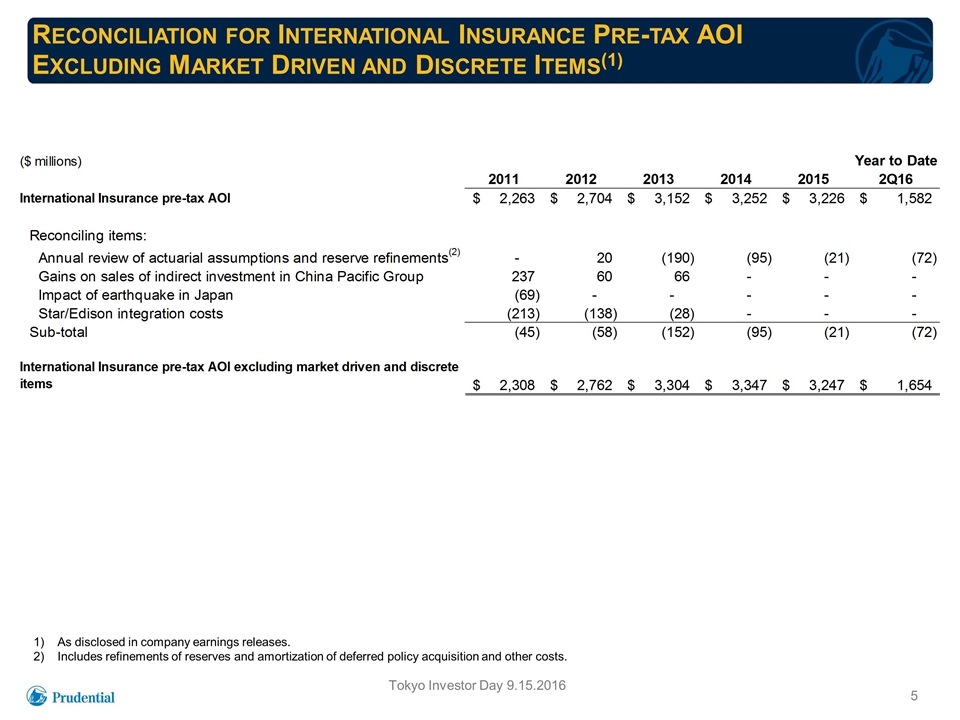
Reconciliation for International Insurance Pre-tax AOI Excluding Market Driven and Discrete Items(1) As disclosed in company earnings releases. Includes refinements of reserves and amortization of deferred policy acquisition and other costs.

Charles F. Lowrey Executive Vice President and Chief Operating Officer International Businesses Prudential Financial, Inc. 2016 Tokyo Investor Day
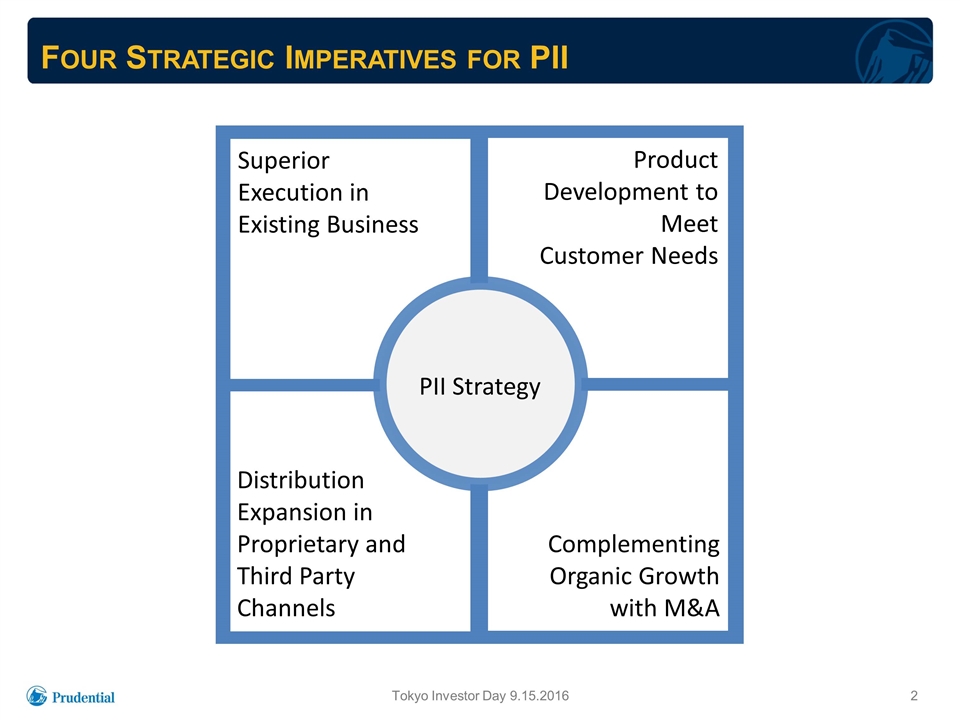
Four Strategic Imperatives for PII Superior Execution in Existing Business Product Development to Meet Customer Needs Distribution Expansion in Proprietary and Third Party Channels Complementing Organic Growth with M&A PII Strategy Tokyo Investor Day 9.15.2016
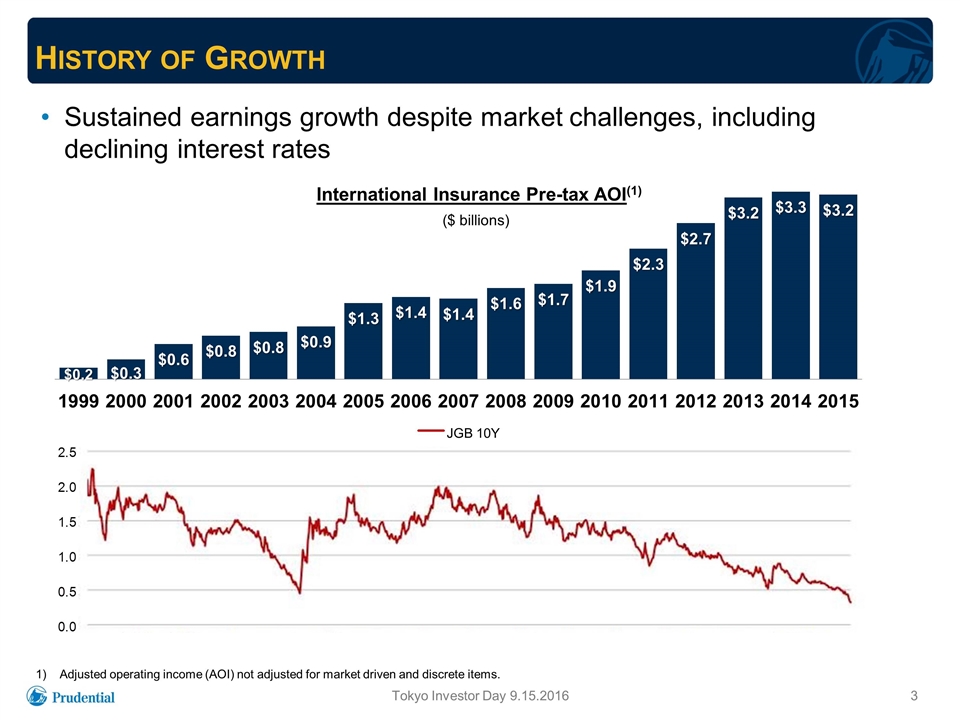
History of Growth Tokyo Investor Day 9.15.2016 Adjusted operating income (AOI) not adjusted for market driven and discrete items. Sustained earnings growth despite market challenges, including declining interest rates International Insurance Pre-tax AOI(1) ($ billions) JGB 10Y
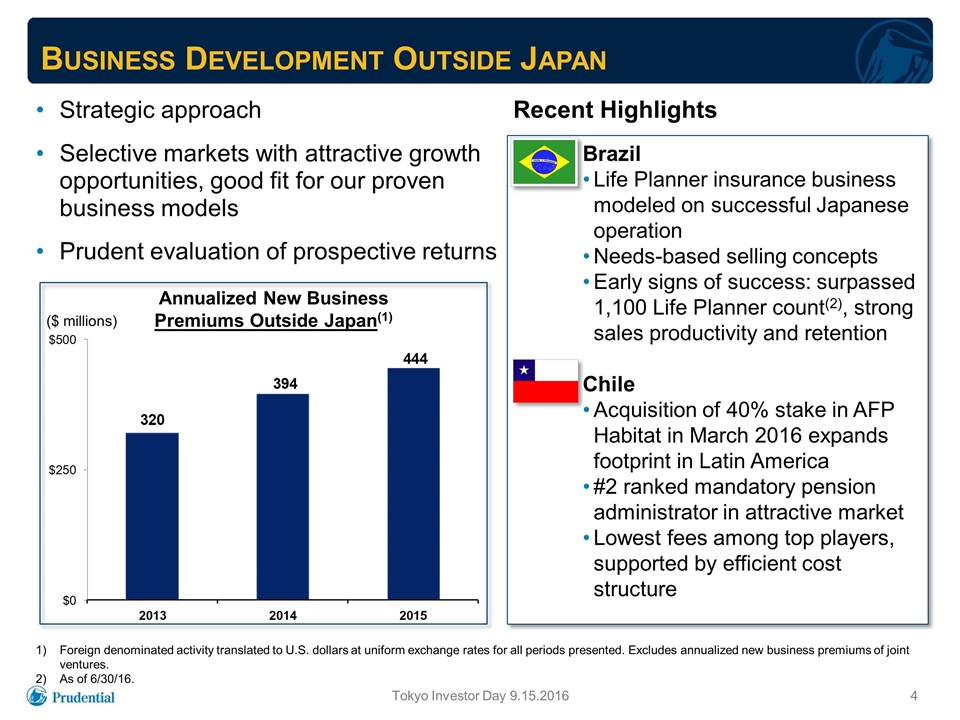
Business Development Outside Japan Strategic approach Selective markets with attractive growth opportunities, good fit for our proven business models Prudent evaluation of prospective returns Tokyo Investor Day 9.15.2016 Foreign denominated activity translated to U.S. dollars at uniform exchange rates for all periods presented. Excludes annualized new business premiums of joint ventures. As of 6/30/16. Recent Highlights Brazil Life Planner insurance business modeled on successful Japanese operation Needs-based selling concepts Early signs of success: surpassed 1,100 Life Planner count(2), strong sales productivity and retention Chile Acquisition of 40% stake in AFP Habitat in March 2016 expands footprint in Latin America #2 ranked mandatory pension administrator in attractive market Lowest fees among top players, supported by efficient cost structure Annualized New Business Premiums Outside Japan(1) ($ millions)
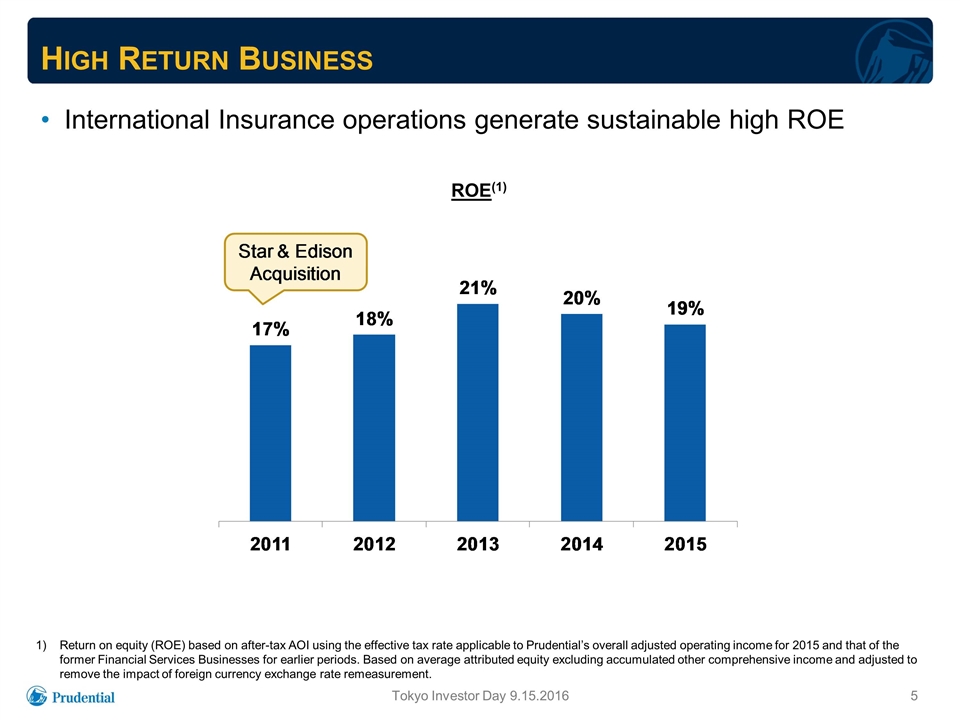
High Return Business International Insurance operations generate sustainable high ROE Tokyo Investor Day 9.15.2016 Return on equity (ROE) based on after-tax AOI using the effective tax rate applicable to Prudential’s overall adjusted operating income for 2015 and that of the former Financial Services Businesses for earlier periods. Based on average attributed equity excluding accumulated other comprehensive income and adjusted to remove the impact of foreign currency exchange rate remeasurement. ROE(1)
Japan Remains a Highly Attractive Market for Prudential High returns driven by mortality and expense margins History of growth across economic landscapes through distribution expansion, selective acquisitions and operating efficiencies Strong cash flow from Japanese operations; historically redeployed excess capital of more than 60% of after-tax AOI since 2009(1) Positioned to navigate increasingly challenging environment Significant product and distribution actions, including product discontinuations, pricing adjustments and commission reductions Impact of sustained low interest rates on returns emerges over a multi-year time frame Opportunities to mitigate interest rate impacts through extending asset durations and leveraging PGIM’s sourcing capabilities Tokyo Investor Day 9.15.2016 Through 2015.
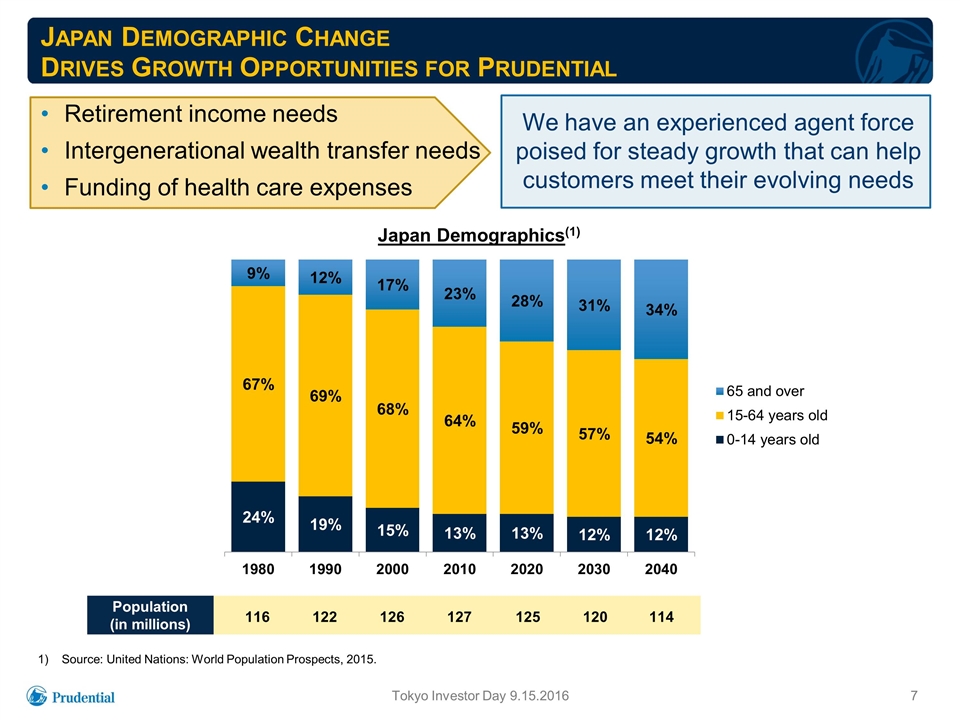
Japan Demographics(1) Japan Demographic Change Drives Growth Opportunities for Prudential Source: United Nations: World Population Prospects, 2015. 24% 19% 15% 12% 10% 10% Retirement income needs Intergenerational wealth transfer needs Funding of health care expenses We have an experienced agent force poised for steady growth that can help customers meet their evolving needs 13% 116 Population (in millions) 122 126 127 125 120 114 Tokyo Investor Day 9.15.2016
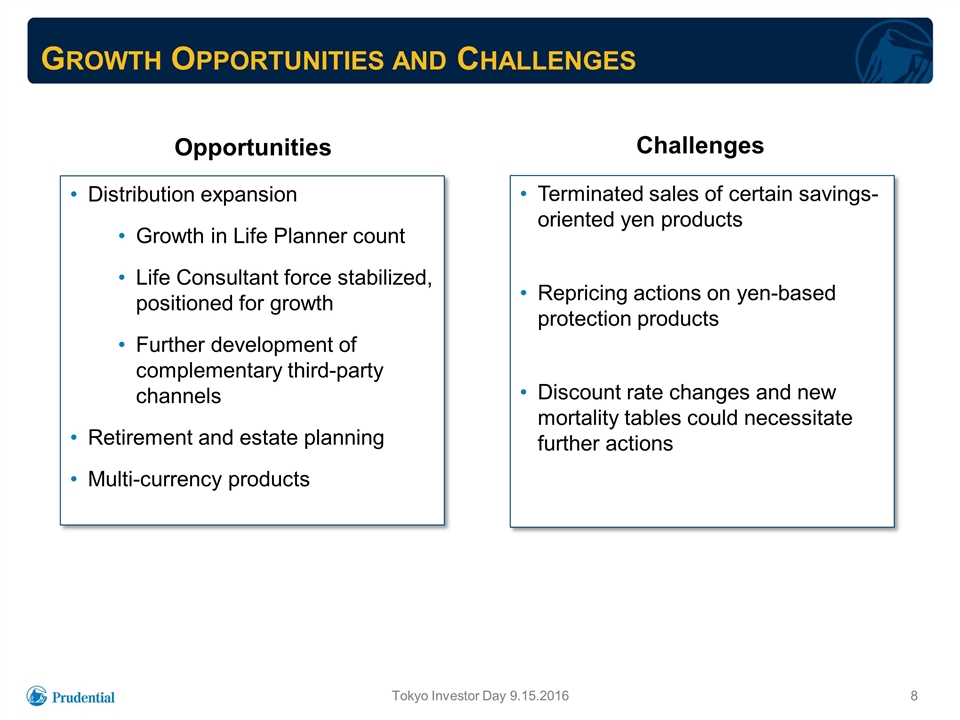
Growth Opportunities and Challenges Tokyo Investor Day 9.15.2016 Opportunities Distribution expansion Growth in Life Planner count Life Consultant force stabilized, positioned for growth Further development of complementary third-party channels Retirement and estate planning Multi-currency products Challenges Terminated sales of certain savings-oriented yen products Repricing actions on yen-based protection products Discount rate changes and new mortality tables could necessitate further actions

Mitsuo Kurashige Chief Executive Officer Japan Life Insurance Operations Japanese Insurance Operations
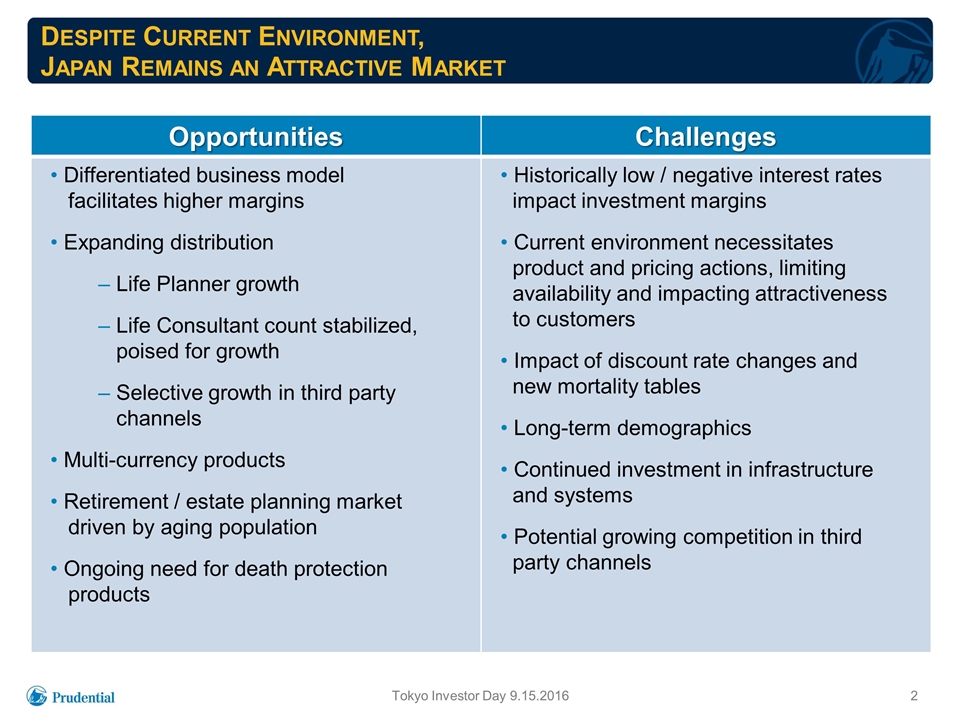
Despite Current Environment, Japan Remains an Attractive Market Opportunities Challenges Differentiated business model facilitates higher margins Expanding distribution Life Planner growth Life Consultant count stabilized, poised for growth Selective growth in third party channels Multi-currency products Retirement / estate planning market driven by aging population Ongoing need for death protection products Historically low / negative interest rates impact investment margins Current environment necessitates product and pricing actions, limiting availability and impacting attractiveness to customers Impact of discount rate changes and new mortality tables Long-term demographics Continued investment in infrastructure and systems Potential growing competition in third party channels Tokyo Investor Day 9.15.2016

Product Actions in 2016 Reduced guaranteed interest rates and commissions on single premium yen products Subsequently discontinued sales of all general account single premium yen products Reduced crediting rates on yen-based advanced premiums, suspended acceptance of advanced premiums on some products Expanded U.S. dollar product portfolio including: Gibraltar low cash value USD whole life product emphasizing death protection coverage Expansion of sales of 15 year USD Multi-Currency Whole Life product to Gibraltar New USD products for both Gibraltar and POJ in development with release expected in late 2016 and early 2017 Tokyo Investor Day 9.15.2016
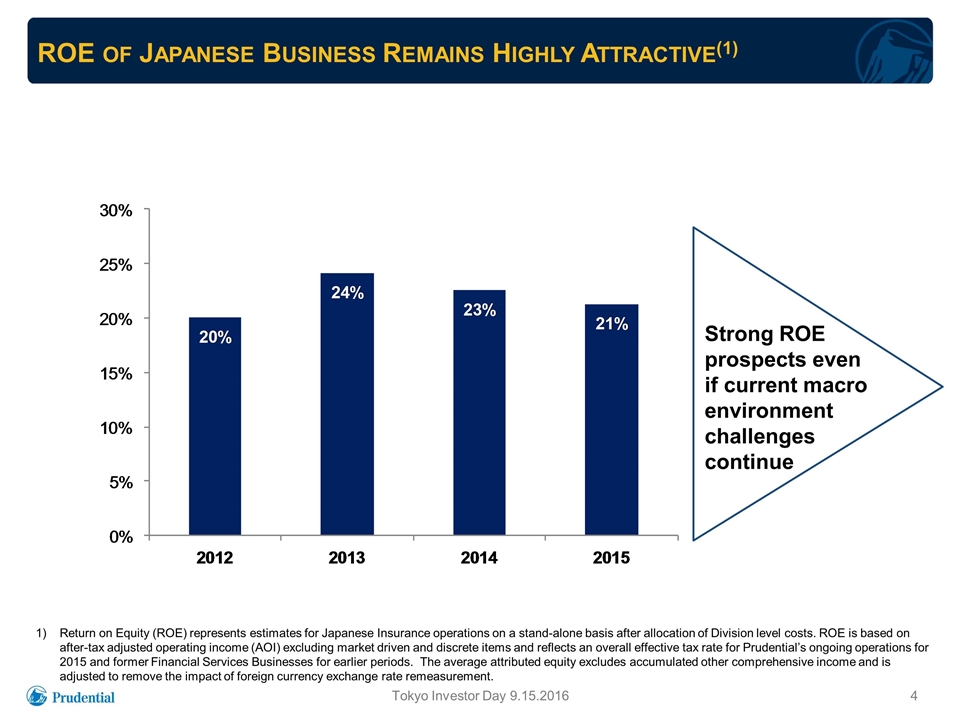
ROE of Japanese Business Remains Highly Attractive(1) Tokyo Investor Day 9.15.2016 Return on Equity (ROE) represents estimates for Japanese Insurance operations on a stand-alone basis after allocation of Division level costs. ROE is based on after-tax adjusted operating income (AOI) excluding market driven and discrete items and reflects an overall effective tax rate for Prudential’s ongoing operations for 2015 and former Financial Services Businesses for earlier periods. The average attributed equity excludes accumulated other comprehensive income and is adjusted to remove the impact of foreign currency exchange rate remeasurement. Strong ROE prospects even if current macro environment challenges continue
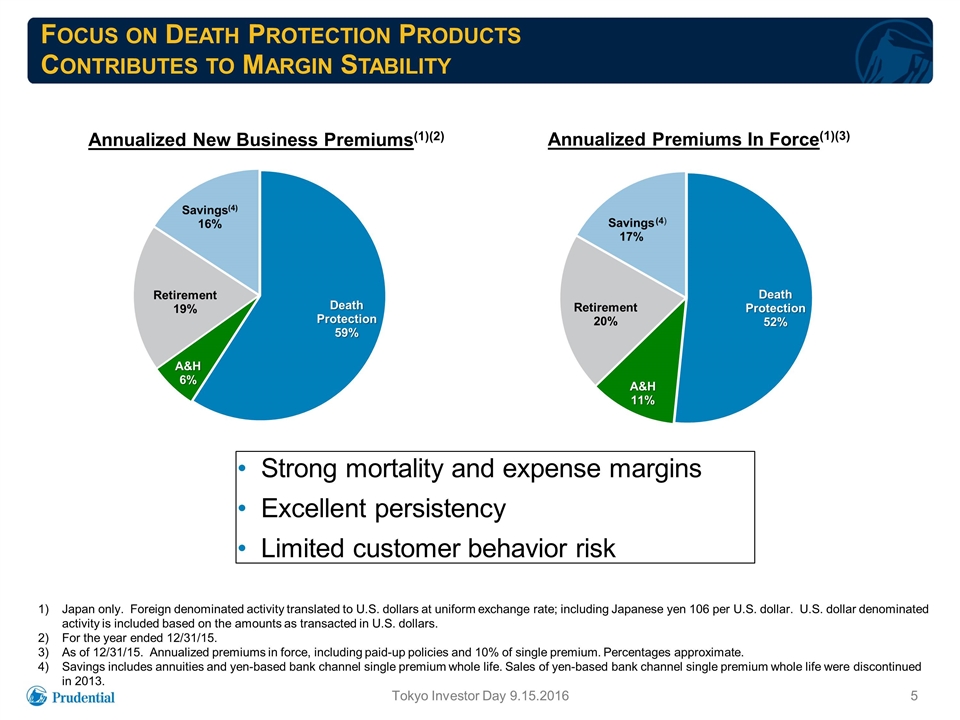
Focus on Death Protection Products Contributes to Margin Stability Tokyo Investor Day 9.15.2016 Japan only. Foreign denominated activity translated to U.S. dollars at uniform exchange rate; including Japanese yen 106 per U.S. dollar. U.S. dollar denominated activity is included based on the amounts as transacted in U.S. dollars. For the year ended 12/31/15. As of 12/31/15. Annualized premiums in force, including paid-up policies and 10% of single premium. Percentages approximate. Savings includes annuities and yen-based bank channel single premium whole life. Sales of yen-based bank channel single premium whole life were discontinued in 2013. Annualized Premiums In Force(1)(3) Annualized New Business Premiums(1)(2) Strong mortality and expense margins Excellent persistency Limited customer behavior risk
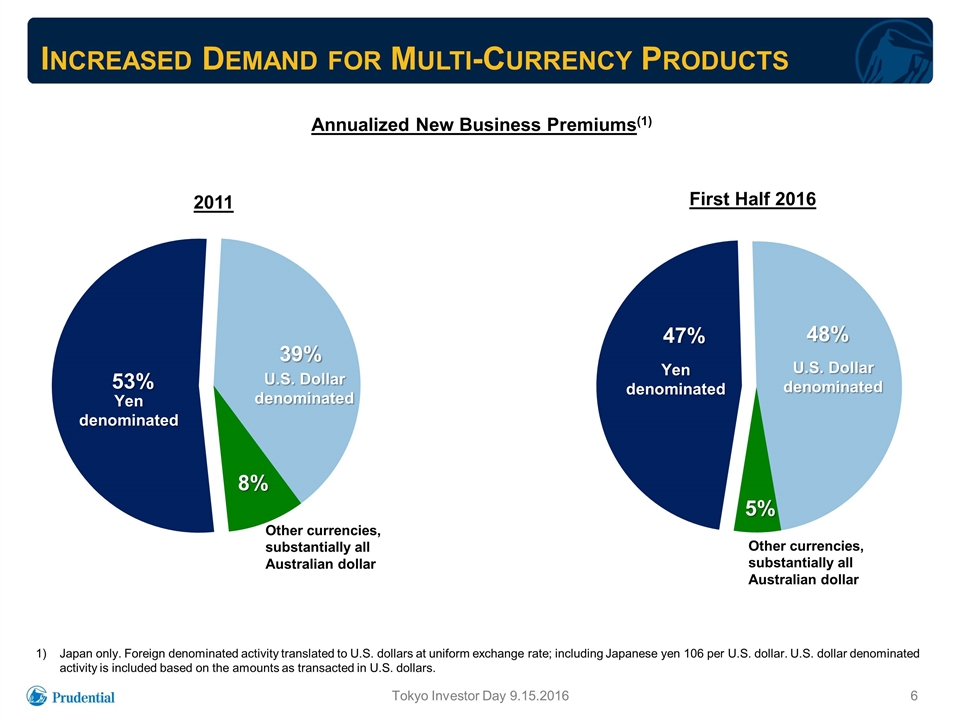
Increased Demand for Multi-Currency Products Tokyo Investor Day 9.15.2016 Japan only. Foreign denominated activity translated to U.S. dollars at uniform exchange rate; including Japanese yen 106 per U.S. dollar. U.S. dollar denominated activity is included based on the amounts as transacted in U.S. dollars. Annualized New Business Premiums(1) 2011 First Half 2016
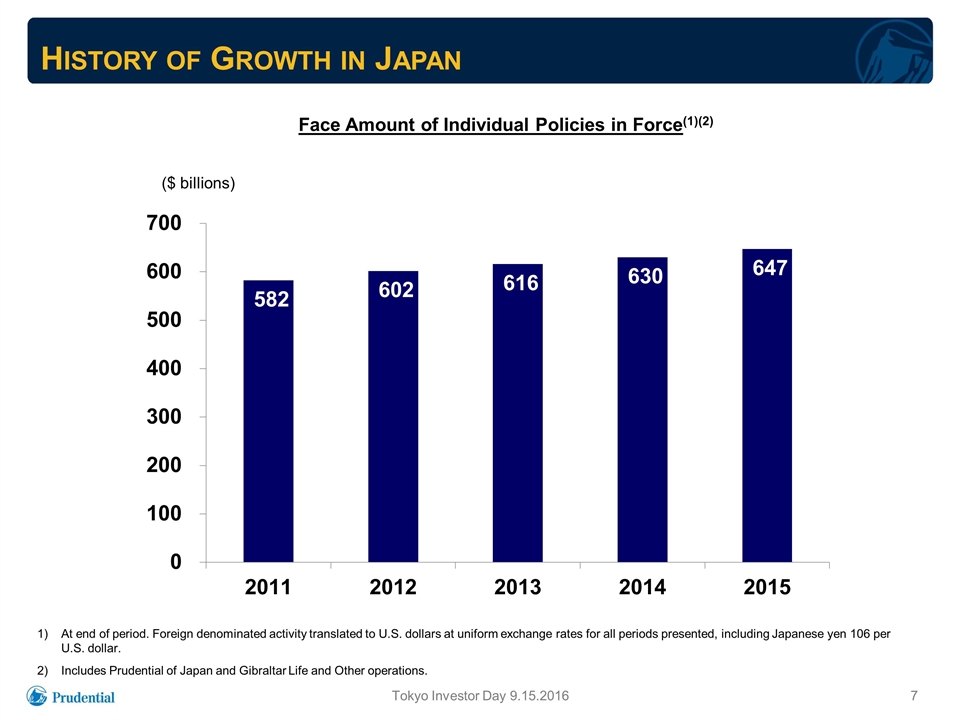
History of Growth in Japan Tokyo Investor Day 9.15.2016 Face Amount of Individual Policies in Force(1)(2) At end of period. Foreign denominated activity translated to U.S. dollars at uniform exchange rates for all periods presented, including Japanese yen 106 per U.S. dollar. Includes Prudential of Japan and Gibraltar Life and Other operations. ($ billions)
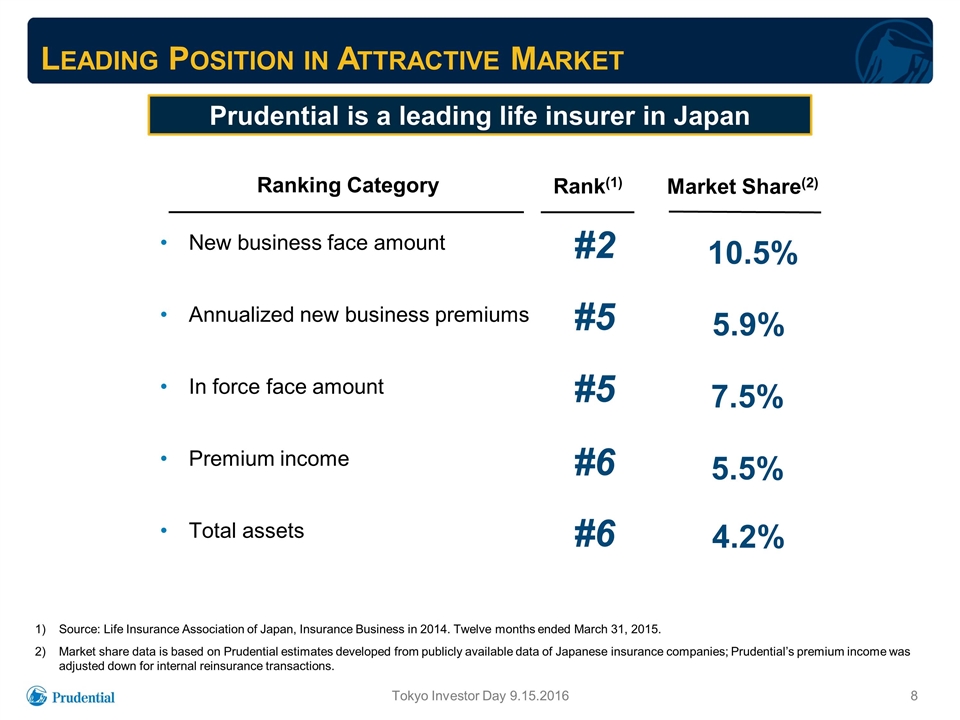
Leading Position in Attractive Market Source: Life Insurance Association of Japan, Insurance Business in 2014. Twelve months ended March 31, 2015. Market share data is based on Prudential estimates developed from publicly available data of Japanese insurance companies; Prudential’s premium income was adjusted down for internal reinsurance transactions. New business face amount Annualized new business premiums In force face amount Premium income Total assets Ranking Category Rank(1) Prudential is a leading life insurer in Japan 10.5% 5.9% 7.5% 5.5% 4.2% #2 #5 #5 #6 #6 Market Share(2) Tokyo Investor Day 9.15.2016
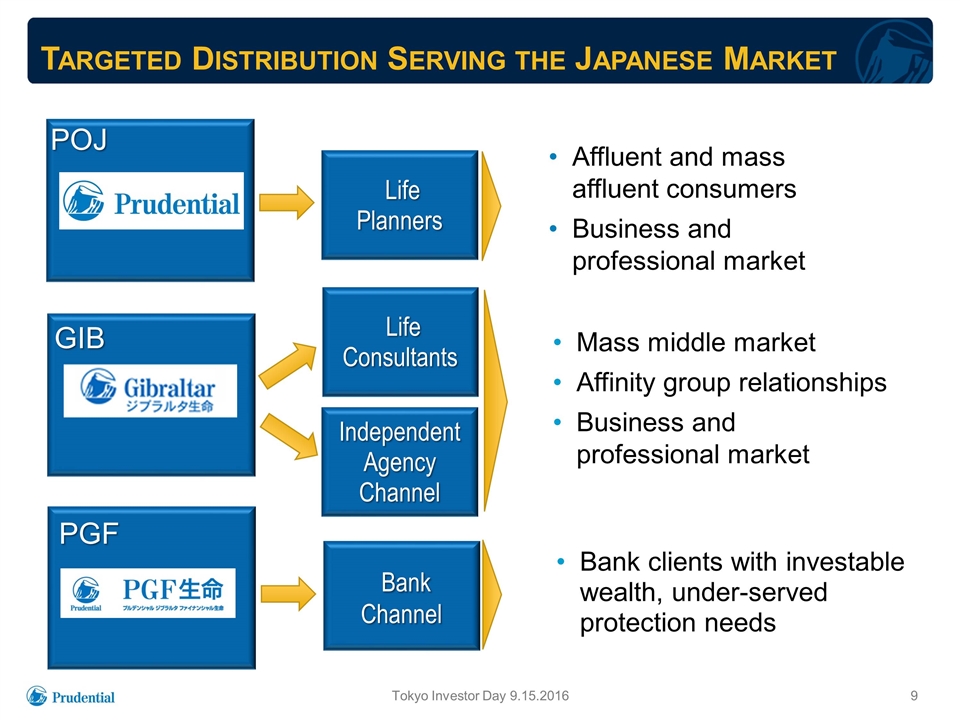
Targeted Distribution Serving the Japanese Market Affluent and mass affluent consumers Business and professional market Mass middle market Affinity group relationships Business and professional market Life Planners Life Consultants Bank Channel Independent Agency Channel Bank clients with investable wealth, under-served protection needs POJ GIB PGF Tokyo Investor Day 9.15.2016
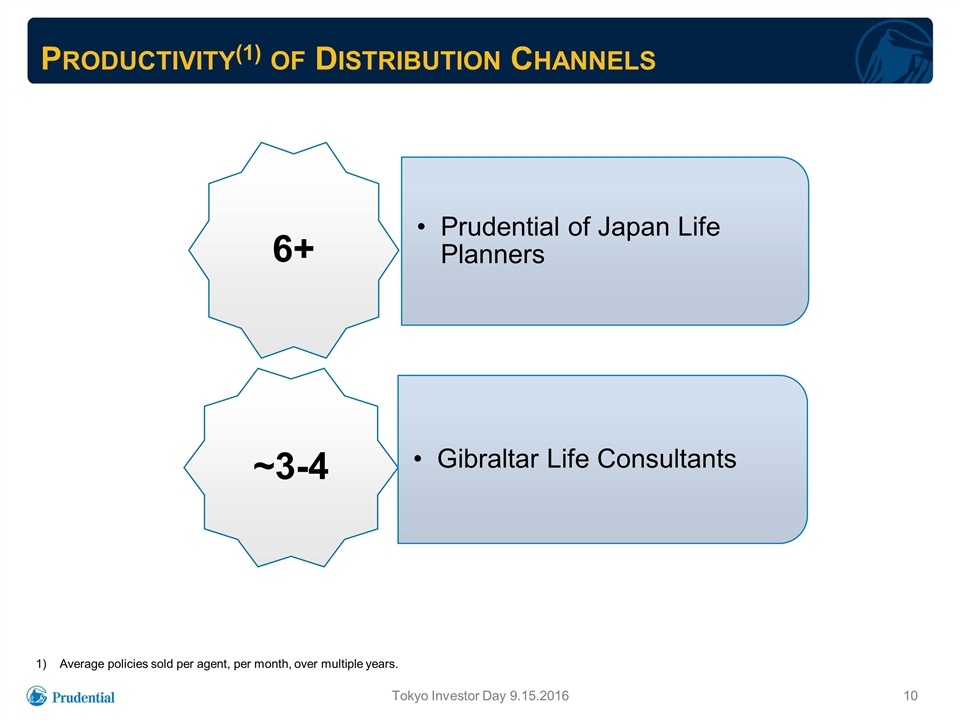
Productivity(1) of Distribution Channels Tokyo Investor Day 9.15.2016 Average policies sold per agent, per month, over multiple years. Prudential of Japan Life Planners ~3-4 Gibraltar Life Consultants 6+
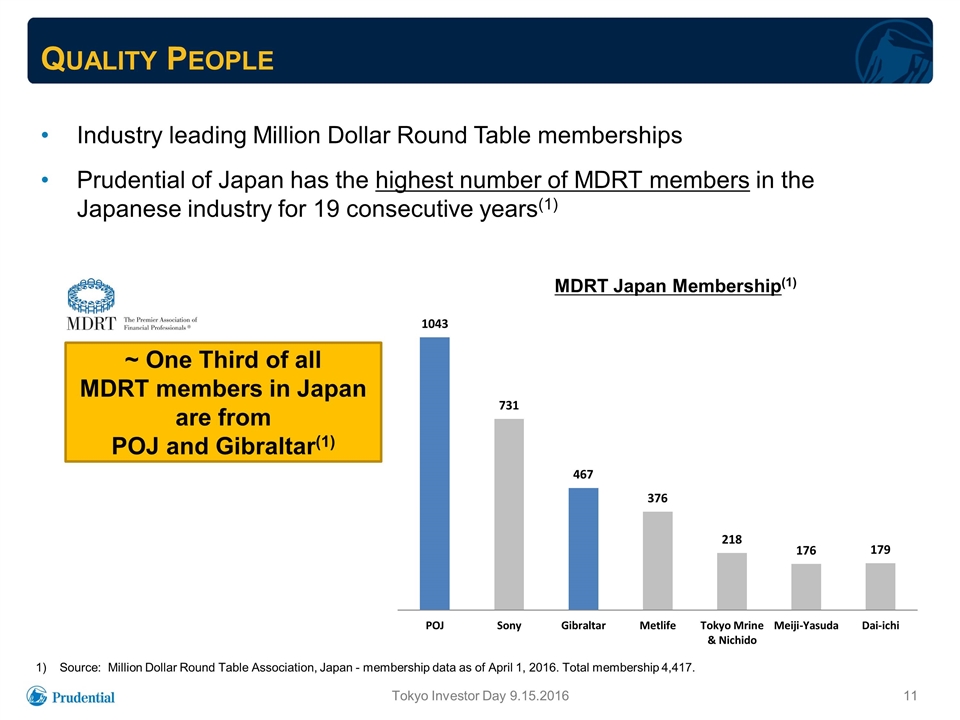
Quality People Source: Million Dollar Round Table Association, Japan - membership data as of April 1, 2016. Total membership 4,417. MDRT Japan Membership(1) ~ One Third of all MDRT members in Japan are from POJ and Gibraltar(1) Industry leading Million Dollar Round Table memberships Prudential of Japan has the highest number of MDRT members in the Japanese industry for 19 consecutive years(1) Tokyo Investor Day 9.15.2016
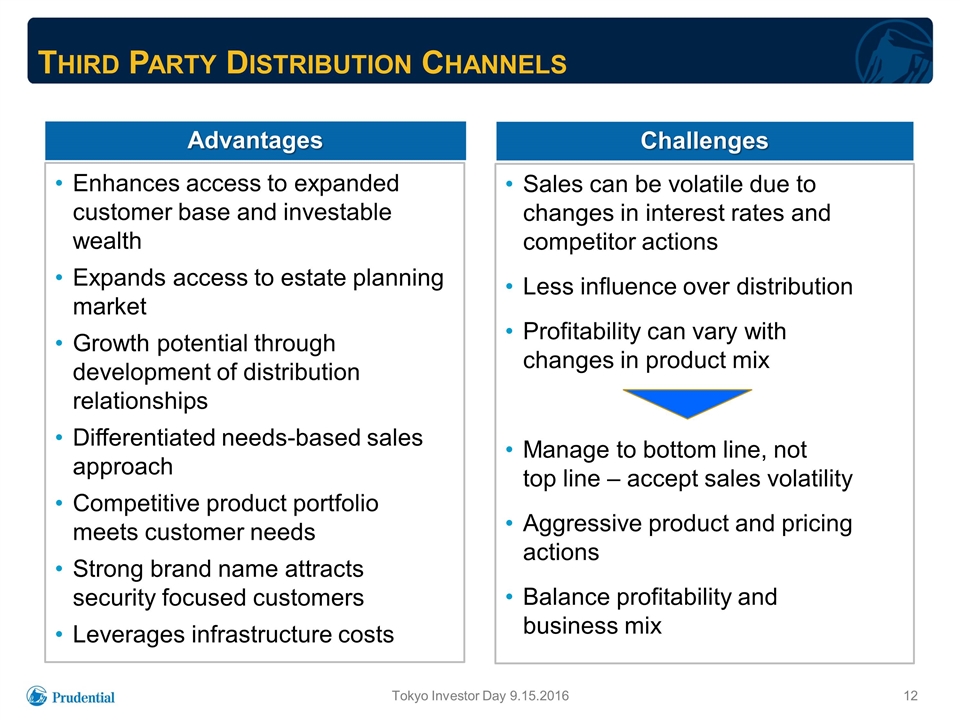
Sales can be volatile due to changes in interest rates and competitor actions Less influence over distribution Profitability can vary with changes in product mix Manage to bottom line, not top line – accept sales volatility Aggressive product and pricing actions Balance profitability and business mix Third Party Distribution Channels Enhances access to expanded customer base and investable wealth Expands access to estate planning market Growth potential through development of distribution relationships Differentiated needs-based sales approach Competitive product portfolio meets customer needs Strong brand name attracts security focused customers Leverages infrastructure costs Advantages Challenges Tokyo Investor Day 9.15.2016
Summary Adapting proactively to current market environment Strong margins sustainable with differentiated model and focus on sound asset/liability management Growth opportunities through expanding distribution, leveraging product capabilities, and lifetime customer relationships Tokyo Investor Day 9.15.2016

Prudential of Japan Shoichiro Ichitani President and Chief Executive Officer Prudential of Japan
Prudential of Japan Strong sales and in force growth over three decades Steady growth in Life Planner count driven by solid selective recruitment and strong retention Superior Life Planner productivity Focus on needs-based selling of death protection products, operating efficiencies, and effective asset/liability management produces strong persistency and differentiated margins Continuing growth opportunities Differentiated Business Model Drives Sustained Track Record of Success and Strong Prospects Tokyo Investor Day 9.15.2016
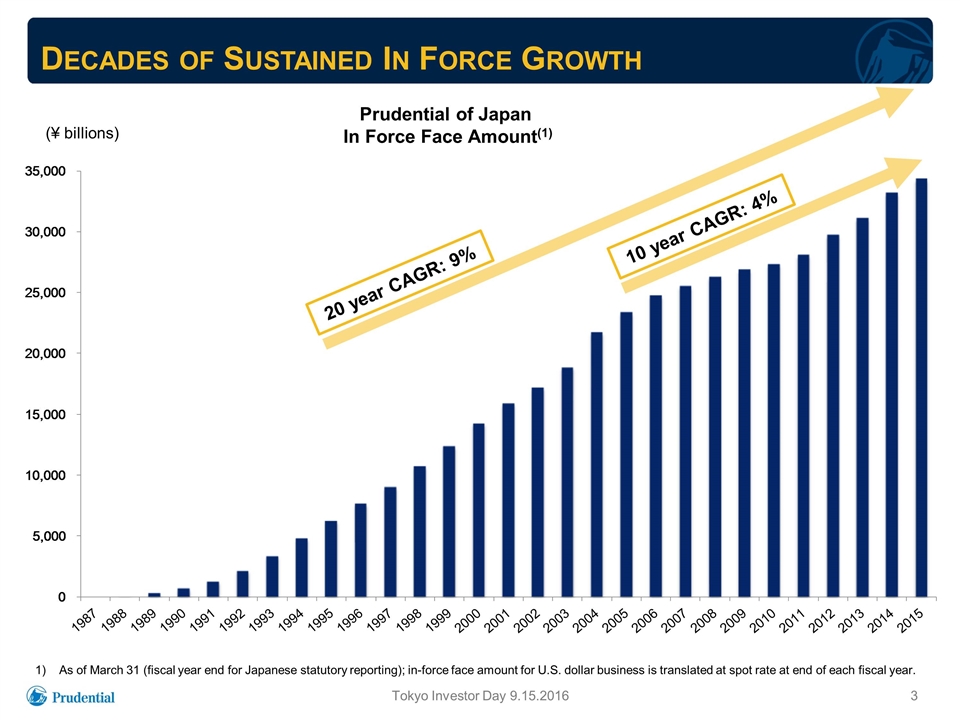
Decades of Sustained In Force Growth (¥ billions) As of March 31 (fiscal year end for Japanese statutory reporting); in-force face amount for U.S. dollar business is translated at spot rate at end of each fiscal year. Prudential of Japan In Force Face Amount(1) Tokyo Investor Day 9.15.2016 20 year CAGR: 9% 10 year CAGR: 4%
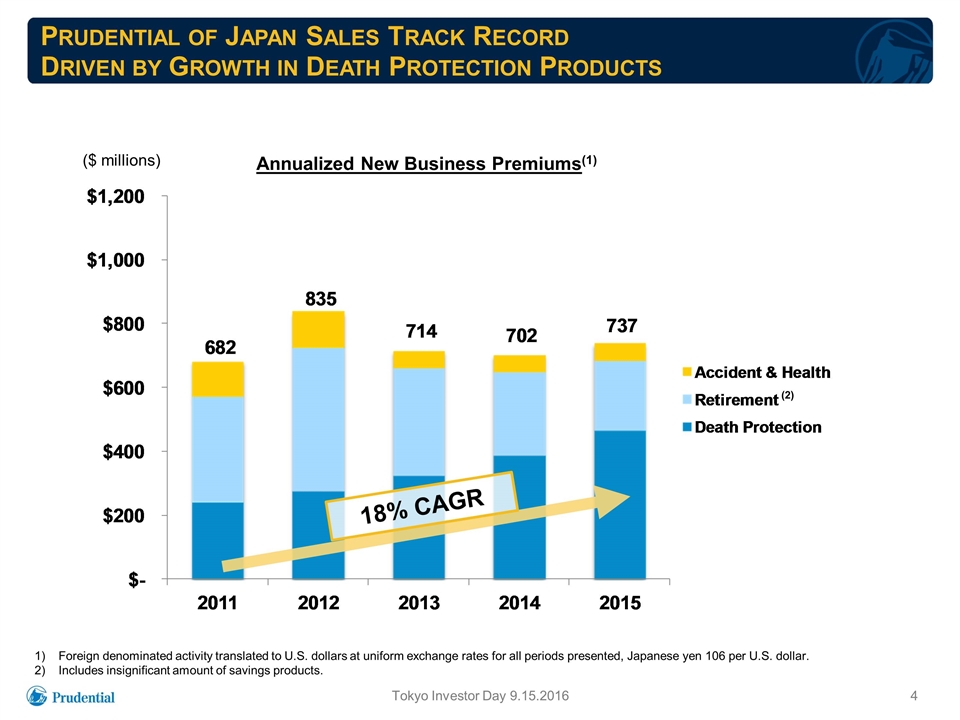
Prudential of Japan Sales Track Record Driven by Growth in Death Protection Products Foreign denominated activity translated to U.S. dollars at uniform exchange rates for all periods presented, Japanese yen 106 per U.S. dollar. Includes insignificant amount of savings products. Tokyo Investor Day 9.15.2016 Annualized New Business Premiums(1) ($ millions) 18% CAGR (2)
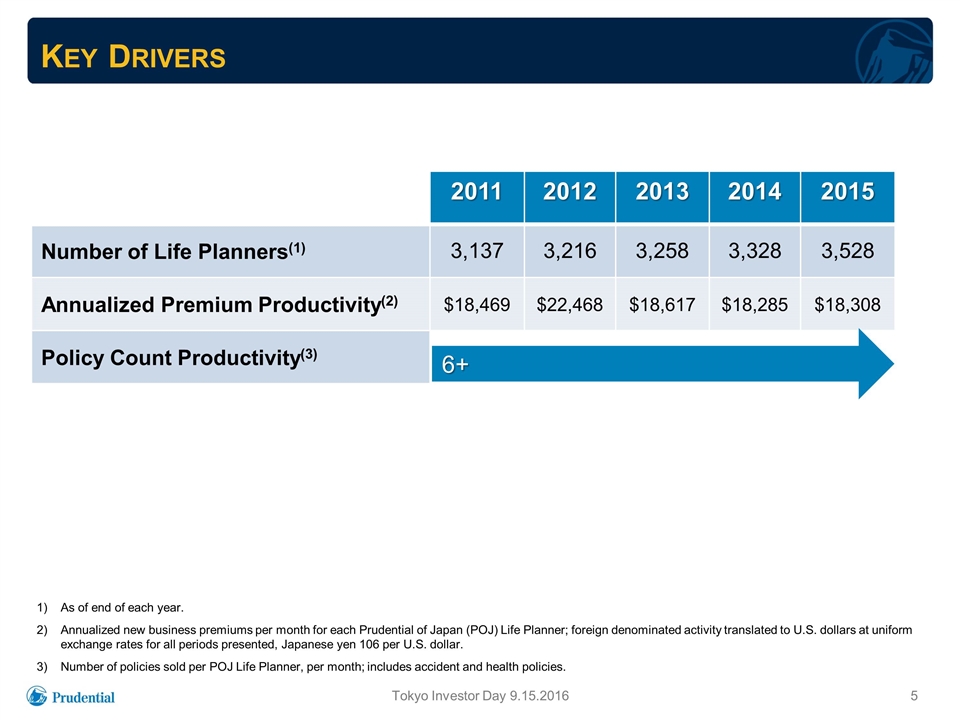
Key Drivers 2011 2012 2013 2014 2015 Number of Life Planners(1) 3,137 3,216 3,258 3,328 3,528 Annualized Premium Productivity(2) $18,469 $22,468 $18,617 $18,285 $18,308 Policy Count Productivity(3) As of end of each year. Annualized new business premiums per month for each Prudential of Japan (POJ) Life Planner; foreign denominated activity translated to U.S. dollars at uniform exchange rates for all periods presented, Japanese yen 106 per U.S. dollar. Number of policies sold per POJ Life Planner, per month; includes accident and health policies. Tokyo Investor Day 9.15.2016 6+

Steady Growth Across Markets Prudential of Japan Insurance Revenues(1)(2) Net premiums, policy charges and fee income; foreign denominated activity translated to U.S. dollars at uniform exchange rates for all periods presented, including Japanese yen 106 per U.S. dollar. Amounts for 2006 and 2005 are calculated based on estimated currency breakdowns. Tokyo Investor Day 9.15.2016 ($ billions) 8% CAGR
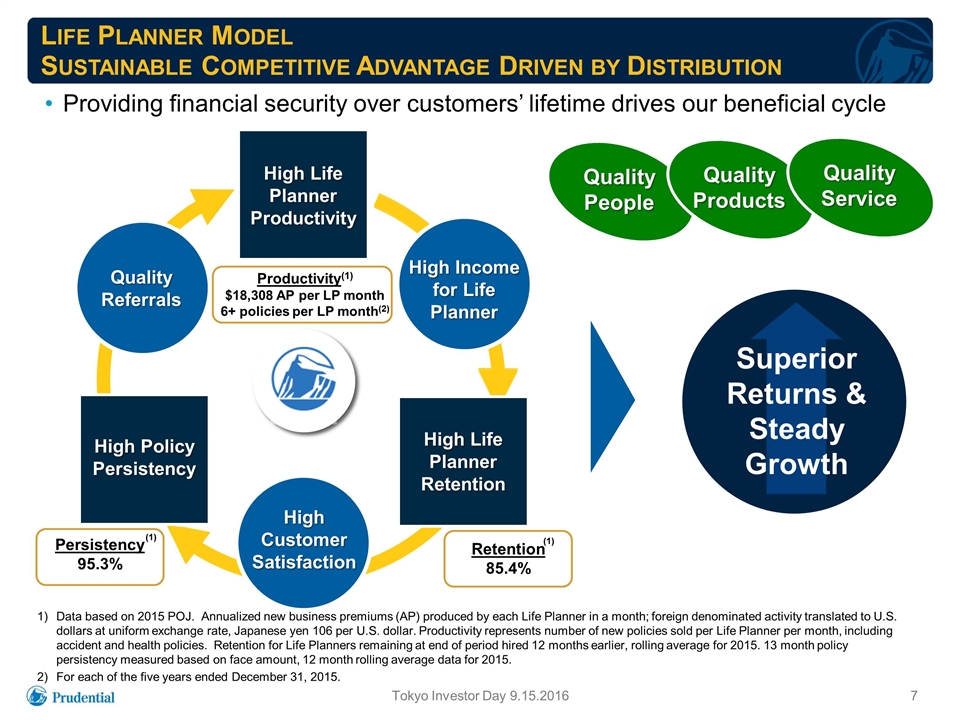
Life Planner Model Sustainable Competitive Advantage Driven by Distribution High Life Planner Retention High Life Planner Productivity High Policy Persistency Providing financial security over customers’ lifetime drives our beneficial cycle Data based on 2015 POJ. Annualized new business premiums (AP) produced by each Life Planner in a month; foreign denominated activity translated to U.S. dollars at uniform exchange rate, Japanese yen 106 per U.S. dollar. Productivity represents number of new policies sold per Life Planner per month, including accident and health policies. Retention for Life Planners remaining at end of period hired 12 months earlier, rolling average for 2015. 13 month policy persistency measured based on face amount, 12 month rolling average data for 2015. For each of the five years ended December 31, 2015. Superior Returns & Steady Growth Quality People Quality Products Quality Service High Life Planner Retention High Life Planner Productivity High Policy Persistency High Customer Satisfaction High Income for Life Planner Quality Referrals Productivity(1) $18,308 AP per LP month 6+ policies per LP month(2) Persistency 95.3% Retention 85.4% (1) (1) Tokyo Investor Day 9.15.2016
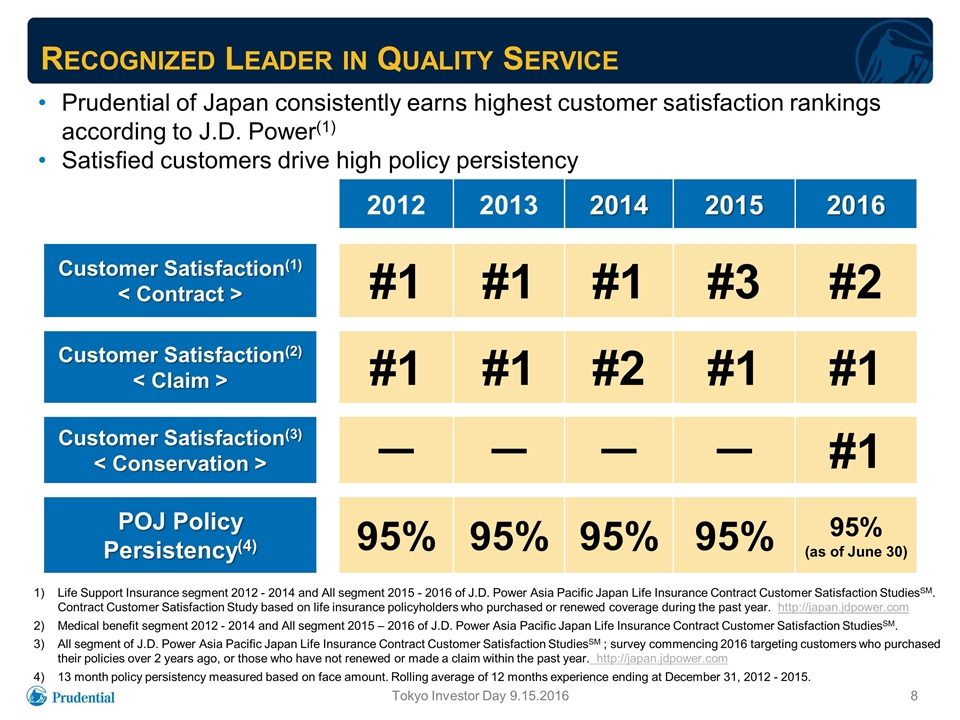
Recognized Leader in Quality Service Prudential of Japan consistently earns highest customer satisfaction rankings according to J.D. Power(1) Satisfied customers drive high policy persistency Life Support Insurance segment 2012 - 2014 and All segment 2015 - 2016 of J.D. Power Asia Pacific Japan Life Insurance Contract Customer Satisfaction StudiesSM. Contract Customer Satisfaction Study based on life insurance policyholders who purchased or renewed coverage during the past year. http://japan.jdpower.com Medical benefit segment 2012 - 2014 and All segment 2015 – 2016 of J.D. Power Asia Pacific Japan Life Insurance Contract Customer Satisfaction StudiesSM. All segment of J.D. Power Asia Pacific Japan Life Insurance Contract Customer Satisfaction StudiesSM ; survey commencing 2016 targeting customers who purchased their policies over 2 years ago, or those who have not renewed or made a claim within the past year. http://japan.jdpower.com 13 month policy persistency measured based on face amount. Rolling average of 12 months experience ending at December 31, 2012 - 2015. 2012 2013 2014 2015 2016 Customer Satisfaction(1) < Contract > #1 #1 #1 #3 #2 Customer Satisfaction(2) < Claim > #1 #1 #2 #1 #1 Customer Satisfaction(3) < Conservation > - - - - #1 POJ Policy Persistency(4) 95% 95% 95% 95% 95% (as of June 30) Tokyo Investor Day 9.15.2016
Continuing Growth Opportunities Continued growth in Life Planner count Solid, selective recruiting by growing sales manager force Highly attractive career for entrepreneurial professionals – approximately 3 of 100 applicants accepted High agent retention rates Lifetime relationships promote “Second Sales” Evolving needs as client moves through life cycle Life Planner offers age / status appropriate solutions as trusted adviser Retirement and estate planning opportunities Life Planners experienced in offering U.S. dollar products, with growing market demand; recurring premium emphasis Tokyo Investor Day 9.15.2016
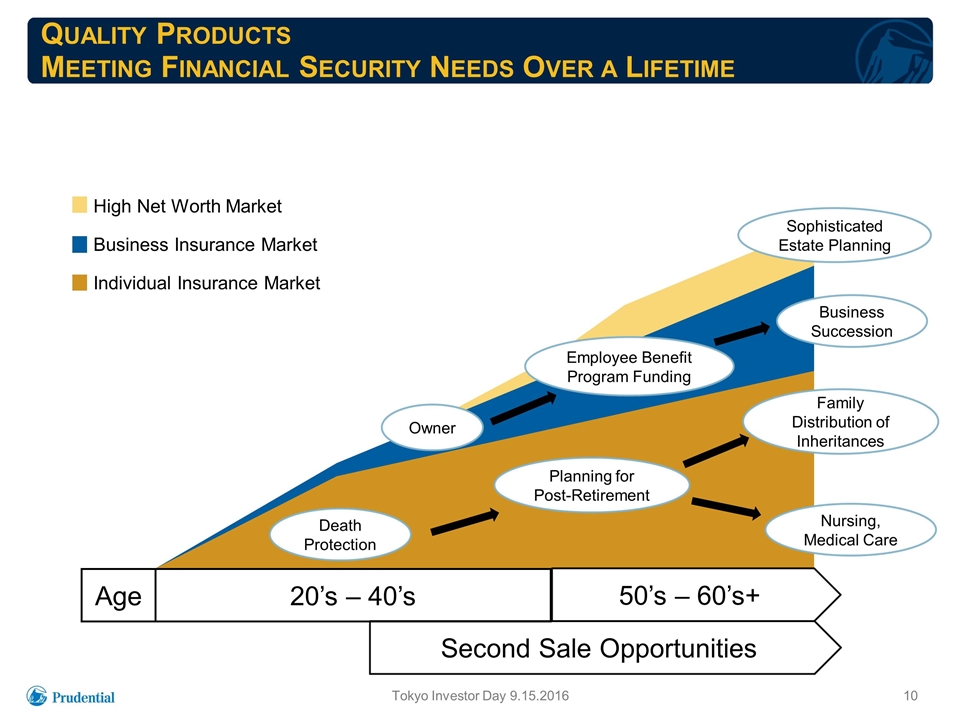
Quality Products Meeting Financial Security Needs Over a Lifetime Age High Net Worth Market Business Insurance Market Individual Insurance Market 20’s – 40’s 50’s – 60’s+ Death Protection Owner Planning for Post-Retirement Employee Benefit Program Funding Sophisticated Estate Planning Business Succession Family Distribution of Inheritances Nursing, Medical Care Tokyo Investor Day 9.15.2016 Second Sale Opportunities
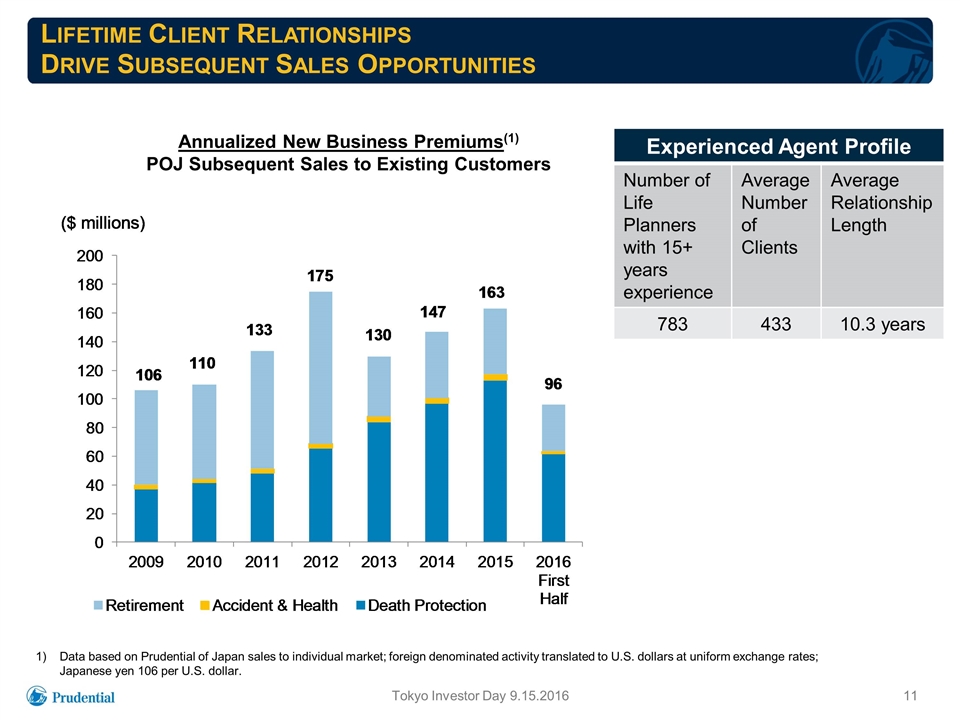
Lifetime Client Relationships Drive Subsequent Sales Opportunities Data based on Prudential of Japan sales to individual market; foreign denominated activity translated to U.S. dollars at uniform exchange rates; Japanese yen 106 per U.S. dollar. Annualized New Business Premiums(1) POJ Subsequent Sales to Existing Customers Tokyo Investor Day 9.15.2016 Experienced Agent Profile Number of Life Planners with 15+ years experience Average Number of Clients Average Relationship Length 783 433 10.3 years
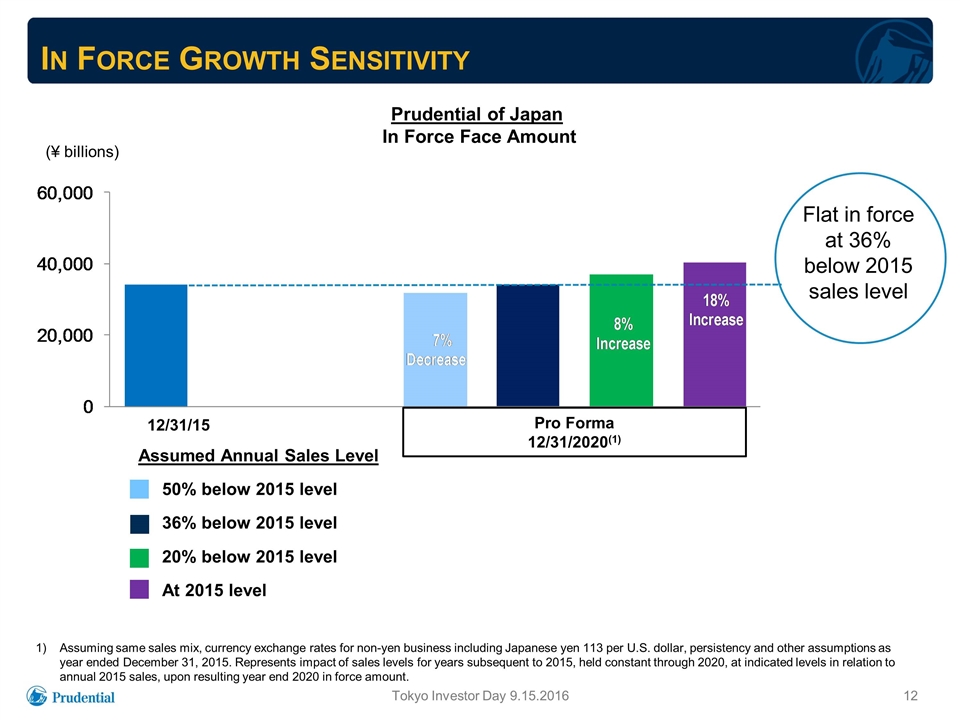
In Force Growth Sensitivity Assumed Annual Sales Level 50% below 2015 level 36% below 2015 level 20% below 2015 level At 2015 level Prudential of Japan In Force Face Amount Tokyo Investor Day 9.15.2016 Assuming same sales mix, currency exchange rates for non-yen business including Japanese yen 113 per U.S. dollar, persistency and other assumptions as year ended December 31, 2015. Represents impact of sales levels for years subsequent to 2015, held constant through 2020, at indicated levels in relation to annual 2015 sales, upon resulting year end 2020 in force amount. Flat in force at 36% below 2015 sales level (¥ billions) 12/31/15 Pro Forma 12/31/2020(1)
Navigating the Current Environment Focus on recurring premium death protection products with returns primarily driven by mortality and expense margins Increased sales of U.S. dollar products Product actions Suspended sales of single premium yen products, effective April 2016 Reduced crediting rates for advance premiums on yen business, to be effective November 2016 Strong asset/liability management reduces reinvestment requirements, mitigating impact of spread compression on margins Tokyo Investor Day 9.15.2016
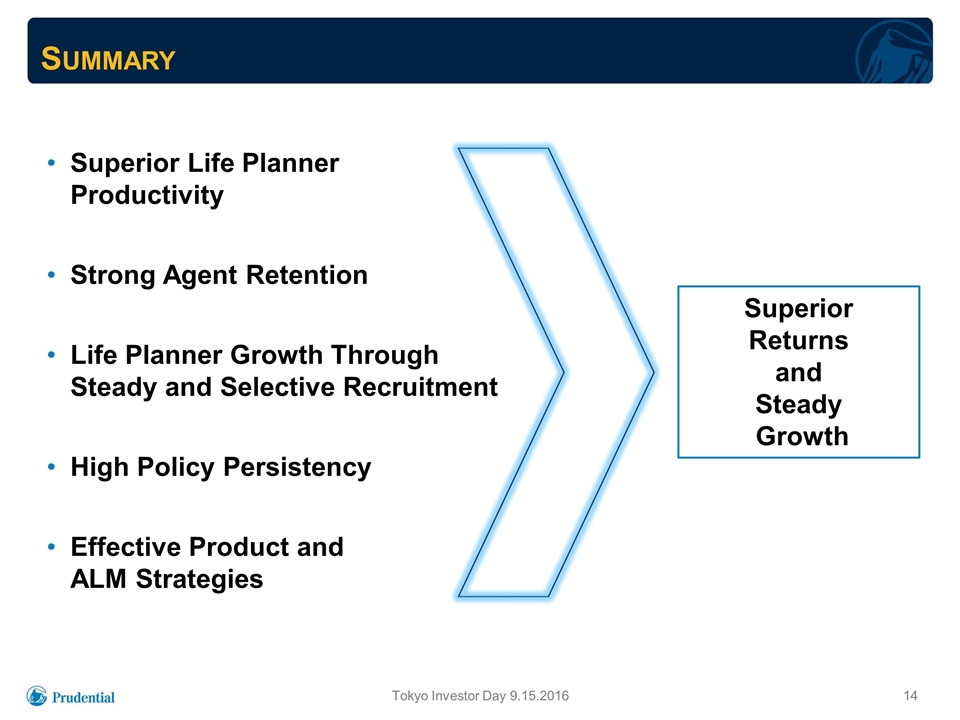
Summary Superior Life Planner Productivity Strong Agent Retention Life Planner Growth Through Steady and Selective Recruitment High Policy Persistency Effective Product and ALM Strategies Superior Returns and Steady Growth Tokyo Investor Day 9.15.2016

Gibraltar Life Kazuhiro Yamauchi President and Chief Executive Officer Gibraltar Life

Gibraltar Life Tokyo Investor Day 9.15.2016 Solid Return In Force Business with Broad Distribution Reach Effective acquisition model with well integrated businesses provides stable block of highly profitable business Life Consultant count stabilized following Star / Edison acquisition and integration; positioned for growth Distinctive affinity distribution through long-standing relationship with Japanese Teachers Association Additive Independent Agency distribution focused on protection products Broader focus on protection, U.S. dollar and other non-yen products, and strong asset-liability management mitigates impact of current low interest rate environment Active management of product offerings to maintain appropriate returns: suspended sales of yen-based fixed annuities, single premium whole life(1) Certain products suspended February 2016, others July 2016.
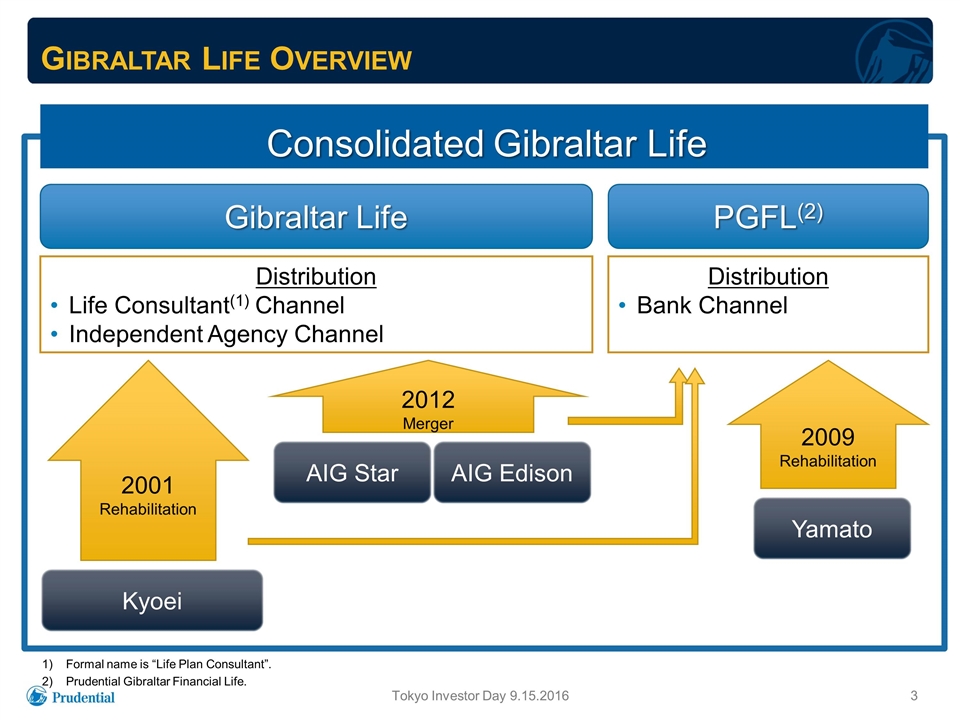
Consolidated Gibraltar Life Distribution Life Consultant(1) Channel Independent Agency Channel Gibraltar Life Overview Distribution Bank Channel Formal name is “Life Plan Consultant”. Prudential Gibraltar Financial Life. Gibraltar Life PGFL(2) Kyoei AIG Star AIG Edison 2001 Rehabilitation 2012 Merger 2009 Rehabilitation Yamato Tokyo Investor Day 9.15.2016
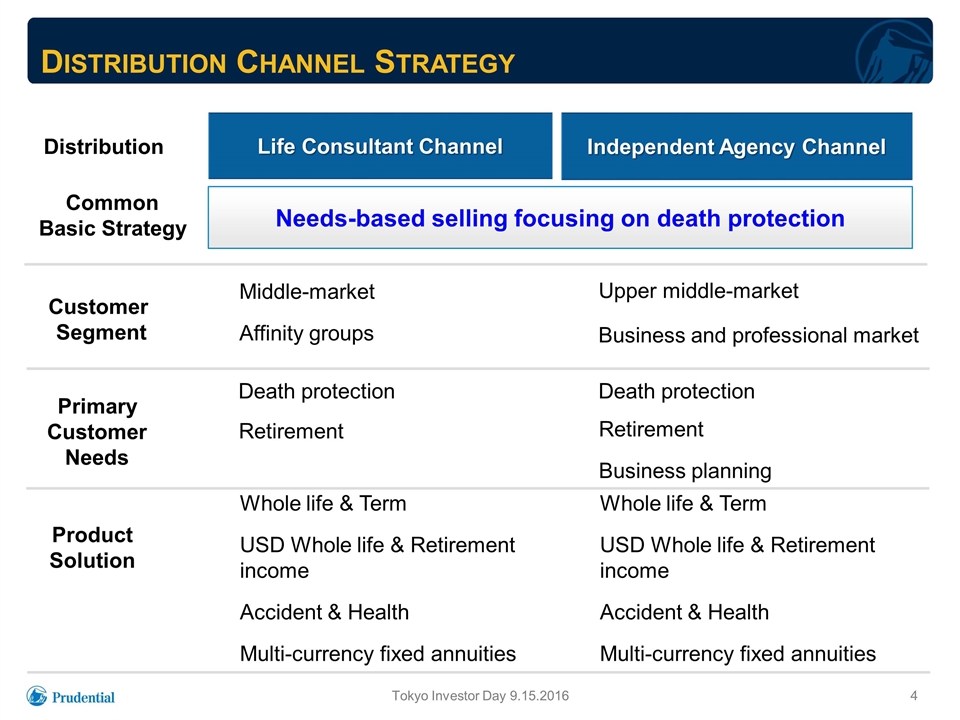
Distribution Channel Strategy Customer Segment Primary Customer Needs Product Solution Distribution Middle-market Affinity groups Life Consultant Channel Death protection Retirement Whole life & Term USD Whole life & Retirement income Accident & Health Multi-currency fixed annuities Independent Agency Channel Upper middle-market Business and professional market Death protection Retirement Business planning Whole life & Term USD Whole life & Retirement income Accident & Health Multi-currency fixed annuities Common Basic Strategy Needs-based selling focusing on death protection Tokyo Investor Day 9.15.2016
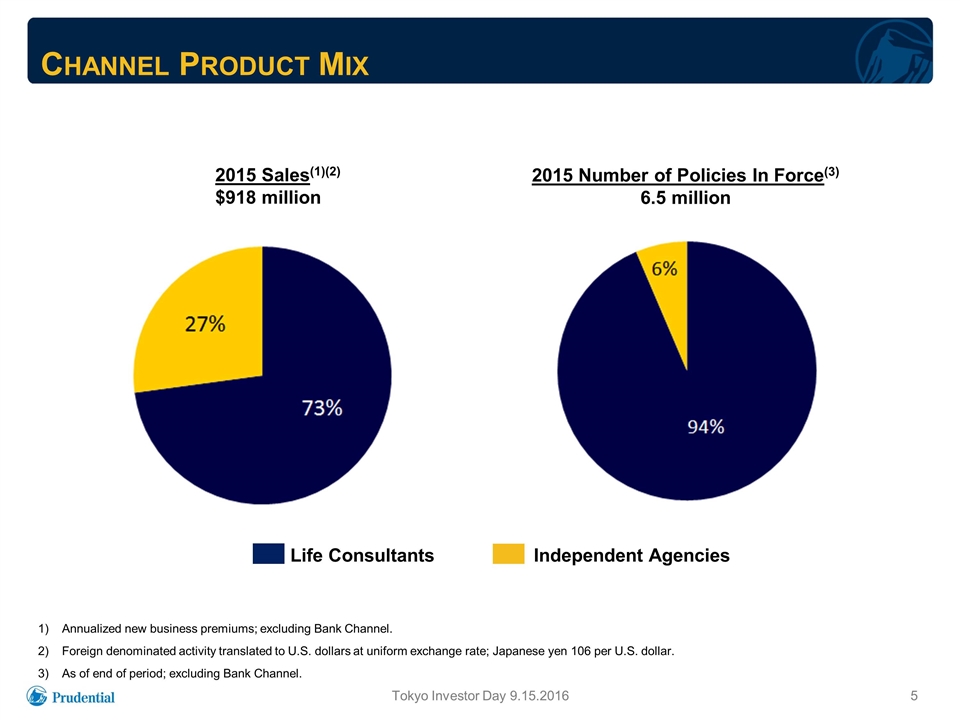
Channel Product Mix 2015 Sales(1)(2) $918 million Annualized new business premiums; excluding Bank Channel. Foreign denominated activity translated to U.S. dollars at uniform exchange rate; Japanese yen 106 per U.S. dollar. As of end of period; excluding Bank Channel. Life Consultants Independent Agencies 2015 Number of Policies In Force(3) 6.5 million Tokyo Investor Day 9.15.2016
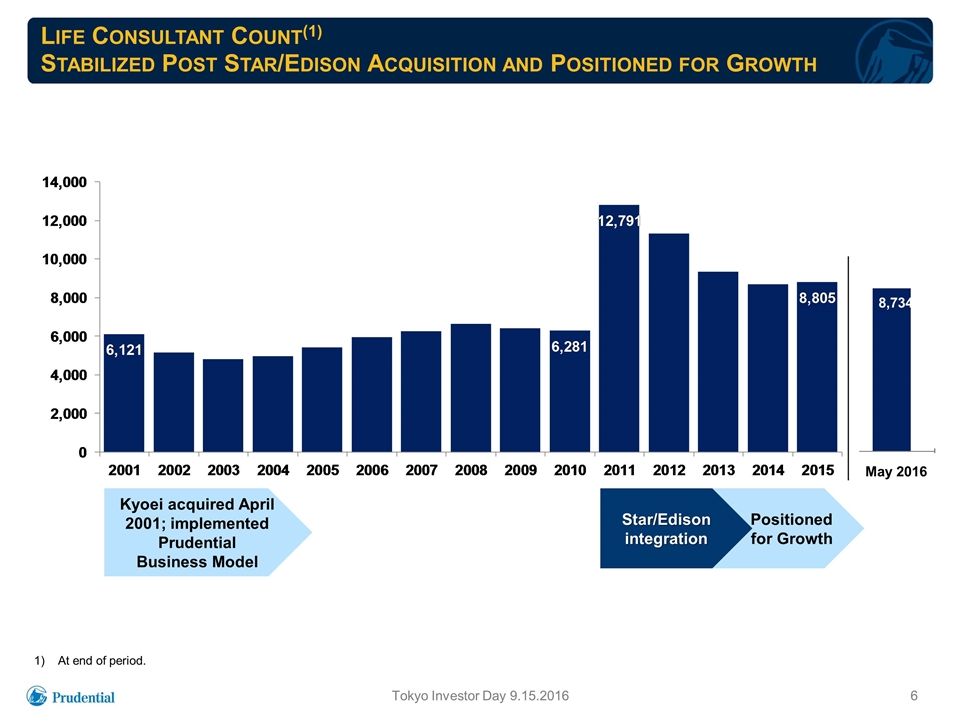
May 2016 8,734 Life Consultant Count(1) Stabilized Post Star/Edison Acquisition and Positioned for Growth Tokyo Investor Day 9.15.2016 At end of period. Positioned for Growth Star/Edison integration Kyoei acquired April 2001; implemented Prudential Business Model 8,734
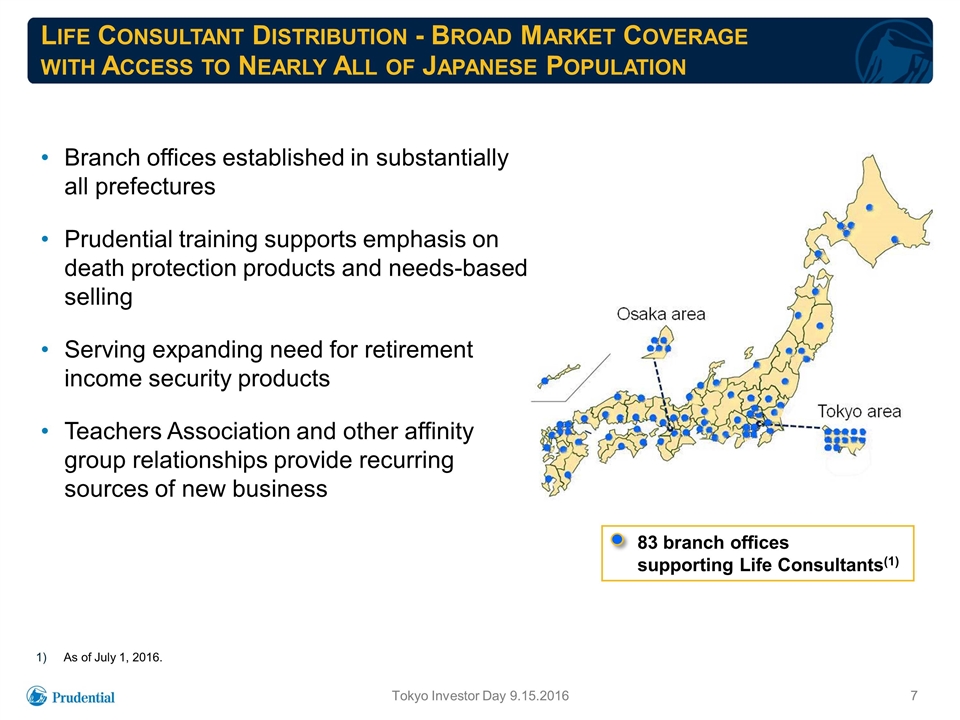
Life Consultant Distribution - Broad Market Coverage with Access to Nearly All of Japanese Population 83 branch offices supporting Life Consultants(1) Branch offices established in substantially all prefectures Prudential training supports emphasis on death protection products and needs-based selling Serving expanding need for retirement income security products Teachers Association and other affinity group relationships provide recurring sources of new business As of July 1, 2016. Tokyo Investor Day 9.15.2016
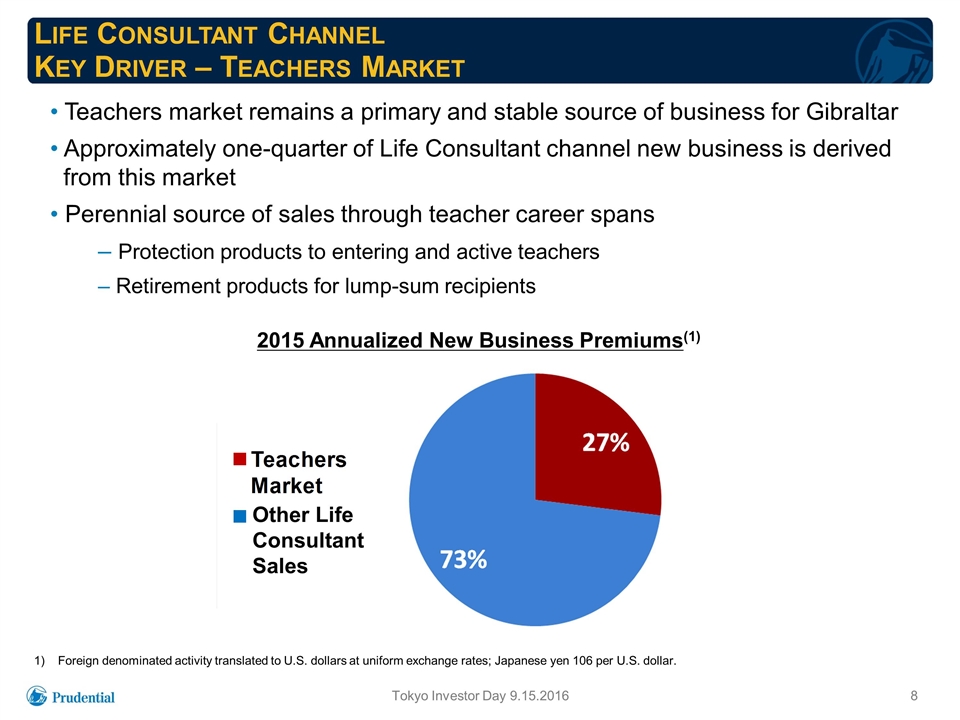
Teachers market remains a primary and stable source of business for Gibraltar Approximately one-quarter of Life Consultant channel new business is derived from this market Perennial source of sales through teacher career spans Protection products to entering and active teachers Retirement products for lump-sum recipients Life Consultant Channel Key Driver – Teachers Market 2015 Annualized New Business Premiums(1) Other Life Consultant Sales Foreign denominated activity translated to U.S. dollars at uniform exchange rates; Japanese yen 106 per U.S. dollar. Tokyo Investor Day 9.15.2016
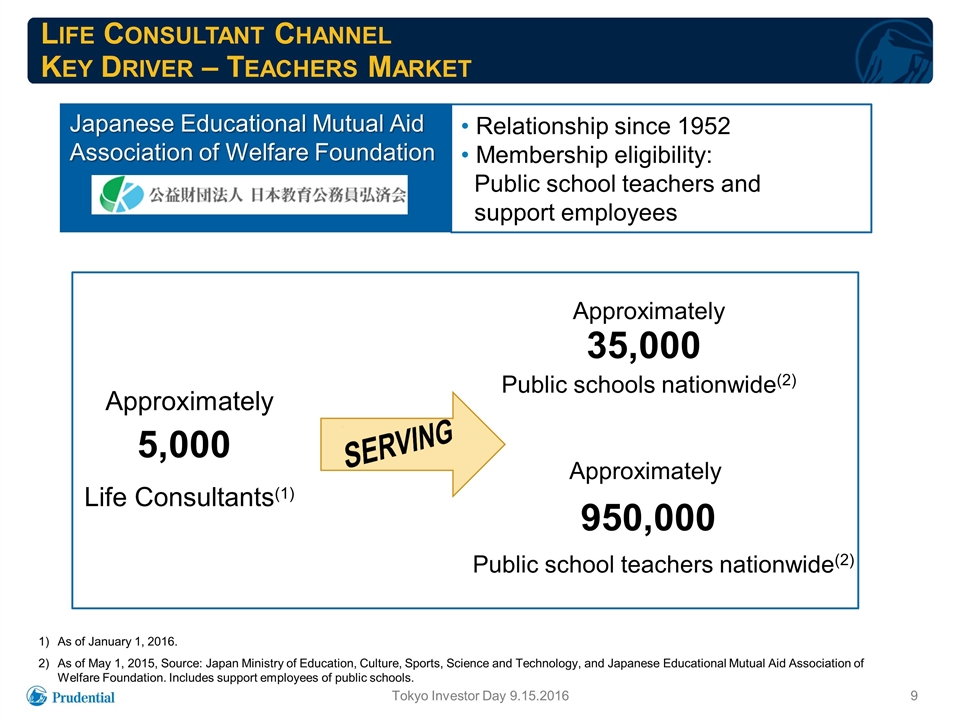
Life Consultant Channel Key Driver – Teachers Market Approximately Life Consultants(1) Approximately Public schools nationwide(2) serving As of January 1, 2016. As of May 1, 2015, Source: Japan Ministry of Education, Culture, Sports, Science and Technology, and Japanese Educational Mutual Aid Association of Welfare Foundation. Includes support employees of public schools. Approximately Public school teachers nationwide(2) Relationship since 1952 Membership eligibility: Public school teachers and support employees Japanese Educational Mutual Aid Association of Welfare Foundation 5,000 35,000 950,000 Tokyo Investor Day 9.15.2016
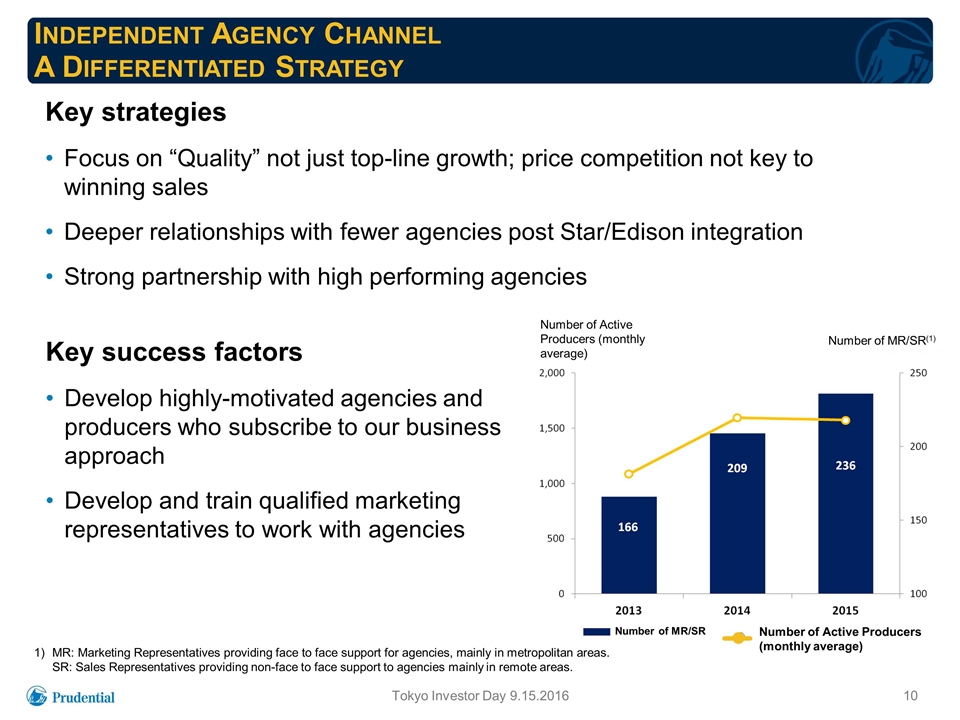
Independent Agency Channel A Differentiated Strategy Key strategies Focus on “Quality” not just top-line growth; price competition not key to winning sales Deeper relationships with fewer agencies post Star/Edison integration Strong partnership with high performing agencies Key success factors Develop highly-motivated agencies and producers who subscribe to our business approach Develop and train qualified marketing representatives to work with agencies Tokyo Investor Day 9.15.2016 MR: Marketing Representatives providing face to face support for agencies, mainly in metropolitan areas. SR: Sales Representatives providing non-face to face support to agencies mainly in remote areas. Number of MR/SR Number of Active Producers (monthly average) Number of Active Producers (monthly average) Number of MR/SR(1)
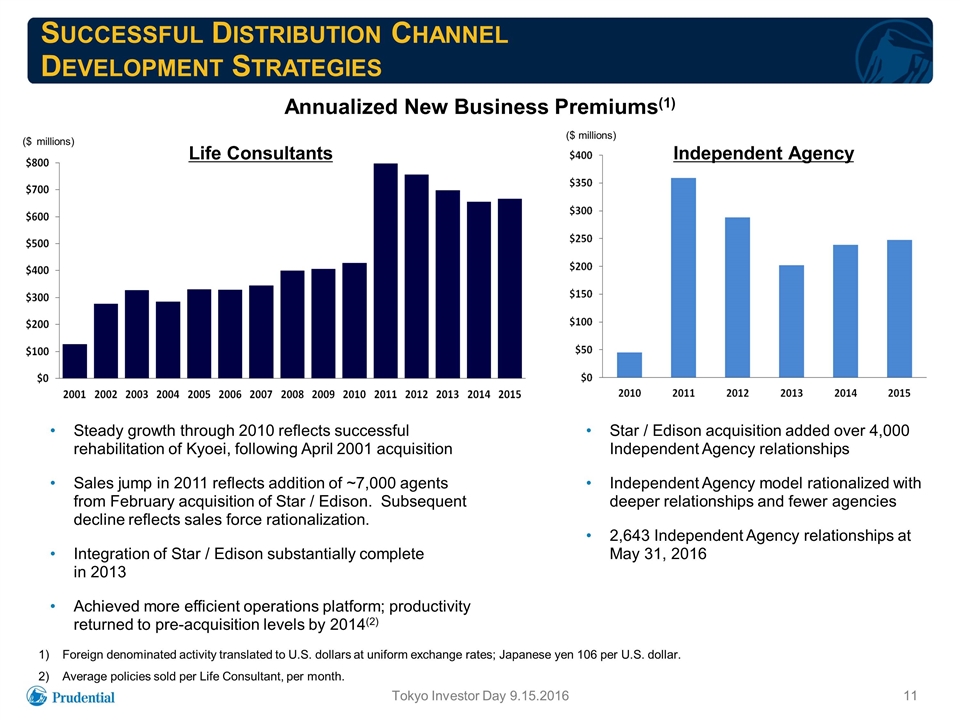
Successful Distribution Channel Development Strategies Tokyo Investor Day 9.15.2016 Foreign denominated activity translated to U.S. dollars at uniform exchange rates; Japanese yen 106 per U.S. dollar. Average policies sold per Life Consultant, per month. Annualized New Business Premiums(1) Steady growth through 2010 reflects successful rehabilitation of Kyoei, following April 2001 acquisition Sales jump in 2011 reflects addition of ~7,000 agents from February acquisition of Star / Edison. Subsequent decline reflects sales force rationalization. Integration of Star / Edison substantially complete in 2013 Achieved more efficient operations platform; productivity returned to pre-acquisition levels by 2014(2) Star / Edison acquisition added over 4,000 Independent Agency relationships Independent Agency model rationalized with deeper relationships and fewer agencies 2,643 Independent Agency relationships at May 31, 2016 Life Consultants Independent Agency ($ millions) ($ millions)
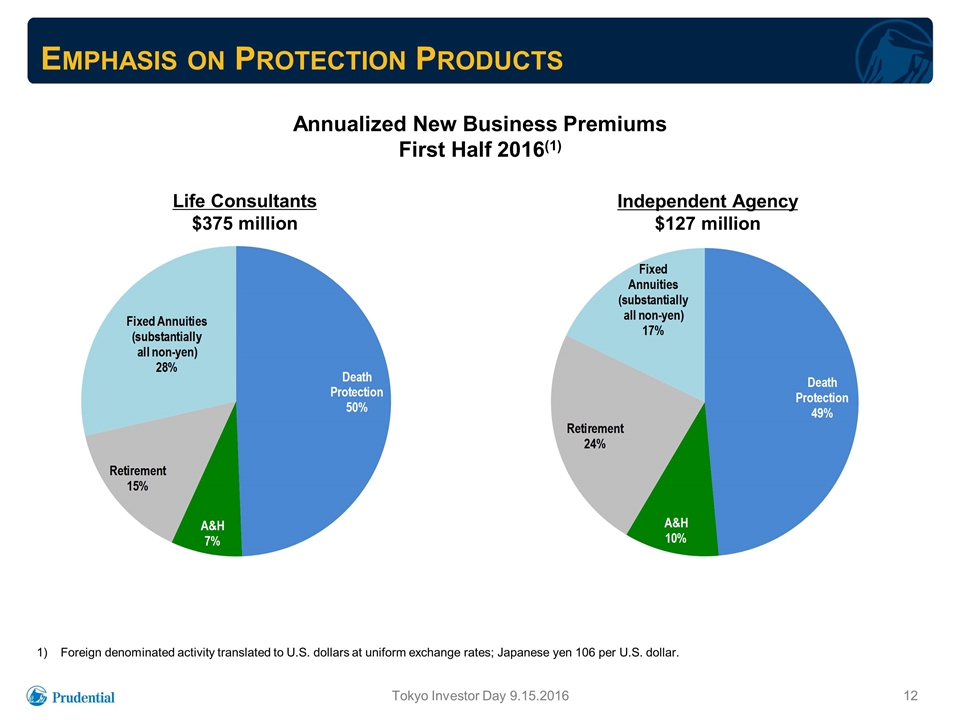
Emphasis on Protection Products Tokyo Investor Day 9.15.2016 Foreign denominated activity translated to U.S. dollars at uniform exchange rates; Japanese yen 106 per U.S. dollar. Annualized New Business Premiums First Half 2016(1) Life Consultants $375 million Independent Agency $127 million
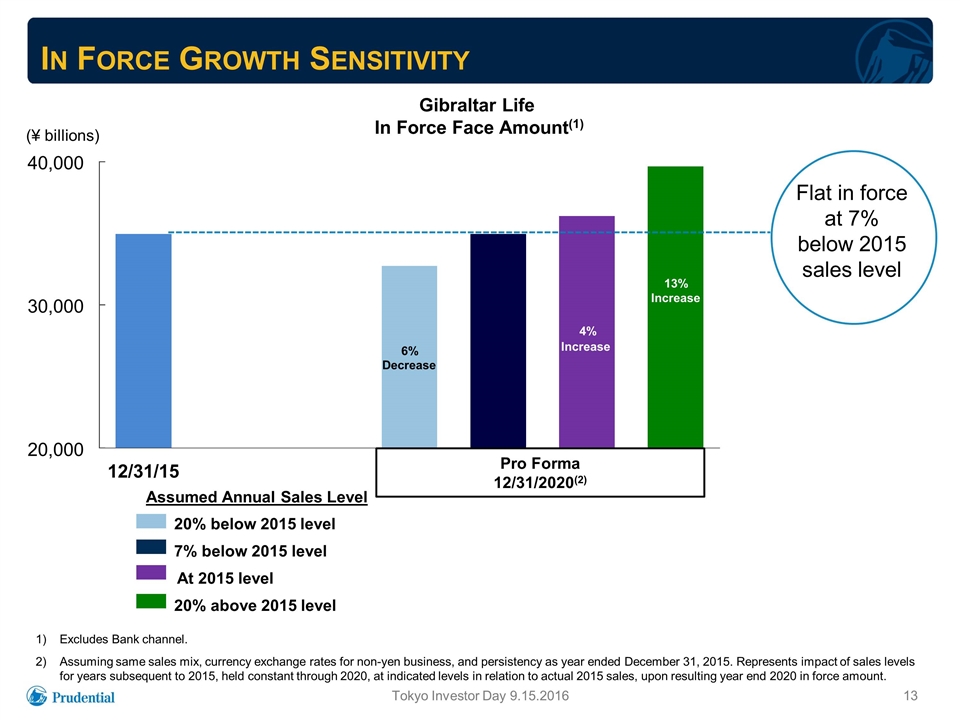
In Force Growth Sensitivity Tokyo Investor Day 9.15.2016 Assumed Annual Sales Level 20% below 2015 level 7% below 2015 level At 2015 level 20% above 2015 level Gibraltar Life In Force Face Amount(1) Excludes Bank channel. Assuming same sales mix, currency exchange rates for non-yen business, and persistency as year ended December 31, 2015. Represents impact of sales levels for years subsequent to 2015, held constant through 2020, at indicated levels in relation to actual 2015 sales, upon resulting year end 2020 in force amount. Flat in force at 7% below 2015 sales level 6% Decrease 4% Increase 13% Increase 20,000 30,000 40,000 12/31/15 ($ (¥ billions) Pro Forma 12/31/2020(2)
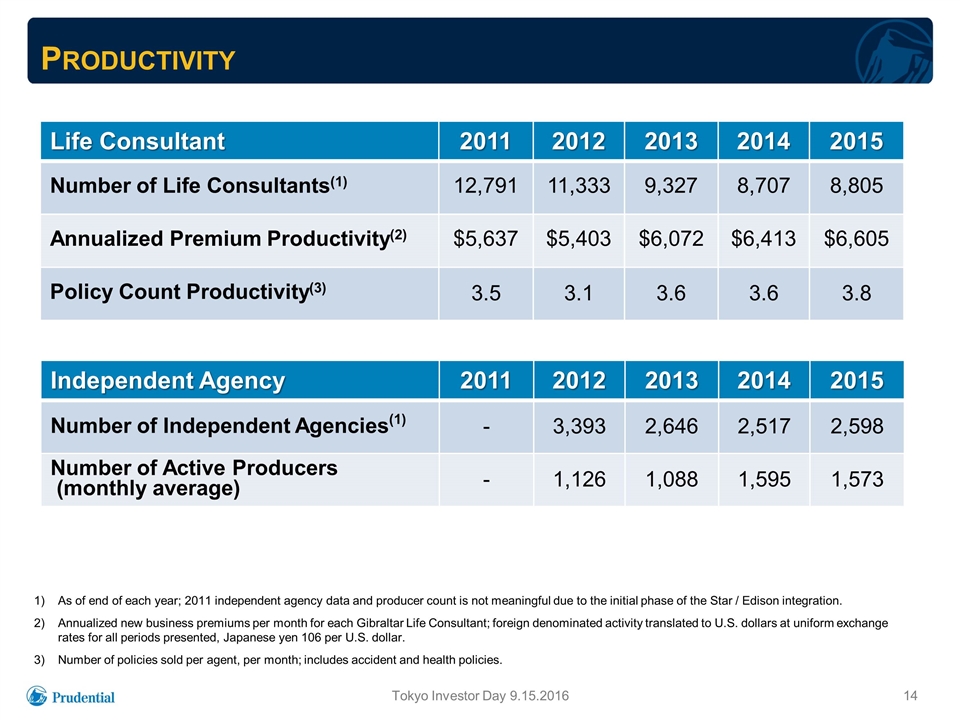
Productivity Tokyo Investor Day 9.15.2016 Life Consultant 2011 2012 2013 2014 2015 Number of Life Consultants(1) 12,791 11,333 9,327 8,707 8,805 Annualized Premium Productivity(2) $5,637 $5,403 $6,072 $6,413 $6,605 Policy Count Productivity(3) 3.5 3.1 3.6 3.6 3.8 As of end of each year; 2011 independent agency data and producer count is not meaningful due to the initial phase of the Star / Edison integration. Annualized new business premiums per month for each Gibraltar Life Consultant; foreign denominated activity translated to U.S. dollars at uniform exchange rates for all periods presented, Japanese yen 106 per U.S. dollar. Number of policies sold per agent, per month; includes accident and health policies. Independent Agency 2011 2012 2013 2014 2015 Number of Independent Agencies(1) - 3,393 2,646 2,517 2,598 Number of Active Producers (monthly average) - 1,126 1,088 1,595 1,573
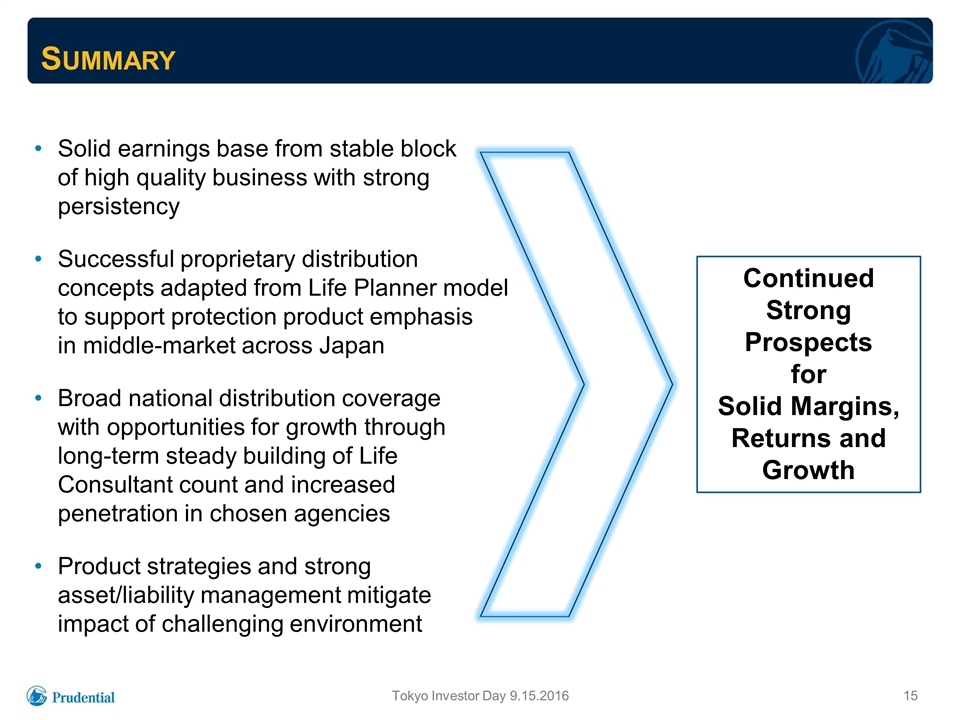
Summary Solid earnings base from stable block of high quality business with strong persistency Successful proprietary distribution concepts adapted from Life Planner model to support protection product emphasis in middle-market across Japan Broad national distribution coverage with opportunities for growth through long-term steady building of Life Consultant count and increased penetration in chosen agencies Product strategies and strong asset/liability management mitigate impact of challenging environment Continued Strong Prospects for Solid Margins, Returns and Growth Tokyo Investor Day 9.15.2016

Bancassurance in Japan Takeshi Soeda President and Chief Executive Officer Prudential Gibraltar Financial Life
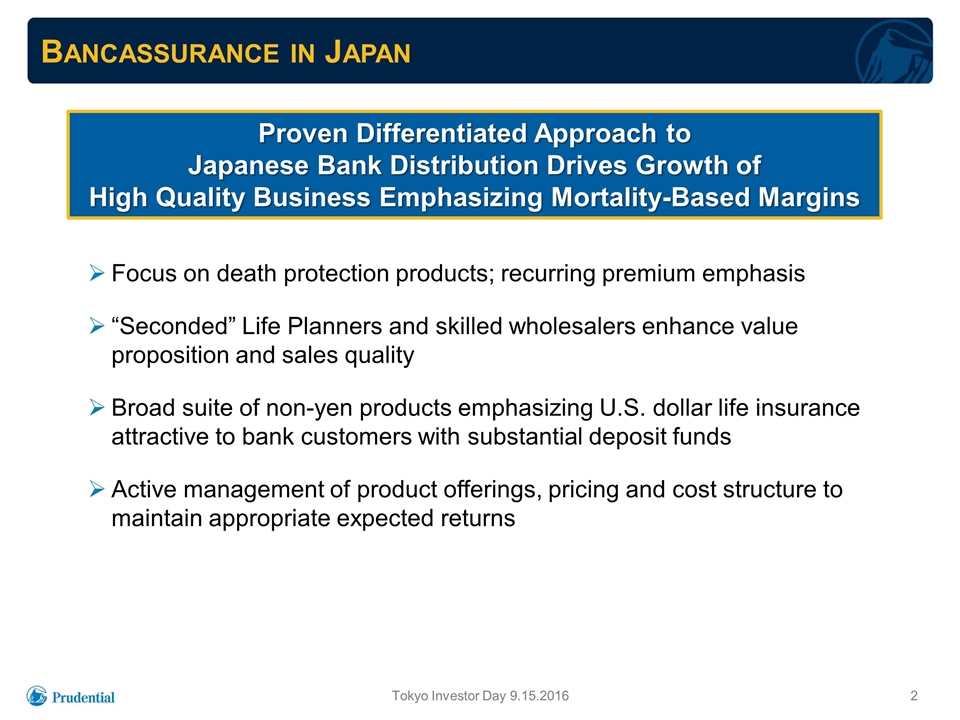
Bancassurance in Japan Proven Differentiated Approach to Japanese Bank Distribution Drives Growth of High Quality Business Emphasizing Mortality-Based Margins Focus on death protection products; recurring premium emphasis “Seconded” Life Planners and skilled wholesalers enhance value proposition and sales quality Broad suite of non-yen products emphasizing U.S. dollar life insurance attractive to bank customers with substantial deposit funds Active management of product offerings, pricing and cost structure to maintain appropriate expected returns Tokyo Investor Day 9.15.2016
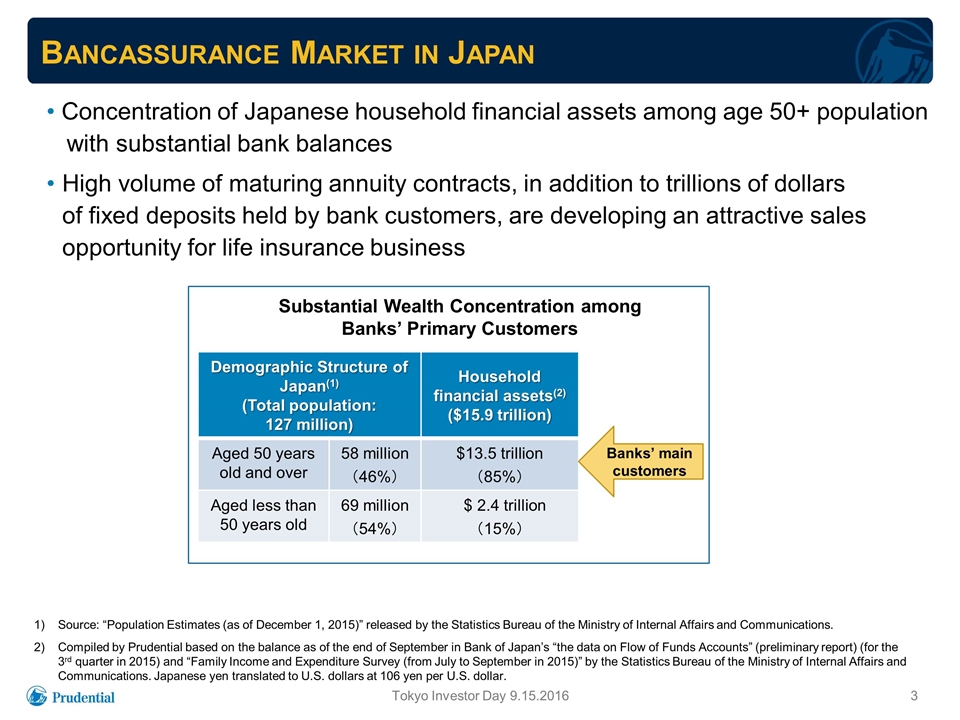
Bancassurance Market in Japan Source: “Population Estimates (as of December 1, 2015)” released by the Statistics Bureau of the Ministry of Internal Affairs and Communications. Compiled by Prudential based on the balance as of the end of September in Bank of Japan’s “the data on Flow of Funds Accounts” (preliminary report) (for the 3rd quarter in 2015) and “Family Income and Expenditure Survey (from July to September in 2015)” by the Statistics Bureau of the Ministry of Internal Affairs and Communications. Japanese yen translated to U.S. dollars at 106 yen per U.S. dollar. Concentration of Japanese household financial assets among age 50+ population with substantial bank balances High volume of maturing annuity contracts, in addition to trillions of dollars of fixed deposits held by bank customers, are developing an attractive sales opportunity for life insurance business Demographic Structure of Japan(1) (Total population: 127 million) Household financial assets(2) ($15.9 trillion) Aged 50 years old and over 58 million (46%) $13.5 trillion (85%) Aged less than 50 years old 69 million (54%) $ 2.4 trillion (15%) Banks’ main customers Tokyo Investor Day 9.15.2016 Substantial Wealth Concentration among Banks’ Primary Customers
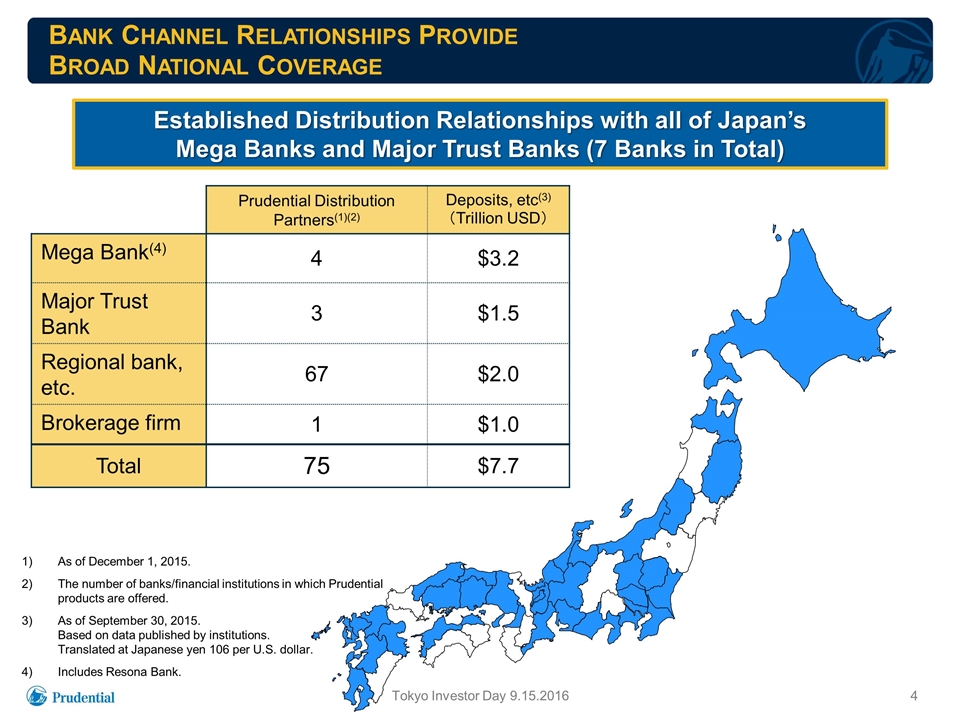
Bank Channel Relationships Provide Broad National Coverage Prudential Distribution Partners(1)(2) Deposits, etc(3) (Trillion USD) Mega Bank(4) 4 $3.2 Major Trust Bank 3 $1.5 Regional bank, etc. 67 $2.0 Brokerage firm 1 $1.0 Total 75 $7.7 As of December 1, 2015. The number of banks/financial institutions in which Prudential products are offered. As of September 30, 2015. Based on data published by institutions. Translated at Japanese yen 106 per U.S. dollar. Includes Resona Bank. Tokyo Investor Day 9.15.2016 Established Distribution Relationships with all of Japan’s Mega Banks and Major Trust Banks (7 Banks in Total)
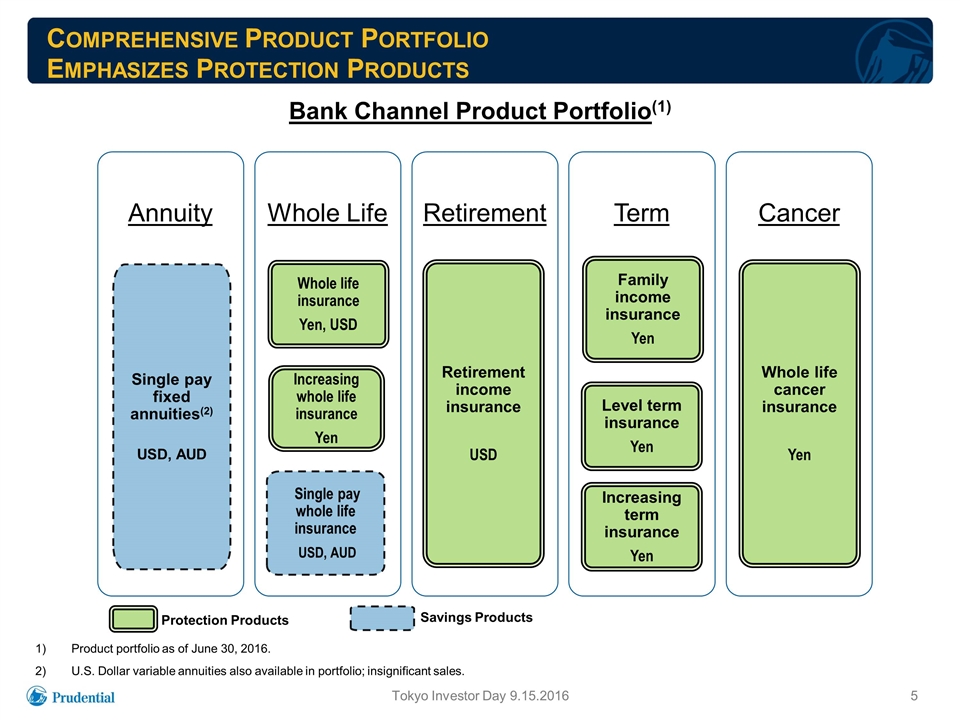
Product portfolio as of June 30, 2016. U.S. Dollar variable annuities also available in portfolio; insignificant sales. Comprehensive Product Portfolio Emphasizes Protection Products Annuity Single pay fixed annuities(2) USD, AUD Whole Life Single pay whole life insurance USD, AUD Whole life insurance Yen, USD Retirement Retirement income insurance USD Term Family income insurance Yen Level term insurance Yen Increasing term insurance Yen Cancer Whole life cancer insurance Yen Increasing whole life insurance Yen Protection Products Savings Products Tokyo Investor Day 9.15.2016 Bank Channel Product Portfolio(1)
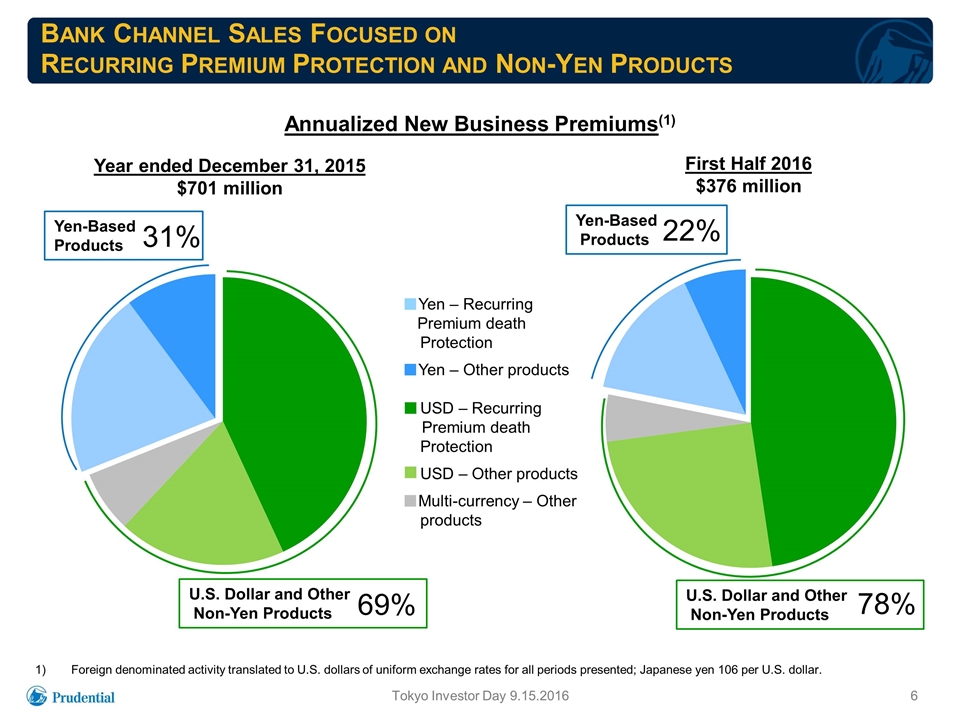
Bank Channel Sales Focused on Recurring Premium Protection and Non-Yen Products Annualized New Business Premiums(1) Foreign denominated activity translated to U.S. dollars of uniform exchange rates for all periods presented; Japanese yen 106 per U.S. dollar. Tokyo Investor Day 9.15.2016 Year ended December 31, 2015 $701 million First Half 2016 $376 million Yen-Based Products U.S. Dollar and Other Non-Yen Products 22% 78% ■Yen – Recurring Premium death Protection ■Yen – Other products USD – Recurring Premium death Protection USD – Other products ■Multi-currency – Other products Yen-Based Products U.S. Dollar and Other Non-Yen Products 31% 69%
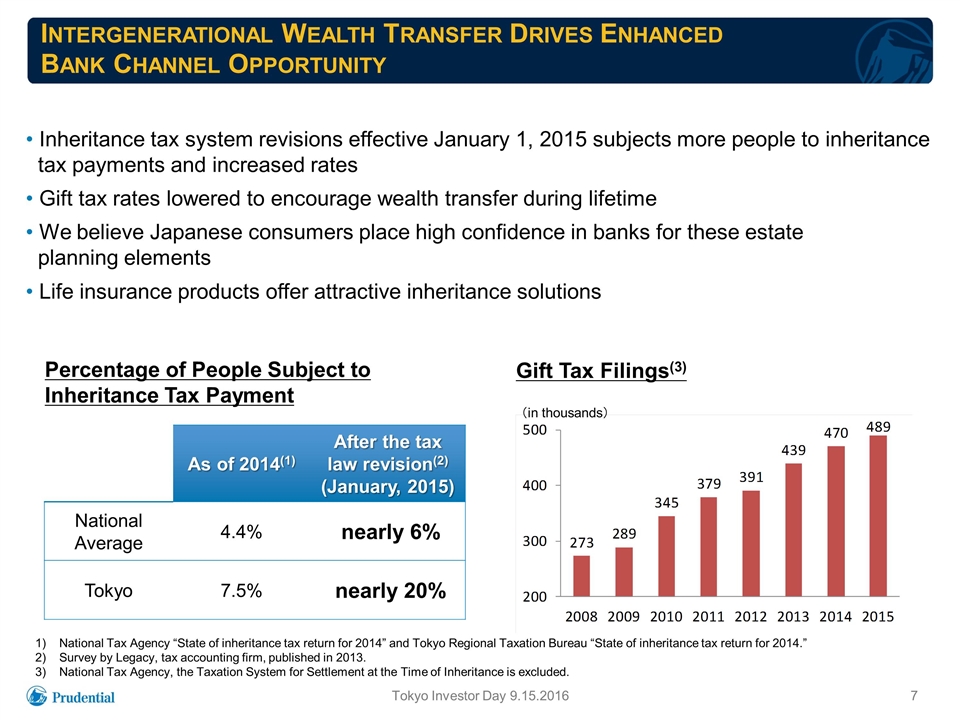
Intergenerational Wealth Transfer Drives Enhanced Bank Channel Opportunity As of 2014(1) After the tax law revision(2) (January, 2015) National Average 4.4% nearly 6% Tokyo 7.5% nearly 20% Percentage of People Subject to Inheritance Tax Payment National Tax Agency “State of inheritance tax return for 2014” and Tokyo Regional Taxation Bureau “State of inheritance tax return for 2014.” Survey by Legacy, tax accounting firm, published in 2013. National Tax Agency, the Taxation System for Settlement at the Time of Inheritance is excluded. Inheritance tax system revisions effective January 1, 2015 subjects more people to inheritance tax payments and increased rates Gift tax rates lowered to encourage wealth transfer during lifetime We believe Japanese consumers place high confidence in banks for these estate planning elements Life insurance products offer attractive inheritance solutions Tokyo Investor Day 9.15.2016 Gift Tax Filings(3) (in thousands)

Bank Channel Sales Support Prudential’s Differentiated Approach As of June 30, 2016. At certain banks. With more than 8 years since Japan’s full deregulation of Bancassurance in 2007, Prudential has secured substantial marketing expertise and skilled human resources to serve the Bank Channel Tokyo Investor Day 9.15.2016 Sales personnel Role Headcount(1) Wholesaler Provide sales support to bank employees ~130 Insurance Consultant (secondment) Experienced former Life Planners: Sell insurance products at banks where “seconded” Provide training to bank employees ~240(2)
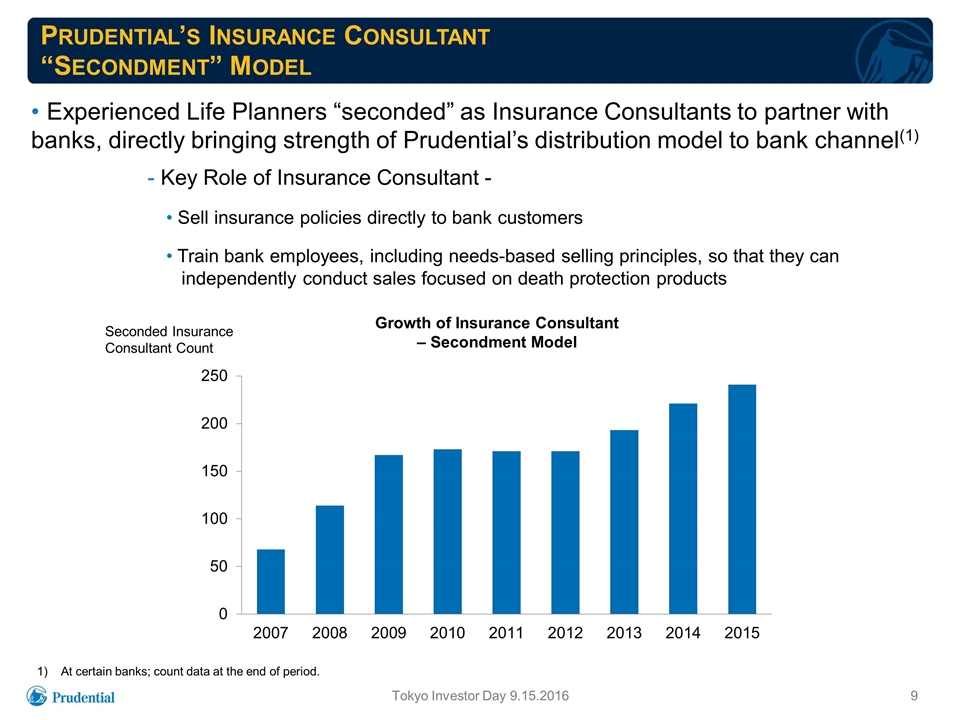
Prudential’s Insurance Consultant “Secondment” Model Experienced Life Planners “seconded” as Insurance Consultants to partner with banks, directly bringing strength of Prudential’s distribution model to bank channel(1) Growth of Insurance Consultant – Secondment Model - Key Role of Insurance Consultant - Sell insurance policies directly to bank customers Train bank employees, including needs-based selling principles, so that they can independently conduct sales focused on death protection products At certain banks; count data at the end of period. Seconded Insurance Consultant Count Tokyo Investor Day 9.15.2016
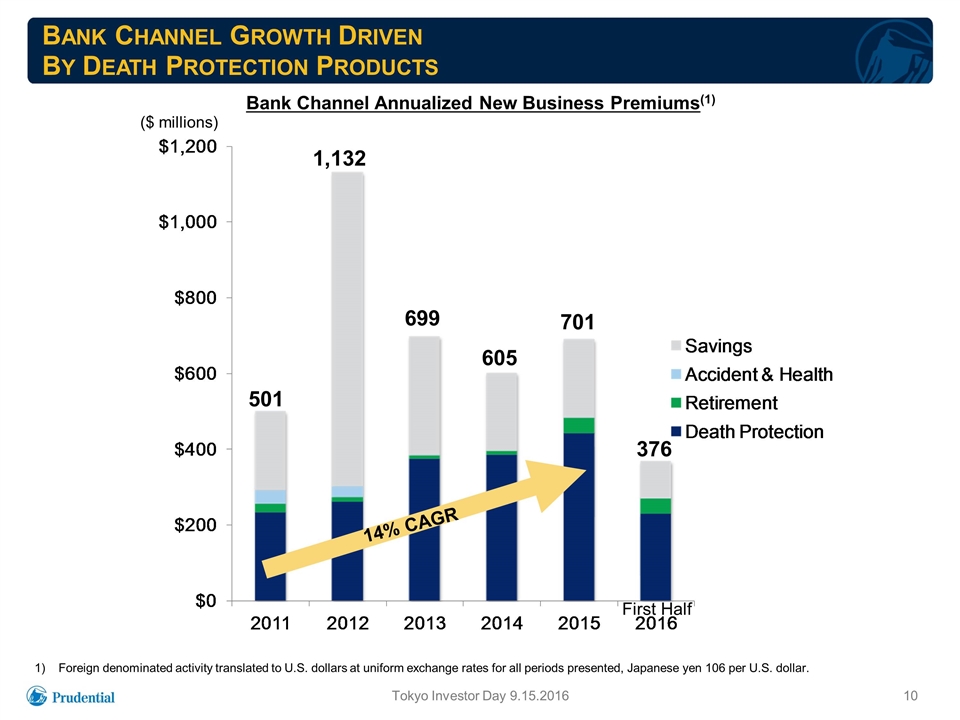
Bank Channel Growth Driven By Death Protection Products Bank Channel Annualized New Business Premiums(1) Foreign denominated activity translated to U.S. dollars at uniform exchange rates for all periods presented, Japanese yen 106 per U.S. dollar. ($ millions) Tokyo Investor Day 9.15.2016 699 701 14% CAGR 501 1,132 605 376 First Half
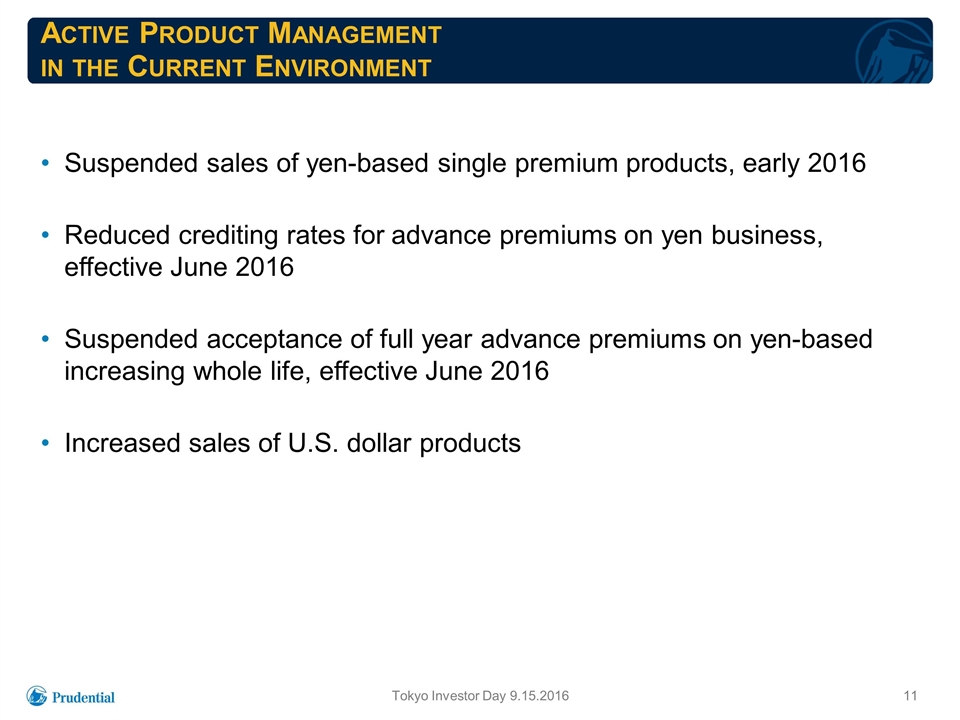
Active Product Management in the Current Environment Suspended sales of yen-based single premium products, early 2016 Reduced crediting rates for advance premiums on yen business, effective June 2016 Suspended acceptance of full year advance premiums on yen-based increasing whole life, effective June 2016 Increased sales of U.S. dollar products Tokyo Investor Day 9.15.2016
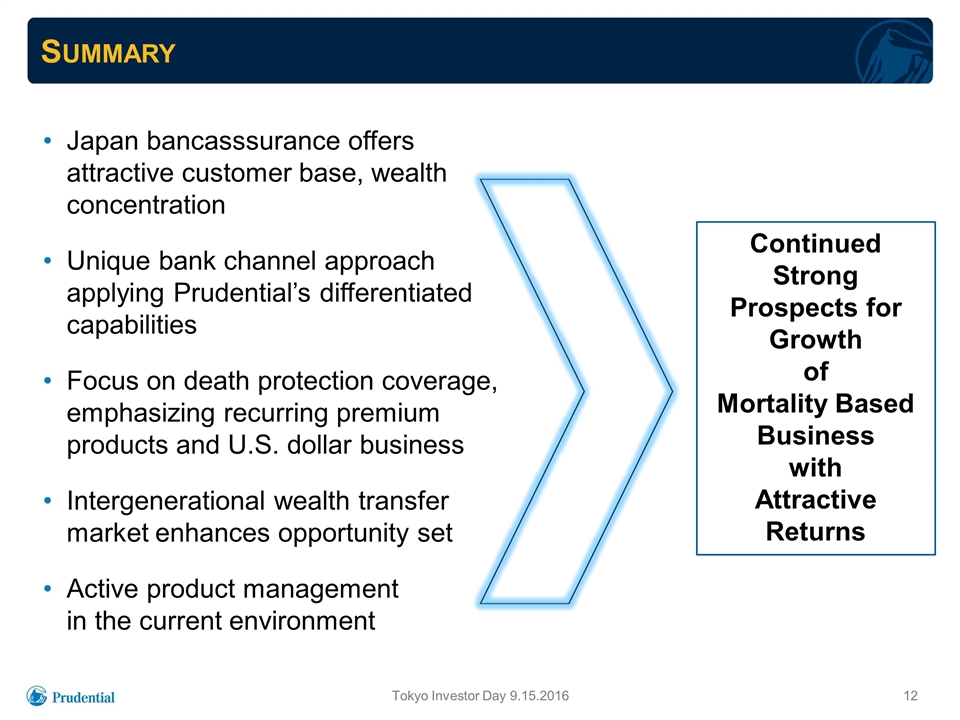
Summary Japan bancasssurance offers attractive customer base, wealth concentration Unique bank channel approach applying Prudential’s differentiated capabilities Focus on death protection coverage, emphasizing recurring premium products and U.S. dollar business Intergenerational wealth transfer market enhances opportunity set Active product management in the current environment Continued Strong Prospects for Growth of Mortality Based Business with Attractive Returns Tokyo Investor Day 9.15.2016

Scott Sleyster Senior Vice President and Chief Investment Officer Prudential Financial, Inc. Investments and Asset–Liability Management in Japan
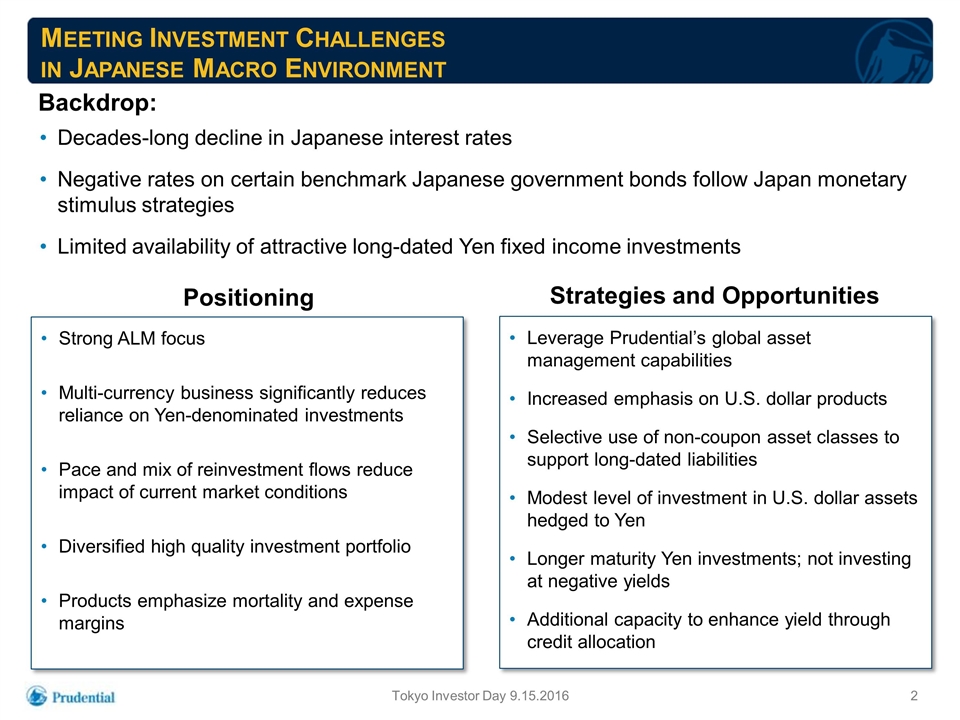
Meeting Investment Challenges in Japanese Macro Environment Tokyo Investor Day 9.15.2016 Decades-long decline in Japanese interest rates Negative rates on certain benchmark Japanese government bonds follow Japan monetary stimulus strategies Limited availability of attractive long-dated Yen fixed income investments Positioning Strong ALM focus Multi-currency business significantly reduces reliance on Yen-denominated investments Pace and mix of reinvestment flows reduce impact of current market conditions Diversified high quality investment portfolio Products emphasize mortality and expense margins Strategies and Opportunities Leverage Prudential’s global asset management capabilities Increased emphasis on U.S. dollar products Selective use of non-coupon asset classes to support long-dated liabilities Modest level of investment in U.S. dollar assets hedged to Yen Longer maturity Yen investments; not investing at negative yields Additional capacity to enhance yield through credit allocation Backdrop:
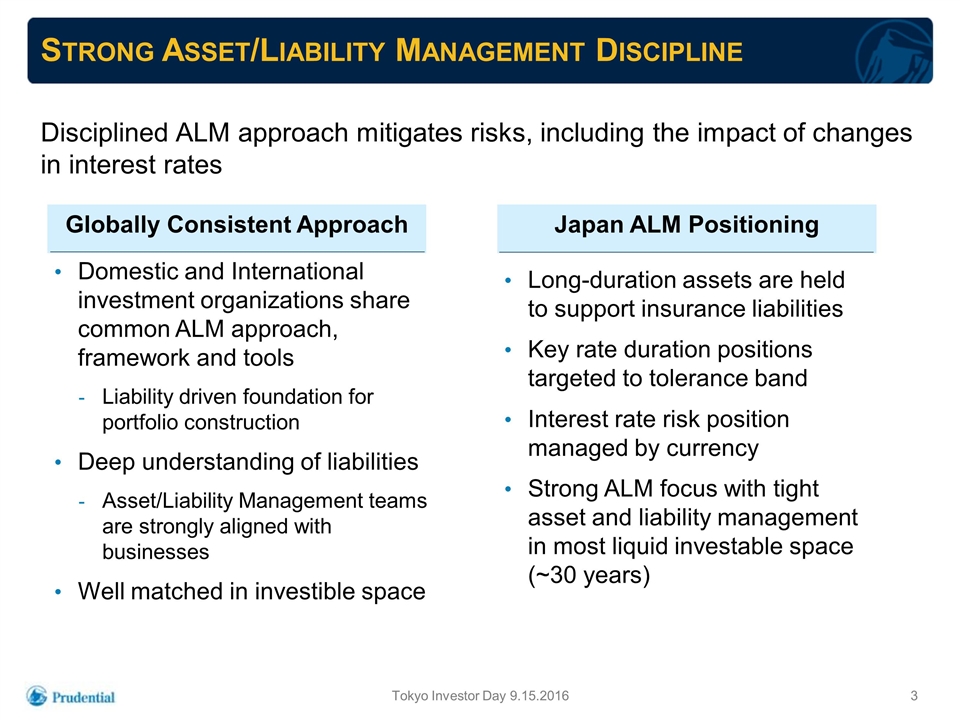
Strong Asset/Liability Management Discipline Disciplined ALM approach mitigates risks, including the impact of changes in interest rates Tokyo Investor Day 9.15.2016 Globally Consistent Approach Domestic and International investment organizations share common ALM approach, framework and tools Liability driven foundation for portfolio construction Deep understanding of liabilities Asset/Liability Management teams are strongly aligned with businesses Well matched in investible space Japan ALM Positioning Long-duration assets are held to support insurance liabilities Key rate duration positions targeted to tolerance band Interest rate risk position managed by currency Strong ALM focus with tight asset and liability management in most liquid investable space (~30 years)
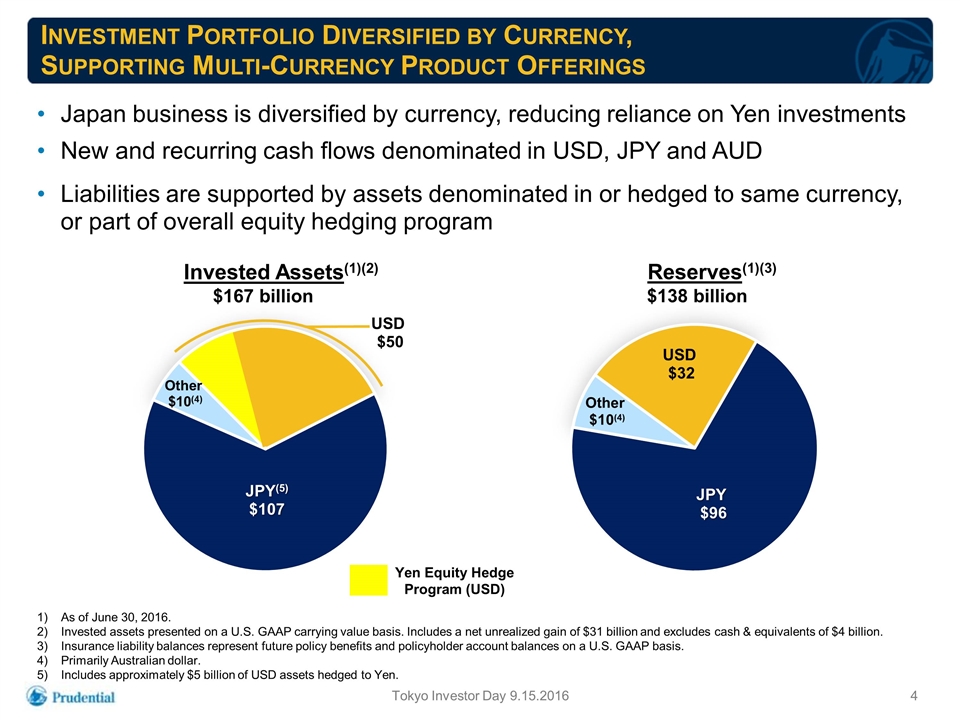
Investment Portfolio Diversified by Currency, Supporting Multi-Currency Product Offerings Japan business is diversified by currency, reducing reliance on Yen investments New and recurring cash flows denominated in USD, JPY and AUD Liabilities are supported by assets denominated in or hedged to same currency, or part of overall equity hedging program Tokyo Investor Day 9.15.2016 As of June 30, 2016. Invested assets presented on a U.S. GAAP carrying value basis. Includes a net unrealized gain of $31 billion and excludes cash & equivalents of $4 billion. Insurance liability balances represent future policy benefits and policyholder account balances on a U.S. GAAP basis. Primarily Australian dollar. Includes approximately $5 billion of USD assets hedged to Yen. Reserves(1)(3) $138 billion Invested Assets(1)(2) $167 billion Yen Equity Hedge Program (USD)
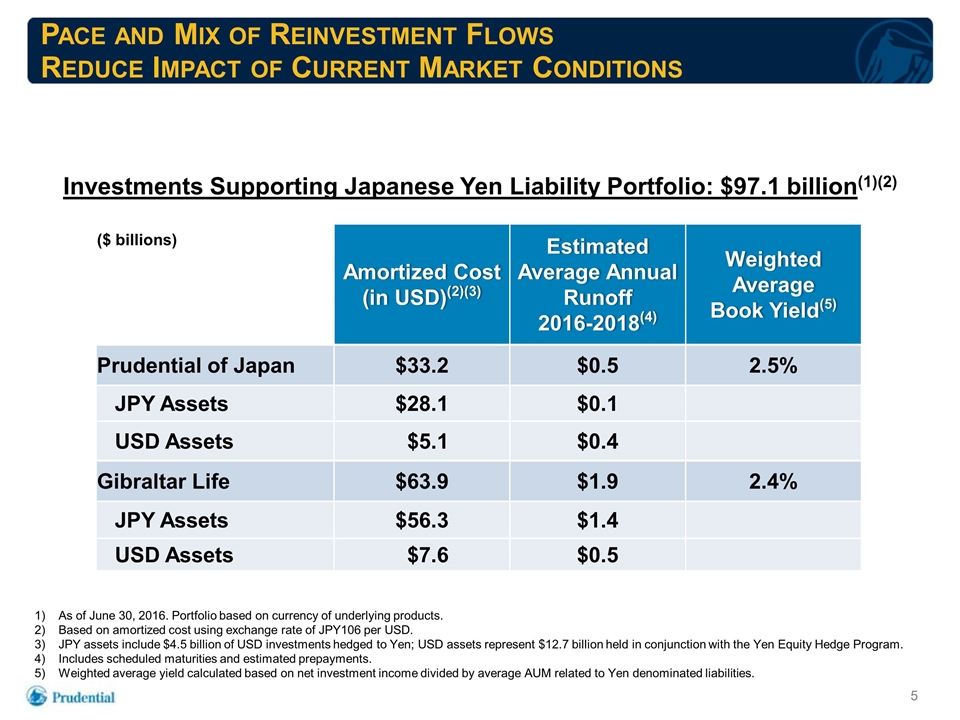
Pace and Mix of Reinvestment Flows Reduce Impact of Current Market Conditions Investments Supporting Japanese Yen Liability Portfolio: $97.1 billion(1)(2) As of June 30, 2016. Portfolio based on currency of underlying products. Based on amortized cost using exchange rate of JPY106 per USD. JPY assets include $4.5 billion of USD investments hedged to Yen; USD assets represent $12.7 billion held in conjunction with the Yen Equity Hedge Program. Includes scheduled maturities and estimated prepayments. Weighted average yield calculated based on net investment income divided by average AUM related to Yen denominated liabilities. ($ billions) Amortized Cost (in USD)(2)(3) Estimated Average Annual Runoff 2016-2018(4) Weighted Average Book Yield(5) Prudential of Japan $33.2 $0.5 2.5% JPY Assets $28.1 $0.1 USD Assets $5.1 $0.4 Gibraltar Life $63.9 $1.9 2.4% JPY Assets $56.3 $1.4 USD Assets $7.6 $0.5
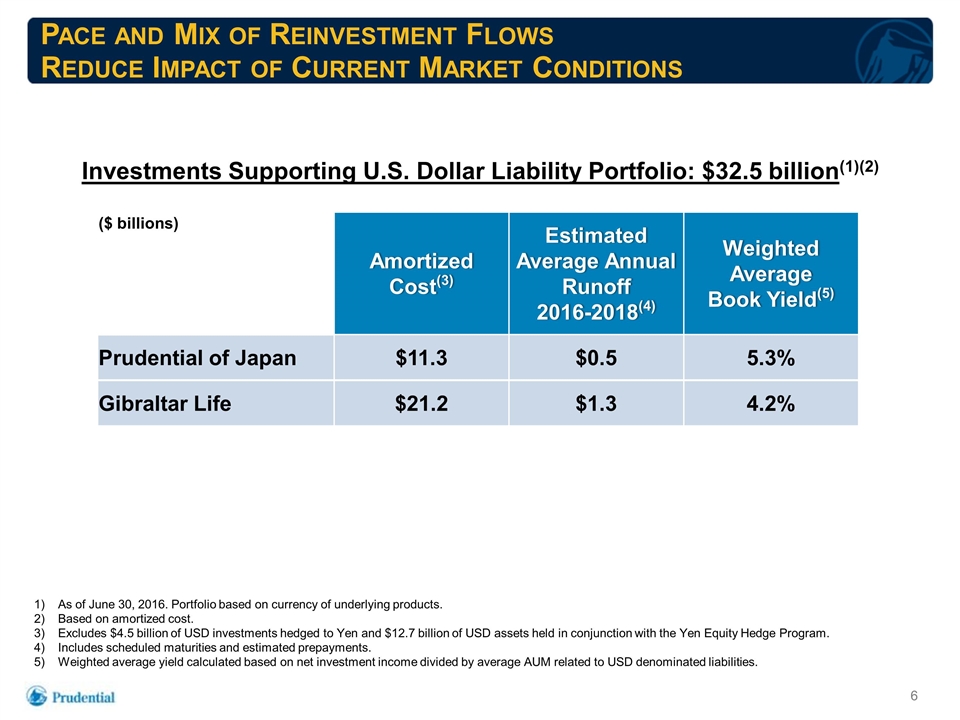
Pace and Mix of Reinvestment Flows Reduce Impact of Current Market Conditions Investments Supporting U.S. Dollar Liability Portfolio: $32.5 billion(1)(2) As of June 30, 2016. Portfolio based on currency of underlying products. Based on amortized cost. Excludes $4.5 billion of USD investments hedged to Yen and $12.7 billion of USD assets held in conjunction with the Yen Equity Hedge Program. Includes scheduled maturities and estimated prepayments. Weighted average yield calculated based on net investment income divided by average AUM related to USD denominated liabilities. ($ billions) Amortized Cost(3) Estimated Average Annual Runoff 2016-2018(4) Weighted Average Book Yield(5) Prudential of Japan $11.3 $0.5 5.3% Gibraltar Life $21.2 $1.3 4.2%
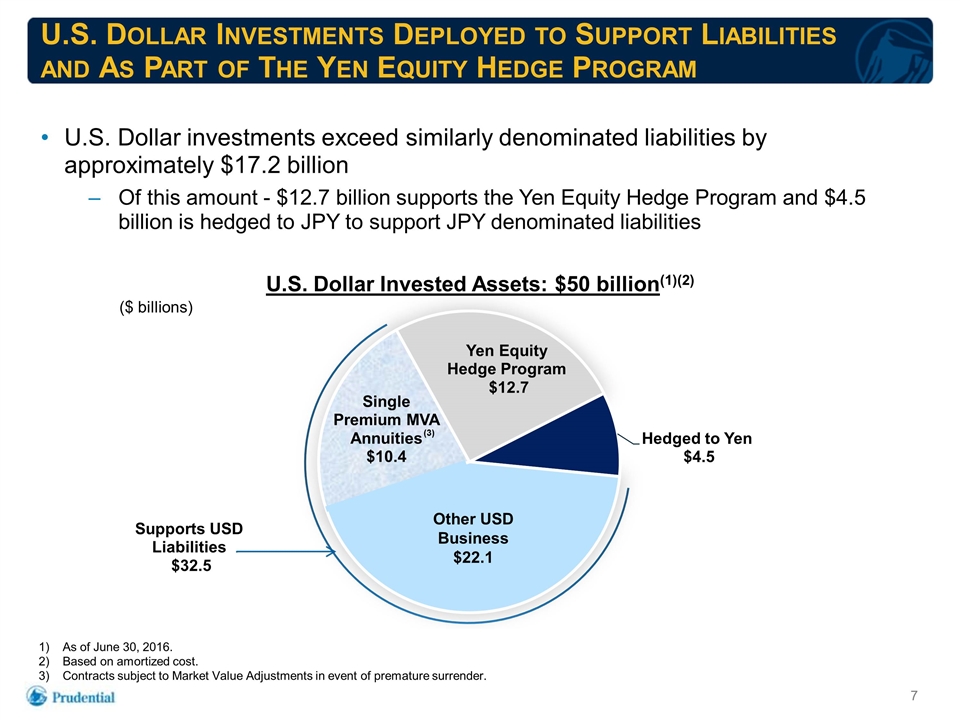
U.S. Dollar Investments Deployed to Support Liabilities and As Part of The Yen Equity Hedge Program As of June 30, 2016. Based on amortized cost. Contracts subject to Market Value Adjustments in event of premature surrender. U.S. Dollar investments exceed similarly denominated liabilities by approximately $17.2 billion Of this amount - $12.7 billion supports the Yen Equity Hedge Program and $4.5 billion is hedged to JPY to support JPY denominated liabilities U.S. Dollar Invested Assets: $50 billion(1)(2) ($ billions) Other USD Business $22.1 (3)
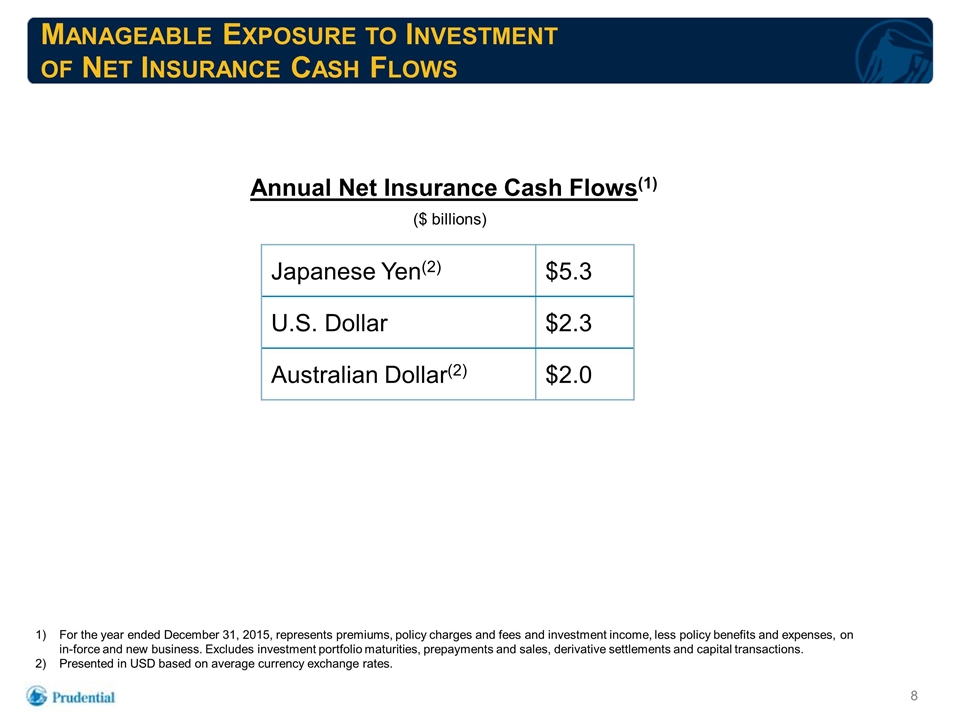
Manageable Exposure to Investment of Net Insurance Cash Flows Annual Net Insurance Cash Flows(1) Japanese Yen(2) $5.3 U.S. Dollar $2.3 Australian Dollar(2) $2.0 For the year ended December 31, 2015, represents premiums, policy charges and fees and investment income, less policy benefits and expenses, on in-force and new business. Excludes investment portfolio maturities, prepayments and sales, derivative settlements and capital transactions. Presented in USD based on average currency exchange rates. ($ billions)
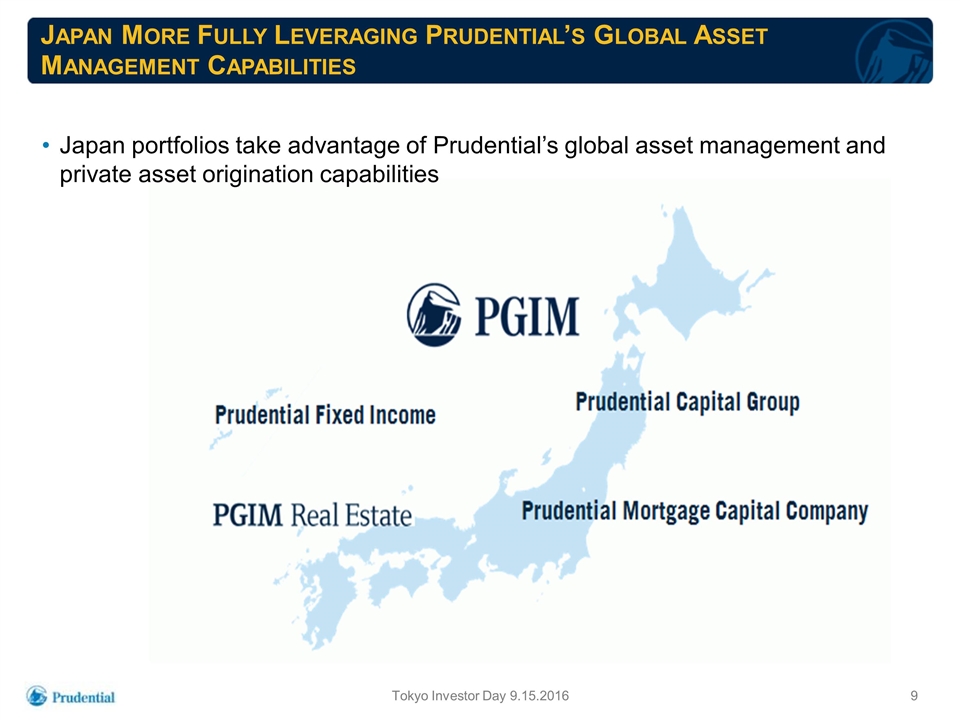
Japan More Fully Leveraging Prudential’s Global Asset Management Capabilities Japan portfolios take advantage of Prudential’s global asset management and private asset origination capabilities Tokyo Investor Day 9.15.2016
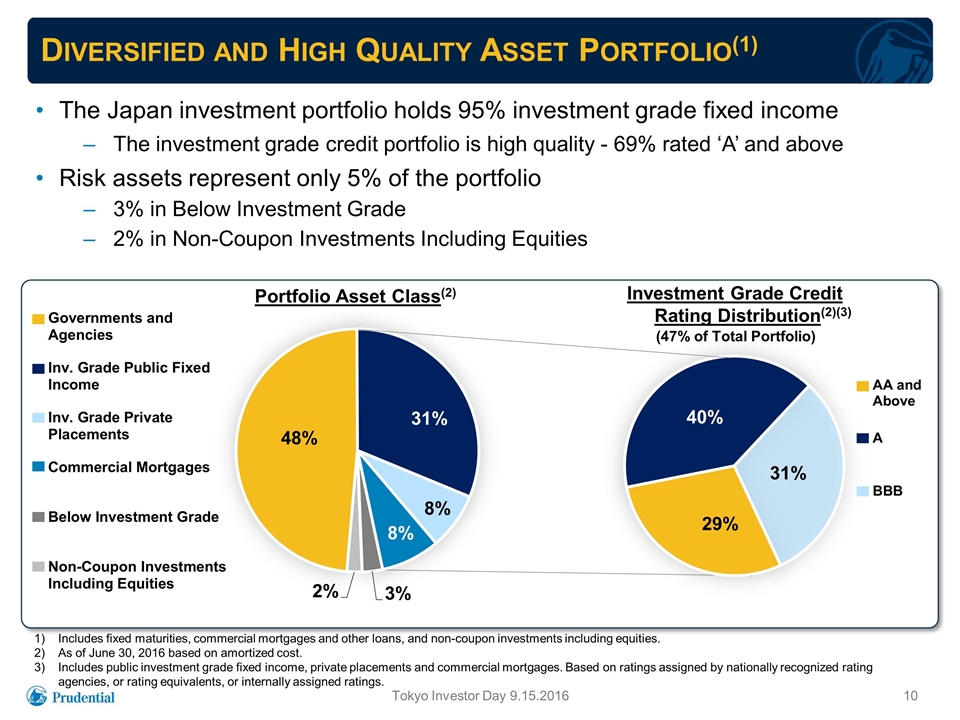
Portfolio Asset Class(2) Investment Grade Credit Rating Distribution(2)(3) Includes fixed maturities, commercial mortgages and other loans, and non-coupon investments including equities. As of June 30, 2016 based on amortized cost. Includes public investment grade fixed income, private placements and commercial mortgages. Based on ratings assigned by nationally recognized rating agencies, or rating equivalents, or internally assigned ratings. Diversified and High Quality Asset Portfolio(1) The Japan investment portfolio holds 95% investment grade fixed income The investment grade credit portfolio is high quality - 69% rated ‘A’ and above Risk assets represent only 5% of the portfolio 3% in Below Investment Grade 2% in Non-Coupon Investments Including Equities 0 (47% of Total Portfolio) Tokyo Investor Day 9.15.2016 31% 29% 40%
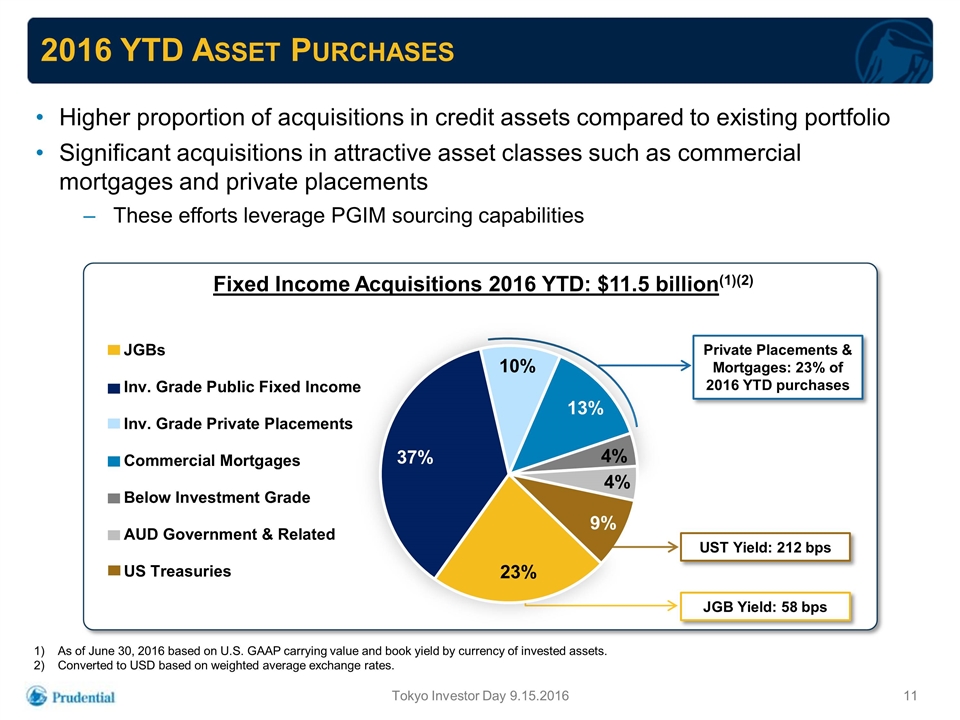
2016 YTD Asset Purchases Tokyo Investor Day 9.15.2016 Fixed Income Acquisitions 2016 YTD: $11.5 billion(1)(2) As of June 30, 2016 based on U.S. GAAP carrying value and book yield by currency of invested assets. Converted to USD based on weighted average exchange rates. Higher proportion of acquisitions in credit assets compared to existing portfolio Significant acquisitions in attractive asset classes such as commercial mortgages and private placements These efforts leverage PGIM sourcing capabilities UST Yield: 212 bps JGB Yield: 58 bps Private Placements & Mortgages: 23% of 2016 YTD purchases
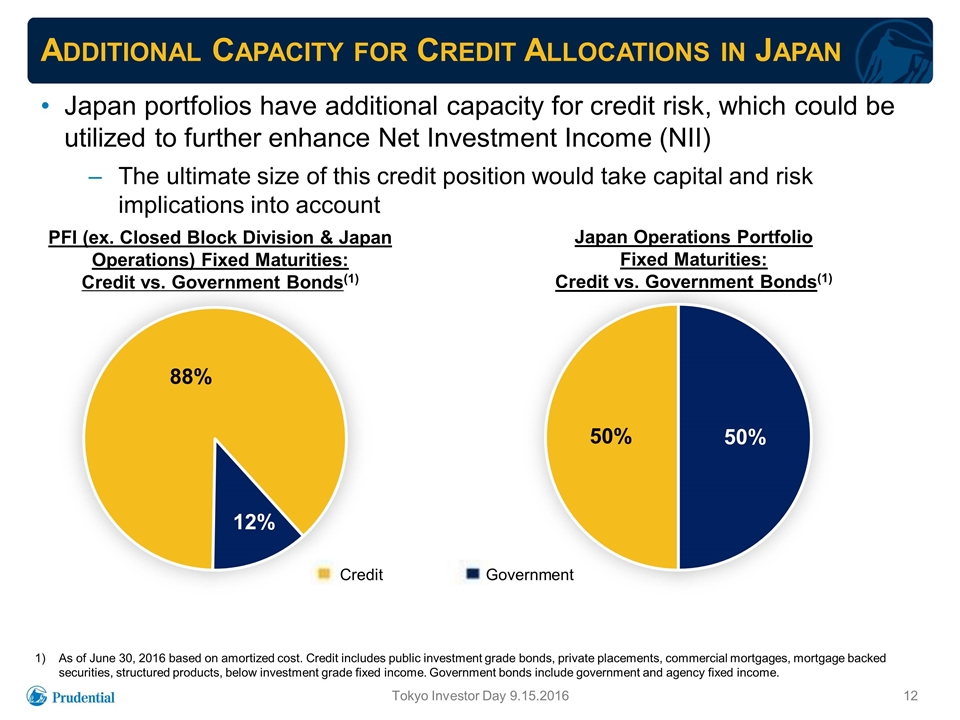
Additional Capacity for Credit Allocations in Japan Japan portfolios have additional capacity for credit risk, which could be utilized to further enhance Net Investment Income (NII) The ultimate size of this credit position would take capital and risk implications into account 12 Tokyo Investor Day 9.15.2016 Japan Operations Portfolio Fixed Maturities: Credit vs. Government Bonds(1) PFI (ex. Closed Block Division & Japan Operations) Fixed Maturities: Credit vs. Government Bonds(1) As of June 30, 2016 based on amortized cost. Credit includes public investment grade bonds, private placements, commercial mortgages, mortgage backed securities, structured products, below investment grade fixed income. Government bonds include government and agency fixed income. 88% 12% 50% 50% Credit Government
Conclusion Strong ALM focus coupled with product portfolio currency mix and emphasis on mortality and expense margins limits exposure of overall returns to Yen investment yields Pace and mix of reinvestment flows reduce impact of current market conditions Diversified high quality investment portfolio Leveraging Prudential’s strong global asset management capabilities Additional capacity to enhance yield by increased allocation to credit Tokyo Investor Day 9.15.2016

Rob Falzon Executive Vice President and Chief Financial Officer Prudential Financial, Inc. Prudential International Insurance Financial Overview
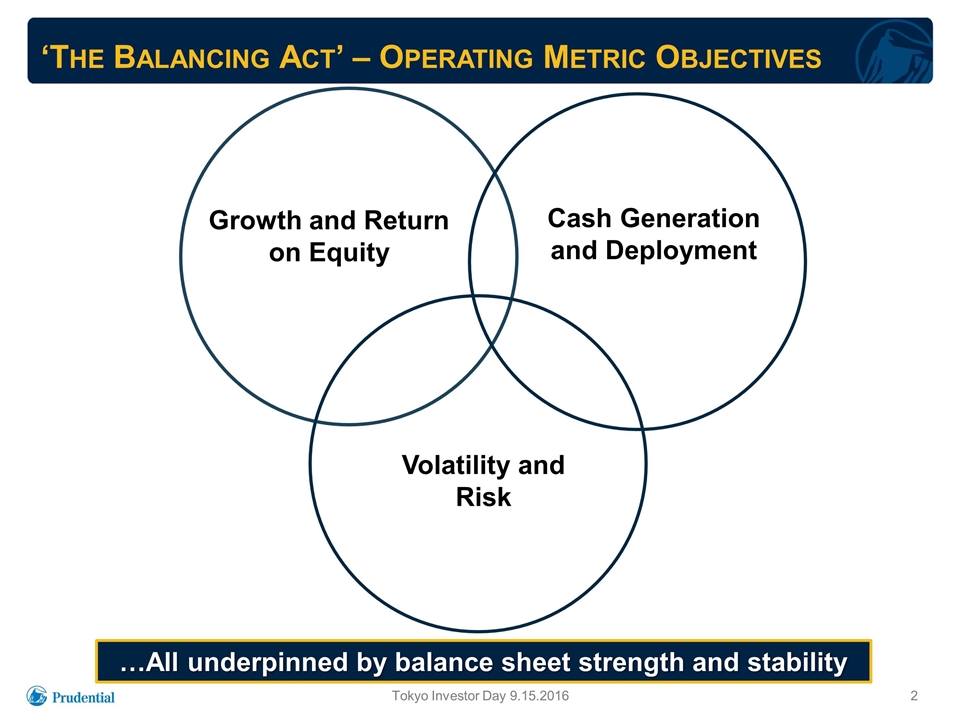
‘The Balancing Act’ – Operating Metric Objectives Tokyo Investor Day 9.15.2016 …All underpinned by balance sheet strength and stability Growth and Return on Equity Cash Generation and Deployment Volatility and Risk
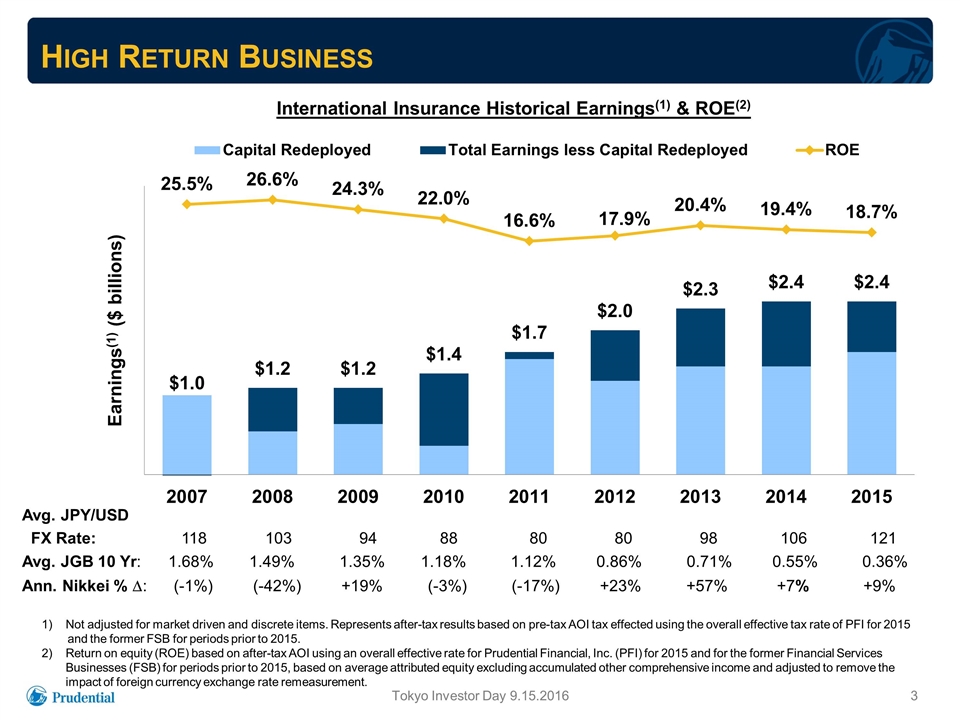
High Return Business Tokyo Investor Day 9.15.2016 1)Not adjusted for market driven and discrete items. Represents after-tax results based on pre-tax AOI tax effected using the overall effective tax rate of PFI for 2015 and the former FSB for periods prior to 2015. Return on equity (ROE) based on after-tax AOI using an overall effective rate for Prudential Financial, Inc. (PFI) for 2015 and for the former Financial Services Businesses (FSB) for periods prior to 2015, based on average attributed equity excluding accumulated other comprehensive income and adjusted to remove the impact of foreign currency exchange rate remeasurement. Earnings(1) ($ billions) International Insurance Historical Earnings(1) & ROE(2) Avg. JPY/USD FX Rate: 118 103 94 88 80 80 98 106 121 Avg. JGB 10 Yr: 1.68% 1.49% 1.35% 1.18% 1.12% 0.86% 0.71% 0.55% 0.36% Ann. Nikkei % D: (-1%) (-42%) +19% (-3%) (-17%) +23% +57% +7% +9%
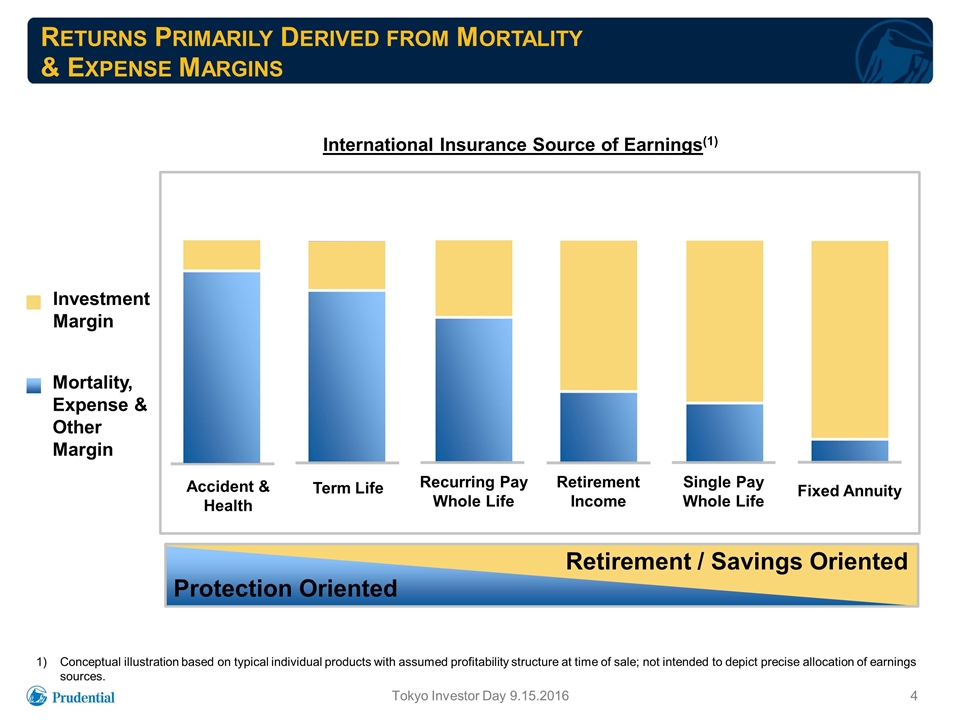
Returns Primarily Derived from Mortality & Expense Margins Tokyo Investor Day 9.15.2016 Conceptual illustration based on typical individual products with assumed profitability structure at time of sale; not intended to depict precise allocation of earnings sources. Mortality, Expense & Other Margin Investment Margin Retirement / Savings Oriented International Insurance Source of Earnings(1) Protection Oriented Term Life Accident & Health Recurring Pay Whole Life Retirement Income Fixed Annuity Single Pay Whole Life
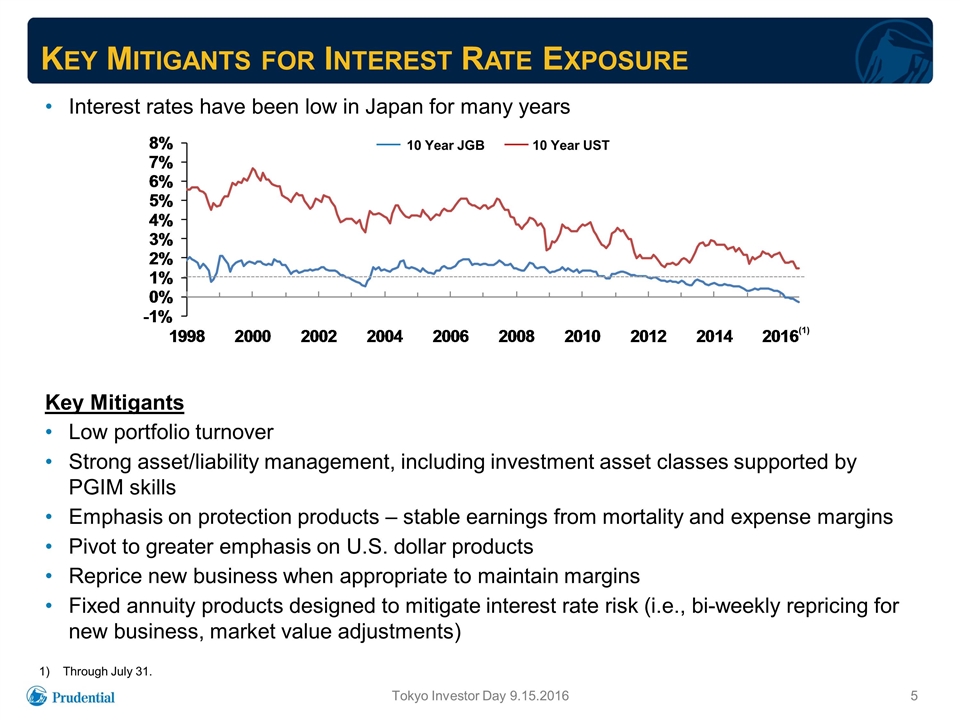
Key Mitigants for Interest Rate Exposure Tokyo Investor Day 9.15.2016 Interest rates have been low in Japan for many years Key Mitigants Low portfolio turnover Strong asset/liability management, including investment asset classes supported by PGIM skills Emphasis on protection products – stable earnings from mortality and expense margins Pivot to greater emphasis on U.S. dollar products Reprice new business when appropriate to maintain margins Fixed annuity products designed to mitigate interest rate risk (i.e., bi-weekly repricing for new business, market value adjustments) Through July 31. (1) 10 Year JGB 10 Year UST
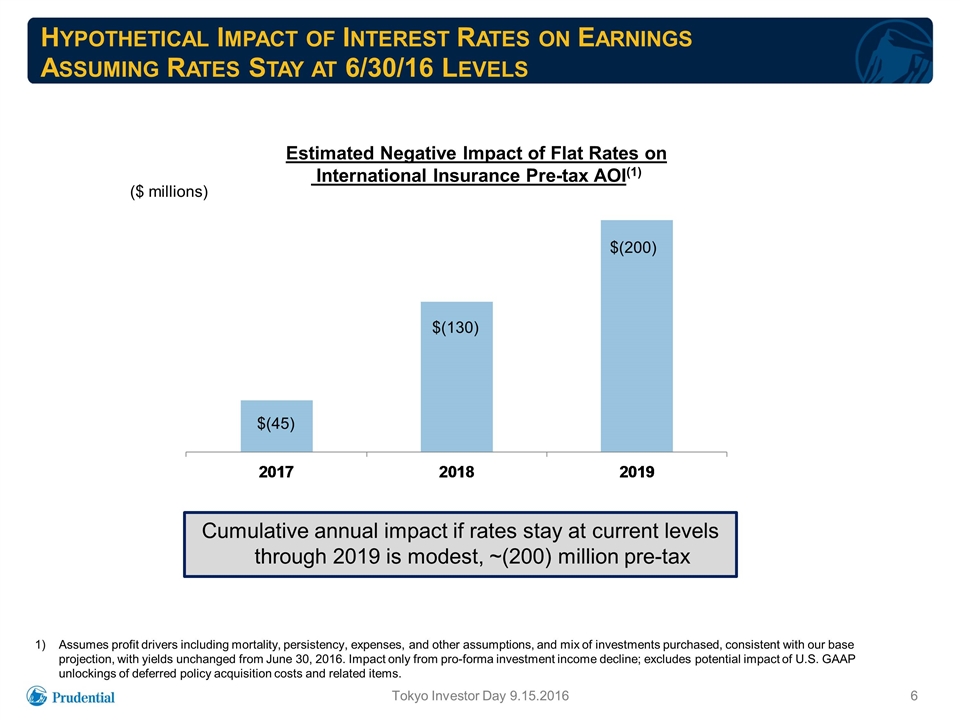
Hypothetical Impact of Interest Rates on Earnings Assuming Rates Stay at 6/30/16 Levels Assumes profit drivers including mortality, persistency, expenses, and other assumptions, and mix of investments purchased, consistent with our base projection, with yields unchanged from June 30, 2016. Impact only from pro-forma investment income decline; excludes potential impact of U.S. GAAP unlockings of deferred policy acquisition costs and related items. Tokyo Investor Day 9.15.2016 $(45) $(130) $(200) ($ millions) Estimated Negative Impact of Flat Rates on International Insurance Pre-tax AOI(1) Cumulative annual impact if rates stay at current levels through 2019 is modest, ~(200) million pre-tax
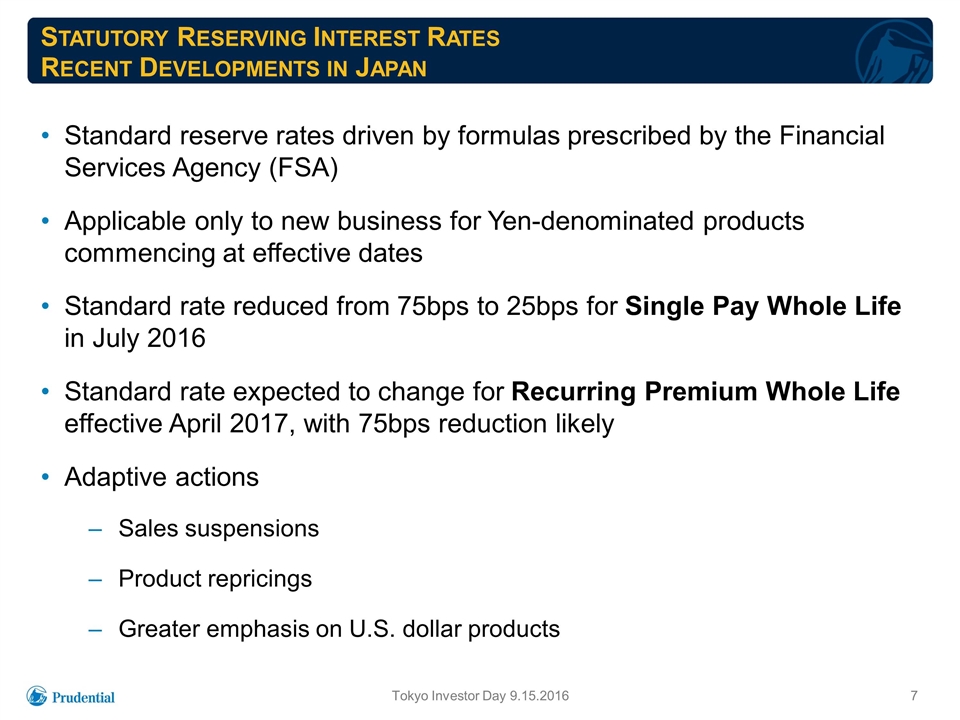
Statutory Reserving Interest Rates Recent Developments in Japan Tokyo Investor Day 9.15.2016 Standard reserve rates driven by formulas prescribed by the Financial Services Agency (FSA) Applicable only to new business for Yen-denominated products commencing at effective dates Standard rate reduced from 75bps to 25bps for Single Pay Whole Life in July 2016 Standard rate expected to change for Recurring Premium Whole Life effective April 2017, with 75bps reduction likely Adaptive actions Sales suspensions Product repricings Greater emphasis on U.S. dollar products
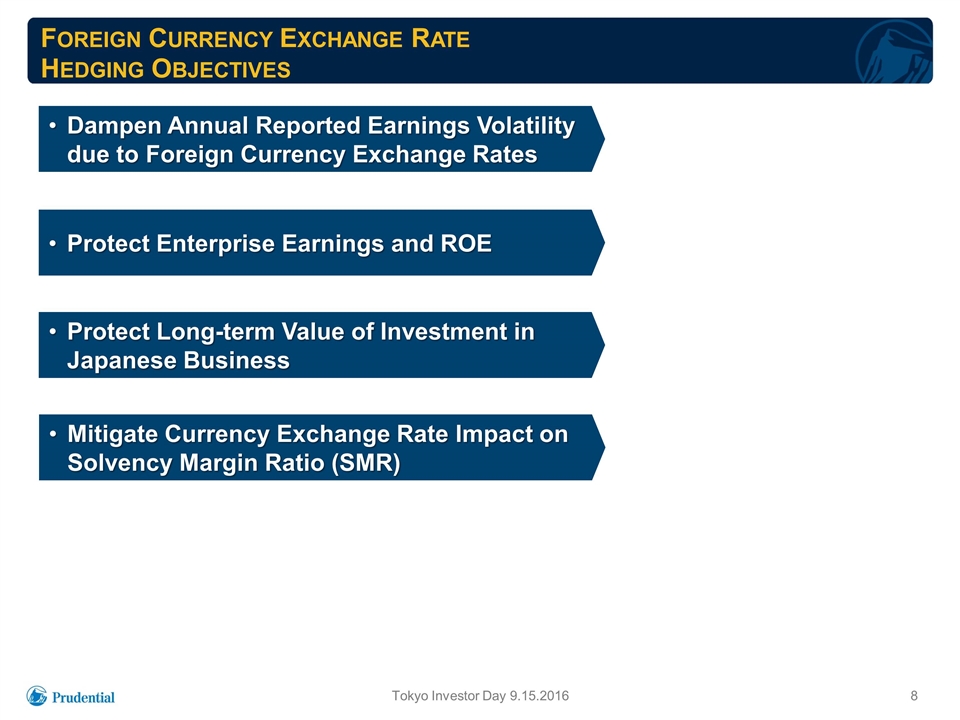
Foreign Currency Exchange Rate Hedging Objectives Tokyo Investor Day 9.15.2016 Protect Enterprise Earnings and ROE Protect Long-term Value of Investment in Japanese Business Mitigate Currency Exchange Rate Impact on Solvency Margin Ratio (SMR) Dampen Annual Reported Earnings Volatility due to Foreign Currency Exchange Rates
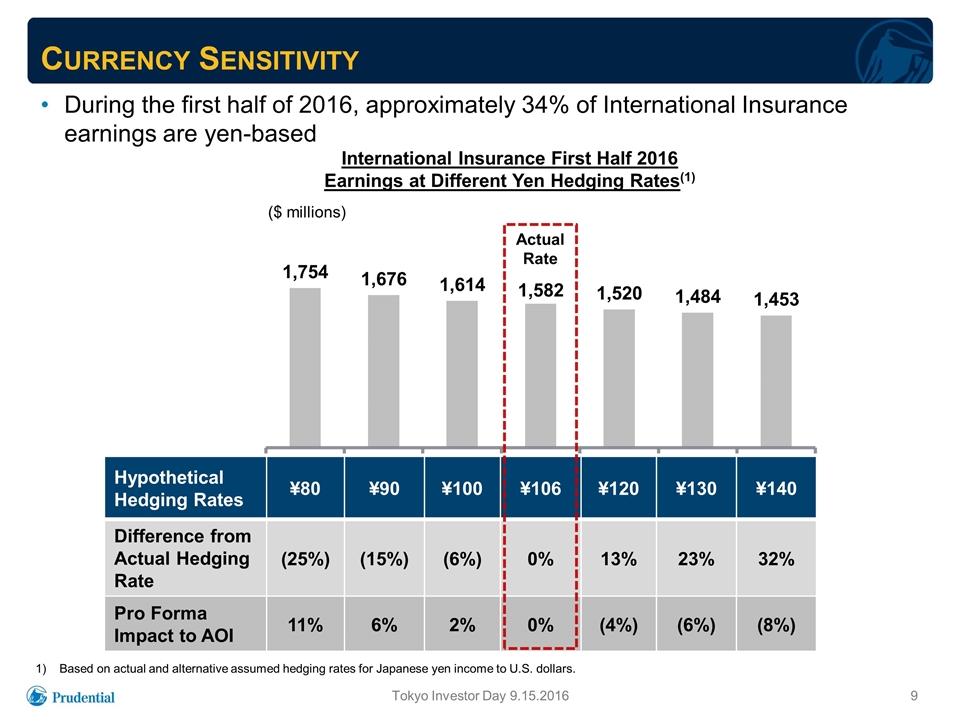
During the first half of 2016, approximately 34% of International Insurance earnings are yen-based Currency Sensitivity Tokyo Investor Day 9.15.2016 International Insurance First Half 2016 Earnings at Different Yen Hedging Rates(1) ($ millions) Hypothetical Hedging Rates ¥80 ¥90 ¥100 ¥106 ¥120 ¥130 ¥140 Difference from Actual Hedging Rate (25%) (15%) (6%) 0% 13% 23% 32% Pro Forma Impact to AOI 11% 6% 2% 0% (4%) (6%) (8%) Based on actual and alternative assumed hedging rates for Japanese yen income to U.S. dollars. Actual Rate
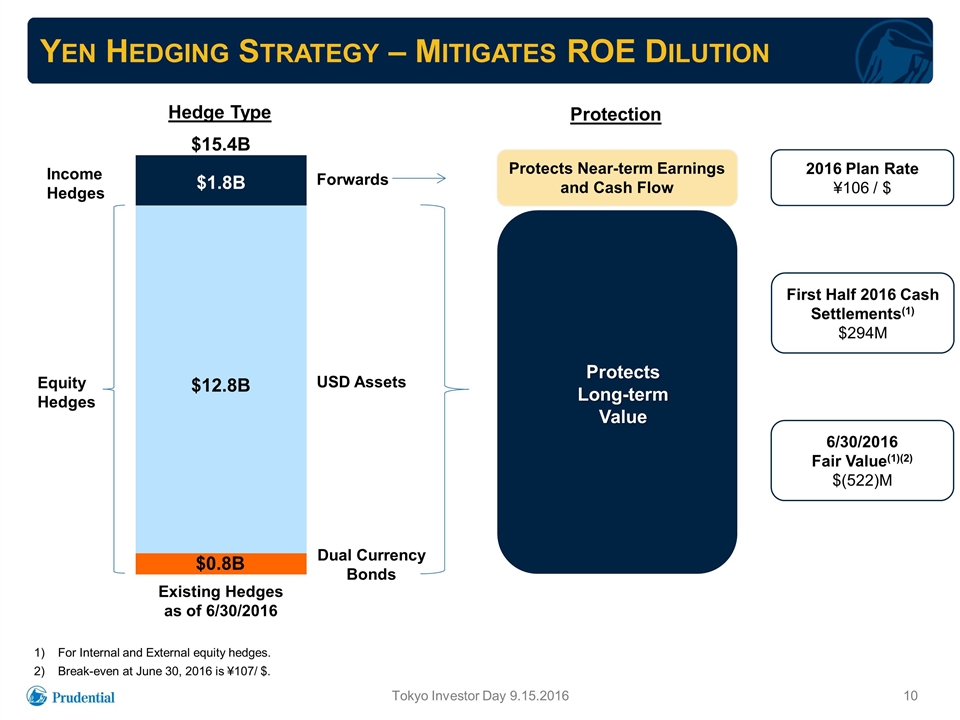
For Internal and External equity hedges. Break-even at June 30, 2016 is ¥107/ $. Protection Protects Near-term Earnings and Cash Flow Protects Long-term Value Yen Hedging Strategy – Mitigates ROE Dilution Income Hedges $15.4B Equity Hedges $1.8B $12.8B $0.8B Forwards USD Assets Dual Currency Bonds Existing Hedges as of 6/30/2016 Hedge Type 2016 Plan Rate ¥106 / $ First Half 2016 Cash Settlements(1) $294M 6/30/2016 Fair Value(1)(2) $(522)M Tokyo Investor Day 9.15.2016
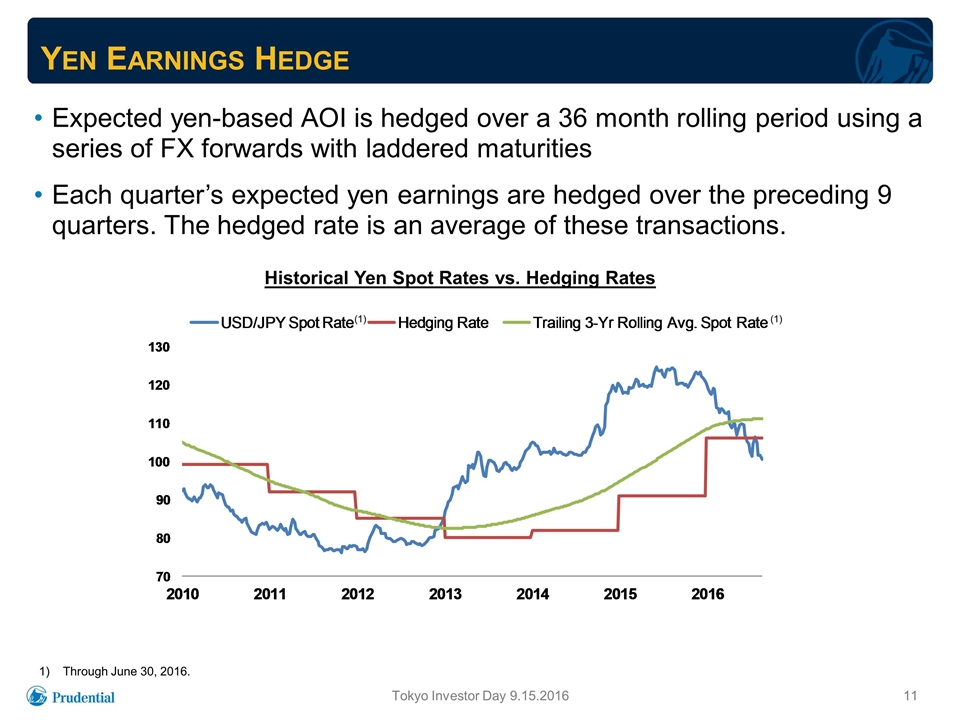
Yen Earnings Hedge Tokyo Investor Day 9.15.2016 Historical Yen Spot Rates vs. Hedging Rates (¥) ¥99 ¥92 ¥85 ¥80 ¥82 Expected yen-based AOI is hedged over a 36 month rolling period using a series of FX forwards with laddered maturities Each quarter’s expected yen earnings are hedged over the preceding 9 quarters. The hedged rate is an average of these transactions. ¥91 ¥106 Through June 30, 2016. (1) (1)
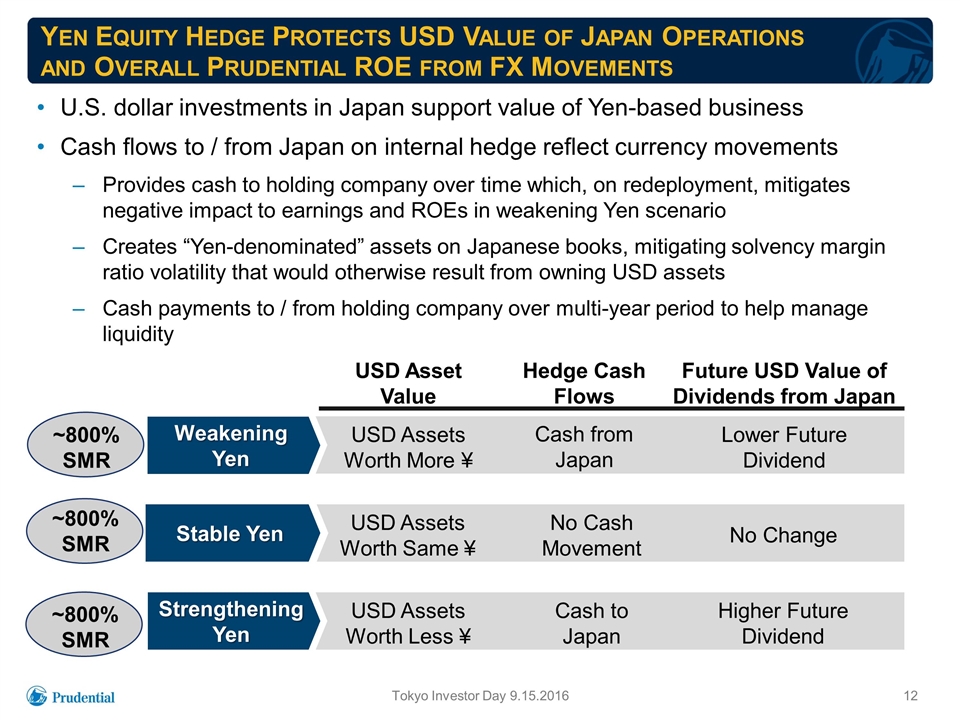
Yen Equity Hedge Protects USD Value of Japan Operations and Overall Prudential ROE from FX Movements Tokyo Investor Day 9.15.2016 U.S. dollar investments in Japan support value of Yen-based business Cash flows to / from Japan on internal hedge reflect currency movements Provides cash to holding company over time which, on redeployment, mitigates negative impact to earnings and ROEs in weakening Yen scenario Creates “Yen-denominated” assets on Japanese books, mitigating solvency margin ratio volatility that would otherwise result from owning USD assets Cash payments to / from holding company over multi-year period to help manage liquidity ~800% SMR Weakening Yen USD Assets Worth More ¥ Cash from Japan Lower Future Dividend ~800% SMR Stable Yen USD Assets Worth Same ¥ No Cash Movement No Change ~800% SMR Strengthening Yen USD Assets Worth Less ¥ Cash to Japan Higher Future Dividend USD Asset Value Hedge Cash Flows Future USD Value of Dividends from Japan
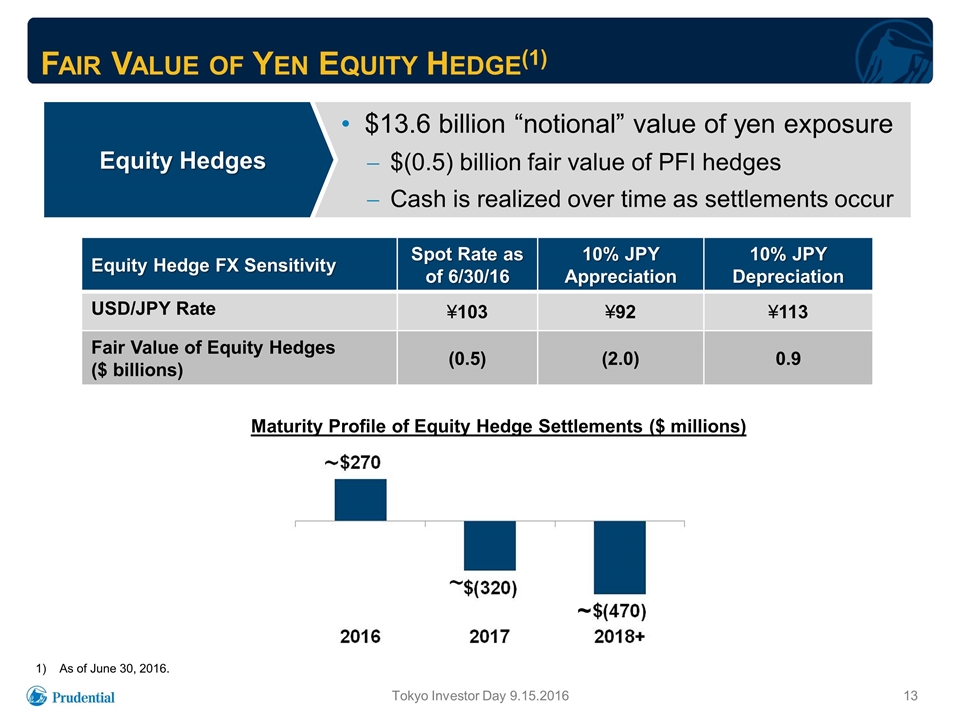
Fair Value of Yen Equity Hedge(1) Tokyo Investor Day 9.15.2016 Equity Hedges $13.6 billion “notional” value of yen exposure $(0.5) billion fair value of PFI hedges Cash is realized over time as settlements occur Equity Hedge FX Sensitivity Spot Rate as of 6/30/16 10% JPY Appreciation 10% JPY Depreciation USD/JPY Rate ¥103 ¥92 ¥113 Fair Value of Equity Hedges ($ billions) (0.5) (2.0) 0.9 Maturity Profile of Equity Hedge Settlements ($ millions) As of June 30, 2016. ~
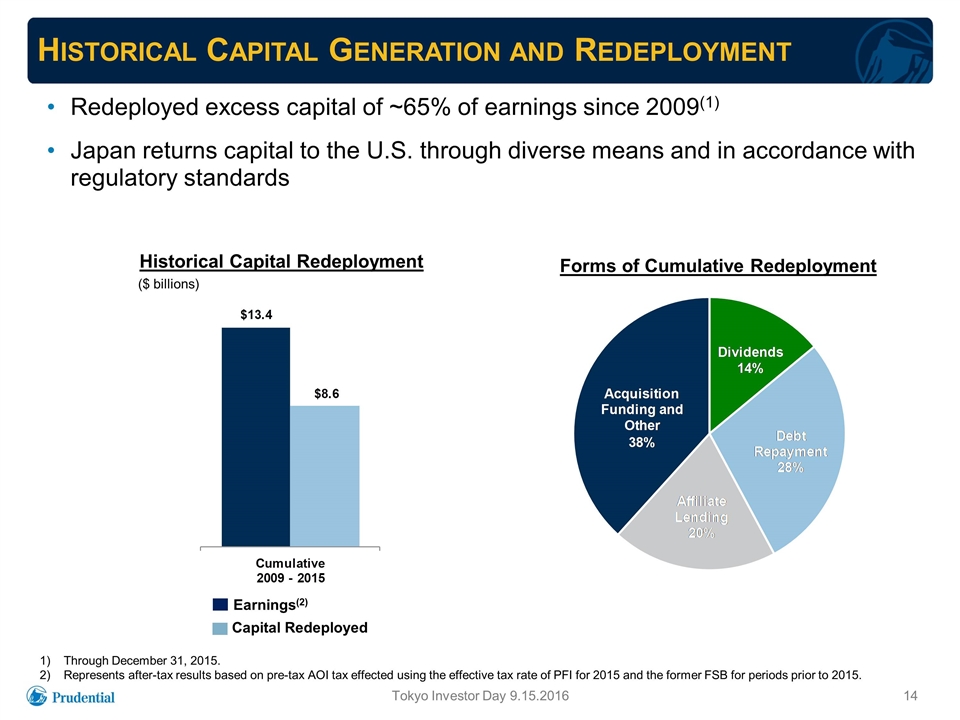
Historical Capital Generation and Redeployment Tokyo Investor Day 9.15.2016 Through December 31, 2015. Represents after-tax results based on pre-tax AOI tax effected using the effective tax rate of PFI for 2015 and the former FSB for periods prior to 2015. Redeployed excess capital of ~65% of earnings since 2009(1) Japan returns capital to the U.S. through diverse means and in accordance with regulatory standards ($ billions) Historical Capital Redeployment Forms of Cumulative Redeployment Capital Redeployed Earnings(2)
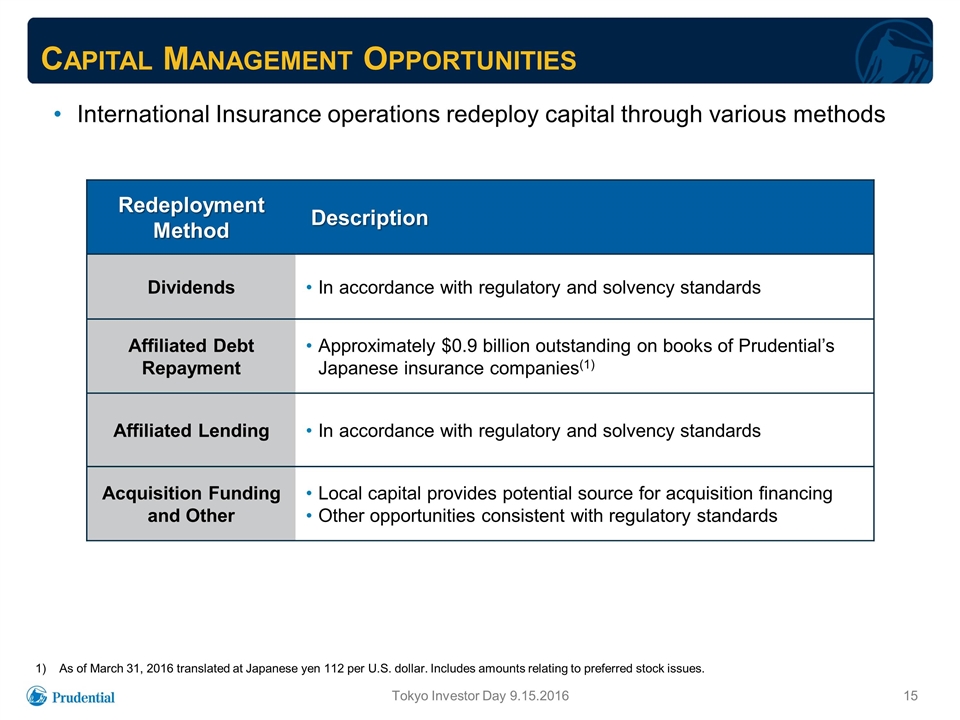
Capital Management Opportunities Redeployment Method Description Dividends In accordance with regulatory and solvency standards Affiliated Debt Repayment Approximately $0.9 billion outstanding on books of Prudential’s Japanese insurance companies(1) Affiliated Lending In accordance with regulatory and solvency standards Acquisition Funding and Other Local capital provides potential source for acquisition financing Other opportunities consistent with regulatory standards As of March 31, 2016 translated at Japanese yen 112 per U.S. dollar. Includes amounts relating to preferred stock issues. International Insurance operations redeploy capital through various methods Tokyo Investor Day 9.15.2016
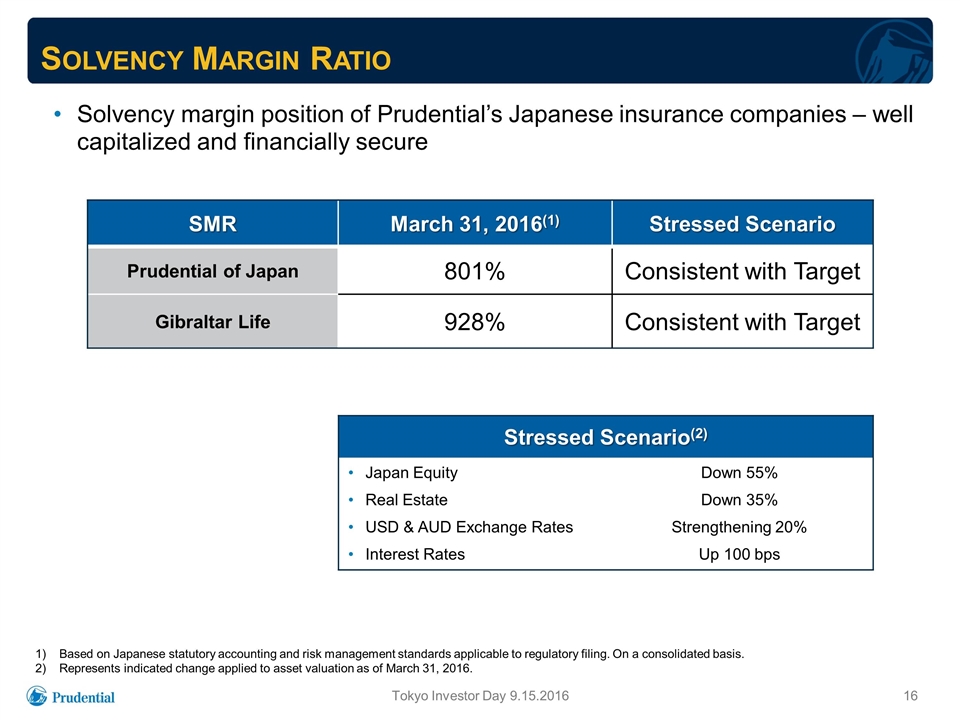
Solvency Margin Ratio SMR March 31, 2016(1) Stressed Scenario Prudential of Japan 801% Consistent with Target Gibraltar Life 928% Consistent with Target Based on Japanese statutory accounting and risk management standards applicable to regulatory filing. On a consolidated basis. Represents indicated change applied to asset valuation as of March 31, 2016. Solvency margin position of Prudential’s Japanese insurance companies – well capitalized and financially secure Stressed Scenario(2) Japan Equity Real Estate USD & AUD Exchange Rates Interest Rates Down 55% Down 35% Strengthening 20% Up 100 bps Tokyo Investor Day 9.15.2016
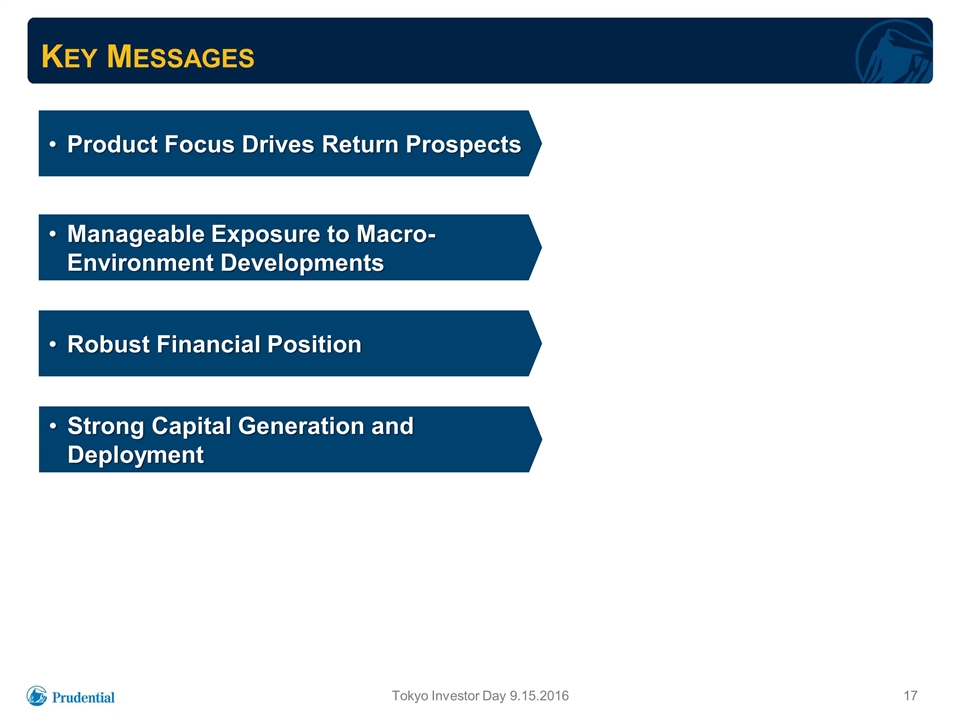
Key Messages Tokyo Investor Day 9.15.2016 Manageable Exposure to Macro-Environment Developments Robust Financial Position Strong Capital Generation and Deployment Product Focus Drives Return Prospects 17


