
Prudential Financial, Inc. 2017 Investor Day June 6, 2017 Exhibit 99.1

Prudential Financial, Inc. 2017 Investor Day Mark Finkelstein Senior Vice President Investor Relations
Forward Looking Statements and Non-GAAP Measures Certain of the statements included in this presentation constitute forward-looking statements within the meaning of the U. S. Private Securities Litigation Reform Act of 1995. Words such as “expects,” “believes,” “anticipates,” “includes,” “plans,” “assumes,” “estimates,” “projects,” “intends,” “should,” “will,” “shall,” or variations of such words are generally part of forward-looking statements. Forward-looking statements are made based on management’s current expectations and beliefs concerning future developments and their potential effects upon Prudential Financial, Inc. and its subsidiaries. There can be no assurance that future developments affecting Prudential Financial, Inc. and its subsidiaries will be those anticipated by management. These forward-looking statements are not a guarantee of future performance and involve risks and uncertainties. Certain important factors that could cause actual results to differ, possibly materially, from expectations or estimates reflected in such forward-looking statements can be found in the “Risk Factors” section included in Prudential Financial, Inc.’s Annual Report on Form 10-K for the year ended December 31, 2016. Prudential Financial, Inc. does not intend, and is under no obligation, to update any particular forward-looking statement included in this presentation. This presentation also includes references to adjusted operating income and adjusted book value, as well as operating return on average equity, which is based on adjusted operating income and adjusted book value. Consolidated adjusted operating income and adjusted book value are not calculated based on accounting principles generally accepted in the United States of America (GAAP). For additional information about adjusted operating income, adjusted book value and the comparable GAAP measures, including a reconciliation between the comparable measures, please refer to our quarterly results news releases, which are available on our Web site at www.investor.prudential.com. Reconciliations are also included as part of this presentation. ______________________________________________________________________________ Prudential Financial, Inc. of the United States is not affiliated with Prudential plc which is headquartered in the United Kingdom. Investor Day 6.6.2017
PGIM Disclosures Consider a fund's investment objectives, risks, charges and expenses carefully before investing. The prospectus and summary prospectus contain this and other information about the fund. For more information about a fund, click on the prospectus or summary prospectus link above. Read them carefully before investing. Investing in mutual funds involves risk. The investment return and principal value will fluctuate, and shares, when sold, may be worth more or less than their original cost. Some investment products have more risk than others. The risks associated with each fund are explained more fully in each fund’s respective prospectus and summary prospectus. There is no guarantee that a Fund’s objectives will be achieved. Class Q and Class Z shares are available to individual investors through certain retirement, mutual fund wrap and asset allocation programs, and to institutions at an investment minimum of $5,000,000. Please see the current prospectus for more detailed information. This information has been prepared by PGIM, Inc.("PGIM"). PGIM is the primary asset management business of Prudential Financial, Inc.(“PFI”) and is a registered investment advisor with the US Securities and Exchange Commission. PFI, a company with corporate headquarters in the US, is not affiliated in any manner with Prudential plc, a company incorporated in the United Kingdom. These materials represent the views, opinions and recommendations of the author(s) regarding the economic conditions, asset classes, securities, issuers, or financial instruments referenced herein. Distribution of this information to any person other than the person to whom it was originally delivered and to such person’s advisers is unauthorized, and any reproduction of these materials, in whole or in part, or the divulgence of any of the contents hereof, without prior consent of PGIM, is prohibited. Certain information contained herein has been obtained from sources that PGIM believes to be reliable as of the date presented; however, PGIM cannot guarantee the accuracy of such information, assure its completeness, or warrant such information will not be changed. The information contained herein is current as of the date of issuance (or such earlier date as referenced herein) and is subject to change without notice. PGIM has no obligation to update any or all of such information; nor do we make any express or implied warranties or representations as to the completeness or accuracy or accept responsibility for errors. These materials are not intended as an offer or solicitation with respect to the purchase or sale of any security or other financial instrument or any investment management services and should not be used as the basis for any investment decision. Past performance is not a guarantee or a reliable indicator of future results. No liability whatsoever is accepted for any loss (whether direct, indirect, or consequential) that may arise from any use of the information contained in or derived from this report. These materials do not take into account individual client circumstances, objectives, or needs, and are not intended as recommendations of particular securities, financial instruments, or strategies to particular clients or prospects. No determination has been made regarding the suitability of any securities, financial instruments, or strategies for particular clients or prospects. For any securities or financial instruments mentioned herein, the recipient(s) of this report must make its own independent decisions. Distribution of this information to any person other than the person to whom it was originally delivered is unauthorized and any reproduction of these materials, in whole and in part, without prior consent of PGIM is prohibited. Investor Day 6.6.2017
PGIM Disclosures (cont.) The Morningstar Rating for funds, or "star rating", is calculated for mutual funds with at least a three-year history. Exchange-traded funds and open-ended mutual funds are considered a single population for comparative purposes. It is calculated based on a Morningstar Risk-Adjusted Return measure that accounts for variation in a managed product's monthly excess performance, placing more emphasis on downward variations and rewarding consistent performance. The top 10% of funds in each category receive 5 stars, the next 22.5% receive 4 stars, the next 35% receive 3 stars, the next 22.5% receive 2 stars, and the bottom 10% receive 1 star. The Overall Morningstar Rating for a fund is derived from a weighted average of the performance figures associated with its three-, five-, and 10-year (if applicable) Morningstar Rating metrics. The weights are: 100% three-year rating for 36-59 months of total returns, 60% five-year rating/40% three-year rating for 60-119 months of total returns, and 50% 10-year rating/30% five-year rating/20% three-year rating for 120 or more months of total returns. While the 10-year overall star rating formula seems to give the most weight to the 10-year period, the most recent three-year period actually has the greatest impact because it is included in all three rating periods. © 2017 Morningstar, Inc. All rights reserved. The information contained herein (1) is proprietary to Morningstar and/or its content providers; (2) may not be copied or distributed; and (3) is not warranted to be accurate, complete, or timely. Neither Morningstar nor its content providers are responsible for any damages or losses arising from any use of this information. Past performance does not guarantee future results. Prudential does not review the Morningstar data and, for mutual fund performance, you should check the fund’s current prospectus for the most up-to-date information concerning loads, fees, and expenses. Mutual funds are distributed by Prudential Investment Management Services LLC, a Prudential Financial company and member SIPC. QMA, Jennison Associates and PGIM, Inc. are registered investment advisors and Prudential Financial companies. QMA is the primary business name of Quantitative Management Associates LLC, a wholly owned subsidiary of PGIM, Inc. PGIM Fixed Income and PGIM Real Estate are units of PGIM, Inc. © 2017 Prudential Financial, Inc. and its related entities. QMA, Quantitative Management Associates, Jennison Associates, Jennison, PGIM Real Estate, the Prudential logo, and the Rock symbol are service marks of Prudential Financial, Inc. and its related entities, registered in many jurisdictions worldwide. These materials are for informational or educational purposes only. The information is not intended as investment advice and is not a recommendation about managing or investing your retirement savings. In providing these materials PGIM Investments is not acting as your fiduciary as defined by the Department of Labor. Mutual funds are not insured by the FDIC or any federal government agency, are not a deposit of or guaranteed by any bank or any bank affiliate, and may lose value. Investor Day 6.6.2017
Variable Annuities Cash Flow Assumptions Present value of cash flows reflect total contract cash flows based upon the in force book of business and initial interest rates as of 12/31/16. Excludes any benefit from release of capital and excess reserves. Each scenario reflects impact of our dynamic lapse assumptions on policyholder behavior (lapse rates based upon in-the-moneyness and level of interest rates) Cash flows are shown on a present value basis, are discounted at projected U.S. Treasury rates, and reflect the results of hedging activity Baseline represents current assumptions based on GAAP best estimates as of 12/31/16. The Company updates its assumptions annually in connection with reporting second quarter financial results. Equity market return of 5.6% grading to 8.0% by year 6 and includes 2% dividend yield Interest rates assume a 10 year U.S. Treasury of 2.45% grading to 4.0% by year 10 Policyholder behavior assumptions for guaranteed lifetime withdrawal benefit products only Cash Flows assume Living Benefit Liability is managed using an asset liability management strategy which includes fixed income instruments and derivatives Investor Day 6.6.2017
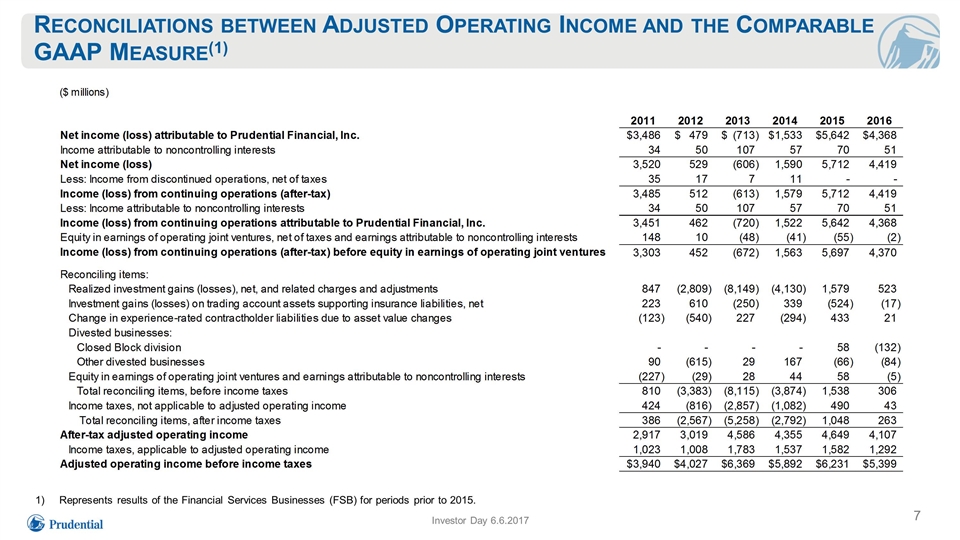
Reconciliations between Adjusted Operating Income and the Comparable GAAP Measure(1) Investor Day 6.6.2017 Represents results of the Financial Services Businesses (FSB) for periods prior to 2015.
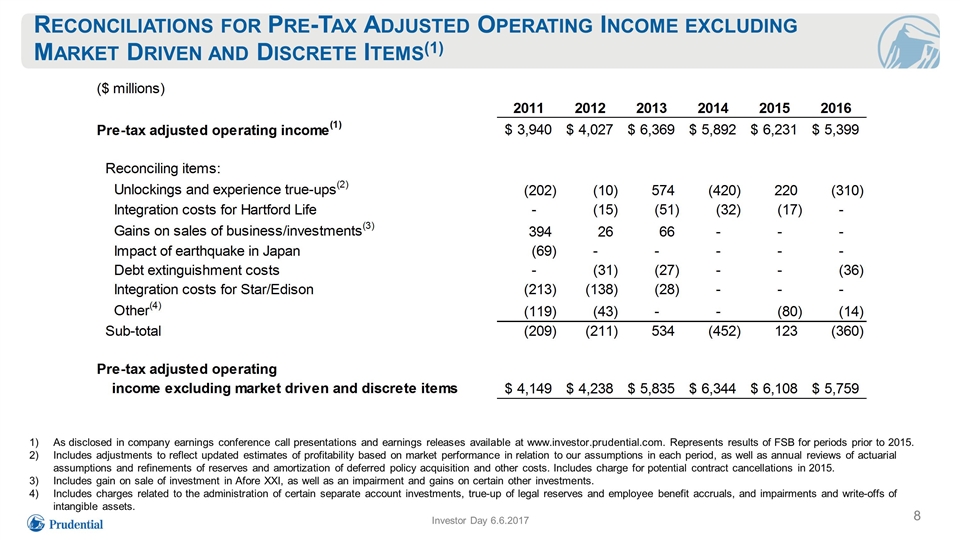
Reconciliations for Pre-Tax Adjusted Operating Income excluding Market Driven and Discrete Items(1) Investor Day 6.6.2017 As disclosed in company earnings conference call presentations and earnings releases available at www.investor.prudential.com. Represents results of FSB for periods prior to 2015. Includes adjustments to reflect updated estimates of profitability based on market performance in relation to our assumptions in each period, as well as annual reviews of actuarial assumptions and refinements of reserves and amortization of deferred policy acquisition and other costs. Includes charge for potential contract cancellations in 2015. Includes gain on sale of investment in Afore XXI, as well as an impairment and gains on certain other investments. Includes charges related to the administration of certain separate account investments, true-up of legal reserves and employee benefit accruals, and impairments and write-offs of intangible assets.
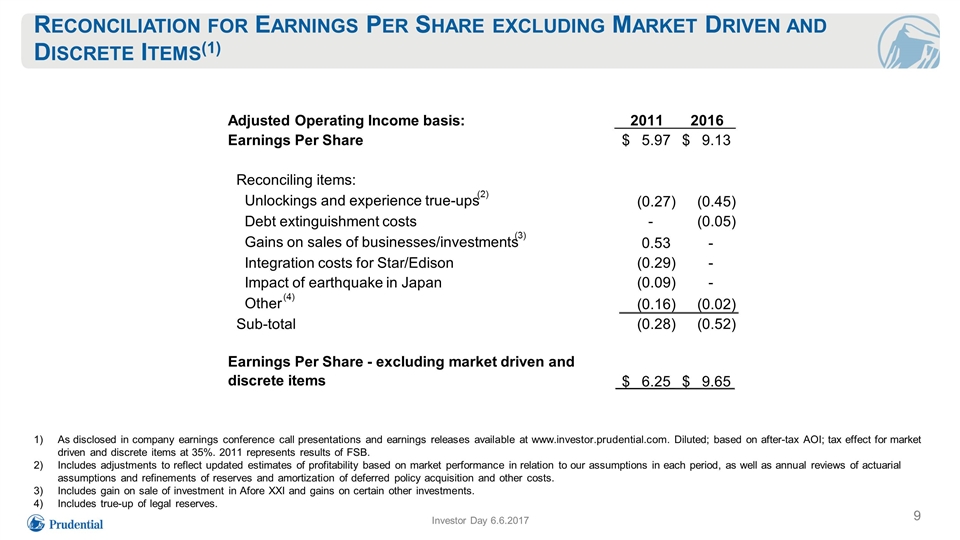
Reconciliation for Earnings Per Share excluding Market Driven and Discrete Items(1) Investor Day 6.6.2017 As disclosed in company earnings conference call presentations and earnings releases available at www.investor.prudential.com. Diluted; based on after-tax AOI; tax effect for market driven and discrete items at 35%. 2011 represents results of FSB. Includes adjustments to reflect updated estimates of profitability based on market performance in relation to our assumptions in each period, as well as annual reviews of actuarial assumptions and refinements of reserves and amortization of deferred policy acquisition and other costs. Includes gain on sale of investment in Afore XXI and gains on certain other investments. Includes true-up of legal reserves. Adjusted Operating Income basis: 2011 2016 Earnings Per Share 5.97 $ 9.13 $ Reconciling items: Unlockings and experience true-ups (2) (0.27) (0.45) Debt extinguishment costs - (0.05) Gains on sales of businesses/investments (3) 0.53 - Integration costs for Star/Edison (0.29) - Impact of earthquake in Japan (0.09) - Other (4) (0.16) (0.02) Sub-total (0.28) (0.52) Earnings Per Share - excluding market driven and discrete items 6.25 $ 9.65 $
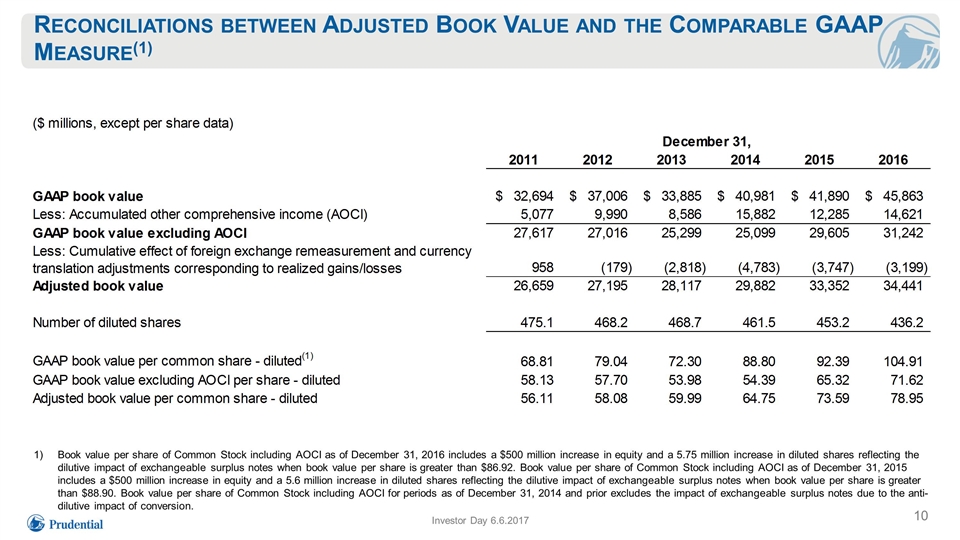
Reconciliations between Adjusted Book Value and the Comparable GAAP Measure(1) Book value per share of Common Stock including AOCI as of December 31, 2016 includes a $500 million increase in equity and a 5.75 million increase in diluted shares reflecting the dilutive impact of exchangeable surplus notes when book value per share is greater than $86.92. Book value per share of Common Stock including AOCI as of December 31, 2015 includes a $500 million increase in equity and a 5.6 million increase in diluted shares reflecting the dilutive impact of exchangeable surplus notes when book value per share is greater than $88.90. Book value per share of Common Stock including AOCI for periods as of December 31, 2014 and prior excludes the impact of exchangeable surplus notes due to the anti-dilutive impact of conversion. Investor Day 6.6.2017
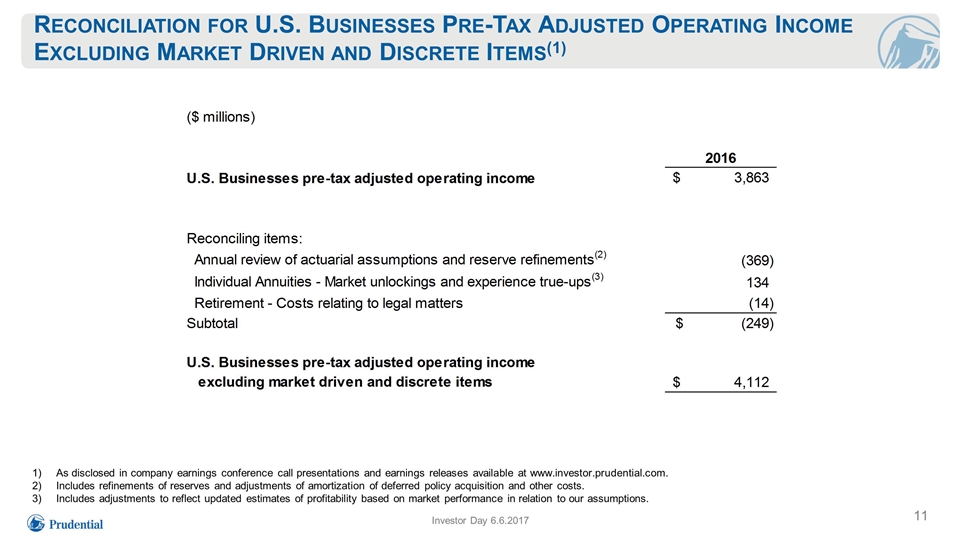
Reconciliation for U.S. Businesses Pre-Tax Adjusted Operating Income Excluding Market Driven and Discrete Items(1) Investor Day 6.6.2017 As disclosed in company earnings conference call presentations and earnings releases available at www.investor.prudential.com. Includes refinements of reserves and adjustments of amortization of deferred policy acquisition and other costs. Includes adjustments to reflect updated estimates of profitability based on market performance in relation to our assumptions.
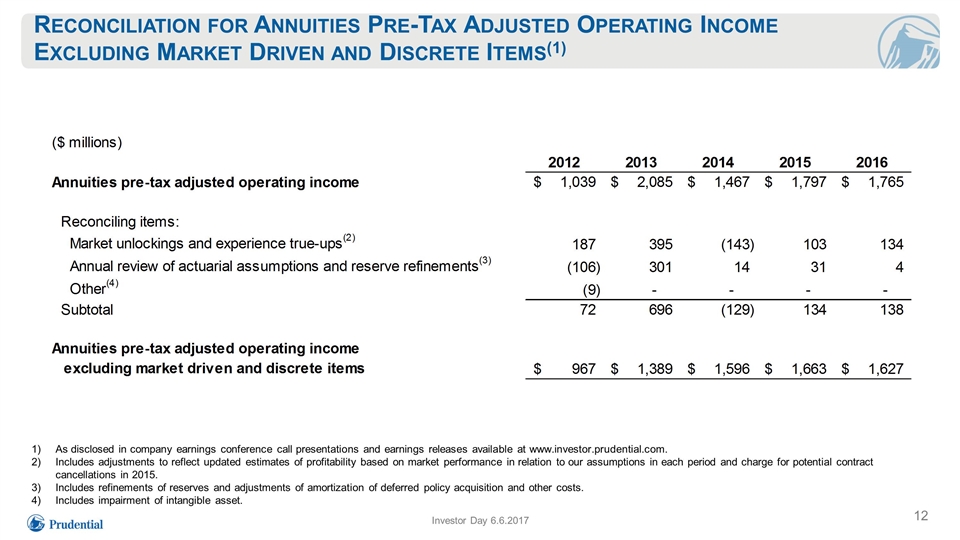
Reconciliation for Annuities Pre-Tax Adjusted Operating Income Excluding Market Driven and Discrete Items(1) Investor Day 6.6.2017 As disclosed in company earnings conference call presentations and earnings releases available at www.investor.prudential.com. Includes adjustments to reflect updated estimates of profitability based on market performance in relation to our assumptions in each period and charge for potential contract cancellations in 2015. Includes refinements of reserves and adjustments of amortization of deferred policy acquisition and other costs. Includes impairment of intangible asset.
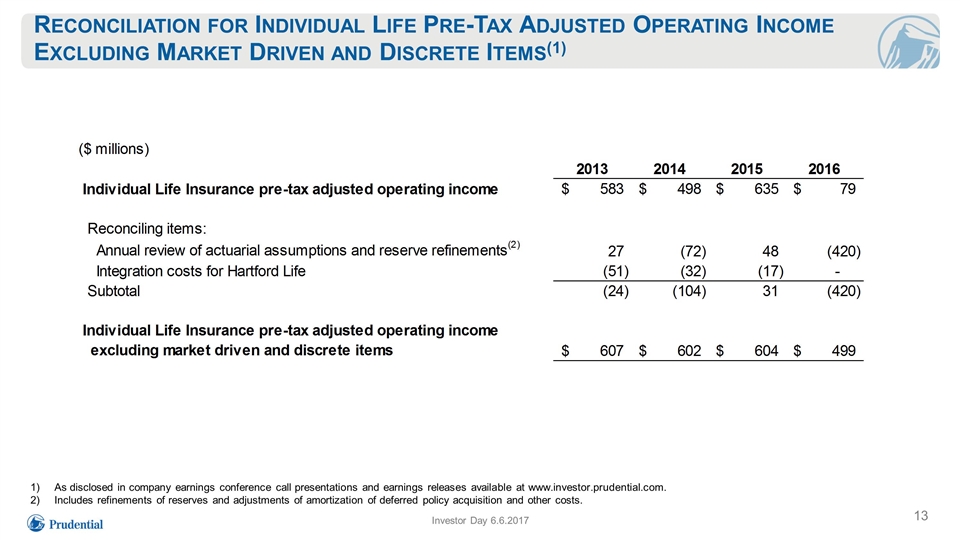
Reconciliation for Individual Life Pre-Tax Adjusted Operating Income Excluding Market Driven and Discrete Items(1) Investor Day 6.6.2017 As disclosed in company earnings conference call presentations and earnings releases available at www.investor.prudential.com. Includes refinements of reserves and adjustments of amortization of deferred policy acquisition and other costs.
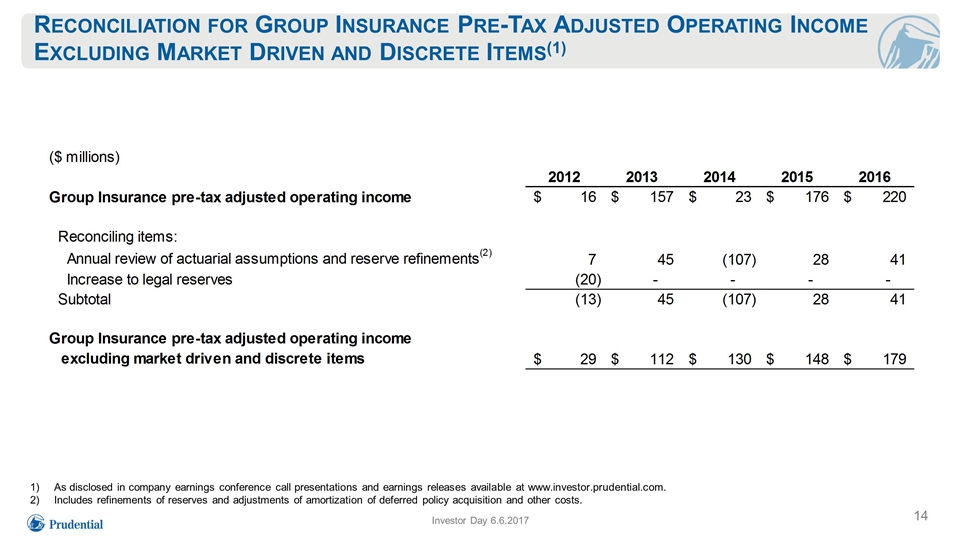
Reconciliation for Group Insurance Pre-Tax Adjusted Operating Income Excluding Market Driven and Discrete Items(1) Investor Day 6.6.2017 As disclosed in company earnings conference call presentations and earnings releases available at www.investor.prudential.com. Includes refinements of reserves and adjustments of amortization of deferred policy acquisition and other costs.

Prudential Financial, Inc. 2017 Investor Day John Strangfeld Chairman & CEO
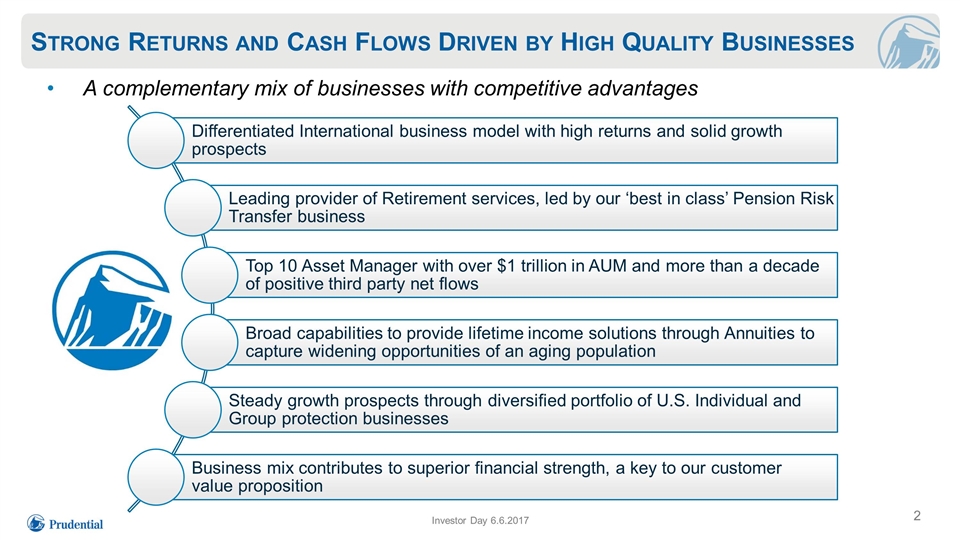
Strong Returns and Cash Flows Driven by High Quality Businesses A complementary mix of businesses with competitive advantages Investor Day 6.6.2017 Differentiated International business model with high returns and solid growth prospects Leading provider of Retirement services, led by our ‘best in class’ Pension Risk Transfer business Top 10 Asset Manager with over $1 trillion in AUM and more than a decade of positive third party net flows Broad capabilities to provide lifetime income solutions through Annuities to capture widening opportunities of an aging population Steady growth prospects through diversified portfolio of U.S. Individual and Group protection businesses Business mix contributes to superior financial strength, a key to our customer value proposition
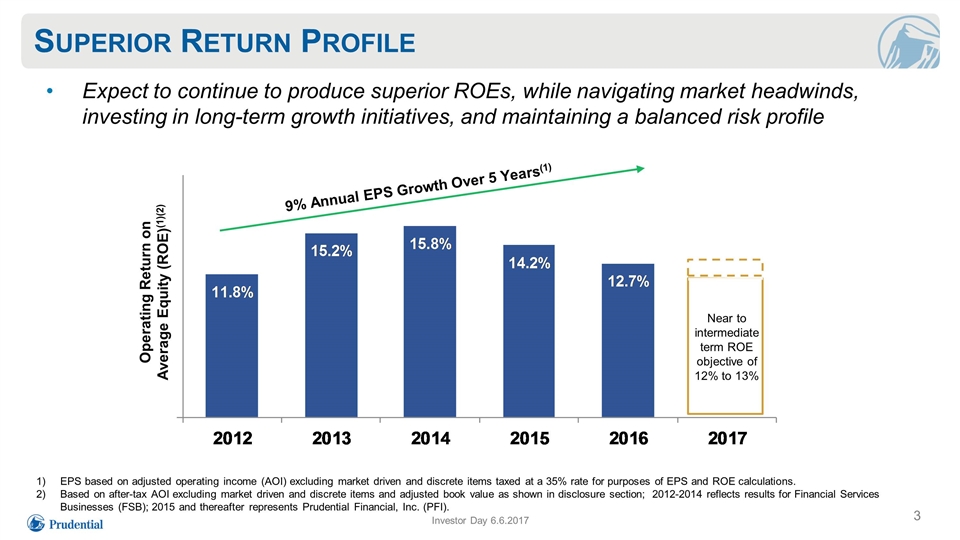
Superior Return Profile EPS based on adjusted operating income (AOI) excluding market driven and discrete items taxed at a 35% rate for purposes of EPS and ROE calculations. Based on after-tax AOI excluding market driven and discrete items and adjusted book value as shown in disclosure section; 2012-2014 reflects results for Financial Services Businesses (FSB); 2015 and thereafter represents Prudential Financial, Inc. (PFI). 9% Annual EPS Growth Over 5 Years(1) Operating Return on Average Equity (ROE)(1)(2) Expect to continue to produce superior ROEs, while navigating market headwinds, investing in long-term growth initiatives, and maintaining a balanced risk profile Near to intermediate term ROE objective of 12% to 13% Investor Day 6.6.2017
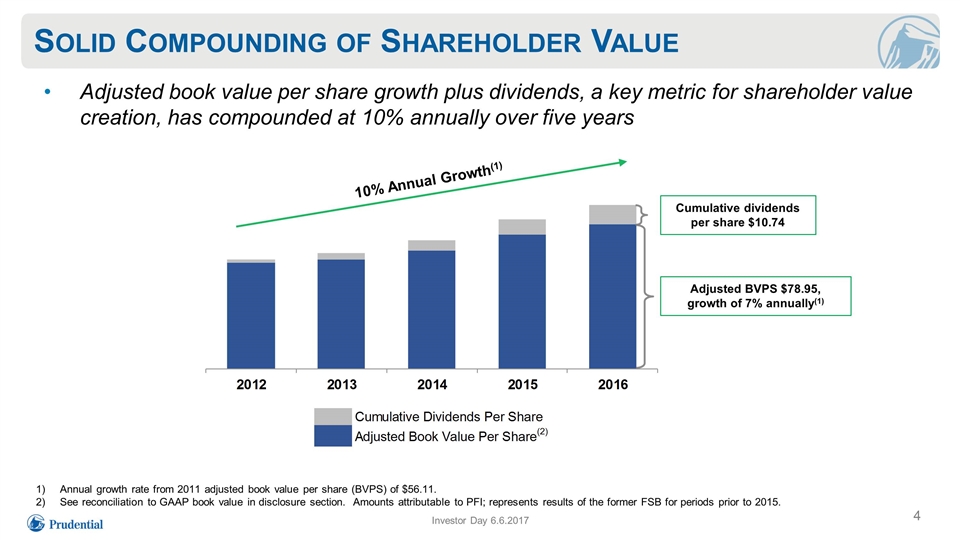
Solid Compounding of Shareholder Value 10% Annual Growth(1) Annual growth rate from 2011 adjusted book value per share (BVPS) of $56.11. See reconciliation to GAAP book value in disclosure section. Amounts attributable to PFI; represents results of the former FSB for periods prior to 2015. Adjusted book value per share growth plus dividends, a key metric for shareholder value creation, has compounded at 10% annually over five years Adjusted BVPS $78.95, growth of 7% annually(1) Cumulative dividends per share $10.74 Investor Day 6.6.2017
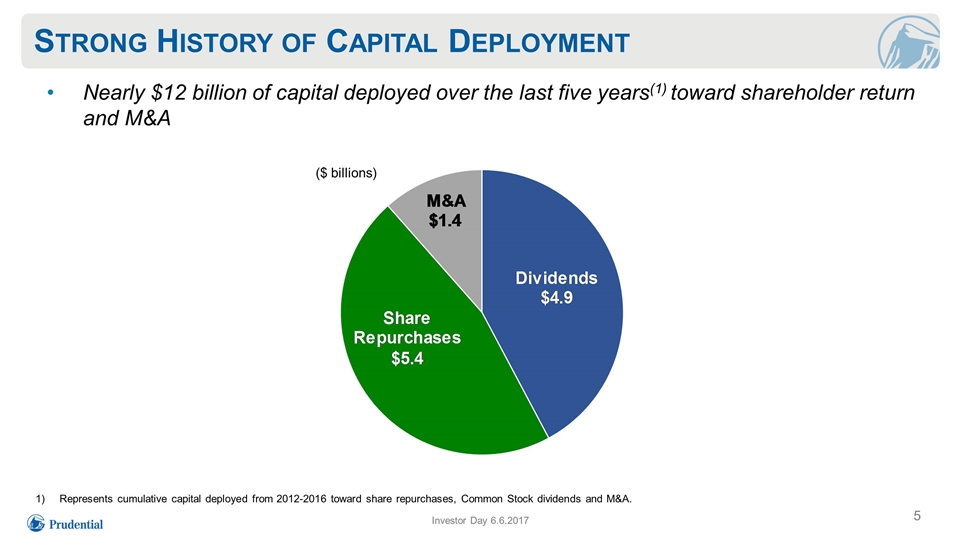
Strong History of Capital Deployment Nearly $12 billion of capital deployed over the last five years(1) toward shareholder return and M&A Represents cumulative capital deployed from 2012-2016 toward share repurchases, Common Stock dividends and M&A. ($ billions) Investor Day 6.6.2017
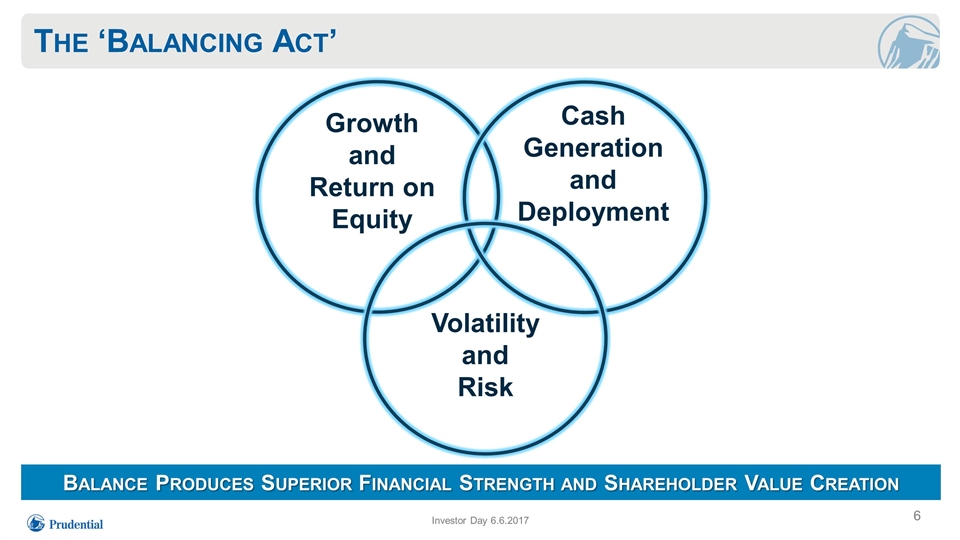
The ‘Balancing Act’ Investor Day 6.6.2017 Growth and Return on Equity Cash Generation and Deployment Volatility and Risk Balance Produces Superior Financial Strength and Shareholder Value Creation
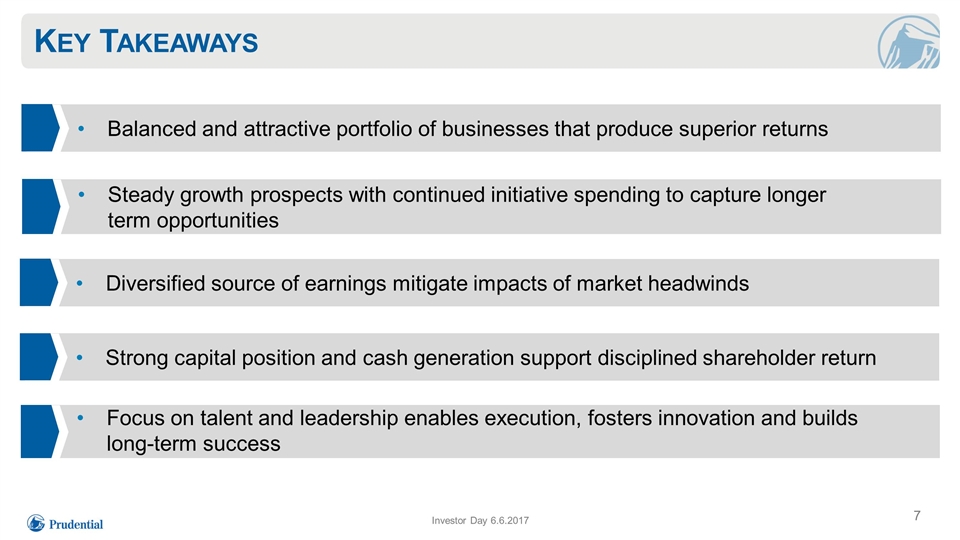
Key Takeaways Balanced and attractive portfolio of businesses that produce superior returns Diversified source of earnings mitigate impacts of market headwinds Strong capital position and cash generation support disciplined shareholder return Focus on talent and leadership enables execution, fosters innovation and builds long-term success Steady growth prospects with continued initiative spending to capture longer term opportunities Investor Day 6.6.2017

Prudential Financial, Inc. 2017 Investor Day Mark Grier Vice Chairman

Prudential Financial, Inc. U.S. Businesses Stephen Pelletier Executive Vice President Chief Operating Officer
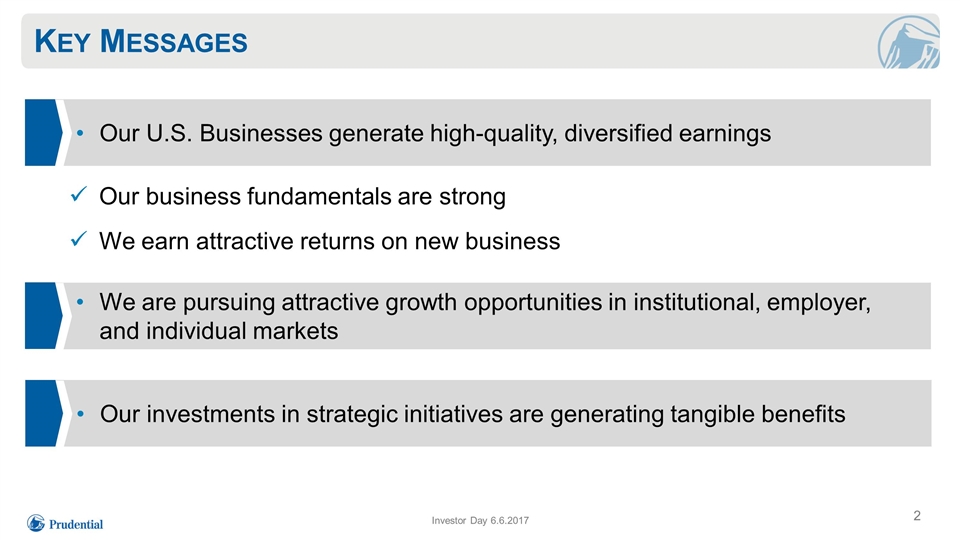
Key Messages Investor Day 6.6.2017 Our business fundamentals are strong We earn attractive returns on new business Our U.S. Businesses generate high-quality, diversified earnings We are pursuing attractive growth opportunities in institutional, employer, and individual markets Our investments in strategic initiatives are generating tangible benefits
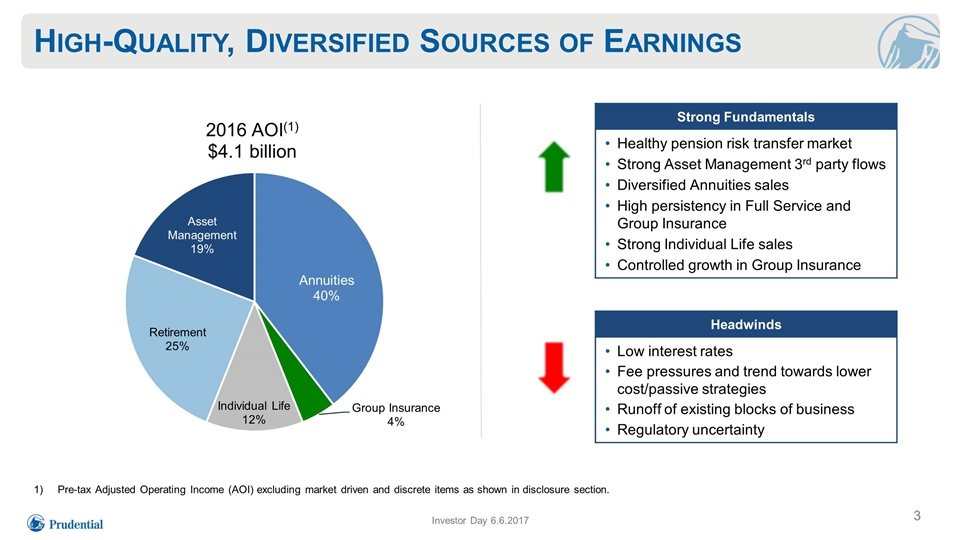
High-Quality, Diversified Sources of Earnings Pre-tax Adjusted Operating Income (AOI) excluding market driven and discrete items as shown in disclosure section. Strong Fundamentals Healthy pension risk transfer market Strong Asset Management 3rd party flows Diversified Annuities sales High persistency in Full Service and Group Insurance Strong Individual Life sales Controlled growth in Group Insurance Headwinds Low interest rates Fee pressures and trend towards lower cost/passive strategies Runoff of existing blocks of business Regulatory uncertainty Investor Day 6.6.2017
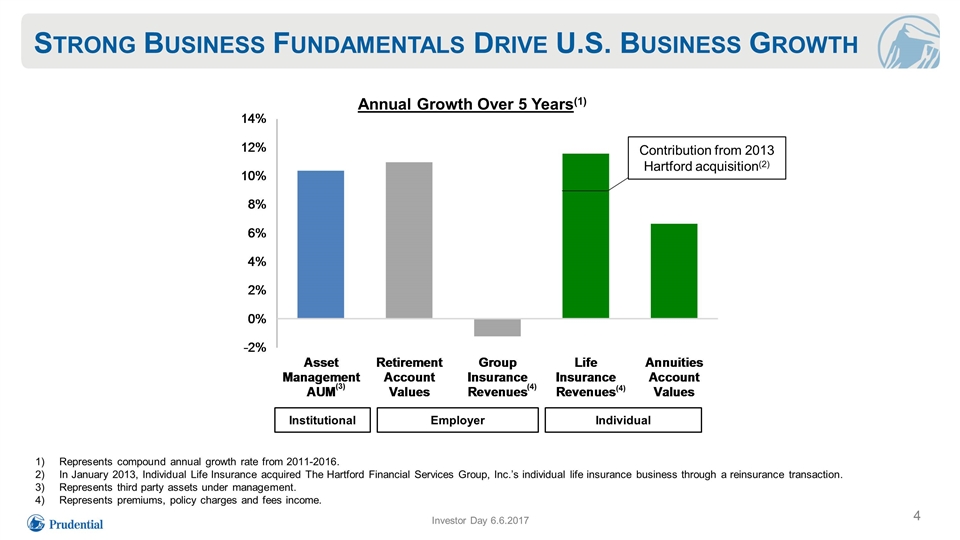
(3) (4) (4) Strong Business Fundamentals Drive U.S. Business Growth Institutional Individual Represents compound annual growth rate from 2011-2016. In January 2013, Individual Life Insurance acquired The Hartford Financial Services Group, Inc.’s individual life insurance business through a reinsurance transaction. Represents third party assets under management. Represents premiums, policy charges and fees income. Employer Contribution from 2013 Hartford acquisition(2) Annual Growth Over 5 Years(1) Investor Day 6.6.2017
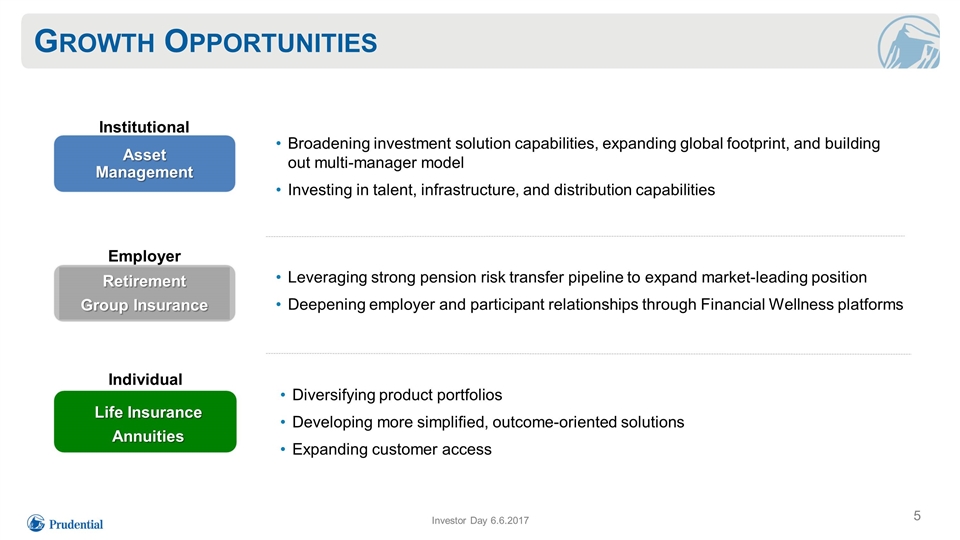
Growth Opportunities Investor Day 6.6.2017 Leveraging strong pension risk transfer pipeline to expand market-leading position Deepening employer and participant relationships through Financial Wellness platforms Diversifying product portfolios Developing more simplified, outcome-oriented solutions Expanding customer access Broadening investment solution capabilities, expanding global footprint, and building out multi-manager model Investing in talent, infrastructure, and distribution capabilities Retirement Group Insurance Asset Management Life Insurance Annuities Institutional Employer Individual
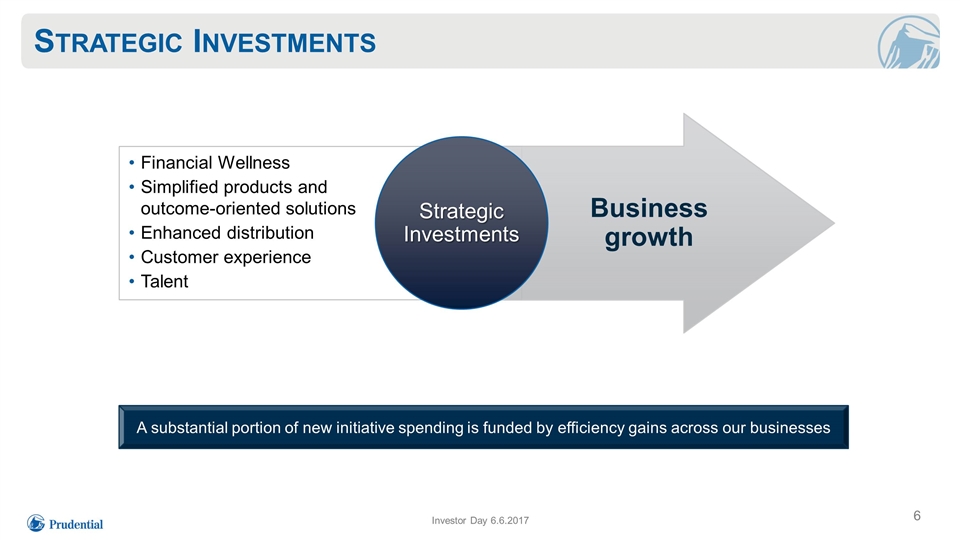
Financial Wellness Simplified products and outcome-oriented solutions Enhanced distribution Customer experience Talent Strategic Investments Investor Day 6.6.2017 Business growth Strategic Investments A substantial portion of new initiative spending is funded by efficiency gains across our businesses
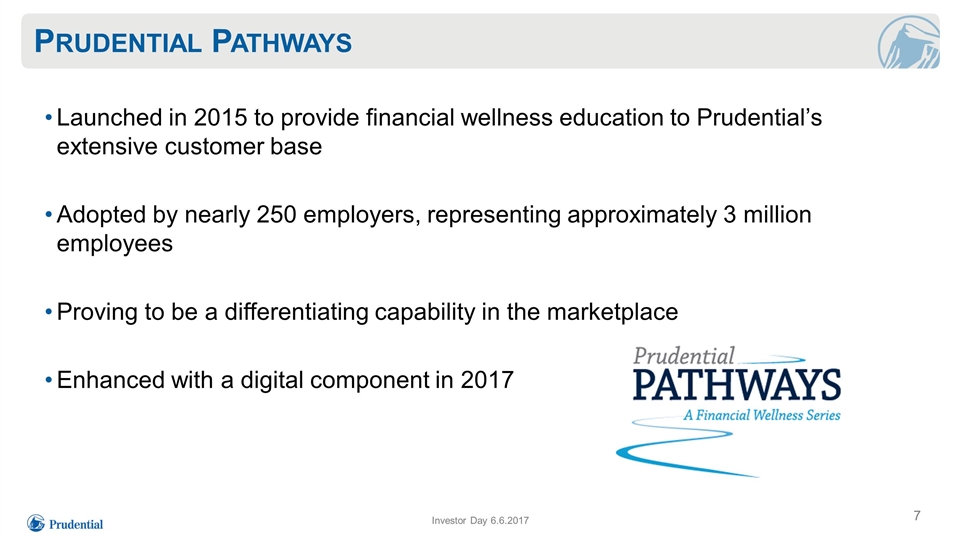
Launched in 2015 to provide financial wellness education to Prudential’s extensive customer base Adopted by nearly 250 employers, representing approximately 3 million employees Proving to be a differentiating capability in the marketplace Enhanced with a digital component in 2017 Prudential Pathways Investor Day 6.6.2017
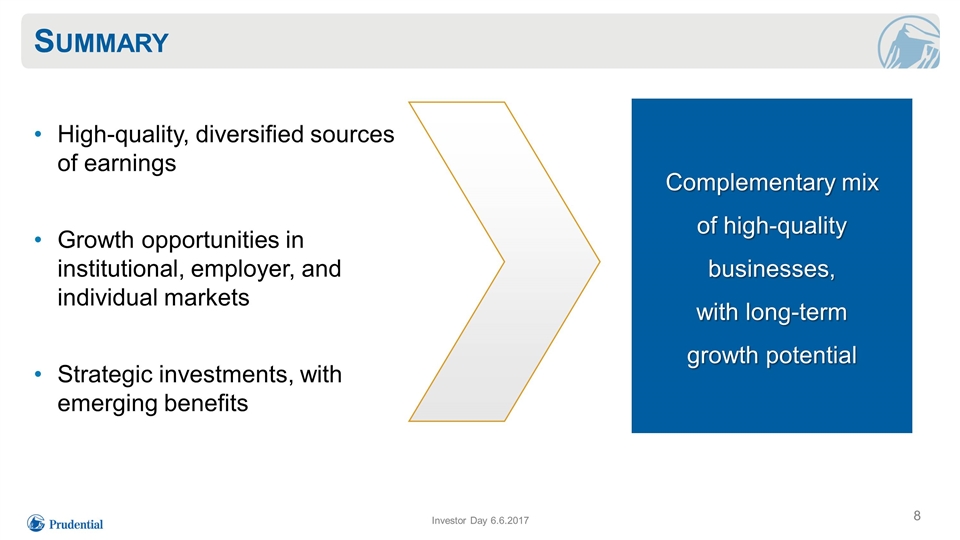
Summary High-quality, diversified sources of earnings Growth opportunities in institutional, employer, and individual markets Strategic investments, with emerging benefits Investor Day 6.6.2017 Complementary mix of high-quality businesses, with long-term growth potential

David Hunt President & CEO PGIM
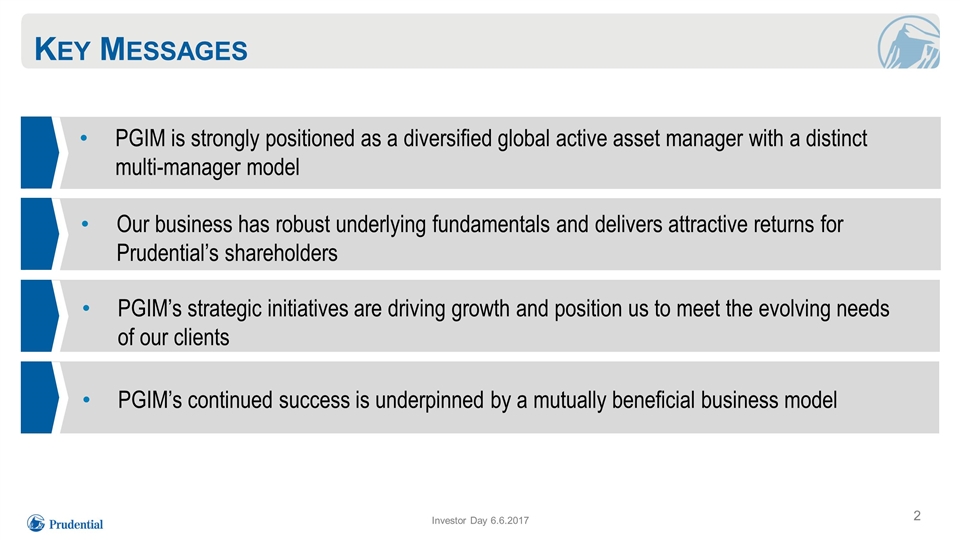
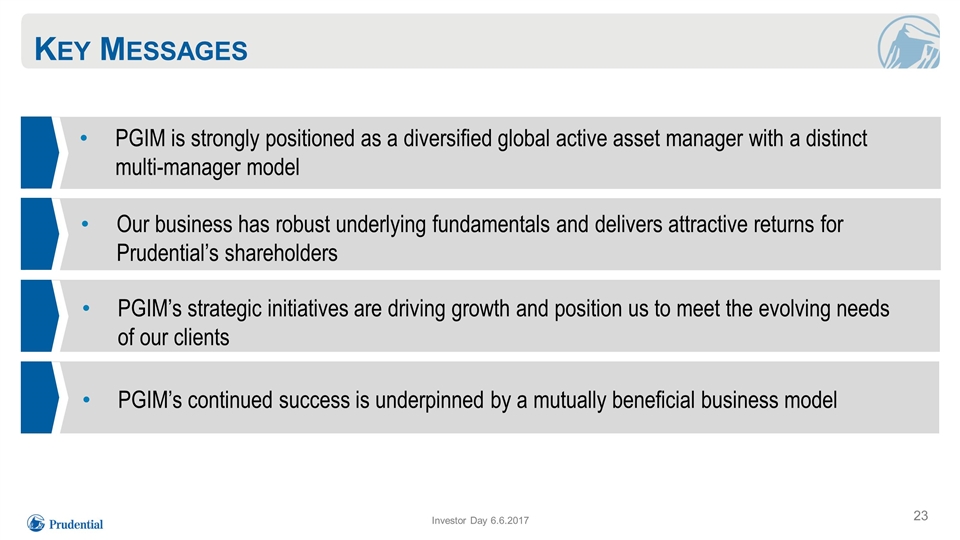
PGIM’s continued success is underpinned by a mutually beneficial business model Key Messages PGIM is strongly positioned as a diversified global active asset manager with a distinct multi-manager model Our business has robust underlying fundamentals and delivers attractive returns for Prudential’s shareholders PGIM’s strategic initiatives are driving growth and position us to meet the evolving needs of our clients Investor Day 6.6.2017
Agenda Leading global asset manager Robust underlying fundamentals Strategic initiatives driving growth Mutually beneficial business model Investor Day 6.6.2017
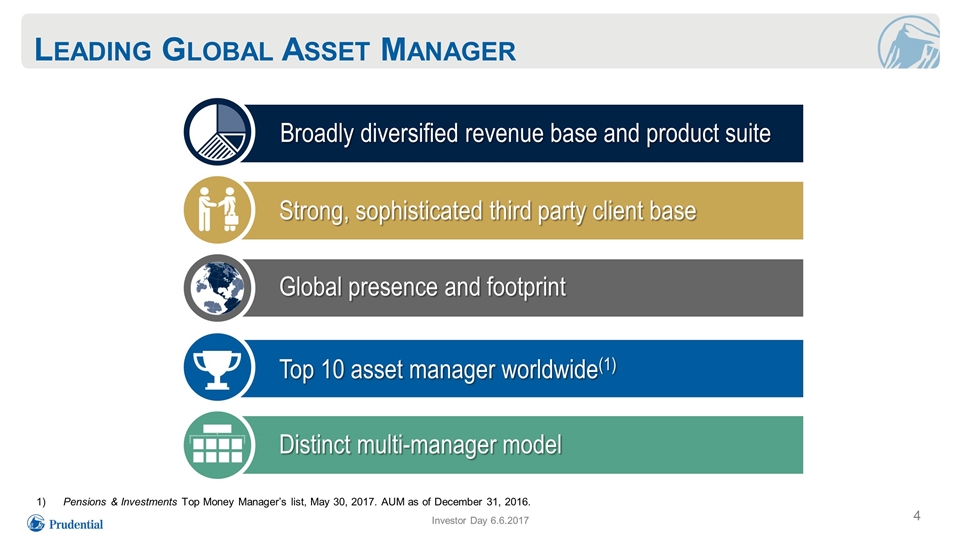
Leading Global Asset Manager Global presence and footprint Distinct multi-manager model Broadly diversified revenue base and product suite Strong, sophisticated third party client base Top 10 asset manager worldwide(1) Pensions & Investments Top Money Manager’s list, May 30, 2017. AUM as of December 31, 2016. Investor Day 6.6.2017
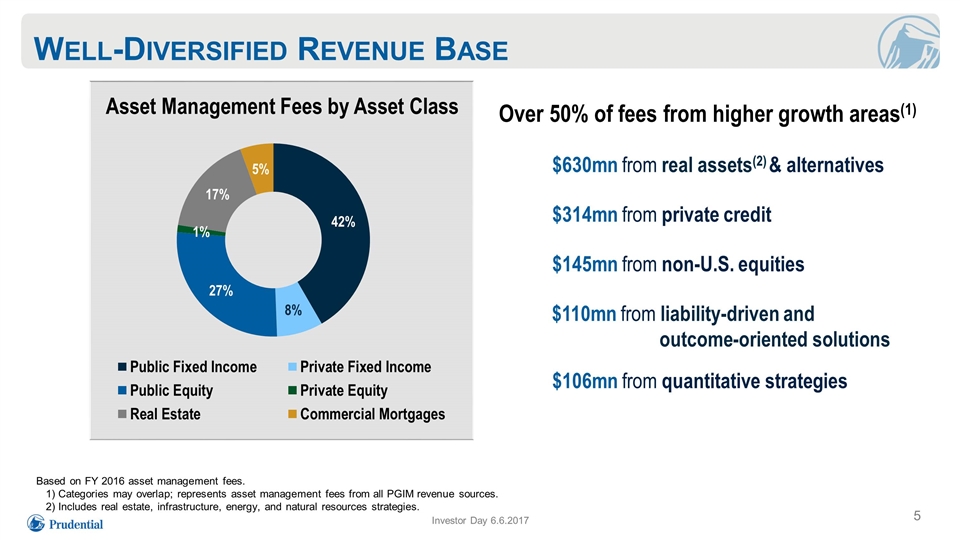
Well-Diversified Revenue Base Investor Day 6.6.2017 Asset Management Fees by Asset Class Over 50% of fees from higher growth areas(1) $630mn from real assets(2) & alternatives $314mn from private credit $145mn from non-U.S. equities $110mn from liability-driven and outcome-oriented solutions $106mn from quantitative strategies Based on FY 2016 asset management fees. 1) Categories may overlap; represents asset management fees from all PGIM revenue sources. 2) Includes real estate, infrastructure, energy, and natural resources strategies.
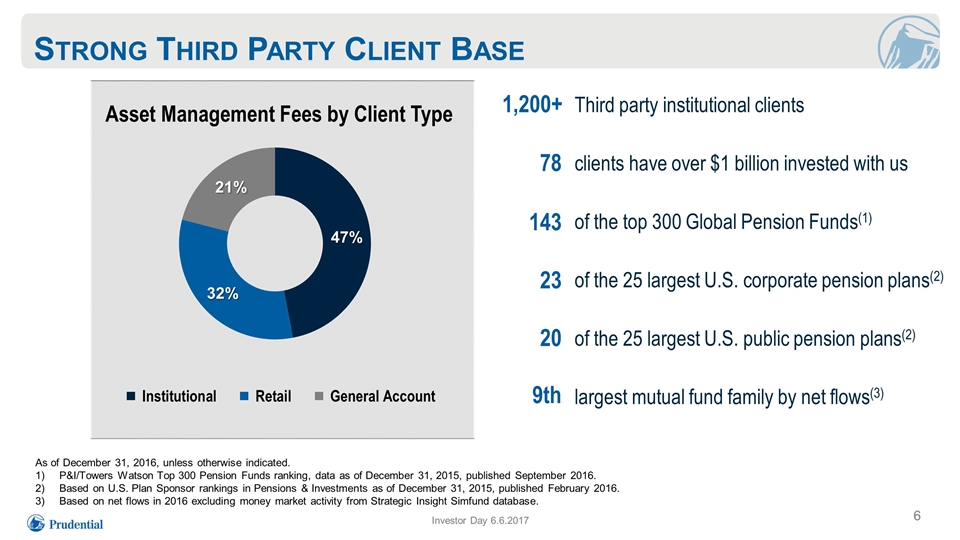
Strong Third Party Client Base Investor Day 6.6.2017 Asset Management Fees by Client Type Third party institutional clients clients have over $1 billion invested with us of the top 300 Global Pension Funds(1) of the 25 largest U.S. corporate pension plans(2) of the 25 largest U.S. public pension plans(2) largest mutual fund family by net flows(3) 1,200+ 78 23 143 20 As of December 31, 2016, unless otherwise indicated. P&I/Towers Watson Top 300 Pension Funds ranking, data as of December 31, 2015, published September 2016. Based on U.S. Plan Sponsor rankings in Pensions & Investments as of December 31, 2015, published February 2016. Based on net flows in 2016 excluding money market activity from Strategic Insight Simfund database. 9th
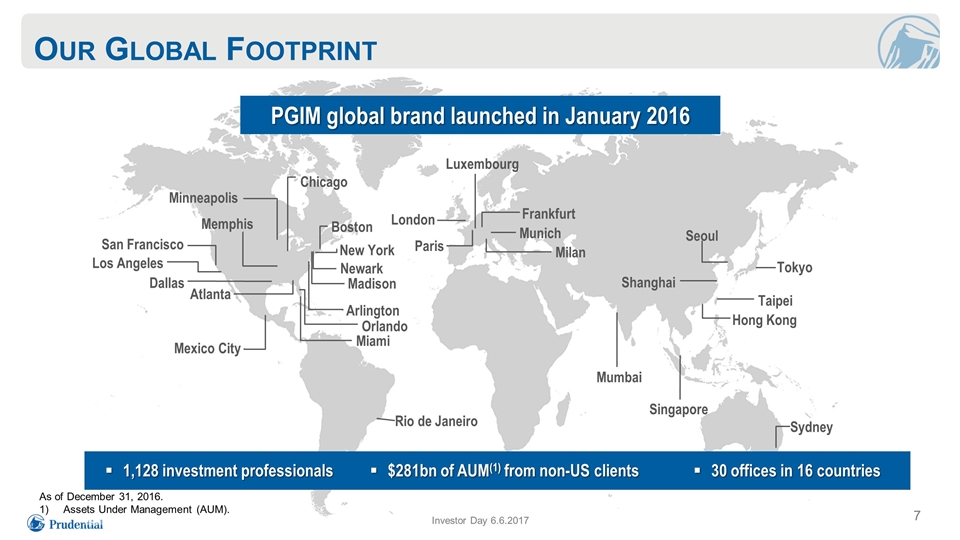
Luxembourg Frankfurt Munich Milan London Paris Mumbai Singapore Shanghai Tokyo Seoul Hong Kong Taipei Sydney Boston New York Arlington Orlando Rio de Janeiro Mexico City Miami Atlanta Dallas Memphis Los Angeles San Francisco Minneapolis Chicago Newark Madison Our Global Footprint Investor Day 6.6.2017 PGIM global brand launched in January 2016 $281bn of AUM(1) from non-US clients 1,128 investment professionals 30 offices in 16 countries As of December 31, 2016. Assets Under Management (AUM).
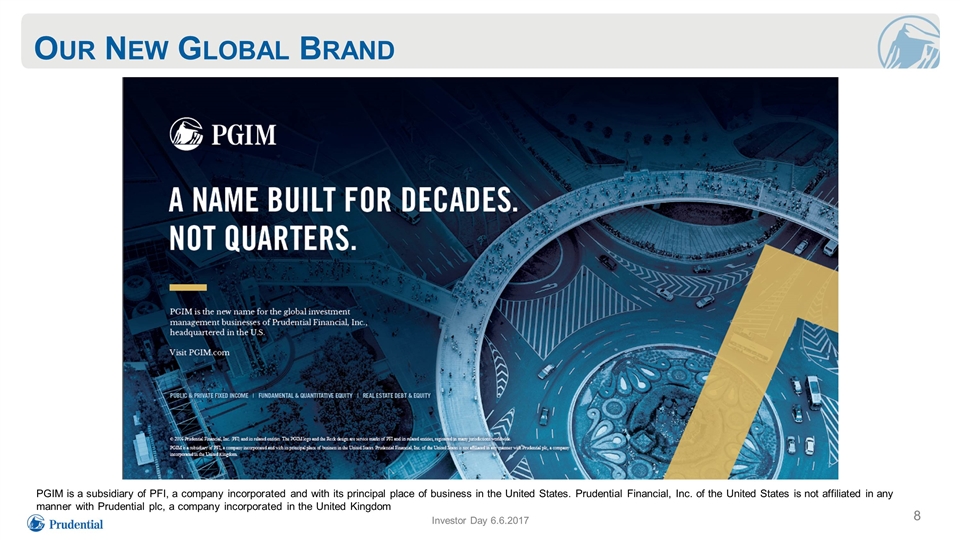
Our New Global Brand Investor Day 6.6.2017 PGIM is a subsidiary of PFI, a company incorporated and with its principal place of business in the United States. Prudential Financial, Inc. of the United States is not affiliated in any manner with Prudential plc, a company incorporated in the United Kingdom
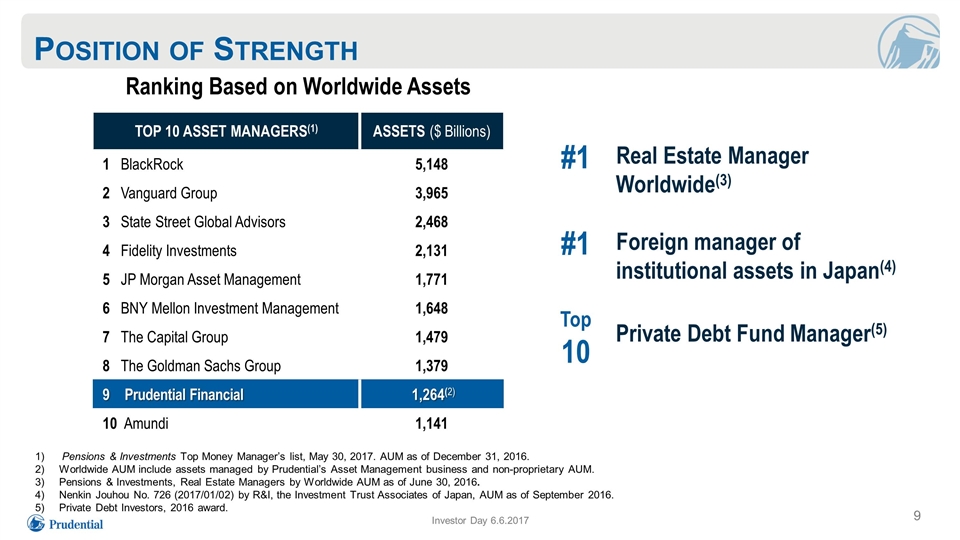
Position of Strength Investor Day 6.6.2017 Ranking Based on Worldwide Assets Top 10 Asset Managers(1) ASSETS ($ Billions) 1 BlackRock 5,148 2 Vanguard Group 3,965 3 State Street Global Advisors 2,468 4 Fidelity Investments 2,131 5 JP Morgan Asset Management 1,771 6 BNY Mellon Investment Management 1,648 7 The Capital Group 1,479 8 The Goldman Sachs Group 1,379 9 Prudential Financial 1,264(2) 10 Amundi 1,141 Pensions & Investments Top Money Manager’s list, May 30, 2017. AUM as of December 31, 2016. Worldwide AUM include assets managed by Prudential’s Asset Management business and non-proprietary AUM. Pensions & Investments, Real Estate Managers by Worldwide AUM as of June 30, 2016. Nenkin Jouhou No. 726 (2017/01/02) by R&I, the Investment Trust Associates of Japan, AUM as of September 2016. Private Debt Investors, 2016 award. Real Estate Manager Worldwide(3) #1 Private Debt Fund Manager(5) Top 10 Foreign manager of institutional assets in Japan(4) #1
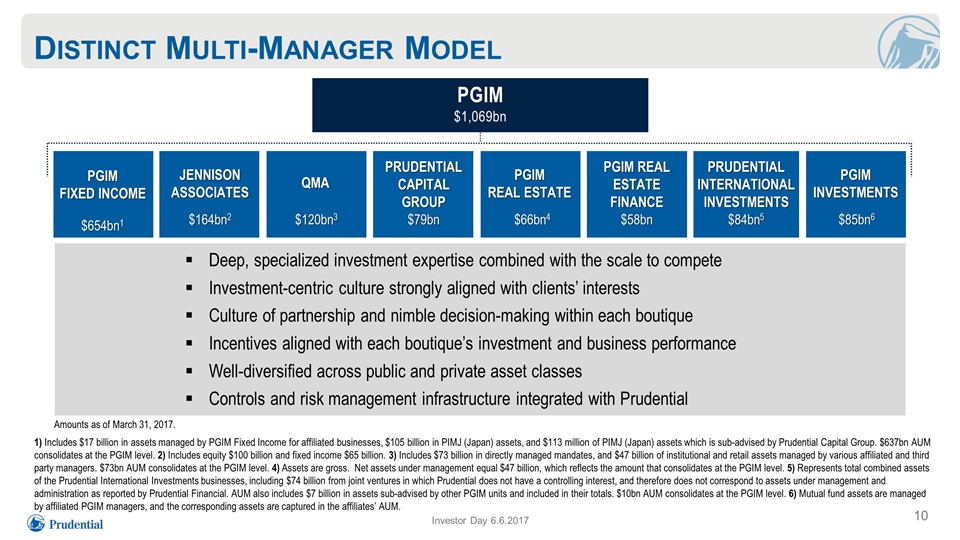
Distinct Multi-Manager Model Investor Day 6.6.2017 PGIM $1,069bn QMA $120bn3 JENNISON ASSOCIATES $164bn2 PGIM FIXED INCOME $654bn1 PRUDENTIAL CAPITAL GROUP $79bn PGIM REAL ESTATE FINANCE $58bn PGIM REAL ESTATE $66bn4 PRUDENTIAL INTERNATIONAL INVESTMENTS $84bn5 PGIM INVESTMENTS $85bn6 Deep, specialized investment expertise combined with the scale to compete Investment-centric culture strongly aligned with clients’ interests Culture of partnership and nimble decision-making within each boutique Incentives aligned with each boutique’s investment and business performance Well-diversified across public and private asset classes Controls and risk management infrastructure integrated with Prudential Amounts as of March 31, 2017. 1) Includes $17 billion in assets managed by PGIM Fixed Income for affiliated businesses, $105 billion in PIMJ (Japan) assets, and $113 million of PIMJ (Japan) assets which is sub-advised by Prudential Capital Group. $637bn AUM consolidates at the PGIM level. 2) Includes equity $100 billion and fixed income $65 billion. 3) Includes $73 billion in directly managed mandates, and $47 billion of institutional and retail assets managed by various affiliated and third party managers. $73bn AUM consolidates at the PGIM level. 4) Assets are gross. Net assets under management equal $47 billion, which reflects the amount that consolidates at the PGIM level. 5) Represents total combined assets of the Prudential International Investments businesses, including $74 billion from joint ventures in which Prudential does not have a controlling interest, and therefore does not correspond to assets under management and administration as reported by Prudential Financial. AUM also includes $7 billion in assets sub-advised by other PGIM units and included in their totals. $10bn AUM consolidates at the PGIM level. 6) Mutual fund assets are managed by affiliated PGIM managers, and the corresponding assets are captured in the affiliates’ AUM.
Agenda Leading global asset manager Robust underlying fundamentals Strategic initiatives driving growth Mutually beneficial business model Investor Day 6.6.2017
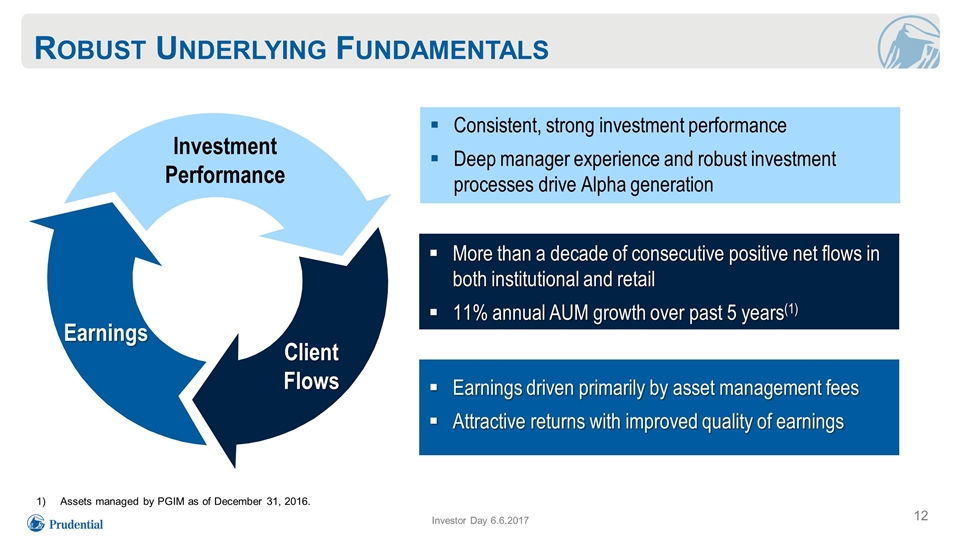
Robust Underlying Fundamentals Investment Performance Client Flows Earnings Consistent, strong investment performance Deep manager experience and robust investment processes drive Alpha generation More than a decade of consecutive positive net flows in both institutional and retail 11% annual AUM growth over past 5 years(1) Earnings driven primarily by asset management fees Attractive returns with improved quality of earnings Assets managed by PGIM as of December 31, 2016. Investor Day 6.6.2017
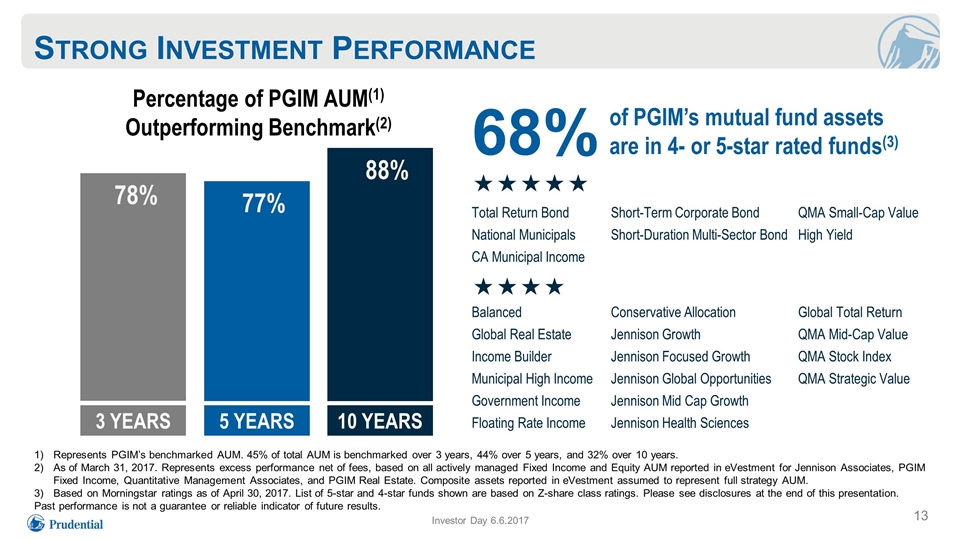
Strong Investment Performance Investor Day 6.6.2017 Percentage of PGIM AUM(1) Outperforming Benchmark(2) Represents PGIM’s benchmarked AUM. 45% of total AUM is benchmarked over 3 years, 44% over 5 years, and 32% over 10 years. As of March 31, 2017. Represents excess performance net of fees, based on all actively managed Fixed Income and Equity AUM reported in eVestment for Jennison Associates, PGIM Fixed Income, Quantitative Management Associates, and PGIM Real Estate. Composite assets reported in eVestment assumed to represent full strategy AUM. Based on Morningstar ratings as of April 30, 2017. List of 5-star and 4-star funds shown are based on Z-share class ratings. Please see disclosures at the end of this presentation. Past performance is not a guarantee or reliable indicator of future results. 68% of PGIM’s mutual fund assets are in 4- or 5-star rated funds(3) ««««« Total Return Bond Short-Term Corporate Bond QMA Small-Cap Value National Municipals Short-Duration Multi-Sector Bond High Yield CA Municipal Income «««« Balanced Conservative Allocation Global Total Return Global Real Estate Jennison Growth QMA Mid-Cap Value Income Builder Jennison Focused Growth QMA Stock Index Municipal High Income Jennison Global Opportunities QMA Strategic Value Government Income Jennison Mid Cap Growth Floating Rate Income Jennison Health Sciences 3 YEARS 5 YEARS 78% 77% 10 YEARS 88%
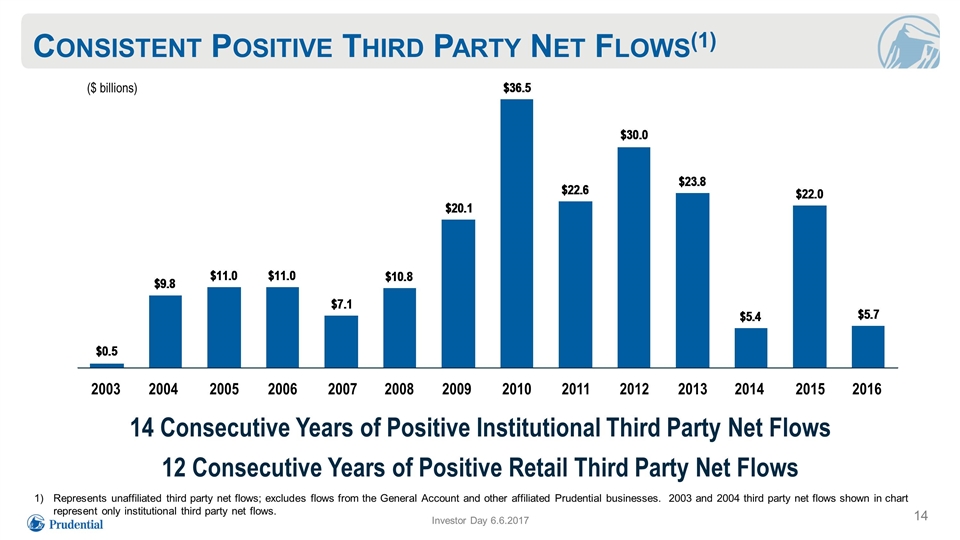
Consistent Positive Third Party Net Flows(1) Investor Day 6.6.2017 $ Billions 14 Consecutive Years of Positive Institutional Third Party Net Flows 12 Consecutive Years of Positive Retail Third Party Net Flows Represents unaffiliated third party net flows; excludes flows from the General Account and other affiliated Prudential businesses. 2003 and 2004 third party net flows shown in chart represent only institutional third party net flows. ($ billions)
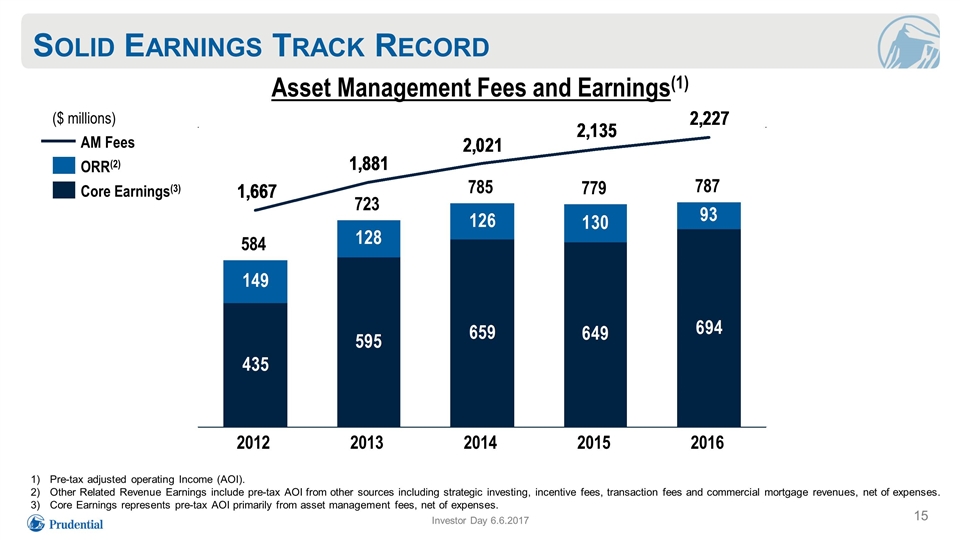
Solid Earnings Track Record ($ millions) Asset Management Fees and Earnings(1) Pre-tax adjusted operating Income (AOI). Other Related Revenue Earnings include pre-tax AOI from other sources including strategic investing, incentive fees, transaction fees and commercial mortgage revenues, net of expenses. Core Earnings represents pre-tax AOI primarily from asset management fees, net of expenses. Core Earnings(3) ORR(2) Investor Day 6.6.2017
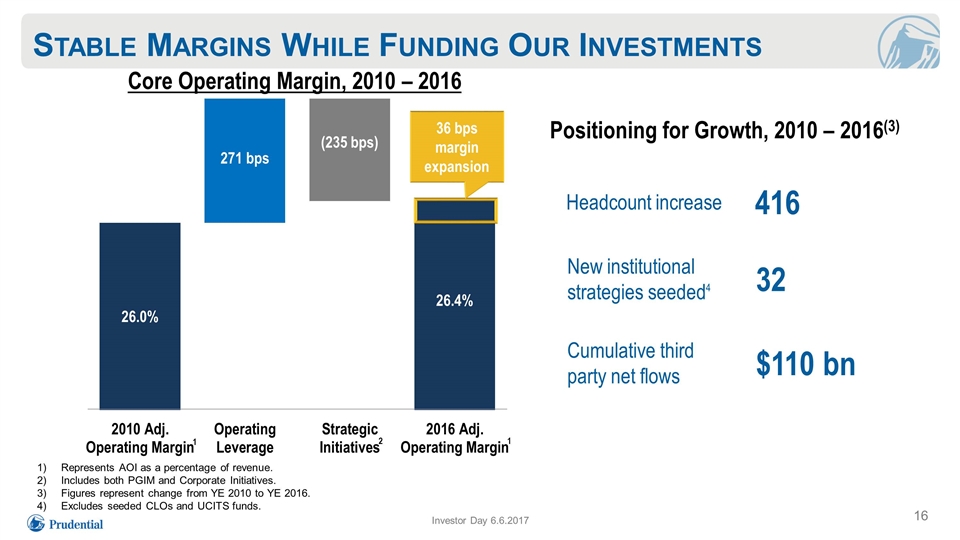
Stable Margins While Funding Our Investments Investor Day 6.6.2017 Core Operating Margin, 2010 – 2016 Positioning for Growth, 2010 – 2016(3) Represents AOI as a percentage of revenue. Includes both PGIM and Corporate Initiatives. Figures represent change from YE 2010 to YE 2016. Excludes seeded CLOs and UCITS funds. 416 Headcount increase 32 New institutional strategies seeded4 $110 bn Cumulative third party net flows 1 1 36 bps margin expansion 2
Agenda Leading global asset manager Robust underlying fundamentals Strategic initiatives driving growth Mutually beneficial business model Investor Day 6.6.2017
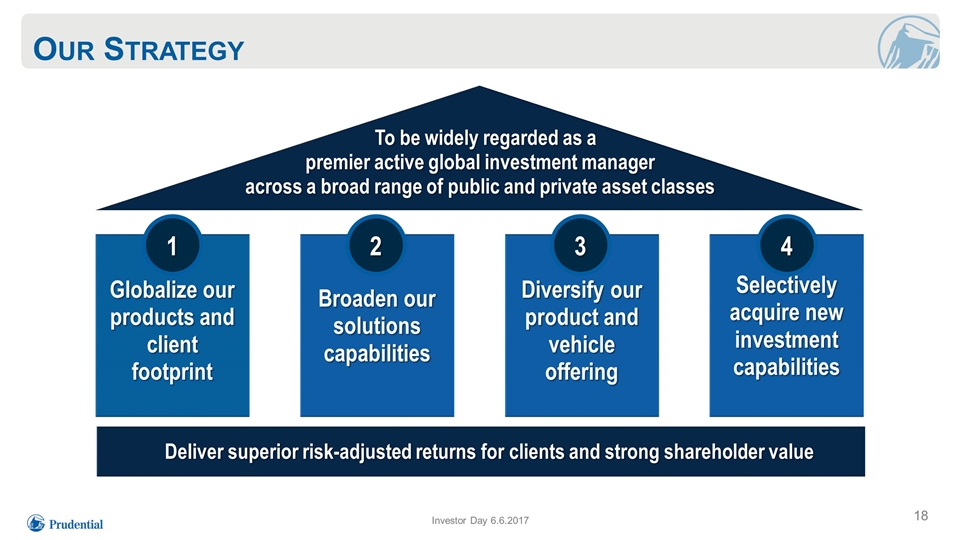
Our Strategy Investor Day 6.6.2017 To be widely regarded as a premier active global investment manager across a broad range of public and private asset classes Deliver superior risk-adjusted returns for clients and strong shareholder value Selectively acquire new investment capabilities Broaden our solutions capabilities Diversify our product and vehicle offering Globalize our products and client footprint 1 2 3 4
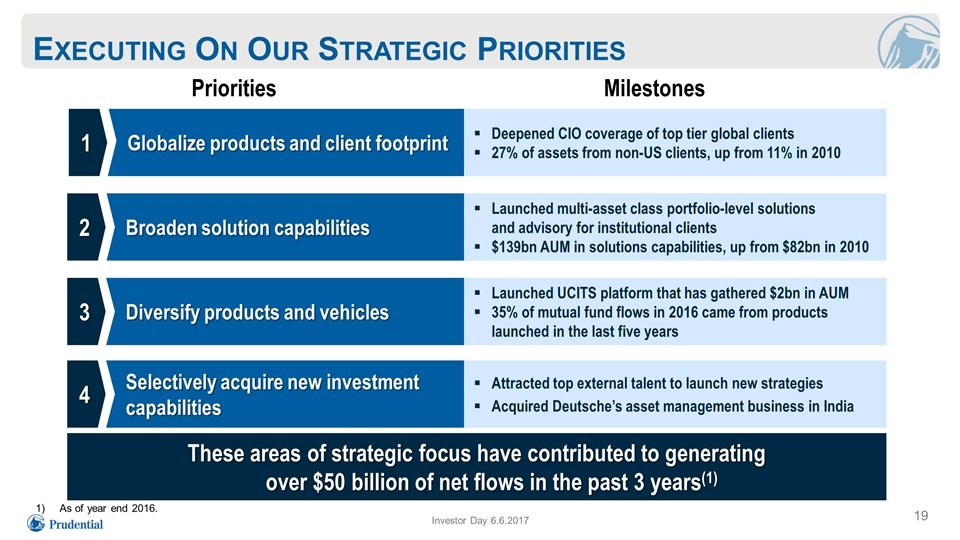
Executing On Our Strategic Priorities Investor Day 6.6.2017 Diversify products and vehicles 3 Launched UCITS platform that has gathered $2bn in AUM 35% of mutual fund flows in 2016 came from products launched in the last five years Broaden solution capabilities 2 Launched multi-asset class portfolio-level solutions and advisory for institutional clients $139bn AUM in solutions capabilities, up from $82bn in 2010 Selectively acquire new investment capabilities 4 Attracted top external talent to launch new strategies Acquired Deutsche’s asset management business in India Priorities Milestones Globalize products and client footprint 1 Deepened CIO coverage of top tier global clients 27% of assets from non-US clients, up from 11% in 2010 These areas of strategic focus have contributed to generating over $50 billion of net flows in the past 3 years(1) As of year end 2016.
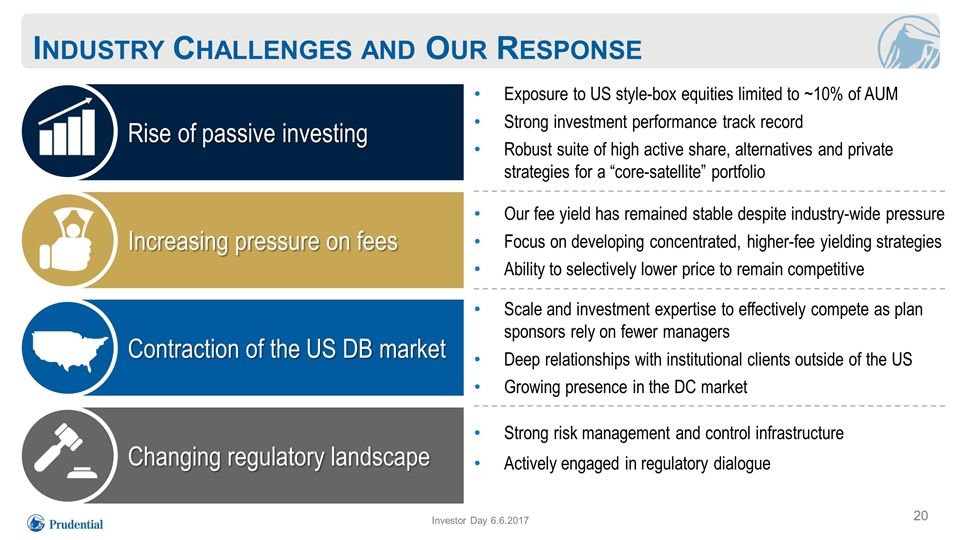
Industry Challenges and Our Response Rise of passive investing Exposure to US style-box equities limited to ~10% of AUM Strong investment performance track record Robust suite of high active share, alternatives and private strategies for a “core-satellite” portfolio Our fee yield has remained stable despite industry-wide pressure Focus on developing concentrated, higher-fee yielding strategies Ability to selectively lower price to remain competitive Scale and investment expertise to effectively compete as plan sponsors rely on fewer managers Deep relationships with institutional clients outside of the US Growing presence in the DC market Strong risk management and control infrastructure Actively engaged in regulatory dialogue Contraction of the US DB market Increasing pressure on fees Changing regulatory landscape Investor Day 6.6.2017
Agenda Leading global asset manager Robust underlying fundamentals Strategic initiatives driving growth Mutually beneficial business model Investor Day 6.6.2017
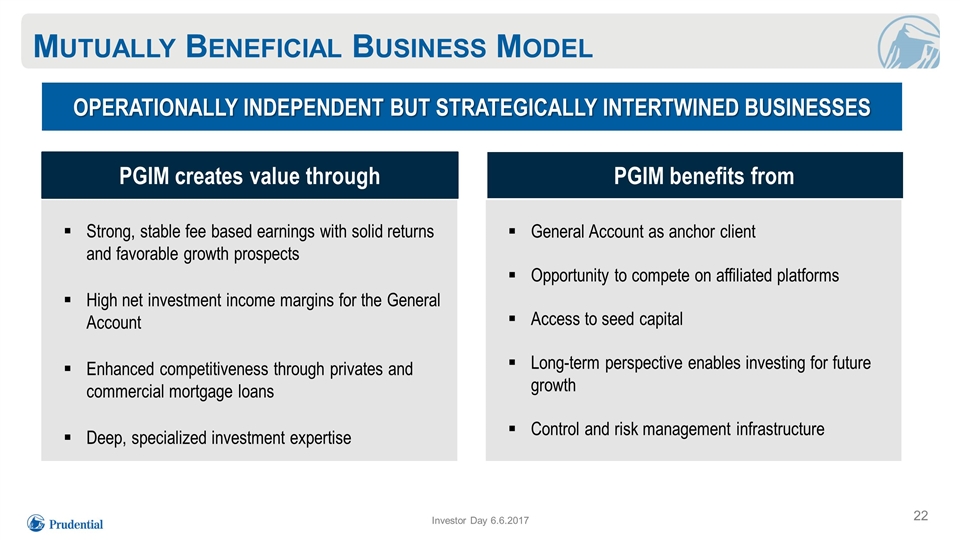
Mutually Beneficial Business Model Investor Day 6.6.2017 Strong, stable fee based earnings with solid returns and favorable growth prospects High net investment income margins for the General Account Enhanced competitiveness through privates and commercial mortgage loans Deep, specialized investment expertise OPERATIONALLY INDEPENDENT BUT STRATEGICALLY INTERTWINED BUSINESSES PGIM creates value through PGIM benefits from General Account as anchor client Opportunity to compete on affiliated platforms Access to seed capital Long-term perspective enables investing for future growth Control and risk management infrastructure
PGIM’s continued success is underpinned by a mutually beneficial business model Key Messages PGIM is strongly positioned as a diversified global active asset manager with a distinct multi-manager model Our business has robust underlying fundamentals and delivers attractive returns for Prudential’s shareholders PGIM’s strategic initiatives are driving growth and position us to meet the evolving needs of our clients Investor Day 6.6.2017

Prudential Financial, Inc. Retirement Phil Waldeck President
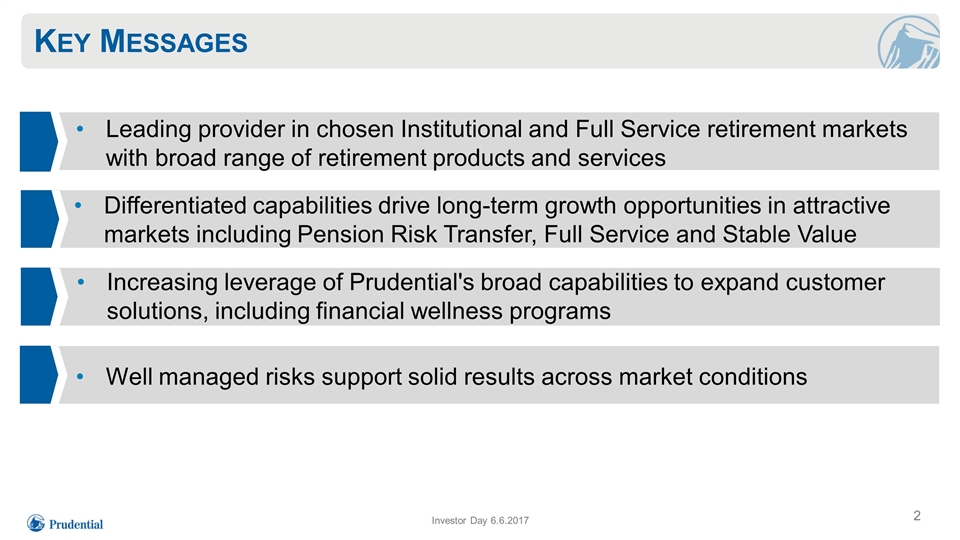
Key Messages Leading provider in chosen Institutional and Full Service retirement markets with broad range of retirement products and services Increasing leverage of Prudential's broad capabilities to expand customer solutions, including financial wellness programs Investor Day 6.6.2017 Well managed risks support solid results across market conditions Differentiated capabilities drive long-term growth opportunities in attractive markets including Pension Risk Transfer, Full Service and Stable Value
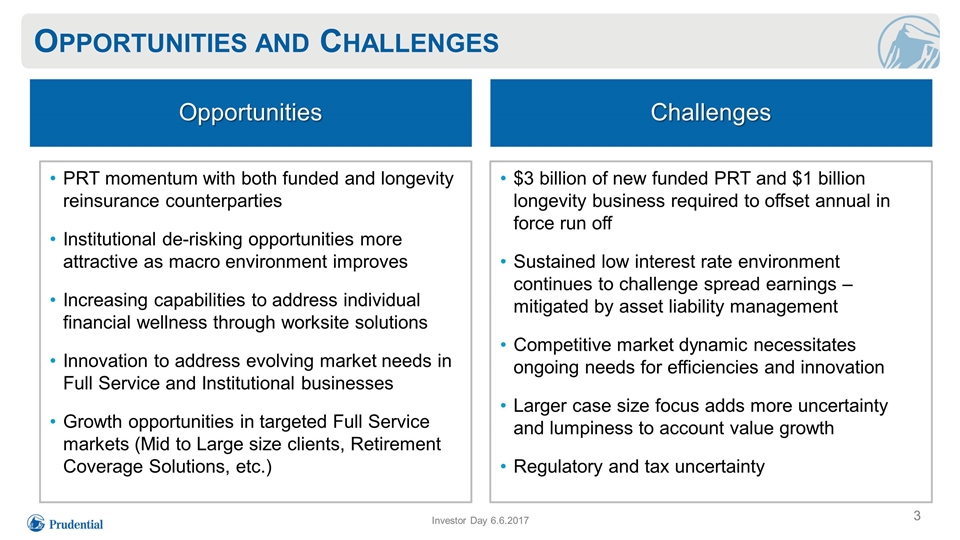
Opportunities and Challenges Challenges Opportunities Investor Day 6.6.2017 $3 billion of new funded PRT and $1 billion longevity business required to offset annual in force run off Sustained low interest rate environment continues to challenge spread earnings – mitigated by asset liability management Competitive market dynamic necessitates ongoing needs for efficiencies and innovation Larger case size focus adds more uncertainty and lumpiness to account value growth Regulatory and tax uncertainty PRT momentum with both funded and longevity reinsurance counterparties Institutional de-risking opportunities more attractive as macro environment improves Increasing capabilities to address individual financial wellness through worksite solutions Innovation to address evolving market needs in Full Service and Institutional businesses Growth opportunities in targeted Full Service markets (Mid to Large size clients, Retirement Coverage Solutions, etc.)
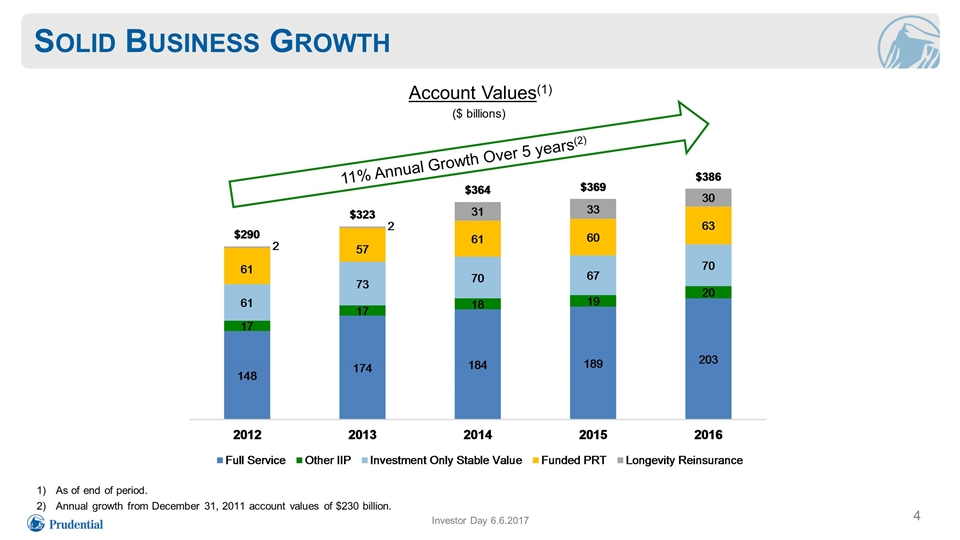
Solid Business Growth Investor Day 6.6.2017 11% Annual Growth Over 5 years(2) As of end of period. Annual growth from December 31, 2011 account values of $230 billion. Account Values(1) ($ billions)
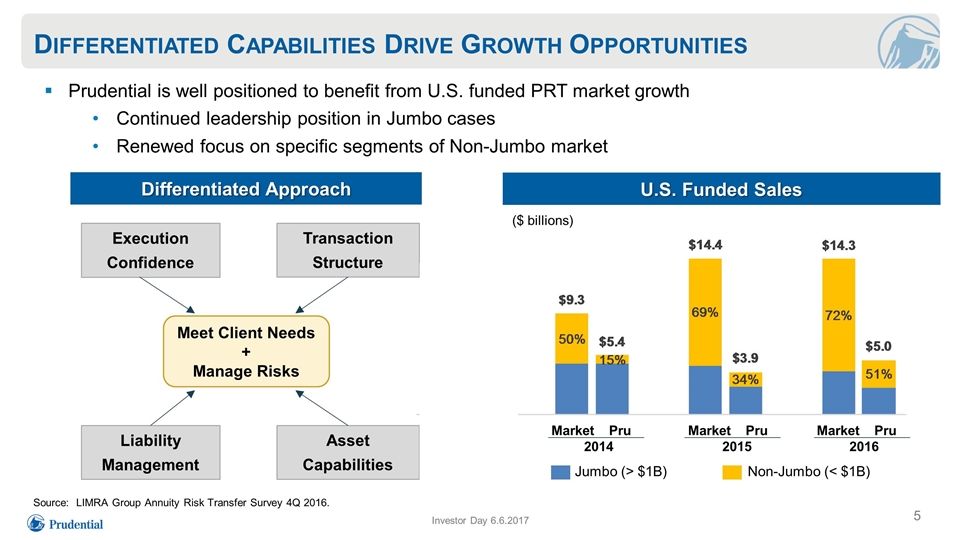
Differentiated Capabilities Drive Growth Opportunities Investor Day 6.6.2017 Prudential is well positioned to benefit from U.S. funded PRT market growth Continued leadership position in Jumbo cases Renewed focus on specific segments of Non-Jumbo market Jumbo (> $1B) Non-Jumbo (< $1B) Market Pru 2014 Market Pru 2015 Market Pru 2016 Asset Capabilities Differentiated Approach Transaction Structure Execution Confidence Liability Management Meet Client Needs + Manage Risks U.S. Funded Sales ($ billions) Source: LIMRA Group Annuity Risk Transfer Survey 4Q 2016.
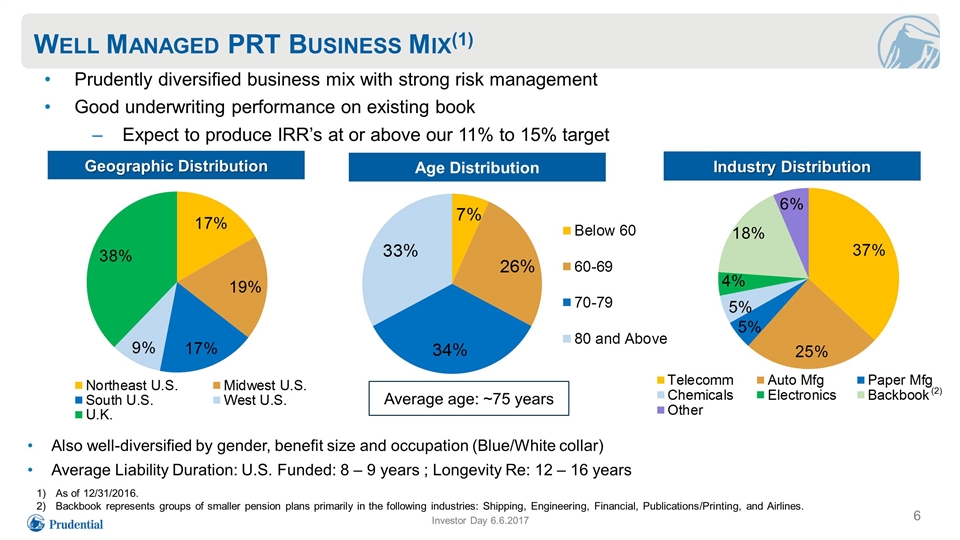
(2) Well Managed PRT Business Mix(1) Prudently diversified business mix with strong risk management Good underwriting performance on existing book Expect to produce IRR’s at or above our 11% to 15% target Also well-diversified by gender, benefit size and occupation (Blue/White collar) Average Liability Duration: U.S. Funded: 8 – 9 years ; Longevity Re: 12 – 16 years Age Distribution Industry Distribution Average age: ~75 years As of 12/31/2016. Backbook represents groups of smaller pension plans primarily in the following industries: Shipping, Engineering, Financial, Publications/Printing, and Airlines. Geographic Distribution Investor Day 6.6.2017
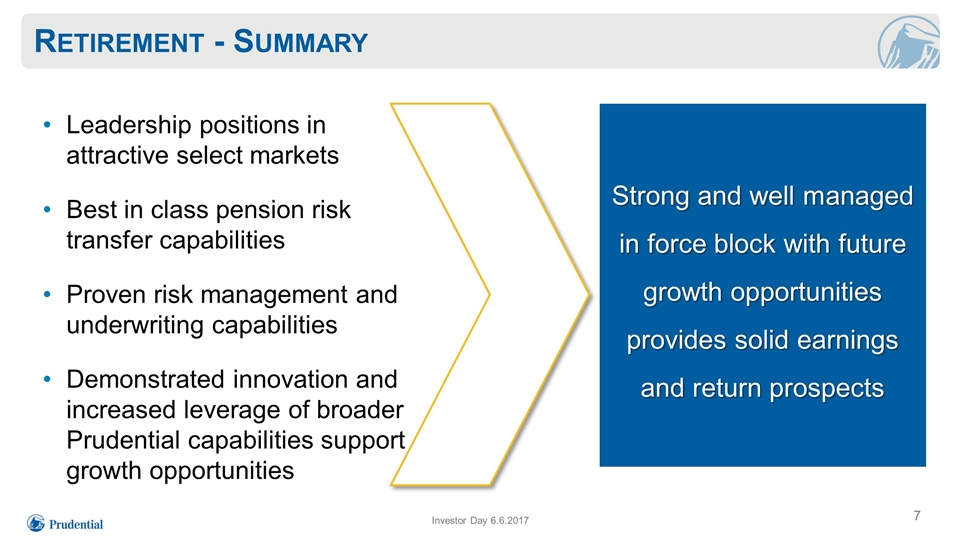
Retirement - Summary Leadership positions in attractive select markets Best in class pension risk transfer capabilities Proven risk management and underwriting capabilities Demonstrated innovation and increased leverage of broader Prudential capabilities support growth opportunities Investor Day 6.6.2017 Strong and well managed in force block with future growth opportunities provides solid earnings and return prospects

Prudential Financial, Inc. Group Insurance Andrew Sullivan President
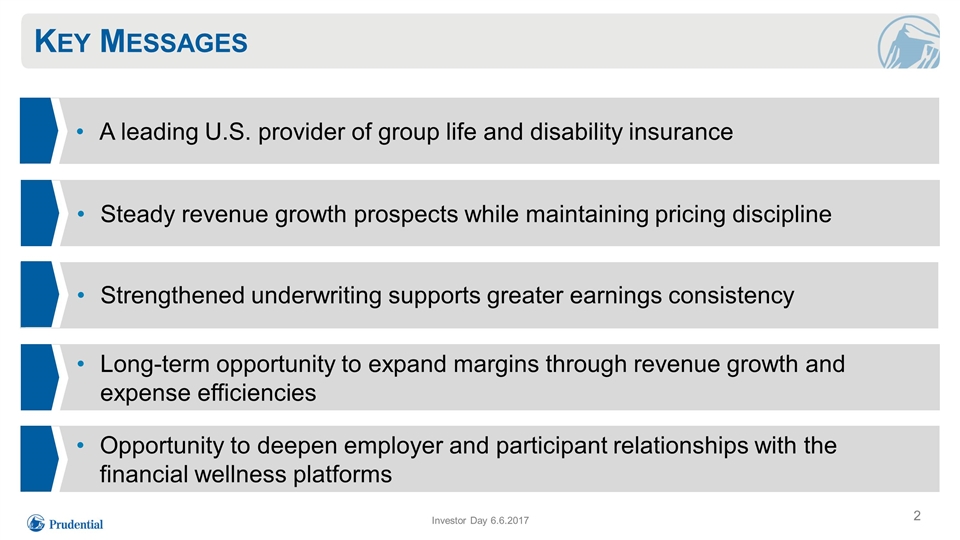
Key Messages A leading U.S. provider of group life and disability insurance Steady revenue growth prospects while maintaining pricing discipline Strengthened underwriting supports greater earnings consistency Investor Day 6.6.2017 Long-term opportunity to expand margins through revenue growth and expense efficiencies Opportunity to deepen employer and participant relationships with the financial wellness platforms
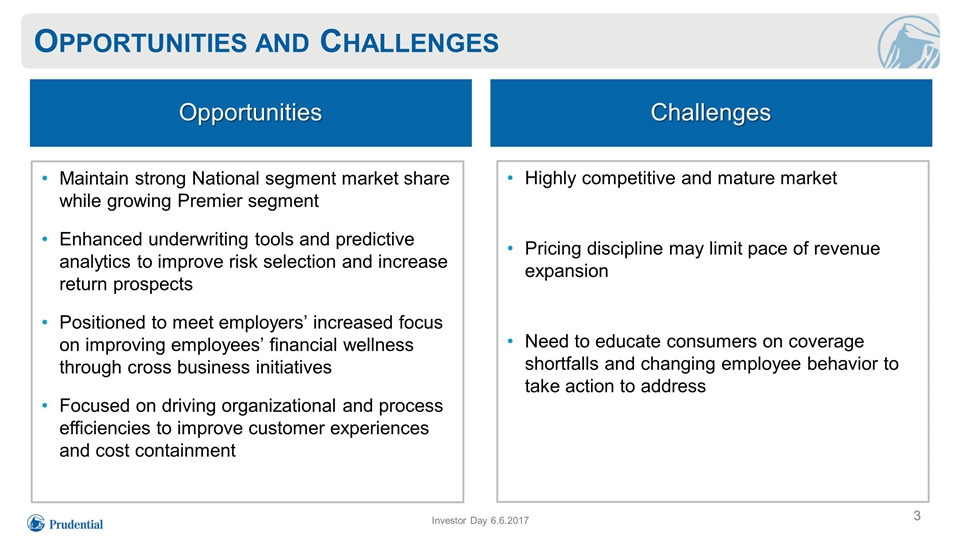
Opportunities and Challenges Investor Day 6.6.2017 Challenges Opportunities Maintain strong National segment market share while growing Premier segment Enhanced underwriting tools and predictive analytics to improve risk selection and increase return prospects Positioned to meet employers’ increased focus on improving employees’ financial wellness through cross business initiatives Focused on driving organizational and process efficiencies to improve customer experiences and cost containment Highly competitive and mature market Pricing discipline may limit pace of revenue expansion Need to educate consumers on coverage shortfalls and changing employee behavior to take action to address
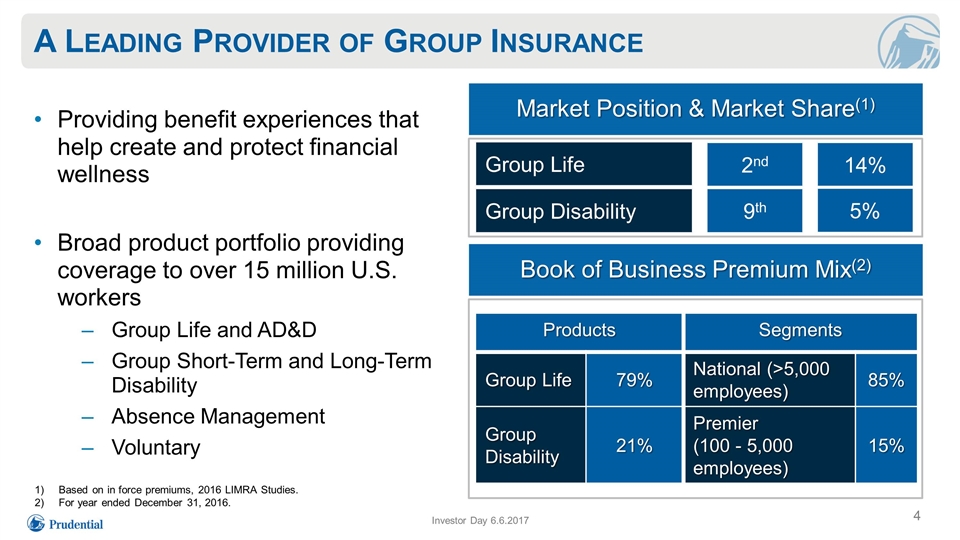
A Leading Provider of Group Insurance Providing benefit experiences that help create and protect financial wellness Broad product portfolio providing coverage to over 15 million U.S. workers Group Life and AD&D Group Short-Term and Long-Term Disability Absence Management Voluntary Market Position & Market Share(1) Group Life Group Disability 2nd 14% 9th 5% Based on in force premiums, 2016 LIMRA Studies. For year ended December 31, 2016. Book of Business Premium Mix(2) Products Segments Group Life 79% National (>5,000 employees) 85% Group Disability 21% Premier (100 - 5,000 employees) 15% Investor Day 6.6.2017
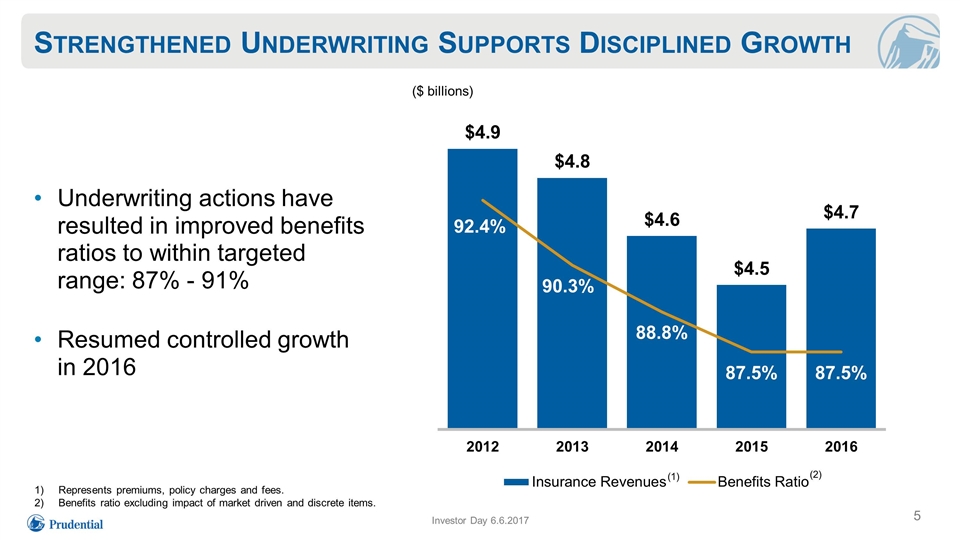
Strengthened Underwriting Supports Disciplined Growth Underwriting actions have resulted in improved benefits ratios to within targeted range: 87% - 91% Resumed controlled growth in 2016 ($ billions) (1) (2) Represents premiums, policy charges and fees. Benefits ratio excluding impact of market driven and discrete items. Investor Day 6.6.2017
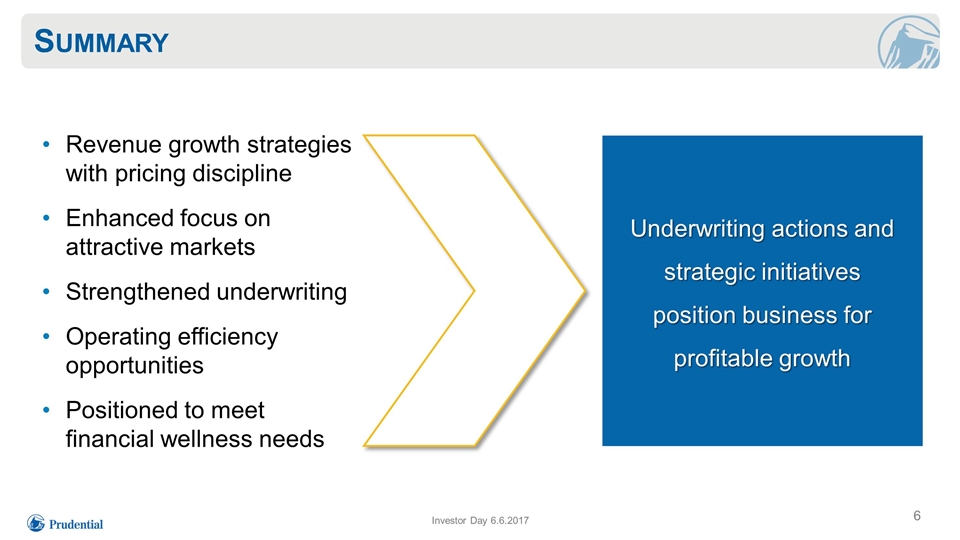
Summary Investor Day 6.6.2017 Revenue growth strategies with pricing discipline Enhanced focus on attractive markets Strengthened underwriting Operating efficiency opportunities Positioned to meet financial wellness needs Underwriting actions and strategic initiatives position business for profitable growth

Prudential Financial, Inc. Individual Life Insurance Kent Sluyter Chief Executive Officer Individual Life Insurance & Prudential Advisors
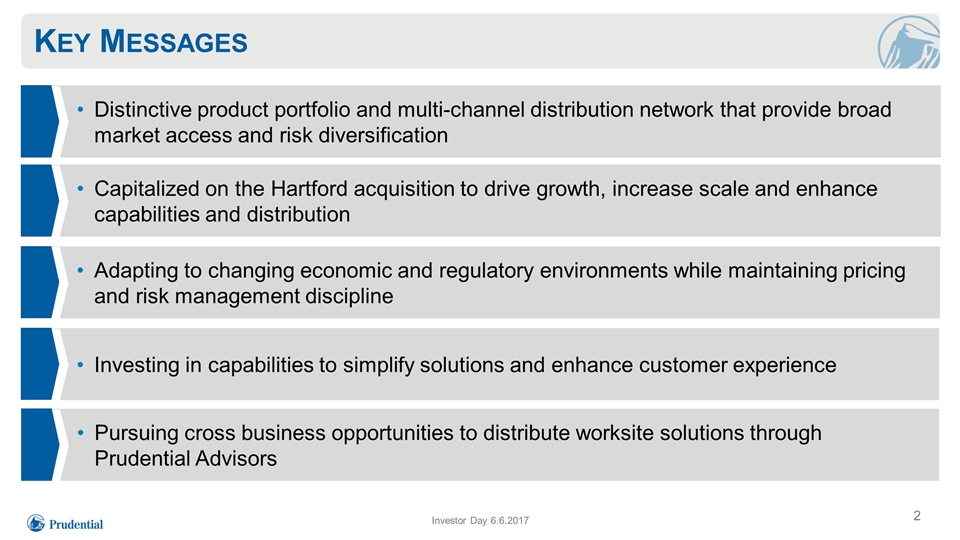
Key Messages Investor Day 6.6.2017 Capitalized on the Hartford acquisition to drive growth, increase scale and enhance capabilities and distribution Distinctive product portfolio and multi-channel distribution network that provide broad market access and risk diversification Investing in capabilities to simplify solutions and enhance customer experience Adapting to changing economic and regulatory environments while maintaining pricing and risk management discipline Pursuing cross business opportunities to distribute worksite solutions through Prudential Advisors
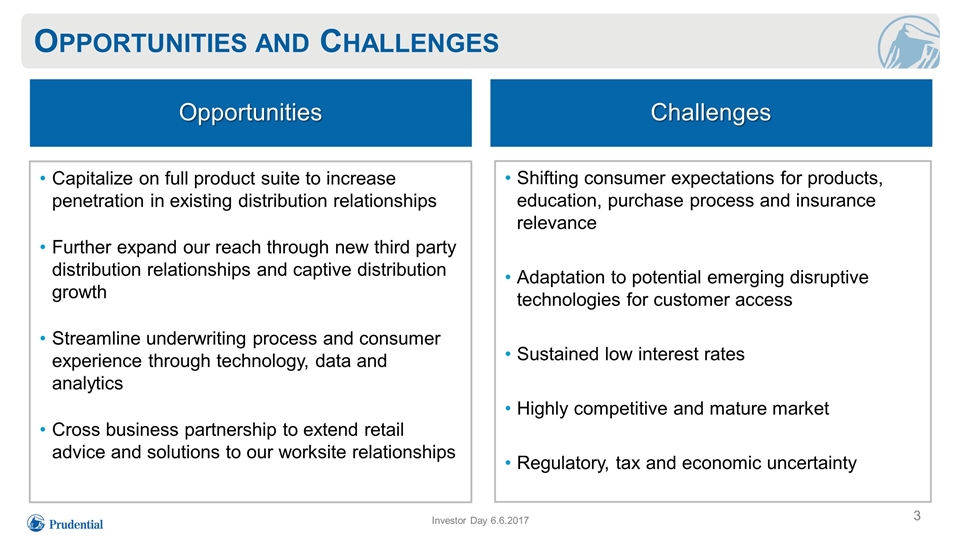
Opportunities and Challenges Investor Day 6.6.2017 Challenges Opportunities Capitalize on full product suite to increase penetration in existing distribution relationships Further expand our reach through new third party distribution relationships and captive distribution growth Streamline underwriting process and consumer experience through technology, data and analytics Cross business partnership to extend retail advice and solutions to our worksite relationships Shifting consumer expectations for products, education, purchase process and insurance relevance Adaptation to potential emerging disruptive technologies for customer access Sustained low interest rates Highly competitive and mature market Regulatory, tax and economic uncertainty
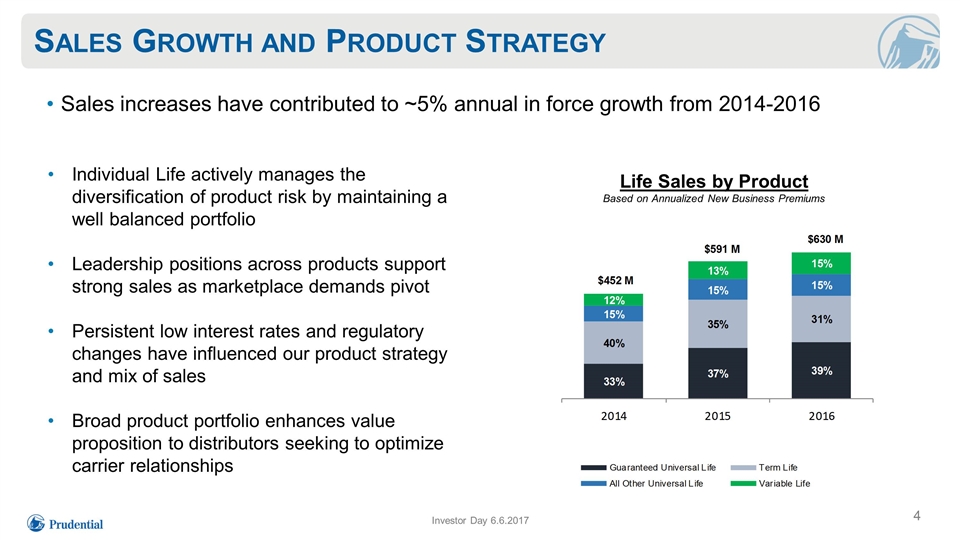
Sales Growth and Product Strategy Sales increases have contributed to ~5% annual in force growth from 2014-2016 Life Sales by Product Based on Annualized New Business Premiums Individual Life actively manages the diversification of product risk by maintaining a well balanced portfolio Leadership positions across products support strong sales as marketplace demands pivot Persistent low interest rates and regulatory changes have influenced our product strategy and mix of sales Broad product portfolio enhances value proposition to distributors seeking to optimize carrier relationships Investor Day 6.6.2017
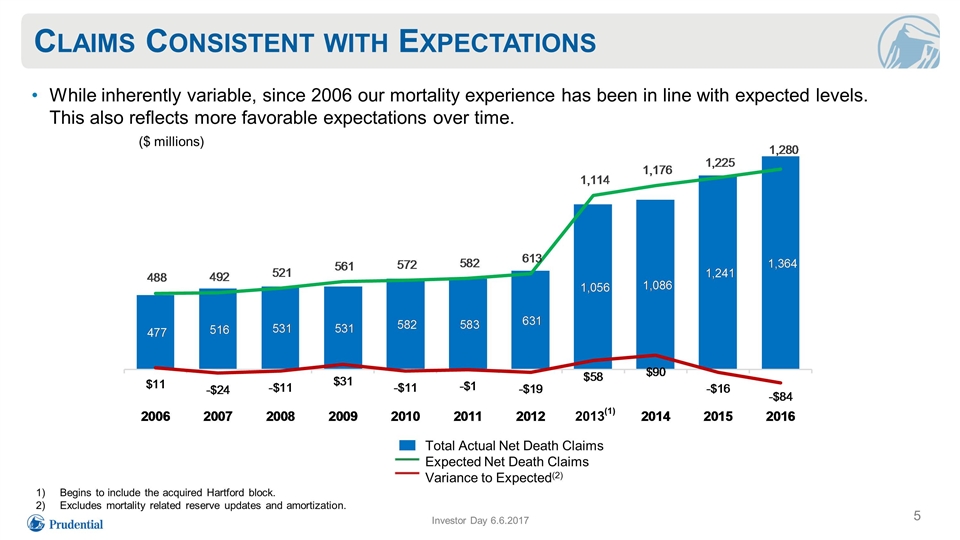
Claims Consistent with Expectations While inherently variable, since 2006 our mortality experience has been in line with expected levels. This also reflects more favorable expectations over time. Begins to include the acquired Hartford block. Excludes mortality related reserve updates and amortization. Investor Day 6.6.2017 Total Actual Net Death Claims Expected Net Death Claims Variance to Expected(2) ($ millions) 2013(1)
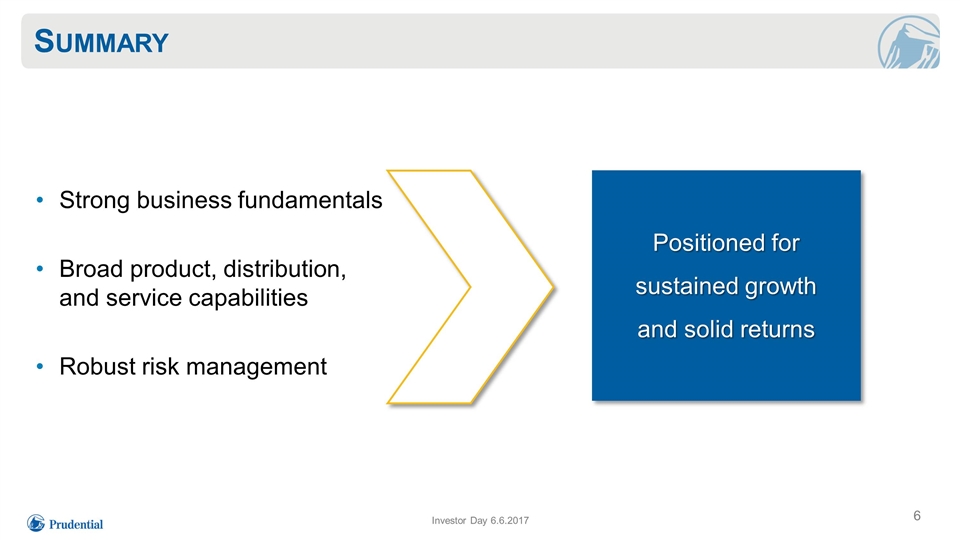
Summary 6 Strong business fundamentals Broad product, distribution, and service capabilities Robust risk management Positioned for sustained growth and solid returns Investor Day 6.6.2017

Prudential Financial, Inc. Annuities Lori Fouché President
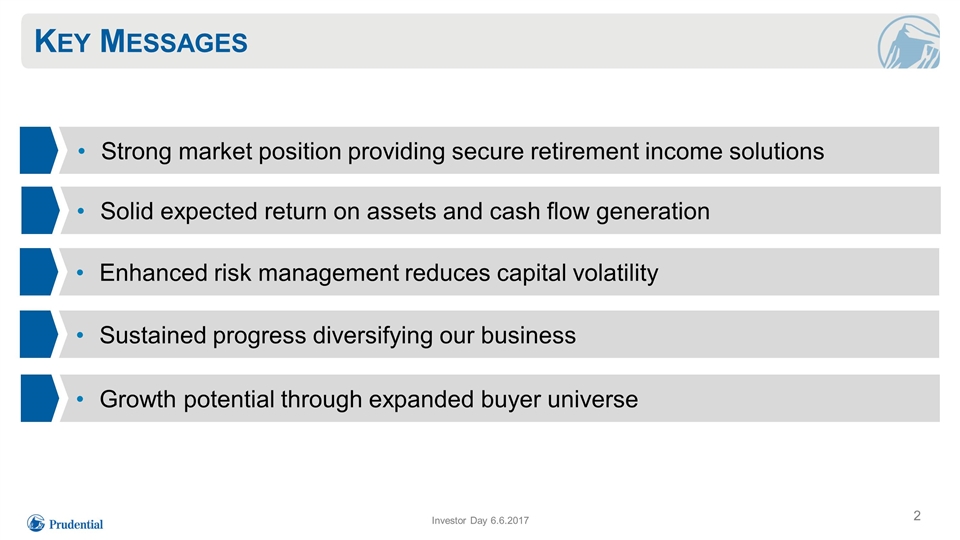
Key Messages Strong market position providing secure retirement income solutions Growth potential through expanded buyer universe Enhanced risk management reduces capital volatility Solid expected return on assets and cash flow generation Investor Day 6.6.2017 Sustained progress diversifying our business
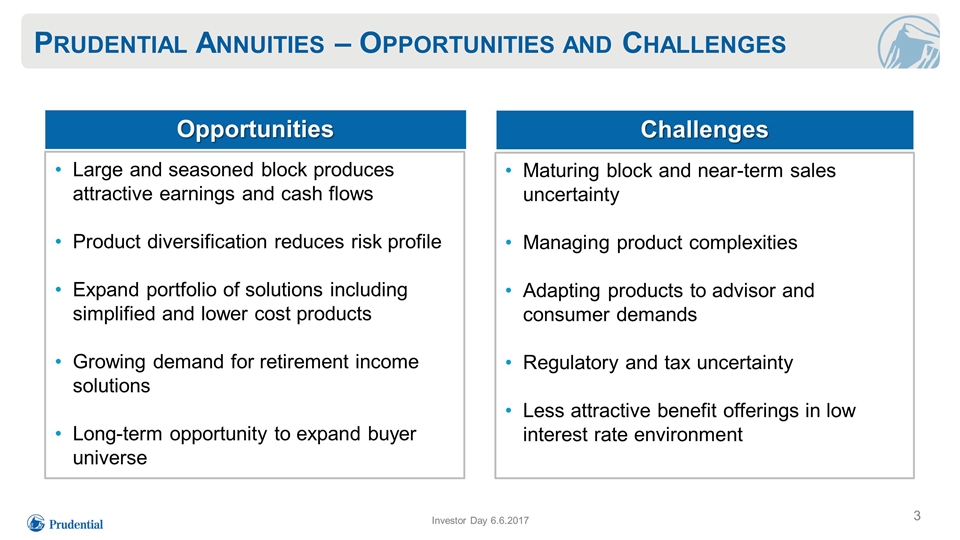
Prudential Annuities – Opportunities and Challenges Maturing block and near-term sales uncertainty Managing product complexities Adapting products to advisor and consumer demands Regulatory and tax uncertainty Less attractive benefit offerings in low interest rate environment Large and seasoned block produces attractive earnings and cash flows Product diversification reduces risk profile Expand portfolio of solutions including simplified and lower cost products Growing demand for retirement income solutions Long-term opportunity to expand buyer universe Opportunities Challenges Investor Day 6.6.2017
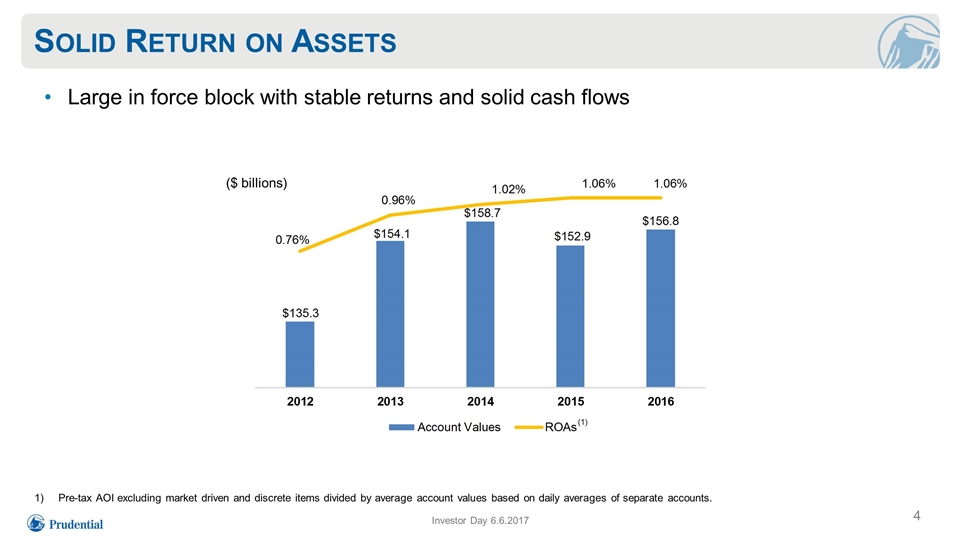
Solid Return on Assets Investor Day 6.6.2017 Pre-tax AOI excluding market driven and discrete items divided by average account values based on daily averages of separate accounts. (1) ($ billions) Large in force block with stable returns and solid cash flows
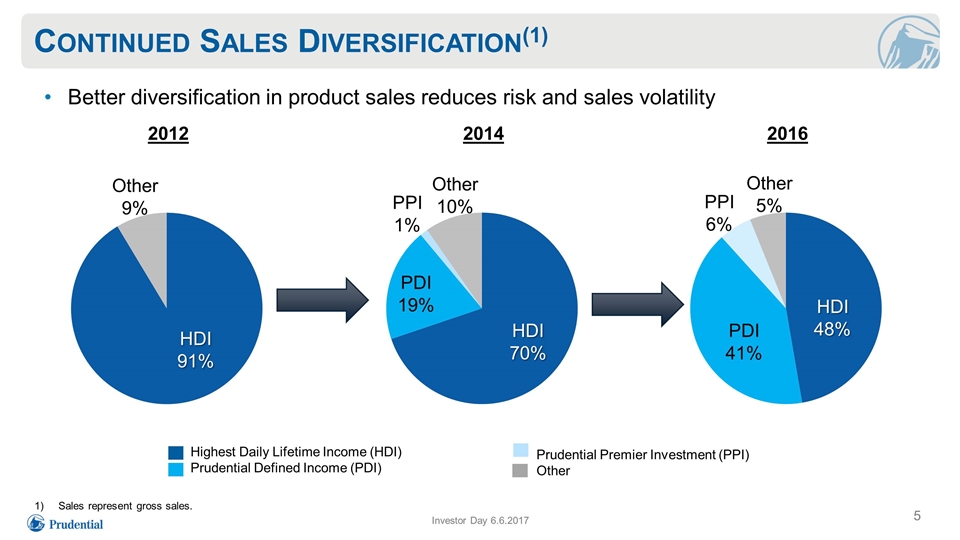
Continued Sales Diversification(1) Investor Day 6.6.2017 2012 2014 2016 HDI 91% Other 9% HDI 70% Other 10% PPI 1% PDI 19% PPI 6% Other 5% HDI 48% PDI 41% Highest Daily Lifetime Income (HDI) Prudential Defined Income (PDI) Prudential Premier Investment (PPI) Other Sales represent gross sales. Better diversification in product sales reduces risk and sales volatility
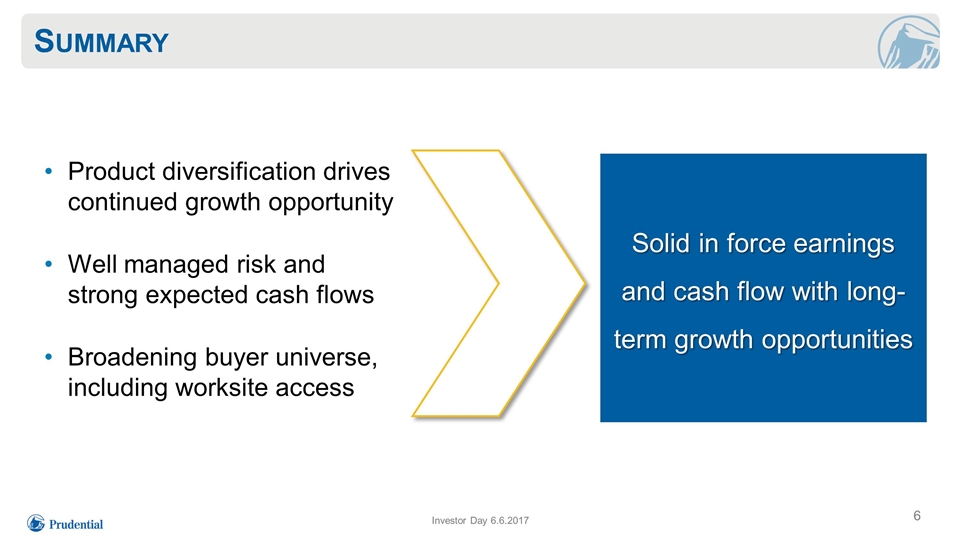
Summary Product diversification drives continued growth opportunity Well managed risk and strong expected cash flows Broadening buyer universe, including worksite access Investor Day 6.6.2017 Solid in force earnings and cash flow with long- term growth opportunities

Prudential Financial, Inc. International Insurance Charles F. Lowrey Executive Vice President Chief Operating Officer
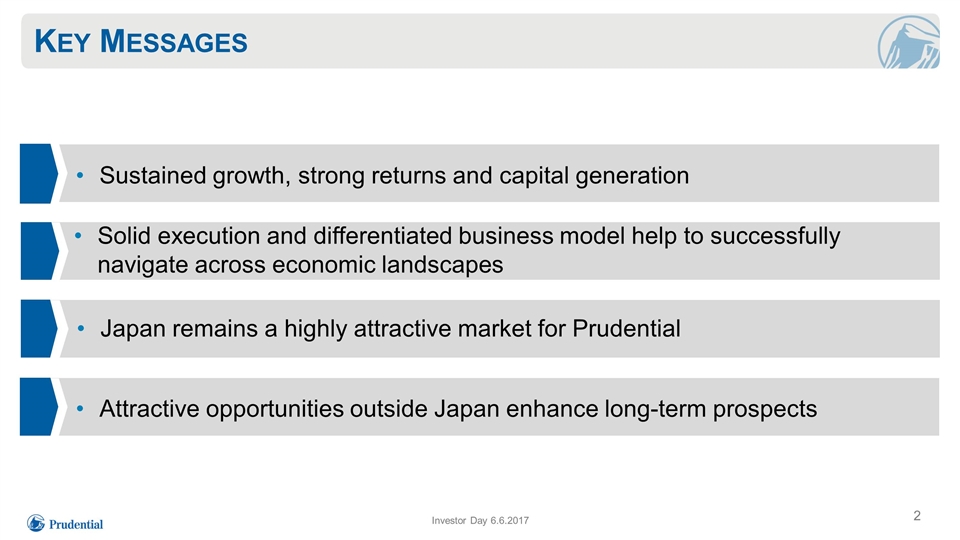
Key Messages Sustained growth, strong returns and capital generation Japan remains a highly attractive market for Prudential Attractive opportunities outside Japan enhance long-term prospects Solid execution and differentiated business model help to successfully navigate across economic landscapes Investor Day 6.6.2017
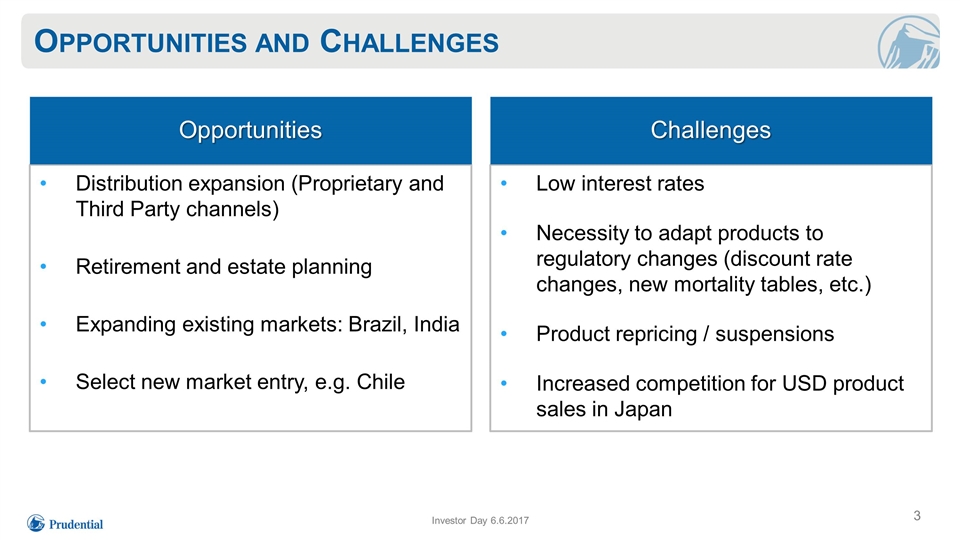
Opportunities and Challenges Low interest rates Necessity to adapt products to regulatory changes (discount rate changes, new mortality tables, etc.) Product repricing / suspensions Increased competition for USD product sales in Japan Distribution expansion (Proprietary and Third Party channels) Retirement and estate planning Expanding existing markets: Brazil, India Select new market entry, e.g. Chile Investor Day 6.6.2017 Challenges Opportunities
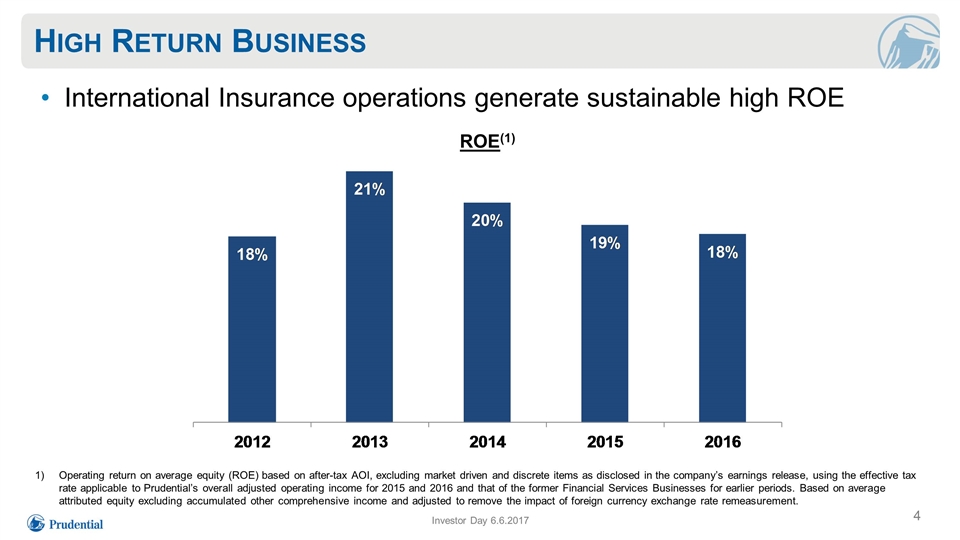
High Return Business 4 Investor Day 6.6.2017 Operating return on average equity (ROE) based on after-tax AOI, excluding market driven and discrete items as disclosed in the company’s earnings release, using the effective tax rate applicable to Prudential’s overall adjusted operating income for 2015 and 2016 and that of the former Financial Services Businesses for earlier periods. Based on average attributed equity excluding accumulated other comprehensive income and adjusted to remove the impact of foreign currency exchange rate remeasurement. International Insurance operations generate sustainable high ROE ROE(1)
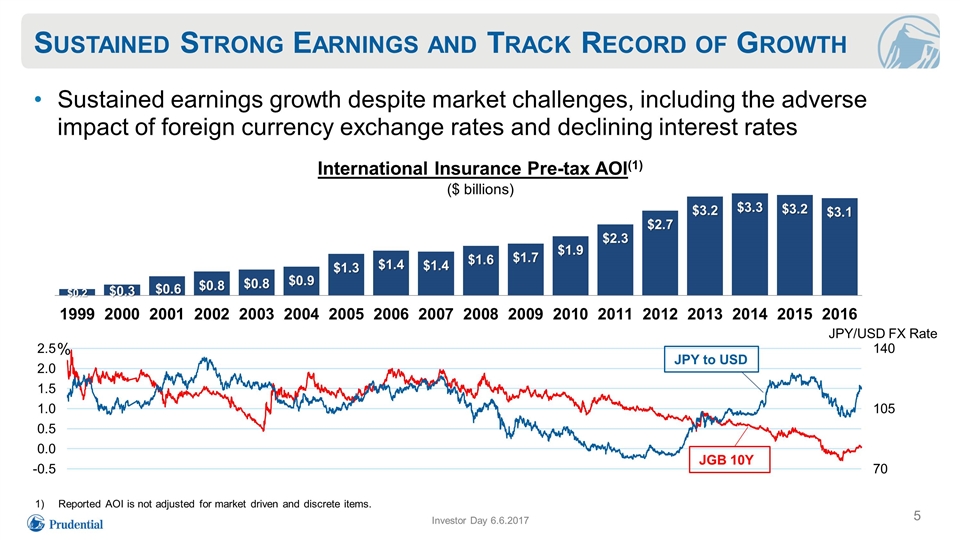
Sustained Strong Earnings and Track Record of Growth Sustained earnings growth despite market challenges, including the adverse impact of foreign currency exchange rates and declining interest rates Investor Day 6.6.2017 International Insurance Pre-tax AOI(1) ($ billions) Reported AOI is not adjusted for market driven and discrete items. % JPY/USD FX Rate JGB 10Y JPY to USD
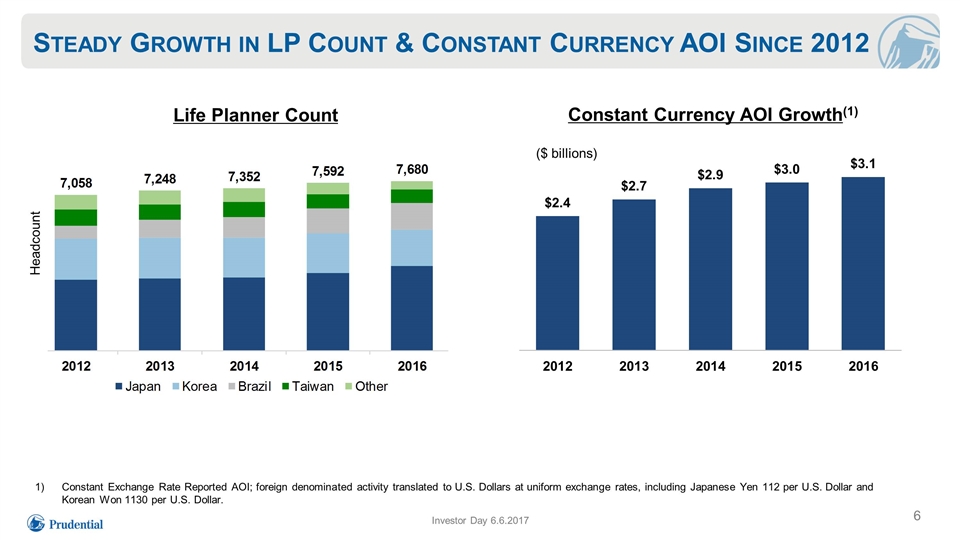
Steady Growth in LP Count & Constant Currency AOI Since 2012 Investor Day 6.6.2017 Headcount Constant Exchange Rate Reported AOI; foreign denominated activity translated to U.S. Dollars at uniform exchange rates, including Japanese Yen 112 per U.S. Dollar and Korean Won 1130 per U.S. Dollar. Constant Currency AOI Growth(1) Life Planner Count ($ billions)
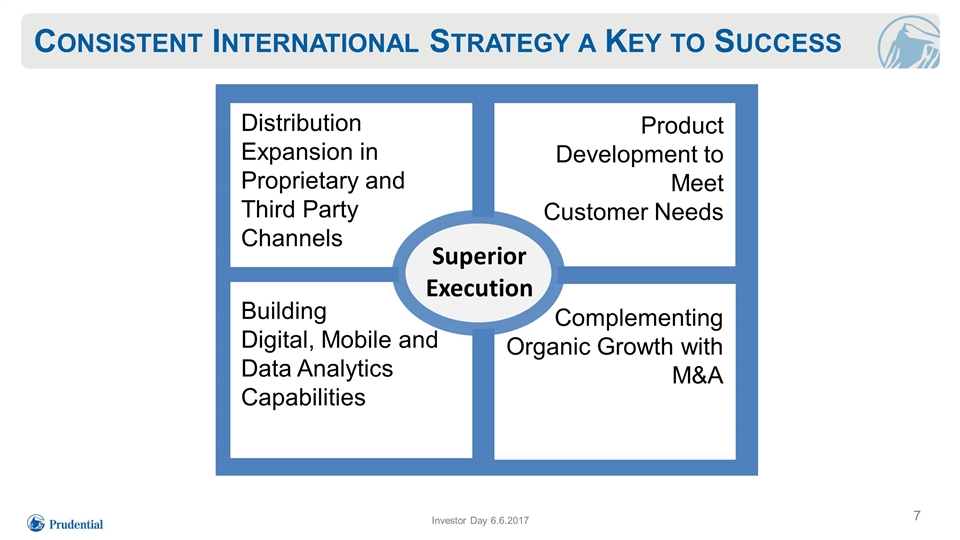
Consistent International Strategy a Key to Success Product Development to Meet Customer Needs Building Digital, Mobile and Data Analytics Capabilities Complementing Organic Growth with M&A Superior Execution Distribution Expansion in Proprietary and Third Party Channels Investor Day 6.6.2017
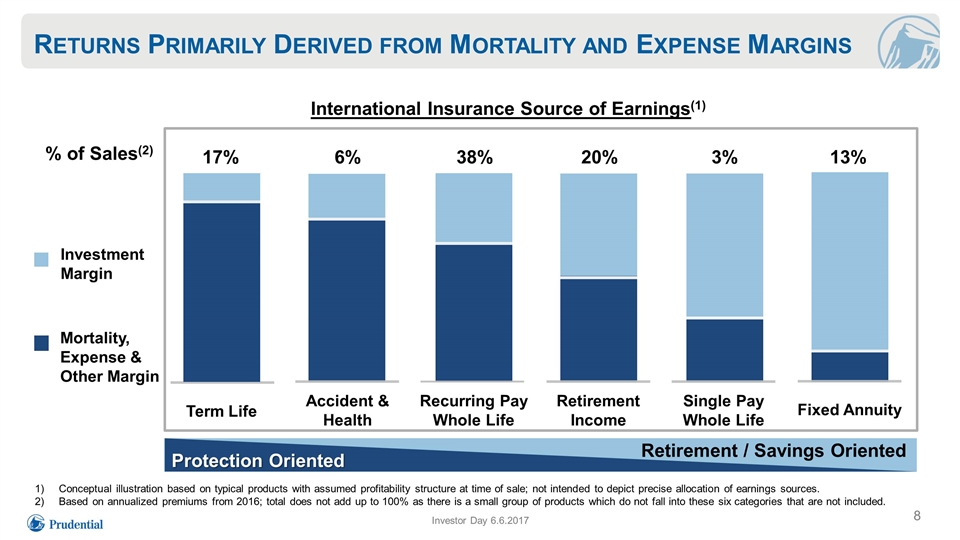
Returns Primarily Derived from Mortality and Expense Margins Conceptual illustration based on typical products with assumed profitability structure at time of sale; not intended to depict precise allocation of earnings sources. Based on annualized premiums from 2016; total does not add up to 100% as there is a small group of products which do not fall into these six categories that are not included. Mortality, Expense & Other Margin Investment Margin Retirement / Savings Oriented Term Life Accident & Health Recurring Pay Whole Life Retirement Income Fixed Annuity Single Pay Whole Life International Insurance Source of Earnings(1) Protection Oriented 17% 6% 38% 20% 3% 13% Investor Day 6.6.2017 % of Sales(2)
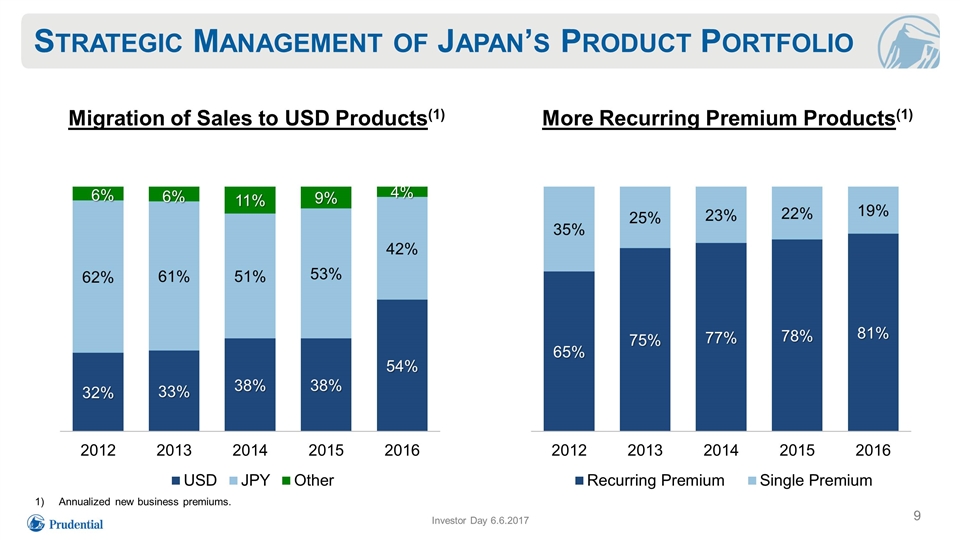
Strategic Management of Japan’s Product Portfolio Investor Day 6.6.2017 More Recurring Premium Products(1) Migration of Sales to USD Products(1) Annualized new business premiums.
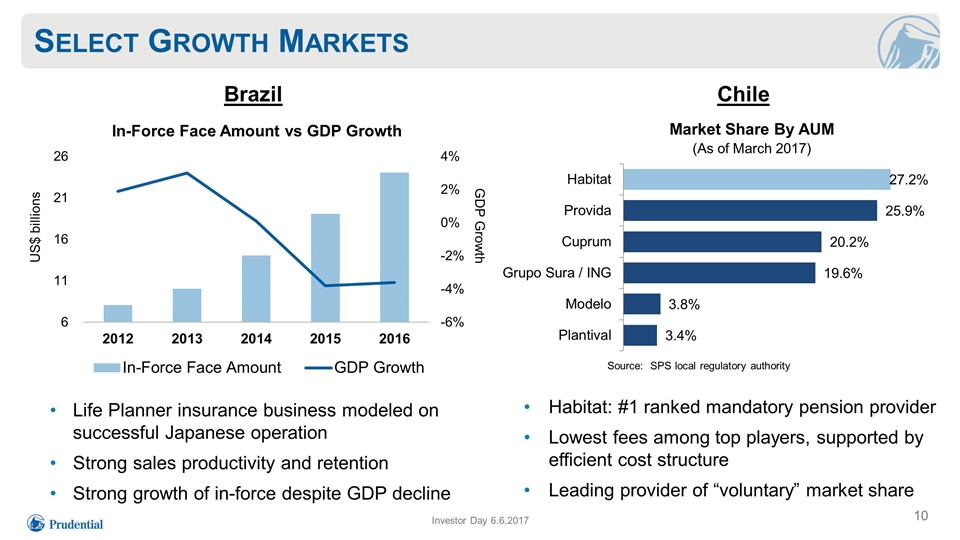
Select Growth Markets Investor Day 6.6.2017 Market Share By AUM (As of March 2017) Source: SPS local regulatory authority Chile Brazil US$ billions GDP Growth Life Planner insurance business modeled on successful Japanese operation Strong sales productivity and retention Strong growth of in-force despite GDP decline Habitat: #1 ranked mandatory pension provider Lowest fees among top players, supported by efficient cost structure Leading provider of “voluntary” market share
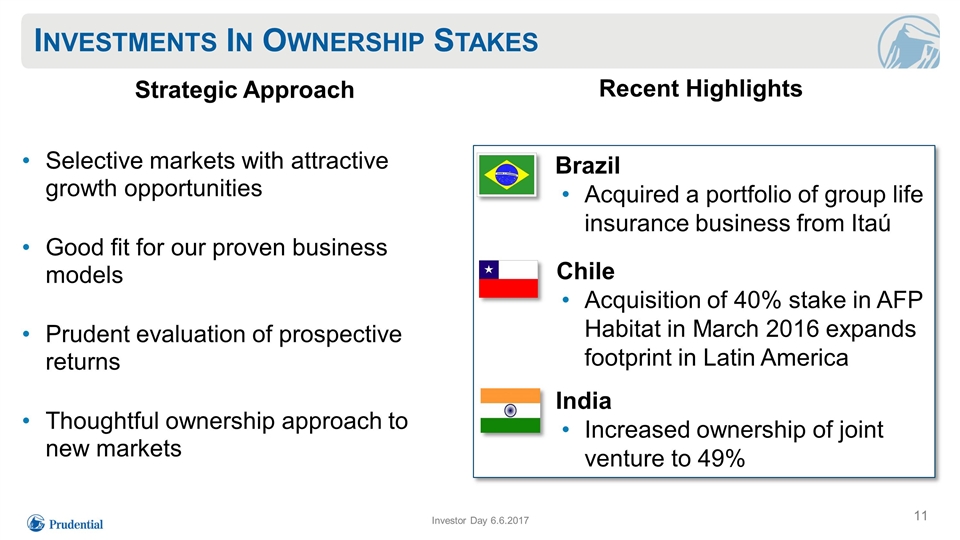
Investments In Ownership Stakes Investor Day 6.6.2017 Recent Highlights Strategic Approach Selective markets with attractive growth opportunities Good fit for our proven business models Prudent evaluation of prospective returns Thoughtful ownership approach to new markets Brazil Acquired a portfolio of group life insurance business from Itaú Chile Acquisition of 40% stake in AFP Habitat in March 2016 expands footprint in Latin America India Increased ownership of joint venture to 49%
Summary Superior execution and differentiated business model Japan remains highly attractive market Continued investment outside Japan enhances long-term prospects Investor Day 6.6.2017 Solid earnings and capital generation with long-term growth opportunities

Prudential Financial, Inc. Investment Portfolio Update Scott Sleyster Senior Vice President Chief Investment Officer
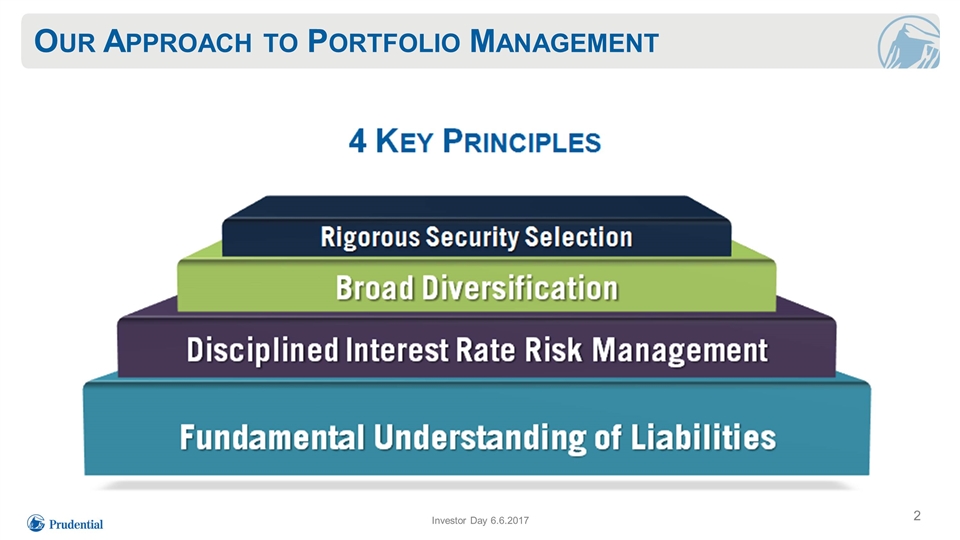
Our Approach to Portfolio Management Investor Day 6.6.2017
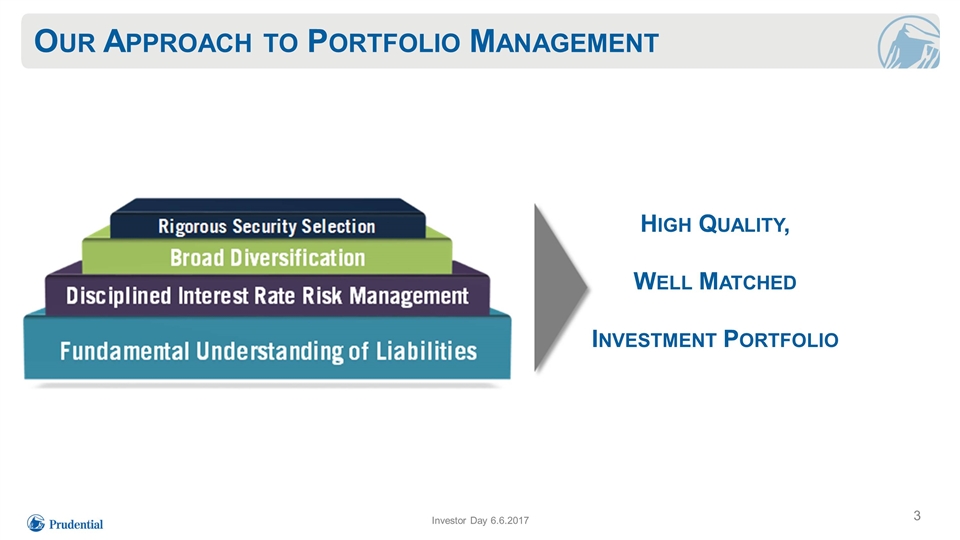
Our Approach to Portfolio Management Investor Day 6.6.2017 High Quality, Well Matched Investment Portfolio
Disciplined Liability-Driven Investing Portfolio managers aligned with business units Comprehensive understanding of product liability characteristics First line of defense against key investment and market risks Participation in product design and pricing committees Portfolio construction designed to hedge product liabilities Segmentation by key liability characteristics Investor Day 6.6.2017
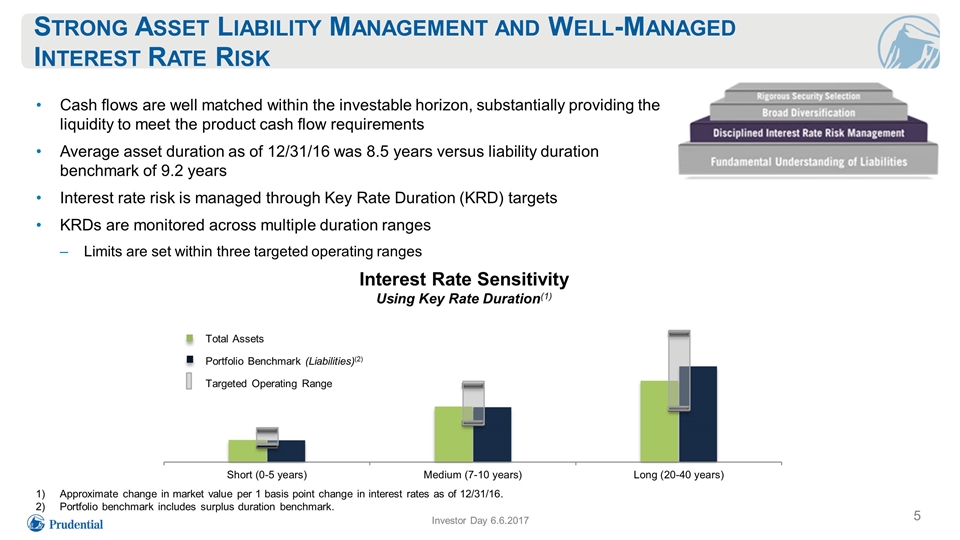
Strong Asset Liability Management and Well-Managed Interest Rate Risk Cash flows are well matched within the investable horizon, substantially providing the liquidity to meet the product cash flow requirements Average asset duration as of 12/31/16 was 8.5 years versus liability duration benchmark of 9.2 years Interest rate risk is managed through Key Rate Duration (KRD) targets KRDs are monitored across multiple duration ranges Limits are set within three targeted operating ranges Investor Day 6.6.2017 Approximate change in market value per 1 basis point change in interest rates as of 12/31/16. Portfolio benchmark includes surplus duration benchmark. Total Assets Portfolio Benchmark (Liabilities)(2) Targeted Operating Range Interest Rate Sensitivity Using Key Rate Duration(1)
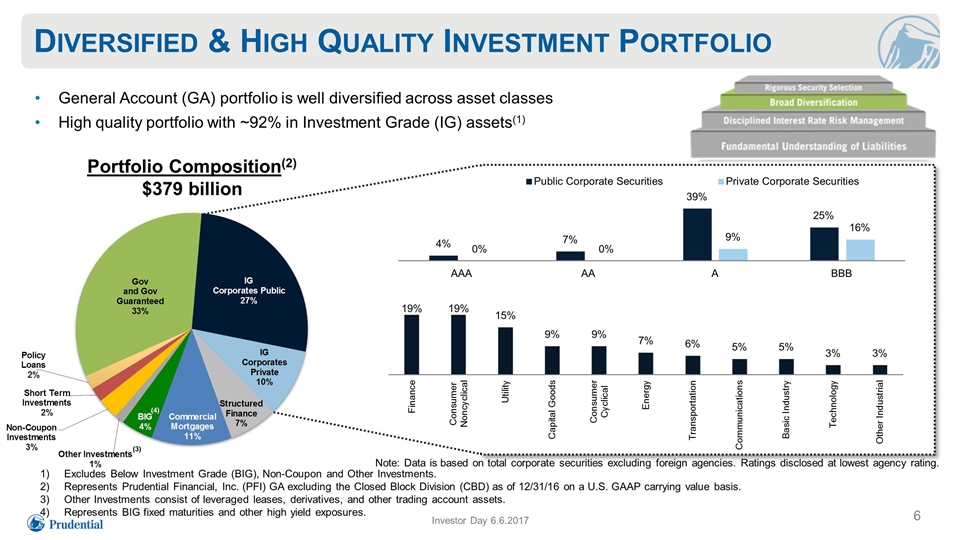
Diversified & High Quality Investment Portfolio General Account (GA) portfolio is well diversified across asset classes High quality portfolio with ~92% in Investment Grade (IG) assets(1) Investor Day 6.6.2017 Portfolio Composition(2) $379 billion Excludes Below Investment Grade (BIG), Non-Coupon and Other Investments. Represents Prudential Financial, Inc. (PFI) GA excluding the Closed Block Division (CBD) as of 12/31/16 on a U.S. GAAP carrying value basis. Other Investments consist of leveraged leases, derivatives, and other trading account assets. Represents BIG fixed maturities and other high yield exposures. Note: Data is based on total corporate securities excluding foreign agencies. Ratings disclosed at lowest agency rating. (4) (3) (4)

Asset Mix Has Remained Relatively Consistent Asset mix(1) continues to be well diversified and quality focused Below Investment Grade (BIG) holdings have decreased to 4% over the past decade Investor Day 6.6.2017 Represents Prudential Financial, Inc. (PFI) GA excluding the Closed Block Division (CBD) on a U.S. GAAP carrying value basis. Other Investments consist of leveraged leases, derivatives, and other trading account assets.
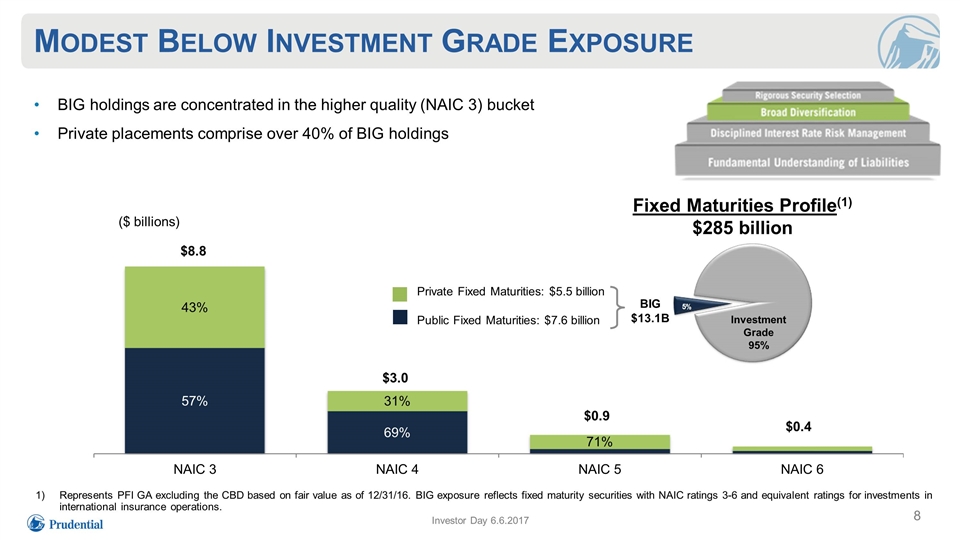
Fixed Maturities Profile(1) $285 billion Modest Below Investment Grade Exposure BIG holdings are concentrated in the higher quality (NAIC 3) bucket Private placements comprise over 40% of BIG holdings Investor Day 6.6.2017 Represents PFI GA excluding the CBD based on fair value as of 12/31/16. BIG exposure reflects fixed maturity securities with NAIC ratings 3-6 and equivalent ratings for investments in international insurance operations. Investment Grade 95% BIG $13.1B ($ billions)
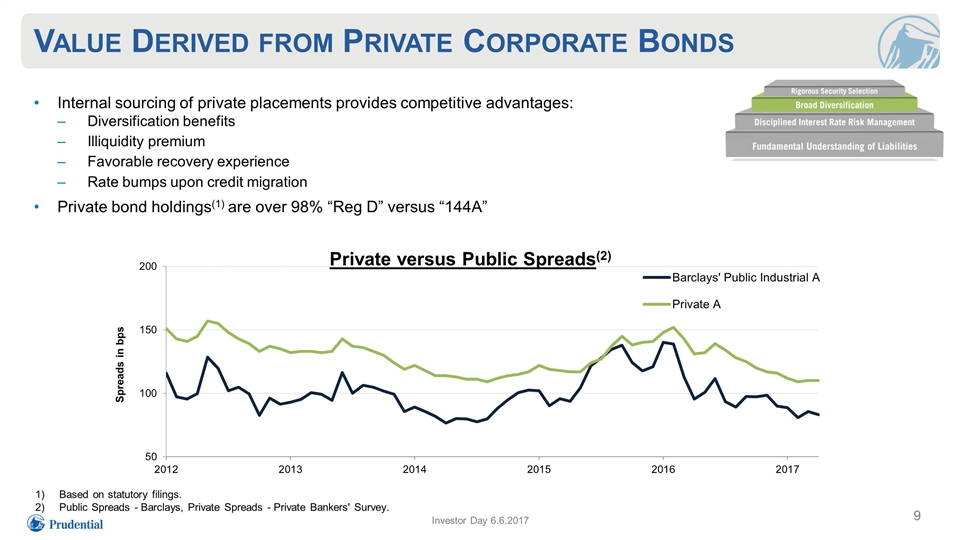
Value Derived from Private Corporate Bonds Internal sourcing of private placements provides competitive advantages: Diversification benefits Illiquidity premium Favorable recovery experience Rate bumps upon credit migration Private bond holdings(1) are over 98% “Reg D” versus “144A” Investor Day 6.6.2017 Private versus Public Spreads(2) Based on statutory filings. Public Spreads - Barclays, Private Spreads - Private Bankers' Survey.
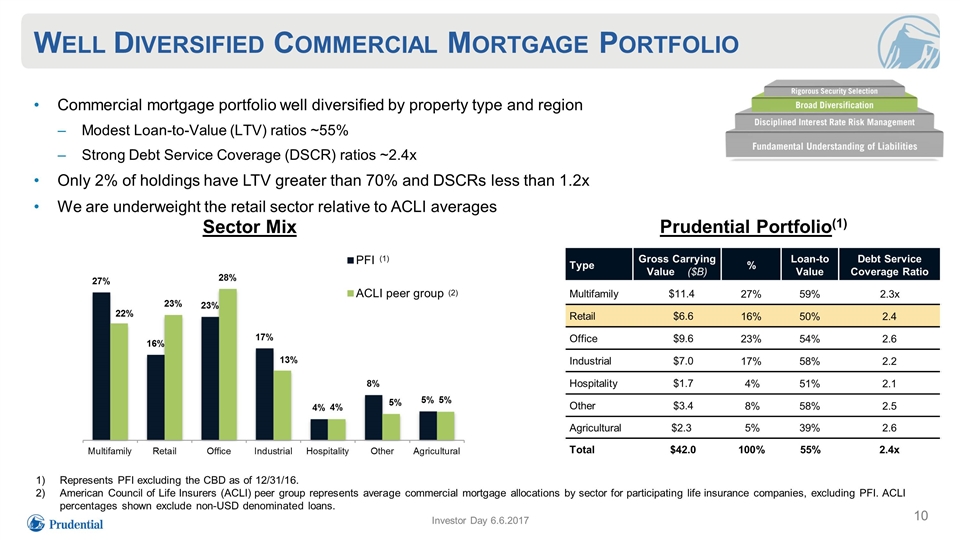
Well Diversified Commercial Mortgage Portfolio Commercial mortgage portfolio well diversified by property type and region Modest Loan-to-Value (LTV) ratios ~55% Strong Debt Service Coverage (DSCR) ratios ~2.4x Only 2% of holdings have LTV greater than 70% and DSCRs less than 1.2x We are underweight the retail sector relative to ACLI averages Investor Day 6.6.2017 Sector Mix Prudential Portfolio(1) Type Gross Carrying Value ($B) % Loan-to Value Debt Service Coverage Ratio Multifamily $11.4 27% 59% 2.3x Retail $6.6 16% 50% 2.4 Office $9.6 23% 54% 2.6 Industrial $7.0 17% 58% 2.2 Hospitality $1.7 4% 51% 2.1 Other $3.4 8% 58% 2.5 Agricultural $2.3 5% 39% 2.6 Total $42.0 100% 55% 2.4x Represents PFI excluding the CBD as of 12/31/16. American Council of Life Insurers (ACLI) peer group represents average commercial mortgage allocations by sector for participating life insurance companies, excluding PFI. ACLI percentages shown exclude non-USD denominated loans. (1) (2)
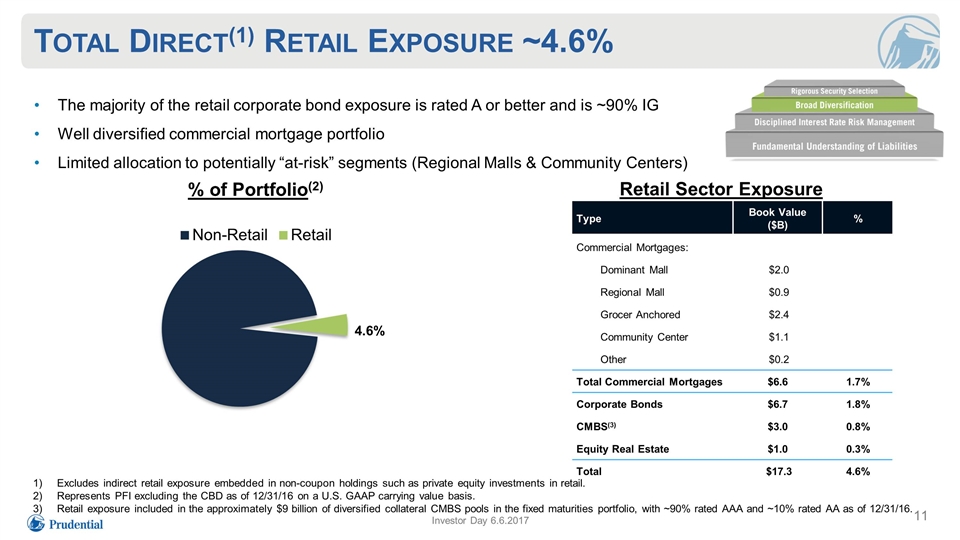
Total Direct(1) Retail Exposure ~4.6% The majority of the retail corporate bond exposure is rated A or better and is ~90% IG Well diversified commercial mortgage portfolio Limited allocation to potentially “at-risk” segments (Regional Malls & Community Centers) Investor Day 6.6.2017 Retail Sector Exposure % of Portfolio(2) Type Book Value ($B) % Commercial Mortgages: Dominant Mall $2.0 Regional Mall $0.9 Grocer Anchored $2.4 Community Center $1.1 Other $0.2 Total Commercial Mortgages $6.6 1.7% Corporate Bonds $6.7 1.8% CMBS(3) $3.0 0.8% Equity Real Estate $1.0 0.3% Total $17.3 4.6% Excludes indirect retail exposure embedded in non-coupon holdings such as private equity investments in retail. Represents PFI excluding the CBD as of 12/31/16 on a U.S. GAAP carrying value basis. Retail exposure included in the approximately $9 billion of diversified collateral CMBS pools in the fixed maturities portfolio, with ~90% rated AAA and ~10% rated AA as of 12/31/16.
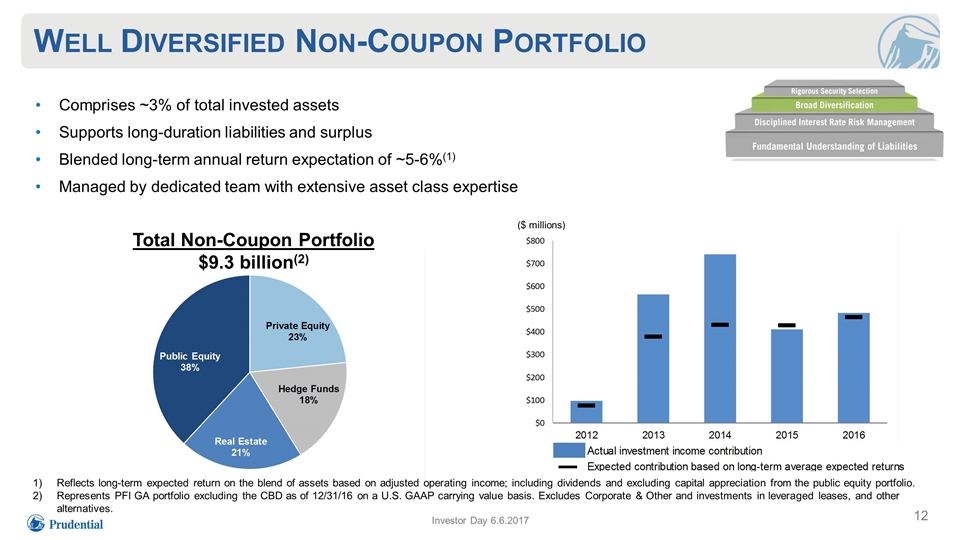
Well Diversified Non-Coupon Portfolio Comprises ~3% of total invested assets Supports long-duration liabilities and surplus Blended long-term annual return expectation of ~5-6%(1) Managed by dedicated team with extensive asset class expertise Investor Day 6.6.2017 ($ millions) Total Non-Coupon Portfolio $9.3 billion(2) Reflects long-term expected return on the blend of assets based on adjusted operating income; including dividends and excluding capital appreciation from the public equity portfolio. Represents PFI GA portfolio excluding the CBD as of 12/31/16 on a U.S. GAAP carrying value basis. Excludes Corporate & Other and investments in leveraged leases, and other alternatives.
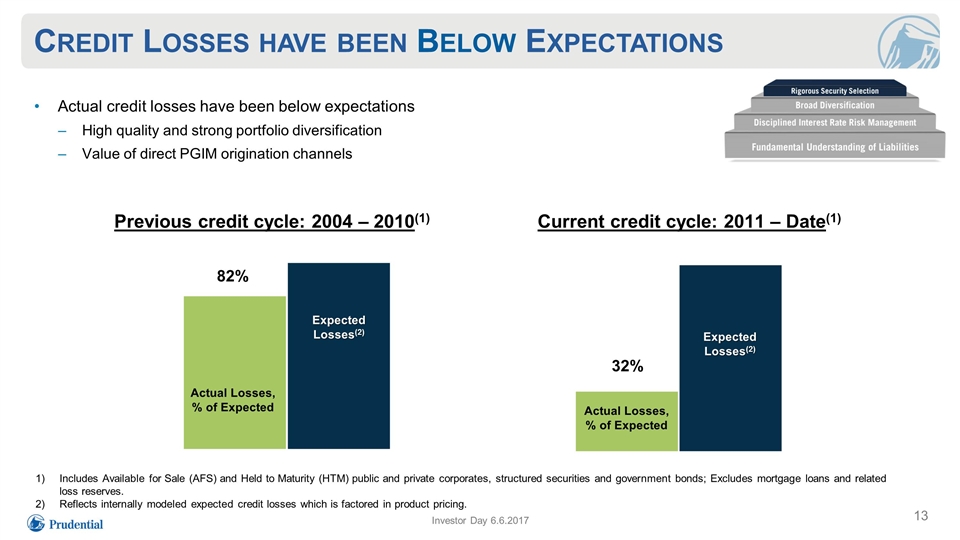
Credit Losses have been Below Expectations Actual credit losses have been below expectations High quality and strong portfolio diversification Value of direct PGIM origination channels Investor Day 6.6.2017 Previous credit cycle: 2004 – 2010(1) Current credit cycle: 2011 – Date(1) Includes Available for Sale (AFS) and Held to Maturity (HTM) public and private corporates, structured securities and government bonds; Excludes mortgage loans and related loss reserves. Reflects internally modeled expected credit losses which is factored in product pricing. 82% Actual Losses, % of Expected Expected Losses(2) Actual Losses, % of Expected Expected Losses(2) 32%
Strong Partnership with PGIM Investor Day 6.6.2017 Access to best in class investment expertise of a top 10 Asset Manager Outstanding private and mortgage origination capabilities Enhanced competitiveness on Pension Risk Transfer and other opportunities Average PGIM senior management team experience ~25 years Value Creation from Close Collaboration with PGIM Asset Managers
Summary Liability-driven and well-matched portfolio High quality and broadly diversified investment profile across asset classes Distinctive advantage from PGIM origination and asset management capabilities Investor Day 6.6.2017

Prudential Financial, Inc. Financial Management Rob Falzon Executive Vice President Chief Financial Officer
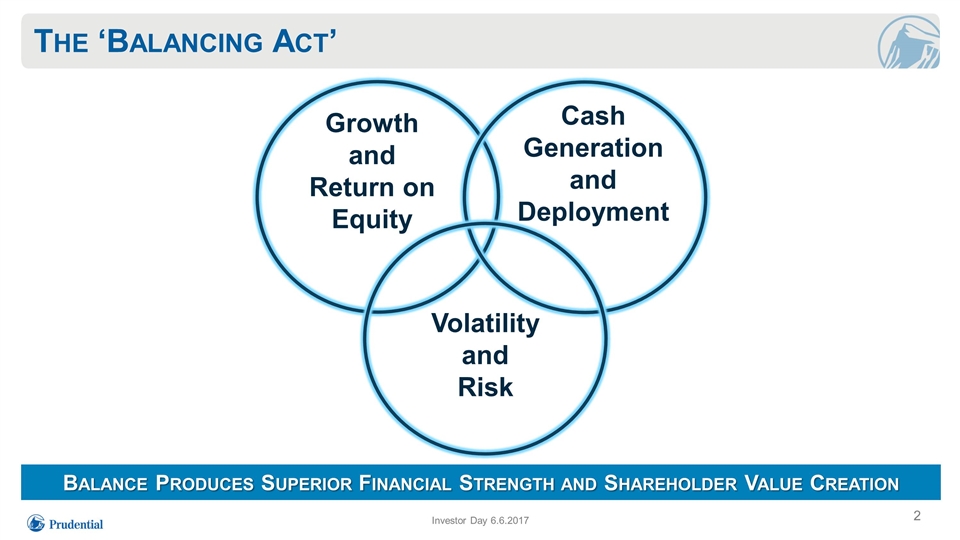
The ‘Balancing Act’ Balance Produces Superior Financial Strength and Shareholder Value Creation Investor Day 6.6.2017 Growth and Return on Equity Cash Generation and Deployment Volatility and Risk
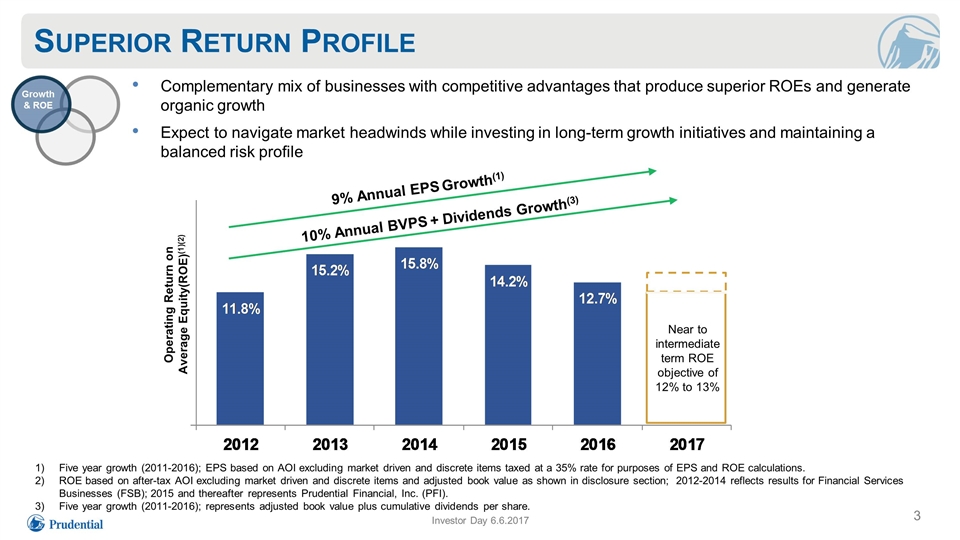
Superior Return Profile Near to intermediate term ROE objective of 12% to 13% Five year growth (2011-2016); EPS based on AOI excluding market driven and discrete items taxed at a 35% rate for purposes of EPS and ROE calculations. ROE based on after-tax AOI excluding market driven and discrete items and adjusted book value as shown in disclosure section; 2012-2014 reflects results for Financial Services Businesses (FSB); 2015 and thereafter represents Prudential Financial, Inc. (PFI). Five year growth (2011-2016); represents adjusted book value plus cumulative dividends per share. 9% Annual EPS Growth(1) Operating Return on Average Equity(ROE)(1)(2) Complementary mix of businesses with competitive advantages that produce superior ROEs and generate organic growth Expect to navigate market headwinds while investing in long-term growth initiatives and maintaining a balanced risk profile 10% Annual BVPS + Dividends Growth(3) Growth & ROE 00 Investor Day 6.6.2017
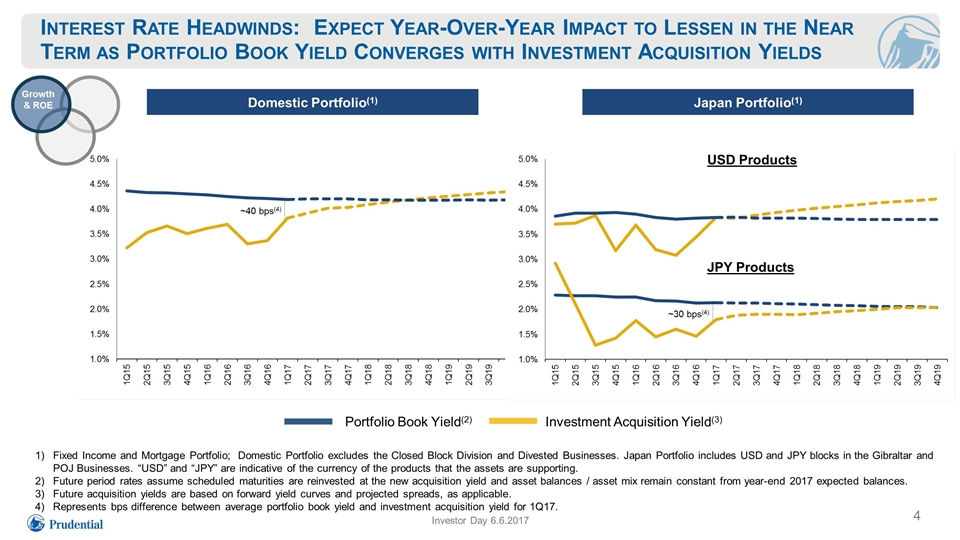
Fixed Income and Mortgage Portfolio; Domestic Portfolio excludes the Closed Block Division and Divested Businesses. Japan Portfolio includes USD and JPY blocks in the Gibraltar and POJ Businesses. “USD” and “JPY” are indicative of the currency of the products that the assets are supporting. Future period rates assume scheduled maturities are reinvested at the new acquisition yield and asset balances / asset mix remain constant from year-end 2017 expected balances. Future acquisition yields are based on forward yield curves and projected spreads, as applicable. Represents bps difference between average portfolio book yield and investment acquisition yield for 1Q17. Interest Rate Headwinds: Expect Year-Over-Year Impact to Lessen in the Near Term as Portfolio Book Yield Converges with Investment Acquisition Yields Domestic Portfolio(1) JPY Products USD Products Japan Portfolio(1) ~40 bps(4) ~30 bps(4) Portfolio Book Yield(2) Investment Acquisition Yield(3) Growth & ROE Investor Day 6.6.2017
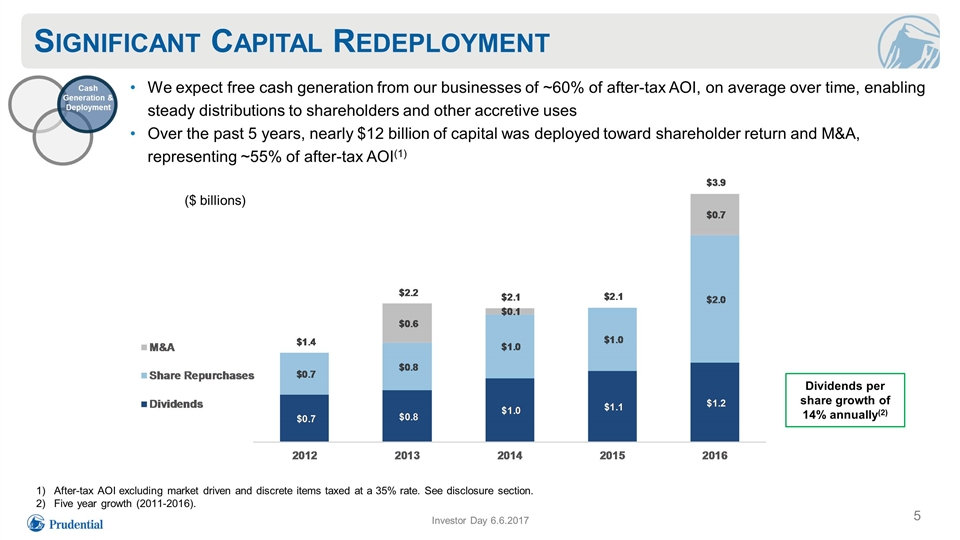
Significant Capital Redeployment We expect free cash generation from our businesses of ~60% of after-tax AOI, on average over time, enabling steady distributions to shareholders and other accretive uses Over the past 5 years, nearly $12 billion of capital was deployed toward shareholder return and M&A, representing ~55% of after-tax AOI(1) After-tax AOI excluding market driven and discrete items taxed at a 35% rate. See disclosure section. Five year growth (2011-2016). Dividends per share growth of 14% annually(2) Cash Generation & Deployment Investor Day 6.6.2017 ($ billions) ($ billions)
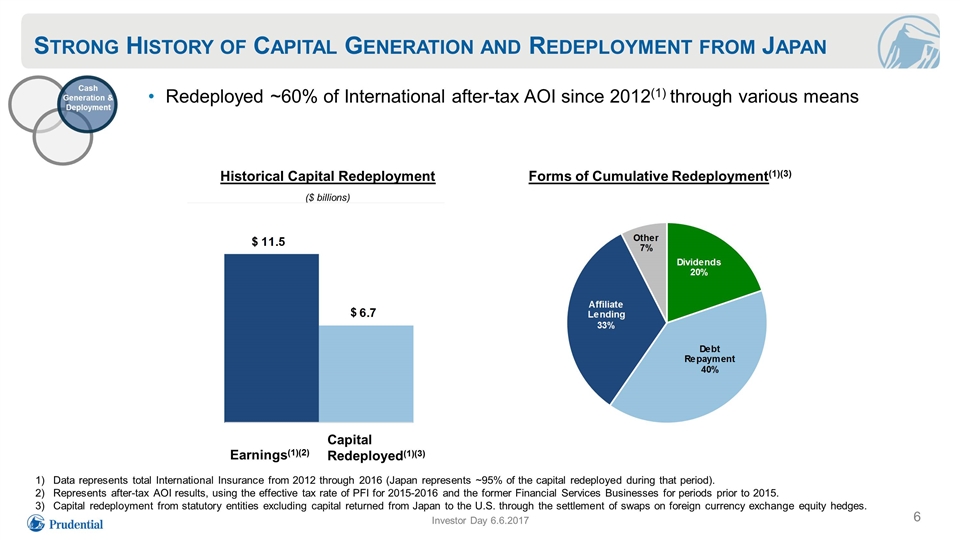
($ billions) Historical Capital Redeployment Forms of Cumulative Redeployment(1)(3) Data represents total International Insurance from 2012 through 2016 (Japan represents ~95% of the capital redeployed during that period). Represents after-tax AOI results, using the effective tax rate of PFI for 2015-2016 and the former Financial Services Businesses for periods prior to 2015. Capital redeployment from statutory entities excluding capital returned from Japan to the U.S. through the settlement of swaps on foreign currency exchange equity hedges. Strong History of Capital Generation and Redeployment from Japan Redeployed ~60% of International after-tax AOI since 2012(1) through various means Cash Generation & Deployment Investor Day 6.6.2017 $ $ Earnings(1)(2) Capital Redeployed(1)(3)
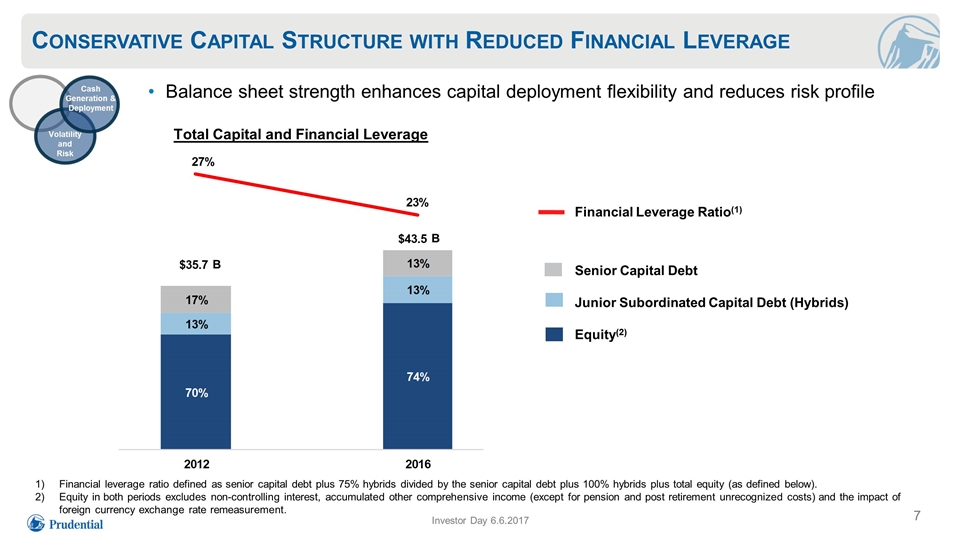
Conservative Capital Structure with Reduced Financial Leverage Financial leverage ratio defined as senior capital debt plus 75% hybrids divided by the senior capital debt plus 100% hybrids plus total equity (as defined below). Equity in both periods excludes non-controlling interest, accumulated other comprehensive income (except for pension and post retirement unrecognized costs) and the impact of foreign currency exchange rate remeasurement. Volatility and Risk Investor Day 6.6.2017 Cash Generation & Deployment Balance sheet strength enhances capital deployment flexibility and reduces risk profile Financial Leverage Ratio(1) Senior Capital Debt Junior Subordinated Capital Debt (Hybrids) Equity(2) B B Total Capital and Financial Leverage
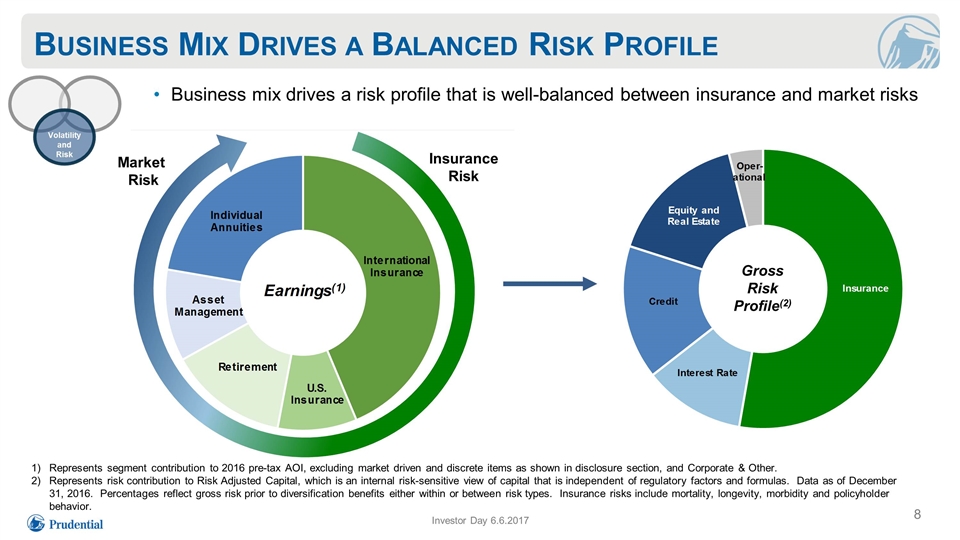
Business Mix Drives a Balanced Risk Profile Business mix drives a risk profile that is well-balanced between insurance and market risks Insurance Risk Market Risk Volatility and Risk Gross Risk Profile(2) Investor Day 6.6.2017 Represents segment contribution to 2016 pre-tax AOI, excluding market driven and discrete items as shown in disclosure section, and Corporate & Other. Represents risk contribution to Risk Adjusted Capital, which is an internal risk-sensitive view of capital that is independent of regulatory factors and formulas. Data as of December 31, 2016. Percentages reflect gross risk prior to diversification benefits either within or between risk types. Insurance risks include mortality, longevity, morbidity and policyholder behavior. 8
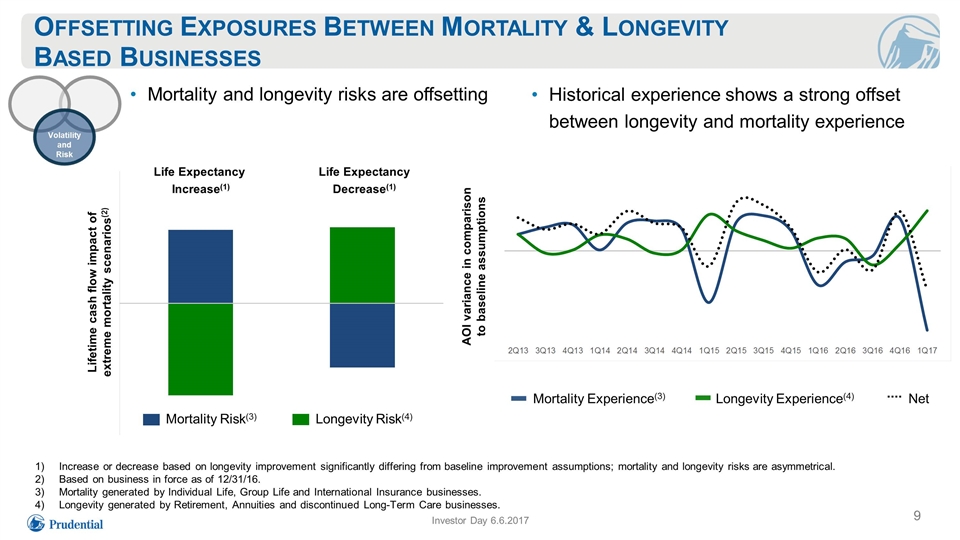
Offsetting Exposures Between Mortality & Longevity Based Businesses 9 Increase or decrease based on longevity improvement significantly differing from baseline improvement assumptions; mortality and longevity risks are asymmetrical. Based on business in force as of 12/31/16. Mortality generated by Individual Life, Group Life and International Insurance businesses. Longevity generated by Retirement, Annuities and discontinued Long-Term Care businesses. Life Expectancy Increase(1) Life Expectancy Decrease(1) Mortality Risk(3) Longevity Risk(4) Mortality Experience(3) Longevity Experience(4) Net Historical experience shows a strong offset between longevity and mortality experience Mortality and longevity risks are offsetting Lifetime cash flow impact of extreme mortality scenarios(2) Investor Day 6.6.2017 Volatility and Risk AOI variance in comparison to baseline assumptions
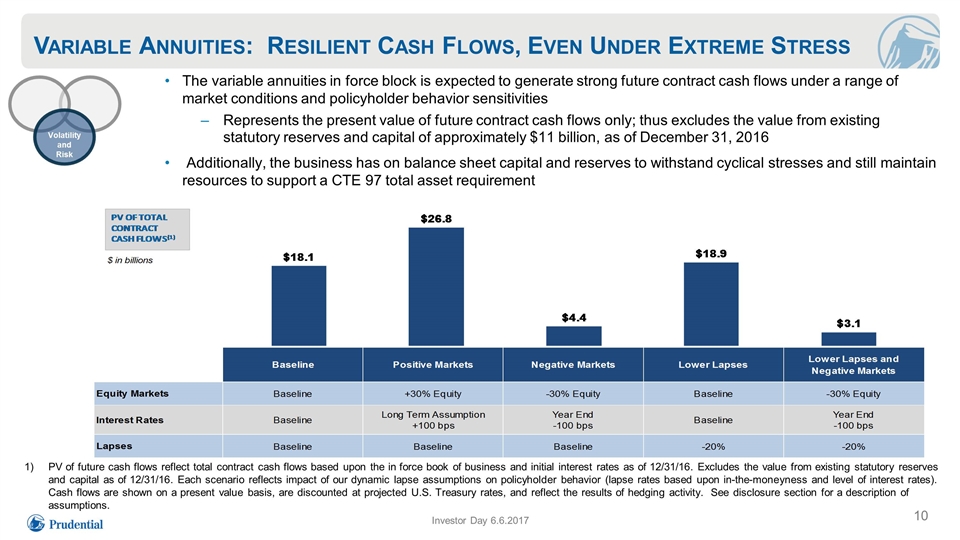
Variable Annuities: Resilient Cash Flows, Even Under Extreme Stress 10 The variable annuities in force block is expected to generate strong future contract cash flows under a range of market conditions and policyholder behavior sensitivities Represents the present value of future contract cash flows only; thus excludes the value from existing statutory reserves and capital of approximately $11 billion, as of December 31, 2016 Additionally, the business has on balance sheet capital and reserves to withstand cyclical stresses and still maintain resources to support a CTE 97 total asset requirement PV of future cash flows reflect total contract cash flows based upon the in force book of business and initial interest rates as of 12/31/16. Excludes the value from existing statutory reserves and capital as of 12/31/16. Each scenario reflects impact of our dynamic lapse assumptions on policyholder behavior (lapse rates based upon in-the-moneyness and level of interest rates). Cash flows are shown on a present value basis, are discounted at projected U.S. Treasury rates, and reflect the results of hedging activity. See disclosure section for a description of assumptions. Volatility and Risk Investor Day 6.6.2017
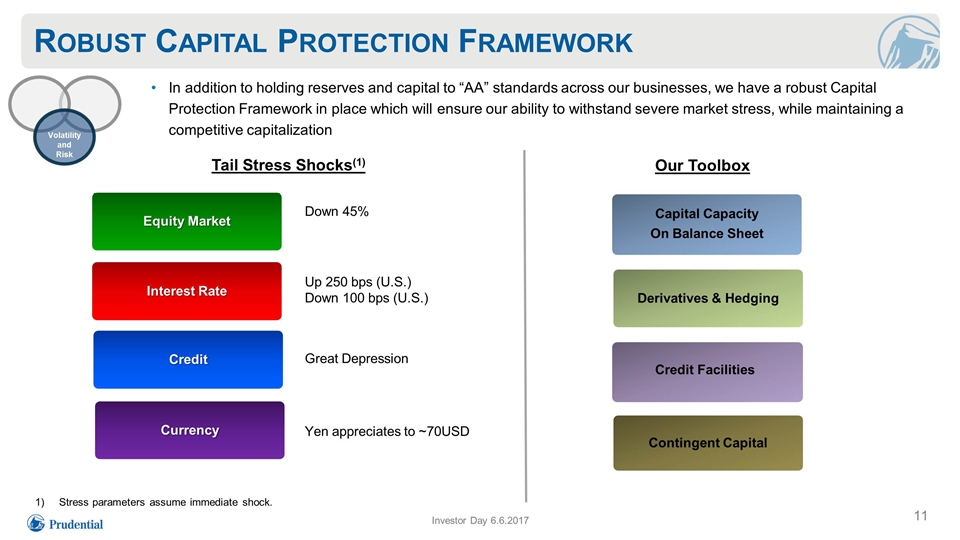
Robust Capital Protection Framework 11 In addition to holding reserves and capital to “AA” standards across our businesses, we have a robust Capital Protection Framework in place which will ensure our ability to withstand severe market stress, while maintaining a competitive capitalization Stress parameters assume immediate shock. Capital Capacity On Balance Sheet Equity Market Interest Rate Credit Currency Down 45% Up 250 bps (U.S.) Down 100 bps (U.S.) Great Depression Yen appreciates to ~70USD Contingent Capital Tail Stress Shocks(1) Our Toolbox Derivatives & Hedging Credit Facilities Volatility and Risk Investor Day 6.6.2017
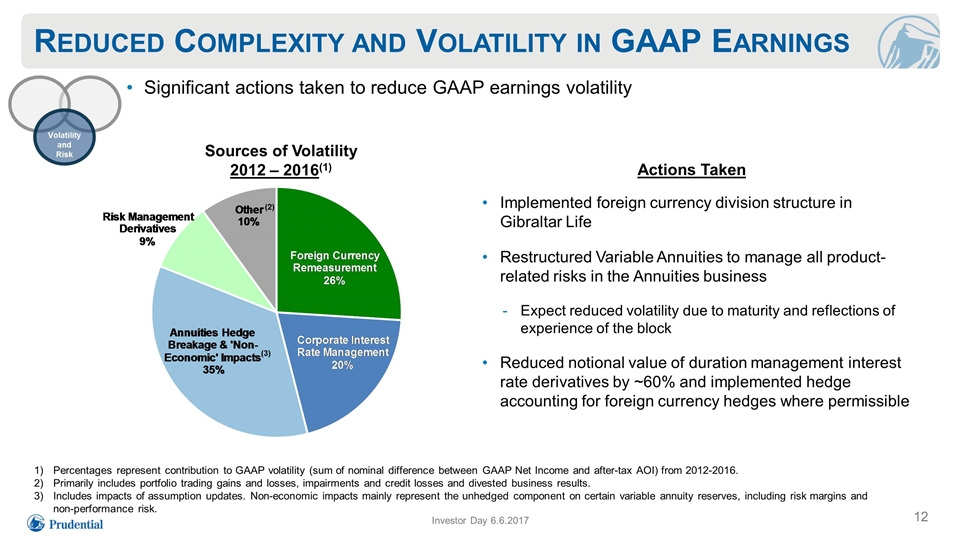
Reduced Complexity and Volatility in GAAP Earnings Percentages represent contribution to GAAP volatility (sum of nominal difference between GAAP Net Income and after-tax AOI) from 2012-2016. Primarily includes portfolio trading gains and losses, impairments and credit losses and divested business results. Includes impacts of assumption updates. Non-economic impacts mainly represent the unhedged component on certain variable annuity reserves, including risk margins and non-performance risk. Implemented foreign currency division structure in Gibraltar Life Restructured Variable Annuities to manage all product-related risks in the Annuities business Expect reduced volatility due to maturity and reflections of experience of the block Reduced notional value of duration management interest rate derivatives by ~60% and implemented hedge accounting for foreign currency hedges where permissible Sources of Volatility 2012 – 2016(1) Significant actions taken to reduce GAAP earnings volatility Volatility and Risk Investor Day 6.6.2017 12 Actions Taken (2) (3)
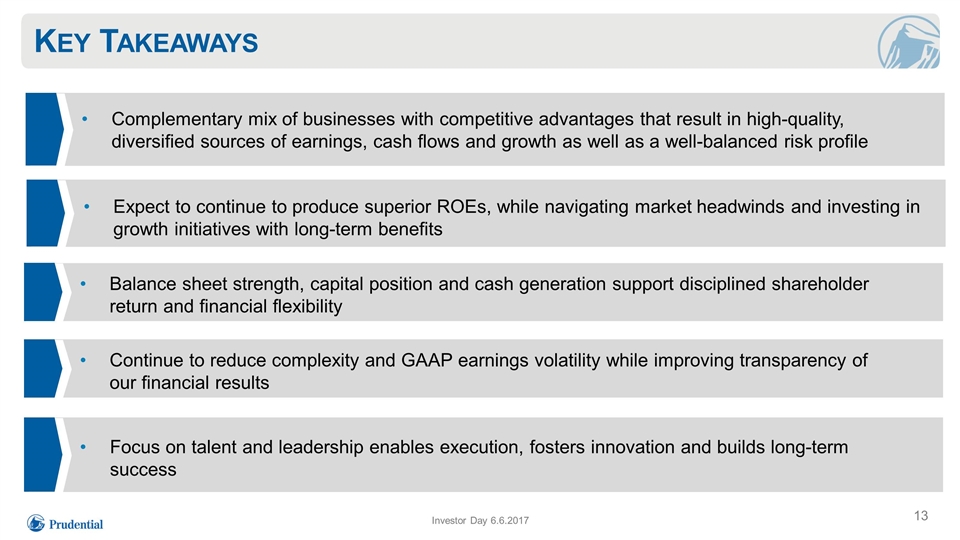
Key Takeaways 13 Complementary mix of businesses with competitive advantages that result in high-quality, diversified sources of earnings, cash flows and growth as well as a well-balanced risk profile Continue to reduce complexity and GAAP earnings volatility while improving transparency of our financial results Expect to continue to produce superior ROEs, while navigating market headwinds and investing in growth initiatives with long-term benefits Balance sheet strength, capital position and cash generation support disciplined shareholder return and financial flexibility Focus on talent and leadership enables execution, fosters innovation and builds long-term success Investor Day 6.6.2017


