Prudential Financial, inc. 2018 Financial Outlook Conference Call Presentation December 14, 2017 Exhibit 99.1
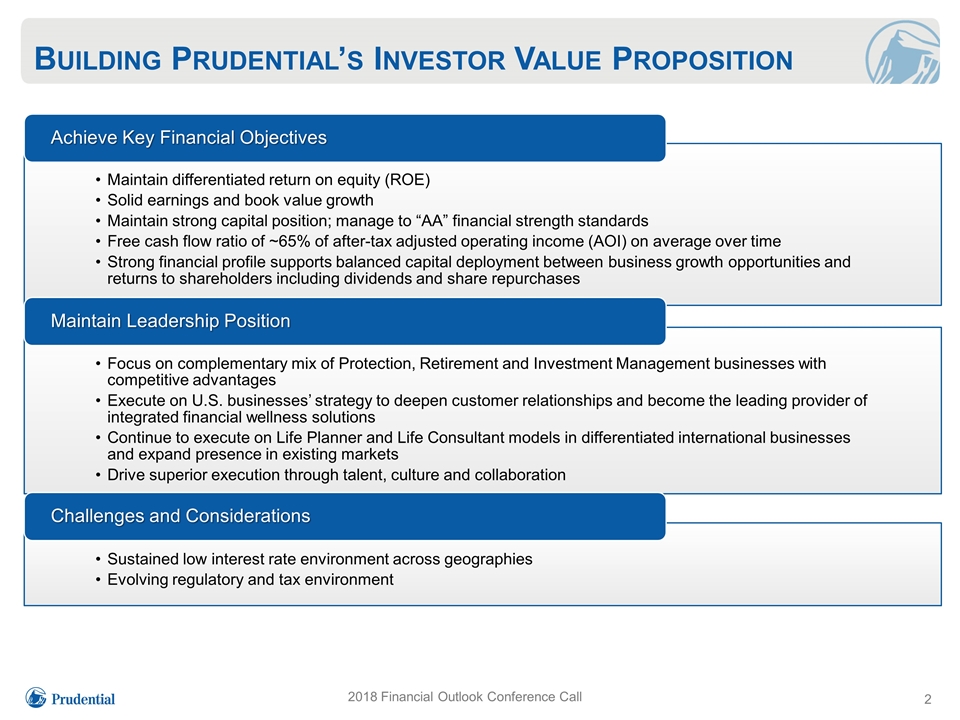
Building Prudential’s Investor Value Proposition 2018 Financial Outlook Conference Call Achieve Key Financial Objectives Maintain Leadership Position Maintain differentiated return on equity (ROE) Focus on complementary mix of Protection, Retirement and Investment Management businesses with competitive advantages Challenges and Considerations Sustained low interest rate environment across geographies Drive superior execution through talent, culture and collaboration Evolving regulatory and tax environment Strong financial profile supports balanced capital deployment between business growth opportunities and returns to shareholders including dividends and share repurchases Execute on U.S. businesses’ strategy to deepen customer relationships and become the leading provider of integrated financial wellness solutions Solid earnings and book value growth Free cash flow ratio of ~65% of after-tax adjusted operating income (AOI) on average over time Maintain strong capital position; manage to “AA” financial strength standards Continue to execute on Life Planner and Life Consultant models in differentiated international businesses and expand presence in existing markets
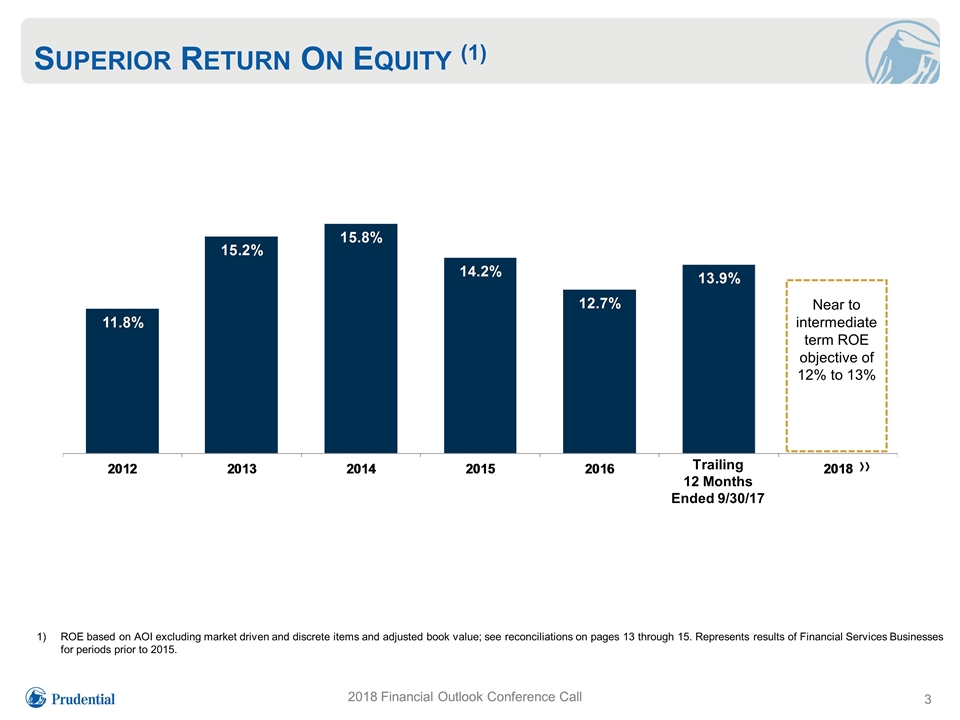
Superior Return On Equity (1) 2018 Financial Outlook Conference Call Near to intermediate term ROE objective of 12% to 13% Trailing 12 Months Ended 9/30/17 ROE based on AOI excluding market driven and discrete items and adjusted book value; see reconciliations on pages 13 through 15. Represents results of Financial Services Businesses for periods prior to 2015.
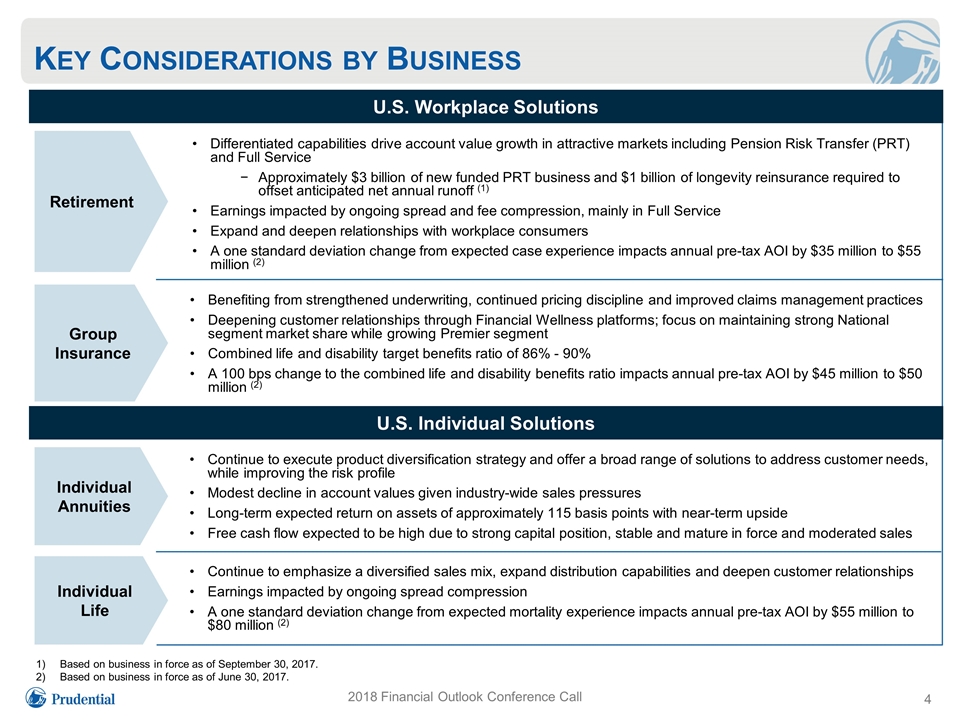
Key Considerations by Business 2018 Financial Outlook Conference Call Based on business in force as of September 30, 2017. Based on business in force as of June 30, 2017. U.S. Individual Solutions Continue to execute product diversification strategy and offer a broad range of solutions to address customer needs, while improving the risk profile Modest decline in account values given industry-wide sales pressures Long-term expected return on assets of approximately 115 basis points with near-term upside Free cash flow expected to be high due to strong capital position, stable and mature in force and moderated sales Continue to emphasize a diversified sales mix, expand distribution capabilities and deepen customer relationships Earnings impacted by ongoing spread compression A one standard deviation change from expected mortality experience impacts annual pre-tax AOI by $55 million to $80 million (2) Differentiated capabilities drive account value growth in attractive markets including Pension Risk Transfer (PRT) and Full Service Approximately $3 billion of new funded PRT business and $1 billion of longevity reinsurance required to offset anticipated net annual runoff (1) Earnings impacted by ongoing spread and fee compression, mainly in Full Service Expand and deepen relationships with workplace consumers A one standard deviation change from expected case experience impacts annual pre-tax AOI by $35 million to $55 million (2) Benefiting from strengthened underwriting, continued pricing discipline and improved claims management practices Deepening customer relationships through Financial Wellness platforms; focus on maintaining strong National segment market share while growing Premier segment Combined life and disability target benefits ratio of 86% - 90% A 100 bps change to the combined life and disability benefits ratio impacts annual pre-tax AOI by $45 million to $50 million (2) U.S. Workplace Solutions Individual Annuities Individual Life Retirement Group Insurance
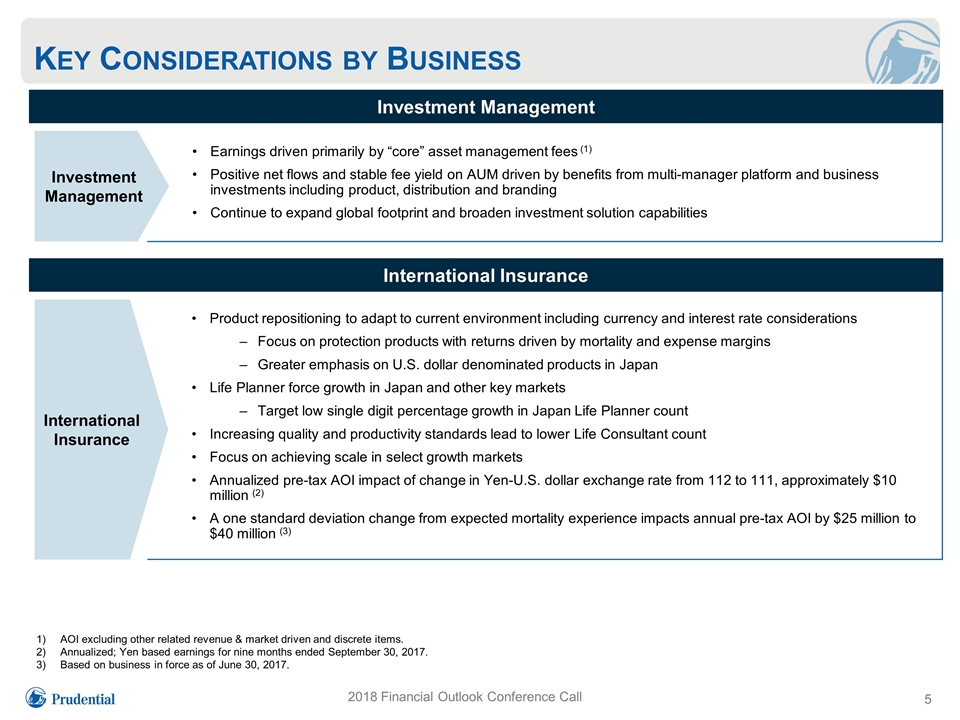
Key Considerations by Business 2018 Financial Outlook Conference Call International Insurance Earnings driven primarily by “core” asset management fees (1) Positive net flows and stable fee yield on AUM driven by benefits from multi-manager platform and business investments including product, distribution and branding Continue to expand global footprint and broaden investment solution capabilities Investment Management International Insurance Investment Management Product repositioning to adapt to current environment including currency and interest rate considerations Focus on protection products with returns driven by mortality and expense margins Greater emphasis on U.S. dollar denominated products in Japan Life Planner force growth in Japan and other key markets Target low single digit percentage growth in Japan Life Planner count Increasing quality and productivity standards lead to lower Life Consultant count Focus on achieving scale in select growth markets Annualized pre-tax AOI impact of change in Yen-U.S. dollar exchange rate from 112 to 111, approximately $10 million (2) A one standard deviation change from expected mortality experience impacts annual pre-tax AOI by $25 million to $40 million (3) AOI excluding other related revenue & market driven and discrete items. Annualized; Yen based earnings for nine months ended September 30, 2017. Based on business in force as of June 30, 2017.
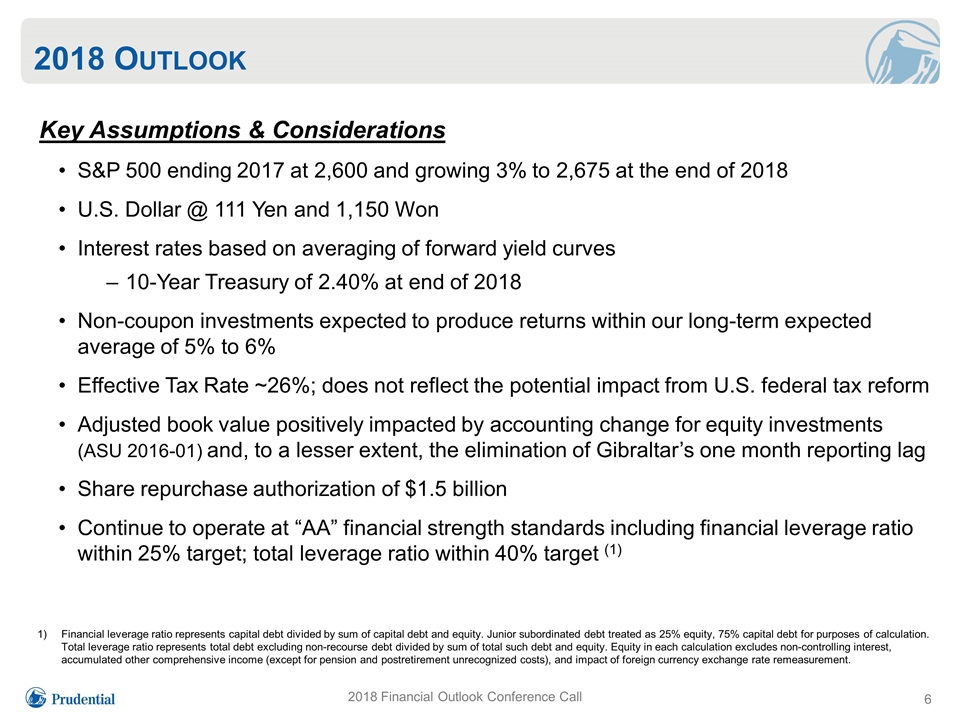
2018 Outlook 6 2018 Financial Outlook Conference Call Key Assumptions & Considerations S&P 500 ending 2017 at 2,600 and growing 3% to 2,675 at the end of 2018 U.S. Dollar @ 111 Yen and 1,150 Won Interest rates based on averaging of forward yield curves 10-Year Treasury of 2.40% at end of 2018 Non-coupon investments expected to produce returns within our long-term expected average of 5% to 6% Effective Tax Rate ~26%; does not reflect the potential impact from U.S. federal tax reform Adjusted book value positively impacted by accounting change for equity investments (ASU 2016-01) and, to a lesser extent, the elimination of Gibraltar’s one month reporting lag Share repurchase authorization of $1.5 billion Continue to operate at “AA” financial strength standards including financial leverage ratio within 25% target; total leverage ratio within 40% target (1) Financial leverage ratio represents capital debt divided by sum of capital debt and equity. Junior subordinated debt treated as 25% equity, 75% capital debt for purposes of calculation. Total leverage ratio represents total debt excluding non-recourse debt divided by sum of total such debt and equity. Equity in each calculation excludes non-controlling interest, accumulated other comprehensive income (except for pension and postretirement unrecognized costs), and impact of foreign currency exchange rate remeasurement.
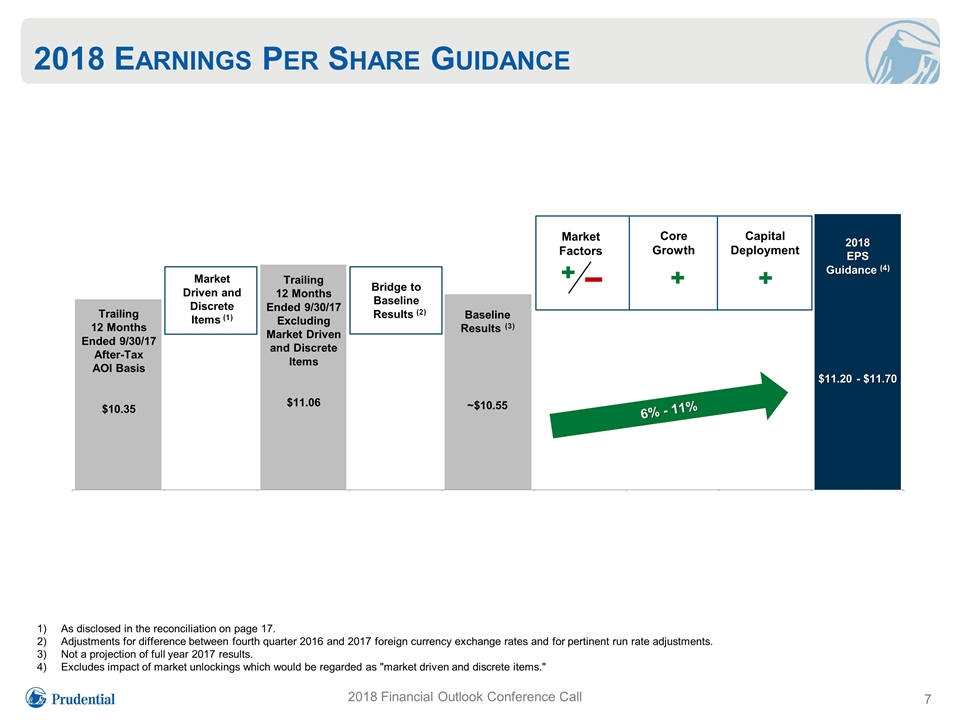
2018 Earnings Per Share Guidance 7 2018 Financial Outlook Conference Call As disclosed in the reconciliation on page 17. Adjustments for difference between fourth quarter 2016 and 2017 foreign currency exchange rates and for pertinent run rate adjustments. Not a projection of full year 2017 results. Excludes impact of market unlockings which would be regarded as "market driven and discrete items." Market Driven and Discrete Items (1) Bridge to Baseline Results (2) Capital Deployment Core Growth Market Factors Trailing 12 Months Ended 9/30/17 After-Tax AOI Basis $10.35 Trailing 12 Months Ended 9/30/17 Excluding Market Driven and Discrete Items $11.06 Baseline Results (3) ~$10.55 2018 EPS Guidance (4) $11.20 - $11.70 6% - 11%
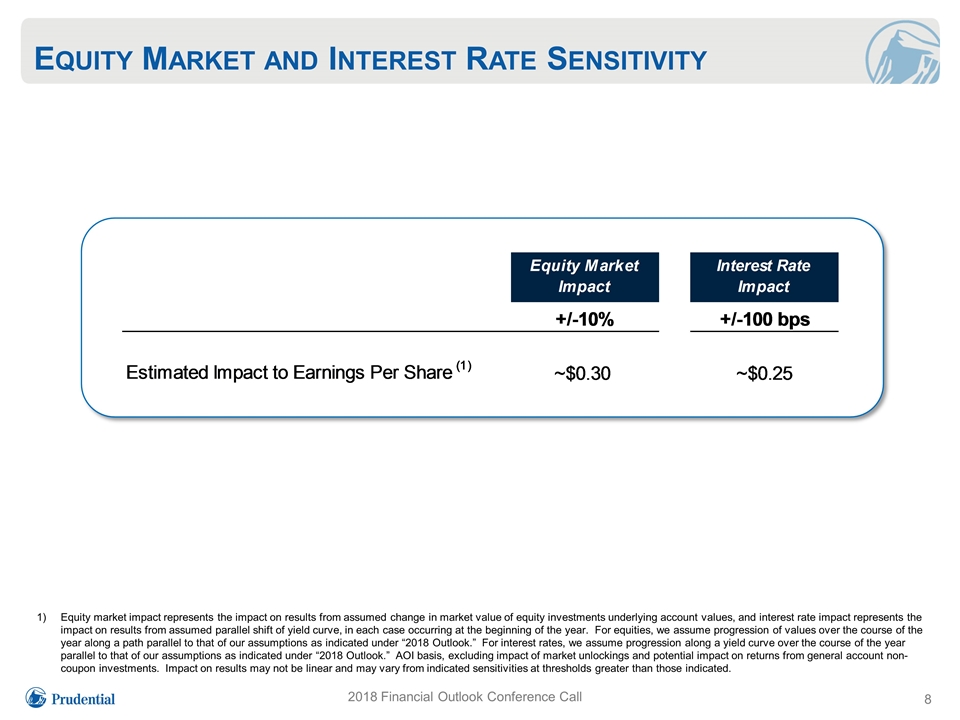
Equity Market and Interest Rate Sensitivity 2018 Financial Outlook Conference Call Equity market impact represents the impact on results from assumed change in market value of equity investments underlying account values, and interest rate impact represents the impact on results from assumed parallel shift of yield curve, in each case occurring at the beginning of the year. For equities, we assume progression of values over the course of the year along a path parallel to that of our assumptions as indicated under “2018 Outlook.” For interest rates, we assume progression along a yield curve over the course of the year parallel to that of our assumptions as indicated under “2018 Outlook.” AOI basis, excluding impact of market unlockings and potential impact on returns from general account non-coupon investments. Impact on results may not be linear and may vary from indicated sensitivities at thresholds greater than those indicated.

Key Takeaways 9 2018 Financial Outlook Conference Call Business mix and solid fundamentals continue to produce an attractive financial profile EPS growth despite interest rate headwinds and moderating equity market growth ROEs expected to be within our near to intermediate term target of 12%-13%, including the increase in book value from implementing the required accounting change for equity investments Greater financial flexibility resulting from: Strong capital position and reduced financial leverage Expected free cash flow ratio increasing from 60% to 65% of after-tax adjusted operating income on average over time Maintain a balanced philosophy for shareholder distributions: Share repurchases of $1.5 billion in 2018; a 20% increase from $1.25 billion in 2017 Dividend level also expected to reflect the higher expected free cash flow as a ratio to operating income

Prudential Financial, inc. 2018 Financial Outlook Conference Call Presentation Questions and Answers December 14, 2017
Forward-Looking Statements 2018 Financial Outlook Conference Call Certain of the statements included in this presentation constitute forward-looking statements within the meaning of the U. S. Private Securities Litigation Reform Act of 1995. Words such as “expects,” “believes,” “anticipates,” “includes,” “plans,” “assumes,” “estimates,” “projects,” “intends,” “should,” “will,” “shall,” or variations of such words are generally part of forward-looking statements. Forward-looking statements are made based on management’s current expectations and beliefs concerning future developments and their potential effects upon Prudential Financial, Inc. and its subsidiaries. There can be no assurance that future developments affecting Prudential Financial, Inc. and its subsidiaries will be those anticipated by management. These forward-looking statements are not a guarantee of future performance and involve risks and uncertainties, and there are certain important factors that could cause actual results to differ, possibly materially, from expectations or estimates reflected in such forward-looking statements, including, among others: (1) general economic, market and political conditions, including the performance and fluctuations of fixed income, equity, real estate and other financial markets; (2) the availability and cost of additional debt or equity capital or external financing for our operations; (3) interest rate fluctuations or prolonged periods of low interest rates; (4) the degree to which we choose not to hedge risks, or the potential ineffectiveness or insufficiency of hedging or risk management strategies we do implement; (5) any inability to access our credit facilities; (6) reestimates of our reserves for future policy benefits and claims; (7) differences between actual experience regarding mortality, morbidity, persistency, utilization, interest rates or market returns and the assumptions we use in pricing our products, establishing liabilities and reserves or for other purposes; (8) changes in our assumptions related to deferred policy acquisition costs, value of business acquired or goodwill; (9) changes in assumptions for our pension and other postretirement benefit plans; (10) changes in our financial strength or credit ratings; (11) statutory reserve requirements associated with term and universal life insurance policies under Regulation XXX, Guideline AXXX and principles-based reserving requirements; (12) investment losses, defaults and counterparty non-performance; (13) competition in our product lines and for personnel; (14) difficulties in marketing and distributing products through current or future distribution channels; (15) changes in tax law including the developing U.S. federal tax reform proposals; (16) economic, political, currency and other risks relating to our international operations; (17) fluctuations in foreign currency exchange rates and foreign securities markets; (18) regulatory or legislative changes, including the Dodd-Frank Wall Street Reform and Consumer Protection Act and the U.S. Department of Labor’s fiduciary rules; (19) inability to protect our intellectual property rights or claims of infringement of the intellectual property rights of others; (20) adverse determinations in litigation or regulatory matters, and our exposure to contingent liabilities, including related to the remediation of certain securities lending activities administered by the Company; (21) domestic or international military actions, natural or man-made disasters including terrorist activities or pandemic disease, or other events resulting in catastrophic loss of life; (22) ineffectiveness of risk management policies and procedures in identifying, monitoring and managing risks; (23) possible difficulties in executing, integrating and realizing projected results of acquisitions, divestitures and restructurings; (24) interruption in telecommunication, information technology or other operational systems or failure to maintain the security, confidentiality or privacy of sensitive data on such systems; (25) changes in statutory or U.S. GAAP accounting principles, practices or policies; (26) Prudential Financial, Inc.’s primary reliance, as a holding company, on dividends or distributions from its subsidiaries to meet debt payment obligations and the ability of the subsidiaries to pay such dividends or distributions in light of our ratings objectives and/or applicable regulatory restrictions; and (27) the possibility that our dividend level will not increase as expected due to changes in our financial condition, economic conditions or otherwise. Prudential Financial, Inc. does not intend, and is under no obligation, to update any particular forward-looking statement included in this document. See “Risk Factors” included in Prudential Financial, Inc.’s Annual Report on Form 10-K for discussion of certain risks relating to our businesses and investment in our securities. ______________________________________________________________________________ Prudential Financial, Inc. of the United States is not affiliated with Prudential plc which is headquartered in the United Kingdom.
Non-GAAP Measures 2018 Financial Outlook Conference Call Consolidated adjusted operating income and adjusted book value are non-GAAP measures. Adjusted operating income excludes “Realized investment gains (losses), net,” as adjusted, and related charges and adjustments. A significant element of realized investment gains and losses are impairments and credit-related and interest rate-related gains and losses. Impairments and losses from sales of credit-impaired securities, the timing of which depends largely on market credit cycles, can vary considerably across periods. The timing of other sales that would result in gains or losses, such as interest rate-related gains or losses, is largely subject to our discretion and influenced by market opportunities as well as our tax and capital profile. Realized investment gains (losses) within certain of our businesses for which such gains (losses) are a principal source of earnings, and those associated with terminating hedges of foreign currency earnings and current period yield adjustments are included in adjusted operating income. Adjusted operating income generally excludes realized investment gains and losses from products that contain embedded derivatives, and from associated derivative portfolios that are part of an asset-liability management program related to the risk of those products. However, the effectiveness of our hedging program will ultimately be reflected in adjusted operating income over time. Adjusted operating income also excludes gains and losses from changes in value of certain assets and liabilities relating to foreign currency exchange movements that have been economically hedged or considered part of our capital funding strategies for our international subsidiaries, as well as gains and losses on certain investments that are classified as other trading account assets. Adjusted operating income also excludes investment gains and losses on trading account assets supporting insurance liabilities and changes in experience-rated contractholder liabilities due to asset value changes, because these recorded changes in asset and liability values are expected to ultimately accrue to contractholders. In addition, adjusted operating income excludes the results of divested businesses, which are not relevant to our ongoing operations. Discontinued operations and earnings attributable to noncontrolling interests, each of which is presented as a separate component of net income under GAAP, are also excluded from adjusted operating income. The tax effect associated with pre-tax adjusted operating income is based on applicable IRS and foreign tax regulations inclusive of pertinent adjustments. Adjusted book value is calculated as total equity (GAAP book value) excluding both accumulated other comprehensive income (loss) and the cumulative effect of foreign currency exchange rate remeasurements and currency translation adjustments corresponding to realized investment gains and losses. These items are excluded in order to highlight the book value attributable to our core business operations separate from the portion attributable to external and potentially volatile capital and currency market conditions. We believe that our use of these non-GAAP measures helps investors understand and evaluate the Company’s performance and financial position. The presentation of adjusted operating income as we measure it for management purposes enhances the understanding of the results of operations by highlighting the results from ongoing operations and the underlying profitability of our businesses. Trends in the underlying profitability of our businesses can be more clearly identified without the fluctuating effects of the items described above. Adjusted book value augments the understanding of our financial position by providing a measure of net worth that is primarily attributable to our business operations separate from the portion that is affected by capital and currency market conditions and by isolating the accounting impact associated with insurance liabilities that are generally not marked to market and the supporting investments that are marked to market through accumulated other comprehensive income under GAAP. However, adjusted operating income and adjusted book value are not substitutes for income and equity determined in accordance with GAAP, and the adjustments made to derive these measures are important to an understanding of our overall results of operations and financial position. Our expectation of Common Stock earnings per share is based on after-tax adjusted operating income. Due to the inherent difficulty in reliably quantifying future realized investment gains/losses and changes in asset and liability values given their unknown timing and potential significance, we cannot, without unreasonable effort, provide a measure of our Common Stock earnings per share expectation based on income from continuing operations, which is the GAAP measure most comparable to adjusted operating income. A reconciliation of adjusted operating income to income from continuing operations in accordance with GAAP and a reconciliation of adjusted book value to GAAP book value are included as part of this presentation. Additional historic information relating to our financial performance is located on our Web site at www.investor.prudential.com.
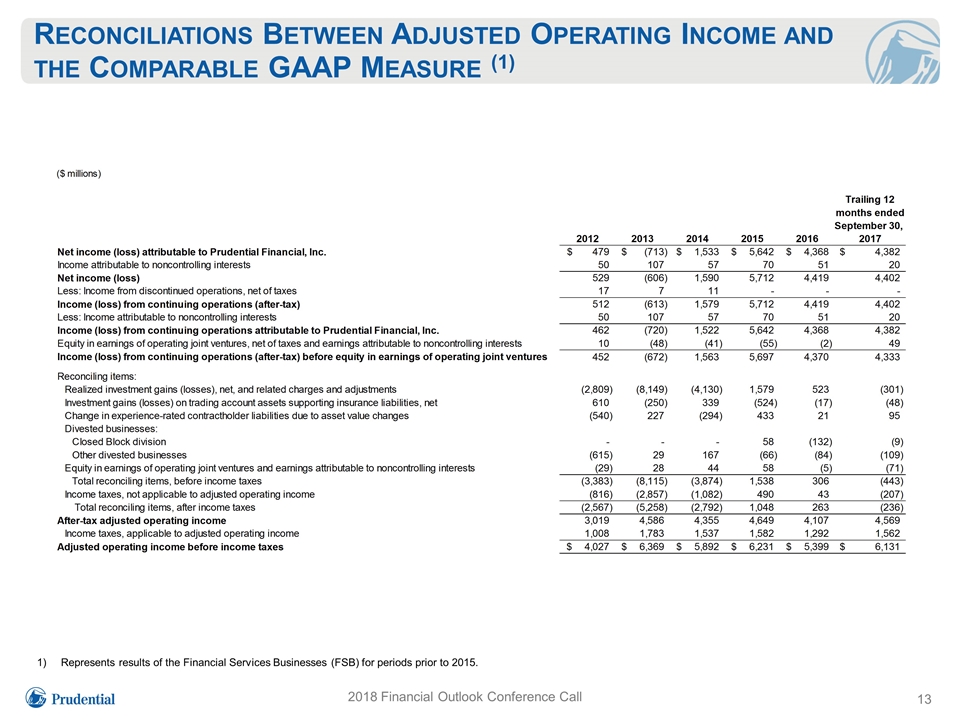
Reconciliations Between Adjusted Operating Income and the Comparable GAAP Measure (1) 2018 Financial Outlook Conference Call Represents results of the Financial Services Businesses (FSB) for periods prior to 2015.
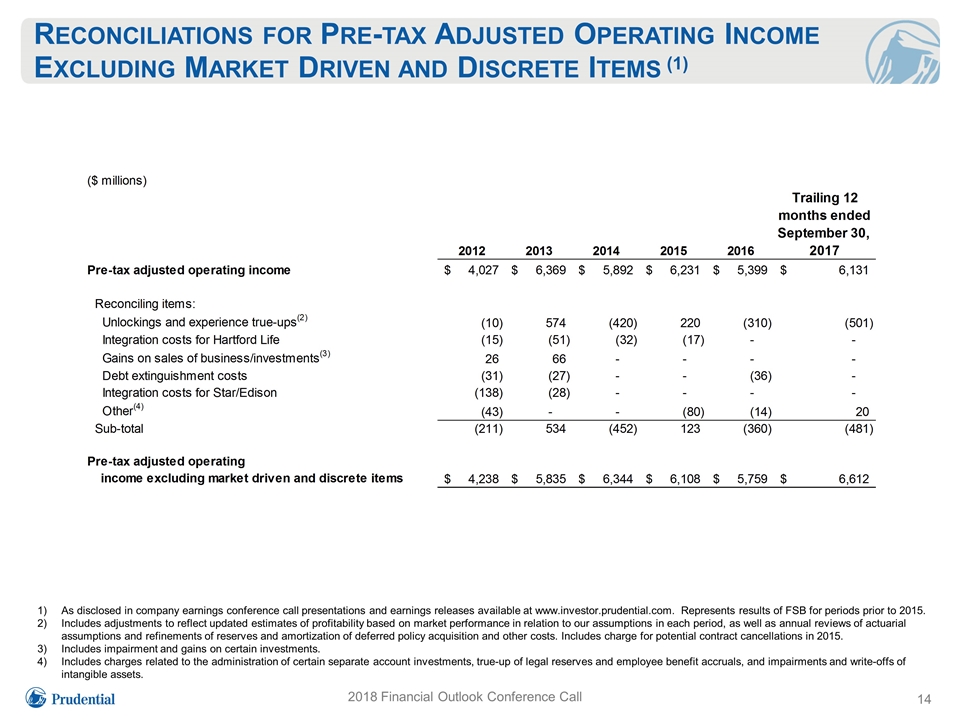
Reconciliations for Pre-tax Adjusted Operating Income Excluding Market Driven and Discrete Items (1) 2018 Financial Outlook Conference Call As disclosed in company earnings conference call presentations and earnings releases available at www.investor.prudential.com. Represents results of FSB for periods prior to 2015. Includes adjustments to reflect updated estimates of profitability based on market performance in relation to our assumptions in each period, as well as annual reviews of actuarial assumptions and refinements of reserves and amortization of deferred policy acquisition and other costs. Includes charge for potential contract cancellations in 2015. Includes impairment and gains on certain investments. Includes charges related to the administration of certain separate account investments, true-up of legal reserves and employee benefit accruals, and impairments and write-offs of intangible assets.
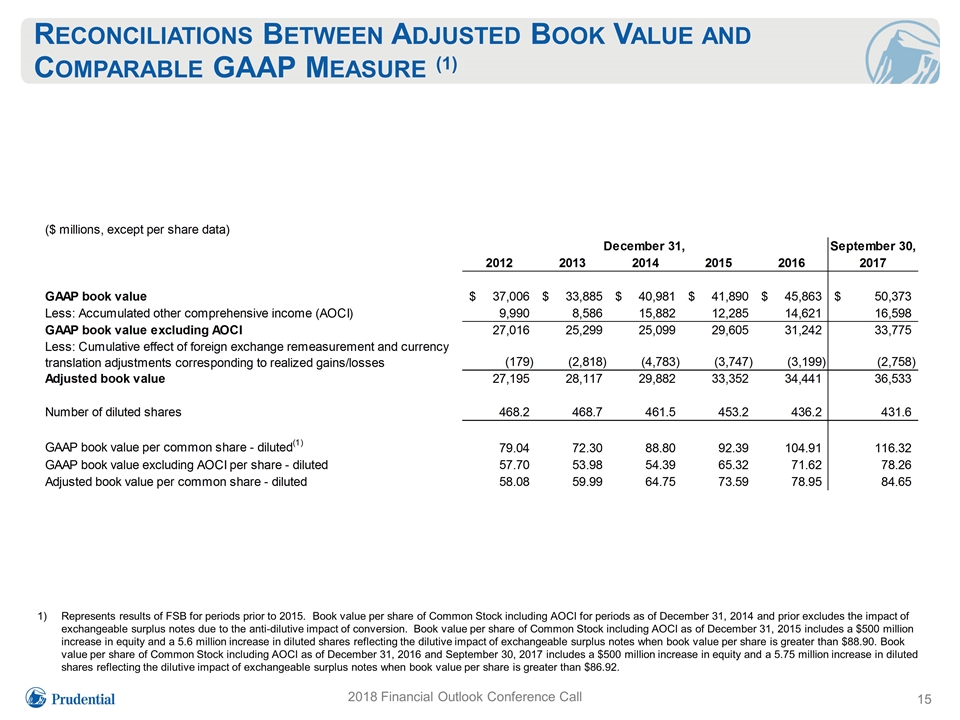
2018 Financial Outlook Conference Call Reconciliations Between Adjusted Book Value and Comparable GAAP Measure (1) Represents results of FSB for periods prior to 2015. Book value per share of Common Stock including AOCI for periods as of December 31, 2014 and prior excludes the impact of exchangeable surplus notes due to the anti-dilutive impact of conversion. Book value per share of Common Stock including AOCI as of December 31, 2015 includes a $500 million increase in equity and a 5.6 million increase in diluted shares reflecting the dilutive impact of exchangeable surplus notes when book value per share is greater than $88.90. Book value per share of Common Stock including AOCI as of December 31, 2016 and September 30, 2017 includes a $500 million increase in equity and a 5.75 million increase in diluted shares reflecting the dilutive impact of exchangeable surplus notes when book value per share is greater than $86.92.

Reconciliation Between AOI Earnings per Share and the Comparable GAAP Measure 2018 Financial Outlook Conference Call
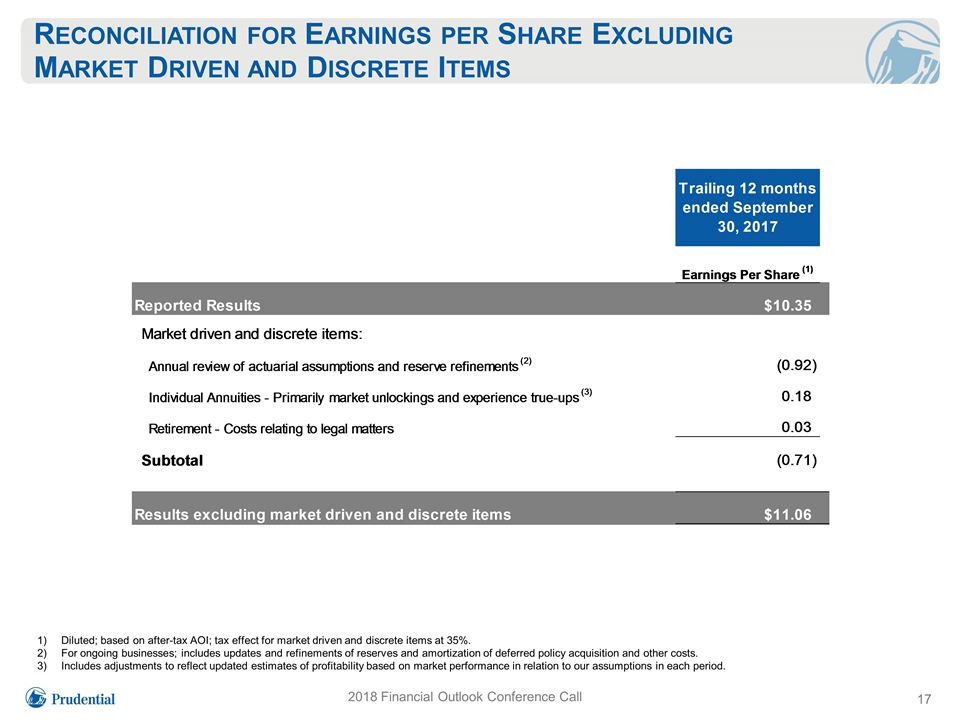
Reconciliation for Earnings per Share Excluding Market Driven and Discrete Items Diluted; based on after-tax AOI; tax effect for market driven and discrete items at 35%. For ongoing businesses; includes updates and refinements of reserves and amortization of deferred policy acquisition and other costs. Includes adjustments to reflect updated estimates of profitability based on market performance in relation to our assumptions in each period. 2018 Financial Outlook Conference Call


