UNITED STATES
SECURITIES AND EXCHANGE COMMISSION
Washington, D.C. 20549
FORM N-CSR
CERTIFIED SHAREHOLDER REPORT OF REGISTERED
MANAGEMENT INVESTMENT COMPANIES
| | |
| Investment Company Act file number | | 811-10345 |
Nuveen Municipal Credit Income Fund
(Exact name of registrant as specified in charter)
Nuveen Investments
333 West Wacker Drive
Chicago, IL 60606
(Address of principal executive offices) (Zip code)
Mark L. Winget
Nuveen Investments
333 West Wacker Drive
Chicago, IL 60606
(Name and address of agent for service)
| | |
| Registrant’s telephone number, including area code: | | (312) 917-7700 |
| | |
| Date of fiscal year end: | | October 31 |
| | |
| Date of reporting period: | | October 31, 2023 |
Form N-CSR is to be used by management investment companies to file reports with the Commission not later than 10 days after the transmission to stockholders of any report that is required to be transmitted to stockholders under Rule 30e-1 under the Investment Company Act of 1940 (17 CFR 270.30e-1). The Commission may use the information provided on Form N-CSR in its regulatory, disclosure review, inspection, and policymaking roles.
A registrant is required to disclose the information specified by Form N-CSR, and the Commission will make this information public. A registrant is not required to respond to the collection of information contained in Form N-CSR unless the Form displays a currently valid Office of Management and Budget (“OMB”) control number. Please direct comments concerning the accuracy of the information collection burden estimate and any suggestions for reducing the burden to Secretary, Securities and Exchange Commission, 450 Fifth Street, NW, Washington, DC 20549-0609. The OMB has reviewed this collection of information under the clearance requirements of 44 U.S.C. ss. 3507.
| ITEM 1. | REPORTS TO STOCKHOLDERS. |
| | | | | | |
| | | |
 | | Closed-End Funds | | | | October 31, 2023 |
| | | | | | |
| | | |
| | | | | | | |
Nuveen Municipal Closed-End Funds
| | |
| | |
Nuveen AMT-Free Municipal Credit Income Fund | | NVG |
| |
Nuveen Municipal Credit Income Fund | | NZF |
| |
Nuveen Municipal High Income Opportunity Fund | | NMZ |
| |
Nuveen Municipal Credit Opportunities Fund | | NMCO |
| |
Nuveen Dynamic Municipal Opportunities Fund | | NDMO |
Annual
Report
Table
of Contents
2
Chair’s Letter
to Shareholders
| | |
 | | Dear Shareholders, Financial markets spent the past year focused on the direction of inflation and whether policy makers would be able to deliver a soft landing in their economies. After more than a year and a half of interest rate increases by the U.S. Federal Reserve (Fed) and other central banks, financial conditions have tightened and inflation rates have cooled considerably. The Fed increased the target fed funds rate from near zero in March 2022 to a range of 5.25% to 5.50% as of November 2023, with pauses in June 2023, September 2023 and November 2023. But current inflation rates remain above central banks’ targets, and the trajectory from here is difficult to predict given that monetary policy acts on the economy with long and variable lags. Surprisingly, economies were relatively resilient for much of 2023. By year-end, the “most predicted recession” had yet to materialize in the U.S., while U.K. and European economic growth was just beginning to show signs of stagnation or decline. U.S. gross domestic product rose 5.2% in the third quarter of 2023, 2.1% in the second quarter of 2023 and 2.0% in the first quarter of 2023, after growing 2.1% in 2022 overall compared to 2021. Much of the growth was driven by a relatively strong jobs market, which kept consumer sentiment and spending elevated despite long-term interest rates nearing multi-year highs, a series of U.S. regional bank failures and shocks from flaring geopolitical tensions. |
| | While central banks are likely nearing the end of this interest rate hiking cycle, there are still upside risks to inflation and downside risks to the economy. Some labor market and consumer indicators are softening. Government funding and deficits remain a concern, especially as the U.S. election year gets underway. The markets will continue to try to anticipate monetary policy shifts as the Fed evaluates incoming data and adjusts its rate setting activity on a meeting-by-meeting basis. Geopolitical risks – from relations with China, to wars in Europe and the Middle East – also expand the range of outcomes from economies and markets around the world. All these uncertainties, and others, will remain sources of short-term market volatility. In this environment, Nuveen remains committed to filtering the market noise for investable opportunities that ultimately serve long-term investment objectives. Maintaining a long-term perspective is also important for investors, and we encourage you to review your time horizon, risk tolerance and investment goals with your financial professional. On behalf of the other members of the Nuveen Fund Board, we look forward to continuing to earn your trust in the months and years ahead. 
Terence J. Toth Chair of the Board December 22, 2023 |
3
Important Notices
Fund Mergers Update for Nuveen Municipal Credit Income Fund (NZF)
Effective prior to the opening of business on April 17, 2023, Nuveen Ohio Quality Municipal Income Fund (NUO) and Nuveen Georgia Quality Municipal Income Fund (NKG) were each merged into NZF (“each a Merger”). Refer to the Notes to Financial Statements within this report for further details on the Merger.
Portfolio Manager Updates
Effective April 10, 2023, Daniel Close, CFA, and Stephen Candido, CFA, were added as portfolio managers of NMZ, NMCO and NDMO. Effective May 31, 2023, John Miller no longer serves as a portfolio manager of NMZ, NMCO and NDMO. Effective October 13, 2023, Steven Hlavin was added as a portfolio manager of NVG. Effective October 13, 2023, Kristen DeJong, CFA, was added as a portfolio manager of NZF. There were no other changes to the portfolio management of the Funds during the reporting period.
Updated Distribution Policy for NDMO
On November 29, 2023, the Funds’ Board of Trustees (the “Board”) updated the Fund’s distribution policy. Effective for distributions payable on December 29, 2023, the Fund’s distribution policy, which may be changed by the Board, is to make regular monthly cash distributions to holders of its common shares (stated in terms of a fixed cents per common share dividend distribution rate which may be set from time to time). The Fund intends to distribute all or substantially all of its net investment income through its regular monthly distribution and to distribute realized capital gains at least annually. In addition, in any monthly period, to maintain its declared per common share distribution amount, the Fund may distribute more or less than its net investment income during the period. In the event the Fund distributes more than its net investment income during any yearly period, such distributions may also include realized gains and/or a return of capital. To the extent that a distribution includes a return of capital the NAV per share may erode. If the Fund’s distribution includes anything other than net investment income, the Fund will provide a notice to shareholders of its best estimate of the distribution sources at that the time of the distribution. These estimates may not match the final tax characterization (for the full year’s distributions) contained in shareholders’ 1099-DIV forms after the end of the year.
4
Portfolio Managers’
Comments
Nuveen AMT-Free Municipal Credit Income Fund (NVG)
Nuveen Municipal Credit Income Fund (NZF)
Nuveen Municipal High Income Opportunity Fund (NMZ)
Nuveen Municipal Credit Opportunities Fund (NMCO)
Nuveen Dynamic Municipal Opportunities Fund (NDMO)
These Funds feature portfolio management by Nuveen Asset Management, LLC (NAM), an affiliate of Nuveen, LLC, the Funds’ investment adviser. Paul Brennan, CFA, and Steven Hlavin manage the Nuveen AMT-Free Municipal Credit Income Fund (NVG). Scott Romans, PhD. and Kristen DeJong, CFA, manage the Nuveen Municipal Credit Income Fund (NZF). Daniel Close, CFA, and Stephen Candido, CFA, manage the Nuveen Municipal High Income Opportunity Fund (NMZ). Daniel Close, CFA, Steven Hlavin and Stephen Candido, CFA, manage the Nuveen Municipal Credit Opportunities Fund (NMCO). Timothy Ryan, CFA, Daniel Close, CFA and Stephen Candido, CFA, manage the Nuveen Dynamic Municipal Opportunities Fund (NDMO).
Effective October 13, 2023, Steven Hlavin was added as portfolio manager of the AMT-Free Municipal Credit Income Fund (NVG), and Kristen DeJong was added as portfolio manager of the Nuveen Municipal Credit Income Fund (NZF).
Effective April 10, 2023, Daniel Close, CFA, and Stephen Candido, CFA, were added as portfolio managers of the Nuveen Municipal High Income Opportunity Fund (NMZ), Nuveen Municipal Credit Opportunities Fund (NMCO) and Nuveen Dynamic Municipal Opportunities Fund (NDMO). Effective May 31, 2023, John Miller no longer serves as a portfolio manager of NMZ, NMCO and NDMO.
Here the portfolio management team discusses U.S. economic and municipal bond market conditions, key investment strategies and the Funds’ performance for the twelve-month reporting period ended October 31, 2023. For more information on the Funds’ investment objectives and policies, please refer to the Shareholder Update section at the end of the report.
What factors affected the U.S. economy and market conditions during the twelve-month annual reporting period ended October 31, 2023?
The U.S. economy performed better than expected despite persistent inflationary pressure and rising interest rates during the twelve-month period ended October 31, 2023. Gross domestic product accelerated sharply in third quarter of 2023 to an annualized rate of 5.2%, according to the U.S. Bureau of Economic Analysis second estimate, up from 2.1% in the second quarter of 2023. By comparison, GDP grew 2.1% in 2022 overall. Early in the reporting period, inflation had risen sharply because of supply chain disruptions and high food and energy prices, the Russia-Ukraine war and China’s zero-COVID restrictions (lifted in December 2022). Since then, price pressures have eased given normalization in supply chains, falling energy prices and aggressive measures by the U.S. Federal Reserve (Fed) and other global central banks to tighten financial conditions and slow demand in their economies. Nevertheless, during the reporting period inflation levels remained much higher than central banks’ target levels.
The Fed raised its target fed funds rate six times during the reporting period, bringing it to a range of 5.25% to 5.50% as of July 2023 and voting to hold it at that level at its next two meetings held near the end of the reporting period. For much of the reporting period, the Fed’s activity led to significant volatility in bond and stock markets, given the uncertainty of how rising interest rates would affect the economy. One of the most highly visible impacts occurred in the U.S. regional banking sector in March 2023, when Silicon Valley Bank, Signature Bank, First Republic Bank and Silvergate Bank failed. In the same month, Swiss bank UBS agreed to buy Credit Suisse, which was considered vulnerable in the current environment. The Fed’s monetary tightening policy also contributed to an increase in the U.S. dollar’s value relative to major world currencies, which acts as a headwind to the profits of international companies and U.S. domestic companies with overseas earnings.
During the reporting period, elevated inflation and higher borrowing costs weighed on some segments of the economy, including the real estate market. Consumer spending, however, has remained more resilient than expected, in part because of a still-strong labor market, another key gauge of the economy’s health. As of October 2023, the unemployment rate was 3.9%, rising from its pre-pandemic low, with monthly job growth continuing to moderate. The strong labor market and wage gains helped the U.S. economy during the reporting period, even as the Fed sought to soften job growth to help curb inflation pressures.
During the reporting period, investors also continued to monitor government funding and deficits. The U.S. government avoided a default scenario after approving an increase to the debt ceiling limit in June 2023. At the same time, the potential for a government shutdown loomed but was ultimately avoided with funding resolutions passed in September 2023 and, subsequent to the close
5
Portfolio Managers’ Comments (continued)
of the reporting period, November 2023. Notably, in August 2023, ratings agency Fitch downgraded U.S. debt from AAA to AA+ based on concerns about the U.S.’s growing fiscal debt and reduced confidence in fiscal management.
The broad municipal bond market was impacted by interest rate volatility and economic uncertainty during the reporting period. Municipal yields rose across the maturity spectrum, but the move was uneven. The greatest increase in yields was at the shorter end of the curve as markets priced in a more aggressive pace of monetary tightening to combat persistently high inflation. Although municipal bonds continued to exhibit relatively strong credit fundamentals, there were periods of spread widening during the reporting period as the market sell-off continued.
Nuveen AMT-Free Municipal Credit Income Fund (NVG)
What key strategies were used to manage the Fund during the twelve-month reporting period ended October 31, 2023?
NVG’s investment objectives are to provide current income exempt from regular federal income tax and federal alternative minimum tax applicable to individuals, and to enhance portfolio value relative to the municipal bond market. The Fund invests in tax-exempt municipal bonds that the portfolio management teams believe are underrated or undervalued or that represent municipal market sectors that are undervalued and uses leverage. Leverage is discussed in more detail in the Fund Leverage section of this report.
During the reporting period, the Fund’s trading activity remained focused on pursuing its investment objectives. The rising yield environment during this reporting period was favorable for the Fund to reset embedded yields higher in its portfolio, primarily by executing on tax-loss swap opportunities. This strategy involves selling depreciated bonds with lower embedded yields to reinvest in similarly structured, higher income-producing bonds to support the Fund’s income earnings and capture tax efficiencies.
As of October 31, 2023, the Fund continued to use inverse floating rate securities. The Fund employs inverse floating rate securities, which are the residual interest in a tender option bond (TOB) trust, and are sometimes referred to as “inverse floaters,” for a variety of reasons, including duration management and income and total return enhancement.
How did the Fund perform during the twelve-month reporting period ended October 31, 2023?
For the twelve-month reporting period ended October 31, 2023, NVG underperformed the NVG Blended Benchmark. For purposes of this Performance Commentary, references to relative performance are in comparison to the NVG Blended Benchmark, which consists of 1) 60% S&P Municipal Bond Investment Grade Index and 2) 40% S&P Municipal Bond High Yield Index.
The primary detractor from NVG’s relative performance was the Fund’s use of leverage through its issuance of preferred shares and investments in inverse floating rate securities, which represent leveraged investments in underlying bonds. Leverage is discussed in more detail in the Fund Leverage section of this report.
Partially offsetting NVG’s underperformance were its underweight to shorter maturity bonds and corresponding overweight to longer maturity bonds. Additionally, the Fund’s credit quality positioning was also advantageous, as credit spreads narrowed occasionally throughout the period. The Fund continued to emphasize bonds rated mid-investment grade and lower, which contributed positively to relative performance.
Nuveen Municipal Credit Income Fund (NZF)
What key strategies were used to manage the Fund during the twelve-month reporting period ended October 31, 2023?
NZF’s investment objectives are to provide current income exempt from regular federal income tax and to enhance portfolio value relative to the municipal bond market. The Fund invests in tax-exempt municipal bonds that the portfolio management teams believe are underrated or undervalued or that represent municipal market sectors that are undervalued and uses leverage. Leverage is discussed in more detail in the Fund Leverage section of this report.
During the reporting period, the Fund’s trading activity remained focused on pursuing its investment objectives. The rising yield environment during this reporting period was favorable for the Fund to reset embedded yields higher in its portfolio, primarily by executing on tax-loss swap opportunities. This strategy involves selling depreciated bonds with lower embedded yields to reinvest in similarly structured, higher income-producing bonds to support the Fund’s income earnings and capture tax efficiencies.
6
Additionally, NZF continued its rotation into lower rated credit by selling AAA and AA rated bonds, which were purchased when rates were lower as temporary placeholders because of their liquidity profiles. The portfolio management team reinvested the proceeds in A, BBB and below investment grade rated bonds. As a result of this rotation strategy, the Fund’s exposures to the health care and transportation sectors increased while exposures to dedicated tax, pre-refunded, and water and sewer bonds decreased.
As of October 31, 2023, the Fund continued to use inverse floating rate securities. The Fund employs inverse floating rate securities, which are the residual interest in a tender option bond (TOB) trust, and are sometimes referred to as “inverse floaters,” for a variety of reasons, including duration management and income and total return enhancement.
How did the Fund perform during the twelve-month reporting period ended October 31, 2023?
For the twelve-month reporting period ended October 31, 2023, NZF underperformed the NZF Blended Benchmark. For purposes of this Performance Commentary, references to relative performance are in comparison to the NZF Blended Benchmark, which consists of 1) 60% S&P Municipal Bond Investment Grade Index and 2) 40% S&P Municipal Bond High Yield Index.
The primary detractor from NZF’s relative performance was the Fund’s use of leverage through its issuance of preferred shares and investments in inverse floating rate securities, which represent leveraged investments in underlying bonds. Leverage is discussed in more detail in the Fund Leverage section of this report.
Partially offsetting NZF’s underperformance were its underweight to shorter-maturity bonds and corresponding overweight to longer maturity bonds. NZF also benefited from its overweight to the transportation sector, particularly “other transportation” bonds, which was one of the better-performing sectors during the period. The Fund’s credit quality positioning was also advantageous, as credit spreads narrowed occasionally throughout the period. Overweight allocations to mid investment grade and lower added to relative performance as these categories outperformed the highest investment grade categories.
Nuveen Municipal High Income Opportunity Fund (NMZ)
What key strategies were used to manage the Fund during the twelve-month reporting period ended October 31, 2023?
NMZ’s primary investment objective is to provide high current income exempt from regular federal income tax. Its secondary investment objective is to seek attractive total return consistent with its primary objective. NMZ invests in an actively managed portfolio of tax-exempt municipal securities and uses leverage. Leverage is discussed in more detail in the Fund Leverage section of this report.
During the reporting period, the Fund’s trading activity remained focused on pursuing its investment objectives. The rising yield environment during this reporting period was favorable for the Fund to reset embedded yields higher in its portfolio, primarily by executing on tax-loss swap opportunities. This strategy involves selling depreciated bonds with lower embedded yields to reinvest in similarly structured, higher income-producing bonds to support the Fund’s income earnings and capture tax efficiencies. The portfolio management team also reduced the Fund’s equity positions in American Airlines and Talen Energy (both of which were acquired in restructurings) when it was favorable to do so during the reporting period.
As of October 31, 2023, the Fund continued to use inverse floating rate securities. The Fund employs inverse floating rate securities, which are the residual interest in a tender option bond (TOB) trust, and are sometimes referred to as “inverse floaters,” for a variety of reasons, including duration management and income and total return enhancement.
How did the Fund perform during the twelve-month reporting period ended October 31, 2023?
For the twelve-month reporting period ended October 31, 2023, NMZ underperformed the S&P Municipal Yield Index. For purposes of this Performance Commentary, references to relative performance are in comparison to the S&P Municipal Yield Index.
The primary detractor from NMZ’s relative performance was the Fund’s use of leverage through its issuance of preferred shares and investments in inverse floating rate securities, which represent leveraged investments in underlying bonds. However, the Fund’s use of leverage was accretive to overall common share income. Leverage is discussed in more detail in the Fund Leverage section of this report.
7
Portfolio Managers’ Comments (continued)
Leading individual detractors included the Fund’s exposures to Puerto Rico Electric Power Authority (PREPA) bonds and certain project finance bonds, which faced a variety of project-specific challenges during the period. PREPA underperformed given the issuer’s ongoing restructuring. The Fund continued to hold PREPA based on the portfolio management team’s outlook.
Partial offsets to NMZ’s relative underperformance included its, credit quality positioning. Credit spreads narrowed occasionally throughout the period and the Fund benefited from an overweight to non-rated bonds and a corresponding underweight to the highest grade (AAA and AA rated) bonds.
Nuveen Municipal Credit Opportunities Fund (NMCO)
What key strategies were used to manage the Fund during the twelve-month reporting period ended October 31, 2023?
NMCO’s primary investment objective is to provide a high level of current income exempt from regular U.S. federal income tax and secondarily, total return. NMCO invests primarily in high yielding, low to medium-quality municipal securities, and uses leverage. Leverage is discussed in more detail in the Fund Leverage section of this report.
During the reporting period, the Fund’s trading activity remained focused on pursuing its investment objectives. The rising yield environment during this reporting period was favorable for the Fund to reset embedded yields higher in its portfolio, primarily by executing on tax-loss swap opportunities. This strategy involves selling depreciated bonds with lower embedded yields to reinvest in similarly structured, higher income-producing bonds to support the Fund’s income earnings and capture tax efficiencies. Additionally, NMCO was active in reducing leverage levels during the reporting period. Please see the Notes to Financial Statements for additional details.
As of October 31, 2023, the Fund continued to use inverse floating rate securities. The Fund employs inverse floating rate securities, which are the residual interest in a tender option bond (TOB) trust, and are sometimes referred to as “inverse floaters,” for a variety of reasons, including duration management and income and total return enhancement.
How did the Fund perform during the twelve-month reporting period ended October 31, 2023?
For the twelve-month reporting period ended October 31, 2023, NMCO significantly underperformed the S&P Municipal Yield Index. For purposes of this Performance Commentary, references to relative performance are in comparison to the S&P Municipal Yield Index.
The primary driver of NMCO’s underperformance was the Fund’s use of leverage, which detracted significantly. The Fund uses leverage through its issuance of preferred shares and investments in inverse floating rate securities, which represent leveraged investments in underlying bonds. Leverage is discussed in more detail in the Fund Leverage section of this report.
Further, the Fund’s exposure to Puerto Rico Electric Power Authority (PREPA) bonds detracted. PREPA underperformed given the ongoing restructuring, along with certain underperforming project finance bonds that faced project-specific challenges during the period. The Fund continued to hold PREPA based on the portfolio management team’s outlook.
Partially offsetting the Fund’s underperformance was its credit quality positioning, as credit spreads narrowed occasionally throughout the period. The Fund benefited from its overweights to below investment grade and non-rated bonds. Additional contributors included overweights to sectors such as transportation and dedicated tax, which were some of the top-performing sectors.
Nuveen Dynamic Municipal Opportunities Fund (NDMO)
What key strategies were used to manage the Fund during the twelve-month reporting period ended October 31, 2023?
NDMO’s investment objective is to provide total return through income exempt from regular federal income taxes and capital appreciation. NDMO invests primarily in municipal securities, the income on which is exempt from regular U.S. federal income tax and uses leverage. Leverage is discussed in more detail in the Fund Leverage section of this report.
During the reporting period, the Fund’s trading activity remained focused on pursuing its investment objectives. The rising yield environment during this reporting period was favorable for the Fund to reset embedded yields higher in its portfolio, primarily by
8
executing on tax-loss swap opportunities. This strategy involves selling depreciated bonds with lower embedded yields to reinvest in similarly structured, higher income-producing bonds to support the Fund’s income earnings and capture tax efficiencies.
Additionally, during the reporting period NDMO was active in reducing leverage levels. Please see the Notes to Financial Statements for additional details. NDMO also actively sought to reduce its overall duration profile by selling positions in longer-duration bonds and by collapsing certain tender option bond (TOB) structures that were no longer cost-efficient because of rising borrowing costs.
As of October 31, 2023, the Fund continued to use inverse floating rate securities. The Fund employs inverse floating rate securities, which are the residual interest in a tender option bond (TOB) trust, and are sometimes referred to as “inverse floaters,” for a variety of reasons, including duration management and income and total return enhancement.
How did the Fund perform during the twelve-month reporting period ended October 31, 2023?
For the twelve-month reporting period ended October 31, 2023, NDMO underperformed the S&P Municipal Bond Index. For purposes of this Performance Commentary, references to relative performance are in comparison to the S&P Municipal Bond Index.
The primary detractor from NDMO’s relative performance was the Fund’s use of leverage through its issuance of preferred shares and investments in inverse floating rate securities, which represent leveraged investments in underlying bonds. Leverage is discussed in more detail in the Fund Leverage section of this report.
Further, the Fund’s exposure to Puerto Rico Electric Power Authority (PREPA) bonds detracted. PREPA underperformed given the ongoing restructuring, along with certain underperforming project finance bonds that faced project-specific challenges during the period. The Fund continued to hold PREPA based on the portfolio management team’s outlook.
Partially offsetting the Fund’s underperformance were its overweights to the tobacco, transportation and dedicated tax sectors, which performed well, and an underweight to housing, which underperformed. In addition, NDMO was aided by strong performance from positions in Brightline, Puerto Rico sales tax revenue bonds known as COFINAs, Big River Steel and American Dream, and an opportunistic investment in short-term Treasury bills. The Fund continued to maintain exposures to the credits listed above but closed out its position in Treasury bills prior to the end of the reporting period.
The Fund managed the duration of its portfolio by shorting interest rate futures contracts. The interest rate futures contracts had a negligible impact on relative performance during the reporting period.
This material is not intended to be a recommendation or investment advice, does not constitute a solicitation to buy, sell or hold a security or an investment strategy, and is not provided in a fiduciary capacity. The information provided does not take into account the specific objectives or circumstances of any particular investor, or suggest any specific course of action. Investment decisions should be made based on an investor’s objectives and circumstances and in consultation with his or her advisors.
Certain statements in this report are forward-looking statements. Discussions of specific investments are for illustration only and are not intended as recommendations of individual investments. The forward-looking statements and other views expressed herein are those of the portfolio managers as of the date of this report. Actual future results or occurrences may differ significantly from those anticipated in any forward-looking statements, and the views expressed herein are subject to change at any time, due to numerous market and other factors. The Funds disclaim any obligation to update publicly or revise any forward-looking statements or views expressed herein.
For financial reporting purposes, the ratings disclosed are the highest rating given by one of the following national rating agencies: Standard
& Poor’s Group (S&P), Moody’s Investors Service, Inc. (Moody’s) or Fitch, Inc. (Fitch). This treatment of split-rated securities may differ from that used for other purposes, such as for Fund investment policies. Credit ratings are subject to change. AAA, AA, A and BBB are investment grade ratings, while BB, B, CCC, CC, C and D are below investment grade ratings. Holdings designated N/R are not rated by these national rating agencies.
Bond insurance guarantees only the payment of principal and interest on the bond when due, and not the value of the bonds themselves, which will fluctuate with the bond market and the financial success of the issuer and the insurer. Insurance relates specifically to the bonds in the portfolio and not to the share prices of a Fund. No representation is made as to the insurers’ ability to meet their commitments.
Refer to the Glossary of Terms Used in this Report for further definition of the terms used within this section.
9
Fund Leverage
IMPACT OF THE FUNDS’ LEVERAGE STRATEGY ON PERFORMANCE
One important factor impacting the returns of the Funds’ common shares relative to their comparative benchmarks was the Funds’ use of leverage through their issuance of preferred shares and/or investments in inverse floating rate securities, which represent leveraged investments in underlying bonds. The Funds use leverage because our research has shown that, over time, leveraging provides opportunities for additional income. The opportunity arises when short-term rates that a Fund pays on its leveraging instruments are lower than the interest the Fund earns on its portfolio of long-term bonds that it has bought with the proceeds of that leverage.
However, use of leverage can expose Fund common shares to additional price volatility. When a Fund uses leverage, the Fund’s common shares will experience a greater increase in their net asset value if the securities acquired through the use of leverage increase in value, but will also experience a correspondingly larger decline in their net asset value if the securities acquired through leverage decline in value. All this will make the shares’ total return performance more variable over time.
In addition, common share income in levered funds will typically decrease in comparison to unlevered funds when short-term interest rates increase and increase when short-term interest rates decrease. In recent quarters, fund leverage expenses have generally tracked the overall movement of short-term interest rates. While fund leverage expenses are higher than their prior year lows, leverage nevertheless continues to provide the opportunity for incremental common share income, particularly over longer-term periods.
NVG, NZF, NMZ and NDMO’s use of leverage detracted from relative performance over this reporting period while NMCO’s use of leverage significantly detracted. However, NMZ’s use of leverage was accretive to overall common share income.
As of October 31, 2023, the Funds’ percentages of leverage are as shown in the accompanying table.
| | | | | | | | | | | | | | | | | | | | |
| | | NVG | | | NZF | | | NMZ | | | NMCO* | | | NDMO | |
| |
Effective Leverage** | | | 43.94% | | | | 42.40% | | | | 42.51% | | | | 44.94% | | | | 29.20% | |
Regulatory Leverage** | | | 41.07% | | | | 36.26% | | | | 25.41% | | | | 43.82% | | | | 29.14% | |
| |
| * | Percentages do not include preferred shares noticed for redemption as noted on Statement of Assets and Liabilities. |
| ** | Effective Leverage is a Fund’s effective economic leverage, and includes both regulatory leverage and the leverage effects of certain derivative and other investments in a Fund’s portfolio that increase the Fund’s investment exposure. Currently, the leverage effects of Tender Option Bond (TOB) inverse floater holdings are included in effective leverage values, in addition to any regulatory leverage. Regulatory leverage consists of preferred shares issued or borrowings of a Fund. Both of these are part of a Fund’s capital structure. A Fund, however, may from time to time borrow on a typically transient basis in connection with its day-to-day operations, primarily in connection with the need to settle portfolio trades. Such incidental borrowings are excluded from the calculation of a Fund’s effective leverage ratio. Regulatory leverage is subject to asset coverage limits set forth in the Investment Company Act of 1940. |
THE FUNDS’ REGULATORY LEVERAGE
As of October 31, 2023, the Funds have issued and outstanding preferred shares as shown in the accompanying table.
| | | | | | | | | | | | | | | | | | | | |
| | | Variable Rate Preferred* | | | | | | Variable Rate Remarketed Preferred** | | | | | | | |
| | | | | | | | | | | | |
| Fund | | Shares Issued at Liquidation Preference | | | | | | Shares Issued at Liquidation Preference | | | | | | Total | |
| |
NVG | | | $67,400,000 | | | | | | | | $1,686,600,000 | | | | | | | | $1,754,000,000 | |
| |
NZF | | | $ 1,172,000,000 | | | | | | | | $146,000,000 | | | | | | | | $1,318,000,000 | |
| |
NMZ | | | $357,000,000 | | | | | | | | $- | | | | | | | | $357,000,000 | |
| |
NMCO*** | | | $330,000,000 | | | | | | | | $100,000,000 | | | | | | | | $430,000,000 | |
| |
NDMO | | | $240,000,000 | | | | | | | | $- | | | | | | | | $240,000,000 | |
| |
| * | Preferred shares of the Fund featuring a floating rate dividend based on a predetermined formula or spread to an index rate. Includes the following preferred shares AMTP, iMTP, MFP-VRM and VRDP in Special Rate Mode, where applicable. See Notes to Financial Statements for further details. |
| ** | Preferred shares of the Fund featuring floating rate dividends set by a remarketing agent via a regular remarketing. Includes the following preferred shares VRDP not in Special Rate Mode, MFP-VRRM and MFP-VRDM, where applicable. See Notes to Financial Statements for further details. |
| *** | Percentages do not include preferred shares noticed for redemption as noted on the Statement of Assets and Liabilities. |
Refer to Notes to Financial Statements for further details on preferred shares and each Fund’s respective transactions.
10
Common Share Information
NVG, NZF, NMZ and NMCO COMMON SHARE DISTRIBUTION INFORMATION
The following information regarding the distributions for NVG, NZF, NMZ and NMCO are current as of October 31, 2023. Each Fund’s distribution levels may vary over time based on each Fund’s investment activity and portfolio investments value changes.
During the current reporting period, each Fund’s distributions to common shareholders were as shown in the accompanying table.
| | | | | | | | | | | | | | | | |
| | | Per Common Share Amounts | |
| | | | |
| Monthly Distributions (Ex-Dividend Date) | | NVG | | | NZF | | | NMZ | | | NMCO | |
| |
November | | | $0.0545 | | | | $0.0505 | | | | $0.0535 | | | | $0.0575 | |
December | | | 0.0545 | | | | 0.0505 | | | | 0.0535 | | | | 0.0575 | |
January | | | 0.0425 | | | | 0.0430 | | | | 0.0455 | | | | 0.0525 | |
February | | | 0.0425 | | | | 0.0430 | | | | 0.0455 | | | | 0.0525 | |
March | | | 0.0425 | | | | 0.0430 | | | | 0.0455 | | | | 0.0525 | |
April | | | 0.0425 | | | | 0.0432 | | | | 0.0455 | | | | 0.0500 | |
May | | | 0.0425 | | | | 0.0430 | | | | 0.0455 | | | | 0.0500 | |
June | | | 0.0425 | | | | 0.0430 | | | | 0.0455 | | | | 0.0500 | |
July | | | 0.0425 | | | | 0.0430 | | | | 0.0455 | | | | 0.0500 | |
August | | | 0.0425 | | | | 0.0430 | | | | 0.0455 | | | | 0.0500 | |
September | | | 0.0425 | | | | 0.0430 | | | | 0.0455 | | | | 0.0500 | |
October | | | 0.0425 | | | | 0.0430 | | | | 0.0425 | | | | 0.0455 | |
| |
Total Distributions from Net Investment Income | | | $0.5340 | | | | $0.5312 | | | | $0.5590 | | | | $0.6180 | |
| |
| | | | |
| Yields | | NVG | | | NZF | | | NMZ | | | NMCO | |
| |
Market Yield1 | | | 5.08% | | | | 5.11% | | | | 6.09% | | | | 6.30% | |
Taxable-Equivalent Yield1 | | | 8.58% | | | | 8.63% | | | | 10.14% | | | | 10.56% | |
| |
| 1 | Market Yield is based on the Fund’s current annualized monthly dividend divided by the Fund’s current market price as of the end of the reporting period. Taxable-Equivalent Yield represents the yield that must be earned on a fully taxable investment in order to equal the yield of the Fund on an after-tax basis. It is based on a federal income tax rate of 40.8%. Your actual federal income tax rate may differ from the assumed rate. The Taxable-Equivalent Yield also takes into account the percentage of the Fund’s income generated and paid by the Fund (based on payments made during the previous calendar year) that was not exempt from federal income tax. Separately, if the comparison were instead to investments that generate qualified dividend income, which is taxable at a rate lower than an individual’s ordinary graduated tax rate, the fund’s Taxable-Equivalent Yield would be lower. |
NVG, NZF, NMZ and NMCO seek to pay regular monthly dividends out of their net investment income at a rate that reflects their past and projected net income performance. To permit each Fund to maintain a more stable monthly dividend, the Fund may pay dividends at a rate that may be more or less than the amount of net income actually earned by the Fund during the period. Distributions to common shareholders are determined on a tax basis, which may differ from amounts recorded in the accounting records. In instances where the monthly dividend exceeds the earned net investment income, the Fund would report a negative undistributed net ordinary income. Refer to Notes to Financial Statements for additional information regarding the amounts of undistributed net ordinary income and undistributed net long-term capital gains and the character of the actual distributions paid by the Fund during the period.
All monthly dividends paid by NVG and NZF during the current reporting period were paid from net investment income. If a portion of the Fund’s monthly distributions is sourced or comprised of elements other than net investment income, including capital gains and/or a return of capital, shareholders will be notified of those sources. During the current fiscal period, NMZ’s and NMCO’s distributions were slightly greater than each Fund’s interest income, net of Fund expenses. As a result a portion of NMZ’s and NMCO’s distributions were deemed to be a return of capital. For financial reporting purposes, the per share amounts of each Fund’s distributions for the reporting period are presented in this report’s Financial Highlights. For income tax purposes, distribution information for each Fund as of its most recent tax year end is presented within the Notes to Financial Statements of this report.
Updated Distribution Policy for NVG, NZF, NMZ and NMCO
On October 23, 2023, the Funds’ Board of Trustees (the “Board”) updated each Fund’s distribution policy. Effective for distributions payable on December 1, 2023, each Fund’s distribution policy, which may be changed by the Board, is to make regular monthly cash distributions to holders of its common shares (stated in terms of a fixed cents per common share dividend distribution rate which may be set from time to time). The Fund intends to distribute all or substantially all of its net investment income through its regular monthly distribution and to distribute realized capital gains at least annually. In addition, in any monthly period, to maintain its declared per common share distribution amount, the Fund may distribute more or less than its net investment income during the period. In the event the Fund distributes more than its net investment income during any yearly period, such distributions may also include realized gains and/or a return of capital. To the extent that a distribution includes a return of capital the NAV per share may erode. If the Fund’s distribution includes anything other than net investment income, the Fund will provide a notice to shareholders of its best estimate of the distribution sources at that the time of the distribution. These estimates may not match the final tax characterization (for the full year’s distributions) contained in shareholders’ 1099-DIV forms after the end of the year.
11
Common Share Information (continued)
COMMON SHARE DISTRIBUTION INFORMATION FOR NDMO
NDMO makes regular cash distributions to shareholders of a stated dollar amount per share. Subject to approval and oversight by the Board of Trustees, the Fund seeks to maintain a stable distribution level designed to deliver the long-term return potential of the Fund’s investment strategy through regular distributions (a “Managed Distribution Program”). The practice of maintaining a stable distribution level had no material effect on the Fund’s investment strategy during the most recent fiscal period and is not expected to have such an effect in future periods, however, distributions in excess of Fund returns will cause its NAV per share to erode. For additional information, refer to the distribution information section below and in the Notes to Financial Statements herein.
This notice provides shareholders with information regarding fund distributions, as required by current securities laws. You should not draw any conclusions about the Fund’s investment performance from the amount of this distribution or from the terms of the Fund’s Managed Distribution Policy.
The following table provides estimates of the Fund’s distribution sources, reflecting year-to-date cumulative experience through the month-end prior to the latest distribution. The Fund attributes these estimates equally to each regular distribution throughout the year. Consequently, the estimated information as of the specified month-end shown below is for the current distribution, and also represents an updated estimate for all prior months in the year. It is estimated that the Fund has distributed more than its income and net realized capital gains; therefore, a portion of the distributions may be (and is shown below as being estimated to be) a return of capital. A return of capital may occur, for example, when some or all of the money that you invested in the Fund is paid back to you. A return of capital distribution does not necessarily reflect the Fund’s investment performance and should not be confused with “yield” or “income.”
The amounts and sources of distributions reported in this notice are only estimates and are not being provided for tax reporting purposes. The actual amounts and sources of the amounts for tax reporting purposes will depend upon the Fund’s investment experience during the remainder of its fiscal year and may be subject to changes based on tax regulations. The Fund will send a Form 1099-DIV for the calendar year that will tell you how to report these distributions for federal income tax purposes. More details about the Fund’s distributions and the basis for these estimates are available on www.nuveen.com/cef.
Data as of October 31, 2023
| | | | | | | | | | | | | | | | | | | | | | | | | | | | | | | | | | | | | | |
Fiscal YTD Per Share Estimated Sources of Distribution | | | | | | Estimated Percentage of Distributions | |
| | | | | | | | | | |
Per Share Distribution | | | Net Investment Income | | | Long-Term Gains | | | Short-Term Gains | | | Return of Capital | | | | | | Net Investment Income | | | Long-Term Gains | | | Short-Term Gains | | | Return of Capital | |
| | |
| | $0.8020 | | | | $0.4122 | | | | $0.0000 | | | | $0.0000 | | | | $0.3898 | | | | | | | | 51.4% | | | | 0.0% | | | | 0.0% | | | | 48.6% | |
| | |
The following table provides information regarding the Fund’s distributions and total return performance over various time periods. This information is intended to help you better understand whether the Fund’s returns for the specified time periods were sufficient to meet its distributions.
Data as of October 31, 2023
| | | | | | | | | | | | | | | | | | | | | | | | | | | | |
| | | | | | | | | | Annualized | | | Cumulative | |
| | | | | | | | | | | | | | | | |
Inception Date | | Latest Monthly Per Share Distribution | | | Fiscal YTD Distribution | | | Net Asset Value (NAV) | | | Current Distribution on NAV | | | Since Inception Return on NAV | | | Fiscal YTD
Distributions
on NAV | | | Fiscal YTD Return on NAV | |
| |
8/26/2020 | | | $0.0620 | | | | $0.8020 | | | | $9.80 | | | | 7.59% | | | | (6.62)% | | | | 8.18% | | | | 1.96% | |
| |
NUVEEN CLOSED-END FUND DISTRIBUTION AMOUNTS
The Nuveen Closed-End Funds’ monthly and quarterly periodic distributions to shareholders are posted on www.nuveen.com and can be found on Nuveen’s enhanced closed-end fund resource page, which is at https://www.nuveen.com/resource-center-closedend funds, along with other Nuveen closed-end fund product updates. To ensure timely access to the latest information, shareholders may use a subscribe function, which can be activated at this web page (https://www.nuveen.com/subscriptions).
COMMON SHARE EQUITY SHELF PROGRAMS
During the current reporting period, NVG, NMZ, NMCO and NDMO were authorized by the Securities and Exchange Commission to issue additional common shares through an equity shelf program (Shelf Offering). Under these programs, NVG, NMZ, NMCO and NDMO, subject to market conditions, may raise additional capital from time to time in varying amounts and offering methods at a net price at or above the Fund’s NAV per common share. The maximum aggregate offering under these Shelf Offerings are as shown in the accompanying table.
| | | | | | | | | | | | | | | | |
| | | NVG | | | NMZ* | | | NMCO | | | NDMO | |
| |
Maximum aggregate offering | | | Unlimited | | | | Unlimited | | | | $90,000,000 | | | | $250,000,000 | |
| |
| * | The Fund carried forward 13,340,607 common shares from the 19,500,000 additional previously authorized common shares. |
12
During the current reporting period, NMZ and NMCO sold common shares through their Shelf Offering at a weighted average premium to their NAV per common share as shown in the accompanying table.
| | | | | | | | |
| | | NMZ | | | NMCO | |
| |
Common shares sold through shelf offering | | | 904,034 | | | | 30,416 | |
Weighted average premium to NAV per common share sold | | | 1.23% | | | | 1.12% | |
| |
Refer to Notes to Financial Statements, for further details of Shelf Offerings and each Fund’s transactions.
COMMON SHARE REPURCHASES
The Funds’ Board of Trustees reauthorized an open-market share repurchase program, allowing each Fund to repurchase and retire an aggregate of up to approximately 10% of its outstanding common shares.
As of October 31, 2023, (and since the inception of the Funds’ repurchase programs), each Fund has cumulatively repurchased and retired its outstanding common shares as shown in the accompanying table.
| | | | | | | | | | | | | | | | | | | | |
| | | NVG | | | NZF | | | NMZ | | | NMCO | | | NDMO | |
| |
Common shares repurchased and retired | | | 202,500 | | | | 67,500 | | | | 0 | | | | 0 | | | | 0 | |
Common shares authorized for repurchase | | | 21,350,000 | | | | 16,535,000 | | | | 11,050,000 | | | | 5,480,000 | | | | 5,945,000 | |
| |
During the current reporting period, the following Fund repurchased and retired its common shares at a weighted average price per share and a weighted average discount per share as shown in the following table.
| | | | |
| | | NZF | |
| |
Common shares repurchased and retired | | | 20,000 | |
Weighted average price per common share repurchased and retired | | | $ 10.72 | |
Weighted average discount per common share repurchased and retired | | | (17.50)% | |
| |
OTHER COMMON SHARE INFORMATION
As of October 31, 2023, the Funds’ common share prices were trading at a premium/(discount) to their common share NAVs and trading at an average premium/(discount) to NAV during the current reporting period, as follows:
| | | | | | | | | | | | | | | | | | | | |
| | | NVG | | | NZF | | | NMZ | | | NMCO | | | NDMO | |
| |
Common share NAV | | | $11.79 | | | | $11.96 | | | | $9.48 | | | | $10.06 | | | | $9.80 | |
Common share price | | | $10.03 | | | | $10.10 | | | | $8.37 | | | | $8.67 | | | | $9.12 | |
Premium/(Discount) to NAV | | | (14.93)% | | | | (15.55)% | | | | (11.71)% | | | | (13.82)% | | | | (6.94)% | |
Average premium/(discount) to NAV | | | (12.98)% | | | | (13.33)% | | | | (4.66)% | | | | (5.58)% | | | | (3.15)% | |
| |
13
About the Funds’ Benchmarks
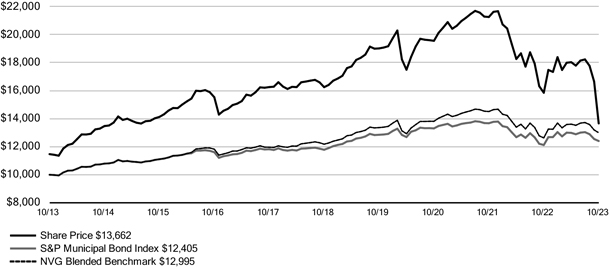
NVG Blended Benchmark: Consists of: 1) 60% S&P Municipal Bond Investment Grade Index (defined herein), and 2) 40% S&P Municipal Bond High Yield Index (defined herein). The Fund’s performance was measured against the S&P Municipal Bond Index through April 10, 2016. Index returns assume reinvestment of distributions, but do not reflect any applicable sales charges or management fees.
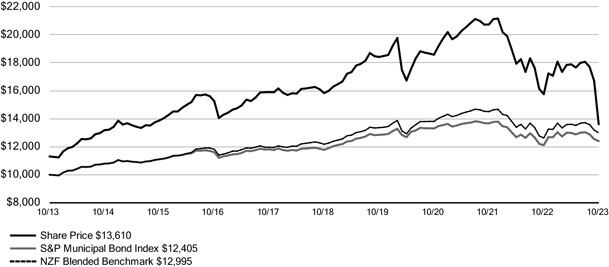
NZF Blended Benchmark: Consists of: 1) 60% S&P Municipal Bond Investment Grade Index (defined herein), and 2) 40% S&P Municipal Bond High Yield Index (defined herein). The Fund’s performance was measured against the S&P Municipal Bond Index through April 10, 2016. Index returns assume reinvestment of distributions, but do not reflect any applicable sales charges or management fees.
S&P Municipal Bond High Yield Index: An index designed to measure the performance of tax-exempt high yield municipal bonds. Index returns assume reinvestment of distributions, but do not reflect any applicable sales charges or management fees.
S&P Municipal Bond Index: An index designed to measure the performance of the tax-exempt U.S. municipal bond market. Index returns assume reinvestment of distributions, but do not reflect any applicable sales charges or management fees.
S&P Municipal Bond Investment Grade Index: An index designed to measure the performance of tax-exempt investment grade municipal bonds. Index returns assume reinvestment of distributions, but do not reflect any applicable sales charges or management fees.
S&P Municipal Yield Index: An index that is structured so that 70% of the index consists of bonds that are either not rated or are rated below investment grade, 20% are rated BBB/Baa, and 10% are rated single A. Index returns assume reinvestment of distributions, but do not reflect any applicable sales charges or management fees.
14
[This page intentionally left blank.]
15
| | |
| NVG | | Nuveen AMT-Free Municipal Credit Income Fund |
| | Performance Overview and Holding Summaries October 31, 2023 |
Refer to the Glossary of Terms Used in this Report for further definition of the terms used within this section.
Fund Performance*
| | | | | | | | | | | | | | | | |
| | | | | | Total Returns as of
October 31, 2023 | |
| | | | | | | | |
| | | | | | Average Annual | |
| | | | | | | | |
| | | Inception
Date | | | 1-Year | | | 5-Year | | | 10-Year | |
| |
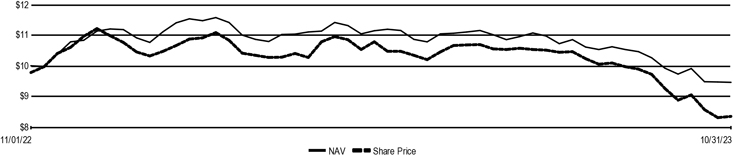
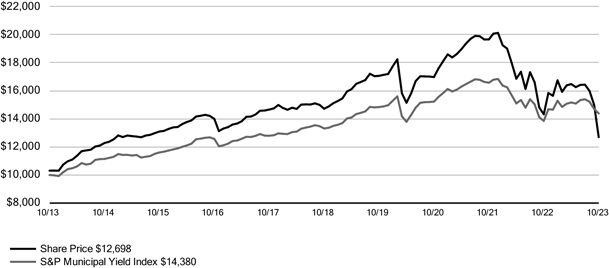
NVG at Common Share NAV | | | 3/25/02 | | | | 0.70% | | | | (0.56)% | | | | 2.97% | |
| |
NVG at Common Share Price | | | 3/25/02 | | | | (4.77)% | | | | (0.59)% | | | | 3.17% | |
| |
S&P Municipal Bond Index | | | – | | | | 2.36% | | | | 1.04% | | | | 2.18% | |
| |
NVG Blended Benchmark | | | – | | | | 2.90% | | | | 1.31% | | | | 2.65% | |
| |
*For purposes of Fund performance, relative results are measured against the NVG Blended Benchmark. The Fund’s Blended Benchmark consists of: 1) 60% S&P Municipal Bond Investment Grade Index and 2) 40% S&P Municipal Bond High Yield Index. The Fund’s performance was measured against the S&P Municipal Bond Index through April 10, 2016.
Performance data shown represents past performance and does not predict or guarantee future results. Current performance may be higher or lower than the data shown. Returns do not reflect the deduction of taxes that shareholders may have to pay on Fund distributions or upon the sale of Fund shares. Returns at NAV are net of Fund expenses, and assume reinvestment of distributions. Comparative index return information is provided for the Fund’s shares at NAV only. Indexes are not available for direct investment.
Daily Common Share NAV and Share Price
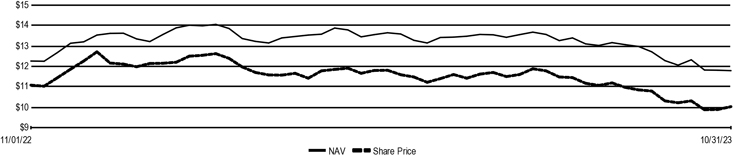
Growth of an Assumed $10,000 Investment as of October 31, 2023 - Common Share Price
16
Holdings Summaries as of October 31, 2023
This data relates to the securities held in the Fund’s portfolio of investments as of the end of the reporting period. It should not be construed as a measure of performance for the Fund itself. Holdings are subject to change.
The ratings disclosed are the lowest rating given by one of the following national rating agencies: Standard & Poor’s Group, Moody’s Investors Service, Inc. or Fitch, Inc. Credit ratings are subject to change. AAA, AA, A and BBB are investment grade ratings; BB, B, CCC, CC, C and D are below-investment grade ratings. Holdings designated N/R are not rated by these national rating agencies.
| | | | |
Fund Allocation (% of net assets) | |
| |
Municipal Bonds | | | 170.8% | |
| |
Common Stocks | | | 2.4% | |
| |
Short-Term Municipal Bonds | | | 1.6% | |
| |
Other Assets & Liabilities, Net | | | 3.1% | |
| |
Floating Rate Obligations | | | (8.4)% | |
| |
MFP Shares, Net | | | (20.5)% | |
| |
VRDP Shares, Net | | | (49.0)% | |
| |
Net Assets | | | 100% | |
| |
| | | | |
Portfolio Credit Quality (% of total investment exposure) | |
| |
U.S. Guaranteed | | | 7.2% | |
| |
AAA | | | 6.1% | |
| |
AA | | | 16.3% | |
| |
A | | | 22.0% | |
| |
BBB | | | 19.3% | |
| |
BB or Lower | | | 10.2% | |
| |
N/R (not rated) | | | 17.5% | |
| |
N/A (not applicable) | | | 1.4% | |
| |
Total | | | 100% | |
| |
| | | | |
Portfolio Composition (% of total investments) | | | |
| |
Tax Obligation/Limited | | | 19.3% | |
| |
Health Care | | | 14.1% | |
| |
Tax Obligation/General | | | 11.9% | |
| |
Transportation | | | 10.3% | |
| |
Utilities | | | 9.7% | |
| |
Education and Civic
Organizations | | | 9.4% | |
| |
U.S. Guaranteed | | | 7.2% | |
| |
Other | | | 16.7% | |
| |
Common Stocks | | | 1.4% | |
| |
Total | | | 100% | |
| |
| | | | |
States and Territories1 (% of total municipal bonds) | | | |
| |
Illinois | | | 15.0% | |
| |
Texas | | | 7.9% | |
| |
California | | | 7.5% | |
| |
Colorado | | | 5.9% | |
| |
Ohio | | | 5.6% | |
| |
New York | | | 5.4% | |
| |
Puerto Rico | | | 4.4% | |
| |
New Jersey | | | 3.9% | |
| |
Connecticut | | | 3.2% | |
| |
Pennsylvania | | | 3.1% | |
| |
Georgia | | | 2.7% | |
| |
Wisconsin | | | 2.6% | |
| |
Florida | | | 2.6% | |
| |
District of Columbia | | | 2.3% | |
| |
Indiana | | | 1.6% | |
| |
South Carolina | | | 1.5% | |
| |
Massachusetts | | | 1.5% | |
| |
Michigan | | | 1.4% | |
| |
Alabama | | | 1.4% | |
| |
Arizona | | | 1.4% | |
| |
Missouri | | | 1.4% | |
| |
Kentucky | | | 1.3% | |
| |
North Dakota | | | 1.2% | |
| |
Rhode Island | | | 1.2% | |
| |
Minnesota | | | 1.2% | |
| |
Other | | | 12.8% | |
| |
Total | | | 100% | |
| |
| 1 | See the Portfolio of Investments for the remaining states comprising “Other” and not listed in the table above. |
17
| | |
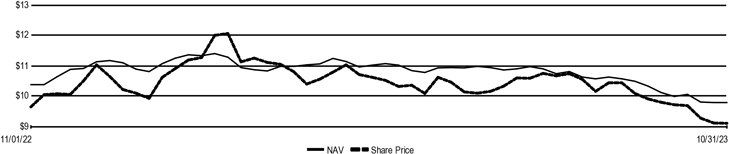
| NZF | | Nuveen Municipal Credit Income Fund |
| | Performance Overview and Holding Summaries October 31, 2023 |
Refer to the Glossary of Terms Used in this Report for further definition of the terms used within this section.
Fund Performance*
| | | | | | | | | | | | | | | | |
| | | | | | Total Returns as of October 31, 2023 | |
| | | | | | | | |
| | | | | | Average Annual | |
| | | | | | | | |
| | | Inception Date | | | 1-Year | | | 5-Year | | | 10-Year | |
| |
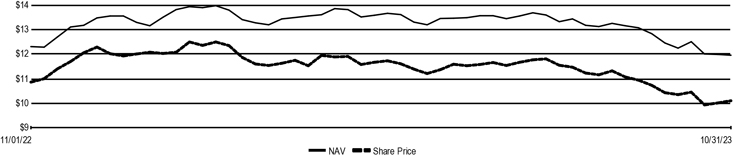
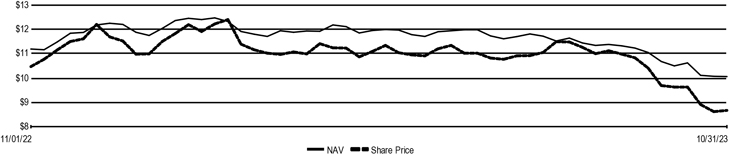
NZF at Common Share NAV | | | 9/25/01 | | | | 1.62% | | | | 0.02% | | | | 3.17% | |
| |
NZF at Common Share Price | | | 9/25/01 | | | | (2.35)% | | | | (0.52)% | | | | 3.13% | |
| |
S&P Municipal Bond Index | | | – | | | | 2.36% | | | | 1.04% | | | | 2.18% | |
| |
NZF Blended Benchmark | | | – | | | | 2.90% | | | | 1.31% | | | | 2.65% | |
| |
* For purposes of Fund performance, relative results are measured against the NZF Blended Benchmark. The Fund’s Blended Benchmark consists of: 1) 60% S&P Municipal Bond Investment Grade Index and 2) 40% S&P Municipal Bond High Yield Index. The Fund’s performance was measured against the S&P Municipal Bond Index through April 10, 2016.
Performance data shown represents past performance and does not predict or guarantee future results. Current performance may be higher or lower than the data shown. Returns do not reflect the deduction of taxes that shareholders may have to pay on Fund distributions or upon the sale of Fund shares. Returns at NAV are net of Fund expenses, and assume reinvestment of distributions. Comparative index return information is provided for the Fund’s shares at NAV only. Indexes are not available for direct investment.
Daily Common Share NAV and Share Price
Growth of an Assumed $10,000 Investment as of October 31, 2023 - Common Share Price
18
Holdings Summaries as of October 31, 2023
This data relates to the securities held in the Fund’s portfolio of investments as of the end of the reporting period. It should not be construed as a measure of performance for the Fund itself. Holdings are subject to change.
The ratings disclosed are the lowest rating given by one of the following national rating agencies: Standard & Poor’s Group, Moody’s Investors Service, Inc. or Fitch, Inc. Credit ratings are subject to change. AAA, AA, A and BBB are investment grade ratings; BB, B, CCC, CC, C and D are below-investment grade ratings. Holdings designated N/R are not rated by these national rating agencies.
| | | | |
Fund Allocation (% of net assets) | | | |
| |
Municipal Bonds | | | 165.9% | |
| |
Common Stocks | | | 5.2% | |
| |
Investment Companies | | | 0.0% | |
| |
Other Assets & Liabilities, Net | | | 1.8% | |
| |
Floating Rate Obligations | | | (16.2)% | |
| |
MFP Shares, Net | | | (27.6)% | |
| |
VRDP Shares, Net | | | (29.1)% | |
| |
Net Assets | | | 100% | |
| |
| | | | |
Portfolio Credit Quality (% of total investment exposure) | |
| |
U.S. Guaranteed | | | 3.8% | |
| |
AAA | | | 1.1% | |
| |
AA | | | 13.0% | |
| |
A | | | 27.9% | |
| |
BBB | | | 24.7% | |
| |
BB or Lower | | | 13.2% | |
| |
N/R (not rated) | | | 13.3% | |
| |
N/A (not applicable) | | | 3.0% | |
| |
Total | | | 100% | |
| |
| | | | |
Portfolio Composition (% of total investments) | |
| |
Health Care | | | 22.4% | |
| |
Transportation | | | 21.1% | |
| |
Tax Obligation/Limited | | | 18.5% | |
| |
Tax Obligation/General | | | 13.4% | |
| |
Utilities | | | 7.9% | |
| |
U.S. Guaranteed | | | 3.6% | |
| |
Education and Civic Organizations | | | 3.0% | |
| |
Other | | | 7.1% | |
| |
Common Stocks | | | 3.0% | |
| |
Investment Companies | | | 0.0% | |
| |
Total | | | 100% | |
| |
| | | | |
States and Territories1 (% of total municipal bonds) | |
| |
Illinois | | | 15.1% | |
| |
California | | | 13.5% | |
| |
New York | | | 10.4% | |
| |
Texas | | | 6.9% | |
| |
Ohio | | | 5.9% | |
| |
Florida | | | 5.8% | |
| |
New Jersey | | | 4.6% | |
| |
Puerto Rico | | | 4.2% | |
| |
Colorado | | | 4.2% | |
| |
Pennsylvania | | | 3.9% | |
| |
Georgia | | | 3.0% | |
| |
Washington | | | 2.3% | |
| |
Virginia | | | 2.2% | |
| |
South Carolina | | | 2.2% | |
| |
Wisconsin | | | 1.4% | |
| |
Oklahoma | | | 1.4% | |
| |
Louisiana | | | 1.2% | |
| |
Minnesota | | | 1.2% | |
| |
North Dakota | | | 1.2% | |
| |
Michigan | | | 1.0% | |
| |
Other | | | 8.4% | |
| |
Total | | | 100% | |
| |
| 1 | See the Portfolio of Investments for the remaining states comprising “Other” and not listed in the table above. |
19
| | |
| NMZ | | Nuveen Municipal High Income Opportunity Fund |
| | Performance Overview and Holding Summaries as of October 31, 2023 |
Refer to the Glossary of Terms Used in this Report for further definition of the terms used within this section.
Fund Performance*
| | | | | | | | | | | | | | | | |
| | | | | | Total Returns as of October 31, 2023 | |
| | | | | | | | |
| | | | | | Average Annual | |
| | | | | | | | |
| | | Inception Date | | | 1-Year | | | 5-Year | | | 10-Year | |
| |
NMZ at Common Share NAV | | | 11/19/03 | | | | 0.13% | | | | (0.54)% | | | | 3.30% | |
| |
NMZ at Common Share Price | | | 11/19/03 | | | | (10.28)% | | | | (1.30)% | | | | 2.42% | |
| |
S&P Municipal Yield Index | | | – | | | | 3.80% | | | | 1.55% | | | | 3.70% | |
| |
*For purposes of Fund performance, relative results are measured against the S&P Municipal Yield Index.
Performance data shown represents past performance and does not predict or guarantee future results. Current performance may be higher or lower than the data shown. Returns do not reflect the deduction of taxes that shareholders may have to pay on Fund distributions or upon the sale of Fund shares. Returns at NAV are net of Fund expenses, and assume reinvestment of distributions. Comparative index return information is provided for the Fund’s shares at NAV only. Indexes are not available for direct investment.
Daily Common Share NAV and Share Price
Growth of an Assumed $10,000 Investment as of October 31, 2023 - Common Share Price
20
Holdings Summaries as of October 31, 2023
This data relates to the securities held in the Fund’s portfolio of investments as of the end of the reporting period. It should not be construed as a measure of performance for the Fund itself. Holdings are subject to change.
The ratings disclosed are the lowest rating given by one of the following national rating agencies: Standard & Poor’s Group, Moody’s Investors Service, Inc. or Fitch, Inc. Credit ratings are subject to change. AAA, AA, A and BBB are investment grade ratings; BB, B, CCC, CC, C and D are below-investment grade ratings. Holdings designated N/R are not rated by these national rating agencies.
| | | | |
Fund Allocation (% of net assets) | | | |
| |
Municipal Bonds | | | 164.4% | |
| |
Common Stocks | | | 5.7% | |
| |
Variable Rate Senior Loan Interests | | | 0.0% | |
| |
Other Assets & Liabilities, Net | | | 2.7% | |
| |
Floating Rate Obligations | | | (38.8)% | |
| |
AMTP Shares, Net | | | (34.0)% | |
| |
Net Assets | | | 100% | |
| |
| | | | |
Portfolio Credit Quality (% of total investment exposure) | | | |
| |
U.S. Guaranteed | | | 0.8% | |
| |
AAA | | | 0.5% | |
| |
AA | | | 8.3% | |
| |
A | | | 15.9% | |
| |
BBB | | | 13.6% | |
| |
BB or Lower | | | 8.2% | |
| |
N/R (not rated) | | | 49.4% | |
| |
N/A (not applicable) | | | 3.3% | |
| |
Total | | | 100% | |
| |
| | | | |
Portfolio Composition (% of total investments) | | | |
| |
Tax Obligation/Limited | | | 29.2% | |
| |
Transportation | | | 18.0% | |
| |
Education and Civic Organizations | | | 12.2% | |
| |
Health Care | | | 11.0% | |
| |
Tax Obligation/General | | | 7.0% | |
| |
Housing/Multifamily | | | 5.0% | |
| |
Industrials | | | 4.2% | |
| |
Other | | | 10.1% | |
| |
Common Stocks | | | 3.3% | |
| |
Variable Rate Senior Loan Interests | | | 0.0% | |
| |
Total | | | 100% | |
| |
| | | | |
States and Territories1 (% of total municipal bonds) | | | |
| |
Florida | | | 13.9% | |
| |
Illinois | | | 11.0% | |
| |
Colorado | | | 8.9% | |
| |
California | | | 8.6% | |
| |
New York | | | 7.4% | |
| |
Puerto Rico | | | 6.4% | |
| |
Wisconsin | | | 5.2% | |
| |
Texas | | | 4.0% | |
| |
Missouri | | | 3.2% | |
| |
Arizona | | | 2.7% | |
| |
New Jersey | | | 2.6% | |
| |
Ohio | | | 2.6% | |
| |
Virginia | | | 2.6% | |
| |
Kentucky | | | 2.0% | |
| |
Michigan | | | 1.9% | |
| |
District of Columbia | | | 1.6% | |
| |
Alabama | | | 1.5% | |
| |
South Carolina | | | 1.4% | |
| |
Oklahoma | | | 1.2% | |
| |
Iowa | | | 1.2% | |
| |
Pennsylvania | | | 1.1% | |
| |
Indiana | | | 1.0% | |
| |
Louisiana | | | 0.8% | |
| |
Virgin Islands | | | 0.7% | |
| |
Massachusetts | | | 0.7% | |
| |
Other | | | 5.8% | |
| |
Total | | | 100% | |
| |
| 1 | See the Portfolio of Investments for the remaining states comprising “Other” and not listed in the table above. |
21
| | |
| NMCO | | Nuveen Municipal Credit Opportunities Fund Performance Overview and Holding Summaries as of October 31, 2023 |
Refer to the Glossary of Terms Used in this Report for further definition of the terms used within this section.
Fund Performance*
| | | | | | | | | | | | |
| | | | | | Total Returns as of October 31, 2023 | |
| | | | | | | | |
| | | | | | Average Annual | |
| | | | | | | | |
| | | Inception Date | | | 1-Year | | | Since Inception | |
| |
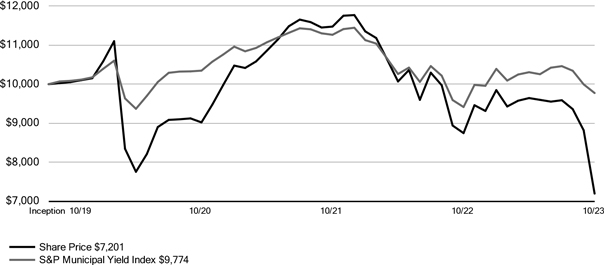
NMCO at Common Share NAV | | | 9/16/19 | | | | (4.85)% | | | | (4.46)% | |
| |
NMCO at Common Share Price | | | 9/16/19 | | | | (11.69)% | | | | (7.65)% | |
| |
S&P Municipal Yield Index | | | – | | | | 3.80% | | | | (0.55)% | |
| |
*For purposes of Fund performance, relative results are measured against the S&P Municipal Yield Index.
Performance data shown represents past performance and does not predict or guarantee future results. Current performance may be higher or lower than the data shown. Returns do not reflect the deduction of taxes that shareholders may have to pay on Fund distributions or upon the sale of Fund shares. Returns at NAV are net of Fund expenses, and assume reinvestment of distributions. Comparative index return information is provided for the Fund’s shares at NAV only. Indexes are not available for direct investment.
Daily Common Share NAV and Share Price
Growth of an Assumed $10,000 Investment as of October 31, 2023 - Common Share Price
22
Holdings Summaries as of October 31, 2023
This data relates to the securities held in the Fund’s portfolio of investments as of the end of the reporting period. It should not be construed as a measure of performance for the Fund itself. Holdings are subject to change.
The ratings disclosed are the lowest rating given by one of the following national rating agencies: Standard & Poor’s Group, Moody’s Investors Service, Inc. or Fitch, Inc. Credit ratings are subject to change. AAA, AA, A and BBB are investment grade ratings; BB, B, CCC, CC, C and D are below-investment grade ratings. Holdings designated N/R are not rated by these national rating agencies.
| | | | |
Fund Allocation (% of net assets) | | | |
| |
Municipal Bonds | | | 168.3% | |
| |
Common Stocks | | | 13.2% | |
| |
Variable Rate Senior Loan Interests | | | 0.0% | |
| |
Other Assets & Liabilities, Net | | | (2.8)% | |
| |
Floating Rate Obligations | | | (3.6)% | |
| |
MFP Shares, Net | | | (75.1)% | |
| |
Net Assets | | | 100% | |
| |
| | | | |
Portfolio Credit Quality (% of total investment exposure) | | | |
| |
U.S. Guaranteed | | | 0.2% | |
| |
AA | | | 1.1% | |
| |
A | | | 6.3% | |
| |
BBB | | | 11.1% | |
| |
BB or Lower | | | 16.9% | |
| |
N/R (not rated) | | | 57.2% | |
| |
N/A (not applicable) | | | 7.2% | |
| |
Total | | | 100% | |
| |
| | | | |
Portfolio Composition (% of total investments) | | | |
| |
Tax Obligation/Limited | | | 21.2% | |
| |
Transportation | | | 19.0% | |
| |
Education and Civic Organizations | | | 12.9% | |
| |
Industrials | | | 6.9% | |
| |
Consumer Staples | | | 6.8% | |
| |
Long-Term Care | | | 6.6% | |
| |
Tax Obligation/General | | | 6.3% | |
| |
Health Care | | | 5.5% | |
| |
Other | | | 7.5% | |
| |
Common Stocks | | | 7.3% | |
| |
Variable Rate Senior Loan Interests | | | 0.0% | |
| |
Total | | | 100% | |
| |
| | | | |
States and Territories1 (% of total municipal bonds) | | | |
| |
Florida | | | 18.3% | |
| |
Illinois | | | 8.2% | |
| |
Wisconsin | | | 8.2% | |
| |
Colorado | | | 7.2% | |
| |
New York | | | 6.4% | |
| |
Ohio | | | 5.7% | |
| |
Puerto Rico | | | 4.8% | |
| |
California | | | 3.7% | |
| |
Alabama | | | 3.4% | |
| |
Pennsylvania | | | 3.2% | |
| |
Texas | | | 3.0% | |
| |
Georgia | | | 2.4% | |
| |
Arizona | | | 2.4% | |
| |
New Jersey | | | 2.3% | |
| |
District of Columbia | | | 2.2% | |
| |
Virgin Islands | | | 2.0% | |
| |
Utah | | | 1.7% | |
| |
Louisiana | | | 1.2% | |
| |
Kansas | | | 1.2% | |
| |
Idaho | | | 1.2% | |
| |
Arkansas | | | 1.0% | |
| |
Tennessee | | | 0.8% | |
| |
Alaska | | | 0.8% | |
| |
Iowa | | | 0.7% | |
| |
Massachusetts | | | 0.7% | |
| |
Other | | | 7.3% | |
| |
Total | | | 100% | |
| |
| 1 | See the Portfolio of Investments for the remaining states comprising “Other” and not listed in the table above. |
23
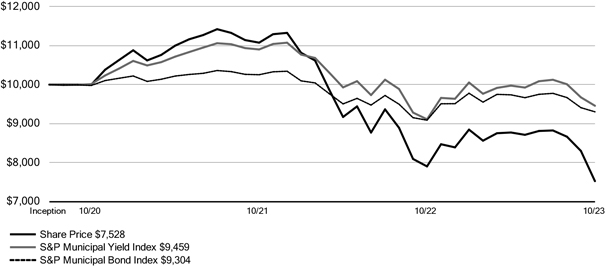
| | |
| NDMO | | Nuveen Dynamic Municipal Opportunities Fund Performance Overview and Holding Summaries as of October 31, 2023 |
Refer to the Glossary of Terms Used in this Report for further definition of the terms used within this section.
Fund Performance*
| | | | | | | | | | | | |
| | | | | | Total Returns as of October 31, 2023 | |
| | | | | | | | |
| | | | | | Average Annual | |
| | | | | | | | |
| | | Inception Date | | | 1-Year | | | Since Inception | |
| |
NDMO at Common Share NAV | | | 8/26/20 | | | | 1.96% | | | | (6.62)% | |
| |
NDMO at Common Share Price | | | 8/26/20 | | | | 4.45% | | | | (8.54)% | |
| |
S&P Municipal Yield Index | | | – | | | | 3.80% | | | | (1.73)% | |
| |
S&P Municipal Bond Index | | | – | | | | 2.36% | | | | (2.24)% | |
| |
*For purposes of Fund performance, relative results are measured against the S&P Municipal Bond Index.
Performance data shown represents past performance and does not predict or guarantee future results. Current performance may be higher or lower than the data shown. Returns do not reflect the deduction of taxes that shareholders may have to pay on Fund distributions or upon the sale of Fund shares. Returns at NAV are net of Fund expenses, and assume reinvestment of distributions. Comparative index return information is provided for the Fund’s shares at NAV only. Indexes are not available for direct investment.
Daily Common Share NAV and Share Price
Growth of an Assumed $10,000 Investment as of October 31, 2023 - Common Share Price
24
Holdings Summaries as of October 31, 2023
This data relates to the securities held in the Fund’s portfolio of investments as of the end of the reporting period. It should not be construed as a measure of performance for the Fund itself. Holdings are subject to change.
The ratings disclosed are the lowest rating given by one of the following national rating agencies: Standard & Poor’s Group, Moody’s Investors Service, Inc. or Fitch, Inc. Credit ratings are subject to change. AAA, AA, A and BBB are investment grade ratings; BB, B, CCC, CC, C and D are below-investment grade ratings. Holdings designated N/R are not rated by these national rating agencies.
| | | | |
Fund Allocation (% of net assets) | | | |
| |
Municipal Bonds | | | 139.4% | |
| |
Corporate Bonds | | | 1.4% | |
| |
Common Stocks | | | 0.2% | |
| |
Variable Rate Senior Loan Interests | | | 0.0% | |
| |
Short-Term Municipal Bonds | | | 1.6% | |
| |
Other Assets & Liabilities, Net | | | (1.4)% | |
| |
Floating Rate Obligations | | | (0.1)% | |
| |
MFP Shares, Net | | | (41.1)% | |
| |
Net Assets | | | 100% | |
| |
| |
Portfolio Credit Quality (% of total investment exposure) | | | |
| |
U.S. Guaranteed | | | 0.1% | |
| |
AAA | | | 1.3% | |
| |
AA | | | 13.7% | |
| |
A | | | 24.8% | |
| |
BBB | | | 7.4% | |
| |
BB or Lower | | | 12.7% | |
| |
N/R (not rated) | | | 39.9% | |
| |
N/A (not applicable) | | | 0.1% | |
| |
Total | | | 100% | |
| |
| | | | |
Portfolio Composition (% of total investments) | | | |
| |
Tax Obligation/Limited | | | 24.4% | |
| |
Transportation | | | 22.2% | |
| |
Education and Civic Organizations | | | 12.2% | |
| |
Utilities | | | 11.5% | |
| |
Health Care | | | 9.9% | |
| |
Tax Obligation/General | | | 7.2% | |
| |
Industrials | | | 6.3% | |
| |
Other | | | 5.2% | |
| |
Corporate Bonds | | | 1.0% | |
| |
Common Stocks | | | 0.1% | |
| |
| Variable Rate Senior Loan Interests | | | 0.0% | |
| |
Total | | | 100% | |
| |
| | | | |
States and Territories1 (% of total municipal bonds) | | | |
| |
New York | | | 13.9% | |
| |
Colorado | | | 12.6% | |
| |
Florida | | | 11.0% | |
| |
Texas | | | 10.2% | |
| |
Illinois | | | 5.6% | |
| |
Arizona | | | 5.3% | |
| |
California | | | 4.9% | |
| |
Alabama | | | 4.1% | |
| |
Puerto Rico | | | 3.2% | |
| |
Michigan | | | 2.9% | |
| |
Pennsylvania | | | 2.9% | |
| |
Wisconsin | | | 2.8% | |
| |
Tennessee | | | 2.6% | |
| |
Ohio | | | 2.2% | |
| |
Indiana | | | 2.1% | |
| |
Virginia | | | 1.4% | |
| |
Arkansas | | | 1.2% | |
| |
Washington | | | 1.0% | |
| |
Kentucky | | | 0.9% | |
| |
Missouri | | | 0.9% | |
| |
Minnesota | | | 0.8% | |
| |
Georgia | | | 0.8% | |
| |
New Jersey | | | 0.8% | |
| |
West Virginia | | | 0.7% | |
| |
New Mexico | | | 0.7% | |
| |
Other | | | 4.5% | |
| |
Total | | | 100% | |
| |
| 1 | See the Portfolio of Investments for the remaining states comprising “Other” and not listed in the table above. |
25
Shareholder Meeting Report
The annual meeting of shareholders was held on May 8, 2023, for NMCO and August 9, 2023, for NVG, NZF, NMZ, and NDMO; at this meeting the shareholders were asked to elect Board members.
| | | | | | | | | | | | | | | | | | | | | | | | |
| | | NVG | | | NZF | | | NMZ | |
| |
| | | Common and Preferred shares voting together as a class | | | Preferred shares voting together as a class | | | Common and Preferred shares voting together as a class | | | Preferred shares voting together as a class | | | Common and Preferred shares voting together as a class | | | Preferred shares voting together as a class | |
| |
| | | | | | |
Approval of the Board Members was reached as follows: | | | | | | | | | | | | | | | | | | | | | | | | |
| | | | | | |
Amy B.R. Lancellotta | | | | | | | | | | | | | | | | | | | | | | | | |
For | | | 151,349,731 | | | | – | | | | 139,619,644 | | | | – | | | | 74,629,685 | | | | – | |
Withhold | | | 7,740,601 | | | | – | | | | 12,710,420 | | | | – | | | | 3,273,737 | | | | – | |
| |
Total | | | 159,090,332 | | | | – | | | | 152,330,064 | | | | – | | | | 77,903,422 | | | | – | |
| |
| | | | | | |
John K. Nelson | | | | | | | | | | | | | | | | | | | | | | | | |
For | | | 150,683,579 | | | | – | | | | 138,053,355 | | | | – | | | | 74,394,934 | | | | – | |
Withhold | | | 8,406,753 | | | | – | | | | 14,276,709 | | | | – | | | | 3,508,488 | | | | – | |
| |
Total | | | 159,090,332 | | | | – | | | | 152,330,064 | | | | – | | | | 77,903,422 | | | | – | |
| |
| | | | | | |
Terence J. Toth | | | | | | | | | | | | | | | | | | | | | | | | |
For | | | 150,719,806 | | | | – | | | | 139,072,404 | | | | – | | | | 74,089,059 | | | | – | |
Withhold | | | 8,370,526 | | | | – | | | | 13,257,660 | | | | – | | | | 3,814,363 | | | | – | |
| |
Total | | | 159,090,332 | | | | – | | | | 152,330,064 | | | | – | | | | 77,903,422 | | | | – | |
| |
| | | | | | |
Robert L. Young | | | | | | | | | | | | | | | | | | | | | | | | |
For | | | 151,025,787 | | | | – | | | | 138,438,919 | | | | – | | | | 74,469,477 | | | | – | |
Withhold | | | 8,064,545 | | | | – | | | | 13,891,145 | | | | – | | | | 3,433,945 | | | | – | |
| |
Total | | | 159,090,332 | | | | – | | | | 152,330,064 | | | | – | | | | 77,903,422 | | | | – | |
| |
| | | | | | |
William C. Hunter | | | | | | | | | | | | | | | | | | | | | | | | |
For | | | – | | | | 461,040 | | | | – | | | | 9,820 | | | | – | | | | 3,570 | |
Withhold | | | – | | | | – | | | | – | | | | – | | | | – | | | | – | |
| |
Total | | | – | | | | 461,040 | | | | – | | | | 9,820 | | | | – | | | | 3,570 | |
| |
| | | | | | |
Albin F. Moschner | | | | | | | | | | | | | | | | | | | | | | | | |
For | | | – | | | | 461,040 | | | | – | | | | 9,820 | | | | – | | | | 3,570 | |
Withhold | | | – | | | | – | | | | – | | | | – | | | | – | | | | – | |
| |
Total | | | – | | | | 461,040 | | | | – | | | | 9,820 | | | | – | | | | 3,570 | |
| |
26
| | | | | | | | | | | | | | | | |
| | | NMCO | | | NDMO | |
| |
| | | Common and Preferred shares voting together as a class | | | Preferred shares voting together as a class | | | Common and Preferred shares voting together as a class | | | Preferred shares voting together as a class | |
| |
| | | | |
Approval of the Board Members was reached as follows: | | | | | | | | | | | | | | | | |
| | | | |
Amy B.R. Lancellotta | | | | | | | | | | | | | | | | |
For | | | 43,414,042 | | | | – | | | | 46,977,600 | | | | – | |
Withhold | | | 1,034,145 | | | | – | | | | 1,132,922 | | | | – | |
| |
Total | | | 44,448,187 | | | | – | | | | 48,110,522 | | | | – | |
| |
| | | | |
John K. Nelson | | | | | | | | | | | | | | | | |
For | | | 43,371,886 | | | | – | | | | 46,494,898 | | | | – | |
Withhold | | | 1,076,301 | | | | – | | | | 1,615,624 | | | | – | |
| |
Total | | | 44,448,187 | | | | – | | | | 48,110,522 | | | | – | |
| |
| | | | |
Terence J. Toth | | | | | | | | | | | | | | | | |
For | | | 43,321,317 | | | | – | | | | 46,313,519 | | | | – | |
Withhold | | | 1,126,870 | | | | – | | | | 1,797,003 | | | | – | |
| |
Total | | | 44,448,187 | | | | – | | | | 48,110,522 | | | | – | |
| |
| | | | |
Robert L. Young | | | | | | | | | | | | | �� | | | |
For | | | 43,470,530 | | | | – | | | | 46,385,873 | | | | – | |
Withhold | | | 977,657 | | | | – | | | | 1,724,649 | | | | – | |
| |
Total | | | 44,448,187 | | | | – | | | | 48,110,522 | | | | – | |
| |
| | | | |
William C. Hunter | | | | | | | | | | | | | | | | |
For | | | – | | | | 4,500 | | | | – | | | | 2,400 | |
Withhold | | | – | | | | – | | | | – | | | | – | |
| |
Total | | | – | | | | 4,500 | | | | – | | | | 2,400 | |
| |
| | | | |
Albin F. Moschner | | | | | | | | | | | | | | | | |
For | | | – | | | | 4,500 | | | | – | | | | 2,400 | |
Withhold | | | – | | | | – | | | | – | | | | – | |
| |
Total | | | – | | | | 4,500 | | | | – | | | | 2,400 | |
| |
27
[This page intentionally left blank.]
28
Report of Independent Registered
Public Accounting Firm
To the Board of Trustees and Shareholders of Nuveen AMT-Free Municipal Credit Income Fund, Nuveen Municipal Credit Income Fund, Nuveen Municipal High Income Opportunity Fund, Nuveen Municipal Credit Opportunities Fund, and Nuveen Dynamic Municipal Opportunities Fund
Opinion on the Financial Statements
We have audited the accompanying statements of assets and liabilities of the Funds Listed in Appendix A (the Funds), including the portfolios of investments, as of October 31, 2023, the related statements of operations, cash flows and changes in net assets for the Funds and periods listed in Appendix A, and the related notes (collectively, the financial statements) and the financial highlights for the Funds and periods listed in Appendix A. In our opinion, the financial statements and financial highlights present fairly, in all material respects, the financial position of the Funds as of October 31, 2023, the results of their operations, cash flows and the changes in their net assets for the periods listed in Appendix A, and the financial highlights for the Funds and periods listed in Appendix A, in conformity with U.S. generally accepted accounting principles.
Basis for Opinion
These financial statements and financial highlights are the responsibility of the Funds’ management. Our responsibility is to express an opinion on these financial statements and financial highlights based on our audits. We are a public accounting firm registered with the Public Company Accounting Oversight Board (United States) (PCAOB) and are required to be independent with respect to the Funds in accordance with the U.S. federal securities laws and the applicable rules and regulations of the Securities and Exchange Commission and the PCAOB.
We conducted our audits in accordance with the standards of the PCAOB. Those standards require that we plan and perform the audit to obtain reasonable assurance about whether the financial statements and financial highlights are free of material misstatement, whether due to error or fraud. Our audits included performing procedures to assess the risks of material misstatement of the financial statements and financial highlights, whether due to error or fraud, and performing procedures that respond to those risks. Such procedures included examining, on a test basis, evidence regarding the amounts and disclosures in the financial statements and financial highlights. Such procedures also included confirmation of securities owned as of October 31, 2023, by correspondence with custodians and brokers; when replies were not received from brokers, we performed other auditing procedures. Our audits also included evaluating the accounting principles used and significant estimates made by management, as well as evaluating the overall presentation of the financial statements and financial highlights. We believe that our audits provide a reasonable basis for our opinion.
/s/ KPMG LLP
We have served as the auditor of one or more Nuveen investment companies since 2014.
Chicago, Illinois
December 28, 2023
29
Report of Independent Registered Public Accounting Firm (continued)
Appendix A
For the year ended October 31, 2023 (statements of operations and cash flows); for each of the years in the two-year period ended October 31, 2023 (statements of changes in net assets); for each of the years in the five-year period ended October 31, 2023 (financial highlights):
Nuveen AMT-Free Municipal Credit Income Fund
Nuveen Municipal Credit Income Fund
Nuveen Municipal High Income Opportunity Fund
For the year ended October 31, 2023 (statements of operations and cash flows); for each of the years in the two-year period ended October 31, 2023 (statements of changes in net assets); for each of the years in the four-year period ended October 31, 2023, and the period September 16, 2019 (commencement of operations) through October 31, 2019 (financial highlights):
Nuveen Municipal Credit Opportunities Fund
For the year ended October 31, 2023 (statements of operations and cash flows); for each of the years in the two-year period ended October 31, 2023 (statements of changes in net assets); for each of the years in the three-year period ended October 31, 2023, and the period August 26, 2020 (commencement of operations) through October 31, 2020 (financial highlights):
Nuveen Dynamic Municipal Opportunities Fund
30
| | |
| NVG | | Nuveen AMT-Free Municipal Credit Income Fund Portfolio of Investments October 31, 2023 |
| | | | | | | | | | | | |
Principal Amount (000) | | | | | Description (a) | | Optional Call Provisions (b) | | Value | |
| | | | | | LONG-TERM INVESTMENTS - 173.2% (99.1% of Total Investments) | | | | | | |
| | | | | | MUNICIPAL BONDS - 170.8% (97.7% of Total Investments) | | | | | | |
| | | | |
| | | | | | Alabama - 2.4% (1.4% of Total Investments) | | | | | | |
| | | | |
| | $ 3,645 | | | | | Alabama Private Colleges and University Facilities Authority, Limited Obligation Bonds, University of Mobile Project, Series 2015A, 6.000%, 9/01/45, 144A | | 9/25 at 100.00 | | $ | 3,486,755 | |
| | | | |
| | 4,710 | | | | | Birmingham-Jefferson Civic Center Authority, Alabama, Special Tax Bonds,
Series 2018A, 4.000%, 7/01/43 | | 7/28 at 100.00 | | | 3,933,887 | |
| | | | |
| | 7,500 | | | | | Black Belt Energy Gas District, Alabama, Gas Project Revenue Bonds, Prepay Morgan Stanley Series 2022C-1, 5.250%, 2/01/53, (Mandatory Put 6/01/29) | | 3/29 at 100.15 | | | 7,517,111 | |
| | | | |
| | 30,730 | | | | | Lower Alabama Gas District, Alabama, Gas Project Revenue Bonds, Series 2016A, 5.000%, 9/01/46 | | No Opt. Call | | | 28,624,983 | |
| | | | |
| | 8,100 | | | | | Mobile Spring Hill College Educational Building Authority, Alabama, Revenue Bonds, Spring Hill College Project, Series 2015, 5.875%, 4/15/45 | | 4/25 at 100.00 | | | 7,353,398 | |
| | | | |
| | | | | | The Improvement District of the City of Mobile - McGowin Park Project, Alabama, Sales Tax Revenue Bonds, Series 2016A: | | | | | | |
| | 1,000 | | | | | 5.250%, 8/01/30 | | 8/26 at 100.00 | | | 924,528 | |
| | 1,300 | | | | | 5.500%, 8/01/35 | | 8/26 at 100.00 | | | 1,153,050 | |
| | | | |
| | | | | | Tuscaloosa County Industrial Development Authority, Alabama, Gulf Opportunity Zone Bonds, Hunt Refining Project, Refunding Series 2019A: | | | | | | |
| | 2,914 | | | | | 4.500%, 5/01/32, 144A | | 5/29 at 100.00 | | | 2,579,742 | |
| | 4,220 | | | | | 5.250%, 5/01/44, 144A | | 5/29 at 100.00 | | | 3,478,117 | |
| | | | |
| | 1,810 | | | | | UAB Medicine Finance Authority, Alabama, Revenue Bonds, Series 2019B,
4.000%, 9/01/44 | | 9/29 at 100.00 | | | 1,546,810 | |
| | | | | | Total Alabama | | | | | 60,598,381 | |
| | | | |
| | | | | | Alaska - 0.5% (0.3% of Total Investments) | | | | | | |
| | | | |
| | | | | | Northern Tobacco Securitization Corporation, Alaska, Tobacco Settlement Asset-Backed Bonds, Senior Series 2021A Class 1: | | | | | | |
| | 4,490 | | | | | 4.000%, 6/01/41 | | 6/31 at 100.00 | | | 3,892,158 | |
| | 8,100 | | | | | 4.000%, 6/01/50 | | 6/31 at 100.00 | | | 6,489,753 | |
| | | | |
| | 940 | | | | | Northern Tobacco Securitization Corporation, Alaska, Tobacco Settlement Asset-Backed Bonds, Series 2021B-1 Class 2, 4.000%, 6/01/50 | | 6/31 at 100.00 | | | 836,768 | |
| | | | |
| | 19,045 | | | | | Northern Tobacco Securitization Corporation, Alaska, Tobacco Settlement Asset-Backed Bonds, Series 2021B-2 Class 2, 0.000%, 6/01/66 | | 6/31 at 30.73 | | | 1,675,989 | |
| | | | | | Total Alaska | | | | | 12,894,668 | |
| | | | |
| | | | | | Arizona - 2.4% (1.3% of Total Investments) | | | | | | |
| | | | |
| | 1,475 | | | | | Arizona Industrial Development Authority, Arizona, Education Facility Revenue Bonds, Basis Schools, Inc. Projects, Series 2017D, 5.000%, 7/01/47, 144A | | 7/27 at 100.00 | | | 1,234,302 | |
| | | | |
| | 6,290 | | | | | Arizona Industrial Development Authority, Arizona, Education Revenue Bonds, Academies of Math & Science Projects, Series 2019, 5.000%, 7/01/54, 144A | | 7/29 at 100.00 | | | 5,056,110 | |
| | | | |
| | 3,260 | | | | | Arizona Industrial Development Authority, Education Facility Revenue Bonds, Caurus Academy Project, Series 2018A, 6.375%, 6/01/39, 144A | | 6/28 at 100.00 | | | 3,296,445 | |
| | | | |
| | 3,142 | | | (c) | | Cahava Springs Revitalization District, Cave Creek, Arizona, Special Assessment Bonds, Series 2017A, 7.000%, 7/01/41, 144A | | 7/27 at 100.00 | | | 2,419,491 | |
31
| | |
| NVG | | Nuveen AMT-Free Municipal Credit Income Fund (continued) |
| | Portfolio of Investments October 31, 2023 |
| | | | | | | | | | | | |
Principal Amount (000) | | | | | Description (a) | | Optional Call Provisions (b) | | Value | |
| | | | |
| | | | | | Arizona (continued) | | | | | | |
| | $ 4,885 | | | | | Glendale Industrial Development Authority, Arizona, Senior Living Revenue Bonds, Royal Oaks Royal Oaks - Inspirata Pointe Project, Series 2020A, 5.000%, 5/15/56 | | 5/26 at 103.00 | | $ | 3,647,806 | |
| | | | |
| | 1,350 | | | | | Maricopa County Industrial Development Authority, Arizona, Education Revenue Bonds, Legacy Traditional Schools Projects, Series 2021A, 4.000%, 7/01/56, 144A | | 7/31 at 100.00 | | | 905,623 | |
| | | | |
| | | | | | Maricopa County Industrial Development Authority, Arizona, Education Revenue Bonds, Legacy Traditional Schools Projects, Taxable Series 2019B: | | | | | | |
| | 1,730 | | | | | 5.000%, 7/01/49, 144A | | 7/29 at 100.00 | | | 1,452,010 | |
| | 1,975 | | | | | 5.000%, 7/01/54, 144A | | 7/29 at 100.00 | | | 1,623,538 | |
| | | | |
| | 800 | | | | | Maricopa County Industrial Development Authority, Arizona, Education Revenue Bonds, Reid Traditional School Projects, Series 2016, 5.000%, 7/01/47 | | 7/26 at 100.00 | | | 710,003 | |
| | | | |
| | | | | | Phoenix Civic Improvement Corporation, Arizona, Revenue Bonds, Civic Plaza Expansion Project, Series 2005B: | | | | | | |
| | 6,000 | | | | | 5.500%, 7/01/37 - FGIC Insured | | No Opt. Call | | | 6,636,791 | |
| | 8,755 | | | | | 5.500%, 7/01/39 - FGIC Insured | | No Opt. Call | | | 9,537,533 | |
| | | | |
| | | | | | Phoenix Industrial Development Authority, Arizona, Education Facility Revenue Bonds, Basis Schools, Inc. Projects, Series 2016A: | | | | | | |
| | 620 | | | | | 5.000%, 7/01/35, 144A | | 7/25 at 100.00 | | | 588,405 | |
| | 1,025 | | | | | 5.000%, 7/01/46, 144A | | 7/25 at 100.00 | | | 863,086 | |
| | | | |
| | | | | | Pima County Industrial Development Authority, Arizona, Education Facility Revenue Bonds, Edkey Charter Schools Project, Series 2016: | | | | | | |
| | 1,130 | | | | | 5.250%, 7/01/36 | | 7/26 at 100.00 | | | 1,052,071 | |
| | 1,850 | | | | | 5.375%, 7/01/46 | | 7/26 at 100.00 | | | 1,599,539 | |
| | 2,135 | | | | | 5.500%, 7/01/51 | | 7/26 at 100.00 | | | 1,831,947 | |
| | | | |
| | 2,920 | | | | | Pima County Industrial Development Authority, Arizona, Education Facility Revenue Bonds, Edkey Charter Schools Project, Series 2019, 5.875%, 7/01/51, 144A | | 7/26 at 103.00 | | | 2,644,296 | |
| | | | |
| | 885 | | | | | Pima County Industrial Development Authority, Arizona, Education Facility Revenue Bonds, San Tan Montessori School Project, Series 2016, 6.500%, 2/01/48, 144A | | 2/24 at 100.00 | | | 878,482 | |
| | | | |
| | 3,050 | | | | | Pima County Industrial Development Authority, Arizona, Education Facility Revenue Bonds, San Tan Montessori School Project, Series 2017, 6.750%, 2/01/50, 144A | | 2/28 at 100.00 | | | 3,008,987 | |
| | | | |
| | | | | | Salt Verde Financial Corporation, Arizona, Senior Gas Revenue Bonds, Citigroup Energy Inc Prepay Contract Obligations, Series 2007: | | | | | | |
| | 6,120 | | | | | 5.000%, 12/01/32 | | No Opt. Call | | | 6,088,540 | |
| | 2,365 | | | | | 5.000%, 12/01/37 | | No Opt. Call | | | 2,295,788 | |
| | | | |
| | 2,000 | | | | | Yavapai County Industrial Development Authority, Arizona, Hospital Revenue Bonds, Yavapai Regional Medical Center, Series 2013A, 5.250%, 8/01/33 | | 11/23 at 100.00 | | | 2,000,386 | |
| | | | | | Total Arizona | | | | | 59,371,179 | |
| | | | |
| | | | | | Arkansas - 0.7% (0.4% of Total Investments) | | | | | | |
| | | | |
| | | | | | Arkansas Development Finance Authority, Tobacco Settlement Revenue Bonds, Arkansas Cancer Research Center Project, Series 2006: | | | | | | |
| | 2,635 | | | | | 0.000%, 7/01/36 - AMBAC Insured | | No Opt. Call | | | 1,418,936 | |
| | 20,480 | | | | | 0.000%, 7/01/46 - AMBAC Insured | | No Opt. Call | | | 5,627,945 | |
| | | | |
| | 1,230 | | | | | Pulaski County, Arkansas, Hospital Revenue Bonds, Arkansas Children’s Hospital, Series 2023, 4.250%, 3/01/48 | | 3/33 at 100.00 | | | 1,042,873 | |
32
| | | | | | | | | | | | |
Principal Amount (000) | | | | | Description (a) | | Optional Call Provisions (b) | | Value | |
| | | | |
| | | | | | Arkansas (continued) | | | | | | |
| | $ 11,925 | | | | | Springdale, Arkansas, Sales and Use Tax Revenue Bonds, Refunding & Improvement Series 2023B, 4.125%, 8/01/50 - BAM Insured | | 2/30 at 100.00 | | $ | 9,984,354 | |
| | | | | | Total Arkansas | | | | | 18,074,108 | |
| | | | |
| | | | | | California - 12.9% (7.4% of Total Investments) | | | | | | |
| | | | |
| | 6,135 | | | | | Alhambra Unified School District, Los Angeles County, California, General Obligation Bonds, Capital Appreciation Series 2009B, 0.000%, 8/01/30 - AGC Insured | | No Opt. Call | | | 4,598,523 | |
| | | | |
| | | | | | Anaheim Public Financing Authority, California, Lease Revenue Bonds, Public Improvement Project, Series 1997C: | | | | | | |
| | 6,820 | | | (d) | | 0.000%, 9/01/35 - AGM Insured, (ETM) | | No Opt. Call | | | 4,137,816 | |
| | 5,795 | | | | | 0.000%, 9/01/35 - AGM Insured | | No Opt. Call | | | 3,310,354 | |
| | | | |
| | 4,100 | | | | | Antelope Valley Healthcare District, California, Revenue Bonds, Series 2016A,
5.000%, 3/01/41 | | 3/26 at 100.00 | | | 3,622,457 | |
| | | | |
| | 3,875 | | | | | Bakersfield City School District, Kern County, California, General Obligation Bonds, Election 2016 Series 2022C, 2.500%, 11/01/46 - BAM Insured | | 11/31 at 100.00 | | | 2,339,491 | |
| | | | |
| | 1,650 | | | | | California Community Choice Financing Authority, Clean Energy Project Revenue Bonds, Green Series 2023C, 5.250%, 1/01/54, (Mandatory Put 10/01/31) | | 10/30 at 100.65 | | | 1,615,315 | |
| | | | |
| | 2,325 | | | | | California Community Housing Agency, California, Essential Housing Revenue Bonds, Fountains at Emerald Park, Senior Lien Series 2021A-1, 3.000%, 8/01/56, 144A | | 8/31 at 100.00 | | | 1,384,314 | |
| | | | |
| | 2,000 | | | | | California Community Housing Agency, California, Essential Housing Revenue Bonds, Summit at Sausalito Apartments, Series 2021A-1, 3.000%, 2/01/57, 144A | | 8/32 at 100.00 | | | 1,190,647 | |
| | | | |
| | 1,430 | | | | | California County Tobacco Securitization Agency, Tobacco Settlement Asset-Backed Bonds, Los Angeles County Securitization Corporation, Series 2020A,
4.000%, 6/01/49 | | 6/30 at 100.00 | | | 1,164,314 | |
| | | | |
| | 310 | | | | | California County Tobacco Securitization Agency, Tobacco Settlement Asset-Backed Bonds, Los Angeles County Securitization Corporation, Series 2020B-1,
5.000%, 6/01/49 | | 6/30 at 100.00 | | | 297,461 | |
| | | | |
| | 50,460 | | | | | California County Tobacco Securitization Agency, Tobacco Settlement Asset-Backed Bonds, Los Angeles County Securitization Corporation, Series 2020B-2,
0.000%, 6/01/55 | | 6/30 at 26.72 | | | 6,986,167 | |
| | | | |
| | 12,940 | | | (e) | | California Educational Facilities Authority, Revenue Bonds, Stanford University
Series 2019V-1, 5.000%, 5/01/49, (UB) | | No Opt. Call | | | 13,300,096 | |
| | 5,000 | | | (e) | | California Educational Facilities Authority, Revenue Bonds, Stanford University
Series 2019V-1, 5.000%, 5/01/49 | | No Opt. Call | | | 5,139,140 | |
| | | | |
| | 10,000 | | | (e) | | California Educational Facilities Authority, Revenue Bonds, Stanford University
Series 2021V-2, 5.000%, 4/01/51, (UB) | | No Opt. Call | | | 10,213,455 | |
| | | | |
| | 8,300 | | | (e) | | California Educational Facilities Authority, Revenue Bonds,Stanford University, Refunding Series 2014U-6, 5.000%, 5/01/45, (UB) | | No Opt. Call | | | 8,708,741 | |
| | | | |
| | 1,915 | | | | | California Health Facilities Financing Authority, Revenue Bonds, Stanford Hospitals and Clinics, Series 2015A, 5.000%, 8/15/54 | | 8/25 at 100.00 | | | 1,905,487 | |
| | | | |
| | | | | | California Municipal Finance Authority, Charter School Revenue Bonds, Palmdale Aerospace Academy Project, Series 2016A: | | | | | | |
| | 3,065 | | | | | 5.000%, 7/01/31, 144A | | 7/26 at 100.00 | | | 3,004,569 | |
| | 1,000 | | | | | 5.000%, 7/01/36, 144A | | 7/26 at 100.00 | | | 940,361 | |
| | 555 | | | | | 5.000%, 7/01/41, 144A | | 7/26 at 100.00 | | | 492,244 | |
| | 195 | | | | | 5.000%, 7/01/46, 144A | | 7/26 at 100.00 | | | 166,069 | |
33
| | |
| NVG | | Nuveen AMT-Free Municipal Credit Income Fund (continued) |
| | Portfolio of Investments October 31, 2023 |
| | | | | | | | | | | | |
Principal Amount (000) | | | | | Description (a) | | Optional Call Provisions (b) | | Value | |
| | | | |
| | | | | | California (continued) | | | | | | |
| | | | | | California Municipal Finance Authority, Education Revenue Bonds, American Heritage Foundation Project, Series 2016A: | | | | | | |
| | $ 260 | | | | | 5.000%, 6/01/36 | | 6/26 at 100.00 | | $ | 250,138 | |
| | 435 | | | | | 5.000%, 6/01/46 | | 6/26 at 100.00 | | | 378,105 | |
| | | | |
| | 3,000 | | | | | California Municipal Finance Authority, Revenue Bonds, Simpson University,
Series 2020A, 6.000%, 10/01/50, 144A | | 10/27 at 103.00 | | | 2,763,992 | |
| | | | |
| | 5,425 | | | | | California Pollution Control Financing Authority, Water Furnishing Revenue Bonds,
San Diego County Water Authoriity Desalination Project Pipeline, Refunding
Series 2019, 5.000%, 11/21/45, 144A | | 1/29 at 100.00 | | | 5,160,486 | |
| | | | |
| | 2,050 | | | | | California Public Finance Authority, Revenue Bonds, Henry Mayo Newhall Hospital, Series 2017, 5.000%, 10/15/47 | | 10/26 at 100.00 | | | 1,867,110 | |
| | | | |
| | 735 | | | | | California School Finance Authority, Charter School Revenue Bonds, Downtown College Prep - Obligated Group, Series 2016, 5.000%, 6/01/46, 144A | | 6/26 at 100.00 | | | 639,792 | |
| | | | |
| | 715 | | | | | California School Finance Authority, Charter School Revenue Bonds, Rocketship Education Obligated Group, Series 2016A, 5.000%, 6/01/36, 144A | | 6/25 at 100.00 | | | 678,455 | |
| | | | |
| | 570 | | | | | California School Finance Authority, Charter School Revenue Bonds, Rocketship Education Obligated Group, Series 2017A, 5.125%, 6/01/47, 144A | | 6/26 at 100.00 | | | 497,742 | |
| | | | |
| | 80 | | | | | California State, General Obligation Bonds, Series 2002, 5.000%, 10/01/32 - NPFG Insured | | 12/23 at 100.00 | | | 80,063 | |
| | | | |
| | 5 | | | | | California State, General Obligation Bonds, Series 2004, 5.000%, 4/01/31 - AMBAC Insured | | 12/23 at 100.00 | | | 5,004 | |
| | | | |
| | 8,440 | | | | | California Statewide Communities Development Authority, California, Revenue Bonds, Loma Linda University Medical Center, Series 2014A, 5.500%, 12/01/54 | | 12/24 at 100.00 | | | 8,040,243 | |
| | | | |
| | 65,130 | | | | | California Statewide Communities Development Authority, California, Revenue Bonds, Loma Linda University Medical Center, Series 2016A, 5.250%, 12/01/56, 144A | | 6/26 at 100.00 | | | 57,701,370 | |
| | | | |
| | 7,130 | | | | | California Statewide Communities Development Authority, California, Revenue Bonds, Loma Linda University Medical Center, Series 2018A, 5.500%, 12/01/58, 144A | | 6/28 at 100.00 | | | 6,521,695 | |
| | | | |
| | 4,000 | | | (d) | | California Statewide Communities Development Authority, Revenue Bonds, Huntington Memorial Hospital, Refunding Series 2014B, 4.000%, 7/01/39, (Pre-refunded 7/01/24) | | 7/24 at 100.00 | | | 4,011,699 | |
| | | | |
| | | | | | California Statewide Community Development Authority, Revenue Bonds, Daughters of Charity Health System, Series 2005A: | | | | | | |
| | 17 | | | (c),(f) | | 5.750%, 7/01/30 | | 1/22 at 100.00 | | | 16,876 | |
| | 49 | | | (c),(f) | | 5.750%, 7/01/35 | | 1/22 at 100.00 | | | 48,702 | |
| | | | |
| | 5,000 | | | (d) | | Clovis Unified School District, Fresno County, California, General Obligation Bonds, Series 2001A, 0.000%, 8/01/25 - FGIC Insured, (ETM) | | No Opt. Call | | | 4,672,911 | |
| | | | |
| | 5,330 | | | | | CMFA Special Finance Agency VII, California, Essential Housing Revenue Bonds, Senior Lien Series 2021A-1, 3.000%, 8/01/56, 144A | | 8/31 at 100.00 | | | 3,194,953 | |
| | | | |
| | 4,000 | | | | | CMFA Special Finance Agency, California, Essential Housing Revenue Bonds, Latitude 33, Senior Series 2021A-1, 3.000%, 12/01/56, 144A | | 12/31 at 100.00 | | | 2,376,116 | |
| | | | |
| | 3,410 | | | | | Coachella Valley Unified School District, Riverside County, California, General Obligation Bonds, Election 2005 Series 2010C, 0.000%, 8/01/33 - AGM Insured | | No Opt. Call | | | 2,202,773 | |
| | | | |
| | 14,375 | | | | | Corona-Norco Unified School District, Riverside County, California, General Obligation Bonds, Capital Appreciation, Election 2006 Refunding Series 2009C, 0.000%, 8/01/39 - AGM Insured | | No Opt. Call | | | 6,309,002 | |
34
| | | | | | | | | | | | |
Principal Amount (000) | | | | | Description (a) | | Optional Call Provisions (b) | | Value | |
| | | | |
| | | | | | California (continued) | | | | | | |
| | $ 2,000 | | | | | CSCDA Community Improvement Authority, California, Essential Housing Revenue Bonds, 777 Place-Pomona, Senior Lien Series 2021A-1, 3.600%, 5/01/47, 144A | | 5/32 at 100.00 | | $ | 1,451,608 | |
| | | | |
| | 5,000 | | | | | CSCDA Community Improvement Authority, California, Essential Housing Revenue Bonds, 777 Place-Pomona, Senior Lien Series 2021A-2, 3.250%, 5/01/57, 144A | | 5/32 at 100.00 | | | 3,099,847 | |
| | | | |
| | 5,000 | | | | | CSCDA Community Improvement Authority, California, Essential Housing Revenue Bonds, Escondido Portfolio, Social Senior Lien Series 2021A-2, 4.000%, 6/01/58, 144A | | 6/31 at 100.00 | | | 3,435,103 | |
| | | | |
| | 4,720 | | | | | CSCDA Community Improvement Authority, California, Essential Housing Revenue Bonds, Moda at Monrovia Station, Social Series 2021A-1, 3.400%, 10/01/46, 144A | | 10/31 at 100.00 | | | 3,312,368 | |
| | | | |
| | 15,985 | | | | | CSCDA Community Improvement Authority, California, Essential Housing Revenue Bonds, Monterrey Station Apartments, Senior Lien Series 2021A-1, 3.125%, 7/01/56, 144A | | 7/32 at 100.00 | | | 9,419,975 | |
| | | | |
| | 5,000 | | | | | CSCDA Community Improvement Authority, California, Essential Housing Revenue Bonds, Pasadena Portfolio Social Bond, Series 2021A-2, 3.000%, 12/01/56 | | 12/31 at 100.00 | | | 2,980,186 | |
| | | | |
| | 2,475 | | | | | CSCDA Community Improvement Authority, California, Essential Housing Revenue Bonds, Vineyard Gardens Apartments, Senior Lien Series 2021A, 3.250%, 10/01/58, 144A | | 4/32 at 100.00 | | | 1,453,662 | |
| | | | |
| | 12,500 | | | | | CSCDA Community Improvement Authority, California, Essential Housing Revenue Bonds, Wood Creek Apartments, Mezzanine Lien Series 2021A-2, 4.000%, 12/01/58 | | 6/32 at 100.00 | | | 8,351,492 | |
| | | | |
| | | | | | El Rancho Unified School District, Los Angeles County, California, General Obligation Bonds, Election 2010 Series 2011A: | | | | | | |
| | 2,615 | | | | | 6.900%, 8/01/31 - AGM Insured | | 8/28 at 100.00 | | | 2,970,467 | |
| | 3,600 | | | | | 7.050%, 8/01/34 - AGM Insured | | 8/28 at 100.00 | | | 4,104,482 | |
| | | | |
| | | | | | Foothill/Eastern Transportation Corridor Agency, California, Toll Road Revenue Bonds, Refunding Senior Lien Series 2015A: | | | | | | |
| | 3,960 | | | | | 0.000%, 1/15/34 - AGM Insured | | No Opt. Call | | | 2,485,703 | |
| | 5,000 | | | | | 0.000%, 1/15/35 - AGM Insured | | No Opt. Call | | | 2,980,201 | |
| | | | |
| | | | | | Foothill/Eastern Transportation Corridor Agency, California, Toll Road Revenue Bonds, Refunding Series 2013A: | | | | | | |
| | 910 | | | (g) | | 0.000%, 1/15/42 | | 1/31 at 100.00 | | | 1,025,270 | |
| | 6,610 | | | (d) | | 6.000%, 1/15/49, (Pre-refunded 1/15/24) | | 1/24 at 100.00 | | | 6,639,751 | |
| | | | |
| | 4,595 | | | | | Foothill/Eastern Transportation Corridor Agency, California, Toll Road Revenue Bonds, Refunding Term Rate Sub-Series 2013B-1, 3.500%, 1/15/53 | | 7/29 at 100.00 | | | 3,291,869 | |
| | | | |
| | 33,860 | | | | | Golden State Tobacco Securitization Corporation, California, Tobacco Settlement Asset-Backed Bonds, Capital Appreciation Series 2021B-2, 0.000%, 6/01/66 | | 12/31 at 27.75 | | | 2,777,275 | |
| | | | |
| | 1,825 | | | | | Golden State Tobacco Securitization Corporation, California, Tobacco Settlement Asset-Backed Revenue Bonds, Series 2022A-1, 5.000%, 6/01/51 | | 12/31 at 100.00 | | | 1,824,924 | |
| | | | |
| | | | | | Kern Community College District, California, General Obligation Bonds, Safety, Repair & Improvement, Election 2002 Series 2006: | | | | | | |
| | 5,600 | | | | | 0.000%, 11/01/24 - AGM Insured | | No Opt. Call | | | 5,378,842 | |
| | 5,795 | | | | | 0.000%, 11/01/25 - AGM Insured | | No Opt. Call | | | 5,341,385 | |
| | | | |
| | 1,075 | | | | | Lincoln Public Financing Authority, Placer County, California, Twelve Bridges Limited Obligation Revenue Bonds, Refunding Series 2011A, 4.375%, 9/02/25 - AGM Insured | | 12/23 at 100.00 | | | 1,075,482 | |
35
| | |
| NVG | | Nuveen AMT-Free Municipal Credit Income Fund (continued) |
| | Portfolio of Investments October 31, 2023 |
| | | | | | | | | | | | |
Principal Amount (000) | | | | | Description (a) | | Optional Call Provisions (b) | | Value | |
| | | | |
| | | | | | California (continued) | | | | | | |
| | $ 7,575 | | | (g) | | Mount San Antonio Community College District, Los Angeles County, California, General Obligation Bonds, Election of 2008, Series 2013A, 0.000%, 8/01/43 | | 8/35 at 100.00 | | $ | 6,596,455 | |
| | | | |
| | 3,310 | | | | | M-S-R Energy Authority, California, Gas Revenue Bonds, Citigroup Prepay Contracts, Series 2009B, 6.500%, 11/01/39 | | No Opt. Call | | | 3,728,159 | |
| | | | |
| | | | | | Oceanside Unified School District, San Diego County, California, General Obligation Bonds, Capital Appreciation, 2008 Election Series 2009A: | | | | | | |
| | 3,960 | | | | | 0.000%, 8/01/26 - AGC Insured | | No Opt. Call | | | 3,542,038 | |
| | 605 | | | (d) | | 0.000%, 8/01/26 - AGC Insured, (ETM) | | No Opt. Call | | | 545,080 | |
| | 540 | | | (d) | | 0.000%, 8/01/26 - AGC Insured, (ETM) | | No Opt. Call | | | 486,518 | |
| | 530 | | | (d) | | 0.000%, 8/01/26 - AGC Insured, (ETM) | | No Opt. Call | | | 477,509 | |
| | 270 | | | (d) | | 0.000%, 8/01/26 - AGC Insured, (ETM) | | No Opt. Call | | | 243,259 | |
| | 1,715 | | | | | 0.000%, 8/01/28 - AGC Insured | | No Opt. Call | | | 1,412,656 | |
| | 225 | | | (d) | | 0.000%, 8/01/28 - AGC Insured, (ETM) | | No Opt. Call | | | 188,556 | |
| | 170 | | | (d) | | 0.000%, 8/01/28 - AGC Insured, (ETM) | | No Opt. Call | | | 142,464 | |
| | 110 | | | (d) | | 0.000%, 8/01/28 - AGC Insured, (ETM) | | No Opt. Call | | | 92,183 | |
| | | | |
| | 3,905 | | | | | Orange County, California, Special Tax Bonds, Community Facilities District 2015-1 Esencia Village, Series 2015A, 4.250%, 8/15/38 | | 8/25 at 100.00 | | | 3,511,099 | |
| | | | |
| | | | | | Palo Alto, California, Certificates of Participation, Public Safety Building, Series 2021: | | | | | | |
| | 2,560 | | | | | 2.000%, 11/01/42 | | 11/30 at 100.00 | | | 1,491,386 | |
| | 1,940 | | | | | 2.125%, 11/01/44 | | 11/30 at 100.00 | | | 1,114,689 | |
| | | | |
| | 3,700 | | | | | Palomar Pomerado Health, California, General Obligation Bonds, Capital Appreciation, Election of 2004, Series 2007A, 0.000%, 8/01/25 - NPFG Insured | | No Opt. Call | | | 3,433,597 | |
| | | | |
| | 7,935 | | | | | Palomar Pomerado Health, California, General Obligation Bonds, Series 2009A, 7.000%, 8/01/38 - AGC Insured | | 8/29 at 100.00 | | | 8,773,484 | |
| | | | |
| | 500 | | | | | Pasadena Area Community College District, Los Angeles County, California, General Obligation Bonds, 2022 Election Series 2023A-1, 4.000%, 8/01/52 | | 8/32 at 100.00 | | | 430,504 | |
| | | | |
| | 9,145 | | | | | Pittsburg Redevelopment Agency, California, Tax Allocation Bonds, Los Medanos Community Development Project, Series 1999, 0.000%, 8/01/30 - AMBAC Insured | | No Opt. Call | | | 6,751,402 | |
| | | | |
| | | | | | San Clemente, California, Special Tax Revenue Bonds, Community Facilities District 2006-1 Marblehead Coastal, Series 2015: | | | | | | |
| | 480 | | | | | 5.000%, 9/01/40 | | 9/25 at 100.00 | | | 465,459 | |
| | 905 | | | | | 5.000%, 9/01/46 | | 9/25 at 100.00 | | | 857,600 | |
| | | | |
| | 5,125 | | | | | San Diego Unified School District, San Diego County, California, General Obligation Bonds, Dedicated Unlimited Ad Valorem Property Tax, 2018 Election Green Series 2023G-3, 4.000%, 7/01/53 | | 7/33 at 100.00 | | | 4,360,909 | |
| | | | |
| | | | | | San Joaquin Hills Transportation Corridor Agency, Orange County, California, Toll Road Revenue Bonds, Refunding Senior Lien Series 2014A: | | | | | | |
| | 2,680 | | | (d) | | 5.000%, 1/15/44, (Pre-refunded 1/15/25) | | 1/25 at 100.00 | | | 2,722,957 | |
| | 8,275 | | | (d) | | 5.000%, 1/15/50, (Pre-refunded 1/15/25) | | 1/25 at 100.00 | | | 8,407,637 | |
| | | | |
| | 3,400 | | | | | San Mateo County Community College District, California, General Obligation Bonds, Series 2006C, 0.000%, 9/01/30 - NPFG Insured | | No Opt. Call | | | 2,567,621 | |
| | | | |
| | 4,340 | | | | | San Ysidro School District, San Diego County, California, General Obligation Bonds, 1997 Election Series 2012G, 0.000%, 8/01/34 - AGM Insured | | No Opt. Call | | | 2,664,267 | |
| | | | |
| | 5,690 | | | | | San Ysidro School District, San Diego County, California, General Obligation Bonds, Refunding Series 2015, 0.000%, 8/01/42 | | 8/25 at 41.10 | | | 2,117,802 | |
36
| | | | | | | | | | | | |
Principal Amount (000) | | | | | Description (a) | | Optional Call Provisions (b) | | Value | |
| | | | |
| | | | | | California (continued) | | | | | | |
| | | | | | Santa Ana Financing Authority, California, Lease Revenue Bonds, Police Administration and Housing Facility, Series 1994A: | | | | | | |
| | $ 1,265 | | | (d) | | 6.250%, 7/01/24, (ETM) | | No Opt. Call | | $ | 1,284,427 | |
| | 1,265 | | | | | 6.250%, 7/01/24 | | No Opt. Call | | | 1,284,093 | |
| | | | |
| | 605 | | | | | Temecula Public Financing Authority, California, Special Tax Bonds, Community Facilities District 16-01, Series 2017, 6.250%, 9/01/47, 144A | | 9/27 at 100.00 | | | 613,835 | |
| | | | | | Total California | | | | | 325,641,785 | |
| | | | |
| | | | | | Colorado - 10.1% (5.8% of Total Investments) | | | | | | |
| | | | |
| | 4,300 | | | | | Aerotropolis Regional Transportation Authority, Colorado, Special Revenue Bonds, Series 2021, 4.375%, 12/01/52 | | 12/26 at 103.00 | | | 3,104,096 | |
| | | | |
| | 850 | | | | | Aviation Station North Metropolitan District 2, Denver County, Colorado, Limited Tax General Obligation Bonds, Refunding & Improvement Series 2019A, 5.000%, 12/01/39 | | 9/24 at 103.00 | | | 748,322 | |
| | | | |
| | | | | | Base Village Metropolitan District 2, Colorado, General Obligation Bonds, Refunding Series 2016A: | | | | | | |
| | 883 | | | | | 5.500%, 12/01/36 | | 12/23 at 101.00 | | | 854,190 | |
| | 1,175 | | | | | 5.750%, 12/01/46 | | 12/23 at 101.00 | | | 1,100,505 | |
| | | | |
| | 700 | | | | | Brighton Crossing Metropolitan District 4, Colorado, General Obligation Bonds, Limited Tax Convertible to Unlimited Tax, Series 2017A, 5.000%, 12/01/47 | | 12/23 at 102.00 | | | 598,199 | |
| | | | |
| | 3,410 | | | | | Canyons Metropolitan District 5, Douglas County, Colorado, Limited Tax General Obligation and Special Revenue Bonds, Refunding & Improvement Series 2017A, 6.125%, 12/01/47 | | 12/23 at 102.00 | | | 3,068,454 | |
| | | | |
| | 1,690 | | | | | Canyons Metropolitan District 6, Douglas County, Colorado, Limited Tax General Obligation and Special Revenue Bonds, Refunding & Improvement Series 2017A, 6.125%, 12/01/47 | | 12/23 at 102.00 | | | 1,520,729 | |
| | | | |
| | | | | | Centerra Metropolitan District 1, Loveland, Colorado, Special Revenue Bonds, Refunding & Improvement Series 2017: | | | | | | |
| | 1,140 | | | | | 5.000%, 12/01/37, 144A | | 12/23 at 102.00 | | | 1,024,771 | |
| | 5,465 | | | | | 5.000%, 12/01/47, 144A | | 12/23 at 102.00 | | | 4,572,495 | |
| | | | |
| | 4,475 | | | | | Centerra Metropolitan District 1, Loveland, Colorado, Special Revenue Bonds, Refunding & Improvement Series 2020A, 5.000%, 12/01/51 | | 12/25 at 103.00 | | | 3,603,476 | |
| | | | |
| | 195 | | | (d) | | Central Platte Valley Metropolitan District, Colorado, General Obligation Bonds, Refunding Series 2014, 5.000%, 12/01/43, (Pre-refunded 12/01/23) | | 12/23 at 100.00 | | | 195,110 | |
| | | | |
| | 1,200 | | | | | Clear Creek Station Metropolitan District 2, Adams County, Colorado, Limited Tax General Obligation Refunding & Improvement Series 2017A, 5.000%, 12/01/47 | | 12/23 at 102.00 | | | 1,024,181 | |
| | | | |
| | 930 | | | | | Colorado Educational and Cultural Facilities Authority, Charter School Revenue Bonds, Flagstaff Academy Project, Refunding Series 2016, 3.625%, 8/01/46 | | 8/26 at 100.00 | | | 661,252 | |
| | | | |
| | 1,165 | | | | | Colorado Educational and Cultural Facilities Authority, Charter School Revenue Bonds, The Classical Academy Project, Refunding Series 2015A, 5.000%, 12/01/38 | | 12/24 at 100.00 | | | 1,139,855 | |
| | | | |
| | 3,675 | | | | | Colorado Educational and Cultural Facilities Authority, Charter School Revenue Bonds, Vanguard School Project, Refunding & Improvement Series 2016,
3.750%, 6/15/47 | | 6/26 at 100.00 | | | 2,740,753 | |
| | | | |
| | 1,750 | | | | | Colorado Educational and Cultural Facilities Authority, Charter School Revenue Bonds, Weld County School District 6 - Frontier Academy, Refunding & Improvement Series 2016, 3.250%, 6/01/46 | | 6/26 at 100.00 | | | 1,193,579 | |
37
| | |
| NVG | | Nuveen AMT-Free Municipal Credit Income Fund (continued) |
| | Portfolio of Investments October 31, 2023 |
| | | | | | | | | | | | |
Principal Amount (000) | | | | | Description (a) | | Optional Call Provisions (b) | | Value | |
| | | | |
| | | | | | Colorado (continued) | | | | | | |
| | | | | | Colorado Health Facilities Authority, Colorado, Health Facilities Revenue Bonds, The Evangelical Lutheran Good Samaritan Society Project, Refunding Series 2017: | | | | | | |
| | $ 2,460 | | | (d) | | 5.000%, 6/01/42, (Pre-refunded 6/01/27) | | 6/27 at 100.00 | | $ | 2,551,075 | |
| | 23,470 | | | (d) | | 5.000%, 6/01/47, (Pre-refunded 6/01/27) | | 6/27 at 100.00 | | | 24,338,918 | |
| | | | |
| | 5,755 | | | | | Colorado Health Facilities Authority, Colorado, Revenue Bonds, CommonSpirit Health, Series 2019A-2, 4.000%, 8/01/49 | | 8/29 at 100.00 | | | 4,451,898 | |
| | | | |
| | 4,900 | | | | | Colorado Health Facilities Authority, Colorado, Revenue Bonds, Covenant Living Communities & Services, Series 2020A, 4.000%, 12/01/50 | | 12/27 at 103.00 | | | 3,506,695 | |
| | | | |
| | | | | | Colorado Health Facilities Authority, Colorado, Revenue Bonds, Evangelical Lutheran Good Samaritan Society Project, Series 2013A: | | | | | | |
| | 1,410 | | | (d) | | 5.000%, 6/01/32, (Pre-refunded 6/01/25) | | 6/25 at 100.00 | | | 1,432,138 | |
| | 2,000 | | | (d) | | 5.000%, 6/01/33, (Pre-refunded 6/01/25) | | 6/25 at 100.00 | | | 2,031,401 | |
| | 5,870 | | | (d) | | 5.000%, 6/01/40, (Pre-refunded 6/01/25) | | 6/25 at 100.00 | | | 5,962,163 | |
| | 6,920 | | | (d) | | 5.000%, 6/01/45, (Pre-refunded 6/01/25) | | 6/25 at 100.00 | | | 7,028,648 | |
| | | | |
| | 2,035 | | | | | Colorado Health Facilities Authority, Colorado, Revenue Bonds, Frasier Meadows Project, Refunding & Improvement Series 2017A, 5.250%, 5/15/47 | | 5/27 at 100.00 | | | 1,770,068 | |
| | | | |
| | 13,610 | | | | | Colorado Housing and Finance Authority, Multifamily Project Bonds, Class I
Series 2020B, 2.350%, 10/01/43 | | 10/29 at 100.00 | | | 8,350,088 | |
| | | | |
| | 4,105 | | | | | Colorado International Center Metropolitan District 14, Denver, Colorado, Limited Tax General Obligation Bonds, Refunding & Improvement Series 2018, 5.875%, 12/01/46 | | 12/23 at 103.00 | | | 3,689,772 | |
| | | | |
| | 600 | | | | | Copperleaf Metropolitan District 4, Arapahoe County, Colorado, Limited Tax General Obligation Bonds, Convertible to Unlimited Tax Series 2020A, 5.000%, 12/01/49 | | 3/25 at 103.00 | | | 493,532 | |
| | | | |
| | 1,480 | | | | | Cornerstar Metropolitan District, Arapahoe County, Colorado, General Obligation Bonds, Limited Tax Convertible to Unlimited Tax, Refunding Series 2017A, 5.250%, 12/01/47 | | 12/23 at 102.00 | | | 1,291,776 | |
| | | | |
| | 1,262 | | | | | Cornerstar Metropolitan District, Arapahoe County, Colorado, General Obligation Bonds, Limited Tax Convertible to Unlimited Tax, Refunding Series 2017B,
5.250%, 12/01/47 | | 12/23 at 102.00 | | | 1,097,423 | |
| | | | |
| | 500 | | | | | Crystal Crossing Metropolitan District, Colorado, General Obligation Limited Tax Bonds, Refunding Series 2016, 5.250%, 12/01/40 | | 12/25 at 100.00 | | | 456,626 | |
| | | | |
| | 10,640 | | | | | Denver City and County, Colorado, Airport System Revenue Bonds, Subordinate Lien Series 2013B, 5.000%, 11/15/43 | | 12/23 at 100.00 | | | 10,504,477 | |
| | | | |
| | | | | | Denver Urban Renewal Authority, Colorado, Tax Increment Revenue Bonds, 9th and Colorado Urban Redevelopement Area, Series 2018A: | | | | | | |
| | 2,190 | | | | | 5.250%, 12/01/39, 144A | | 12/23 at 103.00 | | | 2,091,461 | |
| | 445 | | | | | 5.250%, 12/01/39, 144A | | 12/23 at 103.00 | | | 424,977 | |
| | | | |
| | 11,700 | | | | | E-470 Public Highway Authority, Colorado, Senior Revenue Bonds, Capital Appreciation Series 2010A, 0.000%, 9/01/41 | | No Opt. Call | | | 4,503,297 | |
| | | | |
| | 6,525 | | | | | E-470 Public Highway Authority, Colorado, Senior Revenue Bonds, Series 1997B, 0.000%, 9/01/26 - NPFG Insured | | No Opt. Call | | | 5,786,988 | |
| | | | |
| | | | | | E-470 Public Highway Authority, Colorado, Senior Revenue Bonds, Series 2000B: | | | | | | |
| | 17,030 | | | | | 0.000%, 9/01/25 - NPFG Insured | | No Opt. Call | | | 15,746,064 | |
| | 10,005 | | | | | 0.000%, 9/01/32 - NPFG Insured | | No Opt. Call | | | 6,765,834 | |
| | 43,090 | | | | | 0.000%, 9/01/33 - NPFG Insured | | No Opt. Call | | | 27,718,168 | |
| | | | |
| | | | | | E-470 Public Highway Authority, Colorado, Toll Revenue Bonds, Series 2004A: | | | | | | |
| | 20,000 | | | | | 0.000%, 9/01/27 - NPFG Insured | | No Opt. Call | | | 17,021,584 | |
38
| | | | | | | | | | | | |
Principal Amount (000) | | | | | Description (a) | | Optional Call Provisions (b) | | Value | |
| | | | |
| | | | | | Colorado (continued) | | | | | | |
| | $ 1,180 | | | | | 0.000%, 9/01/28 - NPFG Insured | | No Opt. Call | | $ | 962,869 | |
| | 7,000 | | | | | 0.000%, 9/01/34 - NPFG Insured | | No Opt. Call | | | 4,273,684 | |
| | | | |
| | 5,575 | | | | | Falcon Area Water and Wastewater Authority (El Paso County, Colorado), Tap Fee Revenue Bonds, Series 2022A, 6.750%, 12/01/34, 144A | | 9/27 at 103.00 | | | 5,175,417 | |
| | | | |
| | 590 | | | | | Foothills Metropolitan District, Fort Collins, Colorado, Special Revenue Bonds,
Series 2014, 6.000%, 12/01/38 | | 12/24 at 100.00 | | | 518,566 | |
| | | | |
| | 500 | | | | | Iron Mountain Metropolitan District 2, Windsor, Weld County, Colorado, Limited Tax General Obligation Bonds, Refunding & Improvement Series 2019A, 5.000%, 12/01/39 | | 12/24 at 103.00 | | | 439,453 | |
| | | | |
| | | | | | Lambertson Farms Metropolitan District 1, Colorado, Revenue Bonds, Refunding & Improvement Series 2015: | | | | | | |
| | 1,005 | | | (c) | | 5.750%, 12/15/46 | | 12/23 at 100.00 | | | 858,540 | |
| | 5,355 | | | (c) | | 6.000%, 12/15/50 | | 12/23 at 100.00 | | | 4,641,145 | |
| | | | |
| | 500 | | | | | Littleton Village Metropolitan District No. 2, Colorado, Limited Tax General Obligation and Special Revenue Bonds, Series 2015, 5.375%, 12/01/45 | | 12/23 at 100.00 | | | 449,534 | |
| | | | |
| | 860 | | | | | Mountain Shadows Metropolitan District, Colorado, General Obligation Limited Tax Bonds, Refunding Series 2016, 5.000%, 12/01/35 | | 12/25 at 100.00 | | | 790,251 | |
| | | | |
| | 5,155 | | | | | North Range Metropolitan District 1, Adams County, Colorado, General Obligation Bonds, Series 2016B, 3.500%, 12/01/45 | | 12/25 at 100.00 | | | 3,746,939 | |
| | | | |
| | | | | | North Range Metropolitan District 2, Adams County, Colorado , Limited Tax General Obligation Bonds, Refunding Special Revenue & Improvement Series 2017A: | | | | | | |
| | 1,000 | | | | | 5.625%, 12/01/37 | | 12/23 at 102.00 | | | 977,624 | |
| | 1,000 | | | | | 5.750%, 12/01/47 | | 12/23 at 102.00 | | | 950,627 | |
| | | | |
| | | | | | Painted Prairie Public Improvement Authority, Aurora, Colorado, Special Revenue Bonds, Series 2019: | | | | | | |
| | 3,380 | | | | | 5.000%, 12/01/39 | | 12/24 at 103.00 | | | 2,983,266 | |
| | 6,900 | | | | | 5.000%, 12/01/49 | | 12/24 at 103.00 | | | 5,644,691 | |
| | | | |
| | | | | | Park 70 Metropolitan District, Aurora, Colorado, General Obligation Bonds, Limited Tax Refunding & Improvement Series 2016: | | | | | | |
| | 660 | | | | | 5.000%, 12/01/36 | | 12/26 at 100.00 | | | 641,924 | |
| | 1,060 | | | | | 5.000%, 12/01/46 | | 12/26 at 100.00 | | | 952,642 | |
| | | | |
| | 660 | | | | | Park Creek Metropolitan District, Colorado, Senior Limited Property Tax Supported Revenue Bonds, Refunding Series 2015A, 5.000%, 12/01/45 | | 12/25 at 100.00 | | | 636,149 | |
| | | | |
| | 1,335 | | | | | Peak Metropolitan District 1, Colorado Springs, El Paso County, Colorado, Limited Tax General Obligation Bonds, Series 2021A, 5.000%, 12/01/41, 144A | | 3/26 at 103.00 | | | 1,130,922 | |
| | | | |
| | 4,000 | | | | | Peak Metropolitan District 3, Colorado Springs, El Paso County, Colorado, Limited Tax General Obligation Convertible Capital Appreciation Bonds, Series 2022A-2,
8.000%, 12/01/52 | | 12/27 at 81.40 | | | 2,141,552 | |
| | | | |
| | 2,760 | | | | | Prairie Center Metopolitan District No. 3, In the City of Brighton, Adams County, Colorado, Limited Property Tax Supported Primary Improvements Revenue Bonds, Refunding Series 2017A, 5.000%, 12/15/41, 144A | | 12/26 at 100.00 | | | 2,507,607 | |
| | | | |
| | 1,500 | | | | | Rampart Range Metropolitan District 5, Lone Tree, Douglas County, Colorado, Limited Tax Supported and Special Revenue Bonds, Series 2021, 4.000%, 12/01/41 | | 10/26 at 102.00 | | | 1,077,815 | |
| | | | |
| | | | | | Reata South Metropolitan District, Douglas County, Colorado, Limited Tax General Obligation Bonds, Refunding Series 2018: | | | | | | |
| | 1,310 | | | | | 5.375%, 12/01/37 | | 12/23 at 103.00 | | | 1,214,036 | |
| | 2,765 | | | | | 5.500%, 12/01/47 | | 12/23 at 103.00 | | | 2,436,677 | |
| | | | |
| | 5,050 | | | | | Regional Transportation District, Colorado, Private Activity Bonds, Denver Transit Partners Eagle P3 Project, Series 2020A, 3.000%, 7/15/37 | | 1/31 at 100.00 | | | 3,886,900 | |
39
| | |
| NVG | | Nuveen AMT-Free Municipal Credit Income Fund (continued) |
| | Portfolio of Investments October 31, 2023 |
| | | | | | | | | | | | |
Principal Amount (000) | | | | | Description (a) | | Optional Call Provisions (b) | | Value | |
| | | | |
| | | | | | Colorado (continued) | | | | | | |
| | | | |
| | $ 1,320 | | | | | Riverwalk Metropolitan District 2, Glendale, Arapahoe County, Colorado, Special Revenue Bonds, Series 2022A, 5.000%, 12/01/52 | | 3/27 at 103.00 | | $ | 1,034,612 | |
| | | | |
| | 930 | | | | | SouthGlenn Metropolitan District, Colorado, Special Revenue Bonds, Refunding
Series 2016, 5.000%, 12/01/46 | | 12/23 at 101.00 | | | 786,887 | |
| | | | |
| | 1,000 | | | | | St. Vrain Lakes Metropolitan District No. 2, Weld County, Colorado, Limited Tax General Obligation Bonds, Series 2017A, 5.000%, 12/01/37 | | 12/23 at 102.00 | | | 914,651 | |
| | | | |
| | | | | | STC Metropolitan District 2, Superior, Boulder County, Colorado, Limited Tax General Obligation and Special Revenue Bonds, Refunding & improvement Series 2019A: | | | | | | |
| | 1,000 | | | | | 5.000%, 12/01/38 | | 12/24 at 103.00 | | | 869,108 | |
| | 570 | | | | | 5.000%, 12/01/49 | | 12/24 at 103.00 | | | 466,960 | |
| | | | |
| | 765 | | | | | Sterling Ranch Community Authority Board, Douglas County, Colorado, Limited Tax Supported District 2, Refunding & Improvement Senior Series 2020A,
4.250%, 12/01/50 | | 12/25 at 102.00 | | | 584,338 | |
| | | | |
| | 2,765 | | | | | Sterling Ranch Metropolitan District 1, El Paso County, Colorado, General Obligation Limited Tax Bonds, Series 2020, 5.125%, 12/01/50 | | 12/25 at 103.00 | | | 2,250,416 | |
| | | | |
| | 450 | | | | | The Village at Dry Creek Metropolitan District No. 2, In the City of Thornton, Adams County, Colorado, Limited Tax General Obligation and Special Revenue Bonds,
Series 2019, 4.375%, 12/01/44 | | 9/24 at 103.00 | | | 346,190 | |
| | | | |
| | 500 | | | | | Transport Metropolitan District 3, In the City of Aurora, Adams County, Colorado, General Obligation Limited Bonds, Convertible Capital Appreciation Series 2021A-2, 5.500%, 12/01/51 | | 3/26 at 103.00 | | | 330,990 | |
| | | | |
| | 900 | | | | | Transport Metropolitan District 3, In the City of Aurora, Adams County, Colorado, General Obligation Limited Bonds, Series 2021A-1, 5.000%, 12/01/51 | | 3/26 at 103.00 | | | 652,585 | |
| | | | |
| | 3,410 | | | | | Vauxmont Metropolitan District, Arvada, Colorado, Limited Tax General Obligation and Special Revenue Bonds, Convertible to Unlimited Tax Refunding Subordinate
Series 2020, 5.000%, 12/01/50 - AGM Insured | | 12/29 at 100.00 | | | 3,342,659 | |
| | | | |
| | 8,260 | | | | | West Globeville Metropolitan District 1, Denver, Colorado, General Obligation Limited Tax Bonds, Series 2022, 6.750%, 12/01/52 | | 12/29 at 103.00 | | | 7,141,648 | |
| | | | | | Total Colorado | | | | | 253,924,912 | |
| | | | |
| | | | | | Connecticut - 5.5% (3.1% of Total Investments) | | | | | | |
| | | | |
| | | | | | Bridgeport, Connecticut, General Obligation Bonds, Series 2014A: | | | | | | |
| | 2,345 | | | | | 5.000%, 7/01/32 - AGM Insured | | 7/24 at 100.00 | | | 2,352,150 | |
| | 1,600 | | | | | 5.000%, 7/01/34 - AGM Insured | | 7/24 at 100.00 | | | 1,603,926 | |
| | | | |
| | 2,800 | | | | | Bridgeport, Connecticut, General Obligation Bonds, Series 2016D, 5.000%, 8/15/41 - AGM Insured | | 8/26 at 100.00 | | | 2,794,592 | |
| | | | |
| | | | | | Bridgeport, Connecticut, General Obligation Bonds, Series 2017A: | | | | | | |
| | 1,470 | | | | | 5.000%, 11/01/36 | | 11/27 at 100.00 | | | 1,491,744 | |
| | 750 | | | | | 5.000%, 11/01/37 | | 11/27 at 100.00 | | | 757,550 | |
| | | | |
| | 1,500 | | | | | Connecticut Health and Educational Facilities Authority, Revenue Bonds, Connecticut Childrens Medical Center and Subsidiaries, Series 2023E, 4.250%, 7/15/53 | | 1/33 at 100.00 | | | 1,203,660 | |
| | | | |
| | 1,100 | | | | | Connecticut Health and Educational Facilities Authority, Revenue Bonds, Duncaster, Inc., Series 2014A, 5.000%, 8/01/44 | | 8/24 at 100.00 | | | 975,107 | |
| | | | |
| | | | | | Connecticut Health and Educational Facilities Authority, Revenue Bonds, Healthcare Facility Expansion Church Home of Hartford Inc. Project, Series 2016A: | | | | | | |
| | 590 | | | | | 5.000%, 9/01/46, 144A | | 9/26 at 100.00 | | | 445,523 | |
| | 2,540 | | | | | 5.000%, 9/01/53, 144A | | 9/26 at 100.00 | | | 1,831,366 | |
40
| | | | | | | | | | | | |
Principal Amount (000) | | | | | Description (a) | | Optional Call Provisions (b) | | Value | |
| | | | |
| | | | | | Connecticut (continued) | | | | | | |
| | $ 3,000 | | | | | Connecticut Health and Educational Facilities Authority, Revenue Bonds, Mary Wade Home Issue, Series 2019A-1, 5.000%, 10/01/54, 144A | | 10/24 at 104.00 | | $ | 2,062,630 | |
| | | | |
| | 1,915 | | | | | Connecticut Health and Educational Facilities Authority, Revenue Bonds, Middlesex Hospital, Series 2015O, 5.000%, 7/01/36 | | 7/25 at 100.00 | | | 1,880,535 | |
| | | | |
| | | | | | Connecticut Health and Educational Facilities Authority, Revenue Bonds, Nuvance Health Series 2019A: | | | | | | |
| | 2,770 | | | | | 4.000%, 7/01/41 | | 7/29 at 100.00 | | | 2,203,133 | |
| | 2,000 | | | | | 4.000%, 7/01/49 | | 7/29 at 100.00 | | | 1,454,652 | |
| | | | |
| | | | | | Connecticut Health and Educational Facilities Authority, Revenue Bonds, Quinnipiac University, Refunding Series 2015L: | | | | | | |
| | 6,000 | | | | | 4.125%, 7/01/41 | | 7/25 at 100.00 | | | 5,270,529 | |
| | 5,665 | | | | | 5.000%, 7/01/45 | | 7/25 at 100.00 | | | 5,522,764 | |
| | | | |
| | | | | | Connecticut Health and Educational Facilities Authority, Revenue Bonds, Quinnipiac University, Series 2016M: | | | | | | |
| | 500 | | | | | 5.000%, 7/01/34 | | 7/26 at 100.00 | | | 503,217 | |
| | 1,250 | | | | | 5.000%, 7/01/36 | | 7/26 at 100.00 | | | 1,251,305 | |
| | | | |
| | 5,145 | | | | | Connecticut Health and Educational Facilities Authority, Revenue Bonds, Sacred Heart University, Series 2017I-1, 5.000%, 7/01/42 | | 7/27 at 100.00 | | | 5,016,158 | |
| | | | |
| | 4,025 | | | | | Connecticut Health and Educational Facilities Authority, Revenue Bonds, Stamford Hospital, Series 2016K, 4.000%, 7/01/46 | | 7/26 at 100.00 | | | 3,181,212 | |
| | | | |
| | 2,250 | | | | | Connecticut Health and Educational Facilities Authority, Revenue Bonds, University of New Haven, Series 2018K-1, 5.000%, 7/01/38 | | 7/28 at 100.00 | | | 2,049,209 | |
| | | | |
| | | | | | Connecticut Health and Educational Facilities Authority, Revenue Bonds, Yale-New Haven Health Issue, Series 2014E: | | | | | | |
| | 2,610 | | | | | 5.000%, 7/01/32 | | 7/24 at 100.00 | | | 2,617,788 | |
| | 2,740 | | | | | 5.000%, 7/01/33 | | 7/24 at 100.00 | | | 2,748,035 | |
| | 900 | | | | | 5.000%, 7/01/34 | | 7/24 at 100.00 | | | 902,442 | |
| | | | |
| | | | | | Connecticut Housing Finance Authority, Housing Mortgage Finance Program Bonds, Social Series 2023B: | | | | | | |
| | 2,775 | | | | | 4.500%, 11/15/43 | | 5/32 at 100.00 | | | 2,558,066 | |
| | 13,425 | | | (e) | | 4.650%, 11/15/48, (UB) | | 5/32 at 100.00 | | | 11,983,845 | |
| | | | |
| | 3,500 | | | | | Connecticut State, General Obligation Bonds, Series 2014F, 5.000%, 11/15/34 | | 11/24 at 100.00 | | | 3,491,265 | |
| | | | |
| | 2,630 | | | | | Connecticut State, General Obligation Bonds, Series 2015F, 5.000%, 11/15/34 | | 11/25 at 100.00 | | | 2,649,186 | |
| | | | |
| | 3,750 | | | | | Connecticut State, General Obligation Bonds, Series 2017A, 5.000%, 4/15/35 | | 4/27 at 100.00 | | | 3,850,761 | |
| | | | |
| | | | | | Connecticut State, General Obligation Bonds, Series 2018A: | | | | | | |
| | 3,500 | | | | | 5.000%, 4/15/35 | | 4/28 at 100.00 | | | 3,626,096 | |
| | 5,000 | | | | | 5.000%, 4/15/38 | | 4/28 at 100.00 | | | 5,090,065 | |
| | | | |
| | 3,855 | | | (d) | | Connecticut State, Special Tax Obligation Bonds, Transportation Infrastructure Purposes Series 2013A, 5.000%, 10/01/33, (Pre-refunded 1/29/24) | | 1/24 at 100.00 | | | 3,864,520 | |
| | | | |
| | 1,380 | | | | | Connecticut State, Special Tax Obligation Bonds, Transportation Infrastructure Purposes Series 2015A, 5.000%, 8/01/33 | | 8/25 at 100.00 | | | 1,389,808 | |
| | | | |
| | | | | | Connecticut State, Special Tax Obligation Bonds, Transportation Infrastructure Purposes Series 2016A: | | | | | | |
| | 5,300 | | | | | 5.000%, 9/01/33 | | 9/26 at 100.00 | | | 5,414,752 | |
| | 1,075 | | | | | 5.000%, 9/01/34 | | 9/26 at 100.00 | | | 1,094,841 | |
| | | | |
| | 3,500 | | | | | Connecticut State, Special Tax Obligation Bonds, Transportation Infrastructure Purposes, Series 2014A, 5.000%, 9/01/33 | | 9/24 at 100.00 | | | 3,504,587 | |
41
| | |
| NVG | | Nuveen AMT-Free Municipal Credit Income Fund (continued) |
| | Portfolio of Investments October 31, 2023 |
| | | | | | | | | | | | |
Principal Amount (000) | | | | | Description (a) | | Optional Call Provisions (b) | | Value | |
| | | | |
| | | | | | Connecticut (continued) | | | | | | |
| | | | | | Greater New Haven Water Pollution Control Authority, Connecticut, Regional Wastewater System Revenue Bonds, Refunding Series 2014B: | | | | | | |
| | $ 500 | | | (d) | | 5.000%, 8/15/30, (Pre-refunded 8/15/24) | | 8/24 at 100.00 | | $ | 504,619 | |
| | 1,000 | | | (d) | | 5.000%, 8/15/31, (Pre-refunded 8/15/24) | | 8/24 at 100.00 | | | 1,009,237 | |
| | | | |
| | 55 | | | | | Greater New Haven Water Pollution Control Authority, Connecticut, Regional Wastewater System Revenue Bonds, Series 2005A, 5.000%, 8/15/35 - NPFG Insured | | 12/23 at 100.00 | | | 55,002 | |
| | | | |
| | 225 | | | | | Hamden, Connecticut, General Obligation Bonds, Series 2016, 5.000%, 8/15/32 - BAM Insured | | 8/24 at 100.00 | | | 225,818 | |
| | | | |
| | 2,315 | | | | | Harbor Point Infrastructure Improvement District, Connecticut, Special Obligation Revenue Bonds, Harbor Point Project, Refunding Series 2017, 5.000%, 4/01/39, 144A | | 4/27 at 100.00 | | | 2,193,321 | |
| | | | |
| | 10,015 | | | (d) | | Hartford County Metropolitan District, Connecticut, Clean Water Project Revenue Bonds, Refunding Green Bond Series 2014A, 5.000%, 11/01/42, (Pre-refunded 11/01/24) | | 11/24 at 100.00 | | | 10,133,981 | |
| | | | |
| | 2,285 | | | | | Hartford County Metropolitan District, Connecticut, General Obligation Bonds, Series 2018, 5.000%, 7/15/36 | | 7/28 at 100.00 | | | 2,361,967 | |
| | | | |
| | 1,055 | | | | | Milford, Connecticut, General Obligation Bonds, Series 2018, 4.000%, 11/01/37 | | 11/24 at 100.00 | | | 979,144 | |
| | | | |
| | 1,550 | | | | | New Haven, Connecticut, General Obligation Bonds, Refunding Series 2016A, 5.000%, 8/15/35 - AGM Insured | | 8/26 at 100.00 | | | 1,571,078 | |
| | | | |
| | 985 | | | (d) | | New Haven, Connecticut, General Obligation Bonds, Series 2014A,
5.000%, 8/01/33, (Pre-refunded 8/01/24) - AGM Insured | | 8/24 at 100.00 | | | 993,288 | |
| | | | |
| | | | | | New Haven, Connecticut, General Obligation Bonds, Series 2015: | | | | | | |
| | 790 | | | | | 5.000%, 9/01/32 - AGM Insured | | 9/25 at 100.00 | | | 800,058 | |
| | 1,620 | | | | | 5.000%, 9/01/33 - AGM Insured | | 9/25 at 100.00 | | | 1,640,075 | |
| | 500 | | | | | 5.000%, 9/01/35 - AGM Insured | | 9/25 at 100.00 | | | 504,516 | |
| | | | |
| | | | | | New Haven, Connecticut, General Obligation Bonds, Series 2017A: | | | | | | |
| | 1,045 | | | | | 5.000%, 8/01/35 | | 8/27 at 100.00 | | | 1,057,499 | |
| | 1,425 | | | | | 5.000%, 8/01/36 | | 8/27 at 100.00 | | | 1,436,194 | |
| | | | |
| | 900 | | | | | North Haven, Connecticut, General Obligation Bonds, Series 2006, 5.000%, 7/15/24 | | No Opt. Call | | | 907,983 | |
| | | | |
| | 795 | | | (d) | | South Central Connecticut Regional Water Authority Water System Revenue Bonds, Thirtieth Series 2014A, 5.000%, 8/01/44, (Pre-refunded 8/01/24) | | 8/24 at 100.00 | | | 801,982 | |
| | | | |
| | 2,220 | | | | | South Central Connecticut Regional Water Authority, Water System Revenue Bonds, Refunding Thirty-Second Series 2016B, 5.000%, 8/01/37 | | 8/26 at 100.00 | | | 2,250,767 | |
| | | | |
| | 500 | | | | | Stamford, Connecticut, Water Pollution Control System and Facility Revenue Bonds, Series 2013A, 5.250%, 8/15/43 | | 12/23 at 100.00 | | | 500,183 | |
| | | | |
| | 1,285 | | | | | Steel Point Infrastructure Improvement District, Connecticut, Special Obligation Revenue Bonds, Steelpointe Harbor Project, Series 2021, 4.000%, 4/01/51 | | 4/30 at 100.00 | | | 939,955 | |
| | | | |
| | 1,005 | | | | | Town of Hamden, Connecticut, General Obligation Bonds, Refunding Series 2018A, 5.000%, 8/15/30 - BAM Insured | | 8/28 at 100.00 | | | 1,029,613 | |
| | | | |
| | 2,500 | | | | | University of Connecticut, General Obligation Bonds, Series 2013A,
5.000%, 8/15/32 | | 12/23 at 100.00 | | | 2,500,997 | |
| | | | |
| | 760 | | | | | University of Connecticut, General Obligation Bonds, Series 2014A,
5.000%, 2/15/31 | | 2/24 at 100.00 | | | 761,050 | |
| | | | |
| | 2,250 | | | | | University of Connecticut, General Obligation Bonds, Series 2015A,
5.000%, 3/15/31 | | 3/26 at 100.00 | | | 2,299,313 | |
42
| | | | | | | | | | | | |
Principal Amount (000) | | | | | Description (a) | | Optional Call Provisions (b) | | Value | |
| | | | |
| | | | | | Connecticut (continued) | | | | | | |
| | | | |
| | | | | | Waterbury, Connecticut, General Obligation Bonds, Lot A Series 2015: | | | | | | |
| | $ 445 | | | | | 5.000%, 8/01/30 - BAM Insured | | 8/25 at 100.00 | | $ | 453,379 | |
| | 390 | | | | | 5.000%, 8/01/31 - BAM Insured | | 8/25 at 100.00 | | | 397,347 | |
| | 610 | | | | | 5.000%, 8/01/32 - BAM Insured | | 8/25 at 100.00 | | | 621,456 | |
| | 445 | | | | | 5.000%, 8/01/33 - BAM Insured | | 8/25 at 100.00 | | | 453,217 | |
| | 445 | | | | | 5.000%, 8/01/34 - BAM Insured | | 8/25 at 100.00 | | | 453,073 | |
| | | | | | Total Connecticut | | | | | 138,473,131 | |
| | | | |
| | | | | | Delaware - 0.1% (0.1% of Total Investments) | | | | | | |
| | | | |
| | | | | | Kent County, Delaware, Student Housing & Dining Facility Revenue Bonds, Collegiate Housing Foundation - Dover LLC Delaware State University Project, Series 2018A: | | | | | | |
| | 3,010 | | | | | 5.000%, 7/01/48 | | 1/28 at 100.00 | | | 2,657,142 | |
| | 1,000 | | | | | 5.000%, 7/01/58 | | 1/28 at 100.00 | | | 848,718 | |
| | | | | | Total Delaware | | | | | 3,505,860 | |
| | | | |
| | | | | | District of Columbia - 3.9% (2.2% of Total Investments) | | | | | | |
| | | | |
| | 3,780 | | | | | District of Columbia Student Dormitory Revenue Bonds, Provident Group - Howard Properties LLC Issue, Series 2013, 5.000%, 10/01/45 | | 11/23 at 100.00 | | | 3,252,267 | |
| | | | |
| | 186,000 | | | | | District of Columbia Tobacco Settlement Corporation, Tobacco Settlement Asset-Backed Bonds, Series 2006A, 0.000%, 6/15/46 | | 12/23 at 24.98 | | | 39,918,669 | |
| | | | |
| | 1,500 | | | | | District of Columbia, Washington, D.C., Revenue Bonds, Ingleside at Rock Creek Project, Series 2017A, 5.000%, 7/01/42 | | 7/24 at 103.00 | | | 1,220,881 | |
| | | | |
| | | | | | Metropolitan Washington Airports Authority, District of Columbia, Dulles Toll Road Revenue Bonds, Dulles Metrorail & Capital Improvement Projects, Refunding Second Senior Lien Series 2022A: | | | | | | |
| | 9,095 | | | | | 4.000%, 10/01/52 - AGM Insured | | 10/31 at 100.00 | | | 7,548,141 | |
| | 17,595 | | | | | 2.750%, 10/01/53 - AGM Insured | | 10/31 at 100.00 | | | 10,270,794 | |
| | 22,015 | | | | | 3.000%, 10/01/53 - AGM Insured | | 10/31 at 100.00 | | | 13,909,889 | |
| | | | |
| | 11,000 | | | (d) | | Metropolitan Washington Airports Authority, District of Columbia, Dulles Toll Road Revenue Bonds, Dulles Metrorail & Capital improvement Projects, Second Senior Lien Series 2009C, 6.500%, 10/01/41, (Pre-refunded 10/01/26) - AGC Insured | | 10/26 at 100.00 | | | 11,805,561 | |
| | | | |
| | 10,000 | | | | | Metropolitan Washington Airports Authority, District of Columbia, Dulles Toll Road Revenue Bonds, Dulles Metrorail Capital Appreciation, Second Senior Lien
Series 2010B, 6.500%, 10/01/44 | | 10/28 at 100.00 | | | 10,552,364 | |
| | | | | | Total District of Columbia | | | | | 98,478,566 | |
| | | | |
| | | | | | Florida - 4.4% (2.5% of Total Investments) | | | | | | |
| | | | |
| | 990 | | | | | Bexley Community Development District, Pasco County, Florida, Special Assessment Revenue Bonds, Series 2016, 4.700%, 5/01/36 | | 5/26 at 100.00 | | | 904,227 | |
| | | | |
| | 1,000 | | | | | Capital Trust Agency, Florida, Educational Facilities Lease Revenue Bonds, Franklin Academy Projects, Series 2020, 5.000%, 12/15/50, 144A | | 7/26 at 100.00 | | | 769,523 | |
| | | | |
| | | | | | Capital Trust Agency, Florida, Revenue Bonds, Babcock Neighborhood School
Inc, Series 2018: | | | | | | |
| | 1,290 | | | | | 6.100%, 8/15/38, 144A | | 8/28 at 100.00 | | | 1,255,603 | |
| | 1,045 | | | | | 6.200%, 8/15/48, 144A | | 8/28 at 100.00 | | | 984,512 | |
| | | | |
| | | | | | Capital Trust Agency, Florida, Revenue Bonds, Babcock Neighborhood School
Inc, Series 2021: | | | | | | |
| | 1,290 | | | | | 4.000%, 8/15/51, 144A | | 8/28 at 100.00 | | | 843,904 | |
| | 1,250 | | | | | 4.250%, 8/15/61, 144A | | 8/28 at 100.00 | | | 809,144 | |
| | | | |
| | | | | | Capital Trust Agency, Florida, Revenue Bonds, Odyssey Charter School Project,
Series 2017A: | | | | | | |
| | 1,065 | | | | | 5.375%, 7/01/37, 144A | | 7/27 at 100.00 | | | 992,149 | |
43
| | |
| NVG | | Nuveen AMT-Free Municipal Credit Income Fund (continued) |
| | Portfolio of Investments October 31, 2023 |
| | | | | | | | | | | | |
Principal Amount (000) | | | | | Description (a) | | Optional Call Provisions (b) | | Value | |
| | | | |
| | | | | | Florida (continued) | | | | | | |
| | $ 1,470 | | | | | 5.500%, 7/01/47, 144A | | 7/27 at 100.00 | | $ | 1,298,313 | |
| | | | |
| | 3,788 | | | (c) | | Capital Trust Agency, Florida, Revenue Bonds, Provision CARES Proton Therapy Center, Orlando Project, Series 2018, 7.500%, 6/01/48, 144A | | 6/28 at 100.00 | | | 539,794 | |
| | | | |
| | | | | | Capital Trust Agency, Florida, Revenue Bonds, Renaissance Charter School Project, Series 2017A: | | | | | | |
| | 6,050 | | | | | 5.125%, 6/15/37, 144A | | 6/27 at 100.00 | | | 5,572,276 | |
| | 1,885 | | | | | 5.250%, 6/15/47, 144A | | 6/27 at 100.00 | | | 1,628,793 | |
| | | | |
| | 880 | | | | | Capital Trust Agency, Florida, Revenue Bonds, Viera Charter School Project,
Series 2017A, 5.000%, 10/15/37, 144A | | 10/27 at 100.00 | | | 799,915 | |
| | | | |
| | 735 | | | | | Capital Trust Agency, Florida, Revenue Bonds, Viera Charter School Project,
Series 2019A, 5.000%, 10/15/49, 144A | | 10/27 at 100.00 | | | 604,740 | |
| | | | |
| | 4,670 | | | | | City of Miami Beach, Florida, Stormwater Revenue Bonds, Series 2015,
5.000%, 9/01/41 | | 9/25 at 100.00 | | | 4,688,849 | |
| | | | |
| | 785 | | | | | Cityplace Community Development District, Florida, Special Assessement and Revenue Bonds, Refunding Series 2012, 5.000%, 5/01/26 | | No Opt. Call | | | 789,538 | |
| | | | |
| | | | | | Creekside at Twin Creeks Community Development District, Florida, Special Assessment Bonds, Area 1 Project, Series 2016A-1: | | | | | | |
| | 240 | | | | | 5.250%, 11/01/37 | | 11/28 at 100.00 | | | 228,838 | |
| | 305 | | | | | 5.600%, 11/01/46 | | 11/28 at 100.00 | | | 285,267 | |
| | | | |
| | | | | | Downtown Doral Community Development District, Florida, Special Assessment Bonds, Series 2015: | | | | | | |
| | 280 | | | | | 5.250%, 5/01/35 | | 5/26 at 100.00 | | | 270,374 | |
| | 315 | | | | | 5.300%, 5/01/36 | | 5/26 at 100.00 | | | 304,391 | |
| | 475 | | | | | 5.500%, 5/01/45 | | 5/26 at 100.00 | | | 441,452 | |
| | 655 | | | | | 5.500%, 5/01/46 | | 5/26 at 100.00 | | | 605,115 | |
| | | | |
| | | | | | Florida Development Finance Corporation, Educational Facilities Revenue Bonds, Classical Preparatory Incorporated Project, Series 2017A: | | | | | | |
| | 255 | | | | | 6.000%, 6/15/37, 144A | | 6/26 at 100.00 | | | 249,190 | |
| | 665 | | | | | 6.125%, 6/15/46, 144A | | 6/26 at 100.00 | | | 624,393 | |
| | | | |
| | 415 | | | | | Florida Development Finance Corporation, Educational Facilities Revenue Bonds, Classical Preparatory Incorporated Project, Series 2018A, 6.000%, 6/15/37, 144A | | 6/26 at 100.00 | | | 405,544 | |
| | | | |
| | | | | | Florida Development Finance Corporation, Educational Facilities Revenue Bonds, Downtown Doral Charter Upper School Project, Series 2017C: | | | | | | |
| | 2,375 | | | | | 5.650%, 7/01/37, 144A | | 7/27 at 101.00 | | | 2,245,111 | |
| | 3,735 | | | | | 5.750%, 7/01/47, 144A | | 7/27 at 101.00 | | | 3,377,696 | |
| | | | |
| | | | | | Florida Development Finance Corporation, Educational Facilities Revenue Bonds, Florida Charter Foundation Inc. Projects, Series 2016A: | | | | | | |
| | 2,075 | | | | | 4.750%, 7/15/36, 144A | | 7/26 at 100.00 | | | 1,855,050 | |
| | 1,335 | | | | | 5.000%, 7/15/46, 144A | | 7/26 at 100.00 | | | 1,109,931 | |
| | | | |
| | | | | | Florida Development Finance Corporation, Educational Facilities Revenue Bonds, Mater Academy Projects, Series 2020A: | | | | | | |
| | 4,330 | | | | | 5.000%, 6/15/50 | | 6/27 at 100.00 | | | 3,876,651 | |
| | 3,405 | | | | | 5.000%, 6/15/55 | | 6/27 at 100.00 | | | 2,998,164 | |
| | | | |
| | | | | | Florida Development Finance Corporation, Educational Facilities Revenue Bonds, Renaissance Charter School Income Projects, Series 2015A: | | | | | | |
| | 3,090 | | | | | 6.000%, 6/15/35, 144A | | 6/25 at 100.00 | | | 3,029,093 | |
| | 3,450 | | | | | 6.125%, 6/15/46, 144A | | 6/25 at 100.00 | | | 3,216,494 | |
| | | | |
| | 550 | | | | | Florida Development Finance Corporation, Educational Facilities Revenue Bonds, Renaissance Charter School, Inc. Projects, Series 2014A, 6.125%, 6/15/44, 144A | | 6/24 at 100.00 | | | 523,069 | |
44
| | | | | | | | | | | | |
Principal Amount (000) | | | | | Description (a) | | Optional Call Provisions (b) | | Value | |
| | | | |
| | | | | | Florida (continued) | | | | | | |
| | $ 4,380 | | | | | Florida Development Finance Corporation, Educational Facilities Revenue Bonds, Southwest Charter Foundation Inc Projects, Series 2017A, 6.125%, 6/15/47, 144A | | 6/27 at 100.00 | | $ | 3,844,149 | |
| | | | |
| | | | | | Florida Development Finance Corporation, Educational Facilities Revenue Bonds, The Florida Charter Educational Foundation Inc. Projects, Series 2016A: | | | | | | |
| | 1,485 | | | | | 6.250%, 6/15/36, 144A | | 6/26 at 100.00 | | | 1,490,902 | |
| | 4,350 | | | | | 6.375%, 6/15/46, 144A | | 6/26 at 100.00 | | | 4,205,731 | |
| | | | |
| | 5,490 | | | | | Florida Housing Finance Corporation, Homeowner Mortgage Revenue Bonds, Social Series 2021-1, 2.150%, 7/01/51 | | 1/30 at 100.00 | | | 3,148,562 | |
| | | | |
| | 1,435 | | | | | Grand Bay at Doral Community Development District, Miami-Dade County, Florida, Special Assessment Bonds, South Parcel Assessment Area Project, Series 2016, 4.750%, 5/01/36 | | 5/26 at 100.00 | | | 1,320,656 | |
| | | | |
| | 2,215 | | | | | Jacksonville, Florida, Educational Facilities Revenue Bonds, Jacksonville University Project, Series 2018B, 5.000%, 6/01/53, 144A | | 6/28 at 100.00 | | | 1,763,779 | |
| | | | |
| | 625 | | | | | Lakewood Ranch Stewardship District, Florida, Special Assessment Revenue Bonds, Del Webb Project, Series 2017, 5.000%, 5/01/37, 144A | | 5/27 at 100.00 | | | 590,376 | |
| | | | |
| | 1,000 | | | | | Manatee County, Florida, Public Utilities Revenue Bonds, Improvement and Refunding Series 2023, 4.000%, 10/01/53 | | 4/33 at 100.00 | | | 826,726 | |
| | | | |
| | 4,140 | | | (d) | | Martin County Health Facilities Authority, Florida, Hospital Revenue Bonds, Martin Memorial Medical Center, Series 2015, 5.000%, 11/15/45, (Pre-refunded 11/15/24) | | 11/24 at 100.00 | | | 4,174,223 | |
| | | | |
| | | | | | Miami Dade County Industrial Development Authority, Florida, Educational Facilities Revenue Bonds, South Florida Autism Charter School Project, Series 2017: | | | | | | |
| | 1,080 | | | | | 5.875%, 7/01/37, 144A | | 7/27 at 100.00 | | | 1,026,870 | |
| | 1,920 | | | | | 6.000%, 7/01/47, 144A | | 7/27 at 100.00 | | | 1,750,797 | |
| | | | |
| | 5,710 | | | | | Miami Dade County, Florida, Rickenbacker Causeway Revenue Bonds,
Series 2014, 5.000%, 10/01/43 | | 10/24 at 100.00 | | | 5,398,473 | |
| | | | |
| | 2,130 | | | | | Miami Health Facilities Authority, Florida, Health Facilities Revenue Bonds, Miami Jewish Health System Inc. Project, Series 2017, 5.125%, 7/01/46 | | 7/27 at 100.00 | | | 1,595,654 | |
| | | | |
| | 5,000 | | | | | Miami-Dade County Expressway Authority, Florida, Toll System Revenue Bonds,
Series 2014A, 5.000%, 7/01/39 | | 7/24 at 100.00 | | | 4,853,009 | |
| | | | |
| | 4,785 | | | | | Northern Palm Beach County Improvement District, Florida, Water Control and Improvement Bonds, Development Unit 53, Series 2015, 5.350%, 8/01/35 | | 8/26 at 100.00 | | | 4,730,976 | |
| | | | |
| | 5,070 | | | | | Orange County Health Facilities Authority, Florida, Hospital Revenue Bonds, Orlando Health Obligated Group, Inc., Series 2022, 4.000%, 10/01/52 | | 4/32 at 100.00 | | | 4,082,113 | |
| | | | |
| | | | | | Osceola County, Florida, Transportation Revenue Bonds, Osceola Parkway, Refunding & Improvement Series 2019A-1: | | | | | | |
| | 2,890 | | | | | 5.000%, 10/01/49 | | 10/29 at 100.00 | | | 2,628,517 | |
| | 3,345 | | | | | 4.000%, 10/01/54 | | 10/29 at 100.00 | | | 2,495,560 | |
| | | | |
| | 2,000 | | | | | Palm Beach County Health Facilities Authority, Florida, Hospital Revenue Bonds, Jupiter Medical Center, Series 2022, 5.000%, 11/01/47 | | 11/32 at 100.00 | | | 1,821,469 | |
| | | | |
| | 825 | | | | | Reunion West Community Development District, Florida, Special Assessment Bonds, Area 3 Project, Series 2016, 5.000%, 11/01/46 | | 11/26 at 100.00 | | | 731,100 | |
| | | | |
| | 5,000 | | | | | Sarasota County Public Hospital District, Florida, Hospital Revenue Bonds, Sarasota Memorial Hospital Project, Series 2018, 4.000%, 7/01/48 | | 7/28 at 100.00 | | | 4,121,517 | |
| | | | |
| | 220 | | | | | Seminole County Industrial Development Authority, Florida, Educational Facilities Revenue Bonds, Galileo Schools for Gifted Learning, Series 2021A,
4.000%, 6/15/51, 144A | | 6/31 at 100.00 | | | 145,915 | |
45
| | |
| NVG | | Nuveen AMT-Free Municipal Credit Income Fund (continued) |
| | Portfolio of Investments October 31, 2023 |
| | | | | | | | | | | | |
Principal Amount (000) | | | | | Description (a) | | Optional Call Provisions (b) | | Value | |
| | | | |
| | | | | | Florida (continued) | | | | | | |
| | | | | | Six Mile Creek Community Development District, Florida, Capital | | | | | | |
| | | | |
| | | | | | Improvement Revenue Bonds, Assessment Area 2, Series 2016: | | | | | | |
| | $ 145 | | | | | 4.750%, 11/01/28 | | 11/27 at 100.00 | | $ | 142,786 | |
| | 370 | | | | | 5.375%, 11/01/36 | | 11/27 at 100.00 | | | 358,076 | |
| | | | |
| | 905 | | | | | South Fork III Community Development District, Florida, Special Assessment Revenue Bonds, Refunding Series 2016, 5.375%, 5/01/37 | | 5/27 at 100.00 | | | 876,250 | |
| | | | |
| | 185 | | | (d) | | Tampa, Florida, Healthcare System Revenue Bonds, Allegany Health System - St. Joseph’s Hospital, Series 1993, 5.125%, 12/01/23 - NPFG Insured, (ETM) | | 12/23 at 100.00 | | | 185,168 | |
| | | | |
| | 5,015 | | | | | Volusia County Educational Facilities Authority, Florida, Revenue Bonds, Stetson University Inc. Project, Series 2015, 5.000%, 6/01/40 | | 6/25 at 100.00 | | | 4,953,559 | |
| | | | | | Total Florida | | | | | 111,390,016 | |
| | | | |
| | | | | | Georgia - 4.6% (2.7% of Total Investments) | | | | | | |
| | | | |
| | | | | | Atlanta, Georgia, Airport General Revenue Bonds, Green Series 2023B-1: | | | | | | |
| | 2,500 | | | | | 5.000%, 7/01/48 | | 7/33 at 100.00 | | | 2,522,734 | |
| | 4,250 | | | | | 5.000%, 7/01/53 | | 7/33 at 100.00 | | | 4,265,421 | |
| | | | |
| | 675 | | | | | Atlanta, Georgia, Airport General Revenue Bonds, Series 2023B-2,
4.250%, 7/01/48 | | 7/33 at 100.00 | | | 602,784 | |
| | | | |
| | 4,000 | | | | | Brookhaven Urban Redevelopment Agency, Georgia, Revenue Bonds,
Series 2023A, 4.000%, 7/01/48 | | 7/33 at 100.00 | | | 3,441,463 | |
| | | | |
| | 17,085 | | | | | Burke County Development Authority, Georgia, Pollution Control Revenue Bonds, Georgia Transmission Corporation Vogtle Project, Series 2012, 2.750%, 1/01/52 | | 5/31 at 100.00 | | | 9,745,067 | |
| | | | |
| | 5,775 | | | | | Burke County Development Authority, Georgia, Pollution Control Revenue Bonds, Oglethorpe Power Corporation Vogtle Project, Series 2017C, 4.125%, 11/01/45 | | 2/28 at 100.00 | | | 4,523,695 | |
| | | | |
| | 11,280 | | | | | Burke County Development Authority, Georgia, Pollution Control Revenue Bonds, Oglethorpe Power Corporation Vogtle Project, Series 2017D, 4.125%, 11/01/45 | | 2/28 at 100.00 | | | 8,835,893 | |
| | | | |
| | | | | | Columbia County Hospital Authority, Georgia, Revenue Anticipation Certificates, WellStar Health System, Inc. Project, Series 2023B: | | | | | | |
| | 1,000 | | | | | 5.000%, 4/01/48 - AGM Insured, (WI/DD) | | 4/33 at 100.00 | | | 979,759 | |
| | 11,100 | | | | | 5.125%, 4/01/48, (UB), (WI/DD) | | 4/33 at 100.00 | | | 10,855,639 | |
| | | | |
| | 15,305 | | | (d) | | Gainesville and Hall County Hospital Authority, Georgia, Revenue Anticipation Certificates, Northeast Georgia Health Services Inc., Series 2014A,
5.500%, 8/15/54, (Pre-refunded 2/15/25) | | 2/25 at 100.00 | | | 15,614,127 | |
| | | | |
| | | | | | Georgia Housing and Finance Authority, Single Family Mortgage Bonds,
Series 2018A: | | | | | | |
| | 2,680 | | | | | 3.950%, 12/01/43 | | 6/27 at 100.00 | | | 2,473,359 | |
| | 4,085 | | | | | 4.000%, 12/01/48 | | 6/27 at 100.00 | | | 3,636,917 | |
| | | | |
| | | | | | Georgia Housing and Finance Authority, Single Family Mortgage Bonds,
Series 2023A: | | | | | | |
| | 2,215 | | | (e) | | 4.350%, 12/01/43, (UB) | | 6/32 at 100.00 | | | 2,008,129 | |
| | 3,000 | | | (e) | | 4.550%, 12/01/48, (UB) | | 6/32 at 100.00 | | | 2,603,733 | |
| | | | |
| | 2,930 | | | | | Georgia Municipal Electric Authority, Plant Vogtle Units 3 & 4 Project M Bonds, Series 2019A, 5.000%, 1/01/56 | | 7/28 at 100.00 | | | 2,738,576 | |
| | | | |
| | 1,300 | | | | | Macon-Bibb County Urban Development Authority, Georgia, Revenue Bonds, Academy for Classical Education, Series 2017, 5.750%, 6/15/37, 144A | | 6/27 at 100.00 | | | 1,258,213 | |
| | | | |
| | 10,000 | | | | | Main Street Natural Gas Inc., Georgia, Gas Supply Revenue Bonds, Series 2022C, 4.000%, 8/01/52, (Mandatory Put 11/01/27), 144A | | 5/27 at 100.81 | | | 9,315,477 | |
46
| | | | | | | | | | | | |
Principal Amount (000) | | | | | Description (a) | | Optional Call Provisions (b) | | Value | |
| | | | |
| | | | | | Georgia (continued) | | | | | | |
| | $ 5,000 | | | | | Main Street Natural Gas Inc., Georgia, Gas Supply Revenue Bonds, Series 2023E-1, 5.000%, 12/01/53, (Mandatory Put 6/01/31) | | 3/31 at 100.08 | | $ | 4,965,137 | |
| | | | |
| | 4,000 | | | | | Marietta Development Authority, Georgia, University Facilities Revenue Bonds, Life University, Inc. Project, Refunding Series 2017A, 5.000%, 11/01/47, 144A | | 11/27 at 100.00 | | | 3,142,124 | |
| | | | |
| | 10,000 | | | | | Municipal Electric Authority of Georgia, Plant Vogtle Units 3 & 4 Project J Bonds, Series 2015A, 5.000%, 7/01/60 | | 7/25 at 100.00 | | | 9,256,725 | |
| | | | |
| | 5,630 | | | | | Municipal Electric Authority of Georgia, Plant Vogtle Units 3 & 4 Project J Bonds, Series 2019A, 5.000%, 1/01/49 | | 7/28 at 100.00 | | | 5,344,340 | |
| | | | |
| | 9,060 | | | | | Private Colleges and Universities Authority, Georgia, Revenue Bonds, Mercer University, Series 2015, 5.000%, 10/01/40 | | 10/25 at 100.00 | | | 8,643,005 | |
| | | | | | Total Georgia | | | | | 116,772,317 | |
| | | | |
| | | | | | Guam - 0.3% (0.2% of Total Investments) | | | | | | |
| | | | |
| | 1,500 | | | | | Government of Guam, Business Privilege Tax Bonds, Refunding Series 2015D, 5.000%, 11/15/39 | | 11/25 at 100.00 | | | 1,363,022 | |
| | | | |
| | | | | | Guam Government Waterworks Authority, Water and Wastewater System Revenue Bonds, Refunding Series 2017: | | | | | | |
| | 1,335 | | | | | 5.000%, 7/01/36 | | 7/27 at 100.00 | | | 1,313,817 | |
| | 1,665 | | | | | 5.000%, 7/01/40 | | 7/27 at 100.00 | | | 1,551,343 | |
| | | | |
| | 4,770 | | | | | Guam Government Waterworks Authority, Water and Wastewater System Revenue Bonds, Series 2020A, 5.000%, 1/01/50 | | 7/30 at 100.00 | | | 4,286,050 | |
| | | | | | Total Guam | | | | | 8,514,232 | |
| | | | |
| | | | | | Hawaii - 0.2% (0.1% of Total Investments) | | | | | | |
| | | | |
| | 1,500 | | | | | Hawaii Department of Budget and Finance, Special Purpose Revenue Bonds, Chaminade University of Honolulu, Series 2015A, 5.000%, 1/01/45, 144A | | 1/25 at 100.00 | | | 1,175,346 | |
| | | | |
| | 170 | | | | | Hawaii Department of Budget and Finance, Special Purpose Revenue Bonds, Hawaii Pacific University, Series 2013A, 6.875%, 7/01/43, 144A | | 12/23 at 100.00 | | | 169,988 | |
| | | | |
| | 1,395 | | | | | Hawaii Department of Budget and Finance, Special Purpose Revenue Bonds, Queens Health Systems, Series 2015A, 4.000%, 7/01/40 | | 7/25 at 100.00 | | | 1,209,184 | |
| | | | |
| | 2,635 | | | | | Honolulu City and County, Hawaii, Wastewater System Revenue Bonds, First Bond Resolution, Green Senior Series 2023, 4.500%, 7/01/53 | | 7/33 at 100.00 | | | 2,444,729 | |
| | | | | | Total Hawaii | | | | | 4,999,247 | |
| | | | |
| | | | | | Idaho - 1.4% (0.8% of Total Investments) | | | | | | |
| | | | |
| | | | | | Idaho Health Facilities Authority, Revenue Bonds, Kootenai Health Project,
Series 2014: | | | | | | |
| | 3,300 | | | | | 4.375%, 7/01/34 | | 7/24 at 100.00 | | | 3,226,711 | |
| | 12,495 | | | | | 4.750%, 7/01/44 | | 7/24 at 100.00 | | | 10,532,665 | |
| | | | |
| | 1,250 | | | | | Idaho Health Facilities Authority, Revenue Bonds, Madison Memorial Hospital Project, Refunding Series 2016, 5.000%, 9/01/37 | | 9/26 at 100.00 | | | 1,126,571 | |
| | | | |
| | | | | | Idaho Housing and Finance Association, Nonprofit Facilities Revenue Bonds, Gem Prep Meridian North LLC, Series 2020A: | | | | | | |
| | 500 | | | | | 5.000%, 7/01/40, 144A | | 7/25 at 100.00 | | | 404,176 | |
| | 1,415 | | | | | 5.250%, 7/01/55, 144A | | 7/25 at 100.00 | | | 1,064,057 | |
| | | | |
| | 12,000 | | | (e) | | Idaho Housing and Finance Association, Single Family Mortgage Revenue Bonds, Series 2023C, 4.800%, 7/01/53, (UB) | | 1/33 at 100.00 | | | 11,004,154 | |
| | | | |
| | 12,555 | | | | | Spring Valley Community Infrastructure District 1, Eagle, Idaho, Special Assessment Bonds, Series 2021, 3.750%, 9/01/51, 144A | | 12/26 at 103.00 | | | 8,739,890 | |
| | | | | | Total Idaho | | | | | 36,098,224 | |
47
| | |
| NVG | | Nuveen AMT-Free Municipal Credit Income Fund (continued) |
| | Portfolio of Investments October 31, 2023 |
| | | | | | | | | | | | |
Principal Amount (000) | | | | | Description (a) | | Optional Call Provisions (b) | | Value | |
| | | | |
| | | | | | Illinois - 26.0% (14.9% of Total Investments) | | | | | | |
| | | | |
| | $ 67,135 | | | | | Chicago Board of Education, Illinois, Dedicated Capital Improvement Tax Revenue Bonds, Series 2016, 6.000%, 4/01/46 | | 4/27 at 100.00 | | $ | 67,538,931 | |
| | | | |
| | 1,000 | | | | | Chicago Board of Education, Illinois, Dedicated Capital Improvement Tax Revenue Bonds, Series 2017, 5.000%, 4/01/46 | | 4/27 at 100.00 | | | 892,822 | |
| | | | |
| | 1,110 | | | | | Chicago Board of Education, Illinois, Dedicated Capital Improvement Tax Revenue Bonds, Series 2023, 5.750%, 4/01/48 | | 4/33 at 100.00 | | | 1,116,284 | |
| | | | |
| | 5,245 | | | | | Chicago Board of Education, Illinois, General Obligation Bonds, Dedicated Revenues Series 2012A, 5.000%, 12/01/42 | | 12/23 at 100.00 | | | 4,658,514 | |
| | | | |
| | 8,400 | | | | | Chicago Board of Education, Illinois, General Obligation Bonds, Dedicated Revenues, Refunding Series 2017B, 7.000%, 12/01/42, 144A | | 12/27 at 100.00 | | | 8,763,279 | |
| | | | |
| | | | | | Chicago Board of Education, Illinois, General Obligation Bonds, Dedicated Revenues, Refunding Series 2017H: | | | | | | |
| | 5,835 | | | | | 5.000%, 12/01/36 | | 12/27 at 100.00 | | | 5,520,200 | |
| | 4,940 | | | | | 5.000%, 12/01/46 | | 12/27 at 100.00 | | | 4,348,128 | |
| | | | |
| | 6,055 | | | | | Chicago Board of Education, Illinois, General Obligation Bonds, Dedicated Revenues, Refunding Series 2018D, 5.000%, 12/01/46 | | 12/28 at 100.00 | | | 5,329,538 | |
| | | | |
| | 38,905 | | | | | Chicago Board of Education, Illinois, General Obligation Bonds, Dedicated Revenues, Series 2016A, 7.000%, 12/01/44 | | 12/25 at 100.00 | | | 39,760,879 | |
| | | | |
| | 14,805 | | | | | Chicago Board of Education, Illinois, General Obligation Bonds, Dedicated Revenues, Series 2016B, 6.500%, 12/01/46 | | 12/26 at 100.00 | | | 15,039,683 | |
| | | | |
| | 19,585 | | | | | Chicago Board of Education, Illinois, General Obligation Bonds, Dedicated Revenues, Series 2017A, 7.000%, 12/01/46, 144A | | 12/27 at 100.00 | | | 20,335,231 | |
| | | | |
| | 1,410 | | | | | Chicago Board of Education, Illinois, Unlimited Tax General Obligation Bonds, Dedicated Tax Revenues, Series 1998B-1, 0.000%, 12/01/30 - NPFG Insured | | No Opt. Call | | | 986,356 | |
| | | | |
| | | | | | Chicago Transit Authority, Illinois, Sales Tax Receipts Revenue Bonds, Second Lien Series 2020A: | | | | | | |
| | 1,405 | | | | | 4.000%, 12/01/50 | | 12/29 at 100.00 | | | 1,084,863 | |
| | 2,000 | | | | | 5.000%, 12/01/55 | | 12/29 at 100.00 | | | 1,869,519 | |
| | | | |
| | 11,045 | | | | | Chicago Transit Authority, Illinois, Sales Tax Receipts Revenue Bonds,
Series 2014, 5.250%, 12/01/49 | | 12/24 at 100.00 | | | 10,858,548 | |
| | | | |
| | | | | | Chicago, Illinois, General Airport Revenue Bonds, O’Hare International Airport, Refunding Senior Lien Series 2022B: | | | | | | |
| | 2,565 | | | | | 4.500%, 1/01/56 | | 1/31 at 100.00 | | | 2,249,137 | |
| | 5,000 | | | | | 5.250%, 1/01/56 | | 1/31 at 100.00 | | | 4,944,908 | |
| | | | |
| | 1,355 | | | | | Chicago, Illinois, General Obligation Bonds, Chicago Works Series 2023A,
5.500%, 1/01/39 | | 1/32 at 100.00 | | | 1,371,510 | |
| | | | |
| | 32,670 | | | | | Chicago, Illinois, General Obligation Bonds, City Colleges, Series 1999,
0.000%, 1/01/32 - FGIC Insured | | No Opt. Call | | | 21,385,962 | |
| | | | |
| | 2,500 | | | | | Chicago, Illinois, General Obligation Bonds, Project & Refunding Series 2014A, 5.250%, 1/01/33 | | 1/24 at 100.00 | | | 2,504,727 | |
| | | | |
| | 17,605 | | | | | Chicago, Illinois, General Obligation Bonds, Project & Refunding Series 2017A, 6.000%, 1/01/38 | | 1/27 at 100.00 | | | 18,036,757 | |
| | | | |
| | 2,605 | | | | | Chicago, Illinois, General Obligation Bonds, Refunding Series 2016C,
5.000%, 1/01/38 | | 1/26 at 100.00 | | | 2,486,048 | |
| | | | |
| | 3,000 | | | | | Chicago, Illinois, Wastewater Transmission Revenue Bonds, Second Lien
Series 2008C, 5.000%, 1/01/39 | | 1/25 at 100.00 | | | 2,808,792 | |
| | | | |
| | 10,000 | | | | | Cook County Community College District 508, Illinois, General Obligation Bonds, Chicago City Colleges, Series 2013, 5.250%, 12/01/43 | | 12/23 at 100.00 | | | 9,292,425 | |
48
| | | | | | | | | | | | |
Principal Amount (000) | | | | | Description (a) | | Optional Call Provisions (b) | | Value | |
| | | | |
| | | | | | Illinois (continued) | | | | | | |
| | | | | | Illinois Educational Facilities Authority, Revenue Bonds, Field Museum of Natural History, Series 2002.RMKT: | | | | | | |
| | $ 2,500 | | | | | 4.450%, 11/01/36 | | 11/25 at 102.00 | | $ | 2,420,647 | |
| | 3,400 | | | | | 5.500%, 11/01/36 | | 12/23 at 100.00 | | | 3,404,372 | |
| | | | |
| | | | | | Illinois Finance Authority, Charter School Revenue Bonds, Intrinsic Charter Schools Belmont School Project, Series 2015A: | | | | | | |
| | 1,700 | | | | | 5.750%, 12/01/35, 144A | | 12/25 at 100.00 | | | 1,653,799 | |
| | 115 | | | | | 6.000%, 12/01/45, 144A | | 12/25 at 100.00 | | | 106,905 | |
| | | | |
| | | | | | Illinois Finance Authority, Health Services Facility Lease Revenue Bonds, Provident Group - UIC Surgery Center, LLC - University of Illinois Health Services Facility Project, Series 2020: | | | | | | |
| | 3,835 | | | | | 4.000%, 10/01/50 | | 10/30 at 100.00 | | | 2,877,165 | |
| | 5,190 | | | | | 4.000%, 10/01/55 | | 10/30 at 100.00 | | | 3,784,759 | |
| | | | |
| | | | | | Illinois Finance Authority, Revenue Bonds, Ascension Health/fkaPresence Health Network, Series 2016C: | | | | | | |
| | 37,050 | | | | | 4.000%, 2/15/41 | | 2/27 at 100.00 | | | 32,678,863 | |
| | 1,755 | | | (d) | | 4.000%, 2/15/41, (Pre-refunded 2/15/27) | | 2/27 at 100.00 | | | 1,754,666 | |
| | 80 | | | (d) | | 4.000%, 2/15/41, (Pre-refunded 2/15/27) | | 2/27 at 100.00 | | | 79,985 | |
| | | | |
| | | | | | Illinois Finance Authority, Revenue Bonds, Centegra Health System, Series 2014A: | | | | | | |
| | 1,485 | | | (d) | | 5.000%, 9/01/34, (Pre-refunded 9/01/24) | | 9/24 at 100.00 | | | 1,497,125 | |
| | 19,025 | | | (d) | | 5.000%, 9/01/42, (Pre-refunded 9/01/24) | | 9/24 at 100.00 | | | 19,180,339 | |
| | | | |
| | 500 | | | | | Illinois Finance Authority, Revenue Bonds, DePaul College Prep Foundation,
Series 2023A, 5.625%, 8/01/53, 144A | | 8/33 at 100.00 | | | 461,742 | |
| | | | |
| | 4,000 | | | | | Illinois Finance Authority, Revenue Bonds, Lutheran Home and Services,
Series 2019A, 5.000%, 11/01/49 | | 11/26 at 103.00 | | | 2,968,364 | |
| | | | |
| | 10,000 | | | (e) | | Illinois Finance Authority, Revenue Bonds, Northshore - Edward-Elmhurst Health Credit Group, Series 2022A, 5.000%, 8/15/47, (UB) | | 8/32 at 100.00 | | | 9,568,741 | |
| | | | |
| | 12,000 | | | | | Illinois Finance Authority, Revenue Bonds, OSF Healthcare System,
Series 2015A, 5.000%, 11/15/45 | | 11/25 at 100.00 | | | 11,374,832 | |
| | | | |
| | | | | | Illinois Finance Authority, Revenue Bonds, Rosalind Franklin University Research Building Project, Series 2017C: | | | | | | |
| | 1,000 | | | | | 5.000%, 8/01/42 | | 8/27 at 100.00 | | | 937,160 | |
| | 1,000 | | | | | 5.000%, 8/01/46 | | 8/27 at 100.00 | | | 913,515 | |
| | 1,000 | | | | | 5.000%, 8/01/47 | | 8/27 at 100.00 | | | 907,468 | |
| | | | |
| | | | | | Illinois Finance Authority, Revenue Bonds, Silver Cross Hospital and Medical Centers, Refunding Series 2015C: | | | | | | |
| | 560 | | | | | 5.000%, 8/15/35 | | 8/25 at 100.00 | | | 537,079 | |
| | 5,140 | | | | | 5.000%, 8/15/44 | | 8/25 at 100.00 | | | 4,834,394 | |
| | | | |
| | 10,000 | | | (e) | | Illinois Finance Authority, Revenue Bonds, University of Chicago Medicine,
Series 2022A, 5.000%, 8/15/52, (UB) | | 8/32 at 100.00 | | | 9,464,232 | |
| | | | |
| | | | | | Illinois Finance Authority, Revenue Bonds, University of Chicago, Refunding
Series 2015A: | | | | | | |
| | 17,765 | | | (d) | | 5.000%, 10/01/46, (Pre-refunded 10/01/25) | | 10/25 at 100.00 | | | 18,102,824 | |
| | 2,235 | | | | | 5.000%, 10/01/46 | | 10/25 at 100.00 | | | 2,223,041 | |
| | | | |
| | 5,670 | | | | | Illinois Housing Development Authority, Multifamily Housing Revenue Bonds,
Series 2021C, 2.850%, 7/01/56 | | 7/30 at 100.00 | | | 3,274,893 | |
| | | | |
| | 3,665 | | | | | Illinois Sports Facility Authority, State Tax Supported Bonds, Refunding
Series 2014, 5.250%, 6/15/31 - AGM Insured | | 6/24 at 100.00 | | | 3,681,043 | |
| | | | |
| | | | | | Illinois State, General Obligation Bonds, December Series 2017A: | | | | | | |
| | 11,800 | | | | | 5.000%, 12/01/38 | | 12/27 at 100.00 | | | 11,295,743 | |
49
| | |
| NVG | | Nuveen AMT-Free Municipal Credit Income Fund (continued) |
| | Portfolio of Investments October 31, 2023 |
| | | | | | | | | | | | |
Principal Amount (000) | | | | | Description (a) | | Optional Call Provisions (b) | | Value | |
| | | | |
| | | | | | Illinois (continued) | | | | | | |
| | $ 1,330 | | | | | 5.000%, 12/01/39 | | 12/27 at 100.00 | | $ | 1,263,331 | |
| | | | |
| | | | | | Illinois State, General Obligation Bonds, February Series 2014: | | | | | | |
| | 3,275 | | | | | 5.000%, 2/01/24 | | No Opt. Call | | | 3,279,202 | |
| | 1,575 | | | | | 5.250%, 2/01/34 | | 2/24 at 100.00 | | | 1,549,131 | |
| | 7,515 | | | | | 5.000%, 2/01/39 | | 2/24 at 100.00 | | | 7,159,388 | |
| | | | |
| | 5,200 | | | | | Illinois State, General Obligation Bonds, January Series 2016, 5.000%, 1/01/29 | | 1/26 at 100.00 | | | 5,263,224 | |
| | | | |
| | | | | | Illinois State, General Obligation Bonds, May Series 2014: | | | | | | |
| | 510 | | | | | 5.000%, 5/01/36 | | 5/24 at 100.00 | | | 498,538 | |
| | 1,915 | | | | | 5.000%, 5/01/39 | | 5/24 at 100.00 | | | 1,821,896 | |
| | | | |
| | 4,460 | | | | | Illinois State, General Obligation Bonds, May Series 2020, 5.500%, 5/01/39 | | 5/30 at 100.00 | | | 4,565,220 | |
| | | | |
| | 1,495 | | | | | Illinois State, General Obligation Bonds, May Series 2023B, 4.500%, 5/01/48 | | 5/32 at 100.00 | | | 1,263,418 | |
| | | | |
| | 13,200 | | | | | Illinois State, General Obligation Bonds, November Series 2016, 5.000%, 11/01/41 | | 11/26 at 100.00 | | | 12,453,110 | |
| | | | |
| | 31,460 | | | | | Illinois State, General Obligation Bonds, November Series 2017C, 5.000%, 11/01/29 | | 11/27 at 100.00 | | | 32,108,579 | |
| | | | |
| | 2,040 | | | | | Illinois State, General Obligation Bonds, November Series 2017D, 5.000%, 11/01/27 | | No Opt. Call | | | 2,090,827 | |
| | | | |
| | 5,000 | | | | | Illinois State, General Obligation Bonds, November Series 2019B, 4.000%, 11/01/35 | | 11/29 at 100.00 | | | 4,562,732 | |
| | | | |
| | 5,000 | | | | | Illinois State, General Obligation Bonds, October Series 2016, 5.000%, 2/01/29 | | 2/27 at 100.00 | | | 5,090,309 | |
| | | | |
| | | | | | Illinois Toll Highway Authority, Toll Highway Revenue Bonds, Senior Lien
Series 2013A: | | | | | | |
| | 5,000 | | | | | 5.000%, 1/01/35 | | 12/23 at 100.00 | | | 5,001,257 | |
| | 5,590 | | | | | 5.000%, 1/01/38 | | 12/23 at 100.00 | | | 5,589,539 | |
| | | | |
| | 18,920 | | | | | Illinois Toll Highway Authority, Toll Highway Revenue Bonds, Senior Lien
Series 2015B, 5.000%, 1/01/40 | | 1/26 at 100.00 | | | 18,883,592 | |
| | | | |
| | 10,470 | | | | | Illinois Toll Highway Authority, Toll Highway Revenue Bonds, Senior Lien
Series 2019A, 5.000%, 1/01/44 | | 7/29 at 100.00 | | | 10,470,918 | |
| | | | |
| | 4,250 | | | | | Illinois Toll Highway Authority, Toll Highway Revenue Bonds, Senior Series 2023A, 5.250%, 1/01/45 | | 7/33 at 100.00 | | | 4,315,469 | |
| | | | |
| | 540 | | | | | Metropolitan Pier and Exposition Authority, Illinois, McCormick Place Expansion Project Bonds, Refunding Series 2015B, 5.000%, 6/15/52 | | 12/25 at 100.00 | | | 499,121 | |
| | | | |
| | | | | | Metropolitan Pier and Exposition Authority, Illinois, McCormick Place Expansion Project Bonds, Refunding Series 2020A: | | | | | | |
| | 11,305 | | | | | 4.000%, 6/15/50 | | 12/29 at 100.00 | | | 8,800,399 | |
| | 7,290 | | | | | 5.000%, 6/15/50 | | 12/29 at 100.00 | | | 6,778,988 | |
| | | | |
| | | | | | Metropolitan Pier and Exposition Authority, Illinois, McCormick Place Expansion Project Bonds, Refunding Series 2022A: | | | | | | |
| | 9,945 | | | | | 4.000%, 12/15/47 | | 12/31 at 100.00 | | | 7,883,930 | |
| | 4,500 | | | | | 4.000%, 6/15/52 | | 12/31 at 100.00 | | | 3,466,453 | |
| | | | |
| | | | | | Metropolitan Pier and Exposition Authority, Illinois, McCormick Place Expansion Project Bonds, Series 2015A: | | | | | | |
| | 2,890 | | | | | 0.000%, 12/15/52 | | No Opt. Call | | | 528,658 | |
| | 5,185 | | | | | 5.000%, 6/15/53 | | 12/25 at 100.00 | | | 4,778,437 | |
50
| | | | | | | | | | | | |
Principal Amount (000) | | | | | Description (a) | | Optional Call Provisions (b) | | Value | |
| | | | |
| | | | | | Illinois (continued) | | | | | | |
| | | | | | Metropolitan Pier and Exposition Authority, Illinois, Revenue Bonds, McCormick Place Expansion Project, Capital Appreciation Refunding Series 2010B-1: | | | | | | |
| | $ 25,000 | | | | | 0.000%, 6/15/44 - AGM Insured | | No Opt. Call | | $ | 8,101,852 | |
| | 43,200 | | | | | 0.000%, 6/15/45 - AGM Insured | | No Opt. Call | | | 13,156,392 | |
| | 10,000 | | | | | 0.000%, 6/15/46 - AGM Insured | | No Opt. Call | | | 2,872,557 | |
| | | | |
| | 8,750 | | | | | Metropolitan Pier and Exposition Authority, Illinois, Revenue Bonds, McCormick Place Expansion Project, Series 1994B, 0.000%, 6/15/28 - NPFG Insured | | No Opt. Call | | | 7,053,224 | |
| | | | |
| | | | | | Metropolitan Pier and Exposition Authority, Illinois, Revenue Bonds, McCormick Place Expansion Project, Series 2002A: | | | | | | |
| | 18,085 | | | | | 0.000%, 12/15/24 - NPFG Insured | | No Opt. Call | | | 17,181,240 | |
| | 20,045 | | | | | 0.000%, 12/15/35 - AGM Insured | | No Opt. Call | | | 11,238,873 | |
| | 9,010 | | | | | 0.000%, 6/15/37 - NPFG Insured | | No Opt. Call | | | 4,467,170 | |
| | | | |
| | 465 | | | | | Morton Grove, Illinois, Tax Increment Revenue Bonds, Sawmill Station Redevelopment Project, Senior Lien Series 2019, 5.000%, 1/01/39 | | 1/26 at 100.00 | | | 406,468 | |
| | | | |
| | 1,842 | | | | | Plano, Illinois, Special Tax Bonds, Special Service Area 1 & 2 Lakewood Springs Project, Refunding Series 2014, 5.000%, 3/01/34 - AGM Insured | | 3/24 at 100.00 | | | 1,843,005 | |
| | | | |
| | 2,615 | | | | | Regional Transportation Authority, Cook, DuPage, Kane, Lake, McHenry and Will Counties, Illinois, General Obligation Bonds, Series 2000A, 6.500%, 7/01/30 - NPFG Insured | | No Opt. Call | | | 2,907,005 | |
| | | | |
| | 4,000 | | | | | Southwestern Illinois Development Authority, School Revenue Bonds, Triad School District 2, Madison County, Illinois, Series 2006, 0.000%, 10/01/25 - NPFG Insured | | No Opt. Call | | | 3,657,200 | |
| | | | |
| | 12,125 | | | | | Springfield, Illinois, Electric Revenue Bonds, Refunding Senior Lien Series 2015, 5.000%, 3/01/40 - AGM Insured | | 3/25 at 100.00 | | | 12,197,303 | |
| | | | |
| | 6,415 | | | | | Will County School District 122, New Lenox, Illinois, General Obligation Bonds, Capital Appreciation School Series 2004D, 0.000%, 11/01/24 - AGM Insured | | No Opt. Call | | | 6,136,257 | |
| | | | | | Total Illinois | | | | | 654,350,949 | |
| | | | |
| | | | | | Indiana - 2.7% (1.6% of Total Investments) | | | | | | |
| | | | |
| | 2,650 | | | | | Crown Point Multi-School Building Corporation, Indiana, First Mortgage Bonds, Crown Point Community School Corporation, Series 2000, 0.000%, 1/15/24 - NPFG Insured | | No Opt. Call | | | 2,627,166 | |
| | | | |
| | 12,045 | | | | | Indiana Finance Authority, Educational Facilities Revenue Bonds, Valparaiso University Project, Series 2014, 5.000%, 10/01/44 | | 10/24 at 100.00 | | | 10,711,846 | |
| | | | |
| | 5,000 | | | | | Indiana Finance Authority, Hospital Revenue Bonds, Indiana University Health Obligation Group, Fixed Rate Series 2023A, 5.000%, 10/01/53 | | 10/33 at 100.00 | | | 4,870,022 | |
| | | | |
| | 17,970 | | | | | Indiana Finance Authority, Wastewater Utility Revenue Bonds, CWA Authority Project, Series 2014A, 5.000%, 10/01/44 | | 10/24 at 100.00 | | | 18,148,412 | |
| | | | |
| | | | | | Indianapolis Local Public Improvement Bond Bank, Indiana, Series 1999E: | | | | | | |
| | 10,000 | | | | | 0.000%, 2/01/26 - AMBAC Insured | | No Opt. Call | | | 9,067,437 | |
| | 20,000 | | | | | 0.000%, 2/01/28 - AMBAC Insured | | No Opt. Call | | | 16,649,298 | |
| | | | |
| | 7,845 | | | | | IPS Multi-School Building Corporation, Indiana, First Mortgage Revenue Bonds, Social Series 2023, 4.250%, 7/15/43 | | 7/31 at 100.00 | | | 6,940,372 | |
| | | | | | Total Indiana | | | | | 69,014,553 | |
| | | | |
| | | | | | Iowa - 1.6% (0.9% of Total Investments) | | | | | | |
| | | | |
| | | | | | Iowa Finance Authority, Iowa, Midwestern Disaster Area Revenue Bonds, Iowa Fertilizer Company Project, Refunding Series 2022: | | | | | | |
| | 10,860 | | | | | 5.000%, 12/01/50, (Mandatory Put 12/01/42) | | 12/29 at 103.00 | | | 9,888,048 | |
| | 10,045 | | | | | 5.000%, 12/01/50 | | 12/29 at 103.00 | | | 8,916,082 | |
51
| | |
| NVG | | Nuveen AMT-Free Municipal Credit Income Fund (continued) |
| | Portfolio of Investments October 31, 2023 |
| | | | | | | | | | | | |
Principal Amount (000) | | | | | Description (a) | | Optional Call Provisions (b) | | Value | |
| | | | |
| | | | | | Iowa (continued) | | | | | | |
| | $ 5,700 | | | | | Iowa Finance Authority, Senior Housing Revenue Bonds, PHS Council Bluffs, Inc. Project, Series 2018, 5.250%, 8/01/55 | | 12/23 at 102.00 | | $ | 3,840,918 | |
| | | | |
| | 10,000 | | | (e) | | Iowa Finance Authority, Single Family Mortgage Revenue Bonds, Social Taxable Series 2023C, 4.850%, 7/01/43, (UB) | | 1/33 at 100.00 | | | 9,640,359 | |
| | | | |
| | 36,850 | | | | | Iowa Tobacco Settlement Authority, Tobacco Settlement Asset-Backed Bonds, Class 2 Capital Appreciation Senior Lien Series 2021B-2, 0.000%, 6/01/65 | | 6/31 at 25.58 | | | 3,419,489 | |
| | | | |
| | 3,715 | | | | | Iowa Tobacco Settlement Authority, Tobacco Settlement Asset-Backed Bonds, Seenior Lien Series Class 2 Series 2021B-1, 4.000%, 6/01/49 | | 6/31 at 100.00 | | | 3,314,935 | |
| | | | | | Total Iowa | | | | | 39,019,831 | |
| | | | |
| | | | | | Kansas - 0.4% (0.2% of Total Investments) | | | | | | |
| | | | |
| | 1,000 | | | | | Lenexa, Kansas, Health Care Facilities Revenue Bonds, Lakeview Village Inc, Series 2017A, 5.000%, 5/15/43 | | 5/27 at 100.00 | | | 847,090 | |
| | | | |
| | | | | | Wyandotte County-Kansas City Unified Government, Kansas, Sales Tax Special Obligation Bonds, Vacation Village Project Area 1 and 2A, Series 2015: | | | | | | |
| | 3,125 | | | | | 5.000%, 9/01/27 | | 9/25 at 100.00 | | | 3,017,027 | |
| | 2,380 | | | | | 5.750%, 9/01/32 | | 9/25 at 100.00 | | | 2,096,010 | |
| | 2,575 | | | | | 6.000%, 9/01/35 | | 9/25 at 100.00 | | | 2,206,539 | |
| | | | |
| | 2,500 | | | | | Wyandotte County-Kansas City Unified Government, Kansas, Sales Tax Special Obligation Bonds, Village East Project Areas 2B 3 and 5, Series 2022,
5.750%, 9/01/39, 144A | | 3/29 at 103.00 | | | 2,261,124 | |
| | | | | | Total Kansas | | | | | 10,427,790 | |
| | | | |
| | | | | | Kentucky - 2.2% (1.3% of Total Investments) | | | | | | |
| | | | |
| | 6,400 | | | | | Christian County, Kentucky, Hospital Revenue Bonds, Jennie Stuart Medical Center, Series 2016, 5.500%, 2/01/44 | | 2/26 at 100.00 | | | 6,135,600 | |
| | | | |
| | 10,140 | | | | | Kentucky Economic Development Finance Authority, Hospital Revenue Bonds, Owensboro Health, Refunding Series 2017A, 5.000%, 6/01/37 | | 6/27 at 100.00 | | | 9,759,902 | |
| | | | |
| | | | | | Kentucky Economic Development Finance Authority, Revenue Bonds, Next Generation Kentucky Information Highway Project, Senior Series 2015A: | | | | | | |
| | 4,345 | | | | | 5.000%, 7/01/37 | | 7/25 at 100.00 | | | 4,204,722 | |
| | 16,715 | | | | | 5.000%, 1/01/45 | | 7/25 at 100.00 | | | 15,174,888 | |
| | | | |
| | 1,940 | | | | | Kentucky Housing Corporation, Single Family Mortgage Revenue Bonds, Series 2023A, 4.800%, 7/01/48 | | 7/32 at 100.00 | | | 1,797,994 | |
| | | | |
| | | | | | Kentucky Public Transportation Infrastructure Authority, Toll Revenue Bonds, Downtown Crossing Project, Convertible Capital Appreciation First Tier Series 2013C: | | | | | | |
| | 4,360 | | | | | 6.750%, 7/01/43 | | 7/31 at 100.00 | | | 4,761,666 | |
| | 8,510 | | | | | 6.875%, 7/01/46 | | 7/31 at 100.00 | | | 9,312,430 | |
| | | | |
| | 5,000 | | | | | Louisville and Jefferson County Metropolitan Government, Kentucky, Hospital Revenue Bonds, UofL Health Project, Series 2022A, 5.000%, 5/15/52 | | 5/32 at 100.00 | | | 4,517,798 | |
| | | | | | Total Kentucky | | | | | 55,665,000 | |
| | | | |
| | | | | | Louisiana - 1.4% (0.8% of Total Investments) | | | | | | |
| | | | |
| | 2,435 | | | | | Ascension Parish Industrial development Board, Louisiana, Revenue Bonds, Impala Warehousing (US) LLC Project, Series 2013, 6.000%, 7/01/36 | | 12/23 at 100.00 | | | 2,347,006 | |
| | | | |
| | 12,840 | | | | | Louisiana Publc Facilities Authority, Lousiana, Revenue Bonds, Ochsner Clinic Foundation Project, Series 2020A, 4.000%, 5/15/49 | | 5/30 at 100.00 | | | 10,228,195 | |
52
| | | | | | | | | | | | |
Principal Amount (000) | | | | | Description (a) | | Optional Call Provisions (b) | | Value | |
| | | | |
| | | | | | Louisiana (continued) | | | | | | |
| | | | | | Louisiana Public Facilities Authority, Hospital Revenue Bonds, Franciscan Missionaries of Our Lady Health System, Series 1998A: | | | | | | |
| | $ 3,565 | | | | | 5.750%, 7/01/25, (UB) | | No Opt. Call | | $ | 3,621,962 | |
| | 135 | | | (d) | | 5.750%, 7/01/25, (ETM), (UB) | | No Opt. Call | | | 139,172 | |
| | | | |
| | 8,970 | | | | | Louisiana Public Facilities Authority, Revenue Bonds, Loyola University Project, Refunding Series 2017, 5.250%, 10/01/46 | | 10/33 at 100.00 | | | 7,893,145 | |
| | | | |
| | | | | | Louisiana Public Facilities Authority, Revenue Bonds, Ochsner Clinic Foundation Project, Series 2015: | | | | | | |
| | 1,065 | | | | | 4.250%, 5/15/40 | | 5/25 at 100.00 | | | 930,157 | |
| | 5,000 | | | | | 5.000%, 5/15/47 | | 5/25 at 100.00 | | | 4,719,368 | |
| | | | |
| | 1,000 | | | (d) | | New Orleans, Louisiana, Sewerage Service Revenue Bonds, Refunding Series 2014, 4.250%, 6/01/34, (Pre-refunded 6/01/24) | | 6/24 at 100.00 | | | 1,001,969 | |
| | | | |
| | 3,275 | | | | | Saint James Parish, Louisiana, Revenue Bonds, NuStar Logistics, L.P. Project, Series 2010A, 6.350%, 10/01/40, 144A | | 6/30 at 100.00 | | | 3,437,828 | |
| | | | | | Total Louisiana | | | | | 34,318,802 | |
| | | | |
| | | | | | Maine - 1.5% (0.8% of Total Investments) | | | | | | |
| | | | |
| | | | | | Maine Health and Higher Educational Facilities Authority Revenue Bonds, Eastern Maine Medical Center Obligated Group Issue, Series 2016A: | | | | | | |
| | 5,480 | | | | | 4.000%, 7/01/41 | | 7/26 at 100.00 | | | 4,230,769 | |
| | 10,265 | | | | | 4.000%, 7/01/46 | | 7/26 at 100.00 | | | 7,407,206 | |
| | | | |
| | 10,000 | | | (d) | | Maine Health and Higher Educational Facilities Authority, Revenue Bonds, Mainehealth Issue, Series 2015, 5.000%, 7/01/39, (Pre-refunded 7/01/24) | | 7/24 at 100.00 | | | 10,067,967 | |
| | | | |
| | 500 | | | | | Maine Health and Higher Educational Facilities Authority, Revenue Bonds, MaineHealth Issue, Series 2020A, 4.000%, 7/01/45 | | 7/30 at 100.00 | | | 414,907 | |
| | | | |
| | 4,500 | | | | | Maine State Housing Authority, Multifamily Mortgage Purchase Bonds,
Series 2021A, 2.200%, 11/15/51 | | 5/30 at 100.00 | | | 2,215,877 | |
| | | | |
| | 8,885 | | | | | Maine State Housing Authority, Multifamily Mortgage Purchase Bonds,
Series 2022A, 2.600%, 11/15/46 | | 11/30 at 100.00 | | | 5,375,508 | |
| | | | |
| | 7,695 | | | | | Maine State Housing Authority, Single Family Mortgage Purchase Bonds,
Series 2020D, 2.800%, 11/15/45 | | 5/29 at 100.00 | | | 5,026,387 | |
| | | | |
| | 915 | | | | | Maine State Housing Authority, Single Family Mortgage Purchase Bonds, Social
Series 2021C, 2.300%, 11/15/46 | | 11/30 at 100.00 | | | 510,656 | |
| | | | |
| | 2,000 | | | | | Maine State Housing Authority, Single Family Mortgage Purchase Bonds, Social Series 2023A, 4.600%, 11/15/48 | | 5/32 at 100.00 | | | 1,759,312 | |
| | | | | | Total Maine | | | | | 37,008,589 | |
| | | | |
| | | | | | Maryland - 2.0% (1.2% of Total Investments) | | | | | | |
| | | | |
| | | | | | Baltimore, Maryland, Convention Center Hotel Revenue Bonds, Refunding Series 2017: | | | | | | |
| | 1,280 | | | | | 5.000%, 9/01/33 | | 9/27 at 100.00 | | | 1,194,087 | |
| | 3,050 | | | | | 5.000%, 9/01/39 | | 9/27 at 100.00 | | | 2,607,635 | |
| | 3,025 | | | | | 5.000%, 9/01/46 | | 9/27 at 100.00 | | | 2,439,280 | |
| | | | |
| | 1,000 | | | | | Howard County, Maryland, Special Obligation Bonds, Downtown Columbia Project, Series 2017A, 4.375%, 2/15/39, 144A | | 2/26 at 100.00 | | | 877,157 | |
| | | | |
| | | | | | Maryland Community Development Administration Department of Housing and Community Development, Residential Revenue Bonds, Series 2021C: | | | | | | |
| | 6,600 | | | | | 2.450%, 9/01/41 | | 9/30 at 100.00 | | | 4,320,997 | |
| | 12,000 | | | | | 2.550%, 9/01/44 | | 9/30 at 100.00 | | | 7,597,799 | |
| | | | |
| | 7,975 | | | | | Maryland Health and Higher Educational Facilities Authority, Revenue Bonds, Adventist HealthCare Issue, Series 2021B, 4.000%, 1/01/51 | | 1/32 at 100.00 | | | 5,778,757 | |
53
| | |
| NVG | | Nuveen AMT-Free Municipal Credit Income Fund (continued) |
| | Portfolio of Investments October 31, 2023 |
| | | | | | | | | | | | |
Principal Amount (000) | | | | | Description (a) | | Optional Call Provisions (b) | | Value | |
| | | | |
| | | | | | Maryland (continued) | | | | | | |
| | $ 13,315 | | | | | Maryland Health and Higher Educational Facilities Authority, Revenue Bonds, Adventist Healthcare, Series 2016A, 5.500%, 1/01/46 | | 1/27 at 100.00 | | $ | 12,484,539 | |
| | | | |
| | 4,000 | | | | | Maryland Health and Higher Educational Facilities Authority, Revenue Bonds, LifeBridge Health Issue, Series 2016, 5.000%, 7/01/47 | | 7/26 at 100.00 | | | 3,881,961 | |
| | | | |
| | 1,500 | | | (d) | | Maryland Health and Higher Educational Facilities Authority, Revenue Bonds, Peninsula Regional Medical Center Issue, Refunding Series 2015, 5.000%, 7/01/45, (Pre-refunded 7/01/24) | | 7/24 at 100.00 | | | 1,508,235 | |
| | | | |
| | | | | | Prince George’s County Revenue Authority, Maryland, Special Obligation Bonds, Suitland-Naylor Road Project, Series 2016: | | | | | | |
| | 2,000 | | | | | 4.750%, 7/01/36, 144A | | 1/26 at 100.00 | | | 1,915,343 | |
| | 2,300 | | | | | 5.000%, 7/01/46, 144A | | 1/26 at 100.00 | | | 2,061,929 | |
| | | | |
| | | | | | Rockville Mayor and Council, Maryland, Economic Development Revenue Bonds, Series 2017B: | | | | | | |
| | 1,335 | | | | | 4.250%, 11/01/37 | | 11/24 at 103.00 | | | 1,018,668 | |
| | 1,250 | | | | | 4.500%, 11/01/43 | | 11/24 at 103.00 | | | 930,483 | |
| | 2,650 | | | | | 5.000%, 11/01/47 | | 11/24 at 103.00 | | | 2,068,731 | |
| | | | | | Total Maryland | | | | | 50,685,601 | |
| | | | |
| | | | | | Massachusetts - 2.6% (1.5% of Total Investments) | | | | | | |
| | | | |
| | | | | | Massachusetts Development Finance Agency Revenue Bonds, Lawrence General Hospital Issue, Series 2014A: | | | | | | |
| | 2,245 | | | | | 5.250%, 7/01/34 | | 7/24 at 100.00 | | | 1,968,357 | |
| | 6,195 | | | | | 5.500%, 7/01/44 | | 7/24 at 100.00 | | | 5,042,248 | |
| | | | |
| | | | | | Massachusetts Development Finance Agency Revenue Refunding Bonds, NewBridge on the Charles, Inc. Issue, Series 2017: | | | | | | |
| | 8,200 | | | | | 4.125%, 10/01/42, 144A | | 11/23 at 104.00 | | | 6,032,209 | |
| | 3,000 | | | | | 5.000%, 10/01/57, 144A | | 11/23 at 104.00 | | | 2,359,633 | |
| | | | |
| | | | | | Massachusetts Development Finance Agency, Revenue Bonds, Emerson College, Series 2015: | | | | | | |
| | 1,705 | | | | | 4.500%, 1/01/45 | | 1/25 at 100.00 | | | 1,439,309 | |
| | 2,085 | | | | | 5.000%, 1/01/45 | | 1/25 at 100.00 | | | 1,910,156 | |
| | | | |
| | 4,035 | | | | | Massachusetts Development Finance Agency, Revenue Bonds, Emmanuel College, Series 2016A, 4.000%, 10/01/46 | | 10/26 at 100.00 | | | 3,098,679 | |
| | | | |
| | 900 | | | | | Massachusetts Development Finance Agency, Revenue Bonds, Milford Regional Medical Center Issue, Series 2020G, 5.000%, 7/15/46, 144A | | 7/30 at 100.00 | | | 721,690 | |
| | | | |
| | 6,000 | | | | | Massachusetts Development Finance Authority, Revenue Bonds, WGBH Educational Foundation, Series 2002A, 5.750%, 1/01/42 - AMBAC Insured | | No Opt. Call | | | 6,740,860 | |
| | | | |
| | 7,405 | | | (e) | | Massachusetts Health and Educational Facilities Authority, Revenue Bonds, Massachusetts Institute of Technology, Series 2002K, 5.500%, 7/01/32, (UB) | | No Opt. Call | | | 8,539,632 | |
| | | | |
| | 2,785 | | | | | Massachusetts Housing Finance Agency, Housing Bonds, Series 2014D,
3.875%, 12/01/39 | | 6/24 at 100.00 | | | 2,378,613 | |
| | | | |
| | | | | | Massachusetts Housing Finance Agency, Housing Bonds, Sustainability Green Series 2021A-1: | | | | | | |
| | 3,340 | | | | | 2.375%, 12/01/46 | | 6/30 at 100.00 | | | 1,894,268 | |
| | 3,600 | | | | | 2.450%, 12/01/51 | | 6/30 at 100.00 | | | 1,891,040 | |
| | 8,310 | | | | | 2.550%, 12/01/56 | | 6/30 at 100.00 | | | 4,339,573 | |
| | | | |
| | 4,500 | | | | | Massachusetts Housing Finance Agency, Single Family Housing Revenue Bonds, Social Series 2020-220, 2.300%, 12/01/44 | | 6/30 at 100.00 | | | 2,613,093 | |
| | | | |
| | 3,500 | | | | | Massachusetts Housing Finance Agency, Single Family Housing Revenue Bonds, Social Series 2023-227, 4.900%, 12/01/48 | | 6/32 at 100.00 | | | 3,338,728 | |
54
| | | | | | | | | | | | |
Principal Amount (000) | | | | | Description (a) | | Optional Call Provisions (b) | | Value | |
| | | | |
| | | | | | Massachusetts (continued) | | | | | | |
| | $ 3,345 | | | | | Massachusetts State, General Obligation Bonds, Consolidated Loan,
Series 2021B, 2.000%, 4/01/50 | | 4/31 at 100.00 | | $ | 1,698,916 | |
| | | | |
| | 10,000 | | | | | Massachusetts State, Transportation Fund Revenue Bonds, Rail Enhancement Program, Green Series 2023A, 5.000%, 6/01/53 | | 6/33 at 100.00 | | | 10,074,247 | |
| | | | |
| | 425 | | | | | Massachusetts Water Pollution Abatement Trust, Revenue Bonds, MWRA Loan Program, Subordinate Series 1999A, 5.750%, 8/01/29 | | 12/23 at 100.00 | | | 425,530 | |
| | | | | | Total Massachusetts | | | | | 66,506,781 | |
| | | | |
| | | | | | Michigan - 2.5% (1.4% of Total Investments) | | | | | | |
| | | | |
| | 4,600 | | | | | Detroit City School District, Wayne County, Michigan, Unlimited Tax School Building and Site Improvement Bonds, Series 2001A, 6.000%, 5/01/29 - AGM Insured, (UB) | | No Opt. Call | | | 4,924,569 | |
| | | | |
| | 3,665 | | | | | Detroit Downtown Development Authority, Michigan, Tax Increment Revenue Bonds, Catalyst Development Project, Series 2018A, 5.000%, 7/01/48 - AGM Insured | | 7/24 at 100.00 | | | 3,414,524 | |
| | | | |
| | 875 | | | | | Lansing, Ingham and Eaton Counties, Michigan, General Obligation Bonds, Refunding & Capital Improvement Series 2023B, 4.125%, 6/01/48 - AGM Insured | | 6/33 at 100.00 | | | 741,303 | |
| | | | |
| | | | | | Michigan Finance Authority, Hospital Revenue Bonds, Sparrow Obligated Group, Refunding Series 2015: | | | | | | |
| | 4,495 | | | (d) | | 4.000%, 11/15/35, (Pre-refunded 5/15/25) | | 5/25 at 100.00 | | | 4,497,272 | |
| | 2,410 | | | (d) | | 4.000%, 11/15/36, (Pre-refunded 5/15/25) | | 5/25 at 100.00 | | | 2,411,218 | |
| | | | |
| | | | | | Michigan Finance Authority, Michigan, Revenue Bonds, Trinity Health Credit Group, Refunding Series 2016MI: | | | | | | |
| | 5,040 | | | | | 5.000%, 12/01/45 | | 6/26 at 100.00 | | | 4,909,698 | |
| | 145 | | | (d) | | 5.000%, 12/01/45, (Pre-refunded 6/01/26) | | 6/26 at 100.00 | | | 149,391 | |
| | | | |
| | 2,705 | | | | | Michigan Finance Authority, Tobacco Settlement Asset- Backed Bonds, 2006 Sold Tobacco Receipts Senior Current Interest Series 2020A-2, 5.000%, 6/01/40 | | 12/30 at 100.00 | | | 2,660,005 | |
| | | | |
| | 1,000 | | | | | Michigan Finance Authority, Tobacco Settlement Asset- Backed Bonds, 2007 Sold Tobacco Receipts, Senior Current Interest Series 2020A-CL-1, 4.000%, 6/01/49 | | 12/30 at 100.00 | | | 814,206 | |
| | | | |
| | 5,000 | | | | | Michigan Housing Development Authority, Single Family Mortgage Revenue Bonds, Series 2023B, 4.800%, 12/01/43 | | 12/32 at 100.00 | | | 4,767,142 | |
| | | | |
| | | | | | Michigan Housing Development Authority, Single Family Mortgage Revenue Bonds, Social Series 2021A: | | | | | | |
| | 21,675 | | | | | 2.350%, 12/01/46 | | 12/30 at 100.00 | | | 12,608,499 | |
| | 8,280 | | | | | 2.500%, 6/01/52 | | 12/30 at 100.00 | | | 4,556,790 | |
| | | | |
| | 10,000 | | | | | Michigan State Building Authority, Revenue Bonds, Facilities Program, Refunding Series 2020-I, 2.625%, 10/15/56 | | 10/31 at 100.00 | | | 5,503,928 | |
| | | | |
| | 5,380 | | | | | Michigan State Building Authority, Revenue Bonds, Facilities Program, Refunding Series 2023II, 4.000%, 10/15/47 | | 10/33 at 100.00 | | | 4,528,887 | |
| | | | |
| | | | | | Wayne County Airport Authority, Michigan, Revenue Bonds, Detroit Metropolitan Wayne County Airport, Series 2015D: | | | | | | |
| | 3,550 | | | | | 5.000%, 12/01/40 | | 12/25 at 100.00 | | | 3,504,483 | |
| | 2,730 | | | | | 5.000%, 12/01/45 | | 12/25 at 100.00 | | | 2,681,301 | |
| | | | | | Total Michigan | | | | | 62,673,216 | |
| | | | |
| | | | | | Minnesota - 2.1% (1.2% of Total Investments) | | | | | | |
| | | | |
| | | | | | Baytown Township, Minnesota Charter School Lease Revenue Bonds, Saint Croix Preparatory Academy, Refunding Series 2016A: | | | | | | |
| | 155 | | | | | 4.000%, 8/01/36 | | 8/26 at 100.00 | | | 125,837 | |
| | 440 | | | | | 4.000%, 8/01/41 | | 8/26 at 100.00 | | | 327,515 | |
55
| | |
| NVG | | Nuveen AMT-Free Municipal Credit Income Fund (continued) |
| | Portfolio of Investments October 31, 2023 |
| | | | | | | | | | | | |
Principal Amount (000) | | | | | Description (a) | | Optional Call Provisions (b) | | Value | |
| | | | |
| | | | | | Minnesota (continued) | | | | | | |
| | | | |
| | $ 1,875 | | | | | Brooklyn Park, Minnesota, Charter School Lease Revenue Bonds, Prairie Seeds Academy Project, Refunding Series 2015A, 5.000%, 3/01/34 | | 3/25 at 100.00 | | $ | 1,679,938 | |
| | | | |
| | 1,720 | | | | | Deephaven, Minnesota, Charter School Lease Revenue Bonds, Eagle Ridge Academy Project, Series 2015A, 5.500%, 7/01/50 | | 7/25 at 100.00 | | | 1,513,121 | |
| | | | |
| | | | | | Duluth Economic Development Authority, Minnesota, Health Care Facilities Revenue Bonds, Essentia Health Obligated Group, Series 2018A: | | | | | | |
| | 8,520 | | | | | 4.250%, 2/15/43 | | 2/28 at 100.00 | | | 7,417,819 | |
| | 25,830 | | | | | 4.250%, 2/15/48 | | 2/28 at 100.00 | | | 21,338,982 | |
| | | | |
| | | | | | Minneapolis, Minnesota, Charter School Lease Revenue Bonds, Cyber Village Academy Project, Series 2022A: | | | | | | |
| | 340 | | | | | 5.250%, 6/01/42 | | 6/32 at 100.00 | | | 299,182 | |
| | 215 | | | | | 5.500%, 6/01/57 | | 6/32 at 100.00 | | | 185,252 | |
| | | | |
| | 1,400 | | | | | Minneapolis, Minnesota, Charter School Lease Revenue Bonds, Hiawatha Academies Project, Series 2022A, 5.500%, 7/01/52 | | 7/32 at 100.00 | | | 1,173,109 | |
| | | | |
| | 1,000 | | | | | Minneapolis-St. Paul Metropolitan Airports Commission, Minnesota, Airport Revenue Bonds, Subordinate Lien Series 2022A, 4.250%, 1/01/52 | | 1/32 at 100.00 | | | 846,021 | |
| | | | |
| | 2,225 | | | | | Minnesota Housing Finance Agency, Residential Housing Finance Bonds,
Series 2020E, 2.700%, 7/01/44 | | 7/29 at 100.00 | | | 1,698,010 | |
| | | | |
| | | | | | Minnesota Housing Finance Agency, Residential Housing Finance Bonds,
Series 2020I: | | | | | | |
| | 2,255 | | | | | 2.150%, 7/01/45 | | 1/30 at 100.00 | | | 1,409,274 | |
| | 3,625 | | | | | 2.200%, 1/01/51 | | 1/30 at 100.00 | | | 2,269,249 | |
| | | | |
| | 5,585 | | | | | Minnesota Housing Finance Agency, Residential Housing Finance Bonds,
Series 2021H, 2.550%, 1/01/46 | | 1/31 at 100.00 | | | 3,595,165 | |
| | | | |
| | | | | | Saint Cloud, Minnesota, Charter School Lease Revenue Bonds, Stride Academy Project, Series 2016A: | | | | | | |
| | 405 | | | | | 5.000%, 4/01/36 | | 4/26 at 100.00 | | | 316,636 | |
| | 605 | | | | | 5.000%, 4/01/46 | | 4/26 at 100.00 | | | 412,940 | |
| | | | |
| | 1,395 | | | | | Saint Paul Housing and Redevelopment Authority, Minnesota, Health Care Facility Revenue Bonds, HealthPartners Obligated Group, Refunding Series 2015A,
4.000%, 7/01/35 | | 7/25 at 100.00 | | | 1,283,893 | |
| | | | |
| | 90 | | | | | Saint Paul Housing and Redevelopment Authority, Minnesota, Multifamily Housing Revenue Bonds, 2700 University at Westgate Station, Series 2015B,
4.250%, 4/01/25 | | 12/23 at 100.00 | | | 88,283 | |
| | | | |
| | | | | | St. Paul Housing and Redevelopment Authority, Minnesota, Hospital Revenue Bonds, HealthEast Inc., Series 2015A: | | | | | | |
| | 2,785 | | | (d) | | 5.000%, 11/15/40, (Pre-refunded 11/15/25) | | 11/25 at 100.00 | | | 2,819,603 | |
| | 3,190 | | | (d) | | 5.000%, 11/15/44, (Pre-refunded 11/15/25) | | 11/25 at 100.00 | | | 3,229,634 | |
| | | | | | | Total Minnesota | | | | | 52,029,463 | |
| | | | |
| | | | | | Mississippi - 0.6% (0.4% of Total Investments) | | | | | | |
| | | | |
| | 3,900 | | | | | Mississippi Business Finance Corporation, Revenue Bonds, System Energy Resources, Inc. Project, Refunding Series 2021, 2.375%, 6/01/44 | | 6/26 at 100.00 | | | 2,070,936 | |
| | | | |
| | 1,905 | | | (d) | | Mississippi Development Bank, Special Obligation Bonds, Gulfport Water and Sewer System Project, Series 2005, 5.250%, 7/01/24 - AGM Insured, (ETM) | | No Opt. Call | | | 1,921,658 | |
| | | | |
| | 1,000 | | | | | Mississippi Home Corporation, Single Family Mortgage Revenue Bonds,
Series 2021A, 2.125%, 12/01/44 | | 6/30 at 100.00 | | | 570,559 | |
| | | | |
| | 13,000 | | | (e) | | Mississippi Home Corporation, Single Family Mortgage Revenue Bonds,
Series 2023C, 4.650%, 12/01/48, (UB) | | 6/32 at 100.00 | | | 11,601,865 | |
| | | | | | Total Mississippi | | | | | 16,165,018 | |
56
| | | | | | | | | | | | |
Principal Amount (000) | | | | | Description (a) | | Optional Call Provisions (b) | | Value | |
| | | | |
| | | | | | Missouri - 2.3% (1.3% of Total Investments) | | | | | | |
| | | | |
| | $ 1,650 | | | | | Chesterfield Valley Transportation Development District, Missouri, Transportation Sales Tax Revenue Bonds, Series 2015, 3.625%, 5/15/31 | | 12/23 at 100.00 | | $ | 1,527,158 | |
| | | | |
| | 2,000 | | | | | Jackson County, Missouri, Special Obligation Bonds, Series 2023A, 4.375%, 12/01/58 | | 12/33 at 100.00 | | | 1,700,486 | |
| | | | |
| | | | | | Kansas City Industrial Development Authority, Missouri, Sales Tax Revenue Bonds, Ward Parkway Center Community Improvement District, Senior Refunding & Improvement Series 2016: | | | | | | |
| | 400 | | | | | 5.000%, 4/01/36, 144A | | 4/26 at 100.00 | | | 350,323 | |
| | 1,520 | | | | | 5.000%, 4/01/46, 144A | | 4/26 at 100.00 | | | 1,219,281 | |
| | | | |
| | 15,000 | | | | | Kansas City Municipal Assistance Corporation, Missouri, Leasehold Revenue Bonds, Improvement Series 2004B-1, 0.000%, 4/15/28 - AMBAC Insured | | No Opt. Call | | | 12,429,144 | |
| | | | |
| | 4,345 | | | | | Kirkwood Industrial Development Authority, Missouri, Retirement Community Revenue Bonds, Aberdeen Heights Project, Refunding Series 2017A, 5.250%, 5/15/50 | | 5/27 at 100.00 | | | 3,023,238 | |
| | | | |
| | | | | | Liberty, Missouri, Special Obligation Tax Increment and Special Districts Bonds, Liberty Commons Project, Series 2015A: | | | | | | |
| | 1,575 | | | | | 5.750%, 6/01/35, 144A | | 6/25 at 100.00 | | | 1,380,655 | |
| | 1,055 | | | | | 6.000%, 6/01/46, 144A | | 6/25 at 100.00 | | | 891,985 | |
| | | | |
| | 7,030 | | | | | Missouri Health and Education Facilities Authority, Health Facilities Revenue Bonds, Saint Luke’s Health System, Inc., Series 2018A, 4.000%, 11/15/48 | | 5/28 at 100.00 | | | 5,745,004 | |
| | | | |
| | 5,500 | | | | | Missouri Health and Educational Facilities Authority, Health Facilities Revenue Bonds, Mercy Health, Series 2020, 4.000%, 6/01/53 | | 6/30 at 100.00 | | | 4,357,502 | |
| | | | |
| | 4,300 | | | | | Missouri Health and Educational Facilities Authority, Health Facilities Revenue Bonds, Mercy Health, Series 2023, 5.000%, 12/01/52 | | 12/33 at 100.00 | | | 4,152,595 | |
| | | | |
| | 3,825 | | | | | Missouri Health and Educational Facilities Authority, Health Facilities Revenue Bonds, Mosaic Health System, Series 2019A, 4.000%, 2/15/44 | | 2/29 at 100.00 | | | 3,079,684 | |
| | | | |
| | 1,255 | | | | | Missouri Housing Development Commission, Single Family Mortgage Revenue Bonds, First Place Homeownership Loan Program, Series 2023C, 4.950%, 11/01/48 | | 5/32 at 100.00 | | | 1,206,288 | |
| | | | |
| | 405 | | | | | Saint Louis County Industrial Development Authority, Missouri, Revenue Bonds, Friendship Village of Sunset Hills, Series 2013A, 5.875%, 9/01/43 | | 12/23 at 100.00 | | | 385,623 | |
| | | | |
| | | | | | Saint Louis County Industrial Development Authority, Missouri, Revenue Bonds, Saint Andrew’s Resources for Seniors, Series 2015A: | | | | | | |
| | 1,650 | | | | | 5.000%, 12/01/35 | | 12/25 at 100.00 | | | 1,471,659 | |
| | 455 | | | | | 5.125%, 12/01/45 | | 12/25 at 100.00 | | | 377,991 | |
| | | | |
| | 4,125 | | | | | Saint Louis, Missouri, Airport Revenue Bonds, Lambert-St. Louis International Airport, Series 2005, 5.500%, 7/01/29 - NPFG Insured | | No Opt. Call | | | 4,460,218 | |
| | | | |
| | 15,350 | | | | | Springfield Public Building Corporation, Missouri, Lease Revenue Bonds, Jordan Valley Park Projects, Series 2000A, 0.000%, 6/01/30 - AMBAC Insured | | No Opt. Call | | | 10,836,672 | |
| | | | | | Total Missouri | | | | | 58,595,506 | |
| | | | |
| | | | | | Montana - 0.3% (0.2% of Total Investments) | | | | | | |
| | | | |
| | | | | | Kalispell, Montana, Housing and Healthcare Facilities Revenue Bonds, Immanuel Lutheran Corporation, Series 2017A: | | | | | | |
| | 1,175 | | | | | 5.250%, 5/15/37 | | 5/25 at 102.00 | | | 983,368 | |
| | 375 | | | | | 5.250%, 5/15/47 | | 5/25 at 102.00 | | | 279,399 | |
| | | | |
| | | | | | Montana Board of Housing, Single Family Mortgage Bonds, Series 2023A: | | | | | | |
| | 3,090 | | | | | 4.550%, 12/01/48 | | 12/32 at 100.00 | | | 2,673,608 | |
| | 2,250 | | | | | 4.700%, 6/01/53 | | 12/32 at 100.00 | | | 2,017,929 | |
57
| | |
| NVG | | Nuveen AMT-Free Municipal Credit Income Fund (continued) |
| | Portfolio of Investments October 31, 2023 |
| | | | | | | | | | | | |
Principal Amount (000) | | | | | Description (a) | | Optional Call Provisions (b) | | Value | |
| | | | |
| | | | | | Montana (continued) | | | | | | |
| | $ 2,000 | | | | | Montana Board of Housing, Single Family Mortgage Bonds, Series 2023B,
4.875%, 12/01/48 | | 12/32 at 100.00 | | $ | 1,922,503 | |
| | | | | | | Total Montana | | | | | 7,876,807 | |
| | | | |
| | | | | | Nebraska - 1.2% (0.7% of Total Investments) | | | | | | |
| | | | |
| | | | | | Douglas County Hospital Authority 3, Nebraska, Health Facilities Revenue Bonds, Nebraska Methodist Health System, Refunding Series 2015: | | | | | | |
| | 2,125 | | | | | 4.125%, 11/01/36 | | 11/25 at 100.00 | | | 1,947,360 | |
| | 1,765 | | | | | 5.000%, 11/01/45 | | 11/25 at 100.00 | | | 1,706,540 | |
| | 3,865 | | | | | 5.000%, 11/01/48 | | 11/25 at 100.00 | | | 3,689,930 | |
| | | | |
| | 7,825 | | | | | Nebraska Investment Finance Authority, Single Family Housing Revenue Bonds, Series 2020A, 2.700%, 9/01/43 | | 3/29 at 100.00 | | | 5,831,566 | |
| | | | |
| | | | | | Nebraska Investment Finance Authority, Single Family Housing Revenue Bonds, Series 2023A: | | | | | | |
| | 5,000 | | | (e) | | 4.550%, 9/01/48, (UB) | | 3/32 at 100.00 | | | 4,385,685 | |
| | 5,000 | | | (e) | | 4.600%, 9/01/53, (UB) | | 3/32 at 100.00 | | | 4,430,650 | |
| | | | |
| | 3,250 | | | | | Nebraska Investment Finance Authority, Single Family Housing Revenue Bonds, Social Series 2023C, 4.650%, 9/01/48 | | 9/32 at 100.00 | | | 2,881,836 | |
| | | | |
| | 6,800 | | | | | Scotts Bluff County Hospital Authority 1, Nebraska, Hospital Revenue Bonds, Regional West Medical Center Project, Refunding & Improvement Series 2016A, 5.250%, 2/01/37 | | 2/27 at 100.00 | | | 6,252,756 | |
| | | | | | | Total Nebraska | | | | | 31,126,323 | |
| | | | |
| | | | | | Nevada - 1.2% (0.7% of Total Investments) | | | | | | |
| | | | |
| | 410 | | | | | Director of the State of Nevada Department of Business and Industry, Charter School Lease Revenue Bonds, Somerset Academy, Series 2018A,
5.000%, 12/15/38, 144A | | 12/25 at 100.00 | | | 367,337 | |
| | | | |
| | | | | | Henderson, Nevada, Local Improvement Bonds, Local Improvement District T-21 Black Mountain Ranch, Series 2022: | | | | | | |
| | 745 | | | | | 3.500%, 9/01/45 | | 9/31 at 100.00 | | | 491,001 | |
| | 495 | | | | | 4.000%, 9/01/51 | | 9/31 at 100.00 | | | 349,913 | |
| | | | |
| | 23,005 | | | | | Las Vegas Convention and Visitors Authority, Nevada, Convention Center Expansion Revenue Bonds, Series 2018B, 4.000%, 7/01/49 | | 7/28 at 100.00 | | | 18,980,896 | |
| | | | |
| | 2,150 | | | | | Las Vegas Convention and Visitors Authority, Nevada, Revenue Bonds, Refunding Series 2017B, 4.000%, 7/01/36 | | 7/27 at 100.00 | | | 1,998,207 | |
| | | | |
| | 960 | | | | | Las Vegas, Nevada, Sales Tax Increment Revenue Bonds, Symphony Park Tourism Improvement District, Series 2016, 4.375%, 6/15/35, 144A | | 11/23 at 100.00 | | | 827,122 | |
| | | | |
| | 500 | | | | | Neveda State Director of the Department of Business and Industry, Charter School Revenue Bonds, Doral Academy of Nevada, Series 2017A, 5.000%, 7/15/37 | | 7/25 at 100.00 | | | 461,619 | |
| | | | |
| | 3,950 | | | | | Reno, Nevada, Subordinate Lien Sales Tax Revenue Refunding Bonds, ReTrac-Reno Transporation Rail Access Corridor Project, Series 2018A, 4.000%, 6/01/43 | | 12/28 at 100.00 | | | 3,161,471 | |
| | | | |
| | 3,000 | | | | | Reno, Nevada, Subordinate Lien Sales Tax Revenue Refunding Capital Appreciation Bonds, ReTrac-Reno Transporation Rail Access Corridor Project, Series 2018C, 0.000%, 7/01/58, 144A | | 7/38 at 31.26 | | | 305,631 | |
| | | | |
| | 3,210 | | | | | Tahoe-Douglas Visitors Authority, Nevada, Stateline Revenue Bonds, Series 2020, 5.000%, 7/01/51 | | 7/30 at 100.00 | | | 2,745,245 | |
| | | | | | | Total Nevada | | | | | 29,688,442 | |
58
| | | | | | | | | | | | |
Principal Amount (000) | | | | | Description (a) | | Optional Call Provisions (b) | | Value | |
| | | | |
| | | | | | New Hampshire - 1.2% (0.7% of Total Investments) | | | | | | |
| | | | |
| | $ 13,480 | | | | | National Finance Authority, New Hampshire, Hospital Facilities Revenue Bonds, Saint Elizabeth Medical Center, Inc., Series 2021A, 4.000%, 5/01/51 | | 5/31 at 100.00 | | $ | 10,922,782 | |
| | | | |
| | 11,891 | | | | | National Finance Authority, New Hampshire, Municipal Certificates Series 2022-1 Class A, 4.375%, 9/20/36 | | No Opt. Call | | | 10,858,386 | |
| | | | |
| | 5,000 | | | | | National Finance Authority, New Hampshire, Resource Recovery Revenue Bonds, Covanta Project, Refunding Series 2018B, 4.625%, 11/01/42, 144A | | 12/23 at 100.00 | | | 3,775,522 | |
| | | | |
| | 5,630 | | | | | National Finance Authority, New Hampshire, Resource Recovery Revenue Bonds, Covanta Project, Refunding Series 2020A, 3.625%, 7/01/43, (Mandatory Put 7/02/40), 144A | | 7/25 at 100.00 | | | 3,916,077 | |
| | | | |
| | 500 | | | | | New Hampshire Health and Education Facilities Authority, Revenue Bonds, Kendal at Hanover, Series 2016, 5.000%, 10/01/40 | | 10/26 at 100.00 | | | 452,229 | |
| | | | | | | Total New Hampshire | | | | | 29,924,996 | |
| | | | |
| | | | | | New Jersey - 6.7% (3.8% of Total Investments) | | | | | | |
| | | | |
| | | | | | New Jersey Economic Development Authority, School Facilities Construction Bonds, Refunding Series 2016BBB: | | | | | | |
| | 34,310 | | | (d) | | 5.500%, 6/15/29, (Pre-refunded 12/15/26) | | 12/26 at 100.00 | | | 36,043,842 | |
| | 2,110 | | | (d) | | 5.500%, 6/15/30, (Pre-refunded 12/15/26) | | 12/26 at 100.00 | | | 2,216,628 | |
| | | | |
| | | | | | New Jersey Economic Development Authority, School Facilities Construction Bonds, Series 2005N-1: | | | | | | |
| | 6,835 | | | | | 5.500%, 9/01/24 - AMBAC Insured | | No Opt. Call | | | 6,915,064 | |
| | 5,045 | | | | | 5.500%, 9/01/28 - NPFG Insured | | No Opt. Call | | | 5,385,972 | |
| | | | |
| | | | | | New Jersey Economic Development Authority, School Facilities Construction Bonds, Series 2015WW: | | | | | | |
| | 11,335 | | | (d) | | 5.250%, 6/15/40, (Pre-refunded 6/15/25) | | 6/25 at 100.00 | | | 11,596,879 | |
| | 655 | | | (d) | | 5.250%, 6/15/40, (Pre-refunded 6/15/25) | | 6/25 at 100.00 | | | 670,133 | |
| | | | |
| | 2,305 | | | | | New Jersey Health Care Facilities Financing Authority, Revenue Bonds, Barnabas Health, Refunding Series 2014A, 5.000%, 7/01/44 | | 7/24 at 100.00 | | | 2,255,441 | |
| | | | |
| | 1,385 | | | | | New Jersey Transportation Trust Fund Authority, Transportation Program Bonds, Series 2023AA, 4.250%, 6/15/44 | | 6/33 at 100.00 | | | 1,234,793 | |
| | | | |
| | 2,035 | | | | | New Jersey Transportation Trust Fund Authority, Transportation System Bonds, Capital Appreciation Series 2010A, 0.000%, 12/15/26 | | No Opt. Call | | | 1,781,895 | |
| | | | |
| | 20,000 | | | | | New Jersey Transportation Trust Fund Authority, Transportation System Bonds, Refunding Series 2006C, 0.000%, 12/15/33 - AGM Insured | | No Opt. Call | | | 12,652,540 | |
| | | | |
| | 17,375 | | | | | New Jersey Transportation Trust Fund Authority, Transportation System Bonds,
Series 2014AA, 5.000%, 6/15/44 | | 6/24 at 100.00 | | | 16,774,982 | |
| | | | |
| | | | | | New Jersey Transportation Trust Fund Authority, Transportation System Bonds,
Series 2015AA: | | | | | | |
| | 13,690 | | | | | 4.750%, 6/15/38 | | 6/25 at 100.00 | | | 13,370,350 | |
| | 7,935 | | | | | 5.000%, 6/15/45 | | 6/25 at 100.00 | | | 7,642,604 | |
| | | | |
| | 5,000 | | | | | New Jersey Transportation Trust Fund Authority, Transportation System Bonds,
Series 2019AA, 5.250%, 6/15/43 | | 12/28 at 100.00 | | | 5,047,379 | |
| | | | |
| | 33,200 | | | | | New Jersey Turnpike Authority, Revenue Bonds, Refunding Series 2005D- 1,
5.250%, 1/01/26 - AGM Insured | | No Opt. Call | | | 34,139,457 | |
| | | | |
| | 5,000 | | | | | South Jersey Transportation Authority, New Jersey, Transportation System Revenue Bonds, Series 2020A, 4.000%, 11/01/50 | | 11/30 at 100.00 | | | 3,978,646 | |
| | | | |
| | | | | | Tobacco Settlement Financing Corporation, New Jersey, Tobacco Settlement Asset-Backed Bonds, Series 2018A: | | | | | | |
| | 1,420 | | | | | 5.000%, 6/01/46 | | 6/28 at 100.00 | | | 1,332,248 | |
| | 1,580 | | | | | 5.250%, 6/01/46 | | 6/28 at 100.00 | | | 1,553,260 | |
59
| | |
| NVG | | Nuveen AMT-Free Municipal Credit Income Fund (continued) |
| | Portfolio of Investments October 31, 2023 |
| | | | | | | | | | | | |
Principal Amount (000) | | | | | Description (a) | | Optional Call Provisions (b) | | Value | |
| | | | |
| | | | | | New Jersey (continued) | | | | | | |
| | $ 3,180 | | | | | Tobacco Settlement Financing Corporation, New Jersey, Tobacco Settlement Asset-Backed Bonds, Series 2018B, 5.000%, 6/01/46 | | 6/28 at 100.00 | | $ | 2,952,404 | |
| | | | |
| | 1,330 | | | | | Washington Township Board of Education, Mercer County, New Jersey, General Obligation Bonds, Series 2005, 5.250%, 1/01/26 - AGM Insured | | No Opt. Call | | | 1,359,599 | |
| | | | | | | Total New Jersey | | | | | 168,904,116 | |
| | | | |
| | | | | | New Mexico - 0.2% (0.1% of Total Investments) | | | | | | |
| | | | |
| | 3,345 | | | | | New Mexico Mortgage Finance Authority, Single Family Mortgage Program Bonds, Class 1 Series 2021C, 2.250%, 7/01/46 | | 7/30 at 100.00 | | | 2,291,231 | |
| | | | |
| | 1,065 | | | | | New Mexico Mortgage Finance Authority, Single Family Mortgage Program Bonds, Class 1 Series 2023C, 4.650%, 9/01/48 | | 9/32 at 100.00 | | | 944,356 | |
| | | | |
| | | | | | Santa Fe, New Mexico, Retirement Facilities Revenue Bonds, EL Castillo Retirement Residences Project, Series 2019A: | | | | | | |
| | 670 | | | | | 5.000%, 5/15/44 | | 5/26 at 103.00 | | | 526,984 | |
| | 1,200 | | | | | 5.000%, 5/15/49 | | 5/26 at 103.00 | | | 900,261 | |
| | | | |
| | 1,000 | | | | | Winrock Town Center Tax Increment Development District 1, Albuquerque, New Mexico, Gross Receipts Tax Increment Bonds, Senior Lien Series 2022,
4.250%, 5/01/40, 144A | | 5/29 at 103.00 | | | 778,939 | |
| | | | | | | Total New Mexico | | | | | 5,441,771 | |
| | | | |
| | | | | | New York - 9.2% (5.3% of Total Investments) | | | | | | |
| | | | |
| | | | | | Babylon Local Development Corporation II, New York, Education Revenue Bonds, The Academy Charter School Project, Series 2023A: | | | | | | |
| | 1,000 | | | | | 6.400%, 2/01/43 | | 2/33 at 100.00 | | | 929,991 | |
| | 2,270 | | | | | 6.650%, 2/01/53 | | 2/33 at 100.00 | | | 2,087,304 | |
| | | | |
| | 10,400 | | | | | Battery Park City Authority, New York, Revenue Bonds, Senior Sustainability Series 2023A, 5.000%, 11/01/48 | | 11/33 at 100.00 | | | 10,588,447 | |
| | | | |
| | 14,325 | | | | | Build NYC Resource Corporation, New York, Revenue Bonds, Albert Einstein College of Medicine, Inc, Series 2015, 5.500%, 9/01/45, 144A | | 9/25 at 100.00 | | | 12,864,834 | |
| | | | |
| | 1,350 | | | | | Build NYC Resource Corporation, New York, Revenue Bonds, Albert Einstein College of Medicine, Inc, Series 2023, 7.250%, 6/01/55, 144A | | 12/30 at 100.00 | | | 1,246,950 | |
| | | | |
| | 9,320 | | | | | Build NYC Resource Corporation, New York, Revenue Bonds, Family Life Academy Charter School, Series 2020A-1, 5.500%, 6/01/55, 144A | | 12/30 at 100.00 | | | 6,724,796 | |
| | | | |
| | 7,390 | | | | | Build NYC Resource Corporation, New York, Revenue Bonds, Family Life Academy Charter School, Series 2020B-1, 5.000%, 6/01/55, 144A | | 12/30 at 100.00 | | | 4,905,448 | |
| | | | |
| | 14,215 | | | (e) | | Dormitory Authority of the State of New York, General Revenue Bonds, Northwell Health Obligated Group, Series 2022A, 4.250%, 5/01/52, (UB) | | 5/32 at 100.00 | | | 11,736,829 | |
| | | | |
| | 785 | | | | | Dormitory Authority of the State of New York, Insured Revenue Bonds, Mount Sinai School of Medicine, Series 1994A, 5.150%, 7/01/24 - NPFG Insured | | No Opt. Call | | | 791,201 | |
| | | | |
| | 9,700 | | | | | Dormitory Authority of the State of New York, Revenue Bonds, Columbia University, Series 2017A, 5.000%, 10/01/47 | | No Opt. Call | | | 10,049,220 | |
| | | | |
| | 4,070 | | | | | Dormitory Authority of the State of New York, Revenue Bonds, Icahn School of Medicine at Mount Sinai, Refunding Series 2015A, 5.000%, 7/01/45 | | 7/25 at 100.00 | | | 3,780,791 | |
| | | | |
| | | | | | Dormitory Authority of the State of New York, Revenue Bonds, Orange Regional Medical Center Obligated Group, Series 2015: | | | | | | |
| | 2,700 | | | | | 5.000%, 12/01/40, 144A | | 6/25 at 100.00 | | | 2,360,658 | |
| | 5,600 | | | | | 5.000%, 12/01/45, 144A | | 6/25 at 100.00 | | | 4,699,435 | |
| | | | |
| | 2,095 | | | | | Genesee County Funding Corporation, New York, Revenue Bonds, Rochester Regional Health Project, Series 2022A, 5.250%, 12/01/52 | | 12/32 at 100.00 | | | 1,984,672 | |
60
| | | | | | | | | | | | |
Principal Amount (000) | | | | | Description (a) | | Optional Call Provisions (b) | | Value | |
| | | | |
| | | | | | New York (continued) | | | | | | |
| | $ 2,120 | | | | | Hempstead Town Local Development Corporation, New York, Education Revenue Bonds, The Academy Charter School Project, Refunding Series 2020B,
5.570%, 2/01/41 | | 2/30 at 100.00 | | $ | 1,820,752 | |
| | | | |
| | 2,695 | | | | | Hempstead Town Local Development Corporation, New York, Education Revenue Bonds, The Academy Charter School Project, Series 2017A, 6.240%, 2/01/47 | | 2/27 at 100.00 | | | 2,399,156 | |
| | | | |
| | 2,965 | | | | | Hempstead Town Local Development Corporation, New York, Education Revenue Bonds, The Academy Charter School Project, Series 2018A, 6.760%, 2/01/48 | | 2/28 at 100.00 | | | 2,819,218 | |
| | | | |
| | | | | | Hempstead Town Local Development Corporation, New York, Education Revenue Bonds, The Academy Charter School Project, Series 2020A: | | | | | | |
| | 400 | | | | | 5.530%, 2/01/40 | | 2/30 at 100.00 | | | 345,509 | |
| | 1,270 | | | | | 5.730%, 2/01/50 | | 2/30 at 100.00 | | | 1,042,099 | |
| | | | |
| | | | | | Hempstead Town Local Development Corporation, New York, Education Revenue Bonds, The Academy Charter School Project, Series 2021A: | | | | | | |
| | 1,210 | | | | | 4.450%, 2/01/41 | | 2/30 at 100.00 | | | 885,134 | |
| | 2,380 | | | | | 4.600%, 2/01/51 | | 2/30 at 100.00 | | | 1,605,614 | |
| | | | |
| | | | | | Metropolitan Transportation Authority, New York, Transportation Revenue Bonds, Green Climate Bond Certified Series 2020C-1: | | | | | | |
| | 2,790 | | | | | 5.000%, 11/15/50 | | 5/30 at 100.00 | | | 2,657,329 | |
| | 3,155 | | | | | 5.250%, 11/15/55 | | 5/30 at 100.00 | | | 3,103,495 | |
| | | | |
| | 7,495 | | | | | Metropolitan Transportation Authority, New York, Transportation Revenue Bonds, Green Climate Bond Certified Series 2020D-2, 4.000%, 11/15/47 | | 11/30 at 100.00 | | | 6,141,010 | |
| | | | |
| | 5,000 | | | | | Metropolitan Transportation Authority, New York, Transportation Revenue Bonds, Green Climate Bond Certified Series 2020D-3, 4.000%, 11/15/49 | | 11/30 at 100.00 | | | 4,039,054 | |
| | | | |
| | 2,210 | | | | | Metropolitan Transportation Authority, New York, Transportation Revenue Bonds, Refunding Green Climate Certified Series 2017C-1, 5.000%, 11/15/24 | | No Opt. Call | | | 2,222,505 | |
| | | | |
| | 7,520 | | | | | Metropolitan Transportation Authority, New York, Transportation Revenue Bonds, Refunding Green Climate Certified Series 2020E, 4.000%, 11/15/45 | | 11/30 at 100.00 | | | 6,220,324 | |
| | | | |
| | 3,585 | | | | | Monroe County Industrial Development Corporation, New York, Revenue Bonds, Saint Anns Community Project, Series 2019, 5.000%, 1/01/50 | | 1/26 at 103.00 | | | 2,671,434 | |
| | | | |
| | 1,000 | | | | | Nassau County Local Economic Assistance Corporation, New York, Revenue Bonds, Catholic Health Services of Long Island Obligated Group Project,
Series 2014, 5.000%, 7/01/31 | | 7/24 at 100.00 | | | 1,001,711 | |
| | | | |
| | 3,475 | | | | | Nassau County, New York, General Obligation Bonds, General Improvement
Series 2022A, 4.000%, 4/01/41 | | 4/32 at 100.00 | | | 3,110,696 | |
| | | | |
| | 20,000 | | | | | New York City Housing Development Corporation, New York, Sustainable Impact Revenue Bonds, Williamsburg Housing Preservation LP, Series 2020A,
2.800%, 2/01/50 | | 2/28 at 100.00 | | | 12,047,186 | |
| | | | |
| | 5,000 | | | | | New York City Housing Development Corporation, New York, House Impact Revenue Bonds, Green Series 2023A, 4.800%, 2/01/53 | | 8/31 at 100.00 | | | 4,628,373 | |
| | | | |
| | 11,570 | | | | | New York City Municipal Water Finance Authority, New York, Water and Sewer System Second General Resolution Revenue Bonds, Fiscal 2016 Series BB-1,
5.000%, 6/15/46 | | 6/25 at 100.00 | | | 11,519,969 | |
| | | | |
| | 10,000 | | | (e) | | New York City Municipal Water Finance Authority, New York, Water and Sewer System Second General Resolution Revenue Bonds, Fiscal 2023 Series DD, 4.125%, 6/15/46, (UB) | | 6/33 at 100.00 | | | 8,764,048 | |
| | | | |
| | 5 | | | | | New York City, New York, General Obligation Bonds, Fiscal Series 2005M,
5.000%, 4/01/26 - FGIC Insured | | 12/23 at 100.00 | | | 5,005 | |
61
| | |
| NVG | | Nuveen AMT-Free Municipal Credit Income Fund (continued) |
| | Portfolio of Investments October 31, 2023 |
| | | | | | | | | | | | |
Principal Amount (000) | | | | | Description (a) | | Optional Call Provisions (b) | | Value | |
| | | | |
| | | | | | New York (continued) | | | | | | |
| | $ 28,615 | | | | | New York Liberty Development Corporation, New York, Liberty Revenue Bonds, 3 World Trade Center Project, Class 1 Series 2014, 5.000%, 11/15/44, 144A | | 11/24 at 100.00 | | $ | 25,629,033 | |
| | | | |
| | 25,035 | | | | | New York Liberty Development Corporation, New York, Liberty Revenue Bonds, 7 World Trade Center Project, Refunding Green Series 2022A-CL2, 3.125%, 9/15/50 | | 3/30 at 100.00 | | | 16,321,834 | |
| | | | |
| | 2,560 | | | | | New York Liberty Development Corporation, New York, Liberty Revenue Bonds, Bank of America Tower at One Bryant Park Project, Second Priority Refunding Series 2019 Class 3, 2.800%, 9/15/69 | | 3/29 at 100.00 | | | 2,179,960 | |
| | | | |
| | 3,500 | | | | | New York State Housing Finance Agency, Affordable Housing Revenue Bonds, Climate Bond Certified/Sustainability Series 2019P, 3.050%, 11/01/49 | | 5/28 at 100.00 | | | 2,271,462 | |
| | | | |
| | 6,500 | | | | | New York State Mortgage Agency, Homeowner Mortgage Revenue Bonds,
Series 211, 3.750%, 10/01/43 | | 4/27 at 100.00 | | | 5,280,319 | |
| | | | |
| | | | | | New York State Mortgage Agency, Homeowner Mortgage Revenue Bonds,
Series 252: | | | | | | |
| | 2,140 | | | | | 4.550%, 10/01/48 | | 4/33 at 100.00 | | | 1,853,060 | |
| | 2,000 | | | | | 4.650%, 10/01/53 | | 4/33 at 100.00 | | | 1,738,845 | |
| | | | |
| | 5,000 | | | | | Triborough Bridge and Tunnel Authority, New York, General Revenue Bonds, MTA Bridges & Tunnels, Series 2022A, 4.000%, 11/15/52 | | 11/32 at 100.00 | | | 4,155,959 | |
| | | | |
| | 4,500 | | | | | Triborough Bridge and Tunnel Authority, New York, General Revenue Bonds, MTA Bridges & Tunnels, Series 2023B-1, 5.250%, 11/15/53 | | 11/33 at 100.00 | | | 4,573,123 | |
| | | | |
| | 10,060 | | | | | Triborough Bridge and Tunnel Authority, New York, Sales Tax Revenue Bonds, MTA Bridges & Tunnels, TBTA Capital Lockbox-City Sales Tax, Series 2022A,
4.000%, 5/15/57 | | 11/32 at 100.00 | | | 8,201,028 | |
| | | | |
| | 7,110 | | | | | TSASC Inc., New York, Tobacco Asset-Backed Bonds, Series 2006,
5.000%, 6/01/48 | | 6/27 at 100.00 | | | 5,977,354 | |
| | | | | | | Total New York | | | | | 231,982,174 | |
| | | | |
| | | | | | North Carolina - 0.1% (0.0% of Total Investments) | | | | | | |
| | | | |
| | 2,150 | | | | | North Carolina Medical Care Commission, Retirement Facilities First Mortgage Revenue Bonds, Aldersgate United Retirement Community Inc., Refunding Series 2017A, 5.000%, 7/01/47 | | 7/27 at 100.00 | | | 1,514,848 | |
| | | | | | | Total North Carolina | | | | | 1,514,848 | |
| | | | |
| | | | | | North Dakota - 2.2% (1.2% of Total Investments) | | | | | | |
| | | | |
| | 9,950 | | | | | Cass County, North Dakota, Health Care Facilities Revenue Bonds, Essential Health Obligated Group, Series 2018B, 4.250%, 2/15/48 | | 2/28 at 100.00 | | | 8,220,010 | |
| | | | |
| | 4,525 | | | | | Grand Forks, North Dakota, Health Care System Revenue Bonds, Altru Health System Obligated Group, Series 2017A, 5.000%, 12/01/42 | | 12/27 at 100.00 | | | 4,053,716 | |
| | | | |
| | | | | | Grand Forks, North Dakota, Health Care System Revenue Bonds, Altru Health System Obligated Group, Series 2021: | | | | | | |
| | 1,000 | | | | | 3.000%, 12/01/46 - AGM Insured | | 12/31 at 100.00 | | | 644,211 | |
| | 5,000 | | | | | 3.000%, 12/01/51 - AGM Insured | | 12/31 at 100.00 | | | 3,057,081 | |
| | | | |
| | 1,000 | | | | | Grand Forks, North Dakota, Senior Housing & Nursing Facilities Revenue Bonds, Valley Homes and Services Obligated Group, Series 2017, 5.000%, 12/01/36 | | 12/26 at 100.00 | | | 846,388 | |
| | | | |
| | 2,000 | | | | | Horace, Cass County, North Dakota, General Obligation Bonds, Refunding Improvement Series 2023A,, 5.000%, 5/01/48 | | 5/31 at 100.00 | | | 1,717,577 | |
| | | | |
| | 3,820 | | | | | North Dakota Housing Finance Agency, Home Mortgage Finance Program Bonds, Series 2020B, 2.500%, 7/01/44 | | 1/30 at 100.00 | | | 2,785,811 | |
| | | | |
| | 1,000 | | | | | North Dakota Housing Finance Agency, Home Mortgage Finance Program Bonds, Social Series 2022F, 4.250%, 1/01/47 | | 1/32 at 100.00 | | | 879,954 | |
62
| | | | | | | | | | | | |
Principal Amount (000) | | | | | Description (a) | | Optional Call Provisions (b) | | Value | |
| | | | |
| | | | | | North Dakota (continued) | | | | | | |
| | $ 1,000 | | | | | North Dakota Housing Finance Agency, Home Mortgage Finance Program Bonds, Social Series 2023A, 4.700%, 7/01/47 | | 7/32 at 100.00 | | $ | 919,101 | |
| | | | |
| | | | | | North Dakota Housing Finance Agency, Home Mortgage Finance Program Bonds, Social Series 2023D: | | | | | | |
| | 1,500 | | | | | 4.500%, 7/01/43 | | 7/32 at 100.00 | | | 1,390,652 | |
| | 560 | | | | | 4.550%, 7/01/48 | | 7/32 at 100.00 | | | 489,144 | |
| | | | |
| | | | | | Ward County Health Care, North Dakota, Revenue Bonds, Trinity Obligated Group, Series 2017C: | | | | | | |
| | 8,300 | | | | | 5.000%, 6/01/38 | | 6/28 at 100.00 | | | 6,714,081 | |
| | 1,700 | | | | | 5.000%, 6/01/43 | | 6/28 at 100.00 | | | 1,278,291 | |
| | 28,050 | | | | | 5.000%, 6/01/53 | | 6/28 at 100.00 | | | 19,334,037 | |
| | | | |
| | 2,535 | | | (c) | | Williston, North Dakota, Multifamily Housing Revenue Bonds, Eagle Crest Apartments LLC Project, Series 2013, 7.750%, 9/01/38 | | 12/23 at 100.00 | | | 1,774,500 | |
| | | | | | | Total North Dakota | | | | | 54,104,554 | |
| | | | |
| | | | | | Ohio - 9.2% (5.3% of Total Investments) | | | | | | |
| | | | |
| | 2,000 | | | | | Akron, Bath and Copley Joint Township Hospital District, Ohio, Hospital Facilities Revenue Bonds, Summa Health Obligated Group, Refunding Series 2020,
3.000%, 11/15/40 | | 11/30 at 100.00 | | | 1,383,152 | |
| | | | |
| | 70,220 | | | | | Buckeye Tobacco Settlement Financing Authority, Ohio, Tobacco Settlement Asset-Backed Revenue Bonds, Refunding Senior Lien Capital Appreciation Series 2020B-3 Class 2, 0.000%, 6/01/57 | | 6/30 at 22.36 | | | 5,924,911 | |
| | | | |
| | | | | | Buckeye Tobacco Settlement Financing Authority, Ohio, Tobacco Settlement Asset-Backed Revenue Bonds, Refunding Senior Lien Series 2020A-2 Class 1: | | | | | | |
| | 54,040 | | | | | 3.000%, 6/01/48 | | 6/30 at 100.00 | | | 35,619,850 | |
| | 10,645 | | | | | 4.000%, 6/01/48 | | 6/30 at 100.00 | | | 8,519,745 | |
| | | | |
| | 37,385 | | | | | Buckeye Tobacco Settlement Financing Authority, Ohio, Tobacco Settlement Asset-Backed Revenue Bonds, Refunding Senior Lien Series 2020B-2 Class 2, 5.000%, 6/01/55 | | 6/30 at 100.00 | | | 30,625,594 | |
| | | | |
| | | | | | Centerville, Ohio Health Care Improvement Revenue Bonds, Graceworks Lutheran Services, Refunding & Improvement Series 2017: | | | | | | |
| | 2,750 | | | | | 5.250%, 11/01/37 | | 11/27 at 100.00 | | | 2,467,490 | |
| | 3,200 | | | | | 5.250%, 11/01/47 | | 11/27 at 100.00 | | | 2,626,915 | |
| | | | |
| | 5,000 | | | | | County of Lucas, Ohio, Hospital Revenue Bonds, ProMedica Healthcare Obligated Group, Series 2018A, 5.250%, 11/15/48 | | 11/28 at 100.00 | | | 3,833,661 | |
| | | | |
| | 37,150 | | | (e) | | Cuyahoga County, Ohio, Certificates of Participation, Convention Hotel Project,
Series 2014, 4.375%, 12/01/44, (UB) | | 6/24 at 100.00 | | | 32,438,106 | |
| | | | |
| | | | | | Darke County, Ohio, Hospital Facilities Revenue Bonds, Wayne Healthcare Project, Series 2019A: | | | | | | |
| | 1,165 | | | | | 4.000%, 9/01/40 | | 9/29 at 100.00 | | | 898,130 | |
| | 1,750 | | | | | 4.000%, 9/01/45 | | 9/29 at 100.00 | | | 1,245,667 | |
| | 2,000 | | | | | 5.000%, 9/01/49 | | 9/29 at 100.00 | | | 1,597,356 | |
| | | | |
| | 6,840 | | | | | Franklin County Convention Facilities Authority, Ohio, Hotel Project Revenue Bonds, Greater Columbus Convention Center Hotel Expansion Project, Series 2019, 5.000%, 12/01/51 | | 12/29 at 100.00 | | | 5,577,219 | |
| | | | |
| | 4,000 | | | | | Franklin County, Ohio, Revenue Bonds, Trinity Health Credit Group, Series 2017A, 3.250%, 12/01/42 | | 12/27 at 100.00 | | | 2,945,406 | |
| | | | |
| | | | | | Middletown City School District, Butler County, Ohio, General Obligation Bonds, Refunding Series 2007: | | | | | | |
| | 4,380 | | | | | 5.250%, 12/01/27 - AGM Insured | | No Opt. Call | | | 4,590,843 | |
| | 6,000 | | | | | 5.250%, 12/01/31 - AGM Insured | | No Opt. Call | | | 6,454,684 | |
63
| | |
| NVG | | Nuveen AMT-Free Municipal Credit Income Fund (continued) |
| | Portfolio of Investments October 31, 2023 |
| | | | | | | | | | | | |
Principal Amount (000) | | | | | Description (a) | | Optional Call Provisions (b) | | Value | |
| | | | |
| | | | | | Ohio (continued) | | | | | | |
| | $ 12,000 | | | | | Muskingum County, Ohio, Hospital Facilities Revenue Bonds, Genesis HealthCare System Obligated Group Project, Series 2013, 5.000%, 2/15/48 | | 12/23 at 100.00 | | $ | 9,752,748 | |
| | | | |
| | 25,880 | | | | | Ohio Air Quality Development Authority, Ohio, Pollution Control Revenue Bonds, FirstEnergy Nuclear Generation Project, Refunding Series 2009A, 4.750%, 6/01/33, (Mandatory Put 6/01/22) | | No Opt. Call | | | 23,673,746 | |
| | | | |
| | 490 | | | | | Ohio Higher Educational Facility Commission, Senior Hospital Parking Revenue Bonds, University Circle Incorporated 2020 Project, Series 2020, 5.000%, 1/15/50 | | 1/30 at 100.00 | | | 435,673 | |
| | | | |
| | 1,240 | | | | | Ohio State, Turnpike Revenue Bonds, Ohio Turnpike and Infrastructutre Commission Infrastructure Projects, Junior Lien, Capital Appreciation Series 2013A-3, 5.800%, 2/15/36 | | 2/31 at 100.00 | | | 1,375,690 | |
| | | | |
| | 20,505 | | | | | Ohio Water Development Authority, Pollution Control Revenue Refunding Bonds, FirstEnergy Nuclear Generating Corporation Project, Series 2009A,
4.750%, 6/01/33, (Mandatory Put 6/01/22) | | No Opt. Call | | | 18,756,961 | |
| | | | |
| | 20,480 | | | | | Ohio Water Development Authority, Pollution Control Revenue Refunding Bonds, FirstEnergy Nuclear Generating Corporation Project, Series 2010B, 4.750%, 6/01/33, (Mandatory Put 6/01/22) | | No Opt. Call | | | 18,734,092 | |
| | | | |
| | 2,965 | | | | | Port of Greater Cincinnati Development Authority, Ohio, Special Obligation Tax Increment Financing Revenue Bonds, Cooperative Township Public Parking Project, Gallery at Kenwood, Senior Lien Series 2019A, 5.000%, 11/01/51 | | 11/30 at 100.00 | | | 2,212,376 | |
| | | | |
| | 1,330 | | | | | Tuscarawas County Economic Development and Finance Alliance, Ohio, Higher Education Facilities Revenue Bonds, Ashland University, Refunding & Improvement Series 2015, 6.000%, 3/01/45 | | 3/25 at 100.00 | | | 1,212,352 | |
| | | | |
| | 9,495 | | | | | Washington County, Ohio, Hospital Facilities Revenue Bonds, Memorial Health System Obligated Group, Series 2022, 6.750%, 12/01/52 | | 12/32 at 100.00 | | | 9,133,479 | |
| | | | | | | Total Ohio | | | | | 232,035,846 | |
| | | | |
| | | | | | Oklahoma - 1.0% (0.6% of Total Investments) | | | | | | |
| | | | |
| | | | | | Oklahoma Development Finance Authority, Health System Revenue Bonds, OU Medicine Project, Series 2018B: | | | | | | |
| | 3,965 | | | | | 5.500%, 8/15/52 | | 8/28 at 100.00 | | | 3,437,817 | |
| | 20,510 | | | | | 5.500%, 8/15/57 | | 8/28 at 100.00 | | | 17,540,080 | |
| | | | |
| | | | | | Oklahoma Development Finance Authority, Health System Revenue Bonds, OU Medicine Project, Taxable Series 2022: | | | | | | |
| | 1,150 | | | | | 5.500%, 8/15/41 | | 8/32 at 100.00 | | | 1,011,266 | |
| | 1,390 | | | | | 5.500%, 8/15/44 | | 8/32 at 100.00 | | | 1,198,589 | |
| | | | |
| | 2,340 | | | | | Tulsa County Industrial Authority, Oklahoma, Senior Living Community Revenue Bonds, Montereau, Inc Project, Refunding Series 2017, 5.250%, 11/15/45 | | 11/25 at 102.00 | | | 2,087,632 | |
| | | | | | | Total Oklahoma | | | | | 25,275,384 | |
| | | | |
| | | | | | Oregon - 0.1% (0.1% of Total Investments) | | | | | | |
| | | | |
| | | | | | Clackamas County Hospital Facility Authority, Oregon, Revenue Bonds, Rose Villa Inc., Series 2020A: | | | | | | |
| | 500 | | | | | 5.125%, 11/15/40 | | 11/25 at 102.00 | | | 440,098 | |
| | 220 | | | | | 5.250%, 11/15/50 | | 11/25 at 102.00 | | | 183,010 | |
| | 315 | | | | | 5.375%, 11/15/55 | | 11/25 at 102.00 | | | 261,665 | |
| | | | |
| | | | | | Multnomah County Hospital Facilities Authority, Oregon, Revenue Bonds, Mirabella South Waterfront, Refunding Series 2014A: | | | | | | |
| | 1,000 | | | (d) | | 5.400%, 10/01/44, (Pre-refunded 10/01/24) | | 10/24 at 100.00 | | | 1,010,790 | |
| | 800 | | | (d) | | 5.500%, 10/01/49, (Pre-refunded 10/01/24) | | 10/24 at 100.00 | | | 809,341 | |
| | | | | | | Total Oregon | | | | | 2,704,904 | |
64
| | | | | | | | | | | | |
Principal Amount (000) | | | | | Description (a) | | Optional Call Provisions (b) | | Value | |
| | | | |
| | | | | | Pennsylvania - 5.3% (3.0% of Total Investments) | | | | | | |
| | | | |
| | $ 14,790 | | | | | Allegheny County Hospital Development Authority, Pennsylvania, Revenue Bonds, Allegheny Health Network Obligated Group Issue, Series 2018A, 4.000%, 4/01/44 | | 4/28 at 100.00 | | $ | 11,616,104 | |
| | | | |
| | 2,540 | | | | | Allentown Neighborhood Improvement Zone Development Authority, Pennsylvania, Tax Revenue Bonds, City Center Refunding Project, Series 2017, 5.000%, 5/01/42, 144A | | 5/27 at 100.00 | | | 2,327,496 | |
| | | | |
| | 13,235 | | | | | Beaver County Industrial Development Authority, Pennsylvania, Pollution Control Revenue Bonds, FirstEnergy Generation Project, Refunding Series 2006A,
4.375%, 1/01/35, (Mandatory Put 7/01/33) | | No Opt. Call | | | 12,288,862 | |
| | | | |
| | 9,365 | | | | | Beaver County Industrial Development Authority, Pennsylvania, Pollution Control Revenue Refunding Bonds, FirstEnergy Generation Project, Series 2008B,
3.750%, 10/01/47 | | 4/31 at 100.00 | | | 6,258,339 | |
| | | | |
| | 20,970 | | | | | Berks County Industrial Development Authority, Pennsylvania, Health System Revenue Bonds, Tower Health Project, Series 2017, 5.000%, 11/01/50 | | 11/27 at 100.00 | | | 11,440,045 | |
| | | | |
| | | | | | Bucks County Industrial Development Authority, Pennsylvania, Revenue Bonds, School Lane Charter School Project, Series 2016: | | | | | | |
| | 2,410 | | | | | 5.125%, 3/15/36 | | 3/27 at 100.00 | | | 2,331,940 | |
| | 6,420 | | | | | 5.125%, 3/15/46 | | 3/27 at 100.00 | | | 5,645,770 | |
| | | | |
| | 1,000 | | | | | Butler County Hospital Authority, Pennsylvania, Hospital Revenue Bonds, Butler Health System Project, Series 2015A, 5.000%, 7/01/39 | | 7/25 at 100.00 | | | 886,481 | |
| | | | |
| | 10,975 | | | | | Commonwealth Financing Authority, Pennsylvania, State Appropriation Lease Bonds, Master Settlement, Series 2018, 4.000%, 6/01/39 - AGM Insured | | 6/28 at 100.00 | | | 9,832,272 | |
| | | | |
| | | | | | Cumberland County Municipal Authority, Pennsylvania, Revenue Bonds, Diakon Lutheran Social Ministries Project, Series 2015: | | | | | | |
| | 435 | | | | | 5.000%, 1/01/29 | | 1/25 at 100.00 | | | 430,879 | |
| | 395 | | | (d) | | 5.000%, 1/01/29, (Pre-refunded 1/01/25) | | 1/25 at 100.00 | | | 399,331 | |
| | 170 | | | (d) | | 5.000%, 1/01/29, (Pre-refunded 1/01/25) | | 1/25 at 100.00 | | | 171,864 | |
| | | | |
| | 2,500 | | | | | Dubois Hospital Authority, Pennsylvania, Hospital Revenue Bonds, Penn Highlands Healthcare, Series 2018, 5.000%, 7/15/48 | | 1/28 at 100.00 | | | 2,284,101 | |
| | | | |
| | 1,250 | | | | | Lancaster County Hospital Authority, Pennsylvania, Revenue Bonds, Landis Homes Retirement Community Project, Refunding Series 2015A, 5.000%, 7/01/45 | | 7/25 at 100.00 | | | 1,033,582 | |
| | | | |
| | 820 | | | (d) | | Lehigh County Authority, Pennsylvania, Water and Sewer Revenue Bonds, Allentown Concession, Series 2013A, 5.125%, 12/01/47, (Pre-refunded 12/01/23) | | 12/23 at 100.00 | | | 820,811 | |
| | | | |
| | 1,750 | | | | | McCandless Industrial Development Authority, Pennsylvania, La Roche University Revenue Bonds, Series A and B of 2022, 6.750%, 12/01/46 | | 12/32 at 100.00 | | | 1,524,425 | |
| | | | |
| | | | | | Montgomery County Industrial Development Authority, Pennsylvania, Health System Revenue Bonds, Albert Einstein Healthcare Network Issue, Series 2015A: | | | | | | |
| | 11,030 | | | (d) | | 5.250%, 1/15/45, (Pre-refunded 1/15/25) | | 1/25 at 100.00 | | | 11,199,856 | |
| | 1,200 | | | (d) | | 5.250%, 1/15/46, (Pre-refunded 1/15/25) | | 1/25 at 100.00 | | | 1,218,479 | |
| | | | |
| | 3,500 | | | | | Pennsylvania Housing Finance Agency, Single Family Mortgage Revenue Bonds, Series 2019-131A, 3.100%, 10/01/44 | | 4/29 at 100.00 | | | 2,464,425 | |
| | | | |
| | 3,415 | | | | | Pennsylvania Housing Finance Agency, Single Family Mortgage Revenue Bonds, Social Series 2021-135A, 2.500%, 10/01/50 | | 10/30 at 100.00 | | | 1,878,390 | |
| | | | |
| | 13,550 | | | | | Pennsylvania Turnpike Commission, Oil Franchise Tax Revenue Bonds, Senior Series 2018A, 5.250%, 12/01/44 | | 12/28 at 100.00 | | | 13,826,228 | |
| | | | |
| | 3,505 | | | | | Pennsylvania Turnpike Commission, Turnpike Revenue Bonds, Series 2015A-1, 5.000%, 12/01/45 | | 6/25 at 100.00 | | | 3,446,015 | |
65
| | |
| NVG | | Nuveen AMT-Free Municipal Credit Income Fund (continued) |
| | Portfolio of Investments October 31, 2023 |
| | | | | | | | | | | | |
Principal Amount (000) | | | | | Description (a) | | Optional Call Provisions (b) | | Value | |
| | | | |
| | | | | | Pennsylvania (continued) | | | | | | |
| | $ 11,000 | | | | | Pennsylvania Turnpike Commission, Turnpike Revenue Bonds, Subordinate
Series 2009C, 6.250%, 6/01/33 - AGM Insured | | 6/26 at 100.00 | | $ | 11,626,648 | |
| | | | |
| | 15,000 | | | | | Pennsylvania Turnpike Commission, Turnpike Revenue Bonds, Subordinate
Series 2015B-1, 5.000%, 12/01/45 | | 12/25 at 100.00 | | | 14,707,046 | |
| | | | |
| | 5,000 | | | | | Pennsylvania Turnpike Commission, Turnpike Revenue Bonds, Subordinate
Series 2019A, 4.000%, 12/01/49 | | 12/29 at 100.00 | | | 4,068,585 | |
| | | | | | Total Pennsylvania | | | | | 133,727,974 | |
| | | | |
| | | | | | Puerto Rico - 7.6% (4.3% of Total Investments) | | | | | | |
| | | | |
| | 4,934 | | | | | Cofina Class 2 Trust Tax-Exempt Class 2047, Puerto Rico. Unit Exchanged From Cusip 74529JAN5, 0.000%, 8/01/47 | | No Opt. Call | | | 1,229,112 | |
| | | | |
| | 9,761 | | | | | Cofina Class 2 Trust Tax-Exempt Class 2054, Puerto Rico. Unit Exchanged From Cusip 74529JAP0, 0.000%, 8/01/54 | | No Opt. Call | | | 1,764,344 | |
| | | | |
| | | | | | Puerto Rico Aqueduct and Sewerage Authority, Revenue Bonds, Refunding Senior Lien Series 2020A: | | | | | | |
| | 8,000 | | | | | 5.000%, 7/01/35, 144A | | 7/30 at 100.00 | | | 7,671,660 | |
| | 14,625 | | | | | 5.000%, 7/01/47, 144A | | 7/30 at 100.00 | | | 13,007,723 | |
| | | | |
| | | | | | Puerto Rico Aqueduct and Sewerage Authority, Revenue Bonds, Refunding Senior Lien Series 2021B: | | | | | | |
| | 10,090 | | | | | 5.000%, 7/01/33, 144A | | 7/31 at 100.00 | | | 9,885,031 | |
| | 5,000 | | | | | 5.000%, 7/01/37, 144A | | 7/31 at 100.00 | | | 4,715,371 | |
| | 7,510 | | | | | 4.000%, 7/01/42, 144A | | 7/31 at 100.00 | | | 6,017,238 | |
| | 8,070 | | | | | 4.000%, 7/01/47, 144A | | 7/31 at 100.00 | | | 6,152,508 | |
| | | | |
| | 145 | | | | | Puerto Rico Public Finance Corporation, Commonwealth Appropriation Bonds, Series 1998A, 5.125%, 6/01/24 - AMBAC Insured | | No Opt. Call | | | 145,923 | |
| | | | |
| | | | | | Puerto Rico Sales Tax Financing Corporation, Sales Tax Revenue Bonds, Restructured 2018A-1: | | | | | | |
| | 2,000 | | | | | 0.000%, 7/01/29 | | 7/28 at 98.64 | | | 1,539,753 | |
| | 990 | | | | | 4.500%, 7/01/34 | | 7/25 at 100.00 | | | 945,465 | |
| | 4,614 | | | | | 4.550%, 7/01/40 | | 7/28 at 100.00 | | | 4,106,993 | |
| | 51,890 | | | | | 0.000%, 7/01/46 | | 7/28 at 41.38 | | | 12,927,164 | |
| | 26,599 | | | | | 0.000%, 7/01/51 | | 7/28 at 30.01 | | | 4,808,086 | |
| | 13,340 | | | | | 4.750%, 7/01/53 | | 7/28 at 100.00 | | | 11,300,590 | |
| | 30,300 | | | | | 5.000%, 7/01/58 | | 7/28 at 100.00 | | | 26,527,889 | |
| | | | |
| | 723 | | | | | Puerto Rico Sales Tax Financing Corporation, Sales Tax Revenue Bonds, Restructured Cofina Project Series 2019B-2, 4.536%, 7/01/53 | | 7/28 at 100.00 | | | 590,781 | |
| | | | |
| | | | | | Puerto Rico Sales Tax Financing Corporation, Sales Tax Revenue Bonds, Taxable Restructured Cofina Project Series 2019A-2: | | | | | | |
| | 14,384 | | | | | 4.329%, 7/01/40 | | 7/28 at 100.00 | | | 12,461,226 | |
| | 7,385 | | | | | 4.329%, 7/01/40 | | 7/28 at 100.00 | | | 6,397,814 | |
| | 7,613 | | | | | 4.784%, 7/01/58 | | 7/28 at 100.00 | | | 6,403,321 | |
| | | | |
| | | | | | Puerto Rico, General Obligation Bonds, Restructured Series 2022A-1: | | | | | | |
| | 5,761 | | | | | 5.625%, 7/01/29 | | No Opt. Call | | | 5,894,929 | |
| | 3,899 | | | | | 5.750%, 7/01/31 | | No Opt. Call | | | 4,017,914 | |
| | 21,523 | | | | | 0.000%, 7/01/33 | | 7/31 at 89.94 | | | 12,328,269 | |
| | 10,541 | | | | | 4.000%, 7/01/33 | | 7/31 at 103.00 | | | 9,187,444 | |
| | 8,749 | | | | | 4.000%, 7/01/35 | | 7/31 at 103.00 | | | 7,354,327 | |
| | 10,727 | | | | | 4.000%, 7/01/37 | | 7/31 at 103.00 | | | 8,736,124 | |
| | 4,482 | | | | | 4.000%, 7/01/41 | | 7/31 at 103.00 | | | 3,468,488 | |
| | 1,660 | | | | | 4.000%, 7/01/46 | | 7/31 at 103.00 | | | 1,216,861 | |
| | | | | | Total Puerto Rico | | | | | 190,802,348 | |
66
| | | | | | | | | | | | |
Principal Amount (000) | | | | | Description (a) | | Optional Call Provisions (b) | �� | Value | |
| | | | |
| | | | | | Rhode Island - 2.1% (1.2% of Total Investments) | | | | | | |
| | | | |
| | $ 3,430 | | | | | Rhode Island Housing & Mortgage Finance Corporation, Homeownership Opportunity Bond Program, 2019 Series 71, 3.100%, 10/01/44 | | 4/29 at 100.00 | | $ | 2,762,343 | |
| | | | |
| | 11,005 | | | | | Rhode Island Housing & Mortgage Finance Corporation, Homeownership Opportunity Bond Program, 2022 Series 76A, 2.550%, 10/01/42 | | 4/31 at 100.00 | | | 7,254,412 | |
| | | | |
| | 295,135 | | | | | Rhode Island Tobacco Settlement Financing Corporation, Tobacco Settlement Asset-Backed Bonds, Series 2007A, 0.000%, 6/01/52 | | 11/23 at 18.50 | | | 41,420,279 | |
| | | | |
| | 2,600 | | | | | Rhode Island Tobacco Settlement Financing Corporation, Tobacco Settlement Asset-Backed Bonds, Series 2015B, 4.500%, 6/01/45 | | 6/25 at 100.00 | | | 2,349,857 | |
| | | | | | Total Rhode Island | | | | | 53,786,891 | |
| | | | |
| | | | | | South Carolina - 2.7% (1.5% of Total Investments) | | | | | | |
| | | | |
| | 7,600 | | | | | Piedmont Municipal Power Agency, South Carolina, Electric Revenue Bonds,
Series 2004A-2, 0.000%, 1/01/31 - AMBAC Insured | | No Opt. Call | | | 5,368,496 | |
| | | | |
| | 1,990 | | | | | South Carolina Housing Finance and Development Authority, Mortgage Revenue Bonds, Series 2022B, 4.350%, 7/01/47 | | 7/31 at 100.00 | | | 1,713,774 | |
| | | | |
| | 1,000 | | | | | South Carolina Housing Finance and Development Authority, Mortgage Revenue Bonds, Series 2023A, 4.900%, 7/01/48 | | 7/32 at 100.00 | | | 951,548 | |
| | | | |
| | | | | | South Carolina Jobs-Economic Development Authority, Economic Development Revenue Bonds, Bishop Gadsden Episcopal Retirement Community, Series 2019A: | | | | | | |
| | 890 | | | | | 5.000%, 4/01/49 | | 4/26 at 103.00 | | | 727,827 | |
| | 1,165 | | | | | 4.000%, 4/01/54 | | 4/26 at 103.00 | | | 750,131 | |
| | 1,630 | | | | | 5.000%, 4/01/54 | | 4/26 at 103.00 | | | 1,302,096 | |
| | | | |
| | | | | | South Carolina Jobs-Economic Development Authority, Economic Development Revenue Bonds, Hilton Head Christian Academy, Series 2020: | | | | | | |
| | 405 | | | | | 5.000%, 1/01/40, 144A | | 1/30 at 100.00 | | | 348,741 | |
| | 1,000 | | | | | 5.000%, 1/01/55, 144A | | 1/30 at 100.00 | | | 769,190 | |
| | | | |
| | | | | | South Carolina Jobs-Economic Development Authority, Health Facilities Revenue Bonds, Lutheran Homes of South Carolina Inc., Refunding Series 2017B: | | | | | | |
| | 1,000 | | | | | 5.000%, 5/01/37 | | 12/23 at 104.00 | | | 817,304 | |
| | 750 | | | | | 5.000%, 5/01/42 | | 12/23 at 104.00 | | | 569,569 | |
| | | | |
| | 700 | | | | | South Carolina Jobs-Economic Development Authority, Hospital Revenue Bonds, AnMed Health Project, Series 2023, 4.250%, 2/01/48 | | 2/33 at 100.00 | | | 599,234 | |
| | | | |
| | 30,325 | | | | | South Carolina Public Service Authority, Santee Cooper Revenue Obligations, Refunding & Improvement Series 2015A, 5.000%, 12/01/50 | | 6/25 at 100.00 | | | 28,467,251 | |
| | | | |
| | 7,565 | | | | | South Carolina Public Service Authority, Santee Cooper Revenue Obligations, Refunding & Improvement Series 2020A, 3.000%, 12/01/41 - BAM Insured | | 12/30 at 100.00 | | | 5,440,526 | |
| | | | |
| | 5,985 | | | | | South Carolina Public Service Authority, Santee Cooper Revenue Obligations, Refunding Series 2014C, 5.000%, 12/01/46 | | 12/24 at 100.00 | | | 5,707,898 | |
| | | | |
| | 5,000 | | | | | South Carolina Public Service Authority, Santee Cooper Revenue Obligations, Refunding Series 2022A, 4.000%, 12/01/52 | | 6/32 at 100.00 | | | 3,871,628 | |
| | | | |
| | 10,170 | | | | | South Carolina Public Service Authority, Santee Cooper Revenue Obligations,
Series 2015E, 5.250%, 12/01/55 | | 12/25 at 100.00 | | | 9,801,049 | |
| | | | | | Total South Carolina | | | | | 67,206,262 | |
| | | | |
| | | | | | South Dakota - 0.7% (0.4% of Total Investments) | | | | | | |
| | | | |
| | 3,765 | | | | | South Dakota Health and Educational Facilities Authority, Revenue Bonds, Regional Health, Refunding Series 2017, 5.000%, 9/01/40 | | 9/27 at 100.00 | | | 3,659,436 | |
67
| | |
| NVG | | Nuveen AMT-Free Municipal Credit Income Fund (continued) |
| | Portfolio of Investments October 31, 2023 |
| | | | | | | | | | | | |
Principal Amount (000) | | | | | Description (a) | | Optional Call Provisions (b) | | Value | |
| | | | |
| | | | | | South Dakota (continued) | | | | | | |
| | $ 6,000 | | | | | South Dakota Housing Development Authority, Homeownership Mortgage Revenue Bonds, Series 2022B, 2.500%, 11/01/42 | | 11/30 at 100.00 | | $ | 3,914,932 | |
| | | | |
| | | | | | South Dakota Housing Development Authority, Homeownership Mortgage Revenue Bonds, Social Series 2023A: | | | | | | |
| | 6,250 | | | (e) | | 4.350%, 11/01/43, (UB) | | 11/31 at 100.00 | | | 5,670,235 | |
| | 4,000 | | | (e) | | 4.550%, 5/01/48, (UB) | | 11/31 at 100.00 | | | 3,510,011 | |
| | | | | | Total South Dakota | | | | | 16,754,614 | |
| | | | |
| | | | | | Tennessee - 0.9% (0.5% of Total Investments) | | | | | | |
| | | | |
| | 1,350 | | | | | Chattanooga-Hamilton County Hospital Authority, Tennessee, Hospital Revenue Bonds, Erlanger Health System, Refunding Series 2014A, 5.000%, 10/01/39 | | 10/24 at 100.00 | | | 1,237,704 | |
| | | | |
| | 1,490 | | | | | Knox County Health, Educational and Housing Facility Board, Tennessee, Hospital Revenue Bonds, East Tennessee Children’s Hospital, Series 2019, 4.000%, 11/15/48 | | 2/29 at 100.00 | | | 1,157,562 | |
| | | | |
| | 2,645 | | | (c) | | Memphis/Shelby County Economic Development Growth Engine Industrial Development Board, Tennessee, Tax Increment Revenue Bonds, Graceland Project, Senior Series 2017A, 5.500%, 7/01/37 | | 7/27 at 100.00 | | | 1,741,834 | |
| | | | |
| | 4,100 | | | | | Tennergy Corporation, Tennessee, Gas Revenue Bonds, Series 2022A,
5.500%, 10/01/53, (Mandatory Put 12/01/30) | | 9/30 at 100.10 | | | 4,115,548 | |
| | | | |
| | 855 | | | | | Tennessee Housing Development Agency, Residential Finance Program Bonds, Series 2020-3A, 2.550%, 1/01/45 | | 7/29 at 100.00 | | | 544,557 | |
| | | | |
| | 10,000 | | | | | Tennessee Housing Development Agency, Residential Finance Program Bonds, Social Series 2023-3A, 5.350%, 7/01/48, (UB), (WI/DD) | | 7/32 at 100.00 | | | 10,032,120 | |
| | | | |
| | 1,500 | | | (e) | | Tennessee Housing Development Agency, Residential Finance Program Bonds, Tender Option Bond Trust Series 2023-XL0448, 4.550%, 7/01/48, (UB) | | 7/32 at 100.00 | | | 1,310,208 | |
| | | | |
| | 10,000 | | | (c) | | The Health and Educational Facilities Board of the City of Franklin, Tennessee, Revenue Bonds, Provision Cares Proton Therapy Center, Nashville Project,
Series 2017A, 7.500%, 6/01/47, 144A | | 6/27 at 100.00 | | | 2,100,000 | |
| | | | | | Total Tennessee | | | | | 22,239,533 | |
| | | | |
| | | | | | Texas - 13.2% (7.6% of Total Investments) | | | | | | |
| | | | |
| | 4,400 | | | | | Aubrey, Denton County, Texas, Special Assessment Revenue Bonds, Jackson Ridge Public Improvement District Phase 1 Project, Series 2015, 7.250%, 9/01/45 | | 3/24 at 103.00 | | | 4,482,372 | |
| | | | |
| | 2,835 | | | | | Aubrey, Denton County, Texas, Special Assessment Revenue Bonds, Jackson Ridge Public Improvement District Phases 2-3 Major Improvements Project, Series 2015, 8.250%, 9/01/40 | | 3/24 at 103.00 | | | 2,892,176 | |
| | | | |
| | 5,480 | | | (e) | | Austin, Texas, Electric Utility System Revenue Bonds, Refunding Series 2015A, 5.000%, 11/15/45 | | 11/25 at 100.00 | | | 5,431,612 | |
| | | | |
| | 2,500 | | | | | Board of Managers, Joint Guadalupe County-Seguin City Hospital, Texas, Hospital Mortgage Revenue Bonds, Refunding & Improvement Series 2015, 5.000%, 12/01/45 | | 12/25 at 100.00 | | | 2,017,077 | |
| | | | |
| | 16,280 | | | | | Board of Regents of the University of Texas System, Revenue Financing System Bonds, Series 2019B, 5.000%, 8/15/49, (UB) | | No Opt. Call | | | 16,421,701 | |
| | | | |
| | 3,000 | | | | | Carrollton-Farmers Branch Independent School District, Dallas County, Texas, General Obligation Bonds, School Building Series 2023, 4.000%, 2/15/53 | | 2/33 at 100.00 | | | 2,487,381 | |
| | | | |
| | 2,180 | | | | | Celina, Texas, Special Assessment Revenue Bonds, Sutton Fields II Public Improvement District Neighborhood Improvement Area 1 Project, Series 2015, 7.250%, 9/01/45 | | 3/24 at 102.00 | | | 2,203,624 | |
68
| | | | | | | | | | | | |
Principal Amount (000) | | | | | Description (a) | | Optional Call Provisions (b) | | Value | |
| | | | |
| | | | | | Texas (continued) | | | | | | |
| | $ 3,855 | | | | | Celina, Texas, Special Assessment Revenue Bonds, Sutton Fields II Public Improvement District Neighborhood Improvement Areas 2-5 Major Improvement Project, Series 2015, 8.250%, 9/01/40 | | 3/24 at 102.00 | | $ | 3,914,311 | |
| | | | |
| | 350 | | | | | Celina, Texas, Special Assessment Revenue Bonds, Wells South Public Improvement District Neighborhood Improvement Area 1 Project, Series 2015, 6.250%, 9/01/45 | | 9/24 at 100.00 | | | 350,569 | |
| | | | |
| | 3,335 | | | | | Central Texas Regional Mobility Authority, Revenue Bonds, Senior Lien
Series 2020E, 5.000%, 1/01/45 | | 1/30 at 100.00 | | | 3,268,356 | |
| | | | |
| | 5,390 | | | | | Central Texas Regional Mobility Authority, Revenue Bonds, Senior Lien
Series 2021B, 5.000%, 1/01/46 | | 1/31 at 100.00 | | | 5,261,659 | |
| | | | |
| | 13,685 | | | (d) | | Central Texas Regional Mobility Authority, Revenue Bonds, Senior Lien,
Series 2015A, 5.000%, 1/01/45, (Pre-refunded 7/01/25) | | 7/25 at 100.00 | | | 13,921,975 | |
| | | | |
| | 6,375 | | | | | Central Texas Regional Mobility Authority, Revenue Bonds, Senior Lien,
Series 2016, 3.375%, 1/01/41 | | 1/26 at 100.00 | | | 4,955,808 | |
| | | | |
| | | | | | Clifton Higher Education Finance Corporation, Texas, Education Revenue Bonds, Uplift Education Charter School, Series 2013A: | | | | | | |
| | 765 | | | | | 4.350%, 12/01/42 | | 12/23 at 100.00 | | | 638,545 | |
| | 685 | | | | | 4.400%, 12/01/47 | | 12/23 at 100.00 | | | 549,539 | |
| | | | |
| | 4,000 | | | | | Clifton Higher Education Finance Corporation, Texas, Education Revenue Bonds, Uplift Education Charter School, Series 2015A, 5.000%, 12/01/45 | | 6/25 at 100.00 | | | 3,606,187 | |
| | | | |
| | | | | | Club Municipal Management District 1, Texas, Special Assessment Revenue Bonds, Improvement Area 1 Project, Series 2016: | | | | | | |
| | 380 | | | | | 5.750%, 9/01/28 | | 3/24 at 103.00 | | | 384,342 | |
| | 710 | | | | | 6.500%, 9/01/46 | | 3/24 at 103.00 | | | 716,838 | |
| | | | |
| | 400 | | | | | Decatur Hospital Authority, Texas, Revenue Bonds, Wise Regional Health System, Series 2014A, 5.250%, 9/01/44 | | 9/24 at 100.00 | | | 368,573 | |
| | | | |
| | 12,000 | | | (e) | | Denton Independent School District, Denton County, Texas, General Obligation Bonds, School Building Series 2023, 5.000%, 8/15/53, (UB) | | 8/33 at 100.00 | | | 12,099,492 | |
| | | | |
| | 1,255 | | | | | Fort Bend County Industrial Development Corporation, Texas, Revenue Bonds, NRG Energy Inc. Project, Series 2012A. RMKT, 4.750%, 5/01/38 | | 12/23 at 100.00 | | | 1,131,779 | |
| | | | |
| | 6,010 | | | | | Fort Bend County Industrial Development Corporation, Texas, Revenue Bonds, NRG Energy Inc. Project, Series 2012B, 4.750%, 11/01/42 | | 12/23 at 100.00 | | | 5,287,635 | |
| | | | |
| | 2,490 | | | | | Greater Texoma Utility Authority, Texas, Contract Revenue Bonds, City of Sherman Project Series 2023A, 4.375%, 10/01/53 - BAM Insured | | 10/32 at 100.00 | | | 2,082,554 | |
| | | | |
| | 4,255 | | | | | Harris County Cultural Education Facilities Finance Corporation, Texas, Revenue Bonds, Houston Methodist Hospital System, Series 2015, 5.000%, 12/01/45 | | 6/25 at 100.00 | | | 4,117,861 | |
| | | | |
| | 5,525 | | | | | Harris County Flood Control District, Texas, General Obligation Bonds, Refunding Improvement, Green Series 2023A, 4.000%, 9/15/48 | | 9/33 at 100.00 | | | 4,655,639 | |
| | | | |
| | 4,080 | | | | | Harris County, Texas, General Obligtion Toll Road Revenue Bonds, Tender Option Bond Trust 2015-XF0074, 6.086%, 8/15/32 - AGM Insured, 144A, (IF) | | No Opt. Call | | | 5,366,201 | |
| | | | |
| | 6,000 | | | | | Harris County-Houston Sports Authority, Texas, Revenue Bonds, Capital Appreciation Refunding Senior Lien Series 2014A, 0.000%, 11/15/48 | | 11/31 at 44.13 | | | 1,339,435 | |
| | | | |
| | 6,000 | | | | | Harris County-Houston Sports Authority, Texas, Revenue Bonds, Refunding Senior Lien Series 2014A, 5.000%, 11/15/53 | | 11/24 at 100.00 | | | 5,510,220 | |
| | | | |
| | | | | | Harris County-Houston Sports Authority, Texas, Revenue Bonds, Third Lien
Series 2004A-3: | | | | | | |
| | 14,055 | | | | | 0.000%, 11/15/34 - NPFG Insured | | 11/24 at 55.69 | | | 7,257,488 | |
| | 1,940 | | | (d) | | 0.000%, 11/15/34, (Pre-refunded 11/15/24) - NPFG Insured | | 11/24 at 55.69 | | | 1,033,557 | |
69
| | |
| NVG | | Nuveen AMT-Free Municipal Credit Income Fund (continued) |
| | Portfolio of Investments October 31, 2023 |
| | | | | | | | | | | | |
Principal Amount (000) | | | | | Description (a) | | Optional Call Provisions (b) | | Value | |
| | | | |
| | | | | | Texas (continued) | | | | | | |
| | | | | | Hidalgo County Regional Mobility Authority, Texas, Toll and Vehicle Registration Fee Revenue Bonds, Senior Lien Series 2022A: | | | | | | |
| | $ 2,295 | | | | | 0.000%, 12/01/42 | | 12/31 at 68.27 | | $ | 704,893 | |
| | 3,000 | | | | | 0.000%, 12/01/43 | | 12/31 at 65.48 | | | 861,661 | |
| | 3,000 | | | | | 0.000%, 12/01/44 | | 12/31 at 62.57 | | | 808,106 | |
| | 4,000 | | | | | 0.000%, 12/01/45 | | 12/31 at 59.85 | | | 1,010,311 | |
| | 7,165 | | | | | 0.000%, 12/01/46 | | 12/31 at 57.36 | | | 1,696,582 | |
| | 7,580 | | | | | 0.000%, 12/01/47 | | 12/31 at 55.10 | | | 1,682,315 | |
| | 7,095 | | | | | 0.000%, 12/01/48 | | 12/31 at 52.91 | | | 1,475,658 | |
| | 7,550 | | | | | 0.000%, 12/01/49 | | 12/31 at 50.78 | | | 1,471,268 | |
| | 5,140 | | | | | 0.000%, 12/01/50 | | 12/31 at 48.73 | | | 937,301 | |
| | 4,000 | | | | | 0.000%, 12/01/51 | | 12/31 at 46.73 | | | 680,346 | |
| | | | |
| | 5,000 | | | | | Houston Higher Education Finance Corporation, Texas, Education Revenue Bonds, KIPP, Inc., Refunding Series 2015, 4.000%, 8/15/44 | | 8/25 at 100.00 | | | 4,200,391 | |
| | | | |
| | | | | | Houston, Texas, Hotel Occupancy Tax and Special Revenue Bonds, Convention and Entertainment Project, Series 2001B: | | | | | | |
| | 4,090 | | | | | 0.000%, 9/01/26 - AMBAC Insured | | No Opt. Call | | | 3,620,371 | |
| | 4,865 | | | | | 0.000%, 9/01/27 - AGM Insured | | No Opt. Call | | | 4,120,366 | |
| | | | |
| | 4,715 | | | | | Houston, Texas, Hotel Occupancy Tax and Special Revenue Bonds, Refunding
Series 2015, 5.000%, 9/01/40 | | 9/24 at 100.00 | | | 4,644,054 | |
| | | | |
| | 17,000 | | | (d) | | Houston, Texas, Water and Sewerage System Revenue Bonds, Refunding Junior Lien Series 2002A, 5.750%, 12/01/32 - AGM Insured, (ETM) | | No Opt. Call | | | 19,708,098 | |
| | | | |
| | 940 | | | | | Kerrville Health Facilities Development Corporation, Texas, Revenue Bonds, Sid Peterson Memorial Hospital Project, Series 2015, 5.000%, 8/15/30 | | 8/25 at 100.00 | | | 943,419 | |
| | | | |
| | 6,665 | | | | | Lamar Consolidated Independent School District, Fort Bend County, Texas, General Obligation Bonds, Schoolhouse Series 2023A, 5.000%, 2/15/58 | | 2/33 at 100.00 | | | 6,713,055 | |
| | | | |
| | 1,000 | | | | | Lower Colorado River Authority, Texas, Transmission Contract Revenue Bonds, LCRA Transmission Services Corporation Project, Refunding Series 2015, 5.000%, 5/15/45 | | 5/25 at 100.00 | | | 981,952 | |
| | | | |
| | | | | | McCamey County Hospital District, Texas, General Obligation Bonds, Series 2013: | | | | | | |
| | 3,095 | | | | | 5.750%, 12/01/33 | | 12/25 at 100.00 | | | 3,054,281 | |
| | 3,125 | | | | | 6.125%, 12/01/38 | | 12/25 at 100.00 | | | 3,019,627 | |
| | | | |
| | | | | | New Hope Cultural Education Facilities Finance Corporation, Texas, Retirement Facility Revenue Bonds, Legacy at Willow Bend Project, Series 2016: | | | | | | |
| | 2,335 | | | | | 5.000%, 11/01/46 | | 11/23 at 103.00 | | | 1,683,838 | |
| | 6,015 | | | | | 5.000%, 11/01/51 | | 11/23 at 103.00 | | | 4,191,244 | |
| | | | |
| | 745 | | | | | New Hope Cultural Education Facilities Finance Corporation, Texas, Retirement Facility Revenue Bonds, Wesleyan Homes, Inc. Project, Series 2014, 5.500%, 1/01/43 | | 1/25 at 100.00 | | | 579,614 | |
| | | | |
| | 210 | | | (d) | | New Hope Cultural Education Facilities Finance Corporation, Texas, Student Housing Revenue Bonds, CHF-Collegiate Housing Corpus Christi II, L.L.C.-Texas A&M University-Corpus Christi Project, Series 2016A, 5.000%, 4/01/48, (Pre-refunded 4/01/26) | | 4/26 at 100.00 | | | 215,167 | |
| | | | |
| | 4,530 | | | | | New Hope Cultural Education Facilities Finance Corporation, Texas, Student Housing Revenue Bonds, CHF-Collegiate Housing Foundation - College Station I LLC - Texas A&M University Project, Series 2014A, 4.100%, 4/01/34 - AGM Insured | | 4/24 at 100.00 | | | 4,296,776 | |
70
| | | | | | | | | | | | |
Principal Amount (000) | | | | | Description (a) | | Optional Call Provisions (b) | | Value | |
| | | | |
| | | | | | Texas (continued) | | | | | | |
| $ | 820 | | | (d) | | New Hope Cultural Education Facilities Finance Corporation, Texas, Student Housing Revenue Bonds, CHF-Collegiate Housing Foundation - San Antonio 1, L.L.C. - Texas A&M University - San Antonio Project, Series 2016A, 5.000%, 4/01/48, (Pre-refunded 4/01/26) | | 4/26 at 100.00 | | $ | 839,226 | |
| | | | |
| | | | | | New Hope Cultural Education Facilities Finance Corporation, Texas, Student Housing Revenue Bonds, CHF-Collegiate Housing Foundation - Stephenville II, L.L.C. - Tarleton State University Project, Series 2014A: | | | | | | |
| | 1,000 | | | (d) | | 5.000%, 4/01/34, (Pre-refunded 4/01/24) | | 4/24 at 100.00 | | | 1,003,558 | |
| | 2,200 | | | (d) | | 5.000%, 4/01/39, (Pre-refunded 4/01/24) | | 4/24 at 100.00 | | | 2,207,827 | |
| | 1,600 | | | (d) | | 5.000%, 4/01/46, (Pre-refunded 4/01/24) | | 4/24 at 100.00 | | | 1,605,692 | |
| | | | |
| | 5,540 | | | (d) | | New Hope Cultural Education Facilities Finance Corporation, Texas, Student Housing Revenue Bonds, CHF-Collegiate Housing Galveston- Texas A&M University at Galveston Project, Series 2014A, 5.000%, 4/01/39, (Pre-refunded 4/01/24) | | 4/24 at 100.00 | | | 5,561,983 | |
| | | | |
| | | | | | North Texas Tollway Authority, Special Projects System Revenue Bonds, Convertible Capital Appreciation Series 2011C: | | | | | | |
| | 2,590 | | | (d) | | 7.000%, 9/01/43, (Pre-refunded 9/01/31) | | 9/31 at 100.00 | | | 3,054,991 | |
| | 3,910 | | | (d) | | 6.750%, 9/01/45, (Pre-refunded 9/01/31) | | 9/31 at 100.00 | | | 4,633,270 | |
| | | | |
| | 2,000 | | | | | North Texas Tollway Authority, System Revenue Bonds, Refunding Second Tier, Series 2015A, 5.000%, 1/01/38 | | 1/25 at 100.00 | | | 1,959,088 | |
| | | | |
| | 5,235 | | | | | Pasadena Independent School District, Harris County, Texas, General Obligation Bonds, School Building Series 2023, 4.250%, 2/15/53 | | 2/33 at 100.00 | | | 4,676,402 | |
| | | | |
| | 610 | | | | | Reagan Hospital District of Reagan County, Texas, Limited Tax Revenue Bonds, Series 2014A, 5.125%, 2/01/39 | | 2/24 at 100.00 | | | 574,086 | |
| | | | |
| | 1,080 | | | | | Red River Education Finance Corporation, Texas, Higher Education Revenue Bonds, Saint Edwards University Project, Series 2016, 4.000%, 6/01/41 | | 6/26 at 100.00 | | | 861,637 | |
| | | | |
| | 1,000 | | | | | San Antonio, Texas, Electric and Gas Systems Revenue Bonds, Refunding New Series 2023B, 4.000%, 2/01/43 | | 8/33 at 100.00 | | | 857,877 | |
| | | | |
| | 19,955 | | | | | Tarrant County Cultural Education Facilities Finance Corporation, Texas, Revenue Bonds, Christus Health, Series 2022A, 4.000%, 7/01/53 | | 7/32 at 100.00 | | | 15,366,236 | |
| | | | |
| | 12,040 | | | | | Tarrant County Cultural Education Facilities Finance Corporation, Texas, Revenue Bonds, Texas Health Resources System, Series 2016A, 5.000%, 2/15/47 | | 8/26 at 100.00 | | | 11,639,137 | |
| | | | |
| | 3,955 | | | | | Texas City Industrial Development Corporation, Texas, Industrial Development Revenue Bonds, NRG Energy, inc. Project, Fixed Rate Series 2012,
4.125%, 12/01/45 | | 2/25 at 100.00 | | | 3,075,891 | |
| | | | |
| | 2,565 | | | | | Texas Department of Housing and Community Affairs, Single Family Mortgage Revenue Bonds, Series 2018A, 4.250%, 9/01/43 | | 9/27 at 100.00 | | | 2,295,643 | |
| | | | |
| | | | | | Texas Department of Housing and Community Affairs, Single Family Mortgage Revenue Bonds, Series 2021A: | | | | | | |
| | 7,155 | | | | | 2.250%, 9/01/46 | | 3/30 at 100.00 | | | 4,163,996 | |
| | 6,905 | | | | | 2.350%, 9/01/51 | | 3/30 at 100.00 | | | 3,779,526 | |
| | | | |
| | 2,415 | | | | | Texas Department of Housing and Community Affairs, Single Family Mortgage Revenue Bonds, Series 2023A, 4.600%, 9/01/43 | | 9/32 at 100.00 | | | 2,231,121 | |
| | | | |
| | | | | | Texas Private Activity Bond Surface Transportation Corporation, Senior Lien Revenue Bonds, LBJ Infrastructure Group LLC IH-635 Managed Lanes Project, Refunding Series 2020A: | | | | | | |
| | 5,810 | | | | | 4.000%, 12/31/36 | | 12/30 at 100.00 | | | 5,315,259 | |
| | 2,735 | | | | | 4.000%, 6/30/37 | | 12/30 at 100.00 | | | 2,488,219 | |
71
| | |
| NVG | | Nuveen AMT-Free Municipal Credit Income Fund (continued) |
| | Portfolio of Investments October 31, 2023 |
| | | | | | | | | | | | |
Principal Amount (000) | | | | | Description (a) | | Optional Call Provisions (b) | | Value | |
| | | | |
| | | | | | Texas (continued) | | | | | | |
| | | | | | Texas Transportation Commission, Central Texas Turnpike System Revenue Bonds, Refunding First Tier Series 2015B: | | | | | | |
| | $ 11,280 | | | | | 0.000%, 8/15/36 | | 8/24 at 59.60 | | $ | 5,546,384 | |
| | 10,000 | | | | | 0.000%, 8/15/37 | | 8/24 at 56.94 | | | 4,594,680 | |
| | | | |
| | | | | | Texas Transportation Commission, Central Texas Turnpike System Revenue Bonds, Refunding Second Tier Series 2015C: | | | | | | |
| | 5,230 | | | | | 5.000%, 8/15/37 | | 8/24 at 100.00 | | | 5,042,098 | |
| | 31,775 | | | | | 5.000%, 8/15/42 | | 8/24 at 100.00 | | | 30,059,678 | |
| | | | |
| | 7,500 | | | | | Texas Transportation Commission, State Highway 249 System Revenue Bonds, First Tier Toll Series 2019A, 5.000%, 8/01/57 | | 2/29 at 100.00 | | | 6,593,666 | |
| | | | |
| | 4,400 | | | | | Texas Turnpike Authority, Central Texas Turnpike System Revenue Bonds, First Tier Series 2002A, 0.000%, 8/15/25 - AMBAC Insured | | No Opt. Call | | | 4,075,249 | |
| | | | |
| | 1,480 | | | | | Waxahachie Independent School District, Ellis County, Texas, General Obligation Bonds, School Building Series 2023, 4.250%, 2/15/53 | | 8/33 at 100.00 | | | 1,272,963 | |
| | | | |
| | 500 | | | | | Ysleta Independent School District Public Facility Corporation, Texas, Lease Revenue Refunding Bonds, Series 2001, 5.375%, 11/15/24 - AMBAC Insured | | 5/24 at 100.00 | | | 502,746 | |
| | | | | | Total Texas | | | | | 332,933,329 | |
| | | | |
| | | | | | Utah - 0.3% (0.2% of Total Investments) | | | | | | |
| | | | |
| | | | | | Black Desert Public Infrastructure District, Utah, Limited Tax General Obligation Bonds, Series 2021A: | | | | | | |
| | 510 | | | | | 3.750%, 3/01/41, 144A | | 9/26 at 103.00 | | | 376,799 | |
| | 1,095 | | | | | 4.000%, 3/01/51, 144A | | 9/26 at 103.00 | | | 742,899 | |
| | | | |
| | 5,085 | | | | | Downtown East Streetcar Sewer Public Infrastructure District, South Salt Lake, Salt Lake County, Utah, Limited Tax General Obligation Bonds, Series 2022A, 6.000%, 3/01/53, 144A | | 9/27 at 103.00 | | | 4,438,443 | |
| | | | |
| | 3,360 | | | | | MIDA Military Installation Development Authority Golf and Equestrian Center Public Infrastructure District, Utah, Limited Tax and Tax Allocation Revenue Bonds, Series 2021, 4.500%, 6/01/51, 144A | | 12/26 at 103.00 | | | 2,177,418 | |
| | | | |
| | 500 | | | | | Red Bridge Public Infrastructure District 1, Utah, Limited Tax General Obligation Bonds, Series 2021A, 4.375%, 2/01/51, 144A | | 2/26 at 103.00 | | | 342,581 | |
| | | | | | Total Utah | | | | | 8,078,140 | |
| | | | |
| | | | | | Vermont - 0.1% (0.1% of Total Investments) | | | | | | |
| | | | |
| | 1,835 | | | | | Vermont Economic Development Authority, Mortgage Revenue Bonds, Wake Robin Corporation Project, Series 2021A, 4.000%, 5/01/45 | | 5/28 at 103.00 | | | 1,322,804 | |
| | | | |
| | 1,080 | | | | | Vermont Housing Finance Agency, Multiple Purpose Bonds, Social
Series 2023E, 4.800%, 11/01/43 | | 11/32 at 100.00 | | | 1,030,274 | |
| | | | | | Total Vermont | | | | | 2,353,078 | |
| | | | |
| | | | | | Virgin Islands - 0.3% (0.1% of Total Investments) | | | | | | |
| | | | |
| | 1,695 | | | | | Virgin Islands Public Finance Authority, Gross Receipts Taxes Loan Note, Refunding Series 2012A, 5.000%, 10/01/32 - AGM Insured | | 12/23 at 100.00 | | | 1,687,740 | |
| | | | |
| | 4,715 | | | | | West Indian Company Limited, Virgin Islands, Port Facilities Revenue Bonds, WICO Financing, Series 2022A, 6.375%, 4/01/52, 144A | | 10/29 at 104.00 | | | 4,435,815 | |
| | | | | | Total Virgin Islands | | | | | 6,123,555 | |
| | | | |
| | | | | | Virginia - 1.2% (0.7% of Total Investments) | | | | | | |
| | | | |
| | | | | | Embrey Mill Community Development Authority, Virginia, Special Assessment Revenue Bonds, Series 2015: | | | | | | |
| | 1,180 | | | (d) | | 5.300%, 3/01/35, (Pre-refunded 3/01/25) | | 3/25 at 100.00 | | | 1,200,265 | |
| | 1,085 | | | (d) | | 5.600%, 3/01/45, (Pre-refunded 3/01/25) | | 3/25 at 100.00 | | | 1,107,661 | |
72
| | | | | | | | | | | | |
Principal Amount (000) | | | | | Description (a) | | Optional Call Provisions (b) | | Value | |
| | | | |
| | | | | | Virginia (continued) | | | | | | |
| | $ 5,500 | | | | | Hampton Roads Transportation Accountability Commision, Virginia, Revenue Bonds, Hampton Roads Transportation Fund, Senior Lien
Series 2020A, 5.000%, 7/01/60 | | 7/30 at 100.00 | | $ | 5,548,814 | |
| | | | |
| | | | | | James City County Economic Development Authority, Virginia, Residential Care Facility Revenue Bonds, Williamsburg Landing Inc., Refunding Series 2021A: | | | | | | |
| | 1,115 | | | | | 4.000%, 12/01/40 | | 12/27 at 103.00 | | | 869,641 | |
| | 2,690 | | | | | 4.000%, 12/01/50 | | 12/27 at 103.00 | | | 1,864,314 | |
| | | | |
| | 2,000 | | | | | Peninsula Town Center Community Development Authority, Virginia, Special Obligation Bonds, Refunding Series 2018, 5.000%, 9/01/45, 144A | | 9/27 at 100.00 | | | 1,710,554 | |
| | | | |
| | 1,000 | | | | | Virginia College Building Authority, Educational Facilities Revenue Bonds, Marymount University Project, Green Series 2015B, 5.250%, 7/01/35, 144A | | 7/25 at 100.00 | | | 959,491 | |
| | | | |
| | 3,000 | | | | | Virginia Housing Development Authority, Rental Housing Bonds,
Series 2023D, 4.700%, 8/01/48 | | 8/32 at 100.00 | | | 2,745,402 | |
| | | | |
| | 10,480 | | | | | Virginia Small Business Finance Authority, Healthcare Facilities Revenue Bonds, Bon Secours Mercy Health, Inc., Series 2020A, 4.000%, 12/01/49 | | 6/30 at 100.00 | | | 8,388,824 | |
| | | | |
| | 1,980 | | | | | Virginia Small Business Finance Authority, Tourism Development Financing Program Revenue Bonds, Downtown Norfolk and Virginia Beach Oceanfront Hotel Projects, Series 2018A,
8.375%, 4/01/41, 144A | | 4/28 at 112.76 | | | 1,830,092 | |
| | | | |
| | 3,490 | | | | | Williamsburg Economic Development Authority, Virginia, Student Housing Revenue Bonds, Provident Group - Williamsburg Properties LLC - William and Mary Project Series 2023A,
4.125%, 7/01/58 - AGM Insured | | 7/33 at 100.00 | | | 2,865,880 | |
| | | | | | Total Virginia | | | | | 29,090,938 | |
| | | | |
| | | | | | Washington - 1.4% (0.8% of Total Investments) | | | | | | |
| | | | |
| | 5,000 | | | | | Energy Northwest, Washington, Electric Revenue Bonds, Columbia Generating Station, Refunding Series 2015A, 5.000%, 7/01/38 | | 7/25 at 100.00 | | | 5,049,598 | |
| | | | |
| | | | | | Washington Health Care Facilities Authority, Revenue Bonds, Providence Health & Services, Series 2014C: | | | | | | |
| | 4,120 | | | | | 5.000%, 10/01/44 | | 10/24 at 100.00 | | | 3,838,101 | |
| | 880 | | | (d) | | 5.000%, 10/01/44, (Pre-refunded 10/01/24) | | 10/24 at 100.00 | | | 885,980 | |
| | | | |
| | | | | | Washington State Housing Finance Commission, Non-profit Housing Revenue Bonds, Presbyterian Retirement Communities Northwest Proejct, Refunding Series 2016A: | | | | | | |
| | 5,450 | | | | | 5.000%, 1/01/46, 144A | | 1/25 at 102.00 | | | 3,974,115 | |
| | 3,650 | | | | | 5.000%, 1/01/51, 144A | | 1/25 at 102.00 | | | 2,556,066 | |
| | | | |
| | 21,510 | | | (e) | | Washington State, Motor Vehicle Fuel Tax General Obligation Bonds, Series 2002-03C, 0.000%, 6/01/28 - NPFG Insured, (UB) | | No Opt. Call | | | 18,035,941 | |
| | | | | | Total Washington | | | | | 34,339,801 | |
| | | | |
| | | | | | West Virginia - 0.4% (0.2% of Total Investments) | | | | | | |
| | | | |
| | 1,900 | | | | | Monongalia County Commission, West Virginia, Special District Excise Tax Revenue Bonds, University Town Centre Economic Opportunity Development District, Refunding & Improvement Series 2017A,
5.500%, 6/01/37, 144A | | 6/27 at 100.00 | | | 1,905,175 | |
| | | | |
| | 440 | | | | | Monongalia County Commission, West Virginia, Special District Excise Tax Revenue Bonds, University Town Centre Economic Opportunity Development District, Refunding & Improvement Series 2021A,
4.125%, 6/01/43, 144A | | 6/31 at 100.00 | | | 362,933 | |
| | | | |
| | 1,000 | | | | | West Virginia Hospital Finance Authority, Hospital Revenue Bonds, Cabell Huntington Hospital, Inc. Project, Refunding & Improvement Series 2018A, 5.000%, 1/01/43 | | 1/29 at 100.00 | | | 910,032 | |
73
| | |
| NVG | | Nuveen AMT-Free Municipal Credit Income Fund (continued) |
| | Portfolio of Investments October 31, 2023 |
| | | | | | | | | | | | |
Principal Amount (000) | | | | | Description (a) | | Optional Call Provisions (b) | | Value | |
| | | | |
| | | | | | West Virginia (continued) | | | | | | |
| | | | | | West Virginia Hospital Finance Authority, Revenue Bonds, West Virginia University Health System, Improvement Series 2023A: | | | | | | |
| | $ 2,750 | | | (e) | | 4.250%, 6/01/47, (UB) | | 6/33 at 100.00 | | $ | 2,339,017 | |
| | 5,000 | | | (e) | | 4.375%, 6/01/53, (UB) | | 6/33 at 100.00 | | | 4,289,512 | |
| | | | | | | Total West Virginia | | | | | 9,806,669 | |
| | | | |
| | | | | | Wisconsin - 4.6% (2.6% of Total Investments) | | | | | | |
| | | | |
| | | | | | Public Finance Authority of Wisconsin, Charter School Revenue Bonds, Cornerstone Charter Academy, North Carolina, Series 2016A: | | | | | | |
| | 1,750 | | | | | 5.000%, 2/01/36, 144A | | 2/26 at 100.00 | | | 1,567,310 | |
| | 305 | | | | | 5.125%, 2/01/46, 144A | | 2/26 at 100.00 | | | 248,911 | |
| | | | |
| | 1,715 | | | | | Public Finance Authority of Wisconsin, Charter School Revenue Bonds, Corvian Community School Bonds, North Carolina, Series 2019A, 5.000%, 6/15/49, 144A | | 6/26 at 100.00 | | | 1,305,615 | |
| | | | |
| | 500 | | | | | Public Finance Authority of Wisconsin, Charter School Revenue Bonds, Corvian Community School, North Carolina, Series 2017A, 5.125%, 6/15/47, 144A | | 6/24 at 100.00 | | | 393,363 | |
| | | | |
| | 1,480 | | | | | Public Finance Authority of Wisconsin, Charter School Revenue Bonds, Envision Science Academy Project, Series 2016A, 5.125%, 5/01/36, 144A | | 5/26 at 100.00 | | | 1,333,483 | |
| | | | |
| | 6,000 | | | | | Public Finance Authority of Wisconsin, Charter School Revenue Bonds, Phoenix Academy Charter School, North Carolina, Series 2017A, 5.625%, 6/15/37, 144A | | 6/24 at 100.00 | | | 5,164,459 | |
| | | | |
| | | | | | Public Finance Authority of Wisconsin, Charter School Revenue Bonds, Uwharrie Charter Academy, North Carolina, Series 2017A: | | | | | | |
| | 1,000 | | | | | 5.500%, 6/15/37, 144A | | 6/27 at 100.00 | | | 949,387 | |
| | 1,790 | | | | | 5.625%, 6/15/47, 144A | | 6/27 at 100.00 | | | 1,598,126 | |
| | | | |
| | 1,500 | | | | | Public Finance Authority of Wisconsin, Education Revenue Bonds, Corvian Community School, North Carolina Series 2023A, 6.250%, 6/15/53, 144A | | 6/33 at 100.00 | | | 1,348,097 | |
| | | | |
| | 15,205 | | | | | Public Finance Authority of Wisconsin, Health Care System Revenue Bonds, Cone Health, Series 2022A, 4.000%, 10/01/52 | | 10/32 at 100.00 | | | 12,504,105 | |
| | | | |
| | 35,100 | | | | | Public Finance Authority of Wisconsin, Limited Obligation PILOT Revenue Bonds, American Dream @ Meadowlands Project, Series 2017, 7.000%, 12/01/50, 144A | | 12/27 at 100.00 | | | 30,645,368 | |
| | | | |
| | 1,700 | | | (c) | | Public Finance Authority of Wisconsin, Revenue Bonds, Alabama Proton Therapy Center, Senior Series 2017A, 7.000%, 10/01/47, 144A | | 10/27 at 100.00 | | | 1,020,000 | |
| | | | |
| | | | | | Public Finance Authority of Wisconsin, Revenue Bonds, Prime Healthcare Foundation, Inc., Series 2017A: | | | | | | |
| | 1,055 | | | | | 5.000%, 12/01/27 | | No Opt. Call | | | 1,047,290 | |
| | 1,815 | | | | | 5.200%, 12/01/37 | | 12/27 at 100.00 | | | 1,703,521 | |
| | | | |
| | | | | | Public Finance Authority of Wisconsin, Revenue Bonds, Roseman University of Health Sciences, Series 2020: | | | | | | |
| | 1,225 | | | | | 5.000%, 4/01/40, 144A | | 4/30 at 100.00 | | | 1,108,826 | |
| | 75 | | | (d) | | 5.000%, 4/01/40, (Pre-refunded 4/01/30), 144A | | 4/30 at 100.00 | | | 80,046 | |
| | 4,520 | | | | | 5.000%, 4/01/50, 144A | | 4/30 at 100.00 | | | 3,798,763 | |
| | 245 | | | (d) | | 5.000%, 4/01/50, (Pre-refunded 4/01/30), 144A | | 4/30 at 100.00 | | | 261,483 | |
| | | | |
| | 5,625 | | | | | Public Finance Authority, Wisconsin, Educational Revenue Bonds, Lake Norman Charter School, Series 2018A, 5.000%, 6/15/48, 144A | | 6/26 at 100.00 | | | 4,753,077 | |
| | | | |
| | 2,500 | | | | | Public Finance Authority, Wisconsin, Exempt Facilities Revenue Bonds, Celanese Project, Refunding Series 2016C, 4.050%, 11/01/30 | | 5/26 at 100.00 | | | 2,278,193 | |
| | | | |
| | | | | | Wisconsin Health and Educational Facilities Authority, Revenue Bonds, Mercy Alliance, Inc., Series 2012: | | | | | | |
| | 11,000 | | | | | 5.000%, 6/01/32 | | 12/23 at 100.00 | | | 10,969,957 | |
74
| | | | | | | | | | | | |
Principal Amount (000) | | | | | Description (a) | | Optional Call Provisions (b) | | Value | |
| | | | |
| | | | | | Wisconsin (continued) | | | | | | |
| | $ 1,000 | | | | | 5.000%, 6/01/39 | | 12/23 at 100.00 | | $ | 952,127 | |
| | | | |
| | | | | | Wisconsin Health and Educational Facilities Authority, Revenue Bonds, PHW Muskego, Inc. Project, Series 2021: | | | | | | |
| | 2,405 | | | | | 4.000%, 10/01/51 | | 10/28 at 102.00 | | | 1,567,741 | |
| | 3,845 | | | | | 4.000%, 10/01/61 | | 10/28 at 102.00 | | | 2,335,167 | |
| | | | |
| | 1,450 | | | | | Wisconsin Health and Educational Facilities Authority, Revenue Bonds, Rocket Education Obligated Group, Series 2017C, 5.250%, 6/01/40, 144A | | 6/26 at 100.00 | | | 1,315,451 | |
| | | | |
| | 1,000 | | | | | Wisconsin Health and Educational Facilities Authority, Wisconsin, Revenue Bonds, American Baptist Homes of the Midwest Obligated Group, Refunding Series 2017, 5.000%, 8/01/37 | | 8/24 at 103.00 | | | 757,936 | |
| | | | |
| | | | | | Wisconsin Health and Educational Facilities Authority, Wisconsin, Revenue Bonds, Dickson Hollow Project. Series 2014: | | | | | | |
| | 1,000 | | | | | 5.375%, 10/01/44 | | 12/23 at 101.00 | | | 802,367 | |
| | 1,500 | | | | | 5.500%, 10/01/49 | | 12/23 at 101.00 | | | 1,195,014 | |
| | | | |
| | 3,000 | | | | | Wisconsin Health and Educational Facilities Authority, Wisconsin, Revenue Bonds, Marshfield Clinic, Series 2016A, 5.000%, 2/15/42 | | 2/26 at 100.00 | | | 2,765,562 | |
| | | | |
| | 2,275 | | | | | Wisconsin Health and Educational Facilities Authority, Wisconsin, Revenue Bonds, Oakwood Lutheran Senior Ministries, Series 2021, 4.000%, 1/01/57 | | 1/27 at 103.00 | | | 1,199,807 | |
| | | | |
| | 1,000 | | | | | Wisconsin Health and Educational Facilities Authority, Wisconsin, Revenue Bonds, Rogers Memorial Hospital, Inc., Series 2014A, 5.000%, 7/01/34 | | 7/24 at 100.00 | | | 980,452 | |
| | | | |
| | 1,850 | | | | | Wisconsin Health and Educational Facilities Authority, Wisconsin, Revenue Bonds, Saint Camillus Health System Inc, Series 2019A, 5.000%, 11/01/54 | | 11/26 at 103.00 | | | 1,278,160 | |
| | | | |
| | 10,520 | | | | | Wisconsin Health and Educational Facilities Authority, Wisconsin, Revenue Bonds, ThedaCare Inc, Series 2019, 4.000%, 12/15/49 | | 12/29 at 100.00 | | | 8,319,680 | |
| | | | |
| | | | | | Wisconsin Health and Educational Facilities Authority, Wisconsin, Revenue Bonds, Woodland Hills Senior Housing Project, Series 2014: | | | | | | |
| | 2,565 | | | | | 5.000%, 12/01/44 | | 12/23 at 101.00 | | | 1,985,125 | |
| | 1,775 | | | | | 5.250%, 12/01/49 | | 12/23 at 101.00 | | | 1,385,620 | |
| | | | |
| | | | | | Wisconsin Housing and Economic Development Authority, Housing Revenue Bonds, Series 2019A: | | | | | | |
| | 2,800 | | | | | 3.150%, 11/01/44 | | 11/28 at 100.00 | | | 1,970,019 | |
| | 3,000 | | | | | 3.200%, 11/01/49 | | 11/28 at 100.00 | | | 1,998,754 | |
| | | | | | Total Wisconsin | | | | | 114,888,362 | |
| | | | |
| | | | | | Wyoming - 0.1% (0.0% of Total Investments) | | | | | | |
| | | | |
| | 2,500 | | | | | Wyoming Community Development Authority, Housing Revenue Bonds, 2023 Series 1, 4.400%, 12/01/43 | | 6/32 at 100.00 | | | 2,251,542 | |
| | | | | | Total Wyoming | | | | | 2,251,542 | |
| | | | | | Total Municipal Bonds (cost $4,803,742,914) | | | | | 4,300,160,926 | |
| | | | |
| Shares | | | | | Description (a) | | | | Value | |
| | | | | | COMMON STOCKS - 2.4% (1.4% of Total Investments) | | | | | | |
| | | | |
| | | | | | Utilities - 2.4% (1.4% of Total Investments) | | | | | | |
| | 676,308 | | | (h),(i) | | Energy Harbor Corp | | | | $ | 53,710,352 | |
| | 122,251 | | | (i),(j) | | Talen Energy Supply LLC | | | | | 6,387,615 | |
| | | | | | Total Utilities | | | | | 60,097,967 | |
| | | | | | Total Common Stocks (cost $18,927,854) | | | | | 60,097,967 | |
| | | | | | Total Long-Term Investments (cost $4,822,670,768) | | | | | 4,360,258,893 | |
75
| | |
| NVG | | Nuveen AMT-Free Municipal Credit Income Fund (continued) |
| | Portfolio of Investments October 31, 2023 |
| | | | | | | | | | | | |
Principal Amount (000) | | | | | Description (a) | | Optional Call Provisions (b) | | Value | |
| | | | | | SHORT-TERM INVESTMENTS - 1.6% (0.9% of Total Investments) | | | | | | |
| | | | | | MUNICIPAL BONDS - 1.6% (0.9% of Total Investments) | | | | | | |
| | | | |
| | | | | | New York - 0.1% (0.0% of Total Investments) | | | | | | |
| | $ 1,610 | | | (k) | | Triborough Bridge and Tunnel Authority, New York, Sales Tax Revenue Bonds, MTA Bridges & Tunnels, TBTA Capital Lockbox-City Sales Tax Green Series 2022-XF1321, 4.410%, 5/15/28, (Mandatory Put 11/7/2023), 144A | | No Opt. Call | | $ | 1,610,000 | |
| | | | | | Total New York | | | | | 1,610,000 | |
| | | | |
| | | | | | Ohio - 0.5% (0.3% of Total Investments) | | | | | | |
| | 12,750 | | | (k) | | Hamilton County, Ohio, Sewer System Revenue Bonds, Metropolitan Sewer District of Greater Cincinnati, Tender Option Bond Floater 2016- XM0380,
4.170%, 12/01/23, (Mandatory Put 11/7/2023), 144A | | No Opt. Call | | | 12,750,000 | |
| | | | | | Total Ohio | | | | | 12,750,000 | |
| | | | |
| | | | | | Texas - 0.4% (0.2% of Total Investments) | | | | | | |
| | 10,000 | | | (k) | | Houston, Texas, Combined Utility System Revenue Bonds, Refunding First Lien Weekly Rate Series 2012A, 4.140%, 5/15/34, (Mandatory Put 9/19/2023) | | 9/23 at 100.00 | | | 10,000,000 | |
| | | | | | Total Texas | | | | | 10,000,000 | |
| | | | |
| | | | | | Virginia - 0.6% (0.4% of Total Investments) | | | | | | |
| | 15,000 | | | (k) | | Fairfax County Economic Development Authority, Virginia, Revenue Bonds, Smithsonian Institution, Series 2003A, 4.000%, 12/01/33, (Mandatory Put 11/7/2023) | | 10/23 at 100.00 | | | 15,000,000 | |
| | | | | | Total Virginia | | | | | 15,000,000 | |
| | | | | | Total Municipal Bonds (cost $39,360,000) | | | | | 39,360,000 | |
| | | | | | Total Short-Term Investments (cost $39,360,000) | | | | | 39,360,000 | |
| | | | |
| | | | | | Total Investments (cost $4,862,030,768) - 174.8% | | | | | 4,399,618,893 | |
| | | | | | Floating Rate Obligations - (8.4)% | | | | | (210,540,000 | ) |
| | | | | | MFP Shares, Net - (20.5)%(l) | | | | | (515,526,990 | ) |
| | | | | | VRDP Shares, Net- (49.0)%(m) | | | | | (1,233,916,102 | ) |
| | | | | | Other Assets & Liabilities, Net - 3.1% | | | | | 77,403,142 | |
| | | | | | Net Assets Applicable to Common Shares - 100% | | | | $ | 2,517,038,943 | |
| (a) | All percentages shown in the Portfolio of Investments are based on net assets applicable to common shares unless otherwise noted. |
| (b) | Optional Call Provisions: Dates (month and year) and prices of the earliest optional call or redemption. There may be other call provisions at varying prices at later dates. Certain mortgage-backed securities may be subject to periodic principal paydowns. Optional Call Provisions are not covered by the report of independent registered public accounting firm. |
| (c) | Defaulted security. A security whose issuer has failed to fully pay principal and/or interest when due, or is under the protection of bankruptcy. |
| (d) | Backed by an escrow or trust containing sufficient U.S. Government or U.S. Government agency securities, which ensure the timely payment of principal and interest. |
| (e) | Investment, or portion of investment, has been pledged to collateralize the net payment obligations for investments in inverse floating rate transactions. |
| (f) | For fair value measurement disclosure purposes, investment classified as Level 3. |
| (g) | Step-up coupon bond, a bond with a coupon that increases (“steps up”), usually at regular intervals, while the bond is outstanding. The rate shown is the coupon as of the end of the reporting period. |
76
| (h) | Energy Harbor Corp (ENGH) common stock received as part of the bankruptcy settlements during February 2020 for Beaver County Industrial Development Authority, Pennsylvania, Pollution Control Revenue Bonds, FirstEnergy Nuclear Generation Project, Refunding Series 2005A, 4.000%, 1/01/35, Beaver County Industrial Development Authority, Pennsylvania, Pollution Control Revenue Refunding Bonds, FirstEnergy Nuclear Generation Project, Series 2006A, 3.500%, 4/01/41, Beaver County Industrial Development Authority, Pennsylvania, Pollution Control Revenue Refunding Bonds, FirstEnergy Nuclear Generation Project, Series 2006B, 3.500%, 12/01/35, Ohio Air Quality Development Authority, Ohio, Air Quality Development Revenue Bonds, FirstEnergy Generation Corporation Project, Series 2009A, 5.700%, 8/01/20, Ohio Air Quality Development Authority, Ohio, Pollution Control Revenue Bonds, FirstEnergy Generation Corporation Project, Refunding Series 2009B, 3.100%, 3/01/23, Ohio Air Quality Development Authority, Ohio, Pollution Control Revenue Bonds, FirstEnergy Nuclear Generation Corporation Project, Refunding Series 2010B, 3.750%, 6/01/33, Ohio Air Quality Development Authority, Ohio, Pollution Control Revenue Bonds, FirstEnergy Nuclear Generation Project, Refunding Series 2006B, 3.125%, 1/01/34, Ohio Water Development Authority, Pollution Control Revenue Refunding Bonds, FirstEnergy Nuclear Generating Corporation Project, Series 2006B, 4.000%, 12/01/33, Ohio Water Development Authority, Pollution Control Revenue Refunding Bonds, FirstEnergy Nuclear Generating Corporation Project, Series 2010C, 4.000%, 6/01/33. Various funds and accounts managed by Nuveen, including the Fund, collectively are a substantial minority holder of ENGH’s outstanding shares of common stock, and possess certain other rights with respect to the corporate governance of ENGH. Due to these facts, under the federal securities laws, the securities of ENGH held by Nuveen funds and accounts, including the Fund, cannot be sold except under limited conditions (which are not currently satisfied). The Fund is therefore unable to sell such shares in ordinary secondary market transactions at this time. On March 6, 2023 Vistra Corp. (“Vistra”) announced that it has executed a definitive agreement with Energy Harbor Corp., pursuant to which Energy Harbor will merge with and into a newly-formed subsidiary of Vistra. In connection with the transaction, Nuveen funds and accounts expect to receive a combination of cash and shares in a newly formed entity. Nuveen expects these shares to be issued in a private transaction and may have reduced secondary market liquidity. The transaction is subject to certain regulatory approvals and there can be no assurance that the transaction will close. |
| (i) | Non-income producing; issuer has not declared an ex-dividend date within the past twelve months. |
| (j) | In May 2023, Talen Energy completed a Chapter 11 plan of reorganization whereby the Fund received Talen Energy Common Stock in exchange for the following portfolio holding: Pennsylvania Economic Development Financing Authority, Exempt Facilities Revenue Refunding Bonds, PPL Energy Supply, LLC Project, Series 2009A, 6.400%, 12/01/38. |
| (k) | Investment has a maturity of greater than one year, but has variable rate and/or demand features which qualify it as a short-term investment. The rate disclosed, as well as the reference rate and spread, where applicable, is that in effect as of the end of the reporting period. This rate changes periodically based on market conditions or a specified market index. |
| (l) | MFP Shares, Net as a percentage of Total Investments is 11.7%. |
| (m) | VRDP Shares, Net as a percentage of Total Investments is 28.0%. |
| 144A | Investment is exempt from registration under Rule 144A of the Securities Act of 1933, as amended. These investments may only be resold in transactions exempt from registration, which are normally those transactions with qualified institutional buyers. |
| IF | Inverse floating rate security issued by a tender option bond (“TOB”) trust, the interest rate on which varies inversely with the Securities Industry Financial Markets Association (SIFMA) short-term rate, which resets weekly, or a similar short-term rate, and is reduced by the expenses related to the TOB trust. |
| UB | Underlying bond of an inverse floating rate trust reflected as a financing transaction. |
| WI/DD | When-issued or delayed delivery security. |
| | |
| | See Notes to Financial Statements |
| | 77 |
| | |
| NZF | | Nuveen Municipal Credit Income Fund Portfolio of Investments October 31, 2023 |
| | | | | | | | | | | | |
Principal Amount (000) | | | | | Description (a) | | Optional Call Provisions (b) | | Value | |
| | | | | | LONG-TERM INVESTMENTS - 171.1% (100.0% of Total Investments) | | | | | | |
| | | | | | MUNICIPAL BONDS - 165.9% (97.0% of Total Investments) | | | | | | |
| | | | |
| | | | | | Alabama - 0.6% (0.4% of Total Investments) | | | | | | |
| | | | |
| | $ 8,585 | | | | | Alabama Private Colleges and University Facilities Authority, Limited Obligation Bonds, University of Mobile Project, Series 2015A, 6.000%, 9/01/45, 144A | | 9/25 at 100.00 | | $ | 8,212,288 | |
| | | | |
| | 430 | | | (c) | | Alabama Special Care Facilities Financing Authority, Birmingham, Hospital Revenue Bonds, Daughters of Charity National Health System - Providence Hospital and
St. Vincent’s Hospital, Series 1995, 5.000%, 11/01/25, (ETM) | | 12/23 at 100.00 | | | 449,959 | |
| | | | |
| | 2,280 | | | (d) | | Alabama Special Care Facilities Financing Authority, Revenue Bonds, Ascension Health, Series 2016B, 5.000%, 11/15/46 | | 5/26 at 100.00 | | | 2,177,175 | |
| | | | |
| | 2,720 | | | (d) | | Alabama Special Care Facilities Financing Authority, Revenue Bonds, Ascension Health, Series 2016C, 5.000%, 11/15/46 | | 5/26 at 100.00 | | | 2,597,331 | |
| | | | |
| | 340 | | | | | Hoover Industrial Development Board, Alabama, Environmental Improvement Revenue Bonds, United States Steel Corporation Project, Series 2019, 5.750%, 10/01/49, (AMT) | | 10/29 at 100.00 | | | 317,064 | |
| | | | | | Total Alabama | | | | | 13,753,817 | |
| | | | |
| | | | | | Alaska - 0.3% (0.2% of Total Investments) | | | | | | |
| | | | |
| | | | | | Alaska Industrial Development and Export Authority, Power Revenue Bonds, Snettisham Hydroelectric Project, Refunding Series 2015: | | | | | | |
| | 1,000 | | | | | 5.000%, 1/01/31, (AMT) | | 7/25 at 100.00 | | | 995,684 | |
| | 2,950 | | | | | 5.000%, 1/01/33, (AMT) | | 7/25 at 100.00 | | | 2,928,061 | |
| | 2,400 | | | | | 5.000%, 1/01/34, (AMT) | | 7/25 at 100.00 | | | 2,377,567 | |
| | | | | | Total Alaska | | | | | 6,301,312 | |
| | | | |
| | | | | | Arizona - 1.3% (0.8% of Total Investments) | | | | | | |
| | | | |
| | 2,820 | | | | | Arizona Health Facilities Authority, Revenue Bonds, Scottsdale Lincoln Hospitals Project, Refunding Series 2014A, 5.000%, 12/01/42 | | 12/24 at 100.00 | | | 2,632,851 | |
| | | | |
| | 2,131 | | | (e) | | Cahava Springs Revitalization District, Cave Creek, Arizona, Special Assessment Bonds, Series 2017A, 7.000%, 7/01/41, 144A | | 7/27 at 100.00 | | | 1,640,888 | |
| | | | |
| | 3,185 | | | | | Eastmark Community Facilities District 1, Mesa, Arizona, General Obligation Bonds, Series 2015, 5.000%, 7/15/39, 144A | | 7/25 at 100.00 | | | 2,891,572 | |
| | | | |
| | 10,000 | | | | | Phoenix Civic Improvement Corporation, Arizona, Airport Revenue Bonds, Senior Lien Series 2017A, 5.000%, 7/01/47, (AMT) | | 7/27 at 100.00 | | | 9,576,219 | |
| | | | |
| | | | | | Phoenix Mesa Gateway Airport Authority, Arizona, Special Facility Revenue Bonds, Mesa Project, Series 2012: | | | | | | |
| | 400 | | | | | 5.000%, 7/01/27, (AMT) | | 12/23 at 100.00 | | | 399,500 | |
| | 950 | | | | | 5.000%, 7/01/32, (AMT) | | 12/23 at 100.00 | | | 940,783 | |
| | | | |
| | | | | | Pima County Industrial Development Authority, Arizona, Education Facility Revenue Bonds, Edkey Charter Schools Project, Series 2016: | | | | | | |
| | 1,790 | | | | | 5.375%, 7/01/46 | | 7/26 at 100.00 | | | 1,547,662 | |
| | 2,140 | | | | | 5.500%, 7/01/51 | | 7/26 at 100.00 | | | 1,836,237 | |
| | | | |
| | 595 | | | | | Pima County Industrial Development Authority, Arizona, Education Facility Revenue Bonds, San Tan Montessori School Project, Series 2016, 6.500%, 2/01/48, 144A | | 2/24 at 100.00 | | | 590,618 | |
| | | | |
| | 2,060 | | | | | Pima County Industrial Development Authority, Arizona, Education Facility Revenue Bonds, San Tan Montessori School Project, Series 2017, 6.750%, 2/01/50, 144A | | 2/28 at 100.00 | | | 2,032,299 | |
78
| | | | | | | | | | | | |
Principal Amount (000) | | | | | Description (a) | | Optional Call Provisions (b) | | Value | |
| | | | |
| | | | | | Arizona (continued) | | | | | | |
| $ | 35 | | | | | Pima County Industrial Development Authority, Arizona, Education Facility Revenue Bonds, The Paideia Academies Project, 2019, 5.125%, 7/01/39 | | 7/25 at 100.00 | | $ | 30,404 | |
| | | | |
| | | | | | Salt Verde Financial Corporation, Arizona, Senior Gas Revenue Bonds, Citigroup Energy Inc Prepay Contract Obligations, Series 2007: | | | | | | |
| | 50 | | | | | 5.000%, 12/01/32 | | No Opt. Call | | | 49,743 | |
| | 7,235 | | | | | 5.000%, 12/01/37 | | No Opt. Call | | | 7,023,268 | |
| | | | | | Total Arizona | | | | | 31,192,044 | |
| | | | |
| | | | | | Arkansas - 1.2% (0.7% of Total Investments) | | | | | | |
| | | | |
| | 10,055 | | | | | Arkansas Development Finance Authority, Arkansas, Environmental Improvement Revenue Bonds, United States Steel Corporation, Green Series 2022, 5.450%, 9/01/52, (AMT), 144A | | 9/25 at 105.00 | | | 8,863,958 | |
| | | | |
| | 12,410 | | | | | Arkansas Development Finance Authority, Arkansas, Environmental Improvement Revenue Bonds, United States Steel Corporation, Green Series 2023, 5.700%, 5/01/53, (AMT) | | 5/26 at 105.00 | | | 11,325,281 | |
| | | | |
| | 6,000 | | | | | Arkansas Development Finance Authority, Industrial Development Revenue Bonds, Big River Steel Project, Series 2019, 4.500%, 9/01/49, (AMT), 144A | | 9/26 at 103.00 | | | 5,328,448 | |
| | | | |
| | 2,000 | | | | | Arkansas Development Finance Authority, Industrial Development Revenue Bonds, Big River Steel Project, Series 2020A, 4.750%, 9/01/49, (AMT), 144A | | 9/27 at 103.00 | | | 1,846,054 | |
| | | | | | Total Arkansas | | | | | 27,363,741 | |
| | | | |
| | | | | | California - 22.5% (13.1% of Total Investments) | | | | | | |
| | | | |
| | 4,225 | | | | | Alameda Unified School District, Alameda County, California, General Obligation Bonds, Series 2005B, 0.000%, 8/01/28 - AGM Insured | | No Opt. Call | | | 3,468,848 | |
| | | | |
| | 535 | | | | | Antelope Valley Healthcare District, California, Revenue Bonds, Series 2016A, 5.000%, 3/01/41 | | 3/26 at 100.00 | | | 472,686 | |
| | | | |
| | 1,900 | | | | | Blythe Redevelopment Agency Successor Agency, California, Tax Allocation Bonds, Redevelopment Project 1, Refunding Series 2015, 5.000%, 5/01/38 | | 11/25 at 100.00 | | | 1,881,086 | |
| | | | |
| | 165 | | | | | Brentwood Infrastructure Financing Authority, California, Infrastructure Revenue Bonds, Refunding Subordinated Series 2014B, 5.000%, 9/02/36 | | 9/24 at 100.00 | | | 163,495 | |
| | | | |
| | | | | | Calexico Unified School District, Imperial County, California, General Obligation Bonds, Election of 2004 Series 2005B: | | | | | | |
| | 4,070 | | | | | 0.000%, 8/01/32 - FGIC Insured | | No Opt. Call | | | 2,720,088 | |
| | 6,410 | | | | | 0.000%, 8/01/34 - FGIC Insured | | No Opt. Call | | | 3,897,988 | |
| | | | |
| | 1,510 | | | | | California Community Housing Agency, California, Essential Housing Revenue Bonds, Serenity at Larkspur Apartments, Series 2020A,
5.000%, 2/01/50, 144A | | 2/30 at 100.00 | | | 1,124,764 | |
| | | | |
| | 1,515 | | | | | California Community Housing Agency, California, Essential Housing Revenue Bonds, Verdant at Green Valley Apartments, Series 2019A, 5.000%, 8/01/49, 144A | | 8/29 at 100.00 | | | 1,282,815 | |
| | | | |
| | 1,295 | | | | | California County Tobacco Securitization Agency, Tobacco Settlement Asset-Backed Bonds, Golden Gate Tobacco Funding Corporation, Turbo,
Series 2007A, 5.000%, 6/01/36 | | 11/23 at 100.00 | | | 1,188,132 | |
| | | | |
| | 22,650 | | | (d) | | California Health Facilities Financing Authority, Revenue Bonds, City of Hope National Medical Center, Series 2019, 5.000%, 11/15/49, (UB) | | 11/26 at 100.00 | | | 21,270,155 | |
| | | | |
| | 3,500 | | | | | California Health Facilities Financing Authority, Revenue Bonds, CommonSpirit Health, Series 2020A, 4.000%, 4/01/45 | | 4/30 at 100.00 | | | 2,888,201 | |
| | | | |
| | 825 | | | | | California Municipal Finance Authority, Charter School Lease Revenue Bonds, Santa Rosa Academy Project, Series 2015, 5.375%, 7/01/45, 144A | | 7/25 at 100.00 | | | 760,055 | |
79
| | |
| NZF | | Nuveen Municipal Credit Income Fund (continued) |
| | Portfolio of Investments October 31, 2023 |
| | | | | | | | | | | | |
Principal Amount (000) | | | | | Description (a) | | Optional Call Provisions (b) | | Value | |
| | | | |
| | | | | | California (continued) | | | | | | |
| $ | 34,780 | | | | | California Municipal Finance Authority, Revenue Bonds, Community Health System, Series 2021A, 4.000%, 2/01/51 - AGM Insured | | 2/32 at 100.00 | | $ | 28,437,091 | |
| | | | |
| | 22,130 | | | | | California Municipal Finance Authority, Special Facility Revenue Bonds, United Airlines, Inc. Los Angeles International Airport Project, Series 2019, 4.000%, 7/15/29, (AMT) | | No Opt. Call | | | 20,718,164 | |
| | | | |
| | 2,000 | | | | | California Pollution Control Financing Authority, Water Furnishing Revenue Bonds, San Diego County Water Authoriity Desalination Project Pipeline, Refunding Series 2019, 5.000%, 7/01/39, 144A | | 1/29 at 100.00 | | | 1,974,219 | |
| | | | |
| | 2,000 | | | | | California School Finance Authority, Charter School Revenue Bonds, Downtown College Prep - Obligated Group, Series 2016, 5.000%, 6/01/51, 144A | | 6/26 at 100.00 | | | 1,696,269 | |
| | | | |
| | | | | | California Statewide Communities Development Authority, California, Revenue Bonds, Loma Linda University Medical Center, Series 2014A: | | | | | | |
| | 2,500 | | | | | 5.250%, 12/01/44 | | 12/24 at 100.00 | | | 2,325,218 | |
| | 16,712 | | | | | 5.500%, 12/01/54 | | 12/24 at 100.00 | | | 15,920,443 | |
| | | | |
| | 31,280 | | | | | California Statewide Communities Development Authority, California, Revenue Bonds, Loma Linda University Medical Center, Series 2016A, 5.250%, 12/01/56, 144A | | 6/26 at 100.00 | | | 27,712,250 | |
| | | | |
| | 22,205 | | | | | California Statewide Communities Development Authority, California, Revenue Bonds, Loma Linda University Medical Center, Series 2018A, 5.500%, 12/01/58, 144A | | 6/28 at 100.00 | | | 20,310,554 | |
| | | | |
| | 11 | | | (e),(f) | | California Statewide Community Development Authority, Revenue Bonds, Daughters of Charity Health System, Series 2005A, 5.500%, 7/01/39 | | 1/22 at 100.00 | | | 10,994 | |
| | | | |
| | 7 | | | (e),(f) | | California Statewide Community Development Authority, Revenue Bonds, Daughters of Charity Health System, Series 2005H, 5.750%, 7/01/25 | | 1/22 at 100.00 | | | 7,421 | |
| | | | |
| | 9,955 | | | | | Capistrano Unified School District, Orange County, California, Special Tax Bonds, Community Facilities District 98-2, Series 2005, 0.000%, 9/01/31 - FGIC Insured | | No Opt. Call | | | 6,861,201 | |
| | | | |
| | 3,795 | | | | | Colton Joint Unified School District, San Bernardino County, California, General Obligation Bonds, Series 2006C, 0.000%, 2/01/37 - FGIC Insured | | No Opt. Call | | | 2,015,004 | |
| | | | |
| | 6,215 | | | | | CSCDA Community Improvement Authority, California, Essential Housing Revenue Bonds, Altana Glendale, Series 2021A-2, 4.000%, 10/01/56, 144A | | 10/31 at 100.00 | | | 4,170,931 | |
| | | | |
| | | | | | CSCDA Community Improvement Authority, California, Essential Housing Revenue Bonds, Monterrey Station Apartments, Senior Lien Series 2021A-1: | | | | | | |
| | 2,331 | | | | | 3.000%, 7/01/43, 144A | | 7/32 at 100.00 | | | 1,591,699 | |
| | 10,145 | | | | | 3.125%, 7/01/56, 144A | | 7/32 at 100.00 | | | 5,978,457 | |
| | | | |
| | 3,005 | | | | | CSCDA Community Improvement Authority, California, Essential Housing Revenue Bonds, Westgate Phase 1-Pasadena Apartments, Senior Lien
Series 2021A-1, 3.000%, 6/01/47, 144A | | 6/31 at 100.00 | | | 1,936,678 | |
| | | | |
| | 21,855 | | | | | CSCDA Community Improvement Authority, California, Essential Housing Revenue Bonds, Westgate Phase 1-Pasadena Apartments, Senior Lien
Series 2021A-2, 3.125%, 6/01/57, 144A | | 6/31 at 100.00 | | | 12,449,950 | |
| | | | |
| | 15,120 | | | | | CSCDA Community Improvement Authority, California, Essential Housing Revenue Bonds, Wood Creek Apartments, Senior Lien Series 2021A-1, 3.000%, 12/01/49 | | 6/32 at 100.00 | | | 9,011,444 | |
| | | | |
| | 1,320 | | | | | Davis, California, Special Tax Bonds, Community Facilities District 2015-1
Series 2015, 5.000%, 9/01/40 | | 9/25 at 100.00 | | | 1,278,582 | |
| | | | |
| | 2,510 | | | | | Folsom Cordova Unified School District, Sacramento County, California, General Obligation Bonds, School Facilities Improvement District 1,
Series 2004B, 0.000%, 10/01/28 - NPFG Insured | | No Opt. Call | | | 2,054,120 | |
80
| | | | | | | | | | | | |
Principal Amount (000) | | | | | Description (a) | | Optional Call Provisions (b) | | Value | |
| | | | |
| | | | | | California (continued) | | | | | | |
| | $ 3,360 | | | | | Folsom Cordova Unified School District, Sacramento County, California, General Obligation Bonds, School Facilities Improvement District 2,
Series 2002A, 0.000%, 7/01/27 - NPFG Insured | | No Opt. Call | | $ | 2,885,432 | |
| | | | |
| | 3,725 | | | | | Foothill/Eastern Transportation Corridor Agency, California, Toll Road Revenue Bonds, Refunding Senior Lien Series 2015A, 0.000%, 1/15/34 - AGM Insured | | No Opt. Call | | | 2,338,193 | |
| | | | |
| | | | | | Foothill/Eastern Transportation Corridor Agency, California, Toll Road Revenue Bonds, Refunding Series 2013A: | | | | | | |
| | 3,000 | | | (g) | | 0.000%, 1/15/26 | | No Opt. Call | | | 3,082,486 | |
| | 1,560 | | | (c) | | 5.750%, 1/15/46, (Pre-refunded 1/15/24) | | 1/24 at 100.00 | | | 1,566,341 | |
| | 3,560 | | | (c) | | 6.000%, 1/15/49, (Pre-refunded 1/15/24) | | 1/24 at 100.00 | | | 3,576,023 | |
| | | | |
| | 4,505 | | | | | Foothill-De Anza Community College District, Santa Clara County, California, Election of 1999 General Obligation Bonds, Series A,
0.000%, 8/01/30 - NPFG Insured | | No Opt. Call | | | 3,442,094 | |
| | | | |
| | 2,315 | | | | | Gateway Unified School District, California, General Obligation Bonds, Series 2004B, 0.000%, 8/01/32 - FGIC Insured | | No Opt. Call | | | 1,591,477 | |
| | | | |
| | 3,170 | | | (c) | | Golden State Tobacco Securitization Corporation, California, Enhanced Tobacco Settlement Asset-Backed Revenue Bonds, Series 2005A, 0.000%, 6/01/26 - AGM Insured, (ETM) | | No Opt. Call | | | 2,886,294 | |
| | | | |
| | | | | | Golden State Tobacco Securitization Corporation, California, Tobacco Settlement Asset-Backed Bonds, Tender Option Bond Trust 2015-XF1038: | | | | | | |
| | 2,445 | | | (c),(d) | | 14.939%, 6/01/40, (Pre-refunded 6/01/25), 144A, (IF) | | 6/25 at 100.00 | | | 2,643,604 | |
| | 1,250 | | | (d) | | 14.951%, 6/01/40, 144A, (IF) | | 6/25 at 100.00 | | | 1,351,587 | |
| | | | |
| | 15,000 | | | | | Grossmont Healthcare District, California, General Obligation Bonds, Refunding Series 2015D, 4.000%, 7/15/40 | | 7/25 at 100.00 | | | 13,304,863 | |
| | | | |
| | 3,190 | | | | | Hillsborough City School District, San Mateo County, California, General Obligation Bonds, Series 2006B, 0.000%, 9/01/27 | | No Opt. Call | | | 2,733,714 | |
| | | | |
| | 5,000 | | | | | Huntington Beach Union High School District, Orange County, California, General Obligation Bonds, Series 2005, 0.000%, 8/01/31 - NPFG Insured | | No Opt. Call | | | 3,602,790 | |
| | | | |
| | 2,500 | | | | | Huntington Beach Union High School District, Orange County, California, General Obligation Bonds, Series 2007, 0.000%, 8/01/32 - FGIC Insured | | No Opt. Call | | | 1,718,657 | |
| | | | |
| | 25,000 | | | (d) | | Irvine Facilities Financing Authority, California, Special Tax Revenue Bonds, Great Park Infrastructure Project Series 2023A, 4.000%, 9/01/58 - BAM Insured, (UB) | | 9/33 at 100.00 | | | 21,040,130 | |
| | | | |
| | 225 | | | (h) | | Long Beach Bond Finance Authority, California, Natural Gas Purchase Revenue Bonds, Series 2007B, 5.220%, 11/15/27 (3-Month LIBOR*0.67% reference rate + 1.450% spread) | | No Opt. Call | | | 222,349 | |
| | | | |
| | 12,000 | | | (d) | | Los Angeles Department of Airports, California, Revenue Bonds, Los Angeles International Airport, Senior Lien Series 2015D, 5.000%, 5/15/41, (AMT), (UB) | | 5/25 at 100.00 | | | 11,756,807 | |
| | | | |
| | 2,155 | | | | | Los Angeles Department of Airports, California, Revenue Bonds, Los Angeles International Airport, Senior Series 2022H, 5.000%, 5/15/42, (AMT) | | 11/31 at 100.00 | | | 2,113,501 | |
| | | | |
| | | | | | Los Angeles Department of Airports, California, Revenue Bonds, Los Angeles International Airport, Subordinate Lien Series 2021D: | | | | | | |
| | 4,930 | | | | | 4.000%, 5/15/46, (AMT) | | 11/31 at 100.00 | | | 4,058,019 | |
| | 70 | | | (c) | | 4.000%, 5/15/46, (Pre-refunded 11/15/31), (AMT) | | 11/31 at 100.00 | | | 68,829 | |
| | | | |
| | 2,000 | | | (c) | | Martinez Unified School District, Contra Costa County, California, General Obligation Bonds, Series 2011, 5.875%, 8/01/31, (Pre-refunded 8/01/24) | | 8/24 at 100.00 | | | 2,032,544 | |
| | | | |
| | 1,000 | | | (c) | | Mendocino-Lake Community College District, Mendocino and Lake Counties, California, General Obligation Bonds, Election 2006, Series 2011B, 5.600%, 8/01/31, (Pre-refunded 8/01/26) - AGM Insured | | 8/26 at 100.00 | | | 1,053,078 | |
81
| | |
| NZF | | Nuveen Municipal Credit Income Fund (continued) |
| | Portfolio of Investments October 31, 2023 |
| | | | | | | | | | | | |
Principal Amount (000) | | | | | Description (a) | | Optional Call Provisions (b) | | Value | |
| | | | |
| | | | | | California (continued) | | | | | | |
| | $ 10,000 | | | | | Milpitas Municipal Financing Authority, California, Wastewater Revenue Bonds, Series 2019, 4.000%, 11/01/49 | | 11/29 at 100.00 | | $ | 8,685,594 | |
| | | | |
| | 2,335 | | | | | Morongo Band of Mission Indians, California, Enterprise Revenue Bonds, Series 2018A, 5.000%, 10/01/42, 144A | | 10/28 at 100.00 | | | 2,188,226 | |
| | | | |
| | | | | | Mount San Antonio Community College District, Los Angeles County, California, General Obligation Bonds, Election of 2008, Series 2013A: | | | | | | |
| | 1,030 | | | | | 5.875%, 8/01/28 | | 2/28 at 100.00 | | | 1,126,140 | |
| | 2,320 | | | (g) | | 0.000%, 8/01/43 | | 8/35 at 100.00 | | | 2,020,300 | |
| | | | |
| | 5,420 | | | | | M-S-R Energy Authority, California, Gas Revenue Bonds, Citigroup Prepay Contracts, Series 2009B, 6.500%, 11/01/39 | | No Opt. Call | | | 6,104,719 | |
| | | | |
| | | | | | M-S-R Energy Authority, California, Gas Revenue Bonds, Citigroup Prepay Contracts, Series 2009C: | | | | | | |
| | 2,700 | | | | | 7.000%, 11/01/34 | | No Opt. Call | | | 3,143,644 | |
| | 2,200 | | | | | 6.500%, 11/01/39 | | No Opt. Call | | | 2,477,931 | |
| | | | |
| | | | | | North Orange County Community College District, California, General Obligation Bonds, Election of 2002 Series 2003B: | | | | | | |
| | 7,735 | | | | | 0.000%, 8/01/25 - FGIC Insured | | No Opt. Call | | | 7,197,750 | |
| | 4,180 | | | | | 0.000%, 8/01/26 - FGIC Insured | | No Opt. Call | | | 3,730,776 | |
| | | | |
| | 10,885 | | | | | Norwalk La Mirada Unified School District, Los Angeles County, California, General Obligation Bonds, Election 2002 Series 2005B, 0.000%, 8/01/25 - FGIC Insured | | No Opt. Call | | | 10,123,761 | |
| | | | |
| | 7,750 | | | | | Oxnard Union High School District, Ventura County, California, General Obligation Bonds, Election 2018 Series 2022C, 4.000%, 8/01/47 | | 8/30 at 100.00 | | | 6,753,642 | |
| | | | |
| | 6,000 | | | | | Palomar Pomerado Health, California, General Obligation Bonds, Capital Appreciation, Election of 2004, Series 2007A, 0.000%, 8/01/24 - NPFG Insured | | No Opt. Call | | | 5,812,619 | |
| | | | |
| | 12,210 | | | | | Palomar Pomerado Health, California, General Obligation Bonds, Convertible Capital Appreciation, Election 2004 Series 2010A, 6.750%, 8/01/40 | | 8/30 at 100.00 | | | 13,359,045 | |
| | | | |
| | 5,000 | | | | | Palomar Pomerado Health, California, General Obligation Bonds, Series 2009A, 7.000%, 8/01/38 - AGC Insured | | 8/29 at 100.00 | | | 5,528,345 | |
| | | | |
| | 3,200 | | | | | Redlands Unified School District, San Bernardino County, California, General Obligation Bonds, Series 2003, 0.000%, 7/01/27 - AGM Insured | | No Opt. Call | | | 2,713,760 | |
| | | | |
| | 2,755 | | | | | Sacramento City Unified School District, Sacramento County, California, General Obligation Bonds, Series 2007, 0.000%, 7/01/25 - AGM Insured | | No Opt. Call | | | 2,581,434 | |
| | | | |
| | 22,345 | | | | | San Diego County Regional Airport Authority, California, Airport Revenue Bonds, International Senior Series 2023B, 5.250%, 7/01/58, (AMT) | | 7/33 at 100.00 | | | 21,918,619 | |
| | | | |
| | 6,500 | | | | | San Diego County Regional Airport Authority, California, Airport Revenue Bonds, Senior Series 2023A, 5.000%, 7/01/58 | | 7/33 at 100.00 | | | 6,538,475 | |
| | | | |
| | 2,750 | | | | | San Diego County Regional Airport Authority, California, Airport Revenue Bonds, Subordinate Series 2017A, 5.000%, 7/01/47, (AMT) | | 7/27 at 100.00 | | | 2,601,615 | |
| | | | |
| | 2,360 | | | | | San Diego County Regional Airport Authority, California, Airport Revenue Bonds, Subordinate Series 2021B, 5.000%, 7/01/51, (AMT) | | 7/31 at 100.00 | | | 2,206,434 | |
| | | | |
| | 6,650 | | | | | San Francisco Airports Commission, California, Revenue Bonds, San Francisco International Airport, Refunding Second Series 2019A, 5.000%, 5/01/44, (AMT) | | 5/29 at 100.00 | | | 6,410,449 | |
| | | | |
| | 9,000 | | | | | San Francisco Airports Commission, California, Revenue Bonds, San Francisco International Airport, Second Series 2014A, 5.000%, 5/01/44, (AMT) | | 5/24 at 100.00 | | | 8,621,509 | |
82
| | | | | | | | | | | | |
Principal Amount (000) | | | | | Description (a) | | Optional Call Provisions (b) | | Value | |
| | | | |
| | | | | | California (continued) | | | | | | |
| | | | | | San Francisco Airports Commission, California, Revenue Bonds, San Francisco International Airport, Second Series 2018D: | | | | | | |
| | $ 25,670 | | | | | 5.000%, 5/01/43, (AMT) | | 5/28 at 100.00 | | $ | 24,886,284 | |
| | 33,485 | | | (d) | | 5.000%, 5/01/48, (AMT), (UB) | | 5/28 at 100.00 | | | 31,677,058 | |
| | | | |
| | 5,000 | | | | | San Joaquin Hills Transportation Corridor Agency, Orange County, California, Refunding Senior Lien Toll Road Revenue Bonds, Series 2021A,
4.000%, 1/15/50 | | 1/32 at 100.00 | | | 4,213,074 | |
| | | | |
| | 2,700 | | | | | San Joaquin Hills Transportation Corridor Agency, Orange County, California, Toll Road Revenue Bonds, Refunding Junior Lien Series 2014B,
5.250%, 1/15/44 | | 1/25 at 100.00 | | | 2,708,512 | |
| | | | |
| | | | | | San Joaquin Hills Transportation Corridor Agency, Orange County, California, Toll Road Revenue Bonds, Refunding Senior Lien Series 2014A: | | | | | | |
| | 6,630 | | | (c) | | 5.000%, 1/15/44, (Pre-refunded 1/15/25) | | 1/25 at 100.00 | | | 6,736,270 | |
| | 3,160 | | | (c) | | 5.000%, 1/15/50, (Pre-refunded 1/15/25) | | 1/25 at 100.00 | | | 3,210,651 | |
| | | | |
| | 5,760 | | | | | San Ysidro School District, San Diego County, California, General Obligation Bonds, Refunding Series 2015, 0.000%, 8/01/45 | | 8/25 at 34.92 | | | 1,790,139 | |
| | | | |
| | | | | | Silicon Valley Tobacco Securitization Authority, California, Tobacco Settlement Asset-Backed Bonds, Santa Clara County Tobacco Securitization Corporation, Series 2007A: | | | | | | |
| | 7,500 | | | | | 0.000%, 6/01/36 | | 12/23 at 49.99 | | | 3,424,297 | |
| | 37,555 | | | | | 0.000%, 6/01/47 | | 12/23 at 26.69 | | | 8,085,340 | |
| | | | |
| | 1,800 | | | | | Walnut Valley Unified School District, Los Angeles County, California, General Obligation Bonds, Election 2000 Series 2003D, 0.000%, 8/01/27 - FGIC Insured | | No Opt. Call | | | 1,539,258 | |
| | | | |
| | 4,005 | | | (g) | | Wiseburn School District, Los Angeles County, California, General Obligation Bonds, Series 2011B, 0.000%, 8/01/36 - AGM Insured | | 8/31 at 100.00 | | | 4,024,543 | |
| | | | | | Total California | | | | | 520,788,027 | |
| | | | |
| | | | | | Colorado - 7.0% (4.1% of Total Investments) | | | | | | |
| | | | |
| | 1,206 | | | | | Base Village Metropolitan District 2, Colorado, General Obligation Bonds, Refunding Series 2016A, 5.500%, 12/01/36 | | 12/23 at 101.00 | | | 1,166,651 | |
| | | | |
| | | | | | Canyons Metropolitan District 5, Douglas County, Colorado, Limited Tax General Obligation and Special Revenue Bonds, Refunding & Improvement Series 2017A: | | | | | | |
| | 775 | | | | | 6.000%, 12/01/37 | | 12/23 at 102.00 | | | 712,099 | |
| | 2,320 | | | | | 6.125%, 12/01/47 | | 12/23 at 102.00 | | | 2,087,628 | |
| | | | |
| | 685 | | | | | Canyons Metropolitan District 6, Douglas County, Colorado, Limited Tax General Obligation and Special Revenue Bonds, Refunding & Improvement Series 2017A, 6.125%, 12/01/47 | | 12/23 at 102.00 | | | 616,390 | |
| | | | |
| | | | | | Centerra Metropolitan District 1, Loveland, Colorado, Special Revenue Bonds, Refunding & Improvement Series 2017: | | | | | | |
| | 770 | | | | | 5.000%, 12/01/37, 144A | | 12/23 at 102.00 | | | 692,170 | |
| | 2,210 | | | | | 5.000%, 12/01/47, 144A | | 12/23 at 102.00 | | | 1,849,078 | |
| | | | |
| | 625 | | | (c) | | Central Platte Valley Metropolitan District, Colorado, General Obligation Bonds, Refunding Series 2013A, 6.000%, 12/01/38, (Pre-refunded 12/01/23) | | 12/23 at 100.00 | | | 625,937 | |
| | | | |
| | 900 | | | | | Cherry Creek Corporate Center Metropolitan District, Arapahoe County, Colorado, Revenue Bonds, Refunding Senior Lien Series 2015A, 5.000%, 6/01/37 | | 12/25 at 100.00 | | | 816,384 | |
| | | | |
| | 2,000 | | | (c) | | Colorado Health Facilities Authority, Colorado, Revenue Bonds, Children’s Hospital Colorado Project, Series 2013A, 5.000%, 12/01/36, (Pre-refunded 12/01/23) | | 12/23 at 100.00 | | | 2,000,141 | |
83
| | |
| NZF | | Nuveen Municipal Credit Income Fund (continued) |
| | Portfolio of Investments October 31, 2023 |
| | | | | | | | | | | | |
Principal Amount (000) | | | | | Description (a) | | Optional Call Provisions (b) | | Value | |
| | | | |
| | | | | | Colorado (continued) | | | | | | |
| | $ 2,820 | | | | | Colorado Health Facilities Authority, Colorado, Revenue Bonds, CommonSpirit Health, Series 2019A-1, 4.000%, 8/01/38 | | 8/29 at 100.00 | | $ | 2,453,492 | |
| | | | |
| | | | | | Colorado Health Facilities Authority, Colorado, Revenue Bonds, CommonSpirit Health, Series 2019A-2: | | | | | | |
| | 5,500 | | | | | 5.000%, 8/01/34 | | 8/29 at 100.00 | | | 5,590,301 | |
| | 1,105 | | | | | 5.000%, 8/01/37 | | 8/29 at 100.00 | | | 1,091,854 | |
| | 1,105 | | | | | 5.000%, 8/01/38 | | 8/29 at 100.00 | | | 1,086,383 | |
| | 5,035 | | | | | 5.000%, 8/01/39 | | 8/29 at 100.00 | | | 4,916,502 | |
| | 28,345 | | | | | 5.000%, 8/01/44 | | 8/29 at 100.00 | | | 26,800,756 | |
| | 820 | | | | | 4.000%, 8/01/49 | | 8/29 at 100.00 | | | 634,328 | |
| | | | |
| | | | | | Colorado Health Facilities Authority, Colorado, Revenue Bonds, CommonSpirit Health, Series 2022A: | | | | | | |
| | 5,000 | | | | | 5.500%, 11/01/47 | | 11/32 at 100.00 | | | 4,962,888 | |
| | 8,300 | | | (d) | | 5.250%, 11/01/52, (UB) | | 11/32 at 100.00 | | | 7,807,359 | |
| | | | |
| | 2,100 | | | | | Colorado Health Facilities Authority, Colorado, Revenue Bonds, Craig Hospital Project, Series 2012, 4.000%, 12/01/42 | | 12/23 at 100.00 | | | 1,755,909 | |
| | | | |
| | 3,655 | | | (c) | | Colorado Health Facilities Authority, Colorado, Revenue Bonds, Evangelical Lutheran Good Samaritan Society Project, Series 2013A, 5.000%, 6/01/45, (Pre-refunded 6/01/25) | | 6/25 at 100.00 | | | 3,712,386 | |
| | | | |
| | 2,105 | | | | | Colorado International Center Metropolitan District 14, Denver, Colorado, Limited Tax General Obligation Bonds, Refunding & Improvement Series 2018, 5.875%, 12/01/46 | | 12/23 at 103.00 | | | 1,892,076 | |
| | | | |
| | 3,870 | | | | | Denver City and County, Colorado, Airport System Revenue Bonds, Subordinate Lien Series 2013B, 5.000%, 11/15/43 | | 12/23 at 100.00 | | | 3,820,707 | |
| | | | |
| | | | | | Denver City and County, Colorado, Airport System Revenue Bonds, Subordinate Lien Series 2018A: | | | | | | |
| | 10,695 | | | (d) | | 5.000%, 12/01/48, (AMT), (UB) | | 12/28 at 100.00 | | | 10,026,840 | |
| | 13,965 | | | (d) | | 5.250%, 12/01/48, (AMT), (UB) | | 12/28 at 100.00 | | | 13,640,903 | |
| | | | |
| | | | | | Denver Urban Renewal Authority, Colorado, Tax Increment Revenue Bonds, 9th and Colorado Urban Redevelopement Area, Series 2018A: | | | | | | |
| | 1,240 | | | | | 5.250%, 12/01/39, 144A | | 12/23 at 103.00 | | | 1,184,206 | |
| | 365 | | | | | 5.250%, 12/01/39, 144A | | 12/23 at 103.00 | | | 348,577 | |
| | | | |
| | 10,000 | | | | | E-470 Public Highway Authority, Colorado, Senior Revenue Bonds, Capital Appreciation Series 2010A, 0.000%, 9/01/41 | | No Opt. Call | | | 3,848,972 | |
| | | | |
| | 8,845 | | | | | E-470 Public Highway Authority, Colorado, Senior Revenue Bonds,
Series 1997B, 0.000%, 9/01/26 - NPFG Insured | | No Opt. Call | | | 7,844,584 | |
| | | | |
| | | | | | E-470 Public Highway Authority, Colorado, Senior Revenue Bonds,
Series 2000B: | | | | | | |
| | 7,550 | | | | | 0.000%, 9/01/29 - NPFG Insured | | No Opt. Call | | | 5,887,710 | |
| | 11,100 | | | | | 0.000%, 9/01/31 - NPFG Insured | | No Opt. Call | | | 7,878,224 | |
| | 10,000 | | | | | 0.000%, 9/01/32 - NPFG Insured | | No Opt. Call | | | 6,762,452 | |
| | | | |
| | 4,000 | | | | | E-470 Public Highway Authority, Colorado, Toll Revenue Bonds, Refunding Series 2006B, 0.000%, 9/01/39 - NPFG Insured | | 9/26 at 52.09 | | | 1,761,738 | |
| | | | |
| | | | | | Foothills Metropolitan District, Fort Collins, Colorado, Special Revenue Bonds, Series 2014: | | | | | | |
| | 1,125 | | | | | 5.750%, 12/01/30 | | 12/24 at 100.00 | | | 1,061,215 | |
| | 1,000 | | | | | 6.000%, 12/01/38 | | 12/24 at 100.00 | | | 878,925 | |
| | | | |
| | 825 | | | | | North Range Metropolitan District 2, Adams County, Colorado , Limited Tax General Obligation Bonds, Refunding Special Revenue & Improvement Series 2017A, 5.750%, 12/01/47 | | 12/23 at 102.00 | | | 784,267 | |
| | | | |
| | 4,945 | | | | | Overlook Park Metropolitan District, Routt County, Colorado, General Obligation Bonds, Limited Tax Senior Series 2023A, 7.250%, 12/01/53 | | 6/28 at 103.00 | | | 4,556,101 | |
84
| | | | | | | | | | | | |
Principal Amount (000) | | | | | Description (a) | | Optional Call Provisions (b) | | Value | |
| | | | |
| | | | | | Colorado (continued) | | | | | | |
| | $ 4,310 | | | | | Painted Prairie Public Improvement Authority, Aurora, Colorado, Special Revenue Bonds, Series 2019, 5.000%, 12/01/39 | | 12/24 at 103.00 | | $ | 3,804,105 | |
| | | | |
| | 490 | | | | | Parker Automotive Metropolitan District (In the Town of Parker, Colorado), General Obligation Bonds, Refunding Series 2016, 5.000%, 12/01/45 | | 12/26 at 100.00 | | | 421,872 | |
| | | | |
| | | | | | Public Authority for Colorado Energy, Natural Gas Purchase Revenue Bonds, Colorado Springs Utilities, Series 2008: | | | | | | |
| | 475 | | | | | 6.250%, 11/15/28 | | No Opt. Call | | | 491,672 | |
| | 4,030 | | | | | 6.500%, 11/15/38 | | No Opt. Call | | | 4,456,903 | |
| | | | |
| | 954 | | | | | Reserve Metropolitan District 2, Mount Crested Butte, Colorado, Limited Tax General Obligation Bonds, Refunding Series 2016A, 5.000%, 12/01/45 | | 12/26 at 100.00 | | | 807,135 | |
| | | | |
| | 55 | | | | | Water Valley Metropolitan District 1, Colorado, General Obligation Bonds, Refunding Series 2016, 5.250%, 12/01/40 | | 12/26 at 100.00 | | | 50,188 | |
| | | | |
| | 105 | | | | | Water Valley Metropolitan District 2, Windsor, Colorado, General Obligation Bonds, Refunding Series 2016, 5.250%, 12/01/40 | | 12/26 at 100.00 | | | 96,013 | |
| | | | |
| | | | | | West Meadow Metropolitan District, Town of Fraser, Grand County, Colorado, Limited Tax General Obligation Bonds, Senior Series 2023A: | | | | | | |
| | 1,000 | | | | | 6.000%, 12/01/38, 144A | | 12/28 at 103.00 | | | 970,060 | |
| | 1,000 | | | | | 6.500%, 12/01/50, 144A | | 12/28 at 103.00 | | | 971,443 | |
| | | | |
| | 7,320 | | | | | Windy Gap Firming Project Water Activity Enterprise, Colorado, Senior Revenue Bonds, Series 2021, 5.000%, 7/15/51 | | 7/31 at 100.00 | | | 7,340,786 | |
| | | | | | Total Colorado | | | | | 162,966,310 | |
| | | | |
| | | | | | Connecticut - 0.2% (0.1% of Total Investments) | | | | | | |
| | | | |
| | 6,345 | | | | | Connecticut Health and Educational Facilities Authority, Revenue Bonds, Fairfield University, Series 2022U, 4.000%, 7/01/52 | | 7/32 at 100.00 | | | 4,978,941 | |
| | | | | | Total Connecticut | | | | | 4,978,941 | |
| | | | |
| | | | | | District of Columbia - 0.4% (0.2% of Total Investments) | | | | | | |
| | | | |
| | 5,000 | | | | | District of Columbia, Income Tax Secured Revenue Bonds, Series 2019A,
4.000%, 3/01/39 | | 9/29 at 100.00 | | | 4,559,200 | |
| | | | |
| | 10,000 | | | | | Metropolitan Washington Airports Authority, District of Columbia, Dulles Toll Road Revenue Bonds, Dulles Metrorail & Capital improvement Projects, Second Senior Lien Series 2009B, 0.000%, 10/01/37 - AGC Insured | | No Opt. Call | | | 4,771,576 | |
| | | | | | Total District of Columbia | | | | | 9,330,776 | |
| | | | |
| | | | | | Florida - 9.7% (5.6% of Total Investments) | | | | | | |
| | | | |
| | | | | | Bay County, Florida, Educational Facilities Revenue Refunding Bonds, Bay Haven Charter Academy, Inc. Project, Series 2013A: | | | | | | |
| | 1,005 | | | | | 5.000%, 9/01/43 | | 12/23 at 100.00 | | | 957,290 | |
| | 865 | | | | | 5.000%, 9/01/45 | | 12/23 at 100.00 | | | 817,105 | |
| | | | |
| | 615 | | | | | Belmont Community Development District, Florida, Capital Improvement Revenue Bonds, Series 2016A, 5.375%, 11/01/36 | | 11/27 at 100.00 | | | 594,254 | |
| | | | |
| | 665 | | | | | Bexley Community Development District, Pasco County, Florida, Special Assessment Revenue Bonds, Series 2016, 4.700%, 5/01/36 | | 5/26 at 100.00 | | | 607,385 | |
| | | | |
| | 935 | | | | | Bonterra Community Development District, Hialeah, Florida, Special Assessment Bonds, Assessment Area 2 Project, Series 2016, 4.500%, 5/01/34 | | 5/27 at 100.00 | | | 862,709 | |
| | | | |
| | | | | | Brevard County Health Facilities Authority, Florida, Hospital Revenue Bonds, Health First Obligated Group, Series 2022A: | | | | | | |
| | 3,315 | | | | | 5.000%, 4/01/41 | | 4/32 at 100.00 | | | 3,237,379 | |
| | 3,000 | | | | | 5.000%, 4/01/47 | | 4/32 at 100.00 | | | 2,852,226 | |
85
| | |
| NZF | | Nuveen Municipal Credit Income Fund (continued) |
| | Portfolio of Investments October 31, 2023 |
| | | | | | | | | | | | |
Principal Amount (000) | | | | | Description (a) | | Optional Call Provisions (b) | | Value | |
| | | | |
| | | | | | Florida (continued) | | | | | | |
| | | | |
| | $ 4,390 | | | | | Capital Trust Agency, Florida, Multifamily Housing Revenue Bonds, The Gardens Apartments Project, Series 2015A, 5.000%, 7/01/50 | | 7/25 at 100.00 | | $ | 2,918,568 | |
| | | | |
| | 325 | | | | | Capital Trust Agency, Florida, Revenue Bonds, Renaissance Charter School Project, Series 2019A, 5.000%, 6/15/39, 144A | | 6/26 at 100.00 | | | 283,365 | |
| | | | |
| | 150 | | | | | Charlotte County Industrial Development Authority, Florida, Utility System Revenue Bonds, Town & Country Utilities Project, Series 2019, 5.000%, 10/01/49, (AMT), 144A | | 10/27 at 100.00 | | | 127,447 | |
| | | | |
| | | | | | Creekside at Twin Creeks Community Development District, Florida, Special Assessment Bonds, Area 1 Project, Series 2016A-1: | | | | | | |
| | 120 | | | | | 5.250%, 11/01/37 | | 11/28 at 100.00 | | | 114,419 | |
| | 155 | | | | | 5.600%, 11/01/46 | | 11/28 at 100.00 | | | 144,972 | |
| | | | |
| | | | | | Downtown Doral Community Development District, Florida, Special Assessment Bonds, Series 2015: | | | | | | |
| | 555 | | | | | 5.250%, 5/01/35 | | 5/26 at 100.00 | | | 535,921 | |
| | 615 | | | | | 5.300%, 5/01/36 | | 5/26 at 100.00 | | | 594,287 | |
| | 955 | | | | | 5.500%, 5/01/45 | | 5/26 at 100.00 | | | 887,551 | |
| | 1,305 | | | | | 5.500%, 5/01/46 | | 5/26 at 100.00 | | | 1,205,610 | |
| | | | |
| | | | | | Escambia County Health Facilities Authority, Florida, Health Care Facilities Revenue Bonds, Baptist Health Care Corporation Obligated, Series 2020A: | | | | | | |
| | 12,505 | | | | | 4.000%, 8/15/45 | | 2/30 at 100.00 | | | 9,784,644 | |
| | 6,515 | | | | | 4.000%, 8/15/50 | | 2/30 at 100.00 | | | 4,919,476 | |
| | | | |
| | | | | | Florida Development Finance Corporation, Educational Facilities Revenue Bonds, Downtown Doral Charter Upper School Project, Series 2017C: | | | | | | |
| | 1,115 | | | | | 5.650%, 7/01/37, 144A | | 7/27 at 101.00 | | | 1,054,021 | |
| | 3,385 | | | | | 5.750%, 7/01/47, 144A | | 7/27 at 101.00 | | | 3,061,178 | |
| | | | |
| | | | | | Florida Development Finance Corporation, Educational Facilities Revenue Bonds, Florida Charter Foundation Inc. Projects, Series 2016A: | | | | | | |
| | 1,420 | | | | | 4.750%, 7/15/36, 144A | | 7/26 at 100.00 | | | 1,269,480 | |
| | 1,465 | | | | | 5.000%, 7/15/46, 144A | | 7/26 at 100.00 | | | 1,218,013 | |
| | | | |
| | | | | | Florida Development Finance Corporation, Educational Facilities Revenue Bonds, Pepin Academies Inc., Series 2016A: | | | | | | |
| | 1,000 | | | | | 5.000%, 7/01/36 | | 7/26 at 100.00 | | | 857,844 | |
| | 6,785 | | | | | 5.125%, 7/01/46 | | 7/26 at 100.00 | | | 5,203,873 | |
| | | | |
| | | | | | Florida Development Finance Corporation, Educational Facilities Revenue Bonds, Renaissance Charter School Income Projects, Series 2015A: | | | | | | |
| | 900 | | | | | 6.000%, 6/15/35, 144A | | 6/25 at 100.00 | | | 882,260 | |
| | 560 | | | | | 6.125%, 6/15/46, 144A | | 6/25 at 100.00 | | | 522,098 | |
| | | | |
| | 120 | | | | | Florida Development Finance Corporation, Educational Facilities Revenue Bonds, Renaissance Charter School, Inc. Projects, Series 2020C, 5.000%, 9/15/40, 144A | | 9/27 at 100.00 | | | 99,453 | |
| | | | |
| | | | | | Florida Development Finance Corporation, Educational Facilities Revenue Bonds, The Florida Charter Educational Foundation Inc. Projects, Series 2016A: | | | | | | |
| | 1,015 | | | | | 6.250%, 6/15/36, 144A | | 6/26 at 100.00 | | | 1,019,034 | |
| | 2,475 | | | | | 6.375%, 6/15/46, 144A | | 6/26 at 100.00 | | | 2,392,916 | |
| | | | |
| | 26,600 | | | | | Florida Development Finance Corporation, Florida, Surface Transportation Facility Revenue Bonds, Brightline Passenger Rail Project, Green Series 2019B, 7.375%, 1/01/49, (AMT), 144A | | 1/24 at 107.00 | | | 25,935,032 | |
86
| | | | | | | | | | | | |
Principal Amount (000) | | | | | Description (a) | | Optional Call Provisions (b) | | Value | |
| | | | |
| | | | | | Florida (continued) | | | | | | |
| | | | |
| | | | | | Florida Development Finance Corporation, Florida, Surface Transportation Facility Revenue Bonds, Virgin Trains USA Passenger Rail Project, Series 2019A: | | | | | | |
| $ | 16,155 | | | | | 6.250%, 1/01/49, (AMT), (Mandatory Put 1/01/24), 144A | | 12/23 at 101.00 | | $ | 16,114,989 | |
| | 10,000 | | | | | 6.375%, 1/01/49, (AMT), (Mandatory Put 1/01/26), 144A | | 12/23 at 102.00 | | | 9,519,079 | |
| | 14,210 | | | | | 6.500%, 1/01/49, (AMT), (Mandatory Put 1/01/29), 144A | | 12/23 at 102.00 | | | 13,430,550 | |
| | | | |
| | 25,000 | | | | | Florida Development Finance Corporation, Revenue Bonds, Brightline Passenger Rail Expansion Project, Series 2023C, 8.000%, 7/01/57, (AMT), (Mandatory Put 4/01/24), 144A | | 11/23 at 100.00 | | | 25,176,705 | |
| | | | |
| | 3,380 | | | | | Fort Myers, Florida, Utility System Revenue Bonds, Refunding Series 2019A, 4.000%, 10/01/49 | | 10/28 at 100.00 | | | 2,770,976 | |
| | | | |
| | 320 | | | | | Grand Bay at Doral Community Development District, Miami-Dade County, Florida, Special Assessment Bonds, South Parcel Assessment Area Project, Series 2016, 4.750%, 5/01/36 | | 5/26 at 100.00 | | | 294,502 | |
| | | | |
| | | | | | Greater Orlando Aviation Authority, Florida, Airport Facilities Revenue Bonds, Series 2019A: | | | | | | |
| | 5,000 | | | | | 4.000%, 10/01/39, (AMT) | | 10/29 at 100.00 | | | 4,356,958 | |
| | 4,230 | | | | | 4.000%, 10/01/49, (AMT) | | 10/29 at 100.00 | | | 3,374,116 | |
| | | | |
| | 4,500 | | | | | Greater Orlando Aviation Authority, Florida, Orlando Airport Facilities Revenue Bonds, Priority Subordinated Series 2017A, 5.000%, 10/01/42, (AMT) | | 10/27 at 100.00 | | | 4,364,625 | |
| | | | |
| | 6,845 | | | | | Hillsborough County Aviation Authority, Florida, Revenue Bonds, Tampa International Airport, Alternative Minimum Tax Refunding Subordinate Lien Series 2022A, 4.000%, 10/01/52, (AMT) | | 10/31 at 100.00 | | | 5,375,565 | |
| | | | |
| | 12,410 | | | | | Hillsborough County Aviation Authority, Florida, Revenue Bonds, Tampa International Airport, Series 2018E, 5.000%, 10/01/48, (AMT) | | 10/28 at 100.00 | | | 11,733,916 | |
| | | | |
| | 1,750 | | | (c) | | Hillsborough County Aviation Authority, Florida, Revenue Bonds, Tampa International Airport, Subordinate Lien Series 2015B, 5.000%, 10/01/40, (Pre-refunded 10/01/24), (AMT) | | 10/24 at 100.00 | | | 1,759,551 | |
| | | | |
| | 7,665 | | | | | Miami-Dade County, Florida, Aviation Revenue Bonds, Refunding Series 2019A, 5.000%, 10/01/49, (AMT) | | 10/29 at 100.00 | | | 7,139,189 | |
| | | | |
| | 2,140 | | | | | Northern Palm Beach County Improvement District, Florida, Water Control and Improvement Bonds, Development Unit 53, Series 2015, 5.350%, 8/01/35 | | 8/26 at 100.00 | | | 2,115,839 | |
| | | | |
| | 6,495 | | | | | Orange County Health Facilities Authority, Florida, Hospital Revenue Bonds, Orlando Health Obligated Group, Inc., Series 2022, 4.000%, 10/01/52 | | 4/32 at 100.00 | | | 5,229,452 | |
| | | | |
| | 7,500 | | | | | Orange County Health Facilities Authority, Florida, Hospital Revenue Bonds, Orlando Health, Inc., Series 2019A, 5.000%, 10/01/47 | | 4/29 at 100.00 | | | 7,261,530 | |
| | | | |
| | 500 | | | | | Palm Beach County Health Facilities Authority, Florida, Hospital Revenue Bonds, Jupiter Medical Center, Series 2022, 5.000%, 11/01/52 | | 11/32 at 100.00 | | | 447,425 | |
| | | | |
| | | | | | Palm Beach County, Florida, Revenue Bonds, Provident Group - PBAU Properties LLC - Palm Beach Atlantic University Housing Project, Series 2019A: | | | | | | |
| | 1,950 | | | | | 5.000%, 4/01/39, 144A | | 4/29 at 100.00 | | | 1,808,089 | |
| | 5,225 | | | | | 5.000%, 4/01/51, 144A | | 4/29 at 100.00 | | | 4,526,118 | |
| | | | |
| | 545 | | | | | Reunion West Community Development District, Florida, Special Assessment Bonds, Area 3 Project, Series 2016, 5.000%, 11/01/46 | | 11/26 at 100.00 | | | 482,969 | |
| | | | |
| | | | | | Six Mile Creek Community Development District, Florida, Capital Improvement Revenue Bonds, Assessment Area 2, Series 2016: | | | | | | |
| | 110 | | | | | 4.750%, 11/01/28 | | 11/27 at 100.00 | | | 108,320 | |
| | 265 | | | | | 5.375%, 11/01/36 | | 11/27 at 100.00 | | | 256,460 | |
87
| | |
| NZF | | Nuveen Municipal Credit Income Fund (continued) |
| | Portfolio of Investments October 31, 2023 |
| | | | | | | | | | | | |
Principal Amount (000) | | | | | Description (a) | | Optional Call Provisions (b) | | Value | |
| | | | |
| | | | | | Florida (continued) | | | | | | |
| | | | |
| $ | 10,075 | | | | | South Broward Hospital District, Florida, Hospital Revenue Bonds, South Broward Hospital District Obligated Group, Refunding Series 2016A, 4.000%, 5/01/44 | | 5/26 at 100.00 | | $ | 8,465,004 | |
| | | | |
| | 365 | | | | | South Village Community Development District, Clay County, Florida, Capital Improvement Revenue Bonds, Refunding Series 2016A1, 3.625%, 5/01/35 | | 5/26 at 100.00 | | | 320,416 | |
| | | | |
| | | | | | South Village Community Development District, Clay County, Florida, Capital Improvement Revenue Bonds, Refunding Series 2016A2: | | | | | | |
| | 85 | | | | | 4.350%, 5/01/26 | | No Opt. Call | | | 83,501 | |
| | 100 | | | | | 4.875%, 5/01/35 | | 5/26 at 100.00 | | | 94,176 | |
| | | | |
| | 1,350 | | | | | Sumter County Industrial Development Authority, Florida, Hospital Revenue Bonds, Central Florida Health Alliance Projects, Series 2014A, 5.125%, 7/01/34 | | 1/24 at 100.00 | | | 1,350,843 | |
| | | | |
| | | | | | Tallahassee, Florida, Health Facilities Revenue Bonds, Tallahassee Memorial HealthCare Inc. Project, Refunding Series 2015A: | | | | | | |
| | 1,000 | | | | | 5.000%, 12/01/40 | | 6/25 at 100.00 | | | 924,881 | |
| | 7,780 | | | (d) | | 5.000%, 12/01/44, (UB) | | 6/25 at 100.00 | | | 6,958,442 | |
| | | | |
| | 2,600 | | | (d) | | Tallahassee, Florida, Health Facilities Revenue Bonds, Tallahassee Memorial HealthCare Inc. Project, Series 2016A, 5.000%, 12/01/55, (UB) | | 12/25 at 100.00 | | | 2,203,894 | |
| | | | |
| | 395 | | | (g) | | Tolomato Community Development District, Florida, Special Assessment Bonds, Refunding Series 2015-2, 0.000%, 5/01/40 | | 12/23 at 100.00 | | | 367,582 | |
| | | | |
| | 430 | | | (e) | | Tolomato Community Development District, Florida, Special Assessment Bonds, Refunding Series 2015-3, 6.610%, 5/01/40 | | 12/23 at 100.00 | | | 4 | |
| | | | |
| | 300 | | | | | Union Park Community Development District, Florida, Capital Improvement Revenue Bonds, Series 2016A-1, 5.375%, 11/01/37 | | 11/27 at 100.00 | | | 288,725 | |
| | | | | | Total Florida | | | | | 223,664,201 | |
| | | | |
| | | | | | Georgia - 4.9% (2.9% of Total Investments) | | | | | | |
| | | | |
| | 285 | | | (e) | | Atlanta Development Authority, Georgia, Senior Health Care Facilities Revenue Bonds, Georgia Proton Treatment Center Project, Current Interest Series 2017A-1, 6.500%, 1/01/29 | | 1/28 at 100.00 | | | 128,250 | |
| | | | |
| | 1,205 | | | | | Atlanta Urban Residential Finance Authority, Georgia, Multifamily Housing Revenue Bonds, Testletree Village Apartments, Series 2013A, 4.500%, 11/01/35 | | 12/23 at 100.00 | | | 895,690 | |
| | | | |
| | 3,750 | | | (d) | | Atlanta, Georgia, Airport Passenger Facilities Charge and General Revenue Bonds, Refunding Subordinate Lien Series 2014A, 5.000%, 1/01/34 | | 1/24 at 100.00 | | | 3,755,895 | |
| | | | |
| | 2,030 | | | | | Atlanta, Georgia, General Obligation Bonds, Public Improvement Social Series 2022A-1, 5.000%, 12/01/41 | | 12/32 at 100.00 | | | 2,113,035 | |
| | | | |
| | 725 | | | | | Atlanta, Georgia, Tax Allocation Bonds, Perry Bolton Project Series 2014, 5.000%, 7/01/41 | | 12/23 at 100.00 | | | 704,485 | |
| | | | |
| | 4,000 | | | (d) | | Atlanta, Georgia, Water and Wastewater Revenue Bonds, Refunding Series 2018A, 5.000%, 11/01/39, (UB) | | 11/27 at 100.00 | | | 4,045,082 | |
| | | | |
| | | | | | Bainbridge, Georgia, Combined Utilities Revenue Bonds, Series 2021: | | | | | | |
| | 2,875 | | | | | 4.000%, 12/01/46 - BAM Insured | | 12/31 at 100.00 | | | 2,407,158 | |
| | 5,000 | | | | | 4.000%, 12/01/51 - BAM Insured | | 12/31 at 100.00 | | | 4,061,042 | |
| | | | |
| | 4,245 | | | (d) | | Brookhaven Development Authority, Georgia, Revenue Bonds, Children’s Healthcare of Atlanta, Inc. Project, Series 2019A, 4.000%, 7/01/49 | | 7/29 at 100.00 | | | 3,578,986 | |
| | | | |
| | 4,000 | | | (d) | | Bryan County School District, Georgia, General Obligation Bonds, Series 2018, 5.000%, 8/01/42, (UB) | | 8/26 at 100.00 | | | 4,017,772 | |
88
| | | | | | | | | | | | |
Principal Amount (000) | | | | | Description (a) | | Optional Call Provisions (b) | | Value | |
| | | | |
| | | | | | Georgia (continued) | | | | | | |
| | | | |
| | $ 1,250 | | | | | Burke County Development Authority, Georgia, Pollution Control Revenue Bonds, Oglethorpe Power Corporation Vogtle Project, Series 2017C, 4.125%, 11/01/45 | | 2/28 at 100.00 | | $ | 979,155 | |
| | | | |
| | 1,250 | | | | | Burke County Development Authority, Georgia, Pollution Control Revenue Bonds, Oglethorpe Power Corporation Vogtle Project, Series 2017D, 4.125%, 11/01/45 | | 2/28 at 100.00 | | | 979,155 | |
| | | | |
| | 1,925 | | | (d) | | Carroll City-County Hospital Authority, Georgia, Revenue Anticipation Certificates, Tanner Medical Center Inc. Project, Series 2020, 4.000%, 7/01/50 | | 7/30 at 100.00 | | | 1,588,994 | |
| | | | |
| | 5 | | | | | Cherokee County Water and Sewerage Authority, Georgia, Revenue Bonds, Series 2001, 5.000%, 8/01/35 - AGM Insured | | 12/23 at 100.00 | | | 5,002 | |
| | | | |
| | 2,460 | | | | | Cobb-Marietta Coliseum and Exhibit Hall Authority, Georgia, Revenue Bonds, Refunding Series 1993, 5.625%, 10/01/26 - NPFG Insured | | No Opt. Call | | | 2,517,181 | |
| | | | |
| | 8,200 | | | | | Columbia County Hospital Authority, Georgia, Revenue Anticipation Certificates, WellStar Health System, Inc. Project, Series 2023B, 5.125%, 4/01/53, (WI/DD) | | 4/33 at 100.00 | | | 7,981,713 | |
| | | | |
| | 1,760 | | | | | Crisp County Hospital Authority, Georgia, Revenue Anticipation Certificates, Crisp County Hospital Project, Series 2021, 4.000%, 7/01/46 | | 7/31 at 100.00 | | | 1,385,774 | |
| | | | |
| | 1,000 | | | | | Dalton, Georgia, Combined Utilities Revenue Bonds, Series 2020, 4.000%, 3/01/40 | | 3/30 at 100.00 | | | 857,840 | |
| | | | |
| | 1,340 | | | | | Douglas County Development Authority, Georgia, Charter School Revenue Bonds, Brighten Academy Project, Series 2013B, 7.000%, 10/01/43 | | 12/23 at 100.00 | | | 1,292,582 | |
| | | | |
| | 3,485 | | | | | Fulton County Development Authority, Georgia, Revenue Bonds, Piedmont Healthcare, Inc. Project, Series 2014A, 5.000%, 7/01/44 | | 7/24 at 100.00 | | | 3,350,181 | |
| | | | |
| | | | | | Fulton County Development Authority, Georgia, Revenue Bonds, Piedmont Healthcare, Inc. Project, Series 2019A: | | | | | | |
| | 29,265 | | | (d) | | 4.000%, 7/01/49, (UB) | | 7/29 at 100.00 | | | 23,668,092 | |
| | 2,500 | | | | | 4.000%, 7/01/49 - BAM Insured | | 7/29 at 100.00 | | | 2,033,843 | |
| | | | |
| | 3,000 | | | (c) | | Gainesville and Hall County Hospital Authority, Georgia, Revenue Anticipation Certificates, Northeast Georgia Health Services Inc., Series 2014A, 5.500%, 8/15/54, (Pre-refunded 2/15/25) | | 2/25 at 100.00 | | | 3,060,593 | |
| | | | |
| | | | | | Gainesville and Hall County Hospital Authority, Georgia, Revenue Anticipation Certificates, Northeast Georgia Health Services Inc., Series 2017B: | | | | | | |
| | 3,000 | | | (d) | | 5.500%, 2/15/42, (UB) | | 2/27 at 100.00 | | | 3,062,952 | |
| | 5,500 | | | (d) | | 5.250%, 2/15/45, (UB) | | 2/27 at 100.00 | | | 5,554,420 | |
| | | | |
| | 3,020 | | | | | Georgia Local Governments, Certificates of Participation, Georgia Municipal Association, Series 1998A, 4.750%, 6/01/28 - NPFG Insured | | No Opt. Call | | | 2,990,180 | |
| | | | |
| | | | | | Georgia Ports Authority, Revenue Bonds, Series 2021: | | | | | | |
| | 4,500 | | | | | 4.000%, 7/01/46 | | 7/31 at 100.00 | | | 3,844,788 | |
| | 3,000 | | | | | 4.000%, 7/01/51 | | 7/31 at 100.00 | | | 2,505,628 | |
| | | | |
| | 1,500 | | | | | Georgia State Road and Tollway Authority, Guaranteed Revenue Bonds, Managed Lane System, Series 2021A, 4.000%, 7/15/37 | | 7/31 at 100.00 | | | 1,452,224 | |
| | | | |
| | 840 | | | | | Macon-Bibb County Urban Development Authority, Georgia, Revenue Bonds, Academy for Classical Education, Series 2017, 5.875%, 6/15/47, 144A | | 6/27 at 100.00 | | | 776,987 | |
| | | | |
| | 260 | | | | | Main Street Natural Gas Inc., Georgia, Gas Project Revenue Bonds, Series 2007A, 5.500%, 9/15/26 | | No Opt. Call | | | 262,573 | |
| | | | |
| | 1,070 | | | | | Main Street Natural Gas Inc., Georgia, Gas Supply Revenue Bonds, Series 2019A, 5.000%, 5/15/43 | | 5/29 at 100.00 | | | 1,006,151 | |
89
| | |
| NZF | | Nuveen Municipal Credit Income Fund (continued) |
| | Portfolio of Investments October 31, 2023 |
| | | | | | | | | | | | |
Principal Amount (000) | | | | | Description (a) | | Optional Call Provisions (b) | | Value | |
| | | | |
| | | | | | Georgia (continued) | | | | | | |
| | | | |
| | $ 3,000 | | | | | Marietta Development Authority, Georgia, University Facilities Revenue Bonds, Life University, Inc. Project, Refunding Series 2017A, 5.000%, 11/01/47, 144A | | 11/27 at 100.00 | | $ | 2,356,593 | |
| | | | |
| | 3,325 | | | | | Monroe, Georgia, Combined Utilities Revenue Bonds, Series 2020, 4.000%, 12/01/45 - AGM Insured | | 12/30 at 100.00 | | | 2,808,843 | |
| | | | |
| | 3,700 | | | | | Municipal Electric Authority of Georgia, Plant Vogtle Units 3 & 4 Project J Bonds, Series 2015A, 5.500%, 7/01/60 | | 7/25 at 100.00 | | | 3,580,097 | |
| | | | |
| | 3,000 | | | | | Private Colleges and Universities Authority, Georgia, Revenue Bonds, Emory University, Refunding Series 2013A, 5.000%, 10/01/43 | | 11/23 at 100.00 | | | 2,999,870 | |
| | | | |
| | 2,000 | | | (d) | | Private Colleges and Universities Authority, Georgia, Revenue Bonds, Emory University, Refunding Series 2016A, 5.000%, 10/01/46, (UB) | | 10/26 at 100.00 | | | 1,997,392 | |
| | | | |
| | 3,000 | | | (c) | | Private Colleges and Universities Authority, Georgia, Revenue Bonds, Savannah College of Art & Design Projects, Series 2014, 5.000%, 4/01/44, (Pre-refunded 4/01/24) | | 4/24 at 100.00 | | | 3,014,369 | |
| | | | | | Total Georgia | | | | | 113,620,567 | |
| | | | |
| | | | | | Guam - 0.1% (0.0% of Total Investments) | | | | | | |
| | | | |
| | | | | | Government of Guam, Business Privilege Tax Bonds, Refunding Series 2015D: | | | | | | |
| | 195 | | | | | 5.000%, 11/15/33 | | 11/25 at 100.00 | | | 189,269 | |
| | 1,805 | | | | | 5.000%, 11/15/39 | | 11/25 at 100.00 | | | 1,640,170 | |
| | | | | | Total Guam | | | | | 1,829,439 | |
| | | | |
| | | | | | Hawaii - 0.1% (0.1% of Total Investments) | | | | | | |
| | | | |
| | 1,175 | | | | | Hawaii Department of Budget and Finance, Special Purpose Revenue Bonds, Hawaii Pacific University, Series 2013A, 6.625%, 7/01/33, 144A | | 12/23 at 100.00 | | | 1,175,480 | |
| | | | |
| | 2,320 | | | | | Hawaii State, Airport System Revenue Bonds, Series 2015A, 5.000%, 7/01/41, (AMT) | | 7/25 at 100.00 | | | 2,251,753 | |
| | | | | | Total Hawaii | | | | | 3,427,233 | |
| | | | |
| | | | | | Idaho - 0.1% (0.0% of Total Investments) | | | | | | |
| | | | |
| | 1,175 | | | | | Idaho Health Facilities Authority, Revenue Bonds, Madison Memorial Hospital Project, Refunding Series 2016, 5.000%, 9/01/37 | | 9/26 at 100.00 | | | 1,058,977 | |
| | | | |
| | 595 | | | | | Idaho Water Resource Board, Water Resource Loan Program Revenue, Ground Water Rights Mitigation Series 2012A, 5.000%, 9/01/32 | | 12/23 at 100.00 | | | 595,071 | |
| | | | | | Total Idaho | | | | | 1,654,048 | |
| | | | |
| | | | | | Illinois - 25.0% (14.6% of Total Investments) | | | | | | |
| | | | |
| | 55,000 | | | | | Chicago Board of Education, Illinois, Dedicated Capital Improvement Tax Revenue Bonds, Series 2016, 6.000%, 4/01/46 | | 4/27 at 100.00 | | | 55,330,919 | |
| | | | |
| | 2,255 | | | | | Chicago Board of Education, Illinois, General Obligation Bonds, Dedicated Revenues, Project Series 2015C, 5.250%, 12/01/35 | | 12/24 at 100.00 | | | 2,180,621 | |
| | | | |
| | 15,500 | | | | | Chicago Board of Education, Illinois, General Obligation Bonds, Dedicated Revenues, Refunding Series 2012B, 5.000%, 12/01/33 | | 12/23 at 100.00 | | | 14,767,312 | |
| | | | |
| | 8,400 | | | | | Chicago Board of Education, Illinois, General Obligation Bonds, Dedicated Revenues, Refunding Series 2017B, 7.000%, 12/01/42, 144A | | 12/27 at 100.00 | | | 8,763,279 | |
| | | | |
| | | | | | Chicago Board of Education, Illinois, General Obligation Bonds, Dedicated Revenues, Series 2016A: | | | | | | |
| | 1,800 | | | | | 7.000%, 12/01/26 | | 12/25 at 100.00 | | | 1,866,221 | |
| | 51,780 | | | | | 7.000%, 12/01/44 | | 12/25 at 100.00 | | | 52,919,118 | |
| | | | |
| | 1,335 | | | | | Chicago Board of Education, Illinois, General Obligation Bonds, Dedicated Revenues, Series 2016B, 6.500%, 12/01/46 | | 12/26 at 100.00 | | | 1,356,162 | |
90
| | | | | | | | | | | | |
Principal Amount (000) | | | | | Description (a) | | Optional Call Provisions (b) | | Value | |
| | | | |
| | | | | | Illinois (continued) | | | | | | |
| $ | 6,210 | | | | | Chicago Board of Education, Illinois, General Obligation Bonds, Dedicated Revenues, Series 2017A, 7.000%, 12/01/46, 144A | | 12/27 at 100.00 | | $ | 6,447,883 | |
| | | | |
| | 450 | | | | | Chicago Board of Education, Illinois, General Obligation Bonds, Series 1999A, 0.000%, 12/01/26 - NPFG Insured | | No Opt. Call | | | 386,770 | |
| | | | |
| | | | | | Chicago Board of Education, Illinois, Unlimited Tax General Obligation Bonds, Dedicated Tax Revenues, Series 1998B-1: | | | | | | |
| | 1,715 | | | | | 0.000%, 12/01/26 - NPFG Insured | | No Opt. Call | | | 1,474,022 | |
| | 1,000 | | | | | 0.000%, 12/01/27 - NPFG Insured | | No Opt. Call | | | 818,794 | |
| | 1,765 | | | | | 0.000%, 12/01/30 - NPFG Insured | | No Opt. Call | | | 1,234,693 | |
| | | | |
| | | | | | Chicago Board of Education, Illinois, Unlimited Tax General Obligation Bonds, Dedicated Tax Revenues, Series 1999A: | | | | | | |
| | 2,585 | | | | | 0.000%, 12/01/27 - NPFG Insured | | No Opt. Call | | | 2,116,584 | |
| | 8,565 | | | | | 0.000%, 12/01/31 - NPFG Insured | | No Opt. Call | | | 5,671,126 | |
| | | | |
| | 9,150 | | | (d) | | Chicago Transit Authority, Illinois, Sales Tax Receipts Revenue Bonds, Second Lien Series 2017, 5.000%, 12/01/51, (UB) | | 12/26 at 100.00 | | | 8,662,794 | |
| | | | |
| | 2,430 | | | | | Chicago Transit Authority, Illinois, Sales Tax Receipts Revenue Bonds, Second Lien Series 2020A, 5.000%, 12/01/45 | | 12/29 at 100.00 | | | 2,379,403 | |
| | | | |
| | 6,000 | | | | | Chicago Transit Authority, Illinois, Sales Tax Receipts Revenue Bonds, Second Lien Series 2022A, 5.000%, 12/01/57 | | 12/31 at 100.00 | | | 5,556,206 | |
| | | | |
| | | | | | Chicago, Illinois, General Obligation Bonds, City Colleges, Series 1999: | | | | | | |
| | 25,755 | | | | | 0.000%, 1/01/29 - NPFG Insured | | No Opt. Call | | | 20,034,928 | |
| | 8,765 | | | | | 0.000%, 1/01/34 - FGIC Insured | | No Opt. Call | | | 5,110,782 | |
| | 17,310 | | | | | 0.000%, 1/01/37 - FGIC Insured | | No Opt. Call | | | 8,234,765 | |
| | | | |
| | | | | | Chicago, Illinois, General Obligation Bonds, Neighborhoods Alive 21 Program,
Series 2002B: | | | | | | |
| | 670 | | | | | 5.500%, 1/01/31 | | 1/25 at 100.00 | | | 670,692 | |
| | 1,000 | | | | | 5.500%, 1/01/33 | | 1/25 at 100.00 | | | 999,918 | |
| | | | |
| | 2,695 | | | | | Chicago, Illinois, General Obligation Bonds, Project & Refunding Series 2014A, 5.000%, 1/01/35 | | 1/24 at 100.00 | | | 2,699,013 | |
| | | | |
| | 13,205 | | | | | Chicago, Illinois, General Obligation Bonds, Project & Refunding Series 2017A, 6.000%, 1/01/38 | | 1/27 at 100.00 | | | 13,528,849 | |
| | | | |
| | 2,000 | | | | | Chicago, Illinois, General Obligation Bonds, Project and Refunding Series 2005D, 5.500%, 1/01/40 | | 1/25 at 100.00 | | | 1,967,279 | |
| | | | |
| | | | | | Chicago, Illinois, General Obligation Bonds, Refunding Series 2007E: | | | | | | |
| | 10,115 | | | | | 5.500%, 1/01/35 | | 1/25 at 100.00 | | | 10,014,499 | |
| | 5,890 | | | | | 5.500%, 1/01/42 | | 1/25 at 100.00 | | | 5,734,770 | |
| | | | |
| | | | | | Chicago, Illinois, General Obligation Bonds, Refunding Series 2016C: | | | | | | |
| | 3,470 | | | | | 5.000%, 1/01/24 | | No Opt. Call | | | 3,470,329 | |
| | 350 | | | | | 5.000%, 1/01/29 | | 1/26 at 100.00 | | | 351,806 | |
| | 765 | | | | | 5.000%, 1/01/35 | | 1/26 at 100.00 | | | 760,428 | |
| | | | |
| | 1,610 | | | | | Chicago, Illinois, General Obligation Bonds, Series 1999, 0.000%, 1/01/30 | | No Opt. Call | | | 1,198,520 | |
| | | | |
| | | | | | Chicago, Illinois, General Obligation Bonds, Series 2015A: | | | | | | |
| | 1,000 | | | | | 5.500%, 1/01/35 | | 1/25 at 100.00 | | | 990,064 | |
| | 9,800 | | | | | 5.500%, 1/01/39 | | 1/25 at 100.00 | | | 9,650,769 | |
| | | | |
| | 10,125 | | | (d) | | Chicago, Illinois, General Obligation Bonds, Series 2019A, 5.000%, 1/01/44, (UB) | | 1/29 at 100.00 | | | 9,560,054 | |
| | | | |
| | 5,000 | | | | | Chicago, Illinois, Midway Airport Revenue Bonds, Refunding Senior Lien
Series 2023A, 5.500%, 1/01/53 - BAM Insured, (WI/DD) | | 1/33 at 100.00 | | | 5,031,241 | |
| | | | |
| | 5,000 | | | | | Chicago, Illinois, Wastewater Transmission Revenue Bonds, Second Lien Project, Series 2023A, 5.500%, 1/01/62 - AGM Insured | | 7/33 at 100.00 | | | 5,085,286 | |
91
| | |
| NZF | | Nuveen Municipal Credit Income Fund (continued) |
| | Portfolio of Investments October 31, 2023 |
| | | | | | | | | | | | |
Principal Amount (000) | | | | | Description (a) | | Optional Call Provisions (b) | | Value | |
| | | | |
| | | | | | Illinois (continued) | | | | | | |
| $ | 2,350 | | | | | Evanston, Cook County, Illinois, General Obligation Bonds, Corporate Purpose Series 2018A, 4.000%, 12/01/43 | | 6/28 at 100.00 | | $ | 2,008,792 | |
| | | | |
| | 12,190 | | | | | Illinois Finance Authority Revenue Bonds, OSF Healthcare System, Refunding Series 2018A, 4.125%, 5/15/47 | | 11/28 at 100.00 | | | 10,027,176 | |
| | | | |
| | 800 | | | | | Illinois Finance Authority, Charter School Revenue Bonds, Intrinsic Charter Schools Belmont School Project, Series 2015A, 5.500%, 12/01/30, 144A | | 12/25 at 100.00 | | | 779,850 | |
| | | | |
| | 20,000 | | | (d) | | Illinois Finance Authority, Revenue Bonds, Mercy Health Corporation,
Series 2016, 5.000%, 12/01/46, (UB) | | 6/26 at 100.00 | | | 18,891,464 | |
| | | | |
| | 17,770 | | | (d) | | Illinois Finance Authority, Revenue Bonds, Mercy Health Corporation,
Series 2016, 5.000%, 12/01/46 | | 6/26 at 100.00 | | | 16,785,066 | |
| | | | |
| | 3,375 | | | | | Illinois Finance Authority, Revenue Bonds, Silver Cross Hospital and Medical Centers, Refunding Series 2015C, 5.000%, 8/15/44 | | 8/25 at 100.00 | | | 3,174,335 | |
| | | | |
| | | | | | Illinois Finance Authority, Revenue Bonds, University of Chicago, Refunding Series 2015A: | | | | | | |
| | 2,700 | | | (c),(d) | | 5.000%, 10/01/46, (Pre-refunded 10/01/25), (UB) | | 10/25 at 100.00 | | | 2,751,344 | |
| | 300 | | | (d) | | 5.000%, 10/01/46, (UB) | | 10/25 at 100.00 | | | 298,395 | |
| | | | |
| | | | | | Illinois State, General Obligation Bonds, April Series 2014: | | | | | | |
| | 6,165 | | | | | 5.000%, 4/01/38 | | 4/24 at 100.00 | | | 5,932,745 | |
| | 5,000 | | | | | 5.000%, 4/01/39 | | 4/24 at 100.00 | | | 4,760,652 | |
| | | | |
| | | | | | Illinois State, General Obligation Bonds, February Series 2014: | | | | | | |
| | 4,100 | | | | | 5.250%, 2/01/31 | | 2/24 at 100.00 | | | 4,078,815 | |
| | 2,200 | | | | | 5.250%, 2/01/32 | | 2/24 at 100.00 | | | 2,184,681 | |
| | 2,435 | | | | | 5.250%, 2/01/33 | | 2/24 at 100.00 | | | 2,403,500 | |
| | 6,000 | | | | | 5.000%, 2/01/39 | | 2/24 at 100.00 | | | 5,716,078 | |
| | | | |
| | 1,785 | | | | | Illinois State, General Obligation Bonds, May Series 2020, 5.500%, 5/01/39 | | 5/30 at 100.00 | | | 1,827,111 | |
| | | | |
| | 7,605 | | | (d) | | Illinois State, General Obligation Bonds, May Series 2023B, 5.500%, 5/01/47, (UB) | | 5/32 at 100.00 | | | 7,649,171 | |
| | | | |
| | | | | | Illinois State, General Obligation Bonds, November Series 2016: | | | | | | |
| | 3,100 | | | | | 5.000%, 11/01/35 | | 11/26 at 100.00 | | | 3,100,263 | |
| | 3,000 | | | | | 5.000%, 11/01/37 | | 11/26 at 100.00 | | | 2,920,355 | |
| | 2,400 | | | | | 5.000%, 11/01/40 | | 11/26 at 100.00 | | | 2,270,507 | |
| | | | |
| | 5,795 | | | | | Illinois State, General Obligation Bonds, November Series 2017C,
5.000%, 11/01/29 | | 11/27 at 100.00 | | | 5,914,470 | |
| | | | |
| | 20,830 | | | (d) | | Illinois State, General Obligation Bonds, November Series 2017D,
5.000%, 11/01/27, (UB) | | No Opt. Call | | | 21,348,988 | |
| | 3,800 | | | (d) | | Illinois State, General Obligation Bonds, November Series 2017D,
5.000%, 11/01/27 | | No Opt. Call | | | 3,894,678 | |
| | | | |
| | 5,000 | | | | | Illinois State, General Obligation Bonds, October Series 2016,
5.000%, 2/01/27 | | No Opt. Call | | | 5,103,477 | |
| | | | |
| | 5,350 | | | | | Illinois State, General Obligation Bonds, Refunding April Series 2019B,
5.125%, 9/01/26 | | No Opt. Call | | | 5,462,958 | |
| | | | |
| | 5,295 | | | | | Illinois Toll Highway Authority, Toll Highway Revenue Bonds, Senior Lien Series 2013A, 5.000%, 1/01/38 | | 12/23 at 100.00 | | | 5,294,563 | |
| | | | |
| | 5,000 | | | | | Illinois Toll Highway Authority, Toll Highway Revenue Bonds, Senior Lien Series 2015A, 5.000%, 1/01/40 | | 7/25 at 100.00 | | | 4,990,379 | |
| | | | |
| | 560 | | | | | Illinois Toll Highway Authority, Toll Highway Revenue Bonds, Tender Option Bond Trust 2015-XF0052, 5.791%, 1/01/38, 144A, (IF) | | 1/23 at 100.00 | | | 559,815 | |
| | | | |
| | 2,500 | | | | | Kane & DeKalb Counties Community Unit School District 301, Illinois, General Obligation Bonds, Series 2006, 0.000%, 12/01/23 - NPFG Insured | | No Opt. Call | | | 2,490,449 | |
92
| | | | | | | | | | | | |
Principal Amount (000) | | | | | Description (a) | | Optional Call Provisions (b) | | Value | |
| | | | |
| | | | | | Illinois (continued) | | | | | | |
| $ | 5,400 | | | | | Metropolitan Pier and Exposition Authority, Illinois, McCormick Place Expansion Project Bonds, Refunding Series 2015B, 5.000%, 6/15/52 | | 12/25 at 100.00 | | $ | 4,991,212 | |
| | | | |
| | | | | | Metropolitan Pier and Exposition Authority, Illinois, McCormick Place Expansion Project Bonds, Refunding Series 2020A: | | | | | | |
| | 10,000 | | | | | 4.000%, 6/15/50 | | 12/29 at 100.00 | | | 7,784,519 | |
| | 13,000 | | | | | 5.000%, 6/15/50 | | 12/29 at 100.00 | | | 12,088,731 | |
| | | | |
| | | | | | Metropolitan Pier and Exposition Authority, Illinois, McCormick Place Expansion Project Bonds, Series 2015A: | | | | | | |
| | 23,110 | | | | | 0.000%, 12/15/52 | | No Opt. Call | | | 4,227,431 | |
| | 2,455 | | | | | 5.000%, 6/15/53 | | 12/25 at 100.00 | | | 2,262,500 | |
| | | | |
| | 1,945 | | | | | Metropolitan Pier and Exposition Authority, Illinois, McCormick Place Expansion Project Bonds, Series 2017A, 5.000%, 6/15/57 | | 12/27 at 100.00 | | | 1,779,586 | |
| | | | |
| | 8,000 | | | | | Metropolitan Pier and Exposition Authority, Illinois, McCormick Place Expansion Project Bonds, Series 2017B, 0.000%, 12/15/56 - AGM Insured | | No Opt. Call | | | 1,247,071 | |
| | | | |
| | 45,000 | | | | | Metropolitan Pier and Exposition Authority, Illinois, Revenue Bonds, McCormick Place Expansion Project, Capital Appreciation Refunding Series 2010B-1, 0.000%, 6/15/43 - AGM Insured | | No Opt. Call | | | 15,514,376 | |
| | | | |
| | 2,680 | | | | | Metropolitan Pier and Exposition Authority, Illinois, Revenue Bonds, McCormick Place Expansion Project, Refunding Series 1998A,
5.500%, 6/15/29 - NPFG Insured | | No Opt. Call | | | 2,716,798 | |
| | | | |
| | | | | | Metropolitan Pier and Exposition Authority, Illinois, Revenue Bonds, McCormick Place Expansion Project, Series 2002A: | | | | | | |
| | 8,400 | | | | | 0.000%, 12/15/30 - NPFG Insured | | No Opt. Call | | | 5,979,702 | |
| | 7,940 | | | | | 0.000%, 6/15/33 - NPFG Insured | | No Opt. Call | | | 5,009,113 | |
| | 450 | | | | | 0.000%, 12/15/34 - NPFG Insured | | No Opt. Call | | | 262,497 | |
| | 12,500 | | | | | 0.000%, 6/15/35 - NPFG Insured | | No Opt. Call | | | 7,081,720 | |
| | 10,620 | | | | | 0.000%, 12/15/35 - NPFG Insured | | No Opt. Call | | | 5,835,904 | |
| | 11,505 | | | | | 0.000%, 12/15/36 - NPFG Insured | | No Opt. Call | | | 5,905,844 | |
| | 65,000 | | | | | 0.000%, 12/15/38 - NPFG Insured | | No Opt. Call | | | 29,266,049 | |
| | 38,040 | | | | | 0.000%, 6/15/40 - NPFG Insured | | No Opt. Call | | | 15,531,721 | |
| | 3,720 | | | | | 0.000%, 6/15/41 - NPFG Insured | | No Opt. Call | | | 1,425,915 | |
| | | | |
| | 4,755 | | | | | Sales Tax Securitization Corporation, Illinois, Sales Tax Securitzation Bonds, Series 2018A, 5.000%, 1/01/40 | | 1/28 at 100.00 | | | 4,721,834 | |
| | | | |
| | 4,005 | | | | | Southwestern Illinois Development Authority, Environmental Improvement Revenue Bonds, US Steel Corporation Project,
Series 2012, 5.750%, 8/01/42, (AMT) | | 12/23 at 100.00 | | | 3,884,030 | |
| | | | |
| | 11,350 | | | | | Will County Community High School District 210 Lincoln-Way, Illinois, General Obligation Bonds, Series 2006, 0.000%, 1/01/24 - AGM Insured | | No Opt. Call | | | 11,267,863 | |
| | | | | | | Total Illinois | | | | | 578,430,392 | |
| | | | |
| | | | | | Indiana - 1.2% (0.7% of Total Investments) | | | | | | |
| | | | |
| | | | | | Carmel Redevelopment Authority, Indiana, Lease Rent Revenue Bonds, Series 2005: | | | | | | |
| | 1,950 | | | | | 0.000%, 2/01/24 | | No Opt. Call | | | 1,927,911 | |
| | 2,705 | | | | | 0.000%, 2/01/25 | | No Opt. Call | | | 2,553,040 | |
| | | | |
| | 4,400 | | | | | Crown Point Multi-School Building Corporation, Indiana, First Mortgage Bonds, Crown Point Community School Corporation, Series 2000, 0.000%, 1/15/24 - NPFG Insured | | No Opt. Call | | | 4,362,087 | |
| | | | |
| | 2,000 | | | | | Gary Local Public Improvement Bond Bank, Indiana, Economic Development Revenue Bonds, Drexel Foundation for Educational Excellence Project, Refunding Series 2020A, 5.875%, 6/01/55, 144A | | 6/30 at 100.00 | | | 1,574,273 | |
| | | | |
| | 1,230 | | | | | Indiana Finance Authority, Environmental Improvement Revenue Bonds, United States Steel Corporation Project, Series 2012, 5.750%, 8/01/42, (AMT) | | 12/23 at 100.00 | | | 1,192,848 | |
93
| | |
| NZF | | Nuveen Municipal Credit Income Fund (continued) |
| | Portfolio of Investments October 31, 2023 |
| | | | | | | | | | | | |
Principal Amount (000) | | | | | Description (a) | | Optional Call Provisions (b) | | Value | |
| | | | |
| | | | | | Indiana (continued) | | | | | | |
| | | | |
| $ | 4,375 | | | | | Indianapolis Local Public Improvement Bond Bank, Indiana, Community Justice Campus Bonds, Courthouse & Jail Project, Series 2019A, 3.840%, 2/01/54 | | 2/29 at 100.00 | | $ | 3,449,075 | |
| | | | |
| | 10,000 | | | | | Indianapolis Local Public Improvement Bond Bank, Indiana, Series 1999E,
0.000%, 2/01/26 - AMBAC Insured | | No Opt. Call | | | 9,067,437 | |
| | | | |
| | 1,000 | | | | | Merrillville, Indiana, Economic Development Revenue Bonds, Belvedere Housing Project, Series 2016, 5.750%, 4/01/36 | | 4/24 at 102.00 | | | 827,637 | |
| | | | |
| | 1,250 | | | | | Shoals, Indiana, Exempt Facilities Revenue Bonds, National Gypsum Company Project, Series 2013, 7.250%, 11/01/43, (AMT) | | 12/23 at 100.00 | | | 1,251,184 | |
| | | | |
| | 1,230 | | | | | Valparaiso, Indiana, Exempt Faciltiies Revenue Bonds, Pratt Paper LLC Project, Series 2013, 7.000%, 1/01/44, (AMT) | | 1/24 at 100.00 | | | 1,232,410 | |
| | | | | | Total Indiana | | | | | 27,437,902 | |
| | | | |
| | | | | | Iowa - 1.0% (0.6% of Total Investments) | | | | | | |
| | | | |
| | 5,750 | | | | | Iowa Finance Authority, Iowa, Midwestern Disaster Area Revenue Bonds, Alcoa Inc. Project, Series 2012, 4.750%, 8/01/42 | | 12/23 at 100.00 | | | 5,058,966 | |
| | | | |
| | 21,525 | | | | | Iowa Finance Authority, Iowa, Midwestern Disaster Area Revenue Bonds, Iowa Fertilizer Company Project, Refunding Series 2022, 5.000%, 12/01/50 | | 12/29 at 103.00 | | | 19,105,889 | |
| | | | | | | Total Iowa | | | | | 24,164,855 | |
| | | | |
| | | | | | Kansas - 0.6% (0.3% of Total Investments) | | | | | | |
| | | | |
| | 2,085 | | | | | Overland Park Development Corporation, Kansas, Revenue Bonds, Convention Center Hotel, Refunding & improvement Series 2019, 5.000%, 3/01/44 | | 3/29 at 100.00 | | | 1,817,469 | |
| | | | |
| | 3,565 | | | | | Overland Park, Kansas, Sales Tax Special Obligation Revenue Bonds, Prairiefire at Lionsgate Project, Series 2012, 6.000%, 12/15/32 | | 12/23 at 100.00 | | | 1,581,989 | |
| | | | |
| | 10,000 | | | | | University of Kansas Hospital Authority, Health Facilities Revenue Bonds, University of Kansas Health System, Series 2017A, 5.000%, 3/01/47 | | 3/27 at 100.00 | | | 9,561,915 | |
| | | | | | Total Kansas | | | | | 12,961,373 | |
| | | | |
| | | | | | Kentucky - 1.0% (0.6% of Total Investments) | | | | | | |
| | | | |
| | | | | | Christian County, Kentucky, Hospital Revenue Bonds, Jennie Stuart Medical Center, Series 2016: | | | | | | |
| | 5,000 | | | | | 5.375%, 2/01/36 | | 2/26 at 100.00 | | | 5,021,035 | |
| | 435 | | | | | 5.500%, 2/01/44 | | 2/26 at 100.00 | | | 417,029 | |
| | | | |
| | 2,355 | | | | | Henderson, Kentucky, Facilities Revenue Bonds, Pratt Paper LLC Project,
Series 2022A, 4.700%, 1/01/52, (AMT) | | 1/32 at 100.00 | | | 2,038,335 | |
| | | | |
| | | | | | Kentucky Economic Development Finance Authority, Kentucky, Healthcare Facilities Revenue Bonds, Rosedale Green Project, Refunding Series 2015: | | | | | | |
| | 500 | | | | | 5.750%, 11/15/45 | | 11/25 at 100.00 | | | 395,987 | |
| | 2,250 | | | | | 5.750%, 11/15/50 | | 11/25 at 100.00 | | | 1,731,234 | |
| | | | |
| | 6,000 | | | | | Kentucky Economic Development Finance Authority, Revenue Bonds, CommonSpirit Health, Series 2019A-2, 5.000%, 8/01/44 | | 8/29 at 100.00 | | | 5,673,118 | |
| | | | |
| | 5,070 | | | | | Kentucky Economic Development Finance Authority, Revenue Bonds, Next Generation Kentucky Information Highway Project, Senior Series 2015A,
5.000%, 1/01/45 | | 7/25 at 100.00 | | | 4,602,853 | |
| | | | |
| | | | | | Kentucky Public Transportation Infrastructure Authority, Toll Revenue Bonds, Downtown Crossing Project, Convertible Capital Appreciation First Tier
Series 2013C: | | | | | | |
| | 1,335 | | | | | 6.750%, 7/01/43 | | 7/31 at 100.00 | | | 1,457,987 | |
| | 2,295 | | | | | 6.875%, 7/01/46 | | 7/31 at 100.00 | | | 2,511,402 | |
94
| | | | | | | | | | | | |
Principal Amount (000) | | | | | Description (a) | | Optional Call Provisions (b) | | Value | |
| | | | |
| | | | | | Kentucky (continued) | | | | | | |
| $ | 215 | | | | | Warren County, Kentucky, Hospital Revenue Bonds, Bowling Green- Warren County Community Hospital Corporation, Series 2012A,
4.000%, 10/01/29 | | 12/23 at 100.00 | | $ | 213,840 | |
| | | | | | | Total Kentucky | | | | | 24,062,820 | |
| | | | |
| | | | | | Louisiana - 2.0% (1.2% of Total Investments) | | | | | | |
| | | | |
| | 500 | | | | | Jefferson Parish Economic Development and Port District, Louisiana, Kenner Discovery Health Sciences Academy Project, Series 2018A, 5.625%, 6/15/48, 144A | | 6/28 at 100.00 | | | 440,477 | |
| | | | |
| | | | | | Louisiana Publc Facilities Authority, Lousiana, Revenue Bonds, Ochsner Clinic Foundation Project, Refunding Series 2017: | | | | | | |
| | 5,000 | | | | | 5.000%, 5/15/42 | | 5/27 at 100.00 | | | 4,805,615 | |
| | 3,730 | | | | | 5.000%, 5/15/46 | | 5/27 at 100.00 | | | 3,485,869 | |
| | | | |
| | 18,730 | | | | | Louisiana Publc Facilities Authority, Lousiana, Revenue Bonds, Ochsner Clinic Foundation Project, Series 2020A, 4.000%, 5/15/49 | | 5/30 at 100.00 | | | 14,920,101 | |
| | | | |
| | 5,930 | | | | | Louisiana Public Facilities Authority, Dock and Wharf Revenue Bonds, Impala Warehousing (US) LLC Project, Series 2013, 6.500%, 7/01/36, (AMT), 144A | | 12/23 at 100.00 | | | 5,721,433 | |
| | | | |
| | 10 | | | (c) | | Louisiana Public Facilities Authority, Hospital Revenue Bonds, Franciscan Missionaries of Our Lady Health System, Refunding Series 2015A,
5.000%, 7/01/39, (Pre-refunded 7/01/25) | | 7/25 at 100.00 | | | 10,189 | |
| | | | |
| | 1,835 | | | | | Louisiana Public Facilities Authority, Revenue Bonds, Lake Charles Charter Academy Foundation Project, Series 2011A, 7.750%, 12/15/31 | | 12/23 at 100.00 | | | 1,837,683 | |
| | | | |
| | | | | | Louisiana Public Facilities Authority, Revenue Bonds, Loyola University Project, Refunding Series 2017: | | | | | | |
| | 1,775 | | | | | 5.250%, 10/01/36 | | 10/33 at 100.00 | | | 1,712,270 | |
| | 3,000 | | | | | 5.250%, 10/01/46 | | 10/33 at 100.00 | | | 2,639,848 | |
| | | | |
| | 7,000 | | | | | Louisiana Public Facilities Authority, Revenue Bonds, Ochsner Clinic Foundation Project, Series 2015, 5.000%, 5/15/47 | | 5/25 at 100.00 | | | 6,607,115 | |
| | | | |
| | 1,060 | | | | | Louisiana Public Facilities Authority, Revenue Bonds, Southwest Louisiana Charter Academy Foundation Project, Series 2013A,
8.375%, 12/15/43 | | 12/23 at 100.00 | | | 1,060,435 | |
| | | | |
| | 2,560 | | | (c) | | New Orleans, Louisiana, Sewerage Service Revenue Bonds, Refunding Series 2014, 5.000%, 6/01/44, (Pre-refunded 6/01/24) | | 6/24 at 100.00 | | | 2,575,944 | |
| | | | | | | Total Louisiana | | | | | 45,816,979 | |
| | | | |
| | | | | | Maine - 0.2% (0.1% of Total Investments) | | | | | | |
| | | | |
| | 4,965 | | | | | Maine Health and Higher Educational Facilities Authority Revenue Bonds, Eastern Maine Medical Center Obligated Group Issue, Series 2016A, 5.000%, 7/01/46 | | 7/26 at 100.00 | | | 3,996,828 | |
| | | | | | Total Maine | | | | | 3,996,828 | |
| | | | |
| | | | | | Maryland - 1.4% (0.8% of Total Investments) | | | | | | |
| | | | |
| | 2,795 | | | | | Maryland Economic Development Corporation, Private Activity Revenue Bonds, Purple Line Light Rail Project, Green Series 2022B,
5.000%, 12/31/41, (AMT) | | 6/32 at 100.00 | | | 2,606,024 | |
| | | | |
| | 2,000 | | | (e) | | Maryland Economic Development Corporation, Revenue Bonds, Chesapeake Bay Hyatt Conference Center, Series 2006A,
5.000%, 12/01/31 | | 12/23 at 100.00 | | | 1,200,000 | |
| | | | |
| | 7,145 | | | | | Maryland Health and Higher Educational Facilities Authority, Revenue Bonds, Adventist Healthcare, Series 2016A, 5.500%, 1/01/46 | | 1/27 at 100.00 | | | 6,699,364 | |
| | | | |
| | 20,000 | | | | | Maryland Health and Higher Educational Facilities Authority, Revenue Bonds, MedStar Health Issue, Series 2017A, 5.000%, 5/15/45 | | 5/27 at 100.00 | | | 19,447,596 | |
95
| | |
| NZF | | Nuveen Municipal Credit Income Fund (continued) |
| | Portfolio of Investments October 31, 2023 |
| | | | | | | | | | | | |
Principal Amount (000) | | | | | Description (a) | | Optional Call Provisions (b) | | Value | |
| | | | |
| | | | | | Maryland (continued) | | | | | | |
| | $ 2,000 | | | (c) | | Maryland Health and Higher Educational Facilities Authority, Revenue Bonds, Peninsula Regional Medical Center Issue, Refunding Series 2015,
5.000%, 7/01/45, (Pre-refunded 7/01/24) | | 7/24 at 100.00 | | $ | 2,010,980 | |
| | | | |
| | 355 | | | | | Prince George’s County Revenue Authority, Maryland, Special Obligation Bonds, Suitland-Naylor Road Project, Series 2016, 5.000%, 7/01/46, 144A | | 1/26 at 100.00 | | | 318,254 | |
| | | | | | Total Maryland | | | | | 32,282,218 | |
| | | | |
| | | | | | Massachusetts - 0.2% (0.1% of Total Investments) | | | | | | |
| | | | |
| | 525 | | | | | Massachusetts Development Finance Agency, Revenue Bonds, Boston Medical Center Issue, Green Bonds, Series 2015D, 5.000%, 7/01/44 | | 7/25 at 100.00 | | | 488,640 | |
| | | | |
| | 1,525 | | | | | Massachusetts Development Finance Agency, Revenue Bonds, Emerson College, Series 2015, 4.500%, 1/01/45 | | 1/25 at 100.00 | | | 1,287,359 | |
| | | | |
| | 1,800 | | | | | Massachusetts Development Finance Agency, Revenue Bonds, Emmanuel College, Series 2016A, 5.000%, 10/01/34 | | 10/26 at 100.00 | | | 1,803,691 | |
| | | | | | Total Massachusetts | | | | | 3,579,690 | |
| | | | |
| | | | | | Michigan - 1.7% (1.0% of Total Investments) | | | | | | |
| | | | |
| | | | | | Detroit Academy of Arts and Sciences, Michigan, Public School Academy Revenue Bonds, Refunding Series 2013: | | | | | | |
| | 700 | | | | | 6.000%, 10/01/33 | | 12/23 at 100.00 | | | 634,691 | |
| | 1,250 | | | | | 6.000%, 10/01/43 | | 12/23 at 100.00 | | | 1,051,941 | |
| | | | |
| | 12,600 | | | | | Detroit City School District, Wayne County, Michigan, Unlimited Tax School Building and Site Improvement Bonds, Series 2001A, 6.000%, 5/01/29 - AGM Insured, (UB) | | No Opt. Call | | | 13,489,036 | |
| | | | |
| | 5 | | | | | Detroit, Michigan, Second Lien Sewerage Disposal System Revenue Bonds, Series 2005A, 4.500%, 7/01/35 - NPFG Insured | | 12/23 at 100.00 | | | 5,000 | |
| | | | |
| | 2,925 | | | | | Detroit, Michigan, Senior Lien Sewerage Disposal System Revenue Bonds, Series 2001B, 5.500%, 7/01/29 - NPFG Insured | | No Opt. Call | | | 2,982,512 | |
| | | | |
| | 5 | | | | | Detroit, Michigan, Sewer Disposal System Revenue Bonds, Second Lien, Series 2006B, 5.000%, 7/01/36 - FGIC Insured | | 12/23 at 100.00 | | | 5,005 | |
| | | | |
| | 10 | | | | | Detroit, Michigan, Water Supply System Revenue Bonds, Senior Lien
Series 2003A, 5.000%, 7/01/34 - NPFG Insured | | 12/23 at 100.00 | | | 10,010 | |
| | | | |
| | 10,000 | | | | | Michigan Finance Authority, Hospital Revenue Bonds, Beaumont Health Credit Group, Series 2016A, 5.000%, 11/01/44 | | 11/25 at 100.00 | | | 9,501,128 | |
| | | | |
| | 6,800 | | | | | Michigan Finance Authority, Hospital Revenue Bonds, Henry Ford Health System, Series 2019A, 5.000%, 11/15/48 | | 11/29 at 100.00 | | | 6,401,423 | |
| | | | |
| | 1,000 | | | | | Michigan Finance Authority, Local Government Loan Program Revenue Bonds, Detroit Water & Sewerage Department Water Supply System Local Project,
Series 2014D-6, 5.000%, 7/01/36 - NPFG Insured | | 7/24 at 100.00 | | | 1,001,976 | |
| | | | |
| | 5,000 | | | | | Michigan State Building Authority, Revenue Bonds, Facilities Program, Refunding Series 2019-I, 4.000%, 4/15/54 | | 10/29 at 100.00 | | | 4,084,046 | |
| | | | | | Total Michigan | | | | | 39,166,768 | |
| | | | |
| | | | | | Minnesota - 2.0% (1.1% of Total Investments) | | | | | | |
| | | | |
| | 700 | | | | | City of Ham Lake, Minnesota, Charter School Lease Revenue Bonds, DaVinci Academy Project,Series 2016A, 5.000%, 7/01/47 | | 7/24 at 102.00 | | | 543,198 | |
| | | | |
| | | | | | Duluth Economic Development Authority, Minnesota, Health Care Facilities Revenue Bonds, Essentia Health Obligated Group, Series 2018A: | | | | | | |
| | 10,000 | | | | | 5.000%, 2/15/53 | | 2/28 at 100.00 | | | 9,004,012 | |
| | 15,830 | | | | | 5.250%, 2/15/53 | | 2/28 at 100.00 | | | 15,249,385 | |
| | 4,765 | | | | | 5.000%, 2/15/58 | | 2/28 at 100.00 | | | 4,271,034 | |
| | | | |
| | 1,500 | | | | | Forest Lake, Minnesota, Charter School Lease Revenue Bonds, Lakes International Language Academy, Series 2014A, 5.750%, 8/01/44 | | 12/23 at 101.00 | | | 1,372,657 | |
96
| | | | | | | | | | | | |
Principal Amount (000) | | | | | Description (a) | | Optional Call Provisions (b) | | Value | |
| | | | |
| | | | | | Minnesota (continued) | | | | | | |
| | $ 800 | | | | | Minneapolis, Minnesota, Charter School Lease Revenue Bonds, Hiawatha Academies Project, Series 2022A, 5.500%, 7/01/52 | | 7/32 at 100.00 | | $ | 670,348 | |
| | | | |
| | | | | | Saint Paul Housing & Redevelopment Authority, Minnesota, Charter School Lease Revenue Bonds, Hmong College Prep Academy Project, Series 2016A: | | | | | | |
| | 750 | | | | | 5.750%, 9/01/46 | | 9/26 at 100.00 | | | 694,367 | |
| | 4,000 | | | | | 6.000%, 9/01/51 | | 9/26 at 100.00 | | | 3,753,502 | |
| | | | |
| | 6,000 | | | | | Saint Paul Housing and Redevelopment Authority, Minnesota, Health Care Facility Revenue Bonds, HealthPartners Obligated Group, Refunding Series 2015A, 5.000%, 7/01/32 | | 7/25 at 100.00 | | | 6,014,534 | |
| | | | |
| | 3,850 | | | | | Saint Paul Port Authority, Minnesota, Lease Revenue Bonds, Regions Hospital Parking Ramp Project, Series 2007-1, 5.000%, 8/01/36 | | 12/23 at 100.00 | | | 3,787,788 | |
| | | | | | Total Minnesota | | | | | 45,360,825 | |
| | | | |
| | | | | | Missouri - 1.6% (1.0% of Total Investments) | | | | | | |
| | | | |
| | 560 | | | | | Branson Industrial Development Authority, Missouri, Tax Increment Revenue Bonds, Branson Shoppes Redevelopment Project, Refunding Series 2017A, 3.900%, 11/01/29 | | 11/25 at 100.00 | | | 500,618 | |
| | | | |
| | 895 | | | | | Cape Girardeau County Industrial Development Authority, Missouri, Health Facilities Revenue Bonds, Southeasthealth, Series 2016A, 6.000%, 3/01/33 | | 12/23 at 103.00 | | | 922,554 | |
| | | | |
| | 55 | | | | | Cape Girardeau County Industrial Development Authority, Missouri, Health Facilities Revenue Bonds, Southeasthealth, Series 2017A, 5.000%, 3/01/36 | | 3/27 at 100.00 | | | 53,504 | |
| | | | |
| | 10,090 | | | | | Kansas City Industrial Development Authority, Missouri, Airport Special Obligation Bonds, Kansas City International Airport Terminal Modernization Project, Series 2019B, 5.000%, 3/01/46, (AMT) | | 3/29 at 100.00 | | | 9,505,157 | |
| | | | |
| | 135 | | | | | Kansas City Industrial Development Authority, Missouri, Sales Tax Revenue Bonds, Ward Parkway Center Community Improvement District, Senior Refunding & Improvement Series 2016, 5.000%, 4/01/46, 144A | | 4/26 at 100.00 | | | 108,291 | |
| | | | |
| | 12,005 | | | | | Kansas City Municipal Assistance Corporation, Missouri, Leasehold Revenue Bonds, Improvement Series 2004B-1, 0.000%, 4/15/29 - AMBAC Insured | | No Opt. Call | | | 9,498,671 | |
| | | | |
| | 650 | | | | | Land Clearance for Redevelopment Authority of Kansas City, Missouri, Project Revenue Bonds, Convention Center Hotel Project - TIF Financing, Series 2018B, 5.000%, 2/01/40, 144A | | 2/28 at 100.00 | | | 489,277 | |
| | | | |
| | | | | | Liberty, Missouri, Special Obligation Tax Increment and Special Districts Bonds, Liberty Commons Project, Series 2015A: | | | | | | |
| | 660 | | | | | 5.125%, 6/01/25, 144A | | No Opt. Call | | | 644,807 | |
| | 3,810 | | | | | 5.750%, 6/01/35, 144A | | 6/25 at 100.00 | | | 3,339,869 | |
| | 3,695 | | | | | 6.000%, 6/01/46, 144A | | 6/25 at 100.00 | | | 3,124,061 | |
| | | | |
| | | | | | Missouri Health and Educational Facilities Authority, Educational Facilities Revenue Bonds, Kansas City University of Medicine and Biosciences,
Series 2013A: | | | | | | |
| | 1,590 | | | | | 5.000%, 6/01/30 | | 11/23 at 100.00 | | | 1,590,798 | |
| | 2,700 | | | | | 5.000%, 6/01/33 | | 11/23 at 100.00 | | | 2,701,330 | |
| | | | |
| | 50 | | | | | Missouri Health and Educational Facilities Authority, Health Facilities Revenue Bonds, CoxHealth, Series 2013A, 5.000%, 11/15/44 | | 12/23 at 100.00 | | | 48,418 | |
| | | | |
| | 2,000 | | | | | Missouri Health and Educational Facilities Authority, Health Facilities Revenue Bonds, Mercy Health, Series 2014F, 5.000%, 11/15/45 | | 11/24 at 100.00 | | | 1,948,553 | |
| | | | |
| | 1,105 | | | | | Saint Louis County Industrial Development Authority, Missouri, Health Facilities Revenue Bonds, Ranken-Jordan Project, Refunding & Improvement Series 2016, 5.000%, 11/15/46 | | 11/25 at 100.00 | | | 937,348 | |
97
| | |
| NZF | | Nuveen Municipal Credit Income Fund (continued) |
| | Portfolio of Investments October 31, 2023 |
| | | | | | | | | | | | |
Principal Amount (000) | | | | | Description (a) | | Optional Call Provisions (b) | | Value | |
| | | | |
| | | | | | Missouri (continued) | | | | | | |
| | $ 430 | | | | | Saint Louis County Industrial Development Authority, Missouri, Revenue Bonds, Friendship Village of Sunset Hills, Series 2013A, 5.875%, 9/01/43 | | 12/23 at 100.00 | | $ | 409,427 | |
| | | | |
| | | | | | Saint Louis County Industrial Development Authority, Missouri, Revenue Bonds, Saint Andrew’s Resources for Seniors, Series 2015A: | | | | | | |
| | 450 | | | | | 5.000%, 12/01/35 | | 12/25 at 100.00 | | | 401,362 | |
| | 130 | | | | | 5.125%, 12/01/45 | | 12/25 at 100.00 | | | 107,997 | |
| | | | |
| | 830 | | | | | Stoddard County Industrial Development Authority, Missouri, Health Facility Revenue Bonds, Southeasthealth, Series 2016B, 6.000%, 3/01/37 | | 12/23 at 103.00 | | | 855,694 | |
| | | | |
| | 700 | | | | | The Industrial Development Authority of the City of Saint Louis, Missouri, Development Financing Revenue Bonds, Ballpark Village Development Project, Series 2017A, 4.750%, 11/15/47 | | 11/26 at 100.00 | | | 475,023 | |
| | | | | | Total Missouri | | | | | 37,662,759 | |
| | | | |
| | | | | | Nebraska - 0.4% (0.2% of Total Investments) | | | | | | |
| | | | |
| | 5,835 | | | | | Central Plains Energy Project, Nebraska, Gas Project 3 Revenue Bonds, Refunding Crossover Series 2017A, 5.000%, 9/01/42 | | No Opt. Call | | | 5,486,936 | |
| | | | |
| | 3,435 | | | | | Douglas County Hospital Authority 2, Nebraska, Health Facilities Revenue Bonds, Children’s Hospital Obligated Group, Series 2017, 5.000%, 11/15/47 | | 5/27 at 100.00 | | | 3,292,284 | |
| | | | | | Total Nebraska | | | | | 8,779,220 | |
| | | | |
| | | | | | Nevada - 0.3% (0.2% of Total Investments) | | | | | | |
| | | | |
| | 2,000 | | | | | Clark County School District, Nevada, General Obligation Bonds, Limited Tax Building Series 2018A, 4.000%, 6/15/37 | | 6/28 at 100.00 | | | 1,793,439 | |
| | | | |
| | 4,410 | | | | | Clark County, Nevada, General Obligation Bonds, Stadium Improvement, Limited Tax Additionally Secured by Pledged Revenues, Series 2018A, 5.000%, 5/01/48 | | 6/28 at 100.00 | | | 4,410,137 | |
| | | | | | Total Nevada | | | | | 6,203,576 | |
| | | | |
| | | | | | New Hampshire - 0.3% (0.2% of Total Investments) | | | | | | |
| | | | |
| | 2,995 | | | | | National Finance Authority, New Hampshire, Resource Recovery Revenue Bonds, Covanta Project, Refunding Series 2018C, 4.875%, 11/01/42, (AMT), 144A | | 12/23 at 100.00 | | | 2,339,731 | |
| | | | |
| | 6,060 | | | | | New Hampshire Health and Education Facilities Authority, Revenue Bonds, Covenant Health Group Series 2023, 4.000%, 7/01/37, 144A | | 1/33 at 100.00 | | | 4,918,569 | |
| | | | | | Total New Hampshire | | | | | 7,258,300 | |
| | | | |
| | | | | | New Jersey - 7.6% (4.4% of Total Investments) | | | | | | |
| | | | |
| | 200 | | | (c) | | Gloucester County Pollution Control Financing Authority, New Jersey, Pollution Control Revenue Bonds, Logan Project, Refunding Series 2014A,
5.000%, 12/01/24, (AMT), (ETM) | | No Opt. Call | | | 200,340 | |
| | | | |
| | 1,100 | | | | | New Jersey Economic Development Authority, Private Activity Bonds, The Goethals Bridge Replacement Project, Series 2013, 5.125%, 7/01/42 - AGM Insured, (AMT) | | 1/24 at 100.00 | | | 1,099,901 | |
| | | | |
| | 17,580 | | | (c) | | New Jersey Economic Development Authority, School Facilities Construction Bonds, Refunding Series 2016BBB, 5.500%, 6/15/31, (Pre-refunded 12/15/26) | | 12/26 at 100.00 | | | 18,468,398 | |
| | | | |
| | | | | | New Jersey Economic Development Authority, School Facilities Construction Bonds, Series 2015WW: | | | | | | |
| | 755 | | | (c),(d) | | 5.250%, 6/15/40, (Pre-refunded 6/15/25), (UB) | | 6/25 at 100.00 | | | 772,443 | |
| | 40 | | | (c),(d) | | 5.250%, 6/15/40, (Pre-refunded 6/15/25), (UB) | | 6/25 at 100.00 | | | 40,924 | |
| | | | |
| | | | | | New Jersey Economic Development Authority, School Facilities Construction Bonds, Series 2016AAA: | | | | | | |
| | 1,000 | | | | | 5.000%, 6/15/36 | | 12/26 at 100.00 | | | 1,004,744 | |
98
| | | | | | | | | | | | |
Principal Amount (000) | | | | | Description (a) | | Optional Call Provisions (b) | | Value | |
| | | | |
| | | | | | New Jersey (continued) | | | | | | |
| | $ 10,000 | | | (c) | | 5.000%, 6/15/41, (Pre-refunded 12/15/26) | | 12/26 at 100.00 | | $ | 10,359,520 | |
| | | | |
| | | | | | New Jersey Economic Development Authority, School Facilities Construction Bonds, Series 2017DDD: | | | | | | |
| | 2,000 | | | (c) | | 5.000%, 6/15/35, (Pre-refunded 6/15/27) | | 6/27 at 100.00 | | | 2,091,966 | |
| | 2,175 | | | (c) | | 5.000%, 6/15/42, (Pre-refunded 6/15/27) | | 6/27 at 100.00 | | | 2,275,013 | |
| | | | |
| | 16,000 | | | | | New Jersey Economic Development Authority, School Facilities Construction Bonds, Series 2019LLL, 5.000%, 6/15/49 | | 12/29 at 100.00 | | | 15,643,538 | |
| | | | |
| | 1,650 | | | | | New Jersey Economic Development Authority, Special Facilities Revenue Bonds, Continental Airlines Inc., Series 1999, 5.250%, 9/15/29, (AMT) | | 12/23 at 100.50 | | | 1,614,083 | |
| | | | |
| | 2,900 | | | | | New Jersey Transportation Trust Fund Authority, Transportation Program Bonds, Series 2022BB, 4.000%, 6/15/41 | | 12/31 at 100.00 | | | 2,555,640 | |
| | | | |
| | 19,650 | | | | | New Jersey Transportation Trust Fund Authority, Transportation Program Bonds, Series 2022CC, 5.000%, 6/15/48 | | 12/32 at 100.00 | | | 19,267,130 | |
| | | | |
| | | | | | New Jersey Transportation Trust Fund Authority, Transportation System Bonds, Capital Appreciation Series 2010A: | | | | | | |
| | 3,130 | | | | | 0.000%, 12/15/28 | | No Opt. Call | | | 2,503,310 | |
| | 3,000 | | | | | 0.000%, 12/15/31 | | No Opt. Call | | | 2,060,925 | |
| | 12,715 | | | | | 0.000%, 12/15/33 | | No Opt. Call | | | 7,870,763 | |
| | 610 | | | | | 0.000%, 12/15/34 | | No Opt. Call | | | 356,990 | |
| | 2,480 | | | | | 0.000%, 12/15/40 | | No Opt. Call | | | 984,018 | |
| | | | |
| | | | | | New Jersey Transportation Trust Fund Authority, Transportation System Bonds, Refunding Series 2006C: | | | | | | |
| | 10,000 | | | | | 0.000%, 12/15/33 - AGM Insured | | No Opt. Call | | | 6,326,270 | |
| | 20,000 | | | (d) | | 0.000%, 12/15/36 - AMBAC Insured, (UB) | | No Opt. Call | | | 10,385,460 | |
| | | | |
| | 19,175 | | | | | New Jersey Transportation Trust Fund Authority, Transportation System Bonds,
Series 2008A, 0.000%, 12/15/35 | | No Opt. Call | | | 10,537,048 | |
| | | | |
| | 15,000 | | | | | New Jersey Transportation Trust Fund Authority, Transportation System Bonds,
Series 2009A, 0.000%, 12/15/39 | | No Opt. Call | | | 6,336,974 | |
| | | | |
| | 5,000 | | | | | New Jersey Transportation Trust Fund Authority, Transportation System Bonds,
Series 2009C, 5.250%, 6/15/32 | | 12/24 at 100.00 | | | 5,029,906 | |
| | | | |
| | 6,305 | | | | | New Jersey Transportation Trust Fund Authority, Transportation System Bonds,
Series 2015AA, 5.000%, 6/15/45 | | 6/25 at 100.00 | | | 6,072,668 | |
| | | | |
| | 15,000 | | | (d) | | New Jersey Transportation Trust Fund Authority, Transportation System Bonds, Series 2018A, 5.000%, 12/15/34, (UB) | | 12/28 at 100.00 | | | 15,383,526 | |
| | | | |
| | 6,000 | | | | | New Jersey Transportation Trust Fund Authority, Transportation System Bonds,
Series 2019BB, 4.000%, 6/15/44 | | 12/28 at 100.00 | | | 5,138,839 | |
| | | | |
| | 2,345 | | | | | New Jersey Turnpike Authority, Revenue Bonds, Refunding Series 2015E,
5.000%, 1/01/45 | | 1/25 at 100.00 | | | 2,277,938 | |
| | | | |
| | 1,595 | | | | | Tobacco Settlement Financing Corporation, New Jersey, Tobacco Settlement Asset-Backed Bonds, Series 2018A, 5.000%, 6/01/46 | | 6/28 at 100.00 | | | 1,496,433 | |
| | | | |
| | 19,345 | | | | | Tobacco Settlement Financing Corporation, New Jersey, Tobacco Settlement Asset-Backed Bonds, Series 2018B, 5.000%, 6/01/46 | | 6/28 at 100.00 | | | 17,960,459 | |
| | | | | | Total New Jersey | | | | | 176,115,167 | |
| | | | |
| | | | | | New York - 17.2% (10.1% of Total Investments) | | | | | | |
| | | | |
| | | | | | Brooklyn Arena Local Development Corporation, New York, Payment in Lieu of Taxes Revenue Bonds, Barclays Center Project, Series 2009: | | | | | | |
| | 3,400 | | | | | 0.000%, 7/15/44 | | No Opt. Call | | | 1,016,088 | |
| | 12,020 | | | | | 0.000%, 7/15/46 | | No Opt. Call | | | 3,154,553 | |
| | | | |
| | 450 | | | | | Buffalo and Erie County Industrial Land Development Corporation, New York, Revenue Bonds, Catholic Health System, Inc. Project, Series 2015,
5.250%, 7/01/35 | | 7/25 at 100.00 | | | 372,762 | |
99
| | |
| NZF | | Nuveen Municipal Credit Income Fund (continued) |
| | Portfolio of Investments October 31, 2023 |
| | | | | | | | | | | | |
Principal Amount (000) | | | | | Description (a) | | Optional Call Provisions (b) | | Value | |
| | | | |
| | | | | | New York (continued) | | | | | | |
| | | | |
| | $ 200 | | | | | Build New York City Resource Corporation, New York, Revenue Bonds, Metropolitan College of New York, Series 2014, 5.000%, 11/01/39 | | 11/24 at 100.00 | | $ | 150,000 | |
| | | | |
| | 480 | | | | | Build NYC Resource Corporation, New York, Revenue Bonds, Albert Einstein College of Medicine, Inc, Series 2015, 5.500%, 9/01/45, 144A | | 9/25 at 100.00 | | | 431,073 | |
| | | | |
| | 15,270 | | | | | Dormitory Authority of the State of New York, Revenue Bonds, Vaughn College of Aeronautics & Technology, Series 2016A, 5.500%, 12/01/46, 144A | | 12/26 at 100.00 | | | 12,895,471 | |
| | | | |
| | 5,000 | | | | | Dormitory Authority of the State of New York, State Personal Income Tax Revenue Bonds, General Purpose, Bidding Group 5 Series 2021E, 4.000%, 3/15/48 | | 3/32 at 100.00 | | | 4,278,941 | |
| | | | |
| | 5,000 | | | | | Dormitory Authority of the State of New York, State Personal Income Tax Revenue Bonds, General Purpose, Series 2019D, 4.000%, 2/15/40 | | 2/30 at 100.00 | | | 4,474,623 | |
| | | | |
| | 7,250 | | | | | Dutchess County Local Development Corporation, New York, Revenue Bonds, Health Quest Systems, Inc. Project, Series 2016B, 5.000%, 7/01/46 | | 7/26 at 100.00 | | | 6,292,524 | |
| | | | |
| | 81,270 | | | | | Erie County Tobacco Asset Securitization Corporation, New York, Tobacco Settlement Asset-Backed Bonds, Series 2005C, 0.000%, 6/01/50, 144A | | 12/23 at 18.96 | | | 7,670,986 | |
| | | | |
| | 350 | | | | | Jefferson County Civic Facility Development Corporation, New York, Revenue Bonds, Samaritan Medical Center Project, Series 2017A, 4.000%, 11/01/42 | | 11/27 at 100.00 | | | 231,798 | |
| | | | |
| | 6,280 | | | | | Metropolitan Transportation Authority, New York, Transportation Revenue Bonds, Green Climate Bond Certified Series 2020C-1, 5.250%, 11/15/55 | | 5/30 at 100.00 | | | 6,177,480 | |
| | | | |
| | | | | | Metropolitan Transportation Authority, New York, Transportation Revenue Bonds, Refunding Green Series 2016B: | | | | | | |
| | 4,210 | | | | | 5.000%, 11/15/34 | | 11/26 at 100.00 | | | 4,246,263 | |
| | 3,320 | | | | | 5.000%, 11/15/37 | | 11/26 at 100.00 | | | 3,296,308 | |
| | | | |
| | 1,000 | | | | | Metropolitan Transportation Authority, New York, Transportation Revenue Bonds, Refunding Series 2015F, 5.000%, 11/15/35 | | 11/25 at 100.00 | | | 1,001,437 | |
| | | | |
| | 5,000 | | | | | Metropolitan Transportation Authority, New York, Transportation Revenue Bonds, Refunding Series 2017D, 5.000%, 11/15/32 | | 5/28 at 100.00 | | | 5,082,746 | |
| | | | |
| | 2,500 | | | | | Metropolitan Transportation Authority, New York, Transportation Revenue Bonds, Series 2013A, 5.000%, 11/15/38 | | 1/24 at 100.00 | | | 2,504,179 | |
| | | | |
| | 2,775 | | | (c) | | Metropolitan Transportation Authority, New York, Transportation Revenue Bonds, Series 2013D, 5.000%, 11/15/38, (Pre-refunded 1/08/24) | | 1/24 at 100.00 | | | 2,779,639 | |
| | | | |
| | 1,000 | | | | | Monroe County Industrial Development Corporation, New York, Revenue Bonds, St. John Fisher College, Series 2011, 6.000%, 6/01/34 | | 12/23 at 100.00 | | | 1,001,338 | |
| | | | |
| | 6,895 | | | | | New York City Municipal Water Finance Authority, New York, Water and Sewer System Second General Resolution Revenue Bonds, Fiscal 2019 Series FF-2, 4.000%, 6/15/41 | | 6/29 at 100.00 | | | 6,138,710 | |
| | | | |
| | 10,000 | | | (d) | | New York City Municipal Water Finance Authority, New York, Water and Sewer System Second General Resolution Revenue Bonds, Fiscal 2020 Series AA, 4.000%, 6/15/40 | | 12/29 at 100.00 | | | 8,990,356 | |
| | | | |
| | 9,750 | | | | | New York City Municipal Water Finance Authority, New York, Water and Sewer System Second General Resolution Revenue Bonds, Fiscal 2020 Series CC-1, 4.000%, 6/15/49 | | 12/29 at 100.00 | | | 8,261,405 | |
| | | | |
| | 2,035 | | | | | New York City Municipal Water Finance Authority, New York, Water and Sewer System Second General Resolution Revenue Bonds, Fiscal 2020 Series EE, 4.000%, 6/15/42 | | 6/30 at 100.00 | | | 1,785,366 | |
| | | | |
| | 5,000 | | | | | New York City Municipal Water Finance Authority, New York, Water and Sewer System Second General Resolution Revenue Bonds, Fiscal 2020 Series GG-1, 4.000%, 6/15/50 | | 6/30 at 100.00 | | | 4,221,465 | |
100
| | | | | | | | | | | | |
Principal Amount (000) | | | | | Description (a) | | Optional Call Provisions (b) | | Value | |
| | | | |
| | | | | | New York (continued) | | | | | | |
| | $ 8,530 | | | | | New York City Municipal Water Finance Authority, New York, Water and Sewer System Second General Resolution Revenue Bonds, Fiscal 2021 Series AA-1, 4.000%, 6/15/50 | | 12/30 at 100.00 | | $ | 7,201,820 | |
| | | | |
| | 10,000 | | | | | New York City Municipal Water Finance Authority, New York, Water and Sewer System Second General Resolution Revenue Bonds, Fiscal 2022 Series AA-1, 4.000%, 6/15/51 | | 6/31 at 100.00 | | | 8,402,909 | |
| | | | |
| | 4,440 | | | | | New York City Transitional Finance Authority, New York, Building Aid Revenue Bonds, Fiscal Series 2016S-1, 5.000%, 7/15/34 | | 1/26 at 100.00 | | | 4,509,413 | |
| | | | |
| | 5,000 | | | | | New York City Transitional Finance Authority, New York, Future Tax Secured Bonds, Subordinate Fiscal 2017 Series E-1, 5.000%, 2/01/43 | | 2/27 at 100.00 | | | 4,961,720 | |
| | | | |
| | 10,000 | | | | | New York City, New York, Educational Construction Fund Revenue Bonds,
Series 2021B, 5.000%, 4/01/52 | | 4/31 at 100.00 | | | 9,851,289 | |
| | | | |
| | 5,750 | | | | | New York City, New York, General Obligation Bonds, Fiscal 2018 Series E-1, 5.000%, 3/01/40 | | 3/28 at 100.00 | | | 5,813,575 | |
| | | | |
| | 2,860 | | | | | New York City, New York, General Obligation Bonds, Fiscal 2022 Series A-1, 5.000%, 8/01/47 | | 8/31 at 100.00 | | | 2,853,354 | |
| | | | |
| | 45,260 | | | | | New York Liberty Development Corporation, New York, Liberty Revenue Bonds, 3 World Trade Center Project, Class 1 Series 2014, 5.000%, 11/15/44, 144A | | 11/24 at 100.00 | | | 40,537,133 | |
| | | | |
| | 5,700 | | | | | New York Liberty Development Corporation, New York, Liberty Revenue Bonds, 3 World Trade Center Project, Class 2 Series 2014, 5.150%, 11/15/34, 144A | | 11/24 at 100.00 | | | 5,392,059 | |
| | | | |
| | 5,000 | | | | | New York State Thruway Authority, General Revenue Junior Indebtedness Obligations, Series 2016A, 5.000%, 1/01/46 | | 1/26 at 100.00 | | | 4,880,723 | |
| | | | |
| | 8,265 | | | | | New York State Urban Development Corporation, State Personal Income Tax Revenue Bonds, General Purpose, Series 2020C, 5.000%, 3/15/47 | | 9/30 at 100.00 | | | 8,271,032 | |
| | | | |
| | 12,100 | | | | | New York Transportation Development Corporation, New York, Facility Revenue Bonds, Thruway Service Areas Project, Series 2021, 4.000%, 4/30/53, (AMT) | | 10/31 at 100.00 | | | 9,107,237 | |
| | | | |
| | | | | | New York Transportation Development Corporation, New York, Special Facilities Bonds, LaGuardia Airport Terminal B Redevelopment Project, Series 2016A: | | | | | | |
| | 14,650 | | | | | 5.000%, 7/01/46, (AMT) | | 7/24 at 100.00 | | | 13,490,472 | |
| | 68,360 | | | | | 5.250%, 1/01/50, (AMT) | | 7/24 at 100.00 | | | 64,424,795 | |
| | | | |
| | | | | | New York Transportation Development Corporation, New York, Special Facility Revenue Bonds, American Airlines, Inc. John F Kennedy International Airport Project, Refunding Series 2016: | | | | | | |
| | 1,615 | | | | | 5.000%, 8/01/26, (AMT) | | 11/23 at 100.00 | | | 1,601,819 | |
| | 28,700 | | | | | 5.000%, 8/01/31, (AMT) | | 11/23 at 100.00 | | | 27,784,614 | |
| | | | |
| | 7,905 | | | | | New York Transportation Development Corporation, New York, Special Facility Revenue Bonds, American Airlines, Inc. John F Kennedy International Airport Project, Series 2020, 5.250%, 8/01/31, (AMT) | | 8/30 at 100.00 | | | 7,897,434 | |
| | | | |
| | 5,350 | | | | | New York Transportation Development Corporation, Special Facility Revenue Bonds, Delta Air Lines, Inc. - LaGuardia Airport Terminals C&D Redevelopment Project, Series 2018, 5.000%, 1/01/31, (AMT) | | 1/28 at 100.00 | | | 5,215,936 | |
| | | | |
| | | | | | New York Transportation Development Corporation, Special Facility Revenue Bonds, Delta Air Lines, Inc. - LaGuardia Airport Terminals C&D Redevelopment Project, Series 2020: | | | | | | |
| | 1,000 | | | | | 4.000%, 10/01/30, (AMT) | | No Opt. Call | | | 920,088 | |
| | 2,100 | | | | | 5.000%, 10/01/40, (AMT) | | 10/30 at 100.00 | | | 1,914,033 | |
| | | | |
| | 13,750 | | | | | New York Transportation Development Corporation, Special Facility Revenue Bonds, Delta Air Lines, Inc. - LaGuardia Airport Terminals C&D Redevelopment Project, Series 2023, 5.625%, 4/01/40, (AMT) | | 4/31 at 100.00 | | | 13,698,223 | |
101
| | |
| NZF | | Nuveen Municipal Credit Income Fund (continued) |
| | Portfolio of Investments October 31, 2023 |
| | | | | | | | | | | | |
Principal Amount (000) | | | | | Description (a) | | Optional Call Provisions (b) | | Value | |
| | | | |
| | | | | | New York (continued) | | | | | | |
| | | | |
| | $ 10,325 | | | | | Port Authority of New York and New Jersey, Consolidated Revenue Bonds, One Hundred Ninety-Eighth Series 2016, 5.250%, 11/15/56 | | 11/26 at 100.00 | | $ | 10,327,252 | |
| | | | |
| | 14,500 | | | | | Suffolk Tobacco Asset Securitization Corporation, New York, Tobacco Settlement Asset-Backed Bonds, Series 2021B-2, 0.000%, 6/01/66 | | 6/31 at 27.72 | | | 1,229,381 | |
| | | | |
| | 2,320 | | | | | Triborough Bridge and Tunnel Authority, New York, General Purpose Revenue Bonds, Series 2015B, 5.000%, 11/15/45 | | 11/25 at 100.00 | | | 2,302,558 | |
| | | | |
| | 30,000 | | | (d) | | Triborough Bridge and Tunnel Authority, New York, Sales Tax Revenue Bonds, MTA Bridges & Tunnels, TBTA Capital Lockbox-City Sales Tax Series 2023A, 4.500%, 5/15/63, (UB) | | 5/33 at 100.00 | | | 26,485,125 | |
| | | | |
| | 2,150 | | | | | TSASC Inc., New York, Tobacco Asset-Backed Bonds, Series 2006,
5.000%, 6/01/48 | | 6/27 at 100.00 | | | 1,807,498 | |
| | | | |
| | 9,986 | | | | | Westchester County Health Care Corporation, New York, Senior Lien Revenue Bonds, Series 2014A, 5.000%, 11/01/44 | | 5/24 at 101.00 | | | 8,662,898 | |
| | | | |
| | 3,640 | | | | | Westchester County Local Development Corporation, New York, Revenue Bonds, Westchester Medical Center Obligated Group Project, Refunding Series 2016, 5.000%, 11/01/46 | | 11/25 at 100.00 | | | 2,933,316 | |
| | | | | | | Total New York | | | | | 398,933,217 | |
| | | | |
| | | | | | North Carolina - 0.4% (0.2% of Total Investments) | | | | | | |
| | | | |
| | 4,500 | | | | | North Carolina Medical Care Commission, Health Care Facilities Revenue Bonds, Novant Health Obligated Group, Series 2019A, 4.000%, 11/01/52 | | 11/29 at 100.00 | | | 3,761,055 | |
| | | | |
| | 5,000 | | | | | North Carolina Turnpike Authority, Triangle Expressway System Revenue Bonds, Senior Lien Series 2019, 5.000%, 1/01/49 | | 1/30 at 100.00 | | | 4,786,194 | |
| | | | | | | Total North Carolina | | | | | 8,547,249 | |
| | | | |
| | | | | | North Dakota - 1.9% (1.1% of Total Investments) | | | | | | |
| | | | |
| | | | | | Grand Forks, North Dakota, Health Care System Revenue Bonds, Altru Health System Obligated Group, Series 2021: | | | | | | |
| | 2,000 | | | | | 3.000%, 12/01/39 - AGM Insured | | 12/31 at 100.00 | | | 1,459,028 | |
| | 1,075 | | | | | 4.000%, 12/01/46 | | 12/31 at 100.00 | | | 813,530 | |
| | 1,750 | | | | | 3.000%, 12/01/51 - AGM Insured | | 12/31 at 100.00 | | | 1,069,978 | |
| | | | |
| | | | | | Ward County Health Care, North Dakota, Revenue Bonds, Trinity Obligated Group, Series 2017C: | | | | | | |
| | 10,315 | | | | | 5.000%, 6/01/43 | | 6/28 at 100.00 | | | 7,756,219 | |
| | 10,950 | | | | | 5.000%, 6/01/48 | | 6/28 at 100.00 | | | 7,783,359 | |
| | 37,840 | | | | | 5.000%, 6/01/53 | | 6/28 at 100.00 | | | 26,081,996 | |
| | | | | | | Total North Dakota | | | | | 44,964,110 | |
| | | | |
| | | | | | Ohio - 9.8% (5.7% of Total Investments) | | | | | | |
| | | | |
| | 1,430 | | | | | American Municipal Power Inc., Ohio, Combined Hydroelectric Projects Revenue Bonds, Green Series 2016A, 5.000%, 2/15/46 | | 2/26 at 100.00 | | | 1,374,841 | |
| | | | |
| | 2,420 | | | | | Ashland County-West Holmes Joint Vocational School District, Ohio, General Obligation Bonds, Limited Tax School Facilities Construction & Improvement Series 2022, 4.000%, 12/01/46 | | 12/29 at 100.00 | | | 2,031,919 | |
| | | | |
| | 28,980 | | | | | Buckeye Tobacco Settlement Financing Authority, Ohio, Tobacco Settlement Asset-Backed Revenue Bonds, Refunding Senior Lien Capital Appreciation
Series 2020B-3 Class 2, 0.000%, 6/01/57 | | 6/30 at 22.36 | | | 2,445,228 | |
| | | | |
| | 9,515 | | | | | Buckeye Tobacco Settlement Financing Authority, Ohio, Tobacco Settlement Asset-Backed Revenue Bonds, Refunding Senior Lien Series 2020B-2 Class 2, 5.000%, 6/01/55 | | 6/30 at 100.00 | | | 7,794,638 | |
| | | | |
| | | | | | Chillicothe, Ohio, Hospital Facilities Revenue Bonds, Adena Health System Obligated Group Project, Refunding & Improvement Series 2017: | | | | | | |
| | 3,250 | | | | | 5.000%, 12/01/37 | | 12/27 at 100.00 | | | 3,176,404 | |
102
| | | | | | | | | | | | |
Principal Amount (000) | | | | | Description (a) | | Optional Call Provisions (b) | | Value | |
| | | | |
| | | | | | Ohio (continued) | | | | | | |
| | $ 7,200 | | | | | 5.000%, 12/01/47 | | 12/27 at 100.00 | | $ | 6,677,816 | |
| | | | |
| | 2,500 | | | | | Clark-Shawnee Local School District, Clark County, Ohio, General Obligation Bonds, School Facilities Construction & Improvement Series 2017,
5.000%, 11/01/54 | | 11/27 at 100.00 | | | 2,516,829 | |
| | | | |
| | 6,500 | | | | | Cleveland Clinic Health System Obligated Group, Ohio, Martin County Health Facilities Authority, Hospital Revenue Bonds, Series 2019B, 4.000%, 1/01/46 | | 1/29 at 100.00 | | | 5,427,733 | |
| | | | |
| | | | | | Cleveland, Ohio, Public Power System Revenue Bonds, Series 2008B-2: | | | | | | |
| | 2,000 | | | | | 0.000%, 11/15/28 - NPFG Insured | | No Opt. Call | | | 1,596,096 | |
| | 6,895 | | | | | 0.000%, 11/15/32 - NPFG Insured | | No Opt. Call | | | 4,479,503 | |
| | 2,155 | | | | | 0.000%, 11/15/34 - NPFG Insured | | No Opt. Call | | | 1,253,644 | |
| | | | |
| | | | | | Columbus City School District: | | | | | | |
| | 4,145 | | | | | 0.000%, 12/01/27 | | No Opt. Call | | | 3,515,199 | |
| | 165 | | | | | 0.000%, 12/01/27 | | No Opt. Call | | | 140,265 | |
| | 5,615 | | | | | 0.000%, 12/01/28, (WI/DD) | | No Opt. Call | | | 4,561,726 | |
| | 220 | | | | | 0.000%, 12/01/28 | | No Opt. Call | | | 179,982 | |
| | | | |
| | 770 | | | | | Columbus-Franklin County Finance Authority, Ohio, Tax Increment Financing Revenue Bonds, Easton Project, Series 2020, 5.000%, 6/01/28, 144A | | No Opt. Call | | | 749,728 | |
| | | | |
| | | | | | Cuyahoga County, Ohio, Hospital Revenue Bonds, MetroHealth System, Series 2017: | | | | | | |
| | 19,495 | | | | | 5.500%, 2/15/52 | | 2/27 at 100.00 | | | 18,505,120 | |
| | 20,650 | | | | | 5.500%, 2/15/57 | | 2/27 at 100.00 | | | 19,389,035 | |
| | | | |
| | 2,400 | | | | | Fairfield County, Ohio, Hospital Facilities Revenue Bonds, Fairfield Medical Center Project, Series 2013, 5.000%, 6/15/43 | | 12/23 at 100.00 | | | 1,885,002 | |
| | | | |
| | | | | | Franklin County Convention Facilities Authority, Ohio, Hotel Project Revenue Bonds, Greater Columbus Convention Center Hotel Expansion Project, Series 2019: | | | | | | |
| | 1,010 | | | | | 5.000%, 12/01/34 | | 12/29 at 100.00 | | | 944,329 | |
| | 1,000 | | | | | 5.000%, 12/01/44 | | 12/29 at 100.00 | | | 842,221 | |
| | 4,780 | | | | | 5.000%, 12/01/51 | | 12/29 at 100.00 | | | 3,897,530 | |
| | | | |
| | 10,000 | | | (d) | | Franklin County, Ohio, Hospital Facilities Revenue Bonds, OhioHealth Corporation, Series 2015, 5.000%, 5/15/40, (UB) | | 5/25 at 100.00 | | | 9,793,123 | |
| | | | |
| | 1,730 | | | | | Franklin County, Ohio, Revenue Bonds, Trinity Health Credit Group, Series 2017OH, 5.000%, 12/01/46 | | 6/27 at 100.00 | | | 1,660,493 | |
| | | | |
| | 2,500 | | | | | Franklin County, Ohio, Sales Tax Revenue Bonds, Various Purpose Series 2018, 5.000%, 6/01/43 | | 6/28 at 100.00 | | | 2,530,507 | |
| | | | |
| | 8,020 | | | | | Hamilton County, Ohio, Hospital Facilities Revenue Bonds, TriHealth, Inc. Obligated Group Project, Series 2017A, 5.000%, 8/15/47 | | 8/27 at 100.00 | | | 7,674,130 | |
| | | | |
| | 5,565 | | | | | Hamilton County, Ohio, Sales Tax Bonds, Subordinate Series 2000B,
0.000%, 12/01/28 - AGM Insured | | No Opt. Call | | | 4,474,114 | |
| | | | |
| | 1,000 | | | | | Mahoning County, Ohio, Sewer System Revenue Bonds, Refunding and Improvement Series 2022, 5.000%, 12/01/42 | | 12/31 at 100.00 | | | 1,001,604 | |
| | | | |
| | 2,875 | | | | | Miami University of Ohio, General Receipts Revenue Bonds, Refunding
Series 2020A, 4.000%, 9/01/45 | | 9/30 at 100.00 | | | 2,462,693 | |
| | | | |
| | 4,500 | | | | | Middletown City School District, Butler County, Ohio, General Obligation Bonds, Refunding Series 2007, 5.250%, 12/01/31 - AGM Insured | | No Opt. Call | | | 4,841,013 | |
| | | | |
| | 6,105 | | | | | Muskingum County, Ohio, Hospital Facilities Revenue Bonds, Genesis HealthCare System Obligated Group Project, Series 2013, 5.000%, 2/15/44 | | 12/23 at 100.00 | | | 5,086,438 | |
103
| | |
| NZF | | Nuveen Municipal Credit Income Fund (continued) |
| | Portfolio of Investments October 31, 2023 |
| | | | | | | | | | | | |
Principal Amount (000) | | | | | Description (a) | | Optional Call Provisions (b) | | Value | |
| | | | |
| | | | | | Ohio (continued) | | | | | | |
| | $ 1,600 | | | | | Northeast Ohio Regional Sewer District, Wastewater Improvement Revenue Bonds, Refunding & Improvement Series 2017, 4.000%, 11/15/43 | | 5/28 at 100.00 | | $ | 1,362,061 | |
| | | | |
| | 2,845 | | | | | Ohio Air Quality Development Authority, Ohio, Pollution Control Revenue Bonds, FirstEnergy Generation Corporation Project, Refunding Series 2009D, 3.375%, 8/01/29, (Mandatory Put 9/15/21) | | No Opt. Call | | | 2,506,393 | |
| | | | |
| | | | | | Ohio Higher Educational Facility Commission, Higher Educational Facility Revenue Bonds, John Carroll University 2022 Project, Series 2022: | | | | | | |
| | 1,250 | | | | | 4.000%, 10/01/42 | | 10/31 at 100.00 | | | 1,008,100 | |
| | 1,250 | | | | | 4.000%, 10/01/47 | | 10/31 at 100.00 | | | 954,700 | |
| | | | |
| | 950 | | | | | Ohio Municipal Electric Generation Agency, Beneficial Interest Certificates, Belleville Hydroelectric Project - Joint Venture 5, Series 2001, 0.000%, 2/15/29 - NPFG Insured | | No Opt. Call | | | 752,549 | |
| | | | |
| | 7,045 | | | | | Ohio State, Hospital Revenue Bonds, University Hospitals Health System, Inc., Series 2021A, 4.000%, 1/15/46 | | 7/31 at 100.00 | | | 5,665,789 | |
| | | | |
| | | | | | Ohio State, Turnpike Revenue Bonds, Ohio Turnpike and Infrastructutre Commission Infrastructure Projects, Junior Lien, Capital Appreciation Series 2013A-2: | | | | | | |
| | 5,000 | | | | | 0.000%, 2/15/37 | | No Opt. Call | | | 2,634,277 | |
| | 11,260 | | | | | 0.000%, 2/15/38 | | No Opt. Call | | | 5,493,018 | |
| | 5,000 | | | | | 0.000%, 2/15/40 | | No Opt. Call | | | 2,145,498 | |
| | | | |
| | 27,880 | | | | | Ohio Water Development Authority, Pollution Control Revenue Refunding Bonds, FirstEnergy Nuclear Generating Corporation Project, Series 2009A, 4.750%, 6/01/33, (Mandatory Put 6/01/22) | | No Opt. Call | | | 25,503,247 | |
| | | | |
| | 22,820 | | | | | Ohio Water Development Authority, Pollution Control Revenue Refunding Bonds, FirstEnergy Nuclear Generating Corporation Project, Series 2010B, 4.750%, 6/01/33, (Mandatory Put 6/01/22) | | No Opt. Call | | | 20,874,609 | |
| | | | |
| | 1,500 | | | | | Ohio Water Development Authority, Water Pollution Control Loan Fund Revenue Bonds, Kestrel Verifiers, Green Series 2021A, 5.000%, 12/01/46 | | 12/31 at 100.00 | | | 1,534,614 | |
| | | | |
| | 4,250 | | | | | Pickerington Local School District, Fairfield and Franklin Counties, Ohio, General Obligation Bonds, School Facilities Construction & Improvement, Series 2023, 5.250%, 12/01/59 | | 12/32 at 100.00 | | | 4,332,382 | |
| | | | |
| | 1,845 | | | | | Pinnacle Community Infrastructure Financing Authority, Grove City, Ohio, Community Facilities Bonds, Series 2015A, 4.250%, 12/01/36 - AGM Insured | | 12/25 at 100.00 | | | 1,801,079 | |
| | | | |
| | 505 | | | | | Port of Greater Cincinnati Development Authority, Ohio, Public Improvement TOT Revenue Bonds, Series 2021, 4.250%, 12/01/50, 144A | | 12/28 at 100.00 | | | 369,724 | |
| | | | |
| | 395 | | | | | Port of Greater Cincinnati Development Authority, Ohio, Special Obligation Development TIF Revenue Bonds, RBM Development - Phase 2B Project, Series 2018A, 6.000%, 12/01/50 | | 12/28 at 100.00 | | | 351,658 | |
| | | | |
| | 990 | | | | | Port of Greater Cincinnati Development Authority, Ohio, Special Obligation Tax Increment Financing Revenue Bonds, Cooperative Township Public Parking Project, Gallery at Kenwood, Senior Lien Series 2019A, 5.000%, 11/01/51 | | 11/30 at 100.00 | | | 738,702 | |
| | | | |
| | 4,000 | | | | | Southwest Local School District, Hamilton and Butler Counties, Ohio, General Obligation Bonds, School Improvement Series 2018A, 4.000%, 1/15/55 | | 1/28 at 100.00 | | | 3,162,408 | |
| | | | |
| | 1,500 | | | | | Springboro Community City School District, Warren County, Ohio, General Obligation Bonds, Refunding Series 2007, 5.250%, 12/01/32 | | No Opt. Call | | | 1,627,074 | |
| | | | |
| | 10,000 | | | | | Toledo, Ohio, Water System Revenue Bonds, Refunding & Improvement Series 2016, 5.000%, 11/15/41 | | 11/26 at 100.00 | | | 10,134,201 | |
104
| | | | | | | | | | | | |
Principal Amount (000) | | | | | Description (a) | | Optional Call Provisions (b) | | Value | |
| | | | |
| | | | | | Ohio (continued) | | | | | | |
| | $ 1,000 | | | | | Tuscarawas County Economic Development and Finance Alliance, Ohio, Higher Education Facilities Revenue Bonds, Ashland University, Refunding & Improvement Series 2015, 6.000%, 3/01/45 | | 3/25 at 100.00 | | $ | 911,543 | |
| | | | |
| | 1,100 | | | | | Wadsworth City School District, Medina County, Ohio, General Obligation Bonds, School Improvement Series 2021, 4.000%, 12/01/51 | | 12/26 at 100.00 | | | 888,819 | |
| | | | | | Total Ohio | | | | | 227,661,348 | |
| | | | |
| | | | | | Oklahoma - 2.2% (1.3% of Total Investments) | | | | | | |
| | | | |
| | | | | | Oklahoma Development Finance Authority, Health System Revenue Bonds, OU Medicine Project, Series 2018B: | | | | | | |
| | 12,690 | | | | | 5.250%, 8/15/43 | | 8/28 at 100.00 | | | 11,074,275 | |
| | 9,715 | | | | | 5.250%, 8/15/48 | | 8/28 at 100.00 | | | 8,186,554 | |
| | 18,235 | | | | | 5.500%, 8/15/52 | | 8/28 at 100.00 | | | 15,810,489 | |
| | 16,570 | | | | | 5.500%, 8/15/57 | | 8/28 at 100.00 | | | 14,170,606 | |
| | | | |
| | 1,550 | | | | | Oklahoma Development Finance Authority, Health System Revenue Bonds, OU Medicine Project, Taxable Series 2022, 5.500%, 8/15/41 | | 8/32 at 100.00 | | | 1,363,011 | |
| | | | |
| | 1,500 | | | | | Tulsa Municipal Airport Trust, Oklahoma, Revenue Bonds, American Airlines Inc., Refunding Series 2015, 5.000%, 6/01/35, (AMT), (Mandatory Put 6/01/25) | | 6/25 at 100.00 | | | 1,481,607 | |
| | | | | | | Total Oklahoma | | | | | 52,086,542 | |
| | | | |
| | | | | | Oregon - 0.4% (0.2% of Total Investments) | | | | | | |
| | | | |
| | 7,330 | | | | | Port of Portland, Oregon, International Airport Revenue Bonds, Series 2020-27A, 5.000%, 7/01/45, (AMT) | | 7/30 at 100.00 | | | 7,042,984 | |
| | | | |
| | 1,150 | | | | | Warm Springs Reservation Confederated Tribes, Oregon, Hydroelectric Revenue Bonds, Tribal Economic Development Bond Pelton Round Butte Project, Taxable Refunding Green Series 2019B, 5.000%, 11/01/36, 144A | | 5/29 at 100.00 | | | 1,187,862 | |
| | | | | | | Total Oregon | | | | | 8,230,846 | |
| | | | |
| | | | | | Pennsylvania - 6.4% (3.8% of Total Investments) | | | | | | |
| | | | |
| | 380 | | | | | Allegheny Country Industrial Development Authority, Pennsylvania, Environmental Improvement Revenue Bonds, United States Steel Corporation Project, Series 2012, 5.750%, 8/01/42, (AMT) | | 12/23 at 100.00 | | | 368,522 | |
| | | | |
| | 7,355 | | | | | Allentown Neighborhood Improvement Zone Development Authority, Pennsylvania, Tax Revenue Bonds, City Center Refunding Project, Series 2017, 5.000%, 5/01/42, 144A | | 5/27 at 100.00 | | | 6,739,660 | |
| | | | |
| | 11,700 | | | | | Beaver County Industrial Development Authority, Pennsylvania, Pollution Control Revenue Bonds, FirstEnergy Generation Project, Refunding Series 2006A, 4.375%, 1/01/35, (Mandatory Put 7/01/33) | | No Opt. Call | | | 10,863,595 | |
| | | | |
| | 2,030 | | | | | Beaver County Industrial Development Authority, Pennsylvania, Pollution Control Revenue Refunding Bonds, FirstEnergy Generation Project, Series 2008B, 3.750%, 10/01/47 | | 4/31 at 100.00 | | | 1,356,586 | |
| | | | |
| | | | | | Berks County Industrial Development Authority, Pennsylvania, Health System Revenue Bonds, Tower Health Project, Series 2017: | | | | | | |
| | 16,975 | | | | | 5.000%, 11/01/47 | | 11/27 at 100.00 | | | 9,263,482 | |
| | 6,695 | | | | | 5.000%, 11/01/50 | | 11/27 at 100.00 | | | 3,652,413 | |
| | | | |
| | | | | | Commonwealth Financing Authority, Pennsylvania, State Appropriation Lease Bonds, Master Settlement, Series 2018: | | | | | | |
| | 4,000 | | | (d) | | 5.000%, 6/01/32, (UB) | | 6/28 at 100.00 | | | 4,095,276 | |
| | 2,260 | | | (d) | | 5.000%, 6/01/33, (UB) | | 6/28 at 100.00 | | | 2,312,219 | |
| | 2,405 | | | (d) | | 5.000%, 6/01/34 | | 6/28 at 100.00 | | | 2,457,485 | |
| | 1,275 | | | (d) | | 5.000%, 6/01/34, (UB) | | 6/28 at 100.00 | | | 1,302,824 | |
105
| | |
| NZF | | Nuveen Municipal Credit Income Fund (continued) |
| | Portfolio of Investments October 31, 2023 |
| | | | | | | | | | | | |
Principal Amount (000) | | | | | Description (a) | | Optional Call Provisions (b) | | Value | |
| | | | |
| | | | | | Pennsylvania (continued) | | | | | | |
| | | | | | Cumberland County Municipal Authority, Pennsylvania, Revenue Bonds, Diakon Lutheran Social Ministries Project, Series 2015: | | | | | | |
| $ | 1,030 | | | | | 5.000%, 1/01/38 | | 1/25 at 100.00 | | $ | 969,077 | |
| | 845 | | | (c) | | 5.000%, 1/01/38, (Pre-refunded 1/01/25) | | 1/25 at 100.00 | | | 854,265 | |
| | 205 | | | (c) | | 5.000%, 1/01/38, (Pre-refunded 1/01/25) | | 1/25 at 100.00 | | | 207,248 | |
| | | | |
| | 15,000 | | | | | Geisinger Authority, Montour County, Pennsylvania, Health System Revenue Bonds, Geisinger Health System, Series 2017A-1,
4.000%, 2/15/47 | | 2/27 at 100.00 | | | 12,185,329 | |
| | | | |
| | | | | | Geisinger Authority, Montour County, Pennsylvania, Health System Revenue Bonds, Geisinger Health System, Series 2020A: | | | | | | |
| | 8,710 | | | | | 4.000%, 4/01/39 | | 4/30 at 100.00 | | | 7,675,945 | |
| | 5,085 | | | | | 4.000%, 4/01/50 | | 4/30 at 100.00 | | | 4,031,398 | |
| | 5,000 | | | | | 5.000%, 4/01/50 | | 4/30 at 100.00 | | | 4,618,072 | |
| | | | |
| | 15,220 | | | (d) | | Lehigh County General Purpose Authority, Pennsylvania, Hospital Revenue Bonds, Lehigh Valley Health Network, Series 2019A,
5.000%, 7/01/44, (UB) | | 7/29 at 100.00 | | | 14,507,398 | |
| | | | |
| | 17,000 | | | | | Montgomery County Higher Education and Health Authority, Pennsylvania, Revenue Bonds, Thomas Jefferson University,
Series 2022B, 5.000%, 5/01/52 | | 5/32 at 100.00 | | | 15,867,657 | |
| | | | |
| | | | | | Montgomery County Industrial Development Authority, Pennsylvania, Health System Revenue Bonds, Albert Einstein Healthcare Network Issue, | | | | | | |
| | | | | | Series 2015A: | | | | | | |
| | 5,440 | | | (c) | | 5.250%, 1/15/36, (Pre-refunded 1/15/25) | | 1/25 at 100.00 | | | 5,523,773 | |
| | 3,535 | | | (c) | | 5.250%, 1/15/45, (Pre-refunded 1/15/25) | | 1/25 at 100.00 | | | 3,589,437 | |
| | | | |
| | 2,206 | | | | | Northampton County Industrial Development Authority, Pennsylvania, Recovery Revenue Bonds, Northampton Generating Project, Senior Lien Series 2013A0 & AE2, 0.900%, 12/31/23 | | 12/23 at 100.00 | | | 397,030 | |
| | | | |
| | 1,131 | | | | | Northampton County Industrial Development Authority, Pennsylvania, Recovery Revenue Bonds, Northampton Generating Project, Senior Lien Taxable Series 2013B, 0.900%, 12/31/23, (cash 5.000%, PIK 5.000%) | | No Opt. Call | | | 203,681 | |
| | | | |
| | 4,135 | | | | | Pennsylvania Economic Development Financing Authority, Exempt Facilities Revenue Bonds, National Gypsum Company, Refunding Series 2014, 5.500%, 11/01/44, (AMT) | | 11/24 at 100.00 | | | 3,918,306 | |
| | | | |
| | 24,890 | | | (d) | | Pennsylvania Economic Development Financing Authority, Pennsylvania, Private Activity Revenue Bonds, The PennDOT Major Bridges Package One Project, Series 2022, 5.000%, 12/31/57 - AGM Insured, (AMT), (UB) | | 12/32 at 100.00 | | | 23,942,960 | |
| | | | |
| | 3,000 | | | | | Pennsylvania Turnpike Commission, Turnpike Revenue Bonds, Capital Appreciation Series 2009E, 6.000%, 12/01/30 | | 12/27 at 100.00 | | | 3,236,511 | |
| | | | |
| | 4,000 | | | | | Philadelphia Authority for Industrial Development, Pennsylvania, Revenue Bonds, University of the Sciences in Philadelphia,
Series 2017, 5.000%, 11/01/47 | | 5/27 at 100.00 | | | 3,672,315 | |
| | | | |
| | 1,100 | | | | | The Redevelopment Authority of the City of Scranton, Lackawanna county, Pennsylvania, Guaranteed Lease Revenue Bonds, Series 2016A,
5.000%, 11/15/28 | | 5/24 at 100.00 | | | 1,073,238 | |
| | | | | | Total Pennsylvania | | | | | 148,885,702 | |
| | | | |
| | | | | | Puerto Rico - 7.0% (4.1% of Total Investments) | | | | | | |
| | | | |
| | 75,000 | | | | | Children’s Trust Fund, Puerto Rico, Tobacco Settlement Asset-Backed Bonds, Series 2008A, 0.000%, 5/15/57 | | 12/23 at 8.18 | | | 4,410,653 | |
| | | | |
| | 1,805 | | | | | Cofina Class 2 Trust Tax-Exempt Class 2054, Puerto Rico. Unit Exchanged From Cusip 74529JAP0, 0.000%, 8/01/54 | | No Opt. Call | | | 326,196 | |
| | | | |
| | 1,595 | | | | | Puerto Rico Aqueduct and Sewerage Authority, Revenue Bonds, Refunding Senior Lien Forward Delivery Series 2022A,
5.000%, 7/01/37, 144A | | 7/32 at 100.00 | | | 1,504,189 | |
106
| | | | | | | | | | | | |
Principal Amount (000) | | | | | Description (a) | | Optional Call Provisions (b) | | Value | |
| | | | |
| | | | | | Puerto Rico (continued) | | | | | | |
| | | | |
| | | | | | Puerto Rico Aqueduct and Sewerage Authority, Revenue Bonds, Refunding Senior Lien Series 2020A: | | | | | | |
| $ | 16,000 | | | | | 5.000%, 7/01/35, 144A | | 7/30 at 100.00 | | $ | 15,343,320 | |
| | 5,255 | | | | | 5.000%, 7/01/47, 144A | | 7/30 at 100.00 | | | 4,673,886 | |
| | | | |
| | | | | | Puerto Rico Aqueduct and Sewerage Authority, Revenue Bonds, Refunding Senior Lien Series 2021B: | | | | | | |
| | 8,180 | | | | | 5.000%, 7/01/33, 144A | | 7/31 at 100.00 | | | 8,013,831 | |
| | 2,745 | | | | | 5.000%, 7/01/37, 144A | | 7/31 at 100.00 | | | 2,588,739 | |
| | 5,785 | | | | | 4.000%, 7/01/42, 144A | | 7/31 at 100.00 | | | 4,635,116 | |
| | | | |
| | 1,142 | | | | | Puerto Rico Highway and Transportation Authority, Restructured Toll Revenue Bonds, Series 2022A, 5.000%, 7/01/62 | | 7/32 at 100.00 | | | 1,127,901 | |
| | | | |
| | 60 | | | | | Puerto Rico Highway and Transportation Authority, Restructured Toll Revenue Bonds, Series 2022B, 0.000%, 7/01/32 | | No Opt. Call | | | 38,263 | |
| | | | |
| | 102 | | | | | Puerto Rico Highway and Transportation Authority, Restructured Toll Revenue Bonds, Series 2022C, 5.000%, 7/01/53 | | 1/33 at 100.00 | | | 65,837 | |
| | | | |
| | | | | | Puerto Rico Sales Tax Financing Corporation, Sales Tax Revenue Bonds, Restructured 2018A-1: | | | | | | |
| | 6,055 | | | | | 4.500%, 7/01/34 | | 7/25 at 100.00 | | | 5,782,615 | |
| | 46,230 | | | | | 0.000%, 7/01/51 | | 7/28 at 30.01 | | | 8,356,623 | |
| | 2,260 | | | | | 4.750%, 7/01/53 | | 7/28 at 100.00 | | | 1,914,493 | |
| | 108,619 | | | | | 5.000%, 7/01/58 | | 7/28 at 100.00 | | | 95,096,792 | |
| | | | |
| | 1,780 | | | | | Puerto Rico Sales Tax Financing Corporation, Sales Tax Revenue Bonds, Restructured Cofina Project Series 2019A-2A, 4.550%, 7/01/40 | | 7/28 at 100.00 | | | 1,584,406 | |
| | | | |
| | 493 | | | | | Puerto Rico Sales Tax Financing Corporation, Sales Tax Revenue Bonds, Taxable Restructured Cofina Project Series 2019A-2, 4.536%, 7/01/53 | | 7/28 at 100.00 | | | 402,842 | |
| | | | |
| | 587 | | | | | Puerto Rico, General Obligation Bonds, Clawback Highway Transportation Authority Claims Taxable Series 2022, 0.000%, 11/01/51 | | No Opt. Call | | | 297,997 | |
| | | | |
| | 8,008 | | | | | Puerto Rico, General Obligation Bonds, Restructured Series 2022A-1,
4.000%, 7/01/41 | | 7/31 at 103.00 | | | 6,197,047 | |
| | | | |
| | 1,000 | | | | | Puerto Rico, Highway and Transportation Authority Highway Revenue Bonds, Series 2022, 5.250%, 7/01/36 | | 11/23 at 100.00 | | | 1,004,272 | |
| | | | | | Total Puerto Rico | | | | | 163,365,018 | |
| | | | |
| | | | | | Rhode Island - 0.1% (0.1% of Total Investments) | | | | | | |
| | | | |
| | 21,570 | | | | | Rhode Island Tobacco Settlement Financing Corporation, Tobacco Settlement Asset-Backed Bonds, Series 2007A, 0.000%, 6/01/52 | | 11/23 at 18.50 | | | 3,027,209 | |
| | | | | | Total Rhode Island | | | | | 3,027,209 | |
| | | | |
| | | | | | South Carolina - 3.6% (2.1% of Total Investments) | | | | | | |
| | | | |
| | 21,570 | | | | | Piedmont Municipal Power Agency, South Carolina, Electric Revenue Bonds, Series 2004A-2, 0.000%, 1/01/30 - AMBAC Insured | | No Opt. Call | | | 16,047,526 | |
| | | | |
| | 7,530 | | | | | South Carolina Housing Finance and Development Authority, Mortgage Revenue Bonds, Series 2023B, 4.850%, 7/01/48 | | 7/32 at 100.00 | | | 7,083,705 | |
| | | | |
| | | | | | South Carolina Jobs-Economic Development Authority, Hospital Revenue Bonds, Prisma Health Obligated Group, Series 2018A: | | | | | | |
| | 9,985 | | | (d) | | 5.000%, 5/01/43, (UB) | | 5/28 at 100.00 | | | 9,667,961 | |
| | 8,560 | | | (d) | | 5.000%, 5/01/48, (UB) | | 5/28 at 100.00 | | | 8,116,462 | |
| | | | |
| | 4,915 | | | (d) | | South Carolina Public Service Authority, Santee Cooper Revenue Obligations, Refunding & Improvement Series 2015A, 5.000%, 12/01/50, (UB) | | 6/25 at 100.00 | | | 4,613,901 | |
| | 4,915 | | | (d) | | South Carolina Public Service Authority, Santee Cooper Revenue Obligations, Refunding & Improvement Series 2015A, 5.000%, 12/01/50 | | 6/25 at 100.00 | | | 4,613,900 | |
107
| | |
| NZF | | Nuveen Municipal Credit Income Fund (continued) |
| | Portfolio of Investments October 31, 2023 |
| | | | | | | | | | | | |
Principal Amount (000) | | | | | Description (a) | | Optional Call Provisions (b) | | Value | |
| | | | |
| | | | | | South Carolina (continued) | | | | | | |
| $ | 7,500 | | | (d) | | South Carolina Public Service Authority, Santee Cooper Revenue Obligations, Refunding Series 2016B, 5.000%, 12/01/46, (UB) | | 12/26 at 100.00 | | $ | 7,152,755 | |
| | | | |
| | | | | | South Carolina Public Service Authority, Santee Cooper Revenue Obligations, Refunding Series 2022A: | | | | | | |
| | 5,970 | | | | | 4.000%, 12/01/43 | | 6/32 at 100.00 | | | 4,926,427 | |
| | 10,295 | | | | | 5.000%, 12/01/55 | | 6/32 at 100.00 | | | 9,564,503 | |
| | | | |
| | 9,155 | | | | | South Carolina Public Service Authority, Santee Cooper Revenue Obligations, Series 2014A, 5.500%, 12/01/54 | | 6/24 at 100.00 | | | 8,939,536 | |
| | | | |
| | 2,585 | | | | | South Carolina Public Service Authority, Santee Cooper Revenue Obligations, Series 2015E, 5.250%, 12/01/55 | | 12/25 at 100.00 | | | 2,491,220 | |
| | | | | | Total South Carolina | | | | | 83,217,896 | |
| | | | |
| | | | | | South Dakota - 0.2% (0.1% of Total Investments) | | | | | | |
| | | | |
| | 4,455 | | | | | South Dakota Health and Educational Facilities Authority, Revenue Bonds, Sanford Health, Series 2015, 5.000%, 11/01/45 | | 11/25 at 100.00 | | | 4,153,735 | |
| | | | | | Total South Dakota | | | | | 4,153,735 | |
| | | | |
| | | | | | Tennessee - 0.5% (0.3% of Total Investments) | | | | | | |
| | | | |
| | 1,000 | | | | | Bristol Industrial Development Board, Tennessee, State Sales Tax Revenue Bonds, Pinnacle Project, Series 2016A, 5.125%, 12/01/42, 144A | | 12/26 at 100.00 | | | 834,556 | |
| | | | |
| | 4,000 | | | | | Chattanooga Health, Educational and Housing Facility Board, Tennessee, Revenue Bonds, CommonSpirit Health, Series 2019A-1, 4.000%, 8/01/44 | | 8/29 at 100.00 | | | 3,224,186 | |
| | | | |
| | 2,395 | | | | | Chattanooga-Hamilton County Hospital Authority, Tennessee, Hospital Revenue Bonds, Erlanger Health System, Refunding Series 2014A,
5.000%, 10/01/44 | | 10/24 at 100.00 | | | 2,106,455 | |
| | | | |
| | 5,000 | | | | | Metropolitan Nashville Airport Authority, Tennessee, Airport Revenue Bonds, Subordinate Series 2019B, 5.000%, 7/01/54, (AMT) | | 7/30 at 100.00 | | | 4,637,161 | |
| | | | |
| | 155 | | | | | The Tennessee Energy Acquisition Corporation, Gas Revenue Bonds,
Series 2006C, 5.000%, 2/01/24 | | No Opt. Call | | | 154,986 | |
| | | | | | Total Tennessee | | | | | 10,957,344 | |
| | | | |
| | | | | | Texas - 11.4% (6.7% of Total Investments) | | | | | | |
| | | | |
| | 855 | | | | | Aubrey, Denton County, Texas, Special Assessment Revenue Bonds, Jackson Ridge Public Improvement District Phase 1 Project, Series 2015,
7.250%, 9/01/45 | | 3/24 at 103.00 | | | 871,006 | |
| | | | |
| | 710 | | | | | Aubrey, Denton County, Texas, Special Assessment Revenue Bonds, Jackson Ridge Public Improvement District Phases 2-3 Major Improvements Project, Series 2015, 8.250%, 9/01/40 | | 3/24 at 103.00 | | | 724,319 | |
| | | | |
| | | | | | Board of Managers, Joint Guadalupe County-Seguin City Hospital, Texas, Hospital Mortgage Revenue Bonds, Refunding & Improvement Series 2015: | | | | | | |
| | 3,135 | | | | | 5.250%, 12/01/35 | | 12/25 at 100.00 | | | 2,864,671 | |
| | 3,340 | | | | | 5.000%, 12/01/40 | | 12/25 at 100.00 | | | 2,823,537 | |
| | | | |
| | 9,000 | | | | | Carrollton-Farmers Branch Independent School District, Dallas County, Texas, General Obligation Bonds, School Building Series 2023, 4.000%, 2/15/53 | | 2/33 at 100.00 | | | 7,462,144 | |
| | | | |
| | 960 | | | | | Celina, Texas, Special Assessment Revenue Bonds, Sutton Fields II Public Improvement District Neighborhood Improvement Area 1 Project, Series 2015, 7.250%, 9/01/45 | | 3/24 at 102.00 | | | 970,403 | |
| | | | |
| | 1,690 | | | | | Celina, Texas, Special Assessment Revenue Bonds, Sutton Fields II Public Improvement District Neighborhood Improvement Areas 2-5 Major Improvement Project, Series 2015, 8.250%, 9/01/40 | | 3/24 at 102.00 | | | 1,716,002 | |
108
| | | | | | | | | | | | |
Principal Amount (000) | | | | | Description (a) | | Optional Call Provisions (b) | | Value | |
| | | | |
| | | | | | Texas (continued) | | | | | | |
| | | | | | Central Texas Regional Mobility Authority, Revenue Bonds, Senior Lien,
Series 2015A: | | | | | | |
| $ | 2,000 | | | (c) | | 5.000%, 1/01/40, (Pre-refunded 7/01/25) | | 7/25 at 100.00 | | $ | 2,034,633 | |
| | 3,625 | | | (c) | | 5.000%, 1/01/45, (Pre-refunded 7/01/25) | | 7/25 at 100.00 | | | 3,687,772 | |
| | | | |
| | | | | | Club Municipal Management District 1, Texas, Special Assessment Revenue Bonds, Improvement Area 1 Project, Series 2016: | | | | | | |
| | 505 | | | | | 6.250%, 9/01/35 | | 3/24 at 103.00 | | | 510,804 | |
| | 480 | | | | | 6.500%, 9/01/46 | | 3/24 at 103.00 | | | 484,623 | |
| | | | |
| | 21,000 | | | | | Crowley Independent School District, Tarrant and Johnson Counties, Texas, General Obligation Bonds, School Building Series 2023, 4.250%, 2/01/53 | | 2/33 at 100.00 | | | 18,082,394 | |
| | | | |
| | 1,000 | | | | | Fort Bend County Industrial Development Corporation, Texas, Revenue Bonds, NRG Energy Inc. Project, Series 2012A. RMKT, 4.750%, 5/01/38 | | 12/23 at 100.00 | | | 901,816 | |
| | | | |
| | 150 | | | | | Fort Bend County Industrial Development Corporation, Texas, Revenue Bonds, NRG Energy Inc. Project, Series 2012B, 4.750%, 11/01/42 | | 12/23 at 100.00 | | | 131,971 | |
| | | | |
| | 10,000 | | | | | Gulf Coast Industrial Development Authority, Texas, Solid Waste Disposal Revenue Bonds, Citgo Petroleum Corporation Project, Series 1998,
8.000%, 4/01/28, (AMT) | | 12/23 at 100.00 | | | 10,002,816 | |
| | | | |
| | | | | | Harris County-Houston Sports Authority, Texas, Revenue Bonds, Capital Appreciation Refunding Senior Lien Series 2014A: | | | | | | |
| | 295 | | | | | 0.000%, 11/15/41 - AGM Insured | | 11/31 at 62.66 | | | 103,415 | |
| | 590 | | | | | 0.000%, 11/15/42 - AGM Insured | | 11/31 at 59.73 | | | 192,807 | |
| | 1,000 | | | | | 0.000%, 11/15/43 - AGM Insured | | 11/31 at 56.93 | | | 306,375 | |
| | 2,000 | | | | | 0.000%, 11/15/44 - AGM Insured | | 11/31 at 54.25 | | | 573,164 | |
| | 2,600 | | | | | 0.000%, 11/15/45 - AGM Insured | | 11/31 at 51.48 | | | 699,786 | |
| | 4,180 | | | | | 0.000%, 11/15/53 - AGM Insured | | 11/31 at 33.96 | | | 681,361 | |
| | | | |
| | 6,170 | | | | | Harris County-Houston Sports Authority, Texas, Revenue Bonds, Junior Lien
Series 2001H, 0.000%, 11/15/37 - NPFG Insured | | 11/31 at 69.08 | | | 2,637,423 | |
| | | | |
| | 4,565 | | | | | Harris County-Houston Sports Authority, Texas, Revenue Bonds, Third Lien
Series 2004A-3, 0.000%, 11/15/35 - NPFG Insured | | 11/24 at 52.47 | | | 2,189,272 | |
| | | | |
| | 40,500 | | | | | Harris County-Houston Sports Authority, Texas, Special Revenue Bonds, Refunding Senior Lien Series 2001A, 0.000%, 11/15/40 - NPFG Insured | | 11/30 at 54.04 | | | 14,594,353 | |
| | | | |
| | 2,000 | | | | | Houston, Texas, Airport System Special Facilities Revenue Bonds, United Airlines Inc. Terminal Improvement Project, Refunding Series 2015B-1, 5.000%, 7/15/35, (AMT) | | 7/25 at 100.00 | | | 1,857,219 | |
| | | | |
| | 235 | | | | | Houston, Texas, Airport System Special Facilities Revenue Bonds, United Airlines, Inc. Terminal E Project, Refunding Series 2014, 5.000%, 7/01/29, (AMT) | | 7/24 at 100.00 | | | 227,224 | |
| | | | |
| | 2,845 | | | | | Houston, Texas, Airport System Special Facilities Revenue Bonds, United Airlines, Inc. Terminal E Project, Refunding Series 2020A, 5.000%, 7/01/27, (AMT) | | No Opt. Call | | | 2,751,519 | |
| | | | |
| | 3,750 | | | | | Houston, Texas, Airport System Special Facilities Revenue Bonds, United Airlines, Inc. Terminal Improvements Project, Refunding Series 2020B-2,
5.000%, 7/15/27, (AMT) | | No Opt. Call | | | 3,625,587 | |
| | | | |
| | | | | | Houston, Texas, Hotel Occupancy Tax and Special Revenue Bonds, Convention and Entertainment Project, Series 2001B: | | | | | | |
| | 28,305 | | | | | 0.000%, 9/01/28 - AMBAC Insured | | No Opt. Call | | | 22,782,194 | |
| | 5,000 | | | | | 0.000%, 9/01/30 - AMBAC Insured | | No Opt. Call | | | 3,647,933 | |
| | 5,765 | | | | | 0.000%, 9/01/31 - AMBAC Insured | | No Opt. Call | | | 3,998,808 | |
| | | | |
| | 6,000 | | | (c) | | Houston, Texas, Water and Sewerage System Revenue Bonds, Refunding Junior Lien Series 2001B, 5.500%, 12/01/29 - NPFG Insured, (ETM) | | No Opt. Call | | | 6,400,906 | |
| | | | |
| | 7,500 | | | (c) | | Houston, Texas, Water and Sewerage System Revenue Bonds, Refunding Junior Lien Series 2002A, 5.750%, 12/01/32 - AGM Insured, (ETM) | | No Opt. Call | | | 8,694,749 | |
109
| | |
| NZF | | Nuveen Municipal Credit Income Fund (continued) |
| | Portfolio of Investments October 31, 2023 |
| | | | | | | | | | | | |
Principal Amount (000) | | | | | Description (a) | | Optional Call Provisions (b) | | Value | |
| | | | |
| | | | | | Texas (continued) | | | | | | |
| | | | |
| $ | 720 | | | | | Kerrville Health Facilities Development Corporation, Texas, Revenue Bonds, Sid Peterson Memorial Hospital Project, Series 2015,
5.000%, 8/15/35 | | 8/25 at 100.00 | | $ | 722,203 | |
| | | | |
| | 2,505 | | | | | Matagorda County Navigation District 1, Texas, Collateralized Revenue Refunding Bonds, Houston Light and Power Company, Series 1997, 5.125%, 11/01/28 - AMBAC Insured, (AMT) | | No Opt. Call | | | 2,516,625 | |
| | | | |
| | 8,630 | | | | | Mission Economic Development Corporation, Texas, Revenue Bonds, Natgasoline Project, Senior Lien Series 2018, 4.625%, 10/01/31, (AMT), 144A | | 11/23 at 103.00 | | | 8,123,903 | |
| | | | |
| | 825 | | | (e) | | New Hope Cultural Education Facilities Finance Corporation, Texas, Student Housing Revenue Bonds, NCCD - College Station Properties LLC - Texas A&M University Project, Series 2015A, 5.000%, 7/01/47 | | 7/25 at 100.00 | | | 748,687 | |
| | | | |
| | | | | | North Texas Tollway Authority, Special Projects System Revenue Bonds, Convertible Capital Appreciation Series 2011C: | | | | | | |
| | 6,330 | | | (c) | | 7.000%, 9/01/43, (Pre-refunded 9/01/31) | | 9/31 at 100.00 | | | 7,466,445 | |
| | 9,130 | | | (c) | | 6.750%, 9/01/45, (Pre-refunded 9/01/31) | | 9/31 at 100.00 | | | 10,818,864 | |
| | | | |
| | | | | | North Texas Tollway Authority, System Revenue Bonds, Refunding First Tier Capital Appreciation Series 2008I: | | | | | | |
| | 2,555 | | | (c) | | 6.200%, 1/01/42, (Pre-refunded 1/01/25) - AGC Insured | | 1/25 at 100.00 | | | 2,619,557 | |
| | 7,000 | | | (c) | | 6.500%, 1/01/43, (Pre-refunded 1/01/25) | | 1/25 at 100.00 | | | 7,196,479 | |
| | | | |
| | 10,000 | | | | | North Texas Tollway Authority, System Revenue Bonds, Refunding First Tier, Series 2008D, 0.000%, 1/01/28 - AGC Insured | | No Opt. Call | | | 8,374,139 | |
| | | | |
| | 1,570 | | | | | Reagan Hospital District of Reagan County, Texas, Limited Tax Revenue Bonds, Series 2014A, 5.000%, 2/01/34 | | 2/24 at 100.00 | | | 1,542,489 | |
| | | | |
| | 1,000 | | | (e) | | Red River Health Facilities Development Corporation, Texas, First Mortgage Revenue Bonds, Eden Home Inc., Series 2012,
7.250%, 12/15/47 | | 12/23 at 100.00 | | | 600,000 | |
| | | | |
| | 1,090 | | | | | Texas Municipal Gas Acquisition and Supply Corporation I, Gas Supply Revenue Bonds, Senior Lien Series 2008D, 6.250%, 12/15/26 | | No Opt. Call | | | 1,111,185 | |
| | | | |
| | 87,165 | | | | | Texas Private Activity Bond Surface Transporation Corporation, Senior Lien Revenue Bonds, NTE Mobility Partners Segments 3 LLC Segments 3C Project, Series 2019, 5.000%, 6/30/58, (AMT) | | 6/29 at 100.00 | | | 79,815,727 | |
| | | | |
| | 3,600 | | | | | Texas Turnpike Authority, Central Texas Turnpike System Revenue Bonds, First Tier Series 2002A, 0.000%, 8/15/25 - AMBAC Insured | | No Opt. Call | | | 3,334,295 | |
| | | | | | Total Texas | | | | | 264,223,604 | |
| | | | |
| | | | | | Utah - 0.1% (0.1% of Total Investments) | | | | | | |
| | | | |
| | 1,945 | | | | | Box Elder County, Utah, Solid Waste Disposal Revenue Bonds, Promontory Point Res, LLC, Senior Series 2017A, 8.000%, 12/01/39, (AMT), 144A | | 12/27 at 100.00 | | | 1,824,321 | |
| | | | |
| | 1,755 | | | | | Salt Lake City, Utah, Airport Revenue Bonds, International Airport
Series 2021A, 4.000%, 7/01/51 - AGM Insured, (AMT) | | 7/31 at 100.00 | | | 1,404,517 | |
| | | | | | Total Utah | | | | | 3,228,838 | |
| | | | |
| | | | | | Virginia - 3.6% (2.1% of Total Investments) | | | | | | |
| | | | |
| | 22,405 | | | (d) | | Chesapeake Bay Bridge and Tunnel District, Virginia, General Resolution Revenue Bonds, First Tier Series 2016, 5.000%, 7/01/51, (UB) | | 7/26 at 100.00 | | | 20,826,521 | |
| | | | |
| | 12,000 | | | (d) | | Chesapeake Bay Bridge and Tunnel District, Virginia, General Resolution Revenue Bonds, First Tier Series 2016, 5.000%, 7/01/51 | | 7/26 at 100.00 | | | 11,154,575 | |
| | | | |
| | 540 | | | (c) | | Embrey Mill Community Development Authority, Virginia, Special Assessment Revenue Bonds, Series 2015, 5.600%, 3/01/45, (Pre-refunded 3/01/25) | | 3/25 at 100.00 | | | 551,278 | |
| | | | |
| | 2,000 | | | | | Tobacco Settlement Financing Corporation of Virginia, Tobacco Settlement Asset Backed Bonds, Series 2007B1, 5.000%, 6/01/47 | | 11/23 at 100.00 | | | 1,715,536 | |
110
| | | | | | | | | | | | |
Principal Amount (000) | | | | | Description (a) | | Optional Call Provisions (b) | | Value | |
| | | | |
| | | | | | Virginia (continued) | | | | | | |
| | | | | | Virginia Small Business Financing Authority, Private Activity Revenue Bonds, Transform 66 P3 Project, Senior Lien Series 2017: | | | | | | |
| | $ 8,995 | | | | | 5.000%, 12/31/49, (AMT) | | 6/27 at 100.00 | | $ | 8,421,521 | |
| | 16,520 | | | | | 5.000%, 12/31/52, (AMT) | | 6/27 at 100.00 | | | 15,325,554 | |
| | 27,570 | | | | | 5.000%, 12/31/56, (AMT) | | 6/27 at 100.00 | | | 25,280,425 | |
| | | | | | Total Virginia | | | | | 83,275,410 | |
| | | | |
| | | | | | Washington - 3.8% (2.3% of Total Investments) | | | | | | |
| | | | |
| | 940 | | | | | Central Puget Sound Regional Transit Authority, Washington, Sales Tax and Motor Vehicle Excise Tax Bonds, Series 1999, 4.750%, 2/01/28 - FGIC Insured | | 12/23 at 100.00 | | | 939,486 | |
| | | | |
| | 125 | | | | | Tacoma Consolidated Local Improvement District 65, Washington, Special Assessment Bonds, Series 2013, 5.750%, 4/01/43 | | 11/23 at 100.00 | | | 111,635 | |
| | | | |
| | 6,065 | | | | | Washington Health Care Facilities Authority, Revenue Bonds, Central Washington Health Services Association, Refunding Series 2015, 4.000%, 7/01/36 | | 7/25 at 100.00 | | | 5,281,537 | |
| | | | |
| | 10,420 | | | (d) | | Washington Health Care Facilities Authority, Revenue Bonds, MultiCare Health System, Series 2015A, 5.000%, 8/15/45, (UB) | | 8/25 at 100.00 | | | 9,904,041 | |
| | | | |
| | 10,500 | | | | | Washington Health Care Facilities Authority, Revenue Bonds, MultiCare Health System, Series 2017B, 4.000%, 8/15/41 | | 2/28 at 100.00 | | | 8,957,141 | |
| | | | |
| | 1,760 | | | | | Washington Health Care Facilities Authority, Revenue Bonds, Overlake Hospital Medical Center, Series 2017A, 5.000%, 7/01/42 | | 1/28 at 100.00 | | | 1,585,309 | |
| | | | |
| | 10,785 | | | (d) | | Washington Health Care Facilities Authority, Revenue Bonds, Providence Health & Services, Series 2014C, 5.000%, 10/01/44, (UB) | | 10/24 at 100.00 | | | 10,047,067 | |
| | | | |
| | 21,320 | | | (d) | | Washington Health Care Facilities Authority, Revenue Bonds, Providence Health & Services, Series 2014D, 5.000%, 10/01/38, (UB) | | 10/24 at 100.00 | | | 20,642,071 | |
| | | | |
| | | | | | Washington Health Care Facilities Authority, Revenue Bonds, Seattle Cancer Center Alliance, Series 2020: | | | | | | |
| | 2,000 | | | | | 4.000%, 9/01/45 | | 9/30 at 100.00 | | | 1,614,768 | |
| | 14,875 | | | (d) | | 5.000%, 9/01/55, (UB) | | 9/30 at 100.00 | | | 14,057,285 | |
| | 6,185 | | | (d) | | 5.000%, 9/01/55 | | 9/30 at 100.00 | | | 5,844,996 | |
| | | | |
| | | | | | Washington State Convention Center Public Facilities District, Lodging Tax Revenue Bonds, Refunding Subordinate Series 2021B. Exchange Purchase: | | | | | | |
| | 9,435 | | | | | 4.000%, 7/01/43 | | 7/31 at 100.00 | | | 7,814,093 | |
| | 1,675 | | | | | 3.000%, 7/01/48 | | 7/31 at 100.00 | | | 1,052,556 | |
| | | | |
| | 1,410 | | | | | Washington State, Motor Vehicle Fuel Tax General Obligation Bonds, Series 2003F, 0.000%, 12/01/24 - NPFG Insured | | No Opt. Call | | | 1,352,749 | |
| | | | | | Total Washington | | | | | 89,204,734 | |
| | | | |
| | | | | | West Virginia - 0.1% (0.1% of Total Investments) | | | | | | |
| | | | |
| | 3,500 | | | | | West Virginia State, General Obligation Bonds, State Road Competitive Series 2018B, 4.000%, 6/01/42 | | 6/28 at 100.00 | | | 3,036,919 | |
| | | | | | Total West Virginia | | | | | 3,036,919 | |
| | | | |
| | | | | | Wisconsin - 2.3% (1.3% of Total Investments) | | | | | | |
| | | | |
| | 25 | | | | | Public Finance Authority of Wisconsin, Charter School Revenue Bonds, Corvian Community School, North Carolina, Series 2017A, 5.000%, 6/15/37, 144A | | 6/24 at 100.00 | | | 21,664 | |
| | | | |
| | 1,000 | | | | | Public Finance Authority of Wisconsin, Charter School Revenue Bonds, Envision Science Academy Project, Series 2016A, 5.125%, 5/01/36, 144A | | 5/26 at 100.00 | | | 901,002 | |
111
| | |
| NZF | | Nuveen Municipal Credit Income Fund (continued) |
| | Portfolio of Investments October 31, 2023 |
| | | | | | | | | | | | |
Principal Amount (000) | | | | | Description (a) | | Optional Call Provisions (b) | | Value | |
| | | | |
| | | | | | Wisconsin (continued) | | | | | | |
| | | | | | Public Finance Authority of Wisconsin, Charter School Revenue Bonds, North Carolina Charter Educational Foundation Project, Series 2016A: | | | | | | |
| | $ 5,545 | | | | | 5.000%, 6/15/36, 144A | | 6/26 at 100.00 | | $ | 4,511,916 | |
| | 4,430 | | | | | 5.000%, 6/15/46, 144A | | 6/26 at 100.00 | | | 3,110,264 | |
| | | | |
| | | | | | Public Finance Authority of Wisconsin, Conference Center and Hotel Revenue Bonds, Lombard Public Facilities Corporation, First Tier Series 2018A-1: | | | | | | |
| | 80 | | | (e) | | 0.000%, 1/01/47, 144A | | No Opt. Call | | | 1,605 | |
| | 70 | | | (e) | | 0.000%, 1/01/48, 144A | | No Opt. Call | | | 1,323 | |
| | 69 | | | (e) | | 0.000%, 1/01/49, 144A | | No Opt. Call | | | 1,221 | |
| | 66 | | | (e) | | 0.000%, 1/01/50, 144A | | No Opt. Call | | | 1,091 | |
| | 65 | | | (e) | | 0.000%, 1/01/51, 144A | | No Opt. Call | | | 1,011 | |
| | 85 | | | (e) | | 0.000%, 1/01/52, 144A | | No Opt. Call | | | 1,216 | |
| | 84 | | | (e) | | 0.000%, 1/01/53, 144A | | No Opt. Call | | | 1,131 | |
| | 81 | | | (e) | | 0.000%, 1/01/54, 144A | | No Opt. Call | | | 1,023 | |
| | 79 | | | (e) | | 0.000%, 1/01/55, 144A | | No Opt. Call | | | 943 | |
| | 78 | | | (e) | | 0.000%, 1/01/56, 144A | | No Opt. Call | | | 874 | |
| | 4,225 | | | (e) | | 5.500%, 7/01/56, 144A | | 3/28 at 100.00 | | | 2,197,937 | |
| | 86 | | | (e) | | 0.000%, 1/01/57, 144A | | No Opt. Call | | | 907 | |
| | 84 | | | (e) | | 0.000%, 1/01/58, 144A | | No Opt. Call | | | 831 | |
| | 81 | | | (e) | | 0.000%, 1/01/59, 144A | | No Opt. Call | | | 765 | |
| | 80 | | | (e) | | 0.000%, 1/01/60, 144A | | No Opt. Call | | | 700 | |
| | 79 | | | (e) | | 0.000%, 1/01/61, 144A | | No Opt. Call | | | 647 | |
| | 76 | | | (e) | | 0.000%, 1/01/62, 144A | | No Opt. Call | | | 591 | |
| | 75 | | | (e) | | 0.000%, 1/01/63, 144A | | No Opt. Call | | | 546 | |
| | 73 | | | (e) | | 0.000%, 1/01/64, 144A | | No Opt. Call | | | 505 | |
| | 72 | | | (e) | | 0.000%, 1/01/65, 144A | | No Opt. Call | | | 465 | |
| | 78 | | | (e) | | 0.000%, 1/01/66, 144A | | No Opt. Call | | | 461 | |
| | 935 | | | (e) | | 0.000%, 1/01/67, 144A | | No Opt. Call | | | 4,997 | |
| | | | |
| | | | | | Public Finance Authority of Wisconsin, Conference Center and Hotel Revenue Bonds, Lombard Public Facilities Corporation, Second Tier Series 2018B: | | | | | | |
| | 69 | | | (e) | | 0.000%, 1/01/46, 144A | | No Opt. Call | | | 1,512 | |
| | 68 | | | (e) | | 0.000%, 1/01/47, 144A | | No Opt. Call | | | 1,375 | |
| | 68 | | | (e) | | 0.000%, 1/01/48, 144A | | No Opt. Call | | | 1,287 | |
| | 67 | | | (e) | | 0.000%, 1/01/49, 144A | | No Opt. Call | | | 1,199 | |
| | 67 | | | (e) | | 0.000%, 1/01/50, 144A | | No Opt. Call | | | 1,091 | |
| | 73 | | | (e) | | 0.000%, 1/01/51, 144A | | No Opt. Call | | | 1,127 | |
| | 1,874 | | | (e) | | 1.000%, 7/01/51, 144A | | 3/28 at 100.00 | | | 990,137 | |
| | 72 | | | (e) | | 0.000%, 1/01/52, 144A | | No Opt. Call | | | 1,036 | |
| | 71 | | | (e) | | 0.000%, 1/01/53, 144A | | No Opt. Call | | | 963 | |
| | 71 | | | (e) | | 0.000%, 1/01/54, 144A | | No Opt. Call | | | 896 | |
| | 70 | | | (e) | | 0.000%, 1/01/55, 144A | | No Opt. Call | | | 831 | |
| | 69 | | | (e) | | 0.000%, 1/01/56, 144A | | No Opt. Call | | | 775 | |
| | 68 | | | (e) | | 0.000%, 1/01/57, 144A | | No Opt. Call | | | 721 | |
| | 67 | | | (e) | | 0.000%, 1/01/58, 144A | | No Opt. Call | | | 669 | |
| | 67 | | | (e) | | 0.000%, 1/01/59, 144A | | No Opt. Call | | | 628 | |
| | 67 | | | (e) | | 0.000%, 1/01/60, 144A | | No Opt. Call | | | 582 | |
| | 66 | | | (e) | | 0.000%, 1/01/61, 144A | | No Opt. Call | | | 538 | |
| | 65 | | | (e) | | 0.000%, 1/01/62, 144A | | No Opt. Call | | | 502 | |
| | 64 | | | (e) | | 0.000%, 1/01/63, 144A | | No Opt. Call | | | 467 | |
| | 64 | | | (e) | | 0.000%, 1/01/64, 144A | | No Opt. Call | | | 439 | |
| | 63 | | | (e) | | 0.000%, 1/01/65, 144A | | No Opt. Call | | | 407 | |
| | 62 | | | (e) | | 0.000%, 1/01/66, 144A | | No Opt. Call | | | 368 | |
| | 808 | | | (e) | | 0.000%, 1/01/67, 144A | | No Opt. Call | | | 4,319 | |
| | | | |
| | 500 | | | | | Public Finance Authority of Wisconsin, Education Revenue Bonds, Corvian Community School, North Carolina Series 2023A, 6.250%, 6/15/48, 144A | | 6/33 at 100.00 | | | 456,226 | |
112
| | | | | | | | | | | | |
Principal Amount (000) | | | | | Description (a) | | Optional Call Provisions (b) | | Value | |
| | | | |
| | | | | | Wisconsin (continued) | | | | | | |
| | $ 1,200 | | | | | Public Finance Authority of Wisconsin, Exempt Facilities Revenue Bonds, National Gypsum Company Project, Refunding Series 2016, 4.000%, 8/01/35, (AMT) | | 8/26 at 100.00 | | $ | 986,324 | |
| | | | |
| | 1,690 | | | (e) | | Public Finance Authority of Wisconsin, Limited Obligation Grant Revenue Bonds, American Dream @ Meadowlands Project, Series 2017A, 3.125%, 8/01/27, 144A | | No Opt. Call | | | 1,290,738 | |
| | | | |
| | 1,350 | | | | | Public Finance Authority of Wisconsin, Limited Obligation PILOT Revenue Bonds, American Dream @ Meadowlands Project, Series 2017, 7.000%, 12/01/50, 144A | | 12/27 at 100.00 | | | 1,178,668 | |
| | | | |
| | 160 | | | | | Public Finance Authority of Wisconsin, Revenue Bonds, Prime Healthcare Foundation, Inc., Series 2017A, 5.200%, 12/01/37 | | 12/27 at 100.00 | | | 150,173 | |
| | | | |
| | 2,905 | | | | | Public Finance Authority of Wisconsin, Student Housing Revenue Bonds, Collegiate Housing Foundation - Cullowhee LLC - Western California University Project, Series 2015A, 5.000%, 7/01/35 | | 7/25 at 100.00 | | | 2,698,114 | |
| | | | |
| | 1,000 | | | | | Public Finance Authority, Wisconsin, Exempt Facilities Revenue Bonds, Celanese Project, Refunding Series 2016C, 4.300%, 11/01/30 | | 5/26 at 100.00 | | | 925,582 | |
| | | | |
| | 1,000 | | | | | Wisconsin Center District, Dedicated Tax Revenue Bonds, Refunding Senior Series 2003A, 0.000%, 12/15/31 | | No Opt. Call | | | 690,801 | |
| | | | |
| | | | | | Wisconsin Health and Educational Facilities Authority, Revenue Bonds, Mercy Alliance, Inc., Series 2012: | | | | | | |
| | 2,105 | | | | | 5.000%, 6/01/32 | | 12/23 at 100.00 | | | 2,099,251 | |
| | 2,500 | | | | | 5.000%, 6/01/39 | | 12/23 at 100.00 | | | 2,380,317 | |
| | | | |
| | | | | | Wisconsin Health and Educational Facilities Authority, Wisconsin, Revenue Bonds, Ascension Health Alliance Senior Credit Group, Series 2016A: | | | | | | |
| | 12,650 | | | | | 5.000%, 11/15/39 | | 5/26 at 100.00 | | | 12,417,315 | |
| | 13,080 | | | | | 4.000%, 11/15/46 | | 5/26 at 100.00 | | | 10,967,114 | |
| | | | |
| | 1,120 | | | | | Wisconsin Health and Educational Facilities Authority, Wisconsin, Revenue Bonds, Dickson Hollow Project. Series 2014, 5.250%, 10/01/39 | | 12/23 at 101.00 | | | 922,386 | |
| | | | |
| | 4,000 | | | | | Wisconsin Health and Educational Facilities Authority, Wisconsin, Revenue Bonds, ProHealth Care, Inc. Obligated Group, Refunding Series 2015, 5.000%, 8/15/39 | | 8/24 at 100.00 | | | 3,866,977 | |
| | | | | | Total Wisconsin | | | | | 52,807,491 | |
| | | | | | Total Municipal Bonds
(cost $4,072,115,376) | | | | | 3,843,957,340 | |
| | | | |
| Shares | | | | | Description (a) | | | | Value | |
| | | | | | COMMON STOCKS - 5.2% (3.0% of Total Investments) | | | | | 120,121,945 | |
| | | | |
| | | | | | Utilities - 5.2% (3.0% of Total Investments) | | | | | | |
| | 1,512,547 | | | (i),(j) | | Energy Harbor Corp | | | | $ | 120,121,945 | |
| | | | | | Total Utilities | | | | | 120,121,945 | |
| | | | | | Total Common Stocks (cost $43,090,878) | | | | | 120,121,945 | |
| | | | |
| Shares | | | | | Description (a) | | | | Value | |
| | | | |
| | | | | | INVESTMENT COMPANIES - 0.0% (0.0% of Total Investments) | | | | | 972,719 | |
| | 6,266 | | | | | BlackRock MuniHoldings Fund Inc | | | | $ | 63,412 | |
| | 30,000 | | | | | Invesco Municipal Opportunity Trust | | | | | 241,800 | |
| | 43,020 | | | | | Invesco Trust for Investment Grade Municipals | | | | | 358,357 | |
113
| | |
| NZF | | Nuveen Municipal Credit Income Fund (continued) |
| | Portfolio of Investments October 31, 2023 |
| | | | | | | | | | | | |
| | | | |
| Shares | | | | | Description (a) | | | | Value | |
| | | | |
| | | | | | INVESTMENT COMPANIES (continued) | | | | | | |
| | 43,420 | | | | | PIMCO Municipal Income Fund II | | | | $ | 309,150 | |
| | | | | | Total Investment Companies (cost $1,569,945) | | | | | 972,719 | |
| | | | | | Total Long-Term Investments (cost $4,116,776,199) | | | | | 3,965,052,004 | |
| | | | | | Floating Rate Obligations - (16.2)% | | | | | (374,706,000 | ) |
| | | | | | MFP Shares, Net - (27.6)%(k) | | | | | (640,119,683 | ) |
| | | | | | VRDP Shares, Net- (29.1)%(l) | | | | | (673,553,812 | ) |
| | | | | | Other Assets & Liabilities, Net - 1.8% | | | | | 40,040,980 | |
| | | | | | Net Assets Applicable to Common Shares - 100% | | | | $ | 2,316,713,489 | |
| (a) | All percentages shown in the Portfolio of Investments are based on net assets applicable to common shares unless otherwise noted. |
| (b) | Optional Call Provisions: Dates (month and year) and prices of the earliest optional call or redemption. There may be other call provisions at varying prices at later dates. Certain mortgage-backed securities may be subject to periodic principal paydowns. Optional Call Provisions are not covered by the report of independent registered public accounting firm. |
| (c) | Backed by an escrow or trust containing sufficient U.S. Government or U.S. Government agency securities, which ensure the timely payment of principal and interest. |
| (d) | Investment, or portion of investment, has been pledged to collateralize the net payment obligations for investments in inverse floating rate transactions. |
| (e) | Defaulted security. A security whose issuer has failed to fully pay principal and/or interest when due, or is under the protection of bankruptcy. |
| (f) | For fair value measurement disclosure purposes, investment classified as Level 3. |
| (g) | Step-up coupon bond, a bond with a coupon that increases (“steps up”), usually at regular intervals, while the bond is outstanding. The rate shown is the coupon as of the end of the reporting period. |
| (h) | Variable rate security. The rate shown is the coupon as of the end of the reporting period. |
| (i) | Energy Harbor Corp (ENGH) common stock received as part of the bankruptcy settlements during February 2020 for Beaver County Industrial Development Authority, Pennsylvania, Pollution Control Revenue Refunding Bonds, FirstEnergy Nuclear Generation Project, Series 2006B, 3.500%, 12/01/35, Ohio Air Quality Development Authority, Ohio, Pollution Control Revenue Bonds, FirstEnergy Nuclear Generation Project, Refunding Series 2008C, 3.950%, 11/01/32, Ohio Water Development Authority, Pollution Control Revenue Refunding Bonds, FirstEnergy Nuclear Generating Corporation Project, Series 2008C, 3.950%, 11/01/32. Various funds and accounts managed by Nuveen, including the Fund, collectively are a substantial minority holder of ENGH’s outstanding shares of common stock, and possess certain other rights with respect to the corporate governance of ENGH. Due to these facts, under the federal securities laws, the securities of ENGH held by Nuveen funds and accounts, including the Fund, cannot be sold except under limited conditions (which are not currently satisfied). The Fund is therefore unable to sell such shares in ordinary secondary market transactions at this time. On March 6, 2023 Vistra Corp. (“Vistra”) announced that it has executed a definitive agreement with Energy Harbor Corp., pursuant to which Energy Harbor will merge with and into a newly-formed subsidiary of Vistra. In connection with the transaction, Nuveen funds and accounts expect to receive a combination of cash and shares in a newly formed entity. Nuveen expects these shares to be issued in a private transaction and may have reduced secondary market liquidity. The transaction is subject to certain regulatory approvals and there can be no assurance that the transaction will close. |
| (j) | Non-income producing; issuer has not declared an ex-dividend date within the past twelve months. |
| (k) | MFP Shares, Net as a percentage of Total Investments is 16.1%. |
| (l) | VRDP Shares, Net as a percentage of Total Investments is 17.0%. |
| 144A | Investment is exempt from registration under Rule 144A of the Securities Act of 1933, as amended. These investments may only be resold in transactions exempt from registration, which are normally those transactions with qualified institutional buyers. |
| AMT | Alternative Minimum Tax |
| IF | Inverse floating rate security issued by a tender option bond (“TOB”) trust, the interest rate on which varies inversely with the Securities Industry Financial Markets Association (SIFMA) short-term rate, which resets weekly, or a similar short-term rate, and is reduced by the expenses related to the TOB trust. |
| LIBOR | London Inter-Bank Offered Rate |
| PIK | Payment-in-kind (“PIK”) security. Depending on the terms of the security, income may be received in the form of cash, securities, or a combination of both. The PIK rate shown, where applicable, represents the annualized rate of the last PIK payment made by the issuer as of the end of the reporting period. |
| UB | Underlying bond of an inverse floating rate trust reflected as a financing transaction. |
| WI/DD | When-issued or delayed delivery security. |
See Notes to Financial Statements
114
| | |
| NMZ | | Nuveen Municipal High Income Opportunity Fund |
| | Portfolio of Investments October 31, 2023 |
| | | | | | | | | | | | |
Principal Amount (000) | | | | | Description (a) | | Optional Call Provisions (b) | | Value | |
| | | | | | LONG-TERM INVESTMENTS - 170.1% (100.0% of Total Investments) | | | | | | |
| | | | | | MUNICIPAL BONDS - 164.4% (96.7% of Total Investments) | | | | | | |
| | | | |
| | | | | | Alabama - 2.5% (1.5% of Total Investments) | | | | | | |
| | | | |
| | $ 182 | | | (c) | | Adamsville Solid Waste Disposal Authority, Alabama, Solid Waste Disposal Revenue Bonds, Big Sky Environmental LLC Project, Refunding Taxable Series 2017C, 1.000%, 9/01/37, 144A | | 12/23 at 100.00 | | $ | 2 | |
| | | | |
| | 1,000 | | | (c) | | Adamsville Solid Waste Disposal Authority, Alabama, Solid Waste Disposal Revenue Bonds, Big Sky Environmental LLC Project, Series 2017A, 6.750%, 9/01/37, 144A | | 9/27 at 100.00 | | | 700,000 | |
| | | | |
| | 213 | | | (c) | | Adamsville Solid Waste Disposal Authority, Alabama, Solid Waste Disposal Revenue Bonds, Big Sky Environmental LLC Project, Taxable Series 2017B, 6.750%, 9/01/37, 144A | | 9/27 at 100.00 | | | 148,646 | |
| | | | |
| | 2,000 | | | | | Alabama Private Colleges and University Facilities Authority, Limited Obligation Bonds, University of Mobile Project, Series 2015A, 6.000%, 9/01/45, 144A | | 9/25 at 100.00 | | | 1,913,171 | |
| | | | |
| | 2,500 | | | | | Birmingham-Jefferson Civic Center Authority, Alabama, Special Tax Bonds, Series 2018A, 5.000%, 7/01/48 | | 7/28 at 100.00 | | | 2,364,396 | |
| | | | |
| | 785 | | | | | Hoover Industrial Development Board, Alabama, Environmental Improvement Revenue Bonds, United States Steel Corporation Proejcet, Green Series 2020, 6.375%, 11/01/50, (AMT), (Mandatory Put 11/01/30) | | No Opt. Call | | | 816,141 | |
| | | | |
| | 10,765 | | | | | Hoover Industrial Development Board, Alabama, Environmental Improvement Revenue Bonds, United States Steel Corporation Project, Series 2019, 5.750%, 10/01/49, (AMT) | | 10/29 at 100.00 | | | 10,038,801 | |
| | | | |
| | 5,000 | | | | | Jefferson County, Alabama, Sewer Revenue Warrants, Capital Appreciation Subordinate Lien Series 2013F, 7.900%, 10/01/50 | | 11/23 at 105.00 | | | 5,257,213 | |
| | | | |
| | 1,000 | | | | | Jefferson County, Alabama, Sewer Revenue Warrants, Senior Lien Series 2013C, 6.500%, 10/01/38 - AGM Insured | | 11/23 at 105.00 | | | 1,050,304 | |
| | | | |
| | 250 | | | | | MidCity Improvement District, Alabama, Special Assessment Revenue Bonds, Series 2022, 4.750%, 11/01/49 | | 11/32 at 100.00 | | | 184,022 | |
| | | | |
| | 1,875 | | | | | Mobile County, Alabama, Limited Obligation Warrants, Gomesa Projects, Series 2020, 4.000%, 11/01/45, 144A | | 11/29 at 100.00 | | | 1,484,184 | |
| | | | |
| | | | | | Tuscaloosa County Industrial Development Authority, Alabama, Gulf Opportunity Zone Bonds, Hunt Refining Project, Refunding Series 2019A: | | | | | | |
| | 241 | | | | | 4.500%, 5/01/32, 144A | | 5/29 at 100.00 | | | 213,259 | |
| | 2,950 | | | | | 5.250%, 5/01/44, 144A | | 5/29 at 100.00 | | | 2,431,385 | |
| | | | | | Total Alabama | | | | | 26,601,524 | |
| | | | |
| | | | | | Arizona - 4.4% (2.6% of Total Investments) | | | | | | |
| | | | |
| | | | | | Arizona Industrial Development Authority, Arizona, Education Revenue Bonds, Arizona Christian University Project, Series 2019A: | | | | | | |
| | 400 | | | | | 5.500%, 10/01/40, 144A | | 10/26 at 103.00 | | | 320,744 | |
| | 800 | | | | | 5.625%, 10/01/49, 144A | | 10/26 at 103.00 | | | 600,495 | |
| | | | |
| | 10,000 | | | | | Arizona Industrial Development Authority, Arizona, Education Revenue Bonds, Heritage Academy - Gateway and Laveen Pojects, Series 2021B, 5.000%, 7/01/51, 144A | | 7/28 at 103.00 | | | 7,812,460 | |
| | | | |
| | 1,000 | | | | | Arizona Industrial Development Authority, Arizona, Education Revenue Bonds, Heritage Academy - Gateway and Laveen Pojects, Taxable Series 2021C, 6.000%, 7/01/29, 144A | | No Opt. Call | | | 941,599 | |
| | | | |
| | 10,000 | | | | | Arizona Industrial Development Authority, Arizona, Education Revenue Bonds, Heritage Academy - Gateway and Laveen Projects, Taxable Series 2021A, 5.000%, 7/01/51, 144A | | 7/28 at 103.00 | | | 7,812,460 | |
115
| | |
| NMZ | | Nuveen Municipal High Income Opportunity Fund (continued) |
| | Portfolio of Investments October 31, 2023 |
| | | | | | | | | | | | |
Principal Amount (000) | | | | | Description (a) | | Optional Call Provisions (b) | | Value | |
| | | | |
| | | | | | Arizona (continued) | | | | | | |
| | $ 5,000 | | | | | Arizona Industrial Development Authority, Arizona, Education Revenue Bonds, Pinecrest Academy of Nevada Sloan Canyon Campus Project, Series 2020A-2, 6.150%, 9/15/53, 144A | | 11/23 at 105.00 | | $ | 4,925,622 | |
| | | | |
| | 2,765 | | | | | Arizona Industrial Development Authority, Arizona, Hotel Revenue Bonds, Provident Group Falcon Properties LLC, Project, Senior Series 2022A-1, 4.150%, 12/01/57, 144A | | 12/31 at 100.00 | | | 1,786,983 | |
| | | | |
| | 2,590 | | | | | Arizona Industrial Development Authority, Arizona, Hotel Revenue Bonds, Provident Group Falcon Properties LLC, Project, Subordinate Series 2022B, 5.750%, 12/15/57, 144A | | 12/31 at 100.00 | | | 1,813,108 | |
| | | | |
| | 1,000 | | | | | Arizona Industrial Development Authority, Education Facility Revenue Bonds, Caurus Academy Project, Series 2018A, 6.500%, 6/01/50, 144A | | 6/28 at 100.00 | | | 1,001,886 | |
| | | | |
| | 1,000 | | | | | Maricopa County Industrial Development Authority, Arizona, Education Revenue Bonds, Gateway Academy Project, Series 2019A, 5.750%, 1/01/50, 144A | | 1/30 at 100.00 | | | 790,097 | |
| | | | |
| | 1,000 | | | | | Pima County Industrial Development Authority, Arizona, Charter School Revenue Bonds, Desert Heights Charter School, Series 2014, 7.250%, 5/01/44 | | 5/24 at 100.00 | | | 1,005,107 | |
| | | | |
| | 3,000 | | | | | Pima County Industrial Development Authority, Arizona, Education Facility Revenue Bonds, Edkey Charter Schools Project, Refunding Series 2020, 5.000%, 7/01/49, 144A | | 7/26 at 103.00 | | | 2,410,186 | |
| | | | |
| | | | | | Pima County Industrial Development Authority, Arizona, Education Facility Revenue Bonds, Edkey Charter Schools Project, Series 2016: | | | | | | |
| | 245 | | | | | 5.250%, 7/01/36 | | 7/26 at 100.00 | | | 228,104 | |
| | 400 | | | | | 5.375%, 7/01/46 | | 7/26 at 100.00 | | | 345,847 | |
| | 475 | | | | | 5.500%, 7/01/51 | | 7/26 at 100.00 | | | 407,576 | |
| | | | |
| | 1,000 | | | | | Pima County Industrial Development Authority, Arizona, Education Facility Revenue Bonds, Edkey Charter Schools Project, Series 2019, 5.875%, 7/01/51, 144A | | 7/26 at 103.00 | | | 905,581 | |
| | | | |
| | 2,000 | | | | | Pima County Industrial Development Authority, Arizona, Education Facility Revenue Bonds, San Tan Montessori School Project, Series 2014A, 9.000%, 2/01/44 | | 2/24 at 100.00 | | | 2,013,500 | |
| | | | |
| | 310 | | | | | Pima County Industrial Development Authority, Arizona, Education Facility Revenue Bonds, Synergy Public Charter School Project, Series 2020, 5.000%, 6/15/35, 144A | | 6/28 at 100.00 | | | 282,369 | |
| | | | |
| | 100 | | | | | Pima County Industrial Development Authority, Arizona, Education Facility Revenue Bonds, The Paideia Academies Project, 2019, 5.125%, 7/01/39 | | 7/25 at 100.00 | | | 86,870 | |
| | | | |
| | 7,500 | | | | | Salt Verde Financial Corporation, Arizona, Senior Gas Revenue Bonds, Citigroup Energy Inc Prepay Contract Obligations, Series 2007, 5.500%, 12/01/37, 144A | | No Opt. Call | | | 7,649,348 | |
| | | | |
| | 2,000 | | | | | Sierra Vista Industrial Development Authority, Arizona, Economic Development Revenue Bonds, Convertible Capital Appreciation Revenue Bonds, Series 2021A, 5.375%, 10/01/56 | | 10/29 at 103.00 | | | 1,302,709 | |
| | | | |
| | 1,980 | | | | | Sierra Vista Industrial Development Authority, Arizona, Education Facility Revenue Bonds, AmeriSchools Academy Project, Series 2022, 6.000%, 6/15/57, 144A | | 6/29 at 103.00 | | | 1,722,673 | |
| | | | | | Total Arizona | | | | | 46,165,324 | |
| | | | |
| | | | | | Arkansas - 0.7% (0.4% of Total Investments) | | | | | | |
| | | | |
| | 1,750 | | | | | Arkansas Development Finance Authority, Arkansas, Environmental Improvement Revenue Bonds, United States Steel Corporation, Green Series 2022, 5.450%, 9/01/52, (AMT), 144A | | 9/25 at 105.00 | | | 1,542,708 | |
| | | | |
| | 4,000 | | | | | Arkansas Development Finance Authority, Industrial Development Revenue Bonds, Big River Steel Project, Series 2019, 4.500%, 9/01/49, (AMT), 144A | | 9/26 at 103.00 | | | 3,552,299 | |
116
| | | | | | | | | | | | |
Principal Amount (000) | | | | | Description (a) | | Optional Call Provisions (b) | | Value | |
| | | | |
| | | | | | Arkansas (continued) | | | | | | |
| | $ 2,500 | | | | | Arkansas Development Finance Authority, Industrial Development Revenue Bonds, Big River Steel Project, Series 2020A, 4.750%, 9/01/49, (AMT), 144A | | 9/27 at 103.00 | | $ | 2,307,567 | |
| | | | | | Total Arkansas | | | | | 7,402,574 | |
| | | | |
| | | | | | California - 14.1% (8.3% of Total Investments) | | | | | | |
| | | | |
| | 16,390 | | | | | Alameda Corridor Transportation Authority, California, Revenue Bonds, Refunding Second Subordinate Lien Series 2022C, 1.000%, 10/01/52 - AGM Insured | | 10/37 at 100.00 | | | 7,728,882 | |
| | | | |
| | | | | | Alameda Corridor Transportation Authority, California, Revenue Bonds, Refunding Senior Lien Series 2022B: | | | | | | |
| | 4,000 | | | | | 5.300%, 10/01/47 | | 10/37 at 100.00 | | | 1,857,449 | |
| | 18,905 | | | | | 5.350%, 10/01/48 | | 10/37 at 100.00 | | | 8,762,309 | |
| | 4,585 | | | | | 5.375%, 10/01/49 | | 10/37 at 100.00 | | | 2,123,918 | |
| | 3,055 | | | | | 5.400%, 10/01/50 | | 10/37 at 100.00 | | | 1,412,807 | |
| | | | |
| | 3,000 | | | | | California Community Housing Agency, California, Essential Housing Revenue Bonds, Creekwood, Series 2021A, 4.000%, 2/01/56, 144A | | 8/31 at 100.00 | | | 1,726,765 | |
| | | | |
| | 2,000 | | | | | California Community Housing Agency, California, Essential Housing Revenue Bonds, Exchange at Bayfront Apartments, Junior Series 2021A-2, 4.000%, 8/01/51, 144A | | 8/32 at 100.00 | | | 1,179,714 | |
| | | | |
| | 1,000 | | | | | California Community Housing Agency, California, Essential Housing Revenue Bonds, Glendale Properties, Junior Series 2021A-2, 4.000%, 8/01/47, 144A | | 8/31 at 100.00 | | | 710,836 | |
| | | | |
| | 3,000 | | | | | California Community Housing Agency, California, Essential Housing Revenue Bonds, Mira Vista Hills Apartments, Series 2021A, 4.000%, 2/01/56, 144A | | 8/31 at 100.00 | | | 1,877,607 | |
| | | | |
| | 1,000 | | | | | California Community Housing Agency, California, Essential Housing Revenue Bonds, Serenity at Larkspur Apartments, Series 2020A, 5.000%, 2/01/50, 144A | | 2/30 at 100.00 | | | 744,877 | |
| | | | |
| | 5,000 | | | | | California Community Housing Agency, California, Essential Housing Revenue Bonds, Stoneridge Apartments, Series 2021A, 4.000%, 2/01/56, 144A | | 2/31 at 100.00 | | | 3,335,699 | |
| | | | |
| | 3,590 | | | | | California Community Housing Agency, California, Essential Housing Revenue Bonds, Summit at Sausalito Apartments, Series 2021A-2, 4.000%, 2/01/50, 144A | | 8/32 at 100.00 | | | 2,429,357 | |
| | | | |
| | 500 | | | | | California Enterprise Development Authority, Charter School Revenue Bonds, Norton Science & Language Academy Project, Series 2021, 4.000%, 7/01/61, 144A | | 7/27 at 100.00 | | | 306,592 | |
| | | | |
| | 2,230 | | | | | California Enterprise Development Authority, Charter School Revenue Bonds, Norton Science and Language Academy Project, Series 2020, 6.250%, 7/01/58, 144A | | 7/27 at 102.00 | | | 2,069,917 | |
| | | | |
| | 10,450 | | | (d) | | California Health Facilities Financing Authority, Revenue Bonds, Cedars- Sinai Health System, Series 2021A, 4.000%, 8/15/48 | | 8/31 at 100.00 | | | 9,017,706 | |
| | | | |
| | 5,000 | | | | | California Health Facilities Financing Authority, Revenue Bonds, Kaiser Permanente System, Series 2017A-2, 4.000%, 11/01/44, (UB) | | 11/27 at 100.00 | | | 4,486,654 | |
| | | | |
| | 1,020 | | | | | California Municipal Finance Authority, Mobile Home Park Revenue Bonds, Caritas Affordable Housing Inc Projects, Series 2014B, 5.875%, 8/15/49 | | 8/24 at 100.00 | | | 968,707 | |
| | | | |
| | 500 | | | | | California Municipal Finance Authority, Revenue Bonds, California Baptist University, Series 2016A, 5.000%, 11/01/36, 144A | | 11/26 at 100.00 | | | 469,483 | |
| | | | |
| | 10,925 | | | (d) | | California Municipal Finance Authority, Revenue Bonds, Linxs APM Project, Senior Lien Series 2018A, 4.000%, 12/31/47, (AMT), (UB) | | 6/28 at 100.00 | | | 8,592,689 | |
117
| | |
| NMZ | | Nuveen Municipal High Income Opportunity Fund (continued) |
| | Portfolio of Investments October 31, 2023 |
| | | | | | | | | | | | |
Principal Amount (000) | | | | | Description (a) | | Optional Call Provisions (b) | | Value | |
| | | | |
| | | | | | California (continued) | | | | | | |
| | $ 2,165 | | | | | California Municipal Finance Authority, Special Tax Revenue Bonds, Community Facilities District 2020-6, County of Placer-PV400, Series 2022, 5.250%, 9/01/52 | | 9/29 at 103.00 | | $ | 1,949,036 | |
| | | | |
| | 1,130 | | | | | California Municipal Financing Authority, Certificates of Participation, Palomar Health, Series 2022A, 5.250%, 11/01/52 - AGM Insured | | 11/32 at 100.00 | | | 1,145,414 | |
| | | | |
| | 400 | | | (c) | | California Pollution Contol Financing Authority, Solid Waste Disposal Revenue Bonds, Aemerge Redpak Services Southern California, LLC Project, Subordinate Series 2017, 8.000%, 12/01/27, (AMT), 144A | | No Opt. Call | | | 24,000 | |
| | | | |
| | 1,000 | | | | | California Public Finance Authority, Charter School Lease Revenue Bonds, California Crosspoint Academy Project, Series 2020A, 5.125%, 7/01/55, 144A | | 7/28 at 100.00 | | | 724,200 | |
| | | | |
| | 1,000 | | | | | California School Finance Authority, California, Charter School Revenue Bonds, Alta Public Schools - Obligated Group, Series 2020A, 6.000%, 6/01/59, 144A | | 6/28 at 102.00 | | | 870,587 | |
| | | | |
| | 1,000 | | | | | California School Finance Authority, California, Charter School Revenue Bonds, Girls Athletic Leadership School Los Angeles Project, Series 2021A, 4.000%, 6/01/61, 144A | | 6/31 at 100.00 | | | 608,061 | |
| | | | |
| | 1,000 | | | | | California School Finance Authority, Charter School Revenue Bonds, Arts in Action Charter Schools - Obligated Group, Series 2020A, 5.000%, 6/01/40, 144A | | 6/27 at 100.00 | | | 720,530 | |
| | | | |
| | 4,000 | | | | | California School Finance Authority, Charter School Revenue Bonds, Russell Westbrook Academy Obligated Group, Series 2021A, 4.000%, 6/01/61, 144A | | 6/27 at 100.00 | | | 2,446,441 | |
| | | | |
| | 1,000 | | | | | California School Finance Authority, Charter School Revenue Bonds, Scholarship Prep Public Schools Obligated Group, Series 2020A, 5.000%, 6/01/60, 144A | | 6/28 at 100.00 | | | 674,008 | |
| | | | |
| | | | | | California Statewide Communities Development Authority, California, Revenue Bonds, Loma Linda University Medical Center, Series 2014A: | | | | | | |
| | 800 | | | | | 5.250%, 12/01/44 | | 12/24 at 100.00 | | | 744,070 | |
| | 1,000 | | | | | 5.500%, 12/01/54 | | 12/24 at 100.00 | | | 952,635 | |
| | | | |
| | 6,940 | | | | | California Statewide Communities Development Authority, California, Revenue Bonds, Loma Linda University Medical Center, Series 2016A, 5.250%, 12/01/56, 144A | | 6/26 at 100.00 | | | 6,148,434 | |
| | | | |
| | 500 | | | | | California Statewide Communities Development Authority, Revenue Bonds, Lancer Educational Student Housing Project, Refunding Series 2016A, 5.000%, 6/01/46, 144A | | 6/26 at 100.00 | | | 418,536 | |
| | | | |
| | 765 | | | | | California Statewide Communities Development Authority, Statewide Community Infrastructure Program Revenue Bonds, Series 2011A, 8.000%, 9/02/41 | | 11/23 at 100.00 | | | 678,020 | |
| | | | |
| | 995 | | | | | California Statewide Communities Development Authority, Statewide Community Infrastructure Program Revenue Bonds, Series 2021A, 4.000%, 9/02/51 | | 9/31 at 100.00 | | | 689,562 | |
| | | | |
| | 16 | | | (c),(e) | | California Statewide Community Development Authority, Revenue Bonds, Daughters of Charity Health System, Series 2005A, 5.500%, 7/01/39 | | 1/22 at 100.00 | | | 16,491 | |
| | | | |
| | 1,300 | | | | | CMFA Special Finance Agency I, California, Essential Housing Revenue Bonds, The Mix at Center City, Subordinate Series 2021B, 8.000%, 4/01/56, 144A | | 4/31 at 100.00 | | | 939,853 | |
| | | | |
| | 1,750 | | | | | CMFA Special Finance Agency VII, California, Essential Housing Revenue Bonds, Senior Lien Series 2021A-1, 3.000%, 8/01/56, 144A | | 8/31 at 100.00 | | | 1,049,000 | |
| | | | |
| | 2,000 | | | | | CMFA Special Finance Agency, California, Essential Housing Revenue Bonds, Latitude 33, Senior Series 2021A-2, 4.000%, 12/01/45, 144A | | 12/31 at 100.00 | | | 1,436,531 | |
| | | | |
| | 300 | | | | | Corona, California, Special Tax Bonds, Community Facilities District 2018- 2 Sierra Bella, Series 2022A, 5.000%, 9/01/42 | | 9/29 at 103.00 | | | 290,990 | |
118
| | | | | | | | | | | | |
Principal Amount (000) | | | | | Description (a) | | Optional Call Provisions (b) | | Value | |
| | | | |
| | | | | | California (continued) | | | | | | |
| | $ 1,000 | | | | | CSCDA Community Improvement Authority, California, Essential Housing Revenue Bonds, Acacia on Santa Rosa Creek, Mezzanine Lien Series 2021B, 4.000%, 10/01/46, 144A | | 10/31 at 100.00 | | $ | 689,565 | |
| | | | |
| | 25,385 | | | | | CSCDA Community Improvement Authority, California, Essential Housing Revenue Bonds, Altana Glendale, Series 2021A-2, 4.000%, 10/01/56, 144A | | 10/31 at 100.00 | | | 17,036,056 | |
| | | | |
| | 2,000 | | | | | CSCDA Community Improvement Authority, California, Essential Housing Revenue Bonds, Dublin Mezzanine Lien Series 2021B, 4.000%, 2/01/57, 144A | | 2/32 at 100.00 | | | 1,283,971 | |
| | | | |
| | 1,095 | | | | | CSCDA Community Improvement Authority, California, Essential Housing Revenue Bonds, Moda at Monrovia Station, Social Series 2021A-1, 3.400%, 10/01/46, 144A | | 10/31 at 100.00 | | | 768,441 | |
| | | | |
| | 1,000 | | | | | CSCDA Community Improvement Authority, California, Essential Housing Revenue Bonds, Moda at Monrovia Station, Social Series 2021A-2, 4.000%, 10/01/56, 144A | | 10/31 at 100.00 | | | 651,534 | |
| | | | |
| | 2,000 | | | | | CSCDA Community Improvement Authority, California, Essential Housing Revenue Bonds, Monterrey Station Apartments, Series 2021B, 4.000%, 7/01/58, 144A | | 7/32 at 100.00 | | | 1,219,896 | |
| | | | |
| | 4,250 | | | | | CSCDA Community Improvement Authority, California, Essential Housing Revenue Bonds, Pasadena Portfolio Social Bond, Mezzanine Senior Series 2021B, 4.000%, 12/01/56, 144A | | 12/31 at 100.00 | | | 2,726,738 | |
| | | | |
| | 2,000 | | | | | CSCDA Community Improvement Authority, California, Essential Housing Revenue Bonds, Westgate Phase 1-Pasadena Apartments, Mezzanine Lien Series 2021B, 4.000%, 6/01/57, 144A | | 6/31 at 100.00 | | | 1,182,089 | |
| | | | |
| | 535 | | | | | CSCDA Community Improvement Authority, California, Essential Housing Revenue Bonds, Westgate Phase 1-Pasadena Apartments, Senior Lien Series 2021A-2, 3.125%, 6/01/57, 144A | | 6/31 at 100.00 | | | 304,769 | |
| | | | |
| | 5,000 | | | | | CSCDA Community Improvement Authority, California, Essential Housing Revenue Bonds, Wood Creek Apartments, Mezzanine Lien Series 2021A-2, 4.000%, 12/01/58 | | 6/32 at 100.00 | | | 3,340,597 | |
| | | | |
| | 2,145 | | | | | CSCDA Community Improvement Authority, California, Essential Housing Revenue Bonds, Wood Creek Apartments, Mezzanine Lien Series 2021B, 4.000%, 12/01/59 | | 6/32 at 100.00 | | | 1,234,391 | |
| | | | |
| | 3,430 | | | | | CSCDA Community Improvement Authority, California, Essential Housing Revenue Bonds, Wood Creek Apartments, Senior Lien Series 2021A-1, 3.000%, 12/01/49 | | 6/32 at 100.00 | | | 2,044,263 | |
| | | | |
| | 1,720 | | | | | Daly City Housing Development Finance Agency, California, Mobile Home Park Revenue Bonds, Franciscan Mobile Home Park Project, Refunding Third Tier Series 2007C, 6.500%, 12/15/47 | | 12/23 at 100.00 | | | 1,555,783 | |
| | | | |
| | 2,000 | | | | | Daly City Housing Development Finance Agency, California, Mobile Home Park Revenue Bonds, Franciscan Mobile Home Park, Refunding Series 2007A, 5.000%, 12/15/37 | | 12/23 at 100.00 | | | 2,000,257 | |
| | | | |
| | 77,855 | | | | | Golden State Tobacco Securitization Corporation, California, Tobacco Settlement Asset-Backed Bonds, Capital Appreciation Series 2021B-2, 0.000%, 6/01/66 | | 12/31 at 27.75 | | | 6,385,846 | |
| | | | |
| | 390 | | | | | Lee Lake Public Financing Authority, California, Junior Lien Revenue Bonds, Series 2013B, 5.250%, 9/01/32 | | 12/23 at 100.00 | | | 390,175 | |
| | | | |
| | 1,000 | | | | | Los Angeles County Community Facilities District 2021-01, California, Special Tax Bond, Valencia-Facilities Improvement Area 1, Series 2022, 5.000%, 9/01/52 | | 9/29 at 103.00 | | | 896,303 | |
| | | | |
| | 535 | | | | | Menifee Union School District, Riverside County, California, Special Tax Bonds, Community Facilities District 2011-1, Improvement Area 6, Series 2021, 4.000%, 9/01/50 | | 9/28 at 103.00 | | | 408,055 | |
119
| | |
| NMZ | | Nuveen Municipal High Income Opportunity Fund (continued) |
| | Portfolio of Investments October 31, 2023 |
| | | | | | | | | | | | |
Principal Amount (000) | | | | | Description (a) | | Optional Call Provisions (b) | | Value | |
| | | | |
| | | | | | California (continued) | | | | | | |
| | | | | | Sacramento City Financing Authority California, Lease Revenue Bonds, Master Lease Program Facilities Projects, Tender Option Bond Trust 2016-XG0100: | | | | | | |
| | $ 750 | | | (d) | | 7.103%, 12/01/30 - AMBAC Insured, 144A, (IF) | | No Opt. Call | | $ | 973,770 | |
| | 2,015 | | | (d) | | 7.427%, 12/01/33 - AMBAC Insured, 144A, (IF) | | No Opt. Call | | | 2,878,781 | |
| | | | |
| | 10,000 | | | (d) | | San Francisco Airports Commission, California, Revenue Bonds, San Francisco International Airport, Second Series 2018D, 5.000%, 5/01/43, (AMT), (UB) | | 5/28 at 100.00 | | | 9,694,696 | |
| | | | |
| | 4,095 | | | | | San Francisco City and County Redevelopment Agency Successor Agency, California, Tax Allocation Bonds, Mission Bay South Redevelopment Project, Subordinate Series 2016D, 0.000%, 8/01/31, 144A | | 12/23 at 69.12 | | | 2,800,353 | |
| | | | |
| | 1,055 | | | | | Temecula Public Financing Authority, California, Special Tax Bonds, Community Facilities District 16-01, Series 2017, 6.250%, 9/01/47, 144A | | 9/27 at 100.00 | | | 1,070,406 | |
| | | | |
| | 5,000 | | | (d) | | University of California Regents, Medical Center Pooled Revenue Bonds, Series 2022P, 4.000%, 5/15/53, (UB) | | 5/32 at 100.00 | | | 4,248,918 | |
| | | | | | Total California | | | | | 148,114,020 | |
| | | | |
| | | | | | Colorado - 14.7% (8.6% of Total Investments) | | | | | | |
| | | | |
| | 856 | | | | | Antelope Heights Metropolitan District, Colorado, Limited Tax General Obligation Bonds, Junior Lien Series Series 2021B, 5.500%, 12/15/37 | | 9/26 at 103.00 | | | 719,248 | |
| | | | |
| | 1,089 | | | | | Aspen Street Metropolitan District, Broomfield County and City, Colorado, Limited Tax General Obligation Bonds, Series 2021A-3, 5.125%, 12/01/50 | | 6/26 at 103.00 | | | 798,630 | |
| | | | |
| | 12,000 | | | | | Aurora Highlands Community Authority Board, Adams County, Colorado, Special Tax Revenue Bonds, Refunding & Improvement Series 2021A, 5.750%, 12/01/51 | | 12/28 at 103.00 | | | 9,936,902 | |
| | | | |
| | 500 | | | | | Aviation Station North Metropolitan District 2, Denver County, Colorado, Limited Tax General Obligation Bonds, Subordinate Series 2019B, 7.750%, 12/15/48 | | 9/24 at 103.00 | | | 430,181 | |
| | | | |
| | 1,500 | | | | | Belford North Metropolitan District, Douglas County, Colorado, General Obligation Limited Tax Bonds, Series 2020A, 5.500%, 12/01/50 | | 12/25 at 103.00 | | | 1,227,487 | |
| | | | |
| | 1,000 | | | | | Bennett Ranch Metropolitan District 1, Adams County, Colorado, General Obligation Limited Tax Bonds, Convertible to Unlimited Tax Series 2021A, 5.000%, 12/01/51 | | 3/26 at 103.00 | | | 781,914 | |
| | | | |
| | 500 | | | | | Berthoud-Heritage Metropolitan District 10, Larimer County, Colorado, Limited Tax General Obligation Bonds, Senior Series 2022A, 4.750%, 12/01/52 | | 12/26 at 103.00 | | | 365,844 | |
| | | | |
| | 2,000 | | | | | Bradley Heights Metropolitan District 2, Colorado Springs, El Paso County, Colorado, General Obligation Limited Tax Bonds, Series 2021A-3, 4.750%, 12/01/51 | | 9/26 at 103.00 | | | 1,366,090 | |
| | | | |
| | 1,000 | | | | | Broadway Station Metropolitan District 3, Denver City and County, Colorado, General Obligation Limited Tax Bonds, Convertible to Unlimited Series 2019A, 5.000%, 12/01/49 | | 6/24 at 103.00 | | | 710,202 | |
| | | | |
| | 3,000 | | | | | Canyons Metropolitan District 5, Douglas County, Colorado, Limited Tax General Obligation and Special Revenue Bonds, Junior Subordinate Series 2016, 7.000%, 12/15/57 | | 12/23 at 100.00 | | | 1,928,134 | |
| | | | |
| | 500 | | | | | Centerra Metropolitan District 1, Loveland, Colorado, Special Revenue Improvement Bonds, Series 2022, 6.500%, 12/01/53 | | 12/27 at 103.00 | | | 466,983 | |
| | | | |
| | 460 | | | | | Cherry Creek Corporate Center Metropolitan District, Arapahoe County, Colorado, Revenue Bonds, Refunding Subordinate Lien Series 2016B, 8.000%, 6/15/37 | | 12/23 at 102.00 | | | 417,716 | |
| | | | |
| | 600 | | | | | Clear Creek Transit Metropolitan District 2, Adams County, Colorado, Revenue Supported Limited Tax General Obligation Bonds, Series 2021A, 5.000%, 12/01/41 | | 12/26 at 103.00 | | | 507,790 | |
120
| | | | | | | | | | | | |
Principal Amount (000) | | | | | Description (a) | | Optional Call Provisions (b) | | Value | |
| | | | |
| | | | | | Colorado (continued) | | | | | | |
| | | | |
| | $ 500 | | | | | Colorado Educational and Cultural Facilities Authority, Charter School Revenue Bonds, Community Leadership Academy Project, Series 2008, 6.250%, 7/01/28 | | 12/23 at 100.00 | | $ | 500,210 | |
| | | | |
| | | | | | Colorado Educational and Cultural Facilities Authority, Charter School Revenue Bonds, New Summit Charter Academy Project, Series 2021A: | | | | | | |
| | 100 | | | | | 4.000%, 7/01/41, 144A | | 7/31 at 100.00 | | | 76,399 | |
| | 100 | | | | | 4.000%, 7/01/51, 144A | | 7/31 at 100.00 | | | 67,989 | |
| | | | |
| | 560 | | | | | Colorado Educational and Cultural Facilities Authority, Charter School Revenue Bonds, Skyview Academy Project, Series 2014, 5.375%, 7/01/44, 144A | | 7/24 at 100.00 | | | 512,622 | |
| | | | |
| | 720 | | | | | Colorado Educational and Cultural Facilities Authority, Revenue Bonds, Global Village Academy - Northglenn Project, Series 2020, 5.000%, 12/01/55, 144A | | 12/30 at 100.00 | | | 539,782 | |
| | | | |
| | 2,500 | | | | | Colorado Health Facilities Authority, Colorado, Revenue Bonds, American Baptist Homes of the Midwest Obligated Group, Series 2013, 8.000%, 8/01/43 | | 2/24 at 100.00 | | | 2,362,643 | |
| | | | |
| | 1,000 | | | | | Colorado Health Facilities Authority, Colorado, Revenue Bonds, American Baptist Homes Project, Series 2016, 6.125%, 2/01/46, 144A | | 2/26 at 100.00 | | | 791,691 | |
| | | | |
| | 3,144 | | | | | Colorado International Center Metropolitan District 8, Adams County, Colorado, Limited Tax General Obligation Bonds, Series 2020, 6.500%, 12/01/50 | | 9/25 at 103.00 | | | 2,656,696 | |
| | | | |
| | 500 | | | | | Conestoga Metropolitan District 2, Ault, Weld County, Colorado, Limited Tax General Obligation Bonds, Refunding & Improvement Series 2021A-3, 5.250%, 12/01/51 | | 9/26 at 103.00 | | | 402,204 | |
| | | | |
| | 500 | | | | | Copperleaf Metropolitan District 3, Arapahoe County, Colorado, Limited Tax General Obligation Bonds, Subordinate Series 2021B, 5.500%, 12/15/36 | | 9/26 at 103.00 | | | 421,470 | |
| | | | |
| | 750 | | | | | Copperleaf Metropolitan District 4, Arapahoe County, Colorado, Limited Tax General Obligation Bonds, Convertible to Unlimited Tax Series 2020A, 5.000%, 12/01/49 | | 3/25 at 103.00 | | | 616,915 | |
| | | | |
| | 1,000 | | | | | Crowfoot Valley Ranch Metropolitan District No. 2, Douglas County, Colorado, Limited Tax General Obligation Bonds, Series 2018A, 5.625%, 12/01/38 | | 12/23 at 103.00 | | | 940,331 | |
| | | | |
| | 656 | | | | | Dacono Urban Renewal Authority, Weld County, Colorado, Tax Increment Revenue Bonds, Series 2020, 6.250%, 12/01/39 | | 12/25 at 103.00 | | | 581,835 | |
| | | | |
| | 5,000 | | | (d) | | Denver City and County, Colorado, Airport System Revenue Bonds, Subordinate Lien Series 2018A, 5.250%, 12/01/48, (AMT), (UB) | | 12/28 at 100.00 | | | 4,883,961 | |
| | | | |
| | 465 | | | | | Dinosaur Ridge Metropolitan District, Golden, Jefferson County, Colorado, Special Revenue Refunding and Improvement Bonds, Series 2019A, 5.000%, 6/01/49 | | 6/24 at 103.00 | | | 385,077 | |
| | | | |
| | 1,030 | | | | | E-86 Metropolitan District, Elizabeth, Elbert County, Colorado, General Obligation Limited Tax Cash Flow Bonds, Series 2021A-3, 5.125%, 12/01/51 | | 6/26 at 103.00 | | | 774,567 | |
| | | | |
| | 2,000 | | | | | Elbert and Highway 86 Commercial Metropolitan District, Elbert County, Colorado, Special Revenue and Tax Supported Bonds, Refunding & Improvement Senior Series 2021A, 5.000%, 12/01/51, 144A | | 6/26 at 103.00 | | | 1,525,217 | |
| | | | |
| | 1,000 | | | | | Erie Urban Renewal Authority, Colorado, Tax Increment Revenue Bonds, Series 2021, 4.000%, 12/01/38 | | 9/26 at 103.00 | | | 763,528 | |
| | | | |
| | 4,150 | | | | | Falcon Area Water and Wastewater Authority (El Paso County, Colorado), Tap Fee Revenue Bonds, Series 2022A, 6.750%, 12/01/34, 144A | | 9/27 at 103.00 | | | 3,852,553 | |
121
| | |
| NMZ | | Nuveen Municipal High Income Opportunity Fund (continued) |
| | Portfolio of Investments October 31, 2023 |
| | | | | | | | | | | | |
Principal Amount (000) | | | | | Description (a) | | Optional Call Provisions (b) | | Value | |
| | | | |
| | | | | | Colorado (continued) | | | | | | |
| | | | | | Foothills Metropolitan District, Fort Collins, Colorado, Special Revenue Bonds, Series 2014: | | | | | | |
| | $ 1,000 | | | | | 5.750%, 12/01/30 | | 12/24 at 100.00 | | $ | 943,303 | |
| | 2,080 | | | | | 6.000%, 12/01/38 | | 12/24 at 100.00 | | | 1,828,163 | |
| | | | |
| | 1,000 | | | | | Four Corners Business Improvement District, Erie, Boulder County, Colorado, Limited Tax Supported Revenue Bonds, Series 2022, 6.000%, 12/01/52 | | 9/27 at 103.00 | | | 840,318 | |
| | | | |
| | | | | | Fourth North Business Improvement District, Silverthorne, Summit County, Colorado, Special Revenue and Tax Supported Bonds, Refunding & Improvement Senior Series 2022A: | | | | | | |
| | 8,380 | | | | | 5.500%, 12/01/42 | | 12/30 at 102.00 | | | 7,623,926 | |
| | 1,000 | | | | | 5.750%, 12/01/52 | | 12/30 at 102.00 | | | 887,123 | |
| | | | |
| | 2,260 | | | | | Fourth North Business Improvement District, Silverthorne, Summit County, Colorado, Special Revenue and Tax Supported Bonds, Subordinate Series 2022B, 8.125%, 12/15/52 | | 12/30 at 102.00 | | | 2,095,826 | |
| | | | |
| | | | | | Future Legends Sports Park Business Improvement District, Colorado, Limited Tax General Obligation Bonds, Series 2022A and Subordinate Limited Tax General Obligation Bonds, Series 2022B: | | | | | | |
| | 3,000 | | | | | 6.000%, 12/01/52 | | 9/27 at 103.00 | | | 2,662,910 | |
| | 1,000 | | | | | 8.500%, 12/15/52 | | 9/27 at 103.00 | | | 916,340 | |
| | | | |
| | 3,000 | | | | | Future Legends Sports Park Metropolitan District 2, Colorado, Limited Tax General Obligation Bonds, Series 2020A, 5.500%, 6/01/50, 144A | | 6/25 at 103.00 | | | 2,363,422 | |
| | | | |
| | 500 | | | | | Glen Metropolitan District 3, El Paso County, Colorado, General Obligation Limited Tax Bonds, Series 2021, 4.250%, 12/01/51, 144A | | 12/26 at 103.00 | | | 333,563 | |
| | | | |
| | | | | | Grand Junction Dos Rios General Improvement District, Grand Junction, Mesa County, Colorado, Special Revenue Bonds, Series 2021: | | | | | | |
| | 500 | | | | | 4.500%, 12/01/41 | | 12/26 at 103.00 | | | 376,227 | |
| | 500 | | | | | 4.750%, 12/01/51 | | 12/26 at 103.00 | | | 351,024 | |
| | | | |
| | | | | | Grandview Reserve Metropolitan District, El Paso County, Colorado, Limited Tax General Obligation Senior Bonds, Series 2022A and Limited Tax General Obligation Subordinate Bonds, Series 2022B(3): | | | | | | |
| | 750 | | | | | 6.250%, 12/01/52 | | 9/27 at 103.00 | | | 649,063 | |
| | 1,000 | | | | | 9.000%, 12/15/52 | | 9/27 at 103.00 | | | 904,057 | |
| | | | |
| | 2,000 | | | | | Heritage Todd Creek Metropolitan District, Colorado, General Obligation Bonds Limited Tax, Refunding & Improvement Series 2015, 6.125%, 12/01/44 | | 12/24 at 100.00 | | | 1,894,717 | |
| | | | |
| | 540 | | | | | Highlands Metropolitan District 1, Broomfield City and County, colorado, Limited Tax General Obligation Bonds, Convertible to Unlimited Tax Series 2021, 5.000%, 12/01/41 | | 3/26 at 103.00 | | | 434,363 | |
| | | | |
| | 810 | | | | | Jefferson Center Metropolitan District 1, Arvada, Jefferson County, Colorado, Special Revenue Bonds, Subordinate Series 2020B, 5.750%, 12/15/50 | | 12/23 at 103.00 | | | 715,320 | |
| | | | |
| | 1,000 | | | | | Johnstown Village Metropolitan District 2, Weld County, own of Johnstown, Colorado, General Obligation Limited Tax Bonds, Series 2020A, 5.000%, 12/01/50 | | 9/25 at 103.00 | | | 798,234 | |
| | | | |
| | 1,700 | | | | | Jones District Community Authority Board, Centennial, Colorado, Special Revenue Convertible Capital Appreciaiton Bonds, Series 2020A, 5.750%, 12/01/50 | | 12/25 at 103.00 | | | 1,329,354 | |
| | | | |
| | 1,000 | | | | | Kinston Metropolitan District 5, Loveland, Larimer County, Colorado, Limited Tax General Obligation Bonds, Series 2020A, 5.125%, 12/01/50 | | 12/25 at 103.00 | | | 733,642 | |
| | | | |
| | 500 | | | | | Lanterns Metropolitan District 1, Castle Rock, Douglas County, Colorado, Limited Tax General Obligation Bonds, Series 2019A, 5.000%, 12/01/49 | | 9/24 at 103.00 | | | 422,319 | |
122
| | | | | | | | | | | | |
Principal Amount (000) | | | | | Description (a) | | Optional Call Provisions (b) | | Value | |
| | | | |
| | | | | | Colorado (continued) | | | | | | |
| | $ 500 | | | | | Lanterns Metropolitan District 2, Castle Rock, Douglas County, Colorado, Limited Tax General Obligation Bonds, Series 2021A-3, 4.500%, 12/01/50 | | 9/26 at 103.00 | | $ | 331,877 | |
| | | | |
| | 5,000 | | | | | Ledge Rock Center Commercial Metropolitan District (In the Town of Johnstown, Weld County, Colorado), Limited Tax General Obligation Bonds, Series 2022, 7.375%, 11/01/52, 144A | | 11/29 at 103.00 | | | 4,599,801 | |
| | | | |
| | | | | | Mayberry Community Authority, Colorado Springs, El Paso County, Colorado, Special Revenue Bonds, Series 2021A: | | | | | | |
| | 500 | | | | | 5.000%, 12/01/41 | | 6/26 at 103.00 | | | 422,892 | |
| | 500 | | | | | 5.000%, 4/15/51 | | 6/26 at 103.00 | | | 390,275 | |
| | | | |
| | 1,000 | | | | | Meadowbrook Heights Metropolitan District, Jefferson County, Colorado, General Obligation Limited Tax Bonds, Series 2021A(3), 4.875%, 12/01/51 | | 9/26 at 103.00 | | | 716,183 | |
| | | | |
| | 2,000 | | | (c) | | Murphy Creek Metropolitan District 3, Aurora, Colorado, General Obligation Bonds, Refunding & Improvement Series 2006, 6.125%, 12/01/35 | | 12/23 at 100.00 | | | 2,000,000 | |
| | | | |
| | 500 | | | | | Murphy Creek Metropolitan District 5 (In the City of Aurora, Arapahoe County, Colorado), General Obligation Limited Tax Bonds, Series 2022A and Subordinate General Obligation Limited Tax Bonds, Series 2022B(3), 6.000%, 12/01/52 | | 9/27 at 103.00 | | | 445,191 | |
| | | | |
| | 500 | | | | | North Pine Vistas Metropolitan District 3, Castle Pines, Douglas County, Colorado, Limited Tax General Obligation Bonds, Subordinate Series 2021B, 4.625%, 12/15/51 - AGM Insured | | 12/26 at 103.00 | | | 384,634 | |
| | | | |
| | 1,000 | | | | | North Range Metropolitan District 3, Adams County, Colorado, Limited Tax General Obligation Bonds, Series 2020A-3, 5.250%, 12/01/50 | | 12/25 at 103.00 | | | 829,542 | |
| | | | |
| | 1,535 | | | | | North Vista Highlands Metropolitan District 3, Pueblo County, Colorado, Limited Tax General Obligation Bonds, Series 2020, 5.125%, 12/01/49 | | 3/25 at 103.00 | | | 1,283,175 | |
| | | | |
| | 1,000 | | | | | Northfield Metropolitan District 2, Fort Collins, Larimer County, Colorado, Limited Tax General Obligation Bonds, Series 2020A, 5.000%, 12/01/50 | | 12/25 at 103.00 | | | 792,680 | |
| | | | |
| | 1,500 | | | | | Overlook Park Metropolitan District, Routt County, Colorado, General Obligation Bonds, Limited Tax Senior Series 2023A, 7.250%, 12/01/53 | | 6/28 at 103.00 | | | 1,382,033 | |
| | | | |
| | 6,555 | | | | | Painted Prairie Public Improvement Authority, Aurora, Colorado, Special Revenue Bonds, Series 2019, 5.000%, 12/01/49 | | 12/24 at 103.00 | | | 5,362,457 | |
| | | | |
| | 500 | | | | | Palisade Park West Metropolitan District, Broomfield County, Colorado, Limited Tax General Obligation Bonds, Convertible to Unlimited Tax, Series 2019A, 5.125%, 12/01/49 | | 6/24 at 103.00 | | | 420,736 | |
| | | | |
| | 500 | | | | | Parkdale Community Authority, Erie, Colorado, Limited Tax Supported Revenue Bonds, District 1, Series 2020A, 5.250%, 12/01/50 | | 9/25 at 103.00 | | | 408,859 | |
| | | | |
| | | | | | Peak Metropolitan District 1, Colorado Springs, El Paso County, Colorado, Limited Tax General Obligation Bonds, Series 2021A: | | | | | | |
| | 500 | | | | | 5.000%, 12/01/41, 144A | | 3/26 at 103.00 | | | 423,566 | |
| | 1,000 | | | | | 5.000%, 12/01/51, 144A | | 3/26 at 103.00 | | | 786,935 | |
| | | | |
| | 9,300 | | | | | Peak Metropolitan District 3, Colorado Springs, El Paso County, Colorado, Limited Tax General Obligation Convertible Capital Appreciation Bonds, Series 2022A-2, 8.000%, 12/01/52 | | 12/27 at 81.40 | | | 4,979,109 | |
| | | | |
| | 4,690 | | | | | Pioneer Community Authority Board (Weld County, Colorado), Special Revenue Bonds, Series 2022, 6.500%, 12/01/34 | | 6/29 at 103.00 | | | 4,194,171 | |
| | | | |
| | 500 | | | | | Prairie Corner Metropolitan District, Adams County, Colorado, Limited Tax General Obligation Bonds, Series 2021, 4.875%, 12/01/51, 144A | | 12/26 at 103.00 | | | 357,346 | |
| | | | |
| | 1,000 | | | | | Prairie Song Metropolitan District 4, Windsor, Colorado, Limited Tax General Obligation Bonds, Series 2021, 6.000%, 12/01/51, 144A | | 12/28 at 103.00 | | | 810,793 | |
| | | | |
| | 1,000 | | | | | Pueblo Urban Renewal Authority, Colorado, Tax Increment Revenue Bonds, EVRAZ Project, Series 2021A, 4.750%, 12/01/45, 144A | | 12/30 at 100.00 | | | 680,000 | |
123
| | |
| NMZ | | Nuveen Municipal High Income Opportunity Fund (continued) |
| | Portfolio of Investments October 31, 2023 |
| | | | | | | | | | | | |
Principal Amount (000) | | | | | Description (a) | | Optional Call Provisions (b) | | Value | |
| | | | |
| | | | | | Colorado (continued) | | | | | | |
| | | | |
| | $ 1,000 | | | | | Raindance Metropolitan District 1, Acting by and through its Water Activity Enterprise In the Town of Windsor, Weld County, Colorado, Non-Potable Water Enterprise Revenue Bonds, Series 2020, 5.250%, 12/01/50 | | 12/25 at 103.00 | | $ | 821,980 | |
| | | | |
| | 1,000 | | | | | Rampart Range Metropolitan District 5, Lone Tree, Douglas County, Colorado, Limited Tax Supported and Special Revenue Bonds, Series 2021, 4.000%, 12/01/51 | | 10/26 at 102.00 | | | 648,461 | |
| | | | |
| | 2,000 | | | | | Reagan Ranch Metropolitan District 1, Colorado Springs, Colorado, General Obligation Bonds, Limited Tax Series 2021-3, 5.375%, 12/01/51 | | 12/26 at 103.00 | | | 1,547,173 | |
| | | | |
| | 1,000 | | | | | Remuda Ranch Metropolitan District, Douglas County, Colorado, Limited Tax General Obligation Bonds, Series 2020A, 5.000%, 12/01/50 | | 12/25 at 103.00 | | | 807,839 | |
| | | | |
| | 736 | | | | | Reunion Metropolitan District, Acting By and Through its Water Activity Enterprise, Adams County, Colorado, Special Revenue Bonds, Series 2021, 3.625%, 12/01/44 | | 6/26 at 103.00 | | | 495,905 | |
| | | | |
| | 500 | | | | | Ritoro Metropolitan District In the Town of Elizabeth, Elbert County, Colorado, Limited Tax , Convertible to Unlimited Tax, General Obligation Bonds, Series 2019A, 5.000%, 12/01/49 | | 6/24 at 103.00 | | | 420,061 | |
| | | | |
| | 500 | | | | | Riverdale Ranch Metropolitan District, Thornton City, Adams County, Colorado, Limited Tax General Obligation Bonds, Convertible to Unlimited Tax Series 2019A, 5.000%, 12/01/49 | | 9/24 at 103.00 | | | 412,947 | |
| | | | |
| | 570 | | | | | Riverview Metropolitan District, Steamboat Springs, Routt County, Colorado, General Obligation Limited Tax Bonds, Convertible to Unlimited Tax Refunding Series 2021, 5.000%, 12/01/51 | | 6/26 at 103.00 | | | 444,687 | |
| | | | |
| | 1,000 | | | | | Riverwalk Metropolitan District 2, Glendale, Arapahoe County, Colorado, Special Revenue Bonds, Series 2022A, 5.000%, 12/01/52 | | 3/27 at 103.00 | | | 783,797 | |
| | | | |
| | 2,000 | | | | | RRC Metropolitan District 2, Jefferson County, Colorado, Limited Tax General Obligation Bonds, Series 2021, 5.250%, 12/01/51 | | 12/26 at 103.00 | | | 1,538,833 | |
| | | | |
| | 2,000 | | | | | Sagebrush Farm Metropolitan District 1, Aurora, Adams County, Colorado, General Obligation Limited Tax Bonds, Series 2022A, 6.750%, 12/01/52 | | 12/29 at 103.00 | | | 1,813,983 | |
| | | | |
| | | | | | Siena Lake Metropolitan District, Gypsum, Colorado, General Obligation Limited Tax Bonds, Series 2021: | | | | | | |
| | 2,515 | | | | | 3.750%, 12/01/41 | | 9/26 at 103.00 | | | 1,757,606 | |
| | 2,000 | | | | | 4.000%, 12/01/51 | | 9/26 at 103.00 | | | 1,339,257 | |
| | | | |
| | 1,025 | | | | | Silver Leaf Metropolitan District, Jefferson County, Colorado, General Obligation Limited Tax Bonds, Series 2021A-3, 5.250%, 12/01/50 | | 6/26 at 103.00 | | | 799,178 | |
| | | | |
| | 1,000 | | | | | South Aurora Regional Improvement Authority, Aurora, Colorado, Special Revenue Bonds, Series 2018, 6.250%, 12/01/57 | | 12/23 at 103.00 | | | 866,820 | |
| | | | |
| | 5,000 | | | | | Sterling Ranch Community Authority Board, Douglas County, Colorado, Limited Tax Supported and Special Revenue Bonds, Special District 3, Series 2022, 6.750%, 12/01/53 | | 12/27 at 103.00 | | | 4,868,013 | |
| | | | |
| | 2,790 | | | | | Sterling Ranch Metropolitan District 1, El Paso County, Colorado, General Obligation Limited Tax Bonds, Series 2020, 5.125%, 12/01/50 | | 12/25 at 103.00 | | | 2,270,763 | |
| | | | |
| | 3,000 | | | (c) | | Stone Ridge Metropolitan District 2, Colorado, General Obligation Bonds, Limited Tax Convertible to Unlimited, Series 2007, 7.250%, 12/01/31 | | 12/23 at 100.00 | | | 480,000 | |
| | | | |
| | 685 | | | | | Three Springs Metropolitan District 1, Durango, La Plata County, Colorado, Limited Tax General Obligation Bonds, Refunding Subordinate Series 2020B, 7.125%, 12/15/50 | | 12/25 at 103.00 | | | 572,066 | |
| | | | |
| | | | | | Transport Metropolitan District 3, In the City of Aurora, Adams County, Colorado, General Obligation Limited Bonds, Series 2021A-1: | | | | | | |
| | 1,000 | | | | | 5.000%, 12/01/41 | | 3/26 at 103.00 | | | 781,209 | |
| | 3,000 | | | | | 5.000%, 12/01/51 | | 3/26 at 103.00 | | | 2,175,283 | |
| | | | |
| | 1,000 | | | | | Tree Farm Metropolitan District, Eagle County, Colorado, General Obligation Limited Tax Bonds, Series 2021, 4.750%, 12/01/50, 144A | | 12/26 at 103.00 | | | 777,292 | |
124
| | | | | | | | | | | | |
Principal Amount (000) | | | | | Description (a) | | Optional Call Provisions (b) | | Value | |
| | | | |
| | | | | | Colorado (continued) | | | | | | |
| | $ 1,000 | | | | | Velocity Metropolitan District 3, In the City of Aurora, Colorado, Limited Tax General Obligation Bonds, Series 2019, 5.375%, 12/01/39 | | 12/23 at 103.00 | | $ | 924,643 | |
| | | | |
| | 1,500 | | | | | Velocity Metropolitan District 5, In the City of Aurora, Colorado, Limited Tax General Obligation Bonds, Convertible Capital Appreciation Series 2020A-2, 6.000%, 12/01/50 | | 12/23 at 81.31 | | | 1,008,624 | |
| | | | |
| | 1,570 | | | | | Velocity Metropolitan District 5, In the City of Aurora, Colorado, Limited Tax General Obligation Bonds, Series 2020A-1, 5.375%, 12/01/50 | | 12/23 at 103.00 | | | 1,316,655 | |
| | | | |
| | 1,000 | | | | | Verve Metropolitan District 1, Jefferson County and the City and County of Broomfield, Colorado, General Obligation Bonds, Refunding and Improvement Limited Tax Series 2021, 5.000%, 12/01/51 | | 3/26 at 103.00 | | | 681,994 | |
| | | | |
| | 500 | | | | | Village East Community Metropolitan District, Frederick, Weld County, Colorado, Limited Tax General Obligation Bonds, Series 2020A, 5.250%, 12/01/50 | | 9/25 at 103.00 | | | 412,070 | |
| | | | |
| | 1,100 | | | | | Village Metropolitan District In the Town of Avon, Eagle County, Colorado, Special Revenue and Limited Property Tax Bonds, Refunding & Improvement Series 2020, 5.000%, 12/01/40 | | 12/25 at 103.00 | | | 980,810 | |
| | | | |
| | 3,000 | | | | | Villages at Johnstown Metropolitan District 7, Johnstown, Colorado, Limited Tax General Obligation Bonds, Series 2022A(3), 6.250%, 12/01/52 | | 6/27 at 103.00 | | | 2,774,075 | |
| | | | |
| | 1,000 | | | | | Waterfront at Foster Lake Metropolitan District 2, Weld County, Colorado, Special Revenue Bonds, Series 2022, 4.625%, 12/01/28 | | No Opt. Call | | | 900,993 | |
| | | | |
| | 750 | | | | | Waterview II Metropolitan District, El Paso County, Colorado, Limited Tax General Obligation Bonds, Series 2022A, 5.000%, 12/01/41 | | 3/27 at 103.00 | | | 634,737 | |
| | | | |
| | 1,500 | | | | | West Globeville Metropolitan District 1, Denver, Colorado, General Obligation Limited Tax Bonds, Series 2022, 6.750%, 12/01/52 | | 12/29 at 103.00 | | | 1,296,909 | |
| | | | |
| | 1,000 | | | | | Westgate Metropolitan District, Colorado Springs, El Paso County, Colorado, General Obligation Limited Tax Bonds, Series 2022, 5.125%, 12/01/51 | | 3/27 at 103.00 | | | 779,557 | |
| | | | |
| | 2,000 | | | | | Westwood Metropolitan District, Thornton, Adams County, Colorado, Limited Tax General Obligation Bonds, Senior Series 2021A, 4.000%, 12/01/51, 144A | | 9/26 at 103.00 | | | 1,328,945 | |
| | | | |
| | 2,390 | | | | | Windler Public Improvement Authority, Aurora, Colorado, Limited Tax Supported Revenue Bonds, Convertible Capital Appreciation Series 2021A-2, 4.625%, 12/01/51, 144A | | 9/26 at 97.28 | | | 1,180,356 | |
| | | | |
| | 14,000 | | | | | Windler Public Improvement Authority, Aurora, Colorado, Limited Tax Supported Revenue Bonds, Series 2021A-1, 4.125%, 12/01/51, 144A | | 9/26 at 103.00 | | | 7,828,608 | |
| | | | |
| | 705 | | | | | Windsor Highlands Metropolitan District 9, Windsor, Larimer County, Colorado, Limited Tax Supported Revenue Bonds, Series 2019, 5.000%, 12/01/49 | | 9/24 at 103.00 | | | 579,772 | |
| | | | |
| | 1,000 | | | | | Winsome Metropolitan District No. 3, El Paso County, Colorado, General Obligation Limited Tax Bonds, Series 2021A, 5.125%, 12/01/50, 144A | | 9/26 at 103.00 | | | 757,196 | |
| | | | |
| | 816 | | | | | Woodmen Heights Metropolitan District 2, El Paso County, Colorado, General Obligation Limited Tax Bonds, Taxable Converting to Tax-Exempt Refunding Subordinate Series 2020B-1, 6.250%, 12/15/40 | | 12/25 at 103.00 | | | 708,496 | |
| | | | | | Total Colorado | | | | | 153,935,873 | |
| | | | |
| | | | | | Connecticut - 0.2% (0.1% of Total Investments) | | | | | | |
| | | | |
| | 2,000 | | | | | Connecticut Health and Educational Facilities Authority, Revenue Bonds, Stamford Hospital, Forward Delivery Series 2022M, 4.000%, 7/01/41 | | 7/32 at 100.00 | | | 1,682,242 | |
| | | | |
| | 410 | | | | | Steel Point Infrastructure Improvement District, Connecticut, Special Obligation Revenue Bonds, Steelpointe Harbor Project, Series 2021, 4.000%, 4/01/51 | | 4/30 at 100.00 | | | 299,908 | |
| | | | | | Total Connecticut | | | | | 1,982,150 | |
125
| | |
| NMZ | | Nuveen Municipal High Income Opportunity Fund (continued) |
| | Portfolio of Investments October 31, 2023 |
| | | | | | | | | | | | |
Principal Amount (000) | | | | | Description (a) | | Optional Call Provisions (b) | | Value | |
| | | | |
| | | | | | Delaware - 0.2% (0.2% of Total Investments) | | | | | | |
| | | | |
| | $ 2,500 | | | (f) | | Delaware Economic Development Authority, Revenue Bonds, Odyssey Charter School Inc. Project, Series 2015A, 7.000%, 9/01/45, (Pre-refunded 3/03/25), 144A | | 3/25 at 100.00 | | $ | 2,597,173 | |
| | | | | | Total Delaware | | | | | 2,597,173 | |
| | | | |
| | | | | | District of Columbia - 2.7% (1.6% of Total Investments) | | | | | | |
| | | | |
| | 1,998 | | | | | District of Columbia, Revenue Bonds, Saint Paul on Fouth Street, Inc., Series 2019A, 5.250%, 5/15/55, 144A | | 5/30 at 100.00 | | | 1,509,029 | |
| | | | |
| | 1,800 | | | | | District of Columbia, Tax Increment Revenue Bonds, Union Market Infrastructure Project, Series 2021A, 4.250%, 6/01/46, 144A | | 6/28 at 100.00 | | | 1,070,876 | |
| | | | |
| | 5,100 | | | (d) | | Metropolitan Washington Airports Authority, District of Columbia, Dulles Toll Road Revenue Bonds, Dulles Metrorail & Capital improvement Projects, Refunding & Subordinate Lien Series 2019B, 4.000%, 10/01/53 - AGM Insured, (UB) | | 10/29 at 100.00 | | | 4,214,652 | |
| | | | |
| | 20,640 | | | (d) | | Metropolitan Washington Airports Authority, District of Columbia, Dulles Toll Road Revenue Bonds, Dulles Metrorail & Capital Improvement Projects, Refunding Second Senior Lien Series 2022A, 4.000%, 10/01/52 - AGM Insured, (UB) | | 10/31 at 100.00 | | | 17,129,590 | |
| | | | |
| | 4,750 | | | (d) | | Metropolitan Washington Airports Authority, District of Columbia, Dulles Toll Road Revenue Bonds, Dulles Metrorail & Capital Improvement Projects, Refunding Second Senior Lien Series 2022A, 4.000%, 10/01/52 - AGM Insured | | 10/31 at 100.00 | | | 3,942,130 | |
| | | | | | Total District of Columbia | | | | | 27,866,277 | |
| | | | |
| | | | | | Florida - 22.7% (13.3% of Total Investments) | | | | | | |
| | | | |
| | 350 | | | | | Abbott Square Community Development District, Zephyrhills, Florida, Special Assessment Revenue Bonds, 2022 Project Series 2022, 5.500%, 6/15/52 | | 6/32 at 100.00 | | | 315,607 | |
| | | | |
| | 500 | | | | | Academical Village Community Development District, Davie, Florida, Special Assessment Revenue Bonds, Series 2020, 4.000%, 5/01/51 | | 5/30 at 100.00 | | | 350,670 | |
| | | | |
| | 1,645 | | | | | Alachua County Health Facilities Authority, Florida, Health Facilities Revenue Bonds, Terraces at Bonita Springs Project, Refunding Series 2022A, 5.000%, 11/15/61, 144A | | 11/29 at 103.00 | | | 1,025,586 | |
| | | | |
| | 250 | | | | | Alachua County Health Facilities Authority, Florida, Health Facilities Revenue Bonds, Terraces at Bonita Springs Project, Taxable Refunding Series 2022B, 6.500%, 11/15/33, 144A | | No Opt. Call | | | 209,761 | |
| | | | |
| | 1,680 | | | | | Ave Maria Stewardship Community District, Florida, Capital Improvement Revenue Bonds, 2015 Assessment Project, Series 2015, 5.375%, 5/01/45 | | 5/25 at 100.00 | | | 1,545,788 | |
| | | | |
| | 2,245 | | | | | Ave Maria Stewardship Community District, Florida, Capital Improvement Revenue Bonds, Ave Maria National Project, Series 2021, 4.000%, 5/01/51 | | 5/31 at 100.00 | | | 1,587,773 | |
| | | | |
| | 2,500 | | | | | Ave Maria Stewardship Community District, Florida, Capital Improvement Revenue Bonds, Phase 3 Master Improvements Project, Series 2021, 4.000%, 5/01/52, 144A | | 5/32 at 100.00 | | | 1,745,386 | |
| | | | |
| | 1,000 | | | | | Ave Maria Stewardship Community District, Florida, Capital Improvement Revenue Bonds, Phase 4 Master Improvement Project, Series 2023, 5.500%, 5/01/53, 144A | | 5/33 at 100.00 | | | 888,185 | |
| | | | |
| | 1,190 | | | | | Avenir Community Development District, Palm Beach Gardens, Florida, Special Assessment Bonds, Area 3 - Master Infrastructure Project, Series 2023, 5.625%, 5/01/54 | | 5/33 at 100.00 | | | 1,094,045 | |
| | | | |
| | 1,020 | | | | | Babcock Ranch Community Independent Special District, Charlotte County, Florida, Special Assessment Bonds, 2021 Project Series 2021, 4.000%, 5/01/52, 144A | | 5/31 at 100.00 | | | 725,345 | |
| | | | |
| | 1,100 | | | | | Babcock Ranch Community Independent Special District, Charlotte County, Florida, Special Assessment Bonds, 2022 Project Series 2022, 5.000%, 5/01/53 | | 5/32 at 100.00 | | | 923,265 | |
126
| | | | | | | | | | | | |
Principal Amount (000) | | | | | Description (a) | | Optional Call Provisions (b) | | Value | |
| | | | |
| | | | | | Florida (continued) | | | | | | |
| | | | |
| | $ 995 | | | | | Babcock Ranch Community Independent Special District, Charlotte County, Florida, Special Assessment Bonds, Series 2015, 5.250%, 11/01/46 | | 11/25 at 100.00 | | $ | 894,966 | |
| | | | |
| | 1,000 | | | | | Balm Grove Community Development District, Florida, Special Assessment Bonds, 2022 Project, Series 2022, 4.125%, 11/01/51 | | 11/32 at 100.00 | | | 721,729 | |
| | | | |
| | 905 | | | | | Belmont Community Development District, Florida, Capital Improvement Revenue Bonds, Phase 1 Project, Series 2013A, 6.125%, 11/01/33 | | No Opt. Call | | | 929,314 | |
| | | | |
| | 1,575 | | | | | Boggy Creek Improvement District, Orlando, Florida, Special Assessment Revenue Bonds, Refunding Series 2013, 5.125%, 5/01/43 | | 12/23 at 100.00 | | | 1,461,341 | |
| | | | |
| | 500 | | | | | Buckhead Trails Community Development District, Manatee County Florida, Special Assessment Bonds, 2022 Project Series 2022, 5.750%, 5/01/52, 144A | | 5/37 at 100.00 | | | 450,437 | |
| | | | |
| | | | | | Capital Trust Agency, Florida, Educational Facilities Revenue Bonds, AcadeMir Charter Schools, Series 2021A: | | | | | | |
| | 285 | | | | | 4.000%, 7/01/41, 144A | | 7/31 at 100.00 | | | 212,982 | |
| | 1,070 | | | | | 4.000%, 7/01/51, 144A | | 7/31 at 100.00 | | | 711,343 | |
| | | | |
| | 1,000 | | | | | Capital Trust Agency, Florida, Educational Facilities Revenue Bonds, Legends Academy, Series 2021A, 5.000%, 12/01/56, 144A | | 12/28 at 100.00 | | | 690,394 | |
| | | | |
| | 2,500 | | | | | Capital Trust Agency, Florida, Educational Facilities Revenue Bonds, LLT Academy South Bay Project, Series 2020A, 6.000%, 6/15/55, 144A | | 6/25 at 105.00 | | | 2,200,311 | |
| | | | |
| | | | | | Capital Trust Agency, Florida, Revenue Bonds, Babcock Neighborhood School Inc, Series 2021: | | | | | | |
| | 500 | | | | | 4.000%, 8/15/51, 144A | | 8/28 at 100.00 | | | 327,095 | |
| | 1,000 | | | | | 4.200%, 8/15/56, 144A | | 8/28 at 100.00 | | | 657,433 | |
| | 1,000 | | | | | 4.250%, 8/15/61, 144A | | 8/28 at 100.00 | | | 647,315 | |
| | | | |
| | 4,000 | | | | | Capital Trust Agency, Florida, Revenue Bonds, Educational Growth Fund, LLC, Charter School Portfolio Projects, Series 2021A-1, 5.000%, 7/01/56, 144A | | 7/31 at 100.00 | | | 3,262,428 | |
| | | | |
| | 2,273 | | | (c) | | Capital Trust Agency, Florida, Revenue Bonds, Provision CARES Proton Therapy Center, Orlando Project, Series 2018, 7.500%, 6/01/48, 144A | | 6/28 at 100.00 | | | 323,877 | |
| | | | |
| | 830 | | | | | Capital Trust Agency, Florida, Revenue Bonds, Renaissance Charter School Project, Series 2019A, 5.000%, 6/15/39, 144A | | 6/26 at 100.00 | | | 723,672 | |
| | | | |
| | 1,000 | | | (c) | | Capital Trust Agency, Florida, Revenue Bonds, Tuscan Gardens of Palm Coast Project, Series 2017A, 7.000%, 10/01/49, 144A | | 4/24 at 103.00 | | | 530,000 | |
| | | | |
| | 1,000 | | | | | Capital Trust Agency, Florida, Senior Living Facilities Revenue Bonds, Elim Senior Housing, Inc. Project, Series 2017, 5.875%, 8/01/52, 144A | | 8/24 at 103.00 | | | 669,252 | |
| | | | |
| | 955 | | | | | Celebration Pointe Community Development District 1, Alachua County, Florida, Special Assessment Revenue Bonds, Series 2014, 5.125%, 5/01/45 | | 5/24 at 100.00 | | | 857,992 | |
| | | | |
| | 1,000 | | | | | Charlotte County Industrial Development Authority, Florida, Utility System Revenue Bonds, Town & Country Utilities Project, Series 2019, 5.000%, 10/01/49, (AMT), 144A | | 10/27 at 100.00 | | | 849,649 | |
| | | | |
| | 215 | | | | | Coddington Community Development District, Manatee County, Florida, Capital Improvement Revenue Bonds, Series 2022, 5.750%, 5/01/42, 144A | | 5/32 at 100.00 | | | 207,367 | |
| | | | |
| | 1,491 | | | (c) | | Collier County Industrial Development Authority, Florida, Continuing Care Community Revenue Bonds, Arlington of Naples Project, Series 2014A, 7.750%, 5/15/35, 144A | | 5/24 at 100.00 | | | 82,026 | |
| | | | |
| | 995 | | | | | Cross Creek North Community Development District, Clay County, Florida, Special Assessment Bonds, Series 2018, 5.375%, 11/01/50, 144A | | 11/29 at 100.00 | | | 909,028 | |
127
| | |
| NMZ | | Nuveen Municipal High Income Opportunity Fund (continued) |
| | Portfolio of Investments October 31, 2023 |
| | | | | | | | | | | | |
Principal Amount (000) | | | | | Description (a) | | Optional Call Provisions (b) | | Value | |
| | | | |
| | | | | | Florida (continued) | | | | | | |
| | $ 1,490 | | | | | Cypress Mill Community Development District, Hillsborough County, Florida, Special Assessment Bonds, Assessment Area 2, Series 2020, 4.000%, 6/15/40 | | 6/30 at 100.00 | | $ | 1,193,992 | |
| | | | |
| | 1,515 | | | | | East Nassau Stewardship District, Florida, Special Assessment Revenue Bonds, Series 2021, 4.000%, 5/01/51 | | 5/31 at 100.00 | | | 1,068,386 | |
| | | | |
| | 750 | | | | | Eden Hills Community Development District, Lake Alfred, Florida, Special Assessment Revenue Bonds, Series 2022, 4.125%, 5/01/52 | | 5/32 at 100.00 | | | 543,855 | |
| | | | |
| | 1,245 | | | | | Florida Development Finance Corporation, Educational Facilities Revenue Bonds, Creative Inspiration Journey School of St. Cloud, Series 2021A, 5.000%, 6/15/41, 144A | | 6/29 at 102.00 | | | 1,000,404 | |
| | | | |
| | 1,850 | | | | | Florida Development Finance Corporation, Educational Facilities Revenue Bonds, Downtown Doral Charter Elementary School Project, Series 2014A, 6.500%, 7/01/44 | | 7/24 at 100.00 | | | 1,824,979 | |
| | | | |
| | 1,000 | | | | | Florida Development Finance Corporation, Educational Facilities Revenue Bonds, Downtown Doral Charter Elementary School Project, Series 2017A, 5.750%, 7/01/44, 144A | | 7/27 at 100.00 | | | 865,385 | |
| | | | |
| | 2,000 | | | | | Florida Development Finance Corporation, Educational Facilities Revenue Bonds, Dreamers Academy Project, Series 2022A, 6.000%, 1/15/57, 144A | | 1/28 at 101.00 | | | 1,384,175 | |
| | | | |
| | 565 | | | | | Florida Development Finance Corporation, Educational Facilities Revenue Bonds, Florida Charter Foundation Inc. Projects, Series 2016A, 5.000%, 7/15/46, 144A | | 7/26 at 100.00 | | | 469,746 | |
| | | | |
| | 5,855 | | | | | Florida Development Finance Corporation, Educational Facilities Revenue Bonds, Imagine School at Broward Project, Series 2021A, 4.000%, 12/15/56, 144A | | 12/29 at 100.00 | | | 3,954,382 | |
| | | | |
| | 1,000 | | | | | Florida Development Finance Corporation, Educational Facilities Revenue Bonds, Miami Arts Charter School Projects, Series 2014, 6.000%, 6/15/44, 144A | | 6/24 at 100.00 | | | 793,578 | |
| | | | |
| | 655 | | | | | Florida Development Finance Corporation, Educational Facilities Revenue Bonds, Pepin Academies of Pasco County Inc., Series 2020A, 5.000%, 1/01/50, 144A | | 1/27 at 100.00 | | | 493,675 | |
| | | | |
| | 120 | | | | | Florida Development Finance Corporation, Educational Facilities Revenue Bonds, Renaissance Charter School, Inc. Projects, Series 2020C, 5.000%, 9/15/50, 144A | | 9/27 at 100.00 | | | 90,985 | |
| | | | |
| | 20,860 | | | | | Florida Development Finance Corporation, Florida, Surface Transportation Facility Revenue Bonds, Brightline Passenger Rail Project, Green Series 2019B, 7.375%, 1/01/49, (AMT), 144A | | 1/24 at 107.00 | | | 20,338,525 | |
| | | | |
| | | | | | Florida Development Finance Corporation, Florida, Surface Transportation Facility Revenue Bonds, Virgin Trains USA Passenger Rail Project, Series 2019A: | | | | | | |
| | 5,590 | | | | | 6.250%, 1/01/49, (AMT), (Mandatory Put 1/01/24), 144A | | 12/23 at 101.00 | | | 5,576,155 | |
| | 31,170 | | | | | 6.375%, 1/01/49, (AMT), (Mandatory Put 1/01/26), 144A | | 12/23 at 102.00 | | | 29,670,969 | |
| | 6,485 | | | | | 6.500%, 1/01/49, (AMT), (Mandatory Put 1/01/29), 144A | | 12/23 at 102.00 | | | 6,129,284 | |
| | | | |
| | 5,000 | | | | | Florida Development Finance Corporation, Revenue Bonds, Brightline Florida Passenger Rail Expansion Project, Series 2023A, 7.500%, 7/01/57, (AMT), (Mandatory Put 8/15/24) | | 12/23 at 103.50 | | | 4,916,206 | |
| | | | |
| | 25,000 | | | | | Florida Development Finance Corporation, Revenue Bonds, Brightline Passenger Rail Expansion Project, Series 2023C, 8.000%, 7/01/57, (AMT), (Mandatory Put 4/01/24), 144A | | 11/23 at 100.00 | | | 25,176,705 | |
| | | | |
| | | | | | FRERC Community Development District, Ocoee, Florida, Special Assessment Bonds, Series 2020: | | | | | | |
| | 2,655 | | | | | 5.375%, 11/01/40 | | 11/29 at 100.00 | | | 2,400,999 | |
| | 2,000 | | | | | 5.500%, 11/01/50 | | 11/29 at 100.00 | | | 1,742,463 | |
128
| | | | | | | | | | | | |
Principal Amount (000) | | | | | Description (a) | | Optional Call Provisions (b) | | Value | |
| | | | |
| | | | | | Florida (continued) | | | | | | |
| | $ 2,900 | | | | | Gracewater Sarasota Community Development District, Sarasota County, Florida, Capital Improvement Revenue Bonds, Series 2021, 4.000%, 5/01/52, 144A | | 5/31 at 100.00 | | $ | 2,029,216 | |
| | | | |
| | 1,000 | | | | | Grand Bay at Doral Community Development District, Miami-Dade County, Florida, Special Assessment Improvement Bonds, Assessment Area Two Project, Refunding Series 2014A-2, 6.500%, 5/01/39 | | 5/24 at 100.00 | | | 1,003,620 | |
| | | | |
| | 200 | | | | | Gulfstream Polo Community Development District, Palm Beach County, Florida, Special Assessment Bonds, Phase 2 Project, Series 2019, 4.375%, 11/01/49 | | 11/29 at 100.00 | | | 157,042 | |
| | | | |
| | 940 | | | | | Hammock Reserve Community Development District, Haines City, Florida, Special Assessment Revenue Bonds, Area 3 Project, Series 2022, 5.000%, 5/01/52, 144A | | 5/32 at 100.00 | | | 802,030 | |
| | | | |
| | 1,860 | | | | | Harmony Community Development District, Florida, Capital Improvement Revenue Bonds, Special Assessment, Refunding Series 2014, 5.250%, 5/01/32 | | 5/24 at 100.00 | | | 1,834,843 | |
| | | | |
| | 200 | | | | | Hawkstone Community Development District, Florida, Special Assessment Revenue Bonds, Assessment Area 2, Series 2019, 4.000%, 11/01/39 | | 11/29 at 100.00 | | | 162,783 | |
| | | | |
| | 1,000 | | | | | Hawkstone Community Development District, Florida, Special Assessment Revenue Bonds, Assessment Area 4, Series 2023, 5.500%, 5/01/53 | | 5/33 at 100.00 | | | 900,260 | |
| | | | |
| | 5,000 | | | (d) | | Hillsborough County Aviation Authority, Florida, Revenue Bonds, Tampa International Airport, Subordinate Lien Series 2018A, 5.000%, 10/01/48, (AMT), (UB) | | 10/28 at 100.00 | | | 4,695,071 | |
| | | | |
| | 265 | | | | | Lakes of Sarasota Community Development District, Florida, Improvement Revenue Bonds, Capital Phase 1 Project 2021A-1, 4.100%, 5/01/51 | | 5/31 at 100.00 | | | 193,678 | |
| | | | |
| | 500 | | | | | Lakes of Sarasota Community Development District, Florida, Improvement Revenue Bonds, Capital Phase 1 Project 2021B-1, 4.300%, 5/01/51 | | 5/31 at 100.00 | | | 378,307 | |
| | | | |
| | 610 | | | | | Lakewood Park Community Development District, Florida, Special Assessment Revenue Bonds, Assessment Area 1, Series 2021, 4.000%, 5/01/52 | | 5/31 at 100.00 | | | 426,835 | |
| | | | |
| | 610 | | | | | Lakewood Ranch Stewardship District, Florida, Special Assessment Revenue Bonds, Lakewood Centre North Project, Series 2015, 4.875%, 5/01/45 | | 5/25 at 100.00 | | | 524,922 | |
| | | | |
| | 2,000 | | | | | Lee County Industrial Development Authority, Florida, Charter School Revenue Bonds, Lee County Community Charter Schools, Series 2007A, 5.375%, 6/15/37 | | 12/23 at 100.00 | | | 1,806,560 | |
| | | | |
| | 1,630 | | | | | Lee County Industrial Development Authority, Florida, Healthcare Facilities Revenue Bonds, Preserve Project, Series 2017A, 5.750%, 12/01/52, 144A | | 12/23 at 104.00 | | | 1,074,915 | |
| | | | |
| | 750 | | | | | Leomas Landing Community Development District, Florida, Capital Improvement Revenue Bonds, Assessment Area 2, Series 2021, 4.000%, 5/01/52 | | 5/31 at 100.00 | | | 524,797 | |
| | | | |
| | 2,500 | | | | | LTC Rance Residential Community Development District, Port Saint Lucie, Florida, Special Assessment Bonds, Assessment Area 1 Project, Series 2021A, 4.000%, 5/01/52 | | 5/31 at 100.00 | | | 1,749,324 | |
| | | | |
| | | | | | Magic Place Community Development District, Osceola County, Florida, Special Assessment Revenue Bonds, Series 2019: | | | | | | |
| | 2,000 | | | | | 4.375%, 5/01/40 | | 5/30 at 100.00 | | | 1,671,154 | |
| | 3,000 | | | | | 4.500%, 5/01/51 | | 5/30 at 100.00 | | | 2,311,223 | |
| | | | |
| | 3,000 | | | (d) | | Miami Beach, Florida, Resort Tax Revenue Bonds, Series 2015, 5.000%, 9/01/45 | | 9/25 at 100.00 | | | 2,975,593 | |
| | | | |
| | 750 | | | | | Miami Dade County Industrial Development Authority, Florida, Educational Facilities Revenue Bonds, South Florida Autism Charter School Project, Series 2017, 6.000%, 7/01/47, 144A | | 7/27 at 100.00 | | | 683,905 | |
129
| | |
| NMZ | | Nuveen Municipal High Income Opportunity Fund (continued) |
| | Portfolio of Investments October 31, 2023 |
| | | | | | | | | | | | |
Principal Amount (000) | | | | | Description (a) | | Optional Call Provisions (b) | | Value | |
| | | | |
| | | | | | Florida (continued) | | | | | | |
| | $ 1,085 | | | | | Miami World Center Community Development District, Miami-Dade County, Florida, Special Assessment Bonds, Series 2017, 5.250%, 11/01/49 | | 11/27 at 100.00 | | $ | 986,187 | |
| | | | |
| | 5,000 | | | | | Miami-Dade County Expressway Authority, Florida, Toll System Revenue Bonds, Series 2014A, 5.000%, 7/01/39 | | 7/24 at 100.00 | | | 4,853,009 | |
| | | | |
| | 1,750 | | | | | Miami-Dade County Industrial Development Authority, Florida, Revenue Bonds, Youth Co-Op Charter Schools Project, Series 2015A, 6.000%, 9/15/45, 144A | | 9/25 at 100.00 | | | 1,621,584 | |
| | | | |
| | 1,000 | | | | | Miami-Dade County Industrual Development Authority, Florida, Revenue Bonds, Doral Academy, Seres 2018, 5.000%, 1/15/48 | | 1/28 at 100.00 | | | 841,723 | |
| | | | |
| | 11,250 | | | (d) | | Miami-Dade County, Florida, Seaport Revenue Bonds, Refunding Series 2022A, 5.250%, 10/01/52, (AMT), (UB) | | 10/32 at 100.00 | | | 10,831,277 | |
| | | | |
| | 605 | | | | | Mirada Community Development District, Pasco County, Florida, Bond Anticipation Note, Assessment Area 3, Series 2019, 4.500%, 5/01/24 | | 12/23 at 100.00 | | | 603,400 | |
| | | | |
| | 460 | | | | | Mirada II Community Development District, Florida, Capital Improvement Revenue Bonds, Series 2022, 5.750%, 5/01/53, 144A | | 5/32 at 100.00 | | | 425,814 | |
| | | | |
| | 355 | | | | | North Park Isle Community Development District, Plant City, Florida, Special Assessment Revenue Bonds, Assessment Area 1, Series 2019, 4.750%, 5/01/50 | | 5/29 at 100.00 | | | 288,043 | |
| | | | |
| | 930 | | | | | Northern Palm Beach County Improvement District, Florida, Water Control and Improvement Bonds, Development Unit 53, Series 2015, 5.500%, 8/01/46 | | 8/26 at 100.00 | | | 870,536 | |
| | | | |
| | 5,000 | | | (d) | | Orange County Health Facilities Authority, Florida, Hospital Revenue Bonds, Orlando Health, Inc., Series 2019A, 5.000%, 10/01/47, (UB) | | 4/29 at 100.00 | | | 4,841,020 | |
| | | | |
| | 9,305 | | | (d) | | Palm Beach County Health Facilities Authority, Florida, Hospital Revenue Bonds, Baptist Health Systems of South Florida Obligated Group, Series 2019, 4.000%, 8/15/49, (UB) | | 8/29 at 100.00 | | | 7,333,310 | |
| | | | |
| | 250 | | | | | Palm Beach County Health Facilities Authority, Florida, Hospital Revenue Bonds, Jupiter Medical Center, Series 2022, 5.000%, 11/01/52 | | 11/32 at 100.00 | | | 223,713 | |
| | | | |
| | 1,355 | | | | | Palm Beach County, Florida, Revenue Bonds, Provident Group - LU Properties LLC Lynn University Housing Project, Series 2021A, 5.000%, 6/01/57, 144A | | 6/31 at 100.00 | | | 1,051,660 | |
| | | | |
| | 500 | | | | | Palm Beach County, Florida, Revenue Bonds, Provident Group - PBAU Properties LLC - Palm Beach Atlantic University Housing Project, Series 2019A, 5.000%, 4/01/51, 144A | | 4/29 at 100.00 | | | 433,121 | |
| | | | |
| | 250 | | | | | Palm Coast Park Community Development District, Florida, Special Assessment Revenue Bonds, Sawmill Branch Phase 2 Flager, Series 2022, 5.125%, 5/01/51 | | 5/32 at 100.00 | | | 214,156 | |
| | | | |
| | 500 | | | | | Portico Community Development District, Lee County, Florida, Special Assessment, Improvement Series 2020-2, 4.000%, 5/01/50 | | 5/30 at 100.00 | | | 355,334 | |
| | | | |
| | 910 | | | | | Rivers Edge II Community Development District, Florida, Capital Improvement Revenue Bonds, Series 2021, 4.000%, 5/01/51 | | 5/31 at 100.00 | | | 641,737 | |
| | | | |
| | 905 | | | | | Rivers Edge III Community Development District, Florida, Capital Improvement Revenue Bonds, Series 2021, 4.000%, 5/01/51, 144A | | 5/31 at 100.00 | | | 638,211 | |
| | | | |
| | 2,495 | | | | | Rolling Oaks Community Development District, Florida, Special Assessment Bonds, Series 2016, 6.000%, 11/01/47 | | 11/27 at 100.00 | | | 2,479,307 | |
| | | | |
| | 1,000 | | | | | Saint Johns County Housing Authority, Florida, Multifamily Mortgage Revenue Bonds, Victoria Crossing, Series 2021A, 3.920%, 4/01/59, (Mandatory Put 4/01/39), 144A | | 11/31 at 100.00 | | | 628,683 | |
| | | | |
| | 1,110 | | | | | Sawyers Landing Community Development District, Florida, Special Assessment Revenue Bonds, Series 2021, 4.125%, 5/01/41, 144A | | 5/31 at 100.00 | | | 859,179 | |
130
| | | | | | | | | | | | |
Principal
Amount (000) | | | | | Description (a) | | Optional Call
Provisions (b) | | Value | |
| | | | |
| | | | | | Florida (continued) | | | | | | |
| | $ 610 | | | | | Seminole County Industrial Development Authority, Florida, Educational Facilities Revenue Bonds, Galileo Schools for Gifted Learning, Series 2021A, 4.000%, 6/15/51, 144A | | 6/31 at 100.00 | | $ | 404,582 | |
| | | | |
| | 990 | | | | | Shingle Creek Community Development District, Osceola County, Florida, Special Assessment Revenue Bonds, Series 2015, 5.400%, 11/01/45 | | 11/25 at 100.00 | | | 917,161 | |
| | | | |
| | 15,000 | | | | | South Miami Health Facilities Authority, Florida, Hospital Revenue Bonds, Baptist Health Systems of South Florida Obligated Group, Refunding Series 2017, 5.000%, 8/15/47, (UB) | | 8/27 at 100.00 | | | 14,294,790 | |
| | | | |
| | 675 | | | | | Southern Grove Community Develoment District 5, Port Saint Lucie, Florida, Special Assessment Bonds, Community Infrastructure Series 2021, 4.000%, 5/01/48 | | 5/31 at 100.00 | | | 488,091 | |
| | | | |
| | 585 | | | | | Summit View Community Development District, Dade City, Florida, Special Assessment Revenue Bonds, Series 2021B, 5.000%, 5/01/41 | | No Opt. Call | | | 489,778 | |
| | | | |
| | 615 | | | | | Three Rivers Community Development District, Florida, Special Assessment Revenue Bonds, South Assessment Area Series 2021B, 4.625%, 5/01/36, 144A | | 12/23 at 100.00 | | | 542,375 | |
| | | | |
| | 2,300 | | | (g) | | Tolomato Community Development District, Florida, Special Assessment Bonds, Refunding Series 2015-2, 0.000%, 5/01/40 | | 12/23 at 100.00 | | | 2,140,351 | |
| | | | |
| | 2,505 | | | (c) | | Tolomato Community Development District, Florida, Special Assessment Bonds, Refunding Series 2015-3, 6.610%, 5/01/40 | | 12/23 at 100.00 | | | 25 | |
| | | | |
| | 1,230 | | | | | Touchstone Community Development District, Hillsborough County, Florida, Special Assessment Bonds, 2019 Project, Series 2019, 4.000%, 12/15/40 | | 12/29 at 100.00 | | | 977,451 | |
| | | | |
| | | | | | Turtle Run Community Development District, Florida, Special Assessment Benefit Tax Bonds, Series 2017-2: | | | | | | |
| | 1,000 | | | | | 5.000%, 5/01/37 | | 5/28 at 100.00 | | | 942,897 | |
| | 2,020 | | | | | 5.000%, 5/01/47 | | 5/28 at 100.00 | | | 1,761,886 | |
| | | | |
| | 1,590 | | | | | Twin Creeks North Community Development District, Florida, Special Assessment Bonds, Master Infrastructure Improvements, Series 2016A-1, 6.375%, 11/01/47 | | 11/31 at 100.00 | | | 1,554,664 | |
| | | | |
| | 3,055 | | | | | Twin Creeks North Community Development District, Florida, Special Assessment Bonds, Master Infrastructure Improvements, Series 2016A-2, 6.375%, 11/01/47 | | 11/31 at 100.00 | | | 2,987,106 | |
| | | | |
| | 500 | | | | | Two Lakes Community Development District, Hialeah, Florida, Special Assessment Bonds, Expansion Area Project, Series 2019, 4.000%, 12/15/49 | | 12/29 at 100.00 | | | 356,948 | |
| | | | |
| | 1,000 | | | | | Two Rivers West Community Development District, Pasco County, Florida, Special Assessment Bonds, 2023 Project, Series 2023, 6.125%, 11/01/53 | | 11/33 at 100.00 | | | 924,848 | |
| | | | |
| | 335 | | | | | Union Park East Community Development District, Florida, Capital Improvement Revenue Bonds, Assessment Area 3 Series 2021, 4.000%, 5/01/51, 144A | | 5/31 at 100.00 | | | 236,244 | |
| | | | |
| | 1,000 | | | | | V-Dana Community Development District, Lee County, Florida,Special Assessment Bonds, Area 1 - 2021 Project, Series 2021, 4.000%, 5/01/52 | | 5/31 at 100.00 | | | 705,991 | |
| | | | |
| | 1,000 | | | | | Venetian Parc Community Development District, Miami-Dade County, Florida, Special Assessment Bonds, Area One Project, Series 2013, 6.500%, 11/01/43 | | 11/28 at 100.00 | | | 1,042,156 | |
| | | | |
| | 500 | | | | | Verano 3 Community Development District, Florida, Special Assessment Bonds, Phase 2 Assessment Area, Series 2022, 6.625%, 11/01/52 | | 11/32 at 100.00 | | | 497,446 | |
| | | | |
| | 965 | | | | | Waterset North Community Development District, Hillsborough County, Florida, Special Assessment Revenue Bonds, Series 2014, 5.500%, 11/01/45 | | 11/24 at 100.00 | | | 895,690 | |
131
| | |
| NMZ | | Nuveen Municipal High Income Opportunity Fund (continued) |
| | Portfolio of Investments October 31, 2023 |
| | | | | | | | | | | | |
Principal
Amount (000) | | | | | Description (a) | | Optional Call
Provisions (b) | | Value | |
| | | | |
| | | | | | Florida (continued) | | | | | | |
| | $ 500 | | | | | Westside Haines City Community Development District, Florida, Special Assessment Bonds, Area 1 Project, Series 2021, 4.000%, 5/01/52 | | 5/31 at 100.00 | | $ | 351,664 | |
| | | | | | Total Florida | | | | | 237,805,436 | |
| | | | |
| | | | | | Georgia - 0.6% (0.3% of Total Investments) | | | | | | |
| | | | |
| | 870 | | | | | Atlanta Urban Residential Finance Authority, Georgia, Multifamily Housing Revenue Bonds, Testletree Village Apartments, Series 2013A, 5.000%, 11/01/48 | | 12/23 at 100.00 | | | 593,153 | |
| | | | |
| | 1,870 | | | | | Douglas County Development Authority, Georgia, Charter School Revenue Bonds, Brighten Academy Project, Series 2013A, 7.125%, 10/01/43 | | 12/23 at 100.00 | | | 1,828,091 | |
| | | | |
| | 1,610 | | | | | Municipal Electric Authority of Georgia, Plant Vogtle Units 3 & 4 Project J Bonds, Series 2015A, 5.000%, 7/01/60 | | 7/25 at 100.00 | | | 1,490,333 | |
| | | | |
| | 2,215 | | | | | Municipal Electric Authority of Georgia, Plant Vogtle Units 3 & 4 Project J Bonds, Series 2023A, 5.000%, 7/01/64 - AGM Insured | | 1/33 at 100.00 | | | 2,132,462 | |
| | | | | | Total Georgia | | | | | 6,044,039 | |
| | | | |
| | | | | | Hawaii - 0.4% (0.2% of Total Investments) | | | | | | |
| | | | |
| | 2,000 | | | | | Hawaii County, Hawaii, Special Tax Revenue Bonds, Community Facilities District 1-2021, Kaloko Heights Project, Series 2023, 7.250%, 5/15/52, 144A | | 5/33 at 100.00 | | | 1,830,320 | |
| | | | |
| | 2,000 | | | | | Hawaii Department of Budget and Finance, Special Purpose Revenue Bonds, Hawaii Pacific University, Series 2013A, 6.875%, 7/01/43, 144A | | 12/23 at 100.00 | | | 1,999,855 | |
| | | | | | Total Hawaii | | | | | 3,830,175 | |
| | | | |
| | | | | | Idaho - 0.2% (0.1% of Total Investments) | | | | | | |
| | | | |
| | 1,000 | | | | | Idaho Housing and Finance Association, Nonprofit Facilities Revenue Bonds, Doral Academy of Idaho, Series 2021A, 5.000%, 7/15/56, 144A | | 7/26 at 103.00 | | | 720,729 | |
| | | | |
| | 565 | | | | | Idaho Housing and Finance Association, Nonprofit Facilities Revenue Bonds, Gem Prep Meridian North LLC, Series 2020A, 5.250%, 7/01/55, 144A | | 7/25 at 100.00 | | | 424,871 | |
| | | | |
| | 1,000 | | | | | Idaho Housing and Finance Association, Nonprofit Facilities Revenue Bonds, Gem Prep Meridian South Charter School Project, Series 2021, 4.000%, 5/01/56, 144A | | 11/25 at 100.00 | | | 610,319 | |
| | | | | | Total Idaho | | | | | 1,755,919 | |
| | | | |
| | | | | | Illinois - 18.2% (10.7% of Total Investments) | | | | | | |
| | | | |
| | 230 | | | (c) | | Bolingbrook, Illinois, Sales Tax Revenue Bonds, Series 2005, 6.250%, 1/01/24 | | 12/23 at 100.00 | | | 228,599 | |
| | | | |
| | 10,670 | | | (d) | | Chicago Board of Education, Illinois, Dedicated Capital Improvement Tax Revenue Bonds, Series 2016, 6.000%, 4/01/46, (UB) | | 4/27 at 100.00 | | | 10,734,198 | |
| | | | |
| | 1,500 | | | | | Chicago Board of Education, Illinois, General Obligation Bonds, Dedicated Revenues, Project Series 2015C, 5.250%, 12/01/39 | | 12/24 at 100.00 | | | 1,389,263 | |
| | | | |
| | 2,575 | | | | | Chicago Board of Education, Illinois, General Obligation Bonds, Dedicated Revenues, Refunding Series 2018D, 5.000%, 12/01/46 | | 12/23 at 100.00 | | | 2,237,462 | |
| | | | |
| | 15,385 | | | | | Chicago Board of Education, Illinois, General Obligation Bonds, Dedicated Revenues, Series 2016A, 7.000%, 12/01/44 | | 12/25 at 100.00 | | | 15,723,458 | |
| | | | |
| | 2,025 | | | | | Chicago Board of Education, Illinois, General Obligation Bonds, Dedicated Revenues, Series 2016B, 6.500%, 12/01/46 | | 12/26 at 100.00 | | | 2,057,099 | |
| | | | |
| | 9,910 | | | | | Chicago Board of Education, Illinois, General Obligation Bonds, Dedicated Revenues, Series 2017A, 7.000%, 12/01/46, 144A | | 12/27 at 100.00 | | | 10,289,616 | |
| | | | |
| | 10,000 | | | (d) | | Chicago Transit Authority, Illinois, Sales Tax Receipts Revenue Bonds, Second Lien Series 2022A, 5.000%, 12/01/46 - BAM Insured, (UB) | | 12/31 at 100.00 | | | 10,217,241 | |
132
| | | | | | | | | | | | |
Principal
Amount (000) | | | | | Description (a) | | Optional Call
Provisions (b) | | Value | |
| | | | |
| | | | | | Illinois (continued) | | | | | | |
| | $ 2,129 | | | | | Chicago, Illinois, Certificates of Participation Tax Increment Bonds, 35th and State Redevelopoment Project, Series 2012, 6.100%, 1/15/29 | | 11/23 at 100.00 | | $ | 2,093,558 | |
| | | | |
| | 1,754 | | | (c) | | Chicago, Illinois, Certificates of Participation, Tax Increment Allocation Revenue Bonds, Diversey-Narragansett Project, Series 2006, 7.460%, 2/15/26 | | 12/23 at 100.00 | | | 1,280,285 | |
| | | | |
| | 5,000 | | | (d) | | Chicago, Illinois, General Airport Revenue Bonds, O’Hare International Airport, Refunding Senior Lien Series 2018A, 5.000%, 1/01/48, (UB) | | 1/29 at 100.00 | | | 4,680,284 | |
| | | | |
| | 8,065 | | | | | Chicago, Illinois, General Airport Revenue Bonds, O’Hare International Airport, Refunding Senior Lien Series 2022A, 5.000%, 1/01/48 | | 1/32 at 100.00 | | | 7,549,297 | |
| | | | |
| | 4,000 | | | (d) | | Chicago, Illinois, General Airport Revenue Bonds, O’Hare International Airport, Senior Lien Series 2016D, 5.000%, 1/01/52, (UB) | | 1/27 at 100.00 | | | 3,876,726 | |
| | | | |
| | 4,000 | | | (d) | | Chicago, Illinois, General Obligation Bonds, Chicago Works Series 2023A, 5.500%, 1/01/43, (UB) | | 1/30 at 100.00 | | | 3,991,613 | |
| | | | |
| | 2,000 | | | | | Chicago, Illinois, General Obligation Bonds, Project & Refunding Series 2014A, 5.250%, 1/01/30 | | 1/24 at 100.00 | | | 2,003,782 | |
| | | | |
| | 9,400 | | | (d) | | Chicago, Illinois, General Obligation Bonds, Project & Refunding Series 2017A, 6.000%, 1/01/38, (UB) | | 1/27 at 100.00 | | | 9,630,532 | |
| | | | |
| | 1,000 | | | (d) | | Chicago, Illinois, General Obligation Bonds, Project and Refunding Series 2005D, 5.500%, 1/01/37, (UB) | | 1/25 at 100.00 | | | 987,029 | |
| | | | |
| | 130 | | | | | Chicago, Illinois, General Obligation Bonds, Refunding Series 2016C, 5.000%, 1/01/38 | | 1/26 at 100.00 | | | 124,064 | |
| | | | |
| | | | | | Chicago, Illinois, General Obligation Bonds, Series 2019A: | | | | | | |
| | 11,000 | | | (d) | | 5.000%, 1/01/44, (UB) | | 1/29 at 100.00 | | | 10,386,232 | |
| | 8,000 | | | (d) | | 5.500%, 1/01/49, (UB) | | 1/29 at 100.00 | | | 7,818,202 | |
| | | | |
| | 1,500 | | | (d) | | Chicago, Illinois, General Obligation Bonds, VAribale Rate Demand Series 2007F, 5.500%, 1/01/42, (UB) | | 1/25 at 100.00 | | | 1,460,468 | |
| | | | |
| | 5,000 | | | (c) | | Illinois Finance Authority Revenue Bonds, Ness Healthcare NFP, Series 2016A, 6.375%, 11/01/46, 144A | | 11/26 at 100.00 | | | 3,951,716 | |
| | | | |
| | | | | | Illinois Finance Authority, Charter School Revenue Bonds, Art in Motion AIM Project, Series 2021A: | | | | | | |
| | 1,000 | | | | | 5.000%, 7/01/51, 144A | | 7/31 at 100.00 | | | 658,936 | |
| | 1,000 | | | | | 5.000%, 7/01/56, 144A | | 7/31 at 100.00 | | | 641,042 | |
| | | | |
| | 1,000 | | | | | Illinois Finance Authority, Revenue Bonds, DePaul College Prep Foundation, Series 2023A, 5.625%, 8/01/53, 144A | | 8/33 at 100.00 | | | 923,484 | |
| | | | |
| | | | | | Illinois Finance Authority, Revenue Bonds, Dominican University, Refunding Series 2022: | | | | | | |
| | 550 | | | | | 5.000%, 3/01/36 | | 9/32 at 100.00 | | | 512,382 | |
| | 600 | | | | | 5.000%, 3/01/38 | | 9/32 at 100.00 | | | 536,011 | |
| | 700 | | | | | 5.000%, 3/01/40 | | 9/32 at 100.00 | | | 612,936 | |
| | | | |
| | 2,000 | | | | | Illinois Finance Authority, Revenue Bonds, Roosevelt University, Series 2018B, 6.125%, 4/01/58, 144A | | 10/28 at 100.50 | | | 1,672,835 | |
| | | | |
| | 7,955 | | | (d) | | Illinois State, General Obligation Bonds, June Series 2022A, 5.500%, 3/01/47, (UB) | | 3/32 at 100.00 | | | 8,002,195 | |
| | | | |
| | 1,715 | | | | | Illinois State, General Obligation Bonds, May Series 2020, 5.750%, 5/01/45 | | 5/30 at 100.00 | | | 1,750,113 | |
| | | | |
| | | | | | Illinois State, General Obligation Bonds, November Series 2016: | | | | | | |
| | 1,000 | | | | | 5.000%, 11/01/35 | | 11/26 at 100.00 | | | 1,000,085 | |
| | 1,000 | | | | | 5.000%, 11/01/37 | | 11/26 at 100.00 | | | 973,452 | |
| | | | |
| | 5,000 | | | | | Illinois State, General Obligation Bonds, October Series 2020C, 4.250%, 10/01/45 | | 10/30 at 100.00 | | | 4,150,440 | |
133
| | |
| NMZ | | Nuveen Municipal High Income Opportunity Fund (continued) |
| | Portfolio of Investments October 31, 2023 |
| | | | | | | | | | | | |
Principal
Amount (000) | | | | | Description (a) | | Optional Call
Provisions (b) | | Value | |
| | | | |
| | | | | | Illinois (continued) | | | | | | |
| | $ 10,000 | | | (d) | | Illinois Toll Highway Authority, Toll Highway Revenue Bonds, Senior Lien Series 2021A, 4.000%, 1/01/46, (UB) | | 1/32 at 100.00 | | $ | 8,465,663 | |
| | | | |
| | | | | | Metropolitan Pier and Exposition Authority, Illinois, McCormick Place Expansion Project Bonds, Refunding Series 2020A: | | | | | | |
| | 7,075 | | | | | 4.000%, 6/15/50 - BAM Insured | | 12/29 at 100.00 | | | 5,716,237 | |
| | 1,000 | | | | | 4.000%, 6/15/50 | | 12/29 at 100.00 | | | 778,452 | |
| | 12,215 | | | | | 5.000%, 6/15/50 | | 12/29 at 100.00 | | | 11,358,758 | |
| | | | |
| | 4,695 | | | | | Metropolitan Pier and Exposition Authority, Illinois, McCormick Place Expansion Project Bonds, Series 2012B, 0.000%, 12/15/50 | | No Opt. Call | | | 971,500 | |
| | | | |
| | 5,000 | | | | | Metropolitan Pier and Exposition Authority, Illinois, McCormick Place Expansion Project Bonds, Series 2017A, 5.000%, 6/15/57 | | 12/27 at 100.00 | | | 4,574,771 | |
| | | | |
| | 35,635 | | | | | Metropolitan Pier and Exposition Authority, Illinois, McCormick Place Expansion Project Bonds, Series 2017B, 0.000%, 12/15/54 | | No Opt. Call | | | 5,779,666 | |
| | | | |
| | 750 | | | | | Rantoul, Champaign County, Illinois, Tax Increment Revenue Bonds, Evans Road Series 2013B, 7.000%, 12/01/33 | | 12/23 at 100.00 | | | 725,790 | |
| | | | |
| | 7,750 | | | (d) | | Sales Tax Securitization Corporation, Illinois, Sales Tax Securitzation Bonds, Series 2018A, 5.000%, 1/01/48, (UB) | | 1/28 at 100.00 | | | 7,363,864 | |
| | | | |
| | 10,000 | | | (d) | | Sales Tax Securitization Corporation, Illinois, Sales Tax Securitzation Bonds, Series 2018C, 5.250%, 1/01/48 - BAM Insured, (UB) | | 1/29 at 100.00 | | | 10,030,632 | |
| | | | |
| | 895 | | | (c) | | Yorkville United City Business District, Illinois, Storm Water and Water Improvement Project Revenue Bonds, Series 2007, 4.800%, 1/01/26 | | 11/23 at 100.00 | | | 384,850 | |
| | | | | | Total Illinois | | | | | 190,294,818 | |
| | | | |
| | | | | | Indiana - 1.7% (1.0% of Total Investments) | | | | | | |
| | | | |
| | 440 | | | | | Carmel Redevelopment District, Indiana, Tax Increment Revenue Bonds, Series 2004A, 6.650%, 7/15/24 | | 12/23 at 100.00 | | | 441,401 | |
| | | | |
| | 1,000 | | | (d) | | Indiana Bond Bank, Special Program Bonds, Hendricks Regional Health Project, Tender Option Bond Trust 2016-XL0019, 6.715%, 4/01/30 - AMBAC Insured, 144A, (IF) | | No Opt. Call | | | 1,228,746 | |
| | | | |
| | 1,000 | | | | | Indiana Finance Authority, Educational Facilities Revenue Bonds, Discovery Charter School Project, Series 2015A, 7.250%, 12/01/45 | | 12/25 at 100.00 | | | 1,010,577 | |
| | | | |
| | 850 | | | | | Indiana Finance Authority, Educational Facilities Revenue Bonds, Seven Oaks Classical School Project, Series 2021A, 5.000%, 6/01/41 | | 6/31 at 100.00 | | | 681,008 | |
| | | | |
| | 7,725 | | | (d) | | Indiana Finance Authority, Educational Facilities Revenue Bonds, University of Evansville Project, Series 2022A, 5.250%, 9/01/57, (UB) | | 9/32 at 100.00 | | | 6,300,887 | |
| | | | |
| | 2,000 | | | | | Indiana Finance Authority, Environmental Improvement Revenue Bonds, United States Steel Corporation Project, Series 2012, 5.750%, 8/01/42, (AMT) | | 12/23 at 100.00 | | | 1,939,591 | |
| | | | |
| | 5,000 | | | (d) | | Indiana Finance Authority, Indiana, Health Facilities Project Revenue Bonds, Baptist Healthcare System Obligated Group, Series 2017A, 5.000%, 8/15/51, (UB) | | 8/27 at 100.00 | | | 4,555,399 | |
| | | | |
| | 790 | | | | | Saint Joseph County, Indiana, Economic Development Revenue Bonds, Chicago Trail Village Apartments, Series 2005A, 7.500%, 7/01/35 | | 12/23 at 100.00 | | | 790,769 | |
| | | | |
| | 1,000 | | | | | Shoals, Indiana, Exempt Facilities Revenue Bonds, National Gypsum Company Project, Series 2013, 7.250%, 11/01/43, (AMT) | | 12/23 at 100.00 | | | 1,000,947 | |
| | | | |
| | 966 | | | (c) | | Terre Haute, Indiana, Economic Development Solid Waste Facility Revenue Bonds, Pyrolyx USA Indiana, LLC Project, Series 2017A, 7.250%, 12/01/28, (AMT) | | No Opt. Call | | | 10 | |
| | | | | | Total Indiana | | | | | 17,949,335 | |
134
| | | | | | | | | | | | |
Principal
Amount (000) | | | | | Description (a) | | Optional Call
Provisions (b) | | Value | |
| | | | |
| | | | | | Iowa - 1.9% (1.1% of Total Investments) | | | | | | |
| | | | |
| | $ 1,000 | | | | | Iowa Finance Authority, Iowa, Midwestern Disaster Area Revenue Bonds, Alcoa Inc. Project, Series 2012, 4.750%, 8/01/42 | | 12/23 at 100.00 | | $ | 879,820 | |
| | | | |
| | | | | | Iowa Finance Authority, Iowa, Midwestern Disaster Area Revenue Bonds, Iowa Fertilizer Company Project, Refunding Series 2022: | | | | | | |
| | 17,940 | | | (d) | | 5.000%, 12/01/50, (UB) | | 12/29 at 103.00 | | | 15,923,793 | |
| | 3,500 | | | | | 5.000%, 12/01/50, (Mandatory Put 12/01/42) | | 12/29 at 103.00 | | | 3,186,756 | |
| | | | | | Total Iowa | | | | | 19,990,369 | |
| | | | |
| | | | | | Kansas - 0.1% (0.1% of Total Investments) | | | | | | |
| | | | |
| | 1,000 | | | | | Wyandotte County-Kansas City Unified Government, Kansas, Sales Tax Special Obligation Bonds, Vacation Village Project Area 1 and 2A, Series 2015, 5.750%, 9/01/32 | | 9/25 at 100.00 | | | 880,676 | |
| | | | | | Total Kansas | | | | | 880,676 | |
| | | | |
| | | | | | Kentucky - 3.3% (2.0% of Total Investments) | | | | | | |
| | | | |
| | 1,385 | | | | | Bell County, Kentucky, Special Assessment Industrial Building Revenue Bonds, Boone’s Ridge Project, Series 2020, 6.000%, 12/01/40 | | 12/30 at 100.00 | | | 1,146,105 | |
| | | | |
| | | | | | Kentucky Economic Development Finance Authority, Hospital Revenue Bonds, Owensboro Health, Refunding Series 2017A: | | | | | | |
| | 11,675 | | | | | 5.000%, 6/01/41, (UB), (WI/DD) | | 6/27 at 100.00 | | | 10,863,864 | |
| | 5,450 | | | | | 5.000%, 6/01/41 | | 6/27 at 100.00 | | | 5,071,354 | |
| | 3,300 | | | (d) | | 5.000%, 6/01/45 | | 6/27 at 100.00 | | | 2,978,823 | |
| | 990 | | | (d) | | 5.000%, 6/01/45, (UB) | | 6/27 at 100.00 | | | 893,647 | |
| | | | |
| | 1,000 | | | | | Kentucky Economic Development Finance Authority, Kentucky, Healthcare Facilities Revenue Bonds, Christian Care Communities, Inc. Obligated Group, Series 2021, 5.125%, 7/01/55 | | 7/29 at 102.00 | | | 648,820 | |
| | | | |
| | 11,800 | | | | | Kentucky Economic Development Finance Authority, Revenue Bonds, Next Generation Kentucky Information Highway Project, Senior Series 2015A, 5.000%, 1/01/45 | | 7/25 at 100.00 | | | 10,712,754 | |
| | | | |
| | 1,000 | | | | | Newport, Kentucky, Special Obligation Revenue Bonds, Newport Clifton Project, Series 2020B, 5.500%, 12/01/60 | | 12/30 at 100.00 | | | 741,000 | |
| | | | |
| | 1,000 | | | | | Union Kentucky, Special Obligation Revenue Bonds, Union Promenade Project, Series 2022B, 5.500%, 12/01/52, 144A | | 12/32 at 100.00 | | | 836,108 | |
| | | | |
| | 1,000 | | | | | Union, Kentucky, Special Obligation Revenue Bonds, Union Promenade Project, Series 2022D, 5.750%, 12/01/52, 144A | | 12/32 at 100.00 | | | 840,122 | |
| | | | | | Total Kentucky | | | | | 34,732,597 | |
| | | | |
| | | | | | Louisiana - 1.2% (0.7% of Total Investments) | | | | | | |
| | | | |
| | 1,810 | | | | | Ascension Parish Industrial development Board, Louisiana, Revenue Bonds, Impala Warehousing (US) LLC Project, Series 2013, 6.000%, 7/01/36 | | 12/23 at 100.00 | | | 1,744,592 | |
| | | | |
| | 500 | | | | | Louisiana Publc Facilities Authority, Lousiana, Revenue Bonds, Lake Charles College Prep Project, Series 2019A, 5.000%, 6/01/58, 144A | | 6/27 at 100.00 | | | 376,516 | |
| | | | |
| | 1,405 | | | | | Louisiana Publc Facilities Authority, Lousiana, Revenue Bonds, Mentorship STEAM Academy, Series 2021A, 5.000%, 6/01/51, 144A | | 6/31 at 100.00 | | | 1,017,053 | |
| | | | |
| | 1,710 | | | | | Louisiana Public Facilities Authority, Dock and Wharf Revenue Bonds, Impala Warehousing (US) LLC Project, Series 2013, 6.500%, 7/01/36, (AMT), 144A | | 12/23 at 100.00 | | | 1,649,857 | |
| | | | |
| | | | | | Louisiana Public Facilities Authority, Louisiana, Revenue Bonds, Encore Academy Project, Series 2021A: | | | | | | |
| | 250 | | | (c) | | 5.000%, 6/01/41, 144A | | 6/31 at 100.00 | | | 175,000 | |
| | 250 | | | (c) | | 5.000%, 6/01/51, 144A | | 6/31 at 100.00 | | | 175,000 | |
135
| | |
| NMZ | | Nuveen Municipal High Income Opportunity Fund (continued) |
| | Portfolio of Investments October 31, 2023 |
| | | | | | | | | | | | |
Principal
Amount (000) | | | | | Description (a) | | Optional Call
Provisions (b) | | Value | |
| | | | |
| | | | | | Louisiana (continued) | | | | | | |
| | | | | | Louisiana Public Facilities Authority, Louisiana, Revenue Bonds, Jefferson Rise Charter School Project, Series 2022A: | | | | | | |
| | $ 500 | | | | | 6.250%, 6/01/52, 144A | | 6/31 at 100.00 | | $ | 435,173 | |
| | 1,000 | | | | | 6.375%, 6/01/62, 144A | | 6/31 at 100.00 | | | 857,580 | |
| | | | |
| | 200 | | | | | Louisiana Public Facilities Authority, Louisiana, Revenue Bonds, Lincoln Preparatory School Project, Series 2022A, 6.500%, 6/01/62, 144A | | 6/31 at 100.00 | | | 175,098 | |
| | | | |
| | 500 | | | | | Louisiana Public Facilities Authority, Louisiana, Revenue Bonds, Young Audiences Charter School, Series 2019A, 5.000%, 4/01/57, 144A | | 4/27 at 100.00 | | | 363,507 | |
| | | | |
| | 1,355 | | | | | Louisiana Public Facilities Authority, Revenue Bonds, Lake Charles Charter Academy Foundation Project, Series 2011A, 7.750%, 12/15/31 | | 12/23 at 100.00 | | | 1,356,981 | |
| | | | |
| | 2,000 | | | | | Louisiana Public Facilities Authority, Revenue Bonds, Loyola University Project, Refunding Series 2017, 5.250%, 10/01/33 | | No Opt. Call | | | 1,983,196 | |
| | | | |
| | 2,110 | | | | | Louisiana Public Facilities Authority, Revenue Bonds, Southwest Louisiana Charter Academy Foundation Project, Series 2013A, 8.125%, 12/15/33 | | 12/23 at 100.00 | | | 2,110,904 | |
| | | | |
| | 2,000 | | | (c) | | Louisiana Public Facilities Authority, Solid Waste Disposal Facility Revenue Bonds, Lousiana Pellets Inc Project, Series 2015, 7.000%, 7/01/24, (AMT), 144A | | No Opt. Call | | | 20 | |
| | | | |
| | 540 | | | | | Saint James Parish, Louisiana, Revenue Bonds, NuStar Logistics, L.P. Project, Series 2010, 6.350%, 7/01/40, 144A | | 6/30 at 100.00 | | | 566,848 | |
| | | | | | Total Louisiana | | | | | 12,987,325 | |
| | | | |
| | | | | | Maryland - 0.9% (0.5% of Total Investments) | | | | | | |
| | | | |
| | 1,595 | | | | | Baltimore, Maryland, Convention Center Hotel Revenue Bonds, Refunding Series 2017, 5.000%, 9/01/42 | | 9/27 at 100.00 | | | 1,326,169 | |
| | | | |
| | 4,000 | | | (c) | | Maryland Economic Development Corporation, Revenue Bonds, Chesapeake Bay Hyatt Conference Center, Series 2006A, 5.000%, 12/01/31 | | 12/23 at 100.00 | | | 2,400,000 | |
| | | | |
| | 2,500 | | | (c) | | Maryland Economic Development Corporation, Revenue Bonds, Chesapeake Bay Hyatt Conference Center, Series 2006B, 5.250%, 12/01/31 | | 12/23 at 100.00 | | | 1,500,000 | |
| | | | |
| | 1,000 | | | | | Maryland Economic Development Corporation, Special Obligation Bonds, Port Covington Project, Series 2020, 4.000%, 9/01/50 | | 9/30 at 100.00 | | | 738,032 | |
| | | | |
| | 5,000 | | | | | Maryland Stadium Authority, Lease Revenue Bonds, Built To Learn, Series 2021, 2.750%, 6/01/51 | | 6/31 at 100.00 | | | 2,989,007 | |
| | | | | | Total Maryland | | | | | 8,953,208 | |
| | | | |
| | | | | | Massachusetts - 1.2% (0.7% of Total Investments) | | | | | | |
| | | | |
| | 7,080 | | | (d) | | Massachusetts Development Finance Agency, Revenue Bonds, CareGroup Issue, Series 2018J-2, 5.000%, 7/01/53, (UB) | | 7/28 at 100.00 | | | 6,725,706 | |
| | | | |
| | 5,735 | | | (d) | | Massachusetts Educational Financing Authority, Education Loan Revenue Bonds, Issue K, Series 2017B, 4.250%, 7/01/46, (AMT), (UB) | | 7/26 at 100.00 | | | 4,727,411 | |
| | | | |
| | 1,200 | | | | | Massachusetts Educational Financing Authority, Education Loan Revenue Bonds, Issue M, Subordinate Series 2021C, 3.000%, 7/01/51, (AMT) | | 7/31 at 100.00 | | | 701,652 | |
| | | | | | Total Massachusetts | | | | | 12,154,769 | |
| | | | |
| | | | | | Michigan - 3.1% (1.8% of Total Investments) | | | | | | |
| | | | |
| | 1,740 | | | | | Detroit, Wayne County, Michigan, General Obligation Bonds, Social Series 2021A, 5.000%, 4/01/46 | | 4/31 at 100.00 | | | 1,569,665 | |
| | | | |
| | 1,945 | | | | | Michigan Finance Authority, Higher Education Limited Obligation Revenue Bonds, Aquinas College Project, Refunding Series 2021, 5.000%, 5/01/36 | | 5/31 at 100.00 | | | 1,687,414 | |
| | | | |
| | 6,480 | | | (d) | | Michigan Finance Authority, Hospital Revenue Bonds, Henry Ford Health System, Series 2019A, 5.000%, 11/15/48, (UB) | | 11/29 at 100.00 | | | 6,100,179 | |
136
| | | | | | | | | | | | |
Principal
Amount (000) | | | | | Description (a) | | Optional Call
Provisions (b) | | Value | |
| | | | |
| | | | | | Michigan (continued) | | | | | | |
| | $ 5,000 | | | (d) | | Michigan Finance Authority, Michigan, Revenue Bonds, Trinity Health Credit Group, Refunding Series 2017A-MI, 4.000%, 12/01/40, (UB) | | 12/27 at 100.00 | | $ | 4,420,685 | |
| | | | |
| | 830 | | | | | Michigan Finance Authority, Public School Academy Limited Obligation Revenue Bonds, Cesar Chavez Academy Project, Refunding Series 2019, 5.000%, 2/01/33 | | 2/27 at 102.00 | | | 781,782 | |
| | | | |
| | 1,000 | | | | | Michigan Finance Authority, Public School Academy Limited Obligation Revenue Bonds, Hanley International Academy, Inc. Project, Refunding Series 2021, 5.000%, 9/01/40 | | 8/31 at 100.00 | | | 844,154 | |
| | | | |
| | | | | | Michigan Finance Authority, Public School Academy Limited Obligation Revenue Bonds, Holly Academy Project, Refunding Series 2021: | | | | | | |
| | 905 | | | | | 4.000%, 12/01/41 | | 12/31 at 100.00 | | | 664,047 | |
| | 1,000 | | | | | 4.000%, 12/01/51 | | 12/31 at 100.00 | | | 659,376 | |
| | | | |
| | | | | | Michigan Finance Authority, Public School Academy Limited Obligation Revenue Bonds, Hope Academy Project, Refunding Series 2021: | | | | | | |
| | 170 | | | | | 4.400%, 4/01/31, 144A | | 4/28 at 100.00 | | | 139,838 | |
| | 315 | | | | | 4.900%, 4/01/41, 144A | | 4/28 at 100.00 | | | 221,300 | |
| | | | |
| | 1,210 | | | | | Michigan Finance AuthorIty, Public School Academy Limited Obligation Revenue Bonds, Voyageur Academy Project, Refunding Series 2017. Private Placement of 2017, 5.900%, 7/15/46, 144A | | 7/27 at 100.00 | | | 885,153 | |
| | | | |
| | 28,335 | | | | | Michigan Finance Authority, Tobacco Settlement Asset- Backed Bonds, 2006 Sold Tobacco Receipts, Taxable Series 2020B, 0.000%, 6/01/45 | | No Opt. Call | | | 6,237,953 | |
| | | | |
| | 1,410 | | | | | Michigan Public Educational Facilities Authority, Charter School Revenue Bonds, American Montessori Academy, Series 2007, 6.500%, 12/01/37 | | 12/23 at 100.00 | | | 1,355,929 | |
| | | | |
| | 1,000 | | | | | Michigan Public Educational Facilities Authority, Limited Obligation Revenue Bonds, Chandler Park Academy Project, Series 2008, 6.500%, 11/01/35 | | 12/23 at 100.00 | | | 999,962 | |
| | | | |
| | 100,000 | | | | | Michigan Tobacco Settlement Finance Authority, Tobacco Settlement Asset-Backed Revenue Bonds, Capital Appreciation Turbo Term Series 2008C, 0.000%, 6/01/58 | | 6/33 at 11.41 | | | 4,517,120 | |
| | | | |
| | 1,650 | | | | | Summit Academy North, Michigan, Revenue Bonds, Public School Academy, Refunding Series 2021, 4.000%, 11/01/41 | | 11/28 at 103.00 | | | 1,252,209 | |
| | | | |
| | 535 | | | | | Universal Academy, Michigan, Public School Academy Bonds, Refunding Series 2021, 4.000%, 12/01/31 | | 12/28 at 103.00 | | | 486,127 | |
| | | | | | Total Michigan | | | | | 32,822,893 | |
| | | | |
| | | | | | Minnesota - 0.8% (0.5% of Total Investments) | | | | | | |
| | | | |
| | 2,000 | | | | | Bethel, Minnesota, Charter School Lease Revenue Bonds, Level Up Academy, Series 2021A, 5.000%, 6/15/56 | | 6/29 at 102.00 | | | 1,316,036 | |
| | | | |
| | 665 | | | | | Brooklyn Park, Minnesota, Charter School Lease Revenue Bonds, Athlos Leadership Academy Project, Series 2015A, 5.500%, 7/01/35 | | 7/25 at 100.00 | | | 591,654 | |
| | | | |
| | 1,000 | | | | | Columbus, Minnesota, Charter School Lease Revenue Bonds, New Millennium Academy Project, Series 2015A, 6.000%, 7/01/45 | | 7/25 at 100.00 | | | 849,886 | |
| | | | |
| | 505 | | | | | Greenwood, Minnesota, Charter School Lease Revenue Bonds, Main Street School of Performing Arts Project, Series 2016A, 5.000%, 7/01/47 | | 7/26 at 100.00 | | | 382,835 | |
| | | | |
| | 1,190 | | | | | Minneapolis, Minnesota, Charter School Lease Revenue Bonds, Cyber Village Academy Project, Series 2022A, 5.500%, 6/01/57 | | 6/32 at 100.00 | | | 1,025,351 | |
| | | | |
| | 100 | | | | | Minneapolis, Minnesota, Charter School Lease Revenue Bonds, Northeast College Prep Project, Series 2020A, 5.000%, 7/01/55 | | 7/30 at 100.00 | | | 73,562 | |
| | | | |
| | 2,000 | | | | | Saint Paul Housing & Redevelopment Authority, Minnesota, Charter School Lease Revenue Bonds, Community School of Excellence, Series 2023, 5.500%, 3/01/58, 144A | | 3/33 at 100.00 | | | 1,667,344 | |
137
| | |
| NMZ | | Nuveen Municipal High Income Opportunity Fund (continued) |
| | Portfolio of Investments October 31, 2023 |
| | | | | | | | | | | | |
Principal
Amount (000) | | | | | Description (a) | | Optional Call
Provisions (b) | | Value | |
| | | | |
| | | | | | Minnesota (continued) | | | | | | |
| | $ 3,000 | | | | | Saint Paul Port Authority, Minnesota, Solid Waste Disposal Revenue Bonds, Gerdau Saint Paul Steel Mill Project, Series 2012-7, 4.500%, 10/01/37, (AMT), 144A | | 12/23 at 100.00 | | $ | 2,724,408 | |
| | | | | | Total Minnesota | | | | | 8,631,076 | |
| | | | |
| | | | | | Mississippi - 0.1% (0.0% of Total Investments) | | | | | | |
| | | | |
| | 500 | | | (c) | | Mississippi Business Finance Corporation, Gulf Opportunity Zone Revenue Bonds, King Edward Mixed-Use Project, Refunding Series 2019A, 4.250%, 10/15/49, (Mandatory Put 10/15/39), 144A | | 10/26 at 100.00 | | | 397,363 | |
| | | | |
| | 507 | | | | | Mississippi Home Corporation, Multifamily Housing Revenue Bonds, Tupelo Personal Care Apartments, Series 2004-2, 6.125%, 9/01/34, (AMT) | | 12/23 at 100.00 | | | 415,042 | |
| | | | | | Total Mississippi | | | | | 812,405 | |
| | | | |
| | | | | | Missouri - 5.3% (3.1% of Total Investments) | | | | | | |
| | | | |
| | 7,090 | | | (d) | | Kansas City Industrial Development Authority, Missouri, Airport Special Obligation Bonds, Kansas City International Airport Terminal Modernization Project, Series 2019B, 5.000%, 3/01/54, (AMT), (UB) | | 3/29 at 100.00 | | | 6,519,007 | |
| | | | |
| | 5,000 | | | (d) | | Kansas City Industrial Development Authority, Missouri, Airport Special Obligation Bonds, Kansas City International Airport Terminal Modernization Project, Series 2020A, 5.000%, 3/01/57 - AGM Insured, (AMT), (UB) | | 3/30 at 100.00 | | | 4,640,094 | |
| | | | |
| | 655 | | | | | Kansas City Industrial Development Authority, Missouri, Sales Tax Revenue Bonds, Ward Parkway Center Community Improvement District, Senior Refunding & Improvement Series 2016, 5.000%, 4/01/46, 144A | | 4/26 at 100.00 | | | 525,414 | |
| | | | |
| | 9,740 | | | (d) | | Kansas City, Missouri, Special Obligation Bonds, Main Streetcar Expansion Project, Refunding & Improvement Series 2022C, 4.000%, 9/01/46, (UB) | | 9/32 at 100.00 | | | 8,257,387 | |
| | | | |
| | 2,000 | | | | | Liberty, Missouri, Special Obligation Tax Increment and Special Districts Bonds, Liberty Commons Project, Subordinate Lien Series 2015B, 8.500%, 6/15/46, 144A | | 6/25 at 100.00 | | | 1,726,552 | |
| | | | |
| | 15,000 | | | (d) | | Missouri Health and Educational Facilities Authority, Health Facilities Revenue Bonds, Mercy Health, Series 2020, 4.000%, 6/01/53, (UB) | | 6/30 at 100.00 | | | 11,884,096 | |
| | | | |
| | 3,510 | | | (d) | | Missouri Health and Educational Facilities Authority, Health Facilities Revenue Bonds, Mercy Health, Series 2023, 5.000%, 12/01/52, (UB) | | 12/33 at 100.00 | | | 3,389,677 | |
| | | | |
| | | | | | Missouri Southern State University, Auxiliary Enterprise System Revenue Bonds, Series 2021: | | | | | | |
| | 1,000 | | | | | 4.000%, 10/01/34 | | 10/31 at 100.00 | | | 880,345 | |
| | 1,000 | | | | | 4.000%, 10/01/44 | | 10/31 at 100.00 | | | 747,894 | |
| | | | |
| | 483 | | | | | North Outer Forty Transportation Development District, Chesterfield, Missouri, Transportation Development Revenue Notes, Refunding Series 2021A, 4.000%, 12/01/46 | | No Opt. Call | | | 320,011 | |
| | | | |
| | | | | | Saint Louis County, Missouri, Special Obligation Bonds, Community Center Projects, Series 2022A: | | | | | | |
| | 8,050 | | | (d) | | 4.000%, 12/01/40, (UB) | | 12/30 at 100.00 | | | 7,073,942 | |
| | 8,970 | | | (d) | | 4.000%, 12/01/41, (UB) | | 12/30 at 100.00 | | | 7,826,365 | |
| | | | |
| | 1,351 | | | | | Saint Louis, Missouri, Tax Increment Financing Revenue Bonds, Fashion Square Redevelopment Project, Series 2008A, 6.300%, 8/22/26 | | 3/24 at 100.00 | | | 378,280 | |
| | | | |
| | 732 | | | (c) | | Saint Louis, Missouri, Tax Increment Financing Revenue Bonds, Grace Lofts Redevelopment Projects, Series 2007A, 2.100%, 12/31/26 | | No Opt. Call | | | 36,600 | |
| | | | |
| | 1,230 | | | | | Universal City Industrial Development Authority, Missouri, Revenue Bonds, Tax Increment and Special District Markets at Olive Project Series 2023A, 5.500%, 6/15/42 | | 6/33 at 100.00 | | | 1,135,588 | |
| | | | | | Total Missouri | | | | | 55,341,252 | |
138
| | | | | | | | | | | | |
Principal
Amount (000) | | | | | Description (a) | | Optional Call
Provisions (b) | | Value | |
| | | | |
| | | | | | Nebraska - 0.5% (0.3% of Total Investments) | | | | | | |
| | | | |
| | $ 5,495 | | | (d) | | Nebraska Investment Finance Authority, Single Family Housing Revenue Bonds, Social Series 2023E, 4.750%, 9/01/48, (UB) | | No Opt. Call | | $ | 5,055,619 | |
| | | | | | Total Nebraska | | | | | 5,055,619 | |
| | | | |
| | | | | | Nevada - 1.0% (0.6% of Total Investments) | | | | | | |
| | | | |
| | 2,000 | | | (e) | | Director of Nevada State Department of Business & Industry, Environmental Improvement Revenue Bonds, Fulcrum Sierra BioFuels LLC Project, Green Series 2020, 6.750%, 2/15/38, 144A | | 2/31 at 100.00 | | | 201,600 | |
| | | | |
| | 1,000 | | | (e) | | Director of Nevada State Department of Business & Industry, Environmental Improvement Revenue Bonds, Fulcrum Sierra BioFuels LLC Project, Series 2017, 6.250%, 12/15/37, (AMT), 144A | | 12/27 at 100.00 | | | 700,000 | |
| | | | |
| | 2,000 | | | (e) | | Director of Nevada State Department of Business & Industry, Environmental Improvement Revenue Bonds, Fulcrum Sierra Holdings LLC, Green Series 2019, 5.750%, 2/15/38, (AMT), 144A | | 8/29 at 100.00 | | | 200,420 | |
| | | | |
| | 905 | | | | | Henderson, Nevada, Local Improvement District No. T-20 Rainbow Canyon, Local Improvement Bonds, Series 2018, 5.375%, 9/01/48 | | 9/28 at 100.00 | | | 843,948 | |
| | | | |
| | 10,000 | | | (d) | | Las Vegas Convention and Visitors Authority, Nevada, Convention Center Expansion Revenue Bonds, Series 2018B, 4.000%, 7/01/49, (UB) | | 7/28 at 100.00 | | | 8,250,770 | |
| | | | | | Total Nevada | | | | | 10,196,738 | |
| | | | |
| | | | | | New Jersey - 4.3% (2.5% of Total Investments) | | | | | | |
| | | | |
| | 2,500 | | | (d) | | New Jersey Economic Development Authority, New Jersey, Transit Transportation Project Revenue Bonds, Portal North Bridge Project Series 2022A, 5.000%, 11/01/52, (UB) | | 11/32 at 100.00 | | | 2,426,075 | |
| | | | |
| | 9,500 | | | (d),(f) | | New Jersey Economic Development Authority, School Facilities Construction Bonds, Series 2017DDD, 5.000%, 6/15/42, (Pre-refunded 6/15/27), (UB) | | 6/27 at 100.00 | | | 9,936,839 | |
| | | | |
| | 2,080 | | | | | New Jersey Economic Development Authority, Special Facilities Revenue Bonds, Continental Airlines Inc., Series 2000A & 2000B, 5.625%, 11/15/30, (AMT) | | 3/24 at 101.00 | | | 2,079,958 | |
| | | | |
| | 40,000 | | | (d) | | New Jersey Transportation Trust Fund Authority, Transportation System Bonds, Refunding Series 2006C, 0.000%, 12/15/35 - AMBAC Insured, (UB) | | No Opt. Call | | | 22,216,012 | |
| | | | |
| | 6,790 | | | (d) | | New Jersey Transportation Trust Fund Authority, Transportation System Bonds, Series 2020AA, 5.000%, 6/15/50, (UB) | | 12/30 at 100.00 | | | 6,619,546 | |
| | | | |
| | 2,050 | | | | | Tobacco Settlement Financing Corporation, New Jersey, Tobacco Settlement Asset-Backed Bonds, Series 2018B, 5.000%, 6/01/46 | | 6/28 at 100.00 | | | 1,903,279 | |
| | | | | | Total New Jersey | | | | | 45,181,709 | |
| | | | |
| | | | | | New Mexico - 0.4% (0.2% of Total Investments) | | | | | | |
| | | | |
| | 265 | | | | | Mariposa East Public Improvement District, New Mexico, Revenue Bonds, Capital Appreciation Taxable Series 2015D, 0.000%, 3/01/32 | | 3/24 at 67.36 | | | 122,528 | |
| | | | |
| | 40 | | | | | Mariposa East Public Improvement District, New Mexico, Special Levy Revenue Bonds, Series 2015A, 5.900%, 9/01/32 | | 9/25 at 100.00 | | | 36,011 | |
| | | | |
| | 170 | | | | | Mariposa East Public Improvement District, New Mexico, Special Levy Revenue Bonds, Series 2015B, 5.900%, 9/01/32 | | 9/25 at 100.00 | | | 155,100 | |
| | | | |
| | 305 | | | | | Mariposa East Public Improvement District, New Mexico, Special Levy Revenue Bonds, Series 2015C, 5.900%, 9/01/32 | | No Opt. Call | | | 270,071 | |
| | | | |
| | 1,210 | | | | | Mesa Del Sol Public Improvement District 1, Albuquerque, New Mexico, Special Levy Revenue Bonds, Series 2013, 7.250%, 10/01/43 | | 12/23 at 100.00 | | | 1,109,023 | |
| | | | |
| | 1,020 | | | | | Volterra Public Improvement District, Albuquerque, New Mexico, Special Levy Revenue Bonds, Series 2014, 6.750%, 10/01/33 | | 10/24 at 100.00 | | | 944,256 | |
139
| | |
| NMZ | | Nuveen Municipal High Income Opportunity Fund (continued) |
| | Portfolio of Investments October 31, 2023 |
| | | | | | | | | | | | |
Principal
Amount (000) | | | | | Description (a) | | Optional Call
Provisions (b) | | Value | |
| | | | |
| | | | | | New Mexico (continued) | | | | | | |
| | $ 500 | | | | | Winrock Town Center Tax Increment Development District 1, Albuquerque, New Mexico, Gross Receipts Tax Increment Bonds, Senior Lien Series 2022, 4.250%, 5/01/40, 144A | | 5/29 at 103.00 | | $ | 389,470 | |
| | | | |
| | 1,500 | | | | | Winrock Town Center Tax Increment Development District 1, Albuquerque, New Mexico, Gross Receipts Tax Increment Bonds, Subordinate Lien Series 2020, 8.000%, 5/01/40, 144A | | 12/23 at 103.00 | | | 1,271,360 | |
| | | | | | Total New Mexico | | | | | 4,297,819 | |
| | | | |
| | | | | | New York - 12.2% (7.2% of Total Investments) | | | | | | |
| | | | |
| | 1,095 | | | | | Babylon Local Development Corporation II, New York, Education Revenue Bonds, The Academy Charter School Project, Series 2023A, 6.650%, 2/01/53 | | 2/33 at 100.00 | | | 1,006,871 | |
| | | | |
| | 610 | | | | | Build New York City Resource Corporation, New York, Revenue Bonds, New World Preparatory Charter School Project, Series 2021A, 4.000%, 6/15/41 | | 6/31 at 100.00 | | | 458,191 | |
| | | | |
| | 4,255 | | | | | Build NYC Resource Corporation, New York, Revenue Bonds, Albert Einstein College of Medicine, Inc, Series 2015, 5.500%, 9/01/45, 144A | | 9/25 at 100.00 | | | 3,821,282 | |
| | | | |
| | 1,000 | | | | | Build NYC Resource Corporation, New York, Revenue Bonds, Albert Einstein College of Medicine, Inc, Series 2023, 7.250%, 6/01/55, 144A | | 12/30 at 100.00 | | | 923,667 | |
| | | | |
| | | | | | Build NYC Resource Corporation, New York, Revenue Bonds, Family Life Academy Charter School, Series 2020A-1: | | | | | | |
| | 5,000 | | | | | 5.250%, 6/01/40, 144A | | 12/30 at 100.00 | | | 3,934,183 | |
| | 2,000 | | | | | 5.500%, 6/01/55, 144A | | 12/30 at 100.00 | | | 1,443,089 | |
| | | | |
| | | | | | Build NYC Resource Corporation, New York, Revenue Bonds, Family Life Academy Charter School, Series 2020C-1: | | | | | | |
| | 1,000 | | | | | 5.000%, 6/01/40, 144A | | 12/30 at 100.00 | | | 763,371 | |
| | 2,000 | | | | | 5.000%, 6/01/55, 144A | | 12/30 at 100.00 | | | 1,327,591 | |
| | | | |
| | 2,000 | | | | | Dormitory Authority of the State of New York, General Revenue Bonds, American Musical and Dramatic Academy Inc., Series 2023A, 7.250%, 7/01/53, 144A | | 7/33 at 100.00 | | | 1,931,342 | |
| | | | |
| | 9,000 | | | (d) | | Dormitory Authority of the State of New York, General Revenue Bonds, Northwell Health Obligated Group, Series 2022A, 4.250%, 5/01/52 - AGM Insured, (UB) | | 5/32 at 100.00 | | | 7,779,945 | |
| | | | |
| | 1,220 | | | | | Dormitory Authority of the State of New York, General Revenue Bonds, Yeshiva University, Series 2022A, 5.000%, 7/15/50 | | 7/32 at 100.00 | | | 1,069,582 | |
| | | | |
| | 200 | | | | | Dormitory Authority of the State of New York, Revenue Bonds, Orange Regional Medical Center Obligated Group, Series 2017, 5.000%, 12/01/36, 144A | | 6/27 at 100.00 | | | 177,999 | |
| | | | |
| | 650 | | | | | Dormitory Authority of the State of New York, Revenue Bonds, Saint Josephs College, Series 2021, 5.000%, 7/01/51 | | 7/30 at 100.00 | | | 574,018 | |
| | | | |
| | 2,000 | | | | | Dormitory Authority of the State of New York, State Personal Income Tax Revenue Bonds, General Purpose, Bidding Group 5 Series 2021E, 4.000%, 3/15/49 | | 3/32 at 100.00 | | | 1,708,380 | |
| | | | |
| | 1,000 | | | | | Hempstead Town Local Development Corporation, New York, Education Revenue Bonds, The Academy Charter School Project, Series 2020A, 5.730%, 2/01/50 | | 2/30 at 100.00 | | | 820,550 | |
| | | | |
| | | | | | Hempstead Town Local Development Corporation, New York, Education Revenue Bonds, The Academy Charter School Project, Series 2021A: | | | | | | |
| | 2,360 | | | | | 4.050%, 2/01/31 | | 2/30 at 100.00 | | | 2,070,964 | |
| | 1,000 | | | | | 4.600%, 2/01/51 | | 2/30 at 100.00 | | | 674,628 | |
| | | | |
| | 1,000 | | | (c) | | Madison County Capital Resource Corporation, New York, Revenue Bonds, Cazenovia College Project, Series 2019A, 5.500%, 9/01/23 | | 9/22 at 100.00 | | | 580,000 | |
140
| | | | | | | | | | | | |
Principal Amount (000) | | | | | Description (a) | | Optional Call Provisions (b) | | Value | |
| | | | |
| | | | | | New York (continued) | | | | | | |
| | $ 10,000 | | | (d) | | Metropolitan Transportation Authority, New York, Transportation Revenue Bonds, Green Climate Bond Certified Series 2020C-1, 5.000%, 11/15/50, (UB) | | 5/30 at 100.00 | | $ | 9,524,476 | |
| | | | |
| | 1,000 | | | (d) | | Metropolitan Transportation Authority, New York, Transportation Revenue Bonds, Green Climate Bond Certified Series 2020D-1, 5.000%, 11/15/43, (UB) | | 11/30 at 100.00 | | | 977,900 | |
| | | | |
| | 1,000 | | | (d) | | Metropolitan Transportation Authority, New York, Transportation Revenue Bonds, Green Climate Bond Certified Series 2020D-3, 4.000%, 11/15/49, (UB) | | 11/30 at 100.00 | | | 807,811 | |
| | | | |
| | 11,850 | | | (d) | | New York City Housing Development Corporation, New York, Multifamily Housing Revenue Bonds, Sustainable Neighborhood Green Series 2018K, 4.125%, 11/01/53, (UB) | | 9/26 at 100.00 | | | 9,604,097 | |
| | | | |
| | | | | | New York City Industrial Development Agency, New York, Civic Facility Revenue Bonds, Bronx Parking Development Company, LLC Project, Series 2007: | | | | | | |
| | 1,500 | | | (c) | | 5.750%, 10/01/37 | | 12/23 at 100.00 | | | 1,200,000 | |
| | 5,000 | | | (c) | | 2.350%, 10/01/46 | | 12/23 at 100.00 | | | 4,000,000 | |
| | | | |
| | 2,500 | | | (d) | | New York City, New York, General Obligation Bonds, Fiscal 2024 Series A, 5.000%, 8/01/51, (UB) | | 8/33 at 100.00 | | | 2,481,992 | |
| | | | |
| | 2,000 | | | | | New York Counties Tobacco Trust IV, Tobacco Settlement Pass-Through Bonds, Turbo Term Series 2005A, 5.000%, 6/01/45 | | 11/23 at 100.00 | | | 1,712,211 | |
| | | | |
| | 1,000 | | | | | New York Liberty Development Corporation, New York, Liberty Revenue Bonds, 3 World Trade Center Project, Class 1 Series 2014, 5.000%, 11/15/44, 144A | | 11/24 at 100.00 | | | 895,650 | |
| | | | |
| | 2,250 | | | | | New York Liberty Development Corporation, New York, Liberty Revenue Bonds, 3 World Trade Center Project, Class 2 Series 2014, 5.150%, 11/15/34, 144A | | 11/24 at 100.00 | | | 2,128,444 | |
| | | | |
| | 7,000 | | | | | New York Liberty Development Corporation, New York, Liberty Revenue Bonds, 3 World Trade Center Project, Class 3 Series 2014, 7.250%, 11/15/44, 144A | | 11/24 at 100.00 | | | 7,000,383 | |
| | | | |
| | 2,000 | | | | | New York State Urban Development Corporation, State Sales Tax Revenue Bonds, Series 2021A, 3.000%, 3/15/50 | | 9/31 at 100.00 | | | 1,336,212 | |
| | | | |
| | | | | | New York Transportation Development Corporation, New York, Special Facilities Bonds, LaGuardia Airport Terminal B Redevelopment Project, Series 2016A: | | | | | | |
| | 1,000 | | | | | 5.000%, 7/01/46, (AMT) | | 7/24 at 100.00 | | | 920,852 | |
| | 15,990 | | | (d) | | 5.250%, 1/01/50, (AMT), (UB) | | 7/24 at 100.00 | | | 15,069,521 | |
| | | | |
| | 10,000 | | | | | New York Transportation Development Corporation, New York, Special Facility Revenue Bonds, American Airlines, Inc. John F Kennedy International Airport Project, Refunding Series 2016, 5.000%, 8/01/31, (AMT) | | 11/23 at 100.00 | | | 9,681,050 | |
| | | | |
| | 3,070 | | | | | New York Transportation Development Corporation, New York, Special Facility Revenue Bonds, American Airlines, Inc. John F Kennedy International Airport Project, Series 2020, 5.375%, 8/01/36, (AMT) | | 8/30 at 100.00 | | | 2,974,771 | |
| | | | |
| | 5,000 | | | | | New York Transportation Development Corporation, Special Facility Revenue Bonds, Delta Air Lines, Inc. - LaGuardia Airport Terminals C&D Redevelopment Project, Series 2023, 5.625%, 4/01/40, (AMT) | | 4/31 at 100.00 | | | 4,981,172 | |
| | | | |
| | 1,000 | | | | | Niagara Area Development Corporation, New York, Revenue Bonds; Catholic Health System, Inc, Series 2022, 4.500%, 7/01/52 | | 7/32 at 100.00 | | | 684,193 | |
| | | | |
| | 9,000 | | | (d) | | Port Authority of New York and New Jersey, Consolidated Revenue Bonds, Two Hundred Thirty Two Series 2022, 4.625%, 8/01/52, (AMT), (UB) | | 8/32 at 100.00 | | | 8,062,710 | |
| | | | |
| | 7,000 | | | (d) | | Port Authority of New York and New Jersey, Consolidated Revenue Bonds, Two Hundred Thirty-Six Series 2022, 5.000%, 1/15/52, (AMT), (UB) | | 1/33 at 100.00 | | | 6,625,957 | |
141
| | |
| NMZ | | Nuveen Municipal High Income Opportunity Fund (continued) |
| | Portfolio of Investments October 31, 2023 |
| | | | | | | | | | | | |
Principal Amount (000) | | | | | Description (a) | | Optional Call Provisions (b) | | Value | |
| | | | |
| | | | | | New York (continued) | | | | | | |
| | $ 855 | | | | | Suffolk Tobacco Asset Securitization Corporation, New York, Tobacco Settlement Asset-Backed Bonds, Series 2021B-2, 0.000%, 6/01/66 | | 6/31 at 27.72 | | $ | 72,491 | |
| | | | |
| | | | | | Westchester County Local Development Corporation, New York, Revenue Bond, Purchase Senior Learning Community, Inc. Project, Accd Inv Series 2021A: | | | | | | |
| | 5,000 | | | | | 4.500%, 7/01/56, 144A | | 7/27 at 104.00 | | | 3,248,606 | |
| | 1,025 | | | | | 5.000%, 7/01/56, 144A | | 7/27 at 104.00 | | | 729,148 | |
| | | | |
| | 2,475 | | | | | Westchester County Local Development Corporation, New York, Revenue Bonds, Westchester Medical Center Obligated Group Project, Refunding Series 2016, 5.000%, 11/01/46 | | 11/25 at 100.00 | | | 1,994,494 | |
| | | | |
| | 250 | | | | | Western Regional Off-Track Betting Corporation, New York, Tax Exempt Revenue Bonds, Additional Secured General Obligation Series 2021, 4.125%, 12/01/41, 144A | | 6/31 at 100.00 | | | 173,720 | |
| | | | | | Total New York | | | | | 127,953,514 | |
| | | | |
| | | | | | North Carolina - 0.3% (0.2% of Total Investments) | | | | | | |
| | | | |
| | 10,000 | | | | | North Carolina Turnpike Authority, Triangle Expressway System Revenue Bonds, Capital Appreciation Series 2019, 0.000%, 1/01/48 | | 1/30 at 55.97 | | | 2,632,701 | |
| | | | | | Total North Carolina | | | | | 2,632,701 | |
| | | | |
| | | | | | North Dakota - 0.1% (0.1% of Total Investments) | | | | | | |
| | | | |
| | 2,000 | | | (c) | | Williston, North Dakota, Multifamily Housing Revenue Bonds, Eagle Crest Apartments LLC Project, Series 2013, 7.750%, 9/01/38 | | 12/23 at 100.00 | | | 1,400,000 | |
| | | | | | Total North Dakota | | | | | 1,400,000 | |
| | | | |
| | | | | | Ohio - 4.3% (2.5% of Total Investments) | | | | | | |
| | | | |
| | 137,120 | | | | | Buckeye Tobacco Settlement Financing Authority, Ohio, Tobacco Settlement Asset-Backed Revenue Bonds, Refunding Senior Lien Capital Appreciation Series 2020B-3 Class 2, 0.000%, 6/01/57 | | 6/30 at 22.36 | | | 11,569,692 | |
| | | | |
| | 990 | | | | | Buckeye Tobacco Settlement Financing Authority, Ohio, Tobacco Settlement Asset-Backed Revenue Bonds, Refunding Senior Lien Series 2020B-2 Class 2, 5.000%, 6/01/55 | | 6/30 at 100.00 | | | 811,003 | |
| | | | |
| | 935 | | | | | Cleveland-Cuyahoga County Port Authority, Ohio, Tax Increment Financing Revenue Bonds, Flats East Bank Project, Refunding Senior Series 2021A, 4.000%, 12/01/55, 144A | | 12/29 at 100.00 | | | 666,998 | |
| | | | |
| | 340 | | | | | Evans Farm New Communty Authority, Ohio, Community Development Charge Revenue Bonds, Evans Farm Mixed-Use Project, Series 2020, 4.000%, 12/01/46 | | 6/29 at 100.00 | | | 244,352 | |
| | | | |
| | 1,000 | | | | | Jefferson County Port Authority, Ohio, Economic Develoepment Revenue Bonds, JSW Steel USA Ohio, Inc. Project, Series 2021, 3.500%, 12/01/51, (AMT) | | 12/31 at 100.00 | | | 619,527 | |
| | | | |
| | 11,160 | | | (d) | | Montgomery County, Ohio, Hospital Facilities Revenue Bonds, Kettering Health Network Obligated Group, Series 2016, 4.000%, 8/01/47, (UB) | | 8/26 at 100.00 | | | 8,817,113 | |
| | | | |
| | 1,300 | | | | | Ohio Air Quality Development Authority, Ohio, Pollution Control Revenue Bonds, FirstEnergy Generation Corporation Project, Refunding Series 2009D, 3.375%, 8/01/29, (Mandatory Put 9/15/21) | | No Opt. Call | | | 1,145,276 | |
| | | | |
| | 1,000 | | | | | Ohio Higher Educational Facility Commission, Senior Hospital Parking Revenue Bonds, University Circle Incorporated 2020 Project, Series 2020, 5.000%, 1/15/50 | | 1/30 at 100.00 | | | 889,130 | |
| | | | |
| | 11,300 | | | | | Ohio Water Development Authority, Pollution Control Revenue Refunding Bonds, FirstEnergy Nuclear Generating Corporation Project, Series 2010B, 4.750%, 6/01/33, (Mandatory Put 6/01/22) | | No Opt. Call | | | 10,336,682 | |
142
| | | | | | | | | | | | |
Principal Amount (000) | | | | | Description (a) | | Optional Call Provisions (b) | | Value | |
| | | | |
| | | | | | Ohio (continued) | | | | | | |
| | $ 990 | | | | | Port of Greater Cincinnati Development Authority, Ohio, Special Obligation Tax Increment Financing Revenue Bonds, Cooperative Township Public Parking Project, Gallery at Kenwood, Senior Lien Series 2019A, 5.000%, 11/01/51 | | 11/30 at 100.00 | | $ | 738,702 | |
| | | | |
| | 8,500 | | | | | Southern Ohio Port Authority, Ohio, Facility Revenue Bonds, Purecycle Project, Series 2020A, 7.000%, 12/01/42, (AMT), 144A | | 12/27 at 103.00 | | | 5,724,524 | |
| | | | |
| | 2,000 | | | | | Southern Ohio Port Authority, Ohio, Facility Revenue Bonds, Purecycle Project, Series 2020B, 10.000%, 12/01/25, (AMT), 144A | | 12/24 at 105.00 | | | 1,219,333 | |
| | | | |
| | 2,000 | | | | | Tuscarawas County Economic Development and Finance Alliance, Ohio, Higher Education Facilities Revenue Bonds, Ashland University, Refunding & Improvement Series 2015, 6.000%, 3/01/45 | | 3/25 at 100.00 | | | 1,823,085 | |
| | | | | | Total Ohio | | | | | 44,605,417 | |
| | | | |
| | | | | | Oklahoma - 1.9% (1.1% of Total Investments) | | | | | | |
| | | | |
| | | | | | Oklahoma Development Finance Authority, Health System Revenue Bonds, OU Medicine Project, Series 2018B: | | | | | | |
| | 1,000 | | | | | 5.500%, 8/15/52 | | 8/28 at 100.00 | | | 867,041 | |
| | 1,000 | | | | | 5.500%, 8/15/57 | | 8/28 at 100.00 | | | 855,196 | |
| | | | |
| | 1,200 | | | | | Oklahoma Development Finance Authority, Health System Revenue Bonds, OU Medicine Project, Taxable Series 2022, 5.500%, 8/15/44 | | 8/32 at 100.00 | | | 1,034,753 | |
| | | | |
| | 15,000 | | | | | Tulsa Municipal Airport Trust, Oklahoma, Revenue Bonds, American Airlines Inc., Refunding Series 2000B, 5.500%, 6/01/35, (AMT) | | 12/23 at 100.00 | | | 14,847,512 | |
| | | | |
| | 2,600 | | | | | Tulsa Municipal Airport Trust, Oklahoma, Revenue Bonds, American Airlines Inc., Refunding Series 2001B, 5.500%, 12/01/35, (AMT) | | 12/23 at 100.00 | | | 2,572,770 | |
| | | | | | Total Oklahoma | | | | | 20,177,272 | |
| | | | |
| | | | | | Oregon - 0.1% (0.1% of Total Investments) | | | | | | |
| | | | |
| | | | | | Clackamas and Washington Counties School District 3JT, Oregon, General Obligation Bonds, Series 2020A: | | | | | | |
| | 1,750 | | | | | 0.000%, 6/15/49 | | 6/30 at 57.54 | | | 396,553 | |
| | 2,000 | | | | | 0.000%, 6/15/50 | | 6/30 at 55.67 | | | 427,145 | |
| | | | | | Total Oregon | | | | | 823,698 | |
| | | | |
| | | | | | Pennsylvania - 1.7% (1.0% of Total Investments) | | | | | | |
| | | | |
| | 2,280 | | | | | Allentown Commercial and Industrial Development Authority, Pennsylvania, Revenue Bonds, Arts Academy Charter Middle School Foundation Project, Series 2022A, 5.000%, 6/15/57, 144A | | 6/29 at 103.00 | | | 1,728,034 | |
| | | | |
| | 930 | | | | | Allentown Neighborhood Improvement Zone Development Authority, Pennsylvania, Tax Revenue Bonds, 615 Waterfront Project, Senior Series 2021, 6.000%, 5/01/42, 144A | | 5/31 at 100.00 | | | 907,698 | |
| | | | |
| | 1,250 | | | | | Allentown Neighborhood Improvement Zone Development Authority, Pennsylvania, Tax Revenue Bonds, City Center Project, Subordinate Lien, Series 2018, 5.125%, 5/01/32, 144A | | 5/28 at 100.00 | | | 1,231,496 | |
| | | | |
| | 500 | | | | | Beaver County Industrial Development Authority, Pennsylvania, Pollution Control Revenue Refunding Bonds, FirstEnergy Generation Project, Series 2008B, 3.750%, 10/01/47 | | 4/31 at 100.00 | | | 334,135 | |
| | | | |
| | 290 | | | | | Berks County Municipal Authority, Pennsylvania, Revenue Bonds, Alvernia University Project, Series 2020, 5.000%, 10/01/49 | | 10/29 at 100.00 | | | 233,356 | |
| | | | |
| | 1,000 | | | | | Dauphin County General Authority, Pennsylvania, Revenue Bonds, Harrisburg University of Science & Technology Project, Series 2017, 5.125%, 10/15/41, 144A | | 10/27 at 100.00 | | | 724,706 | |
| | | | |
| | 1,500 | | | | | Dauphin County General Authority, Pennsylvania, Revenue Bonds, Harrisburg University of Science & Technology Project, Series 2020, 6.250%, 10/15/53, 144A | | 10/28 at 100.00 | | | 1,152,579 | |
143
| | |
| NMZ | | Nuveen Municipal High Income Opportunity Fund (continued) |
| | Portfolio of Investments October 31, 2023 |
| | | | | | | | | | | | |
Principal Amount (000) | | | | | Description (a) | | Optional Call Provisions (b) | | Value | |
| | | | |
| | | | | | Pennsylvania (continued) | | | | | | |
| | $ 1,245 | | | | | Lehigh County General Purpose Authority, Pennsylvania, Revenue Bonds, Good Shepherd Group, Series 2021A, 4.000%, 11/01/51 | | 11/31 at 100.00 | | $ | 880,081 | |
| | | | |
| | | | | | Lehigh County Industrial Development Authority, Pennsylvania, Charter School Revenue Bonds, Seven Generations Charter School, Series 2021A: | | | | | | |
| | 675 | | | | | 4.000%, 5/01/31 | | 5/30 at 100.00 | | | 606,159 | |
| | 2,000 | | | | | 4.000%, 5/01/51 | | 5/30 at 100.00 | | | 1,321,971 | |
| | | | |
| | 1,720 | | | (c),(e) | | Pennsylvania Economic Development Financing Authority, Exempt Facilities Revenue Bonds, KDC Agribusiness Fairless Hills LLC Project, Series 2020A-1, 10.000%, 12/01/40, 144A | | 6/30 at 100.00 | | | 172 | |
| | | | |
| | 1,720 | | | (c),(e) | | Pennsylvania Economic Development Financing Authority, Exempt Facilities Revenue Bonds, KDC Agribusiness Fairless Hills LLC Project, Series 2020A-2, 10.000%, 12/01/40, (AMT), 144A | | 6/30 at 100.00 | | | 172 | |
| | | | |
| | 2,970 | | | (c),(e) | | Pennsylvania Economic Development Financing Authority, Exempt Facilities Revenue Bonds, KDC Agribusiness Fairless Hills LLC Project, Series 2021A, 10.000%, 12/01/31 | | No Opt. Call | | | 297 | |
| | | | |
| | 7,730 | | | (d) | | Pennsylvania Economic Development Financing Authority, Pennsylvania, Private Activity Revenue Bonds, The PennDOT Major Bridges Package One Project, Series 2022, 5.000%, 12/31/57 - AGM Insured, (AMT), (UB) | | 12/32 at 100.00 | | | 7,435,881 | |
| | | | |
| | 1,000 | | | | | Philadelphia Authority for Industrial Development, Pennsylvania, Revenue Bonds, Mariana Bracetti Academy Project, Series 2020A, 5.375%, 6/15/50, 144A | | 12/27 at 100.00 | | | 817,304 | |
| | | | |
| | 1,000 | | | | | Philadelphia Authority for Industrial Development, Pennsylvania, Revenue Bonds, Mariana Bracetti Academy Project, Taxable Series 2020B, 5.125%, 12/15/44, 144A | | 12/27 at 100.00 | | | 819,921 | |
| | | | |
| | 160 | | | | | The Redevelopment Authority of the City of Scranton, Lackawanna county, Pennsylvania, Guaranteed Lease Revenue Bonds, Series 2016A, 5.000%, 11/15/28 | | 5/24 at 100.00 | | | 156,107 | |
| | | | | | Total Pennsylvania | | | | | 18,350,069 | |
| | | | |
| | | | | | Puerto Rico - 10.5% (6.2% of Total Investments) | | | | | | |
| | | | |
| | 682 | | | | | HTA Claas 6, Puerto Rico Highway and Transportation Authority Highway Revenue Bonds, Series 2022, 5.250%, 7/01/38 | | 11/23 at 100.00 | | | 682,335 | |
| | | | |
| | | | | | Puerto Rico Aqueduct and Sewerage Authority, Revenue Bonds, Refunding Senior Lien Series 2020A: | | | | | | |
| | 2,000 | | | | | 5.000%, 7/01/35, 144A | | 7/30 at 100.00 | | | 1,917,915 | |
| | 3,000 | | | | | 5.000%, 7/01/47, 144A | | 7/30 at 100.00 | | | 2,668,251 | |
| | | | |
| | 8,625 | | | (c),(e) | | Puerto Rico Electric Power Authority, Power Revenue Bonds, Federally Taxable Build America Bonds, Series 2010YY, 4.050%, 7/01/40 | | 12/23 at 100.00 | | | 1,981,016 | |
| | | | |
| | | | | | Puerto Rico Electric Power Authority, Power Revenue Bonds, Refunding Series 2012A: | | | | | | |
| | 4,835 | | | (c),(e) | | 3.957%, 7/01/42 | | 12/23 at 100.00 | | | 1,182,651 | |
| | 185 | | | (c),(e) | | 5.050%, 7/01/42 | | 12/23 at 100.00 | | | 43,999 | |
| | | | |
| | 2,000 | | | (c),(e) | | Puerto Rico Electric Power Authority, Power Revenue Bonds, Series 2003NN, 5.500%, 7/01/20 | | No Opt. Call | | | 467,595 | |
| | | | |
| | 1,025 | | | (c),(e) | | Puerto Rico Electric Power Authority, Power Revenue Bonds, Series 2007TT, 3.957%, 7/01/37 | | 12/23 at 100.00 | | | 247,487 | |
| | | | |
| | | | | | Puerto Rico Electric Power Authority, Power Revenue Bonds, Series 2010AAA: | | | | | | |
| | 5,690 | | | (c),(e) | | 5.250%, 7/01/23 | | No Opt. Call | | | 1,390,231 | |
| | 3,000 | | | (c),(e) | | 5.250%, 7/01/25 | | 12/23 at 100.00 | | | 681,250 | |
| | 1,186 | | | (c),(e) | | 3.978%, 7/01/28 | | 12/23 at 100.00 | | | 285,928 | |
| | 890 | | | (c),(e) | | 5.250%, 7/01/29 | | 12/23 at 100.00 | | | 214,566 | |
| | 658 | | | (c),(e) | | 5.250%, 7/01/31 | | 12/23 at 100.00 | | | 158,634 | |
144
| | | | | | | | | | | | |
Principal Amount (000) | | | | | Description (a) | | Optional Call Provisions (b) | | Value | |
| | | | |
| | | | | | Puerto Rico (continued) | | | | | | |
| | $ 405 | | | (c),(e) | | Puerto Rico Electric Power Authority, Power Revenue Bonds, Series 2010CCC, 5.000%, 7/01/28 | | 12/23 at 100.00 | | $ | 96,429 | |
| | | | |
| | 1,350 | | | (c),(e) | | Puerto Rico Electric Power Authority, Power Revenue Bonds, Series 2010XX, 5.250%, 7/01/40 | | 12/23 at 100.00 | | | 333,388 | |
| | | | |
| | 4,000 | | | (c),(e) | | Puerto Rico Electric Power Authority, Power Revenue Bonds, Series 2010ZZ, 5.250%, 7/01/21 | | 7/20 at 100.00 | | | 1,072,861 | |
| | | | |
| | 1,000 | | | (c),(e) | | Puerto Rico Electric Power Authority, Power Revenue Bonds, Series 2013A, 6.750%, 7/01/36 | | 12/23 at 100.00 | | | 224,862 | |
| | | | |
| | | | | | Puerto Rico Electric Power Authority, Power Revenue Bonds, Series WW: | | | | | | |
| | 360 | | | (c),(e) | | 5.375%, 7/01/23 | | No Opt. Call | | | 86,217 | |
| | 710 | | | (c),(e) | | 5.375%, 7/01/24 | | 6/23 at 100.00 | | | 170,038 | |
| | 375 | | | (c),(e) | | 3.978%, 7/01/33 | | 12/23 at 100.00 | | | 87,975 | |
| | | | |
| | 5,500 | | | (c),(e) | | Puerto Rico Electric Power Authority, Power Revenue Bonds, Taxable Build America Bond Series 2010EE, 4.044%, 7/01/32 | | 12/23 at 100.00 | | | 1,265,480 | |
| | | | |
| | 8,500 | | | | | Puerto Rico Highway and Transportation Authority, Restructured Toll Revenue Bonds, Series 2022A, 5.000%, 7/01/62 | | 7/32 at 100.00 | | | 8,393,750 | |
| | | | |
| | | | | | Puerto Rico Sales Tax Financing Corporation, Sales Tax Revenue Bonds, Restructured 2018A-1: | | | | | | |
| | 42,500 | | | | | 0.000%, 7/01/46 | | 7/28 at 41.38 | | | 10,587,868 | |
| | 183,530 | | | | | 0.000%, 7/01/51 | | 7/28 at 30.01 | | | 33,175,232 | |
| | 2,500 | | | | | 4.750%, 7/01/53 | | 7/28 at 100.00 | | | 2,117,802 | |
| | 5,250 | | | | | 5.000%, 7/01/58 | | 7/28 at 100.00 | | | 4,596,416 | |
| | | | |
| | 12,000 | | | | | Puerto Rico Sales Tax Financing Corporation, Sales Tax Revenue Bonds, Taxable Restructured Cofina Project Series 2019A-2, 4.784%, 7/01/58 | | 7/28 at 100.00 | | | 10,093,242 | |
| | | | |
| | | | | | Puerto Rico, General Obligation Bonds, Restructured Series 2022A-1: | | | | | | |
| | 0 | | | (h) | | 5.625%, 7/01/27 | | No Opt. Call | | | 93 | |
| | 4,201 | | | | | 0.000%, 7/01/33 | | 7/31 at 89.94 | | | 2,406,328 | |
| | 6,979 | | | | | 4.000%, 7/01/41 | | 7/31 at 103.00 | | | 5,400,768 | |
| | 14,018 | | | | | 4.000%, 7/01/46 | | 7/31 at 103.00 | | | 10,275,912 | |
| | | | |
| | 16,579 | | | | | Puerto Rico, General Obligation Bonds, Vintage CW NT Claims Taxable Series 2022, 0.000%, 11/01/43 | | No Opt. Call | | | 8,268,808 | |
| | | | | | Total Puerto Rico | | | | | 110,575,327 | |
| | | | |
| | | | | | Rhode Island - 0.2% (0.1% of Total Investments) | | | | | | |
| | | | |
| | 18,260 | | | | | Rhode Island Tobacco Settlement Financing Corporation, Tobacco Settlement Asset-Backed Bonds, Series 2007A, 0.000%, 6/01/52 | | 11/23 at 18.50 | | | 2,562,672 | |
| | | | | | Total Rhode Island | | | | | 2,562,672 | |
| | | | |
| | | | | | South Carolina - 2.2% (1.3% of Total Investments) | | | | | | |
| | | | |
| | 390 | | | | | Hardeeville, South Carolina, Special Assessment Revenue Bonds, East Argent Improvement District, Series 2021, 4.000%, 5/01/52, 144A | | 5/29 at 100.00 | | | 247,402 | |
| | | | |
| | | | | | Lancaster County, South Carolina, Special Assessment Bonds, Edgewater II Improvement District, Capital Appreciation Series 2007-A&B: | | | | | | |
| | 7,335 | | | | | 0.000%, 11/01/39 | | 12/23 at 29.81 | | | 1,737,123 | |
| | 7,120 | | | | | 0.000%, 11/01/39 | | 12/23 at 29.81 | | | 1,468,320 | |
| | | | |
| | 400 | | | | | South Carolina Jobs-Economic Development Authority, Economic Development Revenue Bonds, Hilton Head Christian Academy, Series 2020, 5.000%, 1/01/55, 144A | | 1/30 at 100.00 | | | 307,676 | |
| | | | |
| | 940 | | | | | South Carolina Jobs-Economic Development Authority, Economic Development Revenue Bonds, Midland Valley Preparatory School Project, Series 2014, 7.750%, 11/15/45, 144A | | 11/26 at 100.00 | | | 961,512 | |
145
| | |
| NMZ | | Nuveen Municipal High Income Opportunity Fund (continued) |
| | Portfolio of Investments October 31, 2023 |
| | | | | | | | | | | | |
Principal Amount (000) | | | | | Description (a) | | Optional Call Provisions (b) | | Value | |
| | | | |
| | | | | | South Carolina (continued) | | | | | | |
| | $ 2,960 | | | | | South Carolina Jobs-Economic Development Authority, Economic Development Revenue Bonds, Patriots Place Apartments Project, Series 2022A-1, 5.750%, 6/01/52 | | No Opt. Call | | $ | 1,835,156 | |
| | | | |
| | 1,000 | | | | | South Carolina Jobs-Economic Development Authority, Educational Facilities Revenue Bonds, Horse Creek Academy Project, Series 2021A, 5.000%, 11/15/55, 144A | | 11/26 at 100.00 | | | 780,198 | |
| | | | |
| | 4,215 | | | | | South Carolina Jobs-Economic Development Authority, Educational Facilities Revenue Bonds, Lowcountry Leadership Charter School Project, Series 2019A, 5.000%, 12/01/49, 144A | | 12/29 at 100.00 | | | 3,452,993 | |
| | | | |
| | 235 | | | | | South Carolina Jobs-Economic Development Authority, Educational Facilities Revenue Bonds, Virtus Academy Project, Series 2023A, 7.125%, 6/15/58, 144A | | 6/31 at 100.00 | | | 221,123 | |
| | | | |
| | | | | | South Carolina Jobs-Economic Development Authority, Hospital Revenue Bonds, Prisma Health Obligated Group, Series 2018A: | | | | | | |
| | 2,980 | | | (d) | | 5.000%, 5/01/38, (UB) | | 5/28 at 100.00 | | | 2,928,926 | |
| | 9,895 | | | (d) | | 5.000%, 5/01/48, (UB) | | 5/28 at 100.00 | | | 9,382,288 | |
| | | | | | Total South Carolina | | | | | 23,322,717 | |
| | | | |
| | | | | | Tennessee - 0.8% (0.5% of Total Investments) | | | | | | |
| | | | |
| | 1,000 | | | (c) | | Memphis/Shelby County Economic Development Growth Engine Industrial Development Board, Tennessee, Tax Increment Revenue Bonds, Graceland Project, Senior Series 2017A, 5.625%, 1/01/46 | | 7/27 at 100.00 | | | 561,503 | |
| | | | |
| | 150 | | | | | Metropolitan Government of Nashville-Davidson County Industrial Development Board, Tennessee, Special Assessment Revenue Bonds, South Nashville Central Business Improvement District, Series 2021A, 4.000%, 6/01/51, 144A | | 6/31 at 100.00 | | | 110,591 | |
| | | | |
| | 5,000 | | | (c) | | The Health and Educational Facilities Board of the City of Franklin, Tennessee, Revenue Bonds, Provision Cares Proton Therapy Center, Nashville Project, Series 2017A, 7.500%, 6/01/47, 144A | | 6/27 at 100.00 | | | 1,050,000 | |
| | | | |
| | 6,024 | | | | | The Tennessee Energy Acquisition Corporation, Gas Revenue Bonds, Series 2006B, 5.625%, 9/01/26 | | No Opt. Call | | | 6,024,915 | |
| | | | |
| | 900 | | | (c) | | Wilson County Health and Educational Facilities Board, Tennessee, Senior Living Revenue Bonds, Rutland Place Inc. Project, Series 2015A, 4.400%, 1/01/46, 144A | | 12/23 at 100.00 | | | 543,192 | |
| | | | | | Total Tennessee | | | | | 8,290,201 | |
| | | | |
| | | | | | Texas - 6.5% (3.9% of Total Investments) | | | | | | |
| | | | |
| | 1,000 | | | | | Abilene Convention Center Hotel Development Corporation, Texas, Hotel Revenue Bonds, First-Lien Series 2021A, 4.000%, 10/01/50 | | 10/31 at 100.00 | | | 679,878 | |
| | | | |
| | 2,000 | | | | | Abilene Convention Center Hotel Development Corporation, Texas, Hotel Revenue Bonds, Second-Lien Series 2021B, 5.000%, 10/01/50, 144A | | 10/31 at 100.00 | | | 1,501,798 | |
| | | | |
| | 1,000 | | | | | Anna, Texas, Special Assessment Revenue Bonds, Sherley Tract Public Improvement District 2 Area 1 Project, Series 2021, 4.000%, 9/15/41, 144A | | 9/31 at 100.00 | | | 782,828 | |
| | | | |
| | 1,000 | | | | | Arlington Higher Education Finance Corporation, Texas, Education Revenue Bonds, Brooks Academies, Series 2021A, 5.000%, 6/15/51 | | 6/26 at 100.00 | | | 773,911 | |
| | | | |
| | 1,000 | | | | | Arlington Higher Education Finance Corporation, Texas, Education Revenue Bonds, Legacy Traditional Schools - Texas Project, Refunding Series 2021A, 4.500%, 2/15/56 | | 2/30 at 100.00 | | | 606,334 | |
| | | | |
| | 4,300 | | | | | Aubrey, Denton County, Texas, Special Assessment Revenue Bonds, Jackson Ridge Public Improvement District Phase 1 Project, Series 2015, 7.250%, 9/01/45 | | 3/24 at 103.00 | | | 4,380,500 | |
146
| | | | | | | | | | | | |
Principal Amount (000) | | | | | Description (a) | | Optional Call Provisions (b) | | Value | |
| | | | |
| | | | | | Texas (continued) | | | | | | |
| | $ 830 | | | | | Austin, Travis, Williamson and Hays Counties, Texas, Special Assessment Revenue Bonds, Estancia Hill Country Public Improvement District, Series 2013, 6.000%, 11/01/28 | | 12/23 at 100.00 | | $ | 828,125 | |
| | | | |
| | 300 | | | | | Bee Cave, Travis County, Texas, Special Assessment Revenue Bonds, Backyard Public Improvement District Project, Series 2021, 5.250%, 9/01/51, 144A | | 9/31 at 100.00 | | | 252,065 | |
| | | | |
| | 500 | | | | | Celina, Texas, Special Assessment Revenue Bonds, Celina Sutton Fields II Public Improvement District Neighborhood Improvement Areas 2-3 Project, Series 2019, 4.250%, 9/01/49, 144A | | 9/29 at 100.00 | | | 382,146 | |
| | | | |
| | 1,000 | | | | | Celina, Texas, Special Assessment Revenue Bonds, North Sky Public Improvement District Major Improvements Area Project, Series 2023, 6.125%, 9/01/52, 144A | | 9/33 at 100.00 | | | 910,971 | |
| | | | |
| | 1,500 | | | | | Celina, Texas, Special Assessment Revenue Bonds, Sutton Fields II Public Improvement District Neighborhood Improvement Area 5 Project, Series 2022, 4.000%, 9/01/51, 144A | | 9/31 at 100.00 | | | 1,083,643 | |
| | | | |
| | 500 | | | | | Celina, Texas, Special Assessment Revenue Bonds, The Parks at Wilson Creek Public Improvement District Initial Major Improvement Project, Series 2021, 4.500%, 9/01/51, 144A | | 9/31 at 100.00 | | | 387,752 | |
| | | | |
| | 1,765 | | | | | Comal County Meyer Ranch Municipal Utility District, Texas, General Obligation Bonds, Road Series 2021, 3.000%, 8/15/51 | | 8/26 at 100.00 | | | 965,623 | |
| | | | |
| | 675 | | | | | Conroe Local Government Corporation, Texas, Hotel Revenue and Contract Revenue Bonds, Subordinate Third Lien Series 2021C, 4.000%, 10/01/50 | | 10/31 at 100.00 | | | 517,549 | |
| | | | |
| | 165 | | | | | Fate, Rockwall County, Texas, Special Assessment Revenue Bonds, Williamsburg Public Improvement District 1 Phase 2B, 2C & 3A1, Series 2019, 4.250%, 8/15/49, 144A | | 8/27 at 100.00 | | | 128,526 | |
| | | | |
| | 1,500 | | | | | Fort Bend County Industrial Development Corporation, Texas, Revenue Bonds, NRG Energy Inc. Project, Series 2012A. RMKT, 4.750%, 5/01/38 | | 12/23 at 100.00 | | | 1,352,724 | |
| | | | |
| | 1,000 | | | | | Gulf Coast Industrial Development Authority, Texas, Solid Waste Disposal Revenue Bonds, Citgo Petroleum Corporation Project, Series 1998, 8.000%, 4/01/28, (AMT) | | 12/23 at 100.00 | | | 1,000,282 | |
| | | | |
| | 1,450 | | | | | Harris County Municipal Utility District 213A, Texas, General Obligation Bonds, Series 2021, 3.000%, 4/01/48 | | 4/29 at 100.00 | | | 823,020 | |
| | | | |
| | 125 | | | | | Haslett, Texas, Special Assessment Revenue Bonds, Haslet Public Improvement District 5 Improvement Area 1 Project, Series 2019, 4.375%, 9/01/49, 144A | | 9/29 at 100.00 | | | 97,188 | |
| | | | |
| | 705 | | | | | Heart of Texas Education Finance Corporation, Texas, Gateway Charter Academy, Series 2006A, 6.000%, 2/15/36 | | 12/23 at 100.00 | | | 654,017 | |
| | | | |
| | 1,000 | | | | | Houston, Texas, Airport System Special Facilities Revenue Bonds, Continental Airlines Inc. - Terminal Improvement Project, Refunding Series 2011, 6.625%, 7/15/38, (AMT) | | 12/23 at 100.00 | | | 999,863 | |
| | | | |
| | 500 | | | | | Hutto, Williams County Texas, Special Assessment Revenue Bonds, Emory Crossing, Public Improvement Area 1 Project Series 2021, 4.000%, 9/01/56, 144A | | 9/29 at 100.00 | | | 363,838 | |
| | | | |
| | 1,075 | | | | | Hutto, Williams County Texas, Special Assessment Revenue Bonds, Emory Crossing, Public Improvement Area 2 Project Series 2023, 5.625%, 9/01/58, 144A | | 9/31 at 100.00 | | | 997,152 | |
| | | | |
| | 1,000 | | | | | Kaufman County Fresh Water Supply District 1-D, Texas, General Obligation Road Bonds, Series 2021, 3.000%, 9/01/46 | | 9/26 at 100.00 | | | 580,054 | |
| | | | |
| | 4,000 | | | | | Legato Community Authority, Commerce City, Texas, Limited Tax Supported Revenue Bonds, District 1, 2, 3 & 7, Convertible Capital Appreciation Series 2021A-2, 5.000%, 12/01/51 | | 6/26 at 100.67 | | | 2,383,236 | |
147
| | |
| NMZ | | Nuveen Municipal High Income Opportunity Fund (continued) |
| | Portfolio of Investments October 31, 2023 |
| | | | | | | | | | | | |
Principal Amount (000) | | | | | Description (a) | | Optional Call Provisions (b) | | Value | |
| | | | |
| | | | | | Texas (continued) | | | | | | |
| | $ 1,000 | | | | | Legato Community Authority, Commerce City, Texas, Limited Tax Supported Revenue Bonds, District 1, 2, 3 & 7, Series 2021B, 8.250%, 12/15/51 | | 6/26 at 103.00 | | $ | 842,209 | |
| | | | |
| | 1,435 | | | | | Manor, Texas, Special Assessment Revenue Bonds, Manor Heights Public Improvement District Improvement Area 1-2 Project, Series 2021, 4.000%, 9/15/51, 144A | | 9/31 at 100.00 | | | 1,040,270 | |
| | | | |
| | | | | | Manor, Texas, Special Assessment Revenue Bonds, Manor Heights Public Improvement District Major Improvement Area Project, Series 2021: | | | | | | |
| | 900 | | | | | 4.125%, 9/15/41, 144A | | 9/31 at 100.00 | | | 712,293 | |
| | 1,500 | | | | | 4.375%, 9/15/51, 144A | | 9/31 at 100.00 | | | 1,129,491 | |
| | | | |
| | 1,170 | | | | | McLendon-Chisholm, Texas, Special Assessment Revenue Bonds, Sonoma Public Improvement District Improvement Area 2 Project, Series 2019, 4.250%, 9/15/39, 144A | | 9/29 at 100.00 | | | 996,478 | |
| | | | |
| | | | | | Mesquite, Texas, Special Assessment Bonds, Iron Horse Public Improvement District Project, Series 2019: | | | | | | |
| | 300 | | | | | 5.750%, 9/15/39, 144A | | 9/29 at 100.00 | | | 285,012 | |
| | 500 | | | | | 6.000%, 9/15/49, 144A | | 9/29 at 100.00 | | | 476,040 | |
| | | | |
| | 1,125 | | | | | Missouri City Management District 1, Fort Bend County, Texas, General Obligation Bonds, Road Series 2021, 3.000%, 9/01/46 | | 9/27 at 100.00 | | | 736,377 | |
| | | | |
| | 20,000 | | | | | New Hope Cultural Education Facilities Finance Corporation, Texas, Senior Living Revenue Bonds, Sanctuary LTC LLC Project, Series 2021A-1, 5.500%, 1/01/57 | | 1/28 at 103.00 | | | 13,168,622 | |
| | | | |
| | 1,000 | | | (f) | | New Hope Cultural Education Facilities Finance Corporation, Texas, Student Housing Revenue Bonds, CHF-Collegiate Housing Foundation - San Antonio 1, L.L.C. - Texas A&M University - San Antonio Project, Series 2016A, 5.000%, 4/01/48, (Pre-refunded 4/01/26) | | 4/26 at 100.00 | | | 1,023,446 | |
| | | | |
| | 1,000 | | | (f) | | New Hope Cultural Education Facilities Finance Corporation, Texas, Student Housing Revenue Bonds, CHF-Collegiate Housing Galveston- Texas A&M University at Galveston Project, Series 2014A, 5.000%, 4/01/44, (Pre-refunded 4/01/24) | | 4/24 at 100.00 | | | 1,003,968 | |
| | | | |
| | | | | | New Hope Cultural Education Facilities Finance Corporation, Texas, Student Housing Revenue Bonds, NCCD - College Station Properties LLC - Texas A&M University Project, Series 2015A: | | | | | | |
| | 1,250 | | | (c) | | 5.000%, 7/01/35 | | 7/25 at 100.00 | | | 1,134,375 | |
| | 2,445 | | | (c) | | 5.000%, 7/01/47 | | 7/25 at 100.00 | | | 2,218,837 | |
| | | | |
| | 1,070 | | | | | Oak Point, Denton County, Texas, Special Assessment Revenue Bonds, Oak Point Public Imporvement District 2 Project, Series 2020, 4.000%, 9/01/50, 144A | | 9/30 at 100.00 | | | 780,646 | |
| | | | |
| | 250 | | | | | Pilot Point, Texas, Special Assessment Revenue Bonds, Creekview Public Improvement District Zone A Improvement Area 1 Project, Series 2022, 5.625%, 9/15/52, 144A | | 9/32 at 100.00 | | | 225,070 | |
| | | | |
| | 325 | | | | | Pilot Point, Texas, Special Assessment Revenue Bonds, Creekview Public Improvement District Zone B Improvement Area 1 Project, Series 2022, 5.625%, 9/15/52, 144A | | 9/32 at 100.00 | | | 292,590 | |
| | | | |
| | 2,000 | | | | | Plano, Collin and Denton Counties, Texas, Special Assessment Revenue Bonds, Collin Creek East Public Improvement District Project, Series 2021, 4.375%, 9/15/51, 144A | | 9/31 at 100.00 | | | 1,471,253 | |
| | | | |
| | 1,000 | | | | | Plano, Collin and Denton Counties, Texas, Special Assessment Revenue Bonds, Collin Creek West Public Improvement District Project, Series 2021, 4.000%, 9/15/51, 144A | | 9/31 at 100.00 | | | 711,874 | |
| | | | |
| | 440 | | | | | Port Beaumont Navigation District, Jefferson County, Texas, Dock and Wharf Facility Revenue Bonds, Jefferson Gulf Coast Energy Project, Series 2020, 4.000%, 1/01/50, (AMT), 144A | | 12/23 at 102.00 | | | 285,230 | |
148
| | | | | | | | | | | | |
Principal Amount (000) | | | | | Description (a) | | Optional Call Provisions (b) | | Value | |
| | | | |
| | | | | | Texas (continued) | | | | | | |
| | $ 7,000 | | | | | Port Beaumont Navigation District, Jefferson County, Texas, Dock and Wharf Facility Revenue Bonds, Jefferson Gulf Coast Energy Project, Series 2021A, 3.000%, 1/01/50, (AMT), 144A | | 12/23 at 103.00 | | $ | 3,697,711 | |
| | | | |
| | | | | | Port Freeport, Brazoria County, Texas, Revenue Bonds, Senior Lien Series 2019A: | | | | | | |
| | 1,650 | | | | | 4.000%, 6/01/38, (AMT) | | 6/29 at 100.00 | | | 1,339,886 | |
| | 1,620 | | | | | 4.000%, 6/01/39, (AMT) | | 6/29 at 100.00 | | | 1,289,449 | |
| | | | |
| | 1,000 | | | | | Princeton, Collins County, Texas, Special Assessment Revenue Bonds, Winchester Public Improvement District 2 Project, Series 2022, 5.250%, 9/01/52 | | 9/30 at 100.00 | | | 865,675 | |
| | | | |
| | 205 | | | | | Princeton, Texas, Special Assessment Revenue Bonds, Whitewing Trails Public Improvement District 2 Phase 1 Project, Series 2019, 4.750%, 9/01/49, 144A | | 9/29 at 100.00 | | | 167,396 | |
| | | | |
| | 185 | | | | | Princeton, Texas, Special Assessment Revenue Bonds, Whitewing Trails Public Improvement District 2 Phase 2-6 Major Improvement Project, Series 2019, 5.500%, 9/01/39, 144A | | 9/29 at 100.00 | | | 175,976 | |
| | | | |
| | 1,000 | | | | | Red Oak, Ellis County, Texas, Special Assessment Revenue Bonds, Red Oak Public Improvement District 1 Improvement Area 1 Project, Series 2021, 4.000%, 9/15/51, 144A | | 9/30 at 100.00 | | | 726,798 | |
| | | | |
| | 2,000 | | | (c) | | Red River Health Facilities Development Corporation, Texas, First Mortgage Revenue Bonds, Eden Home Inc., Series 2012, 7.000%, 12/15/32 | | 12/23 at 100.00 | | | 1,200,000 | |
| | | | |
| | 145 | | | | | Rowlett, Texas, Special Assessment Revenue Bonds, Bayside Public Improvement District North Improvement Area, Series 2016, 5.750%, 9/15/36 | | 3/24 at 102.00 | | | 135,418 | |
| | | | |
| | 7,000 | | | | | Sherman, Texas, Combination Tax and Revenue Certificates of Obligation, Series 2023, 5.000%, 8/15/53, (UB) | | 8/33 at 100.00 | | | 7,041,797 | |
| | | | | | Total Texas | | | | | 68,607,210 | |
| | | | |
| | | | | | Utah - 0.6% (0.4% of Total Investments) | | | | | | |
| | | | |
| | 2,500 | | | | | Black Desert Public Infrastructure District, Utah, Limited Tax General Obligation Bonds, Series 2021A, 4.000%, 3/01/51, 144A | | 9/26 at 103.00 | | | 1,696,117 | |
| | | | |
| | 1,000 | | | | | Black Desert Public Infrastructure District, Utah, Limited Tax General Obligation Bonds, Subordinate Series 2021B, 7.375%, 9/15/51, 144A | | 9/26 at 103.00 | | | 767,937 | |
| | | | |
| | 1,000 | | | | | Military Installation Development Authority, Utah, Tax Allocation and Hotel Tax Revenue Bonds, Series 2021A-1, 4.000%, 6/01/52 | | 9/26 at 103.00 | | | 671,393 | |
| | | | |
| | 2,000 | | | | | ROAM Public Infrastructure District 1, Utah, Limited Tax General Obligation Bonds, Series 2021A, 4.250%, 3/01/51, 144A | | 9/26 at 103.00 | | | 1,309,641 | |
| | | | |
| | 830 | | | | | Utah Charter School Finance Authority, Charter School Revenue Bonds, Mountain West Montessori Academy Project, Series 2020A, 5.000%, 6/15/49, 144A | | 12/29 at 100.00 | | | 658,345 | |
| | | | |
| | 970 | | | | | Utah Charter School Finance Authority, Charter School Revenue Bonds, Paradigm High School Project, Series 2020A, 5.125%, 7/15/51, 144A | | 1/25 at 102.00 | | | 685,082 | |
| | | | |
| | 1,000 | | | | | Utah Charter School Finance Authority, Charter School Revenue Bonds, Providence Hall Projects, Refunding Serier 2021A, 4.000%, 10/15/51 | | 10/31 at 100.00 | | | 760,522 | |
| | | | | | Total Utah | | | | | 6,549,037 | |
| | | | |
| | | | | | Virgin Islands - 1.2% (0.7% of Total Investments) | | | | | | |
| | | | |
| | | | | | Virgin Islands Public Finance Authority, Gross Receipts Taxes Loan Note, Refunding Series 2014C: | | | | | | |
| | 1,000 | | | | | 5.000%, 10/01/30, 144A | | 10/24 at 100.00 | | | 916,680 | |
| | 5,000 | | | | | 5.000%, 10/01/39, 144A | | 10/24 at 100.00 | | | 4,042,885 | |
149
| | |
| NMZ | | Nuveen Municipal High Income Opportunity Fund (continued) |
| | Portfolio of Investments October 31, 2023 |
| | | | | | | | | | | | |
Principal Amount (000) | | | | | Description (a) | | Optional Call Provisions (b) | | Value | |
| | | | |
| | | | | | Virgin Islands (continued) | | | | | | |
| | $ 2,890 | | | | | Virgin Islands Water and Power Authority, Electric System Revenue Bonds, Bond Anticipation Notes, Senior Series 2021A, 6.750%, 7/01/26, 144A | | No Opt. Call | | $ | 2,719,761 | |
| | | | |
| | 3,085 | | | | | Virgin Islands Water and Power Authority, Electric System Revenue Bonds, Bond Anticipation Notes, Taxable Series 2022A, 7.750%, 7/01/24 | | No Opt. Call | | | 3,025,725 | |
| | | | |
| | 215 | | | | | Virgin Islands Water and Power Authority, Electric System Revenue Bonds, Bond Anticipation Notes, Taxable Series 2022B, 10.000%, 7/01/24 | | No Opt. Call | | | 212,881 | |
| | | | |
| | 1,480 | | | | | West Indian Company Limited, Virgin Islands, Port Facilities Revenue Bonds, WICO Financing, Series 2022B, 6.250%, 10/01/42, (AMT), 144A | | 10/29 at 104.00 | | | 1,421,150 | |
| | | | | | Total Virgin Islands | | | | | 12,339,082 | |
| | | | |
| | | | | | Virginia - 4.3% (2.5% of Total Investments) | | | | | | |
| | | | |
| | 762 | | | (c) | | Celebrate Virginia North Community Development Authority, Special Assessment Revenue Bonds, Series 2003B, 4.125%, 3/01/22 | | No Opt. Call | | | 495,300 | |
| | | | |
| | 1,000 | | | | | Cutalong II Community Development Authority, Louisa County, Virginia, Special Assessment Revenue Bonds, Cutalong II Project, Series 2022, 4.500%, 3/01/55, 144A | | 3/27 at 103.00 | | | 722,419 | |
| | | | |
| | 15,000 | | | | | Industrial Development Authority of the City of Newport News, Virginia, Health System Revenue Bonds, Riverside Health System, Series 2017A, 5.000%, 7/01/46, 144A | | 7/27 at 100.00 | | | 13,258,905 | |
| | | | |
| | 11,495 | | | (d) | | Lynchburg Economic Development Authority, Virginia, Hospital Revenue Bonds, Centra Health Obligated Group, Refunding Series 2021, 4.000%, 1/01/55, (UB) | | 1/32 at 100.00 | | | 9,107,476 | |
| | | | |
| | 1,000 | | | | | Tobacco Settlement Financing Corporation of Virginia, Tobacco Settlement Asset Backed Bonds, Series 2007B1, 5.000%, 6/01/47 | | 11/23 at 100.00 | | | 857,768 | |
| | | | |
| | 4,500 | | | (d) | | Virginia Housing Development Authority, Commonwealth Mortgage Bonds, Series 2023A, 5.000%, 11/01/38, (UB) | | 5/32 at 100.00 | | | 4,522,229 | |
| | | | |
| | 7,000 | | | | | Virginia Small Business Finance Authority, Educational Facilities Revenue Bonds, Provident Resource Group - Rixey Student Housing Project, Series 2019A, 5.500%, 7/01/54, 144A | | 7/34 at 100.00 | | | 5,741,229 | |
| | | | |
| | 8,707 | | | | | Virginia Small Business Finance Authority, Educational Facilities Revenue Bonds, Provident Resource Group - Rixey Student Housing Project, Series 2019B, 6.525%, 7/01/52, 144A, (cash 7.500%, PIK 7.500%) | | No Opt. Call | | | 5,223,983 | |
| | | | |
| | 4,665 | | | | | Virginia Small Business Financing Authority, Sports and Entertainment Facilities Revenue Bonds, P3 VB Holdings LLC, Senior Series 2023A, 8.500%, 12/01/52, 144A | | 6/33 at 105.00 | | | 4,132,086 | |
| | | | |
| | 550 | | | | | West Falls Community Development Authority, Arlington County, Virginia, Revenue Bonds, Series 2022A, 5.375%, 9/01/52, 144A | | 9/32 at 100.00 | | | 500,288 | |
| | | | | | Total Virginia | | | | | 44,561,683 | |
| | | | |
| | | | | | Washington - 0.9% (0.5% of Total Investments) | | | | | | |
| | | | |
| | 1,000 | | | | | King County Public Hospital District 4, Washington, Hospital Revenue Bonds, Snoqualmie Valley Hospital, Series 2015A, 6.250%, 12/01/45 | | 12/25 at 100.00 | | | 897,309 | |
| | | | |
| | 1,000 | | | | | Kitsap County Consolidated Housing Authority, Washington, Pooled Tax Credit Housing Revenue Bonds, Series 2007, 5.600%, 6/01/37, (AMT) | | 12/23 at 100.00 | | | 875,413 | |
| | | | |
| | 1,300 | | | | | Port of Seattle Industrial Development Corporation, Washington, Special Facilities Revenue Refunding Bonds, Delta Air Lines, Inc. Project, Series 2012, 5.000%, 4/01/30, (AMT) | | 11/23 at 100.00 | | | 1,270,692 | |
| | | | |
| | 5,100 | | | (d) | | Port of Seattle, Washington, Revenue Bonds, Intermediate Lien Series 2018A, 5.000%, 5/01/43, (AMT), (UB) | | 5/27 at 100.00 | | | 4,890,103 | |
| | | | |
| | 2,500 | | | | | Seattle Housing Authority, Washington, Revenue Bonds, Lam Bow Apartments Project, Series 2021, 2.500%, 6/01/54 | | 6/31 at 100.00 | | | 1,297,931 | |
| | | | |
| | 180 | | | | | Tacoma Consolidated Local Improvement District 65, Washington, Special Assessment Bonds, Series 2013, 5.750%, 4/01/43 | | 11/23 at 100.00 | | | 160,754 | |
150
| | | | | | | | | | | | |
| Principal
Amount (000) |
| | | | Description (a) | | Optional Call Provisions (b) | | | Value | |
| | | | |
| | | | | | Washington (continued) | | | | | | |
| | $ 3,065 | | | (c),(e) | | Washington Economic Development Finance Authority, Environmental Facilities Revenue Bonds, Columbia Pulp I, LLC Project, Series 2017A, 7.500%, 1/01/32, (AMT), 144A | | 1/28 at 100.00 | | $ | 306 | |
| | | | |
| | 545 | | | (c),(e) | | Washington Economic Development Finance Authority, Environmental Facilities Revenue Bonds, Columbia Pulp I, LLC Project, Series 2018, 7.250%, 1/01/32, (AMT), 144A | | 1/28 at 100.00 | | | 55 | |
| | | | |
| | 1,565 | | | (c),(e) | | Washington Economic Development Finance Authority, Environmental Facilities Revenue Bonds, Columbia Pulp I, LLC Project, Series 2019A, 7.500%, 1/01/32, (AMT), 144A | | 1/28 at 100.00 | | | 157 | |
| | | | |
| | 1,000 | | | (c),(e) | | Washington Economic Development Finance Authority, Environmental Facilities Revenue Bonds, Columbia Pulp I, LLC Project, Senior Series 2021A, 12.000%, 1/01/33, (AMT), 144A | | No Opt. Call | | | 100 | |
| | | | |
| | 255 | | | (c),(e) | | Washington Economic Development Finance Authority, Environmental Facilities Revenue Bonds, Columbia Pulp I, LLC Project, Taxable Senior Series 2021B, 14.250%, 1/01/27, 144A | | No Opt. Call | | | 25 | |
| | | | | | Total Washington | | | | | 9,392,845 | |
| | | | |
| | | | | | West Virginia - 0.7% (0.4% of Total Investments) | | | | | | |
| | | | |
| | 1,279 | | | | | Berkeley, Hardy and Jefferson Counties, West Virginia, as Joint Issuers, Commercial Development Revenue Bonds, Scattered Site Housing Projects, Series 2010, 5.750%, 12/01/44 | | 12/23 at 100.00 | | | 1,130,959 | |
| | | | |
| | 1,125 | | | | | Monongalia County Commission, West Virginia, Special District Excise Tax Revenue Bonds, University Town Centre Economic Opportunity Development District, Refunding & Improvement Series 2017A, 5.750%, 6/01/43, 144A | | 6/27 at 100.00 | | | 1,129,616 | |
| | | | |
| | 950 | | | | | Monongalia County Commission, West Virginia, Special District Excise Tax Revenue Bonds, University Town Centre Economic Opportunity Development District, Refunding & Improvement Series 2021A, 4.125%, 6/01/43, 144A | | 6/31 at 100.00 | | | 783,606 | |
| | | | |
| | 975 | | | | | West Virginia Economic Development Authority, Dock and Wharf Facilities Revenue Bonds, Empire Trimodal Terminal, LLC Project, Series 2020, 7.625%, 12/01/40, 144A | | 12/27 at 103.00 | | | 740,056 | |
| | | | |
| | 4,000 | | | (d) | | West Virginia Hospital Finance Authority, Revenue Bonds, West Virginia University Health System, Improvement Series 2023A, 4.375%, 6/01/53, (UB) | | 6/33 at 100.00 | | | 3,431,610 | |
| | | | | | Total West Virginia | | | | | 7,215,847 | |
| | | | |
| | | | | | Wisconsin - 8.5% (5.0% of Total Investments) | | | | | | |
| | | | |
| | 2,500 | | | | | Gillett, Wisconsin, Solid Waste Disposal Revenue Bonds, WI RNG Hub North LLC Renewable Natural Gas Production Plant Project, Series 2021A, 5.500%, 12/01/32, 144A | | 12/26 at 100.00 | | | 1,997,889 | |
| | | | |
| | 2,000 | | | | | Lac Courte Oreilles Band of Lake Superior Chippewa Indians, Wisconsin, General Revenue Bonds, Refunding Series 2017, 6.750%, 6/01/32 | | 12/27 at 100.00 | | | 1,929,002 | |
| | | | |
| | 255 | | | | | Public Finance Authority of Wisconsin, Charter School Revenue Bonds, Ascend Leadership Academy Project, Series 2021A, 5.000%, 6/15/51, 144A | | 6/29 at 100.00 | | | 183,622 | |
| | | | |
| | 850 | | | | | Public Finance Authority of Wisconsin, Charter School Revenue Bonds, Coral Academy of Science, Reno, Series 2021A, 4.000%, 6/01/51, 144A | | 6/27 at 100.00 | | | 549,981 | |
| | | | |
| | 150 | | | | | Public Finance Authority of Wisconsin, Charter School Revenue Bonds, Founders Academy of Las Vegas, Series 2020A, 5.000%, 7/01/55, 144A | | 7/28 at 100.00 | | | 112,131 | |
| | | | |
| | 2,015 | | | | | Public Finance Authority of Wisconsin, Charter School Revenue Bonds, Guilford Preparatory Academy, North Carolina, Taxable Series 2022A, 5.000%, 4/01/57, 144A | | 4/31 at 100.00 | | | 1,501,004 | |
151
| | |
| NMZ | | Nuveen Municipal High Income Opportunity Fund (continued) |
| | Portfolio of Investments October 31, 2023 |
| | | | | | | | | | | | |
Principal Amount (000) | | | | | Description (a) | | Optional Call Provisions (b) | | Value | |
| | | | |
| | | | | | Wisconsin (continued) | | | | | | |
| | | | | | Public Finance Authority of Wisconsin, Charter School Revenue Bonds, High Desert Montessori Charter School, Series 2021A: | | | | | | |
| | $ 1,000 | | | | | 5.000%, 6/01/51, 144A | | 6/29 at 100.00 | | $ | 779,145 | |
| | 1,280 | | | | | 5.000%, 6/01/61, 144A | | 6/29 at 100.00 | | | 959,035 | |
| | | | |
| | 4,985 | | | | | Public Finance Authority of Wisconsin, Charter School Revenue Bonds, North Carolina Charter Educational Foundation Project, Series 2016A, 5.000%, 6/15/46, 144A | | 6/26 at 100.00 | | | 3,499,925 | |
| | | | |
| | 500 | | | | | Public Finance Authority of Wisconsin, Charter School Revenue Bonds, Point College Preparatory, Series 2020A, 5.000%, 6/15/55, 144A | | 6/27 at 103.00 | | | 374,836 | |
| | | | |
| | | | | | Public Finance Authority of Wisconsin, Conference Center and Hotel Revenue Bonds, Lombard Public Facilities Corporation, First Tier Series 2018A-1: | | | | | | |
| | 13 | | | (c) | | 0.000%, 1/01/47, 144A | | No Opt. Call | | | 253 | |
| | 11 | | | (c) | | 0.000%, 1/01/48, 144A | | No Opt. Call | | | 209 | |
| | 11 | | | (c) | | 0.000%, 1/01/49, 144A | | No Opt. Call | | | 193 | |
| | 10 | | | (c) | | 0.000%, 1/01/50, 144A | | No Opt. Call | | | 172 | |
| | 10 | | | (c) | | 0.000%, 1/01/51, 144A | | No Opt. Call | | | 160 | |
| | 13 | | | (c) | | 0.000%, 1/01/52, 144A | | No Opt. Call | | | 192 | |
| | 13 | | | (c) | | 0.000%, 1/01/53, 144A | | No Opt. Call | | | 179 | |
| | 13 | | | (c) | | 0.000%, 1/01/54, 144A | | No Opt. Call | | | 161 | |
| | 13 | | | (c) | | 0.000%, 1/01/55, 144A | | No Opt. Call | | | 149 | |
| | 12 | | | (c) | | 0.000%, 1/01/56, 144A | | No Opt. Call | | | 138 | |
| | 667 | | | (c) | | 5.500%, 7/01/56, 144A | | 3/28 at 100.00 | | | 346,958 | |
| | 14 | | | (c) | | 0.000%, 1/01/57, 144A | | No Opt. Call | | | 143 | |
| | 13 | | | (c) | | 0.000%, 1/01/58, 144A | | No Opt. Call | | | 131 | |
| | 13 | | | (c) | | 0.000%, 1/01/59, 144A | | No Opt. Call | | | 121 | |
| | 13 | | | (c) | | 0.000%, 1/01/60, 144A | | No Opt. Call | | | 110 | |
| | 12 | | | (c) | | 0.000%, 1/01/61, 144A | | No Opt. Call | | | 102 | |
| | 12 | | | (c) | | 0.000%, 1/01/62, 144A | | No Opt. Call | | | 93 | |
| | 12 | | | (c) | | 0.000%, 1/01/63, 144A | | No Opt. Call | | | 86 | |
| | 12 | | | (c) | | 0.000%, 1/01/64, 144A | | No Opt. Call | | | 80 | |
| | 11 | | | (c) | | 0.000%, 1/01/65, 144A | | No Opt. Call | | | 73 | |
| | 12 | | | (c) | | 0.000%, 1/01/66, 144A | | No Opt. Call | | | 73 | |
| | 148 | | | (c) | | 0.000%, 1/01/67, 144A | | No Opt. Call | | | 789 | |
| | | | |
| | | | | | Public Finance Authority of Wisconsin, Conference Center and Hotel Revenue Bonds, Lombard Public Facilities Corporation, Second Tier Series 2018B: | | | | | | |
| | 24 | | | (c) | | 0.000%, 1/01/46, 144A | | No Opt. Call | | | 526 | |
| | 24 | | | (c) | | 0.000%, 1/01/47, 144A | | No Opt. Call | | | 478 | |
| | 24 | | | (c) | | 0.000%, 1/01/48, 144A | | No Opt. Call | | | 447 | |
| | 23 | | | (c) | | 0.000%, 1/01/49, 144A | | No Opt. Call | | | 417 | |
| | 23 | | | (c) | | 0.000%, 1/01/50, 144A | | No Opt. Call | | | 379 | |
| | 25 | | | (c) | | 0.000%, 1/01/51, 144A | | No Opt. Call | | | 392 | |
| | 651 | | | (c) | | 1.000%, 7/01/51, 144A | | 3/28 at 100.00 | | | 344,190 | |
| | 25 | | | (c) | | 0.000%, 1/01/52, 144A | | No Opt. Call | | | 360 | |
| | 25 | | | (c) | | 0.000%, 1/01/53, 144A | | No Opt. Call | | | 335 | |
| | 25 | | | (c) | | 0.000%, 1/01/54, 144A | | No Opt. Call | | | 311 | |
| | 24 | | | (c) | | 0.000%, 1/01/55, 144A | | No Opt. Call | | | 289 | |
| | 24 | | | (c) | | 0.000%, 1/01/56, 144A | | No Opt. Call | | | 270 | |
| | 24 | | | (c) | | 0.000%, 1/01/57, 144A | | No Opt. Call | | | 251 | |
| | 23 | | | (c) | | 0.000%, 1/01/58, 144A | | No Opt. Call | | | 233 | |
| | 23 | | | (c) | | 0.000%, 1/01/59, 144A | | No Opt. Call | | | 218 | |
| | 23 | | | (c) | | 0.000%, 1/01/60, 144A | | No Opt. Call | | | 202 | |
| | 23 | | | (c) | | 0.000%, 1/01/61, 144A | | No Opt. Call | | | 187 | |
| | 23 | | | (c) | | 0.000%, 1/01/62, 144A | | No Opt. Call | | | 174 | |
| | 22 | | | (c) | | 0.000%, 1/01/63, 144A | | No Opt. Call | | | 162 | |
| | 22 | | | (c) | | 0.000%, 1/01/64, 144A | | No Opt. Call | | | 153 | |
| | 22 | | | (c) | | 0.000%, 1/01/65, 144A | | No Opt. Call | | | 141 | |
152
| | | | | | | | | | | | |
Principal Amount (000) | | | | | Description (a) | | Optional Call Provisions (b) | | Value | |
| | | | |
| | | | | | Wisconsin (continued) | | | | | | |
| | $ 22 | | | (c) | | 0.000%, 1/01/66, 144A | | No Opt. Call | | $ | 128 | |
| | 281 | | | (c) | | 0.000%, 1/01/67, 144A | | No Opt. Call | | | 1,501 | |
| | | | |
| | 4,700 | | | | | Public Finance Authority of Wisconsin, Contract Revenue Bonds, Mercer Crossing Public Improvement District Project, Series 2017, 7.000%, 3/01/47, 144A | | 3/27 at 100.00 | | | 4,774,671 | |
| | | | |
| | 1,000 | | | | | Public Finance Authority of Wisconsin, Education Revenue Bonds, Corvian Community School, North Carolina Series 2023A, 6.250%, 6/15/53, 144A | | 6/33 at 100.00 | | | 898,731 | |
| | | | |
| | 1,500 | | | | | Public Finance Authority of Wisconsin, Education Revenue Bonds, Pioneer Springs Community School, Series 2020A, 6.250%, 6/15/40, 144A | | 6/27 at 100.00 | | | 1,333,793 | |
| | | | |
| | 1,000 | | | | | Public Finance Authority of Wisconsin, Education Revenue Bonds, The Capitol Encore Academy, Series 2021A, 5.000%, 6/01/56, 144A | | 6/28 at 100.00 | | | 739,584 | |
| | | | |
| | 2,000 | | | | | Public Finance Authority of Wisconsin, Educational Facilities Revenue Bonds, Lake Erie College, Series 2019A, 5.875%, 10/01/54, 144A | | 10/29 at 100.00 | | | 1,464,500 | |
| | | | |
| | 1,550 | | | | | Public Finance Authority of Wisconsin, Educational Facility Revenue Bonds, LEAD Academy Project, Series 2021, 5.000%, 8/01/51, 144A | | 8/28 at 100.00 | | | 1,144,216 | |
| | | | |
| | 3,000 | | | | | Public Finance Authority of Wisconsin, Educational Facility Revenue Bonds, Lenoir-Rhyne University, Refunding Series 2022, 5.125%, 4/01/52 | | 4/32 at 100.00 | | | 2,557,530 | |
| | | | |
| | 335 | | | | | Public Finance Authority of Wisconsin, Exempt Facilities Revenue Bonds, National Gypsum Company Project, Refunding Series 2016, 4.000%, 8/01/35, (AMT) | | 8/26 at 100.00 | | | 275,349 | |
| | | | |
| | 5,000 | | | | | Public Finance Authority of Wisconsin, Hotel Revenue Bonds, Grand Hyatt San Antonio Hotel Acquisition Project, Senior Lien Series 2022A, 5.000%, 2/01/62 | | 2/32 at 100.00 | | | 4,219,640 | |
| | | | |
| | 6,665 | | | | | Public Finance Authority of Wisconsin, Hotel Revenue Bonds, Grand Hyatt San Antonio Hotel Acquisition Project, Subordinate Lien Series 2022B, 6.000%, 2/01/62, 144A | | 2/32 at 100.00 | | | 5,947,859 | |
| | | | |
| | | | | | Public Finance Authority of Wisconsin, Limited Obligation Grant Revenue Bonds, American Dream @ Meadowlands Project, Series 2017A: | | | | | | |
| | 1,665 | | | (c) | | 3.125%, 8/01/27, 144A | | No Opt. Call | | | 1,271,644 | |
| | 1,000 | | | (c) | | 6.750%, 8/01/31, 144A | | No Opt. Call | | | 700,000 | |
| | | | |
| | | | | | Public Finance Authority of Wisconsin, Limited Obligation PILOT Revenue Bonds, American Dream @ Meadowlands Project, Series 2017: | | | | | | |
| | 2,000 | | | | | 6.750%, 12/01/42, 144A | | 12/27 at 100.00 | | | 1,748,132 | |
| | 20,835 | | | | | 7.000%, 12/01/50, 144A | | 12/27 at 100.00 | | | 18,190,776 | |
| | | | |
| | 400 | | | | | Public Finance Authority of Wisconsin, Retirement Facility Revenue Bonds, Shalom Park Development Project, Series 2019, 0.000%, 12/31/24, 144A | | No Opt. Call | | | 24,000 | |
| | | | |
| | 3,500 | | | (c) | | Public Finance Authority of Wisconsin, Revenue Bonds, Alabama Gulf Coast Zoo, Series 2018A, 6.500%, 9/01/48, 144A | | 9/28 at 100.00 | | | 2,100,000 | |
| | | | |
| | 500 | | | (c) | | Public Finance Authority of Wisconsin, Revenue Bonds, Alabama Proton Therapy Center, Senior Series 2017A, 7.000%, 10/01/47, 144A | | 10/27 at 100.00 | | | 300,000 | |
| | | | |
| | | | | | Public Finance Authority of Wisconsin, Revenue Bonds, Procure Proton Therapy Center, Senior Series 2018A: | | | | | | |
| | 4,415 | | | | | 6.950%, 7/01/38, 144A | | 7/28 at 100.00 | | | 3,384,017 | |
| | 6,585 | | | | | 7.000%, 7/01/48, 144A | | 7/28 at 100.00 | | | 4,970,384 | |
| | | | |
| | 1,060 | | | | | Public Finance Authority of Wisconsin, Revenue Bonds, Roseman University of Health Sciences, Series 2015, 5.875%, 4/01/45 | | 4/25 at 100.00 | | | 1,029,169 | |
| | | | |
| | | | | | Public Finance Authority of Wisconsin, Revenue Bonds, SearStone Retirement Community, Series 2023A: | | | | | | |
| | 1,000 | | | | | 5.000%, 6/01/37 | | 6/28 at 103.00 | | | 870,888 | |
| | 4,000 | | | | | 5.000%, 6/01/52 | | 6/28 at 103.00 | | | 2,977,738 | |
153
| | |
| NMZ | | Nuveen Municipal High Income Opportunity Fund (continued) |
| | Portfolio of Investments October 31, 2023 |
| | | | | | | | | | | | | | | | | | |
| Principal
Amount (000) |
| | | | Description (a) | | Optional Call Provisions (b) | | | Value | |
| | | | |
| | | | | | Wisconsin (continued) | | | | | | |
| | | | | | Public Finance Authority of Wisconsin, Revenue Bonds, Sky Harbour LLC Obligated Group Aviation Facilities Project, Series 2021: | | | | | | |
| | $ 1,200 | | | | | 4.000%, 7/01/41, (AMT) | | 7/31 at 100.00 | | $ | 835,603 | |
| | 2,485 | | | | | 4.250%, 7/01/54, (AMT) | | 7/31 at 100.00 | | | 1,550,989 | |
| | | | |
| | | | | | Public Finance Authority of Wisconsin, Senior Revenue Bonds, Maryland Proton Treatment Center, Series 2018A-1: | | | | | | |
| | 1,000 | | | | | 6.125%, 1/01/33, 144A | | 1/28 at 100.00 | | | 615,000 | |
| | 2,000 | | | | | 6.250%, 1/01/38, 144A | | 1/28 at 100.00 | | | 1,230,000 | |
| | 3,500 | | | | | 6.375%, 1/01/48, 144A | | 1/28 at 100.00 | | | 2,152,500 | |
| | | | |
| | 285 | | | (c),(e) | | Public Finance Authority of Wisconsin, Wisconsin Revenue Note, KDC Agribusiness LLC Project, Series 2022B, 15.000%, 3/31/24 | | 4/23 at 105.00 | | | 28 | |
| | | | |
| | 91 | | | (c) | | Public Finance Authority, Wisconsin, Revenue Bonds, Minnesota College of Osteopathic Medicine, Senior Series 2019A-1, 5.500%, 12/01/48, 144A | | 12/28 at 100.00 | | | 28,301 | |
| | | | |
| | | | | | Public Finance Authority, Wisconsin, Revenue Bonds, Ocean Academy Charter School, Series 2021: | | | | | | |
| | 1,130 | | | | | 5.000%, 10/15/51, 144A | | 10/31 at 100.00 | | | 874,669 | |
| | 815 | | | | | 5.000%, 10/15/56, 144A | | 10/31 at 100.00 | | | 613,709 | |
| | | | |
| | 1,000 | | | | | Saint Croix Chippewa Indians of Wisconsin, Revenue Bonds, Refunding Senior Series 2021, 5.000%, 9/30/41, 144A | | 9/28 at 100.00 | | | 700,819 | |
| | | | |
| | 5,000 | | | | | Wisconsin Center District, Dedicated Tax Revenue Bonds, Supported by State Moral Obligation Junior Series 2020D, 0.000%, 12/15/60 - AGM Insured | | 12/30 at 29.95 | | | 643,268 | |
| | | | |
| | 7,250 | | | (d) | | Wisconsin Health and Educational Facilities Authority, Revenue Bonds, Marshfield Clinic Health System, Inc., Series 2017C, 5.000%, 2/15/47, (UB) | | 2/27 at 100.00 | | | 6,448,871 | |
| | | | | | Total Wisconsin | | | | | | | | | | | 89,205,257 | |
| | | | | | Total Municipal Bonds
(cost $2,035,316,369) | | | | | 1,722,947,641 | |
| | | | |
| | Shares | | | | | Description (a) | | | | | Value | |
| | | | | | COMMON STOCKS - 5.7% (3.3% of Total Investments) | | | | | | |
| | | | |
| | | | | | Utilities - 5.7% (3.3% of Total Investments) | | | | | | |
| | 750,823 | | | (i),(j) | | Energy Harbor Corp | | | | $ | 59,628,110 | |
| | | | | | Total Utilities | | | | | | | | | | | 59,628,110 | |
| | | | | | Total Common Stocks
(cost $21,123,492) | | | | | 59,628,110 | |
| | | | | | | |
| Principal
Amount (000) |
| | | | Description (a) | | Coupon (k) | | Reference Rate (k) | | Spread (k) | | Maturity (l) | | | Value | |
| | | | | | VARIABLE RATE SENIOR LOAN INTERESTS - 0.0% (0.0% of Total Investments) (k) | | | | | 162,238 | |
| | |
| | | | | | Capital Goods - 0.0% (0.0% of Total Investments) | |
| | $ 451 | | | (c),(e),(m) | | KDC Agribusiness Fairless Hills LLC | | 12.000% | | N/A | | N/A | | 9/17/23 | | $ | 98,675 | |
| | | | | | Total Capital Goods | | | | | | | | | 98,675 | |
154
| | | | | | | | | | | | | | | | | | | | | | |
Principal
Amount (000) | | | | | Description (a) | | Coupon (k) | | | Reference Rate (k) | | Spread (k) | | Maturity (l) | | | Value | |
| | | | | | |
| | | | | | Industrials - 0.0% (0.0% of Total Investments) | | | | | | | | | | | | | |
| | $ 357 | | | (e) | | Columbia Pulp I LLC | | | 16.000% | | | N/A | | N/A | | | 11/30/23 | | | $ | 63,563 | |
| | | | | | Total Industrials | | | | | | | | | | | | | | | 63,563 | |
| | | | | | Total Variable Rate Senior Loan Interests
(cost $807,463) | | | | | | | | | | | | 162,238 | |
| | | | | | Total Long-Term Investments
(cost $2,057,247,324) | | | | | | | | | | | | 1,782,737,989 | |
| | | | | | Floating Rate Obligations - (38.8)% | | | | | | | | | | | | (406,701,000 | ) |
| | | | | | AMTP Shares, Net- (34.0)%(n) | | | | | | | | | | | | (356,521,633 | ) |
| | | | | | Other Assets & Liabilities, Net -2.7% | | | | | | | | | | | | 28,633,413 | |
| | | | | | Net Assets Applicable to Common Shares - 100% | | | | | | | | $ | 1,048,148,769 | |
| (a) | All percentages shown in the Portfolio of Investments are based on net assets applicable to common shares unless otherwise noted. |
| (b) | Optional Call Provisions: Dates (month and year) and prices of the earliest optional call or redemption. There may be other call provisions at varying prices at later dates. Certain mortgage-backed securities may be subject to periodic principal paydowns. Optional Call Provisions are not covered by the report of independent registered public accounting firm. |
| (c) | Defaulted security. A security whose issuer has failed to fully pay principal and/or interest when due, or is under the protection of bankruptcy. |
| (d) | Investment, or portion of investment, has been pledged to collateralize the net payment obligations for investments in inverse floating rate transactions. |
| (e) | For fair value measurement disclosure purposes, investment classified as Level 3. |
| (f) | Backed by an escrow or trust containing sufficient U.S. Government or U.S. Government agency securities, which ensure the timely payment of principal and interest. |
| (g) | Step-up coupon bond, a bond with a coupon that increases (“steps up”), usually at regular intervals, while the bond is outstanding. The rate shown is the coupon as of the end of the reporting period. |
| (h) | Principal Amount (000) rounds to less than $1,000. |
| (i) | Energy Harbor Corp (ENGH) common stock received as part of the bankruptcy settlements during February 2020 for Beaver County Industrial Development Authority, Pennsylvania, Pollution Control Revenue Refunding Bonds, FirstEnergy Nuclear Generation Project, Series 2006A, 3.500%, 4/01/41, Beaver County Industrial Development Authority, Pennsylvania, Pollution Control Revenue Refunding Bonds, FirstEnergy Nuclear Generation Project, Series 2006B, 3.500%, 12/01/35, Ohio Air Quality Development Authority, Ohio, Air Quality Development Revenue Bonds, FirstEnergy Generation Corporation Project, Series 2009A, 5.700%, 8/01/20, Ohio Air Quality Development Authority, Ohio, Pollution Control Revenue Bonds, FirstEnergy Generation Corporation Project, Refunding Series 2009B, 3.100%, 3/01/23, Ohio Air Quality Development Authority, Ohio, Pollution Control Revenue Bonds, FirstEnergy Nuclear Generation Project, Refunding Series 2008C, 3.950%, 11/01/32, Ohio Water Development Authority, Pollution Control Revenue Refunding Bonds, FirstEnergy Nuclear Generating Corporation Project, Series 2005B, 4.000%, 1/01/34, Ohio Water Development Authority, Pollution Control Revenue Refunding Bonds, FirstEnergy Nuclear Generating Corporation Project, Series 2006A, 3.000%, 5/15/20, Ohio Water Development Authority, Pollution Control Revenue Refunding Bonds, FirstEnergy Nuclear Generating Corporation Project, Series 2008B, 3.625%, 10/01/33, Ohio Water Development Authority, Pollution Control Revenue Refunding Bonds, FirstEnergy Nuclear Generating Corporation Project, Series 2008C, 3.950%, 11/01/32, Ohio Water Development Authority, Pollution Control Revenue Refunding Bonds, FirstEnergy Nuclear Generating Corporation Project, Series 2010A, 3.750%, 7/01/33, Pennsylvania Economic Development Financing Authority, Exempt Facilities Revenue Bonds, Shippingport Project, First Energy Guarantor, Series 2006A, 2.550%, 11/01/41. Various funds and accounts managed by Nuveen, including the Fund, collectively are a substantial minority holder of ENGH’s outstanding shares of common stock, and possess certain other rights with respect to the corporate governance of ENGH. Due to these facts, under the federal securities laws, the securities of ENGH held by Nuveen funds and accounts, including the Fund, cannot be sold except under limited conditions (which are not currently satisfied). The Fund is therefore unable to sell such shares in ordinary secondary market transactions at this time. On March 6, 2023 Vistra Corp. (“Vistra”) announced that it has executed a definitive agreement with Energy Harbor Corp., pursuant to which Energy Harbor will merge with and into a newly-formed subsidiary of Vistra. In connection with the transaction, Nuveen funds and accounts expect to receive a combination of cash and shares in a newly formed entity. Nuveen expects these shares to be issued in a private transaction and may have reduced secondary market liquidity. The transaction is subject to certain regulatory approvals and there can be no assurance that the transaction will close. |
| (j) | Non-income producing; issuer has not declared an ex-dividend date within the past twelve months. |
| (k) | Senior loans generally pay interest at rates which are periodically adjusted by reference to a base short-term, floating lending rate (Reference Rate) plus an assigned fixed rate (Spread). These floating lending rates are generally (i) the lending rate referenced by the London Inter-Bank Offered Rate (“LIBOR”), or (ii) the prime rate offered by one or more major United States banks. Senior loans may be considered restricted in that the Fund ordinarily is contractually obligated to receive approval from the agent bank and/or borrower prior to the disposition of a senior loan. The rate shown is the coupon as of the end of the reporting period. |
| (l) | Senior loans generally are subject to mandatory and/or optional prepayment. Because of these mandatory prepayment conditions and because there may be significant economic incentives for a borrower to prepay, prepayments of senior loans may occur. As a result, the actual remaining maturity of senior loans held may be substantially less than the stated maturities shown. |
| (m) | Senior loan received as part of the bondholder funding agreement during June 2023 for Pennsylvania Economic Development Financing Authority, Exempt Facilities Revenue Bonds, KDC Agribusiness Fairless Hills LLC Project, Series 2020A-1, 10.000%, 12/01/40, 144A, Pennsylvania Economic Development Financing Authority, Exempt Facilities Revenue Bonds, KDC Agribusiness Fairless Hills LLC Project, Series 2020A-2, 10.000%, 12/01/40, (AMT), 144A, Pennsylvania Economic Development Financing Authority, Exempt Facilities Revenue Bonds, KDC Agribusiness Fairless Hills LLC Project, Series 2021A, 10.000%, 12/01/31. |
| (n) | AMTP Shares, Net as a percentage of Total Investments is 20.0%. |
155
| | |
| NMZ | | Nuveen Municipal High Income Opportunity Fund (continued) |
| | Portfolio of Investments October 31, 2023 |
| 144A | Investment is exempt from registration under Rule 144A of the Securities Act of 1933, as amended. These investments may only be resold in transactions exempt from registration, which are normally those transactions with qualified institutional buyers. |
| AMT | Alternative Minimum Tax |
| IF | Inverse floating rate security issued by a tender option bond (“TOB”) trust, the interest rate on which varies inversely with the Securities Industry Financial Markets Association (SIFMA) short-term rate, which resets weekly, or a similar short-term rate, and is reduced by the expenses related to the TOB trust. |
| PIK | Payment-in-kind (“PIK”) security. Depending on the terms of the security, income may be received in the form of cash, securities, or a combination of both. The PIK rate shown, where applicable, represents the annualized rate of the last PIK payment made by the issuer as of the end of the reporting period. |
| UB | Underlying bond of an inverse floating rate trust reflected as a financing transaction. |
| WI/DD | When-issued or delayed delivery security. |
See Notes to Financial Statements
156
| | |
| NMCO | | Nuveen Municipal Credit Opportunities Fund |
| | Portfolio of Investments October 31, 2023 |
| | | | | | | | | | | | |
Principal
Amount (000) | | | | | Description (a) | | Optional Call
Provisions (b) | | Value | |
| | | | | | LONG-TERM INVESTMENTS - 181.5% (100.0% of Total Investments) | | | | | | |
| | | | | | MUNICIPAL BONDS - 168.3% (92.7% of Total Investments) | | | | | | |
| | | | |
| | | | | | Alabama - 5.8% (3.2% of Total Investments) | | | | | | |
| | | | |
| | $ 395 | | | | | Hoover Industrial Development Board, Alabama, Environmental Improvement Revenue Bonds, United States Steel Corporation Proejcet, Green Series 2020, 6.375%, 11/01/50, (AMT), (Mandatory Put 11/01/30) | | No Opt. Call | | $ | 410,670 | |
| | | | |
| | 30,925 | | | | | Hoover Industrial Development Board, Alabama, Environmental Improvement Revenue Bonds, United States Steel Corporation Project, Series 2019, 5.750%, 10/01/49, (AMT) | | 10/29 at 100.00 | | | 28,838,821 | |
| | | | |
| | 3,000 | | | | | Tuscaloosa County Industrial Development Authority, Alabama, Gulf Opportunity Zone Bonds, Hunt Refining Project, Refunding Series 2019A, 5.250%, 5/01/44, 144A | | 5/29 at 100.00 | | | 2,472,595 | |
| | | | | | Total Alabama | | | | | 31,722,086 | |
| | | | |
| | | | | | Alaska - 1.3% (0.7% of Total Investments) | | | | | | |
| | | | |
| | 7,765 | | | | | Anchorage, Alaska, Port Revenue Bonds, Series 2020A, 5.000%, 12/01/50, (AMT) | | 12/30 at 100.00 | | | 6,993,953 | |
| | | | | | Total Alaska | | | | | 6,993,953 | |
| | | | |
| | | | | | Arizona - 4.0% (2.2% of Total Investments) | | | | | | |
| | | | |
| | 4,000 | | | | | Arizona Industrial Development Authority, Arizona, Education Facility Revenue Bonds, Leman Academy of Excellence ? East Tucson & Central Tucson Projects, Series 2019A, 5.000%, 7/01/49, 144A | | 7/24 at 101.00 | | | 3,203,200 | |
| | | | |
| | 1,000 | | | | | Arizona Industrial Development Authority, Arizona, Education Revenue Bonds, Heritage Academy - Gateway and Laveen Projects, Taxable Series 2021A, 5.000%, 7/01/51, 144A | | 7/28 at 103.00 | | | 781,246 | |
| | | | |
| | 340 | | | | | Arizona Industrial Development Authority, Arizona, Education Revenue Bonds, Pinecrest Academy-Cadence Campus Project, Series 2020A, 4.000%, 7/15/40, 144A | | 7/28 at 100.00 | | | 268,557 | |
| | | | |
| | 1,000 | | | | | Maricopa County Industrial Development Authority, Arizona, Education Revenue Bonds, Gateway Academy Project, Series 2019A, 5.750%, 1/01/50, 144A | | 1/30 at 100.00 | | | 790,097 | |
| | | | |
| | | | | | Maricopa County Industrial Development Authority, Arizona, Education Revenue Bonds, Legacy Traditional Schools Projects, Taxable Series 2019B: | | | | | | |
| | 1,100 | | | | | 5.000%, 7/01/39, 144A | | 7/29 at 100.00 | | | 993,345 | |
| | 4,025 | | | | | 5.000%, 7/01/54, 144A | | 7/29 at 100.00 | | | 3,308,729 | |
| | | | |
| | 315 | | | | | Maricopa County Industrial Development Authority, Arizona, Educational Facilities Revenue Bonds, Ottawa University Projects, Series 2020, 5.500%, 10/01/51, 144A | | 10/27 at 103.00 | | | 280,930 | |
| | | | |
| | 6,400 | | | | | Maricopa County Pollution Control Corporation, Arizona, Pollution Control Revenue Bonds, El Paso Electric Company, Refunding Series 2009A, 3.600%, 2/01/40 | | 6/29 at 100.00 | | | 5,032,246 | |
| | | | |
| | 600 | | | | | Phoenix Industrial Development Authority, Arizona, Education Facility Revenue Bonds, Basis Schools, Inc. Projects, Series 2016A, 5.000%, 7/01/35, 144A | | 7/25 at 100.00 | | | 569,424 | |
| | | | |
| | 280 | | | | | Phoenix Industrial Development Authority, Arizona, Education Facility Revenue Bonds, Northwest Christian School Project, Series 2020A, 5.000%, 9/01/55, 144A | | 9/30 at 100.00 | | | 203,152 | |
| | | | |
| | 2,700 | | | | | Phoenix Industrial Development Authority, Arizona, Lease Revenue Bonds, Guam Facilities Foundation, Inc. Project, Series 2014, 5.375%, 2/01/41 | | 2/24 at 100.00 | | | 2,257,802 | |
157
| | |
| NMCO | | Nuveen Municipal Credit Opportunities Fund (continued) |
| | Portfolio of Investments October 31, 2023 |
| | | | | | | | | | | | |
Principal
Amount (000) | | | | | Description (a) | | Optional Call
Provisions (b) | | Value | |
| | | | |
| | | | | | Arizona (continued) | | | | | | |
| | $ 1,000 | | | | | Pima County Industrial Development Authority, Arizona, Education Facility Revenue Bonds, Edkey Charter Schools Project, Series 2019, 5.875%, 7/01/51, 144A | | 7/26 at 103.00 | | $ | 905,581 | |
| | | | |
| | 50 | | | | | Pima County Industrial Development Authority, Arizona, Education Facility Revenue Bonds, Imagine East Mesa Charter Schools Project, Series 2019, 5.000%, 7/01/49, 144A | | 7/26 at 100.00 | | | 41,067 | |
| | | | |
| | 380 | | | | | Pima County Industrial Development Authority, Arizona, Education Facility Revenue Bonds, Synergy Public Charter School Project, Series 2020, 5.250%, 6/15/50, 144A | | 6/28 at 100.00 | | | 309,950 | |
| | | | |
| | 1,000 | | | | | Sierra Vista Industrial Development Authority, Arizona, Economic Development Revenue Bonds, Convertible Capital Appreciation Revenue Bonds, Series 2021A, 5.375%, 10/01/56 | | 10/29 at 103.00 | | | 651,355 | |
| | | | |
| | | | | | Tempe Industrial Development Authority, Arizona, Revenue Bonds, Mirabella at ASU Project, Series 2017A: | | | | | | |
| | 2,205 | | | | | 6.000%, 10/01/37, 144A | | 10/27 at 100.00 | | | 1,395,710 | |
| | 2,350 | | | | | 6.125%, 10/01/52, 144A | | 10/27 at 100.00 | | | 1,252,866 | |
| | | | | | Total Arizona | | | | | 22,245,257 | |
| | | | |
| | | | | | Arkansas - 1.7% (0.9% of Total Investments) | | | | | | |
| | | | |
| | 10,585 | | | | | Arkansas Development Finance Authority, Arkansas, Environmental Improvement Revenue Bonds, United States Steel Corporation, Green Series 2022, 5.450%, 9/01/52, (AMT), 144A | | 9/25 at 105.00 | | | 9,331,178 | |
| | | | | | Total Arkansas | | | | | 9,331,178 | |
| | | | |
| | | | | | California - 6.3% (3.5% of Total Investments) | | | | | | |
| | | | |
| | 3,000 | | | | | California Community Housing Agency, California, Essential Housing Revenue Bonds, K Street Flats, Series 2021A-2, 4.000%, 8/01/50, 144A | | 8/32 at 100.00 | | | 1,984,543 | |
| | | | |
| | 4,500 | | | | | California Community Housing Agency, California, Essential Housing Revenue Bonds, Serenity at Larkspur Apartments, Series 2020A, 5.000%, 2/01/50, 144A | | 2/30 at 100.00 | | | 3,351,944 | |
| | | | |
| | 1,555 | | | | | California County Tobacco Securitization Agency, Tobacco Settlement Asset-Backed Bonds, Los Angeles County Securitization Corporation, Series 2020B-2, 0.000%, 6/01/55 | | 6/30 at 26.72 | | | 215,289 | |
| | | | |
| | 1,520 | | | | | California Enterprise Development Authority, Charter School Revenue Bonds, Norton Science and Language Academy Project, Series 2020, 6.250%, 7/01/58, 144A | | 7/27 at 102.00 | | | 1,410,885 | |
| | | | |
| | 4,000 | | | | | California Municipal Finance Authority, Revenue Bonds, Simpson University, Series 2020A, 6.000%, 10/01/50, 144A | | 10/27 at 103.00 | | | 3,685,322 | |
| | | | |
| | 1,385 | | | | | California Public Finance Authority, Charter School Lease Revenue Bonds, California Crosspoint Academy Project, Series 2020A, 5.125%, 7/01/55, 144A | | 7/28 at 100.00 | | | 1,003,017 | |
| | | | |
| | 320 | | | | | California Public Finance Authority, Senior Living Revenue Bonds, Enso Village, Refunding Green Series 2021A, 5.000%, 11/15/51, 144A | | 11/29 at 102.00 | | | 257,737 | |
| | | | |
| | | | | | California School Finance Authority, California, Charter School Revenue Bonds, Encore Education Obligated Group, Series 2016A: | | | | | | |
| | 4,020 | | | | | 5.000%, 6/01/42, 144A | | 6/26 at 100.00 | | | 3,027,477 | |
| | 4,380 | | | | | 5.000%, 6/01/52, 144A | | 6/26 at 100.00 | | | 3,051,390 | |
| | | | |
| | | | | | California School Finance Authority, Charter School Revenue Bonds, Arts in Action Charter Schools - Obligated Group, Series 2020A: | | | | | | |
| | 1,410 | | | | | 5.000%, 6/01/50, 144A | | 6/27 at 100.00 | | | 925,743 | |
| | 1,200 | | | | | 5.000%, 6/01/59, 144A | | 6/27 at 100.00 | | | 750,145 | |
| | | | |
| | 1,000 | | | | | California School Finance Authority, Charter School Revenue Bonds, Scholarship Prep Public Schools Obligated Group, Series 2020A, 5.000%, 6/01/60, 144A | | 6/28 at 100.00 | | | 674,008 | |
158
| | | | | | | | | | | | |
Principal
Amount (000) | | | | | Description (a) | | Optional Call
Provisions (b) | | Value | |
| | | | |
| | | | | | California (continued) | | | | | | |
| | | | |
| | $ 1,500 | | | | | California Statewide Communities Development Authority, California, Revenue Bonds, Loma Linda University Medical Center, Series 2014A, 5.500%, 12/01/54 | | 12/24 at 100.00 | | $ | 1,428,953 | |
| | | | |
| | | | | | California Statewide Community Development Authority, Revenue Bonds, Daughters of Charity Health System, Series 2005A: | | | | | | |
| | 35 | | | (c),(d) | | 5.750%, 7/01/24 | | 1/22 at 100.00 | | | 34,740 | |
| | 0 | | | (c),(d),(e) | | 5.750%, 7/01/30 | | 1/22 at 100.00 | | | 440 | |
| | 17 | | | (c),(d) | | 5.750%, 7/01/35 | | 1/22 at 100.00 | | | 16,655 | |
| | | | |
| | 27 | | | (c),(d) | | California Statewide Community Development Authority, Revenue Bonds, Daughters of Charity Health System, Series 2005G, 5.500%, 7/01/24 | | 1/22 at 100.00 | | | 27,264 | |
| | | | |
| | 13 | | | (c),(d) | | California Statewide Community Development Authority, Revenue Bonds, Daughters of Charity Health System, Series 2005H, 5.750%, 7/01/25 | | 1/22 at 100.00 | | | 12,423 | |
| | | | |
| | 25,000 | | | | | California Statewide Financing Authority, Tobacco Settlement Asset- Backed Bonds, Pooled Tobacco Securitization Program, Series 2006A, 0.000%, 6/01/46 | | 11/23 at 24.98 | | | 5,403,741 | |
| | | | |
| | 2,500 | | | | | CSCDA Community Improvement Authority, California, Essential Housing Revenue Bonds, Vineyard Gardens Apartments, Senior Lien Series 2021A, 3.250%, 10/01/58, 144A | | 4/32 at 100.00 | | | 1,468,346 | |
| | | | |
| | 2,000 | | | | | CSCDA Community Improvement Authority, California, Essential Housing Revenue Bonds, Wood Creek Apartments, Mezzanine Lien Series 2021A- 2, 4.000%, 12/01/58 | | 6/32 at 100.00 | | | 1,336,239 | |
| | | | |
| | 50,000 | | | | | Golden State Tobacco Securitization Corporation, California, Tobacco Settlement Asset-Backed Bonds, Capital Appreciation Series 2021B-2, 0.000%, 6/01/66 | | 12/31 at 27.75 | | | 4,101,115 | |
| | | | |
| | 615 | | | | | Los Angeles Department of Airports, California, Revenue Bonds, Los Angeles International Airport, Refunding Subordinate Lien Private Activity Series 2021A, 5.000%, 5/15/39, (AMT) | | 5/31 at 100.00 | | | 606,013 | |
| | | | | | Total California | | | | | 34,773,429 | |
| | | | |
| | | | | | Colorado - 12.1% (6.7% of Total Investments) | | | | | | |
| | | | |
| | 3,000 | | | | | Aurora Highlands Community Authority Board, Adams County, Colorado, Special Tax Revenue Bonds, Refunding & Improvement Series 2021A, 5.750%, 12/01/51 | | 12/28 at 103.00 | | | 2,484,226 | |
| | | | |
| | 2,000 | | | | | Bradley Heights Metropolitan District 2, Colorado Springs, El Paso County, Colorado, General Obligation Limited Tax Bonds, Series 2021A-3, 4.750%, 12/01/51 | | 9/26 at 103.00 | | | 1,366,090 | |
| | | | |
| | 963 | | | | | Broadway Station Metropolitan District 2, Denver City and County, Colorado, General Obligation Limited Tax Bonds, Convertible to Unlimited Series 2019A, 5.000%, 12/01/35 | | 6/24 at 103.00 | | | 741,183 | |
| | | | |
| | 3,000 | | | | | Broadway Station Metropolitan District 3, Denver City and County, Colorado, General Obligation Limited Tax Bonds, Convertible to Unlimited Series 2019A, 5.000%, 12/01/49 | | 6/24 at 103.00 | | | 2,130,605 | |
| | | | |
| | 1,000 | | | | | Broadway Station Metropolitan District 3, Denver City and County, Colorado, General Obligation Limited Tax Bonds, Subordinate Convertible to Senior Capital Appreciation Series 2019B, 7.500%, 12/01/49 | | 6/24 at 79.97 | | | 612,732 | |
| | | | |
| | 500 | | | | | Colorado Educational and Cultural Facilities Authority, Charter School Revenue Bonds World Compass Academy Project, Series 2017, 5.375%, 10/01/37 | | 10/27 at 100.00 | | | 412,545 | |
| | | | |
| | 3,145 | | | | | Colorado Educational and Cultural Facilities Authority, Charter School Revenue Bonds, Belle Creek Charter School, Series 2022A, 5.250%, 3/15/52, 144A | | 3/32 at 100.00 | | | 2,677,870 | |
159
| | |
| NMCO | | Nuveen Municipal Credit Opportunities Fund (continued) |
| | Portfolio of Investments October 31, 2023 |
| | | | | | | | | | | | |
Principal
Amount (000) | | | | | Description (a) | | Optional Call
Provisions (b) | | Value | |
| | | | |
| | | | | | Colorado (continued) | | | | | | |
| | $ 500 | | | | | Colorado Educational and Cultural Facilities Authority, Charter School Revenue Bonds, Loveland Classical Schools Project, Series 2016, 5.000%, 7/01/36, 144A | | 7/26 at 100.00 | | $ | 470,346 | |
| | | | |
| | | | | | Colorado Educational and Cultural Facilities Authority, Revenue Bonds, Rocky Mountain Classical Academy Project, Refunding Series 2019: | | | | | | |
| | 3,520 | | | | | 5.000%, 10/01/49, 144A | | 10/27 at 100.00 | | | 2,851,027 | |
| | 6,650 | | | | | 5.000%, 10/01/59, 144A | | 10/27 at 100.00 | | | 5,157,063 | |
| | | | |
| | 2,000 | | | | | Crossroads Metropolitan District 1, El Paso County, Colorado, Limited Tax General Obligation and Special Revenue Bonds, Series 2022, 6.500%, 12/01/51 | | 12/29 at 103.00 | | | 1,765,850 | |
| | | | |
| | 1,750 | | | | | Green Valley Ranch East Metropolitan District 6, Adams County, Colorado, Limited Tax General Obligation Bonds, Series 2020A-3, 5.875%, 12/01/50 | | 9/25 at 103.00 | | | 1,564,784 | |
| | | | |
| | 14,000 | | | (f) | | Hess Ranch Metropolitan District 6, Parker, Colorado, Limited Tax General Obligation Bonds, Convertible Capital Appreciation Series 2020A-2, 0.000%, 12/01/49 | | 3/25 at 93.28 | | | 9,368,285 | |
| | | | |
| | 5,500 | | | | | Hess Ranch Metropolitan District 6, Parker, Colorado, Limited Tax General Obligation Bonds, Series 2020A-1, 5.000%, 12/01/49 | | 3/25 at 103.00 | | | 4,428,322 | |
| | | | |
| | 1,075 | | | (g) | | Indy Oak Tod Metropolitan District, Lakewood, Jefferson County, Colorado, Limited Tax General Obligation Bonds, Convertible to Unlimited Tax Series 2020A, 5.500%, 12/01/50, (Pre-refunded 6/01/25), 144A | | 6/25 at 103.00 | | | 1,092,487 | |
| | | | |
| | 500 | | | | | Iron Mountain Metropolitan District 2, Windsor, Weld County, Colorado, Limited Tax General Obligation Bonds, Refunding & Improvement Series 2019A, 5.000%, 12/01/49 | | 12/24 at 103.00 | | | 403,907 | |
| | | | |
| | 500 | | | | | Johnstown North Metropolitan District 2, Johnstown, Colorado, General Obligation Bonds, Refunding & Improvement Series 2022A, 7.000%, 8/15/52 | | 12/27 at 103.00 | | | 475,379 | |
| | | | |
| | 1,000 | | | | | Lanterns Metropolitan District 2, Castle Rock, Douglas County, Colorado, Limited Tax General Obligation Bonds, Series 2021A-3, 4.500%, 12/01/50 | | 9/26 at 103.00 | | | 663,754 | |
| | | | |
| | 2,000 | | | | | Ledge Rock Center Commercial Metropolitan District (In the Town of Johnstown, Weld County, Colorado), Limited Tax General Obligation Bonds, Series 2022, 7.375%, 11/01/52, 144A | | 11/29 at 103.00 | | | 1,839,920 | |
| | | | |
| | 500 | | | | | Mountain Shadows Metropolitan District, Colorado, General Obligation Limited Tax Bonds, Refunding Series 2016, 4.000%, 12/01/26 | | 12/25 at 100.00 | | | 478,175 | |
| | | | |
| | 1,000 | | | | | Murphy Creek Metropolitan District 5 (In the City of Aurora, Arapahoe County, Colorado), General Obligation Limited Tax Bonds, Series 2022A and Subordinate General Obligation Limited Tax Bonds, Series 2022B(3), 6.000%, 12/01/52 | | 9/27 at 103.00 | | | 890,381 | |
| | | | |
| | 1,000 | | | | | North Range Metropolitan District 3, Adams County, Colorado, Limited Tax General Obligation Bonds, Series 2020A-3, 5.250%, 12/01/50 | | 12/25 at 103.00 | | | 829,542 | |
| | | | |
| | 515 | | | | | North Vista Highlands Metropolitan District 3, Pueblo County, Colorado, Limited Tax General Obligation Bonds, Series 2020, 5.125%, 12/01/49 | | 3/25 at 103.00 | | | 430,512 | |
| | | | |
| | 10,180 | | | | | Painted Prairie Public Improvement Authority, Aurora, Colorado, Special Revenue Bonds, Series 2019, 5.000%, 12/01/49 | | 12/24 at 103.00 | | | 8,327,965 | |
| | | | |
| | 1,000 | | | | | Palisade Metropolitan District 2, Broomfield County, Colorado, General Obligation Limited Tax Bonds, Subordinate Series 2019, 7.250%, 12/15/49 | | 12/24 at 103.00 | | | 852,275 | |
| | | | |
| | 705 | | | | | Penrith Park Metropolitan District, Adams County, Colorado, General Obligation Limited Tax Bonds, Series 2019A, 5.000%, 12/01/49 | | 12/24 at 103.00 | | | 583,030 | |
| | | | |
| | 4,445 | | | | | Pioneer Community Authority Board (Weld County, Colorado), Special Revenue Bonds, Series 2022, 6.500%, 12/01/34 | | 6/29 at 103.00 | | | 3,975,073 | |
| | | | |
| | 5,000 | | | | | Sagebrush Farm Metropolitan District 1, Aurora, Adams County, Colorado, General Obligation Limited Tax Bonds, Series 2022A, 6.750%, 12/01/52 | | 12/29 at 103.00 | | | 4,534,958 | |
160
| | | | | | | | | | | | |
Principal Amount (000) | | | | | Description (a) | | Optional Call Provisions (b) | | Value | |
| | | | |
| | | | | | Colorado (continued) | | | | | | |
| | | | |
| | $ 1,200 | | | | | Sky Ranch Community Authority Board, Arapahoe County, Colorado, Limited Tax Supported District 1 Revenue Bonds, Senior Series 2019A, 5.000%, 12/01/49 | | 12/24 at 102.00 | | $ | 1,054,177 | |
| | | | |
| | 806 | | | | | Sky Ranch Community Authority Board, Arapahoe County, Colorado, Limited Tax Supported District 1 Revenue Bonds, Subordinate Series 2019B, 7.625%, 12/15/49 | | 12/24 at 102.00 | | | 827,471 | |
| | | | |
| | 500 | | | | | STC Metropolitan District 2, Superior, Boulder County, Colorado, Limited Tax General Obligation and Special Revenue Bonds, Refunding & improvement Series 2019A, 5.000%, 12/01/49 | | 12/24 at 103.00 | | | 409,614 | |
| | | | |
| | 1,000 | | | | | Sterling Ranch Community Authority Board, Douglas County, Colorado, Limited Tax Supported and Special Revenue Bonds, Special District 3, Series 2022, 6.750%, 12/01/53 | | 12/27 at 103.00 | | | 973,603 | |
| | | | |
| | 760 | | | | | Talon Pointe Metropolitan District, Adams County, Colorado, Limited Tax General Obligation Bonds, Convertible to Unlimited Tax Refunding & Improvement Series 2019A, 5.250%, 12/01/51 | | 12/25 at 103.00 | | | 527,687 | |
| | | | |
| | 1,000 | | | | | Transport Metropolitan District 3, In the City of Aurora, Adams County, Colorado, General Obligation Limited Bonds, Series 2021A-1, 5.000%, 12/01/51 | | 3/26 at 103.00 | | | 725,094 | |
| | | | |
| | 1,000 | | | | | Ward TOD Metropolitan District 1, Wheat Ridge, Jefferson County, Colorado, Limited Tax General Obligation Bonds, Convertible to Unlimited Tax Series 2019A, 5.000%, 12/01/49 | | 12/24 at 103.00 | | | 824,595 | |
| | | | | | Total Colorado | | | | | 66,750,527 | |
| | | | |
| | | | | | Connecticut - 0.4% (0.2% of Total Investments) | | | | | | |
| | | | |
| | 3,200 | | | | | Connecticut Health and Educational Facilities Authority, Revenue Bonds, Mary Wade Home Issue, Series 2019A-1, 5.000%, 10/01/54, 144A | | 10/24 at 104.00 | | | 2,200,139 | |
| | | | | | Total Connecticut | | | | | 2,200,139 | |
| | | | |
| | | | | | District of Columbia - 3.8% (2.1% of Total Investments) | | | | | | |
| | | | |
| | 89,500 | | | | | District of Columbia Tobacco Settlement Corporation, Tobacco Settlement Asset-Backed Bonds, Series 2006A, 0.000%, 6/15/46, (WI/DD) | | 12/23 at 24.98 | | | 19,208,177 | |
| | | | |
| | 1,998 | | | | | District of Columbia, Revenue Bonds, Saint Paul on Fouth Street, Inc., Series 2019A, 5.250%, 5/15/55, 144A | | 5/30 at 100.00 | | | 1,509,029 | |
| | | | | | Total District of Columbia | | | | | 20,717,206 | |
| | | | |
| | | | | | Florida - 30.6% (16.8% of Total Investments) | | | | | | |
| | | | |
| | 2,000 | | | | | Academical Village Community Development District, Davie, Florida, Special Assessment Revenue Bonds, Series 2020, 3.625%, 5/01/40 | | 5/30 at 100.00 | | | 1,497,443 | |
| | | | |
| | | | | | Capital Trust Agency, Florida, Educational Facilities Lease Revenue Bonds, Franklin Academy Projects, Series 2020: | | | | | | |
| | 140 | | | | | 5.000%, 12/15/35, 144A | | 7/26 at 100.00 | | | 126,485 | |
| | 100 | | | | | 5.000%, 12/15/50, 144A | | 7/26 at 100.00 | | | 76,952 | |
| | | | |
| | 100 | | | | | Capital Trust Agency, Florida, Educational Facilities Revenue Bonds, Imagine School at Land O’Lakes Project, Series 2020A, 5.000%, 12/15/49, 144A | | 12/30 at 100.00 | | | 79,054 | |
| | | | |
| | 1,950 | | | | | Capital Trust Agency, Florida, Educational Facilities Revenue Bonds, Pineapple Cove Classical Academy, Series 2019A, 5.125%, 7/01/39, 144A | | 1/29 at 100.00 | | | 1,729,120 | |
| | | | |
| | 725 | | | (c) | | Capital Trust Agency, Florida, Revenue Bonds, Provision CARES Proton Therapy Center, Orlando Project, Series 2018, 7.500%, 6/01/48, 144A | | 6/28 at 100.00 | | | 103,310 | |
| | | | |
| | | | | | Capital Trust Agency, Florida, Senior Living Facilities Revenue Bonds, Elim Senior Housing, Inc. Project, Series 2017: | | | | | | |
| | 1,490 | | | | | 5.625%, 8/01/37, 144A | | 8/24 at 103.00 | | | 1,122,563 | |
| | 3,735 | | | | | 5.875%, 8/01/52, 144A | | 8/24 at 103.00 | | | 2,499,657 | |
161
| | |
| NMCO | | Nuveen Municipal Credit Opportunities Fund (continued) |
| | Portfolio of Investments October 31, 2023 |
| | | | | | | | | | | | |
Principal Amount (000) | | | | | Description (a) | | Optional Call Provisions (b) | | Value | |
| | | | |
| | | | | | Florida (continued) | | | | | | |
| | $ 170 | | | | | Cypress Preserve Community Development District, Pasco County, Florida, Special Assessment Bonds, Assessment Area 2, Series 2019, 4.125%, 11/01/50 | | 11/29 at 100.00 | | $ | 124,401 | |
| | | | |
| | | | | | Epperson North Community Development District, Florida, Capital Improvement Revenue Bonds, Assessment Area 1, Series 2018A-1: | | | | | | |
| | 1,000 | | | | | 5.500%, 11/01/39, 144A | | 11/29 at 100.00 | | | 960,445 | |
| | 1,000 | | | | | 5.750%, 11/01/49, 144A | | 11/29 at 100.00 | | | 939,882 | |
| | | | |
| | | | | | Florida Development Finance Corporation, Educational Facilities Revenue Bonds, Miami Arts Charter School Projects, Series 2014: | | | | | | |
| | 2,500 | | | | | 5.875%, 6/15/34, 144A | | 6/24 at 100.00 | | | 2,185,992 | |
| | 5,795 | | | | | 6.000%, 6/15/44, 144A | | 6/24 at 100.00 | | | 4,598,785 | |
| | | | |
| | | | | | Florida Development Finance Corporation, Educational Facilities Revenue Bonds, Pepin Academies of Pasco County Inc., Series 2020A: | | | | | | |
| | 2,435 | | | | | 5.000%, 1/01/40, 144A | | 1/27 at 100.00 | | | 1,993,691 | |
| | 500 | | | | | 5.000%, 1/01/50, 144A | | 1/27 at 100.00 | | | 376,851 | |
| | | | |
| | 1,575 | | | | | Florida Development Finance Corporation, Educational Facilities Revenue Bonds, Southwest Charter Foundation Inc Projects, Series 2017A, 6.000%, 6/15/37, 144A | | 6/27 at 100.00 | | | 1,472,042 | |
| | | | |
| | 41,825 | | | | | Florida Development Finance Corporation, Florida, Surface Transportation Facility Revenue Bonds, Brightline Passenger Rail Project, Green Series 2019B, 7.375%, 1/01/49, (AMT), 144A | | 1/24 at 107.00 | | | 40,776,868 | |
| | | | |
| | | | | | Florida Development Finance Corporation, Florida, Surface Transportation Facility Revenue Bonds, Virgin Trains USA Passenger Rail Project, Series 2019A: | | | | | | |
| | 8,535 | | | | | 6.250%, 1/01/49, (AMT), (Mandatory Put 1/01/24), 144A | | 12/23 at 101.00 | | | 8,513,861 | |
| | 6,930 | | | | | 6.375%, 1/01/49, (AMT), (Mandatory Put 1/01/26), 144A | | 12/23 at 102.00 | | | 6,596,722 | |
| | 42,090 | | | | | 6.500%, 1/01/49, (AMT), (Mandatory Put 1/01/29), 144A | | 12/23 at 102.00 | | | 39,781,271 | |
| | | | |
| | 7,500 | | | | | Florida Development Finance Corporation, Revenue Bonds, Brightline Florida Passenger Rail Expansion Project, Series 2023A, 7.500%, 7/01/57, (AMT), (Mandatory Put 8/15/24) | | 12/23 at 103.50 | | | 7,374,310 | |
| | | | |
| | 13,500 | | | | | Florida Development Finance Corporation, Revenue Bonds, Brightline Passenger Rail Expansion Project, Series 2023C, 8.000%, 7/01/57, (AMT), (Mandatory Put 4/01/24), 144A | | 11/23 at 100.00 | | | 13,595,421 | |
| | | | |
| | 6,750 | | | | | Greater Orlando Aviation Authority, Florida, Orlando Airport Facilities Revenue Bonds, Priority Subordinated Series 2017A, 5.000%, 10/01/42, (AMT), (WI/DD) | | 10/27 at 100.00 | | | 6,546,937 | |
| | | | |
| | 965 | | | | | Lee County Industrial Development Authority, Florida, Charter School Revenue Bonds, Lee County Community Charter Schools, Series 2007A, 5.250%, 6/15/27 | | 12/23 at 100.00 | | | 930,050 | |
| | | | |
| | | | | | Lee County Industrial Development Authority, Florida, Healthcare Facilities Revenue Bonds, Preserve Project, Series 2017A: | | | | | | |
| | 1,000 | | | | | 5.375%, 12/01/32, 144A | | 12/23 at 104.00 | | | 811,494 | |
| | 1,100 | | | | | 5.625%, 12/01/37, 144A | | 12/23 at 104.00 | | | 817,481 | |
| | 1,300 | | | | | 5.750%, 12/01/52, 144A | | 12/23 at 104.00 | | | 857,294 | |
| | | | |
| | 690 | | | | | LT Ranch Community Development District, Sarasota County, Florida, Capital Improvement Revenue Bonds, Series 2019, 4.000%, 5/01/40 | | 5/30 at 100.00 | | | 549,804 | |
| | | | |
| | 2,425 | | | | | Mandarin Grove Community Development District, Manatee County, Florida, Special Assessment Revenue Bonds, 2022 Project Series 2022, 6.625%, 5/01/53, 144A | | 5/42 at 100.00 | | | 2,337,318 | |
| | | | |
| | | | | | Miami Health Facilities Authority, Florida, Health Facilities Revenue Bonds, Miami Jewish Health System Inc. Project, Series 2017: | | | | | | |
| | 1,260 | | | | | 5.000%, 7/01/26 | | No Opt. Call | | | 1,195,242 | |
| | 1,000 | | | | | 5.000%, 7/01/27 | | No Opt. Call | | | 930,689 | |
162
| | | | | | | | | | | | |
Principal Amount (000) | | | | | Description (a) | | Optional Call Provisions (b) | | Value | |
| | | | |
| | | | | | Florida (continued) | | | | | | |
| | | | |
| | $ 1,410 | | | | | Miami World Center Community Development District, Miami-Dade County, Florida, Special Assessment Bonds, Series 2017, 5.125%, 11/01/39 | | 11/27 at 100.00 | | $ | 1,314,433 | |
| | | | |
| | 2,400 | | | | | Middleton Community Development District A, Florida, Special Assessment Revenue Bonds, Series 2022, 6.200%, 5/01/53, 144A | | 11/30 at 100.00 | | | 2,356,535 | |
| | | | |
| | 1,790 | | | | | Mirada Community Development District, Florida, Capital Improvement Bonds, Assessment Area 4 Series 2021, 3.250%, 5/01/32 | | No Opt. Call | | | 1,517,335 | |
| | | | |
| | | | | | Osceola County, Florida, Transportation Revenue Bonds, Osceola Parkway, Refunding & Improvement Capital Appreciation Series 2019A-2: | | | | | | |
| | 3,125 | | | | | 0.000%, 10/01/41 | | 10/29 at 66.18 | | | 1,086,141 | |
| | 2,130 | | | | | 0.000%, 10/01/48 | | 10/29 at 50.96 | | | 446,577 | |
| | 500 | | | | | 0.000%, 10/01/54 | | 10/29 at 40.38 | | | 70,255 | |
| | | | |
| | 100 | | | | | Parker Road Community Development District, Florida, Capital Improvement Revenue Bonds, Refudning Series 2020, 3.875%, 5/01/40 | | 5/30 at 100.00 | | | 76,886 | |
| | | | |
| | 125 | | | | | Portico Community Development District, Lee County, Florida, Special Assessment, Refunding Improvement Series 2020-1, 3.500%, 5/01/37 | | 5/30 at 100.00 | | | 96,735 | |
| | | | |
| | 2,325 | | | | | Saint Johns County Industrial Development Authority, Florida, First Mortgage Revenue Bonds, Presbyterian Retirement Communities Obligated Group Project, Series 2020A, 4.000%, 8/01/55 | | 8/25 at 103.00 | | | 1,642,868 | |
| | | | |
| | | | | | Seminole County Industrial Development Authority, Florida, Retirement Facility Revenue Bonds, Legacy Pointe At UCF Project, Series 2019A: | | | | | | |
| | 3,970 | | | | | 5.500%, 11/15/49 | | 11/26 at 103.00 | | | 2,833,738 | |
| | 2,440 | | | | | 5.750%, 11/15/54 | | 11/26 at 103.00 | | | 1,771,072 | |
| | | | |
| | 2,260 | | | | | Three Rivers Community Development District, Florida, Special Assessment Revenue Bonds, Series 2019A-1, 4.750%, 5/01/50 | | 5/29 at 100.00 | | | 1,825,666 | |
| | | | |
| | 70 | | | | | Three Rivers Community Development District, Florida, Special Assessment Revenue Bonds, Series 2019A-2, 4.750%, 5/01/29 | | No Opt. Call | | | 67,713 | |
| | | | |
| | 1,590 | | | | | Twin Creeks North Community Development District, Florida, Special Assessment Bonds, Master Infrastructure Improvements, Series 2016A-1, 6.375%, 11/01/47 | | 11/31 at 100.00 | | | 1,554,664 | |
| | | | |
| | 410 | | | | | West Villages Improvement District, Florida, Special Assessment Revenue Bonds, Unit of Development 1, Series 2017, 4.000%, 5/01/27 | | No Opt. Call | | | 395,465 | |
| | | | | | Total Florida | | | | | 168,557,518 | |
| | | | |
| | | | | | Georgia - 4.1% (2.2% of Total Investments) | | | | | | |
| | | | |
| | | | | | Atlanta Development Authority, Georgia, Senior Health Care Facilities Revenue Bonds, Georgia Proton Treatment Center Project, Current Interest Series 2017A-1: | | | | | | |
| | 1,250 | | | (c) | | 6.500%, 1/01/29 | | 1/28 at 100.00 | | | 562,500 | |
| | 7,030 | | | (c) | | 6.750%, 1/01/35 | | 1/28 at 100.00 | | | 3,163,500 | |
| | 18,430 | | | (c) | | 7.000%, 1/01/40 | | 1/28 at 100.00 | | | 8,293,500 | |
| | | | |
| | 441 | | | | | Georgia Local Governments, Certificates of Participation, Georgia Municipal Association, Series 1998A, 4.750%, 6/01/28 - NPFG Insured | | No Opt. Call | | | 436,645 | |
| | | | |
| | 10,000 | | | | | Main Street Natural Gas Inc., Georgia, Gas Supply Revenue Bonds, Series 2019A, 5.000%, 5/15/43 | | 5/29 at 100.00 | | | 9,403,280 | |
| | | | |
| | 850 | | | | | White County Development Authority, Georgia, Revenue Bonds Truett McConnell University, Series 2019, 5.125%, 10/01/39 | | 10/26 at 103.00 | | | 707,738 | |
| | | | | | Total Georgia | | | | | 22,567,163 | |
163
| | |
| NMCO | | Nuveen Municipal Credit Opportunities Fund (continued) |
| | Portfolio of Investments October 31, 2023 |
| | | | | | | | | | | | |
Principal Amount (000) | | | | | Description (a) | | Optional Call Provisions (b) | | Value | |
| | | | |
| | | | | | Guam - 0.3% (0.2% of Total Investments) | | | | | | |
| | | | |
| | $ 1,915 | | | | | Guam Government, General Obligation Bonds, Series 2019, 5.000%, 11/15/31, (AMT) | | 5/29 at 100.00 | | $ | 1,895,272 | |
| | | | | | Total Guam | | | | | 1,895,272 | |
| | | | |
| | | | | | Hawaii - 0.2% (0.1% of Total Investments) | | | | | | |
| | | | |
| | 1,150 | | | | | Hawaii Department of Budget and Finance, Special Purpose Revenue Bonds, Chaminade University of Honolulu, Series 2015A, 5.000%, 1/01/45, 144A | | 1/25 at 100.00 | | | 901,099 | |
| | | | | | Total Hawaii | | | | | 901,099 | |
| | | | |
| | | | | | Idaho - 2.0% (1.1% of Total Investments) | | | | | | |
| | | | |
| | 9,750 | | | | | Idaho Falls Auditorium District, Idaho, Certifications of Participation, Annual Appropriation Series 2021, 5.250%, 5/15/51, 144A | | 5/26 at 102.00 | | | 8,464,795 | |
| | | | |
| | 2,515 | | | | | Nez Perce County, Idaho, Pollution Control Revenue Bonds, Potlatch Corporation Project, Refunding Series 2016, 2.750%, 10/01/24 | | No Opt. Call | | | 2,453,232 | |
| | | | | | Total Idaho | | | | | 10,918,027 | |
| | | | |
| | | | | | Illinois - 13.7% (7.5% of Total Investments) | | | | | | |
| | | | |
| | 4,605 | | | | | Chicago Board of Education, Illinois, General Obligation Bonds, Dedicated Revenues, Series 2023A, 6.000%, 12/01/49, (WI/DD) | | 12/33 at 100.00 | | | 4,604,780 | |
| | | | |
| | 2,800 | | | (h) | | Chicago, Illinois, General Obligation Bonds, Refunding Series 2016C, 5.000%, 1/01/38, (UB) | | 1/26 at 100.00 | | | 2,672,144 | |
| | | | |
| | 5,000 | | | (h) | | Chicago, Illinois, General Obligation Bonds, Series 2019A, 5.500%, 1/01/49, (UB) | | 1/29 at 100.00 | | | 4,886,376 | |
| | | | |
| | 3,965 | | | (h) | | Chicago, Illinois, General Obligation Bonds, VAribale Rate Demand Series 2007F, 5.500%, 1/01/42, (UB) | | 1/25 at 100.00 | | | 3,860,503 | |
| | | | |
| | 4,750 | | | | | Illinois Finance Authority, Education Revenue Bonds, Noble Network of Charter Schools, Series 2015, 5.000%, 9/01/32, (WI/DD) | | 9/24 at 100.00 | | | 4,673,343 | |
| | | | |
| | 10,850 | | | | | Illinois Finance Authority, Revenue Bonds, Admiral at the Lake Project, Refunding Series 2017, 5.250%, 5/15/54 | | 5/24 at 103.00 | | | 7,414,672 | |
| | | | |
| | 9,945 | | | | | Illinois State, General Obligation Bonds, June Series 2022A, 5.500%, 3/01/47 | | 3/32 at 100.00 | | | 10,004,001 | |
| | | | |
| | 4,840 | | | | | Illinois State, General Obligation Bonds, May Series 2018A, 5.000%, 5/01/32 | | 5/28 at 100.00 | | | 4,919,330 | |
| | | | |
| | 890 | | | | | Illinois State, General Obligation Bonds, May Series 2020, 5.500%, 5/01/39 | | 5/30 at 100.00 | | | 910,997 | |
| | | | |
| | 4,600 | | | | | Illinois State, General Obligation Bonds, November Series 2017D, 5.000%, 11/01/28 | | 11/27 at 100.00 | | | 4,704,228 | |
| | | | |
| | 7,935 | | | | | Metropolitan Pier and Exposition Authority, Illinois, McCormick Place Expansion Project Bonds, Refunding Series 2020A, 5.000%, 6/15/50 | | 12/29 at 100.00 | | | 7,378,776 | |
| | | | |
| | 10,000 | | | | | Metropolitan Pier and Exposition Authority, Illinois, McCormick Place Expansion Project Bonds, Series 2012B, 0.000%, 12/15/50 - AGM Insured | | No Opt. Call | | | 2,216,010 | |
| | | | |
| | 2,980 | | | | | Metropolitan Pier and Exposition Authority, Illinois, McCormick Place Expansion Project Bonds, Series 2017A, 5.000%, 6/15/57 | | 12/27 at 100.00 | | | 2,726,564 | |
| | | | |
| | | | | | Metropolitan Pier and Exposition Authority, Illinois, McCormick Place Expansion Project Bonds, Series 2017B: | | | | | | |
| | 29,815 | | | | | 0.000%, 12/15/54 | | No Opt. Call | | | 5,231,295 | |
| | | | |
| | | | | | Metropolitan Pier and Exposition Authority, Illinois, Revenue Bonds, McCormick Place Expansion Project, Capital Appreciation Refunding Series 2010B-1: | | | | | | |
| | 12,500 | | | | | 0.000%, 6/15/44 - AGM Insured | | No Opt. Call | | | 4,050,926 | |
| | 4,545 | | | | | 0.000%, 6/15/45 - AGM Insured | | No Opt. Call | | | 1,384,162 | |
164
| | | | | | | | | | | | |
Principal Amount (000) | | | | | Description (a) | | Optional Call Provisions (b) | | Value | |
| | | | |
| | | | | | Illinois (continued) | | | | | | |
| | | | | | Northern Illinois University, Auxiliary Facilities System Revenue Bonds, Series 2021: | | | | | | |
| | $ 425 | | | | | 4.000%, 10/01/39 - BAM Insured | | 4/31 at 100.00 | | $ | 366,890 | |
| | 800 | | | | | 4.000%, 10/01/40 - BAM Insured | | 4/31 at 100.00 | | | 680,993 | |
| | 700 | | | | | 4.000%, 10/01/41 - BAM Insured | | 4/31 at 100.00 | | | 586,856 | |
| | | | |
| | | | | | Sales Tax Securitization Corporation, Illinois, Sales Tax Securitzation Bonds, Second Lien Series 2020A: | | | | | | |
| | 150 | | | | | 4.000%, 1/01/38 | | 1/30 at 100.00 | | | 133,935 | |
| | 120 | | | | | 4.000%, 1/01/39 | | 1/30 at 100.00 | | | 105,833 | |
| | | | |
| | 1,000 | | | (c) | | Yorkville United City Business District, Illinois, Storm Water and Water Improvement Project Revenue Bonds, Series 2007, 4.800%, 1/01/26 | | 11/23 at 100.00 | | | 430,000 | |
| | | | |
| | 844 | | | (c) | | Yorkville United City, Kendall County, Illinois, Sales Tax Revenue Bonds, Kendall Marketplace Project, Series 2007, 6.000%, 1/01/26 | | 11/23 at 100.00 | | | 844,465 | |
| | | | |
| | 770 | | | | | Yorkville, Illinois, Special Tax Bonds, Special Service Area 2006-113 Cannoball & Beecher, Series 2007, 5.750%, 3/01/28 | | 12/23 at 100.00 | | | 758,083 | |
| | | | | | Total Illinois | | | | | 75,545,162 | |
| | | | |
| | | | | | Indiana - 1.1% (0.6% of Total Investments) | | | | | | |
| | | | |
| | 140 | | | | | Anderson, Indiana, Multifamily Housing Revenue Bonds, Sweet Galilee at the Wigwam Project, Series 2020A, 5.375%, 1/01/40, 144A | | 1/27 at 102.00 | | | 104,402 | |
| | | | |
| | 3,105 | | | | | Indiana Finance Authority, Educational Facilities Revenue Bonds, Earlham College, Refunding Series 2013A, 5.000%, 10/01/32 | | 12/23 at 100.00 | | | 3,086,934 | |
| | | | |
| | 500 | | | | | Indiana Finance Authority, Environmental Improvement Revenue Bonds, United States Steel Corporation Project, Series 2020, 6.750%, 5/01/39, (AMT) | | 11/30 at 100.00 | | | 525,830 | |
| | | | |
| | 2,325 | | | | | Valparaiso, Indiana, Exempt Faciltiies Revenue Bonds, Pratt Paper LLC Project, Series 2013, 7.000%, 1/01/44, (AMT) | | 1/24 at 100.00 | | | 2,329,556 | |
| | | | | | Total Indiana | | | | | 6,046,722 | |
| | | | |
| | | | | | Iowa - 1.2% (0.7% of Total Investments) | | | | | | |
| | | | |
| | 6,540 | | | | | Iowa Finance Authority, Iowa, Midwestern Disaster Area Revenue Bonds, Alcoa Inc. Project, Series 2012, 4.750%, 8/01/42 | | 12/23 at 100.00 | | | 5,754,024 | |
| | | | |
| | 1,100 | | | | | Iowa Finance Authority, Iowa, Midwestern Disaster Area Revenue Bonds, Iowa Fertilizer Company Project, Refunding Series 2022, 5.000%, 12/01/50 | | 12/29 at 103.00 | | | 976,375 | |
| | | | | | Total Iowa | | | | | 6,730,399 | |
| | | | |
| | | | | | Kansas - 2.0% (1.1% of Total Investments) | | | | | | |
| | | | |
| | 3,000 | | | | | University of Kansas Hospital Authority, Health Facilities Revenue Bonds, University of Kansas Health System, Series 2017A, 4.000%, 3/01/42 | | 3/27 at 100.00 | | | 2,580,106 | |
| | | | |
| | 2,000 | | | | | Wichita, Kansas, Health Care Facilities Revenue Bonds, Presbyterian Manors, Series 2013IV-A, 6.500%, 5/15/48 | | 12/23 at 100.00 | | | 1,571,729 | |
| | | | |
| | 1,365 | | | | | Wyandotte County-Kansas City Unified Government, Kansas, Sales Tax Special Obligation Bonds, Vacation Village Project Area 1 and 2A, Series 2015, 5.750%, 9/01/32 | | 9/25 at 100.00 | | | 1,202,123 | |
| | | | |
| | 6,475 | | | | | Wyandotte County-Kansas City Unified Government, Kansas, Sales Tax Special Obligation Bonds, Village East Project Areas 2B 3 and 5, Series 2022, 5.750%, 3/01/41, 144A | | 3/29 at 103.00 | | | 5,716,266 | |
| | | | | | Total Kansas | | | | | 11,070,224 | |
| | | | |
| | | | | | Kentucky - 0.2% (0.1% of Total Investments) | | | | | | |
| | | | |
| | 1,475 | | | | | Carroll County, Kentucky, Environmental Facilities Revenue Bonds, Kentucky Utilities Company Project, Series 2008A, 2.000%, 2/01/32, (AMT) | | 6/31 at 100.00 | | | 1,090,247 | |
| | | | | | Total Kentucky | | | | | 1,090,247 | |
165
| | |
| NMCO | | Nuveen Municipal Credit Opportunities Fund (continued) |
| | Portfolio of Investments October 31, 2023 |
| | | | | | | | | | | | |
Principal Amount (000) | | | | | Description (a) | | Optional Call Provisions (b) | | Value | |
| | | | |
| | | | | | Louisiana - 2.1% (1.2% of Total Investments) | | | | | | |
| | | | |
| | $ 3,000 | | | | | Louisiana Local Government Environmental Facilities and Community Development Authority, Louisiana, Revenue Bonds, Entergy Lousiana, LLC Project, Refunding Series 2021B, 2.500%, 4/01/36 | | 4/26 at 100.00 | | $ | 2,232,779 | |
| | | | |
| | 945 | | | | | Louisiana Local Government Environmental Facilities and Community Development Authority, Louisiana, Revenue Bonds, Jefferson Parish GOMESA Project, Series 2019, 4.000%, 11/01/44, 144A | | 11/29 at 100.00 | | | 770,778 | |
| | | | |
| | 260 | | | | | Louisiana Publc Facilities Authority, Lousiana, Revenue Bonds, Lake Charles College Prep Project, Series 2019A, 5.000%, 6/01/58, 144A | | 6/27 at 100.00 | | | 195,788 | |
| | | | |
| | 2,365 | | | | | Louisiana Public Facilities Authority, Hospital Revenue Bonds, Franciscan Missionaries of Our Lady Health System, Series 2017A, 5.000%, 7/01/47 | | 7/27 at 100.00 | | | 2,255,056 | |
| | | | |
| | | | | | Louisiana Public Facilities Authority, Louisiana, Revenue Bonds, Tulane University, Refunding Series 2020A: | | | | | | |
| | 235 | | | (g) | | 4.000%, 4/01/50, (Pre-refunded 4/01/30) | | 4/30 at 100.00 | | | 237,549 | |
| | 15 | | | | | 4.000%, 4/01/50 | | 4/30 at 100.00 | | | 11,795 | |
| | | | |
| | | | | | Louisiana Public Facilities Authority, Louisiana, Revenue Bonds, Young Audiences Charter School, Series 2019A: | | | | | | |
| | 1,800 | | | | | 5.000%, 4/01/49, 144A | | 4/27 at 100.00 | | | 1,363,025 | |
| | 2,000 | | | | | 5.000%, 4/01/57, 144A | | 4/27 at 100.00 | | | 1,454,030 | |
| | | | |
| | 200 | | | | | Saint James Parish, Louisiana, Revenue Bonds, NuStar Logistics, L.P. Project, Series 2008, 6.100%, 6/01/38, (Mandatory Put 6/01/30), 144A | | No Opt. Call | | | 208,891 | |
| | | | |
| | 1,235 | | | | | Saint James Parish, Louisiana, Revenue Bonds, NuStar Logistics, L.P. Project, Series 2010, 6.350%, 7/01/40, 144A | | 6/30 at 100.00 | | | 1,296,402 | |
| | | | |
| | 800 | | | | | Saint James Parish, Louisiana, Revenue Bonds, NuStar Logistics, L.P. Project, Series 2010A, 6.350%, 10/01/40, 144A | | 6/30 at 100.00 | | | 839,775 | |
| | | | |
| | 695 | | | | | Saint James Parish, Louisiana, Revenue Bonds, NuStar Logistics, L.P. Project, Series 2010B, 6.100%, 12/01/40, (Mandatory Put 6/01/30), 144A | | No Opt. Call | | | 725,907 | |
| | | | | | Total Louisiana | | | | | 11,591,775 | |
| | | | |
| | | | | | Maryland - 0.8% (0.4% of Total Investments) | | | | | | |
| | | | |
| | | | | | Baltimore, Maryland, Convention Center Hotel Revenue Bonds, Refunding Series 2017: | | | | | | |
| | 1,000 | | | | | 5.000%, 9/01/36 | | 9/27 at 100.00 | | | 897,561 | |
| | 1,000 | | | | | 5.000%, 9/01/39 | | 9/27 at 100.00 | | | 854,962 | |
| | 680 | | | | | 5.000%, 9/01/46 | | 9/27 at 100.00 | | | 548,334 | |
| | | | |
| | 2,080 | | | | | Frederick County, Maryland, Special Tax Limited Obligation Bonds, Jefferson Technology Park Project, Refunding Series 2020A, 5.000%, 7/01/43, 144A | | 7/30 at 102.00 | | | 1,865,907 | |
| | | | | | Total Maryland | | | | | 4,166,764 | |
| | | | |
| | | | | | Massachusetts - 1.2% (0.7% of Total Investments) | | | | | | |
| | | | |
| | 1,620 | | | | | Lowell, Massachusetts, Collegiate Charter School Revenue Bonds, Series 2019, 5.000%, 6/15/54 | | 6/26 at 100.00 | | | 1,309,659 | |
| | | | |
| | 3,900 | | | | | Massachusetts Development Finance Agency Revenue Bonds, Lawrence General Hospital Issue, Series 2017, 5.000%, 7/01/47 | | 7/27 at 100.00 | | | 2,886,946 | |
| | | | |
| | 2,705 | | | | | Massachusetts Development Finance Agency, Revenue Bonds, Boston Medical Center Issue, Green Bonds, Series 2015D, 5.000%, 7/01/44 | | 7/25 at 100.00 | | | 2,517,661 | |
| | | | | | Total Massachusetts | | | | | 6,714,266 | |
| | | | |
| | | | | | Michigan - 0.9% (0.5% of Total Investments) | | | | | | |
| | | | |
| | 1,845 | | | | | Advanced Technology Academy, Michigan, Public School Academy Revenue Bonds, Refunding Series 2019, 5.000%, 11/01/44 | | 11/27 at 102.00 | | | 1,552,667 | |
166
| | | | | | | | | | | | |
Principal Amount (000) | | | | | Description (a) | | Optional Call Provisions (b) | | Value | |
| | | | |
| | | | | | Michigan (continued) | | | | | | |
| | $ 74,130 | | | | | Michigan Tobacco Settlement Finance Authority, Tobacco Settlement Asset-Backed Revenue Bonds, Capital Appreciation Turbo Term Series 2008C, 0.000%, 6/01/58 | | 6/33 at 11.41 | | $ | 3,348,541 | |
| | | | | | Total Michigan | | | | | 4,901,208 | |
| | | | |
| | | | | | Minnesota - 1.0% (0.6% of Total Investments) | | | | | | |
| | | | |
| | 500 | | | | | Bethel, Minnesota Charter School Lease Revenue Bonds, Partnership Academy Project, Series 2018A, 5.000%, 7/01/53 | | 7/26 at 102.00 | | | 374,661 | |
| | | | |
| | 1,300 | | | | | Brooklyn Park, Minnesota, Charter School Lease Revenue Bonds, Athlos Leadership Academy Project, Series 2015A, 5.750%, 7/01/46 | | 7/25 at 100.00 | | | 1,053,691 | |
| | | | |
| | 2,440 | | | | | Columbia Heights, Minnesota, Charter School Lease Revenue Bonds, Prodeo Academy Project, Series 2019A, 5.000%, 7/01/54 | | 7/27 at 102.00 | | | 1,864,340 | |
| | | | |
| | 130 | | | | | Minneapolis, Minnesota, Charter School Lease Revenue Bonds, Friendship Academy of the Arts Project, Series 2019A, 5.250%, 12/01/52, 144A | | 12/27 at 100.00 | | | 100,833 | |
| | | | |
| | 30 | | | | | Minneapolis, Minnesota, Charter School Lease Revenue Bonds, Northeast College Prep Project, Series 2020A, 5.000%, 7/01/40 | | 7/30 at 100.00 | | | 24,792 | |
| | | | |
| | 2,040 | | | | | Saint Cloud, Minnesota, Charter School Lease Revenue Bonds, Athlos Academy, Series 2022A, 5.875%, 6/01/57, 144A | | 6/30 at 102.00 | | | 1,714,939 | |
| | | | |
| | 1,000 | | | | | Scanlon, Minnesota, Health Care Facilities Revenue Bonds, Duluth Health Services Project, Refunding Series 2020, 3.950%, 3/01/50 | | 3/25 at 101.00 | | | 608,082 | |
| | | | | | Total Minnesota | | | | | 5,741,338 | |
| | | | |
| | | | | | Mississippi - 0.6% (0.3% of Total Investments) | | | | | | |
| | | | |
| | 2,000 | | | | | Mississippi Business Finance Corporation, Revenue Bonds, System Energy Resources, Inc. Project, Refunding Series 2021, 2.375%, 6/01/44 | | 6/26 at 100.00 | | | 1,062,018 | |
| | | | |
| | 2,285 | | | | | Mississippi Hospital Equipment and Facilities Authority, Revenue Bonds, Baptist Memorial Healthcare, Series 2016A, 5.000%, 9/01/46 | | 9/26 at 100.00 | | | 2,065,413 | |
| | | | | | Total Mississippi | | | | | 3,127,431 | |
| | | | |
| | | | | | Missouri - 0.8% (0.5% of Total Investments) | | | | | | |
| | | | |
| | 315 | | | | | Boone County, Missouri, Hospital Revenue Bonds, Boone Hospital Center, Refunding Series 2016, 4.000%, 8/01/38 | | 8/26 at 100.00 | | | 218,966 | |
| | | | |
| | | | | | Kirkwood Industrial Development Authority, Missouri, Retirement Community Revenue Bonds, Aberdeen Heights Project, Refunding Series 2017A: | | | | | | |
| | 2,900 | | | | | 5.250%, 5/15/42 | | 5/27 at 100.00 | | | 2,172,173 | |
| | 1,750 | | | | | 5.250%, 5/15/50 | | 5/27 at 100.00 | | | 1,217,645 | |
| | | | |
| | 1,500 | | | | | Land Clearance for Redevelopment Authority of Kansas City, Missouri, Project Revenue Bonds, Convention Center Hotel Project - TIF Financing, Series 2018B, 5.000%, 2/01/50, 144A | | 2/28 at 100.00 | | | 1,034,876 | |
| | | | | | Total Missouri | | | | | 4,643,660 | |
| | | | |
| | | | | | Nevada - 1.0% (0.5% of Total Investments) | | | | | | |
| | | | |
| | 9,202 | | | (d) | | Director of Nevada State Department of Business & Industry, Environmental Improvement Revenue Bonds, Fulcrum Sierra BioFuels LLC Project, Green Series 2018, 6.950%, 2/15/38, (AMT), 144A | | 8/28 at 100.00 | | | 943,086 | |
| | | | |
| | 2,000 | | | (d) | | Director of Nevada State Department of Business & Industry, Environmental Improvement Revenue Bonds, Fulcrum Sierra BioFuels LLC Project, Green Series 2020, 6.750%, 2/15/38, 144A | | 2/31 at 100.00 | | | 201,600 | |
| | | | |
| | | | | | Director of Nevada State Department of Business & Industry, Environmental Improvement Revenue Bonds, Fulcrum Sierra BioFuels LLC Project, Series 2017: | | | | | | |
| | 1,652 | | | (d) | | 5.875%, 12/15/27, (AMT), 144A | | No Opt. Call | | | 1,156,225 | |
| | 340 | | | (d) | | 6.250%, 12/15/37, (AMT), 144A | | 12/27 at 100.00 | | | 238,000 | |
167
| | |
| NMCO | | Nuveen Municipal Credit Opportunities Fund (continued) |
| | Portfolio of Investments October 31, 2023 |
| | | | | | | | | | | | |
Principal Amount (000) | | | | | Description (a) | | Optional Call Provisions (b) | | Value | |
| | | | |
| | | | | | Nevada (continued) | | | | | | |
| | $ 2,750 | | | (d) | | Director of Nevada State Department of Business & Industry, Environmental Improvement Revenue Bonds, Fulcrum Sierra Holdings LLC, Green Series 2019, 5.750%, 2/15/38, (AMT), 144A | | 8/29 at 100.00 | | $ | 275,578 | |
| | | | |
| | 25,000 | | | | | Reno, Nevada, Subordinate Lien Sales Tax Revenue Refunding Capital Appreciation Bonds, ReTrac-Reno Transporation Rail Access Corridor Project, Series 2018C, 0.000%, 7/01/58, 144A | | 7/38 at 31.26 | | | 2,546,922 | |
| | | | | | Total Nevada | | | | | 5,361,411 | |
| | | | |
| | | | | | New Hampshire - 0.6% (0.3% of Total Investments) | | | | | | |
| | | | |
| | 3,970 | | | | | National Finance Authority, New Hampshire, Resource Recovery Revenue Bonds, Covanta Project, Refunding Series 2018C, 4.875%, 11/01/42, (AMT), 144A | | 12/23 at 100.00 | | | 3,101,413 | |
| | | | | | Total New Hampshire | | | | | 3,101,413 | |
| | | | |
| | | | | | New Jersey - 3.8% (2.1% of Total Investments) | | | | | | |
| | | | |
| | 4,000 | | | (c) | | New Jersey Economic Development Authority Revenue Bonds, Black Horse EHT Urban Renewal LLC Project, Series 2019A, 5.000%, 10/01/39, 144A | | 10/27 at 102.00 | | | 2,607,520 | |
| | | | |
| | 1,500 | | | | | New Jersey Economic Development Authority, Fixed Rate Revenue Bonds, Lions Gate Project, Series 2014, 5.000%, 1/01/34 | | 1/24 at 100.00 | | | 1,394,522 | |
| | | | |
| | 5,475 | | | | | New Jersey Economic Development Authority, Revenue Bonds, White Horse HMT Urban Renewal LLC Project, Series 2020, 5.000%, 1/01/40, 144A | | 1/28 at 102.00 | | | 3,637,869 | |
| | | | |
| | 6,765 | | | | | New Jersey Economic Development Authority, Special Facilities Revenue Bonds, Continental Airlines Inc., Refunding Series 2012, 5.750%, 9/15/27, (AMT) | | 12/23 at 100.00 | | | 6,731,769 | |
| | | | |
| | 15,000 | | | | | New Jersey Transportation Trust Fund Authority, Transportation System Bonds, Series 2009A, 0.000%, 12/15/39 | | No Opt. Call | | | 6,336,973 | |
| | | | |
| | 500 | | | | | South Jersey Port Corporation, New Jersey, Marine Terminal Revenue Bonds, Subordinate Series 2017B, 5.000%, 1/01/42, (AMT) | | 1/28 at 100.00 | | | 470,791 | |
| | | | | | Total New Jersey | | | | | 21,179,444 | |
| | | | |
| | | | | | New Mexico - 0.1% (0.1% of Total Investments) | | | | | | |
| | | | |
| | 825 | | | | | Winrock Town Center Tax Increment Development District 1, Albuquerque, New Mexico, Gross Receipts Tax Increment Bonds, Subordinate Lien Series 2020, 8.000%, 5/01/40, 144A | | 12/23 at 103.00 | | | 699,248 | |
| | | | | | Total New Mexico | | | | | 699,248 | |
| | | | |
| | | | | | New York - 10.8% (6.0% of Total Investments) | | | | | | |
| | | | |
| | 250 | | | | | Babylon Local Development Corporation II, New York, Education Revenue Bonds, The Academy Charter School Project, Series 2023A, 5.750%, 2/01/33 | | No Opt. Call | | | 238,595 | |
| | | | |
| | 950 | | | | | Build New York City Resource Corporation, New York, Revenue Bonds, Metropolitan College of New York, Series 2014, 5.250%, 11/01/34 | | 11/24 at 100.00 | | | 712,500 | |
| | | | |
| | 2,910 | | | | | Build NYC Resource Corporation, New York, Revenue Bonds, Family Life Academy Charter School, Series 2020A-1, 5.500%, 6/01/55, 144A | | 12/30 at 100.00 | | | 2,099,695 | |
| | | | |
| | 1,590 | | | | | Build NYC Resource Corporation, New York, Revenue Bonds, Family Life Academy Charter School, Series 2020C-1, 5.000%, 6/01/55, 144A | | 12/30 at 100.00 | | | 1,055,435 | |
| | | | |
| | 450 | | | | | Dormitory Authority of the State of New York, Revenue Bonds, Montefiore Obligated Group, Series 2018A, 4.000%, 8/01/38 | | 8/28 at 100.00 | | | 384,914 | |
| | | | |
| | 36,150 | | | | | Erie County Tobacco Asset Securitization Corporation, New York, Tobacco Settlement Asset-Backed Bonds, Series 2006A, 0.000%, 6/01/60, 144A | | 12/23 at 6.46 | | | 1,732,572 | |
| | | | |
| | 14,000 | | | (f) | | Glen Cove Local Economic Assistance Corporation, New York, Revenue Bonds, Garvies Point Public Improvement Project, Capital Appreciation Series 2016C, 0.000%, 1/01/55 | | 1/34 at 100.00 | | | 11,479,511 | |
168
| | | | | | | | | | | | |
Principal Amount (000) | | | | | Description (a) | | Optional Call Provisions (b) | | Value | |
| | | | |
| | | | | | New York (continued) | | | | | | |
| | | | |
| | $ 650 | | | | | Hempstead Town Local Development Corporation, New York, Education Revenue Bonds, The Academy Charter School Project, Series 2020A, 5.730%, 2/01/50 | | 2/30 at 100.00 | | $ | 533,358 | |
| | | | |
| | 1,570 | | | | | Metropolitan Transportation Authority, New York, Transportation Revenue Bonds, Green Climate Bond Certified Series 2020C-1, 5.250%, 11/15/55 | | 5/30 at 100.00 | | | 1,544,370 | |
| | | | |
| | 5,000 | | | | | Metropolitan Transportation Authority, New York, Transportation Revenue Bonds, Series 2014A-1, 5.250%, 11/15/39 | | 1/24 at 100.00 | | | 5,011,532 | |
| | | | |
| | 380 | | | | | Monroe County Industrial Development Corporation, New York, Revenue Bonds, Academy of Health Sciences Charter School Project, Social Impact Series 2022, 5.875%, 7/01/52, 144A | | 7/32 at 100.00 | | | 339,310 | |
| | | | |
| | 625 | | | | | New York Counties Tobacco Trust VI, New York, Tobacco Settlement Pass-Through Bonds, Turbo Term Series 2016A. Including 2016A-1, 2016A-2A and 2016A-2B, 5.000%, 6/01/45 | | 6/26 at 100.00 | | | 549,886 | |
| | | | |
| | 1,740 | | | | | New York Transportation Development Corporation, New York, Special Facilities Bonds, LaGuardia Airport Terminal B Redevelopment Project, Series 2016A, 5.250%, 1/01/50, (AMT) | | 7/24 at 100.00 | | | 1,639,835 | |
| | | | |
| | 3,000 | | | | | New York Transportation Development Corporation, New York, Special Facility Revenue Bonds, American Airlines, Inc. John F Kennedy International Airport Project, Refunding Series 2016, 5.000%, 8/01/31, (AMT) | | 11/23 at 100.00 | | | 2,904,315 | |
| | | | |
| | 875 | | | | | New York Transportation Development Corporation, New York, Special Facility Revenue Bonds, American Airlines, Inc. John F Kennedy International Airport Project, Series 2020, 5.375%, 8/01/36, (AMT) | | 8/30 at 100.00 | | | 847,858 | |
| | | | |
| | 4,900 | | | | | New York Transportation Development Corporation, Special Facility Revenue Bonds, Delta Air Lines, Inc. - LaGuardia Airport Terminals C&D Redevelopment Project, Series 2023, 5.625%, 4/01/40, (AMT) | | 4/31 at 100.00 | | | 4,881,549 | |
| | | | |
| | 10,000 | | | | | Suffolk Tobacco Asset Securitization Corporation, New York, Tobacco Settlement Asset-Backed Bonds, Series 2021B-2, 0.000%, 6/01/66 | | 6/31 at 27.72 | | | 847,849 | |
| | | | |
| | | | | | Syracuse Industrial Development Authority, New York, PILOT Revenue Bonds, Carousel Center Project, Refunding Series 2016A: | | | | | | |
| | 2,950 | | | | | 5.000%, 1/01/32, (AMT) | | 1/26 at 100.00 | | | 2,124,805 | |
| | 4,000 | | | | | 5.000%, 1/01/33, (AMT) | | 1/26 at 100.00 | | | 2,876,828 | |
| | 3,320 | | | | | 5.000%, 1/01/35, (AMT) | | 1/26 at 100.00 | | | 2,381,651 | |
| | 2,775 | | | | | 5.000%, 1/01/36, (AMT) | | 1/26 at 100.00 | | | 1,988,453 | |
| | | | |
| | 16,200 | | | | | TSASC Inc., New York, Tobacco Asset-Backed Bonds, Series 2006, 5.000%, 6/01/48 | | 6/27 at 100.00 | | | 13,619,288 | |
| | | | | | Total New York | | | | | 59,794,109 | |
| | | | |
| | | | | | North Dakota - 0.2% (0.1% of Total Investments) | | | | | | |
| | | | |
| | 1,500 | | | | | Ward County Health Care, North Dakota, Revenue Bonds, Trinity Obligated Group, Series 2017C, 5.000%, 6/01/48 | | 6/28 at 100.00 | | | 1,066,214 | |
| | | | | | Total North Dakota | | | | | 1,066,214 | |
| | | | |
| | | | | | Ohio - 9.6% (5.3% of Total Investments) | | | | | | |
| | | | |
| | 64,235 | | | | | Buckeye Tobacco Settlement Financing Authority, Ohio, Tobacco Settlement Asset-Backed Revenue Bonds, Refunding Senior Lien Capital Appreciation Series 2020B-3 Class 2, 0.000%, 6/01/57 | | 6/30 at 22.36 | | | 5,419,918 | |
| | | | |
| | 195 | | | | | Buckeye Tobacco Settlement Financing Authority, Ohio, Tobacco Settlement Asset-Backed Revenue Bonds, Refunding Senior Lien Series 2020A-2 Class 1, 3.000%, 6/01/48 | | 6/30 at 100.00 | | | 128,532 | |
| | | | |
| | 16,185 | | | | | Buckeye Tobacco Settlement Financing Authority, Ohio, Tobacco Settlement Asset-Backed Revenue Bonds, Refunding Senior Lien Series 2020B-2 Class 2, 5.000%, 6/01/55 | | 6/30 at 100.00 | | | 13,258,666 | |
169
| | |
| NMCO | | Nuveen Municipal Credit Opportunities Fund (continued) |
| | Portfolio of Investments October 31, 2023 |
| | | | | | | | | | | | |
Principal Amount (000) | | | | | Description (a) | | Optional Call Provisions (b) | | Value | |
| | | | |
| | | | | | Ohio (continued) | | | | | | |
| | $ 7,610 | | | | | Cleveland, Ohio, Airport Special Revenue Bonds, Continental Airlines Inc. Project, Series 1998, 5.375%, 9/15/27, (AMT) | | 12/23 at 100.00 | | $ | 7,500,967 | |
| | | | |
| | | | | | Evans Farm New Communty Authority, Ohio, Community Development Charge Revenue Bonds, Evans Farm Mixed-Use Project, Series 2020: | | | | | | |
| | 2,170 | | | | | 3.750%, 12/01/38 | | 6/29 at 100.00 | | | 1,621,296 | |
| | 140 | | | | | 4.000%, 12/01/46 | | 6/29 at 100.00 | | | 100,616 | |
| | | | |
| | 905 | | | | | Hilliard Hickory Chase Community Authority, Ohio, Infustructure Improvement Revenue Bonds, Hickory Chase Project, Senior Series 2019A, 5.000%, 12/01/40, 144A | | 12/29 at 100.00 | | | 754,337 | |
| | | | |
| | 3,000 | | | | | Muskingum County, Ohio, Hospital Facilities Revenue Bonds, Genesis HealthCare System Obligated Group Project, Series 2013, 5.000%, 2/15/48 | | 12/23 at 100.00 | | | 2,438,187 | |
| | | | |
| | 4,950 | | | | | Ohio Air Quality Development Authority, Ohio, Exempt Facilities Revenue Bonds, AMG Vanadium Project, Series 2019, 5.000%, 7/01/49, (AMT), 144A | | 7/29 at 100.00 | | | 3,955,643 | |
| | | | |
| | 16,350 | | | | | Ohio Air Quality Development Authority, Ohio, Pollution Control Revenue Bonds, FirstEnergy Nuclear Generation Project, Refunding Series 2009A, 4.750%, 6/01/33, (Mandatory Put 6/01/22) | | No Opt. Call | | | 14,956,172 | |
| | | | |
| | 990 | | | | | Port of Greater Cincinnati Development Authority, Ohio, Special Obligation Tax Increment Financing Revenue Bonds, Cooperative Township Public Parking Project, Gallery at Kenwood, Senior Lien Series 2019A, 5.000%, 11/01/51 | | 11/30 at 100.00 | | | 738,702 | |
| | | | |
| | 2,000 | | | | | Southern Ohio Port Authority, Ohio, Facility Revenue Bonds, Purecycle Project, Series 2020A, 7.000%, 12/01/42, (AMT), 144A | | 12/27 at 103.00 | | | 1,346,947 | |
| | | | |
| | 1,000 | | | | | Southern Ohio Port Authority, Ohio, Facility Revenue Bonds, Purecycle Project, Series 2020B, 10.000%, 12/01/27, (AMT), 144A | | 12/26 at 105.00 | | | 598,507 | |
| | | | | | Total Ohio | | | | | 52,818,490 | |
| | | | |
| | | | | | Oklahoma - 1.2% (0.6% of Total Investments) | | | | | | |
| | | | |
| | 975 | | | | | Oklahoma Development Finance Authority, Health System Revenue Bonds, OU Medicine Project, Series 2018B, 5.000%, 8/15/38 | | 8/28 at 100.00 | | | 840,790 | |
| | | | |
| | 1,000 | | | | | Tulsa County Industrial Authority, Oklahoma, Senior Living Community Revenue Bonds, Montereau, Inc Project, Refunding Series 2017, 5.250%, 11/15/45 | | 11/25 at 102.00 | | | 892,151 | |
| | | | |
| | 2,475 | | | | | Tulsa Municipal Airport Trust, Oklahoma, Revenue Bonds, American Airlines Inc., Refunding Series 2000B, 5.500%, 6/01/35, (AMT) | | 12/23 at 100.00 | | | 2,449,840 | |
| | | | |
| | 860 | | | | | Tulsa Municipal Airport Trust, Oklahoma, Revenue Bonds, American Airlines Inc., Refunding Series 2001B, 5.500%, 12/01/35, (AMT) | | 12/23 at 100.00 | | | 850,993 | |
| | | | |
| | 1,475 | | | | | Tulsa Municipal Airport Trust, Oklahoma, Revenue Bonds, American Airlines Inc., Refunding Series 2015, 5.000%, 6/01/35, (AMT), (Mandatory Put 6/01/25) | | 6/25 at 100.00 | | | 1,456,913 | |
| | | | | | Total Oklahoma | | | | | 6,490,687 | |
| | | | |
| | | | | | Oregon - 0.1% (0.1% of Total Investments) | | | | | | |
| | | | |
| | 100 | | | | | Oregon Facilities Authority, Revenue Bonds, Metro East Web Academy Project, Series 2019A, 5.000%, 6/15/49, 144A | | 6/27 at 102.00 | | | 80,031 | |
| | | | |
| | 1,000 | | | | | Yamhill County Hospital Authority, Oregon, Revenue Bonds, Friendsview Retirement Community, Refunding Series 2021A, 5.000%, 11/15/56 | | 11/28 at 103.00 | | | 687,854 | |
| | | | | | Total Oregon | | | | | 767,885 | |
| | | | |
| | | | | | Pennsylvania - 5.4% (3.0% of Total Investments) | | | | | | |
| | | | |
| | 1,125 | | | | | Allegheny Country Industrial Development Authority, Pennsylvania, Environmental Improvement Revenue Bonds, United States Steel Corporation Project, Series 2012, 5.750%, 8/01/42, (AMT) | | 12/23 at 100.00 | | | 1,091,020 | |
170
| | | | | | | | | | | | |
Principal
Amount (000) | | | | | Description (a) | | Optional Call Provisions (b) | | Value | |
| | | | |
| | | | | | Pennsylvania (continued) | | | | | | |
| | $ 6,995 | | | | | Allegheny County Industrial Development Authority, Pennsylvania, Environmental Improvement Revenue Bonds, United States Steel Corp., Refunding Series 2019, 5.125%, 5/01/30 | | No Opt. Call | | $ | 6,830,943 | |
| | | | |
| | 335 | | | | | Allentown Neighborhood Improvement Zone Development Authority, Pennsylvania, Tax Revenue Bonds, 615 Waterfront Project, Senior Series 2021, 6.000%, 5/01/42, 144A | | 5/31 at 100.00 | | | 326,966 | |
| | | | |
| | 3,300 | | | | | Beaver County Industrial Development Authority, Pennsylvania, Pollution Control Revenue Bonds, FirstEnergy Generation Project, Refunding Series 2006A, 4.375%, 1/01/35, (Mandatory Put 7/01/33) | | No Opt. Call | | | 3,064,091 | |
| | | | |
| | 1,555 | | | | | Beaver County Industrial Development Authority, Pennsylvania, Pollution Control Revenue Refunding Bonds, FirstEnergy Generation Project, Series 2008B, 3.750%, 10/01/47 | | 4/31 at 100.00 | | | 1,039,158 | |
| | | | |
| | 2,565 | | | | | Berks County Municipal Authority, Pennsylvania, Revenue Bonds, Alvernia University Project, Series 2020, 5.000%, 10/01/49 | | 10/29 at 100.00 | | | 2,063,997 | |
| | | | |
| | 3,100 | | | | | Berks County Municipal Authority, Pennsylvania, Revenue Bonds, Reading Hospital & Medical Center Project, Series 2012A, 5.000%, 11/01/44 | | 11/23 at 100.00 | | | 1,692,446 | |
| | | | |
| | 4,430 | | | | | Butler County Hospital Authority, Pennsylvania, Hospital Revenue Bonds, Butler Health System Project, Series 2015A, 5.000%, 7/01/35 | | 7/25 at 100.00 | | | 4,173,792 | |
| | | | |
| | 1,000 | | | | | Chester County Health and Education Facilities Authority, Pennsylvania, Revenue Bonds, Simpson Senior Services Project, Series 2015A, 5.000%, 12/01/30 | | 12/25 at 100.00 | | | 876,524 | |
| | | | |
| | 1,870 | | | | | Chester County Industrial Development Authority, Pennsylvania, Revenue Bonds, Collegium Charter School Project, Series 2017A, 5.125%, 10/15/37 | | 4/27 at 100.00 | | | 1,701,925 | |
| | | | |
| | 2,160 | | | | | Cumberland County Municipal Authority, Pennsylvania, Revenue Bonds, Asbury Pennsylvania Obligated Group, Refunding Series 2019, 5.000%, 1/01/39 | | 1/25 at 104.00 | | | 1,808,059 | |
| | | | |
| | 2,350 | | | | | Dallas Area Municipal Authority, Pennsylvania, Revenue Bonds, Misericordia University, Series 2014, 5.000%, 5/01/37 | | 5/24 at 100.00 | | | 2,138,594 | |
| | | | |
| | 3,555 | | | | | Dauphin County General Authority, Pennsylvania, Revenue Bonds, Harrisburg University of Science & Technology Project, Series 2020, 6.250%, 10/15/53, 144A | | 10/28 at 100.00 | | | 2,731,612 | |
| | | | |
| | 1,720 | | | (c),(d) | | Pennsylvania Economic Development Financing Authority, Exempt Facilities Revenue Bonds, KDC Agribusiness Fairless Hills LLC Project, Series 2020A-1, 10.000%, 12/01/40, 144A | | 6/30 at 100.00 | | | 172 | |
| | | | |
| | 1,720 | | | (c),(d) | | Pennsylvania Economic Development Financing Authority, Exempt Facilities Revenue Bonds, KDC Agribusiness Fairless Hills LLC Project, Series 2020A-2, 10.000%, 12/01/40, (AMT), 144A | | 6/30 at 100.00 | | | 172 | |
| | | | |
| | 1,260 | | | (c),(d) | | Pennsylvania Economic Development Financing Authority, Exempt Facilities Revenue Bonds, KDC Agribusiness Fairless Hills LLC Project, Series 2021A, 10.000%, 12/01/31 | | No Opt. Call | | | 126 | |
| | | | |
| | 545 | | | | | Philadelphia Authority for Industrial Development, Pennsylvania, Revenue Bonds, Mariana Bracetti Academy Project, Series 2020A, 5.375%, 6/15/50, 144A | | 12/27 at 100.00 | | | 445,431 | |
| | | | | | Total Pennsylvania | | | | | 29,985,028 | |
| | | | |
| | | | | | Puerto Rico - 8.2% (4.5% of Total Investments) | | | | | | |
| | | | |
| | | | | | Puerto Rico Electric Power Authority, Power Revenue Bonds, Refunding Series 2012A: | | | | | | |
| | 2,070 | | | (c),(d) | | 5.000%, 7/01/29 | | 12/23 at 100.00 | | | 507,171 | |
| | 3,170 | | | (c),(d) | | 3.957%, 7/01/42 | | 12/23 at 100.00 | | | 801,394 | |
| | 1,000 | | | (c),(d) | | 5.050%, 7/01/42 | | 12/23 at 100.00 | | | 240,270 | |
171
| | |
| NMCO | | Nuveen Municipal Credit Opportunities Fund (continued) |
| | Portfolio of Investments October 31, 2023 |
| | | | | | | | | | | | |
Principal
Amount (000) | | | | | Description (a) | | Optional Call Provisions (b) | | Value | |
| | | | |
| | | | | | Puerto Rico (continued) | | | | | | |
| | | | | | Puerto Rico Electric Power Authority, Power Revenue Bonds, Series 2007TT: | | | | | | |
| | $ 130 | | | (c),(d) | | 5.000%, 7/01/21 | | No Opt. Call | | $ | 33,778 | |
| | 3,750 | | | (c),(d) | | 5.000%, 7/01/26 | | 12/23 at 100.00 | | | 903,529 | |
| | 310 | | | (c),(d) | | 3.957%, 7/01/32 | | 12/23 at 100.00 | | | 77,944 | |
| | 1,860 | | | (c),(d) | | 3.957%, 7/01/37 | | 12/23 at 100.00 | | | 465,986 | |
| | | | |
| | | | | | Puerto Rico Electric Power Authority, Power Revenue Bonds, Series 2010AAA: | | | | | | |
| | 1,124 | | | (c),(d) | | 3.978%, 7/01/28 | | 12/23 at 100.00 | | | 274,738 | |
| | 468 | | | (c),(d) | | 5.250%, 7/01/29 | | 12/23 at 100.00 | | | 112,828 | |
| | 346 | | | (c),(d) | | 5.250%, 7/01/31 | | 12/23 at 100.00 | | | 83,416 | |
| | | | |
| | | | | | Puerto Rico Electric Power Authority, Power Revenue Bonds, Series 2010CCC: | | | | | | |
| | 2,995 | | | (c),(d) | | 5.000%, 7/01/28 | | 12/23 at 100.00 | | | 721,618 | |
| | 500 | | | (c),(d) | | 5.250%, 7/01/28 | | 12/23 at 100.00 | | | 118,793 | |
| | | | |
| | | | | | Puerto Rico Electric Power Authority, Power Revenue Bonds, Series 2010XX: | | | | | | |
| | 100 | | | (c),(d) | | 5.250%, 7/01/27 | | 12/23 at 100.00 | | | 23,826 | |
| | 4,000 | | | (c),(d) | | 5.250%, 7/01/35 | | 12/23 at 100.00 | | | 950,340 | |
| | | | |
| | 400 | | | (c),(d) | | Puerto Rico Electric Power Authority, Power Revenue Bonds, Series 2010ZZ, 5.250%, 7/01/24 | | 12/23 at 100.00 | | | 95,034 | |
| | | | |
| | | | | | Puerto Rico Electric Power Authority, Power Revenue Bonds, Series 2013A: | | | | | | |
| | 5,000 | | | (c),(d) | | 7.000%, 7/01/33 | | 12/23 at 100.00 | | | 1,070,467 | |
| | 10,000 | | | (c),(d) | | 6.750%, 7/01/36 | | 12/23 at 100.00 | | | 2,174,492 | |
| | | | |
| | 1,000 | | | (c),(d) | | Puerto Rico Electric Power Authority, Power Revenue Bonds, Series 2016A-4-RSA-1, 10.000%, 7/01/19 | | No Opt. Call | | | 173,822 | |
| | | | |
| | | | | | Puerto Rico Electric Power Authority, Power Revenue Bonds, Series WW: | | | | | | |
| | 190 | | | (c),(d) | | 5.375%, 7/01/23 | | No Opt. Call | | | 45,503 | |
| | 373 | | | (c),(d) | | 5.375%, 7/01/24 | | 6/23 at 100.00 | | | 89,330 | |
| | 25 | | | (c),(d) | | 3.978%, 7/01/33 | | 12/23 at 100.00 | | | 5,940 | |
| | | | |
| | 6,500 | | | | | Puerto Rico Highway and Transportation Authority, Restructured Toll Revenue Bonds, Series 2022A, 5.000%, 7/01/62 | | 7/32 at 100.00 | | | 6,418,750 | |
| | | | |
| | | | | | Puerto Rico Sales Tax Financing Corporation, Sales Tax Revenue Bonds, Restructured 2018A-1: | | | | | | |
| | 10,202 | | | | | 0.000%, 7/01/46 | | 7/28 at 41.38 | | | 2,541,598 | |
| | 7,551 | | | | | 0.000%, 7/01/51 | | 7/28 at 30.01 | | | 1,364,813 | |
| | | | |
| | 1,000 | | | | | Puerto Rico, General Obligation Bonds, Clawback Highway Transportation Authority Claims Taxable Series 2022, 0.000%, 11/01/51 | | No Opt. Call | | | 507,500 | |
| | | | |
| | | | | | Puerto Rico, General Obligation Bonds, Restructured Series 2022A-1: | | | | | | |
| | 0 | | | (e) | | 5.625%, 7/01/27 | | No Opt. Call | | | 3 | |
| | 240 | | | | | 5.750%, 7/01/31 | | No Opt. Call | | | 246,900 | |
| | 23,533 | | | | | 0.000%, 7/01/33 | | 7/31 at 89.94 | | | 13,479,602 | |
| | 0 | | | (e) | | 4.000%, 7/01/37 | | 7/31 at 103.00 | | | 308 | |
| | 5,182 | | | | | 4.000%, 7/01/41 | | 7/31 at 103.00 | | | 4,010,636 | |
| | 12 | | | | | 4.000%, 7/01/46 | | 7/31 at 103.00 | | | 8,532 | |
| | | | |
| | 13,955 | | | | | Puerto Rico, General Obligation Bonds, Vintage CW NT Claims Taxable Series 2022, 0.000%, 11/01/43 | | No Opt. Call | | | 6,960,140 | |
| | | | |
| | 500 | | | | | University of Puerto Rico, University System Revenue Bonds, Series 2006Q, 5.000%, 6/01/24 | | 12/23 at 100.00 | | | 497,619 | |
| | | | | | Total Puerto Rico | | | | | 45,006,620 | |
172
| | | | | | | | | | | | |
Principal
Amount (000) | | | | | Description (a) | | Optional Call Provisions (b) | | Value | |
| | | | |
| | | | | | South Carolina - 0.3% (0.2% of Total Investments) | | | | | | |
| | | | |
| | $ 430 | | | | | Berkeley County, South Carolina, Special Assessment Revenue Bonds, Nexton Improvement District, Series 2019, 4.375%, 11/01/49 | | 11/29 at 100.00 | | $ | 322,590 | |
| | | | |
| | 400 | | | | | South Carolina Jobs-Economic Development Authority, Economic Development Revenue Bonds, Hilton Head Christian Academy, Series 2020, 5.000%, 1/01/55, 144A | | 1/30 at 100.00 | | | 307,676 | |
| | | | |
| | 1,450 | | | | | South Carolina Jobs-Economic Development Authority, Economic Development Revenue Bonds, Palmetto Scholars Academy Project, Series 2015A, 5.125%, 8/15/35, 144A | | 2/25 at 100.00 | | | 1,240,914 | |
| | | | | | Total South Carolina | | | | | 1,871,180 | |
| | | | |
| | | | | | Tennessee - 1.4% (0.8% of Total Investments) | | | | | | |
| | | | |
| | 1,000 | | | | | Bristol Industrial Development Board, Tennessee, State Sales Tax Revenue Bonds, Pinnacle Project, Capital Appreciation Series 2016B, 0.000%, 12/01/31, 144A | | No Opt. Call | | | 604,800 | |
| | | | |
| | 5,000 | | | | | Bristol Industrial Development Board, Tennessee, State Sales Tax Revenue Bonds, Pinnacle Project, Series 2016A, 5.125%, 12/01/42, 144A | | 12/26 at 100.00 | | | 4,172,779 | |
| | | | |
| | 1,587 | | | (c) | | Knox County Health, Educational, and Housing Facilities Board, Tennessee, Revenue Bonds, Provision Center for Proton Therapy Project, Series 2014, 5.250%, 5/01/25, 144A | | 11/24 at 100.00 | | | 212,656 | |
| | | | |
| | 1,000 | | | (c) | | Memphis/Shelby County Economic Development Growth Engine Industrial Development Board, Tennessee, Tax Increment Revenue Bonds, Graceland Project, Senior Series 2017A, 5.625%, 1/01/46 | | 7/27 at 100.00 | | | 561,503 | |
| | | | |
| | 1,500 | | | (c) | | The Health and Educational Facilities Board of the City of Franklin, Tennessee, Revenue Bonds, Provision Cares Proton Therapy Center, Nashville Project, Series 2017A, 6.500%, 6/01/27, 144A | | No Opt. Call | | | 315,000 | |
| | | | |
| | 2,000 | | | | | The Tennessee Energy Acquisition Corporation, Gas Revenue Bonds, Series 2006B, 5.625%, 9/01/26 | | No Opt. Call | | | 2,000,304 | |
| | | | | | Total Tennessee | | | | | 7,867,042 | |
| | | | |
| | | | | | Texas - 5.0% (2.7% of Total Investments) | | | | | | |
| | | | |
| | | | | | Austin Convention Enterprises Inc., Texas, Convention Center Hotel Revenue Bonds, Refunding First Tier Series 2017A: | | | | | | |
| | 500 | | | | | 5.000%, 1/01/31 | | 1/27 at 100.00 | | | 494,004 | |
| | 500 | | | | | 5.000%, 1/01/32 | | 1/27 at 100.00 | | | 492,789 | |
| | | | |
| | | | | | Austin Convention Enterprises Inc., Texas, Convention Center Hotel Revenue Bonds, Refunding Second Tier Series 2017B: | | | | | | |
| | 340 | | | | | 5.000%, 1/01/25 | | No Opt. Call | | | 336,124 | |
| | 475 | | | | | 5.000%, 1/01/29 | | 1/27 at 100.00 | | | 457,123 | |
| | 850 | | | | | 5.000%, 1/01/34 | | 1/27 at 100.00 | | | 793,418 | |
| | | | |
| | 3,000 | | | | | Clifton Higher Education Finance Corporation, Texas, Education Revenue Bonds, Uplift Education Charter School, Series 2015A, 5.000%, 12/01/45, (WI/DD) | | 6/25 at 100.00 | | | 2,704,640 | |
| | | | |
| | 4,665 | | | | | Houston, Texas, Airport System Special Facilities Revenue Bonds, Continental Airlines Inc. - Terminal Improvement Project, Refunding Series 2011, 6.500%, 7/15/30, (AMT) | | 12/23 at 100.00 | | | 4,664,361 | |
| | | | |
| | 650 | | | | | Houston, Texas, Airport System Special Facilities Revenue Bonds, United Airlines, Inc. Terminal E Project, Refunding Series 2014, 5.000%, 7/01/29, (AMT) | | 7/24 at 100.00 | | | 628,492 | |
| | | | |
| | 250 | | | | | Leander, Texas, Special Assessment Revenue Bonds, Deerbrooke Public Improvement District Southern Improvement Area Project, Series 2017, 4.750%, 9/01/37, 144A | | 9/26 at 100.00 | | | 224,373 | |
| | | | |
| | 200 | | | | | Manor, Texas, Special Assessment Revenue Bonds, Lagos Public Improvement District Major Improvement Area Project, Series 2020, 4.625%, 9/15/49, 144A | | 9/30 at 100.00 | | | 160,849 | |
173
| | |
| NMCO | | Nuveen Municipal Credit Opportunities Fund (continued) |
| | Portfolio of Investments October 31, 2023 |
| | | | | | | | | | | | |
Principal
Amount (000) | | | | | Description (a) | | Optional Call Provisions (b) | | Value | |
| | | | |
| | | | | | Texas (continued) | | | | | | |
| | | | |
| | $ 520 | | | | | New Hope Cultural Education Facilities Finance Corporation, Texas, Education Revenue Bonds, Beta Academy, Series 2019A, 5.000%, 8/15/49, 144A | | 8/24 at 100.00 | | $ | 428,046 | |
| | | | |
| | 70 | | | (c) | | New Hope Cultural Education Facilities Finance Corporation, Texas, Retirement Facility Revenue Bonds, Buckingham Senior Living Community, Inc. Project, Series 2021A-1, 7.500%, 11/15/37 | | No Opt. Call | | | 51,332 | |
| | | | |
| | 445 | | | (c) | | New Hope Cultural Education Facilities Finance Corporation, Texas, Retirement Facility Revenue Bonds, Buckingham Senior Living Community, Inc. Project, Series 2021A-2, 7.500%, 11/15/36 | | No Opt. Call | | | 352,141 | |
| | | | |
| | 4,046 | | | (c) | | New Hope Cultural Education Facilities Finance Corporation, Texas, Retirement Facility Revenue Bonds, Buckingham Senior Living Community, Inc. Project, Series 2021B, 5.625%, 11/15/61 | | 11/26 at 105.00 | | | 1,523,040 | |
| | | | |
| | 12,025 | | | | | New Hope Cultural Education Facilities Finance Corporation, Texas, Senior Living Revenue Bonds, Sanctuary LTC LLC Project, Series 2021A-1, 5.500%, 1/01/57 | | 1/28 at 103.00 | | | 7,917,634 | |
| | | | |
| | 625 | | | (g) | | New Hope Cultural Education Facilities Finance Corporation, Texas, Student Housing Revenue Bonds, CHF-Collegiate Housing Corpus Christi II, L.L.C.-Texas A&M University-Corpus Christi Project, Series 2016A, 5.000%, 4/01/48, (Pre-refunded 4/01/26) | | 4/26 at 100.00 | | | 640,378 | |
| | | | |
| | 400 | | | (g) | | New Hope Cultural Education Facilities Finance Corporation, Texas, Student Housing Revenue Bonds, CHF-Collegiate Housing Galveston- Texas A&M University at Galveston Project, Series 2014A, 5.000%, 4/01/29, (Pre-refunded 4/01/24) | | 4/24 at 100.00 | | | 401,587 | |
| | | | |
| | 110 | | | | | North Richland Hills, Texas, Special Assessment Revenue Bonds, City Point Public Improvement District Zone B Project, Series 2019, 5.375%, 9/01/50, 144A | | 9/30 at 100.00 | | | 96,961 | |
| | | | |
| | 2,000 | | | | | Rockdale, Milam County, Texas, Special Assessment Revenue Bonds, Cornerstone Public Improvement District Improvement Area 1, Series 2023, 7.500%, 9/15/54, (WI/DD) | | No Opt. Call | | | 1,948,202 | |
| | | | |
| | 145 | | | | | Royse CIty, Rockwall County, Texas, Special Assessment Revenue Bonds, Waterscape Public improvement District Improvement Area 2 Project, Series 2019, 4.750%, 9/15/49, 144A | | 9/27 at 100.00 | | | 120,336 | |
| | | | |
| | | | | | Tarrant County Cultural Education Facilities Finance Corporaton, Texas, Retirement Facility Revenue Bonds, C.C. Young Memorial Home Project, Series 2016A: | | | | | | |
| | 1,000 | | | (c) | | 6.375%, 2/15/41 | | 2/27 at 100.00 | | | 550,000 | |
| | 4,575 | | | (c) | | 6.375%, 2/15/48 | | 2/27 at 100.00 | | | 2,516,250 | |
| | | | | | Total Texas | | | | | 27,502,080 | |
| | | | |
| | | | | | Utah - 2.8% (1.6% of Total Investments) | | | | | | |
| | | | |
| | 2,000 | | | | | Military Installation Development Authority, Utah, Tax Allocation Revenue Bonds, Series 2021A-2, 4.000%, 6/01/52 | | 9/26 at 103.00 | | | 1,333,305 | |
| | | | |
| | 13,925 | | | | | Salt Lake City, Utah, Airport Revenue Bonds, International Airport Series 2017A, 5.000%, 7/01/42, (AMT), (UB) | | 7/27 at 100.00 | | | 13,509,010 | |
| | | | |
| | 1,000 | | | | | Utah Charter School Finance Authority, Charter School Revenue Bonds, Leadership Learning Academy Project, Series 2019A, 5.000%, 6/15/50, 144A | | 6/27 at 102.00 | | | 802,658 | |
| | | | | | Total Utah | | | | | 15,644,973 | |
| | | | |
| | | | | | Virgin Islands - 3.4% (1.8% of Total Investments) | | | | | | |
| | | | |
| | 670 | | | | | Virgin Islands Public Finance Authority, Gross Receipts Taxes Loan Note, Refunding Series 2012A, 5.000%, 10/01/32 | | 12/23 at 100.00 | | | 594,776 | |
| | | | |
| | 16,000 | | | | | Virgin Islands Public Finance Authority, Gross Receipts Taxes Loan Note, Refunding Series 2014C, 5.000%, 10/01/30, 144A | | 10/24 at 100.00 | | | 14,666,878 | |
174
| | | | | | | | | | | | |
Principal
Amount (000) | | | | | Description (a) | | Optional Call Provisions (b) | | Value | |
| | | | |
| | | | | | Virgin Islands (continued) | | | | | | |
| | $ 150 | | | | | Virgin Islands Public Finance Authority, Gross Receipts Taxes Loan Note, Working Capital Series 2014A, 5.000%, 10/01/24, 144A | | No Opt. Call | | $ | 148,021 | |
| | | | |
| | 1,930 | | | | | Virgin Islands Water and Power Authority, Electric System Revenue Bonds, Bond Anticipation Notes, Senior Series 2021A, 6.750%, 7/01/26, 144A | | No Opt. Call | | | 1,816,311 | |
| | | | |
| | 1,400 | | | | | West Indian Company Limited, Virgin Islands, Port Facilities Revenue Bonds, WICO Financing, Series 2022A, 6.375%, 4/01/52, 144A | | 10/29 at 104.00 | | | 1,317,103 | |
| | | | | | Total Virgin Islands | | | | | 18,543,089 | |
| | | | |
| | | | | | Virginia - 1.2% (0.6% of Total Investments) | | | | | | |
| | | | |
| | | | | | Roanoke Economic Development Authority, Virginia Residential Care Facility Revenue Bonds, Richfield Living, Series 2020: | | | | | | |
| | 5,870 | | | (c) | | 5.000%, 9/01/50 | | 9/27 at 103.00 | | | 3,345,900 | |
| | 4,840 | | | (c) | | 5.125%, 9/01/55 | | 9/27 at 103.00 | | | 2,758,800 | |
| | | | |
| | 622 | | | | | Virginia Small Business Finance Authority, Educational Facilities Revenue Bonds, Provident Resource Group - Rixey Student Housing Project, Series 2019B, 6.525%, 7/01/52, 144A, (cash 7.500%, PIK 7.500%) | | No Opt. Call | | | 373,141 | |
| | | | | | Total Virginia | | | | | 6,477,841 | |
| | | | |
| | | | | | Washington - 0.3% (0.2% of Total Investments) | | | | | | |
| | | | |
| | 1,125 | | | | | Port of Seattle Industrial Development Corporation, Washington, Special Facilities Revenue Refunding Bonds, Delta Air Lines, Inc. Project, Series 2012, 5.000%, 4/01/30, (AMT) | | 11/23 at 100.00 | | | 1,099,637 | |
| | | | |
| | 1,000 | | | | | Washington State Housing Finance Commission, Nonprofit Housing Revenue Bonds, Rockwood Retirement Communities Project, Series 2020A, 5.000%, 1/01/51, 144A | | 1/26 at 103.00 | | | 695,990 | |
| | | | | | Total Washington | | | | | 1,795,627 | |
| | | | |
| | | | | | West Virginia - 1.1% (0.6% of Total Investments) | | | | | | |
| | | | |
| | | | | | Monongalia County Commission, West Virginia, Special District Excise Tax Revenue Bonds, University Town Centre Economic Opportunity Development District, Refunding & Improvement Series 2017A: | | | | | | |
| | 3,000 | | | | | 5.500%, 6/01/37, 144A | | 6/27 at 100.00 | | | 3,008,172 | |
| | 625 | | | | | 5.750%, 6/01/43, 144A | | 6/27 at 100.00 | | | 627,565 | |
| | | | |
| | 2,500 | | | | | Monongalia County, West Virginia, Tax Increment Revenue Bonds, University Town Centre Development District 4, Senior Refunding and Improvement Series 2023A, 6.000%, 6/01/53, 144A | | 6/33 at 100.00 | | | 2,522,865 | |
| | | | | | Total West Virginia | | | | | 6,158,602 | |
| | | | |
| | | | | | Wisconsin - 13.6% (7.5% of Total Investments) | | | | | | |
| | | | |
| | 14,610 | | | | | Ashwaubenon Community Development Authority, Wisconsin, Lease Revenue Bonds, Brown County Expo Center Project, Series 2019, 0.000%, 6/01/54 | | 6/29 at 37.80 | | | 2,689,447 | |
| | | | |
| | | | | | Public Finance Authority of Wisconsin, Charter School Revenue Bonds, 21st Century Public Academy Project, Series 2020A: | | | | | | |
| | 750 | | | | | 5.000%, 6/01/40, 144A | | 6/28 at 102.00 | | | 616,290 | |
| | 1,340 | | | | | 5.000%, 6/01/49, 144A | | 6/28 at 102.00 | | | 1,010,106 | |
| | | | |
| | 365 | | | | | Public Finance Authority of Wisconsin, Charter School Revenue Bonds, Corvian Community School Bonds, North Carolina, Series 2019A, 5.000%, 6/15/49, 144A | | 6/26 at 100.00 | | | 277,871 | |
| | | | |
| | 4,420 | | | | | Public Finance Authority of Wisconsin, Charter School Revenue Bonds, Freedom Classical Academy Inc., Series 2020A, 5.000%, 1/01/42, 144A | | 1/28 at 100.00 | | | 3,693,944 | |
| | | | |
| | | | | | Public Finance Authority of Wisconsin, Charter School Revenue Bonds, North Carolina Charter Educational Foundation Project, Series 2016A: | | | | | | |
| | 3,000 | | | | | 5.000%, 6/15/36, 144A | | 6/26 at 100.00 | | | 2,441,073 | |
175
| | |
| NMCO | | Nuveen Municipal Credit Opportunities Fund (continued) |
| | Portfolio of Investments October 31, 2023 |
| | | | | | | | | | | | |
Principal
Amount (000) | | | | | Description (a) | | Optional Call Provisions (b) | | Value | |
| | | | |
| | | | | | Wisconsin (continued) | | | | | | |
| | $ 4,240 | | | | | 5.000%, 6/15/46, 144A | | 6/26 at 100.00 | | $ | 2,976,866 | |
| | | | |
| | 3,315 | | | | | Public Finance Authority of Wisconsin, Charter School Revenue Bonds, Uwharrie Charter Academy, North Carolina, Series 2022A, 5.000%, 6/15/52, 144A | | 6/32 at 100.00 | | | 2,636,424 | |
| | | | |
| | 1,250 | | | | | Public Finance Authority of Wisconsin, Contract Revenue Bonds, Mercer Crossing Public Improvement District Project, Series 2017, 7.000%, 3/01/47, 144A | | 3/27 at 100.00 | | | 1,269,859 | |
| | | | |
| | 500 | | | | | Public Finance Authority of Wisconsin, Education Revenue Bonds, Corvian Community School, North Carolina Series 2023A, 6.250%, 6/15/48, 144A | | 6/33 at 100.00 | | | 456,226 | |
| | | | |
| | 2,000 | | | | | Public Finance Authority of Wisconsin, Educational Facilities Revenue Bonds, Lake Erie College, Series 2019A, 5.875%, 10/01/54, 144A | | 10/29 at 100.00 | | | 1,464,500 | |
| | | | |
| | | | | | Public Finance Authority of Wisconsin, Limited Obligation Grant Revenue Bonds, American Dream @ Meadowlands Project, Series 2017A: | | | | | | |
| | 14,695 | | | (c) | | 3.125%, 8/01/27, 144A | | No Opt. Call | | | 11,223,306 | |
| | 2,375 | | | (c) | | 6.750%, 8/01/31, 144A | | No Opt. Call | | | 1,662,500 | |
| | | | |
| | | | | | Public Finance Authority of Wisconsin, Limited Obligation PILOT Revenue Bonds, American Dream @ Meadowlands Project, Series 2017: | | | | | | |
| | 555 | | | | | 6.500%, 12/01/37, 144A | | 12/27 at 100.00 | | | 484,203 | |
| | 16,915 | | | | | 7.000%, 12/01/50, 144A | | 12/27 at 100.00 | | | 14,768,274 | |
| | | | |
| | 215 | | | | | Public Finance Authority of Wisconsin, Retirement Facility Revenue Bonds, Shalom Park Development Project, Series 2019, 0.000%, 12/31/24, 144A | | No Opt. Call | | | 12,900 | |
| | | | |
| | 1,000 | | | (c) | | Public Finance Authority of Wisconsin, Revenue Bonds, Alabama Proton Therapy Center, Senior Series 2017B, 8.500%, 10/01/47, 144A | | 10/27 at 100.00 | | | 400,000 | |
| | | | |
| | 1,765 | | | | | Public Finance Authority of Wisconsin, Revenue Bonds, Prime Healthcare Foundation, Inc., Series 2017A, 5.200%, 12/01/37 | | 12/27 at 100.00 | | | 1,656,592 | |
| | | | |
| | 2,000 | | | | | Public Finance Authority of Wisconsin, Revenue Bonds, Procure Proton Therapy Center, Senior Series 2018A, 7.000%, 7/01/48, 144A | | 7/28 at 100.00 | | | 1,509,608 | |
| | | | |
| | | | | | Public Finance Authority of Wisconsin, Revenue Bonds, Roseman University of Health Sciences, Series 2020: | | | | | | |
| | 600 | | | | | 5.000%, 4/01/50, 144A | | 4/30 at 100.00 | | | 504,260 | |
| | 35 | | | (g) | | 5.000%, 4/01/50, (Pre-refunded 4/01/30), 144A | | 4/30 at 100.00 | | | 37,355 | |
| | | | |
| | 3,930 | | | | | Public Finance Authority of Wisconsin, Revenue Bonds, Sky Harbour LLC Obligated Group Aviation Facilities Project, Series 2021, 4.250%, 7/01/54, (AMT) | | 7/31 at 100.00 | | | 2,452,873 | |
| | | | |
| | | | | | Public Finance Authority of Wisconsin, Senior Revenue Bonds, Maryland Proton Treatment Center, Series 2018A-1: | | | | | | |
| | 5,885 | | | | | 6.125%, 1/01/33, 144A | | 1/28 at 100.00 | | | 3,619,275 | |
| | 250 | | | | | 6.250%, 1/01/38, 144A | | 1/28 at 100.00 | | | 153,750 | |
| | 8,735 | | | | | 6.375%, 1/01/48, 144A | | 1/28 at 100.00 | | | 5,372,025 | |
| | | | |
| | 210 | | | (c),(d) | | Public Finance Authority of Wisconsin, Wisconsin Revenue Note, KDC Agribusiness LLC Project, Series 2022B, 15.000%, 3/31/24 | | 4/23 at 105.00 | | | 21 | |
| | | | |
| | | | | | Wisconsin Center District, Dedicated Tax Revenue Bonds, Supported by State Moral Obligation Junior Series 2020D: | | | | | | |
| | 6,225 | | | | | 0.000%, 12/15/45 - AGM Insured | | 12/30 at 56.77 | | | 1,904,910 | |
| | 5,190 | | | | | 0.000%, 12/15/50 - AGM Insured | | 12/30 at 46.55 | | | 1,193,388 | |
| | 4,500 | | | | | 0.000%, 12/15/60 - AGM Insured | | 12/30 at 29.95 | | | 578,942 | |
| | | | |
| | 6,165 | | | | | Wisconsin Health and Educational Facilities Authority, Wisconsin, Revenue Bonds, Marshfield Clinic, Series 2016A, 5.000%, 2/15/42 | | 2/26 at 100.00 | | | 5,683,229 | |
176
| | | | | | | | | | | | | | | | | | |
Principal
Amount (000) | | | | | Description (a) | | | | | | | | Optional Call Provisions (b) | | Value | |
| | | | | | | |
| | | | | | Wisconsin (continued) | | | | | | | | | | | | |
| | $ 3,000 | | | | | Wisconsin Health and Educational Facilities Authority, Wisconsin, Revenue Bonds, Saint Camillus Health System Inc, Series 2019A, 5.000%, 11/01/46 | | 11/26 at 103.00 | | $ | 2,186,502 | |
| | | | | | Total Wisconsin | | | | | | | | | 74,936,519 | |
| | | | | | Total Municipal Bonds (cost $1,102,410,864) | | | | | | | 928,009,552 | |
| | | | | | | |
| Shares | | | | | Description (a) | | | | | | | | | | Value | |
| | | | | | COMMON STOCKS - 13.2% (7.3% of Total Investments) | | | | | | |
| | | | |
| | | | | | Utilities - 13.2% (7.3% of Total Investments) | | | | | | |
| | 859,113 | | | (i),(j) | | Energy Harbor Corp | | | | | | | | $ | 68,228,177 | |
| | 82,200 | | | (j),(k) | | Talen Energy Supply LLC | | | | | | | | | 4,294,950 | |
| | | | | | Total Utilities | | | | | | | | | | | 72,523,127 | |
| | | | | | |
| | | | | | Total Common Stocks (cost $27,037,640) | | | | | | | | | 72,523,127 | |
| | | | | | | |
Principal Amount (000) | | | | | Description (a) | | Coupon (l) | | Reference Rate (l) | | Spread (l) | | Maturity (m) | | Value | |
| | | | | | VARIABLE RATE SENIOR LOAN INTERESTS - 0.0% (0.0% of Total Investments) (l) | | | | | | |
| | | | |
| | | | | | Capital Goods - 0.0% (0.0% of Total Investments) | | | | | | |
| | $ 322 | | | (c),(d),(n) | | KDC Agribusiness Fairless Hills LLC | | 12.000% | | N/A | | N/A | | 9/17/23 | | $ | 70,482 | |
| | | | | | Total Capital Goods | | | | | | | | | 70,482 | |
| | | | | | Total Variable Rate Senior Loan Interests (cost $321,690) | | | | | 70,482 | |
| | | | | |
| | | | | | Total Long-Term Investments (cost $1,129,770,194) | | | | | | | 1,000,603,161 | |
| | | | | | Floating Rate Obligations - (3.6)% | | | | | | | (19,960,000 | ) |
| | | | | | MFP Shares, Net - (77.8)%(o) | | | | | | | (429,128,343 | ) |
| | | | | | Other Assets & Liabilities, Net - (0.0)% | | | | | | | (232,413 | ) |
| | | | | | Net Assets Applicable to Common Shares - 100% | | | | $ | 551,282,405 | |
| (a) | All percentages shown in the Portfolio of Investments are based on net assets applicable to common shares unless otherwise noted. |
| (b) | Optional Call Provisions: Dates (month and year) and prices of the earliest optional call or redemption. There may be other call provisions at varying prices at later dates. Certain mortgage-backed securities may be subject to periodic principal paydowns. Optional Call Provisions are not covered by the report of independent registered public accounting firm. |
| (c) | Defaulted security. A security whose issuer has failed to fully pay principal and/or interest when due, or is under the protection of bankruptcy. |
| (d) | For fair value measurement disclosure purposes, investment classified as Level 3. |
| (e) | Principal Amount (000) rounds to less than $1,000. |
| (f) | Step-up coupon bond, a bond with a coupon that increases (“steps up”), usually at regular intervals, while the bond is outstanding. The rate shown is the coupon as of the end of the reporting period. |
| (g) | Backed by an escrow or trust containing sufficient U.S. Government or U.S. Government agency securities, which ensure the timely payment of principal and interest. |
| (h) | Investment, or portion of investment, has been pledged to collateralize the net payment obligations for investments in inverse floating rate transactions. |
177
| | |
| NMCO | | Nuveen Municipal Credit Opportunities Fund (continued) |
| | Portfolio of Investments October 31, 2023 |
| (i) | Energy Harbor Corp (ENGH) common stock received as part of the bankruptcy settlements during February 2020 for Beaver County Industrial Development Authority, Pennsylvania, Pollution Control Revenue Bonds, FirstEnergy Nuclear Generation Project, Refunding Series 2005A, 4.000%, 1/01/35, Beaver County Industrial Development Authority, Pennsylvania, Pollution Control Revenue Refunding Bonds, FirstEnergy Nuclear Generation Project, Series 2006A, 3.500%, 4/01/41, Beaver County Industrial Development Authority, Pennsylvania, Pollution Control Revenue Refunding Bonds, FirstEnergy Nuclear Generation Project, Series 2006B, 3.500%, 12/01/35, Beaver County Industrial Development Authority, Pennsylvania, Pollution Control Revenue Refunding Bonds, FirstEnergy Nuclear Generation Project, Series 2008A, 2.700%, 4/01/35, Ohio Air Quality Development Authority, Ohio, Air Quality Development Revenue Bonds, FirstEnergy Generation Corporation Project, Series 2009A, 5.700%, 8/01/20, Ohio Air Quality Development Authority, Ohio, Pollution Control Revenue Bonds, FirstEnergy Generation Corporation Project, Refunding Series 2009B, 3.100%, 3/01/23, Ohio Air Quality Development Authority, Ohio, Pollution Control Revenue Bonds, FirstEnergy Generation Project, Refunding Series 2006A, 3.750%, 12/01/23, Ohio Water Development Authority, Pollution Control Revenue Refunding Bonds, FirstEnergy Nuclear Generating Corporation Project, Series 2006A, 3.000%, 5/15/20, Ohio Water Development Authority, Pollution Control Revenue Refunding Bonds, FirstEnergy Nuclear Generating Corporation Project, Series 2006B, 4.000%, 12/01/33, Ohio Water Development Authority, Pollution Control Revenue Refunding Bonds, FirstEnergy Nuclear Generating Corporation Project, Series 2010C, 4.000%, 6/01/33. Various funds and accounts managed by Nuveen, including the Fund, collectively are a substantial minority holder of ENGH’s outstanding shares of common stock, and possess certain other rights with respect to the corporate governance of ENGH. Due to these facts, under the federal securities laws, the securities of ENGH held by Nuveen funds and accounts, including the Fund, cannot be sold except under limited conditions (which are not currently satisfied). The Fund is therefore unable to sell such shares in ordinary secondary market transactions at this time. On March 6, 2023 Vistra Corp. (“Vistra”) announced that it has executed a definitive agreement with Energy Harbor Corp., pursuant to which Energy Harbor will merge with and into a newly-formed subsidiary of Vistra. In connection with the transaction, Nuveen funds and accounts expect to receive a combination of cash and shares in a newly formed entity. Nuveen expects these shares to be issued in a private transaction and may have reduced secondary market liquidity. The transaction is subject to certain regulatory approvals and there can be no assurance that the transaction will close. |
| (j) | Non-income producing; issuer has not declared an ex-dividend date within the past twelve months. |
| (k) | In May 2023, Talen Energy completed a Chapter 11 plan of reorganization whereby the Fund received Talen Energy Common Stock in exchange for the following portfolio holding: Pennsylvania Economic Development Financing Authority, Exempt Facilities Revenue Refunding Bonds, PPL Energy Supply, LLC Project, Series 2009A, 6.400%, 12/01/38. |
| (l) | Senior loans generally pay interest at rates which are periodically adjusted by reference to a base short-term, floating lending rate (Reference Rate) plus an assigned fixed rate (Spread). These floating lending rates are generally (i) the lending rate referenced by the London Inter-Bank Offered Rate (“LIBOR”), or (ii) the prime rate offered by one or more major United States banks. Senior loans may be considered restricted in that the Fund ordinarily is contractually obligated to receive approval from the agent bank and/or borrower prior to the disposition of a senior loan. The rate shown is the coupon as of the end of the reporting period. |
| (m) | Senior loans generally are subject to mandatory and/or optional prepayment. Because of these mandatory prepayment conditions and because there may be significant economic incentives for a borrower to prepay, prepayments of senior loans may occur. As a result, the actual remaining maturity of senior loans held may be substantially less than the stated maturities shown. |
| (n) | Senior loan received as part of the bondholder funding agreement during June 2023 for Pennsylvania Economic Development Financing Authority, Exempt Facilities Revenue Bonds, KDC Agribusiness Fairless Hills LLC Project, Series 2020A-1, 10.000%, 12/01/40, 144A, Pennsylvania Economic Development Financing Authority, Exempt Facilities Revenue Bonds, KDC Agribusiness Fairless Hills LLC Project, Series 2020A-2, 10.000%, 12/01/40, (AMT), 144A, Pennsylvania Economic Development Financing Authority, Exempt Facilities Revenue Bonds, KDC Agribusiness Fairless Hills LLC Project, Series 2021A, 10.000%, 12/01/31. |
| (o) | MFP Shares, Net as a percentage of Total Investments is 42.9%. |
| 144A | Investment is exempt from registration under Rule 144A of the Securities Act of 1933, as amended. These investments may only be resold in transactions exempt from registration, which are normally those transactions with qualified institutional buyers. |
| AMT | Alternative Minimum Tax |
| PIK | Payment-in-kind (“PIK”) security. Depending on the terms of the security, income may be received in the form of cash, securities, or a combination of both. The PIK rate shown, where applicable, represents the annualized rate of the last PIK payment made by the issuer as of the end of the reporting period. |
| UB | Underlying bond of an inverse floating rate trust reflected as a financing transaction. |
| WI/DD | When-issued or delayed delivery security. |
See Notes to Financial Statements
178
| | |
| NDMO | | Nuveen Dynamic Municipal Opportunities Fund |
| | Portfolio of Investments October 31, 2023 |
| | | | | | | | | | | | |
Principal Amount (000) | | | | | Description (a) | | Optional Call Provisions (b) | | Value | |
| | | | | | LONG-TERM INVESTMENTS - 141.0% (98.9% of Total Investments) | | | | | | |
| | | | | | MUNICIPAL BONDS - 139.4% (97.8% of Total Investments) | | | | | | |
| | | | |
| | | | | | Alabama - 5.8% (4.1% of Total Investments) | | | | | | |
| | | | |
| $ | 5,000 | | | | | Black Belt Energy Gas District, Alabama, Gas Project Revenue Bonds, Series 2023A, 5.250%, 1/01/54, (Mandatory Put 10/01/30) | | 7/30 at 100.25 | | $ | 5,007,965 | |
| | | | |
| | 2,360 | | | | | Hoover Industrial Development Board, Alabama, Environmental Improvement Revenue Bonds, United States Steel Corporation Proejcet, Green Series 2020, 6.375%, 11/01/50, (AMT), (Mandatory Put 11/01/30) | | No Opt. Call | | | 2,453,621 | |
| | | | |
| | 4,685 | | | | | Mobile County, Alabama, Limited Obligation Warrants, Gomesa Projects, Series 2020, 4.000%, 11/01/45, 144A | | 11/29 at 100.00 | | | 3,708,482 | |
| | | | |
| | 20,000 | | | | | Southeast Energy Authority, Alabama, Commodity Supply Revenue Bonds, Project 4, Series 2022B-1, 5.000%, 5/01/53, (Mandatory Put 8/01/28) | | 5/28 at 100.34 | | | 19,814,304 | |
| | | | |
| | 2,720 | | | | | Tuscaloosa County Industrial Development Authority, Alabama, Gulf Opportunity Zone Bonds, Hunt Refining Project, Refunding Series 2019A, 4.500%, 5/01/32, 144A | | 5/29 at 100.00 | | | 2,407,759 | |
| | | | |
| | 500 | | | | | UAB Medicine Finance Authority, Alabama, Revenue Bonds, Series 2017B- 2, 5.000%, 9/01/41 | | 3/27 at 100.00 | | | 487,967 | |
| | | | | | Total Alabama | | | | | 33,880,098 | |
| | | | |
| | | | | | Arizona - 7.5% (5.3% of Total Investments) | | | | | | |
| | | | |
| | 7,650 | | | | | Arizona Industrial Development Authority, Arizona, Education Revenue Bonds, Heritage Academy - Gateway and Laveen Projects, Taxable Series 2021A, 5.000%, 7/01/51, 144A | | 7/28 at 103.00 | | | 5,976,532 | |
| | | | |
| | 920 | | | | | Arizona Industrial Development Authority, Arizona, Education Revenue Bonds, Mater Academy of Nevada - Bonanza Campus Project, Series 2020A, 5.000%, 12/15/40, 144A | | 12/28 at 100.00 | | | 833,306 | |
| | | | |
| | 1,500 | | | | | Arizona Industrial Development Authority, Arizona, Education Revenue Bonds, Social Bonds ? Pensar Academy Project, Series 2020, 5.000%, 7/01/55, 144A | | 7/28 at 100.00 | | | 1,144,323 | |
| | | | |
| | 4,500 | | | | | Arizona Industrial Development Authority, Arizona, Hotel Revenue Bonds, Provident Group ? Falcon Properties LLC, Project, Senior Series 2022A-1, 4.000%, 12/01/51, 144A | | 12/31 at 100.00 | | | 2,984,679 | |
| | | | |
| | 1,200 | | | | | Chandler Industrial Development Authority, Arizona, Industrial Development Revenue Bonds, Intel Corporation Project, Series 2007, 4.100%, 12/01/37, (AMT), (Mandatory Put 6/15/28) | | 2/28 at 100.00 | | | 1,167,380 | |
| | | | |
| | 5,085 | | | | | Chandler Industrial Development Authority, Arizona, Industrial Development Revenue Bonds, Intel Corporation Project, Series 2022-2, 5.000%, 9/01/52, (AMT), (Mandatory Put 9/01/27) | | 3/27 at 100.00 | | | 5,122,690 | |
| | | | |
| | 1,090 | | | | | Coconino County Industrial Development Authority, Arizona, Education Revenue Bonds, Flagstaff Arts & Leadership Academy Project, Refunding Series 2020, 5.500%, 7/01/40, 144A | | 7/28 at 100.00 | | | 859,979 | |
| | | | |
| | 1,000 | | | | | Maricopa County Industrial Development Authority, Arizona, Educational Facilities Revenue Bonds, Ottawa University Projects, Series 2020, 5.250%, 10/01/40, 144A | | 10/27 at 103.00 | | | 906,133 | |
| | | | |
| | 1,335 | | | | | Maricopa County Industrial Development Authority, Arizona, Revenue Bonds, Banner Health, Series 2023A-2, 5.000%, 1/01/53, (Mandatory Put 5/15/28) | | 5/27 at 101.68 | | | 1,380,103 | |
| | | | |
| | 1,495 | | | | | Maricopa County Industrial Development Authority, Arizona, Revenue Bonds, Banner Health, Series 2023A-3, 5.000%, 1/01/53, (Mandatory Put 11/01/30) | | 11/29 at 101.58 | | | 1,549,414 | |
179
| | |
| NDMO | | Nuveen Dynamic Municipal Opportunities Fund (continued) |
| | Portfolio of Investments October 31, 2023 |
| | | | | | | | | | | | |
Principal Amount (000) | | | | | Description (a) | | Optional Call Provisions (b) | | Value | |
| | | | |
| | | | | | Arizona (continued) | | | | | | |
| | | | | | Phoenix Civic Improvement Corporation, Arizona, Airport Revenue Bonds, Senior Lien Refunding Series 2023: | | | | | | |
| | $ 1,560 | | | | | 5.000%, 7/01/30, (AMT) | | No Opt. Call | | $ | 1,603,612 | |
| | 1,370 | | | | | 5.000%, 7/01/31, (AMT) | | No Opt. Call | | | 1,408,067 | |
| | 1,260 | | | | | 5.000%, 7/01/32, (AMT) | | No Opt. Call | | | 1,296,587 | |
| | | | |
| | 3,405 | | | | | Phoenix Industrial Development Authority, Arizona, Education Facility Revenue Bonds, Northwest Christian School Project, Series 2020A, 5.000%, 9/01/55, 144A | | 9/30 at 100.00 | | | 2,470,468 | |
| | | | |
| | | | | | Pima County Industrial Development Authority, Arizona, Education Facility Revenue Bonds, Edkey Charter Schools Project, Refunding Series 2020: | | | | | | |
| | 5,265 | | | | | 5.000%, 7/01/35, 144A | | 7/26 at 103.00 | | | 4,870,343 | |
| | 6,800 | | | | | 5.000%, 7/01/40, 144A | | 7/26 at 103.00 | | | 5,889,283 | |
| | | | |
| | 4,580 | | | | | Pima County Industrial Development Authority, Arizona, Education Facility Revenue Bonds, Synergy Public Charter School Project, Series 2020-1, 5.000%, 6/15/50, 144A | | 6/28 at 100.00 | | | 3,595,076 | |
| | | | |
| | 800 | | | | | Pima County Industrial Development Authority, Arizona, Revenue Bonds, Tucson Medical Center, Series 2021A, 4.000%, 4/01/40 | | 4/31 at 100.00 | | | 678,996 | |
| | | | | | Total Arizona | | | | | 43,736,971 | |
| | | | |
| | | | | | Arkansas - 1.7% (1.2% of Total Investments) | | | | | | |
| | | | |
| | 4,500 | | | | | Arkansas Development Finance Authority, Arkansas, Environmental Improvement Revenue Bonds, United States Steel Corporation, Green Series 2022, 5.450%, 9/01/52, (AMT), 144A | | 9/25 at 105.00 | | | 3,966,963 | |
| | | | |
| | 6,500 | | | | | Arkansas Development Finance Authority, Industrial Development Revenue Bonds, Big River Steel Project, Series 2019, 4.500%, 9/01/49, (AMT), 144A | | 9/26 at 103.00 | | | 5,772,485 | |
| | | | | | Total Arkansas | | | | | 9,739,448 | |
| | | | |
| | | | | | California - 6.8% (4.8% of Total Investments) | | | | | | |
| | | | |
| | 1,960 | | | | | California Community Choice Financing Authority, Clean Energy Project Revenue Bonds, Green Series 2023C, 5.250%, 1/01/54, (Mandatory Put 10/01/31) | | 10/30 at 100.65 | | | 1,918,798 | |
| | | | |
| | 4,500 | | | | | California Community Choice Financing Authority, Clean Energy Project Revenue Bonds, Green Series 2023D, 5.500%, 5/01/54, (Mandatory Put 11/01/28) | | 8/28 at 100.24 | | | 4,604,107 | |
| | | | |
| | 3,815 | | | | | California Community Housing Agency, California, Essential Housing Revenue Bonds, Creekwood, Series 2021A, 4.000%, 2/01/56, 144A | | 8/31 at 100.00 | | | 2,195,869 | |
| | | | |
| | 9,500 | | | | | California Municipal Finance Authority, Special Facility Revenue Bonds, United Airlines, Inc. Los Angeles International Airport Project, Series 2019, 4.000%, 7/15/29, (AMT) | | No Opt. Call | | | 8,893,925 | |
| | | | |
| | | | | | California Pollution Control Financing Authority, Water Furnishing Revenue Bonds, Poseidon Resources Channelside LP Desalination Project, Series 2012: | | | | | | |
| | | | |
| | 6,290 | | | | | 5.000%, 7/01/30 | | No Opt. Call | | | 6,293,822 | |
| | | | |
| | 5,000 | | | | | California Public Finance Authority, Charter School Lease Revenue Bonds, California Crosspoint Academy Project, Series 2020A, 5.125%, 7/01/55, 144A | | 7/28 at 100.00 | | | 3,620,999 | |
| | | | |
| | 465 | | | | | California Public Finance Authority, Senior Living Revenue Bonds, Enso Village, Refunding Green Series 2021A, 5.000%, 11/15/46, 144A | | 11/29 at 102.00 | | | 384,189 | |
| | | | |
| | 2,000 | | | | | California School Finance Authority, Charter School Revenue Bonds, Scholarship Prep Public Schools Obligated Group, Series 2020A, 5.000%, 6/01/60, 144A | | 6/28 at 100.00 | | | 1,348,016 | |
| | | | |
| | 925 | | | | | California State, General Obligation Bonds, Refunding Various Purpose Series 2023, 4.000%, 9/01/43 | | 9/33 at 100.00 | | | 840,714 | |
180
| | | | | | | | | | | | |
Principal Amount (000) | | | | | Description (a) | | Optional Call Provisions (b) | | Value | |
| | | | |
| | | | | | California (continued) | | | | | | |
| | | | |
| | $ 1,105 | | | | | California State, General Obligation Bonds, Various Purpose Refunding Series 2023, 4.000%, 10/01/42 | | 4/33 at 100.00 | | $ | 1,006,981 | |
| | | | |
| | 1,220 | | | | | California Statewide Communities Development Authority, California, Revenue Bonds, Loma Linda University Medical Center, Series 2016A, 5.000%, 12/01/41, 144A | | 6/26 at 100.00 | | | 1,118,285 | |
| | | | |
| | 6,180 | | | | | CSCDA Community Improvement Authority, California, Essential Housing Revenue Bonds, Center City Anaheim, Series 2020A, 5.000%, 1/01/54, 144A | | 1/31 at 100.00 | | | 4,461,995 | |
| | | | |
| | 985 | | | (c) | | Northstar Community Services District, California, Special Tax Bonds, Community Facilities District 1, Series 2006, 1.750%, 9/01/37 | | 3/24 at 100.00 | | | 344,901 | |
| | | | |
| | 1,070 | | | | | River Islands Public Financing Authority, California, Special Tax Bonds, Community Facilities District 2003-1 Improvement Area 1, Refunding Series 2022A-1, 5.000%, 9/01/42 - AGM Insured | | 9/29 at 103.00 | | | 1,096,921 | |
| | | | |
| | 1,070 | | | | | River Islands Public Financing Authority, California, Special Tax Bonds, Community Facilities District 2003-1 Improvement Area 1, Subordinate Series 2022B-2, 5.000%, 9/01/42 | | 9/29 at 103.00 | | | 971,197 | |
| | | | |
| | 750 | | | | | San Francisco Community College District, California, General Obligation Bonds, Taxable Election 2020 Series 2020A-1, 3.165%, 6/15/41 | | 6/30 at 100.00 | | | 516,225 | |
| | | | |
| | 420 | | | | | San Jose, California, Airport Revenue Bonds, Taxable Refunding Series 2021C, 3.290%, 3/01/41 | | 3/31 at 100.00 | | | 285,390 | |
| | | | | | Total California | | | | | 39,902,334 | |
| | | | |
| | | | | | Colorado - 17.8% (12.5% of Total Investments) | | | | | | |
| | | | |
| | 2,370 | | | | | 64th Avenue ARI Authority, Adams County, Colorado, Special Revenue Bonds, Series 2020, 6.500%, 12/01/43 | | 12/25 at 103.00 | | | 2,109,096 | |
| | | | |
| | 1,240 | | | | | Arista Metropolitan District, Broomfield County, Colorado, General Obligation Limited Tax Bonds, Refunding & Improvement Convertible to Unlimited Tax Series 2018A, 5.000%, 12/01/38 | | 12/23 at 103.00 | | | 1,118,056 | |
| | | | |
| | 1,060 | | | | | Aurora Crossroads Metropolitan District 2, Colorado, Limited Tax General Obligation Bonds, Series 2020A, 5.000%, 12/01/50 | | 9/25 at 103.00 | | | 852,895 | |
| | | | |
| | 2,285 | | | | | Aurora Crossroads Metropolitan District 2, Colorado, Limited Tax General Obligation Bonds, Subordinate Series 2020B, 7.750%, 12/15/50 | | 9/25 at 103.00 | | | 1,965,477 | |
| | | | |
| | 5,220 | | | | | Aurora Highlands Community Authority Board, Adams County, Colorado, Special Tax Revenue Bonds, Refunding & Improvement Series 2021A, 5.750%, 12/01/51 | | 12/28 at 103.00 | | | 4,322,553 | |
| | | | |
| | 499 | | | | | Aviation Station North Metropolitan District 2, Denver County, Colorado, Limited Tax General Obligation Bonds, Refunding & Improvement Series 2019A, 4.000%, 12/01/29 | | 9/24 at 103.00 | | | 453,982 | |
| | | | |
| | 1,725 | | | | | Belford North Metropolitan District, Douglas County, Colorado, General Obligation Limited Tax Bonds, Series 2020A, 5.500%, 12/01/50 | | 12/25 at 103.00 | | | 1,411,610 | |
| | | | |
| | 1,000 | | | | | Bennett Ranch Metropolitan District 1, Adams County, Colorado, General Obligation Limited Tax Bonds, Convertible to Unlimited Tax Series 2021A, 5.000%, 12/01/51 | | 3/26 at 103.00 | | | 781,914 | |
| | | | |
| | 734 | | | (d) | | Blue Lake Metropolitan District 3, Lochbuie, Weld County, Colorado, Limited Tax General Obligation Bonds, Convertible to Unlimited Tax Series 2018A, 5.250%, 12/01/48, (Pre-refunded 12/01/23) | | 12/23 at 103.00 | | | 756,627 | |
| | | | |
| | 500 | | | | | Broadway Park North Metropolitan District 2, Denver, Colorado, Limited Tax General Obligation Bonds, Refunding & Improvement Series 2020, 5.000%, 12/01/40, 144A | | 12/25 at 103.00 | | | 439,222 | |
| | | | |
| | 1,000 | | | | | Broadway Station Metropolitan District 2, Denver City and County, Colorado, General Obligation Limited Tax Bonds, Convertible to Unlimited Series 2019A, 5.125%, 12/01/48 | | 6/24 at 103.00 | | | 729,502 | |
181
| | |
| NDMO | | Nuveen Dynamic Municipal Opportunities Fund (continued) |
| | Portfolio of Investments October 31, 2023 |
| | | | | | | | | | | | |
Principal Amount (000) | | | | | Description (a) | | Optional Call Provisions (b) | | Value | |
| | | | |
| | | | | | Colorado (continued) | | | | | | |
| | $ 1,500 | | | | | Canyons Metropolitan District 5, Douglas County, Colorado, Limited Tax General Obligation and Special Revenue Bonds, Junior Subordinate Series 2016, 7.000%, 12/15/57 | | 12/23 at 100.00 | | $ | 964,067 | |
| | | | |
| | 1,450 | | | | | Citadel on Colfax Business Improvement District, Aurora, Colorado, Special Revenue and Tax Supported Bonds, Senior Series 2020A, 5.350%, 12/01/50 | | 12/25 at 103.00 | | | 1,180,601 | |
| | | | |
| | | | | | Colorado Educational and Cultural Facilities Authority, Charter School Revenue Bonds, New Summit Charter Academy Project, Series 2021A: | | | | | | |
| | 100 | | | | | 4.000%, 7/01/41, 144A | | 7/31 at 100.00 | | | 76,399 | |
| | 100 | | | | | 4.000%, 7/01/51, 144A | | 7/31 at 100.00 | | | 67,989 | |
| | | | |
| | 1,000 | | | | | Colorado Educational and Cultural Facilities Authority, Revenue Bonds, Global Village Academy - Northglenn Project, Series 2020, 5.000%, 12/01/50, 144A | | 12/30 at 100.00 | | | 768,442 | |
| | | | |
| | 5,370 | | | | | Colorado Health Facilities Authority, Colorado, Revenue Bonds, AdventHealth Obligated Group, Series 2023A-2, 5.000%, 11/15/57, (Mandatory Put 11/15/33) | | 11/32 at 101.57 | | | 5,619,032 | |
| | | | |
| | 500 | | | | | Colorado Health Facilities Authority, Colorado, Revenue Bonds, Cappella of Grand Junction Project, Series 2019, 5.000%, 12/01/54, 144A | | 12/26 at 103.00 | | | 300,990 | |
| | | | |
| | 16,000 | | | | | Colorado International Center Metropolitan District 8, Adams County, Colorado, Limited Tax General Obligation Bonds, Series 2020, 6.500%, 12/01/50 | | 9/25 at 103.00 | | | 13,520,082 | |
| | | | |
| | 656 | | | | | Dacono Urban Renewal Authority, Weld County, Colorado, Tax Increment Revenue Bonds, Series 2020, 6.250%, 12/01/39 | | 12/25 at 103.00 | | | 581,835 | |
| | | | |
| | | | | | Denver City and County, Colorado, Airport System Revenue Bonds, Series 2022A: | | | | | | |
| | 1,000 | | | | | 5.000%, 11/15/31, (AMT) | | No Opt. Call | | | 1,027,421 | |
| | 1,355 | | | | | 5.500%, 11/15/38, (AMT) | | 11/32 at 100.00 | | | 1,417,990 | |
| | | | |
| | 4,000 | | | | | Falcon Area Water and Wastewater Authority (El Paso County, Colorado), Tap Fee Revenue Bonds, Series 2022A, 6.750%, 12/01/34, 144A | | 9/27 at 103.00 | | | 3,713,304 | |
| | | | |
| | 1,000 | | | | | Foothills Metropolitan District, Fort Collins, Colorado, Special Revenue Bonds, Series 2014, 6.000%, 12/01/38 | | 12/24 at 100.00 | | | 878,925 | |
| | | | |
| | | | | | Fourth North Business Improvement District, Silverthorne, Summit County, Colorado, Special Revenue and Tax Supported Bonds, Refunding & Improvement Senior Series 2022A: | | | | | | |
| | 1,425 | | | | | 5.250%, 12/01/32 | | 12/30 at 102.00 | | | 1,346,167 | |
| | 1,200 | | | | | 5.750%, 12/01/52 | | 12/30 at 102.00 | | | 1,064,547 | |
| | | | |
| | 2,000 | | | | | Future Legends Sports Park Metropolitan District 2, Colorado, Limited Tax General Obligation Bonds, Series 2020A, 5.500%, 6/01/50, 144A | | 6/25 at 103.00 | | | 1,575,615 | |
| | | | |
| | 5,250 | | | | | Jefferson Center Metropolitan District 1, Arvada, Jefferson County, Colorado, Special Revenue Bonds, Subordinate Series 2020B, 5.750%, 12/15/50 | | 12/23 at 103.00 | | | 4,636,332 | |
| | | | |
| | 2,000 | | | | | Jones District Community Authority Board, Centennial, Colorado, Special Revenue Convertible Capital Appreciaiton Bonds, Series 2020A, 5.750%, 12/01/50 | | 12/25 at 103.00 | | | 1,563,946 | |
| | | | |
| | 1,000 | | | | | Kinston Metropolitan District 5, Loveland, Larimer County, Colorado, Limited Tax General Obligation Bonds, Series 2020A, 5.125%, 12/01/50 | | 12/25 at 103.00 | | | 733,642 | |
| | | | |
| | 1,380 | | | | | Lanterns Metropolitan District 1, Castle Rock, Douglas County, Colorado, Limited Tax General Obligation Bonds, Series 2019A, 5.000%, 12/01/39 | | 9/24 at 103.00 | | | 1,241,457 | |
| | | | |
| | 1,030 | | | | | Lanterns Metropolitan District 3, Douglas County, Colorado, General Obligation Bonds, Limited Tax Convertible Capital Appreciation Series 2023A-2, 8.000%, 12/01/53 | | 12/28 at 103.00 | | | 692,487 | |
182
| | | | | | | | | | | | |
Principal Amount (000) | | | | | Description (a) | | Optional Call Provisions (b) | | Value | |
| | | | |
| | | | | | Colorado (continued) | | | | | | |
| | $ 560 | | | | | Lanterns Metropolitan District 3, Douglas County, Colorado, General Obligation Bonds, Limited Tax Series 2023A-1, 7.250%, 12/01/53 | | 12/28 at 103.00 | | $ | 560,681 | |
| | | | |
| | 3,000 | | | | | Ledge Rock Center Commercial Metropolitan District (In the Town of Johnstown, Weld County, Colorado), Limited Tax General Obligation Bonds, Series 2022, 7.375%, 11/01/52, 144A | | 11/29 at 103.00 | | | 2,759,880 | |
| | | | |
| | | | | | Mayberry Community Authority, Colorado Springs, El Paso County, Colorado, Special Revenue Bonds, Series 2021A: | | | | | | |
| | 500 | | | | | 5.000%, 12/01/41 | | 6/26 at 103.00 | | | 422,892 | |
| | 500 | | | | | 5.000%, 4/15/51 | | 6/26 at 103.00 | | | 390,275 | |
| | | | |
| | 500 | | | | | Meadowbrook Heights Metropolitan District, Jefferson County, Colorado, General Obligation Limited Tax Bonds, Series 2021A(3), 4.875%, 12/01/51 | | 9/26 at 103.00 | | | 358,092 | |
| | | | |
| | 480 | | | | | Mountain Sky Metropolitan District, Fort Lupton, Weld County, Colorado, Limited Tax General Obligation Bonds, Series 2020A, 5.000%, 12/01/49 | | 3/25 at 103.00 | | | 393,818 | |
| | | | |
| | 2,000 | | | | | North Range Metropolitan District 3, Adams County, Colorado, Limited Tax General Obligation Bonds, Series 2020A-3, 5.000%, 12/01/40 | | 12/25 at 103.00 | | | 1,715,275 | |
| | | | |
| | 1,810 | | | | | Northfield Metropolitan District 2, Fort Collins, Larimer County, Colorado, Limited Tax General Obligation Bonds, Series 2020A, 5.000%, 12/01/50 | | 12/25 at 103.00 | | | 1,434,751 | |
| | | | |
| | | | | | Painted Prairie Public Improvement Authority, Aurora, Colorado,Special Revenue Bonds, Series 2019: | | | | | | |
| | 500 | | | | | 4.000%, 12/01/29 | | 12/24 at 103.00 | | | 452,741 | |
| | 1,250 | | | | | 5.000%, 12/01/39 | | 12/24 at 103.00 | | | 1,103,279 | |
| | | | |
| | 285 | | | | | Peak Metropolitan District 1, Colorado Springs, El Paso County, Colorado, Limited Tax General Obligation Bonds, Series 2021A, 5.000%, 12/01/51, 144A | | 3/26 at 103.00 | | | 224,276 | |
| | | | |
| | 1,100 | | | | | Peak Metropolitan District 3, Colorado Springs, El Paso County, Colorado, Limited Tax General Obligation Bonds, Series 2022A-1, 7.500%, 12/01/52 | | 12/27 at 103.00 | | | 1,016,192 | |
| | | | |
| | 925 | | | | | Pinon Pines Metropolitan District 2, El Paso County, Colorado, General Obligation Limited Tax Bonds, Series 2020, 5.000%, 12/01/40 | | 9/25 at 103.00 | | | 814,632 | |
| | | | |
| | 7,040 | | | | | Pioneer Community Authority Board (Weld County, Colorado), Special Revenue Bonds, Series 2022, 6.500%, 12/01/34 | | 6/29 at 103.00 | | | 6,295,728 | |
| | | | |
| | 3,665 | | | | | Rampart Range Metropolitan District 1, Lone Tree, Colorado, Limited Tax Supported and Special Revenue Bonds, Refunding & Improvement Series 2017, 5.000%, 12/01/42 | | 12/27 at 100.00 | | | 3,683,305 | |
| | | | |
| | 2,000 | | | | | Rampart Range Metropolitan District 5, Lone Tree, Douglas County, Colorado, Limited Tax Supported and Special Revenue Bonds, Series 2021, 4.000%, 12/01/41 | | 10/26 at 102.00 | | | 1,437,086 | |
| | | | |
| | 740 | | | | | Sterling Ranch Community Authority Board, Douglas County, Colorado, Limited Tax Supported District 2, Subordinate Series 2020B, 7.125%, 12/15/50 | | 12/25 at 102.00 | | | 657,831 | |
| | | | |
| | | | | | Sterling Ranch Metropolitan District 1, El Paso County, Colorado, General Obligation Limited Tax Bonds, Series 2020: | | | | | | |
| | 2,350 | | | | | 5.000%, 12/01/40 | | 12/25 at 103.00 | | | 2,046,224 | |
| | 2,300 | | | | | 5.125%, 12/01/50 | | 12/25 at 103.00 | | | 1,871,955 | |
| | | | |
| | 2,175 | | | | | Sunlight Metropolitan District, Steamboat Springs, Colorado, Limited Tax General Obligation Bonds, Series 2020, 5.000%, 12/01/50 | | 12/25 at 103.00 | | | 1,736,160 | |
| | | | |
| | 496 | | | | | Tallman Gulch Metropolitan District, Douglas County, Colorado, Limited Tax General Obligation Refunding and Improvement Bonds,Subordinate Limited Tax General Obligation Bonds, Series 2018A, 5.250%, 12/01/47 | | 12/23 at 102.00 | | | 438,016 | |
| | | | |
| | 1,000 | | | | | Transport Metropolitan District 3, In the City of Aurora, Adams County, Colorado, General Obligation Limited Bonds, Convertible Capital Appreciation Series 2021A-2, 5.500%, 12/01/51 | | 3/26 at 103.00 | | | 661,979 | |
183
| | |
| NDMO | | Nuveen Dynamic Municipal Opportunities Fund (continued) |
| | Portfolio of Investments October 31, 2023 |
| | | | | | | | | | | | |
Principal Amount (000) | | | | | Description (a) | | Optional Call Provisions (b) | | Value | |
| | | | |
| | | | | | Colorado (continued) | | | | | | |
| | $ 1,270 | | | | | Transport Metropolitan District 3, In the City of Aurora, Adams County, Colorado, General Obligation Limited Bonds, Series 2021A-1, 5.000%, 12/01/41 | | 3/26 at 103.00 | | $ | 992,135 | |
| | | | |
| | 5,000 | | | | | Velocity Metropolitan District 5, In the City of Aurora, Colorado, Limited Tax General Obligation Bonds, Convertible Capital Appreciation Series 2020A-2, 6.000%, 12/01/50 | | 12/23 at 81.31 | | | 3,362,082 | |
| | | | |
| | 10,000 | | | | | Velocity Metropolitan District 5, In the City of Aurora, Colorado, Limited Tax General Obligation Bonds, Series 2020A-1, 5.375%, 12/01/50 | | 12/23 at 103.00 | | | 8,386,336 | |
| | | | |
| | 1,500 | | | | | Verve Metropolitan District 1, Jefferson County and the City and County of Broomfield, Colorado, General Obligation Bonds, Refunding and Improvement Limited Tax Series 2021, 5.000%, 12/01/51 | | 3/26 at 103.00 | | | 1,022,990 | |
| | | | |
| | 2,000 | | | | | Windler Public Improvement Authority, Aurora, Colorado, Limited Tax Supported Revenue Bonds, Series 2021A-1, 4.125%, 12/01/51, 144A | | 9/26 at 103.00 | | | 1,118,373 | |
| | | | |
| | 983 | | | | | Woodmen Heights Metropolitan District 2, El Paso County, Colorado, General Obligation Limited Tax Bonds, Taxable Converting to Tax-Exempt Refunding Subordinate Series 2020B-1, 6.250%, 12/15/40 | | 12/25 at 103.00 | | | 853,495 | |
| | | | | | Total Colorado | | | | | 104,122,683 | |
| | | | |
| | | | | | Connecticut - 0.6% (0.4% of Total Investments) | | | | | | |
| | | | |
| | | | | | Connecticut Health and Educational Facilities Authority, Revenue Bonds, Nuvance Health Series 2019A: | | | | | | |
| | 1,325 | | | | | 4.000%, 7/01/34 | | 7/29 at 100.00 | | | 1,194,939 | |
| | 1,250 | | | | | 4.000%, 7/01/36 | | 7/29 at 100.00 | | | 1,087,600 | |
| | | | |
| | 1,255 | | | | | Connecticut Housing Finance Authority, Housing Mortgage Finance Program Bonds, Series 2016B-1, 2.950%, 11/15/31 | | 11/25 at 100.00 | | | 1,096,477 | |
| | | | | | Total Connecticut | | | | | 3,379,016 | |
| | | | |
| | | | | | District of Columbia - 0.2% (0.1% of Total Investments) | | | | | | |
| | | | |
| | 1,000 | | | | | Washington Convention and Sports Authority, Washington D.C., Dedicated Tax Revenue Bonds, Refunding Senior Lien Series 2021A, 4.000%, 10/01/37 | | 10/30 at 100.00 | | | 905,273 | |
| | | | | | Total District of Columbia | | | | | 905,273 | |
| | | | |
| | | | | | Florida - 15.6% (10.9% of Total Investments) | | | | | | |
| | | | |
| | 1,565 | | | | | Ave Maria Stewardship Community District, Florida, Capital Improvement Revenue Bonds, Ave Maria National Project, Series 2021, 3.750%, 5/01/41 | | 5/31 at 100.00 | | | 1,187,891 | |
| | | | |
| | | | | | Capital Trust Agency, Florida, Educational Facilities Lease Revenue Bonds, South Tech Schools Project, Series 2020A: | | | | | | |
| | 1,230 | | | | | 5.000%, 6/15/40, 144A | | 6/27 at 100.00 | | | 1,058,676 | |
| | 1,260 | | | | | 5.000%, 6/15/55, 144A | | 6/27 at 100.00 | | | 979,993 | |
| | | | |
| | | | | | Capital Trust Agency, Florida, Revenue Bonds, Babcock Neighborhood School Inc, Series 2021: | | | | | | |
| | 250 | | | | | 4.000%, 8/15/51, 144A | | 8/28 at 100.00 | | | 163,547 | |
| | 450 | | | | | 4.200%, 8/15/56, 144A | | 8/28 at 100.00 | | | 295,845 | |
| | 500 | | | | | 4.250%, 8/15/61, 144A | | 8/28 at 100.00 | | | 323,658 | |
| | | | |
| | 4,710 | | | | | Currents Community Development District, Collier County, Florida, Capital Improvement Revenue Bonds, Series 2020B, 4.250%, 5/01/41, 144A | | No Opt. Call | | | 3,798,081 | |
| | | | |
| | 10,000 | | | | | Florida Development Finance Corporation, Educational Facilities Revenue Bonds, Discovery High School Project, Series 2020A, 5.000%, 6/01/55, 144A | | 6/29 at 100.00 | | | 7,599,902 | |
| | | | |
| | | | | | Florida Development Finance Corporation, Educational Facilities Revenue Bonds, Renaissance Charter School Income Projects, Series 2023A: | | | | | | |
| | 835 | | | | | 6.000%, 6/15/33, 144A | | No Opt. Call | | | 821,781 | |
184
| | | | | | | | | | | | |
Principal Amount (000) | | | | | Description (a) | | Optional Call Provisions (b) | | Value | |
| | | | |
| | | | | | Florida (continued) | | | | | | |
| | $ 1,000 | | | | | 6.500%, 6/15/38, 144A | | 6/30 at 103.00 | | $ | 978,712 | |
| | 1,000 | | | | | 6.625%, 6/15/43, 144A | | 6/30 at 103.00 | | | 969,530 | |
| | | | |
| | 2,450 | | | | | Florida Development Finance Corporation, Florida, Solid Waste Disposal Revenue Bonds, Waste Pro USA, Inc. Project, Series 2023, 6.125%, 7/01/32, (AMT), (Mandatory Put 7/01/26), 144A | | 4/26 at 100.00 | | | 2,420,551 | |
| | | | |
| | 19,650 | | | | | Florida Development Finance Corporation, Florida, Surface Transportation Facility Revenue Bonds, Brightline Passenger Rail Project, Green Series 2019B, 7.375%, 1/01/49, (AMT), 144A | | 1/24 at 107.00 | | | 19,158,774 | |
| | | | |
| | | | | | Florida Development Finance Corporation, Florida, Surface Transportation Facility Revenue Bonds, Virgin Trains USA Passenger Rail Project, Series 2019A: | | | | | | |
| | 1,250 | | | | | 6.375%, 1/01/49, (AMT), (Mandatory Put 1/01/26), 144A | | 12/23 at 102.00 | | | 1,189,885 | |
| | 6,890 | | | | | 6.500%, 1/01/49, (AMT), (Mandatory Put 1/01/29), 144A | | 12/23 at 102.00 | | | 6,512,068 | |
| | | | |
| | | | | | Florida Development Finance Corporation, Healthcare Facilties Revenue Bonds, Lakeland Regional Health Systems, Series 2021: | | | | | | |
| | 450 | | | | | 4.000%, 11/15/35 | | 11/31 at 100.00 | | | 401,808 | |
| | 1,000 | | | | | 4.000%, 11/15/37 | | 11/31 at 100.00 | | | 854,591 | |
| | 1,940 | | | | | 4.000%, 11/15/38 | | 11/31 at 100.00 | | | 1,629,478 | |
| | | | |
| | 2,750 | | | | | Florida Development Finance Corporation, Revenue Bonds, Brightline Florida Passenger Rail Expansion Project, Series 2023A, 7.500%, 7/01/57, (AMT), (Mandatory Put 8/15/24) | | 12/23 at 103.50 | | | 2,703,913 | |
| | | | |
| | 26,505 | | | | | Florida Development Finance Corporation, Revenue Bonds, Brightline Passenger Rail Expansion Project, Series 2023C, 8.000%, 7/01/57, (AMT), (Mandatory Put 4/01/24), 144A | | 11/23 at 100.00 | | | 26,692,343 | |
| | | | |
| | 985 | | | | | Forest Lake Community Development District, Polk County, Florida, Specia Assessment Bonds, Assessment Area 1 Project, Series 2020, 4.000%, 5/01/51, 144A | | 5/30 at 100.00 | | | 721,281 | |
| | | | |
| | | | | | Grand Oaks Community Development District, Saint Johns County, Florida, Special Assessment Bonds, Assessment Area 2, Series 2020: | | | | | | |
| | 1,100 | | | | | 4.250%, 5/01/40 | | 5/31 at 100.00 | | | 903,162 | |
| | 1,500 | | | | | 4.500%, 5/01/52 | | 5/31 at 100.00 | | | 1,148,563 | |
| | | | |
| | 2,500 | | | | | Greater Orlando Aviation Authority, Florida, Special Purpose Airport Facilities Revenue Bonds, JetBlue Airways Corporation, Series 2013, 5.000%, 11/15/36, (AMT) | | 12/23 at 100.00 | | | 2,353,642 | |
| | | | |
| | 1,000 | | | | | Hammock Reserve Community Development District, Haines City, Florida, Special Assessment Revenue Bonds, Area1 Project, Series 2020, 4.000%, 5/01/51 | | 5/30 at 100.00 | | | 754,081 | |
| | | | |
| | 1,225 | | | | | Miami Dade County Industrial Development Authority, Florida, Educational Facilities Revenue Bonds, Miami Community Charter School Inc Project, Series 2020A, 5.000%, 6/01/47, 144A | | 6/26 at 103.00 | | | 940,554 | |
| | | | |
| | 870 | | | (e) | | Miami-Dade County, Florida, Seaport Revenue Bonds, Refunding Series 2022A, 5.250%, 10/01/52, (AMT), (UB) | | 10/32 at 100.00 | | | 837,619 | |
| | | | |
| | | | | | Miami-Dade County, Florida, Special Obligation Bonds, Subordinate Series 2009: | | | | | | |
| | 1,360 | | | | | 0.000%, 10/01/37 - BAM Insured | | No Opt. Call | | | 675,875 | |
| | 1,480 | | | | | 0.000%, 10/01/42 - BAM Insured | | No Opt. Call | | | 538,990 | |
| | | | |
| | 1,145 | | | | | South Broward Hospital District, Florida, Hospital Revenue Bonds, South Broward Hospital District Obligated Group, Refunding Series 2016A, 4.000%, 5/01/44 | | 5/26 at 100.00 | | | 962,028 | |
| | | | |
| | 310 | | | | | Three Rivers Community Development District, Florida, Special Assessment Revenue Bonds, South Assessment Area Series 2021B, 4.625%, 5/01/36, 144A | | 12/23 at 100.00 | | | 273,392 | |
185
| | |
| NDMO | | Nuveen Dynamic Municipal Opportunities Fund (continued) |
| | Portfolio of Investments October 31, 2023 |
| | | | | | | | | | | | |
Principal Amount (000) | | | | | Description (a) | | Optional Call Provisions (b) | | Value | |
| | | | |
| | | | | | Florida (continued) | | | | | | |
| | $ 425 | | | | | Tradition Community Development District 9, Port Saint Lucie, Florida, Special Assessment Bonds, Series 2021, 2.700%, 5/01/31 | | No Opt. Call | | $ | 351,072 | |
| | | | |
| | 450 | | | | | Village Community Development District 15, Florida, Special Assessment Revenue Bonds, Series 2023, 4.250%, 5/01/28, 144A | | No Opt. Call | | | 438,852 | |
| | | | |
| | 350 | | | | | Windward Community Development District, Florida, Special Assessment Bonds, Series 2020A-2, 4.400%, 11/01/35 | | No Opt. Call | | | 309,570 | |
| | | | | | Total Florida | | | | | 90,949,708 | |
| | | | |
| | | | | | Georgia - 1.1% (0.8% of Total Investments) | | | | | | |
| | | | |
| | | | | | Atlanta, Georgia, Airport Passenger Facilities Charge and General Revenue Bonds, Subordinate Lien Green Series 2023E: | | | | | | |
| | 1,120 | | | | | 5.250%, 7/01/41, (AMT) | | 7/33 at 100.00 | | | 1,132,862 | |
| | 1,395 | | | | | 5.250%, 7/01/43, (AMT) | | 7/33 at 100.00 | | | 1,396,774 | |
| | | | |
| | 500 | | | | | Gainesville and Hall County Hospital Authority, Georgia, Revenue Anticipation Certificates, Northeast Georgia Health Services Inc., Series 2021A, 3.000%, 2/15/51 - BAM Insured | | 2/31 at 100.00 | | | 330,294 | |
| | | | |
| | 1,000 | | | | | Griffin-Spalding County Hospital Authority, Georgia, Revenue Anticipation Certificates, Wellstar Health System Inc., Series 2017A, 4.000%, 4/01/42 | | 4/27 at 100.00 | | | 862,036 | |
| | | | |
| | 2,750 | | | | | Main Street Natural Gas Inc., Georgia, Gas Supply Revenue Bonds, Series 2022C, 4.000%, 8/01/52, (Mandatory Put 11/01/27), 144A | | 5/27 at 100.81 | | | 2,561,756 | |
| | | | | | Total Georgia | | | | | 6,283,722 | |
| | | | |
| | | | | | Guam - 0.2% (0.1% of Total Investments) | | | | | | |
| | | | |
| | | | | | Guam A.B. Won Pat International Airport Authority, Revenue Bonds, Series 2021A: | | | | | | |
| | 765 | | | | | 3.099%, 10/01/28 | | No Opt. Call | | | 649,294 | |
| | 450 | | | | | 4.460%, 10/01/43 | | 10/31 at 100.00 | | | 306,610 | |
| | | | | | Total Guam | | | | | 955,904 | |
| | | | |
| | | | | | Illinois - 8.0% (5.6% of Total Investments) | | | | | | |
| | | | |
| | | | | | Chicago Board of Education, Illinois, Dedicated Capital Improvement Tax Revenue Bonds, Series 2023: | | | | | | |
| | 1,000 | | | | | 5.250%, 4/01/34 | | 4/33 at 100.00 | | | 1,025,431 | |
| | 1,055 | | | | | 5.000%, 4/01/41 | | 4/33 at 100.00 | | | 992,722 | |
| | 1,275 | | | | | 5.500%, 4/01/43 | | 4/33 at 100.00 | | | 1,256,255 | |
| | | | |
| | 2,000 | | | | | Chicago Board of Education, Illinois, General Obligation Bonds, Dedicated Revenues, Series 2021A, 5.000%, 12/01/34 | | 12/30 at 100.00 | | | 1,947,391 | |
| | | | |
| | | | | | Chicago Board of Education, Illinois, General Obligation Bonds, Dedicated Revenues, Series 2023A: | | | | | | |
| | 4,565 | | | | | 5.000%, 12/01/33, (WI/DD) | | No Opt. Call | | | 4,491,839 | |
| | 4,900 | | | | | 5.250%, 12/01/36, (WI/DD) | | 12/33 at 100.00 | | | 4,789,503 | |
| | | | |
| | 1,000 | | | | | Chicago, Illinois, Midway Airport Revenue Bonds, Refunding Second Lien Series 2014A, 5.000%, 1/01/31 | | 1/24 at 100.00 | | | 985,075 | |
| | | | |
| | | | | | Chicago, Illinois, Midway Airport Revenue Bonds, Refunding Senior Lien Series 2023A: | | | | | | |
| | 120 | | | | | 5.000%, 1/01/29 - BAM Insured, (WI/DD) | | No Opt. Call | | | 122,262 | |
| | 190 | | | | | 5.000%, 1/01/30 - BAM Insured, (WI/DD) | | No Opt. Call | | | 194,261 | |
| | 2,250 | | | | | 5.000%, 1/01/31 - BAM Insured, (WI/DD) | | No Opt. Call | | | 2,306,700 | |
| | 1,485 | | | | | 5.000%, 1/01/32 - BAM Insured, (WI/DD) | | No Opt. Call | | | 1,526,089 | |
| | | | |
| | | | | | Chicago, Illinois, O?Hare Airport Customer Facility Charge Revenue Bonds, Senior Lien Refunding Series 2023: | | | | | | |
| | 740 | | | | | 5.250%, 1/01/42 - BAM Insured | | 1/33 at 100.00 | | | 751,649 | |
| | 820 | | | | | 5.250%, 1/01/43 - BAM Insured | | 1/33 at 100.00 | | | 830,529 | |
186
| | | | | | | | | | | | |
Principal Amount (000) | | | | | Description (a) | | Optional Call Provisions (b) | | Value | |
| | | | |
| | | | | | Illinois (continued) | | | | | | |
| | $ 1,750 | | | | | Chicago, Illinois, Wastewater Transmission Revenue Bonds, Second Lien Project, Refunding Series 2023B, 5.000%, 1/01/36 - AGM Insured | | 7/32 at 100.00 | | $ | 1,841,655 | |
| | | | |
| | | | | | Chicago, Illinois, Water Revenue Bonds, Refunding Second Lien Series 2023B: | | | | | | |
| | 450 | | | | | 5.000%, 11/01/35 - AGM Insured | | 5/32 at 100.00 | | | 468,535 | |
| | 520 | | | | | 5.000%, 11/01/36 - AGM Insured | | 5/32 at 100.00 | | | 539,655 | |
| | 200 | | | | | 5.000%, 11/01/37 - AGM Insured | | 5/32 at 100.00 | | | 204,859 | |
| | 405 | | | | | 5.000%, 11/01/38 - AGM Insured | | 5/32 at 100.00 | | | 412,631 | |
| | | | |
| | 2,475 | | | | | Cook County, Illinois, Sales Tax Revenue Bonds, Series 2021A, 4.000%, 11/15/39 | | 11/30 at 100.00 | | | 2,200,275 | |
| | | | |
| | 750 | | | | | Illinois Finance Authority, Revenue Bonds, Ascension Health/fkaPresence Health Network, Series 2016C, 4.000%, 2/15/41 | | 2/27 at 100.00 | | | 661,515 | |
| | | | |
| | 240 | | | | | Illinois Finance Authority, Revenue Bonds, Dominican University, Refunding Series 2022, 5.000%, 3/01/34 | | 9/32 at 100.00 | | | 228,156 | |
| | | | |
| | 875 | | | | | Illinois Finance Authority, Revenue Bonds, Lutheran Home and Services, Series 2019A, 5.000%, 11/01/49 | | 11/26 at 103.00 | | | 649,330 | |
| | | | |
| | 815 | | | | | Illinois Finance Authority, Revenue Bonds, Northshore - Edward-Elmhurst Health Credit Group, Series 2022A, 5.000%, 8/15/47 | | 8/32 at 100.00 | | | 779,852 | |
| | | | |
| | 4,400 | | | | | Illinois State, General Obligation Bonds, Build America Taxable Bonds, Series 2010-4, 7.100%, 7/01/35 | | No Opt. Call | | | 4,449,529 | |
| | | | |
| | 1,500 | | | | | Illinois State, General Obligation Bonds, May Series 2014, 5.000%, 5/01/32 | | 5/24 at 100.00 | | | 1,472,299 | |
| | | | |
| | 2,100 | | | | | Illinois State, General Obligation Bonds, October Series 2020B, 4.000%, 10/01/33 | | 10/30 at 100.00 | | | 1,965,278 | |
| | | | |
| | 1,730 | | | | | Illinois Toll Highway Authority, Toll Highway Revenue Bonds, Senior Series 2023A, 5.250%, 1/01/43 | | 7/33 at 100.00 | | | 1,781,142 | |
| | | | |
| | | | | | Metropolitan Pier and Exposition Authority, Illinois, McCormick Place Expansion Project Bonds, Refunding Series 2022A: | | | | | | |
| | 1,290 | | | | | 0.000%, 12/15/35 | | 12/31 at 90.33 | | | 687,434 | |
| | 1,800 | | | | | 0.000%, 6/15/39 | | 12/31 at 81.66 | | | 758,800 | |
| | 1,500 | | | | | 0.000%, 6/15/40 | | 12/31 at 79.15 | | | 592,960 | |
| | 1,415 | | | | | 0.000%, 12/15/40 | | 12/31 at 78.00 | | | 543,957 | |
| | | | |
| | 5,190 | | | | | Romeoville, Will County, Illinois, Revenue Bonds, Lewis University Project, Series 2015, 5.000%, 10/01/35 | | 4/25 at 100.00 | | | 5,073,247 | |
| | | | | | Total Illinois | | | | | 46,530,815 | |
| | | | |
| | | | | | Indiana - 3.0% (2.1% of Total Investments) | | | | | | |
| | | | |
| | 1,415 | | | | | Gary Local Public Improvement Bond Bank, Indiana, Economic Development Revenue Bonds, Drexel Foundation for Educational Excellence Project, Refunding Series 2020A, 5.875%, 6/01/55, 144A | | 6/30 at 100.00 | | | 1,113,798 | |
| | | | |
| | 1,190 | | | | | Indiana Finance Authority, Educational Facilities Revenue Bonds, Depauw University Project, Series 2019, 5.000%, 7/01/37 | | 7/29 at 100.00 | | | 1,149,449 | |
| | | | |
| | 3,125 | | | | | Indiana Finance Authority, Environmental Improvement Revenue Bonds, United States Steel Corporation Project, Series 2020, 6.750%, 5/01/39, (AMT) | | 11/30 at 100.00 | | | 3,286,435 | |
| | | | |
| | 3,185 | | | | | Indiana Finance Authority, Hospital Revenue Bonds, Indiana University Health Obligation Group, Long Term Rate Series 2023B-2, 5.000%, 10/01/60, (Mandatory Put 7/01/30) | | 7/29 at 101.68 | | | 3,322,458 | |
| | | | |
| | 3,375 | | | | | Indiana Finance Authority, Hospital Revenue Bonds, Indiana University Health Obligation Group, Long Term Rate Series 2023B-3, 5.000%, 10/01/55, (Mandatory Put 7/01/32) | | 7/31 at 101.64 | | | 3,529,482 | |
187
| | |
| NDMO | | Nuveen Dynamic Municipal Opportunities Fund (continued) |
| | Portfolio of Investments October 31, 2023 |
| | | | | | | | | | | | |
Principal Amount (000) | | | | | Description (a) | | Optional Call Provisions (b) | | Value | |
| | | | |
| | | | | | Indiana (continued) | | | | | | |
| | $ 1,500 | | | | | Indianapolis Local Public Improvement Bond Bank, Indiana, Airport Authority Project Revenue Bonds, Refunding Series 2015I, 5.000%, 1/01/32, (AMT) | | 1/25 at 100.00 | | $ | 1,486,220 | |
| | | | |
| | 3,770 | | | | | Whiting, Indiana, Environmental Facilities Revenue Bonds, BP Products North America Inc. Project, Series 2015, 4.400%, 11/01/45, (AMT), (Mandatory Put 6/10/31) | | No Opt. Call | | | 3,588,070 | |
| | | | | | Total Indiana | | | | | 17,475,912 | |
| | | | |
| | | | | | Iowa - 0.6% (0.5% of Total Investments) | | | | | | |
| | | | |
| | 2,500 | | | | | Iowa Finance Authority, Iowa, Midwestern Disaster Area Revenue Bonds, Alcoa Inc. Project, Series 2012, 4.750%, 8/01/42 | | 12/23 at 100.00 | | | 2,199,550 | |
| | | | |
| | 1,745 | | | | | Iowa Finance Authority, Iowa, Midwestern Disaster Area Revenue Bonds, Iowa Fertilizer Company Project, Refunding Series 2022, 5.000%, 12/01/50, (Mandatory Put 12/01/42) | | 12/29 at 103.00 | | | 1,588,826 | |
| | | | | | Total Iowa | | | | | 3,788,376 | |
| | | | |
| | | | | | Kentucky - 1.3% (0.9% of Total Investments) | | | | | | |
| | | | |
| | 3,000 | | | | | Bell County, Kentucky, Special Assessment Industrial Building Revenue Bonds, Boone’s Ridge Project, Series 2020, 6.000%, 12/01/40 | | 12/30 at 100.00 | | | 2,482,538 | |
| | | | |
| | 2,175 | | | | | Carroll County, Kentucky, Environmental Facilities Revenue Bonds, Kentucky Utilities Company Project, Refunding Series 2006B, 2.125%, 10/01/34, (AMT) | | 6/31 at 100.00 | | | 1,504,108 | |
| | | | |
| | 1,000 | | | | | Newport, Kentucky, Special Obligation Revenue Bonds, Newport Clifton Project, Series 2020B, 5.500%, 12/01/60 | | 12/30 at 100.00 | | | 741,000 | |
| | | | |
| | 3,000 | | | | | Public Energy Authority of Kentucky, Gas Supply Revenue Bonds, Series 2018A, 4.000%, 4/01/48, (Mandatory Put 4/01/24) | | 1/24 at 100.37 | | | 2,985,803 | |
| | | | | | Total Kentucky | | | | | 7,713,449 | |
| | | | |
| | | | | | Louisiana - 1.0% (0.7% of Total Investments) | | | | | | |
| | | | |
| | 1,150 | | | | | Louisiana Publc Facilities Authority, Lousiana, Revenue Bonds, Lincoln Preparatory School Project, Series 2021A, 5.250%, 6/01/51, 144A | | 6/31 at 100.00 | | | 862,989 | |
| | | | |
| | 2,720 | | | | | Louisiana Stadium and Exposition District, Revenue Bonds, Senior Series 2023A, 5.000%, 7/01/43 | | 7/33 at 100.00 | | | 2,733,840 | |
| | | | |
| | 2,000 | | | | | Saint James Parish, Louisiana, Revenue Bonds, NuStar Logistics, L.P. Project, Series 2010, 6.350%, 7/01/40, 144A | | 6/30 at 100.00 | | | 2,099,437 | |
| | | | | | Total Louisiana | | | | | 5,696,266 | |
| | | | |
| | | | | | Maryland - 0.0% (0.0% of Total Investments) | | | | | | |
| | | | |
| | 200 | | | | | Baltimore, Maryland, Special Obligation Bonds, Harbor Point Project, Refunding Series 2022, 4.500%, 6/01/33, 144A | | 6/31 at 100.00 | | | 186,567 | |
| | | | | | Total Maryland | | | | | 186,567 | |
| | | | |
| | | | | | Massachusetts - 0.4% (0.3% of Total Investments) | | | | | | |
| | | | |
| | | | | | Massachusetts Development Finance Agency, Revenue Bonds, Northeastern University, Series 2022: | | | | | | |
| | 395 | | | | | 5.000%, 10/01/39 | | 10/32 at 100.00 | | | 414,055 | |
| | 2,060 | | | | | 5.000%, 10/01/41 | | 10/32 at 100.00 | | | 2,142,249 | |
| | | | | | Total Massachusetts | | | | | 2,556,304 | |
| | | | |
| | | | | | Michigan - 2.5% (1.7% of Total Investments) | | | | | | |
| | | | |
| | 5,000 | | | | | Detroit, Wayne County, Michigan, General Obligation Bonds, Financial Recovery Series 2014B-1, 4.000%, 4/01/44 | | 12/23 at 100.00 | | | 3,408,519 | |
| | | | |
| | 710 | | | | | Gerald R. Ford International Airport Authority, Kent County, Michigan, Revenue Bonds, Limited Tax General Obligation Series 2021, 5.000%, 1/01/46, (AMT) | | 1/32 at 100.00 | | | 693,094 | |
188
| | | | | | | | | | | | |
Principal Amount (000) | | | | | Description (a) | | Optional Call Provisions (b) | | Value | |
| | | | |
| | | | | | Michigan (continued) | | | | | | |
| | | | | | Michigan State, Trunk Line Fund Bonds, Rebuilding Michigan Program, Series 2023: | | | | | | |
| | $ 4,500 | | | | | 5.000%, 11/15/41 | | 11/33 at 100.00 | | $ | 4,699,598 | |
| | 4,500 | | | | | 5.000%, 11/15/42 | | 11/33 at 100.00 | | | 4,675,428 | |
| | | | |
| | 1,070 | | | | | Wayne County Airport Authority, Michigan, Revenue Bonds, Detroit Metropolitan Wayne County Airport, Series 2023B, 5.250%, 12/01/37 - AGM Insured, (AMT) | | 12/33 at 100.00 | | | 1,098,861 | |
| | | | | | Total Michigan | | | | | 14,575,500 | |
| | | | |
| | | | | | Minnesota - 1.1% (0.8% of Total Investments) | | | | | | |
| | | | |
| | 2,325 | | | | | Minneapolis, Minnesota, Health Care System Revenue Bonds, Allina Health System, Series 2023B, 5.000%, 11/15/53, (Mandatory Put 11/15/30) | | 11/29 at 101.75 | | | 2,407,095 | |
| | | | |
| | 3,745 | | | | | Saint Paul Housing & Redevelopment Authority, Minnesota, Charter School Lease Revenue Bonds, Community School of Excellence, Series 2023, 5.500%, 3/01/53, 144A | | 3/33 at 100.00 | | | 3,166,749 | |
| | | | |
| | 1,140 | | | | | Saint Paul Housing & Redevelopment Authority, Minnesota, Charter School Lease Revenue Bonds, Hope Community Academy Project, Series 2020A, 5.000%, 12/01/55 | | 12/28 at 102.00 | | | 845,393 | |
| | | | | | Total Minnesota | | | | | 6,419,237 | |
| | | | |
| | | | | | Missouri - 1.2% (0.8% of Total Investments) | | | | | | |
| | | | |
| | 180 | | | | | Cape Girardeau County Industrial Development Authority, Missouri, Health Facilities Revenue Bonds, Southeasthealth, Series 2021, 4.000%, 3/01/41 | | 3/31 at 100.00 | | | 146,109 | |
| | | | |
| | 1,100 | | | | | M150 and 135th Street Transporation Development District, Kansas City, Missouri, Transportation Sales Tax Revenue Bonds, Series 2020A, 4.250%, 10/01/43 | | 10/27 at 100.00 | | | 838,589 | |
| | | | |
| | 3,000 | | | | | Missouri Health and Educational Facilities Authority, Health Facilities Revenue Bonds, Mercy Health, Series 2014F, 4.000%, 11/15/45 | | 11/24 at 100.00 | | | 2,487,160 | |
| | | | |
| | | | | | Saint Louis Municipal Finance Corporation, Missouri, Leasehold Revenue Bonds, Convention Center, Expansion & Improvement Projects Series 2020: | | | | | | |
| | 1,000 | | | | | 5.000%, 10/01/40 - AGM Insured | | 10/30 at 100.00 | | | 1,012,912 | |
| | 2,625 | | | | | 5.000%, 10/01/45 - AGM Insured | | 10/30 at 100.00 | | | 2,613,254 | |
| | | | | | Total Missouri | | | | | 7,098,024 | |
| | | | |
| | | | | | Montana - 0.3% (0.2% of Total Investments) | | | | | | |
| | | | |
| | 1,975 | | | | | Forsyth, Rosebud County, Montana, Pollution Control Revenue Refunding Bonds, Northwestern Corporation Colstrip Project, Series 2023, 3.875%, 7/01/28 | | 4/28 at 100.00 | | | 1,888,204 | |
| | | | | | Total Montana | | | | | 1,888,204 | |
| | | | |
| | | | | | Nebraska - 0.6% (0.4% of Total Investments) | | | | | | |
| | | | |
| | 3,750 | | | | | Central Plains Energy Project, Nebraska, Gas Project Revenue Bonds, Project 5, Series 2022-1, 5.000%, 5/01/53, (Mandatory Put 10/01/29) | | 7/29 at 100.22 | | | 3,708,046 | |
| | | | | | Total Nebraska | | | | | 3,708,046 | |
| | | | |
| | | | | | Nevada - 0.1% (0.1% of Total Investments) | | | | | | |
| | | | |
| | 2,000 | | | (f) | | Director of Nevada State Department of Business & Industry, Environmental Improvement Revenue Bonds, Fulcrum Sierra BioFuels LLC Project, Green Series 2020, 6.750%, 2/15/38, 144A | | 2/31 at 100.00 | | | 201,600 | |
| | | | |
| | 445 | | | | | Las Vegas, Nevada, Local Improvement Bonds, Special Improvement District 611 Sunstone Phase I and II, Series 2020, 4.000%, 6/01/40 | | 6/30 at 100.00 | | | 353,107 | |
| | | | | | Total Nevada | | | | | 554,707 | |
189
| | |
| NDMO | | Nuveen Dynamic Municipal Opportunities Fund (continued) |
| | Portfolio of Investments October 31, 2023 |
| | | | | | | | | | | | |
Principal Amount (000) | | | | | Description (a) | | Optional Call Provisions (b) | | Value | |
| | | | |
| | | | | | New Hampshire - 0.2% (0.1% of Total Investments) | | | | | | |
| | | | |
| | $ 1,250 | | | | | New Hampshire Health and Education Facilities Authority, Revenue Bonds, Catholic Medical Center, Series 2017, 3.750%, 7/01/40 | | 7/27 at 100.00 | | $ | 881,436 | |
| | | | | | Total New Hampshire | | | | | 881,436 | |
| | | | |
| | | | | | New Jersey - 1.1% (0.7% of Total Investments) | | | | | | |
| | | | |
| | 1,685 | | | | | New Jersey Economic Development Authority, Energy Facilities Revenue Bonds, UMM Energy Partners, LLC Project, Series 2012A, 7.000%, 6/15/30, 144A | | 12/23 at 100.00 | | | 1,685,648 | |
| | | | |
| | 750 | | | | | New Jersey Economic Development Authority, Revenue Bonds, Motor Vehicle Surcharge, Refunding Subordinate Series 2017A, 3.375%, 7/01/30 | | 7/27 at 100.00 | | | 675,782 | |
| | | | |
| | 750 | | | | | New Jersey Economic Development Authority, Water Facilities Revenue Bonds, New Jersey-American Water Company Inc. Project, Refunding Series 2020B, 3.750%, 11/01/34, (AMT), (Mandatory Put 6/01/28) | | No Opt. Call | | | 705,150 | |
| | | | |
| | | | | | New Jersey Educational Facilities Authority, Revenue Bonds, Higher Education Capital Improvement Fund Series 2023A: | | | | | | |
| | 665 | | | | | 5.000%, 9/01/34 | | 3/33 at 100.00 | | | 698,690 | |
| | 445 | | | | | 5.000%, 9/01/36 | | 3/33 at 100.00 | | | 461,046 | |
| | 445 | | | | | 5.000%, 9/01/39 | | 3/33 at 100.00 | | | 451,453 | |
| | | | |
| | 3,665 | | | | | New Jersey Transportation Trust Fund Authority, Transportation System Bonds, Series 2009A, 0.000%, 12/15/39 | | No Opt. Call | | | 1,548,334 | |
| | | | | | Total New Jersey | | | | | 6,226,103 | |
| | | | |
| | | | | | New Mexico - 1.0% (0.7% of Total Investments) | | | | | | |
| | | | |
| | 7,000 | | | | | Winrock Town Center Tax Increment Development District 1, Albuquerque, New Mexico, Gross Receipts Tax Increment Bonds, Subordinate Lien Series 2020, 8.000%, 5/01/40, 144A | | 12/23 at 103.00 | | | 5,933,012 | |
| | | | | | Total New Mexico | | | | | 5,933,012 | |
| | | | |
| | | | | | New York - 19.7% (13.8% of Total Investments) | | | | | | |
| | | | |
| | 1,240 | | | | | Build NYC Resource Corporation, New York, Revenue Bonds, Albert Einstein College of Medicine, Inc, Series 2023, 7.250%, 6/01/55, 144A | | 12/30 at 100.00 | | | 1,145,347 | |
| | | | |
| | 5,000 | | | | | Build NYC Resource Corporation, New York, Revenue Bonds, Family Life Academy Charter School, Series 2020A-1, 5.500%, 6/01/55, 144A | | 12/30 at 100.00 | | | 3,607,723 | |
| | | | |
| | | | | | Build NYC Resource Corporation, New York, Revenue Bonds, Family Life Academy Charter School, Series 2020C-1: | | | | | | |
| | 1,310 | | | | | 5.000%, 6/01/40, 144A | | 12/30 at 100.00 | | | 1,000,016 | |
| | 3,000 | | | | | 5.000%, 6/01/55, 144A | | 12/30 at 100.00 | | | 1,991,386 | |
| | | | |
| | 10,000 | | | | | Dormitory Authority of the State of New York, Revenue Bonds, Catholic Health System Obligated Group Series 2019A, 4.000%, 7/01/45 | | 7/29 at 100.00 | | | 6,662,227 | |
| | | | |
| | | | | | Dutchess County Local Development Corporation, New York, Revenue Bonds, Health Quest Systems, Inc. Project, Series 2016B: | | | | | | |
| | 7,630 | | | | | 5.000%, 7/01/32 | | 7/26 at 100.00 | | | 7,529,768 | |
| | 1,095 | | | | | 5.000%, 7/01/35 | | 7/26 at 100.00 | | | 1,066,233 | |
| | | | |
| | | | | | Long Island Power Authority, New York, Electric System General Revenue Bonds, Green Series 2023E: | | | | | | |
| | 490 | | | | | 5.000%, 9/01/41 | | 9/33 at 100.00 | | | 499,247 | |
| | 620 | | | | | 5.000%, 9/01/42 | | 9/33 at 100.00 | | | 628,046 | |
| | 1,000 | | | | | 5.000%, 9/01/43 | | 9/33 at 100.00 | | | 1,009,431 | |
| | | | |
| | 2,500 | | | | | Metropolitan Transportation Authority, New York, Transportation Revenue Bonds, Series 2014B, 5.250%, 11/15/36 | | 5/24 at 100.00 | | | 2,502,344 | |
| | | | |
| | 10,000 | | | | | Metropolitan Transportation Authority, New York, Transportation Revenue Bonds, Series 2014D-1, 5.250%, 11/15/44 | | 11/24 at 100.00 | | | 9,924,295 | |
190
| | | | | | | | | | | | |
Principal
Amount (000) | | | | | Description (a) | | Optional Call
Provisions (b) | | Value | |
| | | | |
| | | | | | New York (continued) | | | | | | |
| | | | | | New York City Transitional Finance Authority, New York, Future Tax Secured Bonds, Subordinate Fiscal 2023 Series A-1: | | | | | | |
| | $ 2,785 | | | | | 5.250%, 8/01/42 | | 8/32 at 100.00 | | $ | 2,895,145 | |
| | 4,640 | | | | | 5.000%, 8/01/43 | | 8/32 at 100.00 | | | 4,721,212 | |
| | | | |
| | 840 | | | | | New York City Transitional Finance Authority, New York, Future Tax Secured Bonds, Subordinate Fiscal Series 2023F-1, 5.250%, 2/01/40 | | 2/33 at 100.00 | | | 882,527 | |
| | | | |
| | 1,000 | | | | | New York City, New York, General Obligation Bonds, Fiscal 2023 Series 1, 5.000%, 8/01/35 | | 8/33 at 100.00 | | | 1,076,540 | |
| | | | |
| | | | | | New York City, New York, General Obligation Bonds, Fiscal 2024 Series A: | | | | | | |
| | 845 | | | | | 5.000%, 8/01/35 | | 8/33 at 100.00 | | | 909,676 | |
| | 485 | | | | | 5.000%, 8/01/36 | | 8/33 at 100.00 | | | 516,388 | |
| | 675 | | | | | 5.000%, 8/01/40 | | 8/33 at 100.00 | | | 693,668 | |
| | 770 | | | | | 5.000%, 8/01/41 | | 8/33 at 100.00 | | | 788,020 | |
| | 385 | | | | | 5.000%, 8/01/42 | | 8/33 at 100.00 | | | 392,037 | |
| | 965 | | | | | 5.000%, 8/01/43 | | 8/33 at 100.00 | | | 978,906 | |
| | 1,215 | | | | | 5.000%, 8/01/44 | | 8/33 at 100.00 | | | 1,227,051 | |
| | 1,250 | | | | | 5.000%, 8/01/45 | | 8/33 at 100.00 | | | 1,257,029 | |
| | | | |
| | | | | | New York City, New York, General Obligation Bonds, Reoffering Fiscal 2012 Series G-5: | | | | | | |
| | 620 | | | | | 5.000%, 4/01/34 | | 10/33 at 100.00 | | | 672,983 | |
| | 535 | | | | | 5.000%, 4/01/35 | | 10/33 at 100.00 | | | 577,856 | |
| | 1,070 | | | | | 5.000%, 4/01/36 | | 10/33 at 100.00 | | | 1,144,639 | |
| | 495 | | | | | 5.000%, 4/01/37 | | 10/33 at 100.00 | | | 523,160 | |
| | 605 | | | | | 5.000%, 4/01/38 | | 10/33 at 100.00 | | | 631,024 | |
| | 450 | | | | | 5.000%, 4/01/39 | | 10/33 at 100.00 | | | 466,452 | |
| | 505 | | | | | 5.000%, 4/01/40 | | 10/33 at 100.00 | | | 519,172 | |
| | | | |
| | 260 | | | | | New York State Environmental Facilities Corporation, Solid Waste Disposal Revenue Bonds, Casella Waste Systems, Inc. Project, Series 2020R-2, 5.125%, 9/01/50, (AMT), (Mandatory Put 9/03/30), 144A | | 6/30 at 100.00 | | | 251,185 | |
| | | | |
| | 635 | | | | | New York State Power Authority, Green Transmission Project Revenue Bonds, Green Series 2023A, 5.250%, 11/15/43 - AGM Insured, (WI/DD) | | 11/33 at 100.00 | | | 664,475 | |
| | | | |
| | | | | | New York State Thruway Authority, State Personal Income Tax Revenue Bonds, Bidding Group 1 Series 2022A: | | | | | | |
| | 1,905 | | | | | 5.000%, 3/15/39 | | 9/32 at 100.00 | | | 1,960,235 | |
| | 640 | | | | | 5.000%, 3/15/41 | | 9/32 at 100.00 | | | 652,036 | |
| | | | |
| | 2,500 | | | | | New York Transportation Development Corporation, New York, Special Facilities Bonds, LaGuardia Airport Terminal B Redevelopment Project, Series 2016A, 5.000%, 7/01/41, (AMT) | | 7/24 at 100.00 | | | 2,374,039 | |
| | | | |
| | | | | | New York Transportation Development Corporation, New York, Special Facility Revenue Bonds, American Airlines, Inc. John F Kennedy International Airport Project, Series 2020: | | | | | | |
| | 10,240 | | | | | 5.250%, 8/01/31, (AMT) | | 8/30 at 100.00 | | | 10,230,199 | |
| | 3,400 | | | | | 5.375%, 8/01/36, (AMT) | | 8/30 at 100.00 | | | 3,294,535 | |
| | | | |
| | | | | | New York Transportation Development Corporation, Special Facility Revenue Bonds, Delta Air Lines, Inc. - LaGuardia Airport Terminals C&D Redevelopment Project, Series 2020: | | | | | | |
| | 1,000 | | | | | 4.000%, 10/01/30, (AMT) | | No Opt. Call | | | 920,088 | |
| | 3,000 | | | | | 5.000%, 10/01/40, (AMT) | | 10/30 at 100.00 | | | 2,734,332 | |
| | | | |
| | | | | | New York Transportation Development Corporation, Special Facility Revenue Bonds, Delta Air Lines, Inc. - LaGuardia Airport Terminals C&D Redevelopment Project, Series 2023: | | | | | | |
| | 1,600 | | | | | 6.000%, 4/01/35, (AMT) | | 4/31 at 100.00 | | | 1,657,897 | |
| | 2,805 | | | | | 5.625%, 4/01/40, (AMT) | | 4/31 at 100.00 | | | 2,794,437 | |
191
| | |
| NDMO | | Nuveen Dynamic Municipal Opportunities Fund (continued) |
| | Portfolio of Investments October 31, 2023 |
| | | | | | | | | | | | |
Principal
Amount (000) | | | | | Description (a) | | Optional Call
Provisions (b) | | Value | |
| | | | |
| | | | | | New York (continued) | | | | | | |
| | | | | | Port Authority of New York and New Jersey, Consolidated Revenue Bonds, Two Hundred Forty Second Series 2023: | | | | | | |
| | $ 1,235 | | | | | 5.000%, 12/01/34, (AMT) | | 12/33 at 100.00 | | $ | 1,288,308 | |
| | 1,135 | | | | | 5.000%, 12/01/37, (AMT) | | 12/33 at 100.00 | | | 1,140,573 | |
| | 1,000 | | | | | 5.000%, 12/01/39, (AMT) | | 12/33 at 100.00 | | | 995,861 | |
| | 3,100 | | | | | 5.000%, 12/01/41, (AMT) | | 12/33 at 100.00 | | | 3,057,394 | |
| | | | |
| | | | | | Port Authority of New York and New Jersey, Consolidated Revenue Bonds, Two Hundred Thirty-Eighth Series 2023: | | | | | | |
| | 2,250 | | | | | 5.000%, 7/15/34, (AMT) | | 7/33 at 100.00 | | | 2,347,850 | |
| | 565 | | | | | 5.000%, 7/15/35, (AMT) | | 7/33 at 100.00 | | | 585,732 | |
| | 490 | | | | | 5.000%, 7/15/37, (AMT) | | 7/33 at 100.00 | | | 494,477 | |
| | 1,450 | | | | | 5.000%, 7/15/38, (AMT) | | 7/33 at 100.00 | | | 1,450,118 | |
| | 590 | | | | | 5.000%, 7/15/39, (AMT) | | 7/33 at 100.00 | | | 587,576 | |
| | | | |
| | 3,960 | | | | | Syracuse Industrial Development Authority, New York, PILOT Revenue Bonds, Carousel Center Project, Taxable Series 2007B, 5.693%, 1/01/28 - SYNCORA GTY Insured, 144A | | No Opt. Call | | | 3,444,635 | |
| | | | |
| | | | | | Triborough Bridge and Tunnel Authority, New York, General Revenue Bonds, MTA Bridges & Tunnels, Series 2023B-1: | | | | | | |
| | 440 | | | | | 5.000%, 11/15/39 | | 11/33 at 100.00 | | | 453,746 | |
| | 790 | | | | | 5.000%, 11/15/44 | | 11/33 at 100.00 | | | 791,839 | |
| | 785 | | | | | 5.000%, 11/15/45 | | 11/33 at 100.00 | | | 785,249 | |
| | | | |
| | | | | | Triborough Bridge and Tunnel Authority, New York, Payroll Mobility Tax Bonds, MTA Bridges and Tunnels, Refunding Senior Lien Green Climate Bond Certified Series 2023C: | | | | | | |
| | 3,225 | | | | | 5.000%, 11/15/36 | | 11/33 at 100.00 | | | 3,429,985 | |
| | 3,225 | | | | | 5.000%, 11/15/38 | | 11/33 at 100.00 | | | 3,362,500 | |
| | 2,330 | | | | | 5.250%, 11/15/40 | | 11/33 at 100.00 | | | 2,448,105 | |
| | 2,325 | | | | | 5.250%, 11/15/42 | | 11/33 at 100.00 | | | 2,425,873 | |
| | | | | | Total New York | | | | | 115,062,827 | |
| | | | |
| | | | | | North Carolina - 0.2% (0.1% of Total Investments) | | | | | | |
| | | | |
| | | | | | Greater Asheville Regional Airport Authority, North Carolina, Airport System Revenue Bonds, Series 2023: | | | | | | |
| | 335 | | | | | 5.250%, 7/01/41 - AGM Insured, (AMT) | | 7/33 at 100.00 | | | 337,829 | |
| | 340 | | | | | 5.250%, 7/01/43 - AGM Insured, (AMT) | | 7/33 at 100.00 | | | 340,433 | |
| | | | |
| | 370 | | | | | North Carolina Medical Care Commission, Retirement Facilities First Mortgage Revenue Bonds, The Forest at Duke, Inc., Series 2021, 4.000%, 9/01/46 | | 9/28 at 103.00 | | | 267,317 | |
| | | | | | Total North Carolina | | | | | 945,579 | |
| | | | |
| | | | | | Ohio - 3.1% (2.2% of Total Investments) | | | | | | |
| | | | |
| | 2,000 | | | | | Buckeye Tobacco Settlement Financing Authority, Ohio, Tobacco Settlement Asset-Backed Revenue Bonds, Refunding Senior Lien Series 2020B-2 Class 2, 5.000%, 6/01/55 | | 6/30 at 100.00 | | | 1,638,389 | |
| | | | |
| | 675 | | | | | Butler County, Ohio, Hospital Facilities Revenue Bonds, UC Health, Refunding Series 2017, 4.000%, 11/15/23 | | No Opt. Call | | | 674,504 | |
| | | | |
| | 1,000 | | | | | Ohio Air Quality Development Authority, Ohio, Pollution Control Revenue Bonds, FirstEnergy Generation Corporation Project, Refunding Series 2009D, 3.375%, 8/01/29, (Mandatory Put 9/15/21) | | No Opt. Call | | | 880,982 | |
| | | | |
| | 21,000 | | | | | Southern Ohio Port Authority, Ohio, Facility Revenue Bonds, Purecycle Project, Series 2020A, 7.000%, 12/01/42, (AMT), 144A | | 12/27 at 103.00 | | | 14,142,942 | |
| | | | |
| | 1,000 | | | | | Southern Ohio Port Authority, Ohio, Facility Revenue Bonds, Purecycle Project, Series 2020B, 10.000%, 12/01/27, (AMT), 144A | | 12/26 at 105.00 | | | 598,507 | |
| | | | | | Total Ohio | | | | | 17,935,324 | |
192
| | | | | | | | | | | | |
Principal
Amount (000) | | | | | Description (a) | | Optional Call
Provisions (b) | | Value | |
| | | | |
| | | | | | Oklahoma - 0.2% (0.2% of Total Investments) | | | | | | |
| | | | |
| | $ 1,500 | | | | | Oklahoma Development Finance Authority, Health System Revenue Bonds, OU Medicine Project, Taxable Series 2018D, 5.450%, 8/15/28 | | No Opt. Call | | $ | 1,290,894 | |
| | | | | | Total Oklahoma | | | | | 1,290,894 | |
| | | | |
| | | | | | Pennsylvania - 4.0% (2.8% of Total Investments) | | | | | | |
| | | | |
| | | | | | Allegheny County Airport Authority, Pennsylvania, Airport Revenue Bonds, Pittsburgh International Airport, Series 2023A: | | | | | | |
| | 700 | | | | | 5.250%, 1/01/39 - AGM Insured, (AMT) | | 1/33 at 100.00 | | | 705,139 | |
| | 700 | | | | | 5.500%, 1/01/43 - AGM Insured, (AMT) | | 1/33 at 100.00 | | | 716,532 | |
| | | | |
| | 1,000 | | | | | Allegheny County Hospital Development Authority, Pennsylvania, Revenue Bonds, University of Pittsburgh Medical Center, Series 2019A, 4.000%, 7/15/37 | | 7/29 at 100.00 | | | 901,892 | |
| | | | |
| | 930 | | | | | Allentown Neighborhood Improvement Zone Development Authority, Pennsylvania, Tax Revenue Bonds, 615 Waterfront Project, Senior Series 2021, 6.000%, 5/01/42, 144A | | 5/31 at 100.00 | | | 907,698 | |
| | | | |
| | 3,000 | | | | | Allentown Neighborhood Improvement Zone Development Authority, Pennsylvania, Tax Revenue Bonds, City Center Refunding Project, Series 2017, 5.000%, 5/01/42, 144A | | 5/27 at 100.00 | | | 2,749,012 | |
| | | | |
| | 500 | | | | | Beaver County Industrial Development Authority, Pennsylvania, Pollution Control Revenue Refunding Bonds, FirstEnergy Generation Project, Series 2008B, 3.750%, 10/01/47 | | 4/31 at 100.00 | | | 334,134 | |
| | | | |
| | 1,000 | | | | | Dauphin County General Authority, Pennsylvania, Revenue Bonds, Harrisburg University of Science & Technology Project, Series 2017, 5.125%, 10/15/41, 144A | | 10/27 at 100.00 | | | 724,706 | |
| | | | |
| | 2,000 | | | | | Dauphin County General Authority, Pennsylvania, Revenue Bonds, Harrisburg University of Science & Technology Project, Series 2020, 6.250%, 10/15/53, 144A | | 10/28 at 100.00 | | | 1,536,772 | |
| | | | |
| | 9,000 | | | | | Geisinger Authority, Montour County, Pennsylvania, Health System Revenue Bonds, Geisinger Health System, Series 2017A-2, 5.000%, 2/15/39 | | 2/27 at 100.00 | | | 8,877,664 | |
| | | | |
| | 3,000 | | | | | Montgomery County Industrial Development Authority, Pennsylvania, Facilities Revenue Bonds, Constellation Energy Generation LLC Project, Refunding Series 2023A, 4.100%, 10/01/53, (Mandatory Put 4/03/28) | | No Opt. Call | | | 2,937,013 | |
| | | | |
| | 1,300 | | | (c),(f) | | Pennsylvania Economic Development Financing Authority, Exempt Facilities Revenue Bonds, KDC Agribusiness Fairless Hills LLC Project, Series 2021A, 10.000%, 12/01/31 | | No Opt. Call | | | 130 | |
| | | | |
| | 2,960 | | | | | Pennsylvania Economic Development Financing Authority, Parking System Revenue Bonds, Capitol Region Parking System, Junior Guaranteed Series 2013B, 0.000%, 1/01/45 - BAM Insured | | No Opt. Call | | | 894,382 | |
| | | | |
| | 2,040 | | | | | Pennsylvania Economic Development Financing Authority, Revenue Bonds, University of Pittsburgh Medical Center, Series 2017A, 4.000%, 11/15/42 | | 11/27 at 100.00 | | | 1,719,283 | |
| | | | |
| | | | | | Pennsylvania Turnpike Commission, Turnpike Revenue Bonds, Series 2022B: | | | | | | |
| | 30 | | | | | 5.250%, 12/01/41 | | 12/32 at 100.00 | | | 31,310 | |
| | 485 | | | | | 5.250%, 12/01/42 | | 12/32 at 100.00 | | | 503,241 | |
| | | | | | Total Pennsylvania | | | | | 23,538,908 | |
| | | | |
| | | | | | Puerto Rico - 4.5% (3.2% of Total Investments) | | | | | | |
| | | | |
| | 409 | | | | | HTA Claas 6, Puerto Rico Highway and Transportation Authority Highway Revenue Bonds, Series 2022, 5.250%, 7/01/38 | | 11/23 at 100.00 | | | 409,402 | |
193
| | |
| NDMO | | Nuveen Dynamic Municipal Opportunities Fund (continued) |
| | Portfolio of Investments October 31, 2023 |
| | | | | | | | | | | | |
Principal
Amount (000) | | | | | Description (a) | | Optional Call
Provisions (b) | | Value | |
| | | | |
| | | | | | Puerto Rico (continued) | | | | | | |
| | | | | | Puerto Rico Aqueduct and Sewerage Authority, Revenue Bonds, Refunding Senior Lien Series 2021B: | | | | | | |
| | $ 3,500 | | | | | 5.000%, 7/01/37, 144A | | 7/31 at 100.00 | | $ | 3,300,760 | |
| | 6,500 | | | | | 4.000%, 7/01/42, 144A | | 7/31 at 100.00 | | | 5,207,995 | |
| | | | |
| | 8,000 | | | (c),(f) | | Puerto Rico Electric Power Authority, Power Revenue Bonds, Series 2010XX, 5.250%, 7/01/40 | | 12/23 at 100.00 | | | 2,157,252 | |
| | | | |
| | 3,065 | | | | | Puerto Rico Highway and Transportation Authority, Restructured Toll Revenue Bonds, Series 2022A, 5.000%, 7/01/62 | | 7/32 at 100.00 | | | 3,026,688 | |
| | | | |
| | 2,150 | | | | | Puerto Rico Sales Tax Financing Corporation, Sales Tax Revenue Bonds, Restructured 2018A-1, 4.550%, 7/01/40 | | 7/28 at 100.00 | | | 1,913,748 | |
| | | | |
| | 6,000 | | | | | Puerto Rico, GDB Debt Recovery Authority Commonwealth Bonds, Taxable Series 2018, 7.500%, 8/20/40 | | No Opt. Call | | | 4,905,000 | |
| | | | |
| | | | | | Puerto Rico, General Obligation Bonds, Restructured Series 2022A-1: | | | | | | |
| | 1,030 | | | | | 0.000%, 7/01/33 | | 7/31 at 89.94 | | | 589,683 | |
| | 0 | | | (g) | | 4.000%, 7/01/35 | | 7/31 at 103.00 | | | 54 | |
| | 1,117 | | | | | 4.000%, 7/01/37 | | 7/31 at 103.00 | | | 909,810 | |
| | 839 | | | | | 4.000%, 7/01/41 | | 7/31 at 103.00 | | | 649,343 | |
| | | | |
| | 6,474 | | | | | Puerto Rico, General Obligation Bonds, Vintage CW NT Claims Taxable Series 2022, 0.000%, 11/01/43 | | No Opt. Call | | | 3,229,067 | |
| | | | | | Total Puerto Rico | | | | | 26,298,802 | |
| | | | |
| | | | | | South Carolina - 0.3% (0.2% of Total Investments) | | | | | | |
| | | | |
| | 1,000 | | | | | South Carolina Jobs-Economic Development Authority, Educational Facilities Revenue Bonds, Columbia College, Refunding Series 2020A, 5.625%, 10/01/40 | | 10/27 at 103.00 | | | 881,072 | |
| | | | |
| | 1,000 | | | | | South Carolina Jobs-Economic Development Authority, Educational Facilities Revenue Bonds, Horse Creek Academy Project, Series 2021A, 5.000%, 11/15/55, 144A | | 11/26 at 100.00 | | | 780,198 | |
| | | | | | Total South Carolina | | | | | 1,661,270 | |
| | | | |
| | | | | | Tennessee - 3.6% (2.5% of Total Investments) | | | | | | |
| | | | |
| | 7,250 | | | | | Johnson City Health and Educational Facilities Board, Tennessee, Revenue Bonds, Ballad Health, Long Term Interest Rate Series 2023B, 5.000%, 7/01/33 | | No Opt. Call | | | 7,544,374 | |
| | | | |
| | | | | | Metropolitan Government of Nashville and Davidson County Sports Authority, Tennessee, Revenue Bonds, Stadium Project, Subordinate Senior Series 2023A: | | | | | | |
| | 665 | | | | | 5.000%, 7/01/36 - AGM Insured | | 1/34 at 100.00 | | | 706,820 | |
| | 525 | | | | | 5.000%, 7/01/37 - AGM Insured | | 1/34 at 100.00 | | | 549,506 | |
| | 675 | | | | | 5.000%, 7/01/39 - AGM Insured | | 1/34 at 100.00 | | | 694,611 | |
| | 1,895 | | | | | 5.000%, 7/01/40 - AGM Insured | | 1/34 at 100.00 | | | 1,943,010 | |
| | 1,345 | | | | | 5.000%, 7/01/41 - AGM Insured | | 1/34 at 100.00 | | | 1,372,093 | |
| | 1,650 | | | | | 5.000%, 7/01/42 - AGM Insured | | 1/34 at 100.00 | | | 1,673,211 | |
| | | | |
| | 650 | | | | | Metropolitan Government of Nashville-Davidson County Health and Educational Facilities Board, Tennessee, Revenue Bonds, Belmont University, Series 2023, 5.000%, 5/01/40 | | 5/33 at 100.00 | | | 648,519 | |
| | | | |
| | | | | | Metropolitan Government of Nashville-Davidson County Health and Educational Facilities Board, Tennessee, Revenue Bonds, Vanderbilt University, Series 2023A: | | | | | | |
| | 2,705 | | | | | 5.000%, 7/01/28, (WI/DD) | | No Opt. Call | | | 2,799,976 | |
| | 2,905 | | | | | 5.000%, 7/01/33, (WI/DD) | | No Opt. Call | | | 3,046,012 | |
| | | | | | Total Tennessee | | | | | 20,978,132 | |
194
| | | | | | | | | | | | |
Principal
Amount (000) | | | | | Description (a) | | Optional Call
Provisions (b) | | Value | |
| | | | |
| | | | | | Texas - 14.5% (10.2% of Total Investments) | | | | | | |
| | | | |
| | $ 500 | | | | | Abilene Convention Center Hotel Development Corporation, Texas, Hotel Revenue Bonds, Second-Lien Series 2021B, 5.000%, 10/01/50, 144A | | 10/31 at 100.00 | | $ | 375,449 | |
| | | | |
| | 755 | | | | | Bexar County, Texas, Venue Project Revenue Bonds, Taxable Refunding Combined Venue Tax Series 2021, 3.031%, 8/15/41 - AGM Insured | | 8/31 at 100.00 | | | 509,302 | |
| | | | |
| | 225 | | | | | City of Midlothian, Texas, Westside Preserve Public Improvement District Improvement Area #1 Project, Special Assessment Revenue Bonds, Series 2022, 4.750%, 9/15/32, 144A | | No Opt. Call | | | 208,194 | |
| | | | |
| | | | | | Crowley Independent School District, Tarrant and Johnson Counties, Texas, General Obligation Bonds, School Building Series 2023: | | | | | | |
| | 545 | | | | | 5.000%, 2/01/33 | | No Opt. Call | | | 592,347 | |
| | 535 | | | | | 5.000%, 2/01/34 | | 2/33 at 100.00 | | | 580,747 | |
| | 450 | | | | | 5.000%, 2/01/35 | | 2/33 at 100.00 | | | 486,362 | |
| | 900 | | | | | 5.000%, 2/01/36 | | 2/33 at 100.00 | | | 965,331 | |
| | 455 | | | | | 5.000%, 2/01/39 | | 2/33 at 100.00 | | | 474,367 | |
| | 530 | | | | | 5.000%, 2/01/40 | | 2/33 at 100.00 | | | 550,174 | |
| | 575 | | | | | 5.000%, 2/01/41 | | 2/33 at 100.00 | | | 594,458 | |
| | 665 | | | | | 5.000%, 2/01/42 | | 2/33 at 100.00 | | | 684,119 | |
| | 1,000 | | | | | 5.000%, 2/01/43 | | 2/33 at 100.00 | | | 1,026,753 | |
| | | | |
| | | | | | Dallas Fort Worth International Airport, Texas, Joint Revenue Bonds, Refunding Series 2023C.: | | | | | | |
| | 455 | | | | | 5.000%, 11/01/27, (AMT) | | No Opt. Call | | | 463,692 | |
| | 1,635 | | | | | 5.000%, 11/01/28, (AMT) | | No Opt. Call | | | 1,668,375 | |
| | 5,275 | | | | | 5.000%, 11/01/29, (AMT) | | No Opt. Call | | | 5,394,117 | |
| | | | |
| | 4,605 | | | | | Dallas, Texas, General Obligation Bonds, Refunding and Improvement Series 2023A, 5.000%, 2/15/42 | | 2/33 at 100.00 | | | 4,679,078 | |
| | | | |
| | 1,000 | | | | | Flower Mound, Texas, Special Assessment Revenue Bonds, River Walk Public Improvement District 1, Refunding Series 2021, 3.500%, 9/01/36, 144A | | 9/31 at 100.00 | | | 764,390 | |
| | | | |
| | 1,280 | | | | | Fort Bend County Industrial Development Corporation, Texas, Revenue Bonds, NRG Energy Inc. Project, Series 2012B, 4.750%, 11/01/42 | | 12/23 at 100.00 | | | 1,126,152 | |
| | | | |
| | 570 | | | | | Galveston, Texas, Wharves and Terminal First Lien Revenue Bonds, Series 2023, 6.000%, 8/01/43, (AMT) | | 2/33 at 100.00 | | | 593,653 | |
| | | | |
| | 1,000 | | | | | Harris County Industrial Development Corporation, Texas, Revenue Bonds, Energy Transfer LP Project, Marine Terminal Refunding Series 2023, 4.050%, 11/01/50, (Mandatory Put 6/01/33) | | 3/33 at 100.00 | | | 935,275 | |
| | | | |
| | | | | | Houston, Texas, Airport System Revenue Bonds, Refunding Subordinate Lien Series 2023A: | | | | | | |
| | 4,500 | | | | | 5.000%, 7/01/32 - AGM Insured, (AMT) | | No Opt. Call | | | 4,630,666 | |
| | 3,330 | | | | | 5.000%, 7/01/33 - AGM Insured, (AMT) | | No Opt. Call | | | 3,433,554 | |
| | 3,500 | | | | | 5.000%, 7/01/34 - AGM Insured, (AMT) | | 7/33 at 100.00 | | | 3,602,313 | |
| | 1,250 | | | | | 5.000%, 7/01/38 - AGM Insured, (AMT) | | 7/33 at 100.00 | | | 1,239,923 | |
| | 1,250 | | | | | 5.250%, 7/01/39 - AGM Insured, (AMT) | | 7/33 at 100.00 | | | 1,270,039 | |
| | 2,500 | | | | | 5.250%, 7/01/40 - AGM Insured, (AMT) | | 7/33 at 100.00 | | | 2,531,373 | |
| | 2,500 | | | | | 5.250%, 7/01/41 - AGM Insured, (AMT) | | 7/33 at 100.00 | | | 2,521,113 | |
| | 1,250 | | | | | 5.250%, 7/01/42 - AGM Insured, (AMT) | | 7/33 at 100.00 | | | 1,254,376 | |
| | 1,715 | | | | | 5.250%, 7/01/43 - AGM Insured, (AMT) | | 7/33 at 100.00 | | | 1,717,180 | |
| | | | |
| | 5,610 | | | | | Love Field Airport Modernization Corporation, Texas, General Airport Revenue Bonds, Refunding Series 2021, 4.000%, 11/01/38 - AGM Insured, (AMT) | | 11/31 at 100.00 | | | 4,915,958 | |
| | | | |
| | 7,050 | | | | | Lower Colorado River Authority, Texas, Revenue Bonds, Refunding Series 2023B, 5.000%, 5/15/39, (Mandatory Put 5/15/28) | | 2/28 at 100.00 | | | 7,206,029 | |
| | | | |
| | 500 | | | | | Marble Falls, Burnet County, Texas, Special Assessment Revenue Bonds, Thunder Rock Public Improvement District Improvement Area 1 Project, Series 2021, 4.125%, 9/01/41, 144A | | 9/31 at 100.00 | | | 399,341 | |
195
| | |
| NDMO | | Nuveen Dynamic Municipal Opportunities Fund (continued) |
| | Portfolio of Investments October 31, 2023 |
| | | | | | | | | | | | |
Principal
Amount (000) | | | | | Description (a) | | Optional Call
Provisions (b) | | Value | |
| | | | |
| | | | | | Texas (continued) | | | | | | |
| | | | |
| | $ 1,500 | | | | | Matagorda County Navigation District 1, Texas, Pollution Control Revenue Bonds, AEP Texas Central Company Project, Remarketing, Series 2008-1, 4.000%, 6/01/30 | | 12/23 at 100.00 | | $ | 1,400,068 | |
| | | | |
| | 625 | | | | | McLendon-Chisholm, Texas, Special Assessment Revenue Bonds, Sonoma Public Improvement District Improvement Area 3 Project, Series 2021, 3.625%, 9/15/41, 144A | | 9/31 at 100.00 | | | 446,006 | |
| | | | |
| | 500 | | | | | Mesquite, Texas, Special Assessment Revenue Bonds, Solterra Public Improvement District Improvement Area A-1 Projects, Series 2023, 5.500%, 9/01/43, 144A | | 9/33 at 100.00 | | | 456,074 | |
| | | | |
| | 4,175 | | | | | New Hope Cultural Education Facilities Finance Corporation, Texas, Education Revenue Bonds, Southwest Preparatory School, Series 2020A, 5.000%, 8/15/50, 144A | | 8/25 at 103.00 | | | 3,170,590 | |
| | | | |
| | | | | | New Hope Cultural Education Facilities Finance Corporation, Texas, Senior Living Revenue Bonds, Sanctuary LTC LLC Project, Series 2021A-1: | | | | | | |
| | 6,795 | | | | | 5.250%, 1/01/42 | | 1/28 at 103.00 | | | 4,807,886 | |
| | 6,465 | | | | | 5.500%, 1/01/57 | | 1/28 at 103.00 | | | 4,256,757 | |
| | | | |
| | | | | | Pflugerville, Texas, Certificates of Obligation, Combination Tax and Revenue Series 2023: | | | | | | |
| | 1,860 | | | | | 5.000%, 8/01/35 | | 8/32 at 100.00 | | | 1,971,873 | |
| | 745 | | | | | 5.000%, 8/01/36 | | 8/32 at 100.00 | | | 780,900 | |
| | 450 | | | | | 5.000%, 8/01/37 | | 8/32 at 100.00 | | | 466,891 | |
| | | | |
| | 3,500 | | | | | Port Beaumont Industrial Development Authority, Texas, Facility Revenue Bonds, Jefferson Gulf Coast Energy Project, Series 2021B, 4.100%, 1/01/28, 144A | | 12/23 at 102.05 | | | 2,764,852 | |
| | | | |
| | 2,000 | | | | | Sachse, Texas, Special Assessment Bonds, Sachse Public Improvement District 1 Major Improvement Area Project, Series 2020, 5.375%, 9/15/40, 144A | | 9/30 at 100.00 | | | 1,809,444 | |
| | | | |
| | 450 | | | | | Tarrant County Cultural Education Facilities Finance Corporation, Texas, Hospital Revenue Bonds, Hendrick Medical Center, Taxable Series 2021, 3.292%, 9/01/40 - AGM Insured | | 9/30 at 100.00 | | | 308,709 | |
| | | | |
| | 1,500 | | | | | Texas Private Activity Bond Surface Transporation Corporation, Senior Lien Revenue Bonds, Blueridge Transportation Group, LLC SH 288 Toll Lanes Project, Series 2016, 5.000%, 12/31/50, (AMT) | | 12/25 at 100.00 | | | 1,334,079 | |
| | | | |
| | | | | | Texas State, General Obligation Bonds, Water Financial Assistance Bonds, Series 2023A: | | | | | | |
| | 500 | | | | | 5.000%, 8/01/41 | | 8/33 at 100.00 | | | 509,350 | |
| | 515 | | | | | 5.000%, 8/01/42 | | 8/33 at 100.00 | | | 522,807 | |
| | 555 | | | | | 5.000%, 8/01/43 | | 8/33 at 100.00 | | | 562,135 | |
| | | | |
| | 1,540 | | | | | Texas Water Development Board, State Water Implementation Revenue Fund Bonds, Master Trust Series 2020, 4.000%, 10/15/45 | | 10/30 at 100.00 | | | 1,345,324 | |
| | | | |
| | 650 | | | | | Texas Water Development Board, State Water Implementation Revenue Fund Bonds, Master Trust Series 2021, 4.000%, 10/15/51 | | 10/31 at 100.00 | | | 540,753 | |
| | | | | | Total Texas | | | | | 84,848,698 | |
| | | | |
| | | | | | Utah - 0.8% (0.6% of Total Investments) | | | | | | |
| | | | |
| | 500 | | | | | Red Bridge Public Infrastructure District 1, Utah, Limited Tax General Obligation Bonds, Series 2021A, 4.125%, 2/01/41, 144A | | 2/26 at 103.00 | | | 362,492 | |
| | | | |
| | | | | | Salt Lake City, Utah, Airport Revenue Bonds, International Airport Series 2023A: | | | | | | |
| | 715 | | | | | 5.000%, 7/01/34, (AMT) | | 7/33 at 100.00 | | | 728,638 | |
| | 645 | | | | | 5.250%, 7/01/43, (AMT) | | 7/33 at 100.00 | | | 643,221 | |
| | | | |
| | 970 | | | | | Utah Charter School Finance Authority, Charter School Revenue Bonds, Paradigm High School Project, Series 2020A, 5.125%, 7/15/51, 144A | | 1/25 at 102.00 | | | 685,082 | |
196
| | | | | | | | | | | | |
Principal
Amount (000) | | | | | Description (a) | | Optional Call
Provisions (b) | | Value | |
| | | | |
| | | | | | Utah (continued) | | | | | | |
| | | | |
| | $ 2,540 | | | | | Wohali Public Infrastructure District 1, Utah, Special Assessment Revenue Bonds, Assessment Area 1 Series 2023, 7.000%, 12/01/42, 144A | | 9/28 at 103.00 | | $ | 2,363,483 | |
| | | | | | Total Utah | | | | | 4,782,916 | |
| | | | |
| | | | | | Virgin Islands - 0.6% (0.4% of Total Investments) | | | | | | |
| | | | |
| | 2,365 | | | | | Matching Fund Special Purpose Securitization Corporation, Virgin Islands, Revenue Bonds, Series 2022A, 5.000%, 10/01/32 | | No Opt. Call | | | 2,325,504 | |
| | | | |
| | 1,000 | | | | | West Indian Company Limited, Virgin Islands, Port Facilities Revenue Bonds, WICO Financing, Series 2022A, 6.125%, 10/01/42, 144A | | 10/29 at 104.00 | | | 938,985 | |
| | | | | | Total Virgin Islands | | | | | 3,264,489 | |
| | | | |
| | | | | | Virginia - 1.9% (1.4% of Total Investments) | | | | | | |
| | | | |
| | 2,195 | | | | | Arlington County Industrial Development Authority, Virginia, Hospital Revenue Bonds, Virginia Hospital Center, Series 2023A, 5.000%, 7/01/53, (Mandatory Put 7/01/31) | | 7/30 at 100.00 | | | 2,271,693 | |
| | | | |
| | 3,580 | | | | | Roanoke Economic Development Authority, Virginia, Hospital Revenue Bonds, Carilion Clinic Obligated Group, Series 2020D, 5.000%, 7/01/53, (Mandatory Put 7/01/30) | | 1/30 at 100.00 | | | 3,697,366 | |
| | | | |
| | 2,790 | | | | | Virginia College Building Authority, Educational Facilities Revenue Bonds, 21st Century Collage & Equipment Programs, Series 2023A, 5.250%, 2/01/42 | | 2/33 at 100.00 | | | 2,934,019 | |
| | | | |
| | | | | | Virginia Port Authority, Commonwealth Port Fund Revenue Bonds, Series 2023A: | | | | | | |
| | 270 | | | | | 5.000%, 7/01/41 | | 7/33 at 100.00 | | | 282,472 | |
| | 1,000 | | | | | 5.000%, 7/01/42 | | 7/33 at 100.00 | | | 1,040,170 | |
| | 130 | | | | | 5.000%, 7/01/43 | | 7/33 at 100.00 | | | 134,710 | |
| | | | |
| | 1,000 | | | | | Virginia Small Business Financing Authority, Tourism Development Financing Program Revenue Bonds, Virginia Beach Oceanfront South Hotel Project, Senior Series 2020A-1, 8.000%, 10/01/43, 144A | | 10/30 at 120.40 | | | 935,778 | |
| | | | | | Total Virginia | | | | | 11,296,208 | |
| | | | |
| | | | | | Washington - 1.4% (1.0% of Total Investments) | | | | | | |
| | | | |
| | 1,770 | | | | | Washington Health Care Facilities Authority, Revenue Bonds, Providence Health & Services, Series 2014D, 5.000%, 10/01/41 | | 10/24 at 100.00 | | | 1,685,007 | |
| | | | |
| | 1,915 | | | | | Washington Health Care Facilities Authority, Revenue Bonds, Providence Saint Joseph Health, Refunding Series 2021B, 4.000%, 10/01/42, (Mandatory Put 10/01/30) | | No Opt. Call | | | 1,781,487 | |
| | | | |
| | 5,683 | | | | | Washington State Housing Finance Commission, Social Municipal Certificates Multifamily Revenue Bonds, Series 2023-1 Class A, 3.375%, 4/20/37 | | No Opt. Call | | | 4,477,450 | |
| | | | | | Total Washington | | | | | 7,943,944 | |
| | | | |
| | | | | | West Virginia - 1.0% (0.7% of Total Investments) | | | | | | |
| | | | |
| | 3,890 | | | | | West Virginia Economic Development Authority, Dock and Wharf Facilities Revenue Bonds, Empire Trimodal Terminal, LLC Project, Series 2020, 7.625%, 12/01/40, 144A | | 12/27 at 103.00 | | | 2,952,635 | |
| | | | |
| | 1,000 | | | | | West Virginia Economic Development Authority, Solid Waste Disposal Facilities Revenue Bonds, Arch Resources Project, Series 2021, 4.125%, 7/01/45, (AMT), (Mandatory Put 7/01/25) | | 1/25 at 100.00 | | | 978,048 | |
| | | | |
| | | | | | West Virginia Hospital Finance Authority, Revenue Bonds, West Virginia University Health System, Improvement Series 2023A: | | | | | | |
| | 1,035 | | | | | 5.000%, 6/01/41 | | 6/33 at 100.00 | | | 1,027,713 | |
| | 1,000 | | | | | 5.000%, 6/01/43 | | 6/33 at 100.00 | | | 982,824 | |
| | | | | | Total West Virginia | | | | | 5,941,220 | |
197
| | |
| NDMO | | Nuveen Dynamic Municipal Opportunities Fund (continued) |
| | Portfolio of Investments October 31, 2023 |
| | | | | | | | | | | | | | | | |
Principal
Amount (000) | | | | | Description (a) | | Optional Call
Provisions (b) | | | Value | |
| | | | |
| | | | | | Wisconsin - 3.9% (2.7% of Total Investments) | | | | | | | | |
| | | | |
| | $ 3,000 | | | | | Gillett, Wisconsin, Solid Waste Disposal Revenue Bonds, WI RNG Hub North LLC Renewable Natural Gas Production Plant Project, Series 2021A, 5.500%, 12/01/32, 144A | | | 12/26 at 100.00 | | | $ | 2,397,467 | |
| | | | |
| | 6,350 | | | | | Public Finance Authority of Wisconsin, Charter School Revenue Bonds, Freedom Classical Academy Inc., Series 2020A, 5.000%, 1/01/56, 144A | | | 1/28 at 100.00 | | | | 4,791,619 | |
| | | | |
| | 200 | | | | | Public Finance Authority of Wisconsin, Education Revenue Bonds, Shining Rock Classical Academy, Series 2022A, 6.125%, 6/15/57 | | | 6/29 at 101.00 | | | | 170,024 | |
| | | | |
| | 1,000 | | | | | Public Finance Authority of Wisconsin, Education Revenue Bonds, The Capitol Encore Academy, Series 2021A, 5.000%, 6/01/56, 144A | | | 6/28 at 100.00 | | | | 739,584 | |
| | | | |
| | 1,000 | | | | | Public Finance Authority of Wisconsin, Educational Facility Revenue Bonds, LEAD Academy Project, Series 2021, 5.000%, 8/01/51, 144A | | | 8/28 at 100.00 | | | | 738,204 | |
| | | | |
| | 2,000 | | | | | Public Finance Authority of Wisconsin, Hotel Revenue Bonds, Grand Hyatt San Antonio Hotel Acquisition Project, Senior Lien Series 2022A, 5.000%, 2/01/52 | | | 2/32 at 100.00 | | | | 1,739,142 | |
| | | | |
| | | | | | Public Finance Authority of Wisconsin, Hotel Revenue Bonds, Grand Hyatt San Antonio Hotel Acquisition Project, Subordinate Lien Series 2022B: | | | | | | | | |
| | 1,670 | | | | | 5.625%, 2/01/46, 144A | | | 2/32 at 100.00 | | | | 1,481,043 | |
| | 2,000 | | | | | 6.000%, 2/01/62, 144A | | | 2/32 at 100.00 | | | | 1,784,804 | |
| | | | |
| | 5,000 | | | | | Public Finance Authority of Wisconsin, Limited Obligation PILOT Revenue Bonds, American Dream @ Meadowlands Project, Series 2017, 7.000%, 12/01/50, 144A | | | 12/27 at 100.00 | | | | 4,365,437 | |
| | | | |
| | 1,000 | | | | | Public Finance Authority of Wisconsin, Pollution Control Revenue Bonds, Duke Energy Progress Project, Refunding Series 2022B, 4.000%, 10/01/46, (Mandatory Put 10/01/30) | | | No Opt. Call | | | | 956,217 | |
| | | | |
| | 2,000 | | | | | Public Finance Authority of Wisconsin, Revenue Bonds, Sky Harbour LLC Obligated Group Aviation Facilities Project, Series 2021, 4.000%, 7/01/41, (AMT) | | | 7/31 at 100.00 | | | | 1,392,671 | |
| | | | |
| | 100 | | | (c),(f) | | Public Finance Authority of Wisconsin, Wisconsin Revenue Note, KDC Agribusiness LLC Project, Series 2022B, 15.000%, 3/31/24 | | | 4/23 at 105.00 | | | | 10 | |
| | | | |
| | 2,500 | | | | | Wisconsin Health and Educational Facilities Authority, Wisconsin, Revenue Bonds, Froedtert Health, Inc. Obligated Group, Series 2017A, 4.000%, 4/01/39 | | | 4/27 at 100.00 | | | | 2,174,150 | |
| | | | | | Total Wisconsin | | | | | | | 22,730,372 | |
| | | | | | Total Municipal Bonds
(cost $917,832,795) | | | | | | | 813,606,698 | |
| | | | | |
Principal Amount (000) | | | | | Description (a) | | Coupon | | Maturity | | | Value | |
| | | | | | CORPORATE BONDS - 1.4% (1.0% of Total Investments) | | | | | | | | | | |
| | | | |
| | | | | | Health Care Equipment & Services - 1.3% (0.9% of Total Investments) | | | | | | | | |
| | $ 2,750 | | | | | Care New England Health System | | 5.500% | | | 9/01/26 | | | $ | 2,481,875 | |
| | 4,363 | | | | | Toledo Hospital/The | | 5.325% | | | 11/15/28 | | | | 3,337,695 | |
| | 3,000 | | | | | Toledo Hospital/The | | 6.015% | | | 11/15/48 | | | | 1,998,750 | |
| | | | | | Total Health Care Equipment & Services | | | | | | | | | 7,818,320 | |
| | | |
| | | | | | Real Estate Management & Development - 0.1% (0.1% of Total Investments) | | | | | |
| | 504 | | | (f) | | Benloch Ranch Improvement Association No 1, 144A | | 9.750% | | | 12/01/39 | | | | 457,538 | |
| | | | | | Total Real Estate Management & Development | | | | | | | | | 457,538 | |
| | | | | | Total Corporate Bonds
(cost $8,681,894) | | | | | | | | | 8,275,858 | |
198
| | | | | | | | | | | | | | | | | | | | | | | | |
| Shares | | | | | Description (a) | | | | | | | | | | | | | Value | |
| | | | | | COMMON STOCKS - 0.2% (0.1% of Total Investments) | | | | | | | | | | | | | |
| | | | | |
| | | | | | Utilities - 0.2% (0.1% of Total Investments) | | | | | | | | | | | | | |
| | 17,120 | | | (h),(i) | | Talen Energy Supply LLC | | | | | | | | | | | | | | | | $ | 894,520 | |
| | | | | | Total Utilities | | | | | | | | | | | | 894,520 | |
| | | | | | Total Common Stocks
(cost $547,840) | | | | | | | | | | | | 894,520 | |
| | | | | | | |
Principal
Amount (000) | | | | | Description (a) | | Coupon (j) | | Reference
Rate (j) | | | Spread (j) | | | Maturity (k) | | | Value | |
| | | | | | VARIABLE RATE SENIOR LOAN INTERESTS - 0.0% (0.0% of Total Investments) (j) | | | | | | | | | |
| | | | | |
| | | | | | Capital Goods - 0.0% (0.0% of Total Investments) | | | | | | | | | | | | | |
| | $ 129 | | | (c),(f),(l) | | KDC Agribusiness Fairless Hills LLC | | 12.000% | | | N/A | | | | N/A | | | | 9/17/23 | | | $ | 28,193 | |
| | | | | | Total Capital Goods | | | | | | | | | | | | | | | | | 28,193 | |
| | | | | | Total Variable Rate Senior Loan Interests
(cost $128,676) | | | | | | | | | | | | | | | 28,193 | |
| | | | | | Total Long-Term Investments
(cost $927,191,205) | | | | | | | | | | | | 822,805,269 | |
| | | | | | | |
Principal
Amount (000) | | | | | Description (a) | | | | | | | | | | Optional Call
Provisions (b) | | | Value | |
| | | | | | SHORT-TERM INVESTMENTS - 1.6% (1.1% of Total Investments) | | | | | | | | | |
| | | | | |
| | | | | | MUNICIPAL BONDS - 1.6% (1.1% of Total Investments) | | | | | | | | | | | | | |
| | | | | |
| | | | | | Michigan - 1.6% (1.1% of Total Investments) | | | | | | | | | | | | | |
| | $ 9,000 | | | (m) | | Great Lakes Water Authority, Michigan, Water Supply Revenue Bonds, Senior Lien Tender Option Bond Trust Series 2022-XM1091, 4.080%, 7/01/25, (Mandatory Put 10/6/2023), 144A | | | | | | | | No Opt. Call | | | $ | 9,000,000 | |
| | | | | | Total Michigan | | | | | | | | | | | | 9,000,000 | |
| | | | | | Total Municipal Bonds
(cost $9,000,000) | | | | | | | | | | | | 9,000,000 | |
| | | | | | Total Short-Term Investments
(cost $9,000,000) | | | | | | | | | | | | 9,000,000 | |
| | | | | |
| | | | | | Total Investments (cost $936,191,205) - 142.6% | | | | | | | | | | | | 831,805,269 | |
| | | | | | Floating Rate Obligations - (0.1)% | | | | | | | �� | | | | | (650,000 | ) |
| | | | | | MFP Shares, Net - (41.1)%(n) | | | | | | | | | | | | (239,609,609 | ) |
| | | | | | Other Assets & Liabilities, Net - (1.4)% | | | | | | | | | | | | (8,041,494 | ) |
| | | | | | Net Assets Applicable to Common Shares - 100% | | | | | | | | | | | $ | 583,504,166 | |
| (a) | All percentages shown in the Portfolio of Investments are based on net assets applicable to common shares unless otherwise noted. |
| (b) | Optional Call Provisions: Dates (month and year) and prices of the earliest optional call or redemption. There may be other call provisions at varying prices at later dates. Certain mortgage-backed securities may be subject to periodic principal paydowns. Optional Call Provisions are not covered by the report of independent registered public accounting firm. |
| (c) | Defaulted security. A security whose issuer has failed to fully pay principal and/or interest when due, or is under the protection of bankruptcy. |
| (d) | Backed by an escrow or trust containing sufficient U.S. Government or U.S. Government agency securities, which ensure the timely payment of principal and interest. |
| (e) | Investment, or portion of investment, has been pledged to collateralize the net payment obligations for investments in inverse floating rate transactions. |
| (f) | For fair value measurement disclosure purposes, investment classified as Level 3. |
| (g) | Principal Amount (000) rounds to less than $1,000. |
| (h) | In May 2023, Talen Energy completed a Chapter 11 plan of reorganization whereby the Fund received Talen Energy Common Stock in exchange for the following portfolio holding: Talen Energy Supply LLC, 6.000%, 12/15/36, Senior Note. |
| (i) | Non-income producing; issuer has not declared an ex-dividend date within the past twelve months. |
| (j) | Senior loans generally pay interest at rates which are periodically adjusted by reference to a base short-term, floating lending rate (Reference Rate) plus an assigned fixed rate (Spread). These floating lending rates are generally (i) the lending rate referenced by the London Inter-Bank Offered Rate (“LIBOR”), or (ii) the prime rate offered by one or more major United States banks. Senior loans may be considered restricted in that the Fund ordinarily is contractually obligated to receive approval from the agent bank and/or borrower prior to the disposition of a senior loan. The rate shown is the coupon as of the end of the reporting period. |
199
| | |
| NDMO | | Nuveen Dynamic Municipal Opportunities Fund (continued) |
| | Portfolio of Investments October 31, 2023 |
| (k) | Senior loans generally are subject to mandatory and/or optional prepayment. Because of these mandatory prepayment conditions and because there may be significant economic incentives for a borrower to prepay, prepayments of senior loans may occur. As a result, the actual remaining maturity of senior loans held may be substantially less than the stated maturities shown. |
| (l) | Senior loan received as part of the bondholder funding agreement during June 2023 for Pennsylvania Economic Development Financing Authority, Exempt Facilities Revenue Bonds, KDC Agribusiness Fairless Hills LLC Project, Series 2021A, 10.000%, 12/01/31. |
| (m) | Investment has a maturity of greater than one year, but has variable rate and/or demand features which qualify it as a short-term investment. The rate disclosed, as well as the reference rate and spread, where applicable, is that in effect as of the end of the reporting period. This rate changes periodically based on market conditions or a specified market index. |
| (n) | MFP Shares, Net as a percentage of Total Investments is 28.8%. |
| 144A | Investment is exempt from registration under Rule 144A of the Securities Act of 1933, as amended. These investments may only be resold in transactions exempt from registration, which are normally those transactions with qualified institutional buyers. |
| AMT | Alternative Minimum Tax |
| UB | Underlying bond of an inverse floating rate trust reflected as a financing transaction. |
| WI/DD | When-issued or delayed delivery security. |
See Notes to Financial Statements
200
Statement of Assets and Liabilities
October 31, 2023
| | | | | | | | | | | | | | | | | | | | |
| October 31, 2023 | | NVG | | | NZF | | | NMZ | | | NMCO | | | NDMO | |
ASSETS | | | | | | | | | | | | | | | | | | | | |
| | | | | |
Long-term investments, at value† | | $ | 4,360,258,893 | | | $ | 3,965,052,004 | | | $ | 1,782,737,989 | | | $ | 1,000,603,161 | | | $ | 822,805,269 | |
| | | | | |
Short-term investments, at valueà | | | 39,360,000 | | | | - | | | | - | | | | - | | | | 9,000,000 | |
Cash | | | 6,922,191 | | | | 11,160,687 | | | | - | | | | - | | | | 981,452 | |
Cash held in escrow for preferred shares noticed for redemption | | | - | | | | - | | | | - | | | | 20,000,000 | | | | - | |
Receivables: | | | | | | | | | | | | | | | | | | | | |
Dividends | | | - | | | | 1,938 | | | | - | | | | - | | | | - | |
Interest | | | 66,659,552 | | | | 60,838,949 | | | | 37,854,524 | | | | 19,819,480 | | | | 18,559,977 | |
Investments sold | | | 65,577,745 | | | | 10,537,716 | | | | 12,963,776 | | | | 20,880,612 | | | | 9,374,040 | |
Deferred offering costs | | | 87,147 | | | | - | | | | 273,749 | | | | 216,315 | | | | 287,958 | |
Other | | | 2,103,295 | | | | 1,012,887 | | | | 234,369 | | | | 110,895 | | | | 102,483 | |
| | | | | | |
Total assets | | | 4,540,968,823 | | | | 4,048,604,181 | | | | 1,834,064,407 | | | | 1,061,630,463 | | | | 861,111,179 | |
| | | | | |
LIABILITIES | | | | | | | | | | | | | | | | | | | | |
Cash overdraft | | | - | | | | - | | | | 5,699,306 | | | | 6,439 | | | | - | |
Floating rate obligations | | | 210,540,000 | | | | 374,706,000 | | | | 406,701,000 | | | | 19,960,000 | | | | 650,000 | |
AMTP Shares, Net* | | | - | | | | - | | | | 356,521,633 | | | | - | | | | - | |
MFP Shares, Net** | | | 515,526,990 | | | | 640,119,683 | | | | - | | | | 429,128,343 | | | | 239,609,609 | |
VRDP Shares, Net*** | | | 1,233,916,102 | | | | 673,553,812 | | | | - | | | | - | | | | - | |
Payables: | | | | | | | | | | | | | | | | | | | | |
MFP Shares noticed for redemption, at liquidation value | | | - | | | | - | | | | - | | | | 20,000,000 | | | | - | |
Dividends | | | 8,597,526 | | | | 7,959,084 | | | | 4,590,639 | | | | 2,352,184 | | | | 3,379,817 | |
Interest | | | 2,413,706 | | | | 5,718,075 | | | | 3,842,472 | | | | 124,808 | | | | 2,062 | |
Investments purchased - regular settlement | | | 22,652,622 | | | | 13,425,500 | | | | 4,882,000 | | | | 16,563,720 | | | | 13,353,478 | |
Investments purchased - when-issued/delayed-delivery settlement | | | 26,199,452 | | | | 13,005,554 | | | | 2,360,696 | | | | 21,192,937 | | | | 19,882,747 | |
Offering costs | | | - | | | | - | | | | 2,705 | | | | - | | | | - | |
Accrued expenses: | | | | | | | | | | | | | | | | | | | | |
Custodian fees | | | 282,572 | | | | 259,063 | | | | 123,773 | | | | 74,530 | | | | 75,739 | |
Investor relations | | | 77,338 | | | | 68,148 | | | | 24,179 | | | | 14,475 | | | | 2,805 | |
Management fees | | | 2,330,805 | | | | 2,091,808 | | | | 958,703 | | | | 771,176 | | | | 592,207 | |
Trustees fees | | | 1,289,898 | | | | 893,872 | | | | 162,984 | | | | 40,198 | | | | 33,853 | |
Professional fees | | | 19,121 | | | | 3,828 | | | | 11,264 | | | | 7,691 | | | | 7,102 | |
Shareholder reporting expenses | | | 71,772 | | | | 75,584 | | | | 28,408 | | | | 17,808 | | | | 15,201 | |
Shareholder servicing agent fees | | | 11,976 | | | | 8,724 | | | | 3,879 | | | | 2,372 | | | | 2,375 | |
Shelf offering costs | | | - | | | | - | | | | - | | | | 67,553 | | | | - | |
Other | | | – | | | | 1,957 | | | | 1,997 | | | | 23,824 | | | | 18 | |
| | | | | | |
Total liabilities | | | 2,023,929,880 | | | | 1,731,890,692 | | | | 785,915,638 | | | | 510,348,058 | | | | 277,607,013 | |
| | | | | |
Commitments and contingencies(1) | | | | | | | | | | | | | | | | | | | | |
| | | | | |
Net assets applicable to common shares | | $ | 2,517,038,943 | | | $ | 2,316,713,489 | | | $ | 1,048,148,769 | | | $ | 551,282,405 | | | $ | 583,504,166 | |
| | | | | |
Common shares outstanding | | | 213,522,363 | | | | 193,729,050 | | | | 110,539,338 | | | | 54,801,890 | | | | 59,562,212 | |
| | | | | | |
Net asset value (“NAV”) per common share outstanding | | $ | 11.79 | | | $ | 11.96 | | | $ | 9.48 | | | $ | 10.06 | | | $ | 9.80 | |
| | | | | | |
NET ASSETS APPLICABLE TO COMMON SHARES CONSIST OF: | | | | | | | | | | | | | | | | | | | | |
Common shares, $0.01 par value per share | | $ | 2,135,224 | | | $ | 1,937,291 | | | $ | 1,105,393 | | | $ | 548,019 | | | $ | 595,622 | |
Paid-in capital | | | 3,086,341,673 | | | | 2,764,929,352 | | | | 1,454,109,375 | | | | 817,984,468 | | | | 840,131,715 | |
Total distributable earnings (loss) | | | (571,437,954 | ) | | | (450,153,154 | ) | | | (407,065,999 | ) | | | (267,250,082 | ) | | | (257,223,171 | ) |
| | | | | | |
Net assets applicable to common shares | | $ | 2,517,038,943 | | | $ | 2,316,713,489 | | | $ | 1,048,148,769 | | | $ | 551,282,405 | | | $ | 583,504,166 | |
Authorized shares: | | | | | | | | | | | | | | | | | | | | |
Common | | | Unlimited | | | | Unlimited | | | | Unlimited | | | | Unlimited | | | | Unlimited | |
Preferred | | | Unlimited | | | | Unlimited | | | | Unlimited | | | | Unlimited | | | | Unlimited | |
| | | | | |
† Long-term investments, cost | | $ | 4,822,670,768 | | | $ | 4,116,776,199 | | | $ | 2,057,247,324 | | | $ | 1,129,770,194 | | | $ | 927,191,205 | |
| | | | | |
à Short-term investments, cost | | $ | 39,360,000 | | | $ | – | | | $ | – | | | $ | – | | | $ | 9,000,000 | |
| | | | | |
* AMTP Shares, liquidation preference | | | – | | | | – | | | | 357,000,000 | | | | – | | | | – | |
| | | | | |
** MFP Shares, liquidation preference | | | 517,400,000 | | | | 641,000,000 | | | | – | | | | 430,000,000 | | | | 240,000,000 | |
| | | | | |
*** VRDP Shares, liquidation preference | | | 1,236,600,000 | | | | 677,000,000 | | | | – | | | | – | | | | – | |
| (1) | As disclosed in Notes to Financial Statements. |
See Notes to Financial Statements
201
Statement of Operations
October 31, 2023
| | | | | | | | | | | | | | | | | | | | |
| Year Ended October 31, 2023 | | NVG | | | NZF | | | NMZ | | | NMCO | | | NDMO | |
| | | | | |
INVESTMENT INCOME | | | | | | | | | | | | | | | | | | | | |
Interest | | $ | 222,349,246 | | | $ | 192,470,850 | | | $ | 101,779,100 | | | $ | 56,064,773 | | | $ | 43,413,340 | |
Total investment income | | | 222,349,246 | | | | 192,470,850 | | | | 101,779,100 | | | | 56,064,773 | | | | 43,413,340 | |
| | | | | |
EXPENSES | | | | | | | | | | | | | | | | | | | | |
Management fees | | | 28,913,825 | | | | 24,240,422 | | | | 12,552,706 | | | | 9,806,782 | | | | 7,408,432 | |
Shareholder servicing agent fees | | | 78,003 | | | | 47,341 | | | | 25,099 | | | | 14,903 | | | | 14,924 | |
Interest expense and amortization of offering costs | | | 66,842,179 | | | | 65,769,336 | | | | 31,090,213 | | | | 19,104,301 | | | | 9,952,399 | |
Trustees fees | | | 158,003 | | | | 131,665 | | | | 54,185 | | | | 37,343 | | | | 32,350 | |
Custodian expenses, net | | | 129,350 | | | | 138,081 | | | | 118,429 | | | | 73,415 | | | | 19,231 | |
Investor relations expenses | | | 170,918 | | | | 143,913 | | | | 73,413 | | | | 43,562 | | | | 129,193 | |
Liquidity fees | | | 9,355,951 | | | | 1,229,896 | | | | – | | | | 826,116 | | | | – | |
Merger expenses | | | – | | | | 426,000 | | | | – | | | | – | | | | – | |
Professional fees | | | 394,515 | | | | 387,553 | | | | 820,087 | | | | 503,646 | | | | 184,892 | |
Remarketing fees | | | 2,600,997 | | | | 75,878 | | | | – | | | | 101,389 | | | | – | |
Shareholder reporting expenses | | | 153,128 | | | | 139,729 | | | | 72,854 | | | | 41,493 | | | | 45,221 | |
Stock exchange listing fees | | | 64,231 | | | | 60,816 | | | | 76,448 | | | | 20,736 | | | | 20,930 | |
Other | | | 221,488 | | | | 137,660 | | | | 62,791 | | | | 94,563 | | | | 12,206 | |
| | | | | | |
Total expenses | | | 109,082,588 | | | | 92,928,290 | | | | 44,946,225 | | | | 30,668,249 | | | | 17,819,778 | |
| | | | | |
Net investment income (loss) | | | 113,266,658 | | | | 99,542,560 | | | | 56,832,875 | | | | 25,396,524 | | | | 25,593,562 | |
| | | | | |
REALIZED AND UNREALIZED GAIN (LOSS) | | | | | | | | | | | | | | | | | | | | |
| | | | | |
Realized gain (loss) from: | | | | | | | | | | | | | | | | | | | | |
Investments | | | (64,101,331 | ) | | | (73,224,640 | ) | | | (66,935,786 | ) | | | (45,121,374 | ) | | | (62,014,472 | ) |
Futures contracts | | | – | | | | – | | | | – | | | | – | | | | 831,869 | |
Net realized gain (loss) | | | (64,101,331 | ) | | | (73,224,640 | ) | | | (66,935,786 | ) | | | (45,121,374 | ) | | | (61,182,603 | ) |
| | | | | |
Change in unrealized appreciation (depreciation) on: | | | | | | | | | | | | | | | | | | | | |
Investments | | | (21,872,197 | ) | | | (30,396,013 | ) | | | 17,358,472 | | | | (5,984,512 | ) | | | 52,750,886 | |
Futures contracts | | | – | | | | – | | | | – | | | | – | | | | (2,140,765 | ) |
Net change in unrealized appreciation (depreciation) | | | (21,872,197 | ) | | | (30,396,013 | ) | | | 17,358,472 | | | | (5,984,512 | ) | | | 50,610,121 | |
| | | | | |
Net realized and unrealized gain (loss) | | | (85,973,528 | ) | | | (103,620,653 | ) | | | (49,577,314 | ) | | | (51,105,886 | ) | | | (10,572,482 | ) |
| | | | | | |
Net increase (decrease) in net assets applicable to common shares from operations | | $ | 27,293,130 | | | $ | (4,078,093 | ) | | $ | 7,255,561 | | | $ | (25,709,362 | ) | | $ | 15,021,080 | |
See Notes to Financial Statements
202
Statement of Changes in Net Assets
October 31, 2023
| | | | | | | | | | | | | | | | | | |
| | | NVG | | | NZF |
| | | | | |
| | | Year Ended 10/31/23 | | | Year Ended 10/31/22 | | | Year Ended 10/31/23 | | | Year Ended 10/31/22 | | | |
OPERATIONS | | | | | | | | | | | | | | | | | | |
Net investment income (loss) | | $ | 113,266,658 | | | $ | 156,378,770 | | | $ | 99,542,560 | | | $ | 107,801,856 | | | |
Net realized gain (loss) | | | (64,101,331 | ) | | | (39,621,634 | ) | | | (73,224,640 | ) | | | (171,362,098 | ) | | |
Net change in unrealized appreciation (depreciation) | | | (21,872,197 | ) | | | (1,029,776,506 | ) | | | (30,396,013 | ) | | | (552,200,933 | ) | | |
| | | | | | |
Net increase (decrease) in net assets applicable to common shares from operations | | | 27,293,130 | | | | (913,019,370 | ) | | | (4,078,093 | ) | | | (615,761,175 | ) | | |
| | | | | |
DISTRIBUTIONS TO COMMON SHAREHOLDERS | | | | | | | | | | | | | | | | | | |
| | | | | |
Dividends | | | (114,020,943 | ) | | | (172,239,856 | ) | | | (95,928,228 | ) | | | (110,518,441 | ) | | |
| | | | | | |
Total distributions | | | (114,020,943 | ) | | | (172,239,856 | ) | | | (95,928,228 | ) | | | (110,518,441 | ) | | |
| | | | | |
CAPITAL SHARE TRANSACTIONS | | | | | | | | | | | | | | | | | | |
| | | | | |
Fund Reorganization/Merger | | | – | | | | – | | | | 391,798,148 | | | | 337,312,370 | | | |
Reinvestments of distributions | | | – | | | | 1,689,861 | | | | – | | | | – | | | |
Cost of shares repurchased and retired | | | – | | | | – | | | | (214,827 | ) | | | – | | | |
| | | | | |
Net increase (decrease) applicable to common shares from capital share transactions | | | – | | | | 1,689,861 | | | | 391,583,321 | | | | 337,312,370 | | | |
Net increase (decrease) in net assets applicable to common shares | | | (86,727,813 | ) | | | (1,083,569,365 | ) | | | 291,577,000 | | | | (388,967,246 | ) | | |
Net assets applicable to common shares at the beginning of the period | | | 2,603,766,756 | | | | 3,687,336,121 | | | | 2,025,136,489 | | | | 2,414,103,735 | | | |
| | | | | | |
Net assets applicable to common shares at the end of the period | | $ | 2,517,038,943 | | | $ | 2,603,766,756 | | | $ | 2,316,713,489 | | | $ | 2,025,136,489 | | | |
See Notes to Financial Statements
203
Statement of Changes in Net Assets (continued)
| | | | | | | | | | | | | | | | | | |
| | | NMZ | | | NMCO |
| | | | | |
| | | Year Ended 10/31/23 | | | Year Ended 10/31/22 | | | Year Ended 10/31/23 | | | Year Ended 10/31/22 | | | |
OPERATIONS | | | | | | | | | | | | | | | | | | |
Net investment income (loss) | | $ | 56,832,875 | | | $ | 73,190,814 | | | $ | 25,396,524 | | | $ | 41,984,439 | | | |
Net realized gain (loss) | | | (66,935,786 | ) | | | (59,668,730 | ) | | | (45,121,374 | ) | | | (20,149,038 | ) | | |
Net change in unrealized appreciation (depreciation) | | | 17,358,472 | | | | (412,043,906 | ) | | | (5,984,512 | ) | | | (215,318,529 | ) | | |
| | | | | | |
Net increase (decrease) in net assets applicable to common shares from operations | | | 7,255,561 | | | | (398,521,822 | ) | | | (25,709,362 | ) | | | (193,483,128 | ) | | |
| | | | | |
DISTRIBUTIONS TO COMMON SHAREHOLDERS | | | | | | | | | | | | | | | | | | |
Dividends | | | (60,518,649 | ) | | | (77,261,266 | ) | | | (33,420,741 | ) | | | (39,698,302 | ) | | |
Return of Capital | | | (1,274,052 | ) | | | – | | | | (446,021 | ) | | | – | | | |
| | | | | | |
Total distributions | | | (61,792,701 | ) | | | (77,261,266 | ) | | | (33,866,762 | ) | | | (39,698,302 | ) | | |
| | | | | |
CAPITAL SHARE TRANSACTIONS | | | | | | | | | | | | | | | | | | |
| | | | | |
Common shares: | | | | | | | | | | | | | | | | | | |
| | | | | |
Proceeds from shelf offering, net of offering costs | | | 9,590,166 | | | | 162,568,435 | | | | 357,037 | | | | 19,150,641 | | | |
Reinvestments of distributions | | | 111,408 | | | | 1,447,326 | | | | – | | | | 260,907 | | | |
| | | | | |
Net increase (decrease) applicable to common shares from capital share transactions | | | 9,701,574 | | | | 164,015,761 | | | | 357,037 | | | | 19,411,548 | | | |
Net increase (decrease) in net assets applicable to common shares | | | (44,835,566 | ) | | | (311,767,327 | ) | | | (59,219,087 | ) | | | (213,769,882 | ) | | |
Net assets applicable to common shares at the beginning of the period | | | 1,092,984,335 | | | | 1,404,751,662 | | | | 610,501,492 | | | | 824,271,374 | | | |
| | | | | | |
Net assets applicable to common shares at the end of the period | | $ | 1,048,148,769 | | | $ | 1,092,984,335 | | | $ | 551,282,405 | | | $ | 610,501,492 | | | |
See Notes to Financial Statements
204
Statement of Changes in Net Assets (continued)
| | | | | | | | | | |
| | | NDMO |
| | | |
| | | Year Ended 10/31/23 | | | Year Ended 10/31/22 | | | |
OPERATIONS | | | | | | | | | | |
Net investment income (loss) | | $ | 25,593,562 | | | $ | 29,814,419 | | | |
Net realized gain (loss) | | | (61,182,603 | ) | | | (87,702,703 | ) | | |
Net change in unrealized appreciation (depreciation) | | | 50,610,121 | | | | (199,839,884 | ) | | |
| | | | |
Net increase (decrease) in net assets applicable to common shares from operations | | | 15,021,080 | | | | (257,728,168 | ) | | |
| | | |
DISTRIBUTIONS TO COMMON SHAREHOLDERS | | | | | | | | | | |
| | | |
Dividends | | | (24,558,159 | ) | | | (29,662,852 | ) | | |
Return of Capital | | | (23,182,895 | ) | | | (24,771,804 | ) | | |
| | | | |
Total distributions | | | (47,741,054 | ) | | | (54,434,656 | ) | | |
| | | |
CAPITAL SHARE TRANSACTIONS | | | | | | | | | | |
| | | |
Common shares: | | | | | | | | | | |
| | | |
Proceeds from shelf offering, net of offering costs | | | – | | | | 12,647,921 | | | |
Reinvestments of distributions | | | 1,070,076 | | | | 1,121,470 | | | |
| | | |
Net increase (decrease) applicable to common shares from capital share transactions | | | 1,070,076 | | | | 13,769,391 | | | |
Net increase (decrease) in net assets applicable to common shares | | | (31,649,898 | ) | | | (298,393,433 | ) | | |
Net assets applicable to common shares at the beginning of the period | | | 615,154,064 | | | | 913,547,497 | | | |
| | | | |
Net assets applicable to common shares at the end of the period | | $ | 583,504,166 | | | $ | 615,154,064 | | | |
See Notes to Financial Statements
205
Statement of Cash Flows
October 31, 2023
| | | | | | | | | | | | | | | | | | | | |
| Year Ended October 31, 2023 | | NVG | | | NZF | | | NMZ | | | NMCO | | | NDMO | |
| | | | | |
CASH FLOWS FROM OPERATING ACTIVITIES | | | | | | | | | | | | | | | | | | | | |
| Net Increase (Decrease) in Net Assets Applicable to Common Shares from Operations | | $ | 27,293,130 | | | $ | (4,078,093 | ) | | $ | 7,255,561 | | | $ | (25,709,362 | ) | | $ | 15,021,080 | |
Adjustments to reconcile the net increase (decrease) in net assets applicable to common shares from operations to net cash provided by (used in) operating activities: | | | | | | | | | | | | | | | | | | | | |
Purchases of investments | | | (792,547,111 | ) | | | (1,181,054,995 | ) | | | (544,946,481 | ) | | | (372,497,802 | ) | | | (724,765,592 | ) |
Proceeds from sale and maturities of investments | | | 933,653,774 | | | | 1,026,257,806 | | | | 583,454,738 | | | | 407,863,387 | | | | 684,528,955 | |
Proceeds from (Purchase of) short-term investments, net | | | (39,360,000 | ) | | | – | | | | – | | | | – | | | | (7,036,837 | ) |
Taxes paid | | | (15,418 | ) | | | (2,049 | ) | | | (39,730 | ) | | | (26,574 | ) | | | (16,444 | ) |
Amortization (Accretion) of premiums and discounts, net | | | (18,654,237 | ) | | | (22,515,169 | ) | | | (7,834,473 | ) | | | (7,104,033 | ) | | | 239,476 | |
Amortization of deferred offering costs | | | 506,944 | | | | 603,082 | | | | 68,387 | | | | 110,051 | | | | (82,890 | ) |
(Increase) Decrease in: | | | | | | | | | | | | | | | | | | | | |
Receivable for dividends | | | – | | | | 921 | | | | – | | | | – | | | | – | |
Receivable for interest | | | 975,281 | | | | (2,332,544 | ) | | | 4,344,354 | | | | 4,272,108 | | | | 441,734 | |
Receivable for investments sold | | | (41,355,895 | ) | | | 96,435,356 | | | | 6,981,469 | | | | (4,313,313 | ) | | | (8,994,040 | ) |
Receivable for variation margin on futures contracts | | | – | | | | – | | | | – | | | | – | | | | 172,125 | |
Other assets | | | (221,522 | ) | | | (87,555 | ) | | | (100,004 | ) | | | (6,862 | ) | | | (72,651 | ) |
Increase (Decrease) in: | | | | | | | | | | | | | | | | | | | | |
Unrealized depreciation on recourse trusts | | | – | | | | (2,027,605 | ) | | | – | | | | (178,372 | ) | | | – | |
Payable for interest | | | 648,572 | | | | 4,000,440 | | | | (484,040 | ) | | | (188,982 | ) | | | (1,312,859 | ) |
Payable for investments purchased - regular settlement | | | 22,652,622 | | | | (40,794,928 | ) | | | (12,705,406 | ) | | | (7,155,629 | ) | | | 13,353,478 | |
Payable for investments purchased - when-issued/delayed-delivery settlement | | | 17,320,592 | | | | 10,378,567 | | | | (7,042,171 | ) | | | 18,275,697 | | | | 19,882,747 | |
Payable for offering cost | | | – | | | | – | | | | (11,624 | ) | | | – | | | | (190,634 | ) |
Accrued custodian fees | | | (105,916 | ) | | | (60,607 | ) | | | (28,422 | ) | | | (31,752 | ) | | | (43,867 | ) |
Accrued investor relations fees | | | (44,109 | ) | | | (21,758 | ) | | | 381 | | | | (8,991 | ) | | | 10,756 | |
Accrued management fees | | | (119,860 | ) | | | 227,755 | | | | (68,833 | ) | | | (54,620 | ) | | | (37,711 | ) |
Accrued Trustees fees | | | 193,764 | | | | 141,985 | | | | 33,037 | | | | 14,684 | | | | 12,143 | |
Accrued professional fees | | | (42,324 | ) | | | (71,040 | ) | | | (25,027 | ) | | | (20,501 | ) | | | (9,112 | ) |
Accrued shareholder reporting expenses | | | (14,512 | ) | | | 14,288 | | | | (4,478 | ) | | | (1,638 | ) | | | (2,472 | ) |
Accrued shareholder servicing agent fees | | | (2,653 | ) | | | 1,622 | | | | 773 | | | | 2,348 | | | | 2,347 | |
Accrued shelf offering costs | | | – | | | | – | | | | (35,218 | ) | | | (6,574 | ) | | | (9,542 | ) |
Accrued other expenses | | | 8,139 | | | | (290,028 | ) | | | (19,231 | ) | | | (29,227 | ) | | | (446 | ) |
Net realized (gain) loss from investments | | | 64,101,331 | | | | 73,224,640 | | | | 66,935,786 | | | | 45,121,374 | | | | 62,014,472 | |
Net realized (gain) loss from paydowns | | | (8,592 | ) | | | (10,754 | ) | | | (388,352 | ) | | | (332,093 | ) | | | (150,853 | ) |
Net change in unrealized (appreciation) depreciation of investments | | | 21,872,197 | | | | 30,396,013 | | | | (17,358,472 | ) | | | 5,984,512 | | | | (52,750,886 | ) |
Net cash provided by (used in) operating activities | | | 196,734,197 | | | | (11,664,650 | ) | | | 77,982,524 | | | | 63,977,836 | | | | 202,477 | |
CASH FLOWS FROM FINANCING ACTIVITIES | | | | | | | | | | | | | | | | | | | | |
Proceeds from borrowings | | | 51,992,872 | | | | 386,303,293 | | | | 125,256,353 | | | | 64,743,297 | | | | – | |
(Repayments) of borrowings | | | (51,992,872 | ) | | | (426,303,293 | ) | | | (125,256,353 | ) | | | (72,943,297 | ) | | | – | |
Proceeds from floating rate obligations | | | 162,260,000 | | | | 230,777,000 | | | | 248,431,000 | | | | 18,640,000 | | | | 650,000 | |
(Repayments of) floating rate obligations | | | (141,595,000 | ) | | | (39,830,000 | ) | | | (284,400,000 | ) | | | (16,530,000 | ) | | | (8,405,000 | ) |
(Repayments for) MFP Shares redeemed, at liquidation preference | | | (138,000,000 | ) | | | – | | | | – | | | | – | | | | – | |
(Repayments for) VRDP Shares redeemed, at liquidation preference | | | – | | | | (50,000,000 | ) | | | – | | | | – | | | | – | |
Proceeds from shelf offering | | | 4,559 | | | | – | | | | 9,589,760 | | | | 357,111 | | | | (5,618 | ) |
Increase (Decrease) in: | | | | | | | | | | | | | | | | | | | | |
Cash overdraft | | | (544,737 | ) | | | (2,845,247 | ) | | | 5,699,306 | | | | (3,746,457 | ) | | | – | |
Cash distributions paid to common shareholders | | | (116,436,828 | ) | | | (95,935,157 | ) | | | (62,782,908 | ) | | | (34,498,490 | ) | | | (47,394,411 | ) |
Cost of common shares repurchased and retired | | | – | | | | (214,827 | ) | | | – | | | | – | | | | – | |
| | | | | | |
Net cash provided by (used in) financing activities | | | (234,312,006 | ) | | | 1,951,769 | | | | (83,462,842 | ) | | | (43,977,836 | ) | | | (55,155,029 | ) |
Net increase (decrease) in Cash | | | (37,577,809 | ) | | | (9,712,881 | ) | | | (5,480,318 | ) | | | 20,000,000 | | | | (54,952,552 | ) |
| Cash, cash held in escrow for preferred shares noticed for redemption and cash collateral at brokers at the beginning of period | | | 44,500,000 | | | | – | | | | 5,480,318 | | | | – | | | | 55,934,004 | |
Cash acquired in connection with the merger | | | – | | | | 20,873,568 | | | | – | | | | – | | | | – | |
| | | | | | |
| Cash and cash held in escrow for preferred shares noticed for redemption at the end of period | | $ | 6,922,191 | | | $ | 11,160,687 | | | $ | – | | | $ | 20,000,000 | | | $ | 981,452 | |
See Notes to Financial Statements
206
The following table provides a reconciliation of cash, cash held in escrow for preferred shares noticed for redemption and cash collateral at brokers to the statement of assets and liabilities:
| | | | | | | | | | | | | | | | | | | | |
| | | NVG | | | NZF | | | NMZ | | | NMCO | | | NDMO | |
| | | | | |
Cash | | $ | 6,922,191 | | | $ | 11,160,687 | | | $ | – | | | $ | – | | | $ | 981,452 | |
| | | | | |
Cash held in escrow for preferred shares noticed for redemption | | | – | | | | – | | | | – | | | | 35,000,000 | | | | – | |
| Total cash and cash held in escrow for preferred shares noticed for redemption | | $ | 6,922,191 | | | $ | 11,160,687 | | | $ | – | | | $ | 35,000,000 | | | $ | 981,452 | |
| | | | | |
SUPPLEMENTAL DISCLOSURE OF CASH FLOW INFORMATION | | | NVG | | | | NZF | | | | NMZ | | | | NMCO | | | | NDMO | |
| | | | | |
Cash paid for interest | | $ | 65,673,119 | | | $ | 61,134,228 | | | $ | 31,246,494 | | | $ | 19,139,062 | | | $ | 11,219,877 | |
| | | | | |
| Non-cash financing activities not included herein consists of reinvestments of common share distributions | | | – | | | | – | | | | 111,408 | | | | – | | | | 1,070,076 | |
See Notes to Financial Statements
207
Financial Highlights
The following data is for a common share outstanding for each fiscal year end unless otherwise noted:
| | | | | | | | | | | | | | | | | | | | | | | | | | | | | | | | | | | | | | | | |
| | | | | | Investment Operations | | | Less Distributions to
Common Shareholders | | | Common Share | |
| | | Common | | | | | | | | | | | | | | | | | | | | | | | | | | | | |
| | | Share | | | | | | | | | | | | | | | | | | | | | Discount | | | | | | | |
| | | Net Asset | | | Net | | | Net | | | | | | | | | | | | | | | Per | | | Net Asset | | | Share | |
| | | Value, | | | Investment | | | Realized/ | | | | | | | | | From Net | | | | | | Share | | | Value, | | | Price, | |
| | | Beginning | | | Income (NII) | | | Unrealized | | | | | | From | | | Realized | | | | | | Repurchased | | | End of | | | End of | |
| | | of Period | | | (Loss) | | | Gain (Loss) | | | Total | | | NII | | | Gains | | | Total | | | and Retired | | | Period | | | Period | |
NVG | | | | | | | | | | | | | | | | | | | | | | | | | | | | | | | | | | | | | | | | |
10/31/23 | | | $12.19 | | | | $0.53 | | | | $(0.40) | | | | $0.13 | | | | $(0.53) | | | | $ – | | | | $(0.53) | | | | $ – | | | | $11.79 | | | | $10.03 | |
10/31/22 | | | 17.28 | | | | 0.73 | | | | (5.01) | | | | (4.28) | | | | (0.78) | | | | (0.03) | | | | (0.81) | | | | – | | | | 12.19 | | | | 11.03 | |
10/31/21 | | | 16.76 | | | | 0.82 | | | | 0.60 | | | | 1.42 | | | | (0.81) | | | | (0.09) | | | | (0.90) | | | | – | | | | 17.28 | | | | 17.29 | |
10/31/20 | | | 17.17 | | | | 0.82 | | | | (0.41) | | | | 0.41 | | | | (0.79) | | | | (0.03) | | | | (0.82) | | | | – | | | | 16.76 | | | | 15.62 | |
10/31/19 | | | 15.48 | | | | 0.79 | | | | 1.72 | | | | 2.51 | | | | (0.79) | | | | (0.03) | | | | (0.82) | | | | – | | | | 17.17 | | | | 16.45 | |
NZF | | | | | | | | | | | | | | | | | | | | | | | | | | | | | | | | | | | | | | | | |
10/31/23 | | | 12.24 | | | | 0.55 | | | | (0.30) | | | | 0.25 | | | | (0.53) | | | | – | | | | (0.53) | | | | –(c) | | | | 11.96 | | | | 10.10 | |
10/31/22 | | | 16.98 | | | | 0.71 | | | | (4.72) | | | | (4.01) | | | | (0.73) | | | | – | | | | (0.73) | | | | – | | | | 12.24 | | | | 10.83 | |
10/31/21 | | | 15.96 | | | | 0.78 | | | | 1.03 | | | | 1.81 | | | | (0.79) | | | | – | | | | (0.79) | | | | – | | | | 16.98 | | | | 16.73 | |
10/31/20 | | | 16.63 | | | | 0.80 | | | | (0.71) | | | | 0.09 | | | | (0.76) | | | | – | | | | (0.76) | | | | – | | | | 15.96 | | | | 14.74 | |
10/31/19 | | | 15.07 | | | | 0.75 | | | | 1.60 | | | | 2.35 | | | | (0.79) | | | | – | | | | (0.79) | | | | – | | | | 16.63 | | | | 16.03 | |
| (a) | Percentage is not annualized. |
208
| | | | | | | | | | | | |
| | | | | | | Common Share Supplemental Data/ Ratios Applicable to Common Shares |
| | | Common Share Total Returns | | | | Ratios to Average Net Assets | | |
| | | | | | |
| | | Based | | Based | | Net | | | | Net | | |
| | | on | | on | | Assets, | | | | Investment | | Portfolio |
| | | Net Asset | | Share | | End of | | | | Income | | Turnover |
| | | Value(a) | | Price(a) | | Period (000) | | Expenses(b) | | (Loss)(b) | | Rate |
| | | | | | | | | | | | | |
| | 0.70% | | (4.77)% | | $2,517,039 | | 3.85% | | 4.00% | | 17% |
| | (25.56) | | (32.54) | | 2,603,767 | | 2.16 | | 4.83 | | 19 |
| | 8.54 | | 16.65 | | 3,687,336 | | 1.52 | | 4.70 | | 12 |
| | 2.53 | | 0.06 | | 3,576,356 | | 1.98 | | 4.89 | | 15 |
| | 16.52 | | 29.47 | | 3,476,962 | | 2.49 | | 4.82 | | 6 |
| | | | | | | | | | | | | |
| | 1.62 | | (2.35) | | 2,316,713 | | 3.87 | | 4.14 | | 26 |
| | (24.20) | | (31.77) | | 2,025,136 | | 2.20 | | 4.78 | | 61 |
| | 11.45 | | 19.05 | | 2,414,104 | | 1.61 | | 4.60 | | 15 |
| | 0.58 | | (3.34) | | 2,267,965 | | 2.04 | | 4.95 | | 21 |
| | | 15.90 | | 27.08 | | 2,364,022 | | 2.60 | | 4.68 | | 12 |
| (b) | ● Net Investment Income (Loss) ratios reflect income earned and expenses incurred on assets attributable to preferred shares issued by the Fund, where applicable. |
● The expense ratios reflect, among other things, all interest expenses and other costs related to preferred shares (as described in Notes to Financial Statements) and/or the interest expense deemed to have been paid by the Fund on the floating rate certificates issued by the special purpose trusts for the self-deposited inverse floaters held by the Fund (as described in Notes to Financial Statements), where applicable, as follows:
| | | | | | |
| | | | | Ratios of Interest Expense to |
| | | | | Average Net Assets Applicable |
| | | | | to Common Shares |
| | | | | NVG | | NZF |
| | 10/31/23 | | 2.78% | | 2.79% |
| | 10/31/22 | | 1.10 | | 1.14 |
| | 10/31/21 | | 0.52 | | 0.62 |
| | 10/31/20 | | 0.97 | | 1.01 |
| | 10/31/19 | | 1.47 | | 1.55 |
| (c) | Value rounded to zero. |
See Notes to Financial Statements.
209
Financial Highlights (continuted)
The following data is for a common share outstanding for each fiscal year end unless otherwise noted:
| | | | | | | | | | | | | | | | | | | | | | | | | | | | | | | | | | | | | | | | | | | | | | | | |
| | | | | | | | | | | | Less Distributions to | | | | | | | |
| | | | | | Investment Operations | | | Common Shareholders | | | Common Share | |
| | | | | | | | | | | | |
| | | | | | | | | | | | | | | | | | | | | | | | | | | | | | Premium | | | | | | | |
| | | Common | | | | | | | | | | | | | | | | | | | | | | | | | | | per | | | | | | | |
| | | Share | | | | | | | | | | | | | | | | | | | | | | | | | | | Share | | | | | | | |
| | | Net Asset | | | Net | | | Net | | | | | | | | | | | | | | | | | | | | | Sold | | | Net Asset | | | Share | |
| | | Value, | | | Investment | | | Realized/ | | | | | | | | | From Net | | | | | | | | | Shelf | | | through | | | Value, | | | Price, | |
| | | Beginning | | | Income (NII) | | | Unrealized | | | | | | From | | | Realized | | | Return of | | | | | | Offering | | | Shelf | | | End of | | | End of | |
| | | of Period | | | (Loss) | | | Gain (Loss) | | | Total | | | NII | | | Gains | | | Capital | | | Total | | | Costs | | | Offering | | | Period | | | Period | |
NMZ | | | | | | | | | | | | | | | | | | | | | | | | | | | | | | | | | | | | | | | | | | | | | | | | |
10/31/23 | | | $9.97 | | | | $0.51 | | | | $(0.44) | | | | $0.07 | | | | $(0.55) | | | | $– | | | | $(0.01) | | | | $(0.56) | | | | $– | | | | $–(c) | | | | $9.48 | | | | $8.37 | |
10/31/22 | | | 14.53 | | | | 0.70 | | | | (4.53) | | | | (3.83) | | | | (0.75) | | | | – | | | | – | | | | (0.75) | | | | –(c) | | | | 0.02 | | | | 9.97 | | | | 9.85 | |
10/31/21 | | | 13.22 | | | | 0.72 | | | | 1.30 | | | | 2.02 | | | | (0.77) | | | | – | | | | – | | | | (0.77) | | | | –(c) | | | | 0.06 | | | | 14.53 | | | | 14.71 | |
10/31/20 | | | 14.04 | | | | 0.70 | | | | (0.82) | | | | (0.12) | | | | (0.73) | | | | – | | | | – | | | | (0.73) | | | | –(c) | | | | 0.03 | | | | 13.22 | | | | 13.22 | |
10/31/19 | | | 12.77 | | | | 0.76 | | | | 1.20 | | | | 1.96 | | | | (0.70) | | | | – | | | | – | | | | (0.70) | | | | – | | | | 0.01 | | | | 14.04 | | | | 14.22 | |
NMCO | | | | | | | | | | | | | | | | | | | | | | | | | | | | | | | | | | | | | | | | | | | | | | | | |
10/31/23 | | | 11.15 | | | | 0.46 | | | | (0.93) | | | | (0.47) | | | | (0.61) | | | | – | | | | (0.01) | | | | (0.62) | | | | –(c) | | | | –(c) | | | | 10.06 | | | | 8.67 | |
10/31/22 | | | 15.47 | | | | 0.78 | | | | (4.36) | | | | (3.58) | | | | (0.74) | | | | – | | | | – | | | | (0.74) | | | | –(c) | | | | –(c) | | | | 11.15 | | | | 10.39 | |
10/31/21 | | | 12.81 | | | | 0.82 | | | | 2.58 | | | | 3.40 | | | | (0.74) | | | | – | | | | – | | | | (0.74) | | | | – | | | | –(c) | | | | 15.47 | | | | 15.04 | |
10/31/20 | | | 15.08 | | | | 0.71 | | | | (2.25) | | | | (1.54) | | | | (0.73) | | | | – | | | | – | | | | (0.73) | | | | – | | | | – | | | | 12.81 | | | | 11.68 | |
10/31/19(d) | | | 15.00 | | | | 0.04 | | | | 0.04 | | | | 0.08 | | | | – | | | | – | | | | – | | | | — | | | | – | | | | – | | | | 15.08 | | | | 15.39 | |
| (a) | Percentage is not annualized. |
| (b) | ● Net Investment Income (Loss) ratios reflect income earned and expenses incurred on assets attributable to preferred shares, borrowings and/or reverse repurchase agreements (as described in Notes to Financial Statements), where applicable. |
● The expense ratios reflect, among other things, all interest expense and other costs related to preferred shares, borrowings and/or reverse repurchase agreements (as described in Notes to Financial Statements) and/or the interest expense deemed to have been paid by the Fund on the floating rate certificates issued by the special purpose trusts for the self-deposited inverse floaters held by the Fund (as described in Notes to Financial Statements), where applicable, as follows:
| | | | | | |
| | | | Ratios of Interest Expense to |
| | | | | Average Net Assets Applicable |
| | | | | to Common Shares |
| | | | | NMZ | | NMCO |
| | 10/31/23 | | 2.59% | | 3.12% |
| | 10/31/22 | | 0.93 | | 1.21 |
| | 10/31/21 | | 0.36 | | 0.72 |
| | 10/31/20 | | 0.66 | | 0.10 |
| | 10/31/19 | | 1.16 | | –(d),(e) |
210
| | | | | | | | | | | | | | | | | | | | | | | | | | | | | | | | | | | | | | | | | | |
| | | | | | | | | | | | Common Share Supplemental Data/ Ratios Applicable to Common Shares |
| | | Common Share
Total Returns | | | | | | | | | Ratios to Average
Net Assets | | | | | | |
| | | | | | | | | | | |
| | | Based on Net Asset Value(a) | | | | | | Based on Share Price(a) | | | | | | Net Assets, End of Period (000) | | | | | | Expenses(b) | | | | | | Net Investment Income (Loss)(b) | | | | | | Portfolio Turnover Rate |
| | | | | | | | | | | | | | | | | | | | | | | | | | | | | | | | | | | | | | | | | | | |
| | | 0.13% | | | | | | | | (10.28)% | | | | | | | | $1,048,149 | | | | | | | | 3.75% | | | | | | | | 4.74% | | | | | | | 27% |
| | | (27.13) | | | | | | | | (28.88) | | | | | | | | 1,092,984 | | | | | | | | 2.05 | | | | | | | | 5.61 | | | | | | | 30 |
| | | 15.80 | | | | | | | | 17.32 | | | | | | | | 1,404,752 | | | | | | | | 1.43 | | | | | | | | 5.13 | | | | | | | 6 |
| | | (0.49) | | | | | | | | (1.84) | | | | | | | | 1,097,418 | | | | | | | | 1.68 | | | | | | | | 5.19 | | | | | | | 10 |
| | | | 15.75 | | | | | | | | 27.45 | | | | | | | | 969,068 | | | | | | | | 2.20 | | | | | | | | 5.67 | | | | | | | 15 |
| | | | | | | | | | | | | | | | | | | | | | | | | | | | | | | | | | | | | | | | | | | |
| | | (4.85) | | | | | | | | (11.69) | | | | | | | | 551,282 | | | | | | | | 4.78 | | | | | | | | 3.96 | | | | | | | 34 |
| | | | (23.88) | | | | | | | | (26.91) | | | | | | | | 610,501 | | | | | | | | 2.74 | | | | | | | | 5.69 | | | | | | | 30 |
| | | 26.91 | | | | | | | | 35.55 | | | | | | | | 824,271 | | | | | | | | 2.18 | | | | | | | | 5.52 | | | | | | | 12 |
| | | (10.33) | | | | | | | | (19.78) | | | | | | | | 682,510 | | | | | | | | 2.41 | | | | | | | | 5.24 | | | | | | | 70 |
| | | | 0.53 | | | | | | | | 2.60 | | | | | | | | 803,046 | | | | | | | | 1.01 (e) | | | | | | | | 2.58 (e) | | | | | | | 8 |
| (c) | Value rounded to zero. |
| (d) | For the period September 16, 2019 (commencement of operations) through October 31, 2019. |
See Notes to Financial Statements.
211
Financial Highlights (continuted)
The following data is for a common share outstanding for each fiscal year end unless otherwise noted:
| | | | | | | | | | | | | | | | | | | | | | | | | | | | | | | | | | | | | | | | | | |
| | | | | | Investment Operations | | | Less Distributions to
Common Shareholders | | | Common Share |
| | | | | | | | | | | |
| | | Common Share Net Asset Value, Beginning of Period | | | Net Investment Income (NII) (Loss) | | | Net Realized/ Unrealized Gain (Loss) | | | Total | | | From NII | | | From Net Realized Gains | | | Return of Capital | | | Total | | | Premium per Share Sold through Shelf Offering | | | Net Asset Value, End of Period | | | Share Price, End of Period |
NDMO | | | | | | | | | | | | | | | | | | | | | | | | | | | | | | | | | | | | | | | | | | |
10/31/23 | | | $10.34 | | | | $0.43 | | | | $(0.17) | | | | $0.26 | | | | $(0.41) | | | | $– | | | | $(0.39) | | | | $(0.80) | | | | $– | | | | $9.80 | | | $9.12 |
10/31/22 | | | 15.60 | | | | 0.51 | | | | (4.85) | | | | (4.34) | | | | (0.50) | | | | – | | | | (0.42) | | | | (0.92) | | | | – | | | | 10.34 | | | 9.43 |
10/31/21 | | | 14.92 | | | | 0.49 | | | | 1.10 | | | | 1.59 | | | | (0.50) | | | | (0.31) | | | | (0.11) | | | | (0.92) | | | | 0.01 | | | | 15.60 | | | 15.64 |
10/31/20(c) | | | 15.00 | | | | 0.03 | | | | (0.03) | | | | – | | | | (0.08) | | | | – | | | | – | | | | (0.08) | | | | – | | | | 14.92 | | | 15.00 |
| (a) | Percentage is not annualized. |
| (b) | ● Net Investment Income (Loss) ratios reflect income earned and expenses incurred on assets attributable to preferred shares, borrowings and/or reverse repurchase agreements (as described in Notes to Financial Statements), where applicable. |
| | ● The expense ratios reflect, among other things, all interest expense and other costs related to borrowings and/or reverse repurchase agreements (as described in Notes to Financial Statements) and/or the interest expense deemed to have been paid by the Fund on the floating rate certificates issued by the special purpose trusts for the self-deposited inverse floaters held by the Fund (as described in Notes to Financial Statements), where applicable, as follows: |
| | | | |
| | | | | Ratios of Interest Expense to Average Net Assets Applicable to Common Shares |
| | | | NDMO |
| | 10/31/23 | | 1.54% |
| | 10/31/22 | | 0.75 |
| | 10/31/21 | | 0.33 |
| | 10/31/20(c) | | 0.03 |
212
| | | | | | | | | | | | | | | | | | | | | | | | | | | | | | | | | | | | | | | | | | |
| | | | | | | | | | | | Common Share Supplemental Data/ Ratios Applicable to Common Shares |
| | | Common Share
Total Returns | | | | | | | | | Ratios to Average
Net Assets | | | | | | |
| | | | | | | | | | | | | | | | | | | | | | | | | | | | | | | | | |
| | | | | | | | | | | |
| | | Based on Net Asset Value(a) | | | | | | Based on Share Price(a) | | | | | | Net Assets, End of Period (000) | | | | | | Expenses(b) | | | | | | Net Investment Income (Loss)(b) | | | | | | Portfolio Turnover Rate |
| | | | | | | | | | | | | | | | | | | | | | | | | | | | | | | | | | | | | | | | | | | |
| | | 1.96% | | | | | | | | 4.45% | | | | | | | | $583,504 | | | | | | | | 2.76 | % | | | | | | | 3.97 | % | | | | | | 79% |
| | | (28.77) | | | | | | | | (35.09) | | | | | | | | 615,154 | | | | | | | | 2.07 | | | | | | | | 3.78 | | | | | | | 61 |
| | | 10.77 | | | | | | | | 10.47 | | | | | | | | 913,547 | | | | | | | | 1.55 | | | | | | | | 3.02 | | | | | | | 63 |
| | | | (0.02) | | | | | | | | 0.51 | | | | | | | | 846,790 | | | | | | | | 0.89 | (d) | | | | | | | 1.06 | (d) | | | | | | 4 |
| (c) | For the period August 26, 2020 (commencement of operations) through October 31, 2020. |
See Notes to Financial Statements
213
Financial Highlights (continued)
The following table sets forth information regarding each Fund’s outstanding senior securities as of the end of each of the Fund’s last five fiscal periods, as applicable.
| | | | | | | | | | | | | | | | | | | | | | | | | | | | |
| | | AMTP Shares | | | MFP Shares | | | VRDP Shares | | | | |
| | | | | | | |
| | | | | | Asset | | | | | | Asset | | | | | | Asset | | | Asset | |
| | | Aggregate | | | Coverage | | | Aggregate | | | Coverage | | | Aggregate | | | Coverage | | | Coverage | |
| | | Amount | | | Per | | | Amount | | | Per | | | Amount | | | Per | | | Per $1 | |
| | | Outstanding | | | $100,000 | | | Outstanding | | | $100,000 | | | Outstanding | | | $100,000 | | | Liquidation | |
| | | (000)(a) | | | Share(b) | | | (000)(a) | | | Share(b),(d) | | | (000)(a) | | | Share(b) | | | Preference(e) | |
NVG | | | | | | | | | | | | | | | | | | | | | | | | | | | | |
10/31/23 | | | $– | | | | $– | | | | $517,400 | | | | $243,503 | | | | $1,236,600 | | | | $243,503 | | | | $2.44 | |
10/31/22 | | | – | | | | – | | | | 610,900 | | | | 240,935 | | | | 1,236,600 | | | | 240,935 | | | | 2.41 | |
10/31/21 | | | 112,000 | | | | 291,153 | | | | 405,400 | | | | 291,153 | | | | 1,411,600 | | | | 291,153 | | | | 2.91 | |
10/31/20 | | | 112,000 | | | | 285,399 | | | | 405,400 | | | | 285,399 | | | | 1,411,600 | | | | 285,399 | | | | 2.85 | |
10/31/19 | | | – | | | | – | | | | 405,400 | | | | 291,357 | | | | 1,411,600 | | | | 291,357 | | | | 2.91 | |
NZF | | | | | | | | | | | | | | | | | | | | | | | | | | | | |
10/31/23 | | | – | | | | – | | | | 641,000 | | | | 275,775 | | | | 677,000 | | | | 275,775 | | | | 2.76 | |
10/31/22 | | | – | | | | – | | | | 641,000 | | | | 243,831 | | | | 727,000 | | | | 243,831 | | | | 2.44 | |
10/31/21 | | | – | | | | – | | | | 641,000 | | | | 276,470 | | | | 727,000 | | | | 276,470 | | | | 2.76 | |
10/31/20 | | | – | | | | – | | | | 641,000 | | | | 265,787 | | | | 727,000 | | | | 265,787 | | | | 2.66 | |
10/31/19 | | | – | | | | – | | | | 641,000 | | | | 272,809 | | | | 727,000 | | | | 272,809 | | | | 2.73 | |
| (a) | Aggregate Amount Outstanding: Aggregate amount outstanding represents the liquidation preference as of the end of the relevant fiscal year and does not included any preferred shares noticed for redemption as noted on the Statement of Assets and Liabilities, where applicable. |
| (b) | Asset Coverage Per $100,000: Asset coverage per $100,000 is calculated by subtracting the Fund’s liabilities and indebtedness not represented by senior securities from the Fund’s total assets, dividing the result by the aggregate amount of the Fund’s senior securities representing indebtedness then outstanding (if applicable,) plus the aggregate of the involuntary liquidation preference of the outstanding preferred shares, if applicable, and multiplying the result by 100,000. |
| (c) | NVG’s Series B and Series C MFP Shares have a $1,000 liquidation preference per share, while all other MFP Shares have a $100,000 liquidation preference per share. The asset coverage per $1,000 share for NVG’s Series B and Series C MFP Shares were as follows: |
| | | | | | |
| | | NVG | |
| Asset
Coverage Per $1,000 Share(c) |
|
| | Series B | | | | |
| | 10/31/23 | | | $2,435 | |
| | 10/31/22 | | | 2,409 | |
| | 10/31/21 | | | 2,912 | |
| | 10/31/20 | | | 2,854 | |
| | 10/31/19 | | | 2,914 | |
| | Series C | | | | |
| | 10/31/23 | | | $2,435 | |
| | 10/31/22 | | | 2,409 | |
| | 10/31/21 | | | – | |
| | 10/31/20 | | | – | |
| | 10/31/19 | | | – | |
| (d) | Includes all preferred shares presented for the Fund. |
214
Financial Highlights (continued)
The following table sets forth information regarding each Fund’s outstanding senior securities as of the end of each of the Fund’s last five fiscal periods, as applicable.
| | | | | | | | | | | | | | | | | | | | | | | | |
| | | Borrowings | | | AMTP Shares | | | MFP Shares | |
| | | | | | |
| | | | | | | | | | | | Asset | | | | | | Asset | |
| | | Aggregate | | | Asset | | | Aggregate | | | Coverage | | | Aggregate | | | Coverage | |
| | | Amount | | | Coverage | | | Amount | | | Per | | | Amount | | | Per | |
| | | Outstanding | | | Per $1,000 | | | Outstanding | | | $100,000 | | | Outstanding | | | $100,000 | |
| | | (000)(a) | | | Share(b) | | | (000)(a) | | | Share(c) | | | (000)(a) | | | Share(c) | |
NMZ | | | | | | | | | | | | | | | | | | | | | | | | |
10/31/23 | | | $– | | | | $– | | | | $357,000 | | | | $393,599 | | | | $– | | | | $– | |
10/31/22 | | | – | | | | – | | | | 357,000 | | | | 406,158 | | | | – | | | | – | |
10/31/21 | | | – | | | | – | | | | 257,000 | | | | 646,596 | | | | – | | | | – | |
10/31/20 | | | – | | | | – | | | | 87,000 | | | | 1,361,400 | | | | – | | | | – | |
10/31/19 | | | – | | | | – | | | | 87,000 | | | | 1,213,872 | | | | – | | | | – | |
NMCO | | | | | | | | | | | | | | | | | | | | | | | | |
10/31/23 | | | – | | | | – | | | | – | | | | – | | | | 430,000 | | | | 228,205 | |
10/31/22 | | | – | | | | – | | | | – | | | | – | | | | 450,000 | | | | 237,489 | |
10/31/21 | | | – | | | | – | | | | – | | | | – | | | | 450,000 | | | | 283,171 | |
10/31/20 | | | – | | | | – | | | | – | | | | – | | | | 450,000 | | | | 251,669 | |
10/31/19(d) | | | – | | | | – | | | | – | | | | – | | | | – | | | | – | |
NDMO | | | | | | | | | | | | | | | | | | | | | | | | |
10/31/23 | | | – | | | | – | | | | – | | | | – | | | | 240,000 | | | | 343,127 | |
10/31/22 | | | – | | | | – | | | | – | | | | – | | | | 240,000 | | | | 356,314 | |
10/31/21 | | | 191,900 | | | | 5,761 | | | | – | | | | – | | | | – | | | | – | |
10/31/20(e) | | | – | | | | – | | | | – | | | | – | | | | – | | | | – | |
| (a) | Aggregate Amount Outstanding: Aggregate amount outstanding represents the principal amount outstanding or liquidation preference, if applicable, as of the end of the relevant fiscal year and does not included any preferred shares noticed for redemption as noted on the Statement of Assets and Liabilities, where applicable. |
| (b) | Asset Coverage Per $1,000: Asset coverage per $1,000 of debt is calculated by subtracting the Fund’s liabilities and indebtedness not represented by senior securities from the Fund’s total assets, dividing the results by the aggregate amount of the Fund’s senior securities representing indebtedness then outstanding (if applicable), plus the aggregate of the involuntary liquidation preference of the outstanding preferred shares, if applicable, and multiplying the result by 1,000. |
| (c) | Asset Coverage Per $100,000: Asset coverage per $100,000 is calculated by subtracting the Fund’s liabilities and indebtedness not represented by senior securities from the Fund’s total assets, dividing the result by the aggregate amount of the Fund’s senior securities representing indebtedness then outstanding (if applicable,) plus the aggregate of the involuntary liquidation preference of the outstanding preferred shares, if applicable, and multiplying the result by 100,000. |
| (d) | For the period September 16, 2019 (commencement of operations) through October 31, 2019. |
| (e) | For the period August 26, 2020 (commencement of operations) through October 31, 2020. |
215
Notes to Financial Statements
Fund Information: The funds covered in this report and their corresponding New York Stock Exchange (“NYSE”) symbols are as follows (each a “Fund” and collectively, the “Funds”):
| | · | | Nuveen AMT-Free Municipal Credit Income Fund (NVG) |
| | · | | Nuveen Municipal Credit Income Fund (NZF) |
| | · | | Nuveen Municipal High Income Opportunity Fund (NMZ) |
| | · | | Nuveen Municipal Credit Opportunities Fund (NMCO) |
| | · | | Nuveen Dynamic Municipal Opportunities Fund (NDMO) |
The Funds are registered under the Investment Company Act of 1940 (the “1940 Act”), as amended, as diversified closed-end management investment companies. NVG, NZF, NMZ, NMCO and NDMO were organized as Massachusetts business trusts on July 12, 1999, March 21, 2001, October 8, 2003, April 18, 2019 and November 4, 2019, respectively.
Current Fiscal Period: The end of the reporting period for the Funds is October 31, 2023, and the period covered by these Notes to Financial Statements is the fiscal year ended October 31, 2023 (the “current fiscal period”).
Investment Adviser and Sub-Adviser: The Funds’ investment adviser is Nuveen Fund Advisors, LLC (the “Adviser”), a subsidiary of Nuveen, LLC (“Nuveen”). Nuveen is the investment management arm of Teachers Insurance and Annuity Association of America (TIAA). The Adviser has overall responsibility for management of the Funds, oversees the management of the Funds’ portfolio, manages the Funds’ business affairs and provides certain clerical, bookkeeping and other administrative services, and, if necessary, asset allocation decisions. The Adviser has entered into sub-advisory agreements with Nuveen Asset Management, LLC, (the “Sub-Adviser”), a subsidiary of the Adviser, under which the Sub-Adviser manages the investment portfolios of the Funds.
Fund Reorganization and Mergers: Effective prior to the opening of business on June 6, 2022, Nuveen Enhanced Municipal Value Fund (NEV) (the “Target Fund”) was reorganized into Nuveen Municipal Credit Income Fund (“NZF” or the “Acquiring Fund”), (the “Reorganization”). Upon the closing of the Reorganization, the Target Fund transferred its assets to the Acquiring Fund in exchange for common shares of the Acquiring Fund and the assumption by the Acquiring Fund of the liabilities of the Target Fund. The Target Fund was then dissolved and terminated in accordance with its Declaration of Trust. Shareholders of the Target Fund became shareholders of the Acquiring Fund. Holders of common shares of the Target Fund received newly issued common shares of the Acquiring Fund, the aggregate net asset value (“NAV”) of which was equal to the aggregate NAV of the common shares of the Target Fund held immediately prior to the Reorganization (including for this purpose fractional Acquiring Fund shares to which shareholders were entitled). For accounting and performance reporting purposes, the Acquiring Fund was the survivor of the reorganization.
Effective prior to the opening of business on April 17, 2023, Nuveen Ohio Quality Municipal Income Fund (NUO) and Nuveen Georgia Quality Municipal Income Fund (NKG) (the “Target Funds”) were each merged into NZF (the “Acquiring Fund”) (each a “Merger”).
With respect to each Merger of a Target Fund with and into the Acquiring Fund, the separate legal existence of the Target Fund ceased for all purposes and the Acquiring Fund succeeded to all the assets and assumed all the liabilities of the Target Fund. Shares of the Target Fund were converted into newly issued shares of the Acquiring Fund. Holders of common shares of the Target Fund received newly issued common shares of the Acquiring Fund, the aggregate net asset value (“NAV”) of which was equal to the aggregate NAV of the common shares of the Target Fund held immediately prior to the Merger (including for this purpose fractional Acquiring Fund shares to which shareholders were entitled). For accounting and performance reporting purposes, the Acquiring Fund is the survivor. Refer to Note 11 for further details on each Merger.
Developments Regarding the Fund’s Control Share By-Law: On October 5, 2020, the Fund and certain other closed-end funds in the Nuveen fund complex amended their by-laws. Among other things, the amended by-laws included provisions pursuant to which, in summary, a shareholder who obtains beneficial ownership of common shares in a Control Share Acquisition (as defined in the by-laws) shall have the same voting rights as other common shareholders only to the extent authorized by the other disinterested shareholders (the “Control Share By-Law”). On January 14, 2021, a shareholder of certain Nuveen closed-end funds filed a civil complaint in the U.S. District Court for the Southern District of New York (the “District Court”) against certain Nuveen funds and their trustees, seeking a declaration that such funds’ Control Share By-Laws violate the 1940 Act, rescission of such fund’s Control Share By-Laws and a permanent injunction against such funds applying the Control Share By-Laws. On February 18, 2022, the District Court granted judgment in favor of the plaintiff’s claim for rescission of such funds’ Control Share By-Laws and the plaintiff’s declaratory judgment claim, and declared that such funds’ Control Share By-Laws violate Section 18(i) of the 1940 Act. Following review of the judgment of the District Court, on February 22, 2022, the Board of Trustees (the “Board”) amended the Fund’s by-laws to provide that the Fund’s Control Share By-Law shall be of no force and effect for so long as the judgment of the District Court is effective and that if the judgment of the District Court is reversed, overturned, vacated, stayed, or otherwise nullified, the Fund’s Control Share By-Law will be automatically reinstated and apply to any beneficial owner of common shares acquired in a Control Share Acquisition, regardless of whether such Control Share Acquisition occurs before or after such reinstatement, for the duration of the stay or upon issuance of the mandate reversing, overturning, vacating or otherwise nullifying the judgment of the District Court. On February 25, 2022, the Board and the Funds appealed the District Court’s decision to the U.S. Court of Appeals for the Second Circuit. On November 30, 2023, the U.S. Court of Appeals for the Second Circuit upheld the opinion of the District Court.
216
| 2. | Significant Accounting Policies |
The accompanying financial statements were prepared in accordance with accounting principles generally accepted in the United States of America (“U.S. GAAP”), which may require the use of estimates made by management and the evaluation of subsequent events. Actual results may differ from those estimates. Each Fund is an investment company and follows accounting guidance in the Financial Accounting Standards Board (“FASB”) Accounting Standards Codification 946, Financial Services — Investment Companies. The NAV for financial reporting purposes may differ from the NAV for processing security and shareholder transactions. The NAV for financial reporting purposes includes security and common share transactions through the date of the report. Total return is computed based on the NAV used for processing security and common share transactions. The following is a summary of the significant accounting policies consistently followed by the Funds.
Compensation: The Funds pay no compensation directly to those of its officers, all of whom receive remuneration for their services to the Funds from the Adviser or its affiliates. The Board has adopted a deferred compensation plan for independent trustees that enables trustees to elect to defer receipt of all or a portion of the annual compensation they are entitled to receive from certain Nuveen-advised funds. Under the plan, deferred amounts are treated as though equal dollar amounts had been invested in shares of select Nuveen-advised funds.
Custodian Fee Credit: As an alternative to overnight investments, each Fund has an arrangement with its custodian bank, State Street Bank and Trust Company, (the “Custodian”) whereby certain custodian fees and expenses are reduced by net credits earned on each Fund’s cash on deposit with the bank. Credits for cash balances may be offset by charges for any days on which a Fund overdraws its account at the Custodian. The amount of custodian fee credit earned by a Fund is recognized on the Statement of Operations as a component of “Custodian expenses, net.” During the current reporting period, the custodian fee credit earned by each Fund was as follows:
| | | | |
| Fund | | Gross Custodian Fee Credits | |
| |
| NVG | | $ | 253,070 | |
| |
| NZF | | | 176,540 | |
| |
| NMZ | | | 70,972 | |
| |
| NMCO | | | 28,638 | |
| |
| NDMO | | | 73,421 | |
Distributions to Common Shareholders: Distributions to common shareholders are recorded on the ex-dividend date. The amount, character and timing of distributions are determined in accordance with federal income tax regulations, which may differ from U.S. GAAP.
NDMO makes monthly cash distributions to common shareholders of a stated dollar amount per share. Subject to approval and oversight by the Board, the Fund seeks to maintain a stable distribution level designed to deliver the long-term return potential of the Fund’s investment strategy through regular monthly distributions (a “Managed Distribution Program”). Total distributions during a calendar year generally will be made from the Fund’s net investment income, net realized capital gains and net unrealized capital gains in the Fund’s portfolio, if any. The portion of distributions paid attributed to net unrealized gains, if any, is distributed from the Fund’s assets and is treated by common shareholders as a nontaxable distribution (“return of capital”) for tax purposes. In the event that total distributions during a calendar year exceed the Fund’s total return on NAV, the difference will reduce NAV per share. If the Fund’s total return on NAV exceeds total distributions during a calendar year, the excess will be reflected as an increase in NAV per share. The final determination of the source and character of all distributions paid by the Fund during the fiscal year is made after the end of the fiscal year and is reflected in the financial statements contained in the annual report as of October 31 each year.
Indemnifications: Under the Funds’ organizational documents, their officers and trustees are indemnified against certain liabilities arising out of the performance of their duties to the Funds. In addition, in the normal course of business, the Funds enter into contracts that provide general indemnifications to other parties. The Funds’ maximum exposure under these arrangements is unknown as this would involve future claims that may be made against the Funds that have not yet occurred. However, the Funds have not had prior claims or losses pursuant to these contracts and expects the risk of loss to be remote.
Investments and Investment Income: Securities transactions are accounted for as of the trade date for financial reporting purposes. Realized gains and losses on securities transactions are based upon the specific identification method. Investment income is comprised of interest income, which is recorded on an accrual basis and includes accretion of discounts and amortization of premiums for financial reporting purposes. Investment income also reflects payment-in-kind (“PIK”) interest and paydown gains and losses, if any. PIK interest represents income received in the form of securities in lieu of cash. Investment income also reflects dividend income, which is recorded on the ex-dividend date.
Netting Agreements: In the ordinary course of business, the Funds may enter into transactions subject to enforceable International Swaps and Derivatives Association, Inc. (ISDA) master agreements or other similar arrangements (“netting agreements”). Generally, the right to offset in netting agreements allows each Fund to offset certain securities and derivatives with a specific counterparty, when applicable, as well as any collateral received or delivered to that counterparty based on the terms of the agreements. Generally, each Fund manages its cash collateral and securities collateral on a counterparty basis. With respect to certain counterparties, in accordance with the terms of the netting agreements, collateral posted to the Funds is held in a segregated account by the Funds’ custodian and/or with respect to those amounts which can be sold or repledged, are presented in the Funds’ Portfolio of Investments or Statement of Assets and Liabilities.
217
Notes to Financial Statements (continued)
The Funds’ investments subject to netting agreements as of the end of the reporting period, if any, are further described later in these Notes to Financials.
New Accounting Pronouncement: In March 2020, FASB issued Accounting Standards Update (“ASU”) 2020-04, Reference Rate Reform: Facilitation of the Effects of Reference Rate Reform on Financial Reporting. The main objective of the new guidance is to provide relief to companies that will be impacted by the expected change in benchmark interest rates, when participating banks will no longer be required to submit London Interbank Offered Rate (LIBOR) quotes by the UK Financial Conduct Authority (FCA). The new guidance allows companies to, provided the only change to existing contracts are a change to an approved benchmark interest rate, account for modifications as a continuance of the existing contract without additional analysis. For new and existing contracts, the Funds may elect to apply the amendments as of March 12, 2020 through December 31, 2022. In December 2022, FASB deferred ASU 2022-04 and issued ASU 2022-06, Reference Rate Reform: Deferral of the Sunset Date of Topic 848, which extends the application of the amendments through December 31, 2024. Management has not yet elected to apply the amendments, is continuously evaluating the potential effect a discontinuation of LIBOR could have on the Funds’ investments and has currently determined that it is unlikely the ASU’s adoption will have a significant impact on the Funds’ financial statements and various filings.
| 3. | Investment Valuation and Fair Value Measurements |
The Funds’ investments in securities are recorded at their estimated fair value utilizing valuation methods approved by the Adviser, subject to oversight of the Board. Fair value is defined as the price that would be received upon selling an investment or transferring a liability in an orderly transaction to an independent buyer in the principal or most advantageous market for the investment. U.S. GAAP establishes the three-tier hierarchy which is used to maximize the use of observable market data and minimize the use of unobservable inputs and to establish classification of fair value measurements for disclosure purposes. Observable inputs reflect the assumptions market participants would use in pricing the asset or liability. Observable inputs are based on market data obtained from sources independent of the reporting entity. Unobservable inputs reflect management’s assumptions about the assumptions market participants would use in pricing the asset or liability. Unobservable inputs are based on the best information available in the circumstances. The following is a summary of the three-tiered hierarchy of valuation input levels.
| | |
| Level 1 – | | Inputs are unadjusted and prices are determined using quoted prices in active markets for identical securities. |
| |
| Level 2 – | | Prices are determined using other significant observable inputs (including quoted prices for similar securities, interest rates, credit spreads, etc.). |
| |
| Level 3 – | | Prices are determined using significant unobservable inputs (including management’s assumptions in determining the fair value of investments). |
A description of the valuation techniques applied to the Funds’ major classifications of assets and liabilities measured at fair value follows:
Equity securities and exchange-traded funds listed or traded on a national market or exchange are valued based on their last reported sales price or official closing price of such market or exchange on the valuation date. Foreign equity securities and registered investment companies that trade on a foreign exchange are valued at the last reported sales price or official closing price on the principal exchange where traded, and converted to U.S. dollars at the prevailing rates of exchange on the valuation date. For events affecting the value of foreign securities between the time when the exchange on which they are traded closes and the time when the Funds’ net assets are calculated, such securities will be valued at fair value in accordance with procedures adopted by the Adviser, subject to the oversight of the Board. To the extent these securities are actively traded and no valuation adjustments are applied, they are generally classified as Level 1. When valuation adjustments are applied to the most recent last sales price or official closing price, these securities are generally classified as Level 2.
Prices of fixed-income securities are generally provided by pricing services approved by the Adviser, which is subject to review by the Adviser and oversight of the Board. Pricing services establish a security’s fair value using methods that may include consideration of the following: yields or prices of investments of comparable quality, type of issue, coupon, maturity and rating, market quotes or indications of value from security dealers, evaluations of anticipated cash flows or collateral, general market conditions and other information and analysis, including the obligor’s credit characteristics considered relevant. In pricing certain securities, particularly less liquid and lower quality securities, pricing services may consider information about a security, its issuer or market activity provided by the Adviser. These securities are generally classified as Level 2.
Investments in investment companies are valued at their respective NAVs or share price on the valuation date and are generally classified as Level 1.
For any portfolio security or derivative for which market quotations are not readily available or for which the Adviser deems the valuations derived using the valuation procedures described above not to reflect fair value, the Adviser will determine a fair value in good faith using alternative procedures approved by the Adviser, subject to the oversight of the Board. As a general principle, the fair value of a security is the amount that the owner might reasonably expect to receive for it in a current sale. A variety of factors may be considered in determining the fair value of such securities, which may include consideration of the following: yields or prices of investments of comparable quality, type of issue, coupon, maturity and rating, market quotes or indications of value from security dealers, evaluations of anticipated cash flows or collateral, general market conditions and other information and analysis, including the obligor’s credit characteristics considered relevant. To the extent the inputs are observable and timely, the values would be classified as Level 2; otherwise they would be classified as Level 3.
The following table summarizes the market value of the Funds’ investments as of the end of the reporting period, based on the inputs used to value them:
218
| | | | | | | | | | | | | | |
| NVG | | Level 1 | | | Level 2 | | | Level 3 | | | Total |
Long-Term Investments: | | | | | | | | | | | | | | |
Municipal Bonds | | $ | – | | | $ | 4,300,095,348 | | | $ | 65,578* | | | $ 4,300,160,926 |
Common Stocks | | | – | | | | 60,097,967 | | | | – | | | 60,097,967 |
Short-Term Investments: | | | | | | | | | | | | | | |
Municipal Bonds | | | – | | | | 39,360,000 | | | | – | | | 39,360,000 |
Total | | $ | – | | | $ | 4,399,553,315 | | | $ | 65,578 | | | $ 4,399,618,893 |
| | | | |
| NZF | | Level 1 | | | Level 2 | | | Level 3 | | | Total |
Long-Term Investments: | | | | | | | | | | | | | | |
Municipal Bonds | | $ | – | | | $ | 3,843,938,925 | | | $ | 18,415* | | | $ 3,843,957,340 |
Common Stocks | | | – | | | | 120,121,945 | | | | – | | | 120,121,945 |
Investment Companies | | | 972,719 | | | | – | | | | – | | | 972,719 |
Total | | $ | 972,719 | | | $ | 3,964,060,870 | | | $ | 18,415 | | | $ 3,965,052,004 |
| | | | |
| NMZ | | Level 1 | | | Level 2 | | | Level 3 | | | Total |
Long-Term Investments: | | | | | | | | | | | | | | |
Municipal Bonds | | $ | – | | | $ | 1,711,837,211 | | | $ | 11,110,430* | | | $ 1,722,947,641 |
Common Stocks | | | – | | | | 59,628,110 | | | | – | | | 59,628,110 |
Variable Rate Senior Loan Interests | | | – | | | | – | | | | 162,238* | | | 162,238 |
Total | | $ | – | | | $ | 1,771,465,321 | | | $ | 11,272,668 | | | $ 1,782,737,989 |
| | | | |
| NMCO | | Level 1 | | | Level 2 | | | Level 3 | | | Total |
Long-Term Investments: | | | | | | | | | | | | | | |
Municipal Bonds | | $ | – | | | $ | 916,132,831 | | | $ | 11,876,721* | | | $ 928,009,552 |
Common Stocks | | | – | | | | 72,523,127 | | | | – | | | 72,523,127 |
Variable Rate Senior Loan Interests | | | – | | | | – | | | | 70,482* | | | 70,482 |
Total | | $ | – | | | $ | 988,655,958 | | | $ | 11,947,203 | | | $ 1,000,603,161 |
| | | | |
| NDMO | | Level 1 | | | Level 2 | | | Level 3 | | | Total |
Long-Term Investments: | | | | | | | | | | | | | | |
Municipal Bonds | | $ | – | | | $ | 811,247,706 | | | $ | 2,358,992* | | | $ 813,606,698 |
Corporate Bonds | | | – | | | | 7,818,320 | | | | 457,538* | | | 8,275,858 |
Common Stocks | | | – | | | | 894,520 | | | | – | | | 894,520 |
Variable Rate Senior Loan Interests | | | – | | | | – | | | | 28,193* | | | 28,193 |
Short-Term Investments: | | | | | | | | | | | | | | |
Municipal Bonds | | | – | | | | 9,000,000 | | | | – | | | 9,000,000 |
Total | | $ | – | | | $ | 828,960,546 | | | $ | 2,844,723 | | | $ 831,805,269 |
| * | Refer to the Fund’s Portfolio of Investments for securities classified as Level 3. |
The Funds hold liabilities in floating rate obligations and preferred shares, where applicable, which are not reflected in the tables above. The fair values of the Funds’ liabilities for floating rate obligations approximate their liquidation values. Floating rate obligations are generally classified as Level 2 and further described later in these Notes to Financial Statements. The fair values of the Funds’ liabilities for preferred shares approximate their liquidation preference. Preferred shares are generally classified as Level 2 and further described later in these Notes to Financial Statements.
The following is a reconciliation of the Funds’ Level 3 investments held at the beginning and end of the measurement period:
219
Notes to Financial Statements (continued)
| | | | | | | | | | | | | | | | | | | | | | | | |
| | | NVG | | | NZF | | | | | | NMZ | |
| | | | | | | | | | | | | | | | |
| | | | |
| | | Level 3 | | | Level 3 | | | | | | Level 3 | |
| | | | | | | | | | | | | | | | |
| | | Municipal
Bonds | | | Municipal
Bonds | | | | | | Municipal
Bonds | | | Corporate
Bonds | | | Variable Rate Senior Loan Interests | |
| |
Balance at the beginning of period | | | $196,331 | | | | $55,131 | | | | | | | | $2,568,954 | | | | $128,102 | | | | $- | |
Gains (losses): | | | | | | | | | | | | | | | | | | | | | | | | |
Net realized gains (losses) | | | 1,013 | | | | 10,754 | | | | | | | | 740 | | | | (3,389,925) | | | | - | |
Change in net unrealized appreciation (depreciation) | | | (1,013) | | | | (10,754) | | | | | | | | (2,396,022) | | | | 3,341,898 | | | | (351,691) | |
Purchases at cost | | | - | | | | - | | | | | | | | 285,000 | | | | - | | | | 700,000 | |
Sales at proceeds | | | (130,753) | | | | (36,716) | | | | | | | | (441,625) | | | | (80,075) | | | | (249,634) | |
Net discounts (premiums) | | | - | | | | - | | | | | | | | - | | | | - | | | | - | |
Transfers into | | | - | | | | - | | | | | | | | 11,093,393 | | | | - | | | | 63,563 | |
Transfers (out of) | | | - | | | | - | | | | | | | | (10) | | | | - | | | | - | |
| |
Balance at the end of period | | | $65,578 | | | | $18,415 | | | | | | | | $11,110,430 | | | | $- | | | | $162,238 | |
| |
| Change in net unrealized appreciation (depreciation) during the period of Level 3 securities held as of period end | | | $(1,013) | | | | $(10,754) | | | | | | | | $(33,337,790) | | | | $- | | | | $(645,224) | |
| |
| | | |
| | | NMCO | | | | | | NDMO | |
| | | | | | | | | | | | |
| | | |
| | | Level 3 | | | | | | Level 3 | |
| | | | | | | | | | | | |
| | | Municipal
Bonds | | | Variable Rate
Senior Loan
Interests | | | | | | Municipal
Bonds | | | Corporate
Bonds | | | Variable Rate
Senior Loan
Interests | |
| |
Balance at the beginning of period | | | $274,007 | | | | $- | | | | | | | | $- | | | | $- | | | | $- | |
Gains (losses): | | | | | | | | | | | | | | | | | | | | | | | | |
Net realized gains (losses) | | | 463 | | | | - | | | | | | | | - | | | | - | | | | - | |
Change in net unrealized appreciation (depreciation) | | | (210,442) | | | | (251,208) | | | | | | | | (99,990) | | | | - | | | | (100,483) | |
Purchases at cost | | | 210,000 | | | | 500,000 | | | | | | | | 100,000 | | | | - | | | | 200,000 | |
Sales at proceeds | | | (182,485) | | | | (178,310) | | | | | | | | - | | | | - | | | | (71,324) | |
Net discounts (premiums) | | | - | | | | - | | | | | | | | - | | | | - | | | | - | |
Transfers into | | | 11,785,178 | | | | - | | | | | | | | 2,358,982 | | | | 457,538 | | | | - | |
Transfers (out of) | | | - | | | | - | | | | | | | | - | | | | - | | | | - | |
| | | | | | | | | |
Balance at the end of period | | | $11,876,721 | | | | $70,482 | | | | | | | | $2,358,992 | | | | $457,538 | | | | $28,193 | |
| | | | | | | | | |
| Change in net unrealized appreciation (depreciation) during the period of Level 3 securities held as of period end | | | $(35,562,327) | | | | $(251,208) | | | | | | | | $(6,547,231) | | | | $22,945 | | | | $(100,483) | |
| | | | | | | | | |
The valuation techniques and significant unobservable inputs used in recurring Level 3 fair value measurements of assets as of the end of the reporting period, were as follows:
| | | | | | | | | | | | | | | | | | |
| Fund | | Asset Class | | Market
Value | | | Techniques | | Unobservable Inputs | | | | Range | | Weighted Average | |
| |
NVG | | Municipal Bonds | | $ | 65,578 | | | Expected Recovery | | Recovery Proceeds | | | | 100% | | | N/A | |
| |
| | | | | | | |
| Fund | | Asset Class | | Market
Value | | | Techniques | | Unobservable Inputs | | | | Range | | Weighted Average | |
| |
NZF | | Municipal Bonds | | $ | 18,415 | | | Expected Recovery | | Recovery Proceeds | | | | 100% | | | N/A | |
| |
220
| | | | | | | | | | | | |
| Fund | | Asset Class | | Market Value | | Techniques | | Unobservable Inputs | | Range | | Weighted Average |
NMZ | | Municipal Bonds | | $11,110,430 | | Expected Recovery | | Recovery Proceeds | | 10.08% - 100% | | 0.146% - 9.776% |
| | |
| | | | | | Discounted Cash Flow | | Yield Spread | | 1.55% - 1.93% | | 88.627% |
| | | | | | | | Discount Rate | | 10% - 15% | | 0.0057% - 0.0059% |
| | | | | | Probability Weighted Expected Recovery | | Recovery Proceeds | | 0.01% - 130% | | 0.0057% - 88.627% |
| | | | | | | | Scenario Weights | | 0% - 100% | | 0.0057% - 88.627% |
| | |
| | Variable Rate Senior Loan Interests | | 162,238 | | Discounted Cash Flow | | Discount Rate | | 10% - 15% | | 0.564% - 0.875% |
| | | | | | Probability Weighted Expected Recovery | | Recovery Proceeds | | 0.01% - 130% | | 0.564% - 0.875% |
| | | | | | | | | Scenario Weights | | 0% - 100% | | 0.564% - 0.875% |
Total | | | | $11,272,668 | | | | | | | | |
| | | | | | |
| Fund | | Asset Class | | Market Value | | Techniques | | Unobservable Inputs | | Range | | Weighted Average |
NMCO | | Municipal Bonds | | $11,876,721 | | Expected Recovery | | Recovery Proceeds | | 10.08% - 100% | | 0.77% - 23.56% |
| | |
| | | | | | Discounted Cash Flow | | Yield Spread | | 1.55% - 1.93% | | 75.08% |
| | | | | | | | Discount Rate | | 15.00% | | 0.004% |
| | | | | | Probability Weighted Expected Recovery | | Recovery Proceeds | | 0.01% - 130% | | 0.004% - 75.08% |
| | | | | | | | Scenario Weights | | 0% - 100% | | 0.004% - 75.08% |
| | |
| | Variable Rate Senior Loan Interests | | 70,482 | | Discounted Cash Flow | | Discount Rate | | 15.00% | | 0.59% |
| | | | | | |
| | | | | | Probability Weighted Expected Recovery | | Recovery Proceeds | | 21.91% | | 0.59% |
| | | | | | | | | Scenario Weights | | 0% - 100% | | 0.59% |
Total | | | | $11,947,203 | | | | | | | | |
| | | | | | |
| Fund | | Asset Class | | Market Value | | Techniques | | Unobservable Inputs | | Range | | Weighted Average |
NDMO | | Municipal Bonds | | $2,358,992 | | Expected Recovery | | Recovery Proceeds | | 70.00% | | 7.09% |
| | |
| | | | | | Discounted Cash Flow | | Yield Spread | | 1.55% - 1.93% | | 75.83% |
| | | | | | | | Discount Rate | | 15.00% | | 0.005% |
| | | | | | |
| | | | | | Probability Weighted Expected Recovery | | Recovery Proceeds | | 0.01% - 130% | | 0.005% - 75.83% |
| | | | | | | | Scenario Weights | | 0% - 100% | | 0.005% - 75.83% |
| | |
| | Corporate Bonds | | 457,538 | | | | | | 4.375% | | 16.08% |
| | |
| | Variable Rate Senior Loan Interests | | 28,193 | | Discounted Cash Flow | | Yield Spread | | 15% | | 0.99% |
| | | | | | |
| | | | | | Probability Weighted Expected Recovery | | Recovery Proceeds | | 21.91% | | 0.99% |
| | | | | | | | | Scenario Weights | | 0% - 100% | | 0.99% |
Total | | | | $2,844,723 | | | | | | | | |
The table below presents the transfers in and out of the three valuation levels for the Funds as of the end of the reporting period when compared to the valuation levels at the end of the previous fiscal year. Changes in valuation inputs or methodologies may result in transfers into or out of an assigned level within the fair value hierarchy. Transfers in or out of levels are generally due to the availability of publicly available information and to the significance or extent the Adviser determines that the valuation inputs or methodologies may impact the valuation of those securities.
| | | | | | | | | | | | | | | | | | | | | | |
| | | Level 1 | | Level 2 | | | Level 3 | |
| | | Transfers In | | | (Transfers Out) | | Transfers In | | | (Transfers Out) | | | Transfers In | | | (Transfers Out) | |
NMZ | | | | | | | | | | | | | | | | | | | | | | |
Municipal Bonds | | | $- | | | $- | | | $- | | | | $- | | | | $11,093,393 | | | | $(10) | |
Variable Rate Senior Loan Interests | | | $- | | | $- | | | $- | | | | $- | | | | 63,563 | | | | $- | |
NMCO | | | | | | | | | | | | | | | | | | | | | | |
Municipal Bonds | | | $- | | | $- | | | $- | | | | $- | | | | $11,785,178 | | | | $- | |
NDMO | | | | | | | | | | | | | | | | | | | | | | |
Municipal Bonds | | | $- | | | $- | | | $- | | | | $- | | | | $2,358,982 | | | | $- | |
Corporate Bonds | | | $- | | | $- | | | $- | | | | $- | | | | 457,538 | | | | $- | |
221
Notes to Financial Statements (continued)
Inverse Floating Rate Securities: Each Fund is authorized to invest in inverse floating rate securities. An inverse floating rate security is created by depositing a municipal bond (referred to as an “Underlying Bond”), typically with a fixed interest rate, into a special purpose tender option bond (“TOB”) trust (referred to as the “TOB Trust”) created by or at the direction of one or more Funds. In turn, the TOB Trust issues (a) floating rate certificates (referred to as “Floaters”), in face amounts equal to some fraction of the Underlying Bond’s par amount or market value, and (b) an inverse floating rate certificate (referred to as an “Inverse Floater”) that represents all remaining or residual interest in the TOB Trust. Floaters typically pay short-term tax-exempt interest rates to third parties who are also provided a right to tender their certificate and receive its par value, which may be paid from the proceeds of a remarketing of the Floaters, by a loan to the TOB Trust from a third party liquidity provider (“Liquidity Provider”), or by the sale of assets from the TOB Trust. The Inverse Floater is issued to a long term investor, such as one or more Funds. The income received by the Inverse Floater holder varies inversely with the short-term rate paid to holders of the Floaters, and in most circumstances the Inverse Floater holder bears substantially all of the Underlying Bond’s downside investment risk and also benefits disproportionately from any potential appreciation of the Underlying Bond’s value. The value of an Inverse Floater will be more volatile than that of the Underlying Bond because the interest rate is dependent on not only the fixed coupon rate of the Underlying Bond but also on the short-term interest paid on the Floaters, and because the Inverse Floater essentially bears the risk of loss (and possible gain) of the greater face value of the Underlying Bond.
The Inverse Floater held by a Fund gives the Fund the right to (a) cause the holders of the Floaters to tender their certificates at par (or slightly more than par in certain circumstances), and (b) have the trustee of the TOB Trust (the “Trustee”) transfer the Underlying Bond held by the TOB Trust to the Fund, thereby collapsing the TOB Trust.
The Fund may acquire an Inverse Floater in a transaction where it (a) transfers an Underlying Bond that it owns to a TOB Trust created by a third party or (b) transfers an Underlying Bond that it owns, or that it has purchased in a secondary market transaction for the purpose of creating an Inverse Floater, to a TOB Trust created at its direction, and in return receives the Inverse Floater of the TOB Trust (referred to as a “self-deposited Inverse Floater”). A Fund may also purchase an Inverse Floater in a secondary market transaction from a third party creator of the TOB Trust without first owning the Underlying Bond (referred to as an “externally-deposited Inverse Floater”).
An investment in a self-deposited Inverse Floater is accounted for as a “financing” transaction (i.e., a secured borrowing). For a self-deposited Inverse Floater, the Underlying Bond deposited into the TOB Trust is identified in the Fund’s Portfolio of Investments as “(UB) – Underlying bond of an inverse floating rate trust reflected as a financing transaction,” with the Fund recognizing as liabilities, labeled “Floating rate obligations” on the Statement of Assets and Liabilities, (a) the liquidation value of Floaters issued by the TOB Trust, and (b) the amount of any borrowings by the TOB Trust from a Liquidity Provider to enable the TOB Trust to purchase outstanding Floaters in lieu of a remarketing. In addition, the Fund recognizes in “Investment Income” the entire earnings of the Underlying Bond, and recognizes (a) the interest paid to the holders of the Floaters or on the TOB Trust’s borrowings, and (b) other expenses related to remarketing, administration, trustee, liquidity and other services to a TOB Trust, as a component of “Interest expense and amortization of offering costs” on the Statement of Operations. Earnings due from the Underlying Bond and interest due to the holders of the Floaters as of the end of the reporting period are recognized as components of “Receivable for interest” and “Payable for interest” on the Statement of Assets and Liabilities, respectively.
In contrast, an investment in an externally-deposited Inverse Floater is accounted for as a purchase of the Inverse Floater and is identified in the Fund’s Portfolio of Investments as “(IF) – Inverse floating rate investment.” For an externally-deposited Inverse Floater, a Fund’s Statement of Assets and Liabilities recognizes the Inverse Floater and not the Underlying Bond as an asset, and the Fund does not recognize the Floaters, or any related borrowings from a Liquidity Provider, as a liability. Additionally, the Fund reflects in “Investment Income” only the net amount of earnings on the Inverse Floater (net of the interest paid to the holders of the Floaters or the Liquidity Provider as lender, and the expenses of the Trust), and does not show the amount of that interest paid or the expenses of the TOB Trust as described above as interest expense on the Statement of Operations.
Fees paid upon the creation of a TOB Trust for self-deposited Inverse Floaters and externally-deposited Inverse Floaters are recognized as part of the cost basis of the Inverse Floater and are capitalized over the term of the TOB Trust.
As of the end of the reporting period, the aggregate value of Floaters issued by each Fund’s TOB Trust for self-deposited Inverse Floaters and externally-deposited Inverse Floaters was as follows:
| | | | | | | | | | | | |
| Fund | | Floating Rate Obligations: Self- Deposited Inverse Floaters | | | Floating Rate Obligations: Externally-Deposited Inverse Floaters | | | Total | |
| | | |
NVG | | $ | 210,540,000 | | | $ | 8,160,000 | | | $ | 218,700,000 | |
| | | |
NZF | | | 374,706,000 | | | | 12,755,000 | | | | 387,461,000 | |
| | | |
NMZ | | | 406,701,000 | | | | 11,290,000 | | | | 417,991,000 | |
| | | |
NMCO | | | 19,960,000 | | | | – | | | | 19,960,000 | |
| | | |
NDMO | | | 650,000 | | | | – | | | | 650,000 | |
During the current fiscal period, the average amount of Floaters (including any borrowings from a Liquidity Provider) outstanding, and the average annual interest rates and fees related to self-deposited Inverse Floaters, were as follows:
222
| | | | | | |
| Fund | | Average Floating Rate Obligations Outstanding | | | Average Annual Interest Rate And Fees |
|
| | |
NVG | | $ | 205,665,849 | | | 3.68% |
| | |
NZF | | | 280,044,101 | | | 3.86 |
| | |
NMZ | | | 427,319,148 | | | 3.74 |
| | |
NMCO | | | 23,035,685 | | | 3.79 |
| | |
NDMO | | | 3,293,726 | | | 3.50 |
|
TOB Trusts are supported by a liquidity facility provided by a Liquidity Provider pursuant to which the Liquidity Provider agrees, in the event that Floaters are (a) tendered to the Trustee for remarketing and the remarketing does not occur, or (b) subject to mandatory tender pursuant to the terms of the TOB Trust agreement, to either purchase Floaters or to provide the Trustee with an advance from a loan facility to fund the purchase of Floaters by the TOB Trust. In certain circumstances, the Liquidity Provider may otherwise elect to have the Trustee sell the Underlying Bond to retire the Floaters that were tendered and not remarketed prior to providing such a loan. In these circumstances, the Liquidity Provider remains obligated to provide a loan to the extent that the proceeds of the sale of the Underlying Bond are not sufficient to pay the purchase price of the Floaters.
The size of the commitment under the loan facility for a given TOB Trust is at least equal to the balance of that TOB Trust’s outstanding Floaters plus any accrued interest. In consideration of the loan facility, fee schedules are in place and are charged by the Liquidity Provider(s). Any loans made by the Liquidity Provider will be secured by the purchased Floaters held by the TOB Trust. Interest paid on any outstanding loan balances will be effectively borne by the Fund that owns the Inverse Floaters of the TOB Trust that has incurred the borrowing and may be at a rate that is greater than the rate that would have been paid had the Floaters been successfully remarketed.
As described above, any amounts outstanding under a liquidity facility are recognized as a component of “Floating rate obligations” on the Statement of Assets and Liabilities by the Fund holding the corresponding Inverse Floaters issued by the borrowing TOB Trust. As of the end of the reporting period, there were no loans outstanding under any such facility.
Each Fund may also enter into shortfall and forbearance agreements (sometimes referred to as a “recourse arrangement”) (TOB Trusts involving such agreements are referred to herein as “Recourse Trusts”), under which a Fund agrees to reimburse the Liquidity Provider for the Trust’s Floaters, in certain circumstances, for the amount (if any) by which the liquidation value of the Underlying Bond held by the TOB Trust may fall short of the sum of the liquidation value of the Floaters issued by the TOB Trust plus any amounts borrowed by the TOB Trust from the Liquidity Provider, plus any shortfalls in interest cash flows (sometimes referred to as “shortfall payments”). Under these agreements, a Fund’s potential exposure to losses related to or on an Inverse Floater may increase beyond the value of the Inverse Floater as a Fund may potentially be liable to fulfill all amounts owed to holders of the Floaters or the Liquidity Provider. Any such shortfall amount in the aggregate is recognized as “Unrealized depreciation on Recourse Trusts” on the Statement of Assets and Liabilities. During the current fiscal period NZF, NMZ and NMCO made Shortfall Payments in the amounts of $3,272,586, $874,057 and $178,372, respectively. Such amounts are recognized as a component of “Net realized gain (loss) from investments” on the Statement of Operations. NVG and NDMO did not make shortfall Payments during the current reporting period.
As of the end of the reporting period, the Funds maximum exposure to the Floaters issued by Recourse Trusts for self-deposited Inverse Floaters and externally-deposited Inverse Floaters was as follows:
| | | | | | | | | | | | |
| Fund | | Maximum Exposure to Recourse Trusts: Self-Deposited Inverse Floaters | | | Maximum Exposure to Recourse Trusts: Externally-Deposited Inverse Floaters | | | Total | |
| | | |
NVG | | $ | 208,240,000 | | | $ | – | | | $ | 208,240,000 | |
| | | |
NZF | | | 368,406,000 | | | | 12,755,000 | | | | 381,161,000 | |
| | | |
NMZ | | | 406,701,000 | | | | 11,290,000 | | | | 417,991,000 | |
| | | |
NMCO | | | 19,960,000 | | | | – | | | | 19,960,000 | |
| | | |
NDMO | | | 650,000 | | | | – | | | | 650,000 | |
Zero Coupon Securities: A zero coupon security does not pay a regular interest coupon to its holders during the life of the security. Income to the holder of the security comes from accretion of the difference between the original purchase price of the security at issuance and the par value of the security at maturity and is effectively paid at maturity. The market prices of zero coupon securities generally are more volatile than the market prices of securities that pay interest periodically.
Purchases and Sales: Long-term purchases and sales during the current fiscal period were as follows:
223
Notes to Financial Statements (continued)
| | | | | | | | |
| Fund | | Non-U.S. Government Purchases | | | Non-U.S. Government Sales and Maturities | |
| | |
NVG | | $ | 792,547,111 | | | $ | 933,653,774 | |
| | |
NZF | | | 1,181,054,995 | | | | 1,026,257,806 | |
| | |
NMZ | | | 544,946,481 | | | | 583,454,738 | |
| | |
NMCO | | | 372,497,802 | | | | 407,863,387 | |
| | |
NDMO | | | 724,765,592 | | | | 684,528,955 | |
The Funds may purchase securities on a when-issued or delayed-delivery basis. Securities purchased on a when-issued or delayed-delivery basis may have extended settlement periods; interest income is not accrued until settlement date. Any securities so purchased are subject to market fluctuation during this period. If a Fund has outstanding when-issued/delayed-delivery purchases commitments as of the end of the reporting period, such amounts are recognized on the Statement of Assets and Liabilities.
Each Fund is authorized to invest in certain derivative instruments. As defined by U.S. GAAP, a derivative is a financial instrument whose value is derived from an underlying security price, foreign exchange rate, interest rate, index of prices or rates, or other variables. Investments in derivatives as of the end of and/or during the current fiscal period, if any, are included within the Statement of Assets and Liabilities and the Statement of Operations, respectively.
Futures Contracts: During the current fiscal period, NDMO managed the duration of its portfolio by shorting interest rate futures contracts.
A futures contract is an agreement between two parties to buy and sell a financial instrument for a set price on a future date. Upon execution of a futures contract, the Fund is obligated to deposit cash or eligible securities, also known as “initial margin,” into an account at its clearing broker equal to a specified percentage of the contract amount. Securities deposited for initial margin, if any, are identified in the Portfolio of Investments and cash deposited for initial margin, if any, is reflected on the Statement of Assets and Liabilities.
During the period the futures contract is open, changes in the market value of the contract are recognized as an unrealized gain or loss by “marking-to-market” on a daily basis. The Fund and the clearing broker are obligated to settle monies on a daily basis representing the changes in the value of the contracts. These daily cash settlements are known as “variation margin” and is recognized on the Statement of Assets and Liabilities as a receivable or payable for variation margin on futures contracts. When the contract is closed or expired, the Fund records a realized gain or loss equal to the difference between the value of the contract on the closing date and value of the contract when originally entered into. The net realized gain or loss and the change in unrealized appreciation (depreciation) on futures contracts held during the period is included on the Statement of Operations.
Risks of investments in futures contracts include the possible adverse movement in the price of the securities or indices underlying the contracts, the possibility that there may not be a liquid secondary market for the contracts and/or that a change in the value of the contract may not correlate with a change in the value of the underlying securities or indices.
The average notional amount of futures contracts outstanding during the current fiscal period was as follows:
| | | | |
| Fund | | Average Notional Amount of Futures Contracts Outstanding* | |
NDMO | | | $3,032,340 | |
| * | The average notional amount is calculated based on the absolute aggregate notional amount of contracts outstanding at the beginning of the current fiscal period and at the end of each fiscal quarter within the current fiscal period. |
During the current fiscal period, the effect of derivative contracts on the Fund’s Statement of Operations was as follows:
| | | | | | | | | | | | |
| Derivative Instrument | | Risk Exposure | | | | Net Realized Gain (Loss) | | | Change in Unrealized Appreciation (Depreciation) | |
NDMO | | | | | | | | | | | | |
Futures contracts | | Interest rate | | | | | $831,869 | | | | $(2,140,765) | |
Market and Counterparty Credit Risk: In the normal course of business each Fund may invest in financial instruments and enter into financial transactions where risk of potential loss exists due to changes in the market (market risk) or failure of the other party to the transaction to perform (counterparty credit risk). The potential loss could exceed the value of the financial assets recorded on the financial statements. Financial assets, which potentially expose each Fund to counterparty credit risk, consist principally of cash due from counterparties on forward, option and swap transactions, when applicable. The extent of each Fund’s exposure to counterparty credit risk in respect to these financial assets approximates their carrying value as recorded on the Statement of Assets and Liabilities.
224
Each Fund helps manage counterparty credit risk by entering into agreements only with counterparties the Adviser believes have the financial resources to honor their obligations and by having the Adviser monitor the financial stability of the counterparties. Additionally, counterparties may be required to pledge collateral daily (based on the daily valuation of the financial asset) on behalf of each Fund with a value approximately equal to the amount of any unrealized gain above a pre-determined threshold. Reciprocally, when each Fund has an unrealized loss, the Funds have instructed the custodian to pledge assets of the Funds as collateral with a value approximately equal to the amount of the unrealized loss above a pre-determined threshold. Collateral pledges are monitored and subsequently adjusted if and when the valuations fluctuate, either up or down, by at least the pre-determined threshold amount.
Common Shares Equity Shelf Programs and Offering Costs: The following Funds have filed a registration statement with the Securities and Exchange Commission (“SEC”) authorizing each Fund to issue additional common shares through one or more equity shelf programs (“Shelf Offering”), which became effective with the SEC during prior fiscal periods.
Under this Shelf Offering, the Funds, subject to market conditions, may raise additional equity capital by issuing additional common shares from time to time in varying amounts and by different offering methods at a net price at or above each Fund’s NAV per common share. In the event the Fund’s Shelf Offering registration statement is no longer current, the Fund may not issue additional common shares until a post-effective amendment to the registration statement has been filed with the SEC.
Maximum aggregate offering, common shares sold and offering proceeds, net of offering costs under each Fund’s Shelf Offering during the Funds’ current and prior fiscal period were as follows:
| | | | | | |
| | | NVG |
| | | Year Ended 10/31/23 | | | Year Ended 10/31/22* |
Maximum aggregate offering | | | Unlimited | | | Unlimited |
Common shares sold | | | – | | | – |
Offering proceeds, net of offering costs | | | $– | | | $– |
| |
| | | NMZ |
| | | Year Ended 10/31/23 | | | Year Ended 10/31/22 |
Maximum aggregate offering | | | Unlimited | | | Unlimited |
Common shares sold | | | 904,034 | | | 12,811,555 |
Offering proceeds, net of offering costs | | | $9,590,166 | | | $162,568,435 |
| |
| | | NMCO |
| | | Year Ended 10/31/23 | | | Year Ended 10/31/22 |
Maximum aggregate offering | | | $90,000,000 | | | $90,000,000 |
Common shares sold | | | 30,416 | | | 1,467,274 |
Offering proceeds, net of offering costs | | | $357,037 | | | $19,150,641 |
| |
| | | NDMO |
| | | Year Ended 10/31/23 | | | Year Ended 10/31/22 |
Maximum aggregate offering | | | $250,000,000 | | | $250,000,000 |
Common shares sold | | | – | | | 827,780 |
Offering proceeds, net of offering costs | | | $– | | | $12,647,921 |
| * | For the period November 21, 2021 through October 31, 2022. |
Costs incurred by the Funds in connection with their initial shelf registrations are recorded as a prepaid expense and recognized as “Deferred offering costs” on the Statement of Assets and Liabilities. These costs are amortized pro rata as common shares are sold and are recognized as a component of “Proceeds from shelf offering, net of offering costs” on the Statement of Changes in Net Assets. Any deferred offering costs remaining after the effectiveness of the initial shelf registration will be expensed. Costs incurred by the Fund to keep the shelf registration current are expensed as incurred and recognized as a component of “Other expenses” on the Statement of Operations.
Common Share Transactions: Transactions in common shares for the Funds during the Funds’ current and prior fiscal period, where applicable, were as follows:
| | | | | | | | |
| | | NVG | | NZF |
| | | Year Ended 10/31/23 | | Year Ended 10/31/22 | | Year Ended 10/31/23 | | Year Ended 10/31/22 |
Common Shares: | | | | | | | | |
Issued in the Reorganization/Merger | | – | | – | | 28,358,649 | | 23,223,782 |
Issued to shareholders due to reinvestment of distributions | | – | | 97,083 | | – | | – |
Repurchased and retired | | – | | – | | (20,000) | | – |
225
Notes to Financial Statements (continued)
| | | | | | | | | | | | | | | | |
| | | NVG | | | NZF | |
| | | Year Ended 10/31/23 | | | Year Ended 10/31/22 | | Year Ended 10/31/23 | | | Year Ended 10/31/22 |
Total | | | - | | | | 97,083 | | | | 28,338,649 | | | | 23,223,782 | |
Weighted average common share: | | | | | | | | | | | | | | | | |
Price per share repurchased and retired | | | - | | | | - | | | | 10.72 | | | | - | |
Discount per share repurchased and retired | | | –% | | | | –% | | | | (17.50)% | | | | –% | |
| | |
| | | NMZ | | | NMCO | |
| | | Year Ended 10/31/23 | | | Year Ended 10/31/22 | | Year Ended 10/31/23 | | | Year Ended 10/31/22 |
Common Shares: | | | | | | | | | | | | | | | | |
Sold through shelf offering | | | 904,034 | | | | 12,811,555 | | | | 30,416 | | | | 1,467,274 | |
Issued to shareholders due to reinvestment of distributions | | | 10,000 | | | | 113,611 | | | | - | | | | 18,120 | |
Total | | | 914,034 | | | | 12,925,166 | | | | 30,416 | | | | 1,485,394 | |
Weighted average common share: | | | | | | | | | | | | | | | | |
Premium to NAV per shelf offering common share sold | | | 1.23% | | | | 1.52% | | | | 1.12% | | | | 1.24% | |
| | | |
| | | | | | | | NDMO | |
| | | | | | | | Year Ended 10/31/23 | | | Year Ended 10/31/22 |
Common Shares: | | | | | | | | | | | | | | | | |
Sold through shelf offering | | | | | | | | | | | - | | | | 827,780 | |
Issued to shareholders due to reinvestment of distributions | | | | | | | | | | | 96,978 | | | | 72,033 | |
Total | | | | | | | | | | | 96,978 | | | | 899,813 | |
Weighted average common share: | | | | | | | | | | | | | | | | |
Premium to NAV per shelf offering common share sold | | | | | | | | | | | -% | | | | 1.28% | |
Preferred Shares
Adjustable Rate MuniFund Term Preferred Shares: NMZ has issued and has outstanding Adjustable Rate MuniFund Term Preferred (“AMTP”) Shares, with a $100,000 liquidation preference per share. AMTP Shares are issued via private placement and are not publicly available.
As of the end of the reporting period, NMZ had $356,521,633 AMTP Shares at liquidation preference, net of deferred offering costs. Further details of the Fund’s AMTP Shares outstanding as of the end of the reporting period, were as follows:
| | | | | | | | | | | | |
| Fund | | Series | | | Shares Outstanding | | | Liquidation Preference | |
NMZ | | | 2028 | | | | 870 | | | | $87,000,000 | |
| | | |
| | | 2031 | | | | 1,700 | | | | $170,000,000 | |
| | | |
| | | | 2032 | | | | 1,000 | | | | $100,000,000 | |
The Fund is obligated to redeem its AMTP Shares by the date as specified in its offering document (“Term Redemption Date”), unless earlier redeemed by the Fund. AMTP Shares are subject to optional and mandatory redemption in certain circumstances. The AMTP Shares may be redeemed at the option of the Fund, subject to payment of premium for approximately six months following the date of issuance (“Premium Expiration Date”), and at the redemption price per share thereafter. The redemption price per share is equal to the sum of the liquidation preference per share plus any accumulated but unpaid dividends.
AMTP Shares are short-term or short/intermediate-term instruments that pay a variable dividend rate tied to a short-term index, plus an additional fixed “spread” amount which is initially established at the time of issuance and may be adjusted in the future based upon a mutual agreement between the majority owner and the Fund. From time-to-time the majority owner may propose to the Fund an adjustment to the dividend rate. Should the majority owner and the Fund fail to agree upon an adjusted dividend rate, and such proposed dividend rate adjustment is not withdrawn, the Fund will be required to redeem all outstanding shares upon the end of a notice period.
In addition, the Fund may be obligated to redeem a certain amount of the AMTP Shares if the Fund fails to maintain certain asset coverage and leverage ratio requirements and such failures are not cured by the applicable cure date. The Term Redemption Date and Premium Expiration Date for the Fund’s AMTP Shares are as follows:
| | | | | | | | | | | | | | |
| Fund | | Notice Period | | Series | | | Term Redemption Date | | | Premium Expiration Date | |
NMZ | | 360-day | | | 2028 | | | | March 1, 2028* | | | | August 31, 2018 | |
| | | | |
| | 360-day | | | 2031 | | | | April 1, 2031* | | | | April 17, 2023 | |
| | | | |
| | | 360-day | | | 2032 | | | | June 1, 2032* | | | | June 8, 2023 | |
| * | Subject to early termination by either the Fund or the holder. |
226
The average liquidation preference of AMTP Shares outstanding and annualized dividend rate for the Fund during the current fiscal period were as follows:
| | | | | | | | |
| Fund | | Average Liquidation Preference of AMTP Shares Outstanding | | | Annualized Dividend Rate | |
| | |
NMZ | | $ | 357,000,000 | | | | 4.10% | |
AMTP Shares are subject to restrictions on transfer, generally do not trade, and market quotations are generally not available. The fair value of AMTP Shares is expected to be approximately their liquidation preference so long as the fixed “spread” on the AMTP Shares remains roughly in line with the “spread” being demanded by investors on instruments having similar terms in the current market environment. In present market conditions, the Fund’s Adviser has determined that the fair value of AMTP Shares is approximately their liquidation preference, but their fair value could vary if market conditions change materially. For financial reporting purposes, the liquidation preference of AMTP Shares is a liability and is recognized as a component of “AMTP Shares, Net” on the Statement of Assets and Liabilities.
AMTP Share dividends are treated as interest payments for financial reporting purposes. Unpaid dividends on AMTP Shares are recognized as a component of “Payable for interest” on the Statement of Assets and Liabilities. Dividends accrued on AMTP Shares are recognized as a component of “Interest expense and amortization of offering costs” on the Statement of Operations.
Costs incurred in connection with the Fund’s offering of AMTP Shares were recorded as deferred charges, which are amortized over the life of the shares and are recognized as components of “AMTP Shares, Net” on the Statement of Assets and Liabilities and “Interest expense and amortization of offering costs” on the Statement of Operations.
MuniFund Preferred Shares: NVG, NZF, NMCO and NDMO have issued and have outstanding MuniFund Preferred (“MFP”) Shares, with a $100,000
($1,000 for NVG’s Series B and Series C) liquidation preference per share. These MFP Shares were issued via private placement and are not publicly available.
The Funds are obligated to redeem their MFP Shares by the date as specified in its offering documents (“Term Redemption Date”), unless earlier redeemed by the Funds. MFP Shares are initially issued in a pre-specified mode, however, MFP Shares can be subsequently designated as an alternative mode at a later date at the discretion of the Funds. The modes within MFP Shares detail the dividend mechanics and are described as follows. At a subsequent date, the Funds may establish additional mode structures with the MFP Share.
• Variable Rate Remarketed Mode (“VRRM”) – Dividends for MFP Shares within this mode will be established by a remarketing agent; therefore, market value of the MFP Shares is expected to approximate its liquidation preference. Shareholders have the ability to request a best-efforts tender of its shares upon seven days notice. If the remarketing agent is unable to identify an alternative purchaser, the shares will be retained by the shareholder requesting tender and the subsequent dividend rate will increase to its step-up dividend rate. If after one consecutive year of unsuccessful remarketing attempts, the Fund will be required to designate an alternative mode or redeem the shares.
Each Fund will pay a remarketing fee on the aggregate principal amount of all MFP Shares while designated in VRRM. Payments made by the Fund to the remarketing agent are recognized as “Remarketing fees” on the Statement of Operations.
• Variable Rate Mode (“VRM”) – Dividends for MFP Shares designated in this mode are based upon a short-term index plus an additional fixed “spread” amount established at the time of issuance or renewal / conversion of its mode. At the end of the period of the mode, the Fund will be required to either extend the term of the mode, designate an alternative mode or redeem the MFP Shares.
The fair value of MFP Shares while in VRM are expected to approximate their liquidation preference so long as the fixed “spread” on the shares remains roughly in line with the “spread” being demanded by investors on instruments having similar terms in the current market. In current market conditions, the Adviser has determined that the fair value of the shares are approximately their liquidation preference, but their fair value could vary if market conditions change materially.
• Variable Rate Demand Mode (“VRDM”) – Dividends for MFP Shares designated in this mode will be established by a remarketing agent; therefore, the market value of the MFP Shares is expected to approximate its liquidation preference. While in this mode, shares will have an unconditional liquidity feature that enable its shareholders to require a liquidity provider, which the Fund has entered into a contractual agreement, to purchase shares in the event that the shares are not able to be successfully remarketed. In the event that shares within this mode are unable to be successfully remarketed and are purchased by the liquidity provider, the dividend rate will be the maximum rate which is designed to escalate according to a specified schedule in order to enhance the remarketing agent’s ability to successfully remarket the shares. Each Fund is required to redeem any shares that are still owned by a liquidity provider after six months of continuous, unsuccessful remarketing.
The Fund will pay a liquidity and remarketing fee on the aggregate principal amount of all MFP shares while within VRDM. Payments made by the Fund to the liquidity provider and remarketing agent are recognized as “Liquidity fees” and “Remarketing fees”, respectively, on the Statement Operations.
227
Notes to Financial Statements (continued)
For financial reporting purposes, the liquidation preference of MFP Shares is recorded as a liability and is recognized as a component of “MFP Shares, Net” on the Statement of Assets and Liabilities. Dividends on the MFP shares are treated as interest payments for financial reporting purposes. Unpaid dividends on MFP shares are recognized as a component on “Payable for interest” on the Statement of Assets and Liabilities. Dividends accrued on MFP Shares are recognized as a component of “Interest expense and amortization of offering costs” on the Statement of Operations.
Subject to certain conditions, MFP Shares may be redeemed, in whole or in part, at any time at the option of the Fund. The Fund may also be required to redeem certain MFP Shares if the Fund fails to maintain certain asset coverage requirements and such failures are not cured by the applicable cure date. The redemption price per share in all circumstances is equal to the liquidation preference per share plus any accumulated but unpaid dividends.
Costs incurred in connection with the Fund’s offering of MFP Shares were recorded as a deferred charge and are being amortized over the life of the shares. These offering costs are recognized as a component of “MFP Shares, Net” on the Statement of Assets and Liabilities and “Interest expense and amortization of offering costs” on the Statement of Operations.
As of the end of the reporting period, NVG, NZF, NMCO and NDMO had $515,526,990, $640,119,683, $429,128,343 and $239,609,609 of MFP Shares at liquidation preference, net of deferred offering costs, respectively. Further details of each Fund’s MFP Shares outstanding as of the end of the reporting period, were as follows:
| | | | | | | | | | | | | | | | | | | | | | | | | | | | |
| Fund | | Series | | | Shares Outstanding | | | Liquidation Preference | | | Term Redemption Date | | | | | | Mode | | | Mode Termination Date | |
NVG | | | A | | | | 674 | | | | $67,400,000 | | | | January 3, 2028 | | | | | | | | VRM | | | | January 3, 2028* | |
| | | | | | | |
| | | B | | | | 200,000 | | | | $200,000,000 | | | | March 1, 2029 | | | | | | | | VRRM | | | | March 1, 2029 | |
| | | | | | | |
| | | | C | | | | 250,000 | | | | $250,000,000 | | | | December 1, 2031 | | | | | | | | VRRM | | | | December 1, 2031 | |
NZF | | | A | | | | 1,500 | | | | $150,000,000 | | | | May 1, 2047 | | | | | | | | VRM | | | | May 1, 2024 | |
| | | | | | | |
| | | B | | | | 1,550 | | | | $155,000,000 | | | | February 3, 2048 | | | | | | | | VRM | | | | February 3, 2048* | |
| | | | | | | |
| | | | C | | | | 3,360 | | | | $336,000,000 | | | | June 1, 2048 | | | | | | | | VRM | | | | September 1, 2024 | |
NMCO | | | A | | | | 1,000 | | | | $100,000,000 | | | | October 1, 2031 | | | | | | | | VRDM | | | | N/A | |
| | | | | | | |
| | | B | | | | 2,050 | | | | $205,000,000 | | | | October 1, 2031 | | | | | | | | VRM | | | | December 1, 2024 | |
| | | | | | | |
| | | | C | | | | 1,250 | | | | $125,000,000 | | | | October 1, 2031 | | | | | | | | VRM | | | | May 16, 2024 | |
| | | | | | | |
NDMO | | | A | | | | 2,400 | | | | $240,000,000 | | | | September 1, 2032 | | | | | | | | VRM | | | | September 1, 2032 | |
| * | Subject to earlier termination by either the Fund or the holder. |
The average liquidation preference of MFP Shares outstanding and annualized dividend rate for the Funds during the current fiscal period were as follows:
| | | | | | | | |
| Fund | | Average Liquidation Preference of MFP Shares Outstanding | | | Annualized Dividend Rate | |
| | |
NVG | | $ | 519,668,493 | | | | 3.71% | |
| | |
NZF | | | 641,000,000 | | | | 4.12 | |
| | |
NMCO | | | 450,000,000 | | | | 3.98 | |
| | |
NDMO | | | 240,000,000 | | | | 4.08 | |
Variable Rate Demand Preferred Shares: The following Funds have issued and have outstanding Variable Rate Demand Preferred (“VRDP”) Shares, with a $100,000 liquidation preference per share. VRDP Shares are issued via private placement and are not publicly available.
As of the end of the reporting period, NVG and NZF had $1,233,916,102 and $673,553,812 VRDP Shares at liquidation preference, net of deferred offering costs, respectively. Further details of the Funds’ VRDP Shares outstanding as of the reporting period, were as follows:
228
| | | | | | | | | | | | | | | | | | | | |
| Fund | | Series | | | Shares Outstanding | | | Remarketing Fees* | | | Liquidation Preference | | | Maturity | |
NVG | | | 1 | | | | 1,790 | | | | 0.10% | | | $ | 179,000,000 | | | | December 1, 2043 | |
| | | 2 | | | | 2,954 | | | | 0.10% | | | $ | 295,400,000 | | | | December 1, 2040 | |
| | | 4 | | | | 1,800 | | | | 0.10% | | | $ | 180,000,000 | | | | June 1, 2046 | |
| | | 5 | | | | 2,955 | | | | 0.10% | | | $ | 295,500,000 | | | | December 1, 2040 | |
| | | | 6 | | | | 2,867 | | | | 0.10% | | | $ | 286,700,000 | | | | December 1, 2040 | |
NZF | | | 1 | | | | 2,688 | | | | N/A** | | | $ | 268,800,000 | | | | March 1, 2040 | |
| | | 2 | | | | 2,622 | | | | N/A** | | | $ | 262,200,000 | | | | March 1, 2040 | |
| | | | 3 | | | | 1,460 | | | | 0.05% | | | $ | 146,000,000 | | | | June 1, 2040 | |
| * | Remarketing fees as a percentage of the aggregate principal amount of all VRDP Shares outstanding for each series. |
| ** | Not applicable. Series is considered to be Special Rate VRDP and therefore does not pay a remarketing fee. |
VRDP Shares include a liquidity feature that allows VRDP shareholders to have their shares purchased by a liquidity provider with whom each Fund has contracted in the event that VRDP Shares are not able to be successfully remarketed. Each Fund is required to redeem any VRDP Shares that are still owned by the liquidity provider after six months of continuous, unsuccessful remarketing. Each Fund pays an annual remarketing fee on the aggregate principal amount of all VRDP Shares outstanding. Each Fund’s VRDP Shares have successfully remarketed since issuance.
NZF’s Series 1 and Series 2 VRDP Shares are considered to be Special Rate VRDP, which are sold to institutional investors. The special rate period will expire on March 1, 2040 for the Fund’s Series 1 and 2 VRDP Shares, but is subject to earlier termination by either the Fund or the holder. During the special rate period, the VRDP Shares will not be remarketed by a remarketing agent, be subject to optional or mandatory tender events, or be supported by a liquidity provider and are not subject to remarketing fees or liquidity fees. During the special rate period, VRDP dividends will be set monthly as a floating rate based on the predetermined formula. Following the initial special rate period, Special Rate Period VRDP Shares may transition to traditional VRDP Shares with dividends set at weekly remarketings, and be supported by designated liquidity provider, or the Board may approve a subsequent special rate period.
Dividends on the VRDP Shares (which are treated as interest payments for financial reporting purposes) are set at a rate established by a remarketing agent; therefore, the market value of the VRDP Shares is expected to approximate its liquidation preference. In the event that VRDP shares are unable to be successfully remarketed, the dividend rate will be the maximum rate which is designed to escalate according to a specified schedule in order to enhance the remarketing agent’s ability to successfully remarket the VRDP Shares.
Subject to certain conditions, VRDP Shares may be redeemed, in whole or in part, at any time at the option of each Fund. Each Fund may also redeem certain of the VRDP Shares if the Fund fails to maintain certain asset coverage requirements and such failures are not cured by the applicable cure date. The redemption price per share is equal to the sum of the liquidation preference per share plus any accumulated but unpaid dividends.
The average liquidation preference of VRDP Shares outstanding and annualized dividend rate for each Fund during the current fiscal period were as follows:
| | | | | | | | |
| Fund | | Average Liquidation Preference of VRDP Shares Outstanding | | | Annualized Dividend Rate | |
| | |
NVG | | $ | 1,236,600,000 | | | | 3.21% | |
| | |
NZF | | | 679,739,726 | | | | 3.99 | |
For financial reporting purposes, the liquidation preference of VRDP Shares is a liability and is recognized as a component of “VRDP Shares, Net” on the Statement of Assets and Liabilities. Unpaid dividends on VRDP Shares are recognized as a component of “Payable for interest” on the Statement of Assets and Liabilities, when applicable. Dividends accrued on VRDP Shares are recognized as a component of “Interest expense and amortization of offering costs” on the Statement of Operations. Costs incurred by the Funds in connection with their offerings of VRDP Shares were recorded as
229
Notes to Financial Statements (continued)
a deferred charge, which are amortized over the life of the shares and are recognized as a component of “VRDP Shares, Net” on the Statement of Assets and Liabilities and “Interest expense and amortization of offering costs” on the Statement of Operations. In addition to interest expense, each Fund may also pay a per annum liquidity fee to the liquidity provider, as well as a remarketing fee, which are recognized as “Liquidity fees” and “Remarketing fees,” respectively, on the Statement of Operations.
Preferred Share Transactions: Transactions in preferred shares during the Funds’ current and prior fiscal period, where applicable, are noted in the following tables.
Transactions in AMTP Shares for the Funds, where applicable, were as follows:
| | | | | | | | | | | | | | | | |
| | | Year Ended October 31, 2022 | |
| NVG | | | | | Series | | | Shares | | | Amount | |
AMTP Shares redeemed | | | | | | | 2028 | | | | (1,120) | | | | $(112,000,000) | |
NMZ | | | | | | | | | | | | | | | | |
AMTP Shares issued | | | | | | | 2032 | | | | 1,000 | | | | $100,000,000 | |
Transactions in MFP Shares for the Funds, where applicable, were as follows:
| | | | | | | | | | | | | | | | |
| | | Year Ended October 31, 2023 | |
| NVG | | | | | Series | | | Shares | | | Amount | |
MFP Shares redeemed | | | | | | | A | | | | (935) | | | | $(93,500,000) | |
| |
| | | Year Ended October 31, 2022 | |
| NVG | | | | | Series | | | Shares | | | Amount | |
MFP Shares issued | | | | | | | C | | | | 250,000 | | | | $250,000,000 | |
MFP Shares noticed for redemption | | | | | | | A | | | | (445) | | | | (44,500,000) | |
| |
| | | Year Ended October 31, 2023 | |
| NMCO | | | | | Series | | | Shares | | | Amount | |
MFP Shares noticed for redemption* | | | | | | | B | | | | (200) | | | | $(20,000,000) | |
| |
| | | Year Ended October 31, 2022 | |
| NDMO | | | | | Series | | | Shares | | | Amount | |
MFP Shares issued | | | | | | | A | | | | 2,400 | | | | $240,000,000 | |
| * | Cash irrevocably deposited for payment of preferred shares noticed for redemption included in “Cash held in escrow for preferred shares noticed for redemption”, on the Statement of Assets and Liabilities. |
Transactions in VRDP Shares for the Funds, where applicable, were as follows:
| | | | | | | | | | | | | | | | |
| | | Year Ended October 31, 2023 | |
| NZF | | | | | Series | | | Shares | | | Amount | |
VRDP Shares redeemed | | | | | | | 3 | | | | (500) | | | | $(50,000,000) | |
| |
| | | Year Ended October 31, 2022 | |
| NVG | | | | | Series | | | Shares | | | Amount | |
VRDP Shares redeemed | | | | | | | 2 | | | | (900) | | | | $(90,000,000) | |
| | | | | | | 5 | | | | (450) | | | | (45,000,000) | |
| | | | | | | | 6 | | | | (400) | | | | (40,000,000) | |
Total | | | | | | | | | | | (1,750) | | | | (175,000,000) | |
230
Each Fund is a separate taxpayer for federal income tax purposes. Each Fund intends to distribute substantially all of its net investment income and net capital gains to shareholders and otherwise comply with the requirements of Subchapter M of the Internal Revenue Code applicable to regulated investment companies. Therefore, no federal income tax provision is required.
Each Fund intends to satisfy conditions that will enable interest from municipal securities, which is exempt from regular federal income tax, and in the case of NVG, the AMT applicable to individuals to retain such tax-exempt status when distributed to shareholders of the Funds. Net realized capital gains and ordinary income distributions paid by the Funds are subject to federal taxation.
Each Fund files income tax returns in U.S. federal and applicable state and local jurisdictions. A Fund’s federal income tax returns are generally subject to examination for a period of three fiscal years after being filed. State and local tax returns may be subject to examination for an additional period of time depending on the jurisdiction. Management has analyzed each Fund’s tax positions taken for all open tax years and has concluded that no provision for income tax is required in the Fund’s financial statements.
Differences between amounts for financial statement and federal income tax purposes are primarily due to timing differences in recognizing gains and losses on investment transactions. Temporary differences do not require reclassification. As of year end, permanent differences that resulted in reclassifications among the components of net assets relate primarily to distressed PIK bond adjustments, investments in partnerships, nondeductible expenses, paydowns, reorganization adjustments, taxable market discount, taxes paid, and treatment of notional principal contracts. Temporary and permanent differences have no impact on a Fund’s net assets.
As of year end, the aggregate cost and the net unrealized appreciation/(depreciation) of all investments for federal income tax purposes were as follows:
| | | | | | | | | | | | | | | | |
| Fund | | Tax Cost | | | Gross Unrealized Appreciation | | | Gross Unrealized (Depreciation) | | | Net Unrealized Appreciation (Depreciation) | |
| | | | |
NVG | | $ | 4,649,764,316 | | | $ | 99,490,037 | | | $ | (560,175,461) | | | $ | (460,685,424) | |
| | | | |
NZF | | | 3,743,211,764 | | | | 125,905,108 | | | | (278,770,802) | | | | (152,865,694) | |
| | | | |
NMZ | | | 1,649,538,751 | | | | 49,755,067 | | | | (323,257,297) | | | | (273,502,230) | |
| | | | |
NMCO | | | 1,109,960,834 | | | | 50,088,972 | | | | (179,404,088) | | | | (129,315,116) | |
| | | | |
NDMO | | | 935,432,534 | | | | 2,029,475 | | | | (106,306,740) | | | | (104,277,265) | |
For purposes of this disclosure, tax cost generally includes the cost of portfolio investments as well as up-front fees or premiums exchanged on derivatives and any amounts unrealized for income statement reporting but realized income and/or capital gains for tax reporting, if applicable.
As of year end, the components of accumulated earnings on a tax basis were as follows:
| | | | | | | | | | | | | | | | | | | | | | | | | | | | | | | | |
| Fund | | Undistributed Tax-Exempt Income1 | | | Undistributed
Ordinary Income | | | Undistributed Long-Term Capital Gains | | | Unrealized
Appreciation
(Depreciation) | | | Capital Loss Carryforwards | | | Late-Year Loss Deferrals | | | Other Book-to-Tax Differences | | | Total | |
| | | | | | | | |
NVG | | $ | - | | | $ | 610,886 | | | $ | - | | | $ | (460,685,424 | ) | | $ | (102,288,716 | ) | | $ | - | | | $ | (9,074,700 | ) | | $ | (571,437,954) | |
| | | | | | | | |
NZF | | | 5,600,405 | | | | 96,828 | | | | - | | | | (152,865,694 | ) | | | (294,654,344 | ) | | | - | | | | (8,330,349 | ) | | | (450,153,154) | |
| | | | | | | | |
NMZ | | | - | | | | 380,433 | | | | - | | | | (273,502,230 | ) | | | (129,246,280 | ) | | | - | | | | (4,697,922 | ) | | | (407,065,999) | |
| | | | | | | | |
NMCO | | | - | | | | 15,318 | | | | - | | | | (129,315,116 | ) | | | (135,428,162 | ) | | | - | | | | (2,522,122 | ) | | | (267,250,082) | |
| | | | | | | | |
NDMO | | | - | | | | 95,640 | | | | - | | | | (104,277,264 | ) | | | (149,324,830 | ) | | | - | | | | (3,716,717 | ) | | | (257,223,171) | |
| 1 | Undistributed tax-exempt income (on a tax basis) has not been reduced for the dividend declared on October 2, 2023 and paid on November 1, 2023. |
The tax character of distributions paid was as follows:
| | | | | | | | | | | | | | | | | | | | | | | | | | | | | | | | |
| | | 10/31/23 | | | 10/31/22 | |
| Fund | | Tax-Exempt
Income1 | | | Ordinary Income | | | Long-Term Capital Gains | | | Return
of Capital | | | Tax-Exempt
Income | | | Ordinary Income | | | Long-Term Capital Gains | | | Return of Capital | |
| | | | | | | | |
NVG | | $ | 112,795,656 | | | $ | 1,225,287 | | | $ | - | | | $ | - | | | $ | 165,132,471 | | | $ | 562,238 | | | $ | 6,545,147 | | | $ | - | |
| | | | | | | | |
NZF | | | 95,870,629 | | | | 57,599 | | | | - | | | | - | | | | 110,510,171 | | | | 8,270 | | | | - | | | | - | |
| | | | | | | | |
NMZ | | | 56,448,218 | | | | 4,070,431 | | | | - | | | | 1,274,052 | | | | 75,631,470 | | | | 1,629,796 | | | | - | | | | - | |
| | | | | | | | |
NMCO | | | 31,918,490 | | | | 1,502,251 | | | | - | | | | 446,021 | | | | 39,069,521 | | | | 628,781 | | | | - | | | | - | |
| | | | | | | | |
NDMO | | | 21,509,992 | | | | 3,048,167 | | | | - | | | | 23,182,895 | | | | 27,535,309 | | | | 2,127,543 | | | | - | | | | 24,771,804 | |
| 1 | Each Fund designates these amounts paid during the period as Exempt Interest Dividends. |
231
Notes to Financial Statements (continued)
As of year end, the Funds had capital loss carryforwards, which will not expire:
| | | | | | | | | | | | |
| Fund | | Short-Term | | | Long-Term | | | Total |
| | | |
NVG1 | | $ | 11,226,867 | | | $ | 91,061,849 | | | $ | 102,288,716 | |
| | | |
NZF1 | | | 146,307,379 | | | | 148,346,965 | | | | 294,654,344 | |
| | | |
NMZ | | | 34,310,477 | | | | 94,935,803 | | | | 129,246,280 | |
| | | |
NMCO | | | 74,019,646 | | | | 61,408,516 | | | | 135,428,162 | |
| | | |
NDMO | | | 63,395,032 | | | | 85,929,798 | | | | 149,324,830 | |
| 1 | A portion of NVG’s and NZF’s capital loss carryforwards is subject to limitation under the Internal Revenue Code and related regulations. |
| 8. | Management Fees and Other Transactions with Affiliates |
Management Fees: Each Fund’s management fee compensates the Adviser for the overall investment advisory and administrative services and general office facilities. The Sub-Adviser is compensated for its services to the Funds from the management fees paid to the Adviser.
Each Fund’s management fee consists of two components – a fund-level fee, based only on the amount of assets within each individual Fund, and a complex-level fee, based on the aggregate amount of all eligible fund assets managed by the Adviser. This pricing structure enables each Fund’s shareholders to benefit from growth in the assets within their respective Fund as well as from growth in the amount of complex-wide assets managed by the Adviser.
The annual fund-level fee, payable monthly, for each Fund is calculated according to the following schedule:
| | | | | | | | | | | | | | | | |
| Average Daily Managed Assets* | | NVG NZF Fund-Level Fee Rate | | | NMZ Fund-Level Fee Rate | | | NMCO Fund-Level Fee Rate | | | NDMO Fund-Level Fee Rate | |
For the first $125 million | | | 0.5000 | % | | | 0.5500 | % | | | 0.7500 | % | | | 0.7000 | % |
For the next $125 million | | | 0.4875 | | | | 0.5375 | | | | 0.7375 | | | | 0.6875 | |
For the next $250 million | | | 0.4750 | | | | 0.5250 | | | | 0.7250 | | | | 0.6750 | |
For the next $500 million | | | 0.4625 | | | | 0.5125 | | | | 0.7125 | | | | 0.6625 | |
For the next $1 billion | | | 0.4500 | | | | 0.5000 | | | | 0.7000 | | | | 0.6500 | |
For the next $3 billion | | | 0.4250 | | | | 0.4750 | | | | 0.6750 | | | | 0.6250 | |
For managed assets over $5 billion | | | 0.4125 | | | | 0.4625 | | | | 0.6625 | | | | 0.6125 | |
The annual complex-level fee, payable monthly, for each Fund is calculated by multiplying the current complex-wide fee rate, determined according to the following schedule by the Funds’ daily managed assets:
| | |
| Complex-Level Eligible Asset Breakpoint Level* | | Effective Complex-Level Fee Rate at Breakpoint Level |
$55 billion | | 0.2000% |
$56 billion | | 0.1996 |
$57 billion | | 0.1989 |
$60 billion | | 0.1961 |
$63 billion | | 0.1931 |
$66 billion | | 0.1900 |
$71 billion | | 0.1851 |
$76 billion | | 0.1806 |
$80 billion | | 0.1773 |
$91 billion | | 0.1691 |
$125 billion | | 0.1599 |
$200 billion | | 0.1505 |
$250 billion | | 0.1469 |
$300 billion | | 0.1445 |
| * | For the complex-level fees, managed assets include closed-end fund assets managed by the Adviser that are attributable to certain types of leverage. For these purposes, leverage includes the funds’ use of preferred stock and borrowings and certain investments in the residual interest certificates (also called inverse floating rate securities) in tender option bond (TOB) trusts, including the portion of assets held by a TOB trust that has been effectively financed by the trust’s issuance of floating rate securities, subject to an agreement by the Adviser as to certain funds to limit the amount of such assets for determining managed assets in certain circumstances. The complex-level fee is calculated based upon the aggregate daily managed assets of all Nuveen open-end and closed-end funds that constitute ‘‘eligible assets.” Eligible assets do not include assets attributable to investments in other Nuveen funds or assets in excess of a |
232
determined amount (originally $2 billion) added to the Nuveen fund complex in connection with the Adviser’s assumption of the management of the former First American Funds effective January 1, 2011, but do not include certain assets of certain Nuveen funds that were reorganized into funds advised by an affiliate of the Adviser during the 2019 calendar year. As of October 31, 2023, the complex-level fee for each Fund was as follows:
| | | | |
| Fund | | Complex-Level Fee | |
| |
NVG | | | 0.1623% | |
| |
NZF | | | 0.1623% | |
| |
NMZ | | | 0.1623% | |
| |
NMCO | | | 0.1623% | |
| |
NDMO | | | 0.1623% | |
Other Transactions with Affiliates: Each Fund is permitted to purchase or sell securities from or to certain other funds or accounts managed by the Sub-Adviser (“Affiliated Entity”) under specified conditions outlined in procedures adopted by the Board (“cross-trade”). These procedures have been designed to ensure that any cross-trade of securities by the Fund from or to an Affiliated Entity by virtue of having a common investment adviser (or affiliated investment adviser), common officer and/or common trustee complies with Rule 17a-7 under the 1940 Act. These transactions are effected at the current market price (as provided by an independent pricing service) without incurring broker commissions.
During the current fiscal period, the Funds engaged in cross-trades pursuant to these procedures as follows:
| | | | | | | | | | | | |
| Fund | | Purchases | | | Sales | | | Realized
Gain (Loss) | |
| | | |
NVG | | $ | 3,728,511 | | | $ | 3,897,639 | | | $ | (236,856) | |
| | | |
NZF | | | 10,034,900 | | | | 10,094,300 | | | | (491,098) | |
| | | |
NMZ | | | 25,720,055 | | | | 1,404,585 | | | | (141,671) | |
| | | |
NMCO | | | 13,693,121 | | | | 4,681,950 | | | | (472,238) | |
| | | |
NDMO | | | - | | | | - | | | | - | |
| 9. | Commitments and Contingencies |
In the normal course of business, each Fund enters into a variety of agreements that may expose the Fund to some risk of loss. These could include recourse arrangements for certain TOB Trusts and certain agreements related to preferred shares, which are described elsewhere in these Notes to Financial Statements. The risk of future loss arising from such agreements, while not quantifiable, is expected to be remote. As of the end of the reporting period, the Funds did not have any unfunded commitments.
From time to time, the Funds may be party to certain legal proceedings in the ordinary course of business, including proceedings relating to the enforcement of the Funds’ rights under contracts. As of the end of the reporting period, management has determined that any legal proceeding(s) the Funds are subject to, including those described within this report, are unlikely to have a material impact to any of the Funds’ financial statements.
| 10. | Borrowing Arrangements |
Committed Line of Credit: The Funds, along with certain other funds managed by the Adviser (“Participating Funds”), have established a 364-day, $2.700 billion standby credit facility with a group of lenders, under which the Participating Funds may borrow for temporary purposes (other than ongoing leveraging for investment purposes). Each Participating Fund is allocated a designated proportion of the facility’s capacity (and its associated costs, as described below) based upon a multi-factor assessment of the likelihood and frequency of its need to draw on the facility, the size of the Fund and its anticipated draws, and the potential importance of such draws to the operations and well-being of the Fund, relative to those of the other Funds. A Fund may effect draws on the facility in excess of its designated capacity if and to the extent that other Participating Funds have undrawn capacity. The current credit facility was entered into on June 21, 2023 expiring on June 19, 2024, replacing the previous facility, which expired in June 2023.
The credit facility has the following terms: 0.15% per annum on unused commitment amounts and a drawn interest rate equal to the higher of (a) OBFR (Overnight Bank Funding Rate) plus 1.20% per annum or (b) the Fed Funds Effective Rate plus 1.20% per annum on amounts borrowed. The Participating Funds also incurred a 0.05% upfront fee on the increased commitments from select lenders. Interest expense incurred by the Participating Funds, when applicable, is recognized as a component of “Interest expense and amortization of offering costs” on the Statement of Operations. Participating Funds paid administration, legal and arrangement fees, which are recognized as a component of “Interest expense and amortization of offering costs” on the Statement of Operations, and along with commitment fees, have been allocated among such Participating Funds based upon the relative proportions of the facility’s aggregate capacity reserved for them and other factors deemed relevant by the Adviser and the Board of each Participating Fund.
During the current fiscal period, the following Funds utilized this facility. Each Fund’s maximum outstanding balance during the utilization period was as follows:
233
Notes to Financial Statements (continued)
| | | | |
| Fund | | Maximum Outstanding Balance | |
| |
NVG | | $ | 51,100,000 | |
| |
NZF | | | 82,800,000 | |
| |
NMZ | | | 47,000,000 | |
| |
NMCO | | | 18,809,893 | |
| |
NDMO | | | - | |
During the Funds’ utilization period(s) during the current fiscal period, the average daily balance outstanding and average annual interest rate on Borrowings were as follows:
| | | | | | | | | | | | |
| Fund | | Utilization Period (Days Outstanding) | | | Average Daily Balance Outstanding | | | Average Annual Interest Rate | |
| | | |
NVG | | | 23 | | | $ | 26,233,543 | | | | 5.12% | |
| | | |
NZF | | | 190 | | | | 25,869,303 | | | | 6.12 | |
| | | |
NMZ | | | 63 | | | | 15,513,909 | | | | 5.79 | |
| | | |
NMCO | | | 69 | | | | 9,773,524 | | | | 5.86 | |
| | | |
NDMO | | | - | | | | - | | | | - | |
Borrowings outstanding as of the end of the reporting period, if any, are recognized as “Borrowings” on the Statement of Assets and Liabilities, where applicable.
| 11. | Inter-Fund Borrowing and Lending |
Inter-Fund Borrowing and Lending: The SEC has granted an exemptive order permitting registered open-end and closed-end Nuveen funds to participate in an inter-fund lending facility whereby the Nuveen funds may directly lend to and borrow money from each other for temporary purposes (e.g., to satisfy redemption requests or when a sale of securities “fails,” resulting in an unanticipated cash shortfall) (the “Inter-Fund Program”). The closed-end Nuveen funds, including the Funds covered by this shareholder report, will participate only as lenders, and not as borrowers, in the Inter-Fund Program because such closed-end funds rarely, if ever, need to borrow cash to meet redemptions. The Inter-Fund Program is subject to a number of conditions, including, among other things, the requirements that (1) no fund may borrow or lend money through the Inter-Fund Program unless it receives a more favorable interest rate than is typically available from a bank or other financial institution for a comparable transaction; (2) no fund may borrow on an unsecured basis through the Inter-Fund Program unless the fund’s outstanding borrowings from all sources immediately after the inter-fund borrowing total 10% or less of its total assets; provided that if the borrowing fund has a secured borrowing outstanding from any other lender, including but not limited to another fund, the inter-fund loan must be secured on at least an equal priority basis with at least an equivalent percentage of collateral to loan value; (3) if a fund’s total outstanding borrowings immediately after an inter-fund borrowing would be greater than 10% of its total assets, the fund may borrow through the inter-fund loan on a secured basis only; (4) no fund may lend money if the loan would cause its aggregate outstanding loans through the Inter-Fund Program to exceed 15% of its net assets at the time of the loan; (5) a fund’s inter-fund loans to any one fund shall not exceed 5% of the lending fund’s net assets; (6) the duration of inter-fund loans will be limited to the time required to receive payment for securities sold, but in no event more than seven days; and (7) each inter-fund loan may be called on one business day’s notice by a lending fund and may be repaid on any day by a borrowing fund. In addition, a Nuveen fund may participate in the Inter-Fund Program only if and to the extent that such participation is consistent with the fund’s investment objective and investment policies. The Board is responsible for overseeing the Inter-Fund Program.
The limitations detailed above and the other conditions of the SEC exemptive order permitting the Inter-Fund Program are designed to minimize the risks associated with Inter-Fund Program for both the lending fund and the borrowing fund. However, no borrowing or lending activity is without risk. When a fund borrows money from another fund, there is a risk that the loan could be called on one day’s notice or not renewed, in which case the fund may have to borrow from a bank at a higher rate or take other actions to payoff such loan if an inter-fund loan is not available from another fund. Any delay in repayment to a lending fund could result in a lost investment opportunity or additional borrowing costs.
During the current reporting period, none of the Funds covered by this shareholder report have entered into any inter-fund loan activity.
The Mergers as previously described in these Notes to Financial Statements were structured to qualify as tax-free reorganizations under the Internal Revenue Code for federal income tax purposes, and the Target Funds’ shareholders recognized no gain or loss for federal income tax purposes as a result. Prior to the closing of each Merger, the Target Funds distributed all of their net investment income and capital gains, if any. Such a distribution may be taxable to the Target Funds’ shareholders for federal income tax purposes.
Investments: The cost, fair value and net unrealized appreciation (depreciation) of the investments (including investments in derivatives) of the Target Funds as of the date of each Merger, were as follows:
234
| | | | | | |
| | | NUO | | | NKG |
Cost of investments | | $ | 244,285,021 | | | $112,066,624 |
Fair value of investments | | | 253,607,985 | | | 112,908,007 |
Net unrealized appreciation (depreciation) of investments | | | 9,322,964 | | | 841,383 |
For financial reporting purposes, assets received and shares issued by the Acquiring Fund were recorded at fair value; however, the cost basis of the investments received from the Target Funds were carried forward to align ongoing reporting of the Acquiring Fund’s realized and unrealized gains and losses with amounts distributable to shareholders for tax purposes.
Common Shares: The common shares outstanding, net assets applicable to common shares and NAV per common share outstanding immediately before and after each Merger were as follows:
| | | | | | |
| Target Fund - Prior to Merger into NZF | | NUO | | | NKG |
Common shares outstanding | | | 18,254,255 | | | 10,399,812 |
| | |
Net assets applicable to common shares | | | $269,057,366 | | | $122,740,782 |
NAV per common share outstanding | | | $14.74 | | | $11.80 |
| | |
| Acquiring Fund - Prior to Merger | | | | | NZF |
Common shares outstanding | | | | | | 165,390,401 |
Net assets applicable to common shares | | | | | | $2,284,999,614 |
NAV per common share outstanding | | | | | | $13.82 |
| | |
| Acquiring Fund - Post Merger | | | | | NZF |
Common shares outstanding | | | | | | 193,749,050 |
| | |
Net assets applicable to common shares | | | | | | $2,676,797,762 |
NAV per common share outstanding | | | | | | $13.82 |
Pro Forma Results of Operations: The beginning of NUO and NKG’s current fiscal period was March 1, 2023 and June 1, 2022, respectively. Assuming the Mergers had been completed on November 1, 2022, the beginning of the Acquiring Fund’s current fiscal period, the pro forma results of operations for the Fund’s current fiscal period, are as follows:
| | |
| Acquiring Fund - Pro Forma Results from Operations | | NZF |
Net investment income (loss) | | $102,811,769 |
| |
Net realized and unrealized gains (losses) | | (70,279,409) |
Change in net assets resulting from operations | | 32,532,360 |
Because the combined investment portfolio of each Merger has been managed as a single integrated portfolio since each Merger was completed, it is not practicable to separate the amounts of revenue and earnings of each Target Fund that have been included in the Statement of Operations of the Acquiring Fund since each Merger was consummated.
Cost and Expenses: In connection with each Merger, the Acquiring Fund incurred certain associated costs and expenses. Such amounts were included as components of “Accrued other expenses” on the Statement of Assets and Liabilities and “Reorganization/Merger expenses” on the Statement of Operations.
Preferred Shares for NMCO: During November 2023, NMCO redeemed 150 of Series C MFP Shares ($15,000,000 liquidation preference).
Updated Distribution Policy: As noted in the Common Share information section of this report, effective with distributions payable on December 1, 2023 (December 29, 2023 for NDMO), each Fund’s distribution policy, which may be changed by the Board, is to make regular monthly cash distributions to holders of its common shares (stated in terms of a fixed cents per common share dividend distribution rate which may be set from time to time). The Fund intends to distribute all or substantially all of its net investment income through its regular monthly distribution and to distribute realized capital gains at least annually. In addition, in any monthly period, to maintain its declared per common share distribution amount, the Fund may distribute more or less than its net investment income during the period. In the event the Fund distributes more than its net investment income during any yearly period, such distributions may also include realized gains and/or a return of capital. To the extent that a distribution includes a return of capital the NAV per share may erode. If the Fund’s distribution includes anything other than net investment income, the Fund will provide a notice to shareholders of its best estimate of the distribution sources at that the time of the distribution. These estimates may not match the final tax characterization (for the full year’s distributions) contained in shareholders’ 1099-DIV forms after the end of the year.
235
[This page intentionally left blank.]
236
Shareholder Update
(Unaudited)
CURRENT INVESTMENT OBJECTIVES, INVESTMENT POLICIES AND PRINCIPAL RISKS OF THE FUNDS
NUVEEN AMT-FREE MUNICIPAL CREDIT INCOME FUND (NVG)
Investment Objectives
The Fund’s investment objectives are to provide current income exempt from regular federal income tax and federal alternative minimum tax applicable to individuals, and to enhance portfolio value relative to the municipal bond market by investing in tax-exempt municipal bonds that the Fund’s investment adviser believes are underrated or undervalued or that represent municipal market sectors that are undervalued.
Investment Policies
As a fundamental investment policy, under normal circumstances, the Fund will invest at least 80% of its Assets (as defined below) in municipal securities and other related investments, the income from which is exempt from regular federal income taxes.
As a non-fundamental investment policy, under normal circumstances, the Fund will invest 100% of its Managed Assets (as defined below) and at least 80% of its Assets in municipal securities and other related investments, the income from which is also exempt from the federal alternative minimum tax applicable to individuals at the time of purchase.
“Assets” mean the net assets of the Fund plus the amount of any borrowings for investment purposes. “Managed Assets” mean the total assets of the Fund, minus the sum of its accrued liabilities (other than Fund liabilities incurred for the express purpose of creating leverage). Total assets for this purpose shall include assets attributable to the Fund’s use of leverage (whether or not those assets are reflected in the Fund’s financial statements for purposes of generally accepted accounting principles), and derivatives will be valued at their market value.
Under normal circumstances:
| | · | | The Fund may invest up to 55% of its Managed Assets in securities that, at the time of investment, are rated below the three highest grades (Baa or BBB or lower) by at least one nationally recognized statistical rating organization (“NRSRO”) or are unrated but judged to be of comparable quality by the Fund’s sub-adviser. |
| | · | | The Fund may invest up to 15% of its Managed Assets in inverse floating rate securities. |
| | · | | The Fund may not enter into a futures contract or related options or forward contracts if more than 30% of the Fund’s Managed Assets would be represented by futures contracts or more than 5% of the Fund’s Managed Assets would be committed to initial margin deposits and premiums on futures contracts or related options. |
| | · | | The Fund will generally maintain an investment portfolio with an overall weighted average maturity of greater than 10 years. |
The foregoing policies apply only at the time of any new investment.
Approving Changes in Investment Policies
The Board of Trustees of the Fund may change the policies described above without a shareholder vote. However, with respect to the Fund’s policy of investing at least 80% of its Assets in municipal securities and other related investments that pay interest exempt from both regular federal income tax and the federal alternative minimum tax applicable to individuals at the time of purchase, such policy may not be changed without 60 days’ prior written notice and the approval of the holders of a majority of the outstanding common shares and preferred shares voting together as a single class, and the approval of the holders of a majority of the outstanding preferred shares, voting separately as a single class. A “majority of the outstanding” shares means (i) 67% or more of the shares present at a meeting, if the holders of more than 50% of the shares are present or represented by proxy or (ii) more than 50% of the shares, whichever is less.
Portfolio Contents
The Fund generally invests in municipal securities. Municipal securities include municipal bonds, notes, securities issued to finance and refinance public projects, certificates of participation, variable rate demand obligations, lease obligations, municipal notes, pre-refunded municipal bonds, private activity bonds, securities issued by tender option bond trusts (“TOB Trusts”), including inverse floating rate securities, and other forms of municipal bonds and securities, and other related instruments that create exposure to municipal bonds, notes and securities that provide for the payment of interest income that is exempt from regular U.S. federal income tax.
Municipal securities are debt obligations generally issued by states, cities and local authorities and certain possessions and territories of the United States (such as Puerto Rico and Guam) to finance or refinance public purpose projects such as roads, schools, and water supply systems.
The Fund may invest in municipal securities that represent lease obligations and certificates of participation in such leases. A municipal lease is an obligation in the form of a lease or installment purchase that is issued by a state or local government to acquire equipment and facilities. Income from such obligations generally is exempt from state and local taxes in the state of issuance. A certificate of participation represents an undivided interest in an unmanaged pool of municipal leases, an installment purchase agreement or other instruments. The certificates typically are issued by a municipal agency, a trust or other entity that has received an assignment of the payments to be made by the state or political subdivision under
237
Shareholder Update (Unaudited) (continued)
such leases or installment purchase agreements. Such certificates provide the Fund with the right to a pro rata undivided interest in the underlying municipal securities. In addition, such participations generally provide the Fund with the right to demand payment, on not more than seven days’ notice, of all or any part of the Fund’s participation interest in the underlying municipal securities, plus accrued interest.
The Fund may invest in municipal notes. Municipal securities in the form of notes generally are used to provide for short-term capital needs, in anticipation of an issuer’s receipt of other revenues or financing, and typically have maturities of up to three years. Such instruments may include tax anticipation notes, revenue anticipation notes, bond anticipation notes, tax and revenue anticipation notes and construction loan notes. Tax anticipation notes are issued to finance the working capital needs of governments. Generally, they are issued in anticipation of various tax revenues, such as income, sales, property, use and business taxes, and are payable from these specific future taxes. Revenue anticipation notes are issued in expectation of receipt of other kinds of revenue, such as federal revenues available under federal revenue sharing programs. Bond anticipation notes are issued to provide interim financing until long-term bond financing can be arranged. In most cases, the long-term bonds then provide the funds needed for repayment of the bond anticipation notes. Tax and revenue anticipation notes combine the funding sources of both tax anticipation notes and revenue anticipation notes. Construction loan notes are sold to provide construction financing. Mortgage notes insured by the Federal Housing Authority secure these notes; however, the proceeds from the insurance may be less than the economic equivalent of the payment of principal and interest on the mortgage note if there has been a default. The anticipated revenues from taxes, grants or bond financing generally secure the obligations of an issuer of municipal notes.
The Fund may invest in “tobacco settlement bonds.” Tobacco settlement bonds are municipal securities that are secured or payable solely from the collateralization of the proceeds from class action or other litigation against the tobacco industry.
The Fund may invest in pre-refunded municipal securities. The principal of and interest on pre-refunded municipal securities are no longer paid from the original revenue source for the securities. Instead, the source of such payments is typically an escrow fund consisting of U.S. government securities. The assets in the escrow fund are derived from the proceeds of refunding bonds issued by the same issuer as the pre-refunded municipal securities. Issuers of municipal securities use this advance refunding technique to obtain more favorable terms with respect to securities that are not yet subject to call or redemption by the issuer. For example, advance refunding enables an issuer to refinance debt at lower market interest rates, restructure debt to improve cash flow or eliminate restrictive covenants in the indenture or other governing instrument for the pre-refunded municipal securities. However, except for a change in the revenue source from which principal and interest payments are made, the pre-refunded municipal securities remain outstanding on their original terms until they mature or are redeemed by the issuer.
The Fund may invest in private activity bonds. Private activity bonds are issued by or on behalf of public authorities to obtain funds to provide privately operated housing facilities, airport, mass transit or port facilities, sewage disposal, solid waste disposal or hazardous waste treatment or disposal facilities and certain local facilities for water supply, gas or electricity. Other types of private activity bonds, the proceeds of which are used for the construction, equipment, repair or improvement of privately operated industrial or commercial facilities, may constitute municipal securities, although the current federal tax laws place substantial limitations on the size of such issues.
The Fund may invest in municipal securities issued by special taxing districts. Special taxing districts are organized to plan and finance infrastructure developments to induce residential, commercial and industrial growth and redevelopment. The bond financing methods such as tax increment finance, tax assessment, special services district and Mello-Roos bonds, are generally payable solely from taxes or other revenues attributable to the specific projects financed by the bonds without recourse to the credit or taxing power of related or overlapping municipalities.
The Fund may invest in inverse floating rate securities issued by a TOB trust, the interest rate on which varies inversely with the Securities Industry Financial Markets Association short-term rate, which resets weekly, or a similar short-term rate, and is reduced by the expenses related to the TOB trust. Typically, inverse floating rate securities represent beneficial interests in a special purpose trust (sometimes called a TOB trust) formed by a third party sponsor for the purpose of holding municipal bonds. Inverse floating rate securities may increase or decrease in value at a greater rate than the underlying interest rate on the municipal bond held by the TOB trust, which effectively leverages the Fund’s investment.
The Fund may invest in floating rate securities issued by special purpose trusts. Floating rate securities may take the form of short-term floating rate securities or the option period may be substantially longer. Generally, the interest rate earned will be based upon the market rates for municipal securities with maturities or remarketing provisions that are comparable in duration to the periodic interval of the tender option, which may vary from weekly, to monthly, to extended periods of one year or multiple years. Since the option feature has a shorter term than the final maturity or first call date of the underlying bond deposited in the trust, the Fund as the holder of the floating rate security relies upon the terms of the agreement with the financial institution furnishing the option as well as the credit strength of that institution. As further assurance of liquidity, the terms of the trust provide for a liquidation of the municipal security deposited in the trust and the application of the proceeds to pay off the floating rate security. The trusts that are organized to issue both short-term floating rate securities and inverse floaters generally include liquidation triggers to protect the investor in the floating rate security.
The Fund may invest in zero coupon bonds. A zero coupon bond is a bond that typically does not pay interest for the entire life of the obligation or for an initial period after the issuance of the obligation.
The Fund may buy and sell securities on a when-issued or delayed delivery basis, making payment or taking delivery at a later date, normally within 15 to 45 days of the trade date.
The Fund may invest in illiquid securities (i.e., securities that are not readily marketable), including, but not limited to, restricted securities (securities the disposition of which is restricted under the federal securities laws), securities that may be resold only pursuant to Rule 144A under the Securities Act of 1933, as amended (the “1933 Act”), and repurchase agreements with maturities in excess of seven days.
238
The Fund may enter into certain derivative instruments in pursuit of its investment objectives, including to seek to enhance return, to hedge certain risks of its investments in municipal securities or as a substitute for a position in the underlying asset. Such instruments include financial futures contracts, swap contracts (including interest rate swaps, credit default swaps and municipal market data rate locks (“MMD Rate Locks”)), options on financial futures, options on swap contracts or other derivative instruments.
The Fund may purchase and sell MMD Rate Locks. An MMD Rate Lock permits the Fund to lock in a specified municipal interest rate for a portion of its portfolio to preserve a return on a particular investment or a portion of its portfolio as a duration management technique or to protect against any increase in the price of securities to be purchased at a later date. By using an MMD Rate Lock, the Fund can create a synthetic long or short position, allowing the Fund to select what the manager believes is an attractive part of the yield curve. The Fund will ordinarily use these transactions as a hedge or for duration or risk management although it is permitted to enter into them to enhance income or gain or to increase the Fund’s yield, for example, during periods of steep interest rate yield curves (i.e., wide differences between short term and long term interest rates).
The Fund may also invest in securities of other open- or closed-end investment companies (including exchange-traded funds (“ETFs”)) that invest primarily in municipal securities of the types in which the Fund may invest directly, to the extent permitted by the Investment Company Act of 1940, as amended (the “1940 Act”), the rules and regulations issued thereunder and applicable exemptive orders issued by the Securities and Exchange Commission (“SEC”).
Use of Leverage
The Fund uses leverage to pursue its investment objectives. The Fund may use leverage to the extent permitted by the 1940 Act. The Fund may source leverage through a number of methods including the issuance of preferred shares of beneficial interest (“Preferred Shares”), entering into reverse repurchase agreements (effectively a secured borrowing) and borrowings (for defensive purposes only). In addition, the Fund may also use certain derivatives that have the economic effect of leverage by creating additional investment exposure. The amount and sources of leverage will vary depending on market conditions.
Temporary Defensive Periods
During temporary defensive periods (e.g., times when, in the Fund’s investment adviser’s and/or the Fund’s sub-adviser’s opinion, temporary imbalances of supply and demand or other temporary dislocations in the tax-exempt bond market adversely affect the price at which long-term or intermediate-term municipal securities are available), and in order to keep the Fund’s cash fully invested, the Fund may invest any percentage of its Managed Assets in short-term investments including high quality, short-term debt securities that may be either tax-exempt or taxable. The Fund may not achieve its investment objectives during such periods.
239
Shareholder Update (Unaudited) (continued)
NUVEEN MUNICIPAL CREDIT INCOME FUND (NZF)
Investment Objectives
The Fund’s investment objectives are to provide current income exempt from regular federal income tax and to enhance portfolio value relative to the municipal bond market by investing in tax-exempt municipal bonds that the Fund’s investment adviser believes are underrated or undervalued or that represent municipal market sectors that are undervalued.
Investment Policies
Under normal circumstances, the Fund will invest at least 80% of its Assets (as defined below) in municipal securities and other related investments, the income from which is exempt from regular federal income taxes.
As a non-fundamental investment policy, under normal circumstances, the Fund may invest up to 55% of its Managed Assets (as defined below) in securities that, at the time of investment, are rated below the three highest grades (Baa or BBB or lower) by at least one NRSRO or are unrated but judged to be of comparable quality by the Fund’s sub-adviser.
“Assets” mean the net assets of the Fund plus the amount of any borrowings for investment purposes. “Managed Assets” mean the total assets of the Fund, minus the sum of its accrued liabilities (other than Fund liabilities incurred for the express purpose of creating leverage). Total assets for this purpose shall include assets attributable to the Fund’s use of leverage (whether or not those assets are reflected in the Fund’s financial statements for purposes of generally accepted accounting principles), and derivatives will be valued at their market value.
Under normal circumstances:
| | · | | The Fund may invest up to 20% of its Managed Assets in municipal securities that pay interest that is taxable under the federal alternative minimum tax. |
| | · | | The Fund may invest up to 15% of its Managed Assets in inverse floating rate securities. |
| | · | | The Fund may not enter into a futures contract or related options or forward contracts if more than 30% of the Fund’s Managed Assets would be represented by futures contracts or more than 5% of the Fund’s Managed Assets would be committed to initial margin deposits and premiums on futures contracts or related options. |
| | · | | The Fund will generally maintain an investment portfolio with an overall weighted average maturity of greater than 10 years. |
The foregoing policies apply only at the time of any new investment.
Approving Changes in Investment Policies
The Board of Trustees of the Fund may change the policies described above without a shareholder vote. However, with respect to the Fund’s policy of investing at least 80% of its Assets in municipal securities and other related investments, the income from which is exempt from regular federal income taxes, such policy may not be changed without 60 days’ prior written notice and the approval of the holders of a majority of the outstanding common shares and preferred shares voting together as a single class, and the approval of the holders of a majority of the outstanding preferred shares, voting separately as a single class. A “majority of the outstanding” shares means (i) 67% or more of the shares present at a meeting, if the holders of more than 50% of the shares are present or represented by proxy or (ii) more than 50% of the shares, whichever is less.
Portfolio Contents
The Fund generally invests in municipal securities. Municipal securities include municipal bonds, notes, securities issued to finance and refinance public projects, certificates of participation, variable rate demand obligations, lease obligations, municipal notes, pre-refunded municipal bonds, private activity bonds, securities issued by TOB Trusts, including inverse floating rate securities, and other forms of municipal bonds and securities, and other related instruments that create exposure to municipal bonds, notes and securities that provide for the payment of interest income that is exempt from regular U.S. federal income tax.
Municipal securities are debt obligations generally issued by states, cities and local authorities and certain possessions and territories of the United States (such as Puerto Rico and Guam) to finance or refinance public purpose projects such as roads, schools, and water supply systems.
The Fund may also invest in municipal securities that pay interest that is taxable under the federal alternative minimum tax applicable to noncorporate taxpayers (“AMT Bonds”). AMT Bonds may trigger adverse tax consequences for Fund shareholders who are subject to the federal alternative minimum tax.
The Fund may invest in municipal securities that represent lease obligations and certificates of participation in such leases. A municipal lease is an obligation in the form of a lease or installment purchase that is issued by a state or local government to acquire equipment and facilities. Income from such obligations generally is exempt from state and local taxes in the state of issuance. A certificate of participation represents an undivided interest in an unmanaged pool of municipal leases, an installment purchase agreement or other instruments. The certificates typically are issued by a municipal agency, a trust or other entity that has received an assignment of the payments to be made by the state or political subdivision under such leases or installment purchase agreements. Such certificates provide the Fund with the right to a pro rata undivided interest in the underlying municipal securities. In addition, such participations generally provide the Fund with the right to demand payment, on not more than seven days’ notice, of all or any part of the Fund’s participation interest in the underlying municipal securities, plus accrued interest.
240
The Fund may invest in municipal notes. Municipal securities in the form of notes generally are used to provide for short-term capital needs, in anticipation of an issuer’s receipt of other revenues or financing, and typically have maturities of up to three years. Such instruments may include tax anticipation notes, revenue anticipation notes, bond anticipation notes, tax and revenue anticipation notes and construction loan notes. Tax anticipation notes are issued to finance the working capital needs of governments. Generally, they are issued in anticipation of various tax revenues, such as income, sales, property, use and business taxes, and are payable from these specific future taxes. Revenue anticipation notes are issued in expectation of receipt of other kinds of revenue, such as federal revenues available under federal revenue sharing programs. Bond anticipation notes are issued to provide interim financing until long-term bond financing can be arranged. In most cases, the long-term bonds then provide the funds needed for repayment of the bond anticipation notes. Tax and revenue anticipation notes combine the funding sources of both tax anticipation notes and revenue anticipation notes. Construction loan notes are sold to provide construction financing. Mortgage notes insured by the Federal Housing Authority secure these notes; however, the proceeds from the insurance may be less than the economic equivalent of the payment of principal and interest on the mortgage note if there has been a default. The anticipated revenues from taxes, grants or bond financing generally secure the obligations of an issuer of municipal notes.
The Fund may invest in “tobacco settlement bonds.” Tobacco settlement bonds are municipal securities that are secured or payable solely from the collateralization of the proceeds from class action or other litigation against the tobacco industry.
The Fund may invest in pre-refunded municipal securities. The principal of and interest on pre-refunded municipal securities are no longer paid from the original revenue source for the securities. Instead, the source of such payments is typically an escrow fund consisting of U.S. government securities. The assets in the escrow fund are derived from the proceeds of refunding bonds issued by the same issuer as the pre-refunded municipal securities. Issuers of municipal securities use this advance refunding technique to obtain more favorable terms with respect to securities that are not yet subject to call or redemption by the issuer. For example, advance refunding enables an issuer to refinance debt at lower market interest rates, restructure debt to improve cash flow or eliminate restrictive covenants in the indenture or other governing instrument for the pre-refunded municipal securities. However, except for a change in the revenue source from which principal and interest payments are made, the pre-refunded municipal securities remain outstanding on their original terms until they mature or are redeemed by the issuer.
The Fund may invest in private activity bonds. Private activity bonds are issued by or on behalf of public authorities to obtain funds to provide privately operated housing facilities, airport, mass transit or port facilities, sewage disposal, solid waste disposal or hazardous waste treatment or disposal facilities and certain local facilities for water supply, gas or electricity. Other types of private activity bonds, the proceeds of which are used for the construction, equipment, repair or improvement of privately operated industrial or commercial facilities, may constitute municipal securities, although the current federal tax laws place substantial limitations on the size of such issues.
The Fund may invest in municipal securities issued by special taxing districts. Special taxing districts are organized to plan and finance infrastructure developments to induce residential, commercial and industrial growth and redevelopment. The bond financing methods such as tax increment finance, tax assessment, special services district and Mello-Roos bonds, are generally payable solely from taxes or other revenues attributable to the specific projects financed by the bonds without recourse to the credit or taxing power of related or overlapping municipalities.
The Fund may invest in inverse floating rate securities issued by a TOB trust, the interest rate on which varies inversely with the Securities Industry Financial Markets Association short-term rate, which resets weekly, or a similar short-term rate, and is reduced by the expenses related to the TOB trust. Typically, inverse floating rate securities represent beneficial interests in a special purpose trust (sometimes called a TOB trust) formed by a third party sponsor for the purpose of holding municipal bonds. Inverse floating rate securities may increase or decrease in value at a greater rate than the underlying interest rate on the municipal bond held by the TOB trust, which effectively leverages the Fund’s investment.
The Fund may invest in floating rate securities issued by special purpose trusts. Floating rate securities may take the form of short-term floating rate securities or the option period may be substantially longer. Generally, the interest rate earned will be based upon the market rates for municipal securities with maturities or remarketing provisions that are comparable in duration to the periodic interval of the tender option, which may vary from weekly, to monthly, to extended periods of one year or multiple years. Since the option feature has a shorter term than the final maturity or first call date of the underlying bond deposited in the trust, the Fund as the holder of the floating rate security relies upon the terms of the agreement with the financial institution furnishing the option as well as the credit strength of that institution. As further assurance of liquidity, the terms of the trust provide for a liquidation of the municipal security deposited in the trust and the application of the proceeds to pay off the floating rate security. The trusts that are organized to issue both short-term floating rate securities and inverse floaters generally include liquidation triggers to protect the investor in the floating rate security.
The Fund may invest in zero coupon bonds. A zero coupon bond is a bond that typically does not pay interest for the entire life of the obligation or for an initial period after the issuance of the obligation.
The Fund may buy and sell securities on a when-issued or delayed delivery basis, making payment or taking delivery at a later date, normally within 15 to 45 days of the trade date.
The Fund may invest in illiquid securities (i.e., securities that are not readily marketable), including, but not limited to, restricted securities (securities the disposition of which is restricted under the federal securities laws), securities that may be resold only pursuant to Rule 144A under the 1933 Act, and repurchase agreements with maturities in excess of seven days.
The Fund may enter into certain derivative instruments in pursuit of its investment objectives, including to seek to enhance return, to hedge certain risks of its investments in municipal securities or as a substitute for a position in the underlying asset. Such instruments include financial futures contracts, swap contracts (including interest rate swaps, credit default swaps and MMD Rate Locks), options on financial futures, options on swap contracts or other derivative instruments.
241
Shareholder Update (Unaudited) (continued)
The Fund may purchase and sell MMD Rate Locks. An MMD Rate Lock permits the Fund to lock in a specified municipal interest rate for a portion of its portfolio to preserve a return on a particular investment or a portion of its portfolio as a duration management technique or to protect against any increase in the price of securities to be purchased at a later date. By using an MMD Rate Lock, the Fund can create a synthetic long or short position, allowing the Fund to select what the manager believes is an attractive part of the yield curve. The Fund will ordinarily use these transactions as a hedge or for duration or risk management although it is permitted to enter into them to enhance income or gain or to increase the Fund’s yield, for example, during periods of steep interest rate yield curves (i.e., wide differences between short term and long term interest rates).
The Fund may also invest in securities of other open- or closed-end investment companies (including ETFs) that invest primarily in municipal securities of the types in which the Fund may invest directly, to the extent permitted by the 1940 Act, the rules and regulations issued thereunder and applicable exemptive orders issued by the SEC. In addition, the Fund may invest a portion of its Managed Assets in pooled investment vehicles (other than investment companies) that invest primarily in municipal securities of the types in which the Fund may invest directly.
Use of Leverage
The Fund uses leverage to pursue its investment objectives. The Fund may use leverage to the extent permitted by the 1940 Act. The Fund may source leverage through a number of methods including the issuance of Preferred Shares, investments in inverse floating rate securities and borrowings. In addition, the Fund may also use certain derivatives that have the economic effect of leverage by creating additional investment exposure. The amount and sources of leverage will vary depending on market conditions.
Temporary Defensive Periods
During temporary defensive periods (e.g., times when, in the Fund’s investment adviser’s and/or the Fund’s sub-adviser’s opinion, temporary imbalances of supply and demand or other temporary dislocations in the tax-exempt bond market adversely affect the price at which long-term or intermediate-term municipal securities are available), and in order to keep the Fund’s cash fully invested, the Fund may invest any percentage of its Managed Assets in short-term investments including high quality, short-term debt securities that may be either tax-exempt or taxable. The Fund may not achieve its investment objectives during such periods.
242
NUVEEN MUNICIPAL HIGH INCOME OPPORTUNITY FUND (NMZ)
Investment Objectives
The Fund’s primary investment objective is to provide high current income exempt from regular federal income tax. The Fund’s secondary investment objective is to seek attractive total return consistent with its primary objective.
Investment Policies
Under normal circumstances, the Fund will invest at least 80% of its Assets (as defined below) in municipal securities and other related investments, the income from which is exempt from regular federal income taxes.
“Assets” mean the net assets of the Fund plus the amount of any borrowings for investment purposes. “Managed Assets” mean the total assets of the Fund, minus the sum of its accrued liabilities (other than Fund liabilities incurred for the express purpose of creating leverage). Total assets for this purpose shall include assets attributable to the Fund’s use of leverage (whether or not those assets are reflected in the Fund’s financial statements for purposes of generally accepted accounting principles), and derivatives will be valued at their market value.
Under normal circumstances:
| | · | | The Fund may invest up to 20% of its Managed Assets in municipal securities that pay interest that is taxable under the federal alternative minimum tax. |
| | · | | The Fund may invest up to 75% of its Managed Assets in municipal securities that, at the time of investment, are rated Baa/BBB or lower by at least one NRSRO or are unrated but judged to be of comparable quality by the Fund’s sub-adviser. |
| | · | | The Fund may not invest more than 10% of its Managed Assets in municipal securities rated below B3/B- by any NRSROs that rate the security or that are unrated by all NRSROs but judged to be of comparable quality by the Fund’s sub-adviser. |
| | · | | The Fund may invest up to 25% of its Managed Assets in municipal securities in any one industry or in any one state of origin. |
| | · | | The Fund may invest up to 15% of its Managed Assets in inverse floating rate securities. |
| | · | | The Fund will generally maintain an investment portfolio with an overall weighted average maturity of greater than 10 years. |
The foregoing policies apply only at the time of any new investment.
Approving Changes in Investment Policies
The Board of Trustees of the Fund may change the policies described above without a shareholder vote. However, with respect to the Fund’s policy of investing at least 80% of its Assets in municipal securities and other related investments, the income from which is exempt from regular federal income taxes, such policy may not be changed without 60 days’ prior written notice and the approval of the holders of a majority of the outstanding common shares and preferred shares voting together as a single class, and the approval of the holders of a majority of the outstanding preferred shares, voting separately as a single class. A “majority of the outstanding” shares means (i) 67% or more of the shares present at a meeting, if the holders of more than 50% of the shares are present or represented by proxy or (ii) more than 50% of the shares, whichever is less.
Portfolio Contents
The Fund generally invests in municipal securities. Municipal securities include municipal bonds, notes, securities issued to finance and refinance public projects, certificates of participation, variable rate demand obligations, lease obligations, municipal notes, pre-refunded municipal bonds, private activity bonds, securities issued by TOB Trusts, including inverse floating rate securities, and other forms of municipal bonds and securities, and other related instruments that create exposure to municipal bonds, notes and securities that provide for the payment of interest income that is exempt from regular U.S. federal income tax.
Municipal securities are debt obligations generally issued by states, cities and local authorities and certain possessions and territories of the United States (such as Puerto Rico and Guam) to finance or refinance public purpose projects such as roads, schools, and water supply systems.
The Fund may invest in municipal securities that are additionally secured by insurance, bank credit agreements or escrow accounts.
The Fund may also invest in AMT Bonds. AMT Bonds may trigger adverse tax consequences for Fund shareholders who are subject to the federal alternative minimum tax.
The Fund may invest a significant portion of its Managed Assets in certain sectors of the municipal securities market, such as hospitals and other health care facilities, charter schools and other private educational facilities, special taxing districts and start-up utility districts, and private activity bonds including industrial development bonds on behalf of transportation companies such as airline companies, whose credit quality and performance may be more susceptible to economic, business, political, regulatory and other developments than other sectors of municipal issuers.
The Fund may invest in municipal securities that represent lease obligations and certificates of participation in such leases. A municipal lease is an obligation in the form of a lease or installment purchase that is issued by a state or local government to acquire equipment and facilities. Income from such obligations generally is exempt from state and local taxes in the state of issuance. A certificate of participation represents an undivided interest in an unmanaged pool of municipal leases, an installment purchase agreement or other instruments. The certificates typically are issued by
243
Shareholder Update (Unaudited) (continued)
a municipal agency, a trust or other entity that has received an assignment of the payments to be made by the state or political subdivision under such leases or installment purchase agreements. Such certificates provide the Fund with the right to a pro rata undivided interest in the underlying municipal securities. In addition, such participations generally provide the Fund with the right to demand payment, on not more than seven days’ notice, of all or any part of the Fund’s participation interest in the underlying municipal securities, plus accrued interest.
The Fund may invest in municipal notes. Municipal securities in the form of notes generally are used to provide for short-term capital needs, in anticipation of an issuer’s receipt of other revenues or financing, and typically have maturities of up to three years. Such instruments may include tax anticipation notes, revenue anticipation notes, bond anticipation notes, tax and revenue anticipation notes and construction loan notes. Tax anticipation notes are issued to finance the working capital needs of governments. Generally, they are issued in anticipation of various tax revenues, such as income, sales, property, use and business taxes, and are payable from these specific future taxes. Revenue anticipation notes are issued in expectation of receipt of other kinds of revenue, such as federal revenues available under federal revenue sharing programs. Bond anticipation notes are issued to provide interim financing until long-term bond financing can be arranged. In most cases, the long-term bonds then provide the funds needed for repayment of the bond anticipation notes. Tax and revenue anticipation notes combine the funding sources of both tax anticipation notes and revenue anticipation notes. Construction loan notes are sold to provide construction financing. Mortgage notes insured by the Federal Housing Authority secure these notes; however, the proceeds from the insurance may be less than the economic equivalent of the payment of principal and interest on the mortgage note if there has been a default. The anticipated revenues from taxes, grants or bond financing generally secure the obligations of an issuer of municipal notes.
The Fund may invest in “tobacco settlement bonds.” Tobacco settlement bonds are municipal securities that are secured or payable solely from the collateralization of the proceeds from class action or other litigation against the tobacco industry.
The Fund may invest in pre-refunded municipal securities. The principal of and interest on pre-refunded municipal securities are no longer paid from the original revenue source for the securities. Instead, the source of such payments is typically an escrow fund consisting of U.S. government securities. The assets in the escrow fund are derived from the proceeds of refunding bonds issued by the same issuer as the pre-refunded municipal securities. Issuers of municipal securities use this advance refunding technique to obtain more favorable terms with respect to securities that are not yet subject to call or redemption by the issuer. For example, advance refunding enables an issuer to refinance debt at lower market interest rates, restructure debt to improve cash flow or eliminate restrictive covenants in the indenture or other governing instrument for the pre-refunded municipal securities. However, except for a change in the revenue source from which principal and interest payments are made, the pre-refunded municipal securities remain outstanding on their original terms until they mature or are redeemed by the issuer.
The Fund may invest in private activity bonds. Private activity bonds are issued by or on behalf of public authorities to obtain funds to provide privately operated housing facilities, airport, mass transit or port facilities, sewage disposal, solid waste disposal or hazardous waste treatment or disposal facilities and certain local facilities for water supply, gas or electricity. Other types of private activity bonds, the proceeds of which are used for the construction, equipment, repair or improvement of privately operated industrial or commercial facilities, may constitute municipal securities, although the current federal tax laws place substantial limitations on the size of such issues.
The Fund may invest in municipal securities issued by special taxing districts. Special taxing districts are organized to plan and finance infrastructure developments to induce residential, commercial and industrial growth and redevelopment. The bond financing methods such as tax increment finance, tax assessment, special services district and Mello-Roos bonds, are generally payable solely from taxes or other revenues attributable to the specific projects financed by the bonds without recourse to the credit or taxing power of related or overlapping municipalities.
The Fund may invest in inverse floating rate securities issued by a TOB trust, the interest rate on which varies inversely with the Securities Industry Financial Markets Association short-term rate, which resets weekly, or a similar short-term rate, and is reduced by the expenses related to the TOB trust. Typically, inverse floating rate securities represent beneficial interests in a special purpose trust (sometimes called a TOB trust) formed by a third party sponsor for the purpose of holding municipal bonds. Inverse floating rate securities may increase or decrease in value at a greater rate than the underlying interest rate on the municipal bond held by the TOB trust, which effectively leverages the Fund’s investment.
The Fund may invest in floating rate securities issued by special purpose trusts. Floating rate securities may take the form of short-term floating rate securities or the option period may be substantially longer. Generally, the interest rate earned will be based upon the market rates for municipal securities with maturities or remarketing provisions that are comparable in duration to the periodic interval of the tender option, which may vary from weekly, to monthly, to extended periods of one year or multiple years. Since the option feature has a shorter term than the final maturity or first call date of the underlying bond deposited in the trust, the Fund as the holder of the floating rate security relies upon the terms of the agreement with the financial institution furnishing the option as well as the credit strength of that institution. As further assurance of liquidity, the terms of the trust provide for a liquidation of the municipal security deposited in the trust and the application of the proceeds to pay off the floating rate security. The trusts that are organized to issue both short-term floating rate securities and inverse floaters generally include liquidation triggers to protect the investor in the floating rate security.
The Fund may invest in zero coupon bonds. A zero coupon bond is a bond that typically does not pay interest for the entire life of the obligation or for an initial period after the issuance of the obligation.
The Fund may buy and sell securities on a when-issued or delayed delivery basis, making payment or taking delivery at a later date, normally within 15 to 45 days of the trade date.
The Fund may invest in illiquid securities (i.e., securities that are not readily marketable), including, but not limited to, restricted securities (securities the disposition of which is restricted under the federal securities laws), securities that may be resold only pursuant to Rule 144A under the 1933 Act, and repurchase agreements with maturities in excess of seven days.
244
The Fund may enter into certain derivative instruments in pursuit of its investment objective, including to seek to enhance return, to hedge certain risks of its investments in municipal securities or as a substitute for a position in the underlying asset. Such instruments include financial futures contracts, swap contracts (including interest rate swaps, credit default swaps and MMD Rate Locks), options on financial futures, options on swap contracts, or other derivative instruments.
The Fund may purchase and sell MMD Rate Locks. An MMD Rate Lock permits the Fund to lock in a specified municipal interest rate for a portion of its portfolio to preserve a return on a particular investment or a portion of its portfolio as a duration management technique or to protect against any increase in the price of securities to be purchased at a later date. By using an MMD Rate Lock, the Fund can create a synthetic long or short position, allowing the Fund to select what the manager believes is an attractive part of the yield curve. The Fund will ordinarily use these transactions as a hedge or for duration or risk management although it is permitted to enter into them to enhance income or gain or to increase the Fund’s yield, for example, during periods of steep interest rate yield curves (i.e., wide differences between short term and long term interest rates).
The Fund may also invest in securities of other open- or closed-end investment companies (including ETFs) that invest primarily in municipal securities of the types in which the Fund may invest directly, to the extent permitted by the 1940 Act, the rules and regulations issued thereunder and applicable exemptive orders issued by the SEC.
Use of Leverage
The Fund uses leverage to pursue its investment objectives. The Fund may use leverage to the extent permitted by the 1940 Act. The Fund may source leverage through a number of methods including the issuance of Preferred Shares, investments in inverse floating rate securities, entering into reverse repurchase agreements (effectively a secured borrowing) and borrowings (subject to certain investment restrictions). In addition, the Fund may also use certain derivatives that have the economic effect of leverage by creating additional investment exposure. The amount and sources of leverage will vary depending on market conditions.
Temporary Defensive Periods
During temporary defensive periods (e.g., times when, in the Fund’s investment adviser’s and/or the Fund’s sub-adviser’s opinion, temporary imbalances of supply and demand or other temporary dislocations in the tax-exempt bond market adversely affect the price at which long-term or intermediate-term municipal securities are available), and in order to keep the Fund’s cash fully invested, the Fund may invest any percentage of its Managed Assets in short-term investments including high quality, short-term debt securities that may be either tax-exempt or taxable. The Fund may not achieve its investment objectives during such periods.
245
Shareholder Update (Unaudited) (continued)
NUVEEN MUNICIPAL CREDIT OPPORTUNITIES FUND (NMCO)
Investment Objectives
The Fund’s primary investment objective is to provide a high level of current income exempt from regular U.S. federal income tax. The Fund’s secondary investment objective is to seek total return.
Investment Policies
Under normal circumstances, the Fund will invest at least 80% of its Assets (as defined below) in municipal securities, the income from which is exempt from regular U.S. federal income taxes.
“Assets” mean the net assets of the Fund plus the amount of any borrowings for investment purposes. “Managed Assets” mean the total assets of the Fund, minus the sum of its accrued liabilities (other than Fund liabilities incurred for the express purpose of creating leverage). Total assets for this purpose shall include assets attributable to the Fund’s use of leverage (whether or not those assets are reflected in the Fund’s financial statements for purposes of generally accepted accounting principles), and derivatives will be valued at their market value.
Under normal circumstances:
| | · | | The Fund may invest without limit in high yielding, low- to medium-quality municipal securities (low- to medium-quality municipal securities are municipal securities rated Baa/BBB or lower) rated by at least one NRSRO at the time of investment or are unrated but judged by the Fund’s sub-adviser to be of comparable quality. |
| | · | | The Fund may invest no more than 30% of its Managed Assets in municipal securities that, at the time of investment, either are rated CCC+/ Caa1 or lower, or are unrated but judged by the Fund’s sub-adviser to be of comparable quality. |
| | · | | The Fund may invest no more than 10% of its Managed Assets in defaulted securities or in the securities of an issuer that is in bankruptcy or insolvency proceedings. |
The foregoing policies apply only at the time of any new investment.
Approving Changes in Investment Policies
The Board of Trustees of the Fund may change the policies described above without a shareholder vote. However, with respect to the Fund’s policy of investing at least 80% of its Assets in municipal securities, the income from which is exempt from regular U.S. federal income taxes, such policy may not be changed without 60 days’ prior written notice and the approval of the holders of a majority of the outstanding common shares and preferred shares voting together as a single class, and the approval of the holders of a majority of the outstanding preferred shares, voting separately as a single class. A “majority of the outstanding” shares means (i) 67% or more of the shares present at a meeting, if the holders of more than 50% of the shares are present or represented by proxy or (ii) more than 50% of the shares, whichever is less.
Portfolio Contents
The Fund generally invests in municipal securities. Municipal securities include municipal bonds, notes, securities issued to finance and refinance public projects, certificates of participation, variable rate demand obligations, lease obligations, municipal notes, pre-refunded municipal bonds, private activity bonds, securities issued by TOB Trusts, including inverse floating rate securities, and other forms of municipal bonds and securities, and other related instruments that create exposure to municipal bonds, notes and securities that provide for the payment of interest income that is exempt from regular U.S. federal income tax.
Municipal securities are debt obligations generally issued by states, cities and local authorities and certain possessions and territories of the United States (such as Puerto Rico and Guam) to finance or refinance public purpose projects such as roads, schools, and water supply systems.
The Fund may invest in municipal securities that are additionally secured by insurance, bank credit agreements or escrow accounts.
The Fund may invest in municipal securities that represent lease obligations and certificates of participation in such leases. A municipal lease is an obligation in the form of a lease or installment purchase that is issued by a state or local government to acquire equipment and facilities. Income from such obligations generally is exempt from state and local taxes in the state of issuance. A certificate of participation represents an undivided interest in an unmanaged pool of municipal leases, an installment purchase agreement or other instruments. The certificates typically are issued by a municipal agency, a trust or other entity that has received an assignment of the payments to be made by the state or political subdivision under such leases or installment purchase agreements. Such certificates provide the Fund with the right to a pro rata undivided interest in the underlying municipal securities. In addition, such participations generally provide the Fund with the right to demand payment, on not more than seven days’ notice, of all or any part of the Fund’s participation interest in the underlying municipal securities, plus accrued interest.
The Fund may invest in municipal notes. Municipal securities in the form of notes generally are used to provide for short-term capital needs, in anticipation of an issuer’s receipt of other revenues or financing, and typically have maturities of up to three years. Such instruments may include tax anticipation notes, revenue anticipation notes, bond anticipation notes, tax and revenue anticipation notes and construction loan notes. Tax anticipation notes are issued to finance the working capital needs of governments. Generally, they are issued in anticipation of various tax revenues, such as income, sales, property, use and business taxes, and are payable from these specific future taxes. Revenue anticipation notes are issued in expectation of receipt of other kinds of revenue, such as federal revenues available under federal revenue sharing programs. Bond anticipation notes are issued to provide interim financing until long-term bond financing can be arranged. In most cases, the long-term bonds then provide the funds
246
needed for repayment of the bond anticipation notes. Tax and revenue anticipation notes combine the funding sources of both tax anticipation notes and revenue anticipation notes. Construction loan notes are sold to provide construction financing. Mortgage notes insured by the Federal Housing Authority secure these notes; however, the proceeds from the insurance may be less than the economic equivalent of the payment of principal and interest on the mortgage note if there has been a default. The anticipated revenues from taxes, grants or bond financing generally secure the obligations of an issuer of municipal notes.
The Fund may invest in “tobacco settlement bonds.” Tobacco settlement bonds are municipal securities that are secured or payable solely from the collateralization of the proceeds from class action or other litigation against the tobacco industry.
The Fund may invest in pre-refunded municipal securities. The principal of and interest on pre-refunded municipal securities are no longer paid from the original revenue source for the securities. Instead, the source of such payments is typically an escrow fund consisting of U.S. government securities. The assets in the escrow fund are derived from the proceeds of refunding bonds issued by the same issuer as the pre-refunded municipal securities. Issuers of municipal securities use this advance refunding technique to obtain more favorable terms with respect to securities that are not yet subject to call or redemption by the issuer. For example, advance refunding enables an issuer to refinance debt at lower market interest rates, restructure debt to improve cash flow or eliminate restrictive covenants in the indenture or other governing instrument for the pre-refunded municipal securities. However, except for a change in the revenue source from which principal and interest payments are made, the pre-refunded municipal securities remain outstanding on their original terms until they mature or are redeemed by the issuer.
The Fund may invest in private activity bonds. Private activity bonds are issued by or on behalf of public authorities to obtain funds to provide privately operated housing facilities, airport, mass transit or port facilities, sewage disposal, solid waste disposal or hazardous waste treatment or disposal facilities and certain local facilities for water supply, gas or electricity. Other types of private activity bonds, the proceeds of which are used for the construction, equipment, repair or improvement of privately operated industrial or commercial facilities, may constitute municipal securities, although the current federal tax laws place substantial limitations on the size of such issues.
The Fund may invest in municipal securities issued by special taxing districts. Special taxing districts are organized to plan and finance infrastructure developments to induce residential, commercial and industrial growth and redevelopment. The bond financing methods such as tax increment finance, tax assessment, special services district and Mello-Roos bonds, are generally payable solely from taxes or other revenues attributable to the specific projects financed by the bonds without recourse to the credit or taxing power of related or overlapping municipalities.
The Fund may invest in inverse floating rate securities issued by a TOB trust, the interest rate on which varies inversely with the Securities Industry Financial Markets Association short-term rate, which resets weekly, or a similar short-term rate, and is reduced by the expenses related to the TOB trust. Typically, inverse floating rate securities represent beneficial interests in a special purpose trust (sometimes called a TOB trust) formed by a third party sponsor for the purpose of holding municipal bonds. Inverse floating rate securities may increase or decrease in value at a greater rate than the underlying interest rate on the municipal bond held by the TOB trust, which effectively leverages the Fund’s investment.
The Fund may invest in floating rate securities issued by special purpose trusts. Floating rate securities may take the form of short-term floating rate securities or the option period may be substantially longer. Generally, the interest rate earned will be based upon the market rates for municipal securities with maturities or remarketing provisions that are comparable in duration to the periodic interval of the tender option, which may vary from weekly, to monthly, to extended periods of one year or multiple years. Since the option feature has a shorter term than the final maturity or first call date of the underlying bond deposited in the trust, the Fund as the holder of the floating rate security relies upon the terms of the agreement with the financial institution furnishing the option as well as the credit strength of that institution. As further assurance of liquidity, the terms of the trust provide for a liquidation of the municipal security deposited in the trust and the application of the proceeds to pay off the floating rate security. The trusts that are organized to issue both short-term floating rate securities and inverse floaters generally include liquidation triggers to protect the investor in the floating rate security.
The Fund may invest in zero coupon bonds. A zero coupon bond is a bond that typically does not pay interest for the entire life of the obligation or for an initial period after the issuance of the obligation.
The Fund may buy and sell securities on a when-issued or delayed delivery basis, making payment or taking delivery at a later date, normally within 15 to 45 days of the trade date.
The Fund may invest in illiquid securities (i.e., securities that are not readily marketable), including, but not limited to, restricted securities (securities the disposition of which is restricted under the federal securities laws), securities that may be resold only pursuant to Rule 144A under the 1933 Act, and repurchase agreements with maturities in excess of seven days.
The Fund may enter into certain derivative instruments in pursuit of its investment objectives, including to seek to enhance return, to hedge certain risks of its investments in municipal securities or as a substitute for a position in the underlying asset. Such instruments include financial futures contracts, swap contracts (including interest rate swaps, credit default swaps and MMD Rate Locks), options on financial futures, options on swap contracts or other derivative instruments.
The Fund may purchase and sell MMD Rate Locks. An MMD Rate Lock permits the Fund to lock in a specified municipal interest rate for a portion of its portfolio to preserve a return on a particular investment or a portion of its portfolio as a duration management technique or to protect against any increase in the price of securities to be purchased at a later date. By using an MMD Rate Lock, the Fund can create a synthetic long or short position, allowing the Fund to select what the manager believes is an attractive part of the yield curve. The Fund will ordinarily use these transactions as a hedge or for duration or risk management although it is permitted to enter into them to enhance income or gain or to increase the Fund’s yield, for example, during periods of steep interest rate yield curves (i.e., wide differences between short term and long term interest rates).
247
Shareholder Update (Unaudited) (continued)
The Fund may also invest in securities of other open- or closed-end investment companies (including ETFs) that invest primarily in municipal securities of the types in which the Fund may invest directly, to the extent permitted by the 1940 Act, the rules and regulations issued thereunder and applicable exemptive orders issued by the SEC.
Use of Leverage
The Fund uses leverage to pursue its investment objectives. The Fund may use leverage to the extent permitted by the 1940 Act. The Fund may source leverage through a number of methods including the issuance of Preferred Shares, investments in inverse floating rate securities, entering into reverse repurchase agreements (effectively a secured borrowing), or a combination of both. In addition, the Fund may also use certain derivatives that have the economic effect of leverage by creating additional investment exposure. The amount and sources of leverage will vary depending on market conditions.
Temporary Defensive Periods
During temporary defensive periods (e.g., times when, in the Fund’s investment adviser’s and/or the Fund’s sub-adviser’s opinion, temporary imbalances of supply and demand or other temporary dislocations in the tax-exempt bond market adversely affect the price at which long-term or intermediate-term municipal securities are available), and in order to keep the Fund’s cash fully invested, the Fund may invest any percentage of its Managed Assets in short-term investments including high quality, short-term debt securities that may be either tax-exempt or taxable. The Fund may not achieve its investment objectives during such periods.
248
NUVEEN DYNAMIC MUNICIPAL OPPORTUNITIES FUND (NDMO)
Investment Objective
The Fund’s investment objective is to seek total return through income exempt from regular federal income taxes and capital appreciation.
Investment Policies
Under normal circumstances, the Fund will invest at least 80% of its Assets (as defined below) in municipal securities, the income from which is exempt from regular federal income taxes.
“Assets” means net assets of the Fund plus the amount of any borrowings for investment purposes. “Managed Assets” means the total assets of the Fund, minus the sum of its accrued liabilities (other than Fund liabilities incurred for the express purpose of creating leverage). Total assets for this purpose shall include assets attributable to the Fund’s use of leverage (whether or not those assets are reflected in the Fund’s financial statements for purposes of generally accepted accounting principles), and derivatives will be valued at their market value.
Under normal circumstances:
| | · | | The Fund may invest in municipal securities of any credit quality and without limit in below investment grade municipal securities (municipal securities rated BB+/Ba1 or lower) rated by at least one NRSRO at the time of investment or are unrated but judged by the Fund’s sub-adviser to be of comparable quality. |
| | · | | The Fund may invest up to 20% of its Managed Assets in taxable debt obligations, including taxable municipal securities and corporate debt securities. |
| | · | | The Fund may invest no more than 10% of its Managed Assets in defaulted securities or in the securities of an issuer that is in bankruptcy or insolvency proceedings. This policy does not apply in connection with any workout of an issuer of a debt security that the Fund already owns. |
The foregoing policies apply only at the time of any new investment.
Approving Changes in Investment Policies
The Board of Trustees of the Fund may change the policies described above without a shareholder vote. However, with respect to the Fund’s fundamental investment policy of investing at least 80% of its Assets in municipal securities, the income from which is exempt from regular federal income taxes, such policy may not be changed without 60 days’ prior written notice and the approval of the holders of a majority of the outstanding common shares and preferred shares voting together as a single class, and the approval of the holders of a majority of the outstanding preferred shares, voting separately as a single class. A “majority of the outstanding” shares means (i) 67% or more of the shares present at a meeting, if the holders of more than 50% of the shares are present or represented by proxy or (ii) more than 50% of the shares, whichever is less.
Portfolio Contents
The Fund generally invests its assets in a portfolio of municipal securities of any credit quality and maturity. Municipal securities include municipal bonds, notes, securities issued to finance and refinance public projects, certificates of participation, variable rate demand obligations, lease obligations, municipal notes, pre-refunded municipal bonds, private activity bonds, securities issued by TOB Trusts, including inverse floating rate securities, and other forms of municipal bonds and securities, and other related instruments that create exposure to municipal bonds, notes and securities that provide for the payment of interest income that is exempt from regular U.S. federal income tax.
Municipal securities are debt obligations generally issued by states, cities and local authorities and certain possessions and territories of the United States (such as Puerto Rico and Guam) to finance or refinance public purpose projects such as roads, schools, and water supply systems.
The Fund may invest in municipal securities that are additionally secured by insurance, bank credit agreements or escrow accounts.
The Fund may also invest in AMT Bonds. AMT Bonds may trigger adverse tax consequences for Fund shareholders who are subject to the federal alternative minimum tax.
The Fund may invest in municipal securities that represent lease obligations and certificates of participation in such leases. A municipal lease is an obligation in the form of a lease or installment purchase that is issued by a state or local government to acquire equipment and facilities. Income from such obligations generally is exempt from state and local taxes in the state of issuance. A certificate of participation represents an undivided interest in an unmanaged pool of municipal leases, an installment purchase agreement or other instruments. The certificates typically are issued by a municipal agency, a trust or other entity that has received an assignment of the payments to be made by the state or political subdivision under such leases or installment purchase agreements. Such certificates provide the Fund with the right to a pro rata undivided interest in the underlying municipal securities. In addition, such participations generally provide the Fund with the right to demand payment, on not more than seven days’ notice, of all or any part of the Fund’s participation interest in the underlying municipal securities, plus accrued interest.
The Fund may invest in municipal notes. Municipal securities in the form of notes generally are used to provide for short-term capital needs, in anticipation of an issuer’s receipt of other revenues or financing, and typically have maturities of up to three years. Such instruments may include tax anticipation notes, revenue anticipation notes, bond anticipation notes, tax and revenue anticipation notes and construction loan notes. Tax
249
Shareholder Update (Unaudited) (continued)
anticipation notes are issued to finance the working capital needs of governments. Generally, they are issued in anticipation of various tax revenues, such as income, sales, property, use and business taxes, and are payable from these specific future taxes. Revenue anticipation notes are issued in expectation of receipt of other kinds of revenue, such as federal revenues available under federal revenue sharing programs. Bond anticipation notes are issued to provide interim financing until long-term bond financing can be arranged. In most cases, the long-term bonds then provide the funds needed for repayment of the bond anticipation notes. Tax and revenue anticipation notes combine the funding sources of both tax anticipation notes and revenue anticipation notes. Construction loan notes are sold to provide construction financing. Mortgage notes insured by the Federal Housing Authority secure these notes; however, the proceeds from the insurance may be less than the economic equivalent of the payment of principal and interest on the mortgage note if there has been a default. The anticipated revenues from taxes, grants or bond financing generally secure the obligations of an issuer of municipal notes.
The Fund may invest in pre-refunded municipal securities. The principal of and interest on pre-refunded municipal securities are no longer paid from the original revenue source for the securities. Instead, the source of such payments is typically an escrow fund consisting of U.S. government securities. The assets in the escrow fund are derived from the proceeds of refunding bonds issued by the same issuer as the pre-refunded municipal securities. Issuers of municipal securities use this advance refunding technique to obtain more favorable terms with respect to securities that are not yet subject to call or redemption by the issuer. For example, advance refunding enables an issuer to refinance debt at lower market interest rates, restructure debt to improve cash flow or eliminate restrictive covenants in the indenture or other governing instrument for the pre-refunded municipal securities. However, except for a change in the revenue source from which principal and interest payments are made, the pre-refunded municipal securities remain outstanding on their original terms until they mature or are redeemed by the issuer.
The Fund may invest in private activity bonds. Private activity bonds are issued by or on behalf of public authorities to obtain funds to provide privately operated housing facilities, airport, mass transit or port facilities, sewage disposal, solid waste disposal or hazardous waste treatment or disposal facilities and certain local facilities for water supply, gas or electricity. Other types of private activity bonds, the proceeds of which are used for the construction, equipment, repair or improvement of privately operated industrial or commercial facilities, may constitute municipal securities, although the current federal tax laws place substantial limitations on the size of such issues.
The Fund may invest in municipal securities issued by special taxing districts. Special taxing districts are organized to plan and finance infrastructure developments to induce residential, commercial and industrial growth and redevelopment. The bond financing methods such as tax increment finance, tax assessment, special services district and Mello-Roos bonds, are generally payable solely from taxes or other revenues attributable to the specific projects financed by the bonds without recourse to the credit or taxing power of related or overlapping municipalities.
The Fund may invest in “tobacco settlement bonds.” Tobacco settlement bonds are municipal securities that are secured or payable solely from the collateralization of the proceeds from class action or other litigation against the tobacco industry.
The Fund may invest in corporate debt securities. Corporate debt securities are fully taxable debt obligations issued by corporations. The broad category of corporate debt securities includes debt issued by companies of all kinds, including those with small-, mid- and large-capitalizations. Corporate debt may be rated investment-grade or below investment-grade and may carry variable or floating rates of interest. Corporate debt securities are fixed income securities issued by businesses to finance their operations, although corporate debt instruments may also include bank loans to companies. Notes, bonds, debentures and commercial paper are the most common types of corporate debt securities, with the primary difference being their maturities and secured or unsecured status. Commercial paper has the shortest term and is usually unsecured.
The Fund may invest in inverse floating rate securities issued by a TOB trust, the interest rate on which varies inversely with the Securities Industry Financial Markets Association short-term rate, which resets weekly, or a similar short-term rate, and is reduced by the expenses related to the TOB trust. Typically, inverse floating rate securities represent beneficial interests in a special purpose trust (sometimes called a TOB trust) formed by a third party sponsor for the purpose of holding municipal bonds. Inverse floating rate securities may increase or decrease in value at a greater rate than the underlying interest rate on the municipal bond held by the TOB trust, which effectively leverages the Fund’s investment.
The Fund may invest in floating rate securities issued by special purpose trusts. Floating rate securities may take the form of short-term floating rate securities or the option period may be substantially longer. Generally, the interest rate earned will be based upon the market rates for municipal securities with maturities or remarketing provisions that are comparable in duration to the periodic interval of the tender option, which may vary from weekly, to monthly, to extended periods of one year or multiple years. Since the option feature has a shorter term than the final maturity or first call date of the underlying bond deposited in the trust, the Fund as the holder of the floating rate security relies upon the terms of the agreement with the financial institution furnishing the option as well as the credit strength of that institution. As further assurance of liquidity, the terms of the trust provide for a liquidation of the municipal security deposited in the trust and the application of the proceeds to pay off the floating rate security. The trusts that are organized to issue both short-term floating rate securities and inverse floaters generally include liquidation triggers to protect the investor in the floating rate security.
The Fund may invest in zero coupon bonds. A zero coupon bond is a bond that typically does not pay interest for the entire life of the obligation or for an initial period after the issuance of the obligation.
The Fund may buy and sell securities on a when-issued or delayed delivery basis, making payment or taking delivery at a later date, normally within 15 to 45 days of the trade date.
The Fund may invest in illiquid securities (i.e., securities that are not readily marketable), including, but not limited to, restricted securities (securities the disposition of which is restricted under the federal securities laws), securities that may be resold only pursuant to Rule 144A under the 1933 Act, and repurchase agreements with maturities in excess of seven days.
250
The Fund may invest without limitation in credit default swaps, and may enter into credit default swaps as either a buyer or a seller. The credit default swaps in which the Fund may invest (or sell) include those in which the underlying reference instrument is the debt obligation of a single reference issuer (“single-name CDS”). Unlike other types of credit default swaps, single-name CDS do not have the benefit of diversification across many issuers.
In addition to credit default swaps, the Fund may enter into certain derivative instruments in pursuit of its investment objective, including to seek to enhance return, to hedge certain risks of its investments in municipal securities, to attempt to manage the effective maturity or duration of securities in the Fund’s portfolio or as a substitute for a position in the underlying asset. Such instruments include financial futures contracts, swap contracts (including interest rate swaps, credit default swaps and MMD Rate Locks), options on financial futures, options on swap contracts or other derivative instruments.
The Fund may purchase and sell MMD Rate Locks. An MMD Rate Lock permits the Fund to lock in a specified municipal interest rate for a portion of its portfolio to preserve a return on a particular investment or a portion of its portfolio as a duration management technique or to protect against any increase in the price of securities to be purchased at a later date. By using an MMD Rate Lock, the Fund can create a synthetic long or short position, allowing the Fund to select what the manager believes is an attractive part of the yield curve. The Fund will ordinarily use these transactions as a hedge or for duration or risk management although it is permitted to enter into them to enhance income or gain or to increase the Fund’s yield, for example, during periods of steep interest rate yield curves (i.e., wide differences between short term and long term interest rates).
The Fund may also invest in securities of other open- or closed-end investment companies (including ETFs) that invest primarily in municipal securities of the types in which the Fund may invest directly, to the extent permitted by the 1940 Act, the rules and regulations issued thereunder and applicable exemptive orders issued by the SEC.
Use of Leverage
The Fund uses leverage to pursue its investment objective. The Fund may use leverage to the extent permitted by the 1940 Act. The Fund may source leverage through a number of methods including through borrowings, issuing Preferred Shares, the issuance of debt securities, entering into reverse repurchase agreements (effectively a borrowing), and investments in inverse floating rate securities. In addition, the Fund may also use certain derivatives that have the economic effect of leverage by creating additional investment exposure. The amount and sources of leverage will vary depending on market conditions.
Temporary Defensive Periods
During temporary defensive periods or in order to help keep the Fund’s assets fully invested, including during the period within which the net proceeds of an offering of Securities are first being invested, the Fund may deviate from its investment policies and objectives. During such periods, the Fund may invest any percentage of its Managed Assets in short-term investments, including high quality, short-term debt securities that may be either tax-exempt or taxable. The Fund may not achieve its investment objectives during such periods.
251
Shareholder Update (Unaudited) (continued)
PRINCIPAL RISKS OF THE FUNDS
The factors that are most likely to have a material effect on a particular Fund’s portfolio as a whole are called “principal risks.” Each Fund is subject to the principal risks indicated below, whether through direct investment or derivative positions. Each Fund may be subject to additional risks other than those identified and described below because the types of investments made by a Fund can change over time.
| | | | | | | | | | |
| Risk | | Nuveen AMT-Free Municipal Credit Income Fund
(NVG) | | Nuveen Municipal Credit Income Fund (NZF) | | Nuveen Municipal High Income Opportunity Fund (NMZ) | | Nuveen Municipal Credit Opportunities Fund (NMCO) | | Nuveen Dynamic Municipal Opportunities Fund (NDMO) |
| | | | | |
| Portfolio Level Risks | | | | | | | | | | |
| | | | | |
| Alternative Minimum Tax Risk | | - | | X | | X | | X | | X |
| | | | | |
| Below Investment Grade Risk | | X | | X | | X | | X | | X |
| | | | | |
| Call Risk | | X | | X | | X | | X | | X |
| | | | | |
| Credit Risk | | X | | X | | X | | X | | X |
| | | | | |
| Credit Spread Risk | | X | | X | | X | | X | | X |
| | | | | |
| Debt Securities Risk | | - | | - | | - | | - | | X |
| | | | | |
| Distressed or Defaulted Securities Risk | | X | | X | | X | | X | | X |
| | | | | |
| Deflation Risk | | X | | X | | X | | X | | X |
| | | | | |
| Derivatives Risk | | X | | X | | X | | X | | X |
| | | | | |
| Duration Risk | | X | | X | | X | | X | | X |
| | | | | |
| Economic Sector Risk | | X | | X | | X | | X | | X |
| | | | | |
| Financial Futures and Options Risk | | X | | X | | X | | X | | X |
| | | | | |
| Hedging Risk | | X | | X | | X | | X | | X |
| | | | | |
| Illiquid Investments Risk | | X | | X | | X | | X | | X |
| | | | | |
| Income Risk | | X | | X | | X | | X | | X |
| | | | | |
| Inflation Risk | | X | | X | | X | | X | | X |
| | | | | |
| Insurance Risk | | X | | X | | X | | X | | X |
| | | | | |
| Interest Rate Risk | | X | | X | | X | | X | | X |
| | | | | |
| Inverse Floating Rate Securities Risk | | X | | X | | X | | X | | X |
| | | | | |
| Municipal Securities Market Liquidity Risk | | X | | X | | X | | X | | X |
| | | | | |
| Municipal Securities Market Risk | | X | | X | | X | | X | | X |
| | | | | |
| Other Investment Companies Risk | | X | | X | | X | | X | | X |
| | | | | |
| Puerto Rico Municipal Securities Market Risk | | X | | X | | X | | X | | X |
| | | | | |
| Reinvestment Risk | | X | | X | | X | | X | | X |
| | | | | |
| Special Risks Related to Certain Municipal Obligations | | X | | X | | X | | X | | X |
| | | | | |
| Swap Transactions Risk | | X | | X | | X | | X | | X |
| | | | | |
| Tax Risk | | X | | X | | X | | X | | X |
| | | | | |
| Taxability Risk | | X | | X | | X | | X | | X |
| | | | | |
| Tobacco Settlement Bond Risk | | X | | X | | X | | X | | X |
| | | | | |
| Unrated Securities Risk | | X | | X | | X | | X | | X |
| | | | | |
| Valuation Risk | | X | | X | | X | | X | | X |
| | | | | |
Zero Coupon Bonds Risk | | X | | X | | X | | X | | X |
252
| | | | | | | | | | |
| Risk | | Nuveen AMT-Free
Municipal Credit
Income Fund
(NVG) | | Nuveen Municipal Credit Income Fund (NZF) | | Nuveen Municipal High Income Opportunity Fund (NMZ) | | Nuveen Municipal Credit Opportunities Fund (NMCO) | | Nuveen Dynamic Municipal Opportunities Fund (NDMO) |
| | | | | |
| Fund Level and Other Risks | | | | | | | | | | |
| | | | | |
| Anti-Takeover Provisions | | X | | X | | X | | X | | X |
| | | | | |
| Borrowing Risk | | - | | - | | - | | - | | X |
| | | | | |
| Counterparty Risk | | X | | X | | X | | X | | X |
| | | | | |
| Cybersecurity Risk | | X | | X | | X | | X | | X |
| | | | | |
| Economic and Political Events Risk | | X | | X | | X | | X | | X |
| | | | | |
| Fund Tax Risk | | X | | X | | X | | X | | X |
| | | | | |
| Global Economic Risk | | X | | X | | X | | X | | X |
| | | | | |
| Investment and Market Risk | | X | | X | | X | | X | | X |
| | | | | |
| Legislation and Regulatory Risk | | X | | X | | X | | X | | X |
| | | | | |
| Leverage Risk | | X | | X | | X | | X | | X |
| | | | | |
| Limited Term and Tender Offer Risks | | - | | - | | - | | X | | X |
| | | | | |
| Market Discount from Net Asset Value | | X | | X | | X | | X | | X |
| | | | | |
| Recent Market Conditions | | X | | X | | X | | X | | X |
| | | | | |
| Reverse Repurchase Agreement Risk | | X | | X | | X | | X | | X |
253
Shareholder Update (Unaudited) (continued)
Portfolio Level Risks:
Alternative Minimum Tax Risk. The Fund may invest in AMT Bonds. Therefore, a portion of the Fund’s otherwise exempt-interest dividends may be taxable to those shareholders subject to the federal alternative minimum tax.
Below Investment Grade Risk. Investments of below investment grade quality are regarded as having speculative characteristics with respect to the issuer’s capacity to pay dividends or interest and repay principal, and may be subject to higher price volatility and default risk than investment grade investments of comparable terms and duration. Issuers of lower grade investments may be highly leveraged and may not have available to them more traditional methods of financing. The prices of these lower grade investments are typically more sensitive to negative developments, such as a decline in the issuer’s revenues or a general economic downturn. The secondary market for lower rated investments may not be as liquid as the secondary market for more highly rated investments, a factor which may have an adverse effect on the Fund’s ability to dispose of a particular investment. If a below investment grade security goes into default, or its issuer enters bankruptcy, it might be difficult to sell that security in a timely manner at a reasonable price.
Call Risk. The Fund may invest in municipal securities that are subject to call risk. Such municipal securities may be redeemed at the option of the issuer, or “called,” before their stated maturity or redemption date. In general, an issuer will call its instruments if they can be refinanced by issuing new instruments that bear a lower interest rate. The Fund is subject to the possibility that during periods of falling interest rates, an issuer will call its high yielding municipal securities. The Fund would then be forced to invest the unanticipated proceeds at lower interest rates, resulting in a decline in the Fund’s income.
Credit Risk. Issuers of municipal securities in which the Fund may invest may default on their obligations to pay principal or interest when due. This non-payment would result in a reduction of income to the Fund, a reduction in the value of a municipal security experiencing non-payment and potentially a decrease in the net asset value (“NAV”) of the Fund. To the extent that the credit rating assigned to a municipal security in the Fund’s portfolio is downgraded, the market price and liquidity of such security may be adversely affected.
Credit Spread Risk. Credit spread risk is the risk that credit spreads (i.e., the difference in yield between securities that is due to differences in their credit quality) may increase when the market believes that municipal securities generally have a greater risk of default. Increasing credit spreads may reduce the market values of the Fund’s securities. Credit spreads often increase more for lower rated and unrated securities than for investment grade securities. In addition, when credit spreads increase, reductions in market value will generally be greater for longer-maturity securities.
Debt Securities Risk. Issuers of debt instruments in which the Fund may invest may default on their obligations to pay principal or interest when due. This non-payment would result in a reduction of income to the Fund, a reduction in the value of a debt instrument experiencing non-payment and, potentially, a decrease in the NAV of the Fund. There can be no assurance that liquidation of collateral would satisfy the issuer’s obligation in the event of non-payment of scheduled interest or principal or that such collateral could be readily liquidated. In the event of bankruptcy of an issuer, the Fund could experience delays or limitations with respect to its ability to realize the benefits of any collateral securing a security. To the extent that the credit rating assigned to a security in the Fund’s portfolio is downgraded, the market price and liquidity of such security may be adversely affected.
Distressed or Defaulted Securities Risk. Investments in “distressed” securities, meaning those whose issuers are experiencing financial difficulties or distress at the time of acquisition, present a substantial risk of future default. In the event distressed securities become defaulted securities or the Fund otherwise holds defaulted securities, the Fund may incur losses, including additional expenses, to the extent it is required to seek recovery upon a default in the payment of principal or interest on those securities. In any reorganization or liquidation proceeding relating to a portfolio security, the Fund may lose its entire investment or may be required to accept cash or securities with a value less than its original investment. Defaulted or distressed securities may be subject to restrictions on resale.
Deflation Risk. Deflation risk is the risk that prices throughout the economy decline over time. Deflation may have an adverse effect on the creditworthiness of issuers and may make issuer default more likely, which may result in a decline in the value of the Fund’s portfolio.
Derivatives Risk. The use of derivatives involves additional risks and transaction costs which could leave the Fund in a worse position than if it had not used these instruments. Derivative instruments can be used to acquire or to transfer the risk and returns of a municipal security or other asset without buying or selling the municipal security or asset. These instruments may entail investment exposures that are greater than their cost would suggest. As a result, a small investment in derivatives can result in losses that greatly exceed the original investment. Derivatives can be highly volatile, illiquid and difficult to value. An over-the-counter derivative transaction between the Fund and a counterparty that is not cleared through a central counterparty also involves the risk that a loss may be sustained as a result of the failure of the counterparty to the contract to make required payments. The payment obligation for a cleared derivative transaction is guaranteed by a central counterparty, which exposes the Fund to the creditworthiness of the central counterparty. The use of certain derivatives involves leverage, which can cause the Fund’s portfolio to be more volatile than if the portfolio had not been leveraged. Leverage can significantly magnify the effect of price movements of the reference asset, disproportionately increasing the Fund’s losses and reducing the Fund’s opportunities for gains when the reference asset changes in unexpected ways. In some instances, such leverage could result in losses that exceed the original amount invested.
It is possible that regulatory or other developments in the derivatives market, including changes in government regulation, could adversely impact the Fund’s ability successfully use derivative instruments.
Duration Risk. Duration is the sensitivity, expressed in years, of the price of a fixed-income security to changes in the general level of interest rates (or yields). Securities with longer durations tend to be more sensitive to interest rate (or yield) changes, which typically corresponds to increased volatility and risk, than securities with shorter durations. For example, if a security or portfolio has a duration of three years and interest rates increase
254
by 1%, then the security or portfolio would decline in value by approximately 3%. Duration differs from maturity in that it considers potential changes to interest rates, and a security’s coupon payments, yield, price and par value and call features, in addition to the amount of time until the security matures. The duration of a security will be expected to change over time with changes in market factors and time to maturity.
Economic Sector Risk. The Fund may invest a significant amount of its total assets in municipal securities in the same economic sector. This may make the Fund more susceptible to adverse economic, political or regulatory occurrences affecting an economic sector making the Fund more vulnerable to unfavorable developments in that sector than funds that invest more broadly. As the percentage of the Fund’s Managed Assets invested in a particular sector increases, so does the potential for fluctuation in the value of the Fund’s assets. In addition, the Fund may invest a significant portion of its assets in certain sectors of the municipal securities market, such as health care facilities, private educational facilities, special taxing districts and start-up utility districts, and private activity bonds including industrial development bonds on behalf of transportation companies, whose credit quality and performance may be more susceptible to economic, business, political, regulatory and other developments than other sectors of municipal issuers. If the Fund invests a significant portion of its assets in one or more particular sectors, the Fund’s performance may be subject to additional risk and variability.
Financial Futures and Options Transactions Risk. The Fund may use certain transactions for hedging the portfolio’s exposure to credit risk and the risk of increases in interest rates, which could result in poorer overall performance for the Fund. There may be an imperfect correlation between price movements of the futures and options and price movements of the portfolio securities being hedged.
If the Fund engages in futures transactions or in the writing of options on futures, it will be required to maintain initial margin and maintenance margin and may be required to make daily variation margin payments in accordance with applicable rules of the exchanges and the Commodity Futures Trading Commission (“CFTC”). If the Fund purchases a financial futures contract or a call option or writes a put option in order to hedge the anticipated purchase of municipal securities, and if the Fund fails to complete the anticipated purchase transaction, the Fund may have a loss or a gain on the futures or options transaction that will not be offset by price movements in the municipal securities that were the subject of the anticipatory hedge. There can be no assurance that a liquid market will exist at a time when the Fund seeks to close out a derivatives or futures or a futures option position, and the Fund would remain obligated to meet margin requirements until the position is closed.
Hedging Risk. The Fund’s use of derivatives or other transactions to reduce risk involves costs and will be subject to the investment adviser’s and/or the sub-adviser’s ability to predict correctly changes in the relationships of such hedge instruments to the Fund’s portfolio holdings or other factors. No assurance can be given that the investment adviser’s and/or the sub-adviser’s judgment in this respect will be correct, and no assurance can be given that the Fund will enter into hedging or other transactions at times or under circumstances in which it may be advisable to do so. Hedging activities may reduce the Fund’s opportunities for gain by offsetting the positive effects of favorable price movements and may result in net losses.
Illiquid Investments Risk. Illiquid investments are investments that are not readily marketable. These investments may include restricted investments, including Rule 144A securities, which cannot be resold to the public without an effective registration statement under the 1933 Act, or, if they are unregistered may be sold only in a privately negotiated transaction or pursuant to an available exemption from registration. The Fund may not be able to readily dispose of such investments at prices that approximate those at which the Fund could sell such investments if they were more widely traded and, as a result of such illiquidity, the Fund may have to sell other investments or engage in borrowing transactions if necessary to raise cash to meet its obligations. Limited liquidity can also affect the market price of investments, thereby adversely affecting the Fund’s NAV and ability to make dividend distributions. The financial markets in general have in recent years experienced periods of extreme secondary market supply and demand imbalance, resulting in a loss of liquidity during which market prices were suddenly and substantially below traditional measures of intrinsic value. During such periods, some investments could be sold only at arbitrary prices and with substantial losses. Periods of such market dislocation may occur again at any time.
Income Risk. The Fund’s income could decline due to falling market interest rates. This is because, in a falling interest rate environment, the Fund generally will have to invest the proceeds from maturing portfolio securities in lower-yielding securities.
Inflation Risk. Inflation risk is the risk that the value of assets or income from investments will be worth less in the future as inflation decreases the value of money. As inflation increases, the real value of the common shares and distributions can decline. Currently, inflation rates are elevated relative to normal market conditions and could increase.
Insurance Risk. The Fund may purchase municipal securities that are secured by insurance, bank credit agreements or escrow accounts. The credit quality of the companies that provide such credit enhancements will affect the value of those securities. Certain significant providers of insurance for municipal securities have incurred significant losses as a result of exposure to sub-prime mortgages and other lower credit quality investments. As a result, such losses reduced the insurers’ capital and called into question their continued ability to perform their obligations under such insurance if they are called upon to do so in the future. While an insured municipal security will typically be deemed to have the rating of its insurer, if the insurer of a municipal security suffers a downgrade in its credit rating or the market discounts the value of the insurance provided by the insurer, the value of the municipal security would more closely, if not entirely, reflect such rating. In such a case, the value of insurance associated with a municipal security may not add any value. The insurance feature of a municipal security does not guarantee the full payment of principal and interest through the life of an insured obligation, the market value of the insured obligation or the NAV of the common shares represented by such insured obligation.
Interest Rate Risk. Interest rate risk is the risk that municipal securities in the Fund’s portfolio will decline in value because of changes in market interest rates. Generally, when market interest rates rise, the market value of such securities will fall, and vice versa. As interest rates decline, issuers of municipal securities may prepay principal earlier than scheduled, forcing the Fund to reinvest in lower-yielding securities and potentially reducing the Fund’s income. As interest rates increase, slower than expected principal payments may extend the average life of municipal securities, potentially locking in a below-market interest rate and reducing the Fund’s value. In typical market interest rate environments, the prices of longer-term municipal securities generally fluctuate more than prices of shorter-term municipal securities as interest rates change.
255
Shareholder Update (Unaudited) (continued)
Inverse Floating Rate Securities Risk. The Fund may invest in inverse floating rate securities. In general, income on inverse floating rate securities will decrease when short-term interest rates increase and increase when short-term interest rates decrease. Investments in inverse floating rate securities may subject the Fund to the risks of reduced or eliminated interest payments and losses of principal. In addition, inverse floating rate securities may increase or decrease in value at a greater rate than the underlying interest rate, which effectively leverages the Fund’s investment. As a result, the market value of such securities generally will be more volatile than that of fixed rate securities.
The Fund may invest in inverse floating rate securities issued by special purpose trusts that have recourse to the Fund. In such instances, the Fund may be at risk of loss that exceeds its investment in the inverse floating rate securities.
The Fund may be required to sell its inverse floating rate securities at less than favorable prices, or liquidate other Fund portfolio holdings in certain circumstances, including, but not limited to, the following:
| | · | | If the Fund has a need for cash and the securities in a special purpose trust are not actively trading due to adverse market conditions; |
| | · | | If special purpose trust sponsors (as a collective group or individually) experience financial hardship and consequently seek to terminate their respective outstanding special purpose trusts; and |
| | · | | If the value of an underlying security declines significantly and if additional collateral has not been posted by the Fund. |
Municipal Securities Market Liquidity Risk. Inventories of municipal securities held by brokers and dealers have decreased in recent years, lessening their ability to make a market in these securities. This reduction in market making capacity has the potential to decrease the Fund’s ability to buy or sell municipal securities at attractive prices, and increase municipal security price volatility and trading costs, particularly during periods of economic or market stress. In addition, recent federal banking regulations may cause certain dealers to reduce their inventories of municipal securities, which may further decrease the Fund’s ability to buy or sell municipal securities. As a result, the Fund may be forced to accept a lower price to sell a security, to sell other securities to raise cash, or to give up an investment opportunity, any of which could have a negative effect on performance. If the Fund needed to sell large blocks of municipal securities to raise cash to meet its obligations, those sales could further reduce the municipal securities’ prices and hurt performance.
Municipal Securities Market Risk. The amount of public information available about the municipal securities in the Fund’s portfolio is generally less than that for corporate equities or bonds, and the investment performance of the Fund may therefore be more dependent on the analytical abilities of the sub-adviser than if the Fund were a stock fund or taxable bond fund. The secondary market for municipal securities, particularly below investment grade municipal securities, also tends to be less well-developed or liquid than many other securities markets, which may adversely affect the Fund’s ability to sell its municipal securities at attractive prices.
Other Investment Companies Risk. The Fund may invest in the securities of other investment companies, including ETFs. Investing in an investment company exposes the Fund to all of the risks of that investment company’s investments. The Fund, as a holder of the securities of other investment companies, will bear its pro rata portion of the other investment companies’ expenses, including advisory fees. These expenses are in addition to the direct expenses of the Fund’s own operations. As a result, the cost of investing in investment company shares may exceed the costs of investing directly in its underlying investments. In addition, securities of other investment companies may be leveraged. As a result, the Fund may be indirectly exposed to leverage through an investment in such securities and therefore magnify the Fund’s leverage risk.
With respect to ETF’s, an ETF that is based on a specific index may not be able to replicate and maintain exactly the composition and relative weighting of securities in the index. The value of an ETF based on a specific index is subject to change as the values of its respective component assets fluctuate according to market volatility. ETFs typically rely on a limited pool of authorized participants to create and redeem shares, and an active trading market for ETF shares may not develop or be maintained. The market value of shares of ETFs and closed-end funds may differ from their NAV.
Puerto Rico Municipal Securities Market Risk. To the extent that the Fund invests a significant portion of its assets in the securities issued by the Commonwealth of Puerto Rico or its political subdivisions, agencies, instrumentalities, or public corporations (collectively referred to as “Puerto Rico” or the “Commonwealth”), it will be disproportionally affected by political, social and economic conditions and developments in the Commonwealth. In addition, economic, political or regulatory changes in that territory could adversely affect the value of the Fund’s investment portfolio.
Puerto Rico currently is experiencing significant fiscal and economic challenges, including substantial debt service obligations, high levels of unemployment, underfunded public retirement systems, and persistent government budget deficits. These challenges may negatively affect the value of the Fund’s investments in Puerto Rican municipal securities. Several major ratings agencies have downgraded the general obligation debt of Puerto Rico to below investment grade and continue to maintain a negative outlook for this debt, which increases the likelihood that the rating will be lowered further. Puerto Rico recently defaulted on its debt by failing to make full payment due on its outstanding bonds, and there can be no assurance that Puerto Rico will be able to satisfy its future debt obligations. Further downgrades or defaults may place additional strain on the Puerto Rico economy and may negatively affect the value, liquidity, and volatility of the Fund’s investments in Puerto Rican municipal securities. Additionally, numerous issuers have entered Title III of the Puerto Rico Oversite, Management and Economic Stability Act (“PROMESA”), which is similar to bankruptcy protection, through which the Commonwealth of Puerto Rico can restructure its debt. However, Puerto Rico’s case is the first ever heard under PROMESA and there is no existing case precedent to guide the proceedings. Accordingly, Puerto Rico’s debt restructuring process could take significantly longer than traditional municipal bankruptcy proceedings. Further, it is not clear whether a debt restructuring process will ultimately be approved or, if so, the extent to which it will apply to Puerto Rico municipal securities sold by an issuer other than the territory. A debt restructuring could reduce the principal amount due, the interest rate, the maturity, and other terms of Puerto Rico municipal securities, which could adversely affect the value of Puerto Rican municipal securities. Legislation that would allow Puerto Rico to restructure its municipal debt obligations, thus increasing the risk that Puerto Rico may never pay off municipal indebtedness, or may pay only a small fraction of the amount owed, could also impact the value of the Fund’s investments in Puerto Rican municipal securities.
256
These challenges and uncertainties have been exacerbated by multiple hurricanes and the resulting natural disasters that have stuck Puerto Rico since 2017. The full extent of the natural disasters’ impact on Puerto Rico’s economy and foreign investment in Puerto Rico is difficult to estimate.
Reinvestment Risk. Reinvestment risk is the risk that income from the Fund’s portfolio will decline if and when the Fund invests the proceeds from matured, traded or called municipal securities at market interest rates that are below the portfolio’s current earnings rate. A decline in income could affect the common shares’ market price, NAV and/or a common shareholder’s overall returns.
Special Risks Related to Certain Municipal Obligations. Municipal leases and certificates of participation involve special risks not normally associated with general obligations or revenue bonds. Leases and installment purchase or conditional sale contracts (which normally provide for title to the leased asset to pass eventually to the governmental issuer) have evolved as a means for governmental issuers to acquire property and equipment without meeting the constitutional and statutory requirements for the issuance of debt. The debt issuance limitations are deemed to be inapplicable because of the inclusion in many leases or contracts of “non-appropriation” clauses that relieve the governmental issuer of any obligation to make future payments under the lease or contract unless money is appropriated for such purpose by the appropriate legislative body. In addition, such leases or contracts may be subject to the temporary abatement of payments in the event that the governmental issuer is prevented from maintaining occupancy of the leased premises or utilizing the leased equipment. Although the obligations may be secured by the leased equipment or facilities, the disposition of the property in the event of non-appropriation or foreclosure might prove difficult, time consuming and costly, and may result in a delay in recovering or the failure to fully recover the Fund’s original investment. In the event of non-appropriation, the issuer would be in default and taking ownership of the assets may be a remedy available to the Fund, although the Fund does not anticipate that such a remedy would normally be pursued.
Certificates of participation involve the same risks as the underlying municipal leases. In addition, the Fund may be dependent upon the municipal authority issuing the certificates of participation to exercise remedies with respect to the underlying securities. Certificates of participation also entail a risk of default or bankruptcy, both of the issuer of the municipal lease and also the municipal agency issuing the certificate of participation.
Swap Transactions Risk. The Fund may enter into debt-related derivative instruments such as credit default swap contracts and interest rate swaps. Like most derivative instruments, the use of swaps is a highly specialized activity that involves investment techniques and risks different from those associated with ordinary portfolio securities transactions. In addition, the use of swaps requires an understanding by the adviser and/or the sub-adviser of not only the referenced asset, rate or index, but also of the swap itself. If the investment adviser and/or the sub-adviser is incorrect in its forecasts of default risks, market spreads or other applicable factors or events, the investment performance of the Fund would diminish compared with what it would have been if these techniques were not used.
Tax Risk. The value of the Fund’s investments and its NAV may be adversely affected by changes in tax rates, rules and policies. Because interest income from municipal securities is normally not subject to regular federal income taxation, the attractiveness of municipal securities in relation to other investment alternatives is affected by changes in federal income tax rates or changes in the tax exempt status of interest income from municipal securities. Additionally, the Fund is not a suitable investment for individual retirement accounts, for other tax exempt or tax-deferred accounts, for investors who are not sensitive to the federal income tax consequences of their investments.
Taxability Risk. The Fund will invest in municipal securities in reliance at the time of purchase on an opinion of bond counsel to the issuer that the interest paid on those securities will be excludable from gross income for regular federal income tax purposes, and the sub-adviser will not independently verify that opinion. Subsequent to the Fund’s acquisition of such a municipal security, however, the security may be determined to pay, or to have paid, taxable income. As a result, the treatment of dividends previously paid or to be paid by the Fund as “exempt-interest dividends” could be adversely affected, subjecting the Fund’s shareholders to increased federal income tax liabilities. Certain other investments made by the Fund, including derivatives transactions, may result in the receipt of taxable income or gains by the Fund.
Tobacco Settlement Bond Risk. The Fund may invest in tobacco settlement bonds. Tobacco settlement bonds are municipal securities that are backed solely by expected revenues to be derived from lawsuits involving tobacco related deaths and illnesses which were settled between certain states and American tobacco companies. Tobacco settlement bonds are secured by an issuing state’s proportionate share in the Master Settlement Agreement, an agreement between 46 states and nearly all of the U.S. tobacco manufacturers (the “MSA”). Under the terms of the MSA, the actual amount of future settlement payments by tobacco-manufacturers is dependent on many factors, including, among other things, reduced cigarette consumption. Payments made by tobacco manufacturers could be negatively impacted if the decrease in tobacco consumption is significantly greater than the forecasted decline.
Unrated Securities Risk. The Fund may purchase securities that are not rated by any rating organization. Unrated securities determined by the Fund’s investment adviser to be of comparable quality to rated investments which the Fund may purchase may pay a higher dividend or interest rate than such rated investments and be subject to a greater risk of illiquidity or price changes. Less public information is typically available about unrated investments or issuers than rated investments or issuers. Some unrated securities may not have an active trading market or may be difficult to value, which means the Fund might have difficulty selling them promptly at an acceptable price. To the extent that the Fund invests in unrated securities, the Fund’s ability to achieve its investment objectives will be more dependent on the investment adviser’s credit analysis than would be the case when the Fund invests in rated securities.
Valuation Risk. The municipal securities in which the Fund invests typically are valued by a pricing service utilizing a range of market-based inputs and assumptions, including readily available market quotations obtained from broker-dealers making markets in such instruments, cash flows and transactions for comparable instruments. There is no assurance that the Fund will be able to sell a portfolio security at the price established by the pricing service, which could result in a loss to the Fund. Pricing services generally price municipal securities assuming orderly transactions of an institutional “round lot” size, but some trades may occur in smaller, “odd lot” sizes, often at lower prices than institutional round lot trades. Different pricing services may incorporate different assumptions and inputs into their valuation methodologies, potentially resulting in different values for the same securities. As a result, if the Fund were to change pricing services, or if the Fund’s pricing service were to change its valuation methodology, there could be a material impact, either positive or negative, on the Fund’s NAV.
257
Shareholder Update (Unaudited) (continued)
Zero Coupon Bonds Risk. Because interest on zero coupon bonds is not paid on a current basis, the values of zero coupon bonds will be more volatile in response to interest rate changes than the values of bonds that distribute income regularly. Although zero coupon bonds generate income for accounting purposes, they do not produce cash flow, and thus the Fund could be forced to liquidate securities at an inopportune time in order to generate cash to distribute to shareholders as required by tax laws.
Fund Level and Other Risks:
Anti-Takeover Provisions. The Fund’s organizational documents include provisions that could limit the ability of other entities or persons to acquire control of the Fund or convert the Fund to open-end status, which include those commonly known as “Control Share Acquisition” provisions. Although the application of the “Control Share Acquisition” provisions has currently been suspended, these provisions could have the effect of depriving the common shareholders of opportunities to sell their common shares at a premium over the then-current market price of the common shares.
Borrowing Risk. In addition to borrowing for leverage, the Fund may borrow for temporary or emergency purposes, to pay dividends, repurchase its shares, or clear portfolio transactions. Borrowing may exaggerate changes in the NAV of the Fund’s shares and may affect the Fund’s net income. When the Fund borrows money, it must pay interest and other fees, which will reduce the Fund’s returns if such costs exceed the returns on the portfolio securities purchased or retained with such borrowings. Any such borrowings are intended to be temporary. However, under certain market circumstances, such borrowings might be outstanding for longer periods of time.
Counterparty Risk. Changes in the credit quality of the companies that serve as the Fund’s counterparties with respect to derivatives or other transactions supported by another party’s credit will affect the value of those instruments. Certain entities that have served as counterparties in the markets for these transactions have incurred or may incur in the future significant financial hardships including bankruptcy and losses as a result of exposure to sub-prime mortgages and other lower-quality credit investments. As a result, such hardships have reduced these entities’ capital and called into question their continued ability to perform their obligations under such transactions. By using such derivatives or other transactions, the Fund assumes the risk that its counterparties could experience similar financial hardships. In the event of the insolvency of a counterparty, the Fund may sustain losses or be unable to liquidate a derivatives position.
Cybersecurity Risk. The Fund and its service providers are susceptible to operational and information security risk resulting from cyber incidents. Cyber incidents refer to both intentional attacks and unintentional events including: processing errors, human errors, technical errors including computer glitches and system malfunctions, inadequate or failed internal or external processes, market-wide technical-related disruptions, unauthorized access to digital systems (through “hacking” or malicious software coding), computer viruses, and cyber-attacks which shut down, disable, slow or otherwise disrupt operations, business processes or website access or functionality (including denial of service attacks). Cyber incidents could adversely impact the Fund and cause the Fund to incur financial loss and expense, as well as face exposure to regulatory penalties, reputational damage, and additional compliance costs associated with corrective measures. In addition, substantial costs may be incurred in order to prevent any cyber incidents in the future. Furthermore, the Fund cannot control the cybersecurity plans and systems put in place by its service providers or any other third parties whose operations may affect the Fund.
Economic and Political Events Risk. The Fund may be more sensitive to adverse economic, business or political developments if it invests a substantial portion of its assets in the municipal securities of similar projects (such as those relating to the education, health care, housing, transportation, or utilities industries), industrial development bonds, or in particular types of municipal securities (such as general obligation bonds, private activity bonds or moral obligation bonds). Such developments may adversely affect a specific industry or local political and economic conditions, and thus may lead to declines in the creditworthiness and value of such municipal securities.
Fund Tax Risk. The Fund has elected to be treated and intends to qualify each year as a Regulated Investment Company (“RIC”) under the Internal Revenue Code of 1986, as amended (the “Code”). As a RIC, the Fund is not expected to be subject to U.S. federal income tax to the extent that it distributes its investment company taxable income and net capital gains. To qualify for the special tax treatment available to a RIC, the Fund must comply with certain investment, distribution, and diversification requirements. Under certain circumstances, the Fund may be forced to sell certain assets when it is not advantageous in order to meet these requirements, which may reduce the Fund’s overall return. If the Fund fails to meet any of these requirements, subject to the opportunity to cure such failures under applicable provisions of the Code, the Fund’s income would be subject to a double level of U.S. federal income tax. The Fund’s income, including its net capital gain, would first be subject to U.S. federal income tax at regular corporate rates, even if such income were distributed to shareholders and, second, all distributions by the Fund from earnings and profits, including distributions of net capital gain (if any), would be taxable to shareholders as dividends.
Global Economic Risk. National and regional economies and financial markets are becoming increasingly interconnected, which increases the possibilities that conditions in one country, region or market might adversely impact issuers in a different country, region or market. Changes in legal, political, regulatory, tax and economic conditions may cause fluctuations in markets and assets prices around the world, which could negatively impact the value of the Fund’s investments. Major economic or political disruptions, particularly in large economies like China’s, may have global negative economic and market repercussions. Additionally, instability in various countries, such as Afghanistan and Syria, war and natural and environmental disasters, and the spread of infectious illnesses or other public health emergencies, terrorist attacks in the United States and around the world, growing social and political discord in the United States, the European debt crisis, the response of the international community—through economic sanctions and otherwise—to international events, further downgrade of U.S. government securities, changes in the U.S. president or political shifts in Congress and other similar events may adversely affect the global economy and the markets and issuers in which the Fund invests. Recent examples of such events include Hamas’ attack on Israel in October 2023 and the ensuing conflict, the outbreak of a novel coronavirus known as COVID-19 that was first detected in China in December 2019 and heightened concerns regarding North Korea’s nuclear weapons and long-range ballistic missile programs. In addition, Russia’s invasion of Ukraine in February 2022 has resulted in sanctions imposed by several nations, such as the United States, United Kingdom, European Union and Canada. The current sanctions and potential further sanctions may negatively impact certain sectors of Russia’s economy, but also may negatively impact the value of the Fund’s investments that do not have direct exposure to Russia. These events could reduce consumer demand or economic output, result in market closure, travel restrictions or quarantines, and generally have a
258
significant impact on the global economy. These events could also impair the information technology and other operational systems upon which the Fund’s service providers, including the Fund’s sub-adviser, rely, and could otherwise disrupt the ability of employees of the Fund’s service providers to perform essential tasks on behalf of the Fund.
The Fund does not know and cannot predict how long the securities markets may be affected by these events, and the future impact of these and similar events on the global economy and securities markets is uncertain. The Fund may be adversely affected by abrogation of international agreements and national laws which have created the market instruments in which the Fund may invest, failure of the designated national and international authorities to enforce compliance with the same laws and agreements, failure of local, national and international organizations to carry out the duties prescribed to them under the relevant agreements, revisions of these laws and agreements which dilute their effectiveness or conflicting interpretation of provisions of the same laws and agreements.
Governmental and quasi-governmental authorities and regulators throughout the world have in the past responded to major economic disruptions with a variety of significant fiscal and monetary policy changes, including but not limited to, direct capital infusions into companies, new monetary programs and dramatically lower interest rates. An unexpected or quick reversal of these policies, or the ineffectiveness of these policies, could increase volatility in securities markets, which could adversely affect the Fund’s investments.
Investment and Market Risk. An investment in common shares is subject to investment risk, including the possible loss of the entire principal amount that you invest. Common shares frequently trade at a discount to their NAV. An investment in common shares represents an indirect investment in the securities owned by the Fund. Common shares at any point in time may be worth less than your original investment, even after taking into account the reinvestment of Fund dividends and distributions.
Legislation and Regulatory Risk. At any time after the date of this report, legislation or additional regulations may be enacted that could negatively affect the assets of the Fund, securities held by the Fund or the issuers of such securities. Fund shareholders may incur increased costs resulting from such legislation or additional regulation. There can be no assurance that future legislation, regulation or deregulation will not have a material adverse effect on the Fund or will not impair the ability of the Fund to achieve its investment objectives.
Leverage Risk. The use of leverage creates special risks for common shareholders, including potential interest rate risks and the likelihood of greater volatility of NAV and market price of, and distributions on, the common shares. The use of leverage in a declining market will likely cause a greater decline in the Fund’s NAV, which may result at a greater decline of the common share price, than if the Fund were not to have used leverage.
The Fund will pay (and common shareholders will bear) any costs and expenses relating to the Fund’s use of leverage, which will result in a reduction in the Fund’s NAV. The investment adviser may, based on its assessment of market conditions, composition of the Fund’s holdings, increase or decrease the amount of leverage. Such changes may impact the Fund’s distributions and the price of the common shares in the secondary market. There is no assurance that the Fund’s use of leverage will be successful.
The Fund may seek to refinance its leverage over time, in the ordinary course, as current forms of leverage mature or it is otherwise desirable to refinance; however, the form that such leverage will take cannot be predicted at this time. If the Fund is unable to replace existing leverage on comparable terms, its costs of leverage will increase. Accordingly, there is no assurance that the use of leverage may result in a higher yield or return to common shareholders.
The amount of fees paid to the investment adviser and the sub-advisor for investment advisory services will be higher if the Fund uses leverage because the fees will be calculated based on the Fund’s Managed Assets - this may create an incentive for the investment adviser and the sub-advisor to leverage the Fund or increase the Fund’s leverage.
Limited Term and Tender Offer Risks. Because the assets of the Fund will be liquidated in connection with its termination or to pay for Common Shares tendered in an Eligible Tender Offer, the Fund may be required to sell portfolio securities when it otherwise would not, including at times when market conditions are not favorable, or at a time when a particular security is in default or bankruptcy, or otherwise in severe distress, which may cause the Fund to lose money.
The Fund may be required to dispose of portfolio investments in connection with any reduction in its outstanding leverage necessary in order to maintain its desired leverage ratios following an Eligible Tender Offer. It is likely that during the pendency of an Eligible Tender Offer, and possibly for a time thereafter, the Fund will hold a greater than normal percentage of its total assets in money market mutual funds, cash, cash equivalents, securities issued or guaranteed by the U.S. government or its instrumentalities or agencies, high quality, short-term money market instruments, short-term debt securities, certificates of deposit, bankers’ acceptances and other bank obligations, commercial paper or other liquid debt securities, which may adversely affect the Fund’s investment performance. If the tax basis for the portfolio investments sold is less than the sale proceeds, the Fund will recognize capital gains, which it will be required to distribute to Common Shareholders. In addition, the Fund’s purchase of tendered Common Shares pursuant to an Eligible Tender Offer will have tax consequences for tendering Common Shareholders and may have tax consequences for non-tendering Common Shareholders. All Common Shareholders remaining after an Eligible Tender Offer will be subject to proportionately higher expenses due to the reduction in the Fund’s total assets resulting from payment for the tendered Common Shares. Such reduction in the Fund’s total assets also may result in less investment flexibility, reduced diversification and greater volatility for the Fund, and may have an adverse effect on the Fund’s investment performance.
If the Fund conducts an Eligible Tender Offer, there can be no assurance that the number of tendered Common Shares would not result in the Fund’s net assets totaling less than the Termination Threshold, in which case the Eligible Tender Offer will be terminated, no Common Shares will be repurchased pursuant to the Eligible Tender Offer and the Fund will terminate on the Termination Date. The investment adviser may have a conflict of interest in recommending to the Board of Trustees that the Fund have a continued existence without limitation of time. The Fund is not required to conduct additional tender offers following an Eligible Tender Offer and conversion to a continued existence without limitation of time. Therefore, remaining Common Shareholders may not have another opportunity to participate in a tender offer.
259
Shareholder Update (Unaudited) (continued)
A Fund portfolio holding default may significantly reduce net investment income and, therefore, Common Share dividends; and may prevent or inhibit the Fund from fully being able to liquidate its portfolio at or prior to the Termination Date.
Market Discount from Net Asset Value. Shares of closed-end investment companies like the Fund frequently trade at prices lower than their NAV. This characteristic is a risk separate and distinct from the risk that the Fund’s NAV could decrease as a result of investment activities. Whether investors will realize gains or losses upon the sale of the common shares will depend not upon the Fund’s NAV but entirely upon whether the market price of the common shares at the time of sale is above or below the investor’s purchase price for the common shares. Furthermore, management may have difficulty meeting the Fund’s investment objectives and managing its portfolio when the underlying securities are redeemed or sold during periods of market turmoil and as investors’ perceptions regarding closed-end funds or their underlying investments change. Because the market price of the common shares will be determined by factors such as relative supply of and demand for the common shares in the market, general market and economic circumstances, and other factors beyond the control of the Fund, the Fund cannot predict whether the common shares will trade at, below or above NAV. The common shares are designed primarily for long-term investors, and you should not view the Fund as a vehicle for short-term trading purposes.
Recent Market Conditions. Periods of unusually high financial market volatility and restrictive credit conditions, at times limited to a particular sector or geographic area, have occurred in the past and may be expected to recur in the future. Some countries, including the United States, have adopted or have signaled protectionist trade measures, relaxation of the financial industry regulations that followed the financial crisis, and/ or reductions to corporate taxes. The scope of these policy changes is still developing, but the equity and debt markets may react strongly to expectations of change, which could increase volatility, particularly if a resulting policy runs counter to the market’s expectations. The outcome of such changes cannot be foreseen at the present time. In addition, geopolitical and other risks, including environmental and public health risks, may add to instability in the world economy and markets generally. As a result of increasingly interconnected global economies and financial markets, the value and liquidity of the Fund’s investments may be negatively affected by events impacting a country or region, regardless of whether the Fund invests in issuers located in or with significant exposure to such country or region.
Ukraine has experienced ongoing military conflict, most recently in February 2022 when Russia invaded Ukraine; this conflict may expand and military attacks could occur elsewhere in Europe. Europe has also been struggling with mass migration from the Middle East and Africa. The ultimate effects of these events and other socio-political or geographical issues are not known but could profoundly affect global economies and markets. Additionally, in October 2023 armed conflict broke out between Israel and the militant group Hamas after Hamas infiltrated Israel’s southern border from the Gaza Strip. Israel has since declared war against Hamas and it’s possible that this conflict could escalate into a greater regional conflict. The ultimate effects of these events and other socio-political or geographical issues are not known but could profoundly affect global economies and markets.
The ongoing trade war between China and the United States, including the imposition of tariffs by each country on the other country’s products, has created a tense political environment. These actions may trigger a significant reduction in international trade, the oversupply of certain manufactured goods, substantial price reductions of goods and possible failure of individual companies and/or large segments of China’s export industry, which could have a negative impact on the Fund’s performance. U.S. companies that source material and goods from China and those that make large amounts of sales in China would be particularly vulnerable to an escalation of trade tensions. Uncertainty regarding the outcome of the trade tensions and the potential for a trade war could cause the U.S. dollar to decline against safe haven currencies, such as the Japanese yen and the euro. Events such as these and their consequences are difficult to predict and it is unclear whether further tariffs may be imposed or other escalating actions may be taken in the future.
Recently the U.S. Federal Reserve (the “Fed”) has sharply raised interest rates and has signaled an intention to continue to do so or maintain higher interest rates until current inflation levels re-align with the Fed’s long-term inflation target. Changing interest rate environments impact the various sectors of the economy in different ways. For example, in March 2023, the Federal Deposit Insurance Corporation (““FDIC””) was appointed receiver for each of Silicon Valley Bank and Signature Bank, the second- and third-largest bank failures in U.S. history, which failures may be attributable, in part, to rising interest rates. Bank failures may have a destabilizing impact on the broader banking industry or markets generally.
Reverse Repurchase Agreement Risk. A reverse repurchase agreement, in economic essence, constitutes a securitized borrowing by the Fund from the security purchaser. The Fund may enter into reverse repurchase agreements for the purpose of creating a leveraged investment exposure and, as such, their usage involves essentially the same risks associated with a leveraging strategy generally since the proceeds from these agreements may be invested in additional portfolio securities. Reverse repurchase agreements tend to be short-term in tenor, and there can be no assurances that the purchaser (lender) will commit to extend or “roll” a given agreement upon its agreed-upon repurchase date or an alternative purchaser can be identified on similar terms. Reverse repurchase agreements also involve the risk that the purchaser fails to return the securities as agreed upon, files for bankruptcy or becomes insolvent. The Fund may be restricted from taking normal portfolio actions during such time, could be subject to loss to the extent that the proceeds of the agreement are less than the value of securities subject to the agreement and may experience adverse tax consequences.
260
EFFECTS OF LEVERAGE
The following table is furnished in response to requirements of the SEC. It is designed to illustrate the effects of leverage through the use of senior securities, as that term is defined under Section 18 of the 1940 Act, as well as certain other forms of leverage, such as reverse repurchase agreements and investments in inverse floating rate securities, on common share total return, assuming investment portfolio total returns (consisting of income and changes in the value of investments held in a Fund’s portfolio) of -10%, -5%, 0%, 5% and 10%. The table below reflects each Fund’s (i) continued use of leverage as of October 31, 2023 as a percentage of Managed Assets (including assets attributable to such leverage), (ii) the estimated annual effective interest expense rate payable by the Funds on such instruments (based on actual leverage costs incurred during the fiscal year ended October 31, 2023) as set forth in the table, and (iii) the annual return that the Fund’s portfolio must experience (net of expenses) in order to cover such costs of leverage based on such estimated annual effective interest expense rate. The information below does not reflect any Fund’s use of certain derivative instruments.
The numbers are merely estimates, used for illustration. The costs of leverage may vary frequently and may be significantly higher or lower than the estimated rate. The assumed investment portfolio returns in the table below are hypothetical figures and are not necessarily indicative of the investment portfolio returns experienced or expected to be experienced by the Funds. Your actual returns may be greater or less than those appearing below.
| | | | | | | | | | |
| | | Nuveen AMT-Free Municipal Credit Income Fund (NVG) | | Nuveen Municipal Credit Income Fund (NZF) | | Nuveen Municipal High Income Opportunity Fund (NMZ) | | Nuveen Municipal Credit Opportunities Fund (NMCO) | | Nuveen Dynamic Municipal Opportunities Fund (NDMO) |
| | | | | |
Estimated Leverage as a Percentage of
Managed Assets (Including Assets
Attributable to Leverage) | | 43.94% | | 42.40% | | 42.51% | | 44.94% | | 29.20% |
| | | | | |
Estimated Annual Effective Leverage Expense
Rate Payable by Fund on Leverage | | 4.01% | | 4.13% | | 3.91% | | 4.19% | | 4.09% |
| | | | | |
Annual Return Fund Portfolio Must Experience
(net of expenses) to Cover Estimated
Annual Effective Interest Expense Rate on
Leverage | | 1.76% | | 1.75% | | 1.66% | | 1.88% | | 1.19% |
| | | | | |
Common Share Total Return for (10.00)%
Assumed Portfolio Total Return | | (20.98)% | | (20.40)% | | (20.29)% | | (21.58)% | | (15.81)% |
| | | | | |
Common Share Total Return for (5.00)%
Assumed Portfolio Total Return | | (12.06)% | | (11.72)% | | (11.59)% | | (12.50)% | | (8.75)% |
| | | | | |
Common Share Total Return for 0.00%
Assumed Portfolio Total Return | | (3.14)% | | (3.04)% | | (2.89)% | | (3.42)% | | (1.69)% |
| | | | | |
Common Share Total Return for 5.00%
Assumed Portfolio Total Return | | 5.77% | | 5.64% | | 5.80% | | 5.66% | | 5.38% |
| | | | | |
Common Share Total Return for 10.00%
Assumed Portfolio Total Return | | 14.69% | | 14.32% | | 14.50% | | 14.74% | | 12.44% |
Common Share total return is composed of two elements — the distributions paid by the Fund to holders of common shares (the amount of which is largely determined by the net investment income of the Fund after paying dividend payments on any preferred shares issued by the Fund and expenses on any forms of leverage outstanding) and gains or losses on the value of the securities and other instruments the Fund owns. As required by SEC rules, the table assumes that the Funds are more likely to suffer capital losses than to enjoy capital appreciation. For example, to assume a total return of 0%, the Fund must assume that the income it receives on its investments is entirely offset by losses in the value of those investments. This table reflects hypothetical performance of the Fund’s portfolio and not the actual performance of the Fund’s common shares, the value of which is determined by market forces and other factors. Should the Fund elect to add additional leverage to its portfolio, any benefits of such additional leverage cannot be fully achieved until the proceeds resulting from the use of such leverage have been received by the Fund and invested in accordance with the Fund’s investment objectives and policies. As noted above, the Fund’s willingness to use additional leverage, and the extent to which leverage is used at any time, will depend on many factors.
261
Shareholder Update (Unaudited) (continued)
DIVIDEND REINVESTMENT PLAN
Nuveen Closed-End Funds Automatic Reinvestment Plan
Your Nuveen Closed-End Fund allows you to conveniently reinvest distributions in additional Fund shares. By choosing to reinvest, you’ll be able to invest money regularly and automatically, and watch your investment grow through the power of compounding. Just like distributions in cash, there may be times when income or capital gains taxes may be payable on distributions that are reinvested. It is important to note that an automatic reinvestment plan does not ensure a profit, nor does it protect you against loss in a declining market.
Easy and convenient
To make recordkeeping easy and convenient, each month you’ll receive a statement showing your total distributions, the date of investment, the shares acquired and the price per share, and the total number of shares you own.
How shares are purchased
The shares you acquire by reinvesting will either be purchased on the open market or newly issued by the Fund. If the shares are trading at or above NAV at the time of valuation, the Fund will issue new shares at the greater of the NAV or 95% of the then-current market price. If the shares are trading at less than NAV, shares for your account will be purchased on the open market. If Computershare Trust Company, N.A. (the “Plan Agent”) begins purchasing Fund shares on the open market while shares are trading below NAV, but the Fund’s shares subsequently trade at or above their NAV before the Plan Agent is able to complete its purchases, the Plan Agent may cease open-market purchases and may invest the uninvested portion of the distribution in newly-issued Fund shares at a price equal to the greater of the shares’ NAV or 95% of the shares’ market value on the last business day immediately prior to the purchase date. Distributions received to purchase shares in the open market will normally be invested shortly after the distribution payment date. No interest will be paid on distributions awaiting reinvestment. Because the market price of the shares may increase before purchases are completed, the average purchase price per share may exceed the market price at the time of valuation, resulting in the acquisition of fewer shares than if the distribution had been paid in shares issued by the Fund. A pro rata portion of any applicable brokerage commissions on open market purchases will be paid by Dividend Reinvestment Plan (the “Plan”) participants. These commissions usually will be lower than those charged on individual transactions.
Flexible
You may change your distribution option or withdraw from the Plan at any time, should your needs or situation change. You can reinvest whether your shares are registered in your name, or in the name of a brokerage firm, bank, or other nominee. Ask your investment advisor if his or her firm will participate on your behalf. Participants whose shares are registered in the name of one firm may not be able to transfer the shares to another firm and continue to participate in the Plan. The Fund reserves the right to amend or terminate the Plan at any time. Although the Fund reserves the right to amend the Plan to include a service charge payable by the participants, there is no direct service charge to participants in the Plan at this time.
Call today to start reinvesting distributions
For more information on the Nuveen Automatic Reinvestment Plan or to enroll in or withdraw from the Plan, speak with your financial professional or call us at (800) 257-8787.
262
CHANGES OCCURRING DURING THE FISCAL YEAR
The following information in this annual report is a summary of certain changes during the most recent fiscal year. This information may not reflect all of the changes that have occurred since you purchased shares of a Fund.
During the most recent fiscal year, there have been no changes required to be reported in connection with: (i) the Funds’ investment objectives and principal investment policies that have not been approved by shareholders, (ii) the principal risks of the Fund, (iii) the portfolio managers of the Funds; (iv) a Fund’s charter or by-laws that would delay or prevent a change of control of the Fund that have not been approved by shareholders except as follows:
Developments Regarding the Funds’ Control Share By-Law
On October 5, 2020, the Nuveen AMT-Free Municipal Credit Income Fund, Nuveen Municipal Credit Income Fund, Nuveen Municipal High Income Opportunity Fund, Nuveen Municipal Credit Opportunities Fund and the Nuveen Dynamic Opportunities Fund (each a “Fund” and collectively the “Funds”) and certain other closed-end funds in the Nuveen fund complex amended their by-laws. Among other things, the amended by-laws included provisions pursuant to which, in summary, a shareholder who obtains beneficial ownership of common shares in a Control Share Acquisition (as defined in the by-laws) shall have the same voting rights as other common shareholders only to the extent authorized by the other disinterested shareholders (the “Control Share By-Law”). On January 14, 2021, a shareholder of certain Nuveen closed-end funds filed a civil complaint in the U.S. District Court for the Southern District of New York (the “District Court”) against certain Nuveen funds and their trustees, seeking a declaration that such funds’ Control Share By-Laws violate the 1940 Act, rescission of such fund’s Control Share By-Laws and a permanent injunction against such funds applying the Control Share By-Laws. On February 18, 2022, the District Court granted judgment in favor of the plaintiff’s claim for rescission of such funds’ Control Share By-Laws and the plaintiff’s declaratory judgment claim, and declared that such funds’ Control Share By-Laws violate Section 18(i) of the 1940 Act. Following review of the judgment of the District Court, on February 22, 2022, the Board amended the Funds’ bylaws to provide that the Funds’ Control Share By-Law shall be of no force and effect for so long as the judgment of the District Court is effective and that if the judgment of the District Court is reversed, overturned, vacated, stayed, or otherwise nullified, the Fund’s Control Share By-Law will be automatically reinstated and apply to any beneficial owner of common shares acquired in a Control Share Acquisition, regardless of whether such Control Share Acquisition occurs before or after such reinstatement, for the duration of the stay or upon issuance of the mandate reversing, overturning, vacating or otherwise nullifying the judgment of the District Court. On February 25, 2022, the Board and the Funds appealed the District Court’s decision to the U.S. Court of Appeals for the Second Circuit. On November 30, 2023, the U.S. Court of Appeals for the Second Circuit upheld the opinion of the District Court.
Principal Risks
The following risk factor was added as a principal risk to the Funds:
Fund Tax Risk. The Fund has elected to be treated and intends to qualify each year as a Regulated Investment Company (“RIC”) under the Internal Revenue Code of 1986, as amended (the “Code”). As a RIC, the Fund is not expected to be subject to U.S. federal income tax to the extent that it distributes its investment company taxable income and net capital gains. To qualify for the special tax treatment available to a RIC, the Fund must comply with certain investment, distribution, and diversification requirements. Under certain circumstances, the Fund may be forced to sell certain assets when it is not advantageous in order to meet these requirements, which may reduce the Fund’s overall return. If the Fund fails to meet any of these requirements, subject to the opportunity to cure such failures under applicable provisions of the Code, the Fund’s income would be subject to a double level of U.S. federal income tax. The Fund’s income, including its net capital gain, would first be subject to U.S. federal income tax at regular corporate rates, even if such income were distributed to shareholders and, second, all distributions by the Fund from earnings and profits, including distributions of net capital gain (if any), would be taxable to shareholders as dividends.
The following principal risks were consolidated into a single risk factor entitled, “Economic Sector Risk,” and are therefore no longer included as stand-alone principal risks:
Sector and Industry Risk. Subject to the concentration limits of the Fund’s investment policies and guidelines, a Fund may invest a significant portion of its net assets in certain sectors of the municipal securities market, such as hospitals and other health care facilities, charter schools and other private educational facilities, special taxing districts and start-up utility districts, and private activity bonds including industrial development bonds on behalf of transportation companies such as airline companies, whose credit quality and performance may be more susceptible to economic, business, political, regulatory and other developments than other sectors of municipal issuers. If the Fund invests a significant portion of its net assets in the sectors noted above, the Fund’s performance may be subject to additional risk and variability.
Sector Focus Risk. At times, the Fund may focus its investments (i.e., overweight its investments relative to the overall municipal securities market) in one or more particular sectors, which may subject the Fund to additional risk and variability. Securities issued in the same sector may be similarly affected by economic or market events, making the Fund more vulnerable to unfavorable developments in that sector than funds that invest more broadly. As the percentage of the Fund’s Managed Assets invested in a particular sector increases, so does the potential for fluctuation in the NAV of the Fund’s common shares.
The following principal risk was consolidated into a single risk factor entitled, “Distressed or Defaulted Securities Risk,” and is therefore no longer included as a stand-alone principal risk:
263
Shareholder Update (Unaudited) (continued)
Distressed Securities Risk. The Fund may invest in low-rated securities or securities unrated but judged by the sub-adviser to be of comparable quality. Some or many of these low-rated securities, although not in default, may be “distressed,” meaning that the issuer is experiencing financial difficulties or distress at the time of acquisition. Such securities would present a substantial risk of future default which may cause the Fund to incur losses, including additional expenses, to the extent it is required to seek recovery upon a default in the payment of principal or interest on those securities. In any reorganization or liquidation proceeding relating to a portfolio security, the Fund may lose its entire investment or may be required to accept cash or securities with a value less than its original investment. Distressed securities may be subject to restrictions on resale.
The following principal risk was removed as a principal risk of the Funds:
London Inter-Offered Bank Rate (“LIBOR”) Replacement Risk. LIBOR is an index rate that historically has been widely used in lending transactions and remains a common reference rate for setting the floating interest rate on private loans. The use of the LIBOR will begin to be phased out in the near future, which may adversely affect the Fund’s investments whose value is tied to LIBOR. While the Secured Overnight Financing Rate (“SOFR”) has been recommended as the replacement rate for LIBOR, and some product markets have adopted the use of SOFR, LIBOR may still be used as a reference rate until such time that private markets have fully transitioned to using SOFR or other alternative reference rates recommended by applicable market regulators. The transition process away from LIBOR may involve, among other things, increased volatility or illiquidity in markets for instruments that currently rely on LIBOR. The potential effect of a discontinuation of LIBOR on the Fund’s investments will vary depending on, among other things: (1) existing fallback provisions that provide a replacement reference rate if LIBOR is no longer available; (2) termination provisions in individual contracts; and (3) how, and when industry participants develop and adopt new reference rates and fallbacks for both legacy and new products and instruments held by the Fund. Accordingly, it is difficult to predict the full impact of the transition away from LIBOR until it is clearer how the Fund’s products and instruments will be impacted by this transition.
Investment Policies
Effective June 22, 2023, the Board of Trustees (the “Board”) of Nuveen AMT-Free Municipal Credit Income Fund (NVG), Nuveen Municipal Credit Income Fund (NZF), and Nuveen Municipal High Income Opportunity Fund (NMZ) approved a change in each such Fund’s maturity policy. The maturity policy for each of NVG, NZF and NMZ effective as of June 22, 2023 is presented below:
“Under normal circumstances, the Fund will generally maintain an investment portfolio with an overall weighted average maturity of greater than 10 years.”
Portfolio Managers
Nuveen Municipal Credit Opportunities Fund (NMCO),
Nuveen Dynamic Municipal Credit Opportunities Fund (NDMO) and
Nuveen Municipal High Income Opportunity Fund (NMZ)
Effective June 1, 2023, John V. Miller, portfolio manager for NMCO, NDMO and NMZ, retired for Nuveen. Daniel J. Close, CFA, Managing Director, and Stephen J. Candido, CFA, Managing Director, have each been named a portfolio manager for each of NMCO, NDMO and NMZ. Timothy Ryan will continue to serve as portfolio manager of NDMO. Steven M. Hlavin will continue to serve as portfolio manager of NMCO. The day-to-day operation of each Fund and the execution of its specific investment strategies is the primary responsibility of each of the Fund’s portfolio managers. The biographies of Daniel J. Close and Stephen J. Candido are presented below:
Daniel J. Close, CFA, is Managing Director and Portfolio Manager at Nuveen Asset Management, LLC (“Nuveen Asset Management”). He began his career in the financial services industry in 1998 and joined Nuveen Asset Management in 2000. He served as a member of the product management and development team and then as a research analyst before assuming portfolio management responsibilities in 2007.
Stephen J. Candido, CFA, is Managing Director and Portfolio Manager at Nuveen Asset Management. He began his career in the financial services industry when he joined Nuveen Asset Management in 1996. He served as a research analyst specializing in high yield sectors before assuming portfolio management responsibilities in 2016.
Nuveen AMT-Free Municipal Credit Income Fund (NVG)
Effective October 13, 2023, Steven M. Hlavin was named as a portfolio manager of NVG. Paul L. Brennan, CFA, CPA, will continue to serve as a portfolio manager for NVG. The day-to-day operation of the Fund and the execution of its specific investment strategies is the primary responsibility of each of the Fund’s portfolio managers. The biography of Steven M. Hlavin is presented below:
Steven M. Hlavin is Managing Director and Portfolio Manager at Nuveen Asset Management. He began his career in the financial services industry when he joined Nuveen Asset Management in 2003 as a senior analyst. From 2008 until he was named a portfolio manager of certain municipal bond funds in 2010, he was an assistant portfolio manager responsible for Nuveen Asset Management’ tender option bond program.
Nuveen Municipal Credit Income Fund (NZF)
Effective October 13, 2023, Kristen M. DeJong, CFA, was added as a portfolio manager of NZF. The day-to-day operation of NZF and the execution of its specific investment strategies is the primary responsibility of each of NZF’s portfolio managers. The biography of Kristen M. DeJong, CFA, is presented below:
264
Kristen M. DeJong, CFA, is Managing Director and Portfolio Manager at Nuveen Asset Management. She began her career in the financial services industry in 2005 and joined Nuveen Asset Management in 2008. She served as a research associate in the wealth management services area and then as a senior research analyst for Nuveen Asset Management’s municipal fixed income team before assuming portfolio management responsibilities in 2021.
265
Shareholder Update (Unaudited) (continued)
UPDATED DISCLOSURES FOR FUNDS WITH AN EFFECTIVE SHELF OFFERING REGISTRATION STATEMENT
The following includes additional disclosures for the Funds in this annual report with an effective shelf offering registration statement as of the fiscal year ended October 31, 2023.
NUVEEN AMT-FREE MUNICIPAL CREDIT INCOME FUND (NVG)
NUVEEN MUNICIPAL HIGH INCOME OPPORTUNITY FUND (NMZ)
NUVEEN MUNICIPAL CREDIT OPPORTUNITIES FUND (NMCO)
NUVEEN DYNAMIC MUNICIPAL OPPORTUNITIES FUND (NDMO)
SUMMARY OF FUND EXPENSES
The purpose of the tables and the examples below are to help you understand all fees and expenses that you, as a common shareholder, would bear directly or indirectly. The tables show the expenses of each Fund as a percentage of the average net assets applicable to Common Shares and not as a percentage of total assets or managed assets.
| | | | | | | | |
| Shareholder Transaction Expenses | | Nuveen AMT-Free Municipal Credit Income Fund (NVG) | | Nuveen Municipal High Income
Opportunity Fund (NMZ) | | Nuveen Municipal Credit Opportunities Fund (NMCO) | | Nuveen Dynamic Municipal Opportunities Fund (NDMO) |
| | | | |
Maximum Sales Charge (as a percentage of offering price | | 1.00% (1) | | 4.00% (2) | | 4.00% (2) | | 1.00% (1) |
| | | | |
Dividend Reinvestment Plan Fees (3) | | $2.50 | | $2.50 | | $2.50 | | $2.50 |
| (1) | A maximum sales charge of 1.00% applies only to offerings made at-the-market. There is no sales charge for offerings pursuant to an underwritten transaction or a private transaction. |
| (2) | A maximum sales charge of 4.00% applies only to offerings pursuant to a syndicated underwriting. The maximum sales charge for offerings made at-the-market is 1.00%. There is no sales charge for offerings pursuant to a private transaction. |
| (3) | You will be charged a $2.50 service charge and pay brokerage charges if you direct Computershare Inc. and Computershare Trust Company, N.A., as agent for the common shareholders, to sell your Common Shares held in a dividend reinvestment account. |
| | | | | | | | |
| | | As a Percentage of Net Assets Attributable to Common Shares (1) |
| Annual Expenses | | Nuveen AMT-Free
Municipal Credit Income Fund (NVG) | | Nuveen Municipal High Income Opportunity Fund (NMZ) | | Nuveen Municipal Credit Opportunities Fund (NMCO) | | Nuveen Dynamic Municipal Opportunities Fund (NDMO) |
| | | | |
Management Fees | | 1.02% | | 1.05% | | 1.53% | | 1.15% |
| | | | |
Interest and Other Related Expenses (2) | | 2.78% | | 2.59% | | 3.12% | | 1.54% |
| | | | |
Other Expenses (3) | | 0.05% | | 0.11% | | 0.13% | | 0.07% |
Total Annual Expenses | | 3.85% | | 3.75% | | 4.78% | | 2.76% |
| (1) | Stated as percentages of average net assets attributable to Common Shares for the fiscal year ended October 31, 2023. |
| (2) | Interest and Other Related Expenses reflect actual expenses and fees for leverage incurred by a Fund for the fiscal year ended October 31, 2023. The types of leverage used by each Fund during the fiscal year ended October 31, 2023 are described in the Fund Leverage and the Notes to Financial Statements (Note 4 – Portfolio Securities, Note 5 – Derivative Investments, Note 6 – Fund Shares, Note 10 – Borrowings Arrangements and Reverse Repurchase Agreements) sections of this annual report. Actual Interest and Other Related Expenses incurred in the future may be higher or lower. If short-term market interest rates rise in the future, and if a Fund continues to maintain leverage, the cost of which is tied to short-term interest rates, a Fund’s interest expenses on its short-term borrowings can be expected to rise in tandem. A Fund’s use of leverage will increase the amount of management fees paid to the Fund’s adviser and sub-advisor(s). |
| (3) | Other Expenses are based on estimated amounts for the current fiscal year. Expenses attributable to the Fund’s investments, if any, in other investment companies are currently estimated not to exceed 0.01%. |
266
Examples
The following examples illustrate the expenses, including the applicable transaction fees (referred to as the “Maximum Sales Charge” in the Shareholder Transaction Expenses table above), if any, that a common shareholder would pay on a $1,000 investment that is held for the time periods provided in the table. Each example assumes that all dividends and other distributions are reinvested in the Fund and that the Fund’s Annual Expenses, as provided above, remain the same. The examples also assume a 5% annual return. Actual expenses may be greater or less than those assumed. Moreover, the Fund’s actual rate of return may be greater or less than the hypothetical 5% return shown in the examples.
Example # 1 (At-the-Market Transaction)
The following example assumes a transaction fee of 1.00%, as a percentage of the offering price.
| | | | | | | | |
| | | 1 Year | | 3 Years | | 5 Years | | 10 Years |
Nuveen AMT-Free Municipal Credit Income Fund (NVG) | | $48 | | $126 | | $206 | | $414 |
Nuveen Municipal High Income Opportunity Fund(NMZ) | | $47 | | $123 | | $202 | | $405 |
Nuveen Municipal Credit Opportunities Fund (NMCO) | | $57 | | $152 | | $248 | | $488 |
Nuveen Dynamic Municipal Opportunities Fund (NDMO) | | $38 | | $95 | | $154 | | $316 |
Example # 2 (Underwriting Syndicate Transaction)
The following example assumes a transaction fee of 4.00%, as a percentage of the offering price.
| | | | | | | | |
| | | 1 Year | | 3 Years | | 5 Years | | 10 Years |
Nuveen AMT-Free Municipal Credit Income Fund (NVG) (1) | | N/A | | N/A | | N/A | | N/A |
Nuveen Municipal High Income Opportunity Fund (NMZ) | | $76 | | $150 | | $226 | | $423 |
Nuveen Municipal Credit Opportunities Fund (NMCO) | | $86 | | $178 | | $271 | | $504 |
Nuveen Dynamic Municipal Opportunities Fund (NDMO) (1) | | N/A | | N/A | | N/A | | N/A |
| (1) | Not applicable – the Fund does not incur a sales charge for offerings pursuant to an underwritten transaction as noted in Shareholder Transaction Expenses table above. |
Example # 3 (Privately Negotiated Transaction)
The following example assumes there is no transaction fee.
| | | | | | | | |
| | | 1 Year | | 3 Years | | 5 Years | | 10 Years |
Nuveen AMT-Free Municipal Credit Income Fund (NVG) | | $39 | | $118 | | $198 | | $408 |
Nuveen Municipal High Income Opportunity Fund (NMZ) | | $38 | | $115 | | $193 | | $399 |
Nuveen Municipal Credit Opportunities Fund (NMCO) | | $48 | | $144 | | $240 | | $483 |
Nuveen Dynamic Municipal Opportunities Fund (NDMO) | | $28 | | $86 | | $146 | | $309 |
The examples should not be considered a representation of future expenses. Actual expenses may be greater or less than those shown above.
267
Shareholder Update (Unaudited) (continued)
TRADING AND NET ASSET VALUE INFORMATION
The following table shows for the periods indicated: (i) the high and low sales prices for the Common Shares reported as of the end of the day on the NYSE, (ii) the high and low net asset value (NAV) of the Common Shares, and (iii) the high and low of the premium/(discount) to NAV (expressed as a percentage) of shares of the Common Shares.
Nuveen AMT-Free Municipal Credit Income Fund (NVG)
| | | | | | | | | | | | | | | | |
| | | Market Price | | | | NAV | | | | Premium/(Discount) to NAV |
| | | | | | | | |
| Fiscal Quarter End | | High | | Low | | | | High | | Low | | | | High | | Low |
| | | | | | | | |
October 2023 | | $11.79 | | $9.72 | | | | $13.50 | | $11.77 | | | | (12.67)% | | (17.70)% |
| | | | | | | | |
July 2023 | | $11.88 | | $11.13 | | | | $13.69 | | $13.10 | | | | (12.69)% | | (15.30)% |
| | | | | | | | |
April 2023 | | $12.69 | | $11.35 | | | | $14.09 | | $13.13 | | | | (9.03)% | | (15.59)% |
| | | | | | | | |
January 2023 | | $12.71 | | $10.91 | | | | $14.05 | | $12.24 | | | | (5.23)% | | (12.81)% |
| | | | | | | | |
October 2022 | | $14.61 | | $10.92 | | | | $14.71 | | $12.07 | | | | 0.63% | | (10.69)% |
| | | | | | | | |
July 2022 | | $14.32 | | $12.64 | | | | $14.71 | | $13.50 | | | | (2.59)% | | (7.62)% |
| | | | | | | | |
April 2022 | | $16.21 | | $13.51 | | | | $16.79 | | $14.45 | | | | (1.78)% | | (8.81)% |
| | | | | | | | |
January 2022 | | $17.93 | | $15.77 | | | | $17.54 | | $16.62 | | | | 2.75% | | (7.02)% |
Nuveen Municipal High Income Opportunity Fund (NMZ)
| | | | | | | | | | | | | | | | |
| | | Market Price | | | | NAV | | | | Premium/(Discount) to NAV |
| | | | | | | | |
| Fiscal Quarter End | | High | | Low | | | | High | | Low | | | | High | | Low |
| | | | | | | | |
October 2023 | | $10.59 | | $8.33 | | | | $10.93 | | $9.46 | | | | (2.61)% | | (12.22)% |
| | | | | | | | |
July 2023 | | $10.81 | | $10.07 | | | | $11.21 | | $10.76 | | | | (2.30)% | | (7.14)% |
| | | | | | | | |
April 2023 | | $11.13 | | $10.20 | | | | $11.63 | | $10.79 | | | | (3.05)% | | (7.46)% |
| | | | | | | | |
January 2023 | | $11.23 | | $9.80 | | | | $11.59 | | $10.00 | | | | 1.20% | | (7.60)% |
| | | | | | | | |
October 2022 | | $12.51 | | $9.78 | | | | $12.36 | | $9.86 | | | | 1.78% | | (4.61)% |
| | | | | | | | |
July 2022 | | $12.71 | | $10.99 | | | | $12.40 | | $11.09 | | | | 2.99% | | (1.17)% |
| | | | | | | | |
April 2022 | | $14.26 | | $11.95 | | | | $14.19 | | $12.11 | | | | 2.23% | | (4.23)% |
| | | | | | | | |
January 2022 | | $15.15 | | $14.13 | | | | $14.80 | | $14.04 | | | | 3.02% | | (1.87)% |
Nuveen Municipal Credit Opportunities Fund (NMCO)
| | | | | | | | | | | | | | | | |
| | | Market Price | | | | NAV | | | | Premium/(Discount) to NAV |
| | | | | | | | |
| Fiscal Quarter End | | High | | Low | | | | High | | Low | | | | High | | Low |
| | | | | | | | |
October 2023 | | $11.54 | | $8.62 | | | | $11.68 | | $10.04 | | | | (0.26)% | | (14.40)% |
| | | | | | | | |
July 2023 | | $11.43 | | $10.74 | | | | $12.01 | | $11.60 | | | | (2.47)% | | (8.20)% |
| | | | | | | | |
April 2023 | | $12.41 | | $10.83 | | | | $12.52 | | $11.69 | | | | 0.65% | | (8.63)% |
| | | | | | | | |
January 2023 | | $12.49 | | $10.47 | | | | $12.51 | | $11.15 | | | | 0.73% | | (8.78)% |
| | | | | | | | |
October 2022 | | $13.64 | | $10.29 | | | | $13.42 | | $10.97 | | | | 2.40% | | (7.81)% |
| | | | | | | | |
July 2022 | | $13.78 | | $11.78 | | | | $13.58 | | $12.19 | | | | 2.21% | | (5.63)% |
| | | | | | | | |
April 2022 | | $14.84 | | $12.46 | | | | $15.21 | | $13.21 | | | | (1.85)% | | (8.08)% |
| | | | | | | | |
January 2022 | | $15.94 | | $14.52 | | | | $15.81 | | $15.12 | | | | 0.89% | | (5.90)% |
268
Nuveen Dynamic Municipal Opportunities Fund (NDMO)
| | | | | | | | | | | | | | | | |
| | | Market Price | | | | NAV | | | | Premium/(Discount) to NAV |
| | | | | | | | |
| Fiscal Quarter End | | High | | Low | | | | High | | Low | | | | High | | Low |
| | | | | | | | |
October 2023 | | $10.96 | | $9.08 | | | | $10.87 | | $9.78 | | | | 0.83% | | (7.25)% |
| | | | | | | | |
July 2023 | | $11.01 | | $10.03 | | | | $11.09 | | $10.77 | | | | 1.01% | | (8.65)% |
| | | | | | | | |
April 2023 | | $12.22 | | $10.41 | | | | $11.44 | | $10.82 | | | | 8.33% | | (5.71)% |
| | | | | | | | |
January 2023 | | $11.37 | | $9.66 | | | | $11.40 | | $10.38 | | | | 0.35% | | (8.59)% |
| | | | | | | | |
October 2022 | | $12.56 | | $9.38 | | | | $12.66 | | $10.28 | | | | (0.08)% | | (9.88)% |
| | | | | | | | |
July 2022 | | $12.53 | | $10.56 | | | | $12.86 | | $11.51 | | | | (1.84)% | | (9.92)% |
| | | | | | | | |
April 2022 | | $15.14 | | $11.47 | | | | $15.22 | | $12.51 | | | | 3.42% | | (8.31)% |
| | | | | | | | |
January 2022 | | $16.64 | | $15.00 | | | | $15.86 | | $15.01 | | | | 5.32% | | (2.15)% |
The following table shows, as of October 31, 2023 each Fund’s: (i) NAV per Common Share, (ii) market price, (iii) percentage of premium/(discount) to NAV per Common Share and, (iv) net assets attributable to Common Shares.
| | | | | | | | |
| October 31, 2023 | | Nuveen AMT-Free Municipal Credit
Income Fund (NVG) | | Nuveen Municipal High Income Opportunity Fund (NMZ) | | Nuveen Municipal Credit Opportunities Fund (NMCO) | | Nuveen Dynamic Municipal Opportunities Fund (NDMO) |
| | | | |
NAV per Common Share | | $11.79 | | $9.48 | | $10.06 | | $9.80 |
| | | | |
Market Price | | $10.03 | | $8.37 | | $8.67 | | $9.12 |
| | | | |
Percentage of Premium/(Discount) to NAV per Common Share | | (14.93)% | | (11.71)% | | (13.82)% | | (6.94)% |
| | | | |
Net Assets Attributable to Common Shares | | $2,517,038,943 | | $1,048,148,769 | | $551,282,405 | | $583,504,166 |
Shares of closed-end investment companies, including those of the Funds, may frequently trade at prices lower than NAV, the Funds’ Board of Trustees (Board) has currently determined that, at least annually, it will consider action that might be taken to reduce or eliminate any material discount from NAV in respect of Common Shares, which may include the repurchase of such shares in the open market or in private transactions, the making of a tender offer for such shares at NAV, or the conversion of the Fund to an open-end investment company. The Funds cannot assure you that their Board will decide to take any of these actions, or that share repurchases or tender offers will actually reduce market discount.
SENIOR SECURITIES
The following table sets forth information regarding each Fund’s outstanding senior securities as of the end of each of the Fund’s last ten fiscal periods, as applicable. Each Fund’s senior securities during this time period are comprised of borrowings that constitute “senior securities” as defined in the Investment Company Act of 1940, as amended (1940 Act). The information in this table has been audited by KPMG LLP, independent registered public accounting firm. The Funds’ audited financial statements, including the report of KPMG LLP thereon, and accompanying notes thereto, are included in this Annual Report.
269
Shareholder Update (Unaudited) (continued)
Nuveen AMT-Free Municipal Credit Income Fund (NVG)
| | | | | | | | | | | | | | | | | | | | | | |
| | | Adjustable Rate MuniFund Term Preferred (AMTP) Shares at the End of Period | | MuniFund Preferred (MFP) Shares at the End of Period | | MuniFund Term Preferred (MTP)Shares at the End of Period | | Variable Rate MuniFund Term Preferred (VMTP) Shares at the End of Period | | Variable Rate Demand Preferred (VRDP) Shares at the End of Period | | AMPT, MFP, MTP, VMTP and/or VRDP Shares at the End of Period |
Year Ended 10/31: | | Aggregate Amount Outstanding (000) (1) | | Asset Coverage Per $100,000 Share (2) | | Aggregate Amount Outstanding (000) (1) | | Asset Coverage Per $100,000 Share (2),(3) | | Aggregate Amount Outstanding (000) (1) | | Asset Coverage Per $10 Share (4) | | Aggregate Amount Outstanding (000) (1) | | Asset
Coverage Per
$100,000 Share (2) | | Aggregate Amount
Outstanding (000) (1) | | Asset Coverage Per
$100,000
Share (2) | | Asset Coverage Per $1
Liquidation
Preference |
2023 | | $0 | | $0 | | $517,400 | | $243,503 | | $0 | | $0 | | $0 | | $0 | | $1,236,600 | | $243,503 | | $2.44 |
2022 | | $0 | | $0 | | $610,900 | | $240,935 | | $0 | | $0 | | $0 | | $0 | | $1,236,600 | | $240,935 | | $2.41 |
2021 | | $112,000 | | $291,153 | | $405,400 | | $291,153 | | $0 | | $0 | | $0 | | $0 | | $1,411,600 | | $291,153 | | $2.91 |
2020 | | $112,000 | | $285,399 | | $405,400 | | $285,399 | | $0 | | $0 | | $0 | | $0 | | $1,411,600 | | $285,399 | | $2.85 |
2019 | | $0 | | $0 | | $405,400 | | $291,357 | | $0 | | $0 | | $0 | | $0 | | $1,411,600 | | $291,357 | | $2.91 |
2018 | | $0 | | $0 | | $405,400 | | $272,535 | | $0 | | $0 | | $0 | | $0 | | $1,411,600 | | $272,535 | | $2.73 |
2017 | | $0 | | $0 | | $0 | | $0 | | $0 | | $0 | | $240,400 | | $300,955 | | $1,411,600 | | $300,955 | | $3.01 |
2016 | | $0 | | $0 | | $0 | | $0 | | $0 | | $0 | | $240,400 | | $304,005 | | $1,411,600 | | $304,005 | | $3.04 |
2015 | | $0 | | $0 | | $0 | | $0 | | $0 | | $0 | | $0 | | $0 | | $179,000 | | $338,606 | | - |
2014 | | $0 | | $0 | | $0 | | $0 | | $0 | | $0 | | $0 | | $0, | | $179,000 | | $341,951 | | - |
| (1) | Aggregate Amount Outstanding: Aggregate amount outstanding represents the liquidation preference as of the end of the relevant fiscal year and does not include any preferred shares noticed for redemption as noted on the Statement of Assets and Liabilities, where applicable. |
| (2) | Asset Coverage Per $100,000: Asset coverage per $100,000 is calculated by subtracting the Fund’s liabilities and indebtedness not represented by senior securities from the Fund’s total assets, dividing the result by the aggregate amount of the Fund’s senior securities representing indebtedness then outstanding (if applicable), plus the aggregate of the involuntary liquidation preference of the outstanding preferred shares, if applicable, and multiplying the result by 100,000. |
| (3) | The Fund’s Series B and Series C MFP Shares have a $1,000 liquidation preference per share, while all other MFP Shares have a $100,000 liquidation preference per share. The asset coverage per $1,000 share for the Fund’s Series B and Series C MFP Shares were as follows: |
| | | | | | | | | | | | |
| | | Fiscal Year Ended October 31 |
| Series B MFP Shares | | 2023 | | 2022 | | 2021 | | 2020 | | 2019 | | 2018 |
Asset Coverage Per $ 1,000 Share* | | $2,435 | | $2,409 | | $2,912 | | $2,854 | | $2,914 | | $0 |
| |
| | | Fiscal Year Ended October 31 |
| Series C MFP Shares | | 2023 | | 2022 | | 2021 | | 2020 | | 2019 | | 2018 |
Asset Coverage Per $ 1,000 Share* | | $2,435 | | $2,409 | | $0 | | $0 | | $0 | | $0 |
| (4) | Asset Coverage Per $10: Asset coverage per $10 is calculated by subtracting the Fund’s liabilities and indebtedness not represented by senior securities from the Fund’s total assets, dividing the result by the aggregate amount of the Fund’s senior securities representing indebtedness then outstanding, and multiplying the result by 10. The Ending and Average Market Value Per Share for each Series of the Fund’s MTP Shares outstanding were as follows: |
| | | | |
| | | | | Fiscal Year Ended October 31 |
| | Series 2014 (NVG PRCCL) | | 2014 |
| | |
| | Ending Market Value Per Share | | $0 |
| | |
| | Average Market Value Per Share | | $10.05 (5) |
| | |
270
Nuveen Municipal High Income Opportunity Fund (NMZ)
| | | | | | | | | | | | | | | | | | | | | | | | |
| | | Borrowings
Outstanding at the End of Period | | | Adjustable Rate MuniFund Term Preferred (AMTP) Shares at the End
of Period | | | Variable Rate MuniFund Term Preferred (VMTP) Shares at the End of Period | |
| Year Ended 10/31: | | Aggregate Amount Outstanding (000) (1) | | | Asset Coverage Per $1,000 Share (2) | | | Aggregate Amount Outstanding (000) | | | Asset Coverage Per $100,000 Share (3) | | | Aggregate Amount Outstanding (000) (1) | | | Asset Coverage Per $100,000
Share (3) | |
2023 | | | $ 0 | | | | $ 0 | | | | $ 357,000 | | | | $ 393,599 | | | | $ 0 | | | | $ 0 | |
2022 | | | $ 0 | | | | $ 0 | | | | $ 357,000 | | | | $ 406,158 | | | | $ 0 | | | | $ 0 | |
2021 | | | $ 0 | | | | $ 0 | | | | $ 257,000 | | | | $ 646,596 | | | | $ 0 | | | | $ 0 | |
2020 | | | $ 0 | | | | $ 0 | | | | $ 87,000 | | | | $ 1,361,400 | | | | $ 0 | | | | $ 0 | |
2019 | | | $ 0 | | | | $ 0 | | | | $ 87,000 | | | | $ 1,213,872 | | | | $ 0 | | | | $ 0 | |
2018 | | | $ 0 | | | | $ 0 | | | | $ 87,000 | | | | $ 1,040,734 | | | | $ 0 | | | | $ 0 | |
2017 | | | $ 0 | | | | $ 0 | | | | $ 0 | | | | $ 0 | | | | $ 87,000 | | | | $ 1,081,317 | |
2016 | | | $ 0 | | | | $ 0 | | | | $ 0 | | | | $ 0 | | | | $ 87,000 | | | | $ 1,006,411 | |
2015 | | | $ 0 | | | | $ 0 | | | | $ 0 | | | | $ 0 | | | | $ 87,000 | | | | $ 886,333 | |
2014 | | | $ 0 | | | | $ 0 | | | | $ 0 | | | | $ 0 | | | | $ 87,000 | | | | $ 888,850 | |
| (1) | Aggregate Amount Outstanding: Aggregate amount outstanding represents the liquidation preference as of the end of the relevant fiscal year. |
| (2) | Asset Coverage Per $1,000: Asset coverage per $1,000 is calculated by subtracting the Fund’s liabilities and indebtedness not represented by senior securities from the Fund’s total assets, dividing the result by the aggregate amount of the Fund’s senior securities representing indebtedness then outstanding (if applicable), plus the aggregate of the involuntary liquidation preference of the outstanding preferred shares, if applicable, and multiplying the result by 1,000. |
| (3) | Asset Coverage Per $100,000: Asset coverage per $100,000 is calculated by subtracting the Fund’s liabilities and indebtedness not represented by senior securities from the Fund’s total assets, dividing the result by the aggregate amount of the Fund’s senior securities representing indebtedness then outstanding (if applicable), plus the aggregate of the involuntary liquidation preference of the outstanding preferred shares, if applicable, and multiplying the result by 100,000. |
Nuveen Municipal Credit Opportunities Fund (NMCO)
| | | | | | | | |
| | | MuniFund Preferred (MFP) Shares at the End of Period | |
| Year Ended 10/31: | | Aggregate Amount Outstanding (000) (1) | | | Asset Coverage Per $100,000 Share (2) | |
| | |
2023 | | | $ 430,000 | | | | $ 228,205 | |
| | |
2022 | | | $ 450,000 | | | | $ 237,489 | |
| | |
2021 | | | $ 450,000 | | | | $ 283,171 | |
| | |
2020 | | | $ 450,000 | | | | $ 251,699 | |
| | |
2019 (3) | | | $ 0 | | | | $ 0 | |
| (1) | Aggregate Amount Outstanding: Aggregate amount outstanding represents the liquidation preference as of the end of the relevant fiscal year and does not include any preferred shares noticed for redemption as noted on the Statement of Assets and Liabilities, where applicable. |
| (2) | Asset Coverage Per $100,000: Asset coverage per $100,000 is calculated by subtracting the Fund’s liabilities and indebtedness not represented by senior securities from the Fund’s total assets, dividing the result by the aggregate amount of the Fund’s senior securities representing indebtedness then outstanding (if applicable), plus the aggregate of the involuntary liquidation preference of the outstanding preferred shares, if applicable, and multiplying the result by 100,000. |
| (3) | For the period September 16, 2019 (commencement of operations) through October 31, 2019. |
271
Shareholder Update (Unaudited) (continued)
Nuveen Dynamic Municipal Opportunities Fund (NDMO)
| | | | | | | | | | | | | | | | |
| | | Borrowings Outstanding at the End of Period | | | MuniFund Preferred (MFP) Shares at the End of Period | |
| Year Ended 10/31: | | Aggregate
Amount
Outstanding
(000) (1) | | | Asset Coverage
Per $1,000 (2) | | | Aggregate
Amount
Outstanding
(000) (1) | | | Asset Coverage Per $100,000 Share
(3) | |
2023 | | | $ 0 | | | | $ 0 | | | | $ 240,000 | | | | $ 343,127 | |
2022 | | | $ 0 | | | | $ 0 | | | | $ 240,000 | | | | $ 356,314 | |
2021 | | | $ 191,900 | | | | $ 5,761 | | | | $ 0 | | | | $ 0 | |
2020 (4) | | | $ 0 | | | | $ 0 | | | | $ 0 | | | | $ 0 | |
| (1) | Aggregate Amount Outstanding: Aggregate amount outstanding represents the liquidation preference as of the end of the relevant fiscal year. |
| (2) | Asset Coverage Per $1,000: Asset coverage per $1,000 is calculated by subtracting the Fund’s liabilities and indebtedness not represented by senior securities from the Fund’s total assets, dividing the result by the aggregate amount of the Fund’s senior securities representing indebtedness then outstanding (if applicable), plus the aggregate of the involuntary liquidation preference of the outstanding preferred shares, if applicable, and multiplying the result by 1,000. |
| (3) | Asset Coverage Per $100,000: Asset coverage per $100,000 is calculated by subtracting the Fund’s liabilities and indebtedness not represented by senior securities from the Fund’s total assets, dividing the result by the aggregate amount of the Fund’s senior securities representing indebtedness then outstanding (if applicable), plus the aggregate of the involuntary liquidation preference of the outstanding preferred shares, if applicable, and multiplying the result by 100,000. |
| (4) | For the period August 26, 2020 (commencement of operations) through October 31, 2020. |
UNRESOLVED STAFF COMMENTS
Each Fund believes that there are no material unresolved written comments, received 180 days or more before October 31, 2023, from the Staff of the Securities and Exchange Commission (SEC) regarding any of its periodic or current reports under the Securities Exchange Act or Investment Company Act of 1940, or its registration statement.
272
Important Tax Information
(Unaudited)
As required by the Internal Revenue Code and Treasury Regulations, certain tax information, as detailed below, must be provided to shareholders. Shareholders are advised to consult their tax advisor with respect to the tax implications of their investment. The amounts listed below may differ from the actual amounts reported on Form 1099-DIV, which will be sent to shareholders shortly after calendar year end.
Long-Term Capital Gains
As of year end, each Fund designates the following distribution amounts, or maximum amount allowable, as being from net long-term capital gains pursuant to Section 852(b)(3) of the Internal Revenue Code:
| | | | |
| Fund | | Net Long-Term Capital Gains | |
NVG | | | $– | |
NZF | | | – | |
NMZ | | | – | |
NMCO | | | – | |
NDMO | | | – | |
273
Additional Fund Information
(Unaudited)
| | | | | | | | | | |
| Board of Trustees | | | | | | | | | | |
| | | | | |
| Jack B. Evans | | William C. Hunter | | Amy B.R. Lancellotta | | Joanne T. Medero | | Albin F. Moschner | | John K. Nelson |
| | | | | |
| Matthew Thornton III | | Terence J. Toth | | Margaret L. Wolff | | Robert L. Young | | | | |
| | | | | |
| | | | | | | | | | | |
| | | | |
Investment Adviser Nuveen Fund Advisors, LLC 333 West Wacker Drive Chicago, IL 60606 | | Custodian State Street Bank & Trust Company One Congress Street Suite 1 Boston, MA 02114-2016 | | Legal Counsel Chapman and Cutler LLP Chicago, IL 60603 | | Independent Registered Public Accounting Firm KPMG LLP 200 East Randolph Street Chicago, IL 60601 | | Transfer Agent and Shareholder Services Computershare Trust Company, N.A. 150 Royall Street Canton, MA 02021 (800) 257-8787 |
| | | | | | | |
Portfolio of Investments Information The Fund is required to file its complete schedule of portfolio holdings with the Securities and Exchange Commission (SEC) for the first and third quarters of each fiscal year as an exhibit to its report on Form N-PORT. You may obtain this information on the SEC’s website at http://www.sec.gov.
Nuveen Funds’ Proxy Voting Information You may obtain (i) information regarding how each fund voted proxies relating to portfolio securities held during the most recent twelve-month period ended June 30, without charge, upon request, by calling Nuveen toll-free at (800) 257-8787 or on Nuveen’s website at www.nuveen.com and (ii) a description of the policies and procedures that each fund used to determine how to vote proxies relating to portfolio securities without charge, upon request, by calling Nuveen toll-free at (800) 257-8787. You may also obtain this information directly from the SEC. Visit the SEC on-line at http://www.sec.gov.
CEO Certification Disclosure The Fund’s Chief Executive Officer (CEO) has submitted to the New York Stock Exchange (NYSE) the annual CEO certification as required by Section 303A.12(a) of the NYSE Listed Company Manual. Each Fund has filed with the SEC the certification of its CEO and Chief Financial Officer required by Section 302 of the Sarbanes-Oxley Act.
Common Share Repurchases Each Fund intends to repurchase, through its open-market share repurchase program, shares of its own common stock at such times and in such amounts as is deemed advisable. During the period covered by this report, each Fund repurchased shares of its common stock as shown in the accompanying table. Any future repurchases will be reported to shareholders in the next annual or semi-annual report.
| | | | | | | | | | | | | | | | | | | | |
| | | NVG | | | NZF | | | NMZ | | | NMCO | | | NDMO | |
Common shares repurchased | | | 0 | | | | 20,000 | | | | 0 | | | | 0 | | | | 0 | |
FINRA BrokerCheck: The Financial Industry Regulatory Authority (FINRA) provides information regarding the disciplinary history of FINRA member firms and associated investment professionals. This information as well as an investor brochure describing FINRA BrokerCheck is available to the public by calling the FINRA BrokerCheck Hotline number at (800) 289-9999 or by visiting www.FINRA.org.
274
Glossary of Terms Used in this Report
(Unaudited)
Average Annual Total Return: This is a commonly used method to express an investment’s performance over a particular, usually multi-year time period. It expresses the return that would have been necessary each year to equal the investment’s actual cumulative performance (including change in NAV or offer price and reinvested dividends and capital gains distributions, if any) over the time period being considered.
Duration: Duration is a measure of the expected period over which a bond’s principal and interest will be paid, and consequently is a measure of the sensitivity of a bond’s or bond fund’s value to changes when market interest rates change. Generally, the longer a bond’s or fund’s duration, the more the price of the bond or fund will change as interest rates change.
Effective Leverage: Effective leverage is a fund’s effective economic leverage, and includes both regulatory leverage (see leverage) and the leverage effects of certain derivative investments in the fund’s portfolio. Currently, the leverage effects of Tender Option Bond (TOB) inverse floater holdings are included in effective leverage values, in addition to any regulatory leverage.
Gross Domestic Product (GDP): The total market value of all final goods and services produced in a country/region in a given year, equal to total consumer, investment and government spending, plus the value of exports, minus the value of imports.
Industrial Development Revenue Bond (IDR): A unique type of revenue bond issued by a state or local government agency on behalf of a private sector company and intended to build or acquire factories or other heavy equipment and tools.
Inverse Floating Rate Securities: Inverse floating rate securities are the residual interest in a tender option bond (TOB) trust, sometimes referred to as “inverse floaters”, are created by depositing a municipal bond, typically with a fixed interest rate, into a special purpose trust. This trust, in turn, (a) issues floating rate certificates typically paying short-term tax-exempt interest rates to third parties in amounts equal to some fraction of the deposited bond’s par amount or market value, and (b) issues an inverse floating rate certificate (sometimes referred to as an “inverse floater”) to an investor (such as a fund) interested in gaining investment exposure to a long-term municipal bond. The income received by the holder of the inverse floater varies inversely with the short-term rate paid to the floating rate certificates’ holders, and in most circumstances the holder of the inverse floater bears substantially all of the underlying bond’s downside investment risk. The holder of the inverse floater typically also benefits disproportionately from any potential appreciation of the underlying bond’s value. Hence, an inverse floater essentially represents an investment in the underlying bond on a leveraged basis.
Leverage: Leverage is created whenever a fund has investment exposure (both reward and/or risk) equivalent to more than 100% of the investment capital.
Net Asset Value (NAV) Per Share: A fund’s Net Assets is equal to its total assets (securities, cash, accrued earnings and receivables) less its total liabilities. NAV per share is equal to the fund’s Net Assets divided by its number of shares outstanding.
Pre-Refunded Bond/Pre-Refunding: Pre-Refunded Bond/Pre-Refunding, also known as advanced refundings or refinancings, is a procedure used by state and local governments to refinance municipal bonds to lower interest expenses. The issuer sells new bonds with a lower yield and uses the proceeds to buy U.S. Treasury securities, the interest from which is used to make payments on the higher-yielding bonds. Because of this collateral, pre-refunding generally raises a bond’s credit rating and thus its value.
Regulatory Leverage: Regulatory leverage consists of preferred shares issued by or borrowings of a fund. Both of these are part of a fund’s capital structure. Regulatory leverage is subject to asset coverage limits set in the Investment Company Act of 1940.
Tax Obligation/General Bonds: Bonds backed by the general revenues of an issuer, including taxes, where the issuer has the ability to increase taxes by an unlimited amount to pay the bonds back.
Tax Obligation/Limited Bonds: Bonds backed by the general revenues of an issuer, including taxes, where the issuer doesn’t have the ability to increase taxes by an unlimited amount to pay the bonds back.
Total Investment Exposure: Total investment exposure is a fund’s assets managed by the Adviser that are attributable to financial leverage. For these purposes, financial leverage includes a fund’s use of preferred stock and borrowings and investments in the residual interest certificates (also called inverse floating rate securities) in tender option bond (TOB) trusts, including the portion of assets held by a TOB trust that has been effectively financed by the trust’s issuance of floating rate securities.
275
Glossary of Terms Users in the Report (Unaudited) (continued)
Zero Coupon Bond: A zero coupon bond does not pay a regular interest coupon to its holders during the life of the bond. Income to the holder of the bond comes from accretion of the difference between the original purchase price of the bond at issuance and the par value of the bond at maturity and is effectively paid at maturity. The market prices of zero coupon bonds generally are more volatile than the market prices of bonds that pay interest periodically.
276
Annual Investment Management
Agreement Approval Process
(Unaudited)
At a meeting held on May 23-25, 2023 (the “May Meeting”), the Boards of Trustees (collectively, the “Board” and each Trustee, a “Board Member”) of the Funds, which are comprised entirely of Board Members who are not “interested persons” (as defined under the Investment Company Act of 1940 (the “1940 Act”)) (the “Independent Board Members”), approved, for their respective Fund, the renewal of the management agreement (each, an “Investment Management Agreement”) with Nuveen Fund Advisors, LLC (the “Adviser”) pursuant to which the Adviser serves as investment adviser to such Fund and the sub-advisory agreement (each, a “Sub-Advisory Agreement”) with Nuveen Asset Management, LLC (the “Sub-Adviser”) pursuant to which the Sub-Adviser serves as the sub-adviser to such Fund for an additional one-year term. As the Board is comprised of all Independent Board Members, the references to the Board and the Independent Board Members are interchangeable.
Following up to an initial two-year period, the Board considers the renewal of each Investment Management Agreement and Sub-Advisory Agreement on behalf of the applicable Fund on an annual basis. The Investment Management Agreements and Sub-Advisory Agreements are collectively referred to as the “Advisory Agreements,” and the Adviser and the Sub-Adviser are collectively, the “Fund Advisers” and each, a “Fund Adviser.”
The Independent Board Members considered the review of the advisory agreements for the Nuveen funds to be an ongoing process and employed the accumulated information, knowledge and experience the Board Members had gained during their tenure on the boards governing the Nuveen funds and working with the Adviser and the applicable sub-advisers in their annual review of the advisory agreements. Throughout the year, the Board and its committees meet regularly and, at these meetings, receive regular and/or special reports that cover an extensive array of topics and information that are relevant to the Board’s annual consideration of the renewal of the advisory agreements for the Nuveen funds. Such information may address, among other things, fund performance and risk information; the Adviser’s strategic plans; product initiatives for various funds; the review of the funds and investment teams; compliance, regulatory and risk management matters; the trading practices of the various sub-advisers to the Nuveen funds; management of distributions; valuation of securities; fund expenses; securities lending; liquidity management; overall market and regulatory developments; and with respect to closed-end funds, capital management initiatives, institutional ownership, management of leverage financing and the secondary market trading of the closed-end funds and any actions to address discounts. The Board also seeks to meet periodically with the Nuveen funds’ sub-advisers and/or portfolio teams, when feasible. The presentations, discussions, and meetings throughout the year also provide a means for the Board to evaluate the level, breadth and quality of services provided by the Adviser and how such services have changed over time in light of new or modified regulatory requirements, changes to market conditions or other factors.
In connection with its annual consideration of the advisory agreements for the Nuveen funds, the Board, through its independent legal counsel, requested and received extensive materials and information prepared specifically for its review of such advisory agreements by the Adviser and by Broadridge Financial Solutions, Inc. (“Broadridge”), an independent provider of investment company data. The materials cover a wide range of topics including, but not limited to, a description of the nature, extent and quality of services provided by the Fund Advisers; a review of product actions advanced in 2022 for the benefit of particular Nuveen funds and/or the Nuveen fund complex; a review of each sub-adviser to the Nuveen funds and/or the applicable investment team; an analysis of fund performance with a focus on any Nuveen funds considered performance outliers; an analysis of the fees and expense ratios of the Nuveen funds with a focus on any Nuveen funds considered expense outliers; a review of management fee schedules; a description of portfolio manager compensation; an overview of the secondary market trading of shares of the Nuveen closed-end funds (including, among other things, an analysis of secondary market performance and commentary regarding the leverage management, share repurchase and shelf offering programs of Nuveen closed-end funds); a description of the profitability or financial data of Nuveen and the sub-advisers to the Nuveen funds; and a description of indirect benefits received by the Adviser and the sub-advisers as a result of their relationships with the Nuveen funds. The information prepared specifically for the annual review supplemented the information provided to the Board and its committees and the evaluations of the Nuveen funds by the Board and its committees during the year. The Board’s review of the advisory agreements for the Nuveen funds is based on all the information provided to the Board and its committees throughout the year as well as the information prepared specifically with respect to the annual review of such advisory agreements. The performance, fee and expense data and other information provided by a Fund Adviser, Broadridge or other service providers were not independently verified by the Independent Board Members.
As part of its review, the Board met on April 11-12, 2023 (the “April Meeting”) to review and discuss, in part, the performance of the Nuveen funds and the Adviser’s evaluation of each sub-adviser to the Nuveen funds and/or its investment teams. At the April Meeting, the Board Members asked questions and requested additional information that was provided for the May Meeting.
The Independent Board Members were advised by independent legal counsel during the annual review process as well as throughout the year, including meeting in executive sessions with such counsel at which no representatives from the Adviser or the Sub-Adviser were present. In connection with their annual review, the Independent Board Members also received a memorandum from independent legal counsel outlining their fiduciary duties and legal standards in reviewing the Advisory Agreements, including guidance from court cases evaluating advisory fees.
The Board’s decision to renew the Advisory Agreements was not based on a single identified factor, but rather the decision reflected the comprehensive consideration of all the information provided to the Board and its committees throughout the year as well as the materials prepared specifically in connection with the renewal process. The contractual arrangements are a result of multiple years of review, negotiation and information provided in connection with the Board’s annual review of the Nuveen funds’ advisory arrangements and oversight of the Nuveen funds. Each Board Member may have attributed different levels of importance to the various factors and information considered in connection with the approval process and may place different emphasis on the relevant information year to year in light of, among other things, changing market and economic conditions. A summary of the principal factors and information, but not all the factors, the Board considered in deciding to renew the Advisory Agreements is set forth below.
277
Annual Investment Management Agreement Approval Process (Unaudited) (continued)
A. Nature, Extent and Quality of Services
In evaluating the renewal of the Advisory Agreements, the Independent Board Members received and considered information regarding the nature, extent and quality of the applicable Fund Adviser’s services provided to the respective Fund with particular focus on the services and enhancements or changes to such services provided during the last year. The Independent Board Members considered the Investment Management Agreements and the Sub-Advisory Agreements separately in the course of their review. With this approach, they considered the respective roles of the Adviser and the Sub-Adviser in providing services to the Funds.
The Board recognized that the Adviser provides a wide array of management, oversight and administrative services to manage and operate the Nuveen funds and that the scope and complexity of these services, along with the undertakings required of the Adviser in connection with providing these services, have expanded over time as a result of, among other things, regulatory, market and other developments. The Board noted the Adviser’s dedication of resources, time, personnel and capital and commitment to continuing to develop improvements and innovations that seek to enhance the Nuveen fund complex and meet the needs of the Nuveen funds in an increasingly complex regulatory environment. The Board received and reviewed information regarding, among other things, the Adviser’s investment oversight responsibilities, regulatory and compliance services, administrative duties and other services.
The Board considered the breadth and the quality of the services the Adviser and its various teams provide in overseeing the investment management of the Nuveen funds, including, among other things, overseeing and reviewing the services provided by the various sub-advisers to the Nuveen funds and their investment teams; evaluating fund performance and market conditions; overseeing operational and investment risks; evaluating investment strategies and recommending any changes thereto; managing liquidity; managing the daily valuation of portfolio securities; overseeing trade execution and securities lending; and setting and managing distributions consistent with the respective fund’s product design. With respect to closed-end funds, such services also include managing leverage; monitoring asset coverage levels for leveraged funds and compliance with rating agency criteria; providing capital management and secondary market services (such as implementing common share shelf offerings, capital return programs and common share repurchases); and maintaining a closed-end fund investor relations program. The Board also reviewed the structure of investment personnel compensation of each Fund Adviser and considered whether the structure provides appropriate incentives to attract and maintain qualified personnel and to act in the best interests of the respective Nuveen fund.
Given the Nuveen funds operate in a highly regulated industry, the Board further considered the extensive compliance, regulatory and administrative services the Adviser and its various teams provide to manage and operate the Nuveen funds. The Board recognized such services included, but were not limited to, managing compliance policies; monitoring compliance with applicable policies, laws and regulations; devising internal compliance programs in seeking to enhance compliance with regulatory requirements and creating a framework to review and assess compliance programs; overseeing sub-adviser compliance testing; preparing compliance training materials; and responding to regulatory requests. The Board reviewed highlights of the various initiatives Nuveen compliance had taken in 2022 including, among other things, additional due diligence of service providers as their operating environments evolve post-Covid to more hybrid in-person working arrangements; investments in supporting and expanding international trading capabilities; continuing efforts to enhance policies and controls to address compliance risks including those related to environmental, social and governance (“ESG”) matters and new regulatory developments or guidance; and establishing and maintaining compliance policies and comprehensive compliance training programs. The Board also considered information regarding the Adviser’s business continuity, disaster recovery and information security programs and the periodic testing and review of such programs.
In addition to the above functions, the Board considered the quality and extent of other non-advisory services the Adviser provides including, among other things, various fund administration services (such as preparing, overseeing or assisting with the preparation of tax and regulatory filings); product management services (such as evaluating and enhancing products and strategies); legal support services; shareholder services and transfer agency function oversight services; and board support and reporting services. With respect to board support services, the Board reviewed a summary of the annual, quarterly, and special reports the Adviser and/or its affiliates provided to the Board throughout 2022.
The Board further acknowledged various initiatives the Adviser had undertaken or continued in 2022 in seeking to improve the effectiveness of its organization, the Nuveen funds product line-up as well as particular Nuveen fund(s) through, among other things, rationalizing the product line and gaining efficiencies through mergers, repositionings and liquidations; launching new funds; reviewing and updating investment policies and benchmarks; reopening certain funds previously closed to new investors; adding or modifying the share classes offered by certain funds; implementing fee waivers and expense cap changes for certain funds and evaluating and adjusting portfolio management teams as appropriate for various funds; and developing policy positions on a broad range of regulatory proposals that may impact the funds and communicating with lawmakers and other regulatory authorities to help ensure these positions are represented.
Aside from the services provided, the Board recognized the financial resources of the Adviser and its affiliates and their willingness to make investments in the technology, personnel and infrastructure to support the Nuveen funds, including maintaining a seed capital budget to support new or existing funds and/or facilitate changes for a respective fund. The Board noted the benefits to shareholders of investing in a fund that is a part of a large fund complex with a variety of investment disciplines, capabilities, expertise and resources available to navigate and support the Nuveen funds including during stressed times. The Board recognized the overall reputation and capabilities of the Adviser and its affiliates, the Adviser’s continuing commitment to provide high quality services, its willingness to implement operational or organizational changes in seeking, among other things, to enhance efficiencies and services to the Nuveen funds and its responsiveness to the Board’s questions and/or concerns raised throughout the year and during the annual review of advisory agreements. The Board also considered the significant risks borne by the Adviser and its affiliates in connection with their services to the Nuveen funds, including entrepreneurial risks in sponsoring new funds and ongoing risks with managing the funds such as investment, operational, reputational, regulatory, compliance and litigation risks.
The Board further considered the division of responsibilities between the Adviser and the Sub-Adviser and recognized that the Sub-Adviser and its investment personnel generally are responsible for the management of each Fund’s portfolio under the oversight of the Adviser and the Board. The Board considered an analysis of the Sub-Adviser provided by the Adviser which included, among other things, the assets under management of the applicable investment team and changes thereto, a summary of the applicable investment team and changes to such team, the investment process
278
and philosophy of the applicable investment team, the performance of the Nuveen funds sub-advised by the Sub-Adviser over various periods of time and a summary of any significant policy and/or other changes to the Nuveen funds sub-advised by the Sub-Adviser. The Board further considered at the May Meeting or prior meetings evaluations of the Sub-Adviser’s compliance programs and trade execution. The Board noted that the Adviser recommended the renewal of the Sub-Advisory Agreements.
Based on its review, the Board determined, in the exercise of its reasonable business judgment, that it was satisfied with the nature, extent and quality of services provided to the respective Funds under each applicable Advisory Agreement.
B. The Investment Performance of the Funds and Fund Advisers
In evaluating the quality of the services provided by the Fund Advisers, the Board also considered a variety of investment performance data of the Nuveen funds prepared specifically for the annual review of the advisory agreements as well as the performance data the Board received throughout the year representing different time periods. In this regard, leading into the May Meeting, the Board reviewed, among other things, Fund performance over the quarter, one-, three- and five-year periods ending December 31, 2022 and March 31, 2023 (or for such shorter periods available to the extent a Fund was not in existence during such periods). In addition, the Board reviewed and discussed performance data at its regularly scheduled quarterly meetings during the year. The Board therefore took into account the performance data, presentations and discussions (written and oral) that have been provided for the annual review as well as in prior meetings over time in evaluating fund performance, including the Adviser’s analysis of a fund’s performance with particular focus on performance outliers (both overperformance and underperformance), the factors contributing to performance (including relative to a fund’s benchmark and peers and the impact of market conditions) and any recommendations or steps that had been taken or were proposed to be taken to address significant performance concerns. In this regard, the Board noted, among other things, that certain Nuveen funds had changes in portfolio managers or other significant changes to their investment strategies or policies since March 2020, and, as a result, the Board reviewed certain tracking performance data comparing the performance of such funds before and after such changes.
The Board recognized that performance data reflects performance over a specified period which may differ significantly depending on the ending dates selected, particularly during periods of market volatility. Further, the Board noted that shareholders may evaluate performance based on their own respective holding periods which may differ from the performance periods reviewed by the Board and lead to differing results.
In its evaluation, the Board reviewed Nuveen fund performance results from different perspectives. In general, subject to certain exceptions, the Board reviewed both absolute and relative fund performance during the annual review over the various time periods and evaluated performance results in light of a fund’s investment objective(s), strategies and risks. With respect to the relative performance, the Board considered fund performance in comparison to the performance of peer funds (the “Performance Peer Group”) and recognized and/or customized benchmarks (i.e., generally benchmarks derived from multiple recognized benchmarks). In reviewing such comparative performance, the Board was cognizant of the inherent limitations of such data which can make meaningful performance comparisons generally difficult. As an illustration, differences in the composition of the Performance Peer Group, the investment objective(s), strategies and other characteristics of the peers in the Performance Peer Group, the level, type and cost of leverage (if any) of the peers, and the varying sizes of peers all may contribute to differences in the performance results of a Performance Peer Group compared to the applicable Nuveen fund. With respect to relative performance of a Nuveen fund compared to a benchmark index, differences, among other things, in the investment objective(s) and strategies of a fund and the benchmark (particularly an actively managed fund that does not directly follow an index) as well as the costs of operating a fund would necessarily contribute to differences in performance results and limit the value of the comparative performance information. To assist the Board in its review of the comparability of the relative performance, the Adviser has ranked the relevancy of the peer group to the Funds as low, medium or high.
The secondary market trading of shares of the Nuveen closed-end funds also continues to be a priority for the Board given its importance to shareholders, and therefore the Board and/or its Closed-end Fund committee reviews certain performance data reflecting, among other things, the premiums and discounts at which the shares of the Nuveen closed-end funds have traded over specified periods throughout the year. In its review, the Board considers, among other things, changes to investment mandates and guidelines, distribution policies, leverage levels and types; share repurchases and similar capital market actions; and effective communications programs to build greater awareness and deepen understanding of closed-end funds. As applicable, the Board considered the impact of leverage on a Nuveen fund’s performance. The Board further acknowledged that performance results should include the distribution yields of funds that seek to provide income as part of their investment objective(s) to shareholders. In this regard, the Board considered that the use of leverage by various funds may have detracted from total return performance of such funds over various periods in current market conditions, but the leverage also was accretive in helping to provide income.
The Board also evaluated Nuveen fund performance in light of various relevant factors which may include, among other things, general market conditions, issuer-specific information, asset class information, leverage and fund cash flows. The Board acknowledged that long-term performance could be impacted by even one period of significant outperformance or underperformance and that a single investment theme could disproportionately affect performance. Further, the Board recognized that the market and economic conditions may significantly impact a fund’s performance, particularly over shorter periods, and such performance may be more reflective of such economic or market events and not necessarily reflective of management skill. Although the Board reviews short-, intermediate- and longer-term performance data, the Board recognized that longer periods of performance may reflect full market cycles.
In relation to recent general market conditions, the Board had recognized the general market volatility and underperformance of the market in 2022 in considering Nuveen fund performance. The Board took into account the Adviser’s assessment of a fund’s performance during the recent period of significant market volatility. In their review from year to year, the Board Members consider and may place different emphasis on the relevant information in light of changing circumstances in market and economic conditions. In evaluating performance, the Board focused particular attention on funds with less favorable performance records. However, depending on the facts and circumstances including any differences between the respective fund and its benchmark and/or Performance Peer Group, the Board may be satisfied with a fund’s performance notwithstanding
279
Annual Investment Management Agreement Approval Process (Unaudited) (continued)
that its performance may be below that of its benchmark and/or peer group for certain periods. With respect to any funds for which the Board has identified performance issues, the Board seeks to monitor such funds closely until performance improves, discusses with the Adviser the reasons for such results, considers whether any steps are necessary or appropriate to address such issues, and reviews the results of any steps undertaken.
The Board’s determinations with respect to each Fund are summarized below.
For Nuveen AMT-Free Municipal Credit Income Fund (the “AMT-Free Municipal Credit Income Fund”), the Board noted that the Fund’s performance was below the performance of its blended benchmark for the one-, three- and five-year periods ended December 31, 2022 and March 31, 2023. Further, although the Fund ranked in the fourth quartile of its Performance Peer Group for the one-year periods ended December 31, 2022 and March 31, 2023, the Fund ranked in the third quartile for the three-year periods and first quartile for the five-year periods ended December 31, 2022 and March 31, 2023. In its review, the Board noted that the Performance Peer Group was classified as low for relevancy. On the basis of the Board’s ongoing review of investment performance and all relevant factors, including the relative market conditions during certain reporting periods, the Fund’s investment objective(s) and management’s discussion of performance, the Board concluded that in light of these factors, the Fund’s performance supported renewal of the Advisory Agreements.
For Nuveen Municipal Credit Income Fund (the “Municipal Credit Income Fund”), the Board noted that although the Fund’s performance was below the performance of its blended benchmark for the one-, three- and five-year periods ended December 31, 2022 and the Fund ranked in the fourth quartile of its Performance Peer Group for the one-year period ended December 31, 2022, the Fund ranked in the second quartile of its Performance Peer Group for the three-year period and first quartile for the five-year period ended December 31, 2022. In addition, although the Fund’s performance was below the performance of its blended benchmark for the one-, three- and five-year periods ended March 31, 2023, the Fund ranked in the third quartile of its Performance Peer Group for the one-year period ended March 31, 2023 and first quartile for the three- and five-year periods ended March 31, 2023. In its review, the Board noted that the Performance Peer Group was classified as low for relevancy. On the basis of the Board’s ongoing review of investment performance and all relevant factors, including the relative market conditions during certain reporting periods, the Fund’s investment objective(s) and management’s discussion of performance, the Board concluded that in light of these factors, the Fund’s performance supported renewal of the Advisory Agreements.
For Nuveen Municipal High Income Opportunity Fund (the “Municipal High Income Opportunity Fund”), the Board noted that the Fund’s performance was below the performance of its benchmark for the one-, three- and five-year periods ended December 31, 2022 and March 31, 2023. The Fund, however, ranked in the third quartile of its Performance Peer Group for the one-year periods, second quartile for the three-year periods and first quartile for the five-year periods ended December 31, 2022 and March 31, 2023. On the basis of the Board’s ongoing review of investment performance and all relevant factors, including the relative market conditions during certain reporting periods, the Fund’s investment objective(s) and management’s discussion of performance, the Board concluded that in light of these factors, the Fund’s performance supported renewal of the Advisory Agreements.
For Nuveen Municipal Credit Opportunities Fund (the “Municipal Credit Opportunities Fund”), the Board noted that although the Fund’s performance was below the performance of its benchmark for the one- and three-year periods ended December 31, 2022, the Fund ranked in the second quartile of its Performance Peer Group for such periods. In addition, although the Fund’s performance was below the performance of its benchmark and the Fund ranked in the fourth quartile of its Performance Peer Group for the one-year period ended March 31, 2023, the Fund outperformed its benchmark and ranked in the first quartile of its Performance Peer Group for the three-year period ended March 31, 2023. On the basis of the Board’s ongoing review of investment performance and all relevant factors, including the relative market conditions during certain reporting periods, the Fund’s investment objective(s) and management’s discussion of performance, the Board concluded that in light of these factors, the Fund’s performance supported renewal of the Advisory Agreements.
For Nuveen Dynamic Municipal Opportunities Fund (the “Dynamic Municipal Opportunities Fund”), the Board noted that the Fund’s performance was below the performance of its benchmark and the Fund ranked in the fourth quartile of its Performance Peer Group for the one-year periods ended December 31, 2022 and March 31, 2023. In its review, the Board noted that the Performance Peer Group was classified as low for relevancy. The Board recognized, however, that the Fund was relatively new with a performance history too limited to make a meaningful assessment of performance, and management deserved additional time to develop a performance record. The Board will continue to monitor the development of the Fund.
C. Fees, Expenses and Profitability
As part of its annual review, the Board generally reviewed, among other things, with respect to the Nuveen closed-end funds, the contractual management fee and actual management fee (i.e., the management fee after taking into consideration fee waivers and/or expense reimbursements, if any) paid by a fund to the Adviser in light of the nature, extent and quality of the services provided. The Board also considered the total operating expense ratio of a fund (after any fee waivers and/or expense reimbursements). More specifically, the Independent Board Members reviewed, among other things, each Nuveen closed-end fund’s actual management fee rate (after fee waivers and/or expense reimbursements, if any) and net total expense ratio in relation to those of a comparable universe of funds (the “Peer Universe”) established by Broadridge. The Independent Board Members reviewed the methodology Broadridge employed to establish its Peer Universe and recognized that differences between the applicable fund and its respective Peer Universe as well as changes to the composition of the Peer Universe from year to year may limit some of the value of the comparative data. The Independent Board Members take these limitations and differences into account when reviewing comparative peer data. The Independent Board Members also considered a fund’s operating expense ratio as it more directly reflected the shareholder’s costs in investing in the respective fund.
280
In their review, the Independent Board Members considered, in particular, each Nuveen fund with a net total expense ratio (excluding investment-related costs of leverage for closed-end funds) of six basis points or higher compared to that of its peer average (each, an “Expense Outlier Fund”), including the Municipal Credit Opportunities Fund and the Dynamic Municipal Opportunities Fund, and an analysis as to the factors contributing to each such fund’s higher relative net total expense ratio. In addition, although the Board reviewed a fund’s total net expenses both including and excluding investment-related expenses (i.e., leverage costs) for certain of the closed-end funds, the Board recognized that leverage expenses will vary across funds and in comparison to peers because of differences in the forms and terms of leverage employed by the respective fund. Accordingly, in reviewing the comparative data between a fund and its peers, the Board generally considered the fund’s net total expense ratio and fees (excluding leverage costs and leveraged assets for the closed-end funds) to be higher if they were over 10 basis points higher, slightly higher if they were 6 to 10 basis points higher, in line if they were within approximately 5 basis points higher than the peer average and below if they were below the peer average of the Peer Universe.
The Independent Board Members also considered, in relevant part, a Nuveen fund’s management fee and net total expense ratio in light of its performance history, including reviewing certain funds identified by the Adviser and/or the Board as having a higher net total expense ratio or management fee compared to their respective peers coupled with experiencing periods of challenged performance and considering the reasons for such comparative positions. In addition, with respect to closed-end funds that utilize leverage, the Independent Board Members recognized that certain assets attributable to a fund’s use of leverage may be included in the amount of assets upon which the advisory fee or sub-advisory fee is calculated. The Independent Board Members acknowledged the fact that a decision to employ leverage or increase a fund’s leverage which has the effect, all other things being equal, of increasing the assets upon which an advisory or sub-advisory fee is based (and, in turn, increasing the Adviser’s and applicable sub-adviser’s management fees), means that the Adviser and applicable sub-adviser may have a conflict of interest in determining whether to use or increase leverage. The Independent Board Members recognized, however, that the Adviser and sub-advisers would seek to manage the potential conflict by recommending to the Board to leverage the applicable fund or increase such leverage when the Adviser and/or sub-adviser, as applicable, has determined that such action would be in the best interests of the respective fund and its common shareholders and by periodically reviewing with the Board the fund’s performance and the impact of the use of leverage on that performance.
In their review of the fee arrangements for the Nuveen funds, the Independent Board Members also considered the management fee schedules, including the complex-wide and fund-level breakpoint schedules, as applicable. The Board noted that across the Nuveen fund complex, the complex-wide fee breakpoints reduced fees by approximately $62.4 million and fund-level breakpoints reduced fees by approximately $76.1 million in 2022.
With respect to the Sub-Adviser, the Board also considered, among other things, the sub-advisory fee schedule paid to the Sub-Adviser in light of the sub-advisory services provided to the respective Fund and comparative data of the fees the Sub-Adviser charges to other clients, if any. In its review, the Board recognized that the compensation paid to the Sub-Adviser is the responsibility of the Adviser, not the Funds.
The Independent Board Members noted that (a) AMT-Free Municipal Credit Income Fund and the Municipal Credit Income Fund each had an actual management fee that was slightly higher than the respective peer average, but a net total expense ratio that was in line with the respective peer average; (b) the Municipal High Income Opportunity Fund had an actual management fee that was in line with the peer average and a net total expense ratio that was below the peer average; and (c) the Municipal Credit Opportunities Fund and the Dynamic Municipal Opportunities Fund each had an actual management fee and a net total expense ratio that were higher than the respective peer averages. With respect to the net total expense ratios of the Municipal Credit Opportunities Fund and the Dynamic Municipal Opportunities Fund, the Independent Board Members noted that the differences in each such Fund’s investment strategy relative to the applicable peer set contributed to the differential and that each such Fund’s net total expense ratio was lower than initially projected prior to the Fund’s launch.
Based on its review of the information provided, the Board determined that each Fund’s management fees (as applicable) to a Fund Adviser were reasonable in light of the nature, extent and quality of services provided to the Fund.
| | 2. | Comparisons with the Fees of Other Clients |
In evaluating the appropriateness of fees, the Board also considered information regarding the fee rates the respective Fund Advisers charged to certain other types of clients and the type of services provided to these other clients. With respect to the municipal Nuveen funds, such other clients may include retail and institutional municipal managed accounts sub-advised by the Sub-Adviser, municipal exchange-traded funds (“ETFs”) sub-advised by the Sub-Adviser that are offered by another fund complex, municipal managed accounts offered by an unaffiliated adviser and certain municipal private limited partnerships offered by Nuveen. The Board reviewed, among other things, the fee range and average fee of municipal retail advisory accounts and municipal institutional accounts, the sub-advisory fee the Sub-Adviser received for serving as sub-adviser to certain municipal ETFs offered outside the Nuveen family and the management fee rates paid by the municipal private limited partnerships operated by Nuveen.
281
Annual Investment Management Agreement Approval Process (Unaudited) (continued)
In considering the comparative fee data, the Board recognized that differences, including but not limited to, the amount, type and level of services provided by the Adviser to the Nuveen funds compared to that provided to other clients as well as differences in investment policies; eligible portfolio assets and the manner of managing such assets; product structure; investor profiles; account sizes; and regulatory requirements contribute to the variations in the fee schedules. The Board acknowledged the wide range of services in addition to investment management that the Adviser had provided to the Nuveen funds compared to other types of clients as well as the increased entrepreneurial, legal and regulatory risks that the Adviser incurs in sponsoring and managing the Nuveen funds. In general, higher fee levels reflect higher levels of service provided by the Adviser, increased investment management complexity, greater product management requirements, and higher levels of business risk or some combination of these factors. The Board further considered that the Sub-Adviser’s fee is essentially for portfolio management services and therefore more comparable to the fees it receives for retail wrap accounts and other external sub-advisory mandates. The Board concluded the varying levels of fees were justified given, among other things, the more extensive services, regulatory requirements and legal liabilities, and the entrepreneurial, legal and regulatory risks incurred in sponsoring and advising a registered investment company compared to that required in advising other types of clients.
| | 3. | Profitability of Fund Advisers |
In their review, the Independent Board Members considered estimated profitability information of Nuveen as a result of its advisory services to the Nuveen funds as well as profitability data of other publicly traded asset management firms. Such profitability information included, among other things, gross and net revenue margins (excluding distribution) of Nuveen Investments, Inc. (“Nuveen Investments”) for services to the Nuveen funds on a pre-tax and after-tax basis for the 2022 and 2021 calendar years as well as the revenues earned (less any expense reimbursements/fee waivers) and expenses incurred by Nuveen Investments for its advisory activities to the Nuveen funds (excluding distribution and certain other expenses) for the 2022 and 2021 calendar years. The Independent Board Members also considered a summary of some of the key factors that impacted Nuveen’s profitability in 2022. In addition, the Board reviewed the revenues, expenses and operating margin (pre- and after-tax) the Adviser derived from its ETF product line for the 2022 and 2021 calendar years.
In developing the profitability data of the Adviser for its advisory services to the Nuveen funds, the Independent Board Members recognized the subjective nature of calculating profitability as the information is not audited and is necessarily dependent on cost allocation methodologies to allocate expenses throughout the complex and among the various advisory products. Given there is no perfect expense allocation methodology and that other reasonable and valid allocation methodologies could be employed and could lead to significantly different results, the Board reviewed, among other things, a description of the cost allocation methodologies employed to develop the financial information, a summary of the history of changes to the methodology over the years from 2010 through 2022, and a historical expense analysis of Nuveen Investments’ revenues, expenses and pre-tax net revenue margins derived from its advisory services to the Nuveen funds (excluding distribution) for the calendar years from 2017 through 2022. The Board had also appointed four Independent Board Members to serve as the Board’s liaisons, with the assistance of independent counsel, to meet with representatives of the Adviser and review the development of the profitability data and to report to the full Board.
In addition, the Board considered certain comparative operating margin data. In this regard, the Board reviewed the operating margins of Nuveen Investments compared to the adjusted operating margins of a peer group of asset management firms with publicly available data and the most comparable assets under management (based on asset size and asset composition) to Nuveen. The Board recognized that the operating margins of the peers were adjusted generally to address that certain services provided by the peers were not provided by Nuveen. The Board also reviewed, among other things, the net revenue margins (pre-tax) of Nuveen Investments on a company-wide basis and the net revenue margins (pre-tax) of Nuveen Investments derived from its services to the Nuveen funds only (including and excluding distribution) compared to the adjusted operating margins of the peer group for each calendar year from 2012 to 2022. Although the total company operating margins of Nuveen Investments were in the bottom half of the peer group range for 2022 and 2021, the Independent Board Members recognized the limitations of the comparative data given that peer data is not generally public and the calculation of profitability is subjective and affected by numerous factors (such as types of funds a peer manages, its business mix, its cost of capital, the numerous assumptions underlying the methodology used to allocate expenses and other factors) that can have a significant impact on the results.
Aside from Nuveen’s profitability, the Board recognized that the Adviser is a subsidiary of Nuveen, LLC, the investment management arm of Teachers Insurance and Annuity Association of America (“TIAA”). Accordingly, the Board also reviewed a balance sheet for TIAA reflecting its assets, liabilities and capital and contingency reserves for the 2022 and 2021 calendar years to consider the financial strength of TIAA. The Board recognized the benefit of an investment adviser and its parent with significant resources, particularly during periods of market volatility. The Board also noted the reinvestments Nuveen, its parent and/or other affiliates made into its business through, among other things, the investment of seed capital in certain Nuveen funds and continued investments in enhancements to technological capabilities.
In addition to Nuveen, the Independent Board Members considered the profitability of the Sub-Adviser from its relationships with the respective Nuveen funds. In this regard, the Independent Board Members reviewed, among other things, the Sub-Adviser’s revenues, expenses and net revenue margins (pre- and after-tax) for its advisory activities to the respective Nuveen funds for the calendar years ended December 31, 2022 and December 31, 2021. The Independent Board Members also reviewed a profitability analysis reflecting the revenues, expenses and revenue margin (pre- and after-tax) by asset type for the Sub-Adviser for the calendar years ending December 31, 2022 and December 31, 2021.
In evaluating the reasonableness of the compensation, the Independent Board Members also considered any other ancillary benefits derived by the respective Fund Adviser from its relationship with the Nuveen funds as discussed in further detail below.
Based on a consideration of all the information provided, the Board noted that Nuveen’s and the Sub-Adviser’s level of profitability was acceptable and not unreasonable in light of the services provided.
282
D. Economies of Scale and Whether Fee Levels Reflect These Economies of Scale
The Board considered whether there have been economies of scale with respect to the management of the Nuveen funds, whether these economies of scale have been appropriately shared with the funds and whether there is potential for realization of further economies of scale. Although the Board recognized that economies of scale are difficult to measure with any precision and certain expenses may not decline with a rise in assets, the Board considered that Nuveen shares the benefits of economies of scale, if any, in a number of ways including through the use of breakpoints in the management fee schedule, fee waivers and/or expense limitations, the pricing of funds at scale at inception and investments in Nuveen’s business which can enhance the services provided to the funds for the fees paid. In this regard, the Board recognized that the management fee of the Adviser is generally comprised of a fund-level component and a complex-level component each with its own breakpoint schedule, subject to certain exceptions. The Board reviewed the fund-level and complex-level fee schedules. With this structure, the Board noted that the complex-level breakpoint schedule is designed to deliver the benefits of economies of scale to shareholders when the eligible assets in the complex pass certain thresholds even if the assets of a particular fund are unchanged or have declined, and the fund-level breakpoint schedules are designed to share economies of scale with shareholders if the particular fund grows. The Board noted, however, that although closed-end funds may make additional share offerings from time to time, the closed-end funds have a more limited ability to increase their assets because the growth of their assets will occur primarily from the appreciation of their investment portfolios.
As noted above, the Independent Board Members also recognized the continued reinvestment in Nuveen’s business to enhance its capabilities and services to the benefit of its various clients. The Board understood that many of these investments in the Nuveen business were not specific to individual Nuveen funds but rather incurred across of a variety of products and services pursuant to which the family of Nuveen funds as a whole may benefit. In addition, the Board also considered that Nuveen has provided, without raising advisory fees to the Nuveen funds, certain additional services, including, but not limited to, services required by new regulations and regulatory interpretations, and this was also a means of sharing economies of scale with the funds and their shareholders.
Based on its review, the Board was satisfied that the current fee arrangements together with the reinvestment in Nuveen’s business appropriately shared any economies of scale with shareholders.
E. Indirect Benefits
The Independent Board Members received and considered information regarding other benefits the respective Fund Adviser or its affiliates may receive as a result of their relationship with the Nuveen funds. The Board acknowledged that an affiliate of the Adviser may receive compensation for serving as a co-manager in the initial public offerings of new Nuveen closed-end funds (if any) and for serving as an underwriter on shelf offerings of existing Nuveen closed-end funds and reviewed the amounts paid for such services, if any, in 2021 and 2022.
In addition, the Independent Board Members noted that the various sub-advisers to the Nuveen funds do not generally benefit from soft dollar arrangements with respect to Nuveen fund portfolio transactions.
Based on its review, the Board concluded that any indirect benefits received by a Fund Adviser as a result of its relationship with the Funds were reasonable in light of the services provided.
F. Other Considerations
The Independent Board Members did not identify any single factor discussed previously as all-important or controlling. The Independent Board Members concluded that the terms of each Advisory Agreement were reasonable, that the respective Fund Adviser’s fees were reasonable in light of the services provided to each Fund and that the Advisory Agreements be renewed for an additional one-year period.
283
Board Members & Officers
(Unaudited)
The management of the Funds, including general supervision of the duties performed for the Funds by the Adviser, is the responsibility of the Board of Trustees of the Funds. None of the trustees who are not “interested” persons of the Funds (referred to herein as “independent board members”) has ever been a director or employee of, or consultant to, Nuveen or its affiliates. The names and business addresses of the trustees and officers of the Funds, their principal occupations and other affiliations during the past five years, the number of portfolios each Trustee oversees and other directorships they hold are set forth below.
| | | | | | | | |
Name, Year of Birth & Address | | Position(s) Held with the Funds | | Year First Elected or Appointed and Term(1) | | Principal Occupation(s) Including other Directorships During Past 5 Years | | Number of Portfolios in Fund Complex Overseen By Board Member |
| | | | |
Independent Trustees: | | | | | | | | |
| | | | | |
Terence J. Toth 1959 333 W. Wacker Drive Chicago, IL 60606 | | Chair and Board Member | | 2008 Class II | | Formerly, a Co-Founding Partner, Promus Capital (investment advisory firm) (2008-2017); formerly, Director, Quality Control Corporation (manufacturing) (2012-2021); Chair of the Board of the Kehrein Center for the Arts (philanthropy) (since 2021); member: Catalyst Schools of Chicago Board (since 2008) and Mather Foundation Board (philanthropy) (since 2012), formerly, Chair of its Investment Committee (2017-2022); formerly, Member, Chicago Fellowship Board (philanthropy) (2005-2016); formerly, Director, Fulcrum IT Services LLC (information technology services firm to government entities) (2010-2019); formerly, Director, LogicMark LLC (health services) (2012-2016); formerly, Director, Legal & General Investment Management America, Inc. (asset management) (2008-2013); formerly, CEO and President, Northern Trust Global Investments (financial services) (2004-2007); Executive Vice President, Quantitative Management & Securities Lending (2000-2004); prior thereto, various positions with Northern Trust Company (financial services) (since 1994); formerly, Member, Northern Trust Mutual Funds Board (2005-2007), Northern Trust Global Investments Board (2004-2007), Northern Trust Japan Board (2004-2007), Northern Trust Securities Inc. Board (2003- 2007) and Northern Trust Hong Kong Board (1997-2004). | | 132 |
| | | | | |
Jack B. Evans 1948 333 W. Wacker Drive Chicago, IL 60606 | | Board Member | | 1999 Class III | | Chairman (since 2019), formerly, President (1996-2019), The Hall-Perrine Foundation, (private philanthropic corporation); Life Trustee of Coe College and the Iowa College Foundation; formerly, Member and President Pro-Tem of the Board of Regents for the State of Iowa University System (2007- 2013); Director and Chairman (2009-2021), United Fire Group, a publicly held company; Director, Public Member, American Board of Orthopaedic Surgery (2015-2020); Director (2000-2004), Alliant Energy; Director (1996-2015), The Gazette Company (media and publishing); Director (1997- 2003), Federal Reserve Bank of Chicago; President and Chief Operating Officer (1972-1995), SCI Financial Group, Inc., (regional financial services firm). | | 132 |
| | | | | |
William C. Hunter 1948 333 W. Wacker Drive Chicago, IL 60606 | | Board Member | | 2003 Class I | | Dean Emeritus, formerly, Dean, Tippie College of Business, University of Iowa (2006-2012); Director of Wellmark, Inc. (since 2009); past Director (2005-2015), and past President (2010- 2014) Beta Gamma Sigma, Inc., The International Business Honor Society; formerly, Director (2004-2018) of Xerox Corporation; formerly, Dean and Distinguished Professor of Finance, School of Business at the University of Connecticut (2003-2006); previously, Senior Vice President and Director of Research at the Federal Reserve Bank of Chicago (1995-2003); formerly, Director (1997-2007), Credit Research Center at Georgetown University. | | 132 |
284
| | | | | | | | |
Name, Year of Birth & Address | | Position(s) Held with the Funds | | Year First Elected or Appointed and Term(1) | | Principal Occupation(s) Including other Directorships During Past 5 Years | | Number of Portfolios in Fund Complex Overseen By Board Member |
| | | | | |
Amy B. R. Lancellotta 1959 333 W. Wacker Drive Chicago, IL 60606 | | Board Member | | 2021 Class II | | Formerly, Managing Director, Independent Directors Council (IDC) (supports the fund independent director community and is part of the Investment Company Institute (ICI), which represents regulated investment companies) (2006-2019); formerly, various positions with ICI (1989-2006); President (since 2023) and Member (since 2020) of the Board of Directors, Jewish Coalition Against Domestic Abuse (JCADA). | | 132 |
| | | | | |
Joanne T. Medero 1954 333 W. Wacker Drive Chicago, IL 60606 | | Board Member | | 2021 Class III | | Formerly, Managing Director, Government Relations and Public Policy (2009-2020) and Senior Advisor to the Vice Chairman (2018-2020), BlackRock, Inc. (global investment management firm); formerly, Managing Director, Global Head of Government Relations and Public Policy, Barclays Group (IBIM) (investment banking, investment management and wealth management businesses) (2006-2009); formerly, Managing Director, Global General Counsel and Corporate Secretary, Barclays Global Investors (global investment management firm) (1996-2006); formerly, Partner, Orrick, Herrington & Sutcliffe LLP (law firm) (1993-1995); formerly, General Counsel, Commodity Futures Trading Commission (government agency overseeing U.S. derivatives markets) (1989-1993); formerly, Deputy Associate Director/Associate Director for Legal and Financial Affairs, Office of Presidential Personnel, The White House (1986-1989); Member of the Board of Directors, Baltic-American Freedom Foundation (seeks to provide opportunities for citizens of the Baltic states to gain education and professional development through exchanges in the U.S.) (since 2019). | | 132 |
| | | | | |
Albin F. Moschner 1952 333 W. Wacker Drive Chicago, IL 60606 | | Board Member | | 2016 Class III | | Founder and Chief Executive Officer, Northcroft Partners, LLC, (management consulting) (since 2012); formerly, Chairman (2019), and Director (2012-2019), USA Technologies, Inc., (provider of solutions and services to facilitate electronic payment transactions); formerly, Director, Wintrust Financial Corporation (1996-2016); previously, held positions at Leap Wireless International, Inc. (consumer wireless services), including Consultant (2011-2012), Chief Operating Officer (2008-2011), and Chief Marketing Officer (2004-2008); formerly, President, Verizon Card Services division of Verizon Communications, Inc. (2000-2003); formerly, President, One Point Services at One Point Communications (telecommunication services) (1999-2000); formerly, Vice Chairman of the Board, Diba, Incorporated (internet technology provider) (1996-1997); formerly, various executive positions (1991-1996) including Chief Executive Officer (1995-1996) of Zenith Electronics Corporation (consumer electronics). | | 132 |
| | | | | |
John K. Nelson 1962 333 W. Wacker Drive Chicago, IL 60606 | | Board Member | | 2013 Class II | | Member of Board of Directors of Core12 LLC. (private firm which develops branding, marketing and communications strategies for clients) (since 2008); served The President’s Council of Fordham University (2010-2019) and previously a Director of the Curran Center for Catholic American Studies (2009-2018); formerly, senior external advisor to the Financial Services practice of Deloitte Consulting LLP. (2012-2014); former Chair of the Board of Trustees of Marian University (2010-2014 as trustee, 2011-2014 as Chair); formerly Chief Executive Officer of ABN AMRO Bank N.V., North America, and Global Head of the Financial Markets Division (2007-2008), with various executive leadership roles in ABN AMRO Bank N.V. between 1996 and 2007. | | 132 |
285
Board Members & Officers (Unaudited) (continued)
| | | | | | | | |
Name, Year of Birth & Address | | Position(s) Held with the Funds | | Year First Elected or Appointed and Term(1) | | Principal Occupation(s) Including other Directorships During Past 5 Years | | Number of Portfolios in Fund Complex Overseen By Board Member |
| | | | | |
Matthew Thornton III 1958 333 W. Wacker Drive Chicago, IL 60606 | | Board Member | | 2020 Class III | | Formerly, Executive Vice President and Chief Operating Officer (2018-2019), FedEx Freight Corporation, a subsidiary of FedEx Corporation (FedEx) (provider of transportation, e-commerce and business services through its portfolio of companies); formerly, Senior Vice President, U.S. Operations (2006-2018), Federal Express Corporation, a subsidiary of FedEx; formerly Member of the Board of Directors (2012-2018), Safe Kids Worldwide® (a non-profit organization dedicated to preventing childhood injuries). Member of the Board of Directors (since 2014), The Sherwin-Williams Company (develops, manufactures, distributes and sells paints, coatings and related products); Director (since 2020), Crown Castle International (provider of communications infrastructure). | | 132 |
| | | | | |
Margaret L. Wolff 1955 333 W. Wacker Drive Chicago, IL 60606 | | Board Member | | 2016 Class I | | Formerly, member of the Board of Directors (2013-2017) of Travelers Insurance Company of Canada and The Dominion of Canada General Insurance Company (each, a part of Travelers Canada, the Canadian operation of The Travelers Companies, Inc.); formerly, Of Counsel, Skadden, Arps, Slate, Meagher & Flom LLP (Mergers & Acquisitions Group) (legal services) (2005- 2014); Member of the Board of Trustees of New York-Presbyterian Hospital (since 2005); Member (since 2004) formerly, Chair (2015- 2022) of the Board of Trustees of The John A. Hartford Foundation (a philanthropy dedicated to improving the care of older adults); formerly, Member (2005-2015) and Vice Chair (2011-2015) of the Board of Trustees of Mt. Holyoke College. | | 132 |
| | | | | |
Robert L. Young 1963 333 W. Wacker Drive Chicago, IL 60606 | | Board Member | | 2017 Class I | | Formerly, Chief Operating Officer and Director, J.P. Morgan Investment Management Inc. (financial services) (2010-2016); formerly, President and Principal Executive Officer (2013-2016), and Senior Vice President and Chief Operating Officer (2005-2010), of J.P. Morgan Funds; formerly, Director and various officer positions for J.P. Morgan Investment Management Inc. (formerly, JPMorgan Funds Management, Inc. and formerly, One Group Administrative Services) and JPMorgan Distribution Services, Inc. (financial services) (formerly, One Group Dealer Services, Inc.) (1999-2017). | | 132 |
| | | | |
Name, Year of Birth & Address | | Position(s) Held
with the Funds | | Year First
Elected or
Appointed(2) | | Principal Occupation(s) Including other Directorships During Past 5 Years | | |
| | | | |
| Officers of the Funds: | | | | | | | | |
| | | | |
David J. Lamb 1963 333 W. Wacker Drive Chicago, IL 60606 | | Chief Administrative Officer | | 2015 | | Managing Director of Nuveen Fund Advisors, LLC (since 2019); Senior Managing Director (since 2021), formerly, Managing Director (2020-2021) of Nuveen Securities, LLC; Senior Managing Director (since 2021), formerly, Managing Director (2017-2021), Senior Vice President of Nuveen (2006-2017). |
| | | | |
Brett E. Black 1972 333 W. Wacker Drive Chicago, IL 60606 | | Vice President and Chief Compliance Officer | | 2022 | | Managing Director, Chief Compliance Officer of Nuveen (since 2022); formerly, Vice President (2014-2022), Chief Compliance Officer and Anti-Money Laundering Compliance Officer (2017-2022), Deputy Chief Compliance Officer (2014-2017) of BMO Funds, Inc. |
286
| | | | | | |
Name, Year of Birth & Address | | Position(s) Held with the Funds | | Year First Elected or Appointed(2) | | Principal Occupation(s) Including other Directorships During Past 5 Years |
| | | | |
Mark J. Czarniecki 1979 901 Marquette Avenue Minneapolis, MN 55402 | | Vice President and Assistant Secretary | | 2013 | | Managing Director (since 2022), formerly, Vice President (2016-2022), and Assistant Secretary (since 2016) of Nuveen Securities, LLC; Managing Director (since 2022), formerly, Vice President (2017-2022) and Assistant Secretary (since 2017) of Nuveen Fund Advisors, LLC; Managing Director and Associate General Counsel (since January 2022), formerly, Vice President and Associate General Counsel of Nuveen (2013-2021); Managing Director (since 2022), formerly, Vice President (2018-2022), Assistant Secretary and Associate General Counsel (since 2018) of Nuveen Asset Management, LLC; Managing Director, Associate General Counsel and Assistant Secretary of Teachers Advisors, LLC and TIAA-CREF Investment Management, LLC (since 2023). |
| | | | |
Diana R. Gonzalez 1978 8500 Andrew Carnegie Blvd. Charlotte, NC 28262 | | Vice President and Assistant Secretary | | 2017 | | Vice President and Assistant Secretary of Nuveen Fund Advisors, LLC (since 2017); Vice President and Associate General Counsel and Assistant Secretary of Nuveen Asset Management, LLC (since 2022); Vice President, Associate General Counsel and Assistant Secretary of Teachers Advisors, LLC and TIAA-CREF Investment Management, LLC (since 2023); Vice President and Associate General Counsel of Nuveen (since 2017); formerly, Associate General Counsel of Jackson National Asset Management (2012-2017). |
| | | | |
Nathaniel T. Jones 1979 333 W. Wacker Drive Chicago, IL 60606 | | Vice President and Treasurer | | 2016 | | Senior Managing Director (since 2021), formerly, Managing Director (2017-2021), Senior Vice President (2016-2017) of Nuveen; Managing Director (since 2015) of Nuveen Fund Advisors, LLC; Chartered Financial Analyst. |
| | | | |
Brian H. Lawrence 1982 8500 Andrew Carnegie Blvd. Charlotte, NC 28262 | | Vice President and Assistant Secretary | | 2023 | | Vice President and Associate General Counsel of Nuveen (since 2023); Vice President, Associate General Counsel and Assistant Secretary (since 2023) of Teachers Advisors, LLC and TIAA-CREF Investment Management, LLC; formerly Corporate Counsel of Franklin Templeton (2018-2022). |
| | | | |
Tina M. Lazar 1961 333 W. Wacker Drive Chicago, IL 60606 | | Vice President | | 2002 | | Managing Director (since 2017), formerly, Senior Vice President (2014-2017) of Nuveen Securities, LLC. |
| | | | |
Brian J. Lockhart 1974 333 W. Wacker Drive Chicago, IL 60606 | | Vice President | | 2019 | | Managing Director (since 2019) of Nuveen Fund Advisors, LLC; Senior Managing Director (since 2021), formerly, Managing Director (2017-2021), Vice President (2010-2017) of Nuveen; Head of Investment Oversight (since 2017), formerly, Team Leader of Manager Oversight (2015-2017); Chartered Financial Analyst and Certified Financial Risk Manager. |
| | | | |
John M. McCann 1975 8500 Andrew Carnegie Blvd. Charlotte, NC 28262 | | Vice President and Assistant Secretary | | 2022 | | Managing Director (since 2021), General Counsel and Secretary (since 2023), formerly, Assistant Secretary (2021-2023), of Nuveen Fund Advisors, LLC; Managing Director, Associate General Counsel and Assistant Secretary of Nuveen Asset Management, LLC (since 2021); Managing Director (since 2021) and Assistant Secretary (since 2016) of TIAA SMA Strategies LLC; Managing Director (since 2019, formerly, Vice President and Director), Associate General Counsel and Assistant Secretary of College Retirement Equities Fund, TIAA Separate Account VA-1, TIAA- CREF Funds and TIAA-CREF Life Funds; Managing Director (since 2018), formerly, Vice President and Director, Associate General Counsel and Assistant Secretary of Teachers Insurance and Annuity Association of America, Teacher Advisors LLC and TIAA-CREF Investment Management, LLC; Managing Director (since 2022), formerly, Vice President (2017-2022), Associate General Counsel and Assistant Secretary (since 2011) of Nuveen Alternative Advisors LLC; General Counsel and Assistant Secretary of Covariance Capital Management, Inc. (2014-2017). |
287
Board Members & Officers (Unaudited) (continued)
| | | | | | |
Name, Year of Birth & Address | | Position(s) Held with the Funds | | Year First Elected or Appointed(2) | | Principal Occupation(s) Including other Directorships During Past 5 Years |
| | | | |
Kevin J. McCarthy 1966 333 W. Wacker Drive Chicago, IL 60606 | | Vice President and Assistant Secretary | | 2007 | | Executive Vice President (since 2022) and Secretary and General Counsel (since 2016) of Nuveen Investments, Inc., formerly, Senior Managing Director (2017- 2022); Executive Vice President (since 2023) and Assistant Secretary (since 2008) of Nuveen Securities, LLC, formerly Senior Managing Director (2017-2023); Executive Vice President and Assistant Secretary (since 2023) of Nuveen Fund Advisors, LLC, formerly, Senior Managing Director (2017-2023), Secretary (2016-2023) and Co- General Counsel (2011-2020); Executive Vice President (since 2023) and Secretary (since 2016) of Nuveen Asset Management, LLC, formerly, Senior Managing Director (2017-2023) and Associate General Counsel (2011-2020); Executive Vice President (since 2021) and Secretary (since 2023) of Teachers Advisors, LLC, formerly, General Counsel and Assistant Secretary (2021-2023); Executive Vice President (since 2017) and Secretary (since 2023) of TIAA-CREF Investment Management, LLC, formerly General Counsel and Assistant Secretary (2017- 2023); formerly, Vice President (2007-2021) and Secretary (2016-2021), of NWQ Investment Management Company, LLC and Santa Barbara Asset Management, LLC; Vice President and Secretary of Winslow Capital Management, LLC (since 2010); Executive Vice President (since 2023) and Secretary (since 2016) of Nuveen Alternative Investments, LLC, formerly Senior Managing Director (2017-2023). |
| | | | |
Jon Scott Meissner 1973 8500 Andrew Carnegie Blvd. Charlotte, NC 28262 | | Vice President and Assistant Secretary | | 2019 | | Managing Director, Mutual Fund Tax and Expense Administration (since 2022), formerly, Managing Director of Mutual Fund Tax and Financial Reporting groups (2017-2022), at Nuveen; Managing Director of Nuveen Fund Advisors, LLC (since 2019); Managing Director (since 2021), formerly, Senior Director (2016-2021), of Teachers Advisors, LLC and TIAA-CREF Investment Management, LLC; Managing Director, Mutual Fund Tax and Expense Administration (since 2022), formerly, Senior Director Mutual Fund Taxation (2015-2022), to the TIAA-CREF Funds, the TIAA-CREF Life Funds, the TIAA Separate Account VA-1 and the CREF Accounts; has held various positions with TIAA since 2004. |
| | | | |
William A. Siffermann 1975 333 W. Wacker Drive Chicago, IL 60606 | | Vice President | | 2017 | | Managing Director (since 2017), formerly Senior Vice President (2016-2017) of Nuveen. |
| | | | |
E. Scott Wickerham 1973 8500 Andrew Carnegie Blvd. Charlotte, NC 28262 | | Vice President and Controller | | 2019 | | Senior Managing Director, Head of Public Investment Finance at Nuveen (since 2019), formerly, Managing Director; Senior Managing Director (since 2019) of Nuveen Fund Advisors, LLC; Senior Managing Director (since 2022) of Nuveen Asset Management, LLC; Senior Managing Director of Teachers Advisors, LLC (since 2021) and TIAA-CREF Investment Management, LLC (since 2016); Principal Financial Officer, Principal Accounting Officer and Treasurer (since 2017) of the TIAA-CREF Funds, the TIAA-CREF Life Funds, the TIAA Separate Account VA-1 and Principal Financial Officer, Principal Accounting Officer (since 2020) and Treasurer (since 2017) of the CREF Accounts; has held various positions with TIAA since 2006. |
| | | | |
Mark L. Winget 1968 333 W. Wacker Drive Chicago, IL 60606 | | Vice President and Secretary | | 2008 | | Vice President and Assistant Secretary of Nuveen Securities, LLC (since 2008), and Nuveen Fund Advisors, LLC (since 2019); Vice President, Associate General Counsel and Assistant Secretary of Teachers Advisors, LLC and TIAA-CREF Investment Management, LLC (since 2023) and Nuveen Asset Management, LLC (since 2020); Vice President (since 2010) and Associate General Counsel (since 2019) of Nuveen. |
| | | | |
Rachael Zufall 1973 8500 Andrew Carnegie Blvd. Charlotte, NC 28262 | | Vice President and Assistant Secretary | | 2022 | | Managing Director and Assistant Secretary (since 2023) of Nuveen Fund Advisors, LLC; Managing Director (since 2017), Associate General Counsel and Assistant Secretary (since 2014) of the CREF Accounts, TIAA Separate Account VA-1, TIAA-CREF Funds and TIAA-CREF Life Funds; Managing Director (since 2017), Associate General Counsel and Assistant Secretary (since 2011) of Teachers Advisors, LLC and TIAA-CREF Investment Management, LLC; Managing Director of Nuveen, LLC and of TIAA (since 2017). |
| (1) | The Board of Trustees is divided into three classes, Class I, Class II, and Class III, with each being elected to serve until the third succeeding annual shareholders’ meeting subsequent to its election or thereafter in each case when its respective successors are duly elected or appointed, except two board members are elected by the holders of Preferred Shares, when applicable, to serve until the next annual shareholders’ meeting subsequent to its election or thereafter in each case when its respective successors are duly elected or appointed. The year first elected or appointed represents the year in which the board member was first elected or appointed to any fund in the Nuveen complex. |
| (2) | Officers serve indefinite terms until their successor has been duly elected and qualified, their death or their resignation or removal. The year first elected or appointed represents the year in which the Officer was first elected or appointed to any fund in the Nuveen Complex. |
288
[This page intentionally left blank.]
[This page intentionally left blank.]
[This page intentionally left blank.]
Nuveen:
Serving Investors for Generations
Since 1898, financial advisors and their clients have relied on Nuveen to provide dependable investment solutions through continued adherence to proven, long-term investing principles. Today, we offer a range of high quality solutions designed to be integral components of a well-diversified core portfolio.
Focused on meeting investor needs.
Nuveen is the investment manager of TIAA. We have grown into one of the world’s premier global asset managers, with specialist knowledge across all major asset classes and particular strength in solutions that provide income for investors and that draw on our expertise in alternatives and responsible investing. Nuveen is driven not only by the independent investment processes across the firm, but also the insights, risk management, analytics and other tools and resources that a truly world-class platform provides. As a global asset manager, our mission is to work in partnership with our clients to create solutions which help them secure their financial future.
Find out how we can help you.
To learn more about how the products and services of Nuveen may be able to help you meet your financial goals, talk to your financial advisor, or call us at (800) 257-8787. Please read the information provided carefully before you invest. Investors should consider the investment objective and policies, risk considerations, charges and expenses of any investment carefully. Where applicable, be sure to obtain a prospectus, which contains this and other relevant information. To obtain a prospectus, please contact your securities representative or Nuveen, 333 W. Wacker Dr., Chicago, IL 60606. Please read the prospectus carefully before you invest or send money.
Learn more about Nuveen Funds at: www.nuveen.com/closed-end-funds
NOT FDIC INSURED MAY LOSE VALUE NO BANK GUARANTEE
| | |
| Nuveen Securities, LLC, member FINRA and SIPC | 333 West Wacker Drive | Chicago, IL 60606 | www.nuveen.com | | EAN-C-1023P 3241319-INV-Y-12/24 |
As of the end of the period covered by this report, the registrant has adopted a code of ethics that applies to the registrant’s principal executive officer, principal financial officer, principal accounting officer or controller, or persons performing similar functions. There were no amendments to or waivers from the Code during the period covered by this report. The registrant has posted the code of ethics on its website at www.nuveen.com/fund-governance. (To view the code, click on Code of Conduct.)
| ITEM 3. | AUDIT COMMITTEE FINANCIAL EXPERT. |
As of the end of the period covered by this report, the registrant’s Board of Directors or Trustees (“Board”) determined that the registrant has at least one “audit committee financial expert” (as defined in Item 3 of Form N-CSR) serving on its Audit Committee. The registrant’s audit committee financial experts are Jack B. Evans, Albin F. Moschner, John K. Nelson and Robert L. Young, who are “independent” for purposes of Item 3 of Form N-CSR.
Mr. Evans was formerly President and Chief Operating Officer of SCI Financial Group, Inc., a full service registered broker-dealer and registered investment adviser (“SCI”). As part of his role as President and Chief Operating Officer, Mr. Evans actively supervised the Chief Financial Officer (the “CFO”) and actively supervised the CFO’s preparation of financial statements and other filings with various regulatory authorities. In such capacity, Mr. Evans was actively involved in the preparation of SCI’s financial statements and the resolution of issues raised in connection therewith. Mr. Evans has also served on the audit committee of various reporting companies. At such companies, Mr. Evans was involved in the oversight of audits, audit plans, and the preparation of financial statements. Mr. Evans also formerly chaired the audit committee of the Federal Reserve Bank of Chicago.
Mr. Moschner is a consultant in the wireless industry and, in July 2012, founded Northcroft Partners, LLC, a management consulting firm that provides operational, management and governance solutions. Prior to founding Northcroft Partners, LLC, Mr. Moschner held various positions at Leap Wireless International, Inc., a provider of wireless services, where he was as a consultant from February 2011 to July 2012, Chief Operating Officer from July 2008 to February 2011, and Chief Marketing Officer from August 2004 to June 2008. Before he joined Leap Wireless International, Inc., Mr. Moschner was President of the Verizon Card Services division of Verizon Communications, Inc. from 2000 to 2003, and President of One Point Services at One Point Communications from 1999 to 2000. Mr. Moschner also served at Zenith Electronics Corporation as Director, President and Chief Executive Officer from 1995 to 1996, and as Director, President and Chief Operating Officer from 1994 to 1995.
Mr. Nelson is on the Board of Directors of Core12, LLC. (since 2008), a private firm which develops branding, marketing, and communications strategies for clients. Mr. Nelson has extensive experience in global banking and markets, having served in several senior executive positions with ABN AMRO Holdings N.V. and its affiliated entities and predecessors, including LaSalle Bank Corporation from 1996 to 2008, ultimately serving as Chief Executive Officer of ABN AMRO N.V. North America. During his tenure at the bank, he also served as Global Head of its Financial Markets Division, which encompassed the bank’s Currency, Commodity, Fixed Income, Emerging Markets, and Derivatives businesses. He was a member of the Foreign Exchange Committee of the Federal Reserve Bank of the United States and during his tenure with ABN AMRO served as the bank’s representative on various committees of The Bank of Canada, European Central Bank, and The Bank of England. Mr. Nelson previously served as a senior, external advisor to the financial services practice of Deloitte Consulting LLP. (2012-2014).
Mr. Young has more than 30 years of experience in the investment management industry. From 1997 to 2017, he held various positions with J.P. Morgan Investment Management Inc. (“J.P. Morgan Investment”) and its affiliates (collectively, “J.P. Morgan”). Most recently, he served as Chief Operating Officer and Director of J.P. Morgan Investment (from 2010 to 2016) and as President and Principal Executive Officer of the J.P. Morgan Funds (from 2013 to 2016). As Chief Operating Officer of J.P. Morgan Investment, Mr. Young led service, administration and business platform support activities for J.P. Morgan’s domestic retail mutual fund and institutional commingled and separate account businesses, and co-led these activities for J.P. Morgan’s global retail and institutional investment management businesses. As President of the J.P. Morgan Funds, Mr. Young interacted with various service providers to these funds, facilitated the relationship between such funds and their boards, and was directly involved in establishing board agendas, addressing regulatory matters, and establishing policies and procedures. Before joining J.P. Morgan, Mr. Young, a former Certified Public Accountant (CPA), was a Senior Manager (Audit) with Deloitte & Touche LLP (formerly, Touche Ross LLP), where he was employed from 1985 to 1996. During his tenure there, he actively participated in creating, and ultimately led, the firm’s midwestern mutual fund practice.
| ITEM 4. | PRINCIPAL ACCOUNTANT FEES AND SERVICES. |
Nuveen Municipal Credit Income Fund
The following tables show the amount of fees that KPMG LLP, the Fund’s auditor, billed to the Fund during the Fund’s last two full fiscal years. For engagements with KPMG LLP the Audit Committee approved in advance all audit services and non-audit services that KPMG LLP provided to the Fund, except for those non-audit services that were subject to the pre-approval exception under Rule 2-01 of Regulation S-X (the “pre-approval exception”). The pre-approval exception for services provided directly to the Fund waives the pre-approval requirement for services other than audit, review or attest services if: (A) the aggregate amount of all such services provided constitutes no more than 5% of the total amount of revenues paid by the Fund to its accountant during the fiscal year in which the services are provided; (B) the Fund did not recognize the services as non-audit services at the time of the engagement; and (C) the services are promptly brought to the Audit Committee’s attention, and the Committee (or its delegate) approves the services before the audit is completed.
The Audit Committee has delegated certain pre-approval responsibilities to its Chair (or, in his absence, any other member of the Audit Committee).
SERVICES THAT THE FUND’S AUDITOR BILLED TO THE FUND
| | | | | | | | | | | | | | | | |
Fiscal Year Ended | | Audit Fees
Billed to Fund 1 | | | Audit-Related Fees
Billed to Fund 2 | | | Tax Fees
Billed to Fund 3 | | | All Other Fees
Billed to Fund 4 | |
October 31, 2023 | | $ | 38,700 | | | $ | 30 | | | $ | 0 | | | $ | 0 | |
| | | | | | | | | | | | | | | | |
| | | | |
Percentage approved pursuant to pre-approval exception | | | 0 | % | | | 0 | % | | | 0 | % | | | 0 | % |
| | | | | | | | | | | | | | | | |
| | | | |
October 31, 2022 | | $ | 31,580 | | | $ | 7,408 | | | $ | 0 | | | $ | 0 | |
| | | | | | | | | | | | | | | | |
| | | | |
Percentage approved pursuant to pre-approval exception | | | 0 | % | | | 0 | % | | | 0 | % | | | 0 | % |
| | | | | | | | | | | | | | | | |
1 “Audit Fees” are the aggregate fees billed for professional services for the audit of the Fund’s annual financial statements and services provided in connection with statutory and regulatory filings or engagements.
2 “Audit Related Fees” are the aggregate fees billed for assurance and related services reasonably related to the performance of the audit or review of financial statements that are not reported under “Audit Fees”. These fees include offerings related to the Fund’s common shares and leverage.
3 “Tax Fees” are the aggregate fees billed for professional services for tax advice, tax compliance, and tax planning. These fees include: all global withholding tax services; excise and state tax reviews; capital gain, tax equalization and taxable basis calculation performed by the principal accountant.
4 “All Other Fees” are the aggregate fees billed for products and services other than “Audit Fees”, “Audit-Related Fees” and “Tax Fees”. These fees represent all “Agreed-Upon Procedures” engagements pertaining to the Fund’s use of leverage.
SERVICES THAT THE FUND’S AUDITOR BILLED TO THE
ADVISER AND AFFILIATED FUND SERVICE PROVIDERS
The following tables show the amount of fees billed by KPMG LLP to Nuveen Fund Advisors, LLC (formerly Nuveen Fund Advisors, Inc.) (the “Adviser”), and any entity controlling, controlled by or under common control with the Adviser that provides ongoing services to the Fund (“Affiliated Fund Service Provider”), for engagements directly related to the Fund’s operations and financial reporting, during the Fund’s last two full fiscal years.
The tables also show the percentage of fees subject to the pre-approval exception. The pre-approval exception for services provided to the Adviser and any Affiliated Fund Service Provider (other than audit, review or attest services) waives the pre-approval requirement if: (A) the aggregate amount of all such services provided constitutes no more than 5% of the total amount of revenues paid to KPMG LLP by the Fund, the Adviser and Affiliated Fund Service Providers during the fiscal year in which the services are provided that would have to be pre-approved by the Audit Committee; (B) the Fund did not recognize the services as non-audit services at the time of the engagement; and (C) the services are promptly brought to the Audit Committee’s attention, and the Committee (or its delegate) approves the services before the Fund’s audit is completed.
| | | | | | | | | | | | |
Fiscal Year Ended | | Audit-Related Fees
Billed to Adviser and
Affiliated Fund
Service Providers | | | Tax Fees
Billed to Adviser and
Affiliated Fund
Service Providers | | | All Other Fees
Billed to Adviser and
Affiliated Fund
Service Providers | |
October 31, 2023 | | $ | 0 | | | $ | 0 | | | $ | 0 | |
| | | | | | | | | | | | |
| | | |
Percentage approved pursuant to pre-approval exception | | | 0 | % | | | 0 | % | | | 0 | % |
| | | | | | | | | | | | |
| | | |
October 31, 2022 | | $ | 0 | | | $ | 0 | | | $ | 0 | |
| | | | | | | | | | | | |
| | | |
Percentage approved pursuant to pre-approval exception | | | 0 | % | | | 0 | % | | | 0 | % |
| | | | | | | | | | | | |
NON-AUDIT SERVICES
The following table shows the amount of fees that KPMG LLP billed during the Fund’s last two full fiscal years for non-audit services. The Audit Committee is required to pre-approve non-audit services that KPMG LLP provides to the Adviser and any Affiliated Fund Services Provider, if the engagement related directly to the Fund’s operations and financial reporting (except for those subject to the pre-approval exception described above). The Audit Committee requested and received information from KPMG LLP about any non-audit services that KPMG LLP rendered during the Fund’s last fiscal year to the Adviser and any Affiliated Fund Service Provider. The Committee considered this information in evaluating KPMG LLP’s independence.
| | | | | | | | | | | | | | | | |
Fiscal Year Ended | | Total Non-Audit Fees
Billed to Fund | | | Total Non-Audit Fees
billed to Adviser and
Affiliated Fund Service
Providers (engagements
related directly to the
operations and financial
reporting of the Fund) | | | Total Non-Audit Fees
billed to Adviser and
Affiliated Fund Service
Providers (all other
engagements) | | | Total | |
October 31, 2023 | | $ | 0 | | | $ | 0 | | | $ | 0 | | | $ | 0 | |
October 31, 2022 | | $ | 0 | | | $ | 0 | | | $ | 0 | | | $ | 0 | |
“Non-Audit Fees billed to Fund” for both fiscal year ends represent “Tax Fees” and “All Other Fees” billed to Fund in their respective amounts from the previous table.
Less than 50 percent of the hours expended on the principal accountant’s engagement to audit the registrant’s financial statements for the most recent fiscal year were attributed to work performed by persons other than the principal accountant’s full-time, permanent employees.
Audit Committee Pre-Approval Policies and Procedures. Generally, the Audit Committee must approve (i) all non-audit services to be performed for the Fund by the Fund’s independent accountants and (ii) all audit and non-audit services to be performed by the Fund’s independent accountants for the Affiliated Fund Service Providers with respect to operations and financial reporting of the Fund. Regarding tax and research projects conducted by the independent accountants for the Fund and Affiliated Fund Service Providers (with respect to operations and financial reports of the Fund) such engagements will be (i) pre-approved by the Audit Committee if they are expected to be for amounts greater than $10,000; (ii) reported to the Audit Committee chair for his verbal approval prior to engagement if they are expected to be for amounts under $10,000 but greater than $5,000; and (iii) reported to the Audit Committee at the next Audit Committee meeting if they are expected to be for an amount under $5,000.
| ITEM 5. | AUDIT COMMITTEE OF LISTED REGISTRANTS. |
The registrant’s Board has a separately designated Audit Committee established in accordance with Section 3(a)(58)(A) of the Securities Exchange Act of 1934, as amended (15 U.S.C. 78c(a) (58)(A)). As of the end of the period covered by this report the members of the audit committee are Jack B. Evans, Albin F. Moschner, John K. Nelson, Chair, Margaret L. Wolff, and Robert L. Young.
| ITEM 6. | SCHEDULE OF INVESTMENTS. |
| a) | | See Portfolio of Investments in Item 1. |
| ITEM 7. | DISCLOSURE OF PROXY VOTING POLICIES AND PROCEDURES FOR CLOSED-END MANAGEMENT INVESTMENT COMPANIES. |
Nuveen Fund Advisors, LLC is the registrant’s investment adviser (referred to herein as the “Adviser”). The Adviser is responsible for the on-going monitoring of the Fund’s investment portfolio, managing the Fund’s business affairs and providing certain clerical, bookkeeping and administrative services. The Adviser has engaged Nuveen Asset Management, LLC (“Sub-Adviser”) as Sub-Adviser to provide discretionary investment advisory services. As part of these services, the Adviser has delegated to the Sub-Adviser the full responsibility for proxy voting on securities held in the registrant’s portfolio and related duties in accordance with the Sub-Adviser’s policies and procedures. The Adviser periodically monitors the Sub-Adviser’s voting to ensure that it is carrying out its duties. The Sub-Adviser’s proxy voting policies and procedures are attached to this filing as an exhibit and incorporated herein by reference.
| ITEM 8. | PORTFOLIO MANAGERS OF CLOSED-END MANAGEMENT INVESTMENT COMPANIES. |
Nuveen Fund Advisors, LLC is the registrant’s investment adviser (also referred to as the “Adviser”). The Adviser is responsible for the selection and on-going monitoring of the Fund’s investment portfolio, managing the Fund’s business affairs and providing certain clerical, bookkeeping and administrative services. The Adviser has engaged Nuveen Asset Management, LLC (“Nuveen Asset Management” or “Sub-Adviser”) as Sub-Adviser to provide discretionary investment advisory services. The following section provides information on the portfolio managers at the Sub-Adviser:
| ITEM 8(a)(1). | PORTFOLIO MANAGER BIOGRAPHIES |
As of the date of filing this report, the following individuals at the Sub-Adviser (the “Portfolio Managers”) have primary responsibility for the day-to-day implementation of the registrant’s investment strategies:
Scott R. Romans, PhD, Managing Director of Nuveen Asset Management, responsible for managing several state-specific, tax-exempt portfolios, including the California Municipal Bond and the New York Municipal Bond strategies. He also serves as portfolio manager for a number of closed-end funds. Before moving to his portfolio management role in 2003, he was a senior research analyst in the firm’s tax-exempt fixed income department, specializing in the education sector. He holds an undergraduate degree from the University of Pennsylvania, an M.S.F. from the Illinois Institute of Technology Stuart School of Business, and an MA and PhD from the University of Chicago.
Kristen M. DeJong, CFA, Managing Director at Nuveen Asset Management, is a portfolio manager responsible for managing taxable municipal fixed income strategies for customized institutional portfolios and closed-end funds. She began her career in the financial services industry in 2005 and joined Nuveen Asset Management in 2008. Prior to her current role, she served as a research associate at Nuveen in the wealth management services area and then as a senior research analyst for Nuveen Asset Management’s municipal fixed income team before assuming portfolio management responsibilities in 2021. She received her B.S. in Business from Miami University. Ms. DeJong holds the Chartered Financial Analyst designation and is a member of the CFA Institute and the CFA Society of Chicago.
| ITEM 8(a)(2). | OTHER ACCOUNTS MANAGED BY PORTFOLIO MANAGERS |
Other Accounts Managed. In addition to managing the registrant, the Portfolio Managers are also primarily responsible for the day-to-day portfolio management of the following accounts:
| | | | | | | | |
Portfolio Manager | | Type of Account
Managed | | Number of
Accounts | | | Assets* |
Scott R. Romans | | Registered Investment Company | | | 17 | | | $11.86 billion |
| | Other Pooled Investment Vehicles | | | 0 | | | $0 |
| | Other Accounts | | | 3 | | | $4.6 million |
Kristen M. DeJong | | Registered Investment Company | | | 20 | | | $13.85 billion |
| | Other Pooled Investment Vehicles | | | 0 | | | $0 |
| | Other Accounts | | | 52 | | | $14.53 billion |
* Assets are as of October 31, 2023. None of the assets in these accounts are subject to an advisory fee based on performance.
POTENTIAL MATERIAL CONFLICTS OF INTEREST
Actual or apparent conflicts of interest may arise when a portfolio manager has day-to-day management responsibilities with respect to more than one account. More specifically, portfolio managers who manage multiple accounts are presented a number of potential conflicts, including, among others, those discussed below.
The management of multiple accounts may result in a portfolio manager devoting unequal time and attention to the management of each account. Nuveen Asset Management seeks to manage such competing interests for the time and attention of portfolio managers by having portfolio managers focus on a particular investment discipline. Most accounts managed by a portfolio manager in a particular investment strategy are managed using the same investment models.
If a portfolio manager identifies a limited investment opportunity which may be suitable for more than one account, an account may not be able to take full advantage of that opportunity due to an allocation of filled purchase or sale orders across all eligible accounts. To deal with these situations, Nuveen Asset Management has adopted procedures for allocating limited opportunities across multiple accounts.
With respect to many of its clients’ accounts, Nuveen Asset Management determines which broker to use to execute transaction orders, consistent with its duty to seek best execution of the transaction. However, with respect to certain other accounts, Nuveen Asset Management may be limited by the client with respect to the selection of brokers or may be instructed to direct trades through a particular broker. In these cases, Nuveen Asset Management may place separate, non-simultaneous, transactions for a Fund and other accounts which may temporarily affect the market price of the security or the execution of the transaction, or both, to the detriment of the Fund or the other accounts.
Some clients are subject to different regulations. As a consequence of this difference in regulatory requirements, some clients may not be permitted to engage in all the investment techniques or transactions or to engage in these transactions to the same extent as the other accounts managed by a portfolio manager. Finally, the appearance of a conflict of interest may arise where Nuveen Asset Management has an incentive, such as a performance-based management fee, which relates to the management of some accounts, with respect to which a portfolio manager has day-to-day management responsibilities.
Conflicts of interest may also arise when the Sub-Adviser invests one or more of its client accounts in different or multiple parts of the same issuer’s capital structure, including investments in public versus private securities, debt versus equity, or senior versus junior/subordinated debt, or otherwise where there are different or inconsistent rights or benefits. Decisions or actions such as investing, trading, proxy voting, exercising, waiving or amending rights or covenants, workout activity, or serving on a board, committee or other involvement in governance may result in conflicts of interest between clients holding different securities or investments. Generally, individual portfolio managers will seek to act in a manner that they believe serves the best interest of the accounts they manage. In cases where a portfolio manager or team faces a conflict among its client accounts, it will seek to act in a manner that it believes best reflects its overall fiduciary duty, which may result in relative advantages or disadvantages for particular accounts.
Nuveen Asset Management has adopted certain compliance procedures which are designed to address these types of conflicts common among investment managers. However, there is no guarantee that such procedures will detect each and every situation in which a conflict arises.
Nuveen Asset Management or its affiliates, including TIAA, sponsor an array of financial products for retirement and other investment goals, and provide services worldwide to a diverse customer base. Accordingly, from time to time, a Fund may be restricted from purchasing or selling securities, or from engaging in other investment activities because of regulatory, legal or contractual restrictions that arise due to another client account’s investments and/or the internal policies of Nuveen Asset Management, TIAA or its affiliates designed to comply with such restrictions. As a result, there may be periods, for example, when Nuveen Asset Management will not initiate or recommend certain types of transactions in certain securities or instruments with respect to which investment limits have been reached.
The investment activities of Nuveen Asset Management or its affiliates may also limit the investment strategies and rights of the Funds. For example, in certain circumstances where the Funds invest in securities issued by companies that operate in certain regulated industries, in certain emerging or international markets, or are subject to corporate or regulatory ownership definitions, or invest in certain futures and derivative transactions, there may be limits on the aggregate amount invested by Nuveen Asset Management or its affiliates for the Funds and other client accounts that may not be exceeded without the grant of a license or other regulatory or corporate consent. If certain aggregate ownership thresholds are reached or certain transactions undertaken, the ability of Nuveen Asset Management, on behalf of the Funds or other client accounts, to purchase or dispose of investments or exercise rights or undertake business transactions may be restricted by regulation or otherwise impaired. As a result, Nuveen Asset Management, on behalf of the Funds or other client accounts, may limit purchases, sell existing investments, or otherwise restrict or limit the exercise of rights (including voting rights) when Nuveen Asset Management, in its sole discretion, deems it appropriate in light of potential regulatory or other restrictions on ownership or other consequences resulting from reaching investment thresholds.
| ITEM 8(a)(3). | FUND MANAGER COMPENSATION |
As of the most recently completed fiscal year end, the primary Portfolio Managers’ compensation is as follows:
Portfolio manager compensation consists primarily of base salary and variable components consisting of (i) a cash bonus; (ii) a long-term performance award; and (iii) participation in a profits interest plan.
Base salary. A portfolio manager’s base salary is determined based upon an analysis of the portfolio manager’s general performance, experience and market levels of base pay for such position.
Cash bonus. A portfolio manager is eligible to receive an annual cash bonus that is based on three variables: risk-adjusted investment performance relative to benchmark generally measured over the most recent one, three and five year periods (unless the portfolio manager’s tenure is shorter), ranking versus Morningstar peer funds generally measured over the most recent one, three and five year periods (unless the portfolio manager’s tenure is shorter), and management and peer reviews.
Long-term performance award. A portfolio manager is eligible to receive a long-term performance award that vests after three years. The amount of the award when granted is based on the same factors used in determining the cash bonus. The value of the award at the completion of the three-year vesting period is adjusted based on the risk-adjusted investment performance of Fund(s) managed by the portfolio manager during the vesting period and the performance of the TIAA organization as a whole.
Profits interest plan. Portfolio managers are eligible to receive profits interests in Nuveen Asset Management and its affiliate, Teachers Advisors, LLC, which vest over time and entitle their holders to a percentage of the firms’ annual profits. Profits interests are allocated to each portfolio manager based on such person’s overall contribution to the firms.
There are generally no differences between the methods used to determine compensation with respect to the Fund and the Other Accounts shown in the table above.
| ITEM 8(a)(4). | OWNERSHIP OF NZF SECURITIES AS OF OCTOBER 31, 2023 |
| | | | | | | | | | | | | | |
Name of Portfolio Manager | | None | | $1-
$10,000 | | $10,001-
$50,000 | | $50,001-
$100,000 | | $100,001-
$500,000 | | $500,001-
$1,000,000 | | Over $1,000,000 |
Scott R. Romans | | X | | | | | | | | | | | | |
Kristen M. DeJong | | X | | | | | | | | | | | | |
| ITEM 9. | PURCHASES OF EQUITY SECURITIES BY CLOSED-END MANAGEMENT INVESTMENT COMPANY AND AFFILIATED PURCHASERS. |
| | | | | | | | | | | | | | | | |
Period* | | (a)
TOTAL NUMBER
OF SHARES
(OR UNITS)
PURCHASED | | | (b)
AVERAGE
PRICE
PAID PER
SHARE
(OR UNIT) | | | (c)
TOTAL NUMBER OF SHARES
(OR UNITS) PURCHASED
AS PART OF PUBLICLY
ANNOUNCED PLANS OR
PROGRAMS | | | (d)*
MAXIMUM NUMBER (OR
APPROXIMATE DOLLAR VALUE) OF
SHARES (OR UNITS) THAT MAY
YET BE PURCHASED UNDER THE
PLANS OR PROGRAMS | |
NOVEMBER 1-30, 2022 | | | 0 | | | | 0.0000 | | | | 0 | | | | 16,535,000 | |
| | | | | | | | | | | | | | | | |
DECEMBER 1-31, 2022 | | | 0 | | | | 0.0000 | | | | 0 | | | | 16,535,000 | |
| | | | | | | | | | | | | | | | |
JANUARY 1-31, 2023 | | | 0 | | | | 0.0000 | | | | 0 | | | | 16,535,000 | |
| | | | | | | | | | | | | | | | |
FEBRUARY 1-28, 2023 | | | 0 | | | | 0.0000 | | | | 0 | | | | 16,535,000 | |
| | | | | | | | | | | | | | | | |
MARCH 1-31, 2023 | | | 0 | | | | 0.0000 | | | | 0 | | | | 16,535,000 | |
| | | | | | | | | | | | | | | | |
APRIL 1-30, 2023 | | | 0 | | | | 0.0000 | | | | 0 | | | | 16,535,000 | |
| | | | | | | | | | | | | | | | |
MAY 1-31, 2023 | | | 0 | | | | 0.0000 | | | | 0 | | | | 16,535,000 | |
| | | | | | | | | | | | | | | | |
JUNE 1-30, 2023 | | | 0 | | | | 0.0000 | | | | 0 | | | | 16,535,000 | |
| | | | | | | | | | | | | | | | |
JULY 1-31, 2023 | | | 0 | | | | 0.0000 | | | | 0 | | | | 16,535,000 | |
| | | | | | | | | | | | | | | | |
AUGUST 1-31, 2023 | | | 0 | | | | 0.0000 | | | | 0 | | | | 16,535,000 | |
| | | | | | | | | | | | | | | | |
SEPTEMBER 1-30, 2023 | | | 20,000 | | | | 10.7213 | | | | 20,000 | | | | 16,515,000 | |
| | | | | | | | | | | | | | | | |
OCTOBER 1-31, 2023 | | | 0 | | | | 0.0000 | | | | 0 | | | | 16,515,000 | |
| | | | | | | | | | | | | | | | |
TOTAL | | | 20,000 | | | | | | | | | | | | | |
| * | | The registrant’s repurchase program, for the repurchase of 16,535,000 shares, was authorized on August 3rd, 2022. The program was reauthorized for a maximum repurchase amount of 16,535,000 shares on February 14th, 2023. Any repurchases made by the registrant pursuant to the program were made through open-market transactions. |
| ITEM 10. | SUBMISSION OF MATTERS TO A VOTE OF SECURITY HOLDERS. |
There have been no material changes to the procedures by which shareholders may recommend nominees to the registrant’s Board implemented after the registrant last provided disclosure in response to this Item.
| ITEM 11. | CONTROLS AND PROCEDURES. |
| (a) | | The registrant’s principal executive and principal financial officers, or persons performing similar functions, have concluded that the registrant’s disclosure controls and procedures (as defined in Rule 30a-3(c) under the Investment Company Act of 1940, as amended (the “1940 Act”) (17 CFR 270.30a-3(c))) are effective, as of a date within 90 days of the filing date of this report that includes the disclosure required by this paragraph, based on their evaluation of the controls and procedures required by Rule 30a-3(b) under the 1940 Act (17 CFR 270.30a-3(b)) and Rules 13a-15(b) or 15d-15(b) under the Securities Exchange Act of 1934, as amended (the “Exchange Act”) (17 CFR 240.13a-15(b) or 240.15d-15(b)). |
| (b) | | There were no changes in the registrant’s internal control over financial reporting (as defined in Rule 30a-3(d) under the 1940 Act (17 CFR 270.30a-3(d)) that occurred during the period covered by this report that has materially affected, or is reasonably likely to materially affect, the registrant’s internal control over financial reporting. |
| ITEM 12. | DISCLOSURE OF SECURITIES LENDING ACTIVITIES FOR CLOSED-END MANAGEMENT INVESTMENT COMPANIES. |
Not applicable.
File the exhibits listed below as part of this Form.
(a)(1) Any code of ethics, or amendment thereto, that is the subject of the disclosure required by Item 2, to the extent that the registrant intends to satisfy the Item 2 requirements through filing of an exhibit: Not applicable because the code is posted on registrant’s website at www.nuveen.com/fund-governance and there were no amendments during the period covered by this report. (To view the code, click on Code of Conduct.)
(a)(2) A separate certification for each principal executive officer and principal financial officer of the registrant as required by Rule 30a-2(a) under the 1940 Act (17 CFR 270.30a-2(a)) in the exact form set forth below: Ex-99.CERT Attached hereto.
(a)(3) Any written solicitation to purchase securities under Rule 23c-1 under the 1940 Act (17 CFR 270.23c-1) sent or given during the period covered by the report by or on behalf of the registrant to 10 or more persons. Not applicable.
(a)(4) Change in the registrant’s independent public accountant. Not applicable.
(b) If the report is filed under Section 13(a) or 15(d) of the Exchange Act, provide the certifications required by Rule 30a-2(b) under the 1940 Act (17 CFR 270.30a-2(b)); Rule 13a-14 (b) or Rule 15d-14(b) under the Exchange Act (17 CFR 240.13a-14(b) or 240.15d-14(b)), and Section 1350 of Chapter 63 of Title 18 of the United States Code (18 U.S.C. 1350) as an exhibit. A certification furnished pursuant to this paragraph will not be deemed “filed” for purposes of Section 18 of the Exchange Act (15 U.S.C. 78r), or otherwise subject to the liability of that section. Such certification will not be deemed to be incorporated by reference into any filing under the Securities Act of 1933 or the Exchange Act, except to the extent that the registrant specifically incorporates it by reference. Ex-99.906 CERT attached hereto.
SIGNATURES
Pursuant to the requirements of the Securities Exchange Act of 1934 and the Investment Company Act of 1940, the registrant has duly caused this report to be signed on its behalf by the undersigned, thereunto duly authorized.
(Registrant) Nuveen Municipal Credit Income Fund
| | |
| By (Signature and Title) | | /s/ David J. Lamb |
| | David J. Lamb |
| | Chief Administrative Officer |
Date: January 5, 2024
Pursuant to the requirements of the Securities Exchange Act of 1934 and the Investment Company Act of 1940, this report has been signed below by the following persons on behalf of the registrant and in the capacities and on the dates indicated.
| | |
| By (Signature and Title) | | /s/ David J. Lamb |
| | David J. Lamb |
| | Chief Administrative Officer |
| | (principal executive officer) |
Date: January 5, 2024
| | |
| By (Signature and Title) | | /s/ E. Scott Wickerham |
| | E. Scott Wickerham |
| | Vice President and Funds Controller |
| | (principal financial officer) |
Date: January 5, 2024