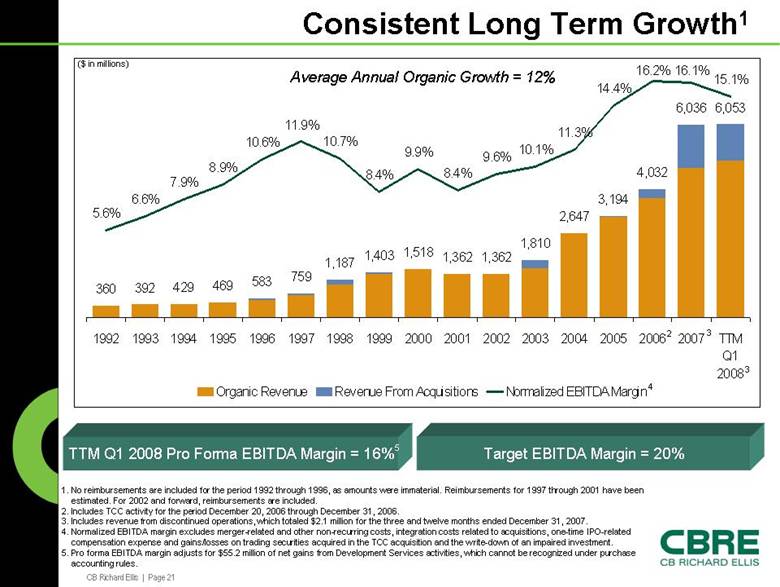
| CB Richard Ellis | Page 21 Consistent Long Term Growth1 5.6% 6.6% 7.9% 8.9% 10.6% 11.9% 10.7% 8.4% 9.9% 8.4% 9.6% 10.1% 11.3% 14.4% 16.2% 16.1% 15.1% 360 392 429 469 583 759 1,187 1,403 1,518 1,362 1,362 1,810 2,647 3,194 4,032 6,036 6,053 1992 1993 1994 1995 1996 1997 1998 1999 2000 2001 2002 2003 2004 2005 2006 2007 TTM Q1 2008 Organic Revenue Revenue From Acquisitions Normalized EBITDA Margin . Average Annual Organic Growth = 12% ($ in millions) TTM Q1 2008 Pro Forma EBITDA Margin = 16% Target EBITDA Margin = 20% 1. No reimbursements are included for the period 1992 through 1996, as amounts were immaterial. Reimbursements for 1997 through 2001 have been estimated. For 2002 and forward, reimbursements are included. 2. Includes TCC activity for the period December 20, 2006 through December 31, 2006. 3. Includes revenue from discontinued operations, which totaled $2.1 million for the three and twelve months ended December 31, 2007. 4. Normalized EBITDA margin excludes merger-related and other non-recurring costs, integration costs related to acquisitions, one-time IPO-related compensation expense and gains/losses on trading securities acquired in the TCC acquisition and the write-down of an impaired investment. 5. Pro forma EBITDA margin adjusts for $55.2 million of net gains from Development Services activities, which cannot be recognized under purchase accounting rules. 2 3 4 5 3 |