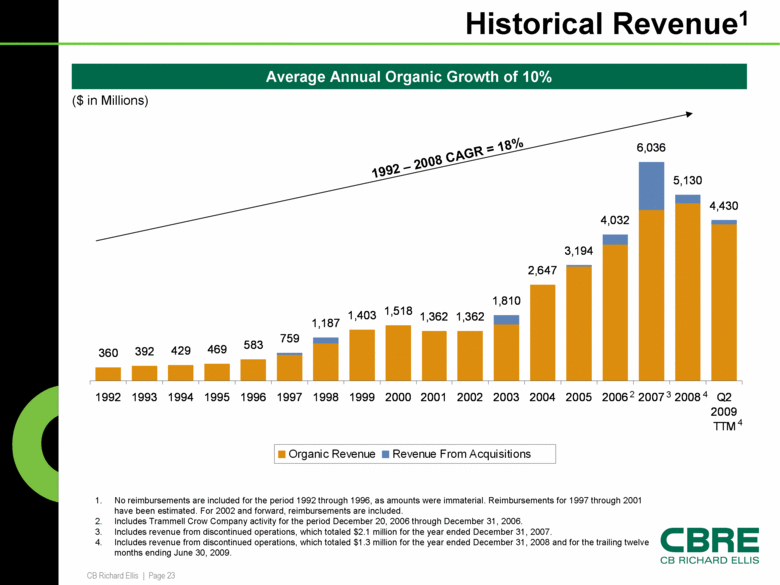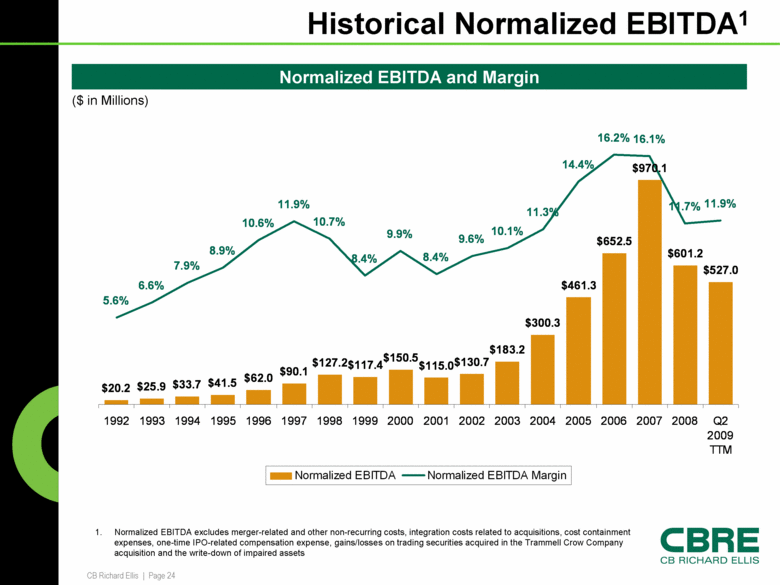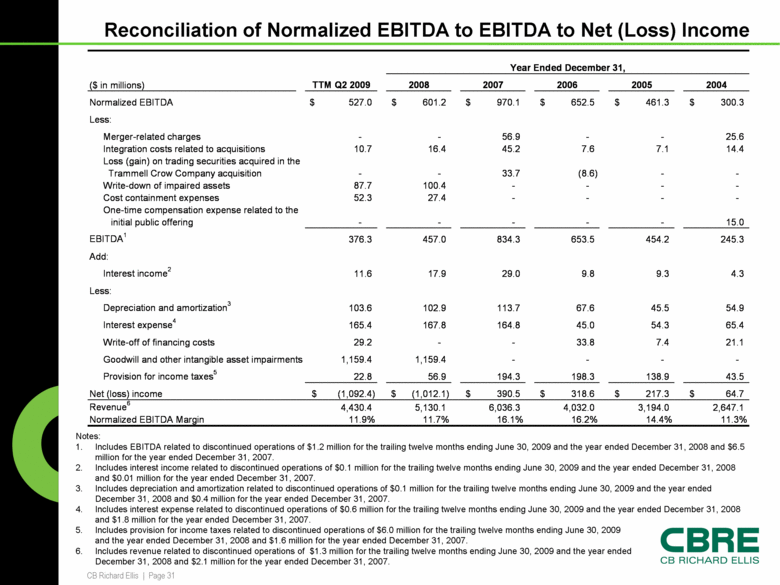
| Reconciliation of Normalized EBITDA to EBITDA to Net (Loss) Income Notes: Includes EBITDA related to discontinued operations of $1.2 million for the trailing twelve months ending June 30, 2009 and the year ended December 31, 2008 and $6.5 million for the year ended December 31, 2007. Includes interest income related to discontinued operations of $0.1 million for the trailing twelve months ending June 30, 2009 and the year ended December 31, 2008 and $0.01 million for the year ended December 31, 2007. Includes depreciation and amortization related to discontinued operations of $0.1 million for the trailing twelve months ending June 30, 2009 and the year ended December 31, 2008 and $0.4 million for the year ended December 31, 2007. Includes interest expense related to discontinued operations of $0.6 million for the trailing twelve months ending June 30, 2009 and the year ended December 31, 2008 and $1.8 million for the year ended December 31, 2007. Includes provision for income taxes related to discontinued operations of $6.0 million for the trailing twelve months ending June 30, 2009 and the year ended December 31, 2008 and $1.6 million for the year ended December 31, 2007. Includes revenue related to discontinued operations of $1.3 million for the trailing twelve months ending June 30, 2009 and the year ended December 31, 2008 and $2.1 million for the year ended December 31, 2007. 11.3% 14.4% 16.2% 16.1% 11.7% 11.9% Normalized EBITDA Margin 2,647.1 3,194.0 4,032.0 6,036.3 5,130.1 4,430.4 Revenue6 $ 64.7 $ 217.3 $ 318.6 $ 390.5 $ (1,012.1) $ (1,092.4) Net (loss) income 43.5 138.9 198.3 194.3 56.9 22.8 Provision for income taxes5 - - - - 1,159.4 1,159.4 Goodwill and other intangible asset impairments 21.1 7.4 33.8 - - 29.2 Write-off of financing costs 65.4 54.3 45.0 164.8 167.8 165.4 Interest expense4 54.9 45.5 67.6 113.7 102.9 103.6 Depreciation and amortization3 Less: 4.3 9.3 9.8 29.0 17.9 11.6 Interest income2 Add: 245.3 454.2 653.5 834.3 457.0 376.3 EBITDA1 15.0 - - - - - initial public offering One-time compensation expense related to the - - - - 27.4 52.3 Cost containment expenses - - - - 100.4 87.7 Write-down of impaired assets - - (8.6) 33.7 - - Trammell Crow Company acquisition Loss (gain) on trading securities acquired in the 14.4 7.1 7.6 45.2 16.4 10.7 Integration costs related to acquisitions 25.6 - - 56.9 - - Merger-related charges Less: $ 300.3 $ 461.3 $ 652.5 $ 970.1 $ 601.2 $ 527.0 Normalized EBITDA 2004 2005 2006 2007 2008 TTM Q2 2009 ($ in millions) Year Ended December 31, |