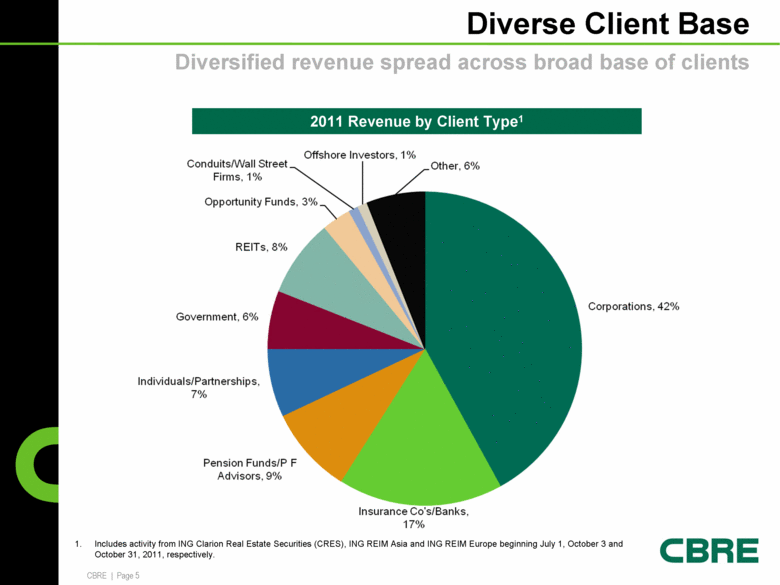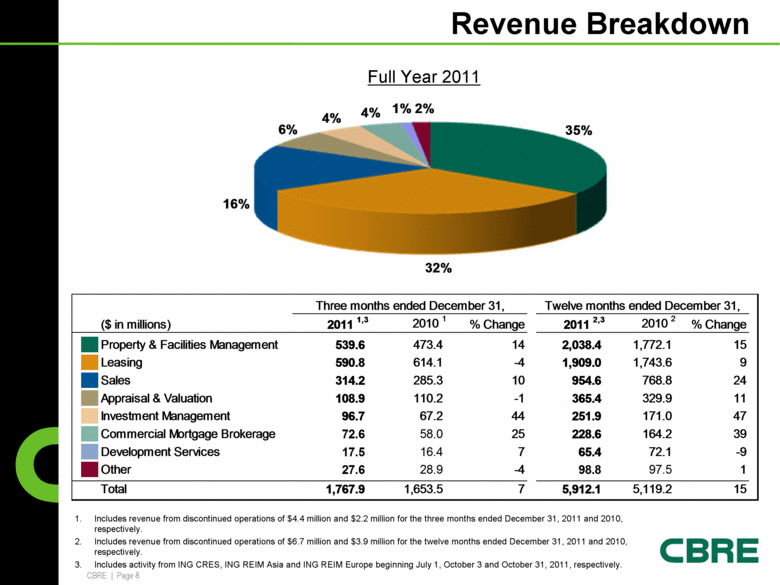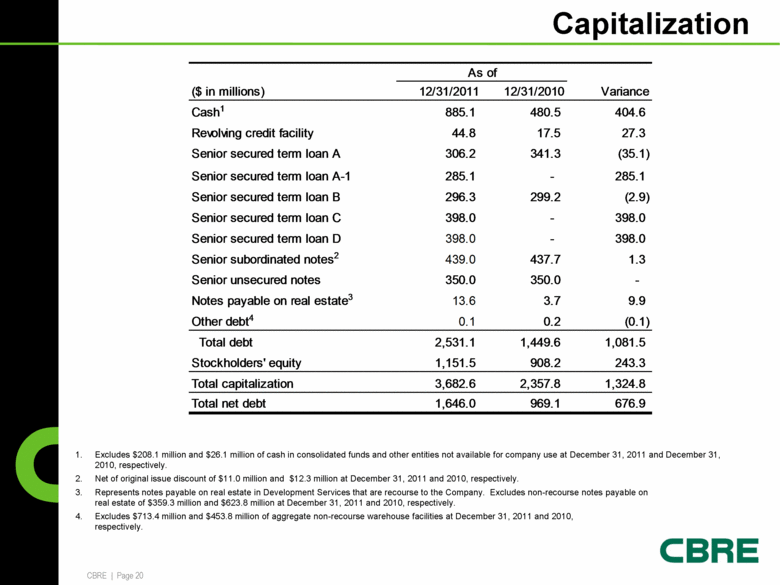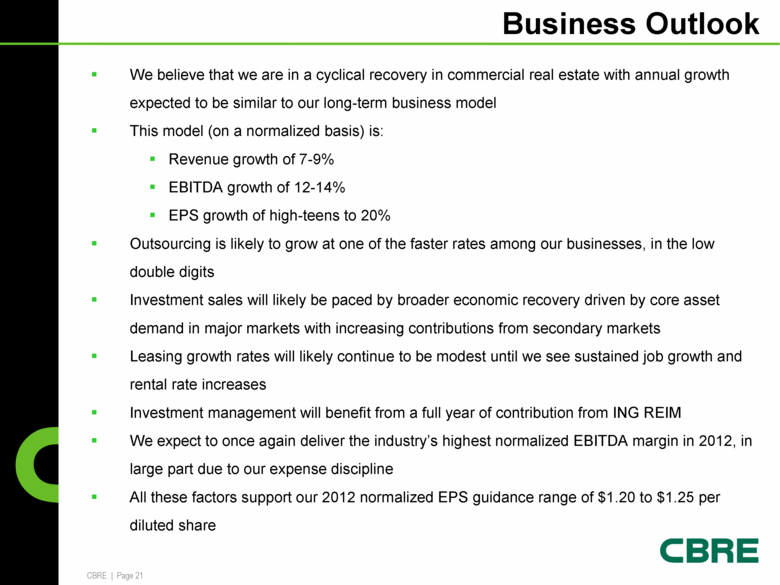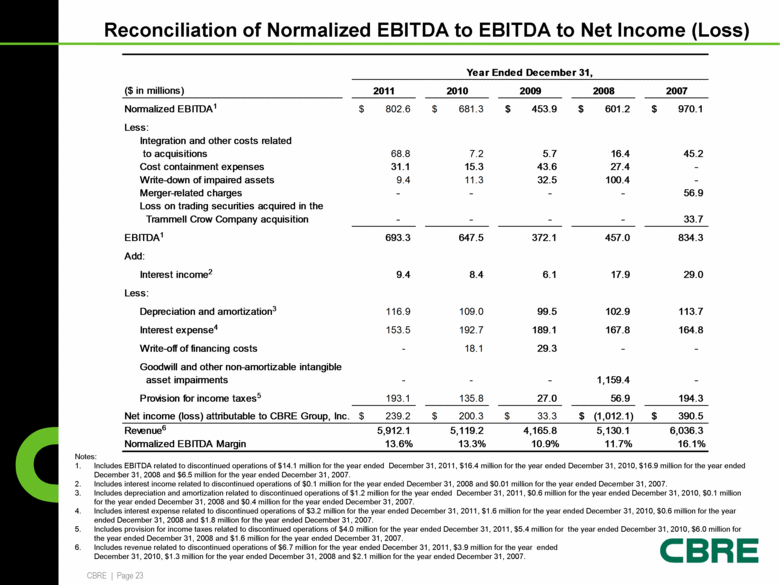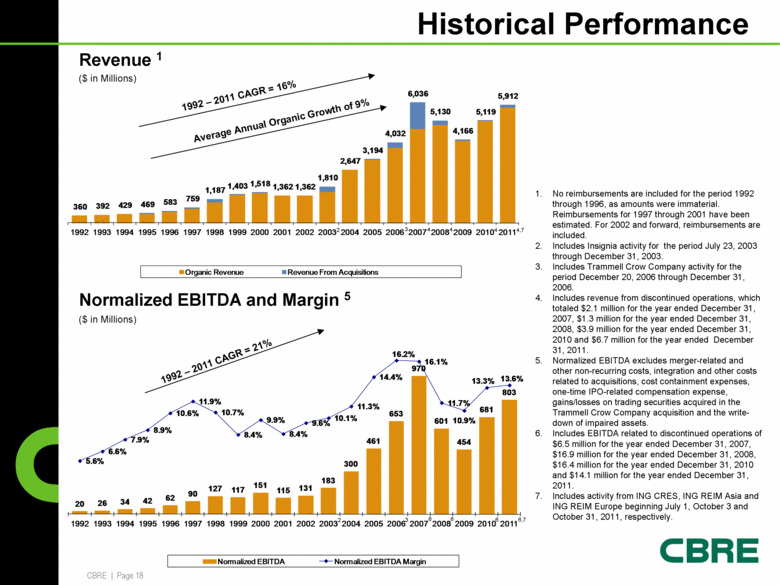
| ($ in Millions) No reimbursements are included for the period 1992 through 1996, as amounts were immaterial. Reimbursements for 1997 through 2001 have been estimated. For 2002 and forward, reimbursements are included. Includes Insignia activity for the period July 23, 2003 through December 31, 2003. Includes Trammell Crow Company activity for the period December 20, 2006 through December 31, 2006. Includes revenue from discontinued operations, which totaled $2.1 million for the year ended December 31, 2007, $1.3 million for the year ended December 31, 2008, $3.9 million for the year ended December 31, 2010 and $6.7 million for the year ended December 31, 2011. Normalized EBITDA excludes merger-related and other non-recurring costs, integration and other costs related to acquisitions, cost containment expenses, one-time IPO-related compensation expense, gains/losses on trading securities acquired in the Trammell Crow Company acquisition and the write-down of impaired assets. Includes EBITDA related to discontinued operations of $6.5 million for the year ended December 31, 2007, $16.9 million for the year ended December 31, 2008, $16.4 million for the year ended December 31, 2010 and $14.1 million for the year ended December 31, 2011. Includes activity from ING CRES, ING REIM Asia and ING REIM Europe beginning July 1, October 3 and October 31, 2011, respectively. ($ in Millions) 1992 – 2011 CAGR = 16% Average Annual Organic Growth of 9% Revenue 1 Normalized EBITDA and Margin 5 1992 – 2011 CAGR = 21% Historical Performance 6 6 6 4 4 4 3 3 4,7 6,7 2 2 360 392 429 469 583 759 1,187 1,403 1,518 1,362 1,362 1,810 2,647 3,194 4,032 6,036 5,130 4,166 5,119 5,912 1992 1993 1994 1995 1996 1997 1998 1999 2000 2001 2002 2003 2004 2005 2006 2007 2008 2009 2010 2011 Organic Revenue Revenue From Acquisitions 20 26 34 42 62 90 127 117 151 115 131 183 300 461 653 970 601 454 681 803 5.6% 6.6% 7.9% 8.9% 10.6% 11.9% 10.7% 8.4% 9.9% 8.4% 9.6% 10.1% 11.3% 14.4% 16.2% 16.1% 11.7% 10.9% 13.3% 13.6% 1992 1993 1994 1995 1996 1997 1998 1999 2000 2001 2002 2003 2004 2005 2006 2007 2008 2009 2010 2011 Normalized EBITDA Normalized EBITDA Margin |
