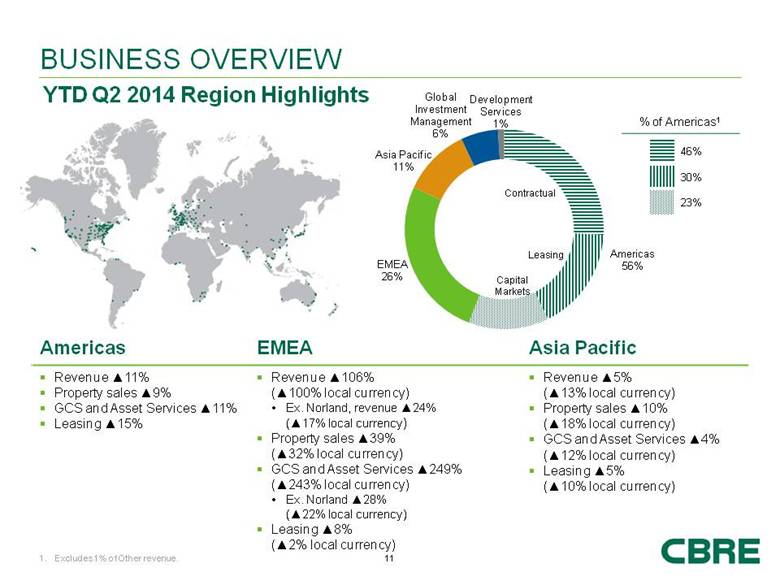
| FOOTNOTES Slide 10 Normalized EBITDA excludes merger-related and other non-recurring charges, gains/losses on trading securities acquired in the Trammell Crow Company acquisition, cost containment expenses, one-time IPO-related compensation expense, integration and other costs related to acquisitions, certain carried interest expense to better match with carried interest revenue realization and the write-down of impaired assets. Includes Insignia activity for the period July 23, 2003 through December 31, 2003. Includes Trammell Crow Company activity for the period December 20, 2006 through December 31, 2006. See discontinued operations discussion on slide 27. Includes CRES, ING REIM Asia and ING REIM Europe beginning July 1, October 3 and October 31, 2011, respectively. Includes Norland Managed Services beginning January 1, 2014. Slide 8 Includes Trammell Crow Company for the period December 20, 2006 through December 31, 2006. Other includes Development Services (1% in both 2006 and TTM Q2 2014) and Other (1% in both 2006 and TTM Q2 2014). Capital Markets includes Sales (31% in 2006 and 17% in TTM Q2 2014) and Commercial Mortgage Services (3% in 2006 and 4% TTM Q2 2014). Contractual Revenues include GCS and Asset Services (14% in 2006 and 38% in TTM Q2 2014; excludes associated sales and lease revenues, most of which are contractual), Global Investment Management (6% in 2006 and 7% in TTM Q2 2014), and Appraisal & Valuation (7% in 2006 and 5% in TTM Q2 2014). See discontinued operations discussion on slide 27. Slide 14 Excludes global securities business. As of June 30, 2014. Includes CRES, ING REIM Asia and ING REIM Europe beginning July 1, October 3 and October 31, 2011, respectively. Slide 20 We have not reconciled the non-GAAP EPS guidance to the most directly comparable GAAP measure because this cannot be done without unreasonable effort. Slide 19 As of December 31 for each year presented. In Process figures include Long-Term Operating Assets (LTOA) of $0.3 billion for Q2 14, $0.9 billion for Q4 13, $1.2 billion for Q4 12 and $1.5 billion for Q4 11. LTOA are projects that have achieved a stabilized level of occupancy or have been held 18-24 months following shell completion or acquisition. Pipeline deals are those projects we are pursuing which we believe have a greater than 50% chance of closing or where land has been acquired and the projected construction start is more than twelve months out. Slide 7 Excludes deal costs, deferred consideration and / or earnouts. As of July 31, 2014 we have paid $40 million of deferred consideration for Norland. Acquisition also includes 362,916 shares of common stock issued to Norland senior management, the value of which is not included in this figure. For fiscal year ended April 5, 2013. Excludes deal costs, deferred consideration and / or earnouts. Annual revenue approximations are based on revenues at the time of purchase. |