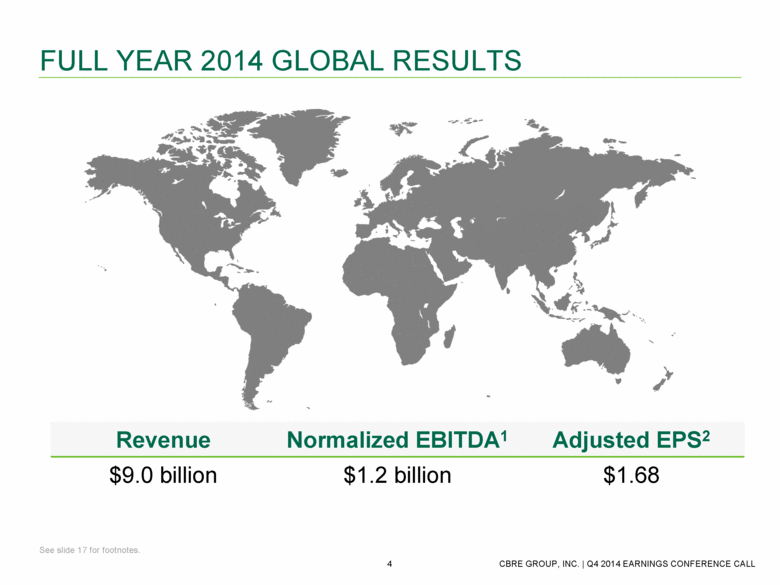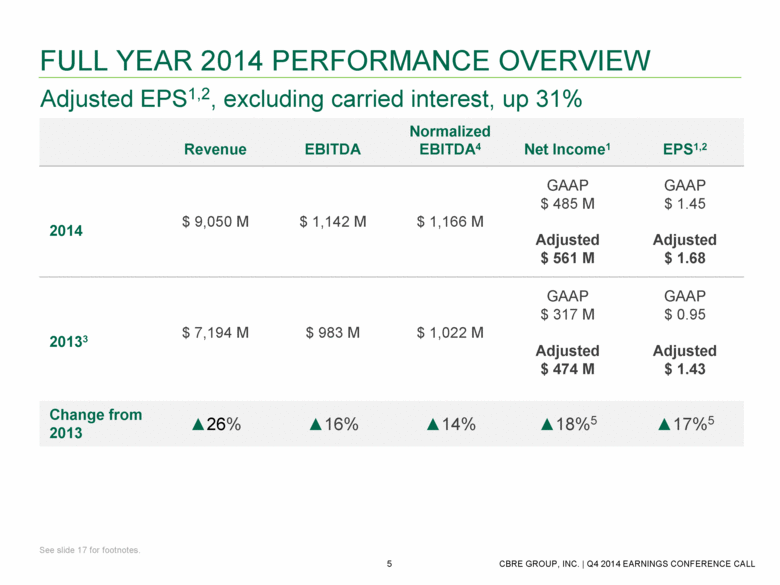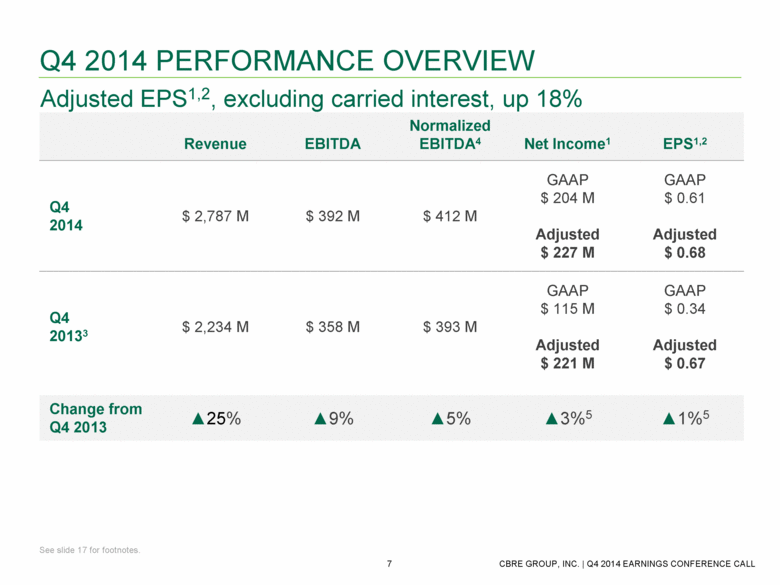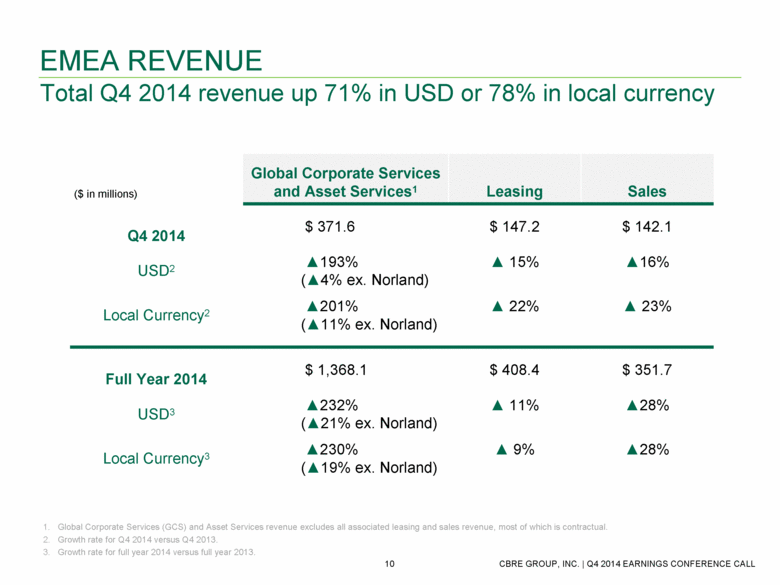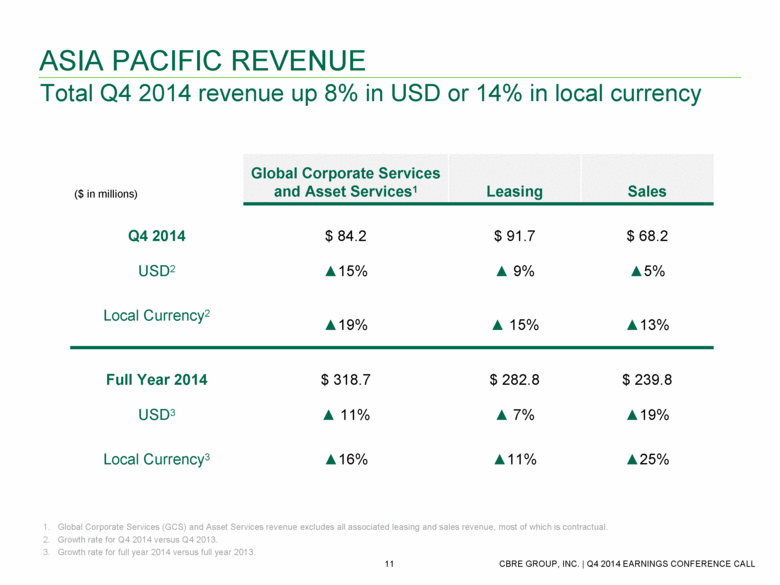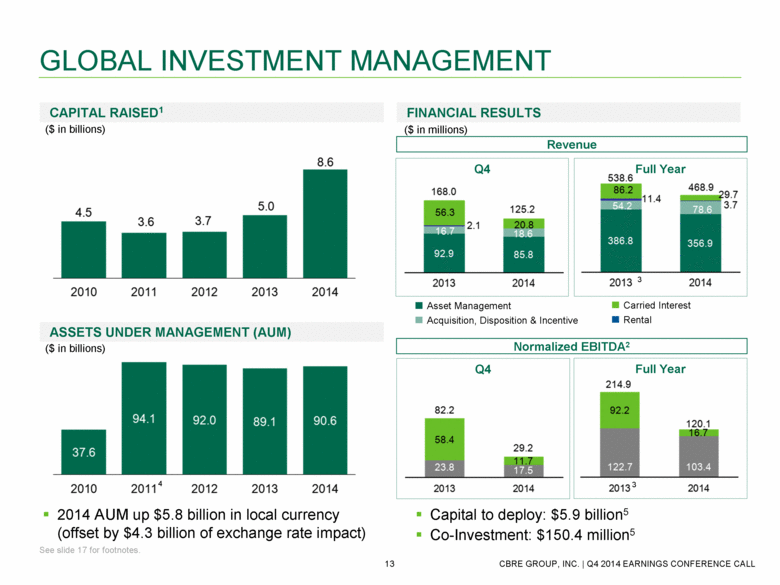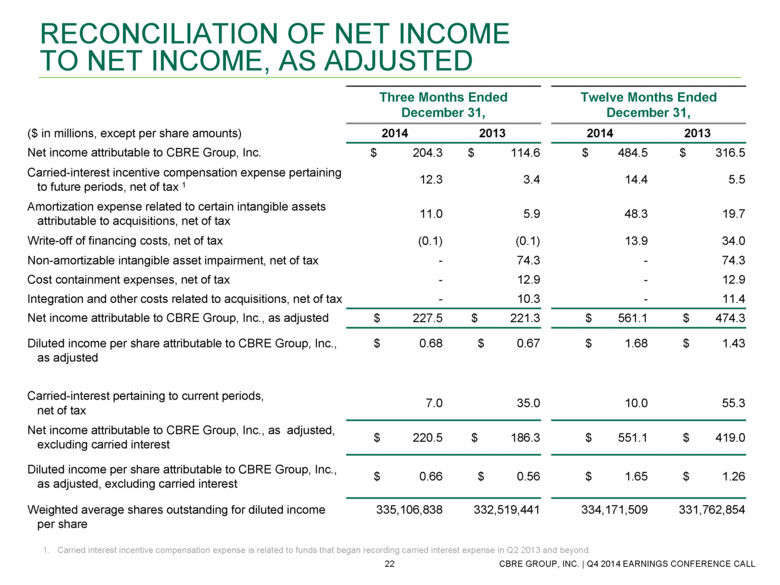
| Three Months Ended December 31, Twelve Months Ended December 31, ($ in millions, except per share amounts) 2014 2013 2014 2013 Net income attributable to CBRE Group, Inc. $ 204.3 $ 114.6 $ 484.5 $ 316.5 Carried-interest incentive compensation expense pertaining to future periods, net of tax 1 12.3 3.4 14.4 5.5 Amortization expense related to certain intangible assets attributable to acquisitions, net of tax 11.0 5.9 48.3 19.7 Write-off of financing costs, net of tax (0.1) (0.1) 13.9 34.0 Non-amortizable intangible asset impairment, net of tax - 74.3 - 74.3 Cost containment expenses, net of tax - 12.9 - 12.9 Integration and other costs related to acquisitions, net of tax - 10.3 - 11.4 Net income attributable to CBRE Group, Inc., as adjusted $ 227.5 $ 221.3 $ 561.1 $ 474.3 Diluted income per share attributable to CBRE Group, Inc., as adjusted $ 0.68 $ 0.67 $ 1.68 $ 1.43 Carried-interest pertaining to current periods, net of tax 7.0 35.0 10.0 55.3 Net income attributable to CBRE Group, Inc., as adjusted, excluding carried interest $ 220.5 $ 186.3 $ 551.1 $ 419.0 Diluted income per share attributable to CBRE Group, Inc., as adjusted, excluding carried interest $ 0.66 $ 0.56 $ 1.65 $ 1.26 Weighted average shares outstanding for diluted income per share 335,106,838 332,519,441 334,171,509 331,762,854 Carried interest incentive compensation expense is related to funds that began recording carried interest expense in Q2 2013 and beyond. RECONCILIATION OF NET INCOME TO NET INCOME, AS ADJUSTED |

