2010 UBS Global Life Sciences Conference New York, NY September 2010 Tina Nova, Ph.D. President & CEO Sam Riccitelli EVP & COO Exhibit 99.1 |
2 Safe Harbor Statement Forward-looking statements contained in this presentation involve known and unknown risks, uncertainties and other factors that may cause our actual results, performance or achievements to be materially different from any future results, performance or achievements expressed or implied by the forward looking statements. They are subject to significant business, economic and competitive risks and uncertainties. Forward-looking statements reflect our current views with respect to future events and are based on our current assumptions and beliefs and subject to risks and uncertainties. The Company disclaims any obligation to publicly update or revise any forward-looking information or statements except as required by law. Factors that could cause our actual results to differ materially from those expressed or implied in such forward looking statements include, but are not limited to, those identified under the heading “Risk Factors” in the Company’s Annual Report on Form 10-K for the year ended December 31, 2009 and most recent Quarterly Report on Form 10-Q filed with the Securities and Exchange Commission. |
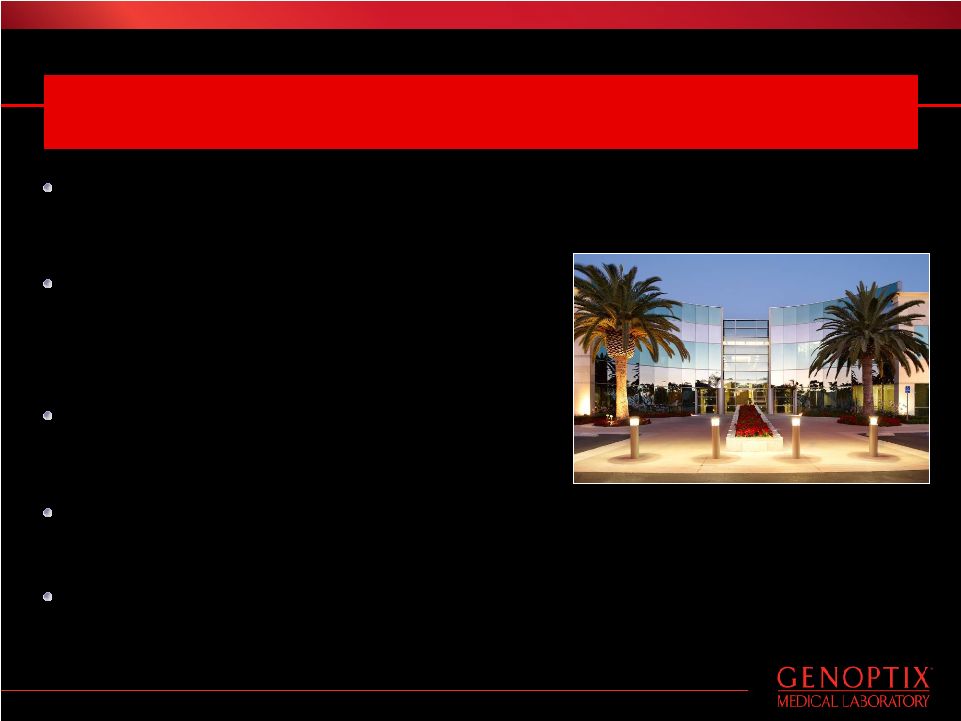
3 Genoptix At-A-Glance Nasdaq Global Select, S&P Small Cap 600 Index, Russell 2000 ® Index Specialized, differentiated laboratory service provider profitable with positive cash flows since 2007 Addressing unmet diagnostic needs in hematology and oncology Addressing unmet needs in predictive therapeutics for solid tumor cancers Established center of excellence for hematomalignancy testing with one of largest specialized physician groups in the U.S. Delivering Personalized And Comprehensive Diagnostic Services To Community-Based Hematologists And Oncologists Located in North County San Diego: Approximately 200,000 total sq. ft. in four facilities, corporate headquarters and diagnostic laboratories |
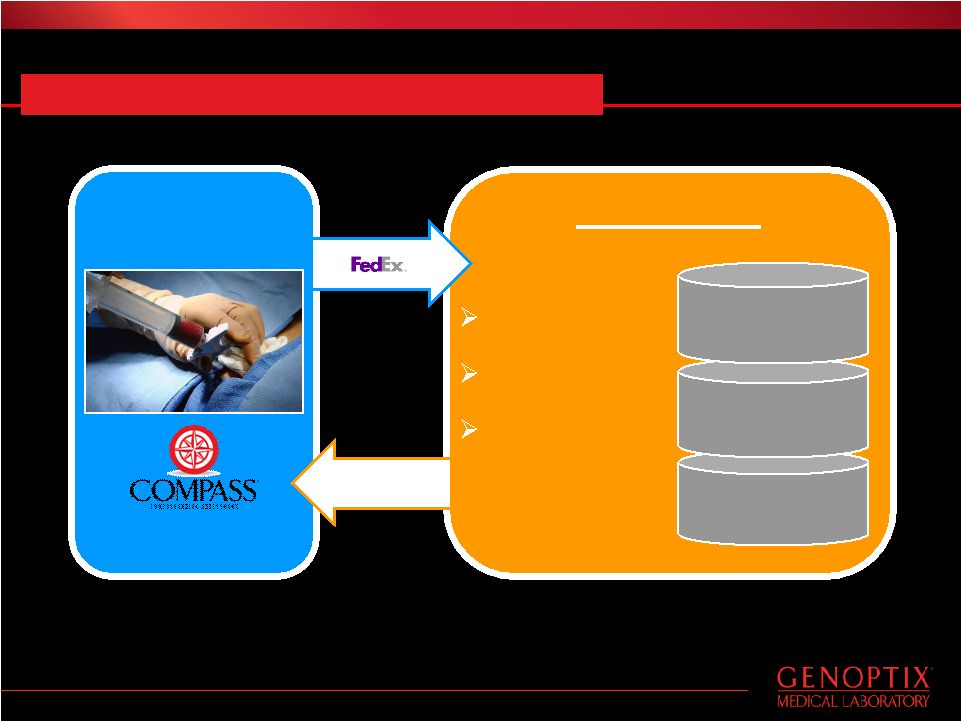
4 Genoptix One Patient One Hempath One Diagnosis PCR Cytogenetics/FISH Flow & Morphology The Genoptix Way Comprehensive And Integrated Diagnosis Community Hem/Onc Office * Final diagnosis * Treatment begins Hempath Consultation |
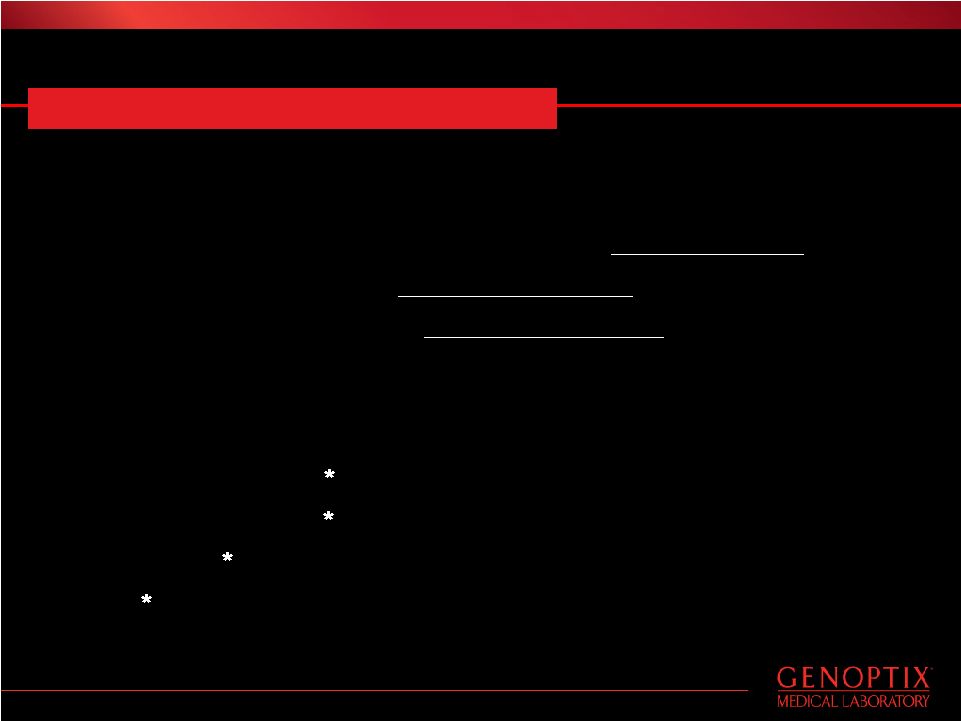
5 Inadequacies of Traditional Testing Results from 409 leukemia cases referred to MDACC: 27% of cases were overturned due to a wrong diagnosis 18% of cases required a change in treatment and/or prognosis 9% of cases required a repeat bone-marrow and re-test Impact on patients and increase in costs: Repeat bone marrow testing Inappropriate drug treatment Potential hospitalization and poorer outcomes Potential precipitation or exacerbation of co-morbid disease MD Anderson Cancer Center Study * MD Anderson Cancer Center Study (MDACC). Dr David C. Hohn, MD, Past Chairman of the Board of Directors of NCCN. 2008 National Comprehensive Cancer Network (NCCN) Case Management Program |
6 GXDX Business Update 3Q10 case volumes and revenues expected to be 5-10% below prior quarter (2Q10) Economics continue to drive change in patient profile and trends in physician practice management Increasing competitive activity leading to market saturation, slowing rate of new customer acquisition Number of actively ordering hem/onc customers stable at 1300-1350 New laboratory open and operational in July 2010, customer service center in 4Q10 Proprietary product in development with pilot launch by year-end Additional major payor contract expected by end of the year Acquiring patient data on clinical outcomes to support efficacy of GXDX model – update by year-end Maintaining goal to capture 15 - 20% market share by 2015 Revenue Trends Reflecting Change In Dynamics |
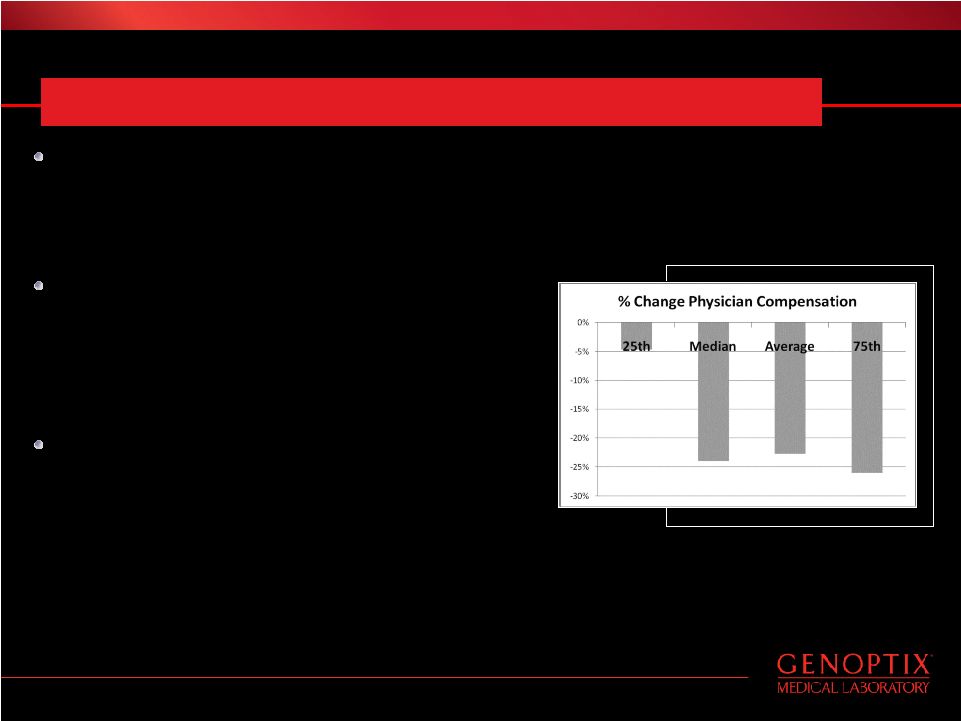
7 Oncology Practice Management Issues Changing patient profile – Number of uninsured at all time high – High deductible plans and increased cost of coinsurance reducing patient utilization of physician services (2) Physicians experimenting with new business models – Selling to hospital or management companies (3) – Creative revenue sharing between labs & hem/oncs – Bringing lab work in-house – Implementation of EMR by 2014 (1) Margot J. Fromer. “Community Cancer Centers Weather Rough Economy.” CancerNetwork.com. April 14, 2010. (2) “Behind The Numbers: Medical Cost Trends For 2011.” PricewaterhouseCoppers Health Research Institute. June, 2010. (3) “Community Oncology Center Care Practice Impact Report.” Community Oncology Alliance. July 19, 2010. Practices getting “squeezed” as community oncologists are forced to manage margins – 52% of community oncologists surveyed are seeing a decrease in patient volumes (1) Hematopathology Testing Market Is Stable But In Transition |
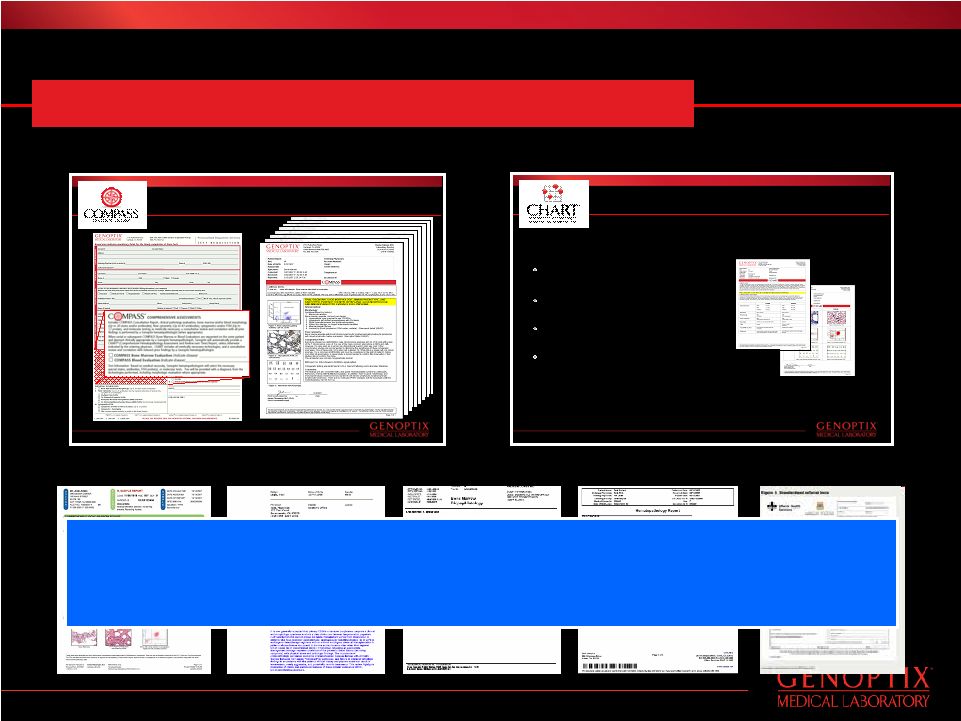
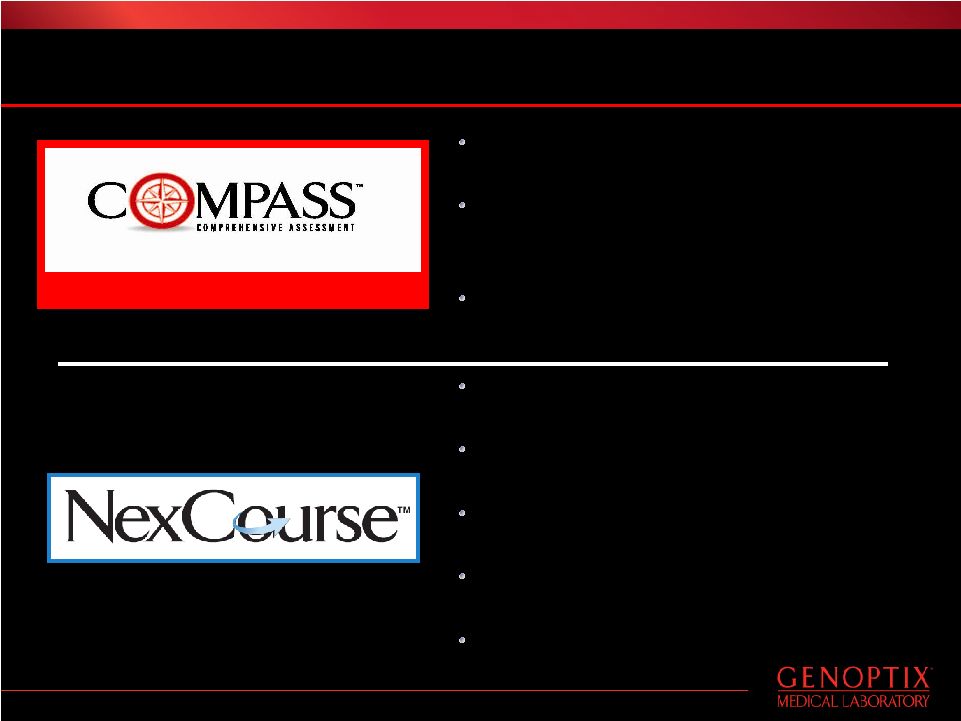
8 COMPASS & CHART: The Transformation of Hematomalignancy DX 10 Convenient Order Process & Clear, Concise, Actionable Report 11 Complementary Service Offering Drives Customer Loyalty Combines multiple COMPASS reports Extends our personalized medicine/service model Integrates intervening clinical actions Provides a complete clinical picture Provides hem/onc with valuable, specialized diagnostic tool to track individual patient’s response to treatment Mapping Patient Disease Progression Over Time Emulating Quality Model With Superficial Imitation • “Me, too” approach based on appearances not business model • We will continue to drive differentiation with quality service offerings and new, innovative diagnostic processes |
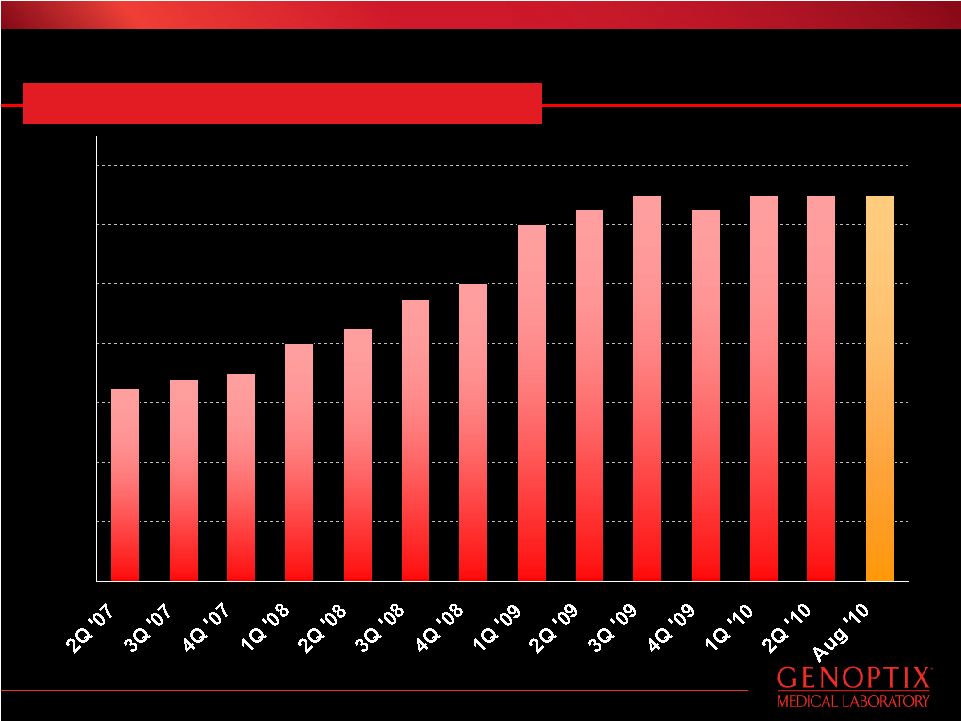
9 Oncologists Value the Benefits of Genoptix Hem/Oncs Using Genoptix Services 0 200 400 600 800 1000 1200 1400 |
10 Addressing Challenges In The Marketplace Increase in regional competitiveness Adding depth to sales coverage, leveraging reputation for quality offering Product imitation by competitors Differentiating by adding new tests and proprietary offerings Competitive EMR purchases Strategic EMR support for key accounts Weakened sales force effectiveness New sales leadership in place in 3Q10, targeted training, new sales incentives Increased pressure from managed care Continued contractual negotiations, additional agreement expected in 2010 Physician consolidation and in-sourcing Targeted account management initiatives underway BM cases moving to hospitals Initiating pilot program in 2H10 to sell into hospitals Challenge Response |
11 New Products & Services Multiple Myeloma MRD - iFISH Enhanced detection of Minimum Residual Disease (MRD) Improved sensitivity with immuno- enrichment over conventional cytogenetics (iFISH) Early identification of disease progression Molecular evaluations for Colorectal and NSCL carcinomas Help determine optimal treatment options Deepens relationship with physician customers Extends the Genoptix service approach to solid tumor indications Additional tests expected in 2011 |
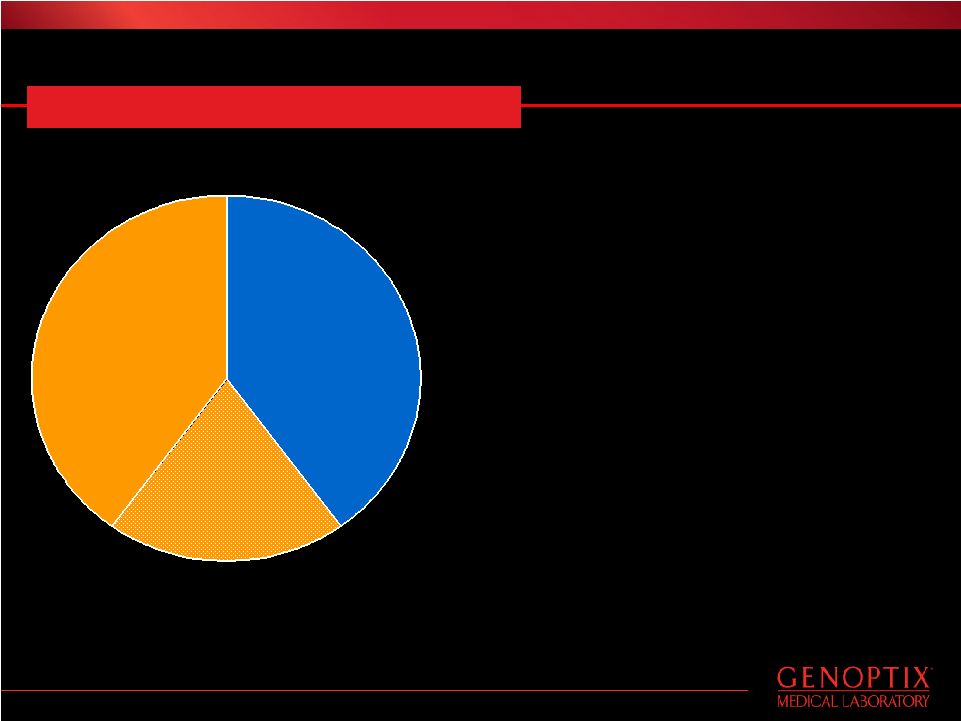
12 Reimbursement And Payor Relationships Non- contracted Contracted Contracted business – ~ 40% Medicare – ~ 20% major payors expected by Y/E 2010 Non-Contracted business – Reimbursed by payors as an out-of-network provider – Bill patient co-insurance and deductibles at in-network rates, as permitted by law Evolution Of Payor Mix – Signed first major national commercial contract with Aetna in 1Q10 – Expect to sign second major payor contract in 2010 – Expect mix to gradually shift toward contractual relationships over next few years Continuously Evolving Payor Mix |
13 Putting Capital to Work Reinvesting income to build long-term value Increasing operational capacity Assessing various opportunities through intensive evaluation – Technologies – Partnerships – Acquisitions Several strategies/opportunities under consideration – Expansion of solid tumor testing capabilities – Accessing new market segments to evolve with market trends – Complementary technologies Growing The Franchise |
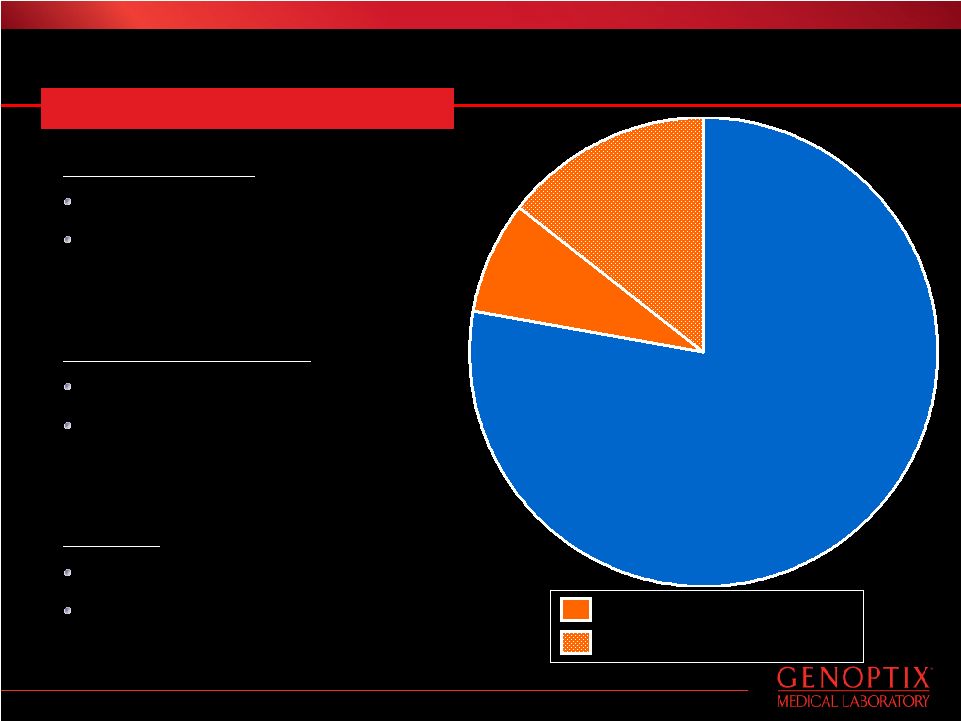
14 ~ 8% The Diagnosis Of Hematomalignancies Incidence Rates 375,000 bone marrows/yr 250,000 related blood-based tests/yr Hem/Onc Physicians 12,500 hem/oncs 9,500, or 76%, practice in the community setting Patients 850,000 patients in the U.S. 150,000 new cases annually = Market Share = Market Share Projection by 2015 Genoptix’ goal is to grow its share of the bone marrow market to 15-20% by 2015 A Large And Growing Market |
15 Financial Performance |
17 2010 Investments 2H 2010 EPS Impact Laboratory Capacity Expansion – Grow HemPath team to 50 by Y/E – Additional lab support personnel – New laboratory opened in July ($0.10) Sales & Marketing Expansion – Grow Sales team to 100 by Y/E – New Customer Service facility in 4Q – Selective investments in client EMR ($0.09) Growth Investment Builds Strong Foundation For Leverage Beyond 2010 Committing To Next Phase Of Growth |
18 Financial Summary ($ in thousands) 2009 2010 Revenues $84,487 $98,336 YOY Growth -- 16% Cost of Revenues 32,201 39,245 Gross Profit $52,286 $59,091 % Gross margin 62% 60% Operating Expenses: Sales & Marketing 14,321 20,851 Sales & Marketing % of Rev 17% 21% General & Administrative 13,881 17,465 G&A as % of Rev 16% 18% Research & Development 527 809 R&D as % of Rev 1% 1% Total Operating Expenses 28,729 39,125 Income from Operations 23,557 19,966 % Operating Margin 28% 20% Income Before Income Tax 24,491 20,496 % Pre-tax Margin 29% 21% Net Income 13,816 10,945 % Net Income Margin 16% 11% Six Months Ended June 30, |
19 Summary Targeting 15-20% of bone marrow market share by 2015 COMPASS and CHART service offerings are transforming hematomalignancy diagnostics in the United States and spurring competitors to emulate our success Continue to strengthen sales organization to convey value proposition and combat new entrants, targeting ~ 100 sales reps by end of 2010 Economic pressure on community hem/onc driving new oncology service and business approaches and we are evolving as appropriate to meet their needs A developing pipeline of new products and services for liquid and solid tumors launching in coming quarters Actively pursuing objective evidence of the efficacy of our diagnostic model Long-term outlook for solid gross margins in mid- to high-50th percentile and operating margins in the high-teens to low-20th percentile with shift in payor mix over next few years Proactively managing resources to improve efficiencies and control costs |
20 Thank You |