
Q4 & Fiscal 2019 Performance Highlights February 25, 2020
Safe Harbor Forward-Looking Statements This presentation contains forward-looking statements, including those related to Infinera’s expectations regarding its business model, market opportunities and customers; its ability to grow faster than the market; its expectations regarding the timing of its new products being available in the market; its ability to win new customers; and its financial outlook for the first quarter of 2020, including the projected impact of the coronavirus for the first quarter of 2020. All statements other than statements of historical fact could be deemed forward-looking, including, but not limited to, statements made about future market and financial performance; statements regarding future products or technology as well as the timing to market of any such products or technology; any statements about historical results that may suggest trends for our business; and any statements of assumptions underlying any of the items mentioned. These statements are based on estimates and information available to us at the time of this presentation and are not guarantees of future performance. These statements are based on information available to Infinera as of the date hereof and actual results could differ materially from those stated or implied due to risks and uncertainties. The risks and uncertainties that could cause Infinera’s results to differ materially from those expressed or implied by such forward-looking statements include, Infinera’s future capital needs and its ability to generate the cash flow or otherwise secure the capital necessary to make anticipated capital expenditures; Infinera's ability to service its debt obligations and pursue its strategic plan; delays in the development and introduction of new products or updates to existing products; market acceptance of Infinera’s end-to-end portfolio; Infinera's reliance on single and limited source suppliers; the effects of the coronavirus on the supply chain and our ability meet customer demand; Infinera’s ability to successfully integrate its enterprise resource planning system and other management systems; the diversion of management time on issues related to the integration and the implementation of its enterprise resource planning system; fluctuations in demand, sales cycles and prices for products and services, including discounts given in response to competitive pricing pressures, as well as the timing of purchases by Infinera's key customers; the effect that changes in product pricing or mix, and/or increases in component costs could have on Infinera’s gross margin; Infinera’s ability to respond to rapid technological changes; aggressive business tactics by Infinera’s competitors; the effects of customer consolidation; Infinera’s ability to protect Infinera’s intellectual property; claims by others that Infinera infringes their intellectual property; the effect of global macroeconomic conditions, including tariffs, on Infinera's business; war, terrorism, public health issues, natural disasters and other circumstances that could disrupt the supply, delivery or demand of Infinera's products; and other risks and uncertainties detailed in Infinera’s SEC filings from time to time. More information on potential factors that may impact Infinera’s business are set forth in its Quarterly Report on Form 10-Q for the quarter ended on September 28, 2019 as filed with the SEC on November 12, 2019, as well as subsequent reports filed with or furnished to the SEC from time to time. These reports are available on Infinera’s website at www.infinera.com and the SEC’s website at www.sec.gov. Infinera assumes no obligation to, and does not currently intend to, update any such forward-looking statements set forth in this presentation. © 2020 Infinera. All rights reserved. 2
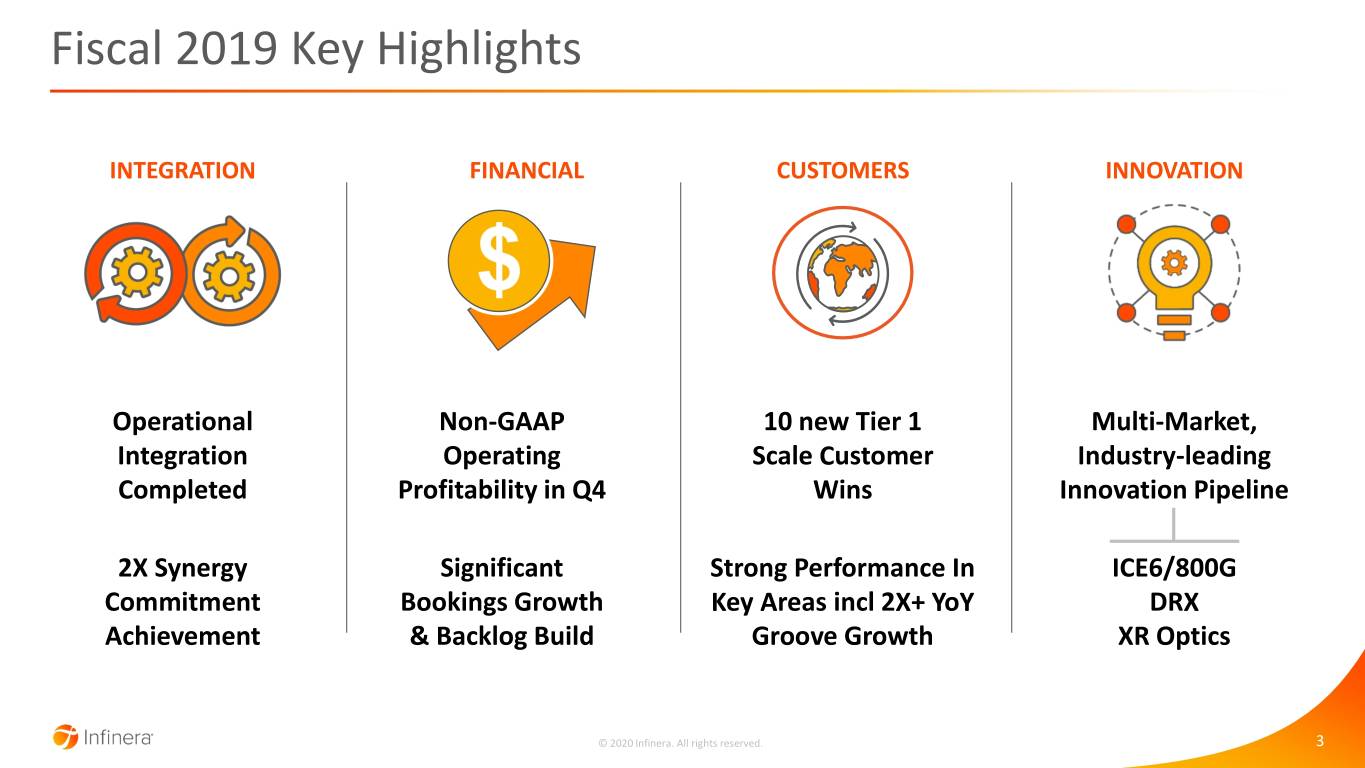
Fiscal 2019 Key Highlights INTEGRATION FINANCIAL CUSTOMERS INNOVATION Operational Non-GAAP 10 new Tier 1 Multi-Market, Integration Operating Scale Customer Industry-leading Completed Profitability in Q4 Wins Innovation Pipeline 2X Synergy Significant Strong Performance In ICE6/800G Commitment Bookings Growth Key Areas incl 2X+ YoY DRX Achievement & Backlog Build Groove Growth XR Optics © 2020 Infinera. All rights reserved. 3
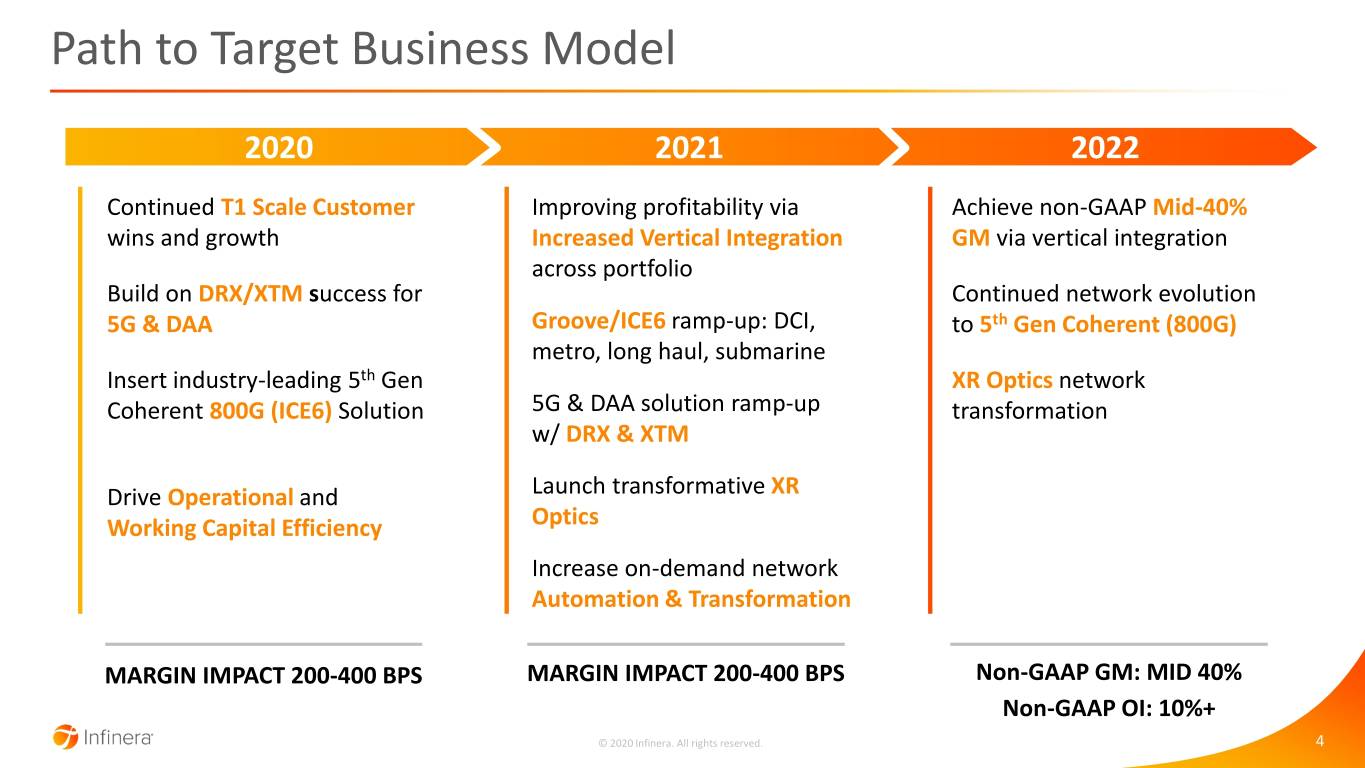
Path to Target Business Model 2020 2021 2022 Continued T1 Scale Customer Improving profitability via Achieve non-GAAP Mid-40% wins and growth Increased Vertical Integration GM via vertical integration across portfolio Build on DRX/XTM success for Continued network evolution 5G & DAA Groove/ICE6 ramp-up: DCI, to 5th Gen Coherent (800G) metro, long haul, submarine Insert industry-leading 5th Gen XR Optics network Coherent 800G (ICE6) Solution 5G & DAA solution ramp-up transformation w/ DRX & XTM Drive Operational and Launch transformative XR Working Capital Efficiency Optics Increase on-demand network Automation & Transformation MARGIN IMPACT 200-400 BPS MARGIN IMPACT 200-400 BPS Non-GAAP GM: MID 40% Non-GAAP OI: 10%+ © 2020 Infinera. All rights reserved. 4
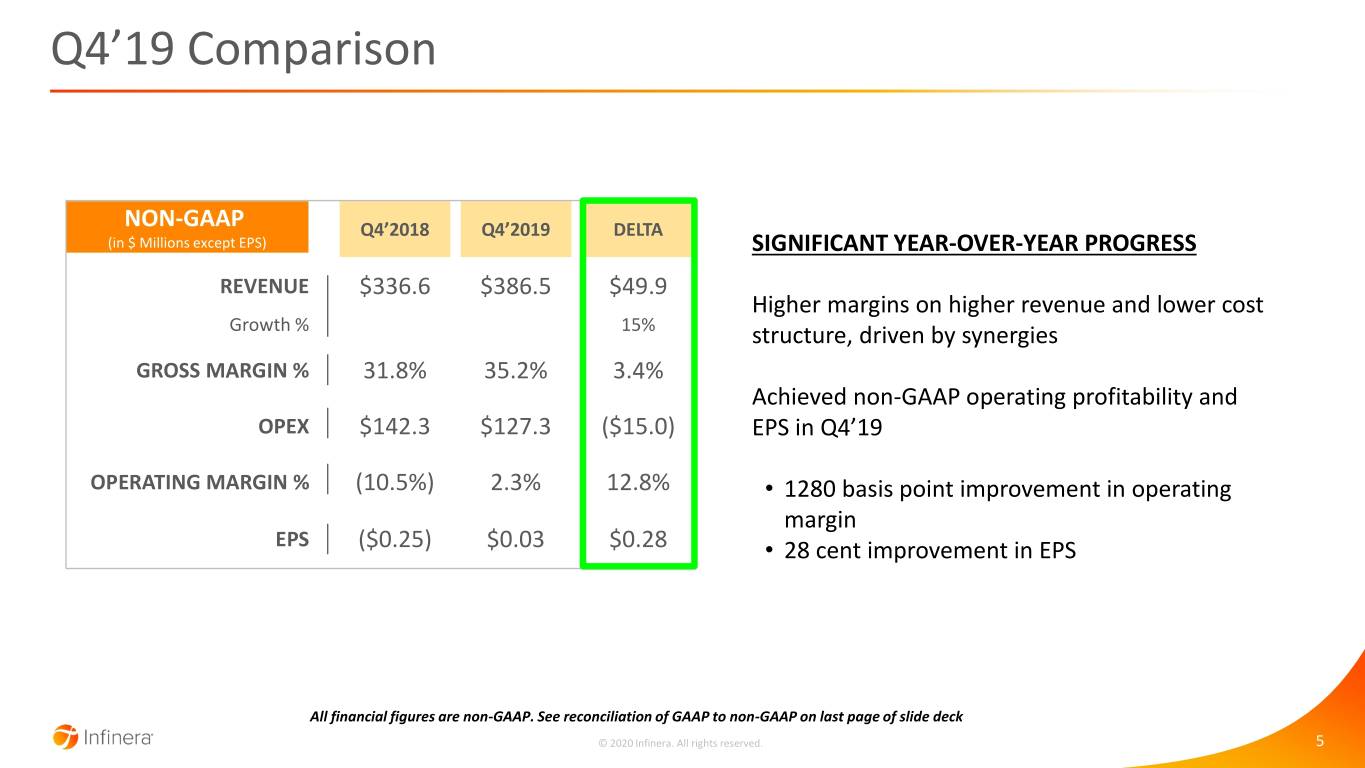
Q4’19 Comparison NON-GAAP Q4’2018 Q4’2019 DELTA (in $ Millions except EPS) SIGNIFICANT YEAR-OVER-YEAR PROGRESS REVENUE $336.6 $386.5 $49.9 Higher margins on higher revenue and lower cost Growth % 15% structure, driven by synergies GROSS MARGIN % 31.8% 35.2% 3.4% Achieved non-GAAP operating profitability and OPEX $142.3 $127.3 ($15.0) EPS in Q4’19 OPERATING MARGIN % (10.5%) 2.3% 12.8% • 1280 basis point improvement in operating margin EPS ($0.25) $0.03 $0.28 • 28 cent improvement in EPS All financial figures are non-GAAP. See reconciliation of GAAP to non-GAAP on last page of slide deck © 2020 Infinera. All rights reserved. 5

Q4'19 Revenue By Region & Revenue by Vertical BY REGION BY VERTICAL 7% 10% 38% 39% 52% 30% 8% 15% North America EMEA APAC Other America Tier 1 ICP Cable Other Service Provider Totals may not foot to 100% due to rounding © 2020 Infinera. All rights reserved. 6
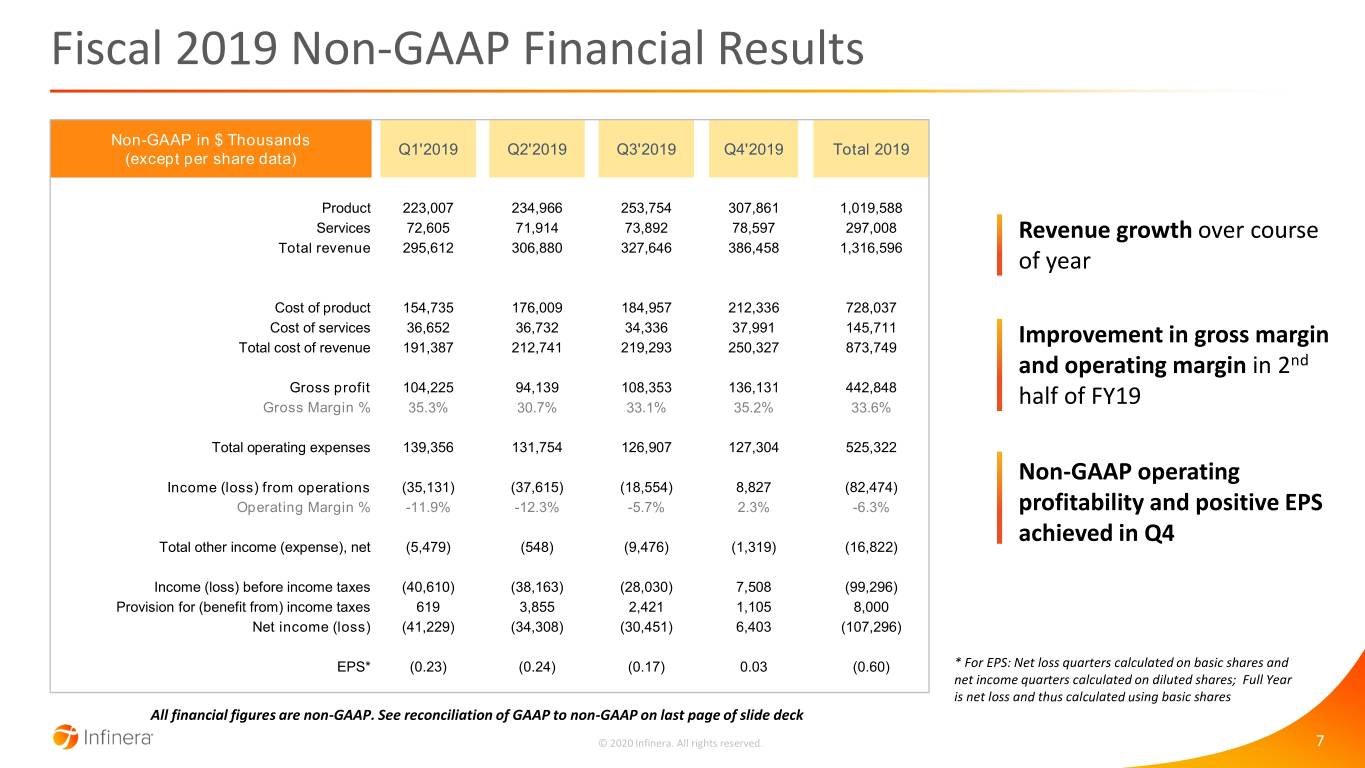
Fiscal 2019 Non-GAAP Financial Results Non-GAAP in $ Thousands Q1'2019 Q2'2019 Q3'2019 Q4'2019 Total 2019 (except per share data) Product 223,007 234,966 253,754 307,861 1,019,588 Services 72,605 71,914 73,892 78,597 297,008 Revenue growth over course Total revenue 295,612 306,880 327,646 386,458 1,316,596 of year Cost of product 154,735 176,009 184,957 212,336 728,037 Cost of services 36,652 36,732 34,336 37,991 145,711 Total cost of revenue 191,387 212,741 219,293 250,327 873,749 Improvement in gross margin and operating margin in 2nd Gross profit 104,225 94,139 108,353 136,131 442,848 Gross Margin % 35.3% 30.7% 33.1% 35.2% 33.6% half of FY19 Total operating expenses 139,356 131,754 126,907 127,304 525,322 Non-GAAP operating Income (loss) from operations (35,131) (37,615) (18,554) 8,827 (82,474) Operating Margin % -11.9% -12.3% -5.7% 2.3% -6.3% profitability and positive EPS achieved in Q4 Total other income (expense), net (5,479) (548) (9,476) (1,319) (16,822) Income (loss) before income taxes (40,610) (38,163) (28,030) 7,508 (99,296) Provision for (benefit from) income taxes 619 3,855 2,421 1,105 8,000 Net income (loss) (41,229) (34,308) (30,451) 6,403 (107,296) EPS* (0.23) (0.24) (0.17) 0.03 (0.60) * For EPS: Net loss quarters calculated on basic shares and net income quarters calculated on diluted shares; Full Year is net loss and thus calculated using basic shares All financial figures are non-GAAP. See reconciliation of GAAP to non-GAAP on last page of slide deck © 2020 Infinera. All rights reserved. 7
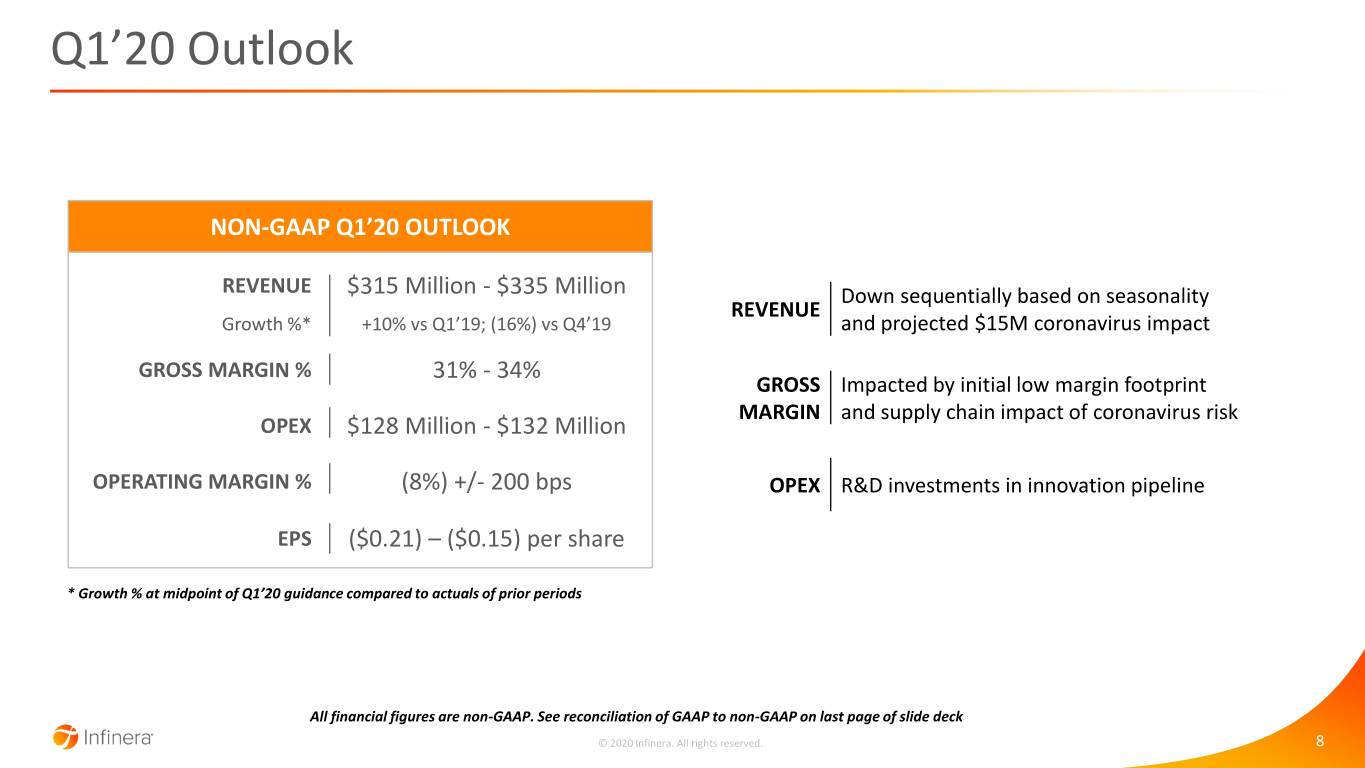
Q1’20 Outlook NON-GAAP Q1’20 OUTLOOK REVENUE $315 Million - $335 Million Down sequentially based on seasonality REVENUE Growth %* +10% vs Q1’19; (16%) vs Q4’19 and projected $15M coronavirus impact GROSS MARGIN % 31% - 34% GROSS Impacted by initial low margin footprint MARGIN and supply chain impact of coronavirus risk OPEX $128 Million - $132 Million OPERATING MARGIN % (8%) +/- 200 bps OPEX R&D investments in innovation pipeline EPS ($0.21) – ($0.15) per share * Growth % at midpoint of Q1’20 guidance compared to actuals of prior periods All financial figures are non-GAAP. See reconciliation of GAAP to non-GAAP on last page of slide deck © 2020 Infinera. All rights reserved. 8

GAAP to Non-GAAP Reconciliation (in millions, except percentages and per share data) Q4'18 Q4'19 FY'19 Q1'20 (in millions, except percentages and per share data) Q4'18 Q4'19 FY'19 Q1'20 Actual Actual Actuals Outlook Actual Actual Actuals Outlook Reconciliation of Revenue: Reconciliation of Operating margin: U.S. GAAP as reported $ 332.1 $ 384.6 $ 1,298.9 323 U.S. GAAP (34.4%) (15.8%) (27.0%) -18% Acquisition-related deferred revenue adjustment $ 4.6 $ 1.9 $ 17.7 2 Acquisition-related deferred revenue adjustment 2.9% 0.5% 0.6% 1% Non-GAAP as adjusted $ 336.6 $ 386.5 $ 1,316.6 $ 325 Stock-based compensation 2.7% 2.9% 3.3% 3% Amortization of acquired intangible assets 10.0% 3.9% 4.6% 3% Reconciliation of Gross Margin: Acquisition and integration costs 4.1% 4.7% 5.4% 2% U.S. GAAP 25.4% 29.0% 25.1% 29% Restructuring and related 4.0% 6.1% 6.4% 1% Stock-based compensation 0.5% 0.5% 0.5% 0% Litigation charges 0.3% 0% Amortization of acquired intangible assets 3.2% 2.2% 2.5% 2% Non-GAAP (10.5%) 2.3% (6.3%) -8% Acquisition and integration costs 0.0% 1.9% 2.2% 0% Acquisition-related deferred revenue adjustment 1.6% 0.5% 1.2% 1% Net Loss per Common Share: Restructuring and related 1.0% 1.2% 2.1% 0.5% U.S. GAAP $ (0.76) $ (0.37) $ (2.16) $ (0.38) Non-GAAP 31.8% 35.2% 33.6% 32.5% Acquisition-related deferred revenue adjustment $ 0.09 $ 0.01 $ 0.04 $ 0.01 Stock-based compensation $ 0.05 $ 0.09 $ 0.27 $ 0.05 Reconciliation of Operating Expenses: Amortization of acquired intangible assets $ 0.22 $ 0.08 $ 0.38 $ 0.07 U.S. GAAP $ 198.7 $ 172.3 $ 676.2 $ 153 Acquisition and integration costs $ 0.08 $ 0.10 $ 0.40 $ 0.04 Stock-based compensation $ (7.4) $ (9.3) $ (36.3) $ (9) Restructuring and related $ 0.08 $ 0.12 $ 0.40 $ 0.01 Amortization of acquired intangible assets $ (24.7) $ (6.6) $ (27.3) $ (5) Litigation charges $ 0.00 $ 0.02 Acquisition and integration costs $ (13.5) $ (11.0) $ (42.3) $ (7) Amortization of debt discount $ 0.03 $ 0.03 $ 0.02 Restructuring and related $ (10.8) $ (18.0) $ (45.0) $ (2) Gain/Loss on non-marketable equity investment $ 0.01 Non-GAAP $ 142.3 $ 127.4 $ 525.3 $ 130 SLA $ 0.05 Tax effects (0.01) $ (0.01) $ - Non-GAAP $ (0.25) $ 0.03 $ (0.60) $ (0.18) Notes: 1. Totals may not foot due to rounding 2. Amounts for Q1’20 Outlook represent the midpoint of the expected range 3. For a complete reconciliation of GAAP to non-GAAP results, please refer to our earnings release published on February 25, 2020 © 2020 Infinera. All rights reserved. 9

Thank You


