
Third Quarter 2020 Financial Results November 5, 2020

Safe Harbor Forward-Looking Statements This presentation contains forward-looking statements, including those related to Infinera’s expectations regarding its business model, market opportunities, competition and customers; its expectations regarding the timing of its new products being available in the market; its ability to win new customers; its visibility into the performance of its business in future quarters based on the unpredictability of the macro-economic environment and the COVID-19 pandemic; and its financial outlook for the fourth quarter of 2020. All statements other than statements of historical fact could be deemed forward-looking, including, but not limited to, statements made about future market, financial and operating performance; statements regarding future products or technology, as well as the timing to market of any such products or technology; any statements about historical results that may suggest trends for Infinera’s business; and any statements of assumptions underlying any of the items mentioned. These statements are based on estimates and information available to Infinera at the time of this presentation and are not guarantees of future performance; actual results could differ materially from those stated or implied due to risks and uncertainties. The risks and uncertainties that could cause Infinera’s results to differ materially from those expressed or implied by such forward-looking statements include the effect of the COVID-19 pandemic on Infinera’s business, results of operations, financial condition, stock price and personnel; the effect of global and regional economic conditions on Infinera’s business, including effects on purchasing decisions by customers; Infinera’s future capital needs and its ability to generate the cash flow or otherwise secure the capital necessary to make anticipated capital expenditures; Infinera's ability to service its debt obligations and pursue its strategic plan; delays in the development and introduction of new products or updates to existing products; market acceptance of Infinera’s end-to-end portfolio; Infinera's reliance on single and limited source suppliers; Infinera’s ability to successfully integrate its enterprise resource planning system and other management systems; the diversion of management time on issues related to the integration and the implementation of its enterprise resource planning system; fluctuations in demand, sales cycles and prices for products and services, including discounts given in response to competitive pricing pressures, as well as the timing of purchases by Infinera's key customers; the effect that changes in product pricing or mix, and/or increases in component costs, could have on Infinera’s gross margin; Infinera’s ability to respond to rapid technological changes; aggressive business tactics by Infinera’s competitors; the effects of customer consolidation; the impacts of foreign currency fluctuations; Infinera’s ability to protect its intellectual property; claims by others that Infinera infringes their intellectual property; impacts of the 2020 presidential election in the United States; war, terrorism, public health issues, natural disasters and other circumstances that could disrupt the supply, delivery or demand of Infinera's products; and other risks and uncertainties detailed in Infinera’s SEC filings from time to time. More information on potential factors that may impact Infinera’s business are set forth in its Annual Report on Form 10-K for the year ended on December 28, 2019 as filed with the SEC on March 4, 2020, and its Quarterly Report on Form 10-Q for the quarter ended June 27, 2020 as filed with the SEC on August 6, 2020, as well as subsequent reports filed with or furnished to the SEC from time to time. These reports are available on Infinera’s website at www.infinera.com and the SEC’s website at www.sec.gov. Infinera assumes no obligation to, and does not currently intend to, update any such forward-looking statements set forth in this presentation. 2 © 2020 Infinera. All rights reserved.

Non-GAAP Q3’20 Key Highlights CONTINUED COMPANY GROWTH ADVANCING KEY SOLUTIONS IMPROVING OPERATIONAL EFFICIENCY Substantial YTD Groove (GX) Expanded Gross Margin Revenue Growth growth, including with non-ICP +140bps QoQ and +210bps YoY +4% YoY, +8% YTD customers $12M inventory reduction in 7 new 600G Groove (GX) Q3’20 and $65M YTD customers (23 total); port growth Operating Margin doubled QoQ 2% OM One-time cash integration +790bps YoY, +690bps YTD ICE6 (800G) – on track for first costs substantially shipments in Q4; strong pipeline, completed, a quarter early few competitors Revenue, Gross Margin and Operating Margin references are non-GAAP. See reconciliation of GAAP to non-GAAP on last page of slide deck 3 © 2020 Infinera. All rights reserved.
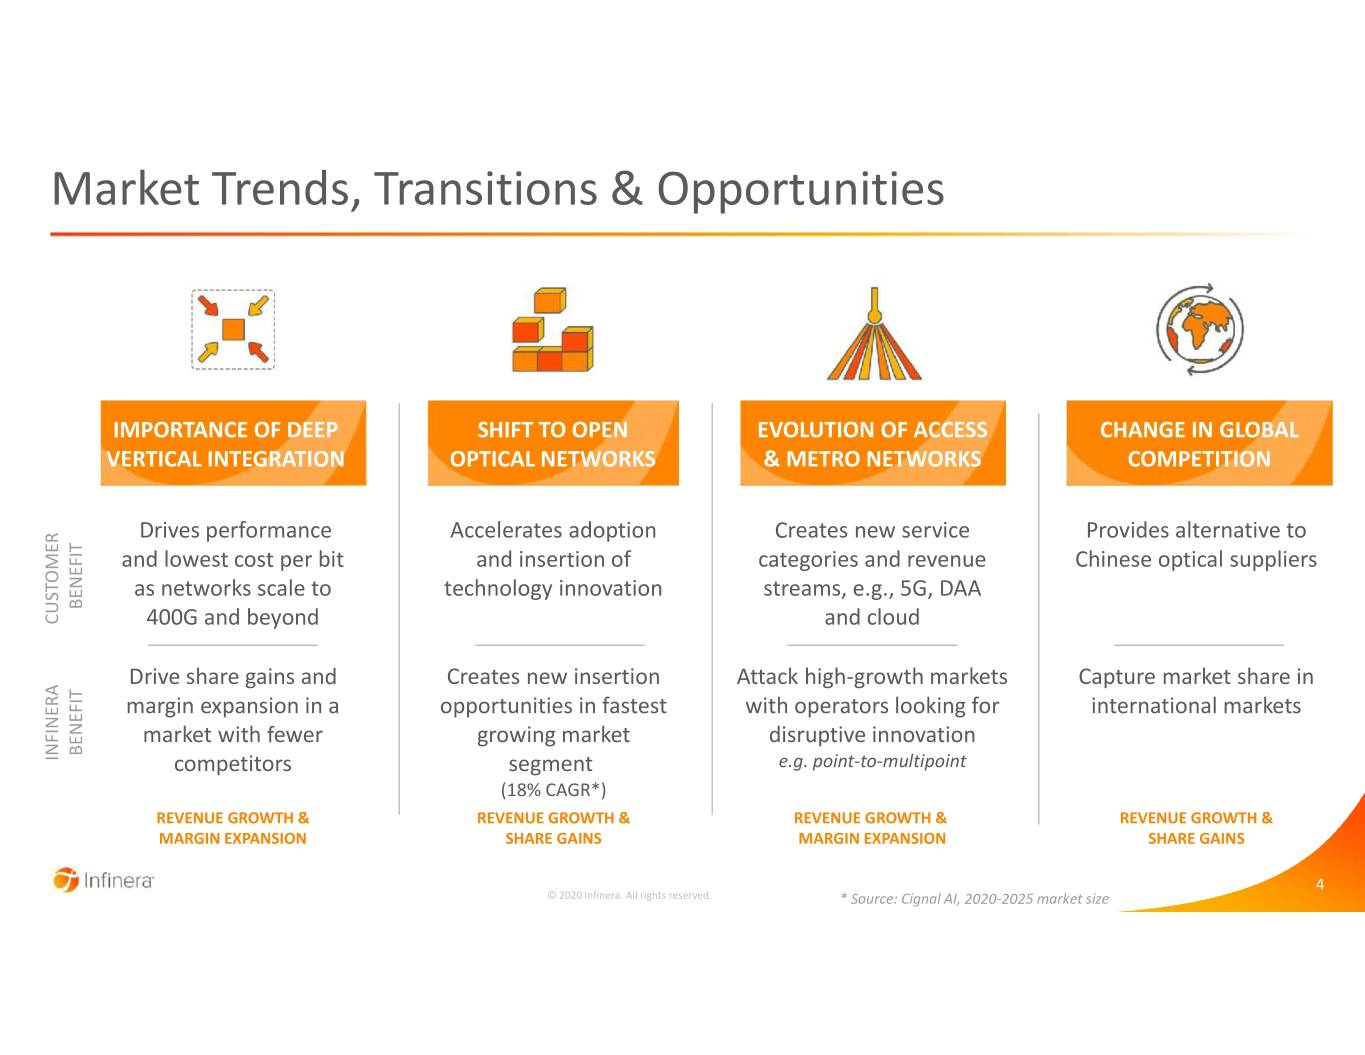
Market Trends, Transitions & Opportunities IMPORTANCE OF DEEP SHIFT TO OPEN EVOLUTION OF ACCESS CHANGE IN GLOBAL VERTICAL INTEGRATION OPTICAL NETWORKS & METRO NETWORKS COMPETITION Drives performance Accelerates adoption Creates new service Provides alternative to and lowest cost per bit and insertion of categories and revenue Chinese optical suppliers as networks scale to technology innovation streams, e.g., 5G, DAA BENEFIT CUSTOMER 400G and beyond and cloud Drive share gains and Creates new insertion Attack high-growth markets Capture market share in margin expansion in a opportunities in fastest with operators looking for international markets market with fewer growing market disruptive innovation BENEFIT INFINERA competitors segment e.g. point-to-multipoint (18% CAGR*) REVENUE GROWTH & REVENUE GROWTH & REVENUE GROWTH & REVENUE GROWTH & MARGIN EXPANSION SHARE GAINS MARGIN EXPANSION SHARE GAINS 4 © 2020 Infinera. All rights reserved. * Source: Cignal AI, 2020-2025 market size
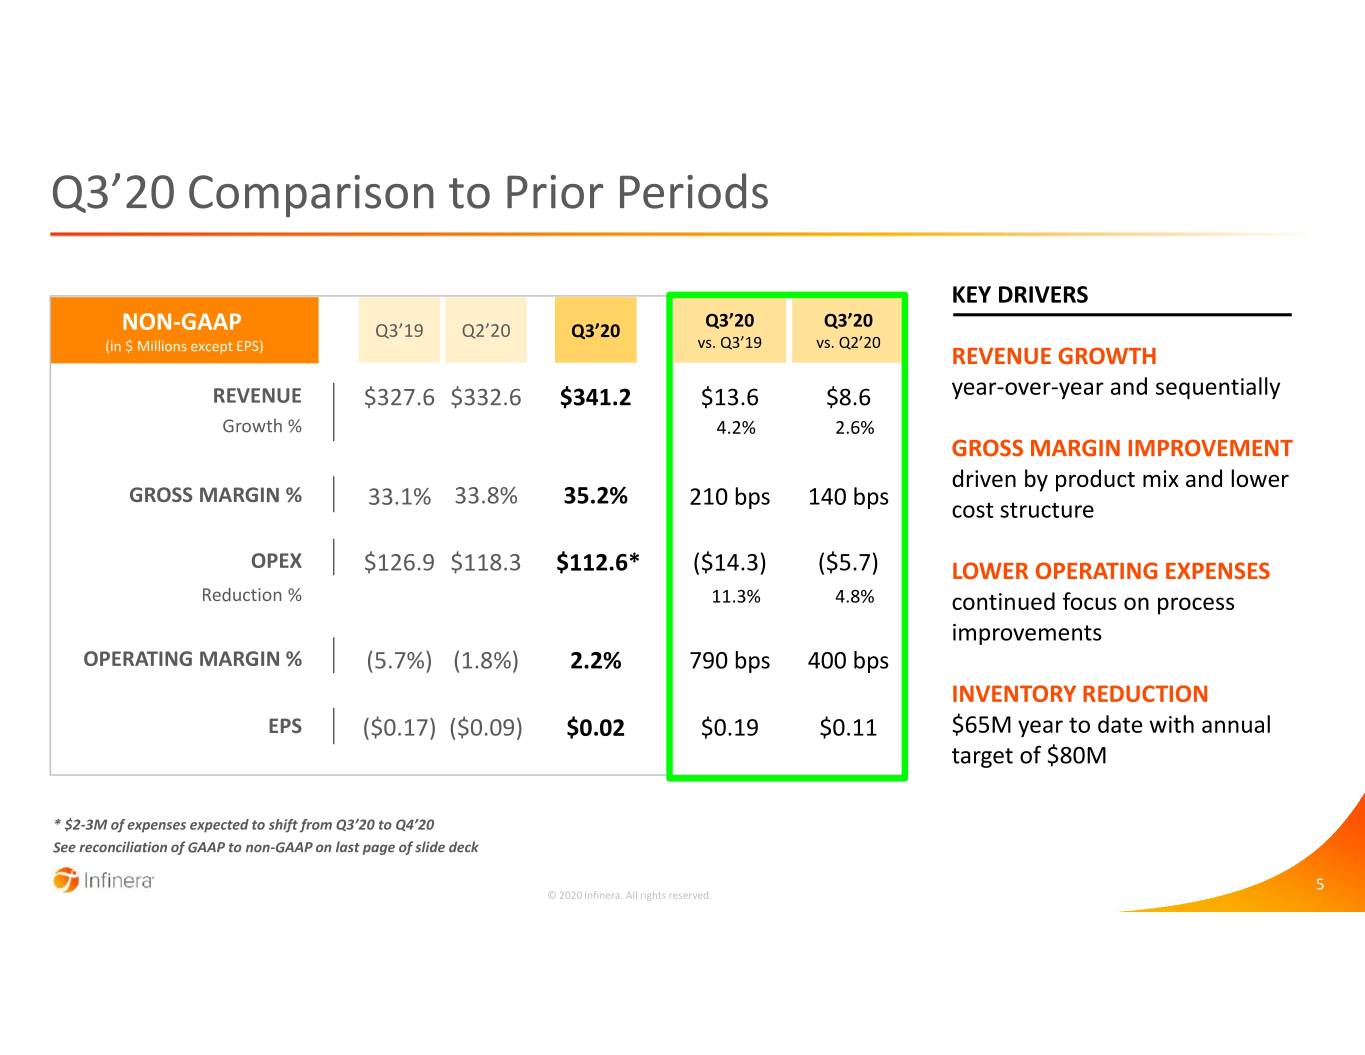
Q3’20 Comparison to Prior Periods KEY DRIVERS Q3’20 Q3’20 NON-GAAP Q3’19 Q2’20 Q3’20 vs. Q3’19 vs. Q2’20 (in $ Millions except EPS) REVENUE GROWTH REVENUE $327.6 $332.6 $341.2 $13.6 $8.6 year-over-year and sequentially Growth % 4.2% 2.6% GROSS MARGIN IMPROVEMENT driven by product mix and lower GROSS MARGIN % 33.1% 33.8% 35.2% 210 bps 140 bps cost structure OPEX $126.9 $118.3 $112.6* ($14.3) ($5.7) LOWER OPERATING EXPENSES Reduction % 11.3% 4.8% continued focus on process improvements OPERATING MARGIN % (5.7%) (1.8%) 2.2% 790 bps 400 bps INVENTORY REDUCTION EPS ($0.17) ($0.09) $0.02 $0.19 $0.11 $65M year to date with annual target of $80M * $2-3M of expenses expected to shift from Q3’20 to Q4’20 See reconciliation of GAAP to non-GAAP on last page of slide deck 5 © 2020 Infinera. All rights reserved.
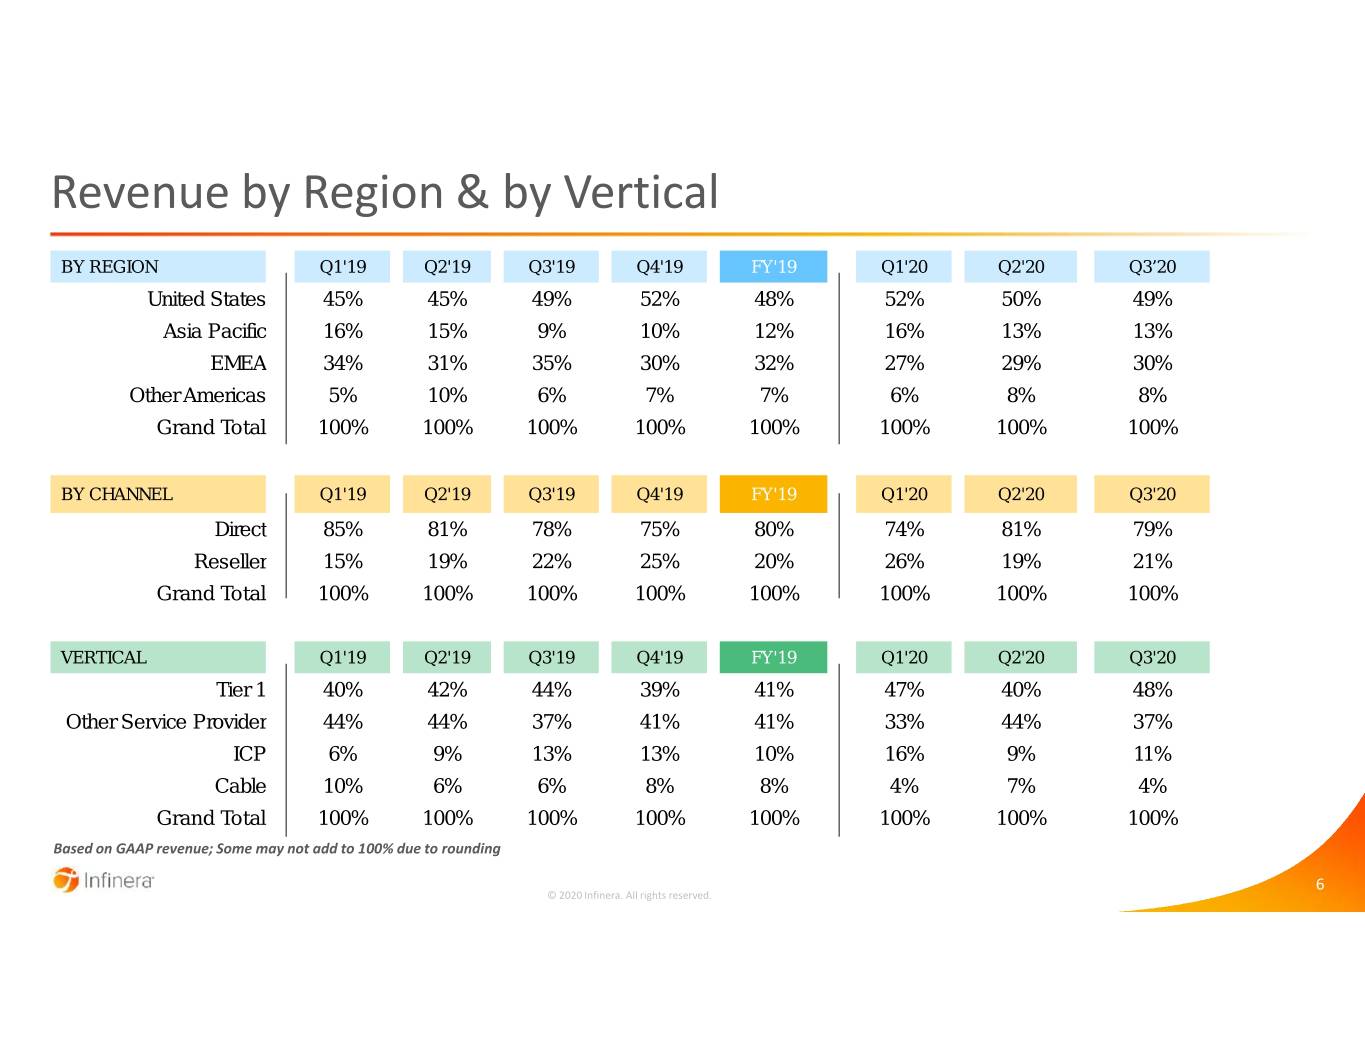
Revenue by Region & by Vertical BY REGION Q1'19 Q2'19 Q3'19 Q4'19 FY'19 Q1'20 Q2'20 Q3’20 United States 45% 45% 49% 52% 48% 52% 50% 49% Asia Pacific 16% 15% 9% 10% 12% 16% 13% 13% EMEA 34% 31% 35% 30% 32% 27% 29% 30% Other Americas 5% 10% 6% 7% 7% 6% 8% 8% Grand Total 100% 100% 100% 100% 100% 100% 100% 100% BY CHANNEL Q1'19 Q2'19 Q3'19 Q4'19 FY'19 Q1'20 Q2'20 Q3'20 Direct 85% 81% 78% 75% 80% 74% 81% 79% Reseller 15% 19% 22% 25% 20% 26% 19% 21% Grand Total 100% 100% 100% 100% 100% 100% 100% 100% VERTICAL Q1'19 Q2'19 Q3'19 Q4'19 FY'19 Q1'20 Q2'20 Q3'20 Tier 1 40% 42% 44% 39% 41% 47% 40% 48% Other Service Provider 44% 44% 37% 41% 41% 33% 44% 37% ICP 6% 9% 13% 13% 10% 16% 9% 11% Cable 10% 6% 6% 8% 8% 4% 7% 4% Grand Total 100% 100% 100% 100% 100% 100% 100% 100% Based on GAAP revenue; Some may not add to 100% due to rounding 6 © 2020 Infinera. All rights reserved.
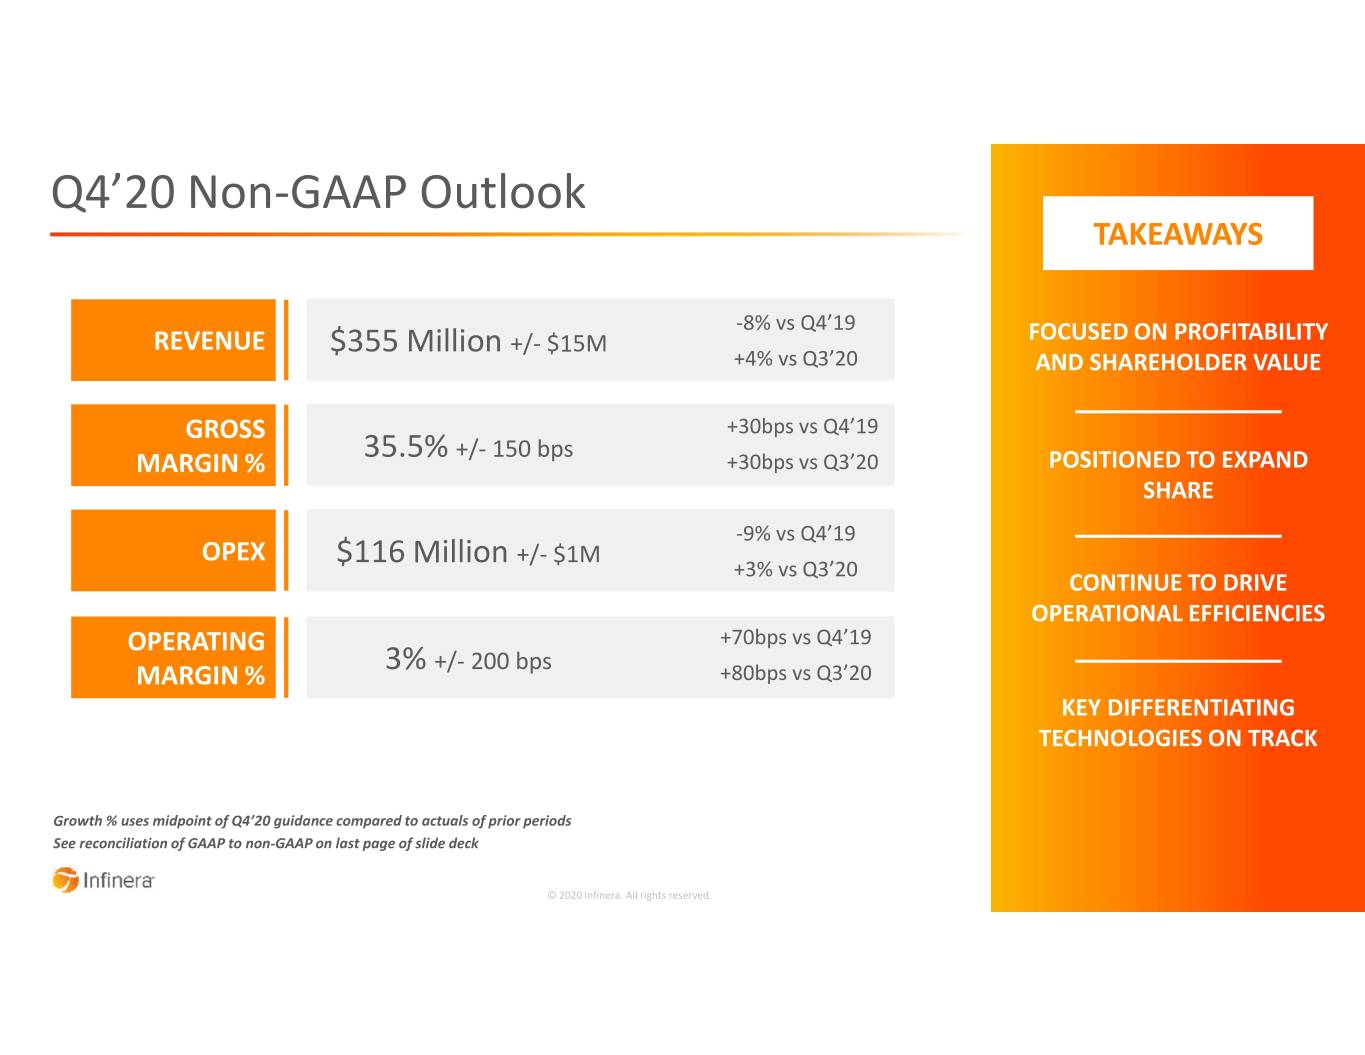
Q4’20 Non-GAAP Outlook TAKEAWAYS -8% vs Q4’19 REVENUE $355 Million +/- $15M FOCUSED ON PROFITABILITY +4% vs Q3’20 AND SHAREHOLDER VALUE GROSS +30bps vs Q4’19 35.5% +/- 150 bps MARGIN % +30bps vs Q3’20 POSITIONED TO EXPAND SHARE -9% vs Q4’19 OPEX +/- $1M $116 Million +3% vs Q3’20 CONTINUE TO DRIVE OPERATIONAL EFFICIENCIES OPERATING +70bps vs Q4’19 3% +/- 200 bps MARGIN % +80bps vs Q3’20 KEY DIFFERENTIATING TECHNOLOGIES ON TRACK Growth % uses midpoint of Q4’20 guidance compared to actuals of prior periods See reconciliation of GAAP to non-GAAP on last page of slide deck 7 © 2020 Infinera. All rights reserved.
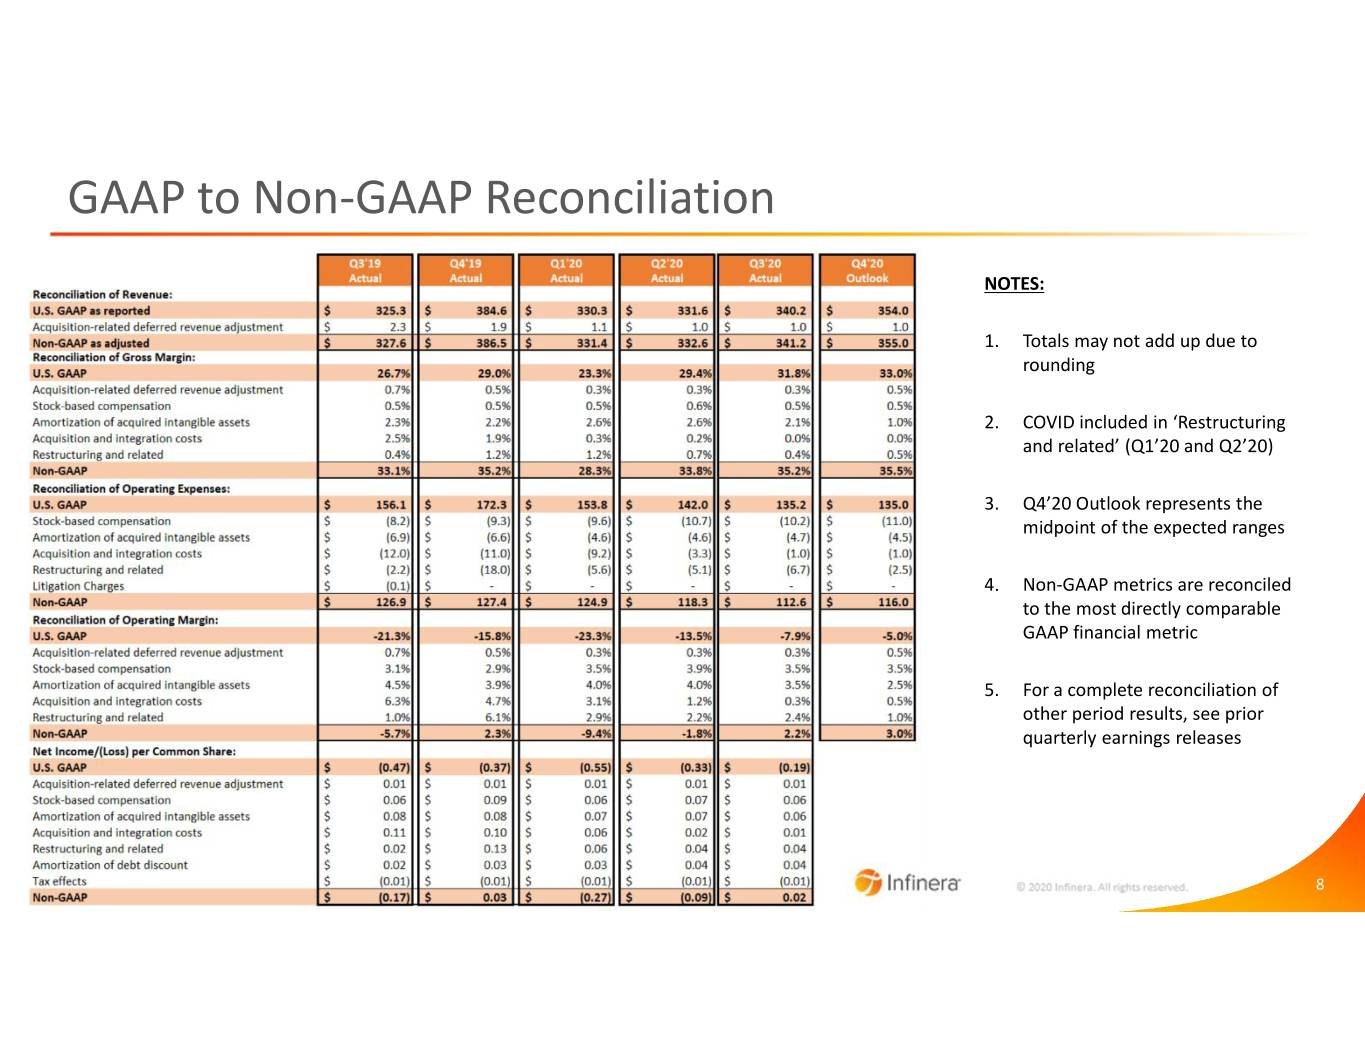
GAAP to Non-GAAP Reconciliation NOTES: 1. Totals may not add up due to rounding 2. COVID included in ‘Restructuring and related’ (Q1’20 and Q2’20) 3. Q4’20 Outlook represents the midpoint of the expected ranges 4. Non-GAAP metrics are reconciled to the most directly comparable GAAP financial metric 5. For a complete reconciliation of other period results, see prior quarterly earnings releases 8 © 2020 Infinera. All rights reserved.

Thank You


