 1 | © 2015 Infinera Infinera Transmode Combination Establishes an End-to-End Optical Leader Transmode Investor Briefing May 2015 Filed by Infinera Corporation Pursuant to Rule 425 Under the Securities Act of 1933 Subject Company: Transmode AB (Commission File No. 001-33486) |
 2 | © 2015 Infinera Safe Harbor This presentation contains "forward-looking" statements that involve risks, uncertainties and assumptions. If the risks or uncertainties ever materialize or the assumptions prove incorrect, our results may differ materially from those expressed or implied by such forward-looking statements. All statements other than statements of historical fact could be deemed forward-looking, including, but not limited to, any projections of financial information, including statements about revenue growth, the potentially accretive nature of the transaction and similar statements; any statements about market liquidity following the transaction; any statements about historical results that may suggest trends for our business; any statements of the plans, strategies, and objectives of management for future operations; any statements of expectation or belief regarding future events, potential markets or market size, technology developments, or enforceability of our intellectual property rights; and any statements of assumptions underlying any of the items mentioned. These statements are based on estimates and information available to us at the time of this presentation and are not guarantees of future performance. These risks and uncertainties include, but are not limited to, the risk that Transmode shareholders fail to tender more than 90% of Transmode’s outstanding shares, that any other closing conditions are not satisfied, and that the transaction may not close; the risk that Transmode’s and Infinera’s businesses will not be integrated successfully; the risk that synergies will not be realized or realized to the extent anticipated; the risk that the combined company will not realize on its financing or operating strategies; the risk that litigation in respect of either company or the transaction could arise; the risk that disruption caused by the combined company would make it difficult to maintain certain strategic relationships; the risks of competitive responses and shifts in the market; delays in the release of new products; fluctuations in customer demand, changes in industry trends, and changes in the macro economic market. These risks and uncertainties also include those risks and uncertainties discussed in the offer document to be filed with the Swedish Financial Supervisory Authority and in the Registration Statement on Form S-4 to be filed with the SEC, those risks and uncertainties identified under the heading “Risk Factors” in the Infinera Quarterly Report on Form 10-Q for the quarter ended March 28, 2015, filed with the SEC, and those risks and uncertainties identified in any subsequent reports filed with the SEC by Infinera. Our SEC filings are available on our website at www.infinera.com and the SEC’s website at www.sec.gov. We assume no obligation to, and do not currently intend to, update any such forward-looking statements. |
 3 | © 2015 Infinera Overview of Infinera Transaction Rationale • Advantages for All Stakeholders Deal Logic Industry Evolution A Fair Deal for Transmode Agenda |
 4 | © 2015 Infinera Overview of Infinera |
 5 | © 2015 Infinera Infinera is an Optical Leader Innovator & Long Haul DWDM Leader • Founded 2000, IPO as “INFN” 2007 • Unique Photonic Integrated Circuits (PICs) • DWDM platforms, Intelligent Transport Networks • 400+ Patents Filed/Granted • #1 Optical company rated by Infonetics 2014 Global • ~1,500 employees • Headquarters Sunnyvale, CA, USA • Global presence |
 Infinera’s Journey • 2005: Shipped 10G PIC-based DTN, rapidly reaches $100M • 2008: #1 market share in NA LH* • 2007: 10G wave market leader (47%)*, completed IPO • 2010: Leapfrogs 40G, invests in 100G • 2000: Infinera founded, promised to do the impossible: PICs • 2014: #1 in 100G WDM, ex China* • 2012: Shipped 500G PIC-based DTN-X • 2004: Introduced industry’s first large scale PIC • 2014: Introduced Cloud Xpress for Metro Cloud * Source: Dell’Oro DWDM Long Haul Vendor Table 2015 6 | © 2015 Infinera |
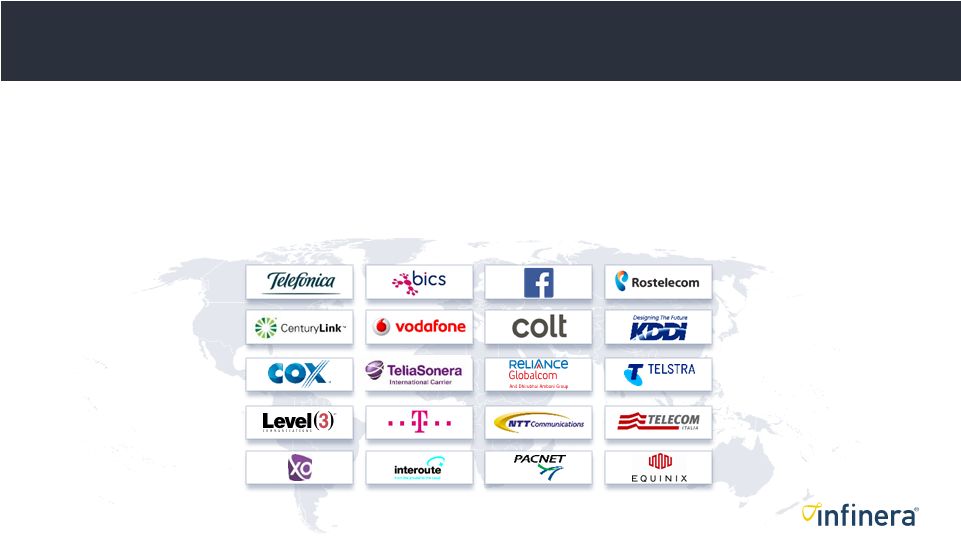 Infinera Today • A leader in Intelligent Transport Network™ solutions • 144 customers in 73 countries; 62 DTN-X customers • Diversified customer base across multiple verticals - 17 Tier 1s globally - 3 of top 4 Internet Content Providers - 4 of top 5 NA Cable/MSOs - Multiple top Wholesale and Enterprise Carriers 7 | © 2015 Infinera |
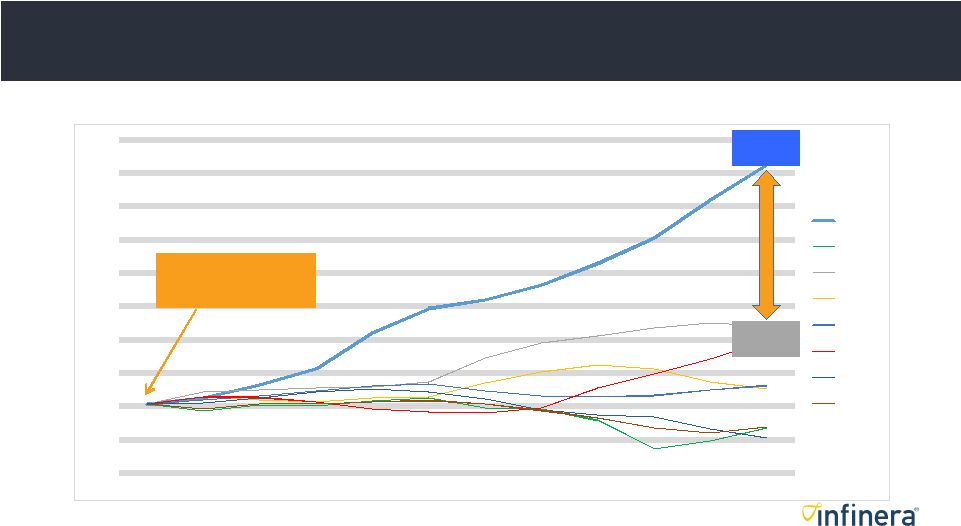 8 | © 2015 Infinera -20% -10% 0% 10% 20% 30% 40% 50% 60% 70% 80% Jun '12 Sep '12 Dec '12 Mar '13 Jun '13 Sep '13 Dec '13 Mar '14 Jun '14 Sep '14 Dec '14 Mar '15 INFN TRMO CIEN JNPR CSCO ADV ERIC ALU INFN Outpacing Other SP Networking Players Source: Company public financial records 3X Rev Growth over CIEN 72% 24% Infinera enters 100G Long Haul Revenue Growth: Quarterly Trailing 12 Month Revenue |
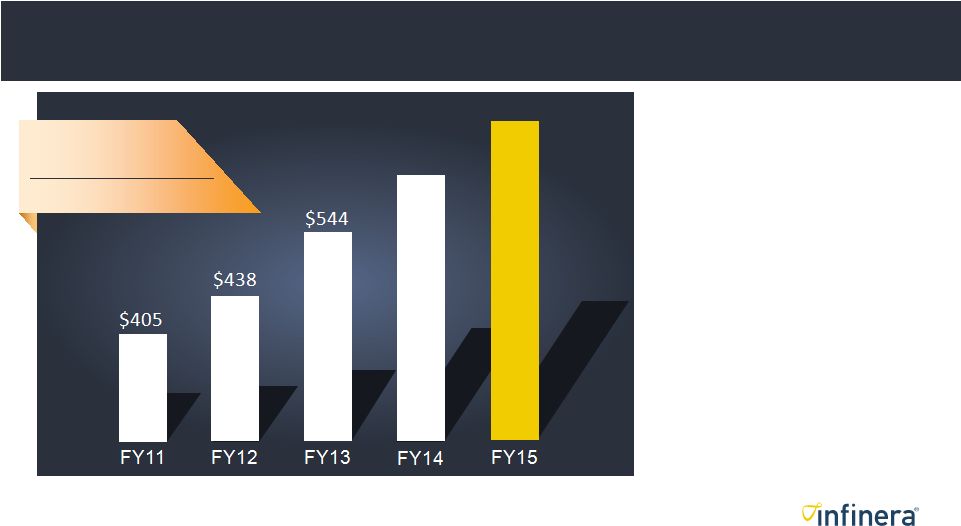 9 | © 2015 Infinera Infinera – Financial Performance Source: Infinera Financial Reporting *Wall Street consensus as of May 19, 2015 **Dell’Oro Group 2014 Optical Transport Report *** Figures are Non-GAAP (reconciliation to GAAP numbers may be found at www.Infinera.com) Recent 20+% growth 2013: 24%; 2014: 23%; 2015e:21%* Increasingly Profitable*** 2014 Gross Margin = 44.0% • Q4 14 = 46.1% • Q1 15 = 47.8% 2014 Operating Margin = 8.3% • Q4 14 = 11.0% • Q1 15 = 12.2% Strong Balance Sheet • Nearly $260 million net cash end of Q1 2015 • Cash Flow from Operations (last four quarters) = $71 million 2014 vs 2013 23% YoY Growth ~2x Market growth ** Revenue $811e* $668 |
 10 | © 2015 Infinera Differentiated Financial Performance Source: Public financial statements; ALU = Entire business YoY Revenue Growth, % 2014 20 10 0 -10 50 40 30 Gross Margin, % 2014 Transmode Ciena ALU Cyan MRV Adva Infinera |
 Transaction Rationale: Advantages for all stakeholders 11 | © 2015 Infinera |
 12 | © 2015 Infinera Infinera + Transmode • End-to-End portfolio, $15.3B market* • Accelerate 100G market momentum • Technology leadership in Photonics, Packet-Optical, ASICs and Network Management • Complementary customers and geographies • Common philosophy of profitable growth • Shared culture and talent driving product excellence • Expected non-GAAP EPS accretive in 2016 Culture Technology Customers Financials *Source: Infonetics Q4 2014 Market Forecast for 2019 |
 13 | © 2015 Infinera Compatible Philosophies • Customer First • Top-rated for Services and Support • Product Excellence • #1 100G WDM Worldwide, ex-China • #1 Packet-Optical EMEA • Unique differentiated technologies • Profitability Focus • Market leading Operating & Gross Margins Source: Infonetics 2014, Dell’Oro 2014 Culture + Talent + Business + Technology |
 14 | © 2015 Infinera A Transaction Good for All Stakeholders Investors • Allows combined company to address $15.3B DWDM TAM (2019) • Combines two of the most profitable companies in the industry • Expected accretive to non-GAAP EPS in 2016; neutral to slightly dilutive 2H’15 Customers • Combined company would be able to deliver an End-to-End product portfolio • Shared culture of customer first, strong technology and product excellence • Scale of combined company allows for further investment in technologies to accelerate & broaden differentiation Employees & Community • Ability to develop compelling solutions with strong combined knowledge base • Deal synergies are revenue-based, not on cost cutting • Intent to invest in Transmode and Swedish engineering talent pool Source of TAM: Infonetics Q4 2014 Market Forecast |
 15 | © 2015 Infinera Deal Logic |
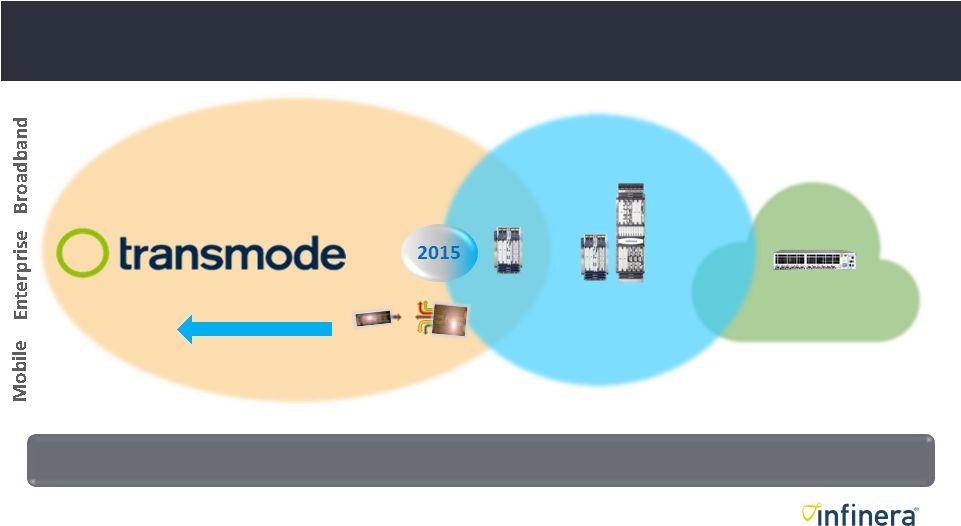 16 | © 2015 Infinera Delivering a Leading End-to-End Portfolio Metro Edge Metro Access Metro Aggregation Metro Core Cloud LH Core Cloud Xpress Sliceable Photonics ePIC-500 oPIC-100 DTN-X XTC4/10 XTC4 Source: Infonetics Q4 2014 Market Forecast Addresses $15.3B (2019) Transport Market |
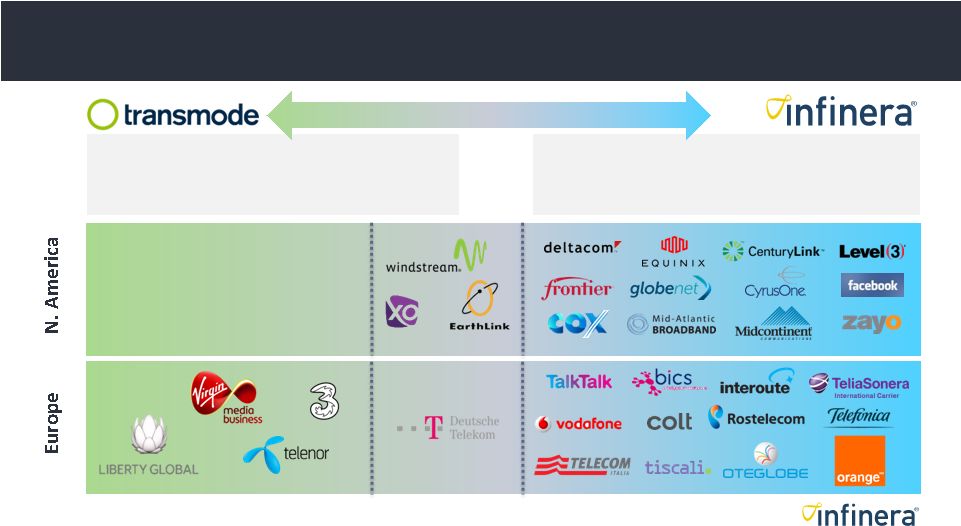 17 | © 2015 Infinera Complementary Customers #1 100G WDM WW ex-China* Leader in ICP, NA Cable, Wholesale & Ent. First mover in Metro Cloud for ICPs #1 Packet-Optical EMEA* Strength in cable, wireless back/front haul, Ethernet services Leverage Strengths, Cross-Sell, New Mkts *Source: Infonetics 2014, Dell’Oro 2014 Revenue Growth Opportunity Common |
 18 | © 2015 Infinera Infinera + Transmode enter Top 5 in WDM Source: Dell’Oro Optical Report Jan 2015 Cross-selling and revenue synergies create opportunity to go higher |
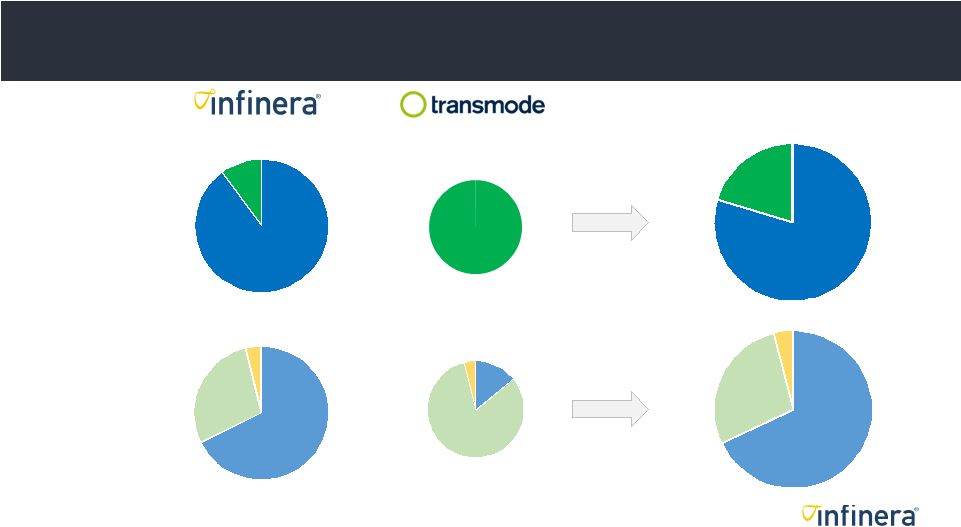 19 | © 2015 Infinera Product Mix* Geographic Mix** Complementary Market Offerings Metro 8% Long-Haul 92% Metro 100% Americas 76% APAC 4% EMEA 20% Americas 14% APAC 4% EMEA 82% Combined Entity Metro ~20% Americas 68% EMEA 28% APAC 4% * Percentages based on 2015 analyst revenue estimates. Infinera Metro includes analyst estimates for Cloud Xpress and other Infinera metro offerings **Geographic mix as of FY14 |
 20 | © 2015 Infinera Industry Evolution |
 21 | © 2015 Infinera WDM Supplier Evolution End-to-End Suppliers Long-Haul Specialists Metro Specialists Circa 2000-2002 Today Consolidation towards end-to-end WDM suppliers underway |
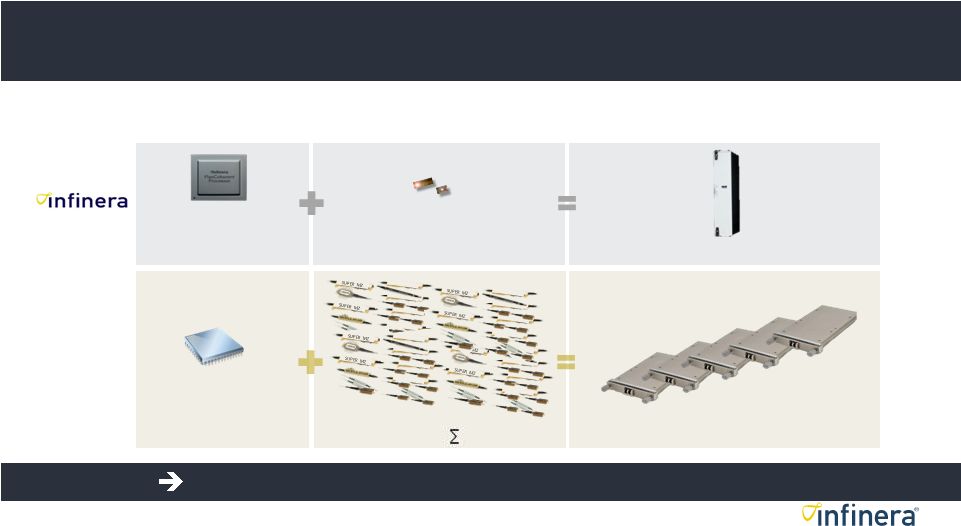 22 | © 2015 Infinera Moving from 10G to 100G = Greater Complexity Alternative Solution Coherent IC (Electronics) Photonics (Optical) 500G Capacity Example 5 modules = more power, space & cost 10G 100G: Increasing advantage for vertically integrated suppliers 3 rd party optics = components 3 rd Gen PIC: 500G “WDM-on-a-chip” FlexCoherent™ Processor (FCP) Coherent ASIC 1 module = less space/power |
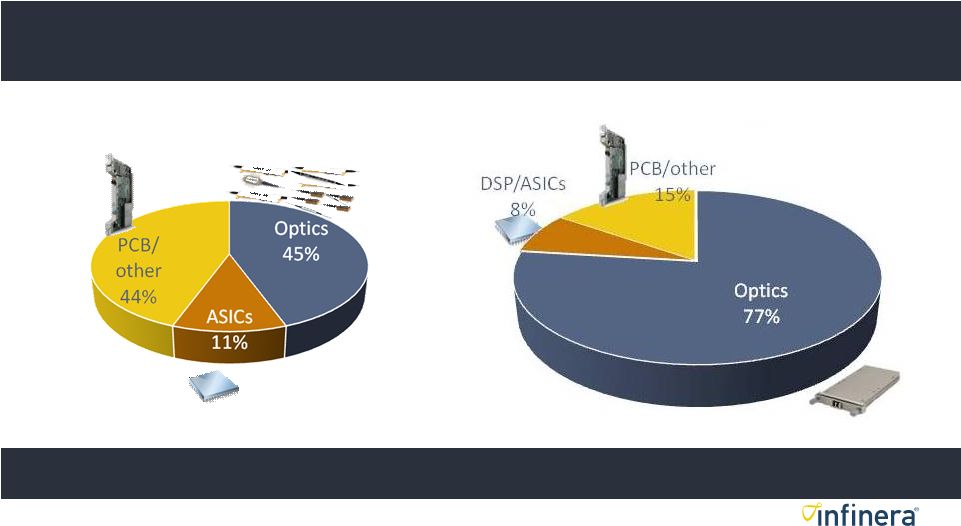 23 | © 2015 Infinera Key to Long-Term Differentiation – Cost Structure 10G 100G Infinera Optics/ASICs + Transmode Metro = Competitive advantage Infinera Internal Estimates |
 24 | © 2015 Infinera A Fair Deal for Transmode |
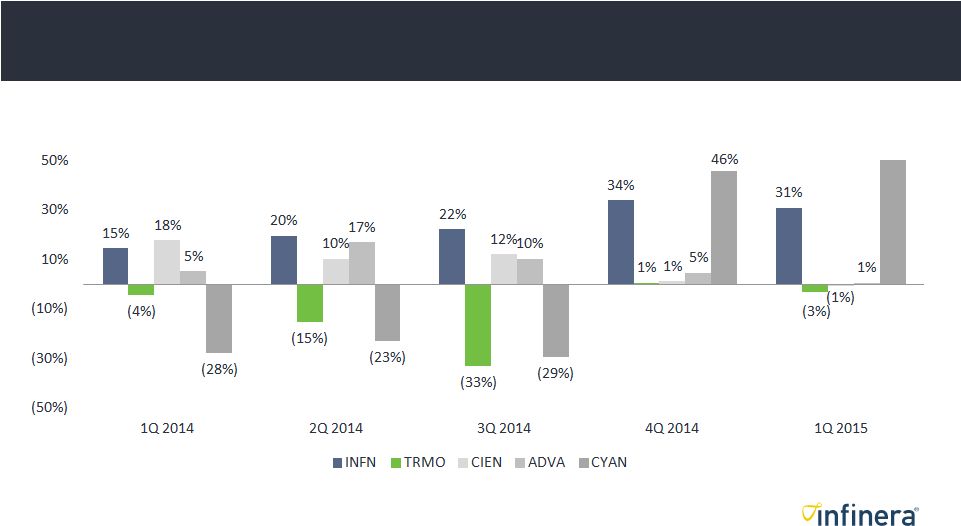
 25 | © 2015 Infinera Quarterly Sales Growth Comparison USDm SEKm (3) Infinera SEKm Transmode In SEK (As Reported)¹ -4% -15% -29% 15% 25% Constant Currency¹ -7% -20% -35% 7% 11% Growth (Y/Y) Growth (Y/Y) In USD (As Reported)² 15% 20% 22% 34% 31% Constant Currency² 14% 19% 22% 36% 35% 1. Source: Transmode Quarterly Reports 2. Source: Infinera Quarterly Reports; constant currency growth uses the same foreign exchange rates that were in effect during the corresponding period in the prior year 3. Represents Infinera revenue converted to SEKm based on average exchange rate during the corresponding quarter |
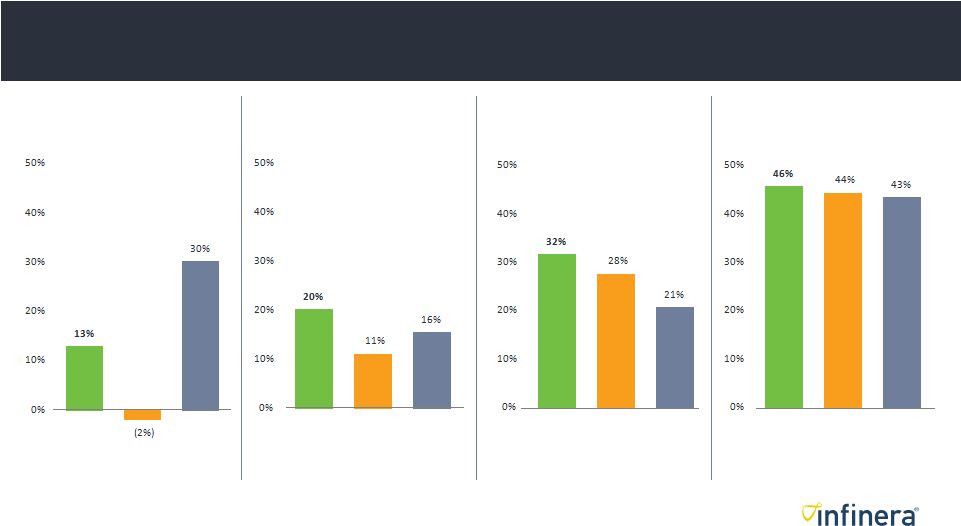
 26 | © 2015 Infinera Quarterly Sales Growth Comparison (Cont’d) Source: Company Quarterly Reports; TRMO and ADVA converted to USD at average SEK / USD and EUR / USD exchange rates, respectively, in effect during the corresponding quarter Y-o-Y Growth (in USD), % Sales Growth of Key Comparables in USD 89% Morgan Stanley Analysis |
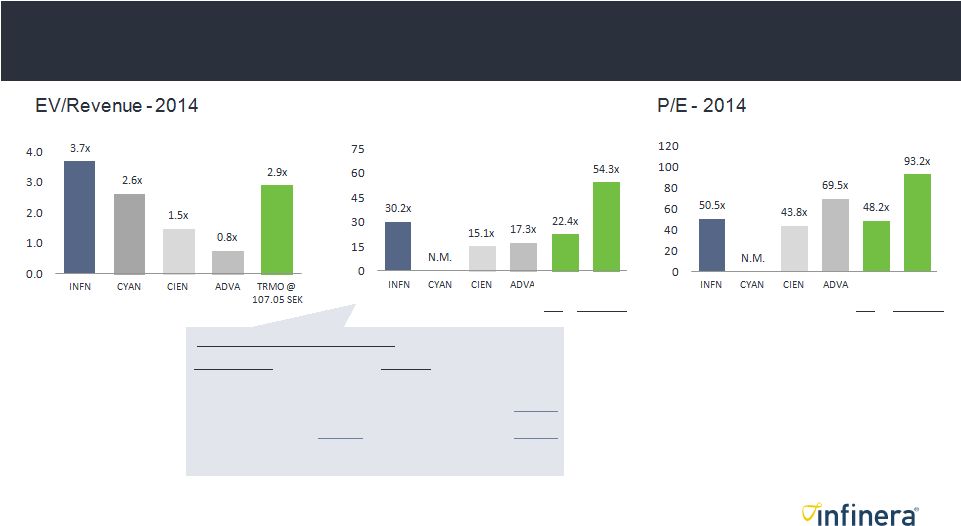 27 | © 2015 Infinera Valuation Comparison – 2014 IFRS (as reported) Adjusted (1) EBITDA 119.5 EBITDA (IFRS) 119.5 Less: Amortized R&D (33.0) Less: Cap R&D Adjustment (70.3) Less: Depreciation / Other (15.9) EBITDA (Adjusted) 49.2 EBIT 70.6 Less: Depreciation (15.9) Margin (%) 7.6% EBIT (Adjusted) 33.3 Margin (%) 3.6% IFRS to US GAAP Adjustments – 2014 (SEKm) EV/EBITDA - 2014 TRMO @ 107.05 SEK IFRS Adjusted (1) • Transmode reports based on IFRS, which allows for capitalization of development expenses (i.e. expenses not deducted for calculating EBITDA) • When adjusting for capitalized R&D, which is not allowed under US GAAP, Transmode’s EBITDA and EBIT margins are lower Source: Data derived from company annual reports; ADVA adjusted for R&D capitalization, which is not allowed under US GAAP 1. After adjusting for the capitalization of R&D, which is not allowed under US GAAP TRMO @ 107.05 SEK IFRS Adjusted (1) Morgan Stanley Analysis |
 28 | © 2015 Infinera Valuation Comparison – 2014 (cont’d) Source: Data derived from company publicly available reports; ADVA adjusted for R&D capitalization, which is not allowed under US GAAP 1. After adjusting for the capitalization of R&D, which is not allowed under US GAAP TRMO @ 107.05 SEK IFRS Adjusted (1) TRMO @ 107.05 SEK IFRS Adjusted (1) IFRS (as reported) Adjusted (1) EBITDA 119.5 EBITDA (IFRS) 119.5 Less: Amortized R&D (33.0) Less: Cap R&D Adjustment (70.3) Less: Depreciation / Other (15.9) EBITDA (Adjusted) 49.2 EBIT 70.6 Less: Depreciation (15.9) Margin (%) 7.6% EBIT (Adjusted) 33.3 Margin (%) 3.6% IFRS to US GAAP Adjustments – 2014 (SEKm) Morgan Stanley Analysis |
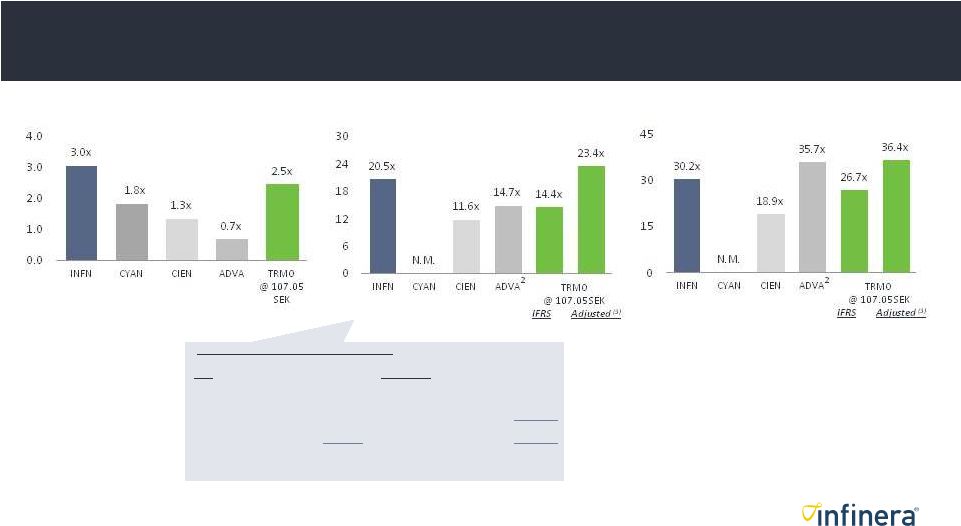 29 | © 2015 Infinera Valuation Comparison – 2015 EV/Revenue - 2015 • Transmode reports based on IFRS, which allows for capitalization of development expenses (i.e. expenses not deducted for calculating EBITDA) • When adjusting for capitalized R&D, which is not allowed under US GAAP, Transmode’s EBITDA and EBIT margins are lower EV/EBITDA - 2015 IFRS Adjusted (3) EBITDA 185.3 EBITDA (IFRS) 185.3 Less: Amortized R&D (1) (33.7) Less: Cap R&D Adjustment (71.0) (2) Less: Depreciation (16.3) EBITDA (Adjusted) 114.3 EBIT 135.3 Less: Depreciation (16.3) Margin (%) 12.4% EBIT (Adjusted) 98.0 Margin (%) 9.0% IFRS to US GAAP Adjustments - 2015 (SEKm) Source: Based on analyst estimates as of May 22, 2015 1. Assumes capitalized R&D adjustment of 71.0 SEKm based on the sum of (a) estimated amortization of capitalized R&D of 33.7 SEKm (assumes same proportion of depreciation and amortization as in 2014) and (b) the increase in capitalized development costs of 37.3 SEKm (assumed equal to 2014 amount) 2. ADVA adjusted for R&D capitalization, which is not allowed under US GAAP 3. After adjusting for the capitalization of R&D, which is not allowed under US GAAP P/E - 2015 Morgan Stanley Analysis |
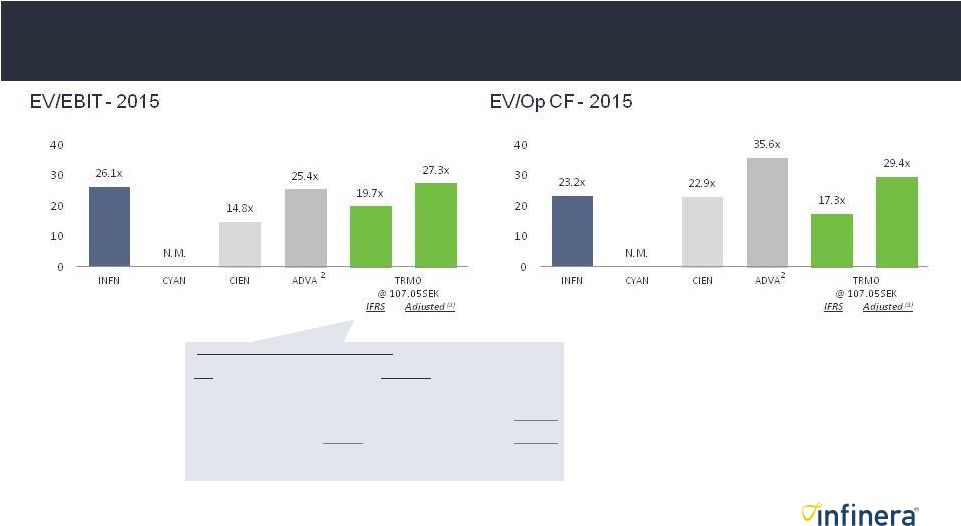 30 | © 2015 Infinera Valuation Comparison – 2015 (cont’d) IFRS Adjusted (3) EBITDA 185.3 EBITDA (IFRS) 185.3 Less: Amortized R&D (1) (33.7) Less: Cap R&D Adjustment (71.0) (3) Less: Depreciation (16.3) EBITDA (Adjusted) 114.3 EBIT 135.3 Less: Depreciation (16.3) Margin (%) 12.4% EBIT (Adjusted) 98.0 Margin (%) 9.0% IFRS to US GAAP Adjustments - 2015 (SEKm) Source: Based on analyst estimates as of May 22, 2015 1. Assumes capitalized R&D adjustment of 71.0 SEKm based on the sum of (a) estimated amortization of capitalized R&D of 33.7 SEKm (assumes same proportion of depreciation and amortization as in 2014) and (b) the increase in capitalized development costs of 37.3 SEKm (assumed equal to 2014 amount) 2. ADVA adjusted for R&D capitalization, which is not allowed under US GAAP 3. After adjusting for the capitalization of R&D, which is not allowed under US GAAP Morgan Stanley Analysis |
 31 | © 2015 Infinera Comparison of Transaction Premiums 1. As disclosed 2. As calculated based on market data from Bloomberg 1-Month VWAP 3-Month VWAP 6-Month VWAP Spot Alcatel / Nokia (2) Cyan / Ciena (2) Transmode / Infinera (2) Alcatel / Nokia (2) Cyan / Ciena (2) Transmode / Infinera (1) Alcatel / Nokia (2) Cyan / Ciena (2) Transmode / Infinera (1) Alcatel / Nokia (2) Cyan / Ciena (2) Transmode / Infinera (1) Morgan Stanley Analysis |
 32 | © 2015 Infinera Analysts Views on Infinera Broker Target Price Rating Jefferies $27.00 Buy Barrington $26.50 Buy MKM Partners $26.00 Buy JP Morgan $26.00 Buy Deutsche Bank $25.00 Buy Stifel Nicolaus $25.00 Buy Juda Group $24.00 Buy William Blair No target Buy Goldman Sachs $23.00 Hold Wedbush $18.00 Hold Needham No target Hold Consensus Target Price = $24.50 Price (5/19/15) = $20.20 |
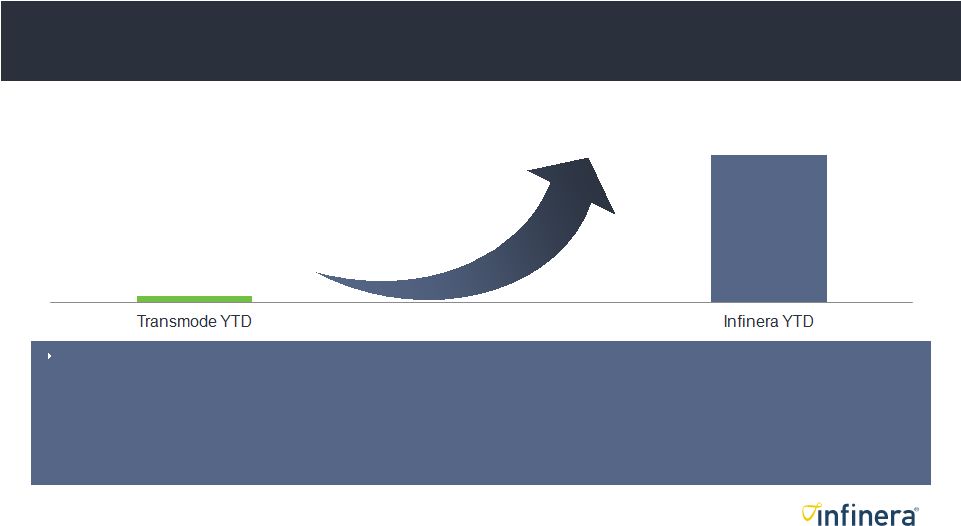 33 | © 2015 Infinera Significant Increase in Liquidity 1. Assumes sell-down at 20% of average daily volume traded (based on assumption that future trading volume similar to YTD volume) 2. As of May 22, 2015; market data from Bloomberg 3. Liquidity based on average daily trading volume year-to-date Significant increase in Transmode’s stock liquidity expected • 28.05 SEK cash per share at closing • Full liquidity – No single investor (x-POD) expected to hold more than 1 day of trading volume – ALL investors (x-POD) expected to hold less than 5 days of trading volume • A 1% stake in Transmode currently takes ~8 weeks to liquidate based on average volume, whereas post-transaction the equivalent stake would take <1 day to liquidate (1) • Exploring Stockholm listing ~75x Greater Liquidity 35K Shares / Day ~SEK3.0 MM / Day (~US$365 K / Day) ~0.1% TSO 1.9MM Shares / Day ~US$26.5 MM / Day ~1.5% TSO Average Trading Volume YTD vs. Expected Post Deal 1 Morgan Stanley Analysis |
 34 | © 2015 Infinera This communication is neither an offer to purchase nor a solicitation of an offer to sell any shares. This communication is for informational purpose only. The exchange offer for shares of Transmode AB will not be made to, nor will exchanges be accepted from, or on behalf of, holders of shares in any jurisdiction in which the making of the exchange offer or the acceptance thereof would not comply with the laws of that jurisdiction. The acceptance period for the exchange offer for shares of Transmode described in this communication has not commenced. In connection with the proposed combination of Infinera and Transmode, Infinera will file an offer document with the Swedish Financial Supervisory Authority and a prospectus and a Registration Statement on Form S-4 with the SEC. Shareholders of Transmode should read the above referenced documents and materials carefully when such documents and materials become available because they contain important information about the transaction. Shareholders of Transmode may obtain free copies of these documents and materials, any amendments or supplements thereto and other documents containing important information about Infinera and the transaction, once such documents and materials are filed or furnished, as applicable, with the SEC, through the website maintained by the SEC at www.sec.gov. Copies of the documents and materials filed with the SEC by Infinera will also be available free of charge on Infinera’s website at www.infinera.com under the heading “SEC Filings” in the “Company—Investor Relations” portion of Infinera’s website. More information about the exchange offer, including the formal announcement of the offer and the offer document to be filed with and approved by the Swedish Financial Supervisory Authority, can be found on www.infinera.se. Disclaimer |
 35 | © 2015 Infinera Thank You www.infinera.com |