Gulf South Bank Conference
This presentation contains forward-looking statements, as defined by Federal securities laws, relating to present or future trends or factors affecting the operations, markets and products of First Security Group, Inc. These statements are provided to assist in the understanding of future financial performance. Any such statements are based on current
expectations and involve a number of risks and uncertainties. For a discussion of factors that may cause such forward-looking statements to differ materially from actual results, please refer to First Security’s most recent documents filed with the Securities and Exchange Commission.
First Security undertakes no obligation to release revisions to these forward-looking statements or reflect events or circumstances after the date of this presentation.
Forward-Looking Statements
GAAP Reporting versus Operating Results
This presentation contains references to operating results. These amounts and ratios are calculated using net operating income (net of tax) which excludes extraordinary items as defined by GAAP and non-recurring items. Furthermore and in accordance with SNL Financial practice, our core efficiency ratio is calculated on a fully tax equivalent basis excluding one-time and non-cash items. Since these items and their impact on First Security's performance are difficult to predict, First Security believes presentation of its financial measures excluding the impact of these items is useful information and important for a complete understanding of its core operating results. Reconciliations for each core number are included in the first quarter earnings release which is available on First Security’s website, www.FSGBank.com.
•
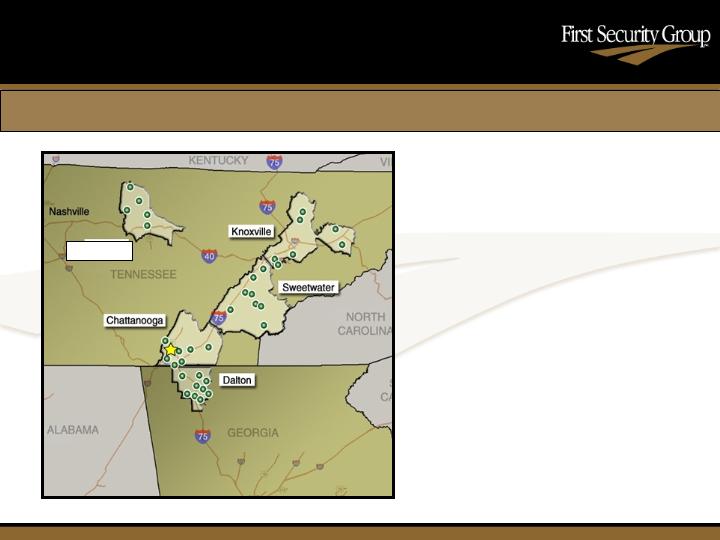
Headquarters in Chattanooga, Tennessee
•
Six years in operation as First Security; founded in Sept,1999 by current management team
•
37 banking offices and 4 leasing offices in Tennessee and north Georgia
•
Strategic focus on small to medium-sized owner-managed businesses and consumers
•
17.6 million shares outstanding
•
Listed on Nasdaq NM under FSGI in August 2005
•
Market capitalization of $199 million*
•
Institutions hold 23.8% of shares
•
Average daily trading volume (3-months) is 27,400 shares
•
Earnings momentum from organic growth and acquisitions
•
Excellent core deposit base
•
Infrastructure in place to support additional growth
•
Experienced management team in all First Security markets
Management Team with Extensive In-Market Experience
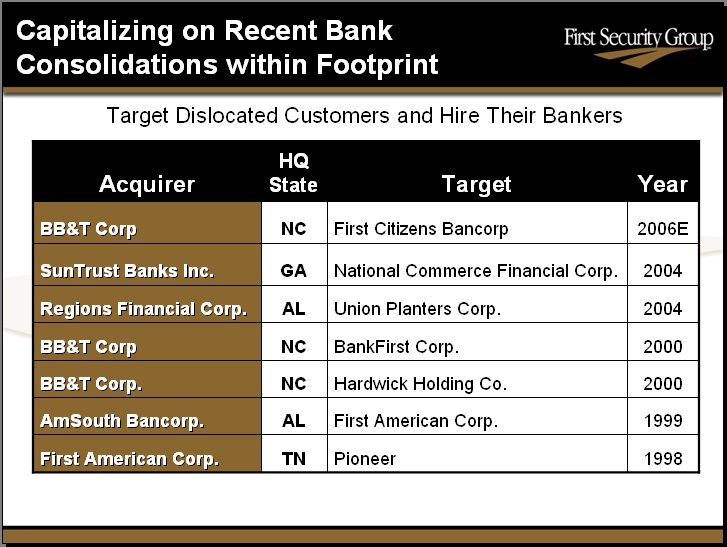
Capitalizing on Recent Bank Consolidations within Footprint Target Dislocated Customers and Hire Their Bankers Acquirer HQ State Target Year BB&T Corp NC First Citizens Bancorp 2006E SunTrust Banks Inc. GA National Commerce Financial Corp. 2004 Regions Financial Corp. AL Union Planters Corp. 2004 BB&T Corp NC BankFirst Corp. 2000 BB&T Corp. NC Hardwick Holding Co. 2000 AmSouth Bancorp. AL First American Corp. 1999 First American Corp. TN Pioneer 1998

Organic Growth Opportunities Share of deposits for top 10 banks within footprint of FSGI* Rank Institution HQ State In-Market Deposits ($000) Market Share (%) # Branches 1 First Horizon TN 3,323.6 19.4 53 2 SunTrust GA 2,947.9 17.2 59 3 AmSouth AL 2,434.9 14.2 51 4 Home Federal Bank TN 1,144.0 6.7 16 5 BB&T Corp. NC 1,113.8 6.5 25 6 First Security Group, Inc. TN 851.0 5.0 35 7 Regions Financial Corp. AL 680.3 4.0 27 8 Wachovia Corp. NC 481.9 2.8 6 9 Bank of America NC 369.4 2.2 9 10 NW Services Corp. GA 349.6 2.0 5 *Source: SNL based on June 2005 FDIC call reports
Organized into Five Regions
•
Regional bank presidents•
Local strategies and identities
•
Knowledge of local markets
•
Serve small and medium-sized businesses within each market
•
Customers get to know their bankers
~ A Focus on Personalized Sales and Service ~
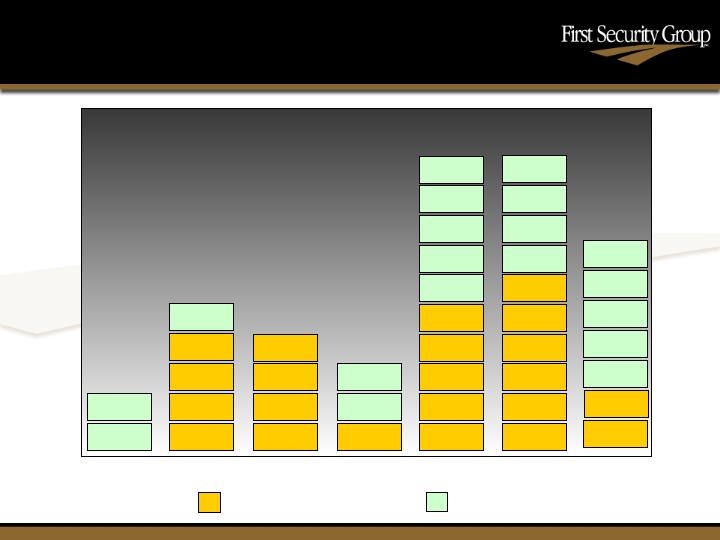
1999 2000 2001 2002 2003 2004 2005
More Offices Make Banking More Convenient
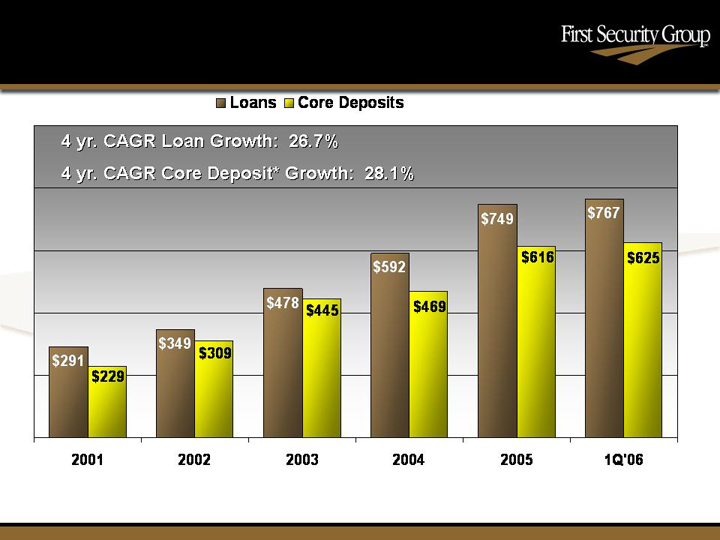
* Core deposits = Transaction accounts + Retail CDs
Strong Deposit and Loan Growth
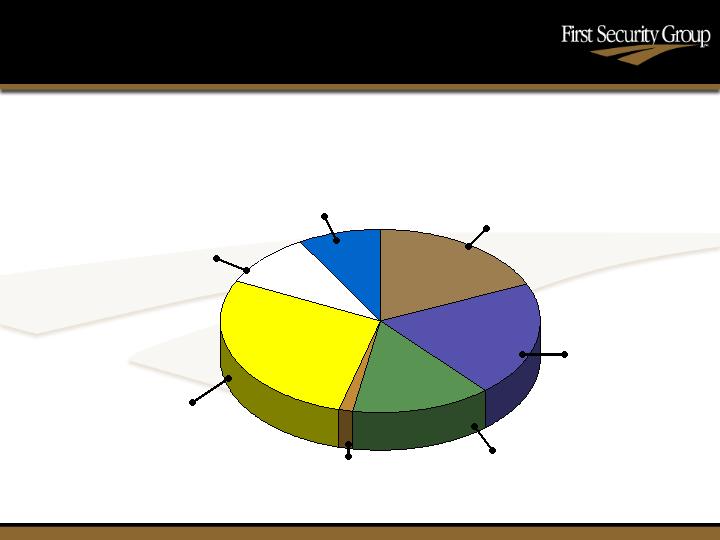
1-4 Family
Residential,
28%
Construction/
Land Development,
18%
Total loans = $766.6 million at March 31, 2006
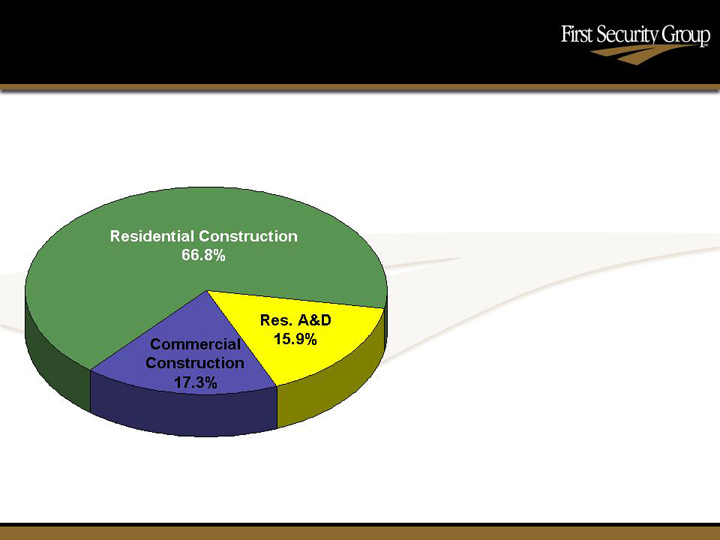
Portfolio Mix Reflects Market Opportunities
$139.8 MM at March 31, 2006
•
Granular: top 10 relationships total 23.7% of portfolio
•
Asset quality high: no past dues at quarter-end & no NCOs for 2 years
Construction & Development Loans
•
Avg. cost of deposits is 2.59%
•
Brokered CDs fund leasing company
Total Deposits = $882.5 million at March 31, 2006
Deposits are Low-Cost & Stable
•
Equipment leasing through J&S Leasing, Inc. and Kenesaw Leasing, Inc.
•
Leases construction equipment, trucks, tractors and trailers
•
$64.6 million outstanding at average yield of 13.49%
•
Offers private banking, financial planning, asset management and trust services
•
Achieved breakeven in 18 months
•
Expanded mortgage banking operations
•
2005 mortgage originations totaled $85.3 million; 1Q 2006 were $18.3 million
Diversifying Our Revenue Stream
Decentralized Sales & Service with Centralized Operations
•
Back office activities centralized at holding company level:
–
Credit Administration/Collection & Recoveries
–
Human Resources/Training
–
Risk Management/Audit, Compliance & Loan Review
–
Treasury/ALCO Management
•
Focus on localized delivery of sales and service
–
Decision-making structured for growth
•
New headquarters building to be completed 3Q 2006
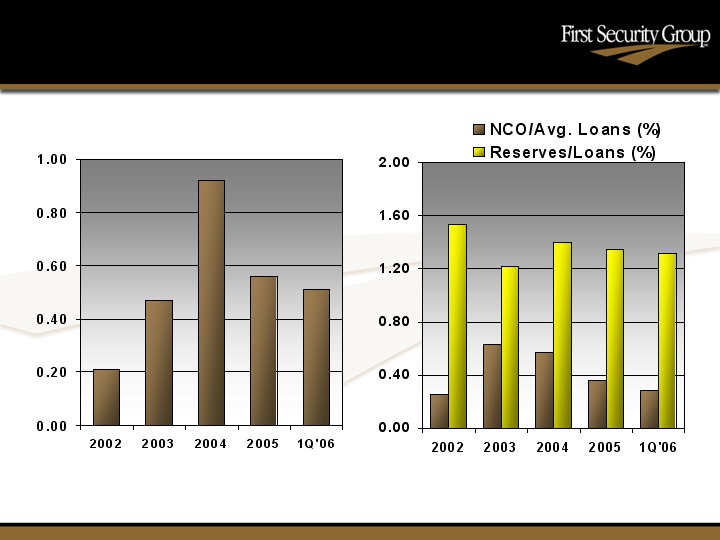
Non- Performing Assets + 90 days
as a % of Total Assets
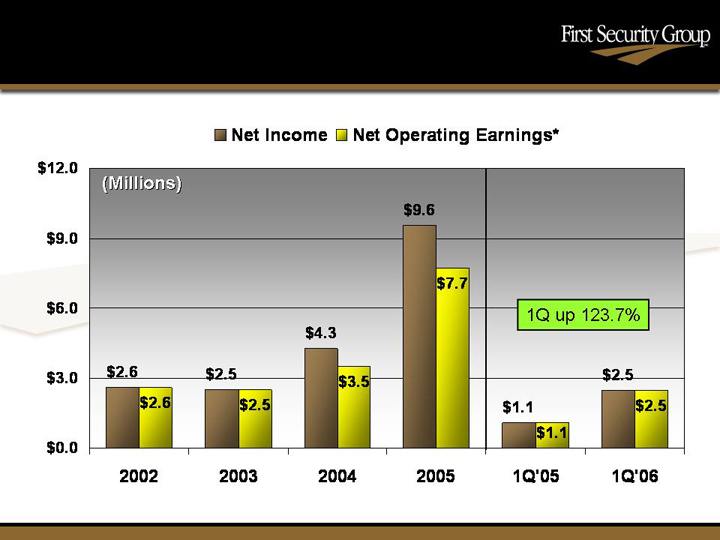
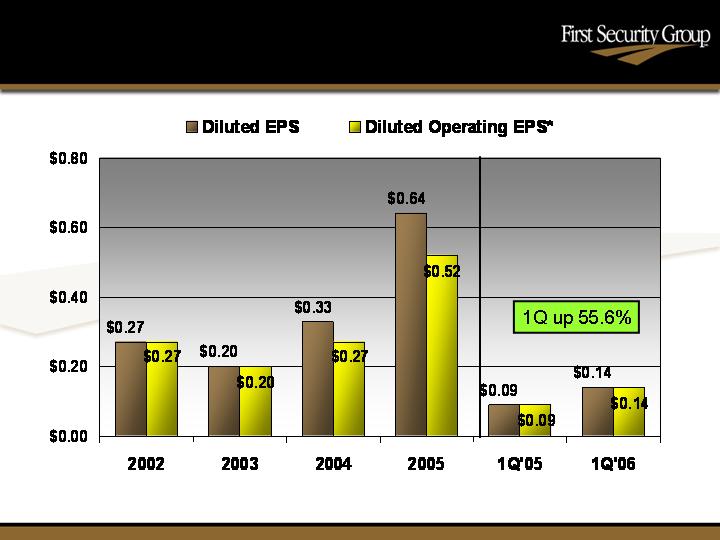
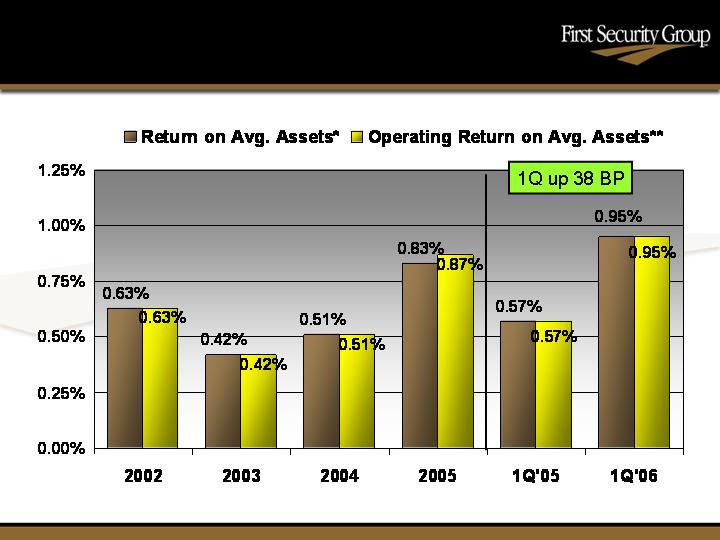
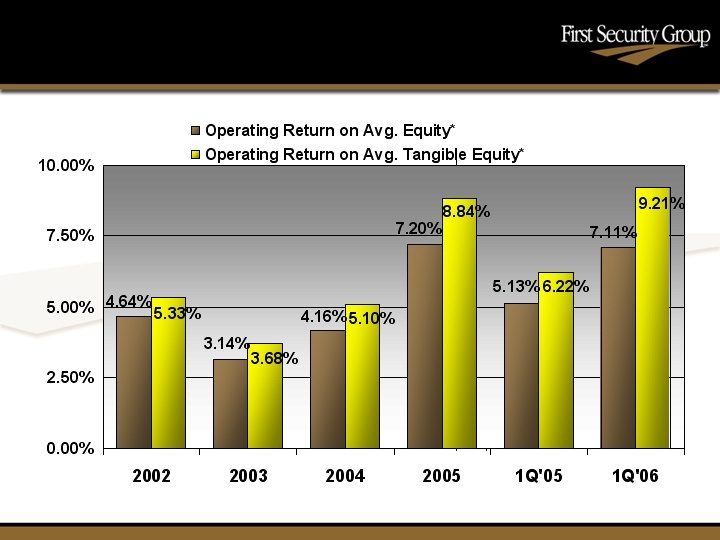
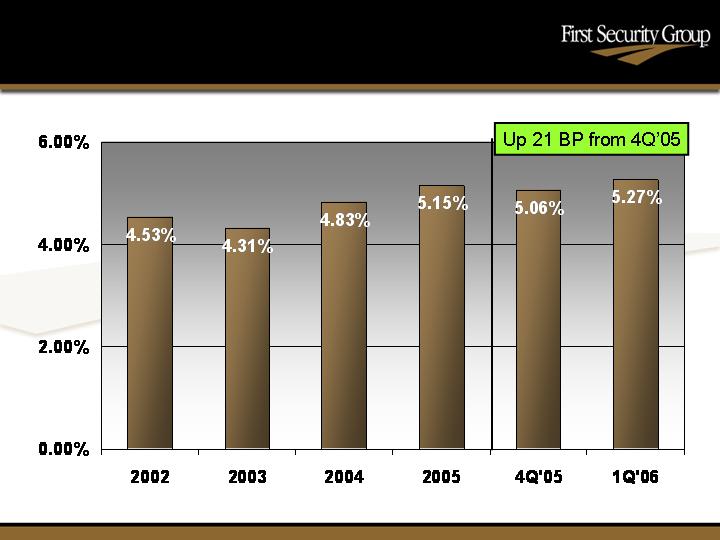
2005 Results: A Balanced Performance 2004 2005 ∆% Net Operating Income* ($M) 3,482 7,742 +122.3% Diluted Operating EPS* ($) 0.27 0.52 +92.6% Operating ROATE*(%) 5.10 8.84 +73.3% Operating ROAA* (%) 0.51 0.87 +70.6% NIM, TE (%) 4.83 5.15 +6.6% Core Efficiency Ratio** (%) 73.04 66.34 -9.2% * Before extraordinary and non-recurring items** Before extraordinary, nonrecurring and non-cash items
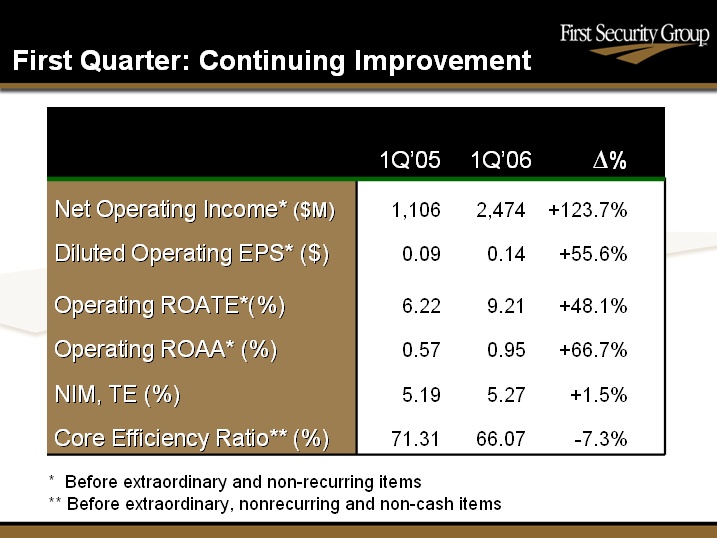
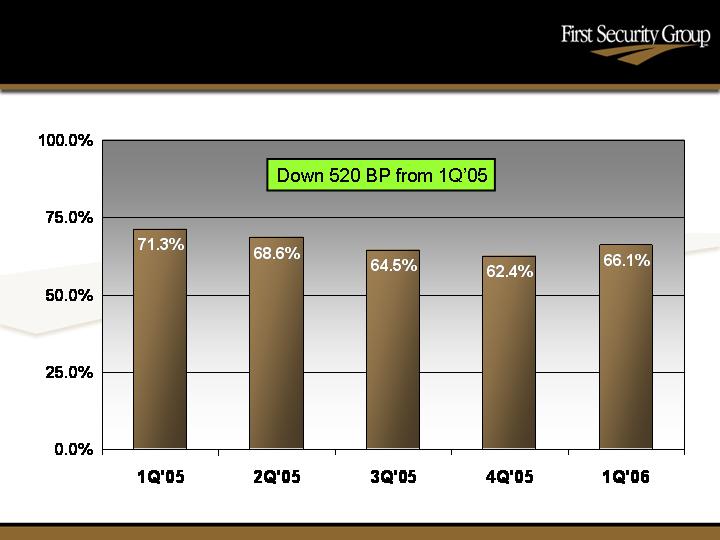
First Quarter: Continuing Improvement 1Q’05 1Q’06 ∆% Net Operating Income* ($M) 1,106 2,474 +123.7% Diluted Operating EPS* ($) 0.09 0.14 +55.6% Operating ROATE*(%) 6.22 9.21 +48.1% Operating ROAA* (%) 0.57 0.95 +66.7% NIM, TE (%) 5.19 5.27 +1.5% Core Efficiency Ratio** (%) 71.31 66.07 -7.3% * Before extraordinary and non-recurring items** Before extraordinary, nonrecurring and non-cash items
* Excludes extraordinary and non-recurring items
* Excludes extraordinary and non-recurring items.
* Excludes extraordinary items
** Excludes extraordinary and non-recurring items.
* Excludes extraordinary and non-recurring items.
* Excludes extraordinary, non-recurring and non-cash items.
520 Basis Point Improvement Over Past 12 Months
*Annualized first quarter data
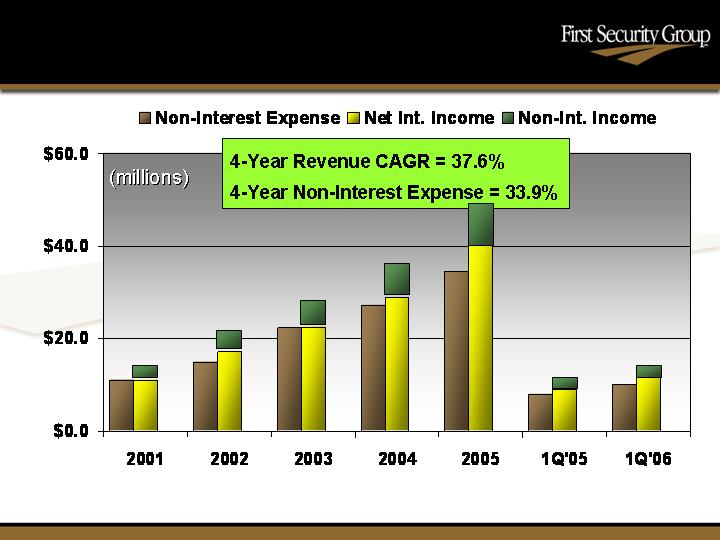
Improved Operating Leverage
Market Statistics | FSGI |
| | |
Price*/ Book | 144% |
| | |
Price*/ Tangible Book | 188% |
| | |
Price*/ LTM Core EPS | 20X |
| | |
Proj. ‘06 Core EPS Growth** | 17% |
* Based on closing price on 4/21/06 ** Based on consensus forecast by all covering analysts
•
Leverage the existing franchise
•
Maintain strong asset quality
•
Maintain balance between growth and profitability
•
Goals over the next three years include:
•
Annual earnings per share growth > 15%
•
Annual balance sheet growth: 8% -12%
•
Incentives align to achieve performance goals
•
Position FSGI as one of the preeminent Tennessee franchises