UNITED STATES
SECURITIES AND EXCHANGE COMMISSION
WASHINGTON, D.C. 20549
FORM 10-K
ANNUAL REPORT PURSUANT TO SECTION 13 OR 15(d)
OF THE SECURITIES EXCHANGE ACT OF 1934
(Mark One)
| x | ANNUAL REPORT PURSUANT TO SECTION 13 OR 15(d) OF THE SECURITIES EXCHANGE ACT OF 1934 |
For the fiscal year ended December 31, 2006
OR
| ¨ | TRANSITION REPORT PURSUANT TO SECTION 13 OR 15(d) OF THE SECURITIES EXCHANGE ACT OF 1934 |
For the transition period from to
Commission File No. 000-49747
FIRST SECURITY GROUP, INC.
(Exact Name of Registrant as Specified in its Charter)
| | |
| Tennessee | | 58-2461486 |
| (State of Incorporation) | | (I.R.S. Employer Identification No.) |
| |
| 531 Broad Street, Chattanooga, TN | | 37402 |
| (Address of principal executive offices) | | (Zip Code) |
(423) 266-2000
(Registrant’s telephone number, including area code)
Securities Registered Pursuant to Section 12(b) of the Act:
| | |
Title of Each Class | | Name of Each Exchange on Which Registered |
| Common Stock, $.01 par value | | The NASDAQ Stock Market LLC |
Securities Registered Pursuant to Section 12(g) of the Act:
None
Indicate by check mark if the registrant is a well-known seasoned issuer, as defined in Rule 405 of the Securities Act. Yes ¨ No x
Indicate by check mark if the registrant is not required to file reports pursuant to Section 13 or Section 15(d) of the Exchange Act. Yes ¨ No x
Indicate by check mark whether the Registrant (1) has filed all reports required to be filed by Section 13 or 15(d) of the Securities and Exchange Act of 1934 during the preceding 12 months (or for such shorter period that the Registrant was required to file such reports), and (2) has been subject to such filing requirements for the past 90 days. Yes x No ¨
Indicate by check mark if disclosure of delinquent filers pursuant to Item 405 of Regulation S-K (229.405 of this chapter) is not contained herein, and will not be contained, to the best of registrant’s knowledge, in definitive proxy or information statements incorporated by reference in Part III of this Form 10-K or any amendment to this Form 10-K. ¨
Indicate by check mark whether the registrant is a large accelerated filer, an accelerated filer, or a non-accelerated filer. See definition of “accelerated filer and large accelerated filer” in Rule 12b-2 of the Exchange Act.
| | | | |
Large accelerated filer ¨ | | Accelerated filer x | | Non-accelerated filer ¨ |
Indicate by check mark whether the registrant is a shell company (as defined in Rule 12b-2 of the Exchange Act). Yes ¨ No x
The aggregate market value of the registrant’s outstanding common stock held by nonaffiliates of the registrant as of June 30, 2006, was approximately $193,912,699, based on the registrant’s closing sales price as reported on the NASDAQ Global Select Market. There were 17,720,658 shares of the registrant’s common stock outstanding as of March 1, 2007.
DOCUMENTS INCORPORATED BY REFERENCE
| | |
Document | | Parts Into Which Incorporated |
Proxy Statement for the Annual Meeting of Shareholders to be held June 14, 2007 | | Part III |
TABLE OF CONTENTS
i
CAUTIONARY NOTE REGARDING FORWARD-LOOKING STATEMENTS
Some of our statements contained in this prospectus, including, without limitation, matters discussed under the caption “Management’s Discussion and Analysis of Financial Condition and Results of Operation,” are “forward-looking statements” within the meaning of the Private Securities Litigation Reform Act of 1995. Forward-looking statements relate to future events or our future financial performance and include statements about the competitiveness of the banking industry, potential regulatory obligations, our entrance and expansion into other markets, our other business strategies and other statements that are not historical facts. Forward-looking statements are not guarantees of performance or results. When we use words like “may,” “plan,” “contemplate,” “anticipate,” “believe,” “intend,” “continue,” “expect,” “project,” “predict,” “estimate,” “could,” “should,” “would,” “will,” and similar expressions, you should consider them as identifying forward-looking statements, although we may use other phrasing. These forward-looking statements involve risks and uncertainties and are based on our beliefs and assumptions, and on the information available to us at the time that these disclosures were prepared.
These forward-looking statements involve risks and uncertainties and may not be realized due to a variety of factors, including, but not limited to the following:
| | • | | the effects of future economic conditions; |
| | • | | governmental monetary and fiscal policies, as well as legislative and regulatory changes; |
| | • | | the risks of changes in interest rates on the level and composition of deposits, loan demand and the values of loan collateral, securities and interest sensitive assets and liabilities; |
| | • | | the effects of the war on terrorism, and more specifically the United States led war in Iraq; |
| | • | | interest rate and credit risks; |
| | • | | the effects of competition from other commercial banks, thrifts, mortgage banking firms, consumer finance companies, credit unions, securities brokerage firms, insurance companies, money market and other mutual funds and other financial institutions operating in our market area and elsewhere, including institutions operating regionally, nationally and internationally, together with such competitors offering banking products and services by mail, telephone and the Internet; |
| | • | | the effect of any mergers, acquisitions or other transactions, including the Jackson Bank acquisition, to which we or our subsidiary may from time to time be a party, including, without limitation, our ability to successfully integrate any businesses that we acquire; and |
| | • | | the failure of assumptions underlying the establishment of reserves for possible loan losses. |
All written or oral forward-looking statements attributable to us are expressly qualified in their entirety by this Cautionary Note. Our actual results may differ significantly from those we discuss in these forward-looking statements.
For other factors, risks and uncertainties that could cause our actual results to differ materially from estimates and projections contained in these forward-looking statements, please read the “Risk Factors” section of this Annual Report beginning on page 19.
ii
PART I
Unless otherwise indicated, all references to “First Security,” “we,” “us,” and “our” in this Annual Report on Form 10-K refer to First Security Group, Inc. and our wholly-owned subsidiary, FSGBank, National Association (FSGBank).
BUSINESS
First Security Group, Inc.
We are a bank holding company headquartered in Chattanooga, Tennessee. We operate 38 full service banking offices and three loan and lease production offices through our wholly-owned bank subsidiary, FSGBank. We serve the banking and financial needs of various communities in eastern and middle Tennessee and northern Georgia.
Through FSGBank, we offer a range of lending services which are primarily secured by single and multi-family real estate, residential construction and owner-occupied commercial buildings. In addition, we make loans to small and medium-sized businesses, as well as to consumers for a variety of purposes. Our principal source of funds for loans and investing in securities is core deposits. We offer a wide range of deposit services, including checking, savings, money market accounts and certificates of deposit. We obtain most of our deposits from individuals and businesses in our market areas. We actively pursue business relationships by utilizing the business contacts of our Board of Directors, senior management and local bankers, thereby capitalizing on our knowledge of the local marketplace.
First Security Group, Inc. was incorporated in 1999 as a Tennessee corporation to serve as a bank holding company, and is regulated and supervised by the Board of Governors of the Federal Reserve System (Federal Reserve Board). As of December 31, 2006, we had total assets of approximately $1.1 billion, total deposits of approximately $922.0 million and shareholders’ equity of approximately $144.8 million.
FSGBank, National Association
FSGBank operates 38 full-service banking-offices and three loan and lease production offices along the Interstate corridors of eastern and middle Tennessee and northern Georgia, and is primarily regulated by the Office of the Comptroller of the Currency (OCC). In Dalton, Georgia, FSGBank operates under the name of Dalton Whitfield Bank, while FSGBank operates under the name of Jackson Bank & Trust along the Interstate 40 corridor. FSGBank also provides trust and investment management, mortgage banking, asset-based lending, financial planning and Internet banking (www.FSGBank.com) services, as well as equipment leasing through its wholly owned subsidiaries, Kenesaw Leasing and J&S Leasing. FSGBank operates two of its full-service banking offices in Dalton, Georgia under the name Primer Banco Seguro, which is an initiative marketed toward and serving Northwest Georgia’s rapidly growing Latino population.
FSGBank is the successor to our three previous banks: Dalton Whitfield Bank (organized in 1999), Frontier Bank (acquired in 2000) and First State Bank (acquired in 2002). From December 31, 2001 to December 31, 2006, our business model has produced strong results through a combination of internal growth and acquisitions. Specifically, we have:
| | • | | increased our total consolidated assets from $472.9 million to $1.1 billion; |
| | • | | increased our total consolidated deposits from $384.5 million to $922.0 million; |
| | • | | increased our total consolidated net loans from $343.2 million to $837.6 million; |
| | • | | expanded our branch network from 24 branches to 38 branches; and |
| | • | | successfully integrated all of our banking subsidiaries into a single national bank. |
1
Dalton Whitfield Bank was a state bank organized under the laws of Georgia engaged in a general commercial banking business. Dalton Whitfield Bank opened for business in September 1999, and simultaneously acquired selected assets and substantially all of the deposits of Colonial Bank’s three branches located in Dalton, Georgia. In 2003, Premier National Bank of Dalton merged with and into Dalton Whitfield Bank for an aggregate purchase price of $11.7 million in cash and stock.
Frontier Bank was a state savings bank organized under the laws of Tennessee in 2000 as First Central Bank of Monroe County. We acquired First Central Bank of Monroe County in 2000 for an aggregate purchase price of $2.3 million in cash. After the acquisition, First Central Bank of Monroe County was renamed Frontier Bank and re-chartered as a state bank under the laws of Tennessee to engage in a general commercial banking business. Outside of the Chattanooga market, Frontier Bank operated under the name of “First Security Bank.”
First State Bank was a state bank organized under the laws of Tennessee engaged in a general commercial banking business since its organization in 1974. We acquired First State Bank in 2002 for an aggregate purchase price of $8.6 million in cash.
During 2003, we converted each of our three subsidiary banks into national banks, renamed each bank “FSGBank, National Association” and merged the banks under the charter previously held by Frontier Bank. As a result, we consolidated our banking operations into one subsidiary, FSGBank. FSGBank currently conducts its banking operations in Dalton, Georgia under the names “Dalton Whitfield Bank” and “Primer Banco Seguro.” Primer Banco Seguro is our Latino-focused banking initiative. In addition, FSGBank’s banking operations in Ringgold, Georgia are conducted under the name “Catoosa Community Bank.”
Since the mergers in 2003, FSGBank has continued the commercial banking business of its predecessors. In addition, in December of 2003, FSGBank acquired certain assets and assumed substantially all of the deposits and other liabilities of National Bank of Commerce’s three branch offices located in Madisonville, Sweetwater and Tellico Plains, Tennessee.
In October 2004, FSGBank acquired 100% of the capital stock of Kenesaw Leasing and J&S Leasing, both Tennessee corporations, from National Bank of Commerce for $13.0 million in cash. Both companies continue to operate as wholly-owned subsidiaries of FSGBank. Kenesaw Leasing leases new and used equipment, fixtures and furnishings to owner-managed businesses, while J&S Leasing leases forklifts, heavy equipment and other machinery primarily to companies in the trucking and construction industries.
In August 2005, we acquired Jackson Bank & Trust (Jackson Bank) for an aggregate purchase price of $33.3 million in cash. Jackson Bank was a state commercial bank headquartered in Gainesboro, Tennessee. Jackson Bank was merged into FSGBank, but we continue to operate our banking operations in Jackson and Putnam Counties, Tennessee under the name of “Jackson Bank & Trust.”
FSGBank is a member of the Federal Reserve Bank of Atlanta and a member of the Federal Home Loan Bank of Cincinnati (FHLB). FSGBank’s deposits are insured by the FDIC. FSGBank operates 38 full-service banking offices in eastern and middle Tennessee and nine offices in northern Georgia. Additionally, FSGBank operates three loan and lease production offices in Tennessee.
2
Business Strategy
We target both consumers and small to medium-sized businesses in our markets and have developed a decentralized strategy that focuses on providing superior customer service through our employees who are relationship- oriented and committed to their respective communities. Through this strategy we intend to grow our business, expand our customer base and improve profitability. The key elements of our strategy are:
Grow Along Interstate Corridors in Eastern and Middle Tennessee and Northern Georgia. We seek to increase our presence in our primary markets along the Interstate 75 and 40 corridors as well as to extend into other interstate corridors in eastern and middle Tennessee and northern Georgia through selective acquisitions and the opening of new branches in attractive locations. In 2005, the acquisition of Jackson Bank extended our franchise along Interstate 40 toward Nashville. We also opened de novo branches in Cleveland, Tennessee and Varnell, Georgia. In 2007 we expect to continue to leverage our existing bank branches, open two de novo branches and actively pursue strategic acquisitions.
These interstate communities are primarily served by branches of large regional and national financial institutions headquartered outside of the area. As a result, we believe these markets need, and are best served by, a locally owned and operated financial institution managed by people in and from the communities served. As we grow, we believe it is important to maintain the local flexibility created by local banks with smart bankers while benefiting from the economies of scale created by our size.
We intend to continue our growth strategy through organic growth and strategic acquisitions. We believe that many opportunities remain in our market area to expand, and we intend to be in a position to acquire additional market share, whether via acquisitions or de novo branches with the right local management. We will continue to identify targets that assist us in achieving strategic and/or financial targets, with the goal of being the bank that other banks call when they have decided to pursue an exit strategy. Although the interstate corridors are our primary focus, we may consider acquiring banking operations outside of the corridors if attractive opportunities arise as we continuously evaluate acquisition opportunities.
Maintain Local Decision Making and Accountability. We effectively compete with our super-regional competitors by providing superior customer service with localized decision-making capabilities. We designate regional bank presidents and separate advisory boards in each of our markets so that we are positioned to react quickly to changes in those communities while maintaining efficient and consistent centralized reporting and policies.
We offer personalized and flexible banking services to the communities in our market area and are able to react quickly to changes in those communities, in part by maintaining local advisory boards. Instead of setting standardized rates across the organization, we continue to give our local markets control over their respective rates. While emphasizing standards to encourage efficiency, control is decentralized to permit rapid adjustments to community changes. We also offer products tailored to the specific needs of our communities.
We are in the process of standardizing the consumer loan approval and pricing process to reduce our risks and costs on consumer loans. We believe this change will provide consistency in our pricing and risks throughout our markets.
Expand Our Products and Services to Meet the Needs of the Communities in Which We Operate. We continually seek to expand our financial products and services to meet the needs of our customers and to increase our fee income. In 2004, we acquired two leasing companies, Kenesaw Leasing and J&S Leasing, to diversify our loan portfolio and to help better serve the needs of our business customers. Kenesaw Leasing leases new and used equipment, fixtures and furnishings to owner-managed businesses, while J&S Leasing leases forklifts, heavy equipment and other machinery primarily to companies in the trucking and construction industries.
3
In 2004, we also established a wealth management division which offers private client services, financial planning, trust administration, investment management and estate planning services. In addition, as a part of our Latino-focused banking initiative, in 2004 we opened two branches in northern Georgia under the name “Primer Banco Seguro” that target the Latino community prevalent in that area.
Maintain Our Asset Quality. We consider asset quality to be of primary importance and have taken measures to ensure that despite growth in our loan portfolio we consistently maintain strong asset quality. Over the past few years, we have improved our commercial underwriting standards, developed a detailed loan policy, established better warning and early detection procedures, additional credit-related management and director reporting and developed a more comprehensive analysis of our allowance for loan losses. Our loan review process targets 60% to 70% of our portfolio for review over an eighteen month cycle. More frequent loan reviews may be completed as needed or as directed by the Audit/Corporate Governance Committee of the Board of Directors.
We believe the effect of these activities is reflected in nearly all of our asset quality measures compared to our peer group, as defined by the Uniform Bank Performance Report as of December 31, 2006. At December 31, 2006, our net charge offs as a percentage of average loans decreased 8 basis points from 0.36% to 0.28%. The ratio of nonaccrual loans plus loans 90 days past due to gross loans was 0.47% and 0.59% for us and our peer group, respectively. The ratio of nonaccrual loans and loans 90 days past due to the allowance for loan losses was 39.90% and 49.28% for us and our peer group, respectively. At December 31, 2006, our reserves to total loans were 1.18%, compared to 1.35% as of December 31, 2005.
Improve Core Profitability. We believe we will be able to take advantage of the economies of scale typically enjoyed by larger organizations as we grow our franchise. We believe the investments we have made in our key employees and our branch network are sufficient to support a much larger organization, and therefore that increases in our expense base going forward should be lower than our proportional increase in assets and revenues. Furthermore, we have the capability to increase our assets without breaching our capital ratio requirements and we are also targeting an improved efficiency ratio. We believe the effect of these trends going forward should improve our profitability over time.
Our net income for the year ended December 31, 2006 was approximately $11.1 million compared to $7.4 million before an extraordinary gain, net of tax of $2.2 million for 2005, which represents an increase of 50.2% excluding the extraordinary gain. For 2006 our annualized return on average equity was 7.91% and our annualized return on average assets was 1.03%, compared to 6.88% and 0.83% for 2005, respectively. Our Tier 1 capital to risk adjusted assets, total capital to risk adjusted assets and leverage ratio were 12.0%, 13.1% and 10.5%, respectively as of December 31, 2006 compared to 12.0%, 13.2% and 10.6%, respectively as of December 31, 2005. Our capital ratios exceed the minimum capital ratios for well capitalized institutions for each respective period. Our core efficiency ratio for 2006 improved to 64.3%, compared to 66.3% for 2005.
4
Market Area and Competition
We currently conduct business principally through 38 branches in our market areas of Bradley, Hamilton, Jackson, Jefferson, Knox, Loudon, McMinn, Monroe, Putnam and Union Counties, Tennessee and Catoosa and Whitfield Counties, Georgia. Our markets follow the Interstate 75 corridor between Dalton, Georgia (one hour north of Atlanta, Georgia) and Jefferson City, Tennessee (30 minutes north of Knoxville, Tennessee) and the Interstate 40 corridor between Nashville, Tennessee and Knoxville, Tennessee. Based upon data available on the FDIC website as of June 30, 2006, FSGBank’s total deposits ranked 6th among financial institutions in our market area, representing approximately 4.6% of the total deposits in our market area. The table below shows our deposit market share in the counties we serve according to data from the FDIC website as of June 30, 2006.
| | | | | | | | | | | | | |
Market | | Number of
Branches | | Our Market
Deposits | | Total
Market
Deposits | | Ranking | | Market Share
Percentage
(%) | |
| | | (dollar amounts in millions) | |
Tennessee | | | | | | | | | | | | | |
Bradley County | | 1 | | $ | 6 | | $ | 1,379 | | 9 | | 0.4 | % |
Hamilton County | | 7 | | | 265 | | | 5,190 | | 4 | | 5.1 | % |
Jackson County | | 3 | | | 71 | | | 118 | | 1 | | 60.2 | % |
Jefferson County | | 2 | | | 76 | | | 516 | | 3 | | 14.8 | % |
Knox County | | 3 | | | 83 | | | 6,855 | | 9 | | 1.2 | % |
Loudon County | | 2 | | | 27 | | | 690 | | 5 | | 3.9 | % |
McMinn County | | 1 | | | 22 | | | 760 | | 9 | | 2.9 | % |
Monroe County | | 5 | | | 69 | | | 566 | | 5 | | 12.2 | % |
Putnam County | | 2 | | | 69 | | | 1,215 | | 8 | | 5.7 | % |
Union County | | 2 | | | 43 | | | 121 | | 2 | | 35.4 | % |
Georgia | | | | | | | | | | | | | |
Catoosa County | | 1 | | | 4 | | | 862 | | 10 | | 0.4 | % |
Whitfield County | | 8 | | | 173 | | | 1,526 | | 3 | | 11.3 | % |
| | | | | | | | | | | | | |
FSGBank | | 37 | | $ | 908 | | $ | 19,798 | | 6 | | 4.6 | % |
| | | | | | | | | | | | | |
Subsequent to June 30, 2006, we opened an additional branch in Hamilton County in conjunction with our new corporate headquarters building at 531 Broad Street, Chattanooga, Tennessee.
Our retail, commercial and mortgage divisions operate in highly competitive markets. We compete directly in retail and commercial banking markets with other commercial banks, savings and loan associations, credit unions, mortgage brokers and mortgage companies, mutual funds, securities brokers, consumer finance companies, other lenders and insurance companies, locally, regionally and nationally. Many of our competitors compete with offerings by mail, telephone, computer and/or the Internet. Interest rates, both on loans and deposits, and prices of services are significant competitive factors among financial institutions generally. Office locations, types and quality of services and products, office hours, customer service, a local presence, community reputation and continuity of personnel are also important competitive factors that we emphasize.
In addition, our leasing operations via Kenesaw Leasing and J&S Leasing primarily serve lease customers located within 150 miles of Knoxville, Memphis and Nashville, Tennessee.
Many other commercial or savings institutions currently have offices in our primary market areas. These institutions include many of the largest banks operating in Tennessee and Georgia, including some of the largest banks in the country. Many of our competitors serve the same counties we do. Within our market area, there are 59 different commercial or savings institutions.
Virtually every type of competitor for business of the type served by our bank has offices in Atlanta, Georgia, approximately 75 miles from Dalton and 100 miles from Chattanooga. In our market area, our largest competitors
5
include First Horizon, SunTrust, Regions/AmSouth, BB&T and Wachovia. These institutions, as well as other competitors of ours, have greater resources, have broader geographic markets, have higher lending limits, offer various services that we do not offer and can better afford and make broader use of media advertising, support services and electronic technology than we do. To offset these competitive disadvantages, we depend on our reputation as being an independent and locally-owned community bank and as having greater personal service, community involvement and ability to make credit and other business decisions quickly and locally.
Lending Activities
We originate loans primarily secured by single and multi-family real estate, residential construction and owner-occupied commercial buildings. In addition, we make loans to small and medium-sized commercial businesses, as well as to consumers for a variety of purposes.
Our loan portfolio at December 31, 2006 was comprised as follows:
| | | | | | |
Type | | Dollar Amount | | Percentage of
Portfolio | |
| | | (dollar amounts in thousands) | |
Commercial—leases | | $ | 52,039 | | 6.1 | % |
Commercial—loans | | | 121,385 | | 14.3 | % |
Real estate—construction | | | 173,652 | | 20.5 | % |
Real estate—mortgage | | | 430,385 | | 50.8 | % |
Consumer | | | 67,858 | | 8.0 | % |
Other | | | 2,274 | | 0.3 | % |
| | | | | | |
Total | | $ | 847,593 | | 100.0 | % |
| | | | | | |
In addition, we have entered into contractual obligations, via lines of credit and standby letters of credit, to extend approximately $286.7 million in credit as of December 31, 2006. We use the same credit policies in making these commitments as we do for our other loans. At December 31, 2006, our contractual obligations to extend credit were comprised as follow:
| | | | | | |
Type | | Dollar Amount | | Percentage of
Contractual
Obligations | |
| | | (dollar amounts in thousands) | |
Commercial—leases | | $ | — | | — | |
Commercial—loans | | | 98,144 | | 34.2 | % |
Consumer | | | 26,962 | | 9.4 | % |
Real estate—construction | | | 94,122 | | 32.9 | % |
Real estate—mortgage | | | 67,260 | | 23.5 | % |
Other | | | 172 | | 0.0 | % |
| | | | | | |
Total | | | 286,660 | | 100.0 | % |
| | | | | | |
Commercial—Leases. Our commercial lease portfolio includes leases made by our leasing companies, Kenesaw Leasing and J&S Leasing. Kenesaw Leasing leases new and used equipment, fixtures and furnishings to owner-managed businesses, while J&S Leasing leases forklifts, heavy equipment and other machinery to owner-managed businesses primarily in the trucking and construction industries. The leased property usually serves as collateral for the lease. Our commercial leases are underwritten on the basis of the value of the underlying leased property as well as the basis of the commercial lessee’s ability to service the lease. Commercial leases generally entail greater risks than commercial loans or loans secured by real estate, but less risk than unsecured consumer loans. The increased risk in commercial leases is generally due to the rolling stock nature of the items leased, as well as the illiquid nature of the secondary market for used equipment. The increased risk also derives from the low barriers to entry in the trucking and construction industries.
6
Commercial—Loans. Our commercial loan portfolio includes loans to smaller business ventures, credit lines for working capital and short-term seasonal or inventory financing, as well as letters of credit that are generally secured by collateral other than real estate. Commercial borrowers typically secure their loans with assets of the business, personal guaranties of their principals and often mortgages on the principals’ personal residences. Our commercial loans are primarily made within our market areas and are underwritten on the basis of the commercial borrower’s ability to service the debt from income. In general, commercial loans involve more credit risk than residential and commercial mortgage loans, but less risk than consumer loans. The increased risk in commercial loans is generally due to the type of assets collateralizing these loans. The increased risk also derives from the expectation that commercial loans generally will be serviced from the operations of the business, and those operations may not be successful.
Consumer. We make a variety of loans to individuals for personal, family and household purposes, including secured and unsecured installment and term loans. Consumer loans entail greater risk than other loans, particularly in the case of consumer loans that are unsecured or secured by depreciating assets such as automobiles. In these cases, any repossessed collateral for a defaulted consumer loan may not provide an adequate source of repayment for the outstanding loan balance. In addition, consumer loan collections are dependent on the borrower’s continuing financial stability, and thus are more likely to be affected by job loss, divorce, illness or personal hardships.
Real Estate—Construction. We also make construction and development loans to residential and, to a lesser extent, commercial contractors and developers located within our market areas. Construction loans generally are secured by first liens on real estate and have floating interest rates. Construction loans involve additional risks attributable to the fact that loan funds are advanced upon the security of a project under construction, and the value of the project is dependent on its successful completion. As a result of these uncertainties, construction lending often involves the disbursement of substantial funds with repayment dependent, in part, upon the success of the ultimate project rather than the ability of a borrower or guarantor to repay the loan. If we are forced to foreclose on a project prior to completion, there is no assurance that we will be able to recover all of the unpaid portion of the loan. In addition, we may be required to fund additional amounts to complete a project and may have to hold the property for an indeterminate period of time. While we have underwriting procedures designed to identify what we believe to be acceptable levels of risks in construction lending, no assurance can be given that these procedures will prevent losses from the risks described above.
Real Estate—Mortgage. We make commercial mortgage loans to finance the purchase of real property as well as loans to smaller business ventures, credit lines for working capital and short-term seasonal or inventory financing, including letters of credit, that are also secured by real estate. Commercial mortgage lending typically involves higher loan principal amounts, and the repayment of loans is dependent, in large part, on sufficient income from the properties collateralizing the loans to cover operating expenses and debt service. As a general practice, we require our commercial mortgage loans to be collateralized by well-managed income producing property with adequate margins and to be guaranteed by responsible parties. In addition, a substantial percentage of our commercial mortgage loan portfolio is secured by owner-occupied commercial buildings. We look for opportunities where cash flow from the collateral provides adequate debt service coverage and the guarantor’s net worth is centered on assets other than the project we are financing. Our commercial mortgage loans are generally collateralized by first liens on real estate, have fixed or floating interest rates and amortize over a 10 to 20-year period with balloon payments due at the end of one to five years. Payments on loans collateralized by such properties are often dependent on the successful operation or management of the properties. Accordingly, repayment of these loans may be subject to adverse conditions in the real estate market.
In underwriting commercial mortgage loans, we seek to minimize our risks in a variety of ways, including giving careful consideration to the property’s operating history, future operating projections, current and projected occupancy, location and physical condition. Our underwriting analysis also includes credit checks, reviews of appraisals and environmental hazards or EPA reports and a review of the financial condition of the borrower. We attempt to limit our risk by analyzing our borrowers’ cash flow and collateral value on an ongoing basis.
7
Our residential mortgage loan program primarily originates loans for the purchase of residential property to individuals for other third-party lenders. Residential loans to individuals retained in our loan portfolio primarily consist of first liens on 1-4 family residential mortgages, home equity loans and lines of credit. These loans are generally made on the basis of the borrower’s ability to repay the loan from his or her employment and other income and are secured by residential real estate, the value of which is reasonably ascertainable. We expect that these loan-to-value ratios will be sufficient to compensate for fluctuations in real estate market value and to minimize losses that could result from a downturn in the residential real estate market. We generally do not retain long term, fixed rate residential real estate loans in our portfolio due to interest rate and collateral risks and low levels of profitability.
Credit Risks. The principal economic risk associated with each category of the loans that we make is the creditworthiness of the borrower and the ability of the borrower to repay the loan. General economic conditions and the strength of the services and retail market segments affect borrower creditworthiness. General factors affecting a commercial borrower’s ability to repay include interest rates, inflation and the demand for the commercial borrower’s products and services, as well as other factors affecting a borrower’s customers, suppliers and employees.
Risks associated with real estate loans also include fluctuations in the value of real estate, new job creation trends, tenant vacancy rates and, in the case of commercial borrowers, the quality of the borrower’s management. Consumer loan repayments depend upon the borrower’s financial stability and are more likely to be adversely affected by divorce, job loss, illness and personal hardships.
Lending Policies. Our Board of Directors has established and periodically reviews our bank’s lending policies and procedures. We have established common documentation and standards based on the type of loans between our regions. There are regulatory restrictions on the dollar amount of loans available for each lending relationship. National banking regulations provide that no loan relationship may exceed 15% of banks’ Tier 1 capital. At December 31, 2006, our legal lending limit was approximately $15.8 million. In addition, we have established a “house” limit of $10 million for each lending relationship. Any loan request exceeding the house limit must be approved by a committee of our Board of Directors. We occasionally sell participation interests in loans to other lenders, primarily when a loan exceeds our house lending limits.
Concentrations. The retail nature of our commercial banking operations allows for diversification of depositors and borrowers, and we believe that our business does not depend upon a single or a few customers. We also do not believe that our credits are concentrated within a single industry or group of related industries.
We offer a variety of loan products with payment terms and rate structures that have been designed to meet the needs of our customers within an established framework of acceptable credit risk. Payment terms range from fully amortizing loans that require periodic principal and interest payments to terms that require periodic payments of interest-only with principal due at maturity. Interest-only loans are a typical characteristic in commercial and home equity lines-of-credit and construction loans (residential and commercial). As of December 31, 2006, we had approximately $397.8 million of interest-only loans, which primarily consist of construction and commercial real estate loans (40%), home equity loans (19%) and commercial and industrial loans (18%). The loans have an average maturity of approximately one year or less, with the exception of home equity lines-of-credit which have an average maturity of approximately seven years. The interest only loans are properly underwritten loans and are within our lending policies.
As of December 31, 2006, we did not offer, hold or service option adjustable rate mortgages that may expose the borrowers to future increases in repayments in excess of changes resulting solely from increases in the market rate of interest (loans subject to negative amortization).
Deposits
Our principal source of funds for loans and investing in securities is core deposits. We offer a wide range of deposit services, including checking, savings, money market accounts and certificates of deposit. We obtain most
8
of our deposits from individuals and businesses in our market areas. We believe that the rates we offer for core deposits are competitive with those offered by other financial institutions in our market areas. Secondary sources of funding include advances from the FHLB, subordinated debt and other borrowings. These secondary sources enable us to borrow funds at rates and terms, which at times, are more beneficial to us. In the last three years, we have chosen to obtain a portion of our deposits from outside our market. Our out of market, or brokered, CDs represented 9.4% of total deposits as of December 31, 2006.
Other Banking Services
Given client demand for increased convenience and account access, we offer a range of products and services, including 24-hour internet banking, ACH transactions, wire transfers, direct deposit, traveler’s checks, safe deposit boxes, and United States savings bonds. We earn fees for most of these services. We also receive ATM transaction fees from transactions performed by our customers participating in a shared network of automated teller machines and a debit card system that our customers can use throughout Tennessee and Georgia, as well as in other states. Additionally, we offer wealth management services including private client services, financial planning, trust administration, investment management and estate planning services.
Securities
After establishing necessary cash reserves and funding loans, we invest our remaining liquid assets in securities allowed under banking laws and regulations. We invest primarily in obligations of the United States or obligations guaranteed as to principal and interest by the United States, other taxable securities and in certain obligations of states and municipalities. We also invest excess funds in federal funds with our correspondent banks. The sale of federal funds represents a short-term loan from us to another bank. Risks associated with securities include, but are not limited to, interest rate fluctuation, maturity and concentration.
Seasonality and Cycles
Although we do not consider our commercial banking business to be seasonal, our mortgage banking business is somewhat seasonal, with the volume of home financings, in particular, being lower during the winter months. The Dalton, Georgia economy also is seasonal and cyclical as a result of its dependence upon the carpet industry and changes in construction of residential and commercial establishments. While the Dalton, Georgia economy is dominated by the carpet and carpet-related industries, we do not have any one customer from whom more than 10% of our revenues are derived. However, we have multiple customers, commercial and retail, that are directly or indirectly affected by, or are engaged in businesses related to the carpet industry that, in the aggregate, have historically provided greater than 10% of our revenues.
Employees
On December 31, 2006, we had 354 full-time employees and 22 part-time employees. We consider our employee relations to be good, and we have no collective bargaining agreements with any employees.
Website Address
Our corporate website address is www.FSGBank.com. From this website, select the “Corporate Info” tab followed by selecting “Investor Relations.” Our filings with the Securities and Exchange Commission (SEC), including but not limited to our Annual Report on Form 10-K, quarterly reports on Form 10-Q, current reports on Form 8-K and any amendments to these reports are available and accessible soon after we file them with the SEC.
9
SUPERVISION AND REGULATION
Both First Security and FSGBank are subject to extensive state and federal banking regulations that impose restrictions on and provide for general regulatory oversight of their operations. These laws are generally intended to protect depositors and not shareholders. The following discussion describes the material elements of the regulatory framework that applies to us.
First Security
Because we own all of the capital stock of FSGBank, we are a bank holding company under the federal Bank Holding Company Act of 1956. As a result, we are primarily subject to the supervision, examination and reporting requirements of the Bank Holding Company Act and the regulations of the Federal Reserve Board.
Acquisitions of Banks. The Bank Holding Company Act requires every bank holding company to obtain the Federal Reserve Board’s prior approval before:
| | • | | acquiring direct or indirect ownership or control of any voting shares of any bank if, after the acquisition, the bank holding company will directly or indirectly own or control more than 5% of the bank’s voting shares; |
| | • | | acquiring all or substantially all of the assets of any bank; or |
| | • | | merging or consolidating with any other bank holding company. |
Additionally, the Bank Holding Company Act provides that the Federal Reserve Board may not approve any of these transactions if it would result in or tend to create a monopoly, substantially lessen competition or otherwise function as a restraint of trade, unless the anticompetitive effects of the proposed transaction are clearly outweighed by the public interest in meeting the convenience and needs of the community to be served. The Federal Reserve Board is also required to consider the financial and managerial resources and future prospects of the bank holding companies and banks concerned. The Federal Reserve Board’s consideration of financial resources generally focuses on capital adequacy, which is discussed below.
Under the Bank Holding Company Act, if we are adequately capitalized and adequately managed, we or any other bank holding company located within Tennessee or Georgia, may purchase a bank located outside of Tennessee or Georgia. Conversely, an adequately capitalized and adequately managed bank holding company located outside of Tennessee or Georgia may purchase a bank located inside Tennessee or Georgia. In each case, however, restrictions may be placed on the acquisition of a bank that has only been in existence for a limited amount of time or will result in specified concentrations of deposits. Currently, Georgia law prohibits a bank holding company from acquiring control of a financial institution until the target financial institution has been incorporated for three years, and Tennessee Law prohibits a bank holding company from acquiring control of a financial institution until the target financial institution has been incorporated for five years. Because FSGBank has been chartered for more than five years, this restriction would not limit our ability to sell.
Change in Bank Control. Subject to various exceptions, the Bank Holding Company Act and the Change in Bank Control Act, together with related regulations, require Federal Reserve Board approval prior to any person or company acquiring “control” of a bank holding company. Control is conclusively presumed to exist if an individual or company acquires 25% or more of any class of voting securities of a bank holding company. Control is also presumed to exist, although rebuttable, if a person or company acquires 10% or more, but less than 25%, of any class of voting securities and either:
| | • | | the bank holding company has registered securities under Section 12 of the Securities Exchange Act of 1934; or |
| | • | | no other person owns a greater percentage of that class of voting securities immediately after the transaction. |
10
Our common stock is registered under Section 12 of the Securities Exchange Act of 1934. The regulations provide a procedure for challenging rebuttable presumptions of control.
Permitted Activities. A bank holding company is generally permitted under the Bank Holding Company Act, to engage in, or acquire direct or indirect control of more than 5% of the voting shares of any company engaged in, the following activities:
| | • | | banking or managing or controlling banks; and |
| | • | | any activity that the Federal Reserve Board determines to be so closely related to banking as to be a proper incident to the business of banking. |
Activities that the Federal Reserve Board has found to be so closely related to banking as to be a proper incident to the business of banking include:
| | • | | factoring accounts receivable; |
| | • | | making, acquiring, brokering or servicing loans and usual related activities; |
| | • | | leasing personal or real property; |
| | • | | operating a non-bank depository institution, such as a savings association; |
| | • | | trust company functions; |
| | • | | financial and investment advisory activities; |
| | • | | conducting discount securities brokerage activities; |
| | • | | underwriting and dealing in government obligations and money market instruments; |
| | • | | providing specified management consulting and counseling activities; |
| | • | | performing selected data processing services and support services; |
| | • | | acting as agent or broker in selling credit life insurance and other types of insurance in connection with credit transactions; and |
| | • | | performing selected insurance underwriting activities. |
Despite prior approval, the Federal Reserve Board may order a bank holding company or its subsidiaries to terminate any of these activities or to terminate its ownership or control of any subsidiary when it has reasonable cause to believe that the bank holding company’s continued ownership, activity or control constitutes a serious risk to the financial safety, soundness or stability of it or any of its bank subsidiaries.
In addition to the permissible bank holding company activities listed above, the Financial Services Modernization Act of 1999, or the Gramm-Leach-Bliley Act, revised and expanded the provisions of the Bank Holding Company Act by permitting a bank holding company to qualify and elect to become a financial holding company. Under the regulations implementing the Gramm-Leach-Bliley Act, a financial holding company may engage in additional activities that are financial in nature or incidental or complementary to financial activity. The following activities are considered financial in nature:
| | • | | lending, trust and other banking activities; |
| | • | | insuring, guaranteeing or indemnifying against loss or harm, or providing and issuing annuities and acting as principal, agent or broker for these purposes, in any state; |
| | • | | providing financial, investment or advisory services; |
| | • | | issuing or selling instruments representing interests in pools of assets permissible for a bank to hold directly; |
| | • | | underwriting, dealing in or making a market in securities; |
11
| | • | | other activities that the Federal Reserve Board may determine to be so closely related to banking or managing or controlling banks as to be a proper incident to managing or controlling banks; |
| | • | | foreign activities permitted outside of the United States if the Federal Reserve Board has determined them to be usual in connection with banking operations abroad; |
| | • | | merchant banking through securities or insurance affiliates; and |
| | • | | insurance company portfolio investments. |
On December 18, 2006, the SEC and the Federal Reserve Board issued joint proposed rules, which would implement the “broker” exception for banks under Section 3(a)(4) of the Exchange Act of 1934 and would be adopted as part of the Gramm-Leach-Bliley Act. The proposed rules would implement the statutory exceptions that allow a bank, subject to certain conditions, to continue to conduct securities transactions for the bank’s customers as part of its trust, fiduciary, custodial and deposit “sweep” functions, and to refer customers to a securities broker-dealer pursuant to a networking arrangement with the broker-dealer.
To qualify to become a financial holding company, FSGBank and any other depository institution subsidiary of First Security must be well capitalized and well managed and must have a Community Reinvestment Act rating of at least “satisfactory.” Additionally, we must file an election with the Federal Reserve Board to become a financial holding company and must provide the Federal Reserve Board with 30 days’ written notice prior to engaging in a permitted financial activity. While we meet the qualification standards applicable to financial holding companies, we have not elected to become a financial holding company at this time.
Support of Subsidiary Institution. Under Federal Reserve Board policy, we are expected to act as a source of financial strength for FSGBank and to commit resources to support FSGBank. This support may be required at times when, without this Federal Reserve Board policy, we might not be inclined to provide it. In addition, any capital loans made by us to FSGBank will be repaid only after its deposits and various other obligations are repaid in full. In the unlikely event of our bankruptcy, any commitment by us to a federal bank regulatory agency to maintain the capital of FSGBank will be assumed by the bankruptcy trustee and entitled to a priority of payment.
FSGBank
Since FSGBank is chartered as a national bank, it is primarily subject to the supervision, examination and reporting requirements of the National Bank Act and the regulations of the OCC. The OCC regularly examines FSGBank’s operations and has the authority to approve or disapprove mergers, the establishment of branches and similar corporate actions. The OCC also has the power to prevent the continuance or development of unsafe or unsound banking practices or other violations of law. Because FSGBank’s deposits are insured by the FDIC to the maximum extent provided by law, FSGBank is subject to certain FDIC regulations. FSGBank is also subject to numerous state and federal statutes and regulations that affect its business, activities and operations.
Branching. National banks are required by the National Bank Act to adhere to branching laws applicable to state banks in the states in which they are located. Under both Tennessee and Georgia law, FSGBank may open branch offices throughout Tennessee or Georgia with the prior approval of the OCC. In addition, with prior regulatory approval, FSGBank may acquire branches of existing banks located in Tennessee or Georgia. FSGBank and any other national or state-chartered bank generally may branch across state lines by merging with banks in other states if allowed by the applicable states’ laws. Tennessee and Georgia law, with limited exceptions, currently permit branching across state lines through interstate mergers.
Under the Federal Deposit Insurance Act, states may “opt-in” and allow out-of-state banks to branch into their state by establishing a new start-up branch in the state. Tennessee has opted in and therefore, any out-of-state bank can establish a start-up branch in Tennessee as long as that state’s banking law would also allow Tennessee banks to establish start-up branches in that state. Therefore, FSGBank may establish start-up branches in any state that would allow a Tennessee bank to do the same.
12
Prompt Corrective Action. The Federal Deposit Insurance Corporation Improvement Act of 1991 establishes a system of prompt corrective action to resolve the problems of undercapitalized financial institutions. Under this system, the federal banking regulators have established five capital categories (well capitalized, adequately capitalized, undercapitalized, significantly undercapitalized and critically undercapitalized) in which all institutions are placed. The federal banking agencies have specified by regulation the relevant capital level for each category. Federal banking regulators are required to take various mandatory supervisory actions and are authorized to take other discretionary actions with respect to institutions in the three undercapitalized categories. The severity of the action depends upon the capital category in which the institution is placed. Generally, subject to a narrow exception, the banking regulator must appoint a receiver or conservator for an institution that is critically undercapitalized.
An institution that is categorized as undercapitalized, significantly undercapitalized or critically undercapitalized is required to submit an acceptable capital restoration plan to its appropriate federal regulator. A bank holding company must guarantee that a subsidiary depository institution meets its capital restoration plan, subject to various limitations. The controlling holding company’s obligation to fund a capital restoration plan is limited to the lesser of 5% of an undercapitalized subsidiary’s assets at the time it became undercapitalized or the amount required to meet regulatory capital requirements. An undercapitalized institution is also generally prohibited from increasing its average total assets, making acquisitions, establishing any branches or engaging in any new line of business, except under an accepted capital restoration plan or with FDIC approval. The regulations also establish procedures for downgrading an institution to a lower capital category based on supervisory factors other than capital.
FDIC Insurance Assessments. The FDIC has adopted a risk-based assessment system for insured depository institutions that takes into account the risks attributable to different categories and concentrations of assets and liabilities. The system assesses higher rates on those institutions that pose greater risks to the Deposit Insurance Fund. The FDIC places each institution into one of four risk categories using a two-step process based first on capital ratios (the capital group assignment) and then on other relevant information (the supervisory groups assignment). With the lowest risk category, Risk Category I, rates will vary based on each institution’s CAMELS component ratings, certain financial ratios and long-term debt issuer ratings.
Capital group assignments are made quarterly and an institution is assigned to one of three capital categories: (1) well capitalized; (2) adequately capitalized; and (3) undercapitalized. These three categories are substantially similar to the prompt corrective action categories described above, with the “undercapitalized” category including institutions that are undercapitalized, significantly undercapitalized and critically undercapitalized for prompt corrective action purposes. The FDIC also assigns an institution to one of three supervisory subgroups based on a supervisory evaluation that the institution’s primary federal banking regulator provides to the FDIC and information that the FDIC determines to be relevant to the institution’s financial condition and the risk posed to the deposit insurance funds. Assessments range from 5 to 43 cents per $100 of deposits, depending on the institution’s capital group and supervisory subgroup. Institutions that are well capitalized will be charged a rate of between 5 and 7 cents per $100 of deposits.
In addition, the FDIC imposes assessments to help pay off the $780 million in annual interest payments on the $8 billion Financing Corporation bonds issued in the late 1980s as part of the government rescue of the thrift industry. This assessment rate is adjusted quarterly and is set at 1.22 cents per $100 of deposits for the first quarter of 2007.
The FDIC may terminate its insurance of deposits if it finds that the institution has engaged in unsafe and unsound practices, is in an unsafe or unsound condition to continue operations, or has violated any applicable law, regulation, rule, order or condition imposed by the FDIC.
Community Reinvestment Act. The Community Reinvestment Act requires that, in connection with examinations of financial institutions within their respective jurisdictions, the federal banking regulators shall evaluate the record of each financial institution in meeting the credit needs of its local community, including low
13
and moderate-income neighborhoods. These facts are also considered in evaluating mergers, acquisitions and applications to open a branch or facility. Failure to adequately meet these criteria could impose additional requirements and limitations on FSGBank. Additionally, we must publicly disclose the terms of various Community Reinvestment Act-related agreements.
Allowance for Loan and Lease Losses. The Allowance for Loan and Lease Losses (the “ALLL”) represents one of the most significant estimates in our financial statements and regulatory reports. Because of its significance, we have developed a system by which we develop, maintain and document a comprehensive, systematic and consistently applied process for determining the amounts of the ALLL and the provision for loan and lease losses. The Interagency Policy Statement on the Allowance for Loan and Lease Losses, issued on December 13, 2006, encourages all banks to ensure controls are in place to consistently determine the ALLL in accordance with GAAP, the bank’s stated policies and procedures, management’s best judgment and relevant supervisory guidance. Consistent with supervisory guidance, we maintain a prudent and conservative, but not excessive, ALLL, that is at a level that is appropriate to cover estimated credit losses on individually evaluated loans determined to be impaired as well as estimated credit losses inherent in the remainder of the loan and lease portfolio. Our estimate of credit losses reflects consideration of all significant factors that affect the collectibility of the portfolio as of the evaluation date. See “Management’s Discussion and Analysis—Critical Accounting Policies.”
Commercial Real Estate Lending. Our lending operations may be subject to enhanced scrutiny by federal banking regulators based on our concentration of commercial real estate loans. On December 6, 2006, the federal banking regulators issued final guidance to remind financial institutions of the risk posed by commercial real estate (“CRE”) lending concentrations. CRE loans generally include land development, construction loans and loans secured by multifamily property, and nonfarm, nonresidential real property where the primary source of repayment is derived from rental income associated with the property. The guidance prescribes the following guidelines for its examiners to help identify institutions that are potentially exposed to significant CRE risk and may warrant greater supervisory scrutiny:
| | • | | total reported loans for construction, land development and other land represent 100% or more of the institutions total capital, or |
| | • | | total commercial real estate loans represent 300% or more of the institution’s total capital, and the outstanding balance of the institution’s commercial real estate loan portfolio has increased by 50% or more during the prior 36 months. |
Other Regulations. Interest and other charges collected or contracted for by FSGBank are subject to state usury laws and federal laws concerning interest rates. FSGBank’s loan operations are also subject to federal laws applicable to credit transactions, such as the:
| | • | | Truth-In-Lending Act, governing disclosures of credit terms to consumer borrowers; |
| | • | | Home Mortgage Disclosure Act of 1975, requiring financial institutions to provide information to enable the public and public officials to determine whether a financial institution is fulfilling its obligation to help meet the housing needs of the community it serves; |
| | • | | Equal Credit Opportunity Act, prohibiting discrimination on the basis of race, creed or other prohibited factors in extending credit; |
| | • | | Fair Credit Reporting Act of 1978, as amended by the Fair and Accurate Credit Transactions Act, governing the use and provision of information to credit reporting agencies, certain identify theft protections, and certain credit and other disclosures; |
| | • | | Fair Debt Collection Act, governing the manner in which consumer debts may be collected by collection agencies; |
| | • | | National Flood Insurance Act and Flood Disaster Protection Act, requiring flood insurance to extend or renew certain loans in flood plains; |
14
| | • | | Real Estate Settlement Procedures Act, requiring certain disclosures concerning loan closing costs and escrows, and governing transfers of loan servicing and the amounts of escrows, in connection with loans secured by one-to-four family residential properties; |
| | • | | Soldiers’ and Sailors’ Civil Relief Act of 1940, as amended by the Servicemembers’ Civil Relief Act, governing the repayment terms of, and property rights underlying, secured obligations of currently on active duty with the United States military; |
| | • | | Talent Amendment in the 2007 Defense Authorization Act, establishing a 36% annual percentage rate ceiling, which includes a variety of charges including late fees, for consumer loans to military service members and their dependents; and |
| | • | | rules and regulations of the various federal agencies charged with the responsibility of implementing these federal laws. |
FSGBank’s deposit operations are also subject to federal laws applicable to depository accounts, such as the:
| | • | | Trust in Savings Act, requiring certain disclosures for consumer deposit accounts; |
| | • | | Right to Financial Privacy Act, which imposes a duty to maintain confidentiality of consumer financial records and prescribes procedures for complying with administrative subpoenas of financial records; |
| | • | | Electronic Funds Transfer Act and Regulation E issued by the Federal Reserve Board to implement that act, governing automatic deposits to and withdrawals from deposit accounts and customers’ rights and liabilities arising from the use of automated teller machines and other electronic banking services; and |
| | • | | rules and regulations of the various federal agencies charged with the responsibility of implementing these federal laws. |
Capital Adequacy
First Security and FSGBank are required to comply with the capital adequacy standards established by the Federal Reserve Board, in the case of First Security, and the OCC, in the case of FSGBank. The Federal Reserve Board has established a risk-based and a leverage measure of capital adequacy for bank holding companies. FSGBank is also subject to risk-based and leverage capital requirements adopted by the OCC, which are substantially similar to those adopted by the Federal Reserve Board for bank holding companies.
The risk-based capital standards are designed to make regulatory capital requirements more sensitive to differences in risk profiles among banks and bank holding companies, to account for off-balance-sheet exposure, and to minimize disincentives for holding liquid assets. Assets and off-balance-sheet items, such as letters of credit and unfunded loan commitments, are assigned to broad risk categories, each with appropriate risk weights. The resulting capital ratios represent capital as a percentage of total risk-weighted assets and off-balance-sheet items.
The minimum guideline for the ratio of total capital to risk-weighted assets is 8%. Total capital consists of two components, Tier 1 Capital and Tier 2 Capital. Tier 1 Capital generally consists of common stock, minority interests in the equity accounts of consolidated depository institution subsidiaries, noncumulative perpetual preferred stock in consolidated non-depository institution subsidiaries and a limited amount of qualifying cumulative perpetual preferred stock, less goodwill and other specified intangible assets. Tier 1 Capital must equal at least 4% of risk-weighted assets. Tier 2 Capital generally consists of subordinated debt, other preferred stock and a limited amount of loan loss reserves. The total amount of Tier 2 Capital is limited to 100% of Tier 1 Capital. At December 31, 2006 our ratio of total capital to risk-weighted assets was 13.1% and our ratio of Tier 1 Capital to risk-weighted assets was 12.0%.
In addition, the Federal Reserve Board has established minimum leverage ratio guidelines for bank holding companies. These guidelines provide for a minimum ratio of Tier 1 Capital to average assets, less goodwill and
15
other specified intangible assets, of 3% for bank holding companies that meet specified criteria, including having the highest regulatory rating and implementing the Federal Reserve Board’s risk-based capital measure for market risk. All other bank holding companies generally are required to maintain a leverage ratio of at least 4%. At December 31, 2006, our leverage ratio was 10.5%. The guidelines also provide that bank holding companies experiencing internal growth or making acquisitions will be expected to maintain strong capital positions substantially above the minimum supervisory levels without reliance on intangible assets. The Federal Reserve Board considers the leverage ratio and other indicators of capital strength in evaluating proposals for expansion or new activities.
Failure to meet capital guidelines could subject a bank or bank holding company to a variety of enforcement remedies, including issuance of a capital directive, the termination of deposit insurance by the FDIC, a prohibition on accepting brokered deposits and certain other restrictions on its business. As described above, significant additional restrictions can be imposed on FDIC-insured depository institutions that fail to meet applicable capital requirements.
Payment of Dividends
First Security is a legal entity separate and distinct from FSGBank. The principal sources of First Security’s cash flow, including cash flow to pay dividends to its shareholders, are dividends that FSGBank pays to its sole shareholder, First Security. Statutory and regulatory limitations apply to FSGBank’s payment of dividends to First Security as well as to First Security’s payment of dividends to its shareholders.
FSGBank is required by federal law to obtain prior approval of the OCC for payments of dividends if the total of all dividends declared by FSGBank’s Board of Directors in any year will exceed (1) the total of FSGBank’s net profits for that year, plus (2) FSGBank’s retained net profits of the preceding two years, less any required transfers to surplus.
The payment of dividends by First Security and FSGBank may also be affected by other factors, such as the requirement to maintain adequate capital above regulatory guidelines. In addition, the OCC may require, after notice and a hearing, that FSGBank stop or refrain from engaging in any practice it considers unsafe or unsound. The federal banking agencies have indicated that paying dividends that deplete a depository institution’s capital base to an inadequate level would be an unsafe and unsound banking practice. Under the Federal Deposit Insurance Corporation Improvement Act of 1991, a depository institution may not pay any dividend if payment would cause it to become undercapitalized or if it already is undercapitalized. Moreover, the federal agencies have issued policy statements that provide that bank holding companies and insured banks should generally only pay dividends out of current operating earnings.
Restrictions on Transactions with Affiliates
First Security and FSGBank are subject to the provisions of Section 23A of the Federal Reserve Act. Section 23A places limits on the amount of:
| | • | | a bank’s loans or extensions of credit to affiliates; |
| | • | | a bank’s investment in affiliates; |
| | • | | assets a bank may purchase from affiliates, except for real and personal property exempted by the Federal Reserve Board; |
| | • | | loans or extensions of credit to third parties collateralized by the securities or obligations of affiliates; and |
| | • | | a bank’s guarantee, acceptance or letter of credit issued on behalf of an affiliate. |
16
The total amount of the above transactions is limited in amount, as to any one affiliate, to 10% of a bank’s capital and surplus and, as to all affiliates combined, to 20% of a bank’s capital and surplus. In addition to the limitation on the amount of these transactions, each of the above transactions must also meet specified collateral requirements. FSGBank must also comply with other provisions designed to avoid the taking of low-quality assets.
First Security and FSGBank are also subject to the provisions of Section 23B of the Federal Reserve Act which, among other things, prohibit an institution from engaging in the above transactions with affiliates unless the transactions are on terms substantially the same, or at least as favorable to the institution or its subsidiaries, as those prevailing at the time for comparable transactions with nonaffiliated companies.
FSGBank is also subject to restrictions on extensions of credit to their executive officers, directors, principal shareholders and their related interests. These extensions of credit (1) must be made on substantially the same terms, including interest rates and collateral, as those prevailing at the time for comparable transactions with third parties and (2) must not involve more than the normal risk of repayment or present other unfavorable features.
Privacy
Financial institutions are required to disclose their policies for collecting and protecting confidential information. Customers generally may prevent financial institutions from sharing nonpublic personal financial information with nonaffiliated third parties except under narrow circumstances, such as the processing of transactions requested by the consumer or when the financial institution is jointly sponsoring a product or service with a nonaffiliated third party. Additionally, financial institutions generally may not disclose consumer account numbers to any nonaffiliated third party for use in telemarketing, direct mail marketing or other marketing to consumers.
Anti-Terrorism and Money Laundering Legislation
FSGBank is subject to the Uniting and Strengthening America by Providing Appropriate Tools Required to Intercept and Obstruct Terrorism Act of 2001 (the USA PATRIOT Act), the Bank Secrecy Act and the rules and regulations of the Office of Foreign Assets Control. These statutes and related rules and regulations impose requirements and limitations on specific financial transactions and account relationships, intended to guard against money laundering and terrorism financing. FSGBank has established a customer identification program pursuant to Section 326 of the USA PATRIOT Act and the Bank Secrecy Act, and otherwise has implemented policies and procedures to comply with the foregoing rules.
Federal Deposit Insurance Reform
On February 8, 2006, President Bush signed the Federal Deposit Insurance Reform Act of 2005 (FDIRA). Among other things, FDIRA changes the Federal deposit insurance system by:
| | • | | raising the coverage level for qualifying retirement accounts to $250,000, subject to future indexing; |
| | • | | authorizing the FDIC to index deposit insurance coverage levels for inflation, for standard accounts and qualifying retirement accounts, every five years beginning April 1, 2007; |
| | • | | prohibiting undercapitalized financial institutions from accepting employee benefit plan deposits; |
| | • | | merging the Bank Insurance Fund and Savings Association Insurance Fund into a new Deposit Insurance Fund (the DIF); and |
| | • | | providing credits to financial institutions that capitalized the FDIC prior to 1996 to offset future assessment premiums. |
17
FDIRA also authorizes the FDIC to revise the current risk-based assessment system, subject to notice and comment and caps the amount of the DIF at 1.50% of domestic deposits. The FDIC must issue cash dividends, awarded on a historical basis, for the amount of the DIF over the 1.50% ratio. Additionally, if the DIF exceeds 1.35% of domestic deposits at year-end, the FDIC must issue cash dividends, awarded on a historical basis, for half of the amount of the excess.
Financial Services Regulatory Relief Act
President Bush signed the Financial Services Regulatory Relief Act of 2006 (“Regulatory Relief Act”) into law on October 13, 2006. The Regulatory Relief Act repeals certain reporting requirements regarding loans to bank executive officers and principal shareholders. These changes have eliminated the statutory requirements for (1) the report to the Board of Directors when an executive officer becomes indebted to another institution in an aggregate amount that is greater than the officer would receive from his or her own institution; (2) the report filed by the institution that listed all credits made to executive officers since the previous report of condition; and (3) the report to the Board of Directors that is required when an executive officer or a principal shareholder become indebted to a correspondent bank.
The Regulatory Relief Act also increased the size of a bank eligible for 18-month (rather than annual) examinations from $250 million to $500 million. The Regulatory Relief Act amends the privacy rules of Gramm-Leach-Bliley to clarify that CPA’s are not required to notify their customers of privacy and disclosure policies as long as they are subject to state law restraints on disclosure of non-public personal information without customer approval. Finally, the Regulatory Relief Act requires that the federal banking regulators develop model privacy notice forms, and banks adopting the model forms will be afforded a regulatory safe harbor under the disclosure requirements of Gramm-Leach-Bliley.
Proposed Legislation and Regulatory Action
New regulations and statutes are regularly proposed that contain wide-ranging potential changes to the structures, regulations and competitive relationships of financial institutions operating and doing business in the United States. We cannot predict whether or in what form any proposed regulation or statute will be adopted or the extent to which our business may be affected by any new regulation or statute.
Effect of Governmental Monetary Policies
Our earnings are affected by domestic economic conditions and the monetary and fiscal policies of the United States government and its agencies. The Federal Reserve Board’s monetary policies have had, and are likely to continue to have, an important impact on the operating results of commercial banks through its power to implement national monetary policy in order, among other things, to curb inflation or combat a recession. The monetary policies of the Federal Reserve Board affect the levels of bank loans, investments and deposits through its control over the issuance of United States government securities, its regulation of the discount rate applicable to member banks and its influence over reserve requirements to which member banks are subject. We cannot predict the nature or impact of future changes in monetary and fiscal policies.
18
An investment in our common stock involves risks. If any of the following risks or other risks, which have not been identified or which we may believe are immaterial or unlikely, actually occur, our business, financial condition and results of operations could be harmed. In such a case, the trading price of our common stock could decline, and you may lose all or part of your investment. The risks discussed below also include forward-looking statements, and our actual results may differ substantially from those discussed in these forward-looking statements.
Our business strategy includes the continuation of significant growth plans, and our financial condition and results of operations could be negatively affected if we fail to grow or fail to manage our growth effectively.
We intend to continue pursuing a significant growth strategy for our business. Our prospects must be considered in light of the risks, expenses and difficulties frequently encountered by companies in significant growth stages of development. We cannot assure you we will be able to expand our market presence in our existing markets or successfully enter new markets or that any such expansion will not adversely affect our results of operations. Failure to manage our growth effectively could have a material adverse effect on our business, future prospects, financial condition or results of operations, and could adversely affect our ability to successfully implement our business strategy. Also, if our growth occurs more slowly than anticipated or declines, our operating results could be materially adversely affected.
Our ability to successfully grow will depend on a variety of factors including the continued availability of desirable business opportunities, the competitive responses from other financial institutions in our market areas and our ability to manage our growth. While we believe we have the management resources and internal systems in place to successfully manage our future growth, there can be no assurance growth opportunities will be available or growth will be successfully managed.
We face risks with respect to future expansion and acquisitions or mergers.
We continually seek to acquire other financial institutions or parts of those institutions and may continue to engage in de novo branch expansion in the future. Acquisitions and mergers involve a number of risks, including:
| | • | | the time and costs associated with identifying and evaluating potential acquisitions and merger partners may negatively affect our business; |
| | • | | the estimates and judgments used to evaluate credit, operations, management and market risks with respect to the target institution may not be accurate; |
| | • | | the time and costs of evaluating new markets, hiring experienced local management and opening new offices and the time lags between these activities and the generation of sufficient assets and deposits to support the costs of the expansion may negatively affect our business; |
| | • | | we may not be able to finance an acquisition without diluting our existing shareholders; |
| | • | | the diversion of our management’s attention to the negotiation of a transaction may detract from their business productivity; |
| | • | | we may enter into new markets where we lack experience; |
| | • | | we may introduce new products and services into our business with which we have no prior experience; and |
| | • | | we may incur an impairment of goodwill associated with an acquisition and experience adverse short-term effects on our results of operations. |
In addition, no assurance can be given that we will be able to integrate our operations after an acquisition without encountering difficulties including, without limitation, the loss of key employees and customers, the disruption of our respective ongoing businesses or possible inconsistencies in standards, controls, procedures and
19
policies. Successful integration of our operations with another entity’s will depend primarily on our ability to consolidate operations, systems and procedures and to eliminate redundancies and costs. If we have difficulties with the integration, we might not achieve the economic benefits we expect to result from any particular acquisition or merger. In addition, we may experience greater than expected costs or difficulties relating to such integration.
Changes in the interest rate environment could reduce our profitability.
Our profitability depends substantially upon our net interest income. Net interest income is the difference between the interest earned on assets, such as loans and investment securities, and the interest paid for liabilities, such as savings and time deposits. Market interest rates for loans, investments and deposits are highly sensitive to many factors beyond our control. Recently, interest rate spreads have generally narrowed due to changing market conditions, policies of various government and regulatory authorities and competitive pricing pressures, and we cannot predict whether these rate spreads will narrow even further. This narrowing of interest rate spreads could adversely affect our earnings and financial condition. In addition, we cannot predict whether interest rates will continue to remain at present levels. Changes in interest rates may cause significant changes, up or down, in our net interest income. Depending on our portfolio of loans and investments, our results of operations may be adversely affected by changes in interest rates. In addition, any significant increase in prevailing interest rates could adversely affect our mortgage banking business because higher interest rates could cause customers to request fewer refinancings and purchase money mortgage originations.
We could suffer loan losses from a decline in credit quality.
We could sustain losses if borrowers, guarantors and related parties fail to perform in accordance with the terms of their loans. We have adopted underwriting and credit monitoring procedures and credit policies, including the establishment and review of the allowance for credit losses, that we believe are appropriate to minimize this risk by assessing the likelihood of nonperformance, tracking loan performance and diversifying our credit portfolio. These policies and procedures, however, may not prevent unexpected losses that could materially adversely affect our results of operations.
We are subject to the local economies in our primary market areas.
Our success depends upon the growth in population, income levels, deposits and housing starts in our primary market areas. If the communities in which FSGBank operate do not grow, or if prevailing economic conditions locally or nationally are unfavorable, our business may not succeed. Unpredictable economic conditions may have an adverse effect on the quality of our loan portfolio and our financial performance. Economic recession over a prolonged period or other economic problems in our market areas could have a material adverse impact on the quality of the loan portfolio and the demand for our products and services. Future adverse changes in the economies in our market areas may have a material adverse effect on our financial condition, results of operations or cash flows. Further, the banking industry in Tennessee and Georgia is affected by general economic conditions such as inflation, recession, unemployment and other factors beyond our control. As an example, our banking business in northern Georgia is highly dependent on the carpet industry, and, as a result, if the carpet industry or one of the large carpet employers in Dalton, Georgia should suffer a downturn in its business, our operating performance could be adversely affected. As a community bank, we are less able to spread the risk of unfavorable local economic conditions than larger or more regional banks. Moreover, we cannot give any assurance that we will benefit from any market growth or favorable economic conditions in our primary market areas if they do occur.
Our continued pace of growth may require us to raise additional capital in the future, but that capital may not be available when it is needed.
We are required by federal and state regulatory authorities to maintain adequate levels of capital to support our operations. We anticipate our capital resources following this offering will satisfy our capital requirements for the foreseeable future. We may at some point, however, need to raise additional capital to support our continued growth.
20
Our ability to raise additional capital, if needed, will depend on conditions in the capital markets at that time, which are outside our control, and on our financial performance. Accordingly, we cannot assure you of our ability to raise additional capital if needed on terms acceptable to us. If we cannot raise additional capital when needed, our ability to further expand our operations through internal growth and acquisitions could be materially impaired.
We face strong competition from larger, more established competitors.
The banking business is highly competitive, and we experience strong competition from many other financial institutions. We compete with commercial banks, credit unions, savings and loan associations, mortgage banking firms, consumer finance companies, securities brokerage firms, insurance companies, money market funds and other financial institutions, which operate in our primary market areas and elsewhere.
We compete with these institutions both in attracting deposits and in making loans. In addition, we have to attract our customer base from other existing financial institutions and from new residents. Many of our competitors are well-established and much larger financial institutions. While we believe we can and do successfully compete with these other financial institutions in our markets, we may face a competitive disadvantage as a result of our smaller size and lack of geographic diversification.
Although we compete by concentrating our marketing efforts in our primary market area with local advertisements, personal contacts and greater flexibility in working with local customers, we can give no assurance that this strategy will be successful.
If the value of real estate in our core market were to decline materially, a significant portion of our loan portfolio could become under-collateralized, which could have a material adverse effect on us.
With most of our loans concentrated along the Interstate corridors of eastern and middle Tennessee and northern Georgia, a decline in local economic conditions could adversely affect the values of our real estate collateral. Consequently, a decline in local economic conditions may have a greater effect on our earnings and capital than on the earnings and capital of larger financial institutions whose real estate loan portfolios are geographically diverse.
In addition to considering the financial strength and cash flow characteristics of borrowers, we often secure loans with real estate collateral. At December 31, 2006, approximately 71.3% of our loans had real estate as a primary or secondary component of collateral. The real estate collateral in each case provides an alternate source of repayment in the event of default by the borrower and may deteriorate in value during the time the credit is extended. If we are required to liquidate the collateral securing a loan to satisfy the debt during a period of reduced real estate values, our earnings and capital could be adversely affected.
Our recent results may not be indicative of our future results.
We may not be able to sustain our historical rate of growth or may not even be able to grow our business at all. In addition, our recent and rapid growth may distort some of our historical financial ratios and statistics. In the future, we may not have the benefit of several recently favorable factors, such as a generally predictable interest rate environment, a strong residential mortgage market or the ability to find suitable expansion opportunities. Various factors, such as economic conditions, regulatory and legislative considerations and competition, may also impede or prohibit our ability to expand our market presence. If we experience a significant decrease in our historical rate of growth, our results of operations and financial condition may be adversely affected due to a high percentage of our operating costs being fixed expenses.
Our corporate culture has contributed to our success, and if we cannot maintain this culture as we grow, we could lose the teamwork and increased productivity fostered by our culture, which could harm our business.
We believe that a critical contributor to our success has been our corporate culture, which we believe fosters teamwork and increased productivity. As our organization grows and we are required to implement more
21
complex organization management structures, we may fine it increasingly difficult to maintain the beneficial aspects of our corporate culture. This could negatively impact our future success.
As a community bank, we have different lending risks than larger banks.
We provide services to our local communities. Our ability to diversify our economic risks is limited by our own local markets and economies. We lend primarily to individuals and to small to medium-sized businesses, which may expose us to greater lending risks than those of banks lending to larger, better-capitalized businesses with longer operating histories.
We manage our credit exposure through careful monitoring of loan applicants and loan concentrations in particular industries, and through loan approval and review procedures. We have established an evaluation process designed to determine the adequacy of our allowance for loan losses. While this evaluation process uses historical and other objective information, the classification of loans and the establishment of loan losses is an estimate based on experience, judgment and expectations regarding our borrowers, the economies in which we and our borrowers operate, as well as the judgment of our regulators. We cannot assure you that our loan loss reserves will be sufficient to absorb future loan losses or prevent a material adverse effect on our business, profitability or financial condition.
We are subject to extensive regulation that could limit or restrict our activities and impose financial requirements or limitations on the conduct of our business.
As a bank holding company, we are primarily regulated by the Federal Reserve Board. Our subsidiary is primarily regulated by the OCC. Our compliance with Federal Reserve Board and OCC regulations is costly and may limit our growth and restrict certain of our activities, including payment of dividends, mergers and acquisitions, investments, loans and interest rates charged, interest rates paid on deposits and locations of offices. We are also subject to capital requirements of our regulators.
The laws and regulations applicable to the banking industry could change at any time, and we cannot predict the effects of these changes on our business and profitability. Because government regulation greatly affects the business and financial results of all commercial banks and bank holding companies, our cost of compliance could adversely affect our ability to operate profitably.
The Sarbanes-Oxley Act of 2002 and the related rules and regulations promulgated by the Securities and Exchange Commission and Nasdaq, have increased the scope, complexity and cost of corporate governance, reporting and disclosure practices. As a result, we may experience greater compliance costs.
Tennessee law and our charter limit the ability of others to acquire us.
Various anti-takeover protections for Tennessee corporations are set forth in the Tennessee Business Corporation Act, the Business Combination Act, the Control Share Acquisition Act, the Greenmail Act and the Investor Protection Act. Because our common stock is registered with the SEC under the Securities Exchange Act of 1934, the Business Combination Act automatically applies to us unless our shareholders adopt a charter or bylaw amendment which expressly excludes us from the anti-takeover provisions of the Business Combination Act two years prior to a proposed takeover. Our Board of Directors has no present intention of recommending such charter or bylaw amendment.
These statutes have the general effect of discouraging, or rendering more difficult, unfriendly takeover or acquisition attempts. Such provisions would be beneficial to current management in an unfriendly takeover attempt but could have an adverse effect on shareholders who might wish to participate in such a transaction.
22
Changes in monetary policies may have an adverse effect on our business.
Our results of operations are affected by credit policies of monetary authorities, particularly the Federal Reserve Board. Actions by monetary and fiscal authorities, including the Federal Reserve Board, could have an adverse effect on our deposit levels, loan demand or business and earnings.
If we fail to retain our key employees, our growth and profitability could be adversely affected.
Our success is, and is expected to remain, highly dependent on our executive officers, especially Rodger B. Holley, Lloyd (“Monty”) L. Montgomery III and William (“Chip”) L. Lusk, Jr. This is particularly true because, as a community bank, we depend on our management team’s ties to the community to generate business for us. Our rapid growth will continue to place significant demands on our management, and the loss of any such person’s services may have an adverse effect upon us.
Our ability to pay dividends is limited and we may be unable to pay future dividends.
We make no assurances that we will pay any dividends in the future. Any future determination relating to dividend policy will be made at the discretion of our Board of Directors and will depend on a number of factors, including our future earnings, capital requirements, financial condition, future prospects, regulatory restrictions and other factors that our Board of Directors may deem relevant. The holders of our common stock are entitled to receive dividends when and if declared by our Board of Directors out of funds legally available therefor. As part of our consideration to pay cash dividends, we intend to retain adequate funds from future earnings to support the development and growth of our business. In addition, our ability to pay dividends is restricted by federal policies and regulations. It is the policy of the Federal Reserve Board that bank holding companies should pay cash dividends on common stock only out of net income available over the past year and only if prospective earnings retention is consistent with the organization’s expected future needs and financial condition. Further, our principal sources of funds to pay dividends are management fees and cash dividends that we receive from our subsidiary. The payment of management fees and dividends by FSGBank to us is subject to restrictions imposed by federal banking laws, regulations and authorities.
Environmental liability associated with lending activities could result in losses.
In the course of our business, we may foreclose on and take title to properties securing our loans. If hazardous substances are discovered on any of these properties, we may be liable to governmental entities or third parties for the costs of remediation of the hazard, as well as for personal injury and property damage. Many environmental laws can impose liability regardless of whether we knew of, or were responsible for, the contamination. In addition, if we arrange for the disposal of hazardous or toxic substances at another site, we may be liable for the costs of cleaning up and removing those substances from the site, even if we neither own nor operate the disposal site. Environmental laws may require us to incur substantial expenses and may materially limit the use of properties that we acquire through foreclosure, reduce their value or limit our ability to sell them in the event of a default on the loans they secure. In addition, future laws or more stringent interpretations or enforcement policies with respect to existing laws may increase our exposure to environmental liability. Our loan policies require certain due diligence of high risk industries and properties with the intention of lowering our risk of a non-performing loan and/or foreclosed property.
| Item 1B. | Unresolved Staff Comments |
There are no written comments from the Commission staff regarding our periodic or current reports under the Act which remain unresolved.
During December 2006, we began conducting our business primarily through our corporate headquarters located at 531 Broad Street, Chattanooga, Hamilton County, Tennessee. Prior to December 2006, we conducted our
23
business primarily through our office located at 817 Broad Street, Chattanooga, Hamilton County, Tennessee. Effective December 31, 2006, the term of our lease for the 817 Broad Street facility was reduced primarily to the main floor (i.e. the bank branch lobby). The lease on the reduced facility continues until August 31, 2011.
We believe that our banking offices are in good condition, are suitable to our needs and, for the most part, are relatively new. The following table summarizes pertinent details of our owned or leased branch, loan production and leasing offices.
| | | | | | | | |
Office Address | | Date Opened | | Owned/ Leased | | Square
Footage | | Use of
Office |
401 South Thornton Avenue Dalton, Whitfield County, Georgia | | September 17, 1999 | | Owned | | 16,438 | | Branch |
| | | | |
1237 Cleveland Road Dalton, Whitfield County, Georgia | | September 17, 1999 | | Owned | | 3,300 | | Branch |
| | | | |
761 New Highway 68 Sweetwater, Monroe County, Tennessee | | June 26, 2000 | | Owned | | 3,000 | | Branch |
| | | | |
1740 Gunbarrel Road Chattanooga, Hamilton County, Tennessee | | July 3, 2000 | | Leased | | 3,400 | | Branch |
| | | | |
4227 Ringgold Road East Ridge, Hamilton County, Tennessee | | July 28, 2000 | | Leased | | 3,400 | | Branch |
| | | | |
817 Broad Street Chattanooga, Hamilton County, Tennessee | | June 26, 2000 | | Leased | | 4,050 | | Branch |
| | | | |
835 South Congress Parkway Athens, McMinn County, Tennessee | | November 6, 2000 | | Owned | | 3,400 | | Branch |
| | | | |
4535 Highway 58 Chattanooga, Hamilton County, Tennessee | | May 7, 2001 | | Owned | | 3,400 | | Branch |
| | | | |
820 Ridgeway Avenue Signal Mountain, Hamilton County, Tennessee | | May 29, 2001 | | Owned | | 2,500 | | Branch |
| | | | |
2709 Chattanooga Road, Suite 5 Rocky Face, Whitfield County, Georgia | | June 4, 2001 | | Leased | | 2,400 | | Branch |
| | | | |
1409 Cowart Street Chattanooga, Hamilton County, Tennessee | | October 22, 2001 | | Building Owned
Land Leased | | 1,000 | | Branch |
| | | | |
9217 Lee Highway Ooltewah, Hamilton County, Tennessee | | July 8, 2002 | | Owned | | 3,400 | | Branch |
| | | | |
2905 Maynardville Highway Maynardville, Union County, Tennessee | | July 20, 2002 | | Owned | | 12,197 | | Branch |
| | | | |
216 Maynardville Highway Maynardville, Union County, Tennessee | | July 20, 2002 | | Leased | | 2,000 | | Branch |
| | | | |
2918 East Walnut Avenue Dalton, Whitfield County, Georgia | | March 31, 2003 | | Owned | | 10,337 | | Branch |
| | | | |
715 South Thornton Avenue Dalton, Whitfield County, Georgia | | March 31, 2003 | | Building Owned
Land Leased | | 4,181 | | Branch |
| | | | |
2270 Highway 72 N Loudon, Loudon County, Tennessee | | June 30, 2003 | | Owned | | 1,860 | | Branch |
| | | | |
35 Poplar Springs Road Ringgold, Catoosa County, Georgia | | July 14, 2003 | | Owned | | 3,400 | | Branch |
| | | | |
167 West Broadway Boulevard Jefferson City, Jefferson County, Tennessee | | October 14, 2003 | | Owned | | 3,743 | | Branch |
| | | | |
705 East Broadway Lenoir City, Loudon County, Tennessee | | October 27, 2003 | | Owned | | 3,610 | | Branch |
| | | | |
301 North Main Street Sweetwater, Monroe County, Tennessee | | December 4, 2003 | | Owned | | 4,650 | | Branch |
24
| | | | | | | | |
Office Address | | Date Opened | | Owned/ Leased | | Square
Footage | | Use of
Office |
| | | | |
215 Warren Street Madisonville, Monroe County, Tennessee | | December 4, 2003 | | Owned | | 8,456 | | Branch |
405 Highway 165 Tellico Plains, Monroe County, Tennessee | | December 4, 2003 | | Owned | | 3,565 | | Branch |
| | | | |
155 North Campbell Station Road Knoxville, Knox County, Tennessee | | March 2, 2004 | | Building Owned
Land Leased | | 3,743 | | Branch |
| | | | |
4215 Highway 411 Madisonville, Monroe County, Tennessee | | March 15, 2004 | | Owned | | 472 | | Branch |
| | | | |
1013 South Highway 92 Dandridge, Jefferson County, Tennessee | | April 5, 2004 | | Owned | | 3,500 | | Branch |
| | | | |
307 Lovell Road Knoxville, Knox County, Tennessee | | August 16, 2004 | | Building Owned
Land Leased | | 3,500 | | Branch |
| | | | |
1111 Northshore Drive, Suite S600 Knoxville, Knox County, Tennessee | | October 1, 2004 | | Leased | | 9,867 | | Loan &
Leasing |
| | | | |
1810 Ailor Avenue, Center City Offices’ Building One Knoxville, Knox County, Tennessee | | October 1, 2004 | | Leased | | 1,780 | | Leasing |
| | | | |
665 Oak Leaf Office Lane, Suite E Memphis, Shelby County, Tennessee | | October 1, 2004 | | Leased | | 930 | | Leasing |
| | | | |
1249 Murray Avenue Dalton, Whitfield County, Georgia | | November 18, 2004 | | Leased | | 2,400 | | Branch |
| | | | |
430 Fields Avenue, Suite Number B-1 Dalton, Whitfield County, Georgia | | December 16, 2004 | | Leased | | 712 | | Branch |
| | | | |
1111 Northshore Drive, Suite P-100 Knoxville, Knox County, Tennessee | | July 25, 2005 | | Leased | | 1,105 | | Branch |
| | | | |
307 Hull Avenue Gainesboro, Jackson County, Tennessee | | August 31, 2005 | | Owned | | 9,662 | | Branch |
| | | | |
6766 Granville Highway Granville, Jackson County, Tennessee | | August 31, 2005 | | Owned | | 2,880 | | Branch |
| | | | |
3261 Jennings Creek Highway Whitleyville, Jackson County, Tennessee | | August 31, 2005 | | Owned | | 1,368 | | Branch |
| | | | |
340 South Jefferson Avenue Cookeville, Putnam County, Tennessee | | August 31, 2005 | | Owned | | 3,220 | | Branch |
| | | | |
376 West Jackson Street Cookeville, Putnam County, Tennessee | | August 31, 2005 | | Owned | | 14,780 | | Branch |
| | | | |
301 Keith Street SW Cleveland, Bradley County, Tennessee | | October 31, 2005 | | Leased | | 3,072 | | Branch |
| | | | |
3895 Cleveland Road Varnell, Whitfield County, Georgia | | November 11, 2005 | | Owned | | 1,860 | | Branch |
| | | | |
531 Broad Street Chattanooga, Hamilton County, Tennessee | | December 11, 2006 | | Owned | | 39,700 | | Branch &
Headquarters |
As of December 31, 2006, we owned three additional plots of land. The vacant lots are located at Lot #6 of Kirkland Heights Property on Maynardville Highway, Maynardville, Union County, Tennessee (1.0 acre); 4300 Maynardville Highway, Maynardville, Union County, Tennessee (0.25 acre); and, 1020 South Highway 92, Dandridge, Jefferson County, Tennessee (1.0 acres). These three lots are currently available for sale. We originally purchased, or a predecessor institution purchased, each site for bank purposes. We are currently building a branch facility located at 614 West Main Street, Algood, Putnam County, Tennessee and have a signed purchase agreement for an existing branch in Cleveland, Bradley County, Tennessee.
25
The Company also owned a non-banking related facility located at 402 East Gore Street, Gainesboro, Jackson County, Tennessee. This property was assumed through the acquisition of Jackson Bank and was sold on March 8, 2007.
We are not aware of any environmental problems with the properties that we own or lease that would be material, either individually, or in the aggregate, to our operations or financial condition.
While we are from time to time a party to various legal proceedings arising in the ordinary course of our business, management believes, after consultation with legal counsel, that there are no proceedings threatened or pending against us that will, individually or in the aggregate, have a material adverse affect on our business or consolidated financial condition.
| Item 4. | Submission of Matters to a Vote of Security Holders |
None.
26
PART II
| Item 5. | Market for Registrant’s Common Equity, Related Stockholder Matters and Issuer Purchases of Equity Securities |
Since August 10, 2005, our common stock has been traded on the Nasdaq Global Select Market under the symbol FSGI. On March 1, 2007, there were 1,311 registered holders of record of our common stock. The high and low prices per share since we listed on Nasdaq were as follows:
| | | | | | | | | |
Quarter | | High | | Low | | Dividend |
2006 | | | | | | | | | |
4th Quarter | | $ | 12.00 | | $ | 10.84 | | $ | 0.05 |
3rd Quarter | | | 12.15 | | | 10.51 | | | 0.025 |
2nd Quarter | | | 13.01 | | | 10.20 | | | 0.025 |
1st Quarter | | | 11.05 | | | 9.39 | | | 0.025 |
| | | |
2005 | | | | | | | | | |
4th Quarter | | $ | 10.05 | | $ | 9.00 | | $ | 0.025 |
3rd Quarter (since August 10th) | | | 10.50 | | | 9.69 | | | — |
Prior to August 10, 2005, no active trading market existed for our common stock. Our shares were infrequently traded in private transactions, and such trades were not necessarily indicative of the value of such shares. Management is aware of sporadic trades in 2005 (prior to August 10th) at prices between $9.00 and $17.25.
We anticipate continuing to pay comparable cash dividends in the foreseeable future, however, there are a number of restrictions on our ability to do so. It is the policy of the Federal Reserve Board that bank holding companies should pay cash dividends on common stock only out of net income available over the past year and only if prospective earnings retention is consistent with the organization’s expected future needs and financial condition. The policy provides that bank holding companies should not maintain a level of cash dividends that undermines the bank holding company’s ability to serve as a source of strength to its banking subsidiaries. For a foreseeable period of time, our principal source of cash will be dividends and management fees paid by FSGBank to us. There are certain restrictions on these payments imposed by federal banking laws, regulations and authorities.
The declaration and payment of dividends on our common stock will depend upon our earnings and financial condition, liquidity and capital requirements, the general economic and regulatory climate, our ability to service any equity or debt obligations senior to our common stock and other factors deemed relevant by our Board of Directors. As of December 31, 2006, an aggregate of approximately $17.6 million was available for payment of dividends by FSGBank to us under applicable regulatory restrictions, without regulatory approval. Regulatory authorities could impose administratively stricter limitations on the ability of FSGBank to pay dividends to us if such limits were deemed appropriate to preserve certain capital adequacy requirements.
On December 5, 2006, we announced a plan to buy back up to 500,000 shares of our common stock in open market transactions. The specific timing and amount of repurchases will vary based on market conditions, securities law limitations, and other factors. The repurchases will be made using our cash resources. The repurchase program may be suspended or discontinued at any time without prior notice.
27
The following table presents information regarding purchases by First Security and our affiliated purchasers of our common stock during the fourth quarter of 2006.
| | | | | | | | |
Period | | Total Number
of Shares
Purchased | | Average Price
Paid per Share | | Total Number of
Shares Purchased
as Part of Publicly
Announced Plans
or Programs | | Maximum Number
of Shares that May
Yet Be Purchased
Under the Plans or
Programs |
October 1, 2006—October 31, 2006 | | — | | — | | — | | — |
November 1, 2006—November 30, 2006 | | — | | — | | — | | — |
December 1, 2006—December 31, 2006 | | — | | — | | — | | 500,000 |
| | | | | | | | |
Total | | — | | | | — | | |
| | | | | | | | |
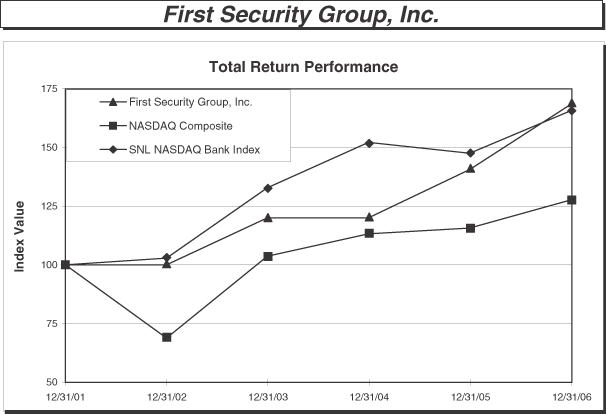
| | | | | | | | | | | | |
| | | Period Ending |
Index | | 12/31/01 | | 12/31/02 | | 12/31/03 | | 12/31/04 | | 12/31/05 | | 12/31/06 |
First Security Group, Inc. | | 100.00 | | 100.00 | | 120.00 | | 120.00 | | 140.58 | | 168.25 |
NASDAQ Composite | | 100.00 | | 68.76 | | 103.67 | | 113.16 | | 115.57 | | 127.58 |
SNL NASDAQ Bank Index | | 100.00 | | 102.85 | | 132.76 | | 152.16 | | 147.52 | | 165.62 |
28
| Item 6. | Selected Financial Data |
Our selected financial data is presented below as of and for the years ended December 31, 2002 through 2006. The selected financial data presented below as of December 31, 2006 and 2005 and for each of the years in the three-year period ended December 31, 2004, are derived from our audited financial statements and related notes included in this Annual Report on Form 10-K and should be read in conjunction with the consolidated financial statements and related notes, along with “Management’s Discussion and Analysis of Financial Condition and Results of Operations” beginning on page 34. The selected financial data as of December 31, 2004, 2003 and 2002 and for the two years ended December 31, 2003 have been derived from our audited financial statements that are not included in this Annual Report on Form 10-K. Retroactive adjustments were also made to all per share data for two stock splits: (1) a 12-for-10 stock split in the form of a stock dividend effected on December 22, 2004 and (2) a 12-for-10 stock split in the form of a stock dividend effected on June 16, 2003. Certain of the measures set forth below are non-GAAP financial measures under the rules and regulations promulgated by the SEC. For a discussion of management’s reasons to present such data and a reconciliation to GAAP, please see “GAAP Reconciliation and Management Explanation for Non-GAAP Financial Measures” on page 32.
| | | | | | | | | | | | | | | | | | | | |
| | | As of and for the Years Ended December 31, | |
| | | 2006 | | | 2005 | | | 2004 | | | 2003 | | | 2002 | |
| | | (dollar amounts in thousands, except per share amounts) | |
Earnings:(1) | | | | | | | | | | | | | | | | | | | | |
Net interest income | | $ | 47,982 | | | $ | 40,441 | | | $ | 28,830 | | | $ | 22,546 | | | $ | 17,204 | |
Provision for loan losses | | | 2,184 | | | | 2,922 | | | | 3,399 | | | | 2,122 | | | | 1,948 | |
Non-interest income | | | 10,617 | | | | 8,847 | | | | 6,544 | | | | 5,429 | | | | 3,819 | |
Non-interest expense(6) | | | 40,017 | | | | 35,373 | | | | 27,128 | | | | 22,278 | | | | 14,915 | |
Net Income, before extraordinary items(6) | | | 11,112 | | | | 7,396 | | | | 3,482 | | | | 2,456 | | | | 2,602 | |
Extraordinary items, net of tax(5) | | | — | | | | 2,175 | | | | 785 | | | | — | | | | — | |
| | | | | | | | | | | | | | | | | | | | |
Net income(6) | | $ | 11,112 | | | $ | 9,571 | | | $ | 4,267 | | | $ | 2,456 | | | $ | 2,602 | |
| | | | | | | | | | | | | | | | | | | | |
Earnings—Normalized:(1) | | | | | | | | | | | | | | | | | | | | |
Non-interest income, adjusted(3) | | $ | 10,617 | | | $ | 8,420 | | | $ | 6,544 | | | $ | 5,429 | | | $ | 3,819 | |
Non-interest expense, adjusted(3) (6) | | | 39,953 | | | | 34,436 | | | | 27,128 | | | | 22,278 | | | | 14,915 | |
Net operating income, net of tax(6) | | | 11,156 | | | | 7,742 | | | | 3,482 | | | | 2,456 | | | | 2,602 | |
| | | | | |
Per Share Data:(1) | | | | | | | | | | | | | | | | | | | | |
Net income, before extraordinary items, basic | | $ | 0.64 | | | $ | 0.51 | | | $ | 0.28 | | | $ | 0.20 | | | $ | 0.28 | |
Net income, basic | | | 0.64 | | | | 0.65 | | | | 0.34 | | | | 0.20 | | | | 0.28 | |
Net income, before extraordinary item, diluted | | | 0.63 | | | | 0.50 | | | | 0.27 | | | | 0.20 | | | | 0.27 | |
Net income, diluted | | | 0.63 | | | | 0.64 | | | | 0.33 | | | | 0.20 | | | | 0.27 | |
Cash dividends declared | | | 0.13 | | | | 0.03 | | | | — | | | | — | | | | — | |
Book value | | | 8.15 | | | | 7.84 | | | | 6.80 | | | | 6.49 | | | | 6.22 | |
Tangible book value | | | 6.39 | | | | 6.00 | | | | 5.60 | | | | 5.25 | | | | 5.44 | |
| | | | |
Per Share Data—Normalized:(1) | | | | | | | | | | | | | | | | |
Net operating income, basic(3) | | $ | 0.64 | | | $ | 0.53 | | | $ | 0.28 | | | $ | 0.20 | | | $ | 0.28 | |
Net operating income, diluted(3) | | | 0.63 | | | | 0.52 | | | | 0.27 | | | | 0.20 | | | | 0.27 | |
| | | | | |
Performance Ratios:(1) | | | | | | | | | | | | | | | | | | | | |
Return on average assets(2) | | | 1.03 | % | | | 0.83 | % | | | 0.51 | % | | | 0.42 | % | | | 0.63 | % |
Return on average equity(2) | | | 7.91 | % | | | 6.88 | % | | | 4.16 | % | | | 3.14 | % | | | 4.64 | % |
Return on average tangible assets(2) | | | 1.06 | % | | | 0.85 | % | | | 0.53 | % | | | 0.43 | % | | | 0.64 | % |
Return on average tangible equity(2) | | | 10.22 | % | | | 8.45 | % | | | 5.10 | % | | | 3.68 | % | | | 5.33 | % |
Net interest margin, taxable equivalent | | | 5.09 | % | | | 5.15 | % | | | 4.83 | % | | | 4.31 | % | | | 4.53 | % |
Efficiency ratio(2) | | | 68.29 | % | | | 71.77 | % | | | 76.69 | % | | | 79.64 | % | | | 70.95 | % |
Non-interest income to net interest income and non-interest income(2) | | | 18.12 | % | | | 17.95 | % | | | 18.50 | % | | | 19.41 | % | | | 18.17 | % |
29
| | | | | | | | | | | | | | | | | | | | |
| | | As of and for the Years Ended December 31, | |
| | | 2006 | | | 2005 | | | 2004 | | | 2003 | | | 2002 | |
| | | (dollar amounts in thousands, except per share amounts) | |
| | | | | |
Performance Ratios—Normalized:(1) | | | | | | | | | | | | | | | | | | | | |
Operating return on average assets(3) | | | 1.03 | % | | | 0.87 | % | | | 0.51 | % | | | 0.42 | % | | | 0.63 | % |
Operating return on average equity(3) | | | 7.94 | % | | | 7.20 | % | | | 4.16 | % | | | 3.14 | % | | | 4.64 | % |
Operating return on average tangible assets(3) | | | 1.06 | % | | | 0.89 | % | | | 0.53 | % | | | 0.43 | % | | | 0.64 | % |
Operating return on average tangible equity(3) | | | 10.26 | % | | | 8.84 | % | | | 5.10 | % | | | 3.68 | % | | | 5.33 | % |
Core efficiency ratio(4) | | | 64.27 | % | | | 66.34 | % | | | 73.04 | % | | | 76.76 | % | | | 69.89 | % |
Non-interest income, adjusted to net interest income and non-interest income, adjusted(3) | | | 18.12 | % | | | 17.23 | % | | | 18.50 | % | | | 19.41 | % | | | 18.17 | % |
| | | | | |
Capital & Liquidity:(1) | | | | | | | | | | | | | | | | | | | | |
Total equity to total assets | | | 12.82 | % | | | 13.30 | % | | | 11.28 | % | | | 12.79 | % | | | 14.36 | % |
Tangible equity to tangible assets | | | 10.33 | % | | | 10.51 | % | | | 9.47 | % | | | 10.61 | % | | | 12.79 | % |
Total loans to total deposits | | | 91.93 | % | | | 86.90 | % | | | 92.48 | % | | | 88.47 | % | | | 90.66 | % |
| | | | | |
Asset Quality:(1) | | | | | | | | | | | | | | | | | | | | |
Net charge-offs | | $ | 2,215 | | | $ | 2,374 | | | $ | 2,925 | | | $ | 2,688 | | | $ | 788 | |
Net loans charged-off to average loans | | | 0.28 | % | | | 0.36 | % | | | 0.57 | % | | | 0.63 | % | | | 0.25 | % |
Non-accrual loans | | $ | 2,653 | | | $ | 1,314 | | | $ | 985 | | | $ | 183 | | | $ | 667 | |
Other real estate owned | | $ | 1,982 | | | $ | 1,552 | | | $ | 2,338 | | | $ | 536 | | | $ | — | |
Repossessed assets | | $ | 2,231 | | | $ | 1,891 | | | $ | 2,472 | | | $ | 143 | | | $ | 249 | |
Non-performing assets (NPA) | | $ | 6,866 | | | $ | 4,757 | | | $ | 5,795 | | | $ | 862 | | | $ | 916 | |
NPA to total assets | | | 0.61 | % | | | 0.46 | % | | | 0.76 | % | | | 0.13 | % | | | 0.19 | % |
Loans 90 days past due | | $ | 1,325 | | | $ | 1,042 | | | $ | 1,230 | | | $ | 2,194 | | | $ | 89 | |
NPA + loans 90 days past due to total assets | | | 0.72 | % | | | 0.56 | % | | | 0.92 | % | | | 0.47 | % | | | 0.21 | % |
Allowance for loan losses to total loans | | | 1.18 | % | | | 1.35 | % | | | 1.40 | % | | | 1.22 | % | | | 1.54 | % |
Allowance for loan losses to NPA | | | 145.21 | % | | | 212.76 | % | | | 143.43 | % | | | 675.99 | % | | | 585.37 | % |
| | | | | |
Period End Balances:(1) | | | | | | | | | | | | | | | | | | | | |
Loans | | $ | 847,593 | | | $ | 748,659 | | | $ | 592,357 | | | $ | 478,013 | | | $ | 348,582 | |
Intangible assets | | | 31,341 | | | | 32,463 | | | | 15,274 | | | | 15,704 | | | | 8,532 | |
Total assets | | | 1,129,803 | | | | 1,040,692 | | | | 766,691 | | | | 644,765 | | | | 472,924 | |
Deposits | | | 922,001 | | | | 861,507 | | | | 640,526 | | | | 540,304 | | | | 384,483 | |
Stockholders’ equity | | | 144,788 | | | | 138,389 | | | | 86,445 | | | | 82,438 | | | | 67,933 | |
Common stock market capitalization | | | 204,796 | | | | 171,950 | | | | 105,833 | | | | 105,808 | | | | 75,743 | |
Full-time equivalent employees | | | 369 | | | | 358 | | | | 308 | | | | 258 | | | | 187 | |
Common shares outstanding | | | 17,762 | | | | 17,654 | | | | 12,705 | | | | 12,702 | | | | 10,914 | |
| | | | | |
Average Balances:(1) | | | | | | | | | | | | | | | | | | | | |
Loans | | $ | 796,866 | | | $ | 657,928 | | | $ | 514,479 | | | $ | 422,332 | | | $ | 311,774 | |
Intangible assets | | | 31,699 | | | | 19,924 | | | | 15,296 | | | | 11,507 | | | | 7,202 | |
Total earning assets | | | 960,966 | | | | 799,109 | | | | 610,585 | | | | 530,777 | | | | 384,483 | |
Total assets | | | 1,081,375 | | | | 866,946 | | | | 676,381 | | | | 578,258 | | | | 415,810 | |
Deposits | | | 887,319 | | | | 734,869 | | | | 559,695 | | | | 475,103 | | | | 337,198 | |
Stockholders’ equity | | | 140,467 | | | | 107,499 | | | | 83,630 | | | | 78,284 | | | | 56,039 | |
Shares outstanding—basic | | | 17,315 | | | | 14,618 | | | | 12,705 | | | | 12,190 | | | | 9,415 | |
Shares outstanding—diluted | | | 17,680 | | | | 14,910 | | | | 12,912 | | | | 12,328 | | | | 9,533 | |
(1) | Data includes our consolidated financial statements, including the following from their date of acquisition: First State Bank in July 2002; Premier National Bank in March 2003; National Bank of Commerce’s branch offices located in Madisonville, Sweetwater and Tellico Plains, Tennessee in December 2003; Kenesaw Leasing and J&S Leasing in October 2004; and Jackson Bank & Trust in August 2005. |
| (2) | These ratios are calculated using net income, before extraordinary items. |
30
| (3) | These amounts and ratios are calculated using net operating income (net of tax) which excludes extraordinary items as defined by GAAP and certain non-recurring items. Since these items and their impact on First Security’s performance are difficult to predict, management believes presentation of financial measures excluding the impact of these items provide useful supplemental information that is important for a proper understanding of the operating results of First Security’s core business. Refer to the following non-GAAP reconciliation table for a detail of the non-recurring items. |
(4) | The core efficiency ratio is calculated on a fully tax equivalent basis excluding non-recurring items (see footnote(3) and non-GAAP reconciliation table) and certain non-cash items, such as amortization of intangibles, gain or losses on investment securities and gains, losses, and write-downs on foreclosed and repossessed properties. Management utilizes this ratio as a key performance measure for First Security’s core results. This ratio provides management with information of the relationship between noninterest expense as compared with net interest income and noninterest income. |
| (5) | The extraordinary gains were recognized in conjunction with our acquisition of Kenesaw Leasing and J&S Leasing effective October 1, 2004. |
| (6) | Includes amortization expense of $1,021 thousand, $806 thousand, $797 thousand, $550 thousand and $102 thousand for core deposit intangibles for the years ended December 31, 2006, 2005, 2004, 2003, 2002, respectively. Core deposit intangibles represent the premiums paid for acquisitions core deposits and are amortized on an accelerated basis over 10 years. Also includes $50 thousand, $50 thousand and $8 thousand for licensing fee amortization for December 31, 2006, 2005 and 2004, respectively and $175 thousand and $73 thousand for non-compete amortization for December 31, 2006 and 2005, respectively. |
31
GAAP Reconciliation and Management Explanation for Non-GAAP Financial Measures
The information set forth above contains certain financial information determined by methods other than in accordance with GAAP. Management uses these “non-GAAP” measures in their analysis of First Security’s performance. Non-GAAP measures typically adjust GAAP performance measures to exclude the effects of charges, expenses and gains related to the consummation of mergers and acquisitions and costs related to the integration of merged entities. These non-GAAP measures may also exclude other significant gains, losses or expenses that are unusual in nature and not expected to recur. Since these items and their impact on our performance are difficult to predict, management believes presentations of financial measures excluding the impact of these items provide useful supplemental information that is important for a proper understanding of the operating results of our core business. Additionally, management utilizes measures involving a tangible basis which exclude the impact of intangible assets such as goodwill and core deposit intangibles. As these assets are normally created through acquisitions and not through normal recurring operations, management believes that the exclusion of these items presents a more comparable assessment of the aforementioned measures on a recurring basis.
These disclosures should not be viewed as a substitute for operating results determined in accordance with GAAP, nor are they necessarily comparable to non-GAAP performance measures that may be presented by other companies. The following table provides a more detailed analysis of these non-GAAP performance measures.
| | | | | | | | | | | | | | | |
| | | As of and for the Years Ended December 31, | |
| | | 2006 | | | 2005 | | | 2004 | | | 2003 | | | 2002 | |
Return on average assets | | 1.03 | % | | 0.83 | % | | 0.51 | % | | 0.42 | % | | 0.63 | % |
Effect of intangible assets | | 0.03 | % | | 0.02 | % | | 0.02 | % | | 0.01 | % | | 0.01 | % |
| | | | | | | | | | | | | | | |
Return on average tangible assets | | 1.06 | % | | 0.85 | % | | 0.53 | % | | 0.43 | % | | 0.64 | % |
| | | | | | | | | | | | | | | |
Return on average equity | | 7.91 | % | | 6.88 | % | | 4.16 | % | | 3.14 | % | | 4.64 | % |
Effect of intangible assets | | 2.31 | % | | 1.57 | % | | 0.94 | % | | 0.54 | % | | 0.69 | % |
| | | | | | | | | | | | | | | |
Return on average tangible equity | | 10.22 | % | | 8.45 | % | | 5.10 | % | | 3.68 | % | | 5.33 | % |
| | | | | | | | | | | | | | | |
Return on average assets | | 1.03 | % | | 0.83 | % | | 0.51 | % | | 0.42 | % | | 0.63 | % |
Effect of non-recurring items | | — | | | 0.04 | % | | — | | | — | | | — | |
| | | | | | | | | | | | | | | |
Operating return on average assets | | 1.03 | % | | 0.87 | % | | 0.51 | % | | 0.42 | % | | 0.63 | % |
Effect of average intangible assets | | 0.03 | % | | 0.02 | % | | 0.02 | % | | 0.01 | % | | 0.01 | % |
| | | | | | | | | | | | | | | |
Operating return on average tangible assets | | 1.06 | % | | 0.89 | % | | 0.53 | % | | 0.43 | % | | 0.64 | % |
| | | | | | | | | | | | | | | |
Return on average equity | | 7.91 | % | | 6.88 | % | | 4.16 | % | | 3.14 | % | | 4.64 | % |
Effect of non-recurring items | | 0.03 | % | | 0.32 | % | | — | | | — | | | — | |
| | | | | | | | | | | | | | | |
Operating return on average equity | | 7.94 | % | | 7.20 | % | | 4.16 | % | | 3.14 | % | | 4.64 | % |
Effect of average intangible assets | | 2.32 | % | | 1.64 | % | | 0.94 | % | | 0.54 | % | | 0.69 | % |
| | | | | | | | | | | | | | | |
Operating return on average tangible equity | | 10.26 | % | | 8.84 | % | | 5.10 | % | | 3.68 | % | | 5.33 | % |
| | | | | | | | | | | | | | | |
Total equity to total assets | | 12.82 | % | | 13.30 | % | | 11.28 | % | | 12.79 | % | | 14.36 | % |
Effect of intangible assets | | (2.49 | )% | | (2.79 | )% | | (1.81 | )% | | (2.18 | )% | | (1.57 | )% |
| | | | | | | | | | | | | | | |
Tangible equity to tangible assets | | 10.33 | % | | 10.51 | % | | 9.47 | % | | 10.61 | % | | 12.79 | % |
| | | | | | | | | | | | | | | |
Efficiency ratio | | 68.29 | % | | 71.77 | % | | 76.69 | % | | 79.64 | % | | 70.95 | % |
Effect of non-recurring items | | (0.11 | )% | | (1.32 | )% | | — | | | — | | | — | |
Effect of non-cash items | | (2.83 | )% | | (3.12 | )% | | (2.66 | )% | | (1.99 | )% | | (0.37 | )% |
Effect of net interest income, tax equivalent adjustment | | (1.08 | )% | | (0.99 | )% | | (0.99 | )% | | (0.89 | )% | | (0.69 | )% |
| | | | | | | | | | | | | | | |
Core efficiency ratio | | 64.27 | % | | 66.34 | % | | 73.04 | % | | 76.76 | % | | 69.89 | % |
| | | | | | | | | | | | | | | |
32
| | | | | | | | | | | | | | | | | | | | |
| | | As of and for the Years Ended December 31, | |
| | | 2006 | | | 2005 | | | 2004 | | | 2003 | | | 2002 | |
| | | (dollar amounts in thousands, except per share amounts) | |
Non-interest expense | | $ | 40,017 | | | $ | 35,373 | | | $ | 27,128 | | | $ | 22,278 | | | $ | 14,915 | |
Corporate headquarters relocation costs | | | (64 | ) | | | — | | | | — | | | | — | | | | — | |
Severance | | | — | | | | (157 | ) | | | — | | | | — | | | | — | |
Impairment of long-lived assets | | | — | | | | (308 | ) | | | — | | | | — | | | | — | |
Jackson Bank & Trust integration costs and other | | | — | | | | (234 | ) | | | — | | | | — | | | | — | |
Reinsurance underwriting expense | | | — | | | | (238 | ) | | | — | | | | — | | | | — | |
| | | | | | | | | | | | | | | | | | | | |
Non-interest expense, adjusted | | $ | 39,953 | | | $ | 34,436 | | | $ | 27,128 | | | $ | 22,278 | | | $ | 14,915 | |
| | | | | | | | | | | | | | | | | | | | |
Non-interest income | | $ | 10,617 | | | $ | 8,847 | | | $ | 6,544 | | | $ | 5,429 | | | $ | 3,819 | |
Recovery on previously disposed repossessed asset | | | — | | | | (173 | ) | | | — | | | | — | | | | — | |
Reinsurance underwriting revenue | | | — | | | | (254 | ) | | | — | | | | — | | | | — | |
| | | | | | | | | | | | | | | | | | | | |
Non-interest income, adjusted | | $ | 10,617 | | | $ | 8,420 | | | $ | 6,544 | | | $ | 5,429 | | | $ | 3,819 | |
| | | | | | | | | | | | | | | | | | | | |
Net income | | $ | 11,112 | | | $ | 9,571 | | | $ | 4,267 | | | $ | 2,456 | | | $ | 2,602 | |
Extraordinary gain, net of tax | | | — | | | | (2,175 | ) | | | (785 | ) | | | — | | | | — | |
Non-recurring expenses (income), net of tax | | | 44 | | | | 346 | | | | — | | | | — | | | | — | |
| | | | | | | | | | | | | | | | | | | | |
Net operating income, net of tax | | $ | 11,156 | | | $ | 7,742 | | | $ | 3,482 | | | $ | 2,456 | | | $ | 2,602 | |
| | | | | | | | | | | | | | | | | | | | |
Per Common Share: | | | | | | | | | | | | | | | | | | | | |
Book value | | $ | 8.15 | | | $ | 7.84 | | | $ | 6.80 | | | $ | 6.49 | | | $ | 6.22 | |
Effect of intangible asset | | | (1.76 | ) | | | (1.84 | ) | | | (1.20 | ) | | | (1.24 | ) | | | (0.78 | ) |
| | | | | | | | | | | | | | | | | | | | |
Tangible book value | | $ | 6.39 | | | $ | 6.00 | | | $ | 5.60 | | | $ | 5.25 | | | $ | 5.44 | |
| | | | | | | | | | | | | | | | | | | | |
Net income, basic | | $ | 0.64 | | | $ | 0.65 | | | $ | 0.34 | | | $ | 0.20 | | | $ | 0.28 | |
Effect of extraordinary and non-recurring items, net of tax | | | — | | | | (0.12 | ) | | | (0.06 | ) | | | — | | | | — | |
| | | | | | | | | | | | | | | | | | | | |
Net operating income, basic | | $ | 0.64 | | | $ | 0.53 | | | $ | 0.28 | | | $ | 0.20 | | | $ | 0.28 | |
| | | | | | | | | | | | | | | | | | | | |
Net income, diluted | | $ | 0.63 | | | $ | 0.64 | | | $ | 0.33 | | | $ | 0.20 | | | $ | 0.27 | |
Effect of extraordinary and non-recurring items, net of tax | | | — | | | | (0.12 | ) | | | (0.06 | ) | | | — | | | | — | |
| | | | | | | | | | | | | | | | | | | | |
Net operating income, diluted | | $ | 0.63 | | | $ | 0.52 | | | $ | 0.27 | | | $ | 0.20 | | | $ | 0.27 | |
| | | | | | | | | | | | | | | | | | | | |
33
| Item 7. | Management’s Discussion and Analysis of Financial Condition and Results of Operation |
The following discussion and analysis should be read in conjunction with “Selected Financial Data” and our financial statements and notes included in this Annual Report on Form 10-K. The discussion in this Annual Report on Form 10-K contains forward-looking statements that involve risks and uncertainties, such as our plans, objectives, expectations, and intentions. The cautionary statements made in this Annual Report on Form 10-K should be read as applying to all related forward-looking statements wherever they appear in this Annual Report. Our actual results could differ materially from those discussed in this Annual Report on Form 10-K.
Retroactive adjustments have been made to all per share data for two stock splits: (1) a 12-for-10 stock split effected on December 22, 2004 which resulted in the par value decreasing from $0.0083 to $0.0069 per share, and (2) a 12-for-10 stock split effected on June 16, 2003, which resulted in the par value decreasing from $0.01 to $0.0083 for accounting purposes. We have rounded the par value to $0.01 per share for presentation purposes.
Year Ended December 31, 2006
The following discussion and analysis sets forth the major factors that affected First Security’s financial condition as of December 31, 2006 and 2005, and results of operations for the three years ended December 31, 2006 as reflected in the audited financial statements.
Overview
As of December 31, 2006, we had total consolidated assets of approximately $1.1 billion, total loans of approximately $847.6 million, total deposits of approximately $922.0 million, and stockholders’ equity of approximately $144.8 million. In 2006, our net income was $11.1 million, resulting in basic and diluted net income of $0.64 and $0.63 per share, respectively.
As of December 31, 2005, we had total consolidated assets of approximately $1.0 billion, total loans of approximately $748.7 million, total deposits of approximately $861.5 million, and stockholders’ equity of approximately $138.4 million. In 2005, our net income, after recognizing an extraordinary gain, net of tax, of $2.2 million was $9.6 million, resulting in basic and diluted net income of $0.65 and $0.64 per share, respectively. The extraordinary gain was recognized as a result of a purchase accounting adjustment related to the acquisition of our leasing companies in October 2004. The gain resulted from the elimination of a tax liability when it became increasingly evident after ongoing discussions with the seller and the preparation of our respective tax returns for 2004, that the obligation for the payment was too remote to be carried on our books as a specific obligation.
Net interest income and non-interest income for 2006 increased by $7.5 million and $1.8 million respectively, while non-interest expense, including provision for loan losses, increased by $3.9 million as compared to 2005. Income increases outpaced expense increases as a result of the additional earning assets acquired through our acquisition and branching activity during 2006 and 2005. Our efficiency ratio improved in 2006 to 68.3% compared to 71.8% in 2005 and 76.7% in 2004. We expect to continue achieving further efficiencies by growing our operating revenue faster than our expenses, as well as evaluating staff levels with particular emphasis on our branches. We completed our corporate headquarters in downtown Chattanooga, Tennessee in the fourth quarter of 2006. In 2007, we anticipate opening de novo branches in Cookeville, Tennessee and Cleveland, Tennessee as well as a loan production office in Marietta, Georgia.
Net interest margin in 2006 was 5.09% or 6 basis points lower as compared to the prior period of 5.15%. The net interest margin of our peer group (as reported on the December 31, 2006 Uniform Bank Performance Report) was unchanged at 4.13% for 2006 and 2005. Our margin declined as expected due to the inclusion of Jackson Bank and the increase in deposit yields due to highly competitive market conditions, the flat yield curve interest rate environment and the lag in CD repricing. While our net interest margin remains among the highest
34
of our peer group, we expect our margin to decline in the first half of 2007 due to continuing changes in the mix of deposits to high-yielding products including retail and jumbo certificates of deposits. Furthermore, by the end of the second quarter, a majority of the CD portfolio will have renewed at current market rates from previously lower rates when we were in a different point of the interest rate cycle. We anticipate the margin to stabilize in the second half of 2007.
Critical Accounting Policies
Our accounting and reporting policies are in accordance with accounting principles generally accepted in the United States of America and conform to general practices within the banking industry. Critical accounting policies include the initial adoption of an accounting policy that has a material impact on our financial presentation as well as accounting estimates reflected in our financial statements that require us to make estimates and assumptions about matters that were highly uncertain at the time. Disclosure about critical estimates is required if different estimates that we reasonably could have used in the current period would have a material impact on the presentation of our financial condition, changes in financial condition or results of operations. Accounting policies related to the allowance for loan losses and the impairment of goodwill and other intangible assets each represent a critical accounting estimate.
The allowance for loan losses is established and maintained at levels management deems adequate to absorb possible credit losses inherent in the portfolio as of the balance sheet date. The level is based on past loan loss experience, known and inherent risks in the portfolio, adverse situations that may affect a borrower’s ability to repay, underlying estimated values of collateral securing loans, current economic conditions and other factors. Should any of these factors change, the estimate of credit losses in the loan portfolio and the related allowance would also change. Refer to the “Provision for Loan Losses” section for a discussion of our methodology of establishing the allowance for loan losses.
SFAS No. 142 prescribes the accounting for goodwill and intangible assets subsequent to initial recognition. The provisions of SFAS No. 142 discontinue the amortization of goodwill and intangible assets with indefinite lives. Instead, these assets are subject to at least an annual impairment review and more frequently if certain impairment indicators are in evidence. Changes in the estimates and assumptions used to evaluate impairment may have a material impact on the Company’s consolidated financial statements, results of operations or liquidity.
Results of Operations
We reported net income for 2006 of $11.1 million versus net income for 2005 of $9.6 million after the recognition of extraordinary gains in 2005 of $2.2 million. Net income for 2004 was $4.3 million after the recognition of extraordinary gain, net of tax, of $785 thousand. In 2006, basic net income per share was $0.64 on approximately 17.3 million shares and diluted net income per share was $0.63 on approximately 17.7 million weighted average shares outstanding. In 2005, basic net income per share was $0.65 on approximately 14.6 million shares and diluted net income per share was $0.64 on approximately 14.9 million weighted average shares outstanding. In 2004, basic net income per share was $0.34 on approximately 12.7 million shares and diluted net income per share was $0.33 on approximately 12.9 million weighted average shares outstanding.
Net income in 2006 was above the 2005 level as a result of (1) a full year inclusion of Jackson Bank which was acquired in August 2005, (2) our branching and deposit gathering activities, and (3) improving our core efficiency by growing revenue faster than expenses. Our overhead also increased in 2006 because of our Jackson Bank acquisition and completion of the corporate headquarters in the fourth quarter. As of December 31, 2006, we had 38 banking offices, including the headquarters, three leasing offices and 369 full time equivalent employees. Although, we expect to continue to expand our branch network and our employee force in 2007, we are mindful of the fact that growth and increasing the number of branches adds expenses (such as administrative costs and occupancy, salaries and benefits expenses) before earnings.
35
The following table summarizes the components of income and expense and the changes in those components for the past three years.
| | | | | | | | | | | | | | | | | | | | | | | | | | | | | | |
| | | Condensed Consolidated Statements of Income For the Years Ended December 31, | |
| | | 2006 | | Change From Prior Year | | | Percent Change | | | 2005 | | Change From Prior Year | | | Percent Change | | | 2004 | | Change From Prior Year | | | Percent Change | |
| | | (dollar amounts in thousands) | |
Gross interest income | | $ | 75,127 | | $ | 18,823 | | | 33.4 | % | | $ | 56,304 | | $ | 18,715 | | | 49.8 | % | | $ | 37,589 | | $ | 6,146 | | | 19.6 | % |
Gross interest expense | | | 27,145 | | | 11,282 | | | 71.1 | % | | | 15,863 | | | 7,104 | | | 81.1 | % | | | 8,759 | | | (138 | ) | | (1.6 | )% |
| | | | | | | | | | | | | | | | | | | | | | | | | | | | | | |
Net interest income | | | 47,982 | | | 7,541 | | | 18.6 | % | | | 40,441 | | | 11,611 | | | 40.3 | % | | | 28,830 | | | 6,284 | | | 27.9 | % |
Provision for loan losses | | | 2,184 | | | (738 | ) | | (25.3 | )% | | | 2,922 | | | (477 | ) | | (14.0 | )% | | | 3,399 | | | 1,277 | | | 60.2 | % |
| | | | | | | | | | | | | | | | | | | | | | | | | | | | | | |
Net interest income after provision for loan losses | | | 45,798 | | | 8,279 | | | 22.1 | % | | | 37,519 | | | 12,088 | | | 47.5 | % | | | 25,431 | | | 5,007 | | | 24.5 | % |
Noninterest income | | | 10,617 | | | 1,770 | | | 20.0 | % | | | 8,847 | | | 2,303 | | | 35.2 | % | | | 6,544 | | | 1,115 | | | 20.5 | % |
Noninterest expense | | | 40,017 | | | 4,644 | | | 13.1 | % | | | 35,373 | | | 8,245 | | | 30.4 | % | | | 27,128 | | | 4,850 | | | 21.8 | % |
| | | | | | | | | | | | | | | | | | | | | | | | | | | | | | |
Income before income taxes | | | 16,398 | | | 5,405 | | | 49.2 | % | | | 10,993 | | | 6,146 | | | 126.8 | % | | | 4,847 | | | 1,272 | | | 35.6 | % |
Income tax provision | | | 5,286 | | | 1,689 | | | 47.0 | % | | | 3,597 | | | 2,232 | | | 163.5 | % | | | 1,365 | | | 246 | | | 22.0 | % |
| | | | | | | | | | | | | | | | | | | | | | | | | | | | | | |
Income before extraordinary item | | | 11,112 | | | 3,716 | | | 50.2 | % | | | 7,396 | | | 3,914 | | | 112.4 | % | | | 3,482 | | | 1,026 | | | 41.8 | % |
Extraordinary gain on business combination, net of income tax | | | — | | | (2,175 | ) | | (100.0 | )% | | | 2,175 | | | 1,390 | | | 177.1 | % | | | 785 | | | 785 | | | 100.0 | % |
| | | | | | | | | | | | | | | | | | | | | | | | | | | | | | |
Net income | | $ | 11,112 | | $ | 1,541 | | | 16.1 | % | | $ | 9,571 | | $ | 5,304 | | | 124.3 | % | | $ | 4,267 | | $ | 1,811 | | | 73.7 | % |
| | | | | | | | | | | | | | | | | | | | | | | | | | | | | | |
Further explanation, with year-to-year comparisons of the income and expense, is provided below.
Net Interest Income
Net interest income (the difference between the interest earned on assets, such as loans and investment securities, and the interest paid on liabilities, such as deposits and other borrowings) is our primary source of operating income. In 2006, net interest income was $48.0 million or 19% more than the 2005 level of $40.4 million, which in turn was 40% more than the 2004 level of $28.8 million.
We monitor and evaluate the effects of certain risks on our earnings and seek balance between the risks assumed and returns sought. Some of these risks include interest rate risk, credit risk and liquidity risk.
The level of net interest income is determined primarily by the average balances (volume) of interest earning assets and the various rate spreads between our interest earning assets and our funding sources. Changes in net interest income from period to period result from increases or decreases in the volume of interest earning assets and interest bearing liabilities, increases or decreases in the average interest rates earned and paid on such assets and liabilities, the ability to manage the interest earning asset portfolio (which includes loans), and the availability of particular sources of funds, such as noninterest bearing deposits.
Interest income in 2006 was $75.1 million, a 33% increase over the 2005 level of $56.3 million, which was a 50% increase over the 2004 level of $37.6 million. Year-to-year increases since 2004 are due to the annual increases in the volume of earning assets. Average earning assets in 2006 were $961.0 million, an increase of
36
$161.9 million or 20% from 2005 average earning assets. The increase from 2004 to 2005 was $188.5 million or 31%. The tax equivalent yield on earning assets increased 78 basis points in 2006 to 7.92% from 7.14% in 2005, which was 88 basis points higher than 2004. The changes in the yield rates relate to our changing the mix of earning assets and the Federal Reserve Board changing the federal funds rate and discount rate.
Total interest expense was $27.1 million in 2006 compared to $15.9 million in 2005 and to $8.8 million in 2004. The increase in interest expense in 2006 is primarily due to raising interest rates on deposits and the additional volume of interest bearing liabilities, which includes the impact of Jackson Bank for the full year. The increase in interest expense in 2005 was primarily due to the additional volume of interest bearing liabilities. The average rate paid on average interest-bearing liabilities increased 103 basis points to 3.55% for 2006 from 2.52% in 2005 and increased 70 basis points from 1.82% in 2004 to 2.52% in 2005. The rate increase is a reflection of the market conditions in 2006. Average interest bearing liabilities increased $136.0 million or 22% in 2006 compared to 2005 and $148.6 million in 2005 or 31% compared to 2004. The significant increase in interest bearing liabilities in 2006 was due to our market penetration and the full year of Jackson Bank. The increase in 2005 was due to our market penetration, the acquisition of Jackson Bank and the issuance of brokered CDs. We primarily use brokered CDs to match fund our leasing portfolio. Average total deposits grew $152.5 million or 21% to $887.3 million in 2006 and increased $175.2 million or 31% to $734.9 million in 2005. Absent any competitive pricing pressures, we feel that our average rate paid on interest bearing liabilities will level off in the second half of the year as our time deposits mature and reprice at current market rates, which have stabilized since the Federal Reserves rate increase initiative ended in June of 2006.
The banking industry uses two key ratios to measure relative profitability of net interest income: net interest rate spread and net interest margin. The net interest rate spread measures the difference between the average yield on earning assets and the average rate paid on interest-bearing liabilities. The net interest rate spread does not consider the impact of noninterest-bearing deposits and gives a direct perspective on the effect of market interest rate movements. The net interest margin is defined as net interest income as a percentage of total average earning assets and takes into account the positive effects of investing noninterest-bearing deposits in earning assets.
First Security’s net interest rate spread (on a tax equivalent basis) was 4.37% in 2006, 4.62% in 2005 and 4.44% in 2004, while the net interest margin (on a tax equivalent basis) was 5.09% in 2006, 5.15% in 2005 and 4.83% in 2004. The decrease in the net interest spread and net interest margin for 2006 was primarily due to (1) the Jackson Bank acquisition and (2) the rates on interest bearing deposits increasing at a faster pace than the yields on earning assets due to the competition for deposits in our markets, the flat to inverted yield curve interest rate environment, and the lag in CD repricing. The increased net interest margin from 2004 to 2005 was due to (1) our earning assets repricing faster than our interest bearing liabilities in an increasing interest rate environment, (2) changes in the mix of our earning assets and (3) the acquisition of Kenesaw Leasing and J&S Leasing in October 2004, which added approximately 45 basis points to our net interest margin at that time. In 2007, we believe our net interest margin will continue to decrease before stabilizing in the second half of the year due to the continued competition for deposits. Average interest bearing liabilities as a percentage of average earning assets was 80% in 2006, 79% in 2005 and 79% in 2004.
In 2004, the Federal Reserve Board raised the federal funds rate five times by a total of 125 basis points, from 1.00% to 2.25%. In 2005, the Federal Reserve Board raised the target federal funds rate eight times by a total of 200 basis points to 4.25%. In 2006, the Federal Reserve Board raised the target federal funds rate four times by a total of 100 basis points to 5.25%.
37
The following table summarizes net interest income and average yields and rates paid for the years ended December 31, 2006, 2005 and 2004.
Average Consolidated Balance Sheets and Net Interest Analysis
Fully Tax-Equivalent Basis
| | | | | | | | | | | | | | | | | | | | | | | | | | | | | | |
| | | For the Years Ended, | |
| | | 2006 | | | 2005 | | | 2004 | |
| | | Average Balance | | | Income/ Expense | | Yield/ Rate | | | Average Balance | | | Income/ Expense | | Yield/ Rate | | | Average Balance | | | Income/ Expense | | Yield/ Rate | |
| | | (dollar amounts in thousands) (fully tax-equivalent basis) | |
ASSETS | | | | | | | | | | | | | | | | | | | | | | | | | | | | | | |
Earning assets: | | | | | | | | | | | | | | | | | | | | | | | | | | | | | | |
Loans, net of unearned income(1) (2) | | $ | 796,866 | | | $ | 67,996 | | 8.53 | % | | $ | 657,928 | | | $ | 50,792 | | 7.72 | % | | $ | 514,479 | | | $ | 34,340 | | 6.67 | % |
Debt securities—taxable | | | 114,518 | | | | 5,350 | | 4.67 | % | | | 91,885 | | | | 3,698 | | 4.02 | % | | | 64,833 | | | | 2,239 | | 3.45 | % |
Debt securities—non-taxable(2) | | | 42,673 | | | | 2,448 | | 5.74 | % | | | 32,455 | | | | 1,892 | | 5.83 | % | | | 21,387 | | | | 1,381 | | 6.46 | % |
Fed funds sold and other earning assets | | | 6,909 | | | | 306 | | 4.43 | % | | | 16,841 | | | | 641 | | 3.81 | % | | | 9,886 | | | | 150 | | 1.52 | % |
| | | | | | | | | | | | | | | | | | | | | | | | | | | | | | |
Total earning assets | | | 960,966 | | | | 76,100 | | 7.92 | % | | | 799,109 | | | | 57,023 | | 7.14 | % | | | 610,585 | | | | 38,110 | | 6.26 | % |
| | | | | | | | | | | | | | | | | | | | | | | | | | | | | | |
Allowance for loan losses | | | (10,241 | ) | | | | | | | | | (9,444 | ) | | | | | | | | | (6,044 | ) | | | | | | |
Intangible assets | | | 31,699 | | | | | | | | | | 19,924 | | | | | | | | | | 15,296 | | | | | | | |
Cash & due from banks | | | 26,125 | | | | | | | | | | 21,666 | | | | | | | | | | 21,259 | | | | | | | |
Premises & equipment | | | 33,060 | | | | | | | | | | 27,652 | | | | | | | | | | 25,514 | | | | | | | |
Other assets | | | 39,766 | | | | | | | | | | 28,039 | | | | | | | | | | 9,771 | | | | | | | |
| | | | | | | | | | | | | | | | | | | | | | | | | | | | | | |
Total assets | | $ | 1,081,375 | | | | | | | | | $ | 886,946 | | | | | | | | | $ | 676,381 | | | | | | | |
| | | | | | | | | | | | | | | | | | | | | | | | | | | | | | |
LIABILITIES AND STOCKHOLDERS’ EQUITY | | | | | | | | | | | | | | | | | | | | | | | | | | | | | | |
Interest bearing liabilities: | | | | | | | | | | | | | | | | | | | | | | | | | | | | | | |
NOW accounts | | $ | 70,125 | | | $ | 589 | | 0.84 | % | | $ | 64,054 | | | $ | 433 | | 0.68 | % | | $ | 52,104 | | | | 183 | | 0.35 | % |
Money market accounts | | | 105,557 | | | | 2,574 | | 2.44 | % | | | 112,681 | | | | 1,958 | | 1.74 | % | | | 100,952 | | | | 1,030 | | 1.02 | % |
Savings deposits | | | 38,243 | | | | 287 | | 0.75 | % | | | 34,606 | | | | 180 | | 0.52 | % | | | 32,789 | | | | 114 | | 0.35 | % |
Time deposits > $100 | | | 182,764 | | | | 8,378 | | 4.58 | % | | | 124,008 | | | | 4,136 | | 3.34 | % | | | 96,433 | | | | 2,522 | | 2.62 | % |
Time deposits < $100 | | | 245,140 | | | | 10,417 | | 4.25 | % | | | 182,629 | | | | 5,645 | | 3.09 | % | | | 162,221 | | | | 3,988 | | 2.46 | % |
Brokered CDs | | | 85,545 | | | | 3,649 | | 4.27 | % | | | 84,844 | | | | 2,987 | | 3.52 | % | | | 7,466 | | | | 263 | | 3.52 | % |
Federal funds purchased | | | 6,563 | | | | 347 | | 5.29 | % | | | 5,369 | | | | 162 | | 3.02 | % | | | 4,686 | | | | 88 | | 1.88 | % |
Repurchase agreements | | | 19,290 | | | | 395 | | 2.05 | % | | | 15,896 | | | | 137 | | 0.86 | % | | | 13,672 | | | | 88 | | 0.64 | % |
Other borrowings | | | 12,277 | | | | 509 | | 4.15 | % | | | 5,372 | | | | 225 | | 4.19 | % | | | 10,494 | | | | 483 | | 4.60 | % |
| | | | | | | | | | | | | | | | | | | | | | | | | | | | | | |
Total interest bearing liabilities | | | 765,504 | | | | 27,145 | | 3.55 | % | | | 629,459 | | | | 15,863 | | 2.52 | % | | | 480,817 | | | | 8,759 | | 1.82 | % |
| | | | | | | | | | | | | | | | | | | | | | | | | | | | | | |
Net interest spread | | | | | | $ | 48,955 | | 4.37 | % | | | | | | $ | 41,160 | | 4.62 | % | | | | | | $ | 29,351 | | 4.44 | % |
| | | | | | | | | | | | | | | | | | | | | | | | | | | | | | |
Noninterest bearing demand deposits | | | 159,945 | | | | | | | | | | 132,047 | | | | | | | | | | 107,730 | | | | | | | |
Accrued expenses and other liabilities | | | 15,459 | | | | | | | | | | 17,941 | | | | | | | | | | 4,204 | | | | | | | |
Stockholders’ equity | | | 142,371 | | | | | | | | | | 108,084 | | | | | | | | | | 83,849 | | | | | | | |
Accumulated other comp (loss) income | | | (1,904 | ) | | | | | | | | | (585 | ) | | | | | | | | | (219 | ) | | | | | | |
| | | | | | | | | | | | | | | | | | | | | | | | | | | | | | |
Total liabilities and stockholders’ equity | | $ | 1,081,375 | | | | | | | | | $ | 886,946 | | | | | | | | | $ | 676,381 | | | | | | | |
| | | | | | | | | | | | | | | | | | | | | | | | | | | | | | |
Impact of noninterest bearing sources and other changes in balance sheet composition | | | | | | | | | 0.72 | % | | | | | | | | | 0.53 | % | | | | | | | | | 0.39 | % |
| | | | | | | | | | | | | | | | | | | | | | | | | | | | | | |
Net interest margin | | | | | | | | | 5.09 | % | | | | | | | | | 5.15 | % | | | | | | | | | 4.83 | % |
| | | | | | | | | | | | | | | | | | | | | | | | | | | | | | |
| (1) | Nonaccrual loans have been included in the average balance. Only the interest collected on such loans has been included as income. |
| (2) | Interest income from securities and loans includes the effects of taxable-equivalent adjustments using a federal income tax rate of approximately 34% for all years reported and where applicable, state income taxes, to increase tax-exempt interest income to a taxable-equivalent basis. The net taxable equivalent adjustment amounts included in the above table were $973 thousand, $719 thousand and $521 thousand for the three years ended December 31, 2006, 2005 and 2004. |
38
The following table shows the relative impact on net interest income to changes in the average outstanding balances (volume) of earning assets and interest-bearing liabilities and the rates earned and paid by us on such assets and liabilities. Variances resulting from a combination of changes in rate and volume are allocated in proportion to the absolute dollar amounts of the change in each category.
Change in Interest Income and Expense on a Tax Equivalent Basis
| | | | | | | | | | | | | | | | | | | | | | | | |
| | | 2006 compared to 2005 increase (decrease) in interest income and expense due to changes in: | | | 2005 compared to 2004 increase (decrease) in interest income and expense due to changes in: | |
| | | Volume | | | Rate | | | Total | | | Volume | | | Rate | | | Total | |
| | | (dollar amounts in thousands) | |
Earning assets: | | | | | | | | | | | | | | | | | | | | | | | | |
Loans, net of unearned income | | $ | 10,726 | | | $ | 6,478 | | | $ | 17,204 | | | $ | 9,575 | | | $ | 6,877 | | | $ | 16,452 | |
Debt Securities—taxable | | | 911 | | | | 741 | | | | 1,652 | | | | 934 | | | | 525 | | | | 1,459 | |
Debt securities—non-taxable | | | 596 | | | | (40 | ) | | | 556 | | | | 715 | | | | (204 | ) | | | 511 | |
Fed funds sold and other earning assets | | | (378 | ) | | | 43 | | | | (335 | ) | | | 106 | | | | 385 | | | | 491 | |
| | | | | | | | | | | | | | | | | | | | | | | | |
Total earning assets | | | 11,855 | | | | 7,222 | | | | 19,077 | | | | 11,330 | | | | 7,583 | | | | 18,913 | |
| | | | | | | | | | | | | | | | | | | | | | | | |
Interest bearing liabilities: | | | | | | | | | | | | | | | | | | | | | | | | |
NOW accounts | | | 41 | | | | 115 | | | | 156 | | | | 42 | | | | 208 | | | | 250 | |
Money market accounts | | | (124 | ) | | | 740 | | | | 616 | | | | 120 | | | | 808 | | | | 928 | |
Savings deposits | | | 19 | | | | 88 | | | | 107 | | | | 6 | | | | 60 | | | | 66 | |
Time deposits > $100 | | | 1,960 | | | | 2,282 | | | | 4,242 | | | | 721 | | | | 893 | | | | 1,614 | |
Time deposits < $100 | | | 1,932 | | | | 2,840 | | | | 4,772 | | | | 502 | | | | 1,155 | | | | 1,657 | |
Brokered CD’s | | | 25 | | | | 637 | | | | 662 | | | | 2,726 | | | | (2 | ) | | | 2,724 | |
Federal funds purchased | | | 36 | | | | 149 | | | | 185 | | | | 13 | | | | 61 | | | | 74 | |
Repurchase agreements | | | 29 | | | | 229 | | | | 258 | | | | 14 | | | | 35 | | | | 49 | |
Other borrowings | | | 289 | | | | (5 | ) | | | 284 | | | | (236 | ) | | | (22 | ) | | | (258 | ) |
| | | | | | | | | | | | | | | | | | | | | | | | |
Total interest bearing liabilities | | | 4,207 | | | | 7,075 | | | | 11,282 | | | | 3,908 | | | | 3,196 | | | | 7,104 | |
| | | | | | | | | | | | | | | | | | | | | | | | |
Increase in net interest income | | $ | 7,648 | | | $ | 147 | | | $ | 7,795 | | | $ | 7,422 | | | $ | 4,387 | | | $ | 11,809 | |
| | | | | | | | | | | | | | | | | | | | | | | | |
Provision for Loan Losses
The provision for loan losses charged to operations during 2006 was $2.2 million compared to $2.9 million in 2005 and $3.4 million in 2004. In 2006, net charge-offs totaled $2.2 million, which is a decrease of $159 thousand as compared to 2005 charge-offs of $2.4 million. Charge-offs in 2004 were $2.9 million. Net charge-offs as a percentage of average loans were 0.28% in 2006, 0.36% in 2005 and 0.57% in 2004 and our Bank’s peer group averages (as reported in the December 31, 2006 Uniform Bank Performance Report) were 0.13%, 0.16% and 0.17% in 2006, 2005 and 2004, respectively.
The decrease in our provision for loan losses in 2006 relative to 2005 was a result of our analysis of inherent risks in the loan portfolio in relation to the portfolio’s growth, the level of past due, charged-off, classified and nonperforming loans, as well as general economic conditions. As a result of our analysis, we determined during the fourth quarter of 2006 that we had adequately provided to absorb potential credit losses and as a result reduced our provision expense for the remainder of 2006 to reflect this improvement in credit quality. Management will reanalyze the allowance for loan losses on at least a quarterly basis, and the next review will be at March 31, 2007, or sooner if necessary, and the provision expense will be adjusted accordingly, if necessary. We anticipate that during 2007 our provision expense for loan losses may increase due to projected loan growth. Our loan pipeline remains strong and we anticipate organic loan growth in 2007 will be consistent with the 2006 level of 13% as a result of our branching and marketing activities.
39
The loan portfolio increased by $98.9 million or 13% from year-end 2005 compared to an increase of $156.3 million from year-end 2004 to year-end 2005. In 2005 we acquired approximately $104.3 million in loans in our acquisition of Jackson Bank. Excluding maturities, prepayments, and payoffs of the purchased loans, our organic loan growth in 2005 was approximately $52.0 million or 9%.
Our allowance for loan losses is also subject to regulatory examinations and determinations as to adequacy, which may take into account such factors as the methodology used to calculate the allowance for loan losses and the size of the allowance for loan losses compared to a group of peer banks. During their routine examinations, regulators may require us to make additional provisions to our allowance for loan losses when, in the opinion of the regulators, their credit evaluations and allowance for loan loss methodology differ materially from ours.
During 2006 we made further improvements in our methodology and analysis of the loan loss reserve and are in process of implementing additional improvements which complies with recently communicated interagency regulatory guidance. In addition to analyzing significant problem loans for possible deficiencies in sources of repayment, we also analyzed the loss history in specific pools of criticized and classified loans. We then used this loss history to estimate the amount of loan loss coverage necessary for the smaller problem loans not specifically analyzed. We also analyze our loan portfolio by product and compare our actual loss history with that reported by our peer banks.
Our primary grouping of loans that are specifically analyzed for loss potential and specific reserves are as follows:
| 1. | Significant Classified Loans: Significant classified loans generally include those loans with a risk rating of substandard and a total exposure exceeding $500 thousand, as well as all loans with a risk rating of doubtful. For this loan group, management estimates the specific potential losses based upon an individual analysis of the relationship risks, the borrower’s cash flow, the borrower’s management and any underlying secondary sources of repayment. If management believes or an outside third party’s valuation indicates that the value of the secondary sources of repayment is less than the balance of the total corporate exposure, then a specific reserve is established or if appropriate, the deficiency is charged off against the allowance. The definition of both substandard and doubtful risk ratings are outlined in item 2 below. |
| 2. | Other Classified and Criticized Loans: We reserve for loan pools that are criticized and classified, but are not considered “significant,” as described in item 1 above, using flat percentages depending on the pool’s risk rating and also the loss history of the specific pools of criticized and classified loans. For this group, we analyze the geographic loan pools as follows: |
| | i. | Loans with Risk Ratings of Special Mention: We reserve for special mention loans using a flat percentage of 4.96% based upon the loss history experienced in this pool of loans for the previous 18 months. We refer to this analysis of these pools as “vintage analysis”. For leases we are using a flat 3% since this is a collateralized product. The special mention risk rating is considered a criticized loan and is not considered as severe as a classified loan risk rating. Special mention loans are loans that must be followed closely because of identified potential weakness(es), which if not checked and corrected, could result in an unacceptable increase in credit risk at some future date. These loans may be characterized by: |
| | • | | Downward trend in sales, profit levels and margins |
| | • | | Impaired working capital position compared to industry |
| | • | | Cash flow strained in order to meet debt repayment schedule |
| | • | | Technical defaults due to noncompliance with financial covenants |
40
| | • | | Recurring trade payable slowness |
| | • | | High leverage compared to industry average with shrinking equity cushion |
| | • | | Questionable abilities of management |
| | • | | Weak industry conditions |
| | • | | Inadequate or outdated financial statements; if audited, adverse opinion may be issued |
| | | Loans to Businesses or Individuals: |
| | • | | Loan delinquencies and overdrafts may occur |
| | • | | Original source of repayment questionable |
| | • | | Documentation deficiencies may not be easily correctable |
| | • | | Loan may need to be restructured |
| | • | | Collateral or guarantor offers adequate protection |
| | • | | Unsecured debt to tangible net worth is excessive |
| | ii. | Loans with Risk Ratings of Substandard: We reserve for substandard loans that are generally less than $500 thousand using 6.10% based on the 18 month vintage analysis testing results. Substandard leases are reserved at 10%. Substandard loans are loans that reflect significant deficiencies with specifically identified and well defined weaknesses due to severely adverse trends of a financial, economic, or managerial nature. For substandard loans, a protracted work-out is likely due to the following factors, in addition to those listed for special mention loans: |
| | • | | Sustained losses which have severely eroded equity and cash flows |
| | • | | Concentration in illiquid assets |
| | • | | Serious management problems or internal fraud |
| | • | | Chronic trade payable slowness; may be placed on COD or collection by trade creditor |
| | • | | Inability to access other funding sources |
| | • | | Financial statements with adverse opinion or disclaimer; may be received late |
| | • | | Insufficient documented cash flows to meet contractual debt service requirements |
| | | Loans to Businesses or Individuals: |
| | • | | Chronic or severe delinquency or has met the retail classification standards which is generally past dues greater than 90 days |
| | • | | Original repayment terms liberalized due to inability to meet original terms |
| | • | | Likelihood of bankruptcy exists |
| | • | | Serious documentation deficiencies |
| | • | | Reliance on secondary sources of repayment which are presently considered adequate |
| | • | | Litigation may have been filed against the borrower |
| | • | | Interest non-accrual may be warranted |
41
| | iii. | Loans with Risk Ratings of Doubtful: We analyze doubtful loans individually to determine our best estimate of loss based upon the most recent assessment of all available sources of repayment. The amount of the estimated loss is then specifically reserved in a separate component of the allowance of loan loss reserve. Doubtful loans are loans where the collection or liquidation in full of principal and/or interest is highly questionable or improbable. Doubtful loans must be placed on non-accrual, and the principal balance charged down to estimated collectable value, or a full or partial reserve must be allocated. In addition to the characteristics listed for substandard loans, the following characteristics apply to doubtful loans: |
| | • | | Normal operations are severely diminished or have ceased |
| | • | | Seriously impaired cash flow |
| | • | | Numerous exceptions to loan agreement |
| | • | | Outside accountant questions entity’s survivability as a “going concern” |
| | • | | Financial statements may be received late, if at all |
| | • | | Material judgments filed |
| | • | | Collection of principal and interest is impaired |
| | • | | Collateral/Guarantor may offer inadequate protection |
| | • | | Possibility of partial loss exists |
| | | Loans to Businesses or Individuals: |
| | • | | Original repayment terms materially altered |
| | • | | Secondary source of repayment is inadequate |
| | • | | Asset liquidation may be in process with all efforts directed at debt retirement |
| | • | | Documentation deficiencies not correctable |
| | iv. | Loans with Risk Ratings of Loss: We reserve loss loans at 100% of the loan balance pursuant to our loan policy. Loss loans are loans of such limited value that they do not merit continuance as an acceptable asset, and therefore must be charged-off in full in the fiscal quarter this grade is assigned. As of December 31, 2006, December 31, 2005 and December 31, 2004, we did not have any loans risk rated as loss that had not been previously charged off. |
| 3. | Unclassified and Uncriticized Loans: In our analysis of these loan pools, we establish our reserves using our historical average net charge-off base for loans for the prior six years. As of December 31, 2006, our historical six year average net charge-off rate for loans and three to five year historical charge-off rate for leases was approximately 0.36% and 1.13%, respectively. |
| 4. | We also analyzed the loan portfolio (excluding criticized and classified loans) based upon six categories that may increase the risk of loss in the portfolio. The six categories include: |
| | i) | Changes in lending policies and procedures, underwriting standards and collection, charge-off and recovery practices |
| | ii) | Changes in national and local economic and business conditions |
| | iii) | Changes in the trends, concentrations, nature and volume of the loan portfolio |
| | iv) | Changes in the experience, ability and depth of lending staff |
42
| | v) | Changes in credit quality indicators |
| | vi) | Provision for lack of vintage analysis data* |
We assigned reserve percentages for each of these categories ranging from 0.02% to 0.11% depending upon the perceived risk that each may have on the portfolio. For example a low risk was assigned 0.02% and a moderate risk was assigned 0.07%. These may increase or decrease each quarter depending upon the perceived risk in each category.
For purposes of analyzing the allowance for loan losses, the unclassified and uncriticized loan pools do not include binding commitments to lend, standby letters of credit, deposit secured loans or mortgage loans originated with commitments to sell in the secondary market. Loans secured by segregated deposits held by us are not required to have an allowance reserve, nor are originated mortgage loans pending sale in the secondary market.
While it is our policy to charge-off in the current period loans for which a loss is considered probable, there are additional risks of future losses which cannot be quantified precisely or attributed to particular loans or classes of loans. Because these risks include the state of the economy, management’s judgment as to the adequacy of the allowance is necessarily approximate and imprecise.
| * | For the year ended December 31, 2006, we provided additional provision for this category. During 2007, we will have adequate data and further provision for a lack of vintage analysis may not be necessary. |
Noninterest Income
Total noninterest income for 2006 was $10.6 million, compared to $8.8 million in 2005 and $6.5 million in 2004. We experienced solid organic growth of approximately 16% year over year. In 2006 and 2005, Jackson Bank contributed approximately $1.0 million and $547 thousand, respectively, in non-interest income. The following table presents the components of noninterest income for years ended December 31, 2006, 2005 and 2004.
Noninterest Income
| | | | | | | | | | | | | | | | | |
| | | For the Years Ended |
| | | 2006 | | | Percent
Change | | | 2005 | | | Percent
Change | | | 2004 |
| | | (dollar amounts in thousands) |
NSF fees | | $ | 3,874 | | | 18.0 | % | | $ | 3,284 | | | 13.1 | % | | $ | 2,903 |
Service charges on deposit accounts | | | 969 | | | 3.4 | % | | | 937 | | | (3.4 | )% | | | 970 |
Mortgage loan and related fees | | | 1,446 | | | (1.5 | )% | | | 1,468 | | | 9.2 | % | | | 1,344 |
Net (loss) gain on sales of available for sale securities | | | (197 | ) | | (68.4 | )% | | | (117 | ) | | (239.3 | )% | | | 84 |
Other income | | | 4,525 | | | 38.2 | % | | | 3,275 | | | 163.5 | % | | | 1,243 |
| | | | | | | | | | | | | | | | | |
Total noninterest income | | $ | 10,617 | | | 20.0 | % | | $ | 8,847 | | | 35.2 | % | | $ | 6,544 |
| | | | | | | | | | | | | | | | | |
Our largest sources of noninterest income are service charges and fees on deposit accounts. Total service charges, including non-sufficient funds (NSF) fees, were $4.8 million, or 46% of total noninterest income for 2006 compared with $4.2 million, or 48% of total noninterest income for 2005, compared with $3.9 million or 59% for 2004. In addition to standard NSF fees, we offer a “bounce protection” program that pays our customers’ non-sufficient fund checks (to a predetermined limit) for a fee. This program and our growing deposit base caused our NSF fee income to increase from 2004 to 2006. Organic growth of NSF fees was $236 thousand or 8% and $82 thousand or 3% for 2006 and 2005, respectively. Effective January 1, 2005, we decreased the
43
amount of time that we may hold an overdraft prior to charging it off from 60 days to 45 days to begin more aggressive recovery efforts earlier in the process. As a result of this change, our NSF fees for 2005 remained relatively consistent as compared to 2004, excluding the positive impact of $299 thousand of NSF fees from Jackson Bank in 2005. Service charges on deposit accounts decreased on an organic basis in 2006 as compared to 2005 and 2004 due to (1) an increase in the average balance of checking and savings accounts thus decreasing the amount of service charges assessed to the customer, (2) an increase in “free checking” due to competitive pressures and (3) a reduction in commercial account analysis charges due to increases in the crediting rate which often occur in a rising interest rate environment. At year-end 2006 and 2005 we had 42,323 and 42,199 transaction and savings accounts, respectively. We increased our transaction accounts by nearly 1,200 accounts while savings accounts decreased by approximately 1,000. This was due to the shift from savings accounts to higher yielding CDs.
Mortgage loan and related fees for 2006 were $1.4 million, compared to $1.5 million in 2005 and to the 2004 level of $1.3 million. Our process to originate and sell a conforming mortgage in the secondary market typically takes 30 to 60 days from the date of mortgage origination to the date the mortgage is sold to an investor in the secondary market. Due to the normal processing time, we will have a certain amount of held for sale loans at any time. Mortgages originated for sale in the secondary market totaled $88.9 million in 2006. Mortgages sold in the secondary market totaled $84.6 million in 2006. In 2005, we originated and sold approximately $85.3 million of residential mortgages; and in 2004 we originated and sold approximately $80.7 million of residential mortgages. We sold these loans with the right to service the loans (the servicing asset) being released to the purchaser for a fee.
Other income for 2006 was $4.5 million, compared to the 2005 level of $3.3 million and the 2004 level of $1.2 million. The components of other income primarily consist of point-of-sale fees on debit cards, credit card fee income, ATM fee income, earnings of bank-owned life insurance, trust fee income, underwriting revenue, safe deposit box fee income and gains on sales of other real estate, repossessions, leased equipment and premises and equipment.
In 2005, we recognized certain other non-interest income, which we consider not to be in the normal course of business or recurring in nature. Adjusting for the 2005 non-recurring items, other noninterest income increased $1.7 million or 59% in 2006.
Earnings on bank-owned life insurance increased $333 thousand or 62%, reflecting a full year of earnings on the $17.3 million of life insurance purchased in the first half of 2005 and the assumption of $3.3 million through the Jackson Bank acquisition in August of 2005. Trust fee income increased $205 thousand or 109% from 2005. Point of service income increased $205 thousand or 35%, and gains on sales of foreclosed and repossessed property, leased equipment, and premises and equipment increased $614 thousand, excluding the above mentioned non-recurring $170 thousand gain in 2005.
44
Noninterest Expense
Total noninterest expense for 2006 was $40.0 million, compared to $35.4 million in 2005 and to $27.1 million in 2004. Noninterest expense for 2006 and 2005 included increases of approximately $2.7 million and $4.7 million, respectively in salaries and benefits as a result of growth within our core banking markets and the acquisitions of Jackson Bank in August 2005 and Kenesaw Leasing and J&S Leasing in October 2004. Unless indicated otherwise in the discussion below, we anticipate increases in noninterest expense for 2007 as a result of our branching activities. The following table represents the components of noninterest expense for the years ended December 31, 2006, 2005 and 2004.
Noninterest Expense
| | | | | | | | | | | | | | | |
| | | For the Years Ended |
| | | 2006 | | Percent
Change | | | 2005 | | Percent
Change | | | 2004 |
| | | (dollar amounts in thousands) |
Salaries & benefits | | $ | 22,108 | | 13.8 | % | | $ | 19,428 | | 31.5 | % | | $ | 14,776 |
Occupancy | | | 3,169 | | 16.3 | % | | | 2,725 | | 34.0 | % | | | 2,033 |
Furniture and equipment | | | 3,444 | | 19.5 | % | | | 2,881 | | 29.3 | % | | | 2,229 |
Professional fees | | | 1,927 | | 41.3 | % | | | 1,364 | | 18.4 | % | | | 1,152 |
Data processing | | | 1,327 | | 11.6 | % | | | 1,189 | | 1.0 | % | | | 1,177 |
Printing & supplies | | | 527 | | 0.4 | % | | | 525 | | (12.1 | )% | | | 597 |
Communications | | | 801 | | 32.4 | % | | | 605 | | 13.9 | % | | | 531 |
Advertising | | | 437 | | (28.4 | )% | | | 610 | | 22.5 | % | | | 498 |
Intangible asset amortization | | | 1,246 | | 34.1 | % | | | 929 | | 16.6 | % | | | 797 |
Other expense | | | 5,031 | | (0.2 | )% | | | 5,117 | | 53.3 | % | | | 3,338 |
| | | | | | | | | | | | | | | |
Total noninterest expense | | $ | 40,017 | | 13.1 | % | | $ | 35,373 | | 30.4 | % | | $ | 27,128 |
| | | | | | | | | | | | | | | |
Total salaries and benefits increased 13.8% in 2006 as compared to 2005. The increase in salaries and benefits is related to our staff additions to accommodate our growth, as well as the acquisition of Jackson Bank in the third quarter of 2005. The Jackson Bank acquisition resulted in approximately $1.2 million of the overall increase in salaries and benefits in 2006. As of December 31, 2006, we had 38 full service banking offices and three leasing offices with 369 full-time equivalent employees; as of December 31, 2005, we had 37 full service banking offices and four leasing offices with 358 full-time equivalent employees; and as of December 31, 2004, we had 30 full service banking offices, one loan production office and four leasing offices with 308 full time equivalent employees. In 2007, we are budgeting to add a de novo branch in Cookeville, Tennessee as well as an additional branch in Cleveland, Tennessee. We anticipate both branches opening in the second quarter. The de novo branches along with the corporate headquarters that opened in December 2006 will increase non-interest expense in 2007.
Total occupancy expense for 2006 increased by 16.3% compared with 2005, which was 34.0% more than total occupancy expense in 2004. The increase in 2006 was primarily due to a full year of the five Jackson Bank branches which accounted for approximately $260 thousand or 59% of the overall $444 thousand or 16.3% increase. The increase in 2005 was primarily due to a full year of expense related to opening three de novo branches in the second half of 2004 and two de novo branches in the fourth quarter of 2005. The increase in 2004 was due to our opening six de novo branches and assuming three facility leases through our acquisition of Kenesaw Leasing and J&S Leasing. As of December 31, 2006, we leased 13 facilities and the land for four branches. As a result, occupancy expense is higher than if we owned these facilities, including the real estate, but conversely, we have been able to deploy the capital into earning assets rather than capital expenditures for facilities.
45
Furniture and equipment expense and communication expense increased in 2006 due to a full year of Jackson Bank’s five branches. The increase in 2005 was due to de novo branch additions and the acquisition of Jackson Bank and the leasing companies. The increase in 2004 was due to the acquisition of the leasing companies and our de novo branching additions.
Professional fees increased by $563 thousand or 41.3% from 2005 to 2006. Professional fees include fees related to investor relations, outsourcing internal audit, loan review, compliance and information technology audits to Professional Bank Services, as well as external audit (including testing under Section 404 of the Sarbanes-Oxley Act of 2002), tax services and legal and accounting advice related to, among other things, potential acquisitions, investment securities, trademarks and intangible properties. The increase in 2006 primarily relates to additional investor relations expense and SOX Section 404 testing. The increase in 2005 primarily relates to legal fees, investor relation fees associated with being a NASDAQ listed company and external audit and tax services.
Data processing expense increased $138 thousand or 11.6% in 2006 as compared to 2005. The monthly fees associated with data processing are primarily based on transaction volume. The increase in 2006 is primarily related to certain credit administration software costs and the increase in transaction volume with the full year of Jackson Bank. The credit administration software (Baker Hill) provides risk analysis for retail loan applications. This program was implemented throughout all markets during 2007. We anticipate data processing expense to increase as we continue to grow.
Intangible asset amortization increased by $317 thousand or 34.1% in 2006 as compared to 2005 and $132 thousand or 16.6% in 2005 compared to 2004. The increase in 2006 is due to the full year of expense associated with the non-compete and core deposit intangible asset associated with the Jackson Bank acquisition. The increase in 2005 is a result of the Jackson Bank acquisition in August 2005. Amortizing intangible assets include core deposit intangible assets, a license fee agreement, and a non-compete agreement. The core deposit intangible assets amortize on an accelerated basis over an estimated useful life of 10 years. The license fee agreement relates to operating the Primer Banco Seguro branches within our market. The original life of 10 years was reduced to 5 years during 2005 when we recorded an impairment charge, which was recorded to other noninterest expense. The non-compete agreement is amortizing on a straight-line basis of the useful life of 4 years.
Each year, goodwill is evaluated for possible impairment. To date, no indications of impairment have been identified, thus no impairment expense has been recorded.
The following table represents our anticipated intangible asset amortization over the next five years, excluding new acquisitions, if any.
| | | | | | | | | | | | | | | |
| | | 2007 | | 2008 | | 2009 | | 2010 | | 2011 |
| | | (in thousands) |
Core deposit intangible amortization expense | | $ | 760 | | $ | 602 | | $ | 513 | | $ | 465 | | $ | 444 |
Covenant not to compete | | | 175 | | | 102 | | | — | | | — | | | — |
License fee agreement amortization expense | | | 50 | | | 50 | | | 42 | | | — | | | — |
| | | | | | | | | | | | | | | |
Total amortization expense | | $ | 985 | | $ | 754 | | $ | 555 | | $ | 465 | | $ | 444 |
| | | | | | | | | | | | | | | |
Other expense decreased $86 thousand or (0.2)% in 2006 as compared to 2005 and increased 53% in 2005 as compared to 2004. Other expense in 2005 includes $427 thousand in costs that are not considered to be in the normal course of business or recurring in nature. These costs were offset by increases in normal operating items as a function of our growth in 2006. The increase in 2005 is primarily a function of our increased branching activities combined with the acquisition of the leasing companies in October 2004 and Jackson Bank in August 2005.
46
Income Taxes
We recorded income tax expense of $5.3 million in 2006, compared with $3.6 million in 2005 and $1.4 million in 2004. Our effective tax rates for 2006, 2005 and 2004 were 32%, 33% and 28%, respectively. Barring legislative tax changes, we anticipate our effective tax rate to remain stable in 2007. As of December 31, 2006, our net deferred tax liability was $648 thousand and as of December 31, 2005, it was $960 thousand.
Statement of Financial Condition
We ended 2006 with consolidated assets of $1.1 billion, a 9% increase over the year-end 2005 level of $1.0 billion, which was a 36% increase over the year-end 2004 level of $766.7 million. Our loan and investment security growth is directly related to deposit growth and the funds available to us for investment. In 2006 our consolidated asset growth remained consistent with the organic growth of 2005, while our loan portfolio increased 13%. The growth is due to (1) our branching and deposit gathering activities and (2) utilizing our available alternative funding sources. In 2005 our consolidated assets increased due to (1) our branching and deposit gathering activities, (2) our acquisition of Jackson Bank, which had approximately $186.7 million in assets on the acquisition date and (3) our initial public offering. In 2004 our consolidated assets increased due to (1) our branching and deposit gathering activities and (2) our acquisition of Kenesaw Leasing and J&S Leasing, which we funded by issuing brokered CDs. In 2005 we opened two de novo bank branches and assumed five bank branches in our acquisition of Jackson Bank. In 2004 we opened six de novo bank branches and assumed four leasing offices through our acquisition of Kenesaw Leasing and J&S Leasing. In 2007 we expect our assets to continue growing because we plan to (1) further leverage our existing bank branches, (2) build two new de novo branches and one loan production office and (3) actively pursue additional acquisitions of existing banks and bank branches.
We continue to seek means to enhance our core deposit market share through acquisitions and further branching to the extent our capital will enable us to do so.
47
Loans
Our loan demand continues to be strong. Total loans increased 13% from year-end 2005 to year-end 2006 and increased 26% from year-end 2004 to year-end 2005. The increase in loans in 2006 is attributable to strong organic growth from the efforts of our branching and lending teams. The increase in loans in 2005 is attributable to (1) our acquisition of Jackson Bank which contributed approximately $104.3 million and (2) organic growth of $52.0 million, which resulted from our branching efforts along with the efforts of our lending team. The increase in loans in 2004 is attributable to (1) our acquisition of Kenesaw Leasing and J&S Leasing which added approximately $60.6 million and (2) organic growth of $53.7 million, which resulted from our branching efforts along with the efforts of our lending team. We believe that general loan growth will remain strong. Funding of future loan growth may be restricted by our ability to raise core deposits, although we will use alternative funding sources if necessary and cost effective. Loan growth may also be restricted by the necessity for us to maintain appropriate capital levels, as well as adequate liquidity. The following table presents a summary of the loan portfolio by category for the last five years.
Loans Outstanding
| | | | | | | | | | | | | | | | | | | | | | | | | | | | | | |
| | | As of December 31, | |
| | | 2006 | | Percent
Change | | | 2005 | | Percent
Change | | | 2004 | | Percent
Change | | | 2003 | | Percent
Change | | | 2002 | | Percent
Change | |
| | | (dollar amounts in thousands) | |
Commercial—leases, net of unearned | | $ | 52,039 | | (17.7 | )% | | $ | 63,205 | | 4.9 | % | | $ | 60,228 | | 100.0 | % | | $ | — | | — | | | $ | — | | — | |
Commercial—loans | | | 121,385 | | 11.4 | % | | | 108,974 | | 21.8 | % | | | 89,440 | | (12.2 | )% | | | 101,859 | | (3.0 | )% | | | 105,010 | | 8.6 | % |
Real estate— construction | | | 173,652 | | 48.0 | % | | | 117,352 | | 52.0 | % | | | 77,209 | | 88.1 | % | | | 41,039 | | 50.9 | % | | | 27,202 | | 44.6 | % |
Real estate—mortgage | | | 430,385 | | 10.0 | % | | | 391,126 | | 32.0 | % | | | 296,202 | | 14.7 | % | | | 258,163 | | 71.5 | % | | | 150,490 | | 29.6 | % |
Installment loans to individuals | | | 67,858 | | 4.9 | % | | | 64,694 | | (3.4 | )% | | | 66,940 | | (10.8 | )% | | | 75,013 | | 16.8 | % | | | 64,201 | | 8.4 | % |
Other | | | 2,274 | | (31.3 | )% | | | 3,308 | | 41.5 | % | | | 2,338 | | 20.6 | % | | | 1,939 | | 15.5 | % | | | 1,679 | | 1050.0 | % |
| | | | | | | | | | | | | | | | | | | | | | | | | | | | | | |
Total Loans | | $ | 847,593 | | 13.2 | % | | $ | 748,659 | | 26.4 | % | | $ | 592,357 | | 23.9 | % | | $ | 478,013 | | 37.1 | % | | $ | 348,582 | | 19.8 | % |
| | | | | | | | | | | | | | | | | | | | | | | | | | | | | | |
48
Substantially all of our loans are to customers located in Georgia and Tennessee, in our immediate markets. We believe that we are not dependent on any single customer or group of customers whose insolvency would have a material adverse effect on operations. We also believe that the loan portfolio is diversified among loan collateral types, as noted by the following table.
Loans by Collateral Type
| | | | | | | | | | | | | | | | | | | | | | | | | | | | | | |
| | | As of December 31, | |
| | | 2006 | | % of
Loans | | | 2005 | | % of
Loans | | | 2004 | | % of
Loans | | | 2003 | | % of
Loans | | | 2002 | | % of
Loans | |
| | | (dollar amounts in thousands) | |
Secured by real estate: | | | | | | | | | | | | | | | | | | | | | | | | | | | | | | |
Construction and land development | | $ | 173,652 | | 20.5 | % | | $ | 117,352 | | 15.7 | % | | $ | 77,209 | | 13.0 | % | | $ | 41,039 | | 8.6 | % | | $ | 27,202 | | 7.8 | % |
Farmland | | | 10,243 | | 1.2 | % | | | 12,799 | | 1.7 | % | | | 14,797 | | 2.5 | % | | | 2,659 | | 0.6 | % | | | 2,123 | | 0.6 | % |
Home equity lines of credit | | | 76,872 | | 9.1 | % | | | 78,387 | | 10.5 | % | | | 68,126 | | 11.5 | % | | | 50,682 | | 10.6 | % | | | 31,813 | | 9.1 | % |
Residential first liens | | | 159,172 | | 18.8 | % | | | 133,743 | | 17.8 | % | | | 72,530 | | 12.2 | % | | | 73,837 | | 15.4 | % | | | 53,879 | | 15.5 | % |
Residential junior liens | | | 9,961 | | 1.2 | % | | | 8,630 | | 1.2 | % | | | 4,009 | | 0.7 | % | | | 4,140 | | 0.9 | % | | | 2,582 | | 0.7 | % |
Multi-family residential | | | 10,301 | | 1.2 | % | | | 9,395 | | 1.2 | % | | | 9,301 | | 1.6 | % | | | 10,849 | | 2.3 | % | | | 6,948 | | 2.0 | % |
Non-farm and non-residential | | | 163,836 | | 19.3 | % | | | 148,172 | | 19.8 | % | | | 127,439 | | 21.5 | % | | | 115,996 | | 24.2 | % | | | 53,145 | | 15.3 | % |
| | | | | | | | | | | | | | | | | | | | | | | | | | | | | | |
Total Real-Estate | | | 604,037 | | 71.3 | % | | | 508,478 | | 67.9 | % | | | 373,411 | | 63.0 | % | | | 299,202 | | 62.6 | % | | | 177,692 | | 51.0 | % |
| | | | | | | | | | | | | | | | | | | | | | | | | | | | | | |
Other loans: | | | | | | | | | | | | | | | | | | | | | | | | | | | | | | |
Commercial—leases, net of unearned | | | 52,039 | | 6.1 | % | | | 63,205 | | 8.4 | % | | | 60,228 | | 10.2 | % | | | — | | — | | | | — | | — | |
Commercial and industrial | | | 121,385 | | 14.3 | % | | | 108,974 | | 14.6 | % | | | 89,440 | | 15.1 | % | | | 101,859 | | 21.3 | % | | | 105,010 | | 30.1 | % |
Agricultural production | | | 1,962 | | 0.2 | % | | | 2,401 | | 0.3 | % | | | 1,942 | | 0.3 | % | | | 1,728 | | 0.4 | % | | | 533 | | 0.2 | % |
Credit cards and other revolving credit | | | 1,513 | | 0.2 | % | | | 1,934 | | 0.3 | % | | | 1,718 | | 0.3 | % | | | 1,071 | | 0.2 | % | | | 717 | | 0.2 | % |
Consumer installment loans | | | 66,028 | | 7.8 | % | | | 62,760 | | 8.4 | % | | | 65,222 | | 11.0 | % | | | 73,942 | | 15.5 | % | | | 63,484 | | 18.2 | % |
Other | | | 629 | | 0.1 | % | | | 907 | | 0.1 | % | | | 396 | | 0.1 | % | | | 211 | | 0.0 | % | | | 1,146 | | 0.3 | % |
| | | | | | | | | | | | | | | | | | | | | | | | | | | | | | |
Total other loans | | | 243,556 | | 28.7 | % | | | 240,181 | | 32.1 | % | | | 218,946 | | 37.0 | % | | | 178,811 | | 37.4 | % | | | 170,890 | | 49.0 | % |
| | | | | | | | | | | | | | | | | | | | | | | | | | | | | | |
Total loans | | $ | 847,593 | | 100.0 | % | | $ | 748,659 | | 100.0 | % | | $ | 592,357 | | 100.0 | % | | $ | 478,013 | | 100.0 | % | | $ | 348,582 | | 100.0 | % |
| | | | | | | | | | | | | | | | | | | | | | | | | | | | | | |
The following table sets forth the maturity distribution of the loan portfolio as of December 31, 2006. Our loan policy does not permit automatic roll-over of matured loans.
Loans by Maturity
| | | | | | | | | | | | | | | |
| | | As of December 31, 2006 |
| | | Less than
three months | | Over three
months to
twelve months | | One year
to
five years | | Over five
years | | Total |
| | | (dollar amounts in thousands) |
Closed end 1-4 family residential | | $ | 33,711 | | $ | 20,574 | | $ | 94,087 | | $ | 10,800 | | $ | 159,172 |
All other loans | | | 397,181 | | | 55,304 | | | 228,671 | | | 7,265 | | | 688,421 |
| | | | | | | | | | | | | | | |
Total | | $ | 430,892 | | $ | 75,878 | | $ | 322,758 | | $ | 18,065 | | $ | 847,593 |
| | | | | | | | | | | | | | | |
49
Asset Quality
We consider our asset quality to be of primary importance. At year-end 2006 our loan portfolio was 75% of total assets. Over the past few years, we have improved our commercial and retail underwriting standards, developed a detailed loan policy, established better warning and early detection procedures, additional credit-related management and director reporting and developed a more comprehensive analysis of our allowance for loan losses. During 2006, we completed comprehensive retail loan underwriting training in conjunction with the implementation of our credit administration software platform. Our loan review process targets 60% to 70% of our portfolio for review over an eighteen month cycle. More frequent loan reviews may be completed as needed or as directed by the Audit/Corporate Governance Committee of the Board of Directors.
The allowance for loan losses represents management’s estimate of an amount adequate in relation to the risk of losses inherent in the loan portfolio. We analyze the loan portfolio regularly to identify potential problems. We undertake this analysis in conjunction with the establishment of our allowance for loan losses to provide a basis for determining the adequacy of our loan loss reserves to absorb losses that we estimate might be experienced. Furthermore, our policy requires regularly scheduled problem-asset meetings in which past due and classified loans are thoroughly analyzed. These analyses are thoroughly reviewed by our credit administration group. In addition to these analyses of existing loans, management considers our loan growth, historical loan losses, past due and non-performing loans, current economic conditions, underlying loan collateral values and other factors which may affect possible loan losses.
Our asset quality ratio of charge-offs to average loans improved in 2006 as compared to 2005. In 2006, loan charge-offs decreased to $2.2 million or 28 basis points of average loans compared to $2.4 million or 36 basis points in 2005. The 2006 level was 15 basis points more than FSGBank’s peer group average of 13 basis points as reported in the Uniform Bank Performance Report as of December 31, 2006. Of the loans charged-off in 2006, approximately $897 thousand in charge-offs resulted from the borrower filing bankruptcy. In 2005, as a result of the acquisition of Jackson Bank, we assumed their allowance for loan losses of $1.3 million, which related to loans that were not subject to the provisions of SOP 03-3. We believe that charge-offs, as a percent of average loans, will decrease in 2007 (barring continued increases in bankruptcies) as a result of our continuing efforts to improve our loan underwriting, approval process, servicing, problem identification and problem resolution.
Our allowance for loan losses as a percentage of total loans was 1.18% and non-performing assets as a percentage of total assets were 61 basis points. The largest components of non-performing assets in 2006 and 2005 were non-accrual loans and repossessed assets. The increase in non-accrual loans is attributable to five relationships, totaling $2.1 million, which were reclassified as non-accrual during the fourth quarter. These relationships are secured by real estate and we do not anticipate any significant losses. The increase in repossessed assets relates to our leasing companies, primarily Kenesaw Leasing. We are actively marketing repossessions in order to maximize their value and minimize their carrying cost. Loans 90 days past due increased from 2005 to 2006. The past due loans are reasonably collateralized, and in most cases, have guarantees. During the fourth quarter of 2006, we created a centralized collection department. This department will aggressively collect the past due loans and manage the marketing of the repossessions and other real estate owned.
50
The following table presents a summary of changes in the allowance for loan losses for the past five years.
Analysis of the Allowance for Loan Losses
| | | | | | | | | | | | | | | | | | | | |
| | | For the Years Ended December 31, | |
| | | 2006 | | | 2005 | | | 2004 | | | 2003 | | | 2002 | |
| | | (dollar amounts in thousands) | |
Allowance for loan losses— | | | | | | | | | | | | | | | | | | | | |
Beginning of period | | $ | 10,121 | | | $ | 8,312 | | | $ | 5,827 | | | $ | 5,362 | | | $ | 3,825 | |
Provision for loan losses | | | 2,064 | | | | 2,922 | | | | 3,399 | | | | 2,122 | | | | 1,948 | |
Additions due to business combinations | | | — | | | | 1,261 | | | | 2,011 | | | | 1,011 | | | | 377 | |
| | | | | | | | | | | | | | | | | | | | |
Sub-total | | | 12,185 | | | | 12,495 | | | | 11,237 | | | | 8,495 | | | | 6,150 | |
| | | | | | | | | | | | | | | | | | | | |
Charged off loans: | | | | | | | | | | | | | | | | | | | | |
Commercial—leases | | | 455 | | | | 900 | | | | — | | | | — | | | | — | |
Commercial—loans | | | 943 | | | | 768 | | | | 1,698 | | | | 2,188 | | | | 414 | |
Real estate—construction | | | 24 | | | | 55 | | | | 45 | | | | — | | | | — | |
Real estate—residential mortgage | | | 751 | | | | 164 | | | | 328 | | | | 11 | | | | 22 | |
Consumer and other | | | 548 | | | | 991 | | | | 1,356 | | | | 1,001 | | | | 432 | |
| | | | | | | | | | | | | | | | | | | | |
Total charged off | | | 2,721 | | | | 2,878 | | | | 3,427 | | | | 3,200 | | | | 868 | |
| | | | | | | | | | | | | | | | | | | | |
Recoveries of charged-off loans: | | | | | | | | | | | | | | | | | | | | |
Commercial—leases | | | 5 | | | | 43 | | | | 26 | | | | — | | | | — | |
Commercial—loans | | | 83 | | | | 143 | | | | 385 | | | | 387 | | | | 54 | |
Real estate—construction | | | — | | | | 12 | | | | — | | | | — | | | | — | |
Real estate—residential mortgage | | | 47 | | | | 88 | | | | — | | | | — | | | | — | |
Consumer and other | | | 371 | | | | 218 | | | | 91 | | | | 145 | | | | 26 | |
| | | | | | | | | | | | | | | | | | | | |
Total recoveries | | | 506 | | | | 504 | | | | 502 | | | | 532 | | | | 80 | |
| | | | | | | | | | | | | | | | | | | | |
Net charged-off loans | | | 2,215 | | | | 2,374 | | | | 2,925 | | | | 2,668 | | | | 788 | |
| | | | | | | | | | | | | | | | | | | | |
Allowance for loan losses—end of period | | $ | 9,970 | | | $ | 10,121 | | | $ | 8,312 | | | $ | 5,827 | | | $ | 5,362 | |
| | | | | | | | | | | | | | | | | | | | |
Total loans—end of period | | $ | 847,593 | | | $ | 748,659 | | | $ | 592,357 | | | $ | 478,013 | | | $ | 348,582 | |
Average loans | | $ | 796,866 | | | $ | 657,928 | | | $ | 514,479 | | | $ | 422,332 | | | $ | 311,774 | |
| | | | | |
As a percentage of average loans: | | | | | | | | | | | | | | | | | | | | |
Net loans charged-off | | | 0.28 | % | | | 0.36 | % | | | 0.57 | % | | | 0.63 | % | | | 0.25 | % |
Provision for loan losses | | | 0.26 | % | | | 0.44 | % | | | 0.66 | % | | | 0.50 | % | | | 0.62 | % |
Allowance for loan losses as a percentage of: | | | | | | | | | | | | | | | | | | | | |
Year-end loans | | | 1.18 | % | | | 1.35 | % | | | 1.40 | % | | | 1.22 | % | | | 1.54 | % |
Non-performing assets | | | 145.21 | % | | | 212.76 | % | | | 143.43 | % | | | 675.99 | % | | | 585.37 | % |
51
The following table presents the allocation of the allowance for loan losses for each respective loan category with the corresponding percent of loans in each category to total loans. The comprehensive allowance analysis developed by our credit administration group enables us to allocate the allowance based on risk elements within the portfolio. The unallocated reserve is available as a general reserve against the entire loan portfolio and is related to factors such as current economic conditions which are not directly associated with a specific loan category (See Provision for Loan Losses).
Allocation of the Allowance for Loan Losses
| | | | | | | | | | | | | | | | | | | | | | | | | | | | | | |
| | | As of December 31, | |
| | | 2006 | | | 2005 | | | 2004 | | | 2003 | | | 2002 | |
| | | Amount | | Percent of
loans in each
category to
total loans | | | Amount | | Percent of
loans in each
category to
total loans | | | Amount | | Percent of
loans in each
category to
total loans | | | Amount | | Percent of
loans in each
category to
total loans | | | Amount | | Percent of
loans in each
category to
total loans | |
| | | (dollar amounts in thousands) | |
Commercial—leases | | $ | 1,639 | | 6.1 | % | | $ | 1,505 | | 8.4 | % | | $ | 1,202 | | 10.2 | % | | $ | — | | — | | | $ | — | | — | |
Commercial—loans | | | 2,375 | | 14.3 | % | | | 2,525 | | 14.8 | % | | | 2,244 | | 20.0 | % | | | 2,379 | | 24.6 | % | | | 2,446 | | 31.2 | % |
Real estate—
construction | | | 1,613 | | 20.5 | % | | | 665 | | 17.1 | % | | | 700 | | 13.1 | % | | | 262 | | 8.9 | % | | | 271 | | 8.2 | % |
Real estate—mortgage | | | 3,439 | | 50.8 | % | | | 4,396 | | 50.8 | % | | | 3,432 | | 44.7 | % | | | 2,187 | | 50.6 | % | | | 1,650 | | 41.7 | % |
Consumer | | | 841 | | 8.3 | % | | | 864 | | 8.6 | % | | | 728 | | 12.0 | % | | | 712 | | 15.9 | % | | | 672 | | 18.9 | % |
Unallocated and charter condition | | | 63 | | — | | | | 166 | | — | | | | 6 | | — | | | | 287 | | — | | | | 323 | | — | |
| | | | | | | | | | | | | | | | | | | | | | | | | | | | | | |
Total | | $ | 9,970 | | 100 | % | | $ | 10,121 | | 100 | % | | $ | 8,312 | | 100.0 | % | | $ | 5,827 | | 100.0 | % | | $ | 5,362 | | 100.0 | % |
| | | | | | | | | | | | | | | | | | | | | | | | | | | | | | |
We believe that the allowance for loan losses at December 31, 2006 is sufficient to absorb losses inherent in the loan portfolio based on our assessment of the information available. Our assessment involves uncertainty and judgment; therefore, the adequacy of the allowance for loan losses cannot be determined with precision and may be subject to change in future periods. In addition, bank regulatory authorities, as part of their periodic examinations, may require additional charges to the provision for loan losses in future periods if the results of their reviews warrant.
Nonperforming Assets
Nonperforming assets include nonaccrual loans, restructured loans, other real estate under contract for sale and repossessed assets. We place loans on non-accrual status when we have concerns relating to our ability to collect the loan principal and interest, and generally when such loans are 90 days or more past due. Nonaccrual loans totaled $2.7 million, $1.3 million and $985 thousand as of December 31, 2006, 2005 and 2004, respectively. We earned interest of $198 thousand, $79 thousand and $65 thousand on these loans during 2006, 2005 and 2004, respectively. If these loans had been performing, we would have earned an additional $36 thousand, $20 thousand and $16 thousand in 2006, 2005 and 2004, respectively. We are not aware of any loans which represent material credits about which we are aware of any information which causes us to have serious doubts as to the ability of such borrowers to comply with their loan repayment terms. No amount of loans that have been classified by regulatory examiners as loss, substandard, doubtful, or special mention has been excluded from amounts disclosed as nonperforming loans. Nonperforming assets represent potential losses to us; however, in compliance with Statement of Financial Accounting Standards No. 114,Accounting by Creditors for Impairment of a Loan, we have measured the impairment of these loans and adjusted them to either the present value of expected future cash flows, the fair value of the collateral, or the observable market price.
Loans 90 days or more past due totaled $1.3 million and consisted of $962 thousand in leases, $185 thousand in residential 1—4 family mortgage loans, $102 thousand in non-farm/nonresidential loans, $62 thousand in consumer loans and $14 thousand in commercial and industrial loans,
52
The $2.0 million in other real estate owned consisted of $805 thousand in vacant land and construction, $394 thousand in residential real estate and $783 thousand in nonfarm/nonresidential property. All of these properties have been written down to their respective fair values.
At December 31, 2006, we owned repossessed assets in the amount of $2.2 million, compared to $1.9 million at December 31, 2005 and compared to $2.5 million at December 31, 2004. The increase in repossessed assets from years prior to 2004 is due to the acquisition of Kenesaw Leasing and J&S Leasing in October 2004. After engaging a consultant to evaluate the carrying values of our repossessions, we incurred a $454 thousand fair value write-down in the fourth quarter of 2005. Subsequent to the write-down, we implemented new leasing policies addressing repossessions. We evaluate the fair market value at the date of repossession and on an ongoing basis. Write-downs on repossessions held longer than 90 days totaled $340 thousand in 2006. We believe the value of repossessions at December 31, 2006 is representative of the lower of cost or market, and we do not see any significant losses.
There are no commitments to lend additional funds to customers with loans on nonaccrual status at December 31, 2006. The table below summarizes our nonperforming assets for the last five years.
Nonperforming Assets
| | | | | | | | | | | | | | | | | | | | |
| | | As of December 31, | |
| | | 2006 | | | 2005 | | | 2004 | | | 2003 | | | 2002 | |
| | | (dollar amounts in thousands) | |
Nonaccrual loans | | $ | 2,653 | | | $ | 1,314 | | | $ | 985 | | | $ | 183 | | | $ | 667 | |
Loans past due 90 days and still accruing | | | 1,325 | | | | 1,042 | | | | 1,230 | | | | 2,194 | | | | 89 | |
| | | | | | | | | | | | | | | | | | | | |
Total nonperforming loans | | | 3,978 | | | | 2,356 | | | | 2,215 | | | | 2,377 | | | | 756 | |
| | | | | | | | | | | | | | | | | | | | |
Other real estate owned | | | 1,982 | | | | 1,552 | | | | 2,338 | | | | 536 | | | | — | |
Repossessed assets | | | 2,231 | | | | 1,891 | | | | 2,472 | | | | 143 | | | | 249 | |
Nonaccrual loans | | | 2,653 | | | | 1,314 | | | | 985 | | | | 183 | | | | 667 | |
| | | | | | | | | | | | | | | | | | | | |
Total nonperforming assets | | $ | 6,866 | | | $ | 4,757 | | | $ | 5,795 | | | $ | 862 | | | $ | 916 | |
| | | | | | | | | | | | | | | | | | | | |
Nonperforming loans as a percentage of total loans | | | 0.47 | % | | | 0.31 | % | | | 0.37 | % | | | 0.50 | % | | | 0.22 | % |
Nonperforming assets as a percentage of total assets | | | 0.61 | % | | | 0.46 | % | | | 0.76 | % | | | 0.13 | % | | | 0.19 | % |
Nonperforming assets + loans 90 days past due to total assets | | | 0.72 | % | | | 0.56 | % | | | 0.92 | % | | | 0.47 | % | | | 0.21 | % |
While nonperforming assets have increased over prior years primarily due to our acquisition of the leasing companies, our nonperforming asset ratios generally remain below our peer group. The ratio of nonaccrual loans and loans 90 days past due to gross loans was 0.47% and 0.59% for us and our peer group, respectively. The ratio of nonaccrual loans and loans 90 days past due to the allowance for loan losses was 39.90% and 49.28% for us and our peer group, respectively. The ratio of nonaccrual loans and loans 90 days past due to equity capital was 2.75% and 4.08% for FSGBank and our peer group, respectively. The ratio of nonaccrual loans, loans 90 days past due, and other real estate owned to gross loans and other real estate owned was 0.70% and 0.67% for us and our peer group, respectively.
Investment Securities and Other Earning Assets
The composition of our securities portfolio reflects our investment strategy of maintaining an appropriate level of liquidity while providing a relatively stable source of income. Our securities portfolio also provides a balance to interest rate risk and credit risk in other categories of the balance sheet while providing a vehicle for investing available funds, furnishing liquidity, and supplying securities to pledge as required collateral for certain deposits and borrowed funds. We use two categories to classify our securities: “held-to-maturity” or “available-for-sale.” Currently, none of our investments are classified as held to maturity. While we have no
53
plans to liquidate a significant amount of any securities, the securities classified as available-for-sale may be used for liquidity purposes should management deem it to be in our best interest.
Securities in our portfolio totaled $153.8 million at December 31, 2006, compared to $156.0 million at December 31, 2005. The securities portfolio is consistent as compared to 2005 in our efforts to maintain a certain level of liquid assets in correlation to our overall asset growth. During the fourth quarter, we sold approximately $9.8 million in securities with an average yield of 3.65% to reduce our FHLB borrowing and eliminate negative interest spread. At December 31, 2006 the securities portfolio had unrealized net losses, net of tax, of approximately $871 thousand as compared to $1.6 million at December 31, 2005. All investment securities purchased to date have been classified as available-for-sale. Our securities portfolio at December 31, 2006 consisted of tax-exempt municipal securities, taxable municipal securities, federal agency bonds, federal agency issued Real Estate Mortgage Investment Conduits (REMICs), federal agency issued pools and asset-backed securities and collateralized mortgage obligations (CMOs).
The following table provides the amortized cost of our securities, as of December 31, 2006, by their stated maturities (this maturity schedule excludes security prepayment and call features), as well as the tax equivalent yields for each maturity range.
Maturity of Investment Securities—Amortized Cost
| | | | | | | | | | | | | | | | |
Investment Security Type | | Less than
one year | | | One year to
five years | | | Five years to
ten years | | | More than
ten years | |
| | | (dollar amounts in thousands) | |
Municipal—tax exempt | | $ | 1,292 | | | $ | 6,881 | | | $ | 23,337 | | | $ | 13,605 | |
Municipal—taxable | | | — | | | | — | | | | — | | | | — | |
Agency bonds | | | 4,495 | | | | 25,069 | | | | 3,983 | | | | — | |
Agency issued remics | | | — | | | | 35,656 | | | | 1,972 | | | | — | |
Agency issued pools | | | 153 | | | | 26,388 | | | | 4,622 | | | | 20 | |
Asset backed & CMO | | | — | | | | 6,905 | | | | — | | | | — | |
Other | | | — | | | | — | | | | — | | | | 702 | |
| | | | | | | | | | | | | | | | |
Total | | $ | 5,940 | | | $ | 100,899 | | | $ | 33,914 | | | $ | 14,327 | |
| | | | | | | | | | | | | | | | |
Tax equivalent yield | | | 4.61 | % | | | 4.72 | % | | | 5.46 | % | | | 6.19 | % |
The following table details our investment portfolio by type of investment.
Investment Securities by Type—Amortized Cost
| | | | | | | | | |
| | | As of December 31, |
| | | 2006 | | 2005 | | 2004 |
| | | (in thousands) |
Securities Available-for-Sale | | | | | | | | | |
Debt Securities— | | | | | | | | | |
Federal Agencies | | $ | 33,547 | | $ | 35,304 | | $ | 30,536 |
Mortgage-Backed | | | 75,716 | | | 80,267 | | | 52,215 |
Municipals | | | 45,115 | | | 41,814 | | | 27,100 |
Other | | | 702 | | | 1,000 | | | — |
| | | | | | | | | |
| | $ | 155,080 | | $ | 158,385 | | $ | 109,851 |
| | | | | | | | | |
We currently have the ability and intent to hold our available-for-sale investment securities to maturity. However, should conditions change, we may sell unpledged securities. Our management considers the overall
54
quality of the securities portfolio to be high. All securities held are traded in liquid markets, except for one bond. The bond is a $250 thousand investment is a Qualified Zone Academy Bond (within the meaning of Section 1379E of the Internal Revenue Code of 1986, as amended) issued by The Health, Educational and Housing Facility Board of the County of Knox under the authority from the State of Tennessee. As of December 31, 2006, we owned securities from issuers in which the aggregate book value from such issuers exceeded 10% of our stockholders equity. As of year-end 2006, the book value and market value of the securities from each such issuer are as follows:
| | | | | | |
| | | Book Value | | Market Value |
| | | (in thousands) |
Fannie Mae | | $ | 36,195 | | $ | 35,483 |
Federal Home Loan Mortgage Corporation | | $ | 70,183 | | $ | 68,956 |
At December 31, 2006, we had federal funds sold of $1.6 million, compared to $17.8 million at December 31, 2005. The decrease in federal funds sold as compared to 2005 is primarily due to our loan growth exceeding our core deposit growth. As a result, we utilized the liquidity to assist in funding the loan growth.
As of December 31, 2006, we held $100 thousand in certificates of deposit at other FDIC insured financial institutions.
Deposits and Other Borrowings
Deposits increased by $60.5 million, or 7%, from year-end 2005 to year-end 2006 due to (1) our management team drawing customers away from other financial institutions and (2) our branching efforts. Excluding the impact of brokered CD issuance and acquisitions, our organic growth rate of deposits was 8%. The fastest growing sectors of our core deposit base are retail CDs and non-interest bearing demand deposits, which both grew organically 10% year over year. We define core deposits to include interest bearing and non-interest bearing demand deposits, savings and money market accounts, as well as retail certificates of deposit with denominations less than $100,000. We consider out retail CDs to be a stable source of funding because they are in-market, relationship oriented deposits. Core deposit growth is an important tenant to our business strategy. We believe that by improving our branching network, we will provide more convenient opportunities for customers to bank with us, and thus improve our core deposit funding. For this reason, in 2007 we plan to open two new de novo branches.As a result of these future branches and the branches we opened in the past few years, we anticipate that our deposits will continue to increase in 2007. The table below is a maturity schedule for our certificates of deposit, including brokered CDs, in amounts of $100 thousand or more as of December 31, 2006.
| | | | | | | | | | | | |
| | | Less than
3 months | | Three months
to six months | | Six months
to twelve months | | Greater than
twelve months |
| | | (in thousands) |
Certificates of deposit of $100 thousand or more | | $ | 70,380 | | $ | 67,276 | | $ | 99,804 | | $ | 54,860 |
55
As a member of the Federal Home Loan Bank of Cincinnati (FHLB), we have the ability to acquire short and long-term advances through a blanket agreement secured by the Company’s unencumbered qualifying 1-4 family first mortgage loans and qualifying commercial real estate loans equal to at least 135% and 300%, respectively, of outstanding advances. During 2006, we began utilizing the overnight advances to replace existing higher rate advances from the Federal Reserve Bank. The following table details the maturities and rates of our term borrowings from the Federal Home Loan Bank of Cincinnati as of December 31, 2006.
| | | | | | | | | | | | |
Date | | Type | | Principal | | Term | | Rate | | | Maturity |
12/29/2006 | | Fixed rate advance | | $ | 16,700,000 | | Overnight | | 5.18 | % | | 1/2/07 |
12/4/2003* | | Fixed rate advance | | | 2,666,000 | | 48 months | | 3.17 | % | | 1/24/07 |
12/6/2004* | | Fixed rate advance | | | 2,667,000 | | 48 months | | 3.34 | % | | 1/25/08 |
12/6/2005* | | Fixed rate advance | | | 2,667,000 | | 48 months | | 4.11 | % | | 1/26/09 |
6/18/1996* | | Fixed rate advance | | | 1,881 | | 180 months | | 7.70 | % | | 7/1/11 |
9/16/1996* | | Fixed rate advance | | | 3,523 | | 180 months | | 7.50 | % | | 10/1/11 |
9/9/1997* | | Fixed rate advance | | | 4,325 | | 180 months | | 7.05 | % | | 10/1/12 |
| | | | | | | | | | | | |
| | | | $ | 24,709,729 | | | | | | | |
| | | | | | | | | | | | |
| | | |
Aggregate composite rate | | 4.65 | % |
Overnight rate | | 5.18 | % |
48 month composite rate | | 3.54 | % |
180 month composite rate | | 7.34 | % |
| * | Assumed as part of the acquisition of Jackson Bank. |
Interest Rate Sensitivity
Financial institutions are subject to interest rate risk to the degree that their interest-bearing liabilities (consisting principally of customer deposits) mature or reprice more or less frequently, or on a different basis, than their interest earning assets (generally consisting of intermediate or long-term loans, investment securities and fed funds sold). The match between the scheduled repricing and maturities of our earning assets and liabilities within defined time periods is referred to as “gap” analysis. At December 31, 2006, our cumulative one-year gap was a negative (or liability sensitive) $21.3 million, or 2.1% of total earning assets. This means our interest bearing liabilities are expected to reprice slightly faster than our interest earning assets under given market interest rate changes. The change from a positive (or asset sensitive) $75.5 million in 2005 is primarily due to our pricing on retail and jumbo CDs. The competitive environment of CDs during 2006 increased rates faster than loan yields. We priced rates competitively during 2006 while holding maturities to less than one year as we are anticipating a decrease in rates as these CDs reprice during 2007.
The following “gap” analysis provides information based on maturities. The “Interest Rate Risk Income Sensitivity Summary” table, located in Item 7.A. incorporates additional assumptions, including prepayments on loans and securities and reinvestments of paydowns and maturities of loans, investments, and deposits. Incorporating the additional assumptions, we remain asset sensitive. We believe the Income Sensitivity Summary table located in Item 7.A. provides a more accurate analysis related to interest rate risk.
Intense competition in our markets continues to pressure quality loan rates downward, while conversely pressuring deposit rates upward. The following table reflects our rate sensitive assets and liabilities by maturity as of December 31, 2006. Variable rate loans are shown in the category of due “one to three months” because they reprice with changes in the prime lending rate. Fixed rate loans are presented assuming the entire loan matures on the final due date, although payments are actually made at regular intervals and are not reflected in this schedule. Additionally, demand deposits and savings accounts have no stated maturity; however, it has been our experience that these accounts are not totally rate sensitive, and accordingly the following analysis assumes
56
11% of interest bearing demand deposit accounts, 25% of money market deposit accounts, and 20% of savings accounts reprice within one year and the remaining accounts reprice within one to five years.
Interest Rate Gap Sensitivity
| | | | | | | | | | | | | | | | | |
| | | As of December 31, 2006 |
| | | Within
Three
Months | | After
Three
Months
but Within
One Year | | | After One
but Within
Five Years | | After Five
Years and
Non-rate
Sensitive | | | Total |
| | | (in thousands) |
Interest earning assets: | | | | | | | | | | | | | | | | | |
Interest bearing deposits | | $ | 381 | | $ | 100 | | | $ | — | | $ | — | | | $ | 481 |
Federal funds sold | | | 1,600 | | | — | | | | — | | | — | | | | 1,600 |
Securities | | | 545 | | | 5,359 | | | | 99,668 | | | 48,187 | | | | 153,759 |
Mortgage loans held for sale | | | 7,524 | | | — | | | | — | | | — | | | | 7,524 |
Loans | | | 423,368 | | | 75,878 | | | | 322,758 | | | 18,065 | | | | 840,069 |
| | | | | | | | | | | | | | | | | |
Total interest earning assets | | | 433,418 | | | 81,337 | | | | 422,426 | | | 66,252 | | | | 1,003,433 |
| | | | | | | | | | | | | | | | | |
Interest bearing liabilities: | | | | | | | | | | | | | | | | | |
Demand deposits | | | 3,673 | | | 3,673 | | | | 59,441 | | | — | | | | 66,787 |
MMDA deposits | | | 12,451 | | | 12,451 | | | | 74,709 | | | — | | | | 99,611 |
Savings deposits | | | 3,617 | | | 3,617 | | | | 28,939 | | | — | | | | 36,173 |
Time deposits | | | 141,264 | | | 312,387 | | | | 97,125 | | | — | | | | 550,776 |
Fed funds purchased/repos | | | 20,851 | | | — | | | | — | | | — | | | | 20,851 |
Other borrowings | | | 19,366 | | | 2,667 | | | | 2,667 | | | 138 | | | | 24,838 |
| | | | | | | | | | | | | | | | | |
Total interest bearing liabilities | | | 201,222 | | | 334,795 | | | | 262,881 | | | 138 | | | | 799,036 |
Noninterest bearing sources of funds | | | — | | | — | | | | — | | | 204,397 | | | | 204,397 |
| | | | | | | | | | | | | | | | | |
Interest sensitivity gap | | $ | 232,196 | | $ | (253,458 | ) | | $ | 159,545 | | $ | (138,283 | ) | | $ | — |
| | | | | | | | | | | | | | | | | |
Cumulative sensitivity gap | | $ | 232,196 | | $ | (21,262 | ) | | $ | 138,283 | | $ | — | | | $ | — |
| | | | | | | | | | | | | | | | | |
Liquidity
Liquidity refers to our ability to adjust our future cash flows to meet the needs of our daily operations. We rely primarily on management service fees and dividends from FSGBank to fund our daily operations’ liquidity needs. Our cash balance on deposit with FSGBank, which totaled approximately $1.9 million as of December 31, 2006, is available for funding activities for which FSGBank would not receive direct benefit, such as acquisition due diligence, shareholder relations, including dividends, and holding company reporting and operations. These funds should adequately meet our cash flow needs. If we determine that our cash flow needs will be satisfactorily met, we may deploy a portion of the funds into FSGBank or use them in an acquisition in order to support continued growth.
The liquidity of FSGBank refers to the ability or financial flexibility to adjust its future cash flows to meet the needs of depositors and borrowers and to fund operations on a timely and cost effective basis. The primary sources of funds for FSGBank are cash generated by repayments of outstanding loans, interest payments on loans, and new deposits. Additional liquidity is available from the maturity and earnings on securities and liquid assets, as well as the ability to liquidate securities available for sale.
At December 31, 2006, our consolidated liquidity ratio (defined as cash, due from banks, federal funds sold, and investment securities less securities pledged to liabilities divided by short-term funding liabilities less liabilities pledged by securities) was 18% (excluding anticipated loan repayments). Three, six, nine and twelve months earlier on September 30th, June 30th, March 31st and December 31st, our liquidity ratios were 19%, 21%,
57
22% and 22%, respectively. As a member of the FHLB, FSGBank has attained short and long-term borrowing capability secured by a blanket lien on its 1-4 family residential mortgage loan portfolio, as well as the commercial real estate loan portfolio. As of December 31, 2006, the outstanding overnight and term borrowings were $16.7 million and $8.0 million, respectively. FSGBank also used its borrowing capacity at FHLB to purchase a letter of credit that we pledged to the State of Tennessee Bank Collateral Pool. The letter of credit allows us to release investment securities from the Collateral Pool and thus improve our liquidity ratio. Additionally, FSGBank could increase its borrowing capacity at FHLB, subject to more stringent collateral requirements, by pledging loans other than 1-4 family residential mortgage and commercial real estate loans. As of December 31, 2006, our unused borrowing capacity (using 1-4 family residential mortgage and commercial real estate loans) at FHLB was $64.2 million. FHLB maintains standards for loan collateral files. Therefore, our borrowing capacity may be restricted if our collateral file has exceptions, such as expired property insurance.
FSGBank also had unsecured federal funds lines in the aggregate amount of $99.5 million at December 31, 2006 under which it can borrow funds to meet short-term liquidity needs. The federal funds lines were unused at year-end. Another source of funding is loan participations sold to other commercial banks (in which we retain the service rights). As of year-end, we had $7.9 million in loan participations sold. FSGBank may continue to sell loan participations as a source of liquidity. We may also pledge investment securities against a line of credit at a commercial bank as an additional source of short-term funding. As of year-end, we had no borrowings against our investment securities, except for repurchase agreements and public fund deposits attained in the ordinary course of business.
We utilize brokered CDs to primarily match fund our leasing portfolio. As of December 31, 2006, we had $86.9 million in brokered CDs outstanding with a weighted average remaining life of approximately 11 months, a weighted average coupon rate of 4.50% and a weighted average all-in cost (which includes fees paid to deposit brokers) of 4.75%. Our certificates of deposit greater than $100 thousand were generated in our communities and are considered relatively stable. Management believes that our liquidity sources are adequate to meet its operating needs.
First Security also has contractual cash obligations and commitments, which included certificates of deposit, other borrowings, operating leases and loan commitments. Unfunded loan commitments totaled $270.7 million at year-end. The following table illustrates our significant contractual obligations at December 31, 2006 by future payment period.
Contractual Obligations
| | | | | | | | | | | | | | | | | | |
| | | | | | Total | | Less than
One Year | | One to Three Years | | Three to Five Years | | More than
Five Years |
| | | | | | (in thousands) |
Certificates of deposit | | (1 | ) | | $ | 550,776 | | $ | 453,651 | | $ | 85,224 | | $ | 11,901 | | $ | — |
Federal funds purchased and securities sold under agreements to repurchase | | (2 | ) | | | 20,851 | | | 20,851 | | | — | | | — | | | — |
FHLB borrowings | | | | | | 24,709 | | | 19,366 | | | 5,334 | | | 9 | | | — |
Operating lease obligations | | (3 | ) | | | 6,154 | | | 1,015 | | | 1,915 | | | 1,416 | | | 1,808 |
Note payable | | (4 | ) | | | 129 | | | 9 | | | 30 | | | 32 | | | 58 |
| | | | | | | | | | | | | | | | | | |
Total | | | | | $ | 602,619 | | $ | 494,892 | | $ | 92,503 | | $ | 13,358 | | $ | 1,866 |
| | | | | | | | | | | | | | | | | | |
| 1 | Certificates of deposit give customers rights to early withdrawal. Early withdrawals may be subject to penalties. The penalty amount depends on the remaining time to maturity at the time of early withdrawal. |
| 2 | We expect securities repurchase agreements to be re-issued and, as such, do not necessarily represent an immediate need for cash. |
58
| 3 | Operating lease obligations include existing and future property and equipment non-cancelable lease commitments. |
| 4 | This note payable is a mortgage on the land of our branch facility located at 2905 Maynardville Highway, Maynardville, Tennessee. |
Net cash provided by operations in 2006 total $21.6 million compared to net cash provided by operations of $16.8 million and $13.8 million for 2005 and 2004, respectively. The change can be attributed to an increase in earnings combined with an increase in liabilities from 2004 to 2006. Net cash used in investing activities increased to $108.1 million in 2006 as compared to $104.3 million and $98.2 million in 2005 and 2004, respectively. The increase in 2006 can be attributed to the increase in the loan portfolio. The increase in 2005 is attributable to the increase in the loan portfolio, the purchase of bank-owned life insurance and the acquisition of Jackson Bank. These increases were offset by proceeds from sales of other real estate and repossessions for both 2006 and 2005. Net cash provided by financing activities was $72.8 million in 2006 compared to $113.4 million and $67.7 million in 2005 and 2004, respectively. The proceeds from our initial public offering of $44.7 million in 2005 are the main cause of the fluctuations between the years. Our primary financing method continues to be increasing our deposits, which is a result of our sales and branching activities. An increase in advances on other borrowing provided additional financing to support our loan growth. These increases in financing activities were partially offset by the repurchase of common stock for the ESOP and cash dividends paid.
Capital Resources
Banks and bank holding companies, as regulated institutions, must meet required levels of capital. The OCC and the Federal Reserve Board, the primary federal regulators for FSGBank and First Security, respectively, have adopted minimum capital regulations or guidelines that categorize components and the level of risk associated with various types of assets. Financial institutions are expected to maintain a level of capital commensurate with the risk profile assigned to their assets in accordance with the guidelines. First Security and FSGBank both maintain capital levels exceeding the minimum capital levels required in addition to exceeding those capital requirements for well capitalized banks and holding companies under applicable regulatory guidelines.
The following table compares the required capital ratios maintained by First Security and FSGBank.
| | | | | | | | | | | | |
December 31, 2006 | | Well
Capitalized | | | Adequately
Capitalized | | | First
Security | | | FSGBank | |
Tier 1 capital to risk adjusted assets | | 6.0 | % | | 4.0 | % | | 12.0 | % | | 11.1 | % |
Total capital to risk adjusted assets | | 10.0 | % | | 8.0 | % | | 13.1 | % | | 12.1 | % |
Leverage ratio | | 5.0 | % | | 4.0 | % | | 10.5 | % | | 9.7 | % |
| | | | |
December 31, 2005 | | Well
Capitalized | | | Adequately
Capitalized | | | First
Security | | | FSGBank | |
Tier 1 capital to risk adjusted assets | | 6.0 | % | | 4.0 | % | | 12.0 | % | | 10.1 | % |
Total capital to risk adjusted assets | | 10.0 | % | | 8.0 | % | | 13.2 | % | | 11.2 | % |
Leverage ratio | | 5.0 | % | | 4.0 | % | | 10.6 | % | | 8.9 | % |
Effects of Inflation
Inflation generally increases the cost of funds and operating overhead, and, to the extent loans and other assets bear variable rates, the yields on such assets. Unlike most industrial companies, virtually all of our assets and liabilities are monetary in nature. As a result, interest rates generally have a more significant impact on our performance than the effects of general levels of inflation. Although interest rates do not necessarily move in the same direction, or to the same extent, as the prices of goods and services, increases in inflation generally have resulted in increased interest rates. If the Federal Reserve Board believes that the rate of inflation is likely to increase to undesired levels, its method of curbing inflation in the past has been to increase the interest rate charged on short-term federal borrowings.
59
In addition, inflation results in an increased cost of goods and services purchased, cost of salaries and benefits, occupancy expense and similar items. Inflation and related increases in interest rates generally decrease the market value of investments and loans held and may adversely affect the liquidity and earnings of our commercial banking and mortgage banking business, and our shareholders’ equity. With respect to our mortgage banking business, mortgage originations and refinancings tend to slow as interest rates increase, and increased interest rates would likely reduce our earnings from such activities and the income from the sale of residential mortgage loans in the secondary market.
Off-Balance Sheet Arrangements
We are party to credit-related financial instruments with off-balance-sheet risk in the normal course of business to meet the financing needs of our customers. These financial instruments include commitments to extend credit. Such commitments involve, to varying degrees, elements of credit and interest rate risk in excess of the amount recognized in the consolidated balance sheets.
Our exposure to credit loss is represented by the contractual amount of these commitments. We follow the same credit policies in making commitments as we do for on-balance-sheet instruments.
Our maximum exposure to credit risk for unfunded loan commitments and standby letters of credit at December 31, 2006 and 2005, was as follows:
| | | | | | |
| | | 2006 | | 2005 |
| | | (in thousands) |
Commitments to Extend Credit | | $ | 270,662 | | $ | 234,352 |
Standby Letters of Credit | | $ | 15,998 | | $ | 12,669 |
Commitments to extend credit are agreements to lend to customers. Commitments generally have fixed expiration dates or other termination clauses and may require payment of fees. Since many of the commitments are expected to expire without being drawn upon, the total commitment amounts do not necessarily represent future cash requirements. We evaluate each customer’s credit worthiness on a case-by-case basis. The amount of collateral, if any, we obtain on an extension of credit is based on our credit evaluation of the customer. Collateral held varies but may include accounts receivable, inventory, property and equipment and income-producing commercial properties.
Recent Accounting Developments
In September 2006, the FASB issued Statement of Financial Accounting Standards No. 157,Fair Value Measurement(FAS 157) to clarify how to measure fair value and to expand disclosures about fair value measurements. The expanded disclosures include the extent to which companies measure assets and liabilities at fair value, the information used to measure fair value, and the effect of fair value on earnings and is applicable whenever other standards require (or permit) assets and liabilities to be measured at fair value. FAS 157 is effective for financial statements issued for fiscal years beginning after November 15, 2007 and interim periods within those fiscal years. We believe this Statement will not have a material impact on our consolidated financial statements.
In July 2006, the FASB issued FASB Interpretation No. 48,Accounting for Uncertainty in Income Taxes, an interpretation of FASB Statement No. 109, Accounting for Income Taxes (FIN 48). The Interpretation provides guidance for recognition and measurement of uncertain tax positions that are “more likely than not” of being sustained upon audit, based on the technical merits of the position. FIN 48 also provides guidance on measurement, derecognition, classification, interest and penalties, accounting in interim periods, disclosure and transition. The effective date is for fiscal years beginning after December 15, 2006. We believe this Statement will not have a material impact on our consolidated financial statements.
60
In December 2005, the FASB issued FASB Staff Position (FSP) SOP 94-6-1,Terms of Loan Products That May Give Rise to a Concentration of Credit Risk. This FSP was issued in response to inquiries from constituents and discussions with the SEC staff and regulators of financial institutions to address the circumstances in which the terms of loan products give rise to a concentration of credit risk as that term is used in SFAS No. 107,Disclosures about Fair Value ofFinancial Instruments, and what disclosures apply to entities who deal with loan products whose terms may give rise to a concentration of credit risk. An entity shall provide the disclosures required by SFAS No. 107 for either an individual loan product type or a group of loan products with similar features that are determined to represent a concentration of credit risk in accordance with the guidance of SOP 94-6-1 for all periods presented in financial statements. This SOP is effective for interim and annual periods ending after December 19, 2005. The adoption of FSP SOP 94-6-1 did not have a material impact on our consolidated financial statements.
In November 2005, the FASB issued an FSP on FAS No. 115-1 and FAS No. 124-1 (“the FSP”),The Meaning of Other-Than-Temporary Impairment and Its Application to Certain Investments, which addresses the determination of when an investment is considered impaired; whether the impairment is other-than-temporary; and how to measure an impairment loss. The FSP also addresses accounting considerations subsequent to the recognition of an other-than-temporary impairment on a debt security, and requires certain disclosures about unrealized losses that have not been recognized as other-than-temporary impairments. The FSP replaces the impairment guidance on Emerging Issues Task Force (EITF) Issue No. 03-1 with references to existing authoritative literature concerning other-than-temporary determinations. Under the FSP, losses arising from impairment deemed to be other-than-temporary, must be recognized in earnings at an amount equal to the entire difference between the security’s cost and its fair value at the financial statement date, without considering partial recoveries subsequent to that date. The FSP also required that an investor recognize an other-than-temporary impairment loss when a decision to sell a security has been made and the investor does not expect the fair value of the security to fully recover prior to the expected time of sale. The FSP is effective for reporting periods beginning after December 15, 2005. The initial adoption of this statement did not have a material impact on our consolidated financial statements.
In May 2005, the FASB issued Statement of Financial Accounting Standards No. 154 (SFAS No. 154),Accounting Changes and Error Corrections—a replacement of APB Opinion No. 20 and FASB Statement No. 3, which eliminates the requirement to reflect changes in accounting principles as cumulative adjustments to net income in the period of the change and requires retrospective application to prior periods’ financial statements for voluntary changes in accounting principle, unless it is impracticable to determine either the period-specific effects or the cumulative effect of the change. If it is impracticable to determine the cumulative effect of the change to all prior periods, SFAS No. 154 requires that the new accounting principle be adopted prospectively. For new accounting pronouncements, the transition guidance in the pronouncement should be followed. Retrospective application refers to the application of a different accounting principle to previously issued financial statements as if that principle had always been used.
SFAS 154 did not change the guidance for reporting corrections of errors, changes in estimates or for justification of a change in accounting principle on the basis of preferability. SFAS No. 154 is effective for accounting changes made in fiscal years beginning after December 15, 2005. The adoption of SFAS No. 154 did not have a significant impact on our consolidated financial statements.
In December 2004, the Financial Accounting Standards Board issued SFAS No. 123R,Share-Based Payment, (SFAS No. 123R). This Statement is a revision of FASB Statement No. 123,Accounting for Stock-Based Compensation, and supersedes APB Opinion No. 25,Accounting for Stock Issued to Employees, and its related implementation guidance. Under APB No. 25, issuing stock options to employees generally resulted in recognition of no compensation cost. SFAS No. 123R requires entities to recognize the cost of employee services received in exchange for awards of equity instruments based on the grant-date fair value of those awards. The cost will be recognized over the period during which an employee is required to provide service in exchange for the award—the requisite service period which is usually the vesting period. No compensation cost is recognized
61
for equity instruments for which employees do not render the requisite service. The grant-date fair value of employee share options and similar instruments will be estimated using option-pricing models adjusted for the unique characteristics of those instruments. If an equity award is modified after the grant date, incremental compensation cost will be recognized in an amount equal to the excess of the fair value of the modified award over the fair value of the original award immediately before the modification. For public entities that do not file as small business issuers, SFAS No. 123R is effective as of the beginning of the first annual reporting period that begins after June 15, 2005. The adoption of SFAS No. 123R resulted in compensation expense recorded to our financial statements.
In December 2003, the American Institute of Certified Public Accountants issued Statement of Position 03-3, (SOP 03-3)Accounting for Certain Loans and Debt Securities Acquired in a Transfer. SOP 03-3 addresses accounting for differences between contractual cash flows expected to be collected and an investor’s initial investment in loans or debt securities acquired in a transfer if those differences are attributable, at least in part, to credit quality. It includes loans and debt securities acquired in purchase business combinations. SOP 03-3 limits the yield that may be accreted (accretable yield) to the excess of the investor’s estimate of undiscounted expected principal, interest and other cash flows (cash flows expected at acquisition to be collected) over the investor’s initial investment in the loan. SOP 03-3 requires that the excess of contractual cash flows over cash flows to be collected (nonaccretable difference) not be recognized as an adjustment of yield, loss accrual or valuation allowance. SOP 03-3 prohibits investors from displaying accretable yield and nonaccretable difference on the balance sheet. Subsequent increases in cash flows expected to be collected generally should be recognized prospectively through adjustment of the loan’s yield over its remaining life. Decreases in cash flows expected to be collected should be recognized as an impairment. SOP 03-3 prohibits “carrying over” or creation of valuation allowances in the initial accounting of all loans acquired in a transfer that are within the scope of SOP 03-3. The prohibition of the valuation allowance carryover applies to the purchase of an individual loan, a pool of loans, a group of loans, and loans acquired in a purchase business combination. SOP 03-3 is effective for loans acquired in fiscal years beginning after December 15, 2004. Our adoption of SOP 03-3 has not had a material impact on its financial condition or results of operations.
| Item 7A. | Quantitative and Qualitative Disclosures about Market Risk |
Our market risk is the risk of loss arising from adverse changes in interest rates and prices. The risk of loss can result in either lower fair market values or reduced net interest income. Although we manage other risk, such as credit and liquidity risks, management considers interest rate risk to be the more significant market risk and it could potentially have the largest material effect on our financial condition. Further, we believe the potential reduction of net interest income to be more significant than the effect of reduced fair market values. We do not maintain a trading portfolio or deal in international instruments, and therefore are not exposed to risk inherent to trading activities and foreign currency.
Our interest rate risk management is the responsibility of our Board of Directors’ asset/liability committee. The committee has established policies and limits for management to monitor, measure and coordinate our sources, uses, and pricing of funds.
Interest rate risk represents the sensitivity of earnings to changes in interest rates. As interest rates change, the interest income and expense associated with our interest sensitive assets and liabilities also change, thereby impacting net interest income, the primary component of our earnings. We utilize the results of both a static and dynamic gap report to quantify the estimated exposure of net interest income to a sustained change in interest rates.
The gap analysis projects net interest income based on both a rise and fall in interest rates of 200 basis points (i.e. 2.00%) over a twelve-month period. The model is based on actual repricing dates of interest sensitive assets and interest sensitive liabilities. The model incorporates assumptions regarding the impact of changing interest rates on the prepayment rates of certain assets.
62
We measure this exposure based on an immediate change in interest rates of 200 basis points up or down. Given this scenario, we had, at year-end, an exposure to falling rates and a benefit from rising rates. Morespecifically, the model forecasts a decline in net interest income of $3.3 million or 6.9%, as a result of a 200 basis point decline in rates. The model also predicts a $3.3 million increase in net interest income, or 6.8%, as a result of a 200 basis point increase in rates. The forecasted results of the model are within the limits specified by our guidelines. The following chart reflects First Security’s sensitivity to changes in interest rates as of December 31, 2006. The model is based on a static balance sheet and assumes that paydowns and maturities of both assets and liabilities are reinvested in like instruments at current interest rates, rates down 200 basis points, and rates up 200 basis points.
Interest Rate Risk
Income Sensitivity Summary
| | | | | | | | | | | | |
| | | Down 200 BP | | | Current | | | Up 200 BP | |
| | | (dollar amounts in thousands) | |
Net interest income | | $ | 44,681 | | | $ | 47,982 | | | $ | 51,245 | |
$ change net interest income | | | (3,301 | ) | | | — | | | | 3,263 | |
% change net interest income | | | (6.88 | )% | | | 0.00 | % | | | 6.80 | % |
The preceding sensitivity analysis is a modeling analysis, which changes periodically and consists of hypothetical estimates based upon numerous assumptions including interest rate levels, shape of the yield curve, prepayments on loans and securities, rates on loans and deposits, reinvestments of paydowns and maturities of loans, investments and deposits, and other assumptions. In addition, there is no input for growth or a change in asset mix. While assumptions are developed based on the current economic and market conditions, management cannot make any assurances as to the predictive nature of these assumptions including how customer preferences or competitor influences might change.
As market conditions vary from those assumed in the sensitivity analysis, actual results will differ. Also, the sensitivity analysis does not reflect actions that management might take in responding to or anticipating changes in interest rates.
We use the Sendero Vision Asset/Liability system which is a comprehensive interest rate risk measurement tool that is widely used in the banking industry. Generally, it provides the user with the ability to more accurately model both static and dynamic gap, economic value of equity, duration, and income simulations using a wide range of scenarios including interest rate shocks and rate ramps. The system also has the capability to model derivative instruments such as interest rate swap contracts.
63
| Item 8. | Financial Statements and Supplementary Data |
INDEX TO CONSOLIDATED FINANCIAL STATEMENTS
64
| | |
DECOSIMO CERTIFIED PUBLIC ACCOUNTANTS | | Joseph Decosimo and Company, PLLC Suite 1100—Two Union Square Chattanooga, Tennessee 37402 www.decosimo.com |
Report of Independent Registered Public Accounting Firm
on the Consolidated Financial Statements
Board of Directors and Stockholders
First Security Group, Inc.
Chattanooga, Tennessee
We have audited the accompanying consolidated balance sheets of First Security Group, Inc. and subsidiary (Company) as of December 31, 2006 and 2005, and the related consolidated statements of income, stockholders’ equity, and cash flows for each of the years in the three-year period ended December 31, 2006. These consolidated financial statements are the responsibility of the Company’s management. Our responsibility is to express an opinion on these financial statements based on our audits.
We conducted our audits in accordance with the standards of the Public Company Accounting Oversight Board (United States). Those standards require that we plan and perform the audit to obtain reasonable assurance about whether the consolidated financial statements are free of material misstatement. An audit includes examining, on a test basis, evidence supporting the amounts and disclosures in the consolidated financial statements. An audit also includes assessing the accounting principles used and significant estimates made by management, as well as evaluating the overall financial statement presentation. We believe that our audits provide a reasonable basis for our opinion.
In our opinion, the consolidated financial statements referred to above present fairly, in all material respects, the financial position of First Security Group, Inc. and subsidiary as of December 31, 2006 and 2005, and the results of its operations and its cash flows for each of the years in the three-year period ended December 31, 2006, in conformity with accounting principles generally accepted in the United States of America.
We have also audited, in accordance with the standards of the Public Company Accounting Oversight Board (United States) the effectiveness of First Security Group, Inc. and subsidiary’s internal control over financial reporting as of December 31, 2006, based on criteria established inInternal Control—Integrated Frameworkissued by the Committee of Sponsoring Organizations of the Treadway Commission and our report dated March 15, 2007, expressed an unqualified opinion on management’s assessment of the effectiveness of internal control over financial reporting and an unqualified opinion on the effectiveness of First Security Group, Inc. and subsidiary’s internal control over financial reporting.
/s/ Joseph Decosimo and Company, PLLC
Chattanooga, Tennessee
March 15, 2007
65
FIRST SECURITY GROUP, INC. AND SUBSIDIARY
CONSOLIDATED BALANCE SHEETS
December 31, 2006 and 2005
| | | | | | | | |
| | | 2006 | | | 2005 | |
| | | (in thousands) | |
| ASSETS | | | | |
Cash and Due from Banks | | $ | 26,512 | | | $ | 23,917 | |
Federal Funds Sold and Securities Purchased Under Agreements to Resell | | | 1,600 | | | | 17,835 | |
| | | | | | | | |
Cash and Cash Equivalents | | | 28,112 | | | | 41,752 | |
| | | | | | | | |
Interest-Bearing Deposits in Banks | | | 481 | | | | 1,153 | |
| | | | | | | | |
Securities Available for Sale | | | 153,759 | | | | 155,993 | |
| | | | | | | | |
Loans Held for Sale | | | 7,524 | | | | 4,244 | |
Loans | | | 840,069 | | | | 744,415 | |
| | | | | | | | |
Total Loans | | | 847,593 | | | | 748,659 | |
Less: Allowance for Loan Losses | | | 9,970 | | | | 10,121 | |
| | | | | | | | |
| | | 837,623 | | | | 738,538 | |
| | | | | | | | |
Premises and Equipment, net | | | 35,835 | | | | 31,604 | |
| | | | | | | | |
Goodwill | | | 27,156 | | | | 27,032 | |
| | | | | | | | |
Core Deposit and Other Intangibles | | | 4,185 | | | | 5,431 | |
| | | | | | | | |
Other Assets | | | 42,652 | | | | 39,189 | |
| | | | | | | | |
TOTAL ASSETS | | $ | 1,129,803 | | | $ | 1,040,692 | |
| | | | | | | | |
| LIABILITIES AND STOCKHOLDERS’ EQUITY | | | | | | | | |
LIABILITIES | | | | | | | | |
Deposits— | | | | | | | | |
Noninterest-Bearing Demand | | $ | 168,654 | | | $ | 153,278 | |
Interest-Bearing Demand | | | 66,787 | | | | 75,123 | |
| | | | | | | | |
| | | 235,441 | | | | 228,401 | |
| | | | | | | | |
Savings and Money Market Accounts | | | 135,784 | | | | 152,901 | |
| | | | | | | | |
Time Deposits— | | | | | | | | |
Certificates of Deposit of $100 thousand or more | | | 205,428 | | | | 156,134 | |
Certificates of Deposit of less than $100 thousand | | | 258,456 | | | | 234,501 | |
Brokered Certificates of Deposit | | | 86,892 | | | | 89,570 | |
| | | | | | | | |
| | | 550,776 | | | | 480,205 | |
| | | | | | | | |
Total Deposits | | | 922,001 | | | | 861,507 | |
Federal Funds Purchased and Securities Sold Under Agreements to Repurchase | | | 20,851 | | | | 16,894 | |
Security Deposits—Leases | | | 3,920 | | | | 4,094 | |
Other Borrowings | | | 24,838 | | | | 10,150 | |
Other Liabilities | | | 13,405 | | | | 9,658 | |
| | | | | | | | |
Total Liabilities | | | 985,015 | | | | 902,303 | |
| | | | | | | | |
STOCKHOLDERS’ EQUITY | | | | | | | | |
Common Stock—$.01 par value—50,000,000 shares authorized for 2006
and 20,000,000 shares authorized for 2005; 17,762,278 shares issued for 2006; 17,653,833 shares issued for 2005 | | | 123 | | | | 122 | |
Paid-In Surplus | | | 124,293 | | | | 122,545 | |
Unallocated ESOP Shares | | | (5,094 | ) | | | (91 | ) |
Retained Earnings | | | 26,337 | | | | 17,392 | |
Accumulated Other Comprehensive Loss | | | (871 | ) | | | (1,579 | ) |
| | | | | | | | |
Total Stockholders’ Equity | | | 144,788 | | | | 138,389 | |
| | | | | | | | |
TOTAL LIABILITIES AND STOCKHOLDERS’ EQUITY | | $ | 1,129,803 | | | $ | 1,040,692 | |
| | | | | | | | |
The accompanying notes are an integral part of the financial statements.
66
FIRST SECURITY GROUP, INC. AND SUBSIDIARY
CONSOLIDATED STATEMENTS OF INCOME
Years Ended December 31, 2006, 2005 and 2004
(in thousands, except per share amounts)
| | | | | | | | | | | |
| | | 2006 | | | 2005 | | | 2004 |
INTEREST INCOME | | | | | | | | | | | |
Loans, including fees | | $ | 67,972 | | | $ | 50,774 | | | $ | 34,327 |
Debt Securities—taxable | | | 5,253 | | | | 3,698 | | | | 2,239 |
Debt Securities—nontaxable | | | 1,596 | | | | 1,191 | | | | 873 |
Other | | | 306 | | | | 641 | | | | 150 |
| | | | | | | | | | | |
Total Interest Income | | | 75,127 | | | | 56,304 | | | | 37,589 |
| | | | | | | | | | | |
INTEREST EXPENSE | | | | | | | | | | | |
Interest-Bearing Demand Deposits | | | 589 | | | | 433 | | | | 183 |
Savings Deposits and Money Market Accounts | | | 2,861 | | | | 2,138 | | | | 1,144 |
Certificates of Deposit of $100 thousand or more | | | 8,378 | | | | 4,136 | | | | 2,522 |
Certificates of Deposit of less than $100 thousand | | | 10,417 | | | | 5,645 | | | | 3,988 |
Brokered Certificates of Deposit | | | 3,649 | | | | 2,987 | | | | 263 |
Other | | | 1,251 | | | | 524 | | | | 659 |
| | | | | | | | | | | |
Total Interest Expense | | | 27,145 | | | | 15,863 | | | | 8,759 |
| | | | | | | | | | | |
NET INTEREST INCOME | | | 47,982 | | | | 40,441 | | | | 28,830 |
Provision for Loan Losses | | | 2,184 | | | | 2,922 | | | | 3,399 |
| | | | | | | | | | | |
NET INTEREST INCOME AFTER PROVISION FOR LOAN LOSSES | | | 45,798 | | | | 37,519 | | | | 25,431 |
| | | | | | | | | | | |
NONINTEREST INCOME | | | | | | | | | | | |
Service Charges on Deposit Accounts | | | 4,843 | | | | 4,221 | | | | 3,873 |
(Loss) Gain on Sales of Available for Sale Securities, net | | | (197 | ) | | | (117 | ) | | | 84 |
Other | | | 5,971 | | | | 4,743 | | | | 2,587 |
| | | | | | | | | | | |
Total Noninterest Income | | | 10,617 | | | | 8,847 | | | | 6,544 |
| | | | | | | | | | | |
NONINTEREST EXPENSES | | | | | | | | | | | |
Salaries and Employee Benefits | | | 22,108 | | | | 19,428 | | | | 14,776 |
Expense on Premises and Equipment, net of rental income | | | 6,613 | | | | 5,606 | | | | 4,262 |
Other | | | 11,296 | | | | 10,339 | | | | 8,090 |
| | | | | | | | | | | |
Total Noninterest Expenses | | | 40,017 | | | | 35,373 | | | | 27,128 |
| | | | | | | | | | | |
INCOME BEFORE INCOME TAX PROVISION | | | 16,398 | | | | 10,993 | | | | 4,847 |
Income Tax Provision | | | 5,286 | | | | 3,597 | | | | 1,365 |
| | | | | | | | | | | |
INCOME BEFORE EXTRAORDINARY ITEM | | | 11,112 | | | | 7,396 | | | | 3,482 |
Extraordinary Gain on Business Combination, net of income tax of $1,332 and $481, respectively | | | — | | | | 2,175 | | | | 785 |
| | | | | | | | | | | |
NET INCOME | | $ | 11,112 | | | $ | 9,571 | | | $ | 4,267 |
| | | | | | | | | | | |
NET INCOME PER SHARE: | | | | | | | | | | | |
Net Income Per Share Before Extraordinary Item—Basic | | $ | 0.64 | | | $ | 0.51 | | | $ | 0.28 |
Extraordinary Item—Basic | | | — | | | | 0.14 | | | | 0.06 |
| | | | | | | | | | | |
Net Income Per Share—Basic | | $ | 0.64 | | | $ | 0.65 | | | $ | 0.34 |
| | | | | | | | | | | |
Net Income Per Share Before Extraordinary Item—Diluted | | $ | 0.63 | | | $ | 0.50 | | | $ | 0.27 |
Extraordinary Item—Diluted | | | — | | | | 0.14 | | | | 0.06 |
| | | | | | | | | | | |
Net Income Per Share—Diluted | | $ | 0.63 | | | $ | 0.64 | | | $ | 0.33 |
| | | | | | | | | | | |
The accompanying notes are an integral part of the financial statements.
67
FIRST SECURITY GROUP, INC. AND SUBSIDIARY
CONSOLIDATED STATEMENTS OF STOCKHOLDERS’ EQUITY
Years Ended December 31, 2006, 2005 and 2004
(in thousands)
| | | | | | | | | | | | | | | | | | | | | | | | | | | | | | |
| | | Common Stock | | Paid-In
Surplus | | | Retained
Earnings | | | Accumulated
Other
Comprehensive
Income (Loss) | | | Unallocated
ESOP
Shares | | | Total
Stockholders’
Equity | | | Total
Comprehensive
Income | |
| | Shares | | | Amount | | | | | | |
BALANCE—December 31, 2003 | | 12,702 | | | $ | 88 | | $ | 77,925 | | | $ | 3,995 | | | $ | 430 | | | $ | — | | | $ | 82,438 | | | | | |
Issuance of Common Stock | | 3 | | | | | | | 56 | | | | | | | | | | | | | | | | 56 | | | | | |
Comprehensive Income— | | | | | | | | | | | | | | | | | | | | | | | | | | | | | | |
Net Income | | | | | | | | | | | | | 4,267 | | | | | | | | | | | | 4,267 | | | $ | 4,267 | |
Change in Net Unrealized Loss on Securities Available for Sale, net reclassification adjustment and tax expense | | | | | | | | | | | | | | | | | (316 | ) | | | | | | | (316 | ) | | | (316 | ) |
| | | | | | | | | | | | | | | | | | | | | | | | | | | | | | |
Total Comprehensive Income | | | | | | | | | | | | | | | | | | | | | | | | | | | | $ | 3,951 | |
| | | | | | | | | | | | | | | | | | | | | | | | | | | | | | |
BALANCE—December 31, 2004 | | 12,705 | | | | 88 | | | 77,981 | | | | 8,262 | | | | 114 | | | | — | | | | 86,445 | | | | | |
Issuance of Common Stock | | 5,032 | | | | 34 | | | 45,361 | | | | | | | | | | | | (91 | ) | | | 45,304 | | | | | |
Comprehensive Income— | | | | | | | | | | | | | | | | | | | | | | | | | | | | | | |
Net Income | | | | | | | | | | | | | 9,571 | | | | | | | | | | | | 9,571 | | | $ | 9,571 | |
Change in Net Unrealized Loss on Securities Available for Sale, net reclassification adjustment and tax expense | | | | | | | | | | | | | | | | | (1,693 | ) | | | | | | | (1,693 | ) | | | (1,693 | ) |
| | | | | | | | | | | | | | | | | | | | | | | | | | | | | | |
Total Comprehensive Income | | | | | | | | | | | | | | | | | | | | | | | | | | | | $ | 7,878 | |
| | | | | | | | | | | | | | | | | | | | | | | | | | | | | | |
Dividends Paid | | | | | | | | | | | | | (441 | ) | | | | | | | | | | | (441 | ) | | | | |
Repurchase and Retirement of Common Stock (82,727 shares) | | (83 | ) | | | | | | (797 | ) | | | | | | | | | | | | | | | (797 | ) | | | | |
| | | | | | | | | | | | | | | | | | | | | | | | | | | | | | |
BALANCE—December 31, 2005 | | 17,654 | | | | 122 | | | 122,545 | | | | 17,392 | | | | (1,579 | ) | | | (91 | ) | | | 138,389 | | | | | |
Issuance of Common Stock | | 25 | | | | | | | 709 | | | | | | | | | | | | (5,471 | ) | | | (4,762 | ) | | | | |
Issuance of Common Stock to ESOP | | 170 | | | | 1 | | | 1,876 | | | | | | | | | | | | | | | | 1,877 | | | | | |
Comprehensive Income— | | | | | | | | | | | | | | | | | | | | | | | | | | | | | | |
Net Income | | | | | | | | | | | | | 11,112 | | | | | | | | | | | | 11,112 | | | $ | 11,112 | |
Change in Net Unrealized Gain on Securities Available for Sale, net reclassification adjustment and tax expense | | | | | | | | | | | | | | | | | 708 | | | | | | | | 708 | | | | 708 | |
| | | | | | | | | | | | | | | | | | | | | | | | | | | | | | |
Total Comprehensive Income | | | | | | | | | | | | | | | | | | | | | | | | | | | | $ | 11,820 | |
| | | | | | | | | | | | | | | | | | | | | | | | | | | | | | |
Dividends Paid | | | | | | | | | | | | | (2,167 | ) | | | | | | | | | | | (2,167 | ) | | | | |
ESOP Allocation | | | | | | | | | 80 | | | | | | | | | | | | 468 | | | | 548 | | | | | |
Repurchase and Retirement of Common Stock (87,420 shares) | | (87 | ) | | | | | | (917 | ) | | | | | | | | | | | | | | | (917 | ) | | | | |
| | | | | | | | | | | | | | | | | | | | | | | | | | | | | | |
BALANCE—December 31, 2006 | | 17,762 | | | $ | 123 | | $ | 124,293 | | | $ | 26,337 | | | $ | (871 | ) | | $ | (5,094 | ) | | $ | 144,788 | | | | | |
| | | | | | | | | | | | | | | | | | | | | | | | | | | | | | |
The accompanying notes are an integral part of the financial statements.
68
FIRST SECURITY GROUP, INC. AND SUBSIDIARY
CONSOLIDATED STATEMENTS OF CASH FLOWS
Years Ended December 31, 2006, 2005 and 2004
(in thousands)
| | | | | | | | | | | | |
| | | 2006 | | | 2005 | | | 2004 | |
CASH FLOWS FROM OPERATING ACTIVITIES | | | | | | | | | | | | |
Net Income | | $ | 11,112 | | | $ | 9,571 | | | $ | 4,267 | |
Adjustments to Reconcile Net Income to Net Cash Provided by Operating Activities— | | | | | | | | | | | | |
Provision for Loan Losses | | | 2,184 | | | | 2,922 | | | | 3,399 | |
Gain on Business Combination | | | — | | | | (3,507 | ) | | | (1,266 | ) |
Loss (Gain) on Sale of Securities Available for Sale | | | 197 | | | | 117 | | | | (84 | ) |
(Gain) Loss on Sale of Premises and Equipment | | | (60 | ) | | | 5 | | | | 13 | |
Gain on Sale of Other Real Estate, Repossessions, Leased Equipment and Corporate Stock | | | (348 | ) | | | (239 | ) | | | (48 | ) |
Amortization, net | | | 1,471 | | | | 1,316 | | | | 1,512 | |
Write-down of Other Real Estate and Repossessions | | | 407 | | | | 641 | | | | 226 | |
Write-down of Long-lived Assets | | | — | | | | 308 | | | | — | |
Accretion of Fair Value Adjustment, net | | | (878 | ) | | | (170 | ) | | | — | |
Amortization of Deferred Compensation | | | 454 | | | | 84 | | | | 33 | |
Depreciation | | | 2,489 | | | | 2,075 | | | | 1,710 | |
Deferred Income Taxes | | | 676 | | | | 276 | | | | 617 | |
Changes in Operating Assets and Liabilities— | | | | | | | | | | | | |
Decrease (Increase) in— | | | | | | | | | | | | |
Loans Held for Sale | | | 3,280 | | | | 1,829 | | | | (3,062 | ) |
Interest Receivable | | | (917 | ) | | | (1,596 | ) | | | (222 | ) |
Other Assets | | | (1,542 | ) | | | (574 | ) | | | 2,413 | |
Increase (Decrease) in— | | | | | | | | | | | | |
Interest Payable | | | 2,792 | | | | 1,615 | | | | (283 | ) |
Other Liabilities | | | 313 | | | | 2,086 | | | | 4,562 | |
| | | | | | | | | | | | |
Net Cash Provided by Operating Activities | | | 21,630 | | | | 16,759 | | | | 13,787 | |
| | | | | | | | | | | | |
CASH FLOWS FROM INVESTING ACTIVITIES | | | | | | | | | | | | |
Activity in Available for Sale Securities— | | | | | | | | | | | | |
Sales | | | 9,791 | | | | 14,487 | | | | 8,513 | |
Maturities, Prepayments and Calls | | | 23,558 | | | | 38,839 | | | | 42,555 | |
Purchases | | | (30,465 | ) | | | (60,087 | ) | | | (75,695 | ) |
Net Decrease in Interest-Bearing Deposits in Banks | | | 672 | | | | 63 | | | | 3,907 | |
Proceeds from Sale of Premises and Equipment | | | 587 | | | | — | | | | — | |
Purchase of Bank Owned Life Insurance | | | — | | | | (17,250 | ) | | | — | |
Loan Originations and Principal Collections, net | | | (107,589 | ) | | | (59,952 | ) | | | (61,138 | ) |
License Agreement | | | — | | | | — | | | | (500 | ) |
Purchase Accounting Adjustment to Goodwill | | | — | | | | — | | | | (56 | ) |
Additions to Premises and Equipment | | | (7,425 | ) | | | (2,110 | ) | | | (3,243 | ) |
Capital Improvements to Repossessions | | | (254 | ) | | | (481 | ) | | | — | |
Proceeds from Sale of Repossessions | | | 3,033 | | | | 4,758 | | | | — | |
Net Cash Paid in Transactions Accounted for Under the Purchase Method of Accounting | | | — | | | | (22,578 | ) | | | (12,527 | ) |
| | | | | | | | | | | | |
Net Cash Used in Investing Activities | | | (108,092 | ) | | | (104,311 | ) | | | (98,184 | ) |
| | | | | | | | | | | | |
CASH FLOWS FROM FINANCING ACTIVITIES | | | | | | | | | | | | |
Net Increase in Deposits | | | 60,600 | | | | 80,759 | | | | 100,222 | |
Net Increase (Decrease) in Federal Funds Purchased and Securities Sold Under Agreements to Repurchase | | | 3,957 | | | | (6,361 | ) | | | 11,186 | |
Proceeds from Issuance of Common Stock | | | — | | | | 44,681 | | | | 23 | |
Proceeds from Issuance of Common Stock to ESOP | | | 1,877 | | | | — | | | | — | |
Proceeds from Issuance of Common Stock Under Stock Option Plan | | | 255 | | | | 630 | | | | — | |
Repurchase and Retirement of Common Stock | | | (917 | ) | | | (797 | ) | | | — | |
Purchase of ESOP Shares | | | (5,471 | ) | | | (91 | ) | | | — | |
Dividends Paid on Common Stock | | | (2,167 | ) | | | (441 | ) | | | — | |
Payments Under Line of Credit | | | — | | | | — | | | | (41,724 | ) |
Advances (Repayments) of Other Borrowings, net | | | 14,688 | | | | (5,011 | ) | | | (2,009 | ) |
| | | | | | | | | | | | |
Net Cash Provided by Financing Activities | | | 72,822 | | | | 113,369 | | | | 67,698 | |
| | | | | | | | | | | | |
The accompanying notes are an integral part of the financial statements.
69
FIRST SECURITY GROUP, INC. AND SUBSIDIARY
CONSOLIDATED STATEMENTS OF CASH FLOWS—(Continued)
Years Ended December 31, 2006, 2005 and 2004
(in thousands)
| | | | | | | | | | | | |
| | | 2006 | | | 2005 | | | 2004 | |
NET (DECREASE) INCREASE IN CASH AND CASH EQUIVALENTS | | $ | (13,640 | ) | | $ | 25,817 | | | $ | (16,699 | ) |
CASH AND CASH EQUIVALENTS—beginning of year | | | 41,752 | | | | 15,935 | | | | 32,634 | |
| | | | | | | | | | | | |
CASH AND CASH EQUIVALENTS—end of year | | $ | 28,112 | | | $ | 41,752 | | | $ | 15,935 | |
| | | | | | | | | | | | |
SUPPLEMENTAL DISCLOSURES OF NONCASH INVESTING AND FINANCING ACTIVITIES | | | | | | | | | | | | |
Unrealized Appreciation (Depreciation) of Securities, net of deferred taxes of $363, $(871) and $(163) for 2006, 2005 and 2004, respectively | | $ | 708 | | | $ | (1,693 | ) | | $ | (316 | ) |
Issuance of Common Stock Pursuant to Incentive Plan | | $ | 182 | | | $ | 569 | | | $ | — | |
Foreclosed Properties and Repossessions | | $ | 4,835 | | | $ | 3,303 | | | $ | 4,131 | |
Purchase Accounting Adjustment to Goodwill | | $ | 178 | | | $ | — | | | $ | 182 | |
SUPPLEMENTAL SCHEDULE OF CASH FLOWS | | | | | | | | | | | | |
Interest Paid | | $ | 24,353 | | | $ | 14,250 | | | $ | 9,042 | |
Income Taxes Paid | | $ | 6,450 | | | $ | 6,064 | | | $ | 716 | |
ACQUISITIONS | | | | | | | | | | | | |
Assets (Noncash) Acquired in Business Combination | | $ | — | | | $ | 175,649 | | | $ | 59,777 | |
Liabilities Assumed in Business Combination | | $ | — | | | $ | 153,071 | | | $ | 45,511 | |
The accompanying notes are an integral part of the financial statements.
70
FIRST SECURITY GROUP, INC. AND SUBSIDIARY
NOTES TO CONSOLIDATED FINANCIAL STATEMENTS
NOTE 1—SUMMARY OF SIGNIFICANT ACCOUNTING POLICIES
First Security Group, Inc. is a bank holding company organized for the principal purpose of acquiring, developing and managing banks. The accounting and reporting policies of the Company are in accordance with accounting principles generally accepted in the United States of America and conform to general practices within the banking industry.
The significant accounting policies and practices followed by the Company are as follows:
BASIS OF CONSOLIDATION—The consolidated financial statements include the accounts of First Security Group, Inc. and its wholly-owned subsidiary, FSGBank, National Association (the Bank) (collectively referred to as the Company in the accompanying notes to the consolidated financial statements). All significant intercompany balances and transactions have been eliminated in consolidation.
During 2003, First Security Group, Inc.’s wholly-owned subsidiaries, Dalton Whitfield Bank, Frontier Bank and First State Bank, converted from state chartered banks to national banks. Subsequent to the conversions, each bank became known as FSGBank and was merged into one bank.
NATURE OF OPERATIONS—The Company is headquartered in Chattanooga, Tennessee, and provides banking services through the Bank to the various communities in eastern and middle Tennessee and northern Georgia. The commercial banking operations are primarily retail-oriented and aimed at individuals and small to medium-sized local businesses. The Bank provides traditional banking services, which include obtaining demand and time deposits and the making of secured and nonsecured consumer and commercial loans, as well as trust and investment management, mortgage banking, asset-based lending, financial planning and Internet banking (www.FSGBank.com) services, as well as equipment leasing through its wholly owned subsidiaries, Kenesaw Leasing and J&S Leasing. The Bank also operates two of its full-service banking offices in Dalton, Georgia under the name Primer Banco Seguro, which is an initiative marketed toward and serving Northwest Georgia’s rapidly growing Latino population.
BUSINESS COMBINATIONS—The Company accounts for business combinations in accordance with Statement of Financial Accounting Standards No. 141,Business Combinations (SFAS 141), which requires that all business combinations initiated after June 30, 2001, be accounted for by the purchase method. Under the purchase method, net assets of the acquired business are recorded at their estimated fair values as of the date of acquisition with any excess of the cost of the acquisition over the fair value of the net tangible and intangible assets acquired recorded as goodwill. The Company typically provides an allocation period, not to exceed one year, to identify and determine the fair values of the assets acquired and liabilities assumed in business purchases. Results of operations of the acquired business are included in the income statement from the date of acquisition.
CASH AND CASH EQUIVALENTS—For the purpose of presentation in the statements of cash flows, the Company considers all cash and amounts due from depository institutions to be cash equivalents. The Bank is required to maintain noninterest-bearing average reserve balances with the Federal Reserve Bank.
INTEREST-BEARING DEPOSITS IN BANKS—Interest-bearing deposits in banks mature within one year and are carried at cost.
SECURITIES—Securities that management does not have the intent or ability to hold to maturity are classified as available for sale and recorded at fair value. Unrealized gains and losses are excluded from earnings and reported in other comprehensive income, net of tax. Purchase premiums and discounts are recognized in
71
FIRST SECURITY GROUP, INC. AND SUBSIDIARY
NOTES TO CONSOLIDATED FINANCIAL STATEMENTS—(Continued)
interest income using methods approximating the interest method over the terms of the securities. Gains and losses on sale of securities are determined using the specific identification method.
LOANS—Loans that management has the intent and ability to hold for the foreseeable future or until maturity or payoff are reported at their outstanding principal adjusted for any charge-offs, the allowance for loan losses, and any deferred fees or costs on originated loans.
The Company also engages in direct lease financing through two wholly owned subsidiaries of the Bank. The net investment in direct financing leases is the sum of all minimum lease payments and estimated residual values, less unearned income. Unearned income is added to interest income over the term of the leases to produce a level yield.
A loan is impaired when, based on current information and events, it is probable that the Company will be unable to collect all amounts due according to the contractual terms of the loan agreement. Impaired loans are measured based on the present value of expected future cash flows discounted at the loan’s effective interest rate, or as a practical expedient, at the loan’s observable market price or the fair value of the collateral if the loan is collateral-dependent. When the fair value of the impaired loan is less than the recorded investment in the loan, the impairment is recorded through a specific reserve allocation which is a component of the allowance for loan losses.
Loans, including impaired loans, are generally classified as nonaccrual if they are past due as to maturity or payment of principal or interest for a period of more than 90 days, unless such loans are well collateralized and in the process of collection. If a loan or a portion of a loan is classified as doubtful or is partially charged off, the loan is generally classified as nonaccrual. At management’s discretion, loans that are on a current payment status or past due less than 90 days may also be classified as nonaccrual if repayment in full of principal and/or interest is in doubt.
LOANS HELD FOR SALE—Loans held for sale include residential mortgage loans originated for sale into the secondary market. Loans held for sale are carried at the lower of aggregate cost or fair value.
LOAN ORIGINATION FEES—Loan origination fees and certain direct origination costs are capitalized and recognized as an adjustment of the yield over the lives of the related loans.
INTEREST INCOME ON LOANS—Interest on loans is accrued and credited to income based on the principal amount outstanding. The accrual of interest on loans is discontinued when, in the opinion of management, there is an indication that the borrower may be unable to meet payments as they become due. Upon such discontinuance, all unpaid accrued interest is reversed.
ALLOWANCE FOR LOAN LOSSES—The allowance for loan losses is increased by charges to income and decreased by charge-offs (net of recoveries). Management’s periodic evaluation of the allowance is based on the Company’s past loan loss experience, known and inherent risks in the portfolio, adverse situations that may affect the borrower’s ability to repay, the estimated value of any underlying collateral and current economic conditions. Any difference between the loan’s fair value and carrying amount is recorded as a reserve for loan losses. Although management uses available information to recognize losses on loans, because of uncertainties associated with local economic conditions, collateral values and future cash flows on impaired loans, it is reasonably possible that a material change could occur in the allowance for loan losses in the near term. However, the amount of the change that is reasonably possible cannot be estimated.
72
FIRST SECURITY GROUP, INC. AND SUBSIDIARY
NOTES TO CONSOLIDATED FINANCIAL STATEMENTS—(Continued)
The allowance for loan losses reflects management’s assessment and estimate of the risks associated with extending credit and its evaluation of the quality of the loan portfolio. The Company periodically analyzes the commercial loan portfolio in an effort to establish an allowance for loan losses that it believes will be adequate in light of anticipated risks and loan losses. In assessing the adequacy of the allowance, the Company reviews the size, quality and risk of loans in the portfolio. The Company also, on at least a quarterly basis, considers such factors as:
| | • | | the Company’s loan loss experience; |
| | • | | the amount of past due and nonperforming loans; |
| | • | | the status and amount of past due and nonperforming assets; |
| | • | | underlying estimated values of collateral securing loans; |
| | • | | current economic conditions; and |
| | • | | other factors which management believes affect the allowance for potential credit losses. |
An analysis of the credit quality of the loan portfolio and the adequacy of the allowance for loan losses is prepared by the Company and is presented to the board of directors on a regular basis.
PREMISES AND EQUIPMENT—Land is carried at cost. Premises and equipment are stated at cost less accumulated depreciation. Expenditures for repairs, maintenance and minor improvements are charged to expense as incurred and additions and improvements that significantly extend the lives of assets are capitalized. Upon sale or other retirement of depreciable property, the cost and related accumulated depreciation are removed from the related accounts and any gain or loss is reflected in operations.
Depreciation is provided using the straight-line method over the estimated lives of the depreciable assets. Buildings are depreciated over a period of forty years. Land and building improvements are depreciated over a ten year period. Leasehold improvements are depreciated over the lesser of the term of the related lease or the estimated useful life of the improvement. Furniture, fixtures and equipment and autos are depreciated over an estimated life of three to seven years. Deferred income taxes are provided for differences in the computation of depreciation for book and tax purposes.
GOODWILL AND OTHER INTANGIBLE ASSETS—Goodwill represents the cost in excess of the fair value of the net assets acquired. Other intangible assets represent identified intangible assets including premiums paid for acquisitions of core deposits (core deposit intangibles), license fees and covenants not to compete, which are amortized over their estimated useful lives, except the core deposit intangible which is amortized over a 10 year period.
Management evaluates whether events or circumstances have occurred that indicate the remaining useful life or carrying value of amortizing intangibles should be revised. On an annual basis, the Company tests goodwill for impairment. As of December 31, 2006 and 2005, no impairment of goodwill was recognized.
FORECLOSED PROPERTIES AND REPOSSESSIONS—Foreclosed properties are comprised principally of residential real estate properties obtained in partial or total satisfaction of nonperforming loans. Repossessions are primarily comprised of heavy equipment and other machinery, obtained in partial or total satisfaction of loans. Foreclosed properties and repossessions are recorded at their estimated fair value less anticipated selling costs based upon the property’s or item’s appraised value at the date of transfer, with any difference between the
73
FIRST SECURITY GROUP, INC. AND SUBSIDIARY
NOTES TO CONSOLIDATED FINANCIAL STATEMENTS—(Continued)
fair value of the property and the carrying value of the loan charged to the allowance for loan losses. Subsequent changes in values are reported as adjustments to the carrying amount, not to exceed the initial carrying value of the assets at the time of transfer. Gains or losses not previously recognized resulting from the sale of foreclosed properties or other repossessed items are recognized on the date of sale. At December 31, 2006 and 2005, the Company had $1,982 thousand and $1,552 thousand of foreclosed properties, respectively, and $2,231 thousand and $1,891 thousand of other repossessed items, respectively.
INCOME TAXES—The consolidated financial statements have been prepared on the accrual basis. When income and expenses are recognized in different periods for financial reporting purposes and for purposes of computing income taxes currently payable, deferred taxes are provided on such temporary differences. Deferred tax assets and liabilities are reflected at currently enacted income tax rates applicable to the period in which the deferred tax assets or liabilities are expected to be realized or settled. As changes in tax laws or rates are enacted, deferred tax assets and liabilities are adjusted through the provision for income taxes.
FINANCIAL INSTRUMENTS—In the ordinary course of business, the Company has entered into off-balance-sheet financial instruments consisting of commitments to extend credit, commercial letters of credit and standby letters of credit. Such financial instruments are recorded in the financial statements when they are funded or related fees are incurred or received.
ADVERTISING COSTS—Advertising costs are charged to expense when incurred.
STOCK-BASED COMPENSATION—Effective January 1, 2006, the Company adopted SFAS No. 123 (revised),Share-Based Payment(SFAS 123(R)) utilizing the modified prospective approach. Prior to the adoption of SFAS No. 123 (R) the Company accounted for stock option grants in accordance with APB Opinion No. 25,Accounting for Stock Issued to Employees(the intrinsic value method), and accordingly, recognized no compensation expense for stock option grants.
Under the modified prospective approach, SFAS No. 123 (R) applies to new awards and to awards that were outstanding on January 1, 2006 that are subsequently modified, repurchased or cancelled. Under the modified prospective approach, compensation cost recognized in 2006 includes compensation cost for all share-based payments granted prior to, but not yet vested as of January 1, 2006, based on grant date fair value estimated in accordance with the original provisions of SFAS 123, and compensation cost for all share-based payments granted subsequent to January 1, 2006, based on the grant date fair value estimated in accordance with SFAS 123 (R). Prior periods were not restated to reflect the impact of adopting the new standard.
For 2006, the Company recorded compensation expense related to stock options that reduced income before taxes by $382 thousand and net income by $237 thousand. Basic and diluted net income per share was reduced by $0.02 and $0.01, respectively for 2006.
The stock options granted to employees under the Company’s long-term incentive plans qualify as incentive stock options as defined by the Internal Revenue Code (IRC) Section 422 (b) and have not resulted in tax deductions to the Company. Stock options granted to directors of the Company under the long-term incentive plans qualify as nonqualified stock options under IRC 422 (b). As of December 31, 2006, the Company had not received tax deductions related to nonqualified stock options granted.
Net cash proceeds received from the exercise of options were $255 thousand for 2006.
The following table illustrates the effect on operating results and per share information had the Company accounted for stock-based compensation in accordance with SFAS 123 (R) for 2005 and 2004. For purposes of
74
FIRST SECURITY GROUP, INC. AND SUBSIDIARY
NOTES TO CONSOLIDATED FINANCIAL STATEMENTS—(Continued)
this pro forma disclosure, the value of the options is estimated using the Black-Scholes option pricing model and amortized to expense over the options’ vesting periods.
| | | | | | | | |
| | | 2005 | | | 2004 | |
| | | (in thousands, except per share amounts) | |
Net Income As Reported | | $ | 9,571 | | | $ | 4,267 | |
Compensation Expense, net of tax | | | (291 | ) | | | (299 | ) |
| | | | | | | | |
Pro forma Net Income | | $ | 9,280 | | | $ | 3,968 | |
| | | | | | | | |
Basic Net Income per Share | | | | | | | | |
As Reported | | $ | 0.65 | | | $ | 0.34 | |
Pro forma | | $ | 0.63 | | | $ | 0.31 | |
| | |
Diluted Net Income per Share | | | | | | | | |
As Reported | | $ | 0.64 | | | $ | 0.33 | |
Pro forma | | $ | 0.62 | | | $ | 0.31 | |
ESTIMATES AND UNCERTAINTIES—The preparation of financial statements in conformity with accounting principles generally accepted in the United States of America requires management to make estimates and assumptions that affect the reported amounts of assets and liabilities and disclosure of contingent assets and liabilities at the date of the financial statements and the reported amounts of revenues and expenses during the reporting period. Actual results could differ from those estimates.
PER SHARE DATA—Basic net income per share represents net income divided by the weighted average number of shares outstanding during the period. Diluted net income per share reflects additional shares that would have been outstanding if dilutive potential shares had been issued, as well as any adjustment to income that would result from the assumed issuance.
COMPREHENSIVE INCOME—Accounting principles generally require that recognized revenue, expenses, gains and losses be included in net income. Although certain changes in assets and liabilities, such as unrealized gains and losses on available for sale securities, are reported as a separate component of the equity section of the balance sheet, such items, along with net income, are components of comprehensive income. Reclassification adjustments relating to sales of securities available for sale for the years ended December 31, 2006, 2005 and 2004 were not significant.
SEGMENT REPORTING—Statement of Financial Accounting Standards No. 131,Disclosures about Segments of an Enterprise and Related Information, provides for the identification of reportable segments on the basis of discreet business units and their financial information to the extent such units are reviewed by an entity’s chief decision maker (which can be an individual or group of management persons). The statement permits aggregation or combination of segments that have similar characteristics. The operations of First Security Group, Inc. and the Bank have similar economic characteristics and are similar in each of the following areas: the nature of products and services, the nature of production processes, the type of customers, the methods of distribution, and the nature of their regulatory environment. Accordingly, the Company’s consolidated financial statements reflect the presentation of segment information on an aggregated basis in one reportable segment.
DERIVATIVE INSTRUMENTS AND HEDGING ACTIVITIES—The Company currently does not have any derivative instruments that require fair value measurement under generally accepted accounting principles.
RECLASSIFICATIONS—Certain reclassifications have been made to the prior years’ financial statements to conform to the current year presentation.
75
FIRST SECURITY GROUP, INC. AND SUBSIDIARY
NOTES TO CONSOLIDATED FINANCIAL STATEMENTS—(Continued)
RECENT ACCOUNTING PRONOUNCEMENTS—In September 2006, the FASB issued Statement of Financial Accounting Standards No. 157,Fair Value Measurement(FAS 157) to clarify how to measure fair value and to expand disclosures about fair value measurements. The expanded disclosures include the extent to which companies measure assets and liabilities at fair value, the information used to measure fair value, and the effect of fair value on earnings and is applicable whenever other standards require (or permit) assets and liabilities to be measured at fair value. FAS 157 is effective for financial statements issued for fiscal years beginning after November 15, 2007 and interim periods within those fiscal years. The Company believes this Statement will not have a material impact on the Company’s consolidated financial statements.
In July 2006, the FASB issued FASB Interpretation No. 48,Accounting for Uncertainty in Income Taxes, an interpretation of FASB Statement No. 109, Accounting for Income Taxes (FIN 48). The Interpretation provides guidance for recognition and measurement of uncertain tax positions that are “more likely than not” of being sustained upon audit, based on the technical merits of the position. FIN 48 also provides guidance on measurement, derecognition, classification, interest and penalties, accounting in interim periods, disclosure and transition. The effective date is for fiscal years beginning after December 15, 2006. The Company believes this Interpretation will not have a material impact on the Company’s consolidated financial statements.
In December 2005, the FASB issued FASB Staff Position (FSP) SOP 94-6-1,Terms of Loan Products That May Give Rise to a Concentration of Credit Risk. This FSP was issued in response to inquiries from constituents and discussions with the SEC staff and regulators of financial institutions to address the circumstances in which the terms of loan products give rise to a concentration of credit risk as that term is used in SFAS No. 107,Disclosures about Fair Value of Financial Instruments, and what disclosures apply to entities who deal with loan products whose terms may give rise to a concentration of credit risk. An entity shall provide the disclosures required by SFAS No. 107 for either an individual loan product type or a group of loan products with similar features that are determined to represent a concentration of credit risk in accordance with the guidance of SOP 94-6-1 for all periods presented in financial statements. This SOP is effective for interim and annual periods ending after December 19, 2005. The adoption of FSP SOP 94-6-1 did not have a material impact on the Company’s consolidated financial statements.
In November 2005, the FASB issued an FSP on FAS No. 115-1 and FAS No. 124-1 (“the FSP”),The Meaning of Other-Than-Temporary Impairment and Its Application to Certain Investments, which addresses the determination of when an investment is considered impaired; whether the impairment is other-than-temporary; and how to measure an impairment loss. The FSP also addresses accounting considerations subsequent to the recognition of an other-than-temporary impairment on a debt security, and requires certain disclosures about unrealized losses that have not been recognized as other-than-temporary impairments. The FSP replaces the impairment guidance on Emerging Issues Task Force (EITF) Issue No. 03-1 with references to existing authoritative literature concerning other-than-temporary determinations. Under the FSP, losses arising from impairment deemed to be other-than-temporary, must be recognized in earnings at an amount equal to the entire difference between the security’s cost and its fair value at the financial statement date, without considering partial recoveries subsequent to that date. The FSP also required that an investor recognize an other-than-temporary impairment loss when a decision to sell a security has been made and the investor does not expect the fair value of the security to fully recover prior to the expected time of sale. The FSP is effective for reporting periods beginning after December 15, 2005. The initial adoption of this statement did not have a material impact on the Company’s consolidated financial statements.
In May 2005, the FASB issued Statement of Financial Accounting Standards No. 154 (SFAS No. 154),Accounting Changes and Error Corrections—a replacement of APB Opinion No. 20 and FASB Statement No. 3, which eliminates the requirement to reflect changes in accounting principles as cumulative adjustments to net
76
FIRST SECURITY GROUP, INC. AND SUBSIDIARY
NOTES TO CONSOLIDATED FINANCIAL STATEMENTS—(Continued)
income in the period of the change and requires retrospective application to prior periods’ financial statements for voluntary changes in accounting principle, unless it is impracticable to determine either the period-specific effects or the cumulative effect of the change. If it is impracticable to determine the cumulative effect of the change to all prior periods, SFAS No. 154 requires that the new accounting principle be adopted prospectively. For new accounting pronouncements, the transition guidance in the pronouncement should be followed. Retrospective application refers to the application of a different accounting principle to previously issued financial statements as if that principle had always been used.
SFAS 154 did not change the guidance for reporting corrections of errors, changes in estimates or for justification of a change in accounting principle on the basis of preferability. SFAS No. 154 is effective for accounting changes made in fiscal years beginning after December 15, 2005. The adoption of SFAS No. 154 did not have a significant impact on the Company’s consolidated financial statements.
In December 2004, the Financial Accounting Standards Board issued SFAS No. 123R,Share-Based Payment, (SFAS No. 123R). This Statement is a revision of FASB Statement No. 123,Accounting for Stock-Based Compensation, and supersedes APB Opinion No. 25,Accounting for Stock Issued to Employees, and its related implementation guidance. Under APB No. 25, issuing stock options to employees generally resulted in recognition of no compensation cost. SFAS No. 123R requires entities to recognize the cost of employee services received in exchange for awards of equity instruments based on the grant-date fair value of those awards. The cost will be recognized over the period during which an employee is required to provide service in exchange for the award—the requisite service period which is usually the vesting period. No compensation cost is recognized for equity instruments for which employees do not render the requisite service. The grant-date fair value of employee share options and similar instruments will be estimated using option-pricing models adjusted for the unique characteristics of those instruments. If an equity award is modified after the grant date, incremental compensation cost will be recognized in an amount equal to the excess of the fair value of the modified award over the fair value of the original award immediately before the modification. For public entities that do not file as small business issuers, SFAS No. 123R is effective as of the beginning of the first annual reporting period that begins after June 15, 2005. The adoption of SFAS No. 123R resulted in compensation expense recorded to the Company’s financial statements.
In December 2003, the American Institute of Certified Public Accountants issued Statement of Position 03-3, (SOP 03-3)Accounting for Certain Loans and Debt Securities Acquired in a Transfer. SOP 03-3 addresses accounting for differences between contractual cash flows expected to be collected and an investor’s initial investment in loans or debt securities acquired in a transfer if those differences are attributable, at least in part, to credit quality. It includes loans and debt securities acquired in purchase business combinations. SOP 03-3 limits the yield that may be accreted (accretable yield) to the excess of the investor’s estimate of undiscounted expected principal, interest and other cash flows (cash flows expected at acquisition to be collected) over the investor’s initial investment in the loan. SOP 03-3 requires that the excess of contractual cash flows over cash flows to be collected (nonaccretable difference) not be recognized as an adjustment of yield, loss accrual or valuation allowance. SOP 03-3 prohibits investors from displaying accretable yield and nonaccretable difference on the balance sheet. Subsequent increases in cash flows expected to be collected generally should be recognized prospectively through adjustment of the loan’s yield over its remaining life. Decreases in cash flows expected to be collected should be recognized as an impairment. SOP 03-3 prohibits “carrying over” or creation of valuation allowances in the initial accounting of all loans acquired in a transfer that are within the scope of SOP 03-3. The prohibition of the valuation allowance carryover applies to the purchase of an individual loan, a pool of loans, a group of loans, and loans acquired in a purchase business combination. SOP 03-3 is effective for loans acquired in fiscal years beginning after December 15, 2004. The Company’s adoption of SOP 03-3 has not had a material impact on its financial condition or results of operations.
77
FIRST SECURITY GROUP, INC. AND SUBSIDIARY
NOTES TO CONSOLIDATED FINANCIAL STATEMENTS—(Continued)
NOTE 2—BUSINESS COMBINATIONS
On August 31, 2005, pursuant to an Agreement and Plan of Share Exchange entered into on May 12, 2005, with Jackson Bank & Trust (Jackson Bank), the Company completed its acquisition of 100% of the outstanding shares of common stock of Jackson Bank for $92.39 per share. Subsequent to the Share Exchange, Jackson Bank, including its five branches, was merged into the Bank, with the Bank surviving the transaction. The acquisition was funded through the public offering of the Company’s common stock on August 10, 2005. The acquisition of Jackson Bank, which was formerly headquartered in Gainesboro, Tennessee, has enabled the Company to extend its franchise along the Interstate 40 corridor, toward Nashville, Tennessee and provides five additional branches within that market.
The purchase price of the acquisition was $33,277 thousand, excluding acquisition costs of $308 thousand, such as legal and accounting fees. The transaction resulted in $14,725 thousand of goodwill and $3,240 thousand of core deposit intangible. The amount allocated to the core deposit intangible was determined by an independent valuation and is being amortized over the estimated useful life of ten years using an accelerated basis reflecting the pattern of the expected run off of the related deposits. The fair value of loans and deposits acquired was also determined by an independent valuation, which will result in net accretion of $1,574 thousand over the actual term of the related loans and deposits or approximately 7 years and 5 years, respectively. The results of operations for Jackson Bank are included in the consolidated financial statements beginning September 1, 2005.
The following table summarizes the estimated fair values of the assets acquired and liabilities assumed at the date of the acquisition.
| | | | |
| | | (in thousands) | |
Cash and Due from Banks | | $ | 3,644 | |
Federal Funds Sold | | | 7,055 | |
| | | | |
Cash and Cash Equivalents | | | 10,699 | |
| | | | |
Securities Available for Sale | | | 42,278 | |
| | | | |
Loans | | | 104,307 | |
Less: Allowance for Loan Losses | | | 1,261 | |
| | | | |
Net Loans | | | 103,046 | |
| | | | |
Premises and Equipment, net | | | 5,159 | |
| | | | |
Core Deposit Intangible | | | 3,240 | |
| | | | |
Goodwill (Nondeductible) | | | 14,725 | |
| | | | |
Other Assets | | | 7,454 | |
| | | | |
Total Assets Acquired | | | 186,601 | |
| | | | |
Deposits | | | (140,222 | ) |
FHLB Advance | | | (11,011 | ) |
Other Liabilities | | | (1,783 | ) |
| | | | |
Total Liabilities Assumed | | | (153,016 | ) |
| | | | |
Net Assets Acquired | | $ | 33,585 | |
| | | | |
Effective October 1, 2004, the Company acquired 100% of the outstanding common shares of Kenesaw Leasing, Inc. and J&S Leasing, Inc. Both leasing companies were wholly owned subsidiaries of National Bank of
78
FIRST SECURITY GROUP, INC. AND SUBSIDIARY
NOTES TO CONSOLIDATED FINANCIAL STATEMENTS—(Continued)
Commerce (NBC). These companies are located in the Company’s immediate market area of Knoxville, Tennessee and were acquired to diversify its loan portfolio and enhance its revenue.
The purchase price of the acquisition was $13,000 thousand, with $205 thousand in acquisition costs, such as legal and accounting fees. The acquisition resulted in the recognition of an extraordinary gain, net of tax, of $2,960 thousand. Based on the preliminary purchase price allocation the Company recognized an extraordinary gain, net of tax, of $785 thousand in 2004. In the third quarter of 2005, the Company made a purchase accounting adjustment to eliminate certain tax liabilities which were negotiated as part of the purchase price, when it became increasingly evident after ongoing discussions with the seller and the preparation of the Company’s respective tax returns for 2004, that the obligation for payment of these tax liabilities was remote. The elimination of these tax liabilities resulted in the recognition of an extraordinary gain, net of tax, of $2,175 thousand in 2005.
The Company allocated the purchase price to the assets acquired and liabilities assumed based on their estimated fair values at the date of the acquisition as indicated below. The sum of the amounts assigned to assets acquired and liabilities assumed resulted in excess fair value of the net assets over the cost of the acquired entities. The excess was recognized as an extraordinary gain as the assets acquired by the Company consisted of financial assets and other current assets meeting the exception criteria of SFAS No. 141. The results of operations for Kenesaw Leasing and J&S Leasing are included in the consolidated financial statements beginning October 1, 2004.
The following table summarizes the estimated fair values of the assets acquired and liabilities assumed at the date of the acquisition.
| | | | |
| | | (in thousands) | |
Cash and Due from Banks | | $ | 473 | |
| | | | |
Leases | | | 60,579 | |
Less: Allowance for Lease Losses | | | 2,011 | |
| | | | |
Net Leases | | | 58,568 | |
| | | | |
Premises and Equipment, net | | | 76 | |
| | | | |
Other Assets | | | 4,039 | |
| | | | |
Total Assets Acquired | | | 63,156 | |
| | | | |
Line of Credit—NBC | | | (41,724 | ) |
Other Liabilities | | | (3,659 | ) |
| | | | |
Total Liabilities Assumed | | | (45,383 | ) |
| | | | |
Net Assets Acquired | | $ | 17,773 | |
| | | | |
79
FIRST SECURITY GROUP, INC. AND SUBSIDIARY
NOTES TO CONSOLIDATED FINANCIAL STATEMENTS—(Continued)
The following table presents unaudited proforma results of operations as though the acquisition of the Jackson Bank was completed at the beginning of the years presented:
| | | | | | |
| | | For the Years Ended |
| | | 2005 | | 2004 |
| | | (in thousands, except
per share amounts) |
Interest Income | | $ | 62,635 | | $ | 46,484 |
Interest Expense | | | 17,855 | | | 11,435 |
| | | | | | |
Net Interest Income | | | 44,780 | | | 35,049 |
Provision for Loan Losses | | | 3,022 | | | 3,399 |
| | | | | | |
Net Interest Income After Provision for Loan Losses | | | 41,758 | | | 31,650 |
Noninterest Income | | | 10,013 | | | 8,187 |
Noninterest Expense | | | 40,296 | | | 32,783 |
| | | | | | |
Income Before Income Taxes | | | 11,475 | | | 7,054 |
Income Tax Provision | | | 3,610 | | | 1,952 |
| | | | | | |
Income Before Extraordinary Item | | | 7,865 | | | 5,102 |
Extraordinary Gain on Business Combination, net of income tax | | | 2,175 | | | 785 |
| | | | | | |
Net Income | | $ | 10,040 | | $ | 5,887 |
| | | | | | |
NET INCOME PER SHARE | | | | | | |
Net Income Per Share Before Extraordinary Item—Basic | | $ | 0.45 | | $ | 0.29 |
Extraordinary Item—Basic | | | 0.12 | | | 0.04 |
| | | | | | |
Net Income Per Share—Basic | | $ | 0.57 | | $ | 0.33 |
| | | | | | |
Net Income Per Share Before Extraordinary Item—Diluted | | $ | 0.44 | | $ | 0.29 |
Extraordinary Item—Diluted | | | 0.12 | | | 0.04 |
| | | | | | |
Net Income Per Share—Diluted | | $ | 0.56 | | $ | 0.33 |
| | | | | | |
80
FIRST SECURITY GROUP, INC. AND SUBSIDIARY
NOTES TO CONSOLIDATED FINANCIAL STATEMENTS—(Continued)
The following table presents unaudited proforma results of operations as though the acquisition of the leasing companies was completed at the beginning of the years presented:
| | | | | | |
| | | For the Years Ended |
| | | 2004 | | 2003 |
| | | (in thousands, except
per share amounts) |
Interest Income | | $ | 44,002 | | $ | 39,729 |
Interest Expense | | | 9,896 | | | 10,375 |
| | | | | | |
Net Interest Income | | | 34,106 | | | 29,354 |
Provision for Loan Losses | | | 3,755 | | | 2,816 |
| | | | | | |
Net Interest Income After Provision for Loan Losses | | | 30,351 | | | 26,538 |
Noninterest Income | | | 6,522 | | | 5,569 |
Noninterest Expense | | | 28,388 | | | 24,090 |
| | | | | | |
Income Before Income Taxes | | | 8,485 | | | 8,017 |
Income Tax Provision | | | 2,792 | | | 2,807 |
| | | | | | |
Income Before Extraordinary Item | | | 5,693 | | | 5,210 |
Extraordinary Gain on Business Combination, net of income tax | | | — | | | 2,960 |
| | | | | | |
Net Income | | $ | 5,693 | | $ | 8,170 |
| | | | | | |
NET INCOME PER SHARE | | | | | | |
Net Income Per Share Before Extraordinary Item—Basic | | $ | 0.45 | | $ | 0.43 |
Extraordinary Item—Basic | | | — | | | 0.24 |
| | | | | | |
Net Income Per Share—Basic | | $ | 0.45 | | $ | 0.67 |
| | | | | | |
Net Income Per Share Before Extraordinary Item—Diluted | | $ | 0.44 | | $ | 0.43 |
Extraordinary Item—Diluted | | | — | | | 0.24 |
| | | | | | |
Net Income Per Share—Diluted | | $ | 0.44 | | $ | 0.67 |
| | | | | | |
81
FIRST SECURITY GROUP, INC. AND SUBSIDIARY
NOTES TO CONSOLIDATED FINANCIAL STATEMENTS—(Continued)
NOTE 3—SECURITIES
The amortized cost and fair value of securities, with gross unrealized gains and losses, are as follows:
| | | | | | | | | | | | |
| | | Amortized
Cost | | Gross
Unrealized
Gains | | Gross
Unrealized
Losses | | Fair Value |
| | | (in thousands) |
Securities Available for Sale | | | | | | | | | | | | |
December 31, 2006 | | | | | | | | | | | | |
Debt Securities— | | | | | | | | | | | | |
Federal Agencies | | $ | 33,547 | | $ | 43 | | $ | 300 | | $ | 33,290 |
Mortgage-Backed | | | 75,716 | | | 104 | | | 1,165 | | | 74,655 |
Municipals | | | 45,115 | | | 185 | | | 188 | | | 45,112 |
Other | | | 702 | | | — | | | — | | | 702 |
| | | | | | | | | | | | |
| | $ | 155,080 | | $ | 332 | | $ | 1,653 | | $ | 153,759 |
| | | | | | | | | | | | |
Securities Available for Sale | | | | | | | | | | | | |
December 31, 2005 | | | | | | | | | | | | |
Debt Securities— | | | | | | | | | | | | |
Federal Agencies | | $ | 35,304 | | $ | 2 | | $ | 493 | | $ | 34,813 |
Mortgage-Backed | | | 80,267 | | | 27 | | | 1,524 | | | 78,770 |
Municipals | | | 41,814 | | | 57 | | | 461 | | | 41,410 |
Other | | | 1,000 | | | — | | | — | | | 1,000 |
| | | | | | | | | | | | |
| | $ | 158,385 | | $ | 86 | | $ | 2,478 | | $ | 155,993 |
| | | | | | | | | | | | |
At December 31, 2006 and 2005, federal agencies and mortgage-backed securities with a carrying value of $13,162 thousand and $15,741 thousand, respectively, were pledged to secure public deposits. At December 31, 2006 and 2005, the carrying amount of securities pledged to secure repurchase agreements was $26,224 thousand and $22,115 thousand, respectively.
The amortized cost and fair value of debt securities by contractual maturity at December 31, 2006, are as follows:
| | | | | | |
| | | Amortized
Cost | | Fair Value |
| | | (in thousands) |
Within 1 Year | | $ | 5,787 | | $ | 5,751 |
Over 1 Year through 5 Years | | | 31,950 | | | 31,663 |
5 Years to 10 Years | | | 27,320 | | | 27,363 |
Over 10 Years | | | 14,307 | | | 14,327 |
| | | | | | |
| | | 79,364 | | | 79,104 |
Mortgage-Backed Securities | | | 75,716 | | | 74,655 |
| | | | | | |
| | $ | 155,080 | | $ | 153,759 |
| | | | | | |
Proceeds from sales of securities available for sale totaled $9,791 thousand, $14,487 thousand and $8,513 thousand for the years ended December 31, 2006, 2005 and 2004. Gross realized gains and losses from sales of securities available for sale for the years ended December 31, 2006, 2005 and 2004 were not significant.
82
FIRST SECURITY GROUP, INC. AND SUBSIDIARY
NOTES TO CONSOLIDATED FINANCIAL STATEMENTS—(Continued)
The following table shows the gross unrealized losses and fair value of the Company’s investments with unrealized losses that are not deemed to be other-than-temporarily impaired, aggregated by investment category and length of time that individual securities have been in a continuous unrealized loss position, at December 31, 2006 and 2005.
| | | | | | | | | | | | | | | | | | |
| | | Less Than 12 Months | | 12 months or Greater | | Totals |
| | | Fair Value | | Unrealized
Losses | | Fair
Value | | Unrealized
Losses | | Fair Value | | Unrealized Losses |
| | | (in thousands) |
December 31, 2006 | | | | | | | | | | | | | | | | | | |
Federal Agencies | | $ | 2,456 | | $ | 25 | | $ | 20,842 | | $ | 275 | | $ | 23,298 | | $ | 300 |
Mortgage-Backed | | | 746 | | | 6 | | | 54,200 | | | 1,159 | | | 54,946 | | | 1,165 |
Municipals | | | 8,119 | | | 44 | | | 14,148 | | | 144 | | | 22,267 | | | 188 |
| | | | | | | | | | | | | | | | | | |
Totals | | $ | 11,321 | | $ | 75 | | $ | 89,190 | | $ | 1,578 | | $ | 100,511 | | $ | 1,653 |
| | | | | | | | | | | | | | | | | | |
December 31, 2005 | | | | | | | | | | | | | | | | | | |
Federal Agencies | | $ | 26,935 | | $ | 381 | | $ | 4,869 | | $ | 126 | | $ | 31,804 | | $ | 507 |
Mortgage-Backed | | | 45,225 | | | 566 | | | 29,734 | | | 953 | | | 74,959 | | | 1,519 |
Municipals | | | 29,166 | | | 341 | | | 2,897 | | | 111 | | | 32,063 | | | 452 |
| | | | | | | | | | | | | | | | | | |
Totals | | $ | 101,326 | | $ | 1,288 | | $ | 37,500 | | $ | 1,190 | | $ | 138,826 | | $ | 2,478 |
| | | | | | | | | | | | | | | | | | |
The unrealized losses on the Company’s investments were caused by interest rate increases and were not the result of changes in credit quality. The contractual terms of these investments do not permit the issuer to settle the securities at a price less than the amortized costs of the investments. Because the Company has the ability and intent to hold these investments until a recovery of fair value, which may be maturity, the Company does not consider these investments to be other-than-temporarily impaired at December 31, 2006 and 2005.
NOTE 4—LOANS AND ALLOWANCE FOR LOAN LOSSES
Loans by type are summarized as follows:
| | | | | | | | |
| | | 2006 | | | 2005 | |
| | | (in thousands) | |
Loans Secured by Real Estate— | | | | | | | | |
Residential 1-4 Family | | $ | 246,005 | | | $ | 220,760 | |
Commercial | | | 163,836 | | | | 148,771 | |
Construction | | | 173,652 | | | | 117,352 | |
Other | | | 20,544 | | | | 21,595 | |
| | | | | | | | |
| | | 604,037 | | | | 508,478 | |
Commercial Loans | | | 121,385 | | | | 108,974 | |
Consumer Installment Loans | | | 67,858 | | | | 64,694 | |
Leases, Net of Unearned Income | | | 52,039 | | | | 63,205 | |
Other | | | 2,274 | | | | 3,308 | |
| | | | | | | | |
Total Loans | | | 847,593 | | | | 748,659 | |
Allowance for Loan Losses | | | (9,970 | ) | | | (10,121 | ) |
| | | | | | | | |
Net Loans | | $ | 837,623 | | | $ | 738,538 | |
| | | | | | | | |
83
FIRST SECURITY GROUP, INC. AND SUBSIDIARY
NOTES TO CONSOLIDATED FINANCIAL STATEMENTS—(Continued)
The loan portfolio includes lease financing receivables consisting of direct financing leases on equipment. The components of the investment in lease financing were as follows:
| | | | | | | | |
| | | 2006 | | | 2005 | |
| | | (in thousands) | |
Lease Payments Receivable | | $ | 58,479 | | | $ | 71,322 | |
Estimated Residual Value of Leased Assets | | | 3,072 | | | | 3,457 | |
| | | | | | | | |
Gross Investment | | | 61,551 | | | | 74,779 | |
Unearned Income | | | (9,512 | ) | | | (11,574 | ) |
| | | | | | | | |
Net Investment | | $ | 52,039 | | | $ | 63,205 | |
| | | | | | | | |
At December 31, 2006, the minimum future lease payments to be received were as follows:
| | | |
Year | | (in thousands) |
2007 | | $ | 25,427 |
2008 | | | 17,477 |
2009 | | | 9,751 |
2010 | | | 4,329 |
2011 and After | | | 1,495 |
The following table presents an analysis of the allowance for loan losses. The provision for loan losses of $2,064 thousand in the table does not include our provision accrual for unfunded commitments of $120 thousand as of December 31, 2006. The reserve for unfunded commitments is included in other liabilities in the consolidated balance sheets.
| | | | | | | | | | | | |
| | | 2006 | | | 2005 | | | 2004 | |
| | | (in thousands) | |
Allowance for Loan Losses—beginning of year | | $ | 10,121 | | | $ | 8,312 | | | $ | 5,827 | |
Additions due to Business Combinations | | | — | | | | 1,261 | | | | 2,011 | |
Provision Expense for Loan Losses | | | 2,064 | | | | 2,922 | | | | 3,399 | |
Loans Charged Off | | | (2,721 | ) | | | (2,878 | ) | | | (3,427 | ) |
Loan Loss Recoveries | | | 506 | | | | 504 | | | | 502 | |
| | | | | | | | | | | | |
Allowance for Loan Losses—end of year | | $ | 9,970 | | | $ | 10,121 | | | $ | 8,312 | |
| | | | | | | | | | | | |
Impaired loans, which are recognized in conformity with FASB Statement No. 114 as amended by FASB No. 118, as well as nonaccrual loans and loans past due 90 days or more and still accruing interest as of December 31, 2006 and 2005, were not significant. The Company had no significant outstanding commitments to lend additional funds to customers whose loans have been placed on nonaccrual status.
Because of uncertainties inherent in the estimation process, management’s estimate of credit losses in the loan portfolio and the related allowance may change in the near term. However, the amount of the change that is reasonably possible cannot be estimated.
At December 31, 2006, the Company had $323,008 thousand of loans pledged to secure borrowings from the Federal Home Loan Bank. The loans pledged included commercial real estate loans and residential first mortgage loans.
84
FIRST SECURITY GROUP, INC. AND SUBSIDIARY
NOTES TO CONSOLIDATED FINANCIAL STATEMENTS—(Continued)
The Company has entered into transactions with certain directors, executive officers and significant shareholders and their affiliates. Such transactions were made in the ordinary course of business on substantially the same terms and conditions, including interest rates and collateral, as those prevailing at the same time for comparable transactions with other customers, and did not, in the opinion of management, involve more than normal credit risk or present other unfavorable features. The aggregate amount of loans to such related parties at December 31, 2006 and 2005 was $3,641 thousand and $94 thousand, respectively. New loans made to such related parties amounted to $3,873 thousand and payments amounted to $422 thousand for 2006. New loans made to such related parties amounted to $160 thousand and payments amounted to $419 thousand for 2005. At December 31, 2006, unused lines of credit to these related parties totaled $79 thousand.
NOTE 5—PREMISES AND EQUIPMENT
Premises and equipment consist of the following:
| | | | | | | | |
| | | 2006 | | | 2005 | |
| | | (in thousands) | |
Land | | $ | 8,966 | | | $ | 8,898 | |
Buildings and Improvements | | | 24,403 | | | | 20,028 | |
Equipment | | | 13,761 | | | | 11,605 | |
| | | | | | | | |
| | | 47,130 | | | | 40,531 | |
Accumulated Depreciation | | | (11,295 | ) | | | (8,927 | ) |
| | | | | | | | |
| | $ | 35,835 | | | $ | 31,604 | |
| | | | | | | | |
The amount charged to operating expenses for depreciation was $2,489 thousand for 2006, $2,075 thousand for 2005 and $1,710 thousand for 2004.
NOTE 6—GOODWILL AND OTHER INTANGIBLE ASSETS
The changes in the carrying amounts of goodwill are as follows:
| | | | | | |
| | | 2006 | | 2005 |
| | | (in thousands) |
Balance—beginning of year | | $ | 27,032 | | $ | 12,430 |
Goodwill Acquired | | | — | | | 14,602 |
Purchase Accounting Adjustment to Previously Reported Goodwill | | | 124 | | | ��� |
| | | | | | |
Balance—end of year | | $ | 27,156 | | $ | 27,032 |
| | | | | | |
The Company has other intangible assets in the form of core deposit intangibles, license fee agreements related to operating Latino branches and a non-compete agreement associated with the acquisition of Jackson Bank. The core deposit intangibles are amortized on an accelerated basis over their estimated useful lives of 10 years. The license fee and non-compete agreement are being amortized on a straight-line basis over their estimated useful lives of 5 years and 3 years respectively. A summary of other intangible assets is as follows:
| | | | | | |
| | | 2006 | | 2005 |
| | | (in thousands) |
Gross Carrying Amount | | $ | 8,066 | | $ | 8,066 |
Less: Accumulated Amortization and Impairment of License Fee | | | 3,881 | | | 2,635 |
| | | | | | |
Balance—end of year | | $ | 4,185 | | $ | 5,431 |
| | | | | | |
85
FIRST SECURITY GROUP, INC. AND SUBSIDIARY
NOTES TO CONSOLIDATED FINANCIAL STATEMENTS—(Continued)
The gross carrying amount and accumulated amortization (which includes the impact of the impairment on the license fee) for core deposit intangibles, license fees and non-compete agreement were $7,041 thousand and $3,275 thousand, $500 thousand and $358 thousand and $525 thousand and $248 thousand, respectively at December 31, 2006. The gross carrying amount and accumulated amortization for core deposit intangibles, license fees and non-compete agreement were $7,041 thousand and $2,254 thousand, $500 thousand and $308 thousand and $525 thousand and $73 thousand, respectively at December 31, 2005.
Amortization expense on other intangible assets was $1,246 thousand in 2006, $929 thousand in 2005 and $797 thousand in 2004. Amortization expense related to all other intangible assets for the years 2007 through 2011 is estimated to be approximately $3,203 thousand.
NOTE 7—DEPOSITS
The aggregate amount of time deposits of $100 thousand or more was $292,320 thousand and $245,403 thousand at December 31, 2006 and 2005, respectively.
Scheduled maturities of certificates of deposit as of December 31, 2006, are as follows:
| | | |
| | | (in thousands) |
2007 | | $ | 453,651 |
2008 | | | 68,844 |
2009 | | | 16,380 |
2010 | | | 7,894 |
2011 and thereafter | | | 4,007 |
| | | |
| | $ | 550,776 |
| | | |
NOTE 8—SECURITIES SOLD UNDER AGREEMENTS TO REPURCHASE
Securities sold under agreements to repurchase represent the purchase of interests in securities by commercial checking customers which are repurchased by the Company on the following business day. At December 31, 2006 and 2005, the Company had securities sold under agreements to repurchase of $20,851 thousand and $16,894 thousand, respectively. Securities sold under agreements to repurchase are held in safekeeping for the Company and had a carrying value of approximately $26,224 thousand and $22,115 thousand at December 31, 2006 and 2005, respectively. These agreements averaged $19,290 thousand and $15,896 thousand during 2006 and 2005, respectively. The maximum amounts outstanding at any month end during 2006 and 2005 were $24,923 thousand and $18,797 thousand, respectively. Interest expense on repurchase agreements totaled $395 thousand, $137 thousand and $88 thousand for the years ended 2006, 2005 and 2004, respectively.
NOTE 9—OTHER BORROWINGS
Other borrowings at December 31, 2006, consist of long-term fixed rate advances from the Federal Home Loan Bank of Cincinnati (FHLB), totaling $8,009 thousand, an overnight advance of $16,700 thousand from FHLB and a mortgage note totaling $129 thousand. Additionally, the Company had an FHLB letter of credit totaling $5,000 thousand which reduces the FHLB borrowing capacity. The letter of credit was not in use as of December 31, 2006. Other borrowings at December 31, 2005, consist of long-term, fixed and variable rate advances from the Federal Home Loan Bank of Cincinnati, totaling $10,011 thousand and a mortgage note totaling $139 thousand. The mortgage note has a fixed interest rate of 7.5% and has a final payment date of December 2014.
86
FIRST SECURITY GROUP, INC. AND SUBSIDIARY
NOTES TO CONSOLIDATED FINANCIAL STATEMENTS—(Continued)
Pursuant to the blanket agreement for advances and security agreements with FHLB, advances are secured by the Company’s unencumbered qualifying 1-4 family first mortgage loans and qualifying commercial real estate loans equal to at least 135% and 300%, respectively, of outstanding advances. Advances are also secured by FHLB stock owned by the Company. As of December 31, 2006 and 2005, the Company had loans totaling $323,008 thousand and $271,020 thousand, respectively, pledged as collateral at FHLB. At December 31, 2006, our remaining available borrowing capacity with FHLB was approximately $64,171 thousand.
As a member of FHLB, the Company must own FHLB stock equal to the greater of $500 or 1% of mortgage assets. Also, the Company may be required to own additional FHLB stock to ensure their stock balance is equal to or greater than 5% of outstanding advances. At December 31, 2006 and 2005, the Company owned FHLB stock totaling $3,394 thousand and $3,204 thousand, respectively.
At December 31, 2006, the Company had lines of credit to purchase federal funds totaling $99,500 thousand with correspondent banks for short-term liquidity needs, of which approximately $99,500 thousand was available. The terms of each line of credit varies with respect to borrowing capacity and the duration of time for which the borrowing can be outstanding.
The maturity and weighted average interest rates of FHLB advances as of December 31, 2006 are as follows:
| | | | | | |
| | | Amount | | Rate | |
| | | (in thousands) | |
2007 | | $ | 19,366 | | 4.9 | % |
2008 | | | 2,667 | | 3.3 | % |
2009 | | | 2,667 | | 4.1 | % |
2010 | | | — | | — | |
2011 | | | 9 | | 7.3 | % |
Thereafter | | | — | | — | |
| | | | | | |
| | $ | 24,709 | | | |
| | | | | | |
NOTE 10—COMMON STOCK DATA
The basic and diluted net income per share calculations are as follows:
| | | | | | | | | |
| | | 2006 | | 2005 | | 2004 |
| | | (in thousands, except per share amounts) |
Numerator: | | | | | | | | | |
Net Income for Calculating Diluted Net Income per Share | | $ | 11,112 | | $ | 9,571 | | $ | 4,267 |
| | | | | | | | | |
Denominator: | | | | | | | | | |
Weighted-Average Common Shares for Calculating Basic Net Income per Share | | | 17,315 | | | 14,618 | | | 12,705 |
Effect of Dilutive Securities: | | | | | | | | | |
Stock Options and Restricted Stock Awards (as determined by application of the treasury stock method) | | | 365 | | | 292 | | | 207 |
| | | | | | | | | |
Weighted-Average Common Shares for Calculating Diluted Net Income per Share | | | 17,680 | | | 14,910 | | | 12,912 |
| | | | | | | | | |
Basic Net Income per Share | | $ | 0.64 | | $ | 0.65 | | $ | 0.34 |
Diluted Net Income per Share | | $ | 0.63 | | $ | 0.64 | | $ | 0.33 |
87
FIRST SECURITY GROUP, INC. AND SUBSIDIARY
NOTES TO CONSOLIDATED FINANCIAL STATEMENTS—(Continued)
Options to purchase 547 thousand, 220 thousand and 163 thousand shares of common stock were outstanding during 2006, 2005 and 2004, respectively, but were not included in the computation of diluted earnings per share because the options were anti-dilutive under the treasury method. The adoption of SFAS 123(R) increased the gross proceeds by incorporating the unamortized compensation in the calculation of the treasury stock method for 2006. Under SFAS 123(R), options with an exercise price less than the average price can be anti-dilutive due to the inclusion of unamortized compensation. The anti-dilutive options expire in 2016 and 2015. Of the options, 521 thousand, 220 thousand and 160 thousand options to purchase were still outstanding at December 31, 2006, 2005 and 2004, respectively.
On December 7, 2004, the Company’s board of directors approved a 12-for-10 stock split to be distributed on December 22, 2004, to shareholders of record on December 10, 2004. As a result of the split, the par value was adjusted for accounting purposes from $0.0083 to $0.0069 per share; however, the par value was rounded to $0.01 per share for presentation purposes. All share data has been retroactively adjusted for the 12-for-10 stock split.
NOTE 11—LEASES
The Company leases bank branches and the corporate office and equipment under operating lease agreements. Minimum lease commitments with remaining noncancelable lease terms in excess of one year as of December 31, 2006, are as follows:
| | | |
| | | (in thousands) |
Year Ending | | | |
December 31, 2007 | | $ | 1,015 |
December 31, 2008 | | | 952 |
December 31, 2009 | | | 963 |
December 31, 2010 | | | 822 |
December 31, 2011 | | | 594 |
Thereafter | | | 1,808 |
| | | |
| | $ | 6,154 |
| | | |
Rent expense totaled $1,178 thousand, $1,146 thousand and $768 thousand for the years ended 2006, 2005 and 2004, respectively.
NOTE 12—INCOME TAXES
The income tax provision consists of the following:
| | | | | | | | | |
| | | For the Years Ended |
| | | 2006 | | 2005 | | 2004 |
| | | (in thousands) |
Current Provision | | $ | 4,610 | | $ | 3,321 | | $ | 1,229 |
Deferred Provision | | | 676 | | | 276 | | | 136 |
| | | | | | | | | |
Income Tax Provision | | | 5,286 | | | 3,597 | | | 1,365 |
Income Tax Effect on Extraordinary Item | | | — | | | 1,332 | | | 481 |
| | | | | | | | | |
| | $ | 5,286 | | $ | 4,929 | | $ | 1,846 |
| | | | | | | | | |
88
FIRST SECURITY GROUP, INC. AND SUBSIDIARY
NOTES TO CONSOLIDATED FINANCIAL STATEMENTS—(Continued)
Reconciliation of the income tax provision to statutory rates is as follows:
| | | | | | | | | | | | |
| | | For the Years Ended | |
| | | 2006 | | | 2005 | | | 2004 | |
| | | (in thousands) | |
Federal Taxes at Statutory Tax Rate | | $ | 5,639 | | | $ | 3,748 | | | $ | 1,648 | |
Tax Exempt Earnings on Securities | | | (543 | ) | | | (405 | ) | | | (297 | ) |
Tax Exempt Earnings on Bank Owned Life Insurance | | | (300 | ) | | | (186 | ) | | | (6 | ) |
Other, net | | | 56 | | | | 2 | | | | (113 | ) |
State Taxes, net of federal effect | | | 434 | | | | 438 | | | | 133 | |
| | | | | | | | | | | | |
Income Tax Provision | | $ | 5,286 | | | $ | 3,597 | | | $ | 1,365 | |
| | | | | | | | | | | | |
The components of the net deferred tax asset and liability included in other assets and liabilities consist of the following:
| | | | | | | | |
| | | 2006 | | | 2005 | |
| | | (in thousands) | |
Deferred Tax Assets | | | | | | | | |
Allowance for Loan Losses | | $ | 3,687 | | | $ | 3,547 | |
Securities Available for Sale | | | 449 | | | | 813 | |
Deferred Loan Fees | | | 187 | | | | 158 | |
Acquisition Fair Value Adjustments | | | 469 | | | | 792 | |
Salary Continuation | | | 275 | | | | 119 | |
Other Assets | | | 205 | | | | 198 | |
Other Intangible Assets | | | 186 | | | | 131 | |
| | | | | | | | |
| | | 5,458 | | | | 5,758 | |
| | | | | | | | |
Deferred Tax Liabilities | | | | | | | | |
Gain on Business Combination | | | 352 | | | | 709 | |
Premises and Equipment | | | 1,965 | | | | 2,603 | |
Goodwill and Core Deposit Intangibles | | | 1,522 | | | | 1,663 | |
FHLB and Banker’s Bank Stock | | | 415 | | | | 327 | |
Leasing Activities | | | 1,691 | | | | 1,004 | |
Other | | | 161 | | | | 412 | |
| | | | | | | | |
| | | 6,106 | | | | 6,718 | |
| | | | | | | | |
Net Deferred Tax Liability | | $ | (648 | ) | | $ | (960 | ) |
| | | | | | | | |
NOTE 13—401(k) AND EMPLOYEE STOCK OWNERSHIP PLAN
The Company has a 401(k) and employee stock ownership plan (the Plan) covering employees meeting certain age and service requirements. Employees may contribute up to 75% of their compensation subject to certain limits based on federal tax laws. During 2006, the Plan was amended with an effective date of January 1, 2007. With the amendment, the Company makes matching contributions equal to 100% of the employee’s contribution up to 6% of the employee’s compensation. The employer contribution is made in the form of Company common stock on a quarterly basis. The employee and employer contributions and earnings thereon are vested immediately. All prior employer contributions are 100% vested as of January 1, 2007. In its sole discretion at the end of the Plan year, the Company may make supplemental matching contributions or profit sharing contributions.
89
FIRST SECURITY GROUP, INC. AND SUBSIDIARY
NOTES TO CONSOLIDATED FINANCIAL STATEMENTS—(Continued)
For Plan years prior to January 1, 2007, the Company made matching contributions equal to 25% of the employee’s contribution up to 6% of the employee’s compensation for the Plan year. In its sole discretion at the end of the Plan year, the Company may have made supplemental matching contributions or profit sharing contributions. Participants were vested immediately in their contributions plus actual earnings thereon. A participant was fully vested in employer contributions upon reaching age 65, upon death, or upon permanent disability. Termination of employment before any of the above occurs activates the following vesting schedule for employer contributions:
| | | | | | |
Full Years Of Employment | | 2007 Vested
Schedule | | | 2006 Vested
Schedule | |
Less than 1 | | 100 | % | | 0 | % |
1 | | 100 | % | | 33 | % |
2 | | 100 | % | | 66 | % |
3 or more | | 100 | % | | 100 | % |
During 2005, the Plan was amended to modify the eligibility and service crediting rules to allow certain employees of Jackson Bank to participate in the Plan effective September 1, 2005 and to receive service credit for their period of employment with Jackson Bank prior to September 1, 2005.
The Company recognized $678 thousand, $511 thousand and $432 thousand in expense under the Plan for 2006, 2005 and 2004, respectively, which has been included in salaries and employee benefits in the accompanying consolidated statements of income.
The employee stock ownership (ESOP) portion of the Plan purchased shares of common stock with proceeds from advances of a loan from the Company. The loan between the Company and the Plan enables the Plan to borrow up to $5,750 thousand until December 31, 2006. The loan has a term of 15 years, bears interest at 6.25% and requires annual payments. The loan is secured by the stock purchased by the Plan that has not been allocated to participant accounts. The Company may make discretionary profit sharing contributions to the ESOP. The ESOP contribution will first be used to repay the loan. As the loan is repaid, shares are released from collateral based on the proportion of the payment in relation to total payments required to be made on the loan, and those shares are allocated to the ESOP accounts of participants on a quarterly or annual basis. Cash dividends on financed shares will first be used to repay the acquisition loan. Cash dividends on allocated shares are payable to the participants in cash or reinvested in Company stock not later than 90 days from the end of the Plan year.
Compensation expense is determined by multiplying the per share market price of the common stock by the number of shares to be released. The Company recognized compensation expense of $548 thousand in 2006 related to the 47,547 shares allocated from the ESOP as of December 31, 2006. The Company did not recognize compensation expense for 2005 as no shares were committed to be released during 2005. The number of unallocated, committed to be released, and allocated shares are as follows:
| | | | | | | |
| | | Unallocated
shares | | | Committed to
be released
shares | | Allocated
shares |
Shares as of December 31, 2005 | | 9,500 | | | — | | — |
Shares purchased by ESOP during 2006 | | 490,500 | | | — | | — |
Shares committed to be released during 2006 | | (47,547 | ) | | — | | 47,547 |
| | | | | | | |
Shares as of December 31, 2006 | | 452,453 | | | — | | 47,547 |
| | | | | | | |
90
FIRST SECURITY GROUP, INC. AND SUBSIDIARY
NOTES TO CONSOLIDATED FINANCIAL STATEMENTS—(Continued)
The cost of the shares not yet committed to be released from collateral is shown as a reduction of stockholders’ equity. Unallocated shares are not considered outstanding for earnings per share purposes. At December 31, 2006, the market value of the 452,453 unallocated shares outstanding totaled $5,217 thousand. At December 31, 2005, the market value of the 9,500 unallocated shares purchased totaled $93 thousand.
NOTE 14—LONG-TERM INCENTIVE PLAN
As of December 31, 2006, the Company has two stock-based compensation plans, the 2002 Long-Term Incentive Plan (2002 LTIP) and the 1999 Long-Term Incentive Plan (1999 LTIP). The plans are administered by the Compensation Committee of the Board of Directors (the Committee), which selects persons eligible to receive awards and determines the number of shares and/or options subject to each award, the terms, conditions and other provisions of the award. The plans are described in further detail below.
The 2002 Long-Term Incentive Plan was approved by the shareholders of the Company at the 2002 annual meeting and subsequently amended by the shareholders of the Company at the 2004 annual meeting to increase the number of shares available for issuance under the 2002 LTIP by 480 thousand shares. Eligible participants include eligible employees, officers, consultants and directors of the Company or any affiliate. Pursuant to the 2002 LTIP, the total number of shares of stock authorized for awards was 768 thousand, of which not more than 20% may be granted as awards of restricted stock. The exercise price per share of a stock option granted may not be less than the fair market value as of the grant date. The exercise price must be at least 110% of the fair market value at the grant date for options granted to individuals, who at grant date, are 10% owners of the Company’s voting stock (10% owner). Restricted stock may be awarded to participants with terms and conditions determined by the Committee. The term of each award is determined by the Committee, provided that the term of any incentive stock option may not exceed ten years (five years for 10% owners) from its grant date. Each option award vests in approximately equal percentages each year over a period of not less than three years from the date of grant as determined by the Committee subject to accelerated vesting under terms of the 2002 LTIP or as provided in any award agreement.
The Company’s 1999 Long-Term Incentive Plan (1999 LTIP) is limited to eligible employees. The total number of shares of stock authorized for awards was 936 thousand, of which not more than 10% could be granted as awards of restricted stock. Under the terms of the 1999 LTIP, incentive stock options to purchase shares of the Company’s common stock were granted at a price not less than the fair market value of the stock as of the date of the grant. Options were to be exercised within ten years from the date of grant subject to conditions specified by the plan. Restricted stock could also be awarded by the committee in accordance with the 1999 LTIP. Each award vested in approximately equal percentages each year over a period of not less than three years (with the exception of five grants for a total of 168 thousand shares which vest in approximately equal percentages at 6 months, 18 months and 30 months) and vest from the date of grant as determined by the committee subject to accelerated vesting under terms of the 1999 LTIP or as provided in any award agreement.
91
FIRST SECURITY GROUP, INC. AND SUBSIDIARY
NOTES TO CONSOLIDATED FINANCIAL STATEMENTS—(Continued)
Stock Options
The Company uses the Black-Scholes option pricing model to estimate fair value of stock-based awards, which uses the assumptions indicated in the table below. Expected volatility is based on the implied volatility of the Company’s stock price. The Company uses historical data to estimate option exercise and employee terminations used in the model. The expected term of options granted is derived using the “simplified” method as permitted under the provisions of the Securities and Exchange Commission’s Staff Accounting Bulletin No. 107 and represents the period of time options granted are expected to be outstanding. The risk-free rate for periods within the contractual life of the option is based on the U.S. Treasury yield curve in effect at the time of grant. The table below provides the assumptions used to determine the fair value of stock option grants during the years indicated.
| | | | | | | | | |
| | | 2006 | | | 2005 | | | 2004 | |
Dividend Yield | | 1.56 | % | | 1.03 | % | | 1.00 | % |
Average Risk-Free Interest Rate | | 4.70 | % | | 4.26 | % | | 3.98 | % |
Expected Life | | 6.5 years | | | 7 years | | | 7 years | |
Expected Volatility | | 18 | % | | 13 | % | | 13 | % |
The weighted average fair value of options granted during 2006, 2005 and 2004 was $2.82, $2.25 and $1.82, respectively. The total intrinsic value of options exercised during 2006, 2005, and 2004 was $152 thousand, $405 thousand, and $4 thousand, respectively. At December 31, 2006, there was $1,144 thousand unrecognized compensation expense related to share-based payments, which is expected to be recognized over a weighted average period of 2.5 years.
The following is a summary of the status of stock options as of December 31, 2006, 2005, and 2004, and changes during the years then ended:
| | | | | | | | | | | |
| | | Shares | | | Weighted-
Average
Exercise
Price | | Weighted-
Average
Remaining
Contractual Term | | Aggregate
Intrinsic
Value |
| | | (in thousands) | | | | | (in years) | | (in thousands) |
Outstanding—January 1, 2006 | | 1,164 | | | $ | 7.35 | | | | | |
Granted | | 281 | | | | 11.28 | | | | | |
Exercised | | (36 | ) | | | 7.14 | | | | | |
Forfeited | | (46 | ) | | | 8.83 | | | | | |
| | | | | | | | | | | |
Outstanding—December 31, 2006 | | 1,363 | | | $ | 8.12 | | 7.08 | | $ | 4,655 |
| | | | | | | | | | | |
Exercisable—December 31, 2006 | | 889 | | | $ | 6.88 | | 5.90 | | $ | 4,138 |
| | | | | | | | | | | |
Outstanding—January 1, 2005 | | 1,043 | | | $ | 6.66 | | | | | |
Granted | | 250 | | | | 9.55 | | | | | |
Exercised | | (107 | ) | | | 5.71 | | | | | |
Forfeited | | (22 | ) | | | 7.51 | | | | | |
| | | | | | | | | | | |
Outstanding—December 31, 2005 | | 1,164 | | | $ | 7.35 | | 7.31 | | $ | 2,782 |
| | | | | | | | | | | |
Exercisable—December 31, 2005 | | 707 | | | $ | 6.50 | | 6.12 | | $ | 2,291 |
| | | | | | | | | | | |
Outstanding—January 1, 2004 | | 896 | | | $ | 6.36 | | | | | |
Granted | | 163 | | | | 8.33 | | | | | |
Exercised | | (3 | ) | | | 6.94 | | | | | |
Forfeited | | (13 | ) | | | 7.02 | | | | | |
| | | | | | | | | | | |
Outstanding—December 31, 2004 | | 1,043 | | | $ | 6.66 | | 7.57 | | $ | 1,742 |
| | | | | | | | | | | |
Exercisable—December 31, 2004 | | 586 | | | $ | 6.05 | | 5.80 | | $ | 1,336 |
| | | | | | | | | | | |
92
FIRST SECURITY GROUP, INC. AND SUBSIDIARY
NOTES TO CONSOLIDATED FINANCIAL STATEMENTS—(Continued)
Restricted Stock
The plans described above allow for the issuance of restricted stock awards that may not be sold or otherwise transferred until certain restrictions have lapsed. The unearned stock-based compensation related to these awards is amortized to compensation expense over the period the restrictions lapse. The share-based expense for these awards was determined based on the market price of the Company’s stock at the grant date applied to the total number of shares that were anticipated to fully vest and then amortized over the vesting period.
The Company recognized $24 thousand and $84 thousand in 2006 and 2005, respectively, net of forfeitures related to restricted stock. No restricted shares were granted prior to 2005. As of December 31, 2006, unearned stock-based compensation of $329 thousand was associated with these awards. This cost is expected to be recognized over a weighted-average period of 2.3 years. The total fair value of shares vested during 2006 was $52 thousand.
The following table summarizes the restricted stock activity:
| | | | | | | | | | | | | | | |
| | | 2006 | | 2005 | | 2004 |
| | | Shares | | | Weighted-
Average
Grant Date
Fair Value | | Shares | | Weighted-
Average
Grant Date
Fair Value | | Shares | | Weighted-
Average
Grant Date
Fair Value |
Nonvested—beginning of period | | 57,624 | | | $ | 9.88 | | — | | | — | | — | | — |
Granted | | 16,000 | | | $ | 11.35 | | 57,624 | | $ | 9.88 | | — | | — |
Vested | | (4,455 | ) | | $ | 9.50 | | — | | | — | | — | | — |
Forfeited | | (26,124 | ) | | $ | 10.00 | | — | | | — | | — | | — |
| | | | | | | | | | | | | | | |
Nonvested—end of period | | 43,045 | | | $ | 10.40 | | 57,624 | | $ | 9.88 | | — | | — |
| | | | | | | | | | | | | | | |
During 2005, the Company granted 44,124 restricted stock awards that cliff vest 26 months from the date of grant. The remaining 13,500 awards in 2005 and the 16,000 awards in 2006 vest in equal installments on each of the first three anniversaries of the date of grant.
NOTE 15—STOCKHOLDERS’ EQUITY
On November 29, 2006, the Board of Directors authorized the Company to repurchase up to 500,000 shares of its common stock in open market transactions. As of December 31, 2006, no repurchases had occurred.
On October 27, 2005, the Board of Directors authorized the Company to repurchase up to 500,000 shares of its common stock in open market transactions. The common stock was provided to the Company’s ESOP for matching, discretionary, and profit-sharing contributions for the 401(k) and employee stock ownership plan. During 2005, the Company repurchased 9,500 shares to provide shares under the Company’s ESOP at a weighted average market price of $9.67. During the fourth quarter of 2005, the Company repurchased 82,727 shares at a cost of $797 thousand, or $9.63 per share, that were subsequently retired and returned to authorized and unissued shares. During 2006, the Company repurchased 87,420 shares at a cost of $917 thousand, or $10.49 per share, that were subsequently retired and returned to authorized and unissued shares. The Company issued 170,147 shares to the ESOP at a cost of $11.04 per share. The ESOP also repurchased 320,353 shares to provide to the Company’s ESOP at a weighted average market price of $11.22. The transactions provided the ESOP with 500,000 shares.
93
FIRST SECURITY GROUP, INC. AND SUBSIDIARY
NOTES TO CONSOLIDATED FINANCIAL STATEMENTS—(Continued)
During 2006, the Board of Directors declared the following dividends:
| | | | | | | | | | |
Declaration Date | | Dividend
Per Share | | Date of Record | | Total Amount | | Payment Date |
| | | | | | | (in thousands) | | |
February 22, 2006 | | $ | 0.025 | | March 1, 2006 | | $ | 441 | | March 16, 2006 |
April 26, 2006 | | $ | 0.025 | | June 1, 2006 | | $ | 439 | | June 16, 2006 |
July 26, 2006 | | $ | 0.025 | | September 1, 2006 | | $ | 444 | | September 18, 2006 |
October 25, 2006 | | $ | 0.05 | | December 1, 2006 | | $ | 843 | | December 18, 2006 |
In October 2006, the Company announced the doubling of its quarterly cash dividend to $0.05 per share.
On October 27, 2005, the Company’s shareholders approved an amendment, as proposed by the Board of Directors, to its articles of incorporation to increase the number of authorized shares of common stock from 20 million to 50 million. Amended and restated articles were filed with the Tennessee Secretary of State to effect this change on March 7, 2006. The Board of Directors also declared its first cash dividend of $0.025 per share or $441 thousand.
NOTE 16—MINIMUM REGULATORY CAPITAL REQUIREMENTS
The Company is subject to various regulatory capital requirements administered by the federal banking agencies. Failure to meet minimum capital requirements can result in certain mandatory and possibly additional discretionary actions by regulators that, if undertaken, could have a direct material effect on the Company’s consolidated financial statements. Under capital adequacy guidelines and the regulatory framework for prompt corrective action, the Company must meet specific capital guidelines that involve quantitative measures of their assets, liabilities and certain off-balance-sheet items as calculated under regulatory accounting practices. The capital amounts and classification are also subject to qualitative judgments by the regulators about components, risk weightings and other factors. Prompt corrective action provisions are not applicable to bank holding companies.
Quantitative measures established by regulation to ensure capital adequacy require the Company to maintain minimum amounts and ratios (set forth in the following table) of total and Tier 1 capital (as defined in the regulations) to risk-weighted assets (as defined) and of Tier 1 capital (as defined) to the average assets (as defined). Management believes, as of December 31, 2006, that the Company met all capital adequacy requirements to which they are subject.
94
FIRST SECURITY GROUP, INC. AND SUBSIDIARY
NOTES TO CONSOLIDATED FINANCIAL STATEMENTS—(Continued)
As of December 31, 2006, the Company and the Bank were well capitalized for regulatory purposes. To be categorized as well capitalized, the Bank must maintain minimum total risk-based, Tier 1 risk-based and Tier 1 leverage ratios as set forth in the following table.
| | | | | | | | | | | | | | | | | | |
| | | Actual | | | Minimum
Capital
Requirements | | | Minimum To Be Well
Capitalized Under
Prompt Corrective
Action Provisions | |
| | | Amount | | Ratio | | | Amount | | Ratio | | | Amount | | Ratio | |
| | | (dollar amounts in thousands) | |
December 31, 2006 | | | | | | | | | | | | | | | | | | |
Total Capital to Risk-Weighted Assets— | | | | | | | | | | | | | | | | | | |
First Security Group, Inc. and subsidiary | | $ | 124,408 | | 13.1 | % | | $ | 75,980 | | 8.0 | % | | | N/A | | N/A | |
FSGBank | | $ | 115,264 | | 12.1 | % | | $ | 75,945 | | 8.0 | % | | $ | 94,931 | | 10.0 | % |
| | | | | | |
Tier 1 Capital to Risk-Weighted Assets— | | | | | | | | | | | | | | | | | | |
First Security Group, Inc. and subsidiary | | $ | 114,318 | | 12.0 | % | | $ | 37,990 | | 4.0 | % | | | N/A | | N/A | |
FSGBank | | $ | 105,174 | | 11.1 | % | | $ | 37,972 | | 4.0 | % | | $ | 56,959 | | 6.0 | % |
| | | | | | |
Tier 1 Capital to Average Assets— | | | | | | | | | | | | | | | | | | |
First Security Group, Inc. and subsidiary | | $ | 114,318 | | 10.5 | % | | $ | 43,556 | | 4.0 | % | | | N/A | | N/A | |
FSGBank | | $ | 105,174 | | 9.7 | % | | $ | 43,413 | | 4.0 | % | | $ | 54,266 | | 5.0 | % |
| | | |
| | | Actual | | | Minimum
Capital
Requirements | | | Minimum To Be Well
Capitalized Under
Prompt Corrective
Action Provisions | |
| | | Amount | | Ratio | | | Amount | | Ratio | | | Amount | | Ratio | |
| | | (dollar amounts in thousands) | |
December 31, 2005 | | | | | | | | | | | | | | | | | | |
Total Capital to Risk-Weighted Assets— | | | | | | | | | | | | | | | | | | |
First Security Group, Inc. and subsidiary | | $ | 117,626 | | 13.2 | % | | $ | 71,453 | | 8.0 | % | | | N/A | | N/A | |
FSGBank | | $ | 99,802 | | 11.2 | % | | $ | 71,309 | | 8.0 | % | | $ | 89,136 | | 10.0 | % |
| | | | | | |
Tier 1 Capital to Risk-Weighted Assets— | | | | | | | | | | | | | | | | | | |
First Security Group, Inc. and subsidiary | | $ | 107,505 | | 12.0 | % | | $ | 35,726 | | 4.0 | % | | | N/A | | N/A | |
FSGBank | | $ | 89,681 | | 10.1 | % | | $ | 35,654 | | 4.0 | % | | $ | 53,481 | | 6.0 | % |
| | | | | | |
Tier 1 Capital to Average Assets— | | | | | | | | | | | | | | | | | | |
First Security Group, Inc. and subsidiary | | $ | 107,505 | | 10.6 | % | | $ | 40,482 | | 4.0 | % | | | N/A | | N/A | |
FSGBank | | $ | 89,681 | | 8.9 | % | | $ | 40,408 | | 4.0 | % | | $ | 50,510 | | 5.0 | % |
95
FIRST SECURITY GROUP, INC. AND SUBSIDIARY
NOTES TO CONSOLIDATED FINANCIAL STATEMENTS—(Continued)
NOTE 17—FAIR VALUE OF FINANCIAL INSTRUMENTS
The estimated fair values of the Company’s financial instruments are as follows:
| | | | | | | | | | | | |
| | | December 31, 2006 | | December 31, 2005 |
| | | Carrying
Amount | | Fair
Value | | Carrying
Amount | | Fair
Value |
| | | (in thousands) |
Financial Assets | | | | | | | | | | | | |
Cash and Cash Equivalents | | $ | 28,112 | | $ | 28,112 | | $ | 41,752 | | $ | 41,752 |
Interest-Bearing Deposits in Banks | | $ | 481 | | $ | 481 | | $ | 1,153 | | $ | 1,153 |
Securities Available for Sale | | $ | 153,759 | | $ | 153,759 | | $ | 155,993 | | $ | 155,993 |
Loans Held for Sale | | $ | 7,524 | | $ | 7,524 | | $ | 4,244 | | $ | 4,244 |
Loans | | $ | 840,069 | | $ | 842,135 | | $ | 744,415 | | $ | 742,266 |
Allowance for Loan and Lease Losses | | $ | 9,970 | | $ | 9,970 | | $ | 10,121 | | $ | 10,121 |
| | | | |
Financial Liabilities | | | | | | | | | | | | |
Deposits | | $ | 922,001 | | $ | 922,162 | | $ | 861,507 | | $ | 859,162 |
Federal Funds Purchased and Securities Sold Under Agreements to Repurchase | | $ | 20,851 | | $ | 20,851 | | $ | 16,894 | | $ | 16,894 |
Other Borrowings | | $ | 24,838 | | $ | 24,838 | | $ | 10,150 | | $ | 10,150 |
The following methods and assumptions were used by the Company in estimating fair value of each class of financial instruments for which it is practicable to estimate that value:
| | • | | Cash and Cash Equivalents—The carrying amounts of cash and cash equivalents approximate fair value. |
| | • | | Interest-Bearing Deposits in Banks—The carrying amounts of interest-bearing deposits in banks approximate fair value. |
| | • | | Securities—Fair values for securities are based on quoted market prices. |
| | • | | Loans Held for Sale—The carrying amount of loans held for sale approximates fair value. |
| | • | | Loans—For variable-rate loans that reprice frequently and have no significant change in credit risk, fair values are based on carrying values. Fair values for certain mortgage loans and other consumer loans are estimated using the quoted market prices for securities backed by similar loans, adjusted for differences in loan characteristics. The fair value of other types of loans and leases is estimated by discounting the future cash flows using the current rates at which similar loans would be made to borrowers of similar credit ratings quality. Fair values for impaired loans and leases are estimated using discounted cash flow analysis or underlying collateral values, where applicable. |
| | • | | Deposit Liabilities—The fair value of demand deposits, savings accounts and certain money market deposits is the amount payable on demand at the reporting date. The fair value for fixed-rate certificates of deposit is estimated using a discounted cash flow calculation that applies interest rates currently being offered on certificates to a schedule of aggregated expected monthly maturities on time deposits. |
| | • | | Federal Funds Purchased and Securities Sold Under Agreements to Repurchase—These borrowings generally mature in 90 days or less and, accordingly, the carrying amount reported in the balance sheet approximates fair value. |
| | • | | Other Borrowings—Other borrowings carrying amount reported in the balance sheet approximates fair value. |
96
FIRST SECURITY GROUP, INC. AND SUBSIDIARY
NOTES TO CONSOLIDATED FINANCIAL STATEMENTS—(Continued)
NOTE 18—COMMITMENTS AND CONTINGENCIES
The Company is party to credit related financial instruments with off-balance-sheet risk in the normal course of business to meet the financing needs of its customers. These financial instruments include commitments to extend credit and the issuance of financial guarantees in the form of financial and performance standby letters of credit. Such commitments involve, to varying degrees, elements of credit and interest rate risk in excess of the amount recognized in the consolidated balance sheets.
The Company’s exposure to credit loss is represented by the contractual amount of these commitments. The Bank follows the same credit policies in making commitments as they do for on-balance-sheet instruments.
The Company’s maximum exposure to credit risk for unfunded loan commitments and standby letters of credit at December 31, 2006 and 2005, was as follows:
| | | | | | |
| | | 2006 | | 2005 |
| | | (in thousands) |
Commitments to Extend Credit | | $ | 270,662 | | $ | 234,352 |
Standby Letters of Credit | | $ | 15,998 | | $ | 12,669 |
Commitments to extend credit are agreements to lend to customers. Standby letters of credit are contingent commitments issued by the Company to guarantee performance of a customer to a third party under a contractual non-financial obligation for which it receives a fee. Financial standby letters of credit represent a commitment to guarantee customer repayment of an outstanding loan or debt instrument. Commitments generally have fixed expiration dates or other termination clauses and may require payment of fees. Since many of the commitments are expected to expire without being drawn upon, the total commitment amounts do not necessarily represent future cash requirements. The Company evaluates each customer’s credit worthiness on a case-by-case basis. The amount of collateral obtained, if deemed necessary by the Company on extension of credit, is based on management’s credit evaluation. Collateral held varies but may include accounts receivable, inventory, property and equipment and income-producing commercial properties.
The Company is party to certain legal proceedings incidental to its business. The ultimate disposition of these matters, in the opinion of management, based in part on advice of legal counsel, will not have a material adverse effect on the Company’s consolidated financial position or results of operations.
97
FIRST SECURITY GROUP, INC. AND SUBSIDIARY
NOTES TO CONSOLIDATED FINANCIAL STATEMENTS—(Continued)
NOTE 19—OTHER ASSETS AND OTHER LIABILITIES
Other assets and other liabilities consist of the following:
| | | | | | |
| | | 2006 | | 2005 |
| | | (in thousands) |
Other Assets: | | | | | | |
Cash Surrender Value of Bank-Owned Life Insurance | | $ | 22,293 | | $ | 21,440 |
Equity Securities | | | 6,518 | | | 5,379 |
Interest Receivable | | | 5,511 | | | 4,594 |
Foreclosed Properties and Repossessions | | | 4,213 | | | 3,443 |
Federal Income Tax Receivable | | | 1,506 | | | 2,003 |
Other | | | 2,016 | | | 1,252 |
Prepaid Expenses | | | 595 | | | 1,078 |
| | | | | | |
| | $ | 42,652 | | $ | 39,189 |
| | | | | | |
Other Liabilities: | | | | | | |
Accrued Interest Payable | | $ | 7,205 | | $ | 4,413 |
Accrued Expenses | | | 2,990 | | | 3,001 |
Other | | | 2,562 | | | 1,284 |
Deferred Tax Liability | | | 648 | | | 960 |
| | | | | | |
| | $ | 13,405 | | $ | 9,658 |
| | | | | | |
NOTE 20—SUPPLEMENTAL FINANCIAL DATA
Components of other noninterest income or other noninterest expense in excess of 1% of the aggregate of total interest income and other income are shown in the following table. Amounts less than 1% in the current or prior years are represented by a hyphen.
| | | | | | | | | |
| | | 2006 | | 2005 | | 2004 |
| | | (in thousands) |
Noninterest Income— | | | | | | | | | |
Fees Related to Mortgage Loans Sold | | $ | 1,446 | | $ | 1,468 | | $ | 1,344 |
Bank-Owned Life Insurance Income | | $ | 870 | | $ | — | | $ | — |
| | | |
Noninterest Expense— | | | | | | | | | |
Professional Fees | | $ | 1,927 | | $ | 1,364 | | $ | 1,152 |
Intangible Asset Amortization | | $ | 1,246 | | $ | 929 | | $ | 797 |
Computer Fees | | $ | 1,237 | | $ | 1,189 | | $ | 1,177 |
Printing and Supplies | | $ | — | | $ | — | | $ | 597 |
Advertising | | $ | — | | $ | — | | $ | 498 |
Telephone | | $ | — | | $ | — | | $ | 531 |
98
FIRST SECURITY GROUP, INC. AND SUBSIDIARY
NOTES TO CONSOLIDATED FINANCIAL STATEMENTS—(Continued)
NOTE 21—CONDENSED FINANCIAL STATEMENTS OF PARENT COMPANY
Financial information pertaining only to First Security Group, Inc. is as follows:
CONDENSED BALANCE SHEET
| | | | | | |
| | | 2006 | | 2005 |
| | | (in thousands) |
| ASSETS | | | | | | |
Cash and Due from Bank Subsidiary | | $ | 1,900 | | $ | 10,061 |
Investment in Common Stock of Subsidiary | | | 135,644 | | | 120,565 |
Premises and Equipment, net | | | — | | | 1,670 |
Other Assets | | | 8,603 | | | 6,810 |
| | | | | | |
TOTAL ASSETS | | $ | 146,147 | | $ | 139,106 |
| | | | | | |
| LIABILITIES AND STOCKHOLDERS’ EQUITY | | | | | | |
LIABILITIES | | $ | 1,359 | | $ | 717 |
STOCKHOLDERS’ EQUITY | | | 144,788 | | | 138,389 |
| | | | | | |
TOTAL LIABILITIES AND STOCKHOLDERS’ EQUITY | | $ | 146,147 | | $ | 139,106 |
| | | | | | |
CONDENSED STATEMENT OF OPERATIONS
| | | | | | | | | | | | |
| | | 2006 | | | 2005 | | | 2004 | |
| | | (in thousands) | |
INCOME | | | | | | | | | | | | |
Management Fees | | $ | 5,313 | | | $ | 4,821 | | | $ | 3,600 | |
Interest | | | — | | | | 29 | | | | — | |
Miscellaneous | | | — | | | | — | | | | 2 | |
| | | | | | | | | | | | |
Total Income | | | 5,313 | | | | 4,850 | | | | 3,602 | |
| | | | | | | | | | | | |
EXPENSES | | | | | | | | | | | | |
Salaries and Employee Benefits | | | 6,023 | | | | 4,496 | | | | 3,297 | |
Other | | | 1,585 | | | | 1,526 | | | | 1,465 | |
| | | | | | | | | | | | |
Total Expenses | | | 7,608 | | | | 6,022 | | | | 4,762 | |
| | | | | | | | | | | | |
LOSS BEFORE INCOME TAXES AND EQUITY IN UNDISTRIBUTED NET INCOME OF SUBSIDIARY | | | (2,295 | ) | | | (1,172 | ) | | | (1,160 | ) |
| | | |
Income Tax Benefit | | | (839 | ) | | | (427 | ) | | | (415 | ) |
| | | | | | | | | | | | |
LOSS BEFORE EQUITY IN UNDISTRIBUTED NET INCOME OF SUBSIDIARY | | | (1,456 | ) | | | (745 | ) | | | (745 | ) |
| | | |
Equity in Undistributed Net Income of Subsidiary | | | 12,568 | | | | 10,316 | | | | 5,012 | |
| | | | | | | | | | | | |
NET INCOME | | $ | 11,112 | | | $ | 9,571 | | | $ | 4,267 | |
| | | | | | | | | | | | |
99
FIRST SECURITY GROUP, INC. AND SUBSIDIARY
NOTES TO CONSOLIDATED FINANCIAL STATEMENTS—(Continued)
CONDENSED STATEMENT OF CASH FLOWS
| | | | | | | | | | | | |
| | | 2006 | | | 2005 | | | 2004 | |
| | | (in thousands) | |
CASH FLOWS FROM OPERATING ACTIVITIES | | | | | | | | | | | | |
Net Income | | $ | 11,112 | | | $ | 9,571 | | | $ | 4,267 | |
Adjustments to Reconcile Net Income to Net Cash (Used in) Provided by Operating Activities— | | | | | | | | | | | | |
Equity in Undistributed Net Income of Subsidiary | | | (12,568 | ) | | | (10,316 | ) | | | (5,012 | ) |
Amortization of Deferred Compensation | | | 454 | | | | 84 | | | | 33 | |
(Increase) Decrease in Other Assets | | | (1,793 | ) | | | (6,058 | ) | | | 92 | |
Increase in Liabilities | | | 1,190 | | | | 25 | | | | 642 | |
| | | | | | | | | | | | |
Net Cash (Used in) Provided by Operating Activities | | | (1,605 | ) | | | (6,694 | ) | | | 22 | |
| | | | | | | | | | | | |
CASH FLOWS FROM INVESTING ACTIVITIES | | | | | | | | | | | | |
(Additions to) Disposal of Premises and Equipment | | | (4,133 | ) | | | (120 | ) | | | 39 | |
Acquisition of Subsidiary | | | — | | | | (33,277 | ) | | | — | |
Dividend from Subsidiary | | | 4,000 | | | | — | | | | — | |
| | | | | | | | | | | | |
Net Cash (Used in) Provided by Investing Activities | | | (133 | ) | | | (33,397 | ) | | | 39 | |
| | | | | | | | | | | | |
CASH FLOWS FROM FINANCING ACTIVITIES | | | | | | | | | | | | |
Proceeds from Issuance of Common Stock Under Stock Option Plan | | | 255 | | | | 630 | | | | 23 | |
Proceeds from Issuance of Common Stock, net of stock issuance costs | | | 1,877 | | | | 44,681 | | | | — | |
Repurchase and Retirement of Common Stock | | | (917 | ) | | | (797 | ) | | | — | |
Purchase of ESOP Shares | | | (5,471 | ) | | | (91 | ) | | | — | |
Dividends Paid on Common Stock | | | (2,167 | ) | | | (441 | ) | | | — | |
| | | | | | | | | | | | |
Net Cash (Used in) Provided by Financing Activities | | | (6,423 | ) | | | 43,982 | | | | 23 | |
| | | | | | | | | | | | |
NET (DECREASE) INCREASE IN CASH AND CASH EQUIVALENTS | | | (8,161 | ) | | | 3,891 | | | | 84 | |
CASH AND CASH EQUIVALENTS—beginning of year | | | 10,061 | | | | 6,170 | | | | 6,086 | |
| | | | | | | | | | | | |
CASH AND CASH EQUIVALENTS—end of year | | $ | 1,900 | | | $ | 10,061 | | | $ | 6,170 | |
| | | | | | | | | | | | |
SUPPLEMENTAL DISCLOSURES OF NONCASH INVESTING AND FINANCING ACTIVITIES | | | | | | | | | | | | |
Unrealized Appreciation (Depreciation) of Securities, net of tax | | $ | 708 | | | $ | (1,693 | ) | | $ | (316 | ) |
Issuance of Common Stock Pursuant to Incentive Plan | | $ | 182 | | | $ | 569 | | | $ | — | |
Transfer of Corporate Headquarters to Subsidiary | | $ | 5,803 | | | $ | — | | | $ | — | |
NOTE 22—RELATED PARTY TRANSACTIONS
During 2006, 2005 and 2004 the Company was party to an agreement with Alpha Antiques, whose sole proprietor, Judy Holley, is the spouse of Rodger Holley, the Company’s Chief Executive Officer and President. Under the agreement, Alpha Antiques provided design and procurement services relating to the design and construction of the Bank’s branches and the renovation of the Company’s corporate headquarters, for which it paid $30 thousand in 2006, 2005 and 2004. The agreement has been renewed for 2007.
In connection with the acquisition of Premier National Bank of Dalton in 2003, the Bank assumed a lease with First Plaza, L.L.C. J.C. Harold Anders, a director of the Company, is a 14.2% owner of First Plaza. As a result of the agreement, FSGBank leases property located at 715 S Thornton Avenue, Dalton, Georgia 30721.
100
FIRST SECURITY GROUP, INC. AND SUBSIDIARY
NOTES TO CONSOLIDATED FINANCIAL STATEMENTS—(Continued)
The Bank owns a full service branch facility located on this property. The Company recognized lease expense of $45 thousand in 2006, 2005 and 2004, respectively.
In March 2005, the Company entered an exclusive listing agreement with two agents of Wood Properties, Inc., a real estate broker, to offer for sub-lease the Company’s vacant property located at 109 Northshore Drive, Suite 300, Knoxville, Tennessee. H. Patrick Wood is the Chairman of the Board of Wood Properties. Mr. Wood served as a director of the Company until June 23, 2006. Under the agreement, the Company agrees to pay directly to the assigned Wood Properties, Inc. agents a commission of 4% of the total sublease payments if the sublease is made via one broker and 6% if the subtenant is represented by an independent broker (in which case the fees will be split between the brokers). In November 2005, the Company entered into a sub-lease agreement with Trinity Mortgage Capital, Inc. The Company paid commissions to Wood Properties, Inc. in the amount of $9 thousand in 2005 based on the terms of the listing agreement described above.
NOTE 23—QUARTERLY SUMMARIZED FINANCIAL INFORMATION (UNAUDITED)
| | | | | | | | | | | | |
| | | First Quarter 2006 | | Second Quarter 2006 | | Third Quarter 2006 | | Fourth Quarter 2006 |
| | | (in thousands, except per share amounts) |
Interest Income | | $ | 17,422 | | $ | 18,540 | | $ | 19,384 | | $ | 19,781 |
Interest Expense | | | 5,657 | | | 6,371 | | | 7,228 | | | 7,889 |
| | | | | | | | | | | | |
Net Interest Income | | | 11,765 | | | 12,169 | | | 12,156 | | | 11,892 |
Provision for Loan Losses | | | 543 | | | 600 | | | 600 | | | 441 |
| | | | | | | | | | | | |
Net Interest Income After Provision for Loan Losses | | | 11,222 | | | 11,569 | | | 11,556 | | | 11,451 |
Noninterest Income | | | 2,436 | | | 2,666 | | | 2,776 | | | 2,739 |
Noninterest Expense | | | 10,039 | | | 10,076 | | | 10,031 | | | 9,871 |
| | | | | | | | | | | | |
Income Before Income Taxes | | | 3,619 | | | 4,159 | | | 4,301 | | | 4,319 |
Income Tax Provision | | | 1,145 | | | 1,343 | | | 1,395 | | | 1,403 |
| | | | | | | | | | | | |
Net Income | | $ | 2,474 | | $ | 2,816 | | $ | 2,906 | | $ | 2,916 |
| | | | | | | | | | | | |
Net Income Per Share* | | | | | | | | | | | | |
Net Income Per Share—Basic | | $ | 0.14 | | $ | 0.16 | | $ | 0.17 | | $ | 0.17 |
| | | | | | | | | | | | |
Net Income Per Share—Diluted | | $ | 0.14 | | $ | 0.16 | | $ | 0.16 | | $ | 0.17 |
| | | | | | | | | | | | |
Shares Outstanding | | | | | | | | | | | | |
Basic | | | 17,489 | | | 17,342 | | | 17,218 | | | 17,216 |
Diluted | | | 17,852 | | | 17,759 | | | 17,629 | | | 17,600 |
101
FIRST SECURITY GROUP, INC. AND SUBSIDIARY
NOTES TO CONSOLIDATED FINANCIAL STATEMENTS—(Continued)
| | | | | | | | | | | | | |
| | | First Quarter 2005 | | Second Quarter 2005 | | Third Quarter 2005 | | Fourth Quarter 2005 | |
| | | (in thousands, except per share amounts) | |
Interest Income | | $ | 11,988 | | $ | 12,874 | | $ | 14,576 | | $ | 16,866 | |
Interest Expense | | | 2,987 | | | 3,434 | | | 4,185 | | | 5,257 | |
| | | | | | | | | | | | | |
Net Interest Income | | | 9,001 | | | 9,440 | | | 10,391 | | | 11,609 | |
Provision for Loan Losses | | | 1,143 | | | 843 | | | 693 | | | 243 | |
| | | | | | | | | | | | | |
Net Interest Income After Provision for Loan Losses | | | 7,858 | | | 8,597 | | | 9,698 | | | 11,366 | |
Noninterest Income | | | 1,707 | | | 2,388 | | | 2,388 | | | 2,364 | |
Noninterest Expense | | | 7,966 | | | 8,212 | | | 9,154 | | | 10,041 | |
| | | | | | | | | | | | | |
Income Before Income Taxes | | | 1,599 | | | 2,773 | | | 2,932 | | | 3,689 | |
Income Tax Provision | | | 493 | | | 878 | | | 1,009 | | | 1,217 | |
| | | | | | | | | | | | | |
Income before Extraordinary Item | | | 1,106 | | | 1,895 | | | 1,923 | | | 2,472 | |
Extraordinary Gain on Business Combination, net of tax | | | — | | | — | | | 2,385 | | | (210 | ) |
| | | | | | | | | | | | | |
Net Income | | $ | 1,106 | | $ | 1,895 | | $ | 4,308 | | $ | 2,262 | |
| | | | | | | | | | | | | |
Net Income Per Share* | | | | | | | | | | | | | |
Net Income Per Share Before Extraordinary Item—Basic | | $ | 0.09 | | $ | 0.15 | | $ | 0.13 | | $ | 0.14 | |
Extraordinary Item—Basic | | | — | | | — | | | 0.15 | | | (0.01 | ) |
| | | | | | | | | | | | | |
Net Income Per Share—Basic | | $ | 0.09 | | $ | 0.15 | | $ | 0.28 | | $ | 0.13 | |
| | | | | | | | | | | | | |
Net Income Per Share Before Extraordinary Item—Diluted | | $ | 0.09 | | $ | 0.15 | | $ | 0.12 | | $ | 0.14 | |
Extraordinary Item—Diluted | | | — | | | — | | | 0.16 | | | (0.01 | ) |
| | | | | | | | | | | | | |
Net Income Per Share—Diluted | | $ | 0.09 | | $ | 0.15 | | $ | 0.28 | | $ | 0.13 | |
| | | | | | | | | | | | | |
Shares Outstanding | | | | | | | | | | | | | |
Basic | | | 12,722 | | | 12,733 | | | 15,353 | | | 17,603 | |
Diluted | | | 12,922 | | | 13,014 | | | 15,661 | | | 17,908 | |
| * | The sum of the 2006 and 2005 quarterly earnings per share may differ from the annual earnings per share because of the differences in the weighted average number of common shares outstanding and common shares used in the quarterly and annual computation as well as differences in rounding. |
NOTE 24—BANK-OWNED LIFE INSURANCE
The Company’s Board of Directors approved the establishment of a bank-owned life insurance (BOLI) program on January 26, 2005. The program provides benefits to the Company’s executives, which continues after retirement. The Company is the owner and beneficiary of these life insurance contracts. In order to fund this program, the Company invested a total of $17,250 thousand in three bank-owned life insurance policies during the first half of 2005.
102
FIRST SECURITY GROUP, INC. AND SUBSIDIARY
NOTES TO CONSOLIDATED FINANCIAL STATEMENTS—(Continued)
In conjunction with the acquisitions of First State Bank and Jackson Bank, the Company assumed $362 thousand and $3,348 thousand, respectively in bank-owned life insurance. The Company’s investment in bank-owned life insurance is as follows:
| | | | | | |
| | | 2006 | | 2005 |
| | | (in thousands) |
Cash Surrender Value—beginning of year | | $ | 21,440 | | $ | 362 |
Purchase of BOLI | | | — | | | 17,250 |
Assumption of BOLI through bank acquisition | | | — | | | 3,348 |
Increase in Cash Surrender Value, net of expenses | | | 853 | | | 480 |
| | | | | | |
Cash Surrender Value—end of year | | $ | 22,293 | | $ | 21,440 |
| | | | | | |
The cash surrender value of these policies is reported in other assets in the Company’s consolidated balance sheets. The Company reports income and expenses from the policies as other income and other expense, respectively, in the consolidated statements of operations and expenses. The income is not subject to tax and the expenses are not deductible for tax.
NOTE 25—CONCENTRATIONS OF CREDIT RISK
The Company offers a variety of loan products with payment terms and rate structures that have been designed to meet the needs of its customers within an established framework of acceptable credit risk. Payment terms range from fully amortizing loans that require periodic principal and interest payments to terms that require periodic payments of interest-only with principal due at maturity. Interest-only loans are a typical characteristic in commercial and home equity lines-of-credit and construction loans (residential and commercial). At December 31, 2006, the Company had approximately $397,781 thousand of interest-only loans, which primarily consist of construction and commercial real estate loans (40%), home equity loans (19%) and commercial and industrial loans (18%). The loans have an average maturity of approximately one year or less, with the exception of home equity lines-of-credit which have an average maturity of approximately seven years. The interest only loans are properly underwritten loans and are within the Company’s lending policies.
At December 31, 2006, the Company did not offer, hold or service option adjustable rate mortgages that may expose the borrowers to future increases in repayments in excess of changes resulting solely from increases in the market rate of interest (loans subject to negative amortization).
NOTE 26—SUBSEQUENT EVENT
On January 26, 2007, the Company declared a quarterly cash dividend of $0.05 per share payable on March 16, 2007 to shareholders of record on March 1, 2007.
103
| Item 9. | Changes in and Disagreements with Accountants on Accounting and Financial Disclosure |
There were no changes in or disagreements with accountants on accounting and financial disclosure.
| Item 9A. | Controls and Procedures |
Evaluation of Disclosure Controls and Procedures
As of the end of the period covered by this Annual Report on Form 10-K, our principal executive officer and principal financial officer have evaluated the effectiveness of our “disclosure controls and procedures” (Disclosure Controls). Disclosure Controls, as defined in Rule 13a-15(e) of the Securities Exchange Act of 1934, as amended (the Exchange Act), are procedures that are designed with the objective of ensuring that information required to be disclosed in our reports filed under the Exchange Act, such as this Annual Report, is recorded, processed, summarized and reported within the time periods specified in the Securities and Exchange Commission’s rules and forms. Disclosure Controls are also designed with the objective of ensuring that such information is accumulated and communicated to our management, including the CEO and CFO, as appropriate to allow timely decisions regarding required disclosure.
Our management, including the CEO and CFO, does not expect that our Disclosure Controls will prevent all error and all fraud. A control system, no matter how well conceived and operated, can provide only reasonable, not absolute, assurance that the objectives of the control system are met. Further, the design of a control system must reflect the fact that there are resource constraints, and the benefits of controls must be considered relative to their costs. Because of the inherent limitations in all control systems, no evaluation of controls can provide absolute assurance that all control issues and instances of fraud, if any, within the company have been detected. These inherent limitations include the realities that judgments in decision-making can be faulty, and that breakdowns can occur because of simple error or mistake. The design of any system of controls also is based in part upon certain assumptions about the likelihood of future events, and there can be no assurance that any design will succeed in achieving its stated goals under all potential future conditions.
Based upon their controls evaluation, our CEO and CFO have concluded that our Disclosure Controls are effective at a reasonable assurance level.
Management’s Report on Internal Control Over Financial Reporting
Our management is responsible for establishing and maintaining adequate internal control over financial reporting as defined in Rules 13a-15(f) and 15d-15(f) under the Securities Exchange Act of 1934. Our internal control over financial reporting is a process designed to provide reasonable assurance that assets are safeguarded against loss from unauthorized use or disposition, transactions are executed in accordance with appropriate management authorization and accounting records are reliable for the preparation of financial statements in accordance with generally accepted accounting principles.
Because of its inherent limitations, internal control over financial reporting may not prevent or detect misstatements. Also, projections of any evaluation of effectiveness to future periods are subject to the risk that controls may become inadequate because of changes in conditions, or that the degree of compliance with the policies or procedures may deteriorate.
Management assessed the effectiveness of our internal control over financial reporting as of December 31, 2006. Management based this assessment on criteria for effective internal control over financial reporting described inInternal Control—Integrated Framework issued by the Committee of Sponsoring Organizations of the Treadway Commission. Management’s assessment included an evaluation of the design of our internal control over financial reporting and testing of the operational effectiveness of its internal control over financial reporting. Management reviewed the results of its assessment with the Audit Committee of our Board of Directors.
104
Based on this assessment, management believes that First Security Group, Inc. maintained effective internal control over financial reporting as of December 31, 2006.
Our independent auditors, Joseph Decosimo and Company, PLLC, have issued their auditor’s report on management’s assessment of internal control over financial reporting, which is included herein.
105
Report of Independent Registered Public Accounting Firm on Internal Control Over Financial Reporting
To the Board of Directors and Stockholders of First Security Group, Inc.:
We have audited management’s assessment, included in the accompanying “Management’s Report on Internal Control Over Financial Reporting,” that First Security Group, Inc. and subsidiary (the Company) maintained effective internal control over financial reporting as of December 31, 2006, based on criteria established inInternal Control—Integrated Framework issued by the Committee of Sponsoring Organizations of the Treadway Commission (the COSO criteria). The Company’s management is responsible for maintaining effective internal control over financial reporting and for its assessment of the effectiveness of internal control over financial reporting. Our responsibility is to express an opinion on management’s assessment and an opinion on the effectiveness of the Company’s internal control over financial reporting based on our audit.
We conducted our audit in accordance with the standards of the Public Company Accounting Oversight Board (United States). Those standards require that we plan and perform the audit to obtain reasonable assurance about whether effective internal control over financial reporting was maintained in all material respects. Our audit included obtaining an understanding of internal control over financial reporting, evaluating management’s assessment, testing and evaluating the design and operating effectiveness of internal control, and performing such other procedures as we considered necessary in the circumstances. We believe that our audit provides a reasonable basis for our opinion.
A company’s internal control over financial reporting is a process designed to provide reasonable assurance regarding the reliability of financial reporting and the preparation of financial statements for external purposes in accordance with generally accepted accounting principles. A company’s internal control over financial reporting includes those policies and procedures that (1) pertain to the maintenance of records that, in reasonable detail, accurately and fairly reflect the transactions and dispositions of the assets of the company; (2) provide reasonable assurance that transactions are recorded as necessary to permit preparation of financial statements in accordance with generally accepted accounting principles, and that receipts and expenditures of the company are being made only in accordance with authorizations of management and directors of the company; and (3) provide reasonable assurance regarding prevention or timely detection of unauthorized acquisition, use, or disposition of the company’s assets that could have a material effect on the financial statements.
Because of its inherent limitations, internal control over financial reporting may not prevent or detect misstatements. Also, projections of any evaluation of effectiveness to future periods are subject to the risk that controls may become inadequate because of changes in conditions, or that the degree of compliance with the policies or procedures may deteriorate.
In our opinion, management’s assessment that First Security Group, Inc. and subsidiary maintained effective internal control over financial reporting as of December 31, 2006, is fairly stated, in all material respects, based on the COSO criteria. Also in our opinion, First Security Group, Inc. and subsidiary maintained, in all material respects, effective internal control over financial reporting as of December 31, 2006, based on the COSO criteria.
We have also audited, in accordance with the standards of the Public Company Accounting Oversight Board (United States), the consolidated balance sheets as of December 31, 2006 and 2005, and the related consolidated statements of income, shareholders’ equity, and cash flows for each of the years in the three-year period ended December 31, 2006, of First Security Group, Inc. and subsidiary and our report dated March 15, 2007, expressed an unqualified opinion on those consolidated financial statements.
/s/ Joseph Decosimo and Company, PLLC
Chattanooga, Tennessee
March 15, 2007
106
Changes in Internal Controls
There have been no changes in our internal controls over financial reporting during our fourth fiscal quarter that have materially affected, or are reasonably likely to materially affect, our internal control over financial reporting.
| Item 9B. | Other Information |
There is no information required to be disclosed in a report on Form 8-K during the fourth quarter of 2006 that has not been reported.
107
PART III
| Item 10. | Directors, Executive Officers and Corporate Governance |
We have adopted a Code of Business Conduct and Ethics (the “Code”) that applies to all of our directors, officers and employees. We believe the Code is reasonably designed to deter wrongdoing and to promote honest and ethical conduct, including: the ethical handling of conflicts of interest; full, fair and accurate disclosure in filings and other public communications made by us; compliance with applicable laws; prompt internal reporting of violations of the Code; and accountability for adherence to the Code. We have posted a copy of our Code on our website atwww.FSGBank.com. A copy may also be obtained, without charge, upon written request addressed to First Security Group, Inc., 531 Broad Street, Chattanooga, Tennessee 37402, Attention: Chief Financial Officer. The request may be delivered by letter to the address set forth above or by fax to the attention of First Security’s Chief Financial Officer at 423-267-3383.
The remaining information for this Item is included in First Security’s Proxy Statement for the Annual Meeting of Shareholders to be held on June 14, 2007, under the headings “Proposal One: Election of Directors,” “Section 16(a) Beneficial Ownership Reporting Compliance” and “Executive Officers” and is incorporated herein by reference.
| Item 11. | Executive Compensation |
The response to this Item is included in First Security’s Proxy Statement for the Annual Meeting of Shareholders to be held on June 14, 2007, under the headings “Proposal One: Election of Directors- Director Compensation” and “Executive Compensation” and are incorporated herein by reference.
| Item 12. | Security Ownership of Certain Beneficial Owners and Management and Related Stockholder Matters |
The following table sets forth information regarding our equity compensation plans under which shares of our common stock are authorized for issuance. The only equity compensation plans maintained by us are the First Security Group, Inc. Second Amended and Restated 1999 Long-Term Incentive Plan and the First Security Group, Inc. 2002 Long-Term Incentive Plan, as amended. All data is presented as of December 31, 2006.
| | | | | | | |
| | | Number of securities to be
issued upon exercise of
outstanding options | | Weighted-average
exercise price of outstanding options | | Number of shares
remaining available for
future issuance under
the Plans (excludes outstanding options) |
Equity compensation plans approved by security holders | | 1,363,333 | | $ | 8.12 | | 13,190 |
Equity compensation plans not approved by security holders | | — | | | — | | — |
Total | | 1,363,333 | | $ | 8.12 | | 13,190 |
The remaining information for this Item is included in First Security’s Proxy Statement for the Annual Meeting of Shareholders to be held on June 14, 2007, under the heading “Security Ownership of Certain Beneficial Owners and Management” and is incorporated herein by reference.
| Item 13. | Certain Relationships and Related Transactions, and Director Independence |
The response to this Item is included in First Security’s Proxy Statement for the Annual Meeting of Shareholders to be held on June 14, 2007, under the headings “Related Party Transactions” and “Proposal One: Election of Directors” and is incorporated herein by reference.
| Item 14. | Principal Accountant Fees and Services |
The response to this Item is included in First Security’s Proxy Statement for the Annual Meeting of Shareholders to be held on June 14, 2007, under the heading “Proposal Three: Ratification of Appointment of Independent Auditors” and is incorporated herein by reference.
108
PART IV
| Item 15. | Exhibits and Financial Statement Schedules |
| (a) | (1) The list of all financial statements is included at Item 8. |
| (a) | (2) The financial statement schedules are either included in the financial statements or are not applicable. |
| (a) | (3) Exhibits Required by Item 601. The following exhibits are attached hereto or incorporated by reference herein (numbered to correspond to Item 601(a) of Regulation S-K, as promulgated by the Securities and Exchange Commission): |
| | | |
Exhibit
Number | | | Description |
| |
| 3.1 | | | Amended and Restated Articles of Incorporation.1 |
| |
| 3.2 | | | Bylaws.2 |
| |
| 10.1 | * | | First Security’s Second Amended and Restated 1999 Long-Term Incentive Plan.2 |
| |
| 10.2 | * | | First Security’s 2002 Long-Term Incentive Plan.3 |
| |
| 10.3 | * | | First Amendment to First Security’s 2002 Long-Term Incentive Plan.4 |
| |
| 10.4 | * | | Form of Incentive Stock Option Award under the Second Amended and Restated 1999 Long-Term Incentive Plan.5 |
| |
| 10.5 | * | | Form of Incentive Stock Option Award under the 2002 Long-Term Incentive Plan.5 |
| |
| 10.6 | * | | Form of Non-qualified Stock Option Award under the 2002 Long-Term Incentive Plan.5 |
| |
| 10.7 | * | | Form of Restricted Stock Award under the 2002 Long-Term Incentive Plan.5 |
| |
| 10.8 | * | | Employment Agreement Dated as of May 16, 2003 by and between First Security and Rodger B. Holley.6 |
| |
| 10.9 | * | | Salary Continuation Agreement Dated as of December 21, 2005 by and between First Security, FSGBank and Rodger B. Holley.1 |
| |
| 10.10 | * | | Employment Agreement Dated as of May 16, 2003 by and between First Security and Lloyd L. Montgomery, III.6 |
| |
| 10.11 | * | | Salary Continuation Agreement Dated as of December 21, 2005 by and between First Security, FSGBank and Lloyd L. Montgomery, III.1 |
| |
| 10.12 | * | | Employment Agreement Dated as of May 16, 2003 by and between First Security and William L. Lusk, Jr.6 |
| |
| 10.13 | * | | Salary Continuation Agreement Dated as of December 21, 2005 by and between First Security, FSGBank and William L. Lusk, Jr.1 |
| |
| 10.14 | * | | First Security Group, Inc. Non-Employee Director Compensation Policy. |
| |
| 21.1 | | | Subsidiaries of the Registrant.7 |
| |
| 23.1 | | | Consent of Joseph Decosimo and Company, PLLC. |
| |
| 31.1 | | | Certification of Chief Executive Officer pursuant to Rule 13a-14(a) of the Securities and Exchange Act of 1934. |
| |
| 31.2 | | | Certification of Chief Financial Officer pursuant to Rule 13a-14(a) of the Securities and Exchange Act of 1934. |
109
| | |
Exhibit
Number | | Description |
| 32.1 | | Certification of Chief Executive Officer pursuant to Rule 13a-14(b) under the Securities Exchange Act of 1934. |
| |
| 32.2 | | Certification of Chief Financial Officer pursuant to Rule 13a-14(b) under the Securities Exchange Act of 1934. |
| * | The indicated exhibit is a compensatory plan required to be filed as an exhibit to this Form 10-K |
| 1 | Incorporated by reference to First Security’s Annual Report on Form 10-K for the Year Ended December 31, 2005. |
| 2 | Incorporated by reference to First Security’s Registration Statement on Form S-1 dated April 20, 2001, File No. 333-59338. |
| 3 | Incorporated by reference from Appendix A to First Security’s Proxy Statement filed August 16, 2002. |
| 4 | Incorporated by reference from Appendix B to First Security’s Proxy Statement filed April 16, 2004. |
| 5 | Incorporated by reference to First Security’s Annual Report on Form 10-K for the Year Ended December 31, 2004. |
| 6 | Incorporated by reference to First Security’s Quarterly Report on Form 10-Q for the Period Ended June 30, 2003. |
| 7 | Incorporated by Reference to First Security’s Annual Report on Form 10-K for the Year ended December 31, 2003 |
| (b) | The Exhibits not incorporated by reference herein are submitted as a separate part of this report. |
| (c) | The financial statement schedules are either included in the financial statements or are not applicable. |
110
SIGNATURES
Pursuant to the requirements of Section 13 or 15(d) of the Securities and Exchange Act of 1934, the registrant has duly caused this report to be signed on its behalf by the undersigned thereunto duly authorized.
| | |
FIRST SECURITY GROUP, INC. |
| |
BY: | | /s/ RODGER B. HOLLEY |
| | Rodger B. Holley President and Chief Executive Officer |
|
DATE: March 15, 2007 |
Pursuant to the requirements of the Securities and Exchange Act of 1934, the report has been signed by the following persons on behalf of the registrant and in the capacities indicated on March 15, 2007.
| | |
Signature | | Title |
| |
/s/ RODGER B. HOLLEY Rodger B. Holley | | President, Chief Executive Officer and Chairman of the Board of Directors
(Principal Executive Officer) |
| |
/s/ WILLIAM L. LUSK, JR. William L. Lusk, Jr. | | Secretary, Chief Financial Officer and
Executive Vice President
(Principal Financial Officer) |
| |
/s/ JOHN R. HADDOCK John R. Haddock | | Controller and Vice-President
(Principal Accounting Officer) |
| |
/s/ J. C. HAROLD ANDERS J. C. Harold Anders | | Director |
| |
/s/ RANDALL L. GIBSON Randall L. Gibson | | Director |
| |
/s/ CAROL H. JACKSON Carol H. Jackson | | Director |
| |
/s/ RALPH L. KENDALL Ralph L. Kendall | | Director |
| |
/s/ WILLIAM B. KILBRIDE William B. Kilbride | | Director |
| |
/s/ D. RAY MARLER D. Ray Marler | | Director |
| |
/s/ LLOYD L. MONTGOMERY, III Lloyd L. Montgomery, III | | Director, Chief Operating Officer and
Executive Vice President |