Filed by Atlantic Capital Bancshares, Inc. pursuant to Rule 425 under the Securities Act of 1933 and deemed filed pursuant to Rule 14a-12 under the Securities Exchange Act of 1934
Subject Company: First Security Group, Inc. Commission File No.: 000-49747 Date: June 23, 2015
|
Atlantic Capital Bancshares, Inc. Investor Presentation
Proprietary & Confidential June 2015
|
FORWARD-LOOKING STATEMENTS
This presentation contains forward-looking statements within the meaning of the Private Securities Litigation Reform Act of 1995, which Congress passed in an effort to encourage companies to provide information about their anticipated future financial performance. This act protects a company from unwarranted litigation if actual results are different from management expectations. This presentation reflects the current views and estimates of the management of Atlantic Capital and First Security. These forward-looking statements are subject to a number of factors and uncertainties which could cause Atlantic Capital’s, First Security’s or the combined company’s actual results and experience to differ from the anticipated results and expectations expressed in such forward-looking statements, and such differences may be material. Forward-looking statements speak only as of the date they are made and neither Atlantic Capital nor First Security assumes any duty to update forward-looking statements. In addition to factors previously disclosed in First Security’s reports filed with the SEC and those identified elsewhere in this presentation, these forward-looking statements include, but are not limited to, statements about (i) the expected benefits of the transaction between Atlantic Capital and First Security and between Atlantic Capital Bank and FSGBank, including future financial and operating results, cost savings, enhanced revenues and the expected market position of the combined company that may be realized from the transaction, and (ii) Atlantic Capital’s and First Security’s plans, objectives, expectations and intentions and other statements contained in this presentation that are not historical facts. Other statements identified by words such as “expects,” “anticipates,” “intends,” “plans,” “believes,” “seeks,” “estimates,” “targets,” “projects” or words of similar meaning generally are intended to identify forward-looking statements. These statements are based upon the current beliefs and expectations of Atlantic Capital’s and First Security’s management and are inherently subject to significant business, economic and competitive risks and uncertainties, many of which are beyond their respective control. In addition, these forward-looking statements are subject to assumptions with respect to future business strategies and decisions that are subject to change. Actual results may differ from those indicated or implied in the forward-looking statements and such differences may be material.
The following risks, among others, could cause actual results to differ materially from the anticipated results or other expectations expressed in the forward-looking statements: (1) the businesses of Atlantic Capital and First Security may not integrate successfully or the integration may be more difficult, time-consuming or costly than expected; (2) the expected growth opportunities and cost savings from the transaction may not be fully realized or may take longer to realize than expected; (3) revenues following the transaction may be lower than expected as a result of losses of customers or other reasons, including issues arising in connection with integration of the two banks; (4) deposit attrition, operating costs, customer loss and business disruption following the transaction, including difficulties in maintaining relationships with employees, may be greater than expected; (5) governmental approvals of the transaction may not be obtained on the proposed terms or expected timeframe; (6) the terms of the proposed transaction may need to be modified to satisfy such approvals or conditions; (7) Atlantic Capital’s shareholders or First Security’s stockholders may fail to approve the transaction; (8) reputational risks and the reaction of the companies’ customers to the transaction; (9) diversion of management time on merger related issues; (10) changes in asset quality and credit risk; (11) the cost and availability of capital; (12) customer acceptance of the combined company’s products and services; (13) customer borrowing, repayment, investment and deposit practices; (14) the introduction, withdrawal, success and timing of business initiatives; (15) the impact, extent, and timing of technological changes; (16) catastrophic events in our geographic area; (17) a weakening of the economies in which the combined company will conduct operations may adversely affect its operating results; (18) the U.S. legal and regulatory framework, including those associated with the Dodd Frank Wall Street Reform and Consumer Protection Act, could adversely affect the operating results of the combined company; (19) the interest rate environment may compress margins and adversely affect net interest income; (20) competition from other financial services companies in the companies’ markets could adversely affect operations; and (21) Atlantic Capital may not be able to raise sufficient financing to consummate the merger. Additional factors that could cause First Security’s results to differ materially from those described in the forward-looking statements can be found in First Security’s reports (such as Annual Reports on Form 10-K, Quarterly Reports on Form 10-Q and Current Reports on Form 8-K) filed with the SEC and available at the SEC’s website (www.sec.gov). All subsequent written and oral forward-looking statements concerning Atlantic Capital, First Security or the proposed merger or other matters and attributable to Atlantic Capital, First Security or any person acting on either of their behalf are expressly qualified in their entirety by the cautionary statements above. Atlantic Capital and First Security do not undertake any obligation to update any forward-looking statement, whether written or oral, to reflect circumstances or events that occur after the date the forward-looking statements are made.
Proprietary & Confidential 2
|
FORWARD-LOOKING STATEMENTS (CONTINUED)
ADDITIONAL INFORMATION ABOUT THE ATLANTIC CAPITAL/FIRST SECURITY MERGER TRANSACTION
This presentation relates to the proposed merger transaction involving Atlantic Capital and First Security. In connection with the proposed merger, Atlantic Capital and First Security have filed a preliminary joint proxy statement/prospectus on Form S-4 and other documents with the Securities and Exchange Commission (the “SEC”).This presentation does not constitute an offer to sell or the solicitation of an offer to buy any securities or a solicitation of any vote or approval. BEFORE MAKING ANY VOTING OR INVESTMENT DECISION, INVESTORS ARE URGED TO READ THE JOINT PROXY STATEMENT/PROSPECTUS AND ANY OTHER DOCUMENTS TO BE FILED WITH THE SEC IN CONNECTION WITH THE PROPOSED MERGER OR INCORPORATED BY REFERENCE IN THE JOINT PROXY STATEMENT/PROSPECTUS BECAUSE THEY WILL CONTAIN IMPORTANT INFORMATION ABOUT ATLANTIC CAPITAL, FIRST SECURITY AND THE PROPOSED MERGER. When available, the joint proxy statement/prospectus will be delivered to shareholders of Atlantic Capital and stockholders of First Security. Investors will also be able to obtain copies of the joint proxy statement/prospectus and other relevant documents (when they become available) free of charge at the SEC’s website (www.sec.gov). Copies of documents filed with the SEC by Atlantic Capital will be available free of charge from Carol Tiarsmith, Executive Vice President and Chief Financial Officer, Atlantic Capital Bancshares, Inc., 3525 Piedmont Road, NE, Suite 500, Atlanta, Georgia 30305, telephone: (404) 995-6050. Documents filed with the SEC by First Security will be available free of charge from First Security by contacting John R. Haddock, Executive Vice President and Chief Financial Officer, First Security Group, Inc., 531 Broad Street, Chattanooga, Tennessee, telephone: (423) 308-2075.
Atlantic Capital, First Security and certain of their directors, executive officers and other members of management and employees may be deemed to be participants in the solicitation of proxies from the shareholders of Atlantic Capital and the stockholders of First Security in connection with the proposed merger. Information about the directors and executive officers of Atlantic Capital will be included in the joint proxy statement/prospectus for the proposed transaction. Information about the directors and executive officers of First Security is included in the proxy statement for its 2015 annual meeting of stockholders, which was filed with the SEC on April 29, 2015. Additional information regarding the interests of such participants and other persons who may be deemed participants in the transaction is included in the joint proxy statement/prospectus (or will be included in amendments or supplements thereto) and the other relevant documents filed with the SEC when they become available.
Proprietary & Confidential 3
|
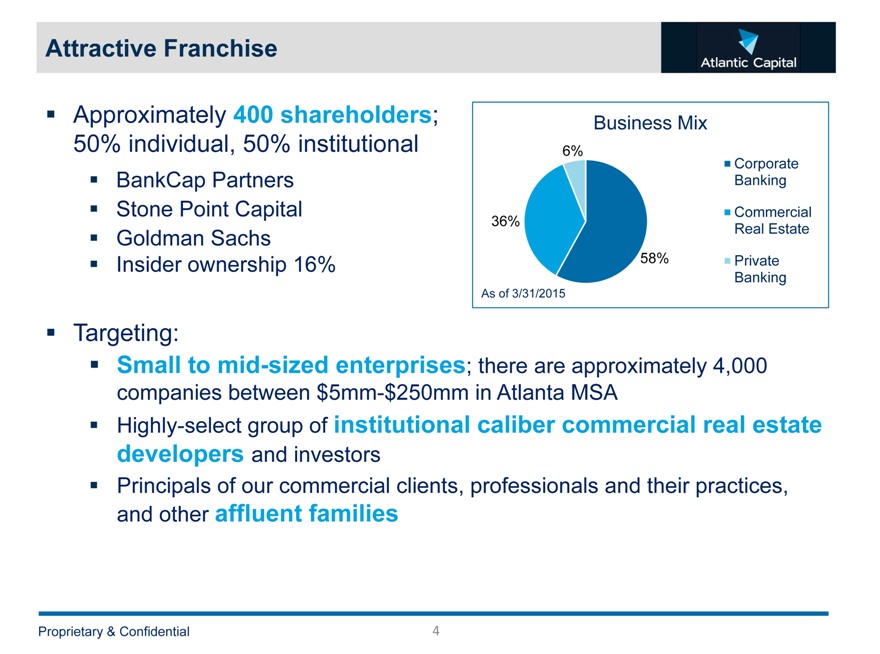
Attractive Franchise
Approximately 400 shareholders; 50% individual, 50% institutional
BankCap Partners Stone Point Capital Goldman Sachs Insider ownership 16%
Targeting:
Small to mid-sized enterprises; there are approximately 4,000 companies between $5mm-$250mm in Atlanta MSA
Highly-select group of institutional caliber commercial real estate developers and investors Principals of our commercial clients, professionals and their practices, and other affluent families
Business Mix
6% Corporate Banking
Commercial 36% Real Estate 58% Private Banking
As of 3/31/2015
Proprietary & Confidential 4
|
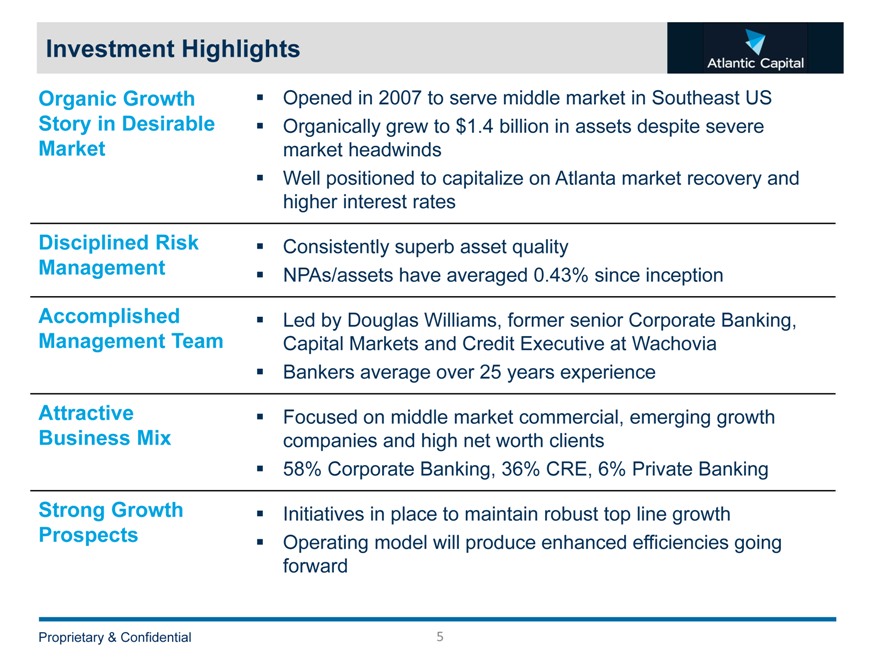
Investment Highlights
Organic Growth Story in Desirable Market Disciplined Risk Management Accomplished Management Team Attractive Business Mix Strong Growth Prospects
Opened in 2007 to serve middle market in Southeast US Organically grew to $1.4 billion in assets despite severe market headwinds Well positioned to capitalize on Atlanta market recovery and higher interest rates
Consistently superb asset quality
NPAs/assets have averaged 0.43% since inception
Led by Douglas Williams, former senior Corporate Banking, Capital Markets and Credit Executive at Wachovia Bankers average over 25 years experience
Focused on middle market commercial, emerging growth companies and high net worth clients 58% Corporate Banking, 36% CRE, 6% Private Banking
Initiatives in place to maintain robust top line growth Operating model will produce enhanced efficiencies going forward Prop
Proprietary & Confidential 5
|
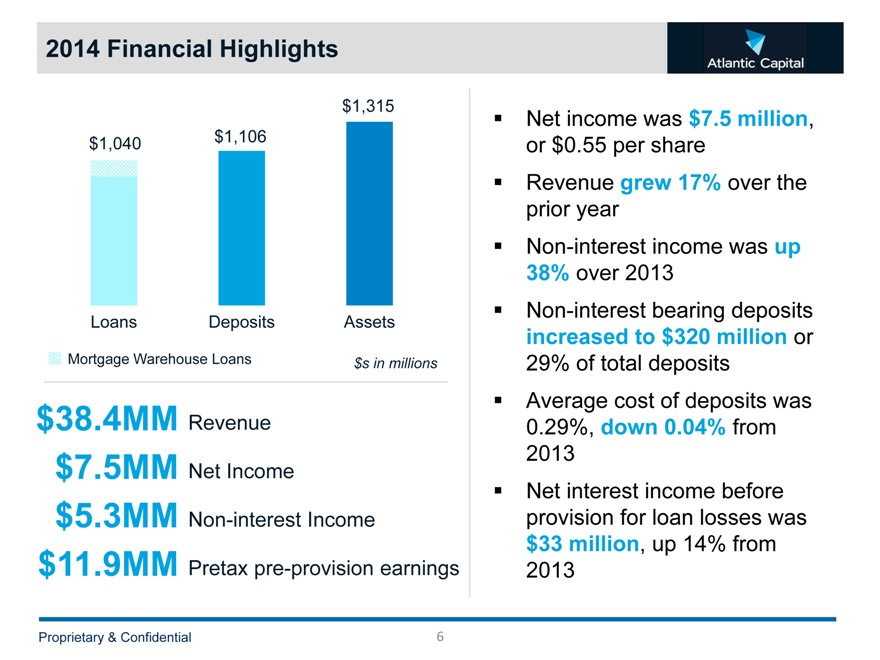
2014 Financial Highlights
$1,315 $1,040 $1,106
Loans Deposits Assets
Mortgage Warehouse Loans $s in millions
$38.4MM Revenue
$7.5MM Net Income $5.3MM Non-interest Income $11.9MM Pretax pre-provision earnings
Net income was $7.5 million, or $0.55 per share Revenue grew 17% over the prior year Non-interest income was up 38% over 2013 Non-interest bearing deposits increased to $320 million or 29% of total deposits Average cost of deposits was 0.29%, down 0.04% from 2013 Net interest income before provision for loan losses was $33 million, up 14% from 2013
Proprietary & Confidential 6
|
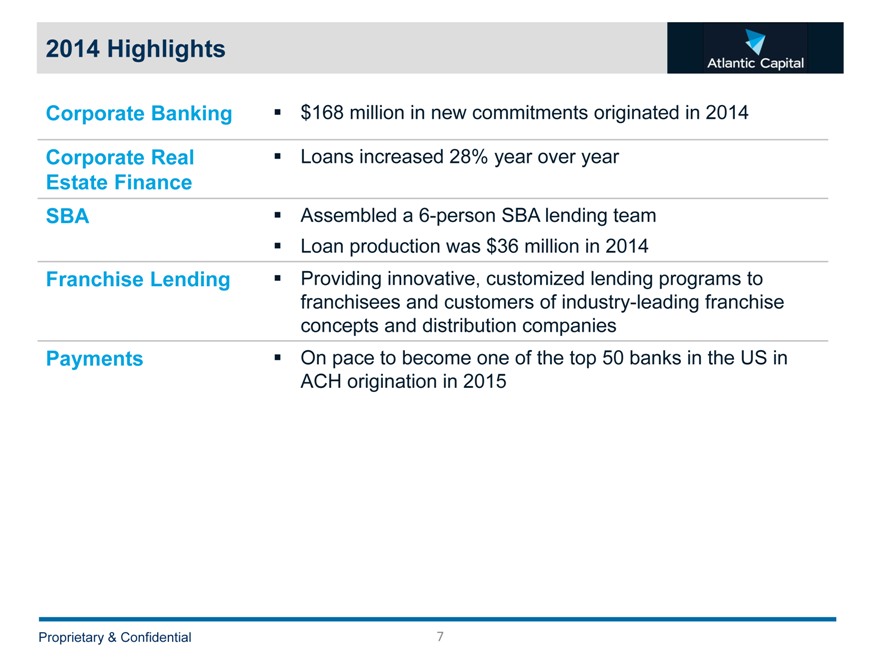
2014 Highlights
Corporate Banking
Corporate Real Estate Finance SBA
Franchise Lending
Payments
$168 million in new commitments originated in 2014
Loans increased 28% year over year
Assembled a 6-person SBA lending team Loan production was $36 million in 2014
Providing innovative, customized lending programs to franchisees and customers of industry-leading franchise concepts and distribution companies On pace to become one of the top 50 banks in the US in ACH origination in 2015 Proprietary & ential
Proprietary & Confidential 7
|

Q1 2015 Financial Highlights
$1,381 $1,085 $1,149
Loans Deposits Assets
Mortgage Warehouse Loans $s in millions
$10.2MM Revenue
$1.7MM Net Income $1.2MM Non-interest Income $3.0MM Pretax pre-provision earnings
Net income was $1.7 million, or $0.12 per share Revenue increased 19% since Q1 2014 Total loans were up $147 million from the same period last year (excluding Mortgage Warehouse) In the first quarter of the year, $83 million in new commitments were generated; $30 million of those were in the Corporate Bank Deposits were $236 million higher than Q1 2014
Proprietary & Confidential 8
|
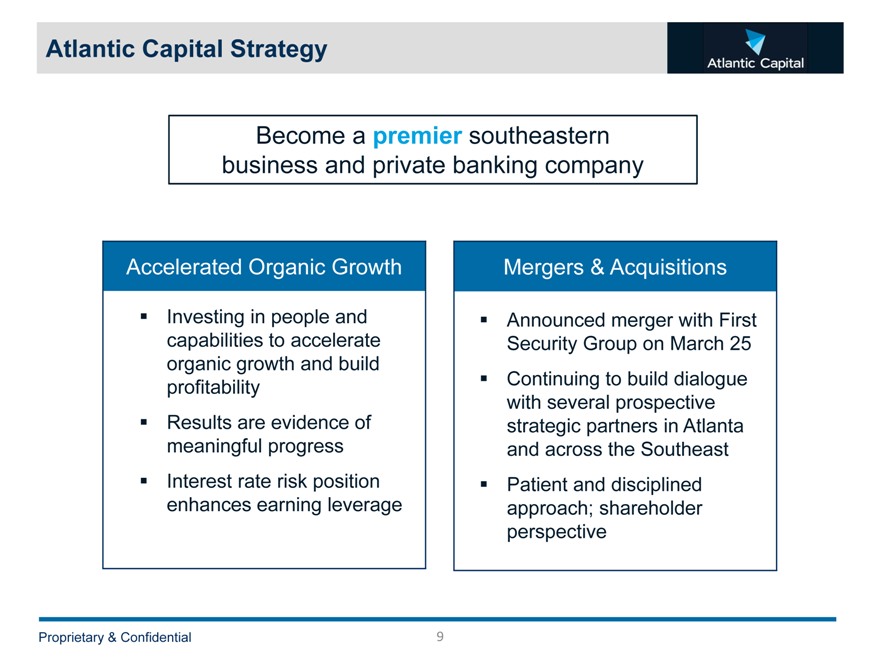
Atlantic Capital Strategy
Become a premier southeastern business and private banking company
Accelerated Organic Growth Mergers & Acquisitions
Investing in people and capabilities to accelerate organic growth and build profitability Results are evidence of meaningful progress Interest rate risk position enhances earning leverage
Announced merger with First Security Group on March 25 Continuing to build dialogue with several prospective strategic partners in Atlanta and across the Southeast Patient and disciplined approach; shareholder perspective
Proprietary & Confidential 9
|
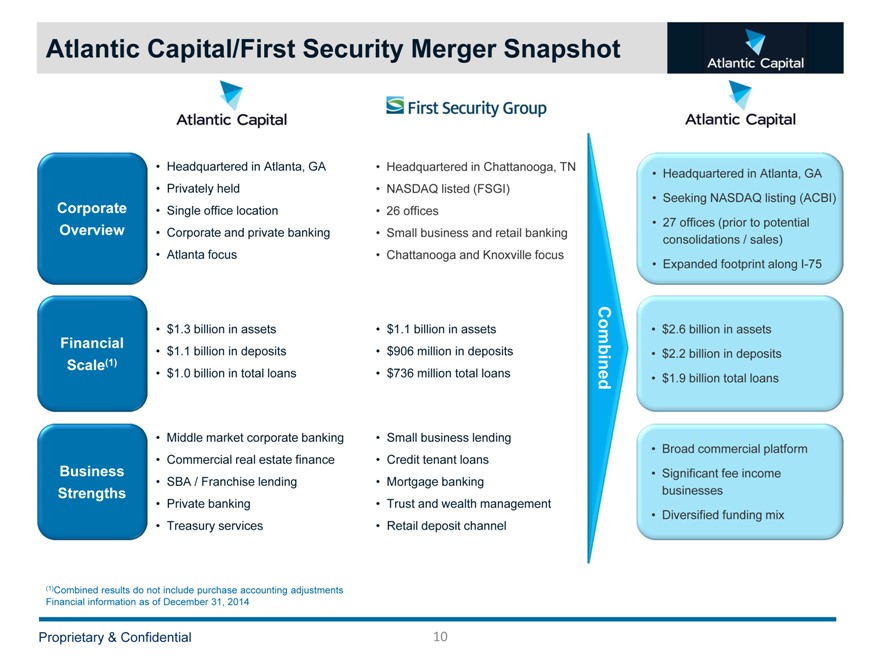
Atlantic Capital/First Security Merger Snapshot
Headquartered in Atlanta, GA Privately held Single office location Corporate and private banking Atlanta focus
$1.3 billion in assets $1.1 billion in deposits $1.0 billion in total loans
Middle market corporate banking Commercial real estate finance SBA / Franchise lending Private banking Treasury services
Headquartered in Chattanooga, TN NASDAQ listed (FSGI) 26 offices Small business and retail banking Chattanooga and Knoxville focus
$1.1 billion in assets $906 million in deposits $736 million total loans Combined Small business lending Credit tenant loans Mortgage banking Trust and wealth management Retail deposit channel
Headquartered in Atlanta, GA Seeking NASDAQ listing (ACBI) 27 offices (prior to potential consolidations / sales) Expanded footprint along I-75
$2.6 billion in assets $2.2 billion in deposits $1.9 billion total loans
Broad commercial platform Significant fee income businesses Diversified funding mix
(1)Combined results do not include purchase accounting adjustments Financial information as of December 31, 2014
Proprietary & Confidential 10
|
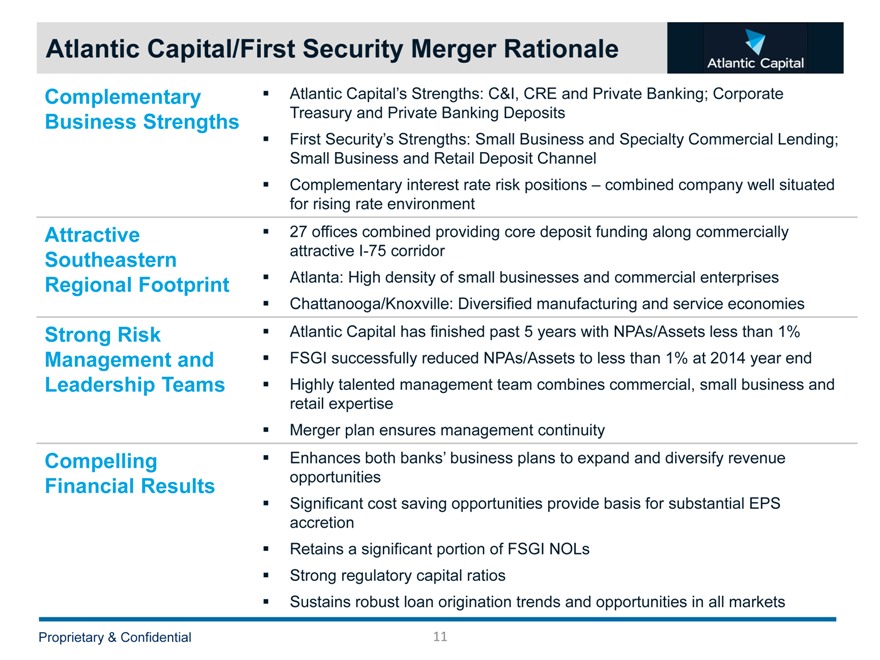
Atlantic Capital/First Security Merger Rationale
Complementary Business Strengths
Attractive Southeastern Regional Footprint
Strong Risk Management and Leadership Teams
Compelling Financial Results
Atlantic Capital’s Strengths: C&I, CRE and Private Banking; Corporate Treasury and Private Banking Deposits First Security’s Strengths: Small Business and Specialty Commercial Lending; Small Business and Retail Deposit Channel Complementary interest rate risk positions – combined company well situated for rising rate environment 27 offices combined providing core deposit funding along commercially attractive I-75 corridor Atlanta: High density of small businesses and commercial enterprises Chattanooga/Knoxville: Diversified manufacturing and service economies Atlantic Capital has finished past 5 years with NPAs/Assets less than 1% FSGI successfully reduced NPAs/Assets to less than 1% at 2014 year end Highly talented management team combines commercial, small business and retail expertise Merger plan ensures management continuity Enhances both banks’ business plans to expand and diversify revenue opportunities Significant cost saving opportunities provide basis for substantial EPS accretion Retains a significant portion of FSGI NOLs Strong regulatory capital ratios Sustains robust loan origination trends and opportunities in all markets
Proprietary & Confidential 11
|
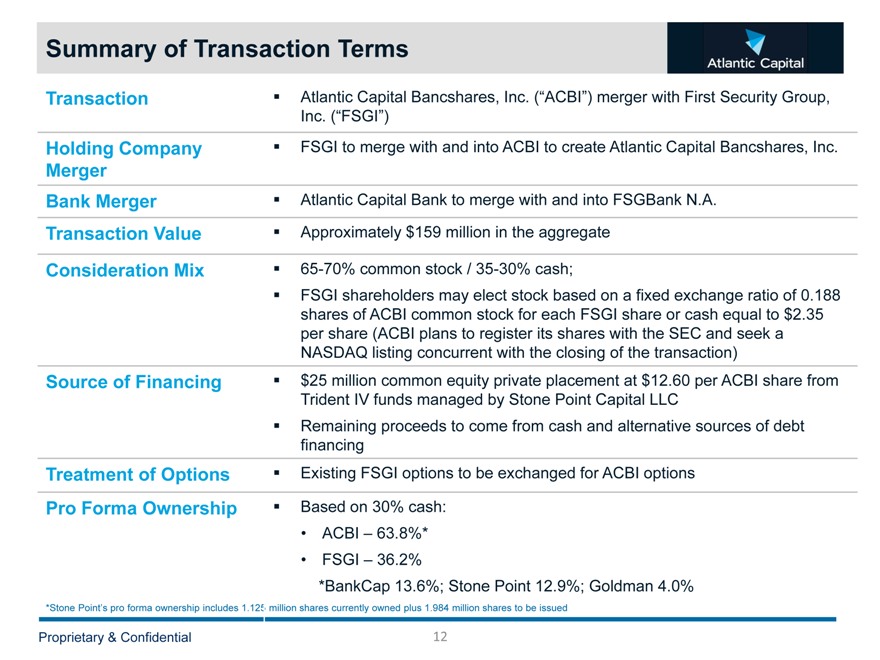
Summary of Transaction Terms
Transaction
Holding Company Merger Bank Merger Transaction Value Consideration Mix
Source of Financing
Treatment of Options Pro Forma Ownership
Atlantic Capital Bancshares, Inc. (“ACBI”) merger with First Security Group, Inc. (“FSGI”) FSGI to merge with and into ACBI to create Atlantic Capital Bancshares, Inc.
Atlantic Capital Bank to merge with and into FSGBank N.A. Approximately $159 million in the aggregate
65-70% common stock / 35-30% cash;
FSGI shareholders may elect stock based on a fixed exchange ratio of 0.188 shares of ACBI common stock for each FSGI share or cash equal to $2.35 per share (ACBI plans to register its shares with the SEC and seek a NASDAQ listing concurrent with the closing of the transaction) $25 million common equity private placement at $12.60 per ACBI share from Trident IV funds managed by Stone Point Capital LLC
Remaining proceeds to come from cash and alternative sources of debt financing Existing FSGI options to be exchanged for ACBI options
Based on 30% cash:
ACBI – 63.8%*
FSGI – 36.2%
*BankCap 13.6%; Stone Point 12.9%; Goldman 4.0%
*Stone Point’s pro forma ownership includes 1.125 million shares currently owned plus 1.984 million shares to be issued
Proprietary & Confidential 12
|
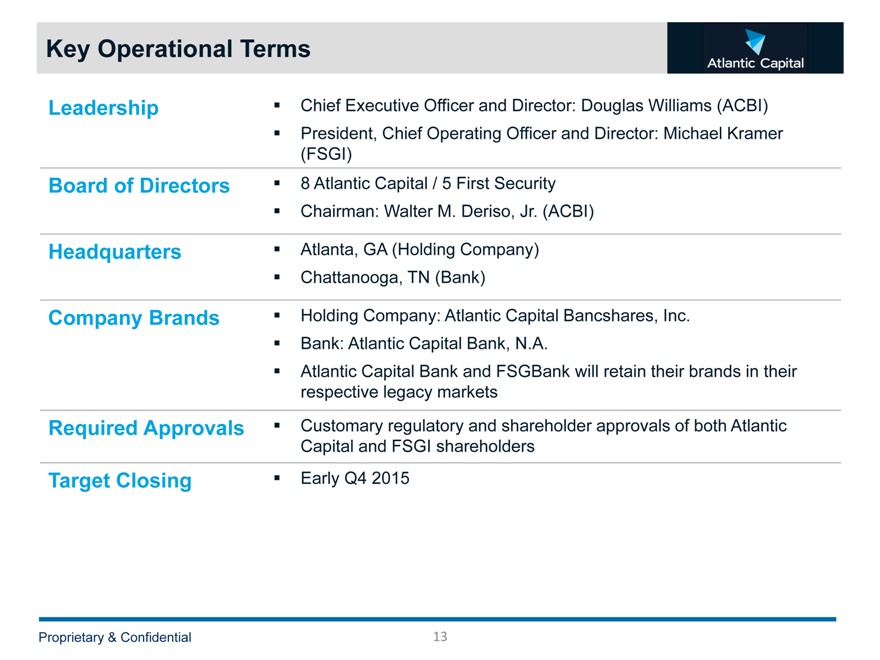
Key Operational Terms
Leadership Board of Directors Headquarters Company Brands
Required Approvals
Target Closing
Chief Executive Officer and Director: Douglas Williams (ACBI) President, Chief Operating Officer and Director: Michael Kramer (FSGI)
8 |
| Atlantic Capital / 5 First Security Chairman: Walter M. Deriso, Jr. (ACBI) |
Atlanta, GA (Holding Company) Chattanooga, TN (Bank)
Holding Company: Atlantic Capital Bancshares, Inc. Bank: Atlantic Capital Bank, N.A.
Atlantic Capital Bank and FSGBank will retain their brands in their respective legacy markets Customary regulatory and shareholder approvals of both Atlantic Capital and FSGI shareholders Early Q4 2015
Proprietary & Confidential 13
|
Pro Forma Financial Results
Key Merger Assumptions Estimated Pro Forma Financial Results
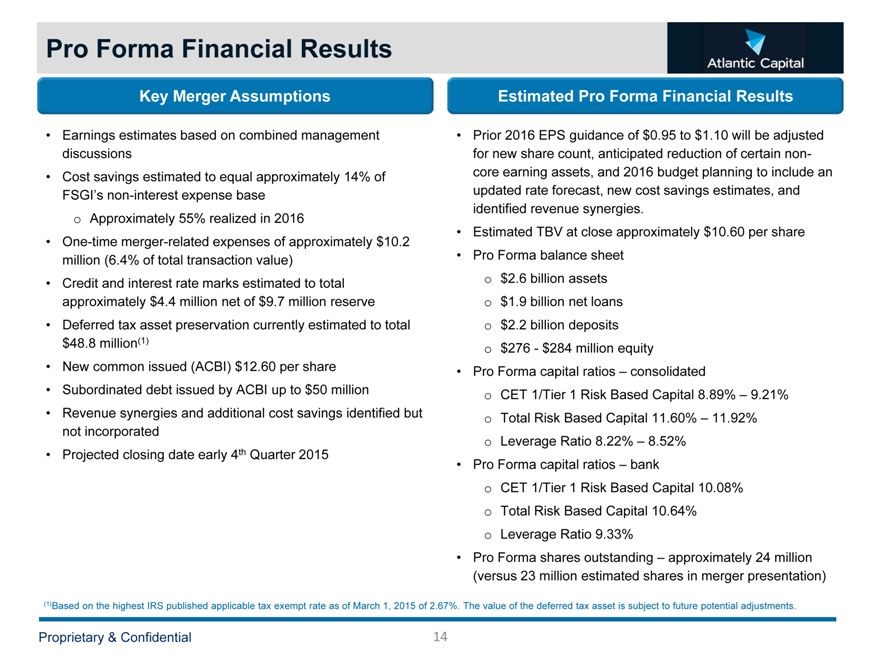
Earnings estimates based on combined management discussions Cost savings estimated to equal approximately 14% of FSGI’s non-interest expense base o Approximately 55% realized in 2016 One-time merger-related expenses of approximately $10.2 million (6.4% of total transaction value) Credit and interest rate marks estimated to total approximately $4.4 million net of $9.7 million reserve Deferred tax asset preservation currently estimated to total $48.8 million(1) New common issued (ACBI) $12.60 per share Subordinated debt issued by ACBI up to $50 million Revenue synergies and additional cost savings identified but not incorporated Projected closing date early 4th Quarter 2015
Prior 2016 EPS guidance of $0.95 to $1.10 will be adjusted for new share count, anticipated reduction of certain non-core earning assets, and 2016 budget planning to include an updated rate forecast, new cost savings estimates, and identified revenue synergies.
Estimated TBV at close approximately $10.60 per share Pro Forma balance sheet
$2.6 billion assets $1.9 billion net loans $2.2 billion deposits $276—$284 million equity
Pro Forma capital ratios – consolidated
CET 1/Tier 1 Risk Based Capital 8.89% – 9.21% Total Risk Based Capital 11.60% – 11.92% Leverage Ratio 8.22% – 8.52%
Pro Forma capital ratios – bank
CET 1/Tier 1 Risk Based Capital 10.08% Total Risk Based Capital 10.64% Leverage Ratio 9.33%
Pro Forma shares outstanding – approximately 24 million (versus 23 million estimated shares in merger presentation)
(1)Based on the highest IRS published applicable tax exempt rate as of March 1, 2015 of 2.67%. The value of the deferred tax asset is subject to future potential adjustments.
Proprietary & Confidential 14
|
Attractive Market Demographics
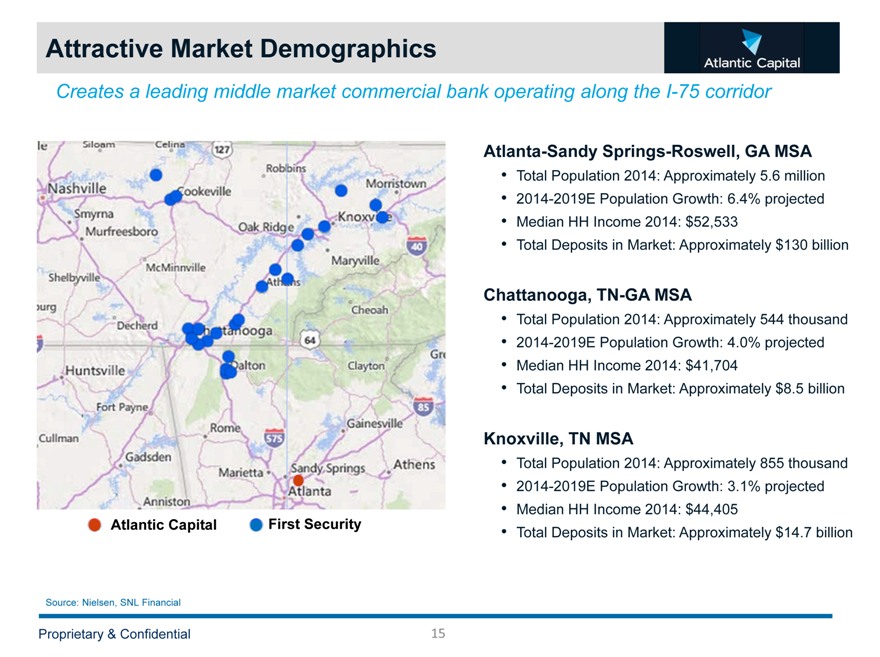
Creates a leading middle market commercial bank operating along the I-75 corridor
Atlantic Capital First Security
Atlanta-Sandy Springs-Roswell, GA MSA
Total Population 2014: Approximately 5.6 million 2014-2019E Population Growth: 6.4% projected Median HH Income 2014: $52,533 Total Deposits in Market: Approximately $130 billion
Chattanooga, TN-GA MSA
Total Population 2014: Approximately 544 thousand 2014-2019E Population Growth: 4.0% projected Median HH Income 2014: $41,704 Total Deposits in Market: Approximately $8.5 billion
Knoxville, TN MSA
Total Population 2014: Approximately 855 thousand 2014-2019E Population Growth: 3.1% projected Median HH Income 2014: $44,405 Total Deposits in Market: Approximately $14.7 billion
Source: Nielsen, SNL Financial
Proprietary & Confidential 15
|
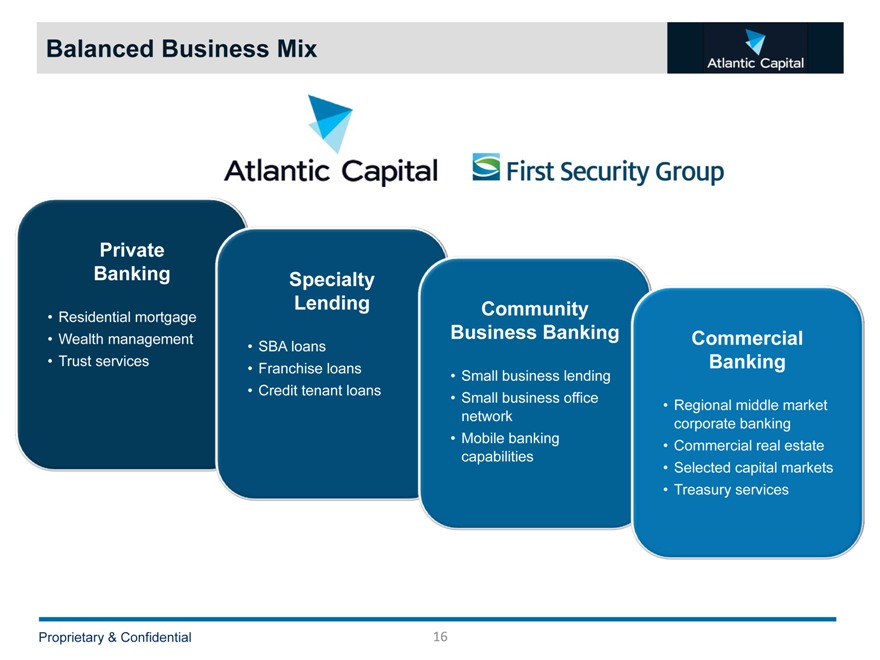
Balanced Business Mix
Private Banking
Residential mortgage Wealth management Trust services
Specialty Lending
SBA loans Franchise loans Credit tenant loans
Community Business Banking
Small business lending Small business office network Mobile banking capabilities
Commercial Banking
Regional middle market corporate banking Commercial real estate Selected capital markets Treasury services
Proprietary & Confidential 16
|
Attractive Deposit Mix
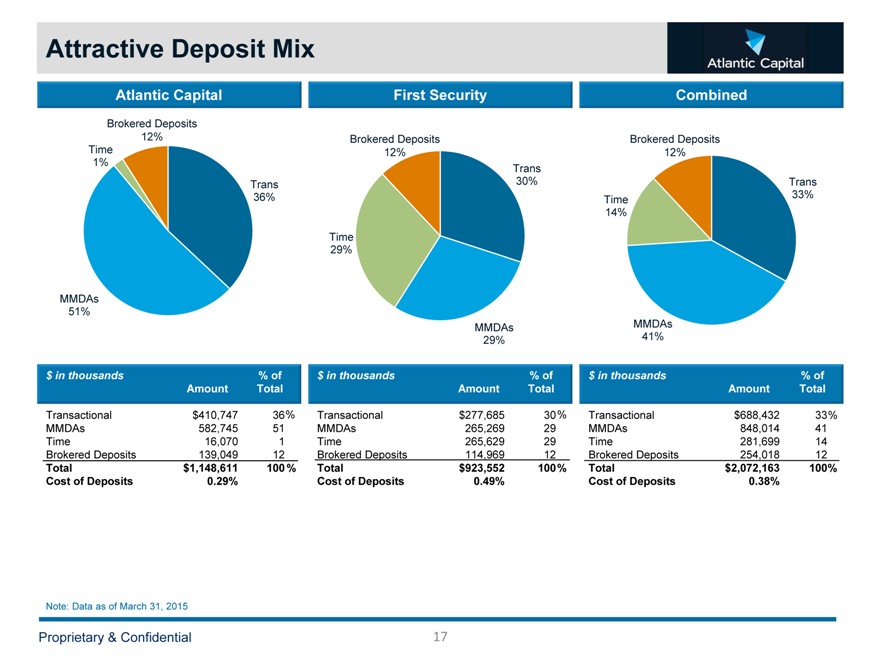
Atlantic Capital First Security Combined
Brokered Deposits
12% Brokered Deposits Brokered Deposits Time 12% 12% 1% Trans
Trans 30% Trans 36% 33% Time 14%
Time 29%
MMDAs 51%
MMDAs MMDAs 29% 41%
$ in thousands % of $ in thousands % of $ in thousands % of Amount Total Amount Total Amount Total
Transactional $410,747 36% Transactional $277,685 30% Transactional $688,432 33% MMDAs 582,745 51 MMDAs 265,269 29 MMDAs 848,014 41 Time 16,070 1 Time 265,629 29 Time 281,699 14 Brokered Deposits 139,049 12 Brokered Deposits 114,969 12 Brokered Deposits 254,018 12
Total $1,148,611 100 % Total $923,552 100% Total $2,072,163 100% Cost of Deposits 0.29% Cost of Deposits 0.49% Cost of Deposits 0.38%
Note: Data as of March 31, 2015
Proprietary & Confidential 17
|
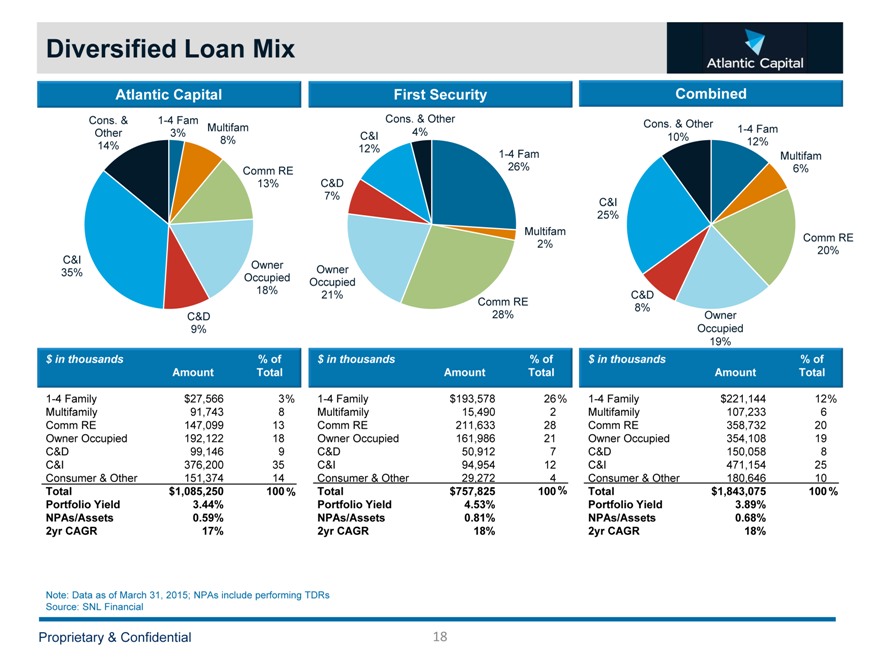
Diversified Loan Mix
Atlantic Capital First Security Combined
Cons. & 1-4 Fam Cons. & Other
Multifam Cons. & Other
Other 3% 4% 1-4 Fam
8% C&I 10%
14% 12% 12%
1-4 Fam Multifam Comm RE 26% 6% 13% C&D
7%
C&I 25% Multifam
Comm RE 2% C&I 20% Owner Owner 35% Occupied Occupied 18% 21% C&D
Comm RE
8%
C&D 28% Owner
9% Occupied 19% $ in thousands % of $ in thousands % of $ in thousands % of Amount Total Amount Total Amount Total
1-4 Family $27,566 3% 1-4 Family $193,578 26% 1-4 Family $221,144 12% Multifamily 91,743 8 Multifamily 15,490 2 Multifamily 107,233 6 Comm RE 147,099 13 Comm RE 211,633 28 Comm RE 358,732 20 Owner Occupied 192,122 18 Owner Occupied 161,986 21 Owner Occupied 354,108 19 C&D 99,146 9 C&D 50,912 7 C&D 150,058 8 C&I 376,200 35 C&I 94,954 12 C&I 471,154 25 Consumer & Other 151,374 14 Consumer & Other 29,272 4 Consumer & Other 180,646 10
Total $1,085,250 100% Total $757,825 100% Total $1,843,075 100% Portfolio Yield 3.44% Portfolio Yield 4.53% Portfolio Yield 3.89% NPAs/Assets 0.59% NPAs/Assets 0.81% NPAs/Assets 0.68% 2yr CAGR 17% 2yr CAGR 18% 2yr CAGR 18%
Note: Data as of March 31, 2015; NPAs include performing TDRs Source: SNL Financial
Proprietary & Confidential 18
|
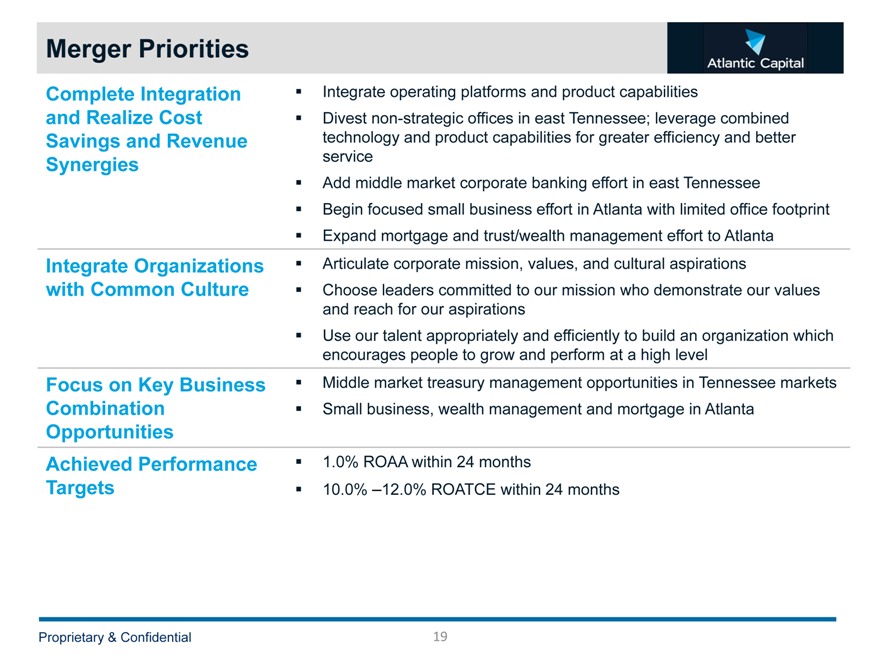
Merger Priorities
Complete Integration and Realize Cost Savings and Revenue SynergiesIntegrate Organizations with Common Culture
Focus on Key Business Combination Opportunities Achieved Performance Targets
Integrate operating platforms and product capabilities
Divest non-strategic offices in east Tennessee; leverage combined technology and product capabilities for greater efficiency and better service Add middle market corporate banking effort in east Tennessee Begin focused small business effort in Atlanta with limited office footprint Expand mortgage and trust/wealth management effort to Atlanta Articulate corporate mission, values, and cultural aspirations Choose leaders committed to our mission who demonstrate our values and reach for our aspirations Use our talent appropriately and efficiently to build an organization which encourages people to grow and perform at a high level Middle market treasury management opportunities in Tennessee markets Small business, wealth management and mortgage in Atlanta
1.0% ROAA within 24 months
10.0% –12.0% ROATCE within 24 months
Proprietary & Confidential 19
|
APPENDIX
|

Management BiographiesName and Title Age Experience
Walter M. “Sonny” Deriso, Jr. Chairman (Non-Executive) Douglas Williams
Chief Executive OfficerMichael Kramer
President,
Chief Operating Officer
68 57 57
Retired Vice Chairman of Synovus Financial Corp. in Columbus, Georgia. Former President of Security Bank and Trust Company of Albany, a Synovus bank Former Partner in the law firm of Divine, Wilkin, Deriso, Raulerson & Fields Former Chairman of the Georgia Bankers Association
Current Member of the Board of Trustees of Emory University, member of the Board of Directors of Post Properties, Chairman of the Board of the Georgia Regional Transportation Authority (GRTA), Chairman of The Foundation of the Methodist Children’s Home of the South Georgia Conference and member of the Board of Directors of the Georgia Chamber of Commerce
Chief Executive Officer of Atlantic Capital since its inception
Former Managing Director and Head of Wachovia Corporation’s International Corporate Finance Group Held numerous roles within Wachovia, including Executive Vice President and Head of the Global Corporate Banking Division; Chief Risk Officer for all corporate, institutional, and wholesale banking activities; Executive Vice President and Co-Head of Wachovia’s Capital Markets Division and Executive Vice President and Head of Wachovia’s US Corporate Banking Division Chairman of the Community Depository Institutions Advisory Council (CDIAC) of the Federal Reserve Bank of Atlanta and its representative to the CDIAC of the Federal Reserve Board of Governors Serves on the Boards of the Metro Atlanta Chamber of Commerce, the Georgia Chamber of Commerce, and the YMCA of Metropolitan Atlanta and the High Museum of Art and is a Member of the Buckhead Coalition
Chief Executive Officer and President of First Security since December and Chief Executive Officer of FSGBank since 2011 Former Managing Director of Ridley Capital Group Former Director, Chief Executive Officer and President of Ohio Legacy Corporation Former Chief Operating Officer and Chief Technology Officer of Integra Bank Corporation Serves on the Boards of Chattanooga Chamber of Commerce, Chattanooga, United Way, The Tennessee Bankers Association and the Chattanooga Young Life Committee
Proprietary & Confidential 21
|
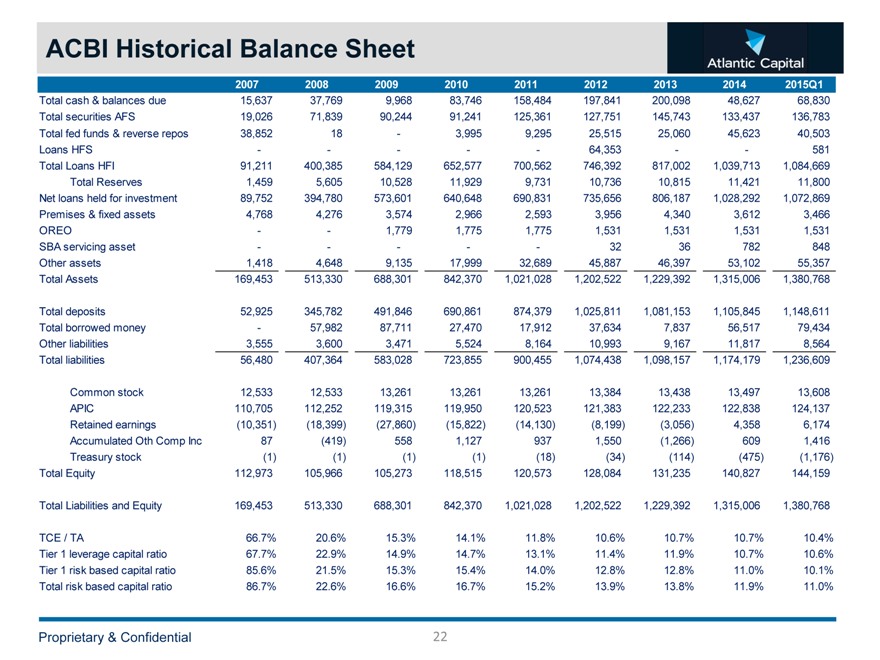
ACBI Historical Balance Sheet
2007 2008 2009 2010 2011 2012 2013 2014 2015Q1
Total cash & balances due 15,637 37,769 9,968 83,746 158,484 197,841 200,098 48,627 68,830 Total securities AFS 19,026 71,839 90,244 91,241 125,361 127,751 145,743 133,437 136,783 Total fed funds & reverse repos 38,852 18 — 3,995 9,295 25,515 25,060 45,623 40,503 Loans HFS — — — — — 64,353 — — 581 Total Loans HFI 91,211 400,385 584,129 652,577 700,562 746,392 817,002 1,039,713 1,084,669 Total Reserves 1,459 5,605 10,528 11,929 9,731 10,736 10,815 11,421 11,800 Net loans held for investment 89,752 394,780 573,601 640,648 690,831 735,656 806,187 1,028,292 1,072,869 Premises & fixed assets 4,768 4,276 3,574 2,966 2,593 3,956 4,340 3,612 3,466 OREO — — 1,779 1,775 1,775 1,531 1,531 1,531 1,531 SBA servicing asset — — — — — 32 36 782 848 Other assets 1,418 4,648 9,135 17,999 32,689 45,887 46,397 53,102 55,357 Total Assets 169,453 513,330 688,301 842,370 1,021,028 1,202,522 1,229,392 1,315,006 1,380,768
Total deposits 52,925 345,782 491,846 690,861 874,379 1,025,811 1,081,153 1,105,845 1,148,611 Total borrowed money — 57,982 87,711 27,470 17,912 37,634 7,837 56,517 79,434 Other liabilities 3,555 3,600 3,471 5,524 8,164 10,993 9,167 11,817 8,564 Total liabilities 56,480 407,364 583,028 723,855 900,455 1,074,438 1,098,157 1,174,179 1,236,609
Common stock 12,533 12,533 13,261 13,261 13,261 13,384 13,438 13,497 13,608 APIC 110,705 112,252 119,315 119,950 120,523 121,383 122,233 122,838 124,137 Retained earnings (10,351) (18,399) (27,860) (15,822) (14,130) (8,199) (3,056) 4,358 6,174 Accumulated Oth Comp Inc 87 (419) 558 1,127 937 1,550 (1,266) 609 1,416 Treasury stock (1) (1) (1) (1) (18) (34) (114) (475) (1,176) Total Equity 112,973 105,966 105,273 118,515 120,573 128,084 131,235 140,827 144,159
Total Liabilities and Equity 169,453 513,330 688,301 842,370 1,021,028 1,202,522 1,229,392 1,315,006 1,380,768
TCE / TA 66.7% 20.6% 15.3% 14.1% 11.8% 10.6% 10.7% 10.7% 10.4% Tier 1 leverage capital ratio 67.7% 22.9% 14.9% 14.7% 13.1% 11.4% 11.9% 10.7% 10.6% Tier 1 risk based capital ratio 85.6% 21.5% 15.3% 15.4% 14.0% 12.8% 12.8% 11.0% 10.1% Total risk based capital ratio 86.7% 22.6% 16.6% 16.7% 15.2% 13.9% 13.8% 11.9% 11.0%
Proprietary & Confidential 22
|
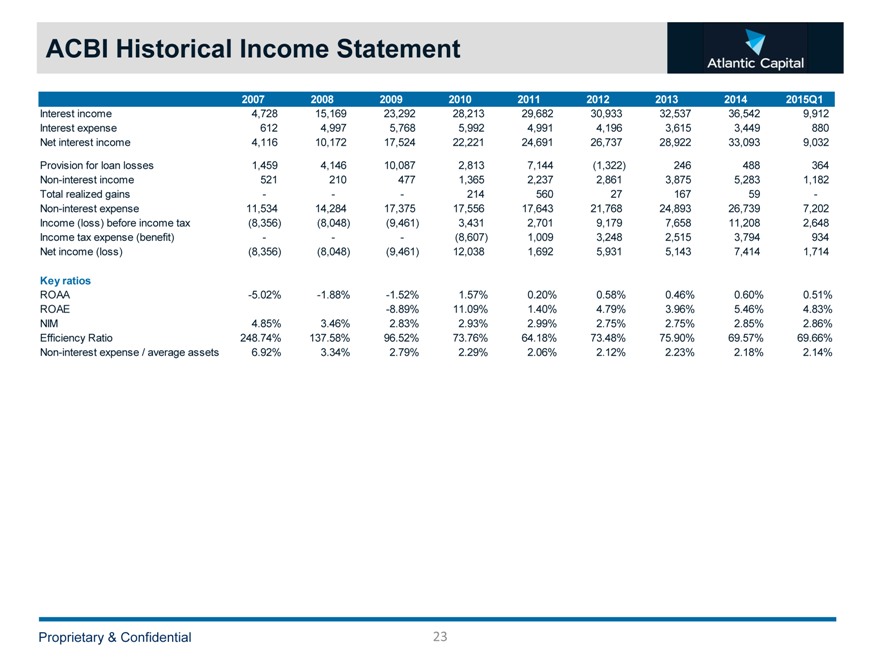
ACBI Historical Income Statement
($ in thousands)
2007 2008 2009 2010 2011 2012 2013 2014 2015Q1
Interest income 4,728 15,169 23,292 28,213 29,682 30,933 32,537 36,542 9,912 Interest expense 612 4,997 5,768 5,992 4,991 4,196 3,615 3,449 880 Net interest income 4,116 10,172 17,524 22,221 24,691 26,737 28,922 33,093 9,032
Provision for loan losses 1,459 4,146 10,087 2,813 7,144 (1,322) 246 488 364 Non-interest income 521 210 477 1,365 2,237 2,861 3,875 5,283 1,182 Total realized gains — — — 214 560 27 167 59 -Non-interest expense 11,534 14,284 17,375 17,556 17,643 21,768 24,893 26,739 7,202 Income (loss) before income tax (8,356) (8,048) (9,461) 3,431 2,701 9,179 7,658 11,208 2,648 Income tax expense (benefit) — — — (8,607) 1,009 3,248 2,515 3,794 934 Net income (loss) (8,356) (8,048) (9,461) 12,038 1,692 5,931 5,143 7,414 1,714
Key ratios
ROAA -5.02% -1.88% -1.52% 1.57% 0.20% 0.58% 0.46% 0.60% 0.51% ROAE -8.89% 11.09% 1.40% 4.79% 3.96% 5.46% 4.83% NIM 4.85% 3.46% 2.83% 2.93% 2.99% 2.75% 2.75% 2.85% 2.86% Efficiency Ratio 248.74% 137.58% 96.52% 73.76% 64.18% 73.48% 75.90% 69.57% 69.66% Non-interest expense / average assets 6.92% 3.34% 2.79% 2.29% 2.06% 2.12% 2.23% 2.18% 2.14%
Proprietary & Confidential 23
|
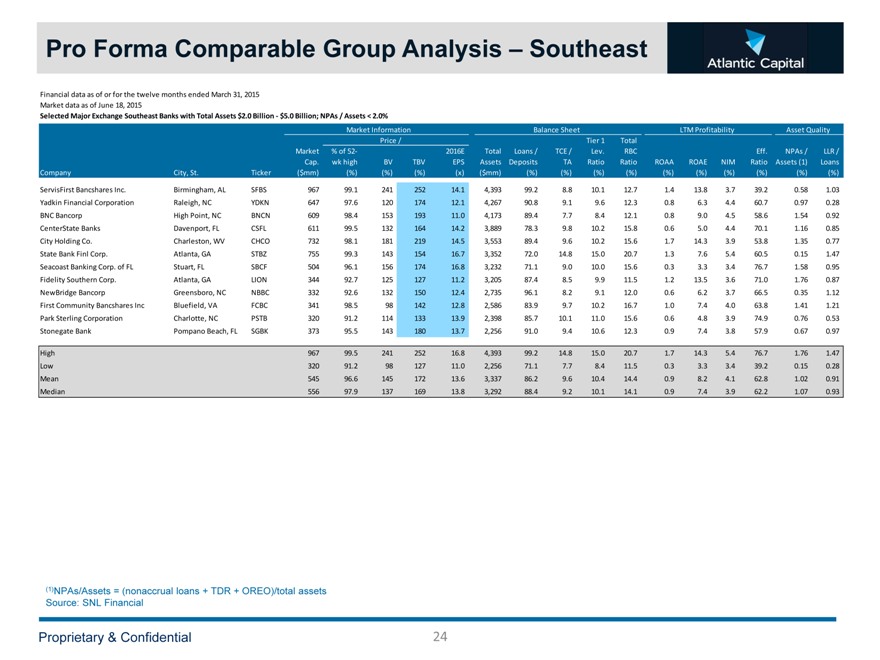
Pro Forma Comparable Group Analysis – Southeast
Financial data as of or for the twelve months ended March 31, 2015 Market data as of June 18, 2015
Selected Major Exchange Southeast Banks with Total Assets $2.0 Billion ? $5.0 Billion; NPAs / Assets < 2.0%
Market Information Balance Sheet LTM Profitability Asset Quality Price / Tier 1 Total Market % of 52? 2016E Total Loans / TCE / Lev. RBC Eff. NPAs / LLR / Cap. wk high BV TBV EPS Assets Deposits TA Ratio Ratio ROAA ROAE NIM Ratio Assets (1) Loans Company City, St. Ticker ($mm) (%) (%) (%) (x) ($mm) (%) (%) (%) (%) (%) (%) (%) (%) (%) (%)
ServisFirst Bancshares Inc. Birmingham, AL SFBS 967 99.1 241 252 14.1 4,393 99.2 8.8 10.1 12.7 1.4 13.8 3.7 39.2 0.58 1.03 Yadkin Financial Corporation Raleigh, NC YDKN 647 97.6 120 174 12.1 4,267 90.8 9.1 9.6 12.3 0.8 6.3 4.4 60.7 0.97 0.28 BNC Bancorp High Point, NC BNCN 609 98.4 153 193 11.0 4,173 89.4 7.7 8.4 12.1 0.8 9.0 4.5 58.6 1.54 0.92 CenterState Banks Davenport, FL CSFL 611 99.5 132 164 14.2 3,889 78.3 9.8 10.2 15.8 0.6 5.0 4.4 70.1 1.16 0.85 City Holding Co. Charleston, WV CHCO 732 98.1 181 219 14.5 3,553 89.4 9.6 10.2 15.6 1.7 14.3 3.9 53.8 1.35 0.77 State Bank Finl Corp. Atlanta, GA STBZ 755 99.3 143 154 16.7 3,352 72.0 14.8 15.0 20.7 1.3 7.6 5.4 60.5 0.15 1.47 Seacoast Banking Corp. of FL Stuart, FL SBCF 504 96.1 156 174 16.8 3,232 71.1 9.0 10.0 15.6 0.3 3.3 3.4 76.7 1.58 0.95 Fidelity Southern Corp. Atlanta, GA LION 344 92.7 125 127 11.2 3,205 87.4 8.5 9.9 11.5 1.2 13.5 3.6 71.0 1.76 0.87 NewBridge Bancorp Greensboro, NC NBBC 332 92.6 132 150 12.4 2,735 96.1 8.2 9.1 12.0 0.6 6.2 3.7 66.5 0.35 1.12 First Community Bancshares Inc Bluefield, VA FCBC 341 98.5 98 142 12.8 2,586 83.9 9.7 10.2 16.7 1.0 7.4 4.0 63.8 1.41 1.21 Park Sterling Corporation Charlotte, NC PSTB 320 91.2 114 133 13.9 2,398 85.7 10.1 11.0 15.6 0.6 4.8 3.9 74.9 0.76 0.53 Stonegate Bank Pompano Beach, FL SGBK 373 95.5 143 180 13.7 2,256 91.0 9.4 10.6 12.3 0.9 7.4 3.8 57.9 0.67 0.97
High 967 99.5 241 252 16.8 4,393 99.2 14.8 15.0 20.7 1.7 14.3 5.4 76.7 1.76 1.47 Low 320 91.2 98 127 11.0 2,256 71.1 7.7 8.4 11.5 0.3 3.3 3.4 39.2 0.15 0.28 Mean 545 96.6 145 172 13.6 3,337 86.2 9.6 10.4 14.4 0.9 8.2 4.1 62.8 1.02 0.91 Median 556 97.9 137 169 13.8 3,292 88.4 9.2 10.1 14.1 0.9 7.4 3.9 62.2 1.07 0.93
(1)NPAs/Assets = (nonaccrual loans + TDR + OREO)/total assets Source: SNL Financial
Proprietary & Confidential 24
|
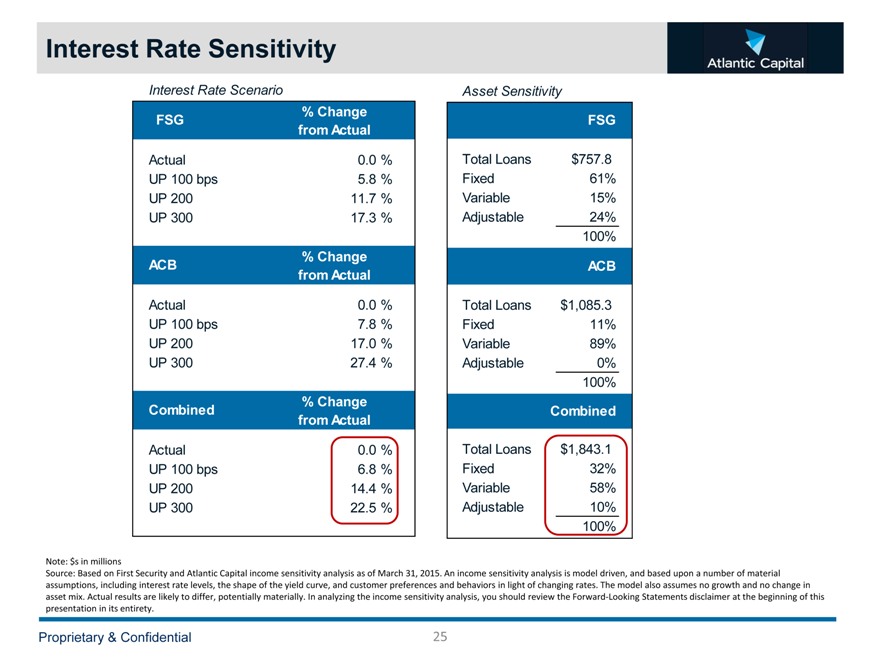
Interest Rate Sensitivity
Interest Rate Scenario Asset Sensitivity
% Change
FSG FSG from Actual
Actual 0.0 % Total Loans $757.8 UP 100 bps 5.8 % Fixed 61% UP 200 11.7 % Variable 15% UP 300 17.3 % Adjustable 24% 100%
% Change
ACB ACB from Actual
Actual 0.0 % Total Loans $1,085.3 UP 100 bps 7.8 % Fixed 11% UP 200 17.0 % Variable 89% UP 300 27.4 % Adjustable 0% 100%
% Change
Combined Combined from Actual
Actual 0.0 % Total Loans $1,843.1 UP 100 bps 6.8 % Fixed 32% UP 200 14.4 % Variable 58% UP 300 22.5 % Adjustable 10% 100%
Note: $s in millions
Source: Based on First Security and Atlantic Capital income sensitivity analysis as of March 31, 2015. An income sensitivity analysis
is model driven, and based upon a number of material assumptions, including interest rate levels, the shape of the yield curve, and
customer preferences and behaviors in light of changing rates. The model also assumes no growth and no change in asset mix. Actual results are likely to differ, potentially materially.
In analyzing the income sensitivity analysis, you should review the Forward?Looking Statements disclaimer at the beginning of this presentation in its entirety.
Proprietary & Confidential 25