SCHEDULE 14A
Consent Statement Pursuant to Section 14(a) of the
Securities Exchange Act of 1934
(Amendment No. )
Filed by the Registrant ¨ Filed by a Party other than the Registrant x
Check the appropriate box:
| ¨ | Preliminary Consent Statement | |||
| ¨ | Confidential, for Use of the Commission Only (as permitted by Rule 14a-6(e)(2)) | |||
| ¨ | Definitive Consent Statement | |||
| ¨ | Definitive Additional Materials | |||
| x | Soliciting Material Pursuant to § 240.14a-12 | |||
| Health Management Associates, Inc. | ||||
| (Name of Registrant as Specified In Its Charter) | ||||
Glenview Capital Partners, L.P. Glenview Capital Master Fund, Ltd. Glenview Institutional Partners, L.P. Glenview Offshore Opportunity Master Fund, Ltd. Glenview Capital Opportunity Fund, L.P. Glenview Capital Management, LLC Larry Robbins | ||||
| (Name of Person(s) Filing Consent Statement, if other than the Registrant) | ||||
| Payment of Filing Fee (check the appropriate box): | ||||
| x | No fee required. | |||
| ¨ | Fee computed on table below per Exchange Act Rule 14a-6(i)(4) and 0-11. | |||
| 1) | Title of each class of securities to which transaction applies:
| |||
| ||||
| 2) | Aggregate number of securities to which transaction applies:
| |||
| ||||
| 3) | Per unit price or other underlying value of transaction computed pursuant to Exchange Act Rule 0-11 (set forth the amount on which the filing fee is calculated and state how it was determined):
| |||
| ||||
| 4) | Proposed maximum aggregate value of transaction:
| |||
| ||||
| 5) | Total fee paid: | |||
| ||||
| ¨ | Fee paid previously with preliminary materials. | |||
| ¨ | Check box if any part of the fee is offset as provided by Exchange Act Rule 0-11(a)(2) and identify the filing for which the offsetting fee was paid previously. Identify the previous filing by registration statement number, or the Form or Schedule and the date of its filing. | |||
| 1) | Amount Previously Paid:
| |||
| ||||
| 2) | Form, Schedule or Registration Statement No.:
| |||
| ||||
| 3) | Filing Party:
| |||
| ||||
| 4) | Date Filed:
| |||
| ||||
On June 25, 2013, Glenview Capital Partners, L.P., Glenview Capital Master Fund, Ltd., Glenview Institutional Partners, L.P., Glenview Offshore Opportunity Master Fund, Ltd., Glenview Capital Opportunity Fund, L.P., Glenview Capital Management, LLC and Larry Robbins posted a slide presentation relating to Health Management Associates, Inc. to www.revitalizehma.com. A copy of the slide presentation is filed herewith as Exhibit 1.
Exhibit 1
| Revitalize HMA - The Case for Change Presentation to HMA Shareholders June 2013 |

| PAGE 2 Executive Summary - The Case for Change at HMA 1 Consistent track record of underperformance 2 Substandard financial management and focus 3 Elevated number of compliance related issues and concerns 4 Misalignment between Board direction and shareholder priorities 5 Sitting Board is insular and lacks a credible path to continuous improvement |
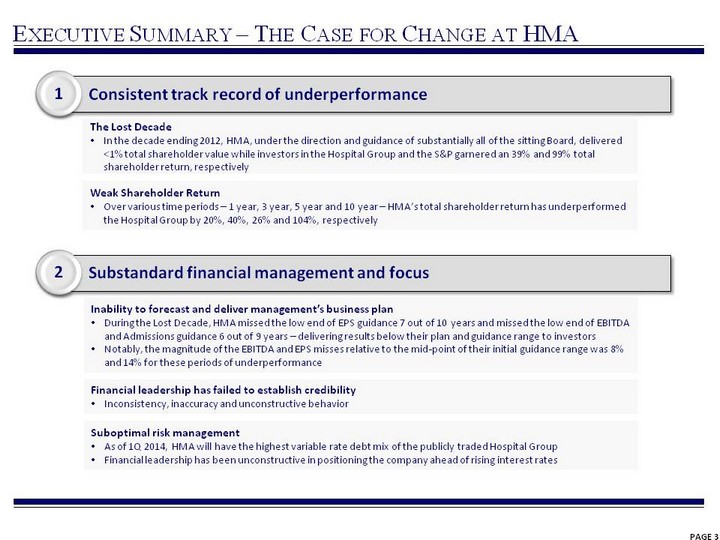
| PAGE 3 Executive Summary - The Case for Change at HMA The Lost Decade In the decade ending 2012, HMA, under the direction and guidance of substantially all of the sitting Board, delivered <1% total shareholder value while investors in the Hospital Group and the S&P garnered an 39% and 99% total shareholder return, respectively Weak Shareholder Return Over various time periods - 1 year, 3 year, 5 year and 10 year - HMA's total shareholder return has underperformed the Hospital Group by 20%, 40%, 26% and 104%, respectively Inability to forecast and deliver management's business plan During the Lost Decade, HMA missed the low end of EPS guidance 7 out of 10 years and missed the low end of EBITDA and Admissions guidance 6 out of 9 years - delivering results below their plan and guidance range to investors Notably, the magnitude of the EBITDA and EPS misses relative to the mid-point of their initial guidance range was 8% and 14% for these periods of underperformance Financial leadership has failed to establish credibility Inconsistency, inaccuracy and unconstructive behavior Suboptimal risk management As of 1Q 2014, HMA will have the highest variable rate debt mix of the publicly traded Hospital Group Financial leadership has been unconstructive in positioning the company ahead of rising interest rates 2 Substandard financial management and focus 1 Consistent track record of underperformance |
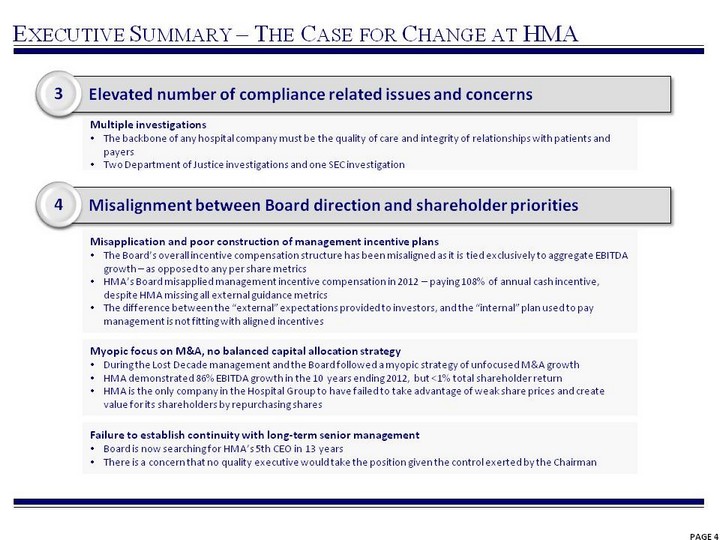
| PAGE 4 Myopic focus on M&A, no balanced capital allocation strategy During the Lost Decade management and the Board followed a myopic strategy of unfocused M&A growth HMA demonstrated 86% EBITDA growth in the 10 years ending 2012, but <1% total shareholder return HMA is the only company in the Hospital Group to have failed to take advantage of weak share prices and create value for its shareholders by repurchasing shares Failure to establish continuity with long-term senior management Board is now searching for HMA's 5th CEO in 13 years There is a concern that no quality executive would take the position given the control exerted by the Chairman Misapplication and poor construction of management incentive plans The Board's overall incentive compensation structure has been misaligned as it is tied exclusively to aggregate EBITDA growth - as opposed to any per share metrics HMA's Board misapplied management incentive compensation in 2012 - paying 108% of annual cash incentive, despite HMA missing all external guidance metrics The difference between the "external" expectations provided to investors, and the "internal" plan used to pay management is not fitting with aligned incentives Multiple investigations The backbone of any hospital company must be the quality of care and integrity of relationships with patients and payers Two Department of Justice investigations and one SEC investigation Executive Summary - The Case for Change at HMA 3 Elevated number of compliance related issues and concerns 4 Misalignment between Board direction and shareholder priorities |
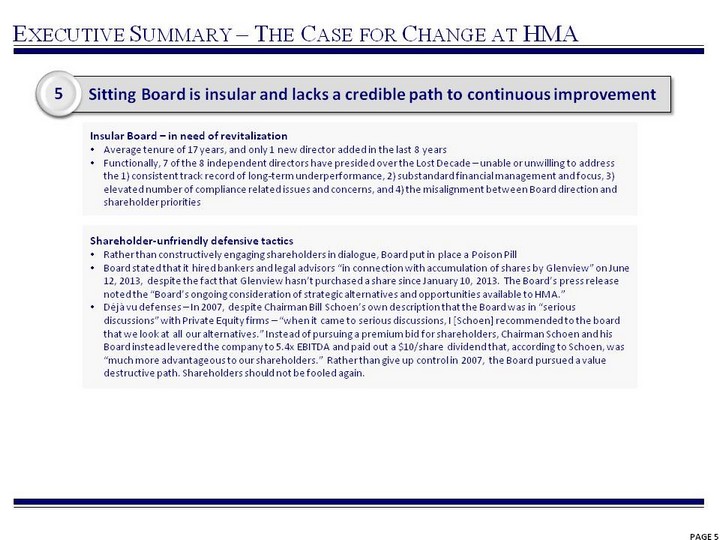
| PAGE 5 Executive Summary - The Case for Change at HMA Shareholder-unfriendly defensive tactics Rather than constructively engaging shareholders in dialogue, Board put in place a Poison Pill Board stated that it hired bankers and legal advisors "in connection with accumulation of shares by Glenview" on June 12, 2013, despite the fact that Glenview hasn't purchased a share since January 10, 2013. The Board's press release noted the "Board's ongoing consideration of strategic alternatives and opportunities available to HMA." Deja vu defenses - In 2007, despite Chairman Bill Schoen's own description that the Board was in "serious discussions" with Private Equity firms - "when it came to serious discussions, I [Schoen] recommended to the board that we look at all our alternatives." Instead of pursuing a premium bid for shareholders, Chairman Schoen and his Board instead levered the company to 5.4x EBITDA and paid out a $10/share dividend that, according to Schoen, was "much more advantageous to our shareholders." Rather than give up control in 2007, the Board pursued a value destructive path. Shareholders should not be fooled again. Insular Board - in need of revitalization Average tenure of 17 years, and only 1 new director added in the last 8 years Functionally, 7 of the 8 independent directors have presided over the Lost Decade - unable or unwilling to address the 1) consistent track record of long-term underperformance, 2) substandard financial management and focus, 3) elevated number of compliance related issues and concerns, and 4) the misalignment between Board direction and shareholder priorities 5 Sitting Board is insular and lacks a credible path to continuous improvement |
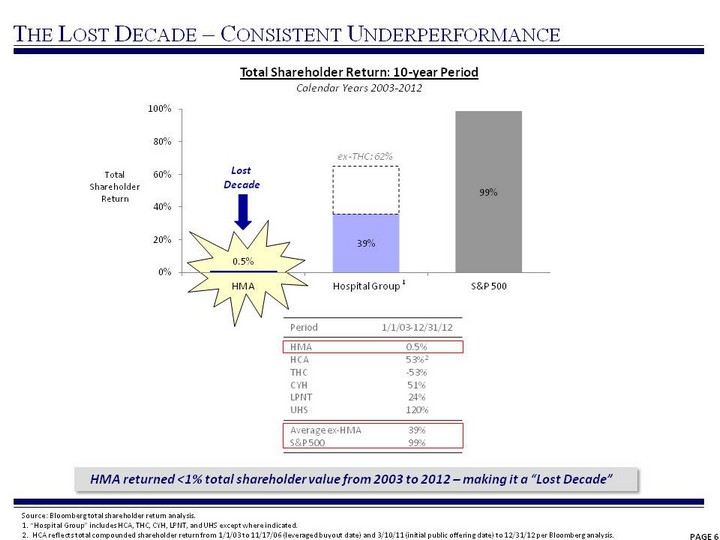
| (CHART) PAGE 6 The Lost Decade - Consistent Underperformance Source: Bloomberg total shareholder return analysis. 1. "Hospital Group" includes HCA, THC, CYH, LPNT, and UHS except where indicated. 2. HCA reflects total compounded shareholder return from 1/1/03 to 11/17/06 (leveraged buyout date) and 3/10/11 (initial public offering date) to 12/31/12 per Bloomberg analysis. HMA returned <1% total shareholder value from 2003 to 2012 - making it a "Lost Decade" Total Shareholder Return: 10-year Period Calendar Years 2003-2012 Period 1/1/03-12/31/12 HMA HCA THC CYH LPNT UHS 0.5% 53%2 -53% 51% 24% 120% Average ex-HMA S&P 500 39% 99% ex-THC: 62% Lost Decade Total Shareholder Return 1 |
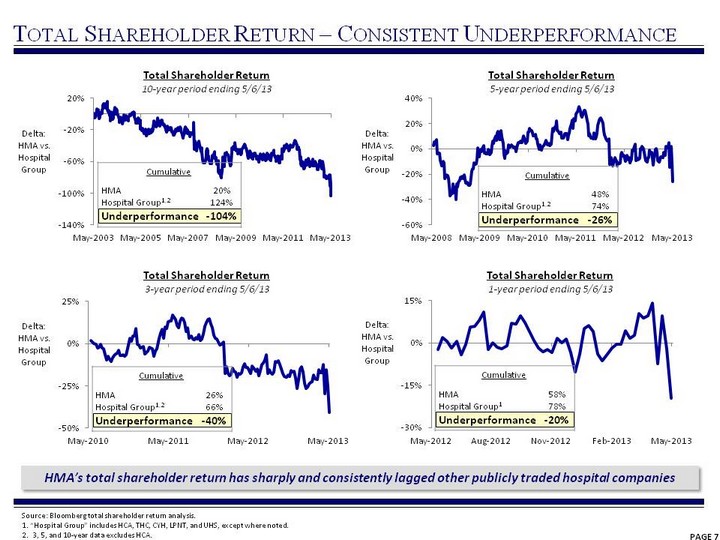
| PAGE 7 Total Shareholder Return - Consistent Underperformance HMA's total shareholder return has sharply and consistently lagged other publicly traded hospital companies Total Shareholder Return 3-year period ending 5/6/13 Total Shareholder Return 5-year period ending 5/6/13 Total Shareholder Return 1-year period ending 5/6/13 (CHART) (CHART) (CHART) Delta: HMA vs. Hospital Group Delta: HMA vs. Hospital Group Delta: HMA vs. Hospital Group Source: Bloomberg total shareholder return analysis. 1. "Hospital Group" includes HCA, THC, CYH, LPNT, and UHS, except where noted. 2. 3, 5, and 10-year data excludes HCA. (CHART) Total Shareholder Return 10-year period ending 5/6/13 Delta: HMA vs. Hospital Group Cumulative Cumulative HMA Hospital Group1,2 Underperformance 20% 124% -104% Cumulative Cumulative HMA Hospital Group1,2 Underperformance 26% 66% -40% Cumulative Cumulative HMA Hospital Group1,2 Underperformance 48% 74% -26% Cumulative Cumulative HMA Hospital Group1 Underperformance 58% 78% -20% |

| PAGE 8 Substandard Financial Management and Focus Source: Company filings, press releases, earnings calls and Morgan Stanley equity research. Guidance based on HMA investor communications/documents: 1) 10/22/02 Q4 earnings call transcript, 2) 10/21/03 Q4 earnings call transcript, 3) 10/26/04 Q4 earnings call transcript, 4) 11/15/05 Q4 earnings press release, 5) 2/22/06 Q4 earnings press release, 6) 2/20/08 Q4 earnings press release, 7) 1/13/09 press release, 8) 1/12/10 press release, 9) 1/10/11 press release, and 10) 1/9/12 press release. Notes: 11) Same-store admissions and EBITDA guidance was not explicitly provided for 2008. 12) Excludes HITECH incentive payments. HMA Reported Performance Metrics Relative to Low End of Initial Guidance Range HMA Reported Performance Metrics Relative to Low End of Initial Guidance Range HMA Reported Performance Metrics Relative to Low End of Initial Guidance Range HMA Reported Performance Metrics Relative to Low End of Initial Guidance Range ? = Missed Low End of Initial Guidance Range - = Achieved or Exceeded Low End of Initial Range Same-Store Admissions Adj. EBITDA Adj. EPS 20031 - ? - 20042 - ? ? 20053 ? ? ? 20064 ? ? ? 20075 ? ? ? 20086 Not Provided11 Not Provided11 ? 20097 - - - 20108 ? - - 20119 ? - ? 201210 ? ?12 ?12 10 Year Track Record MISSED 6 TIMES MISSED 6 TIMES MISSED 7 TIMES Over the past 10 years, management has consistently underperformed relative to their initial guidance In the instances where HMA missed the low end of their guidance range, the average magnitude of difference between reported metrics relative to the midpoint of the initial guidance range averages to be -8% for EBITDA and -14% for EPS |
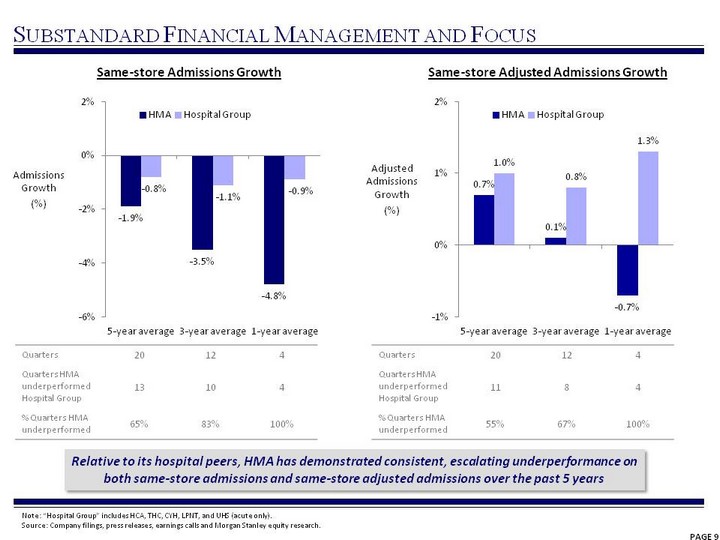
| PAGE 9 Substandard Financial Management and Focus Note: "Hospital Group" includes HCA, THC, CYH, LPNT, and UHS (acute only). Source: Company filings, press releases, earnings calls and Morgan Stanley equity research. Same-store Admissions Growth Relative to its hospital peers, HMA has demonstrated consistent, escalating underperformance on both same-store admissions and same-store adjusted admissions over the past 5 years (CHART) Same-store Adjusted Admissions Growth Quarters 20 12 4 Quarters HMA underperformed Hospital Group 13 10 4 % Quarters HMA underperformed 65% 83% 100% Admissions Growth (%) (CHART) Adjusted Admissions Growth (%) Quarters 20 12 4 Quarters HMA underperformed Hospital Group 11 8 4 % Quarters HMA underperformed 55% 67% 100% |
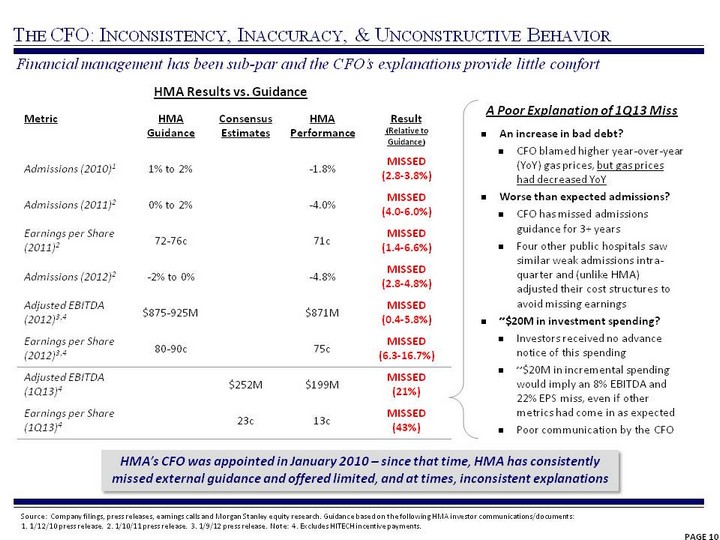
| PAGE 10 Metric HMA Guidance Consensus Estimates HMA Performance Result (Relative to Guidance) Admissions (2010)1 1% to 2% -1.8% MISSED (2.8-3.8%) Admissions (2011)2 0% to 2% -4.0% MISSED (4.0-6.0%) Earnings per Share (2011)2 72-76c 71c MISSED (1.4-6.6%) Admissions (2012)2 -2% to 0% -4.8% MISSED (2.8-4.8%) Adjusted EBITDA (2012)3,4 $875-925M $871M MISSED (0.4-5.8%) Earnings per Share (2012)3,4 80-90c 75c MISSED (6.3-16.7%) Adjusted EBITDA (1Q13)4 $252M $199M MISSED (21%) Earnings per Share (1Q13)4 23c 13c MISSED (43%) Source: Company filings, press releases, earnings calls and Morgan Stanley equity research. Guidance based on the following HMA investor communications/documents: 1. 1/12/10 press release. 2. 1/10/11 press release. 3. 1/9/12 press release. Note: 4. Excludes HITECH incentive payments. A Poor Explanation of 1Q13 Miss An increase in bad debt? CFO blamed higher year-over-year (YoY) gas prices, but gas prices had decreased YoY Worse than expected admissions? CFO has missed admissions guidance for 3+ years Four other public hospitals saw similar weak admissions intra- quarter and (unlike HMA) adjusted their cost structures to avoid missing earnings ~$20M in investment spending? Investors received no advance notice of this spending ~$20M in incremental spending would imply an 8% EBITDA and 22% EPS miss, even if other metrics had come in as expected Poor communication by the CFO Financial management has been sub-par and the CFO's explanations provide little comfort The CFO: Inconsistency, Inaccuracy, & Unconstructive Behavior HMA's CFO was appointed in January 2010 - since that time, HMA has consistently missed external guidance and offered limited, and at times, inconsistent explanations HMA Results vs. Guidance |
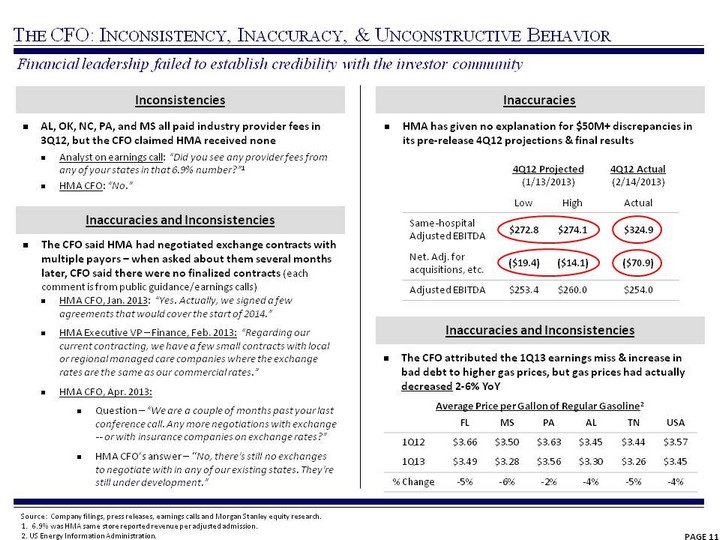
| PAGE 11 AL, OK, NC, PA, and MS all paid industry provider fees in 3Q12, but the CFO claimed HMA received none Analyst on earnings call: "Did you see any provider fees from any of your states in that 6.9% number?"1 HMA CFO: "No." Financial leadership failed to establish credibility with the investor community The CFO said HMA had negotiated exchange contracts with multiple payors - when asked about them several months later, CFO said there were no finalized contracts (each comment is from public guidance/earnings calls) HMA CFO, Jan. 2013: "Yes. Actually, we signed a few agreements that would cover the start of 2014." HMA Executive VP - Finance, Feb. 2013: "Regarding our current contracting, we have a few small contracts with local or regional managed care companies where the exchange rates are the same as our commercial rates." HMA CFO, Apr. 2013: Question - "We are a couple of months past your last conference call. Any more negotiations with exchange -- or with insurance companies on exchange rates?" HMA CFO's answer - "No, there's still no exchanges to negotiate with in any of our existing states. They're still under development." 4Q12 Projected (1/13/2013) 4Q12 Projected (1/13/2013) 4Q12 Actual (2/14/2013) Low High Actual Same-hospital Adjusted EBITDA $272.8 $274.1 $324.9 Net. Adj. for acquisitions, etc. ($19.4) ($14.1) ($70.9) Adjusted EBITDA $253.4 $260.0 $254.0 Average Price per Gallon of Regular Gasoline2 Average Price per Gallon of Regular Gasoline2 Average Price per Gallon of Regular Gasoline2 Average Price per Gallon of Regular Gasoline2 Average Price per Gallon of Regular Gasoline2 Average Price per Gallon of Regular Gasoline2 Average Price per Gallon of Regular Gasoline2 FL MS PA AL TN USA 1Q12 $3.66 $3.50 $3.63 $3.45 $3.44 $3.57 1Q13 $3.49 $3.28 $3.56 $3.30 $3.26 $3.45 % Change -5% -6% -2% -4% -5% -4% Inconsistencies Inaccuracies Inaccuracies and Inconsistencies Inaccuracies and Inconsistencies The CFO: Inconsistency, Inaccuracy, & Unconstructive Behavior Source: Company filings, press releases, earnings calls and Morgan Stanley equity research. 1. 6.9% was HMA same store reported revenue per adjusted admission. 2. US Energy Information Administration. The CFO attributed the 1Q13 earnings miss & increase in bad debt to higher gas prices, but gas prices had actually decreased 2-6% YoY HMA has given no explanation for $50M+ discrepancies in its pre-release 4Q12 projections & final results |
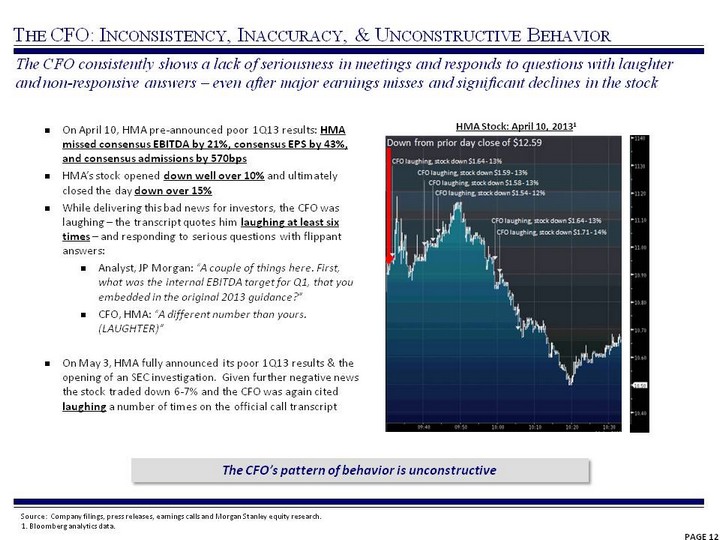
| PAGE 12 The CFO consistently shows a lack of seriousness in meetings and responds to questions with laughter and non-responsive answers - even after major earnings misses and significant declines in the stock On April 10, HMA pre-announced poor 1Q13 results: HMA missed consensus EBITDA by 21%, consensus EPS by 43%, and consensus admissions by 570bps HMA's stock opened down well over 10% and ultimately closed the day down over 15% While delivering this bad news for investors, the CFO was laughing - the transcript quotes him laughing at least six times - and responding to serious questions with flippant answers: Analyst, JP Morgan: "A couple of things here. First, what was the internal EBITDA target for Q1, that you embedded in the original 2013 guidance?" CFO, HMA: "A different number than yours. (LAUGHTER)" On May 3, HMA fully announced its poor 1Q13 results & the opening of an SEC investigation. Given further negative news the stock traded down 6-7% and the CFO was again cited laughing a number of times on the official call transcript The CFO's pattern of behavior is unconstructive HMA Stock: April 10, 20131 The CFO: Inconsistency, Inaccuracy, & Unconstructive Behavior Source: Company filings, press releases, earnings calls and Morgan Stanley equity research. 1. Bloomberg analytics data. |
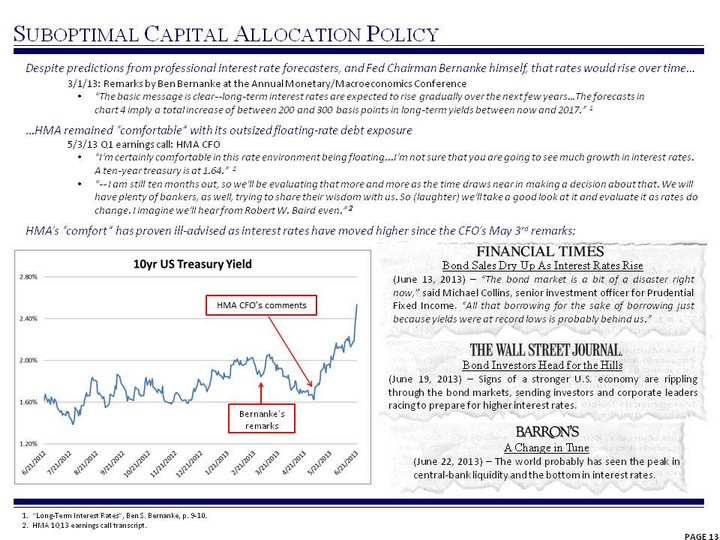
| Suboptimal Capital Allocation Policy 1. "Long-Term Interest Rates", Ben S. Bernanke, p. 9-10. 2. HMA 1Q13 earnings call transcript. 3/1/13: Remarks by Ben Bernanke at the Annual Monetary/Macroeconomics Conference "The basic message is clear--long-term interest rates are expected to rise gradually over the next few years...The forecasts in chart 4 imply a total increase of between 200 and 300 basis points in long-term yields between now and 2017." 1 Despite predictions from professional interest rate forecasters, and Fed Chairman Bernanke himself, that rates would rise over time... ...HMA remained "comfortable" with its outsized floating-rate debt exposure 5/3/13 Q1 earnings call: HMA CFO "I'm certainly comfortable in this rate environment being floating...I'm not sure that you are going to see much growth in interest rates. A ten-year treasury is at 1.64." 2 "-- I am still ten months out, so we'll be evaluating that more and more as the time draws near in making a decision about that. We will have plenty of bankers, as well, trying to share their wisdom with us. So (laughter) we'll take a good look at it and evaluate it as rates do change. I imagine we'll hear from Robert W. Baird even." 2 HMA's "comfort" has proven ill-advised as interest rates have moved higher since the CFO's May 3rd remarks: Bond Sales Dry Up As Interest Rates Rise (June 13, 2013) - "The bond market is a bit of a disaster right now," said Michael Collins, senior investment officer for Prudential Fixed Income. "All that borrowing for the sake of borrowing just because yields were at record lows is probably behind us." Bond Investors Head for the Hills (June 19, 2013) - Signs of a stronger U.S. economy are rippling through the bond markets, sending investors and corporate leaders racing to prepare for higher interest rates. A Change in Tune (June 22, 2013) - The world probably has seen the peak in central-bank liquidity and the bottom in interest rates. PAGE 13 Bernanke's remarks |

| Suboptimal Capital Allocation Policy Fixed Rate Debt (% of total) Variable Rate Debt (% of total) Hospital Competitors1 83% 17% HMA2 41% 59% 1. Weighted average fixed/variable debt percentages of CYH, HCA, LPNT, THC, UHS and VHS net of interest rate swaps. Sourced from most recent 10-Q filings. 2. Post-Feb 2014 interest rate swap expiration doesn't match floating rate maturities. 3. Page 17, 3/31/13 10-Q. 4. Page 35, 3/31/13 10-Q. 5. Bloomberg 5-year swap spread data. After their interest rate swap maturity in Feb. 2014, HMA will have outsized exposure to variable-rate debt versus peers ...meanwhile, the cost to hedge against rising interest rates through their 2018 Term Loan maturity has increased - the 5 year swap rate has increased 92% YTD5 The company freely discloses that their current interest rate swap is not an effective cash flow hedge in their 10Q... As part of a restructuring of our long-term debt on November 18, 2011, our former credit facility was terminated but the interest rate swap contract was not 3...Because of our debt restructuring, the interest rate swap contract is no longer an effective cash flow hedge instrument4 PAGE 14 |

| PAGE 15 Compliance Concerns Have Led to Multiple Investigations Former CEO of Physicians Regional Medical Center Michael Mastej filed a lawsuit against HMA in 2010 Mastej's case claimed that HMA used incentives to increase physician Medicare patient referrals to HMA hospitals Similar allegations of fraud sparked a Department of Justice and HHS-OIG investigation in May 2011 The DOJ/HHS-OIG are investigating physician referrals, patient admissions, ER tests, and surgical procedures for possible fraud November 16, 2011: CtW Investment Group sends a letter to HMA's Chairman of the Audit Committee (Kent Dauten) asking the company to engage an independent commission to review the risks associated with HMA's business strategies and disclose the findings to shareholders January 17, 2012: CtW Investment Group sends a follow-up letter to HMA's Chairman of the Audit Committee (Kent Dauten) regarding ongoing litigation and federal investigations asking for HMA to provide greater disclosure and transparency to shareholders Former HMA compliance director Paul Meyer sued HMA in 2012 for wrongful termination after reporting Medicare fraud HMA stock price dropped ~13% after news of the lawsuit The television show 60 Minutes aired an investigation of HMA on December 2, 2012, which reported that HMA pressured physicians to increase admissions The stock price dropped ~6% after the investigation aired December 2, 2012: The television show 60 Minutes airs piece on alleged claims of inappropriate ER admitting practices HMA received a subpoena from the SEC on April 25, requesting documents relating to its "accounts receivable, billing write-downs, contractual adjustments, reserves for doubtful accounts, accounts receivable aging and revenue." Allegations of Fraud Whistleblower Lawsuit & 60 Minutes Investigation Dept. of Justice Investigation Whistleblower Lawsuit 2010 2011 2012 2013 SEC Inquiry |
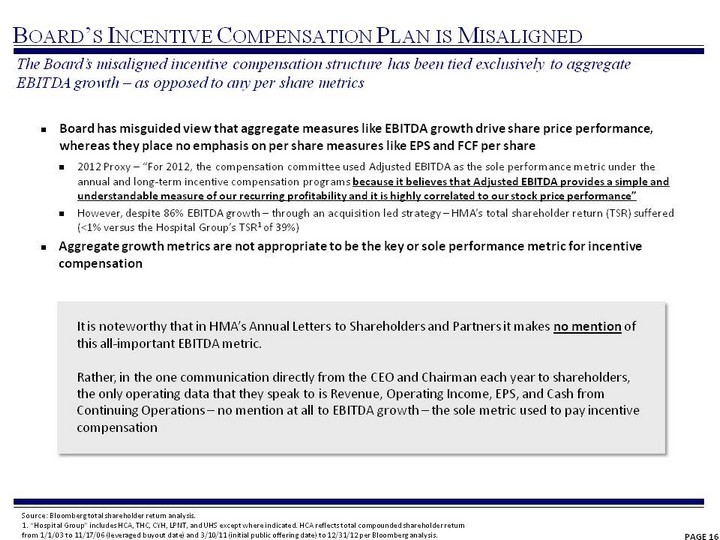
| PAGE 16 The Board's misaligned incentive compensation structure has been tied exclusively to aggregate EBITDA growth - as opposed to any per share metrics Board has misguided view that aggregate measures like EBITDA growth drive share price performance, whereas they place no emphasis on per share measures like EPS and FCF per share 2012 Proxy - "For 2012, the compensation committee used Adjusted EBITDA as the sole performance metric under the annual and long-term incentive compensation programs because it believes that Adjusted EBITDA provides a simple and understandable measure of our recurring profitability and it is highly correlated to our stock price performance" However, despite 86% EBITDA growth - through an acquisition led strategy - HMA's total shareholder return (TSR) suffered (<1% versus the Hospital Group's TSR1 of 39%) Aggregate growth metrics are not appropriate to be the key or sole performance metric for incentive compensation Board's Incentive Compensation Plan is Misaligned It is noteworthy that in HMA's Annual Letters to Shareholders and Partners it makes no mention of this all-important EBITDA metric. Rather, in the one communication directly from the CEO and Chairman each year to shareholders, the only operating data that they speak to is Revenue, Operating Income, EPS, and Cash from Continuing Operations - no mention at all to EBITDA growth - the sole metric used to pay incentive compensation Source: Bloomberg total shareholder return analysis. 1. "Hospital Group" includes HCA, THC, CYH, LPNT, and UHS except where indicated. HCA reflects total compounded shareholder return from 1/1/03 to 11/17/06 (leveraged buyout date) and 3/10/11 (initial public offering date) to 12/31/12 per Bloomberg analysis. |

| PAGE 17 HMA 2012 Performance HMA Guidance Actual Result Adjusted EBITDA1 $875-925M $871M MISSED (0.4-6%) Earnings per Share1 80-90c 75c MISSED (6-17%) Admissions -2% to 0% -4.8% MISSED (2.8-4.8%) HMA 2012 Management Incentives Result Performance Target set by Board: Adjusted EBITDA Target: $924M Actual: $871M MISSED (6%) Annual Cash Incentive PAID 108% Long-term Cash & Equity Incentive PAID 100% How could the Board approve Management incentives when HMA missed all performance targets? Source: Company filings including 2012 proxy statement, press releases, earnings calls and Morgan Stanley equity research. 1. Excluding HITECH incentive payments. $871M actual EBITDA is based on $963M less $92M of reported HITECH incentive payments. Management was paid 108% of incentive compensation despite missing all key guidance metrics Compensation Committee Kent P. Dauten Robert A. Knox William C. Steere, Jr. HMA Misapplied Management Incentive Compensation The following 3 slides lay out the Board's approach Which of these items doesn't add up? A B C D E F |
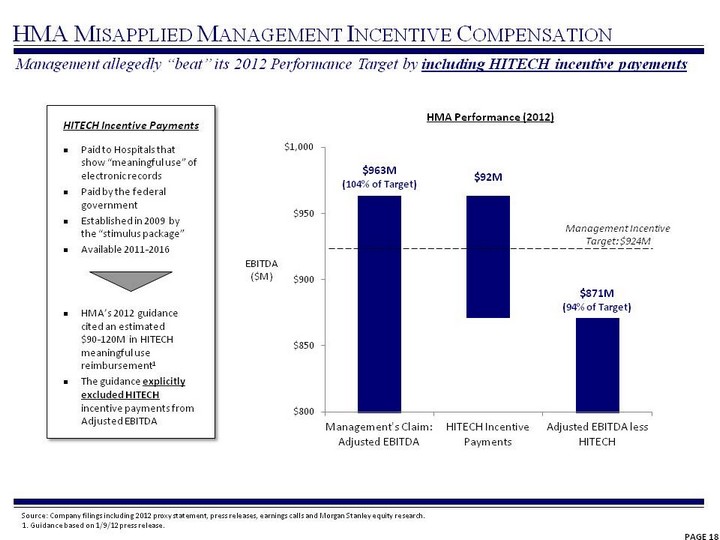
| PAGE 18 HMA Misapplied Management Incentive Compensation Paid to Hospitals that show "meaningful use" of electronic records Paid by the federal government Established in 2009 by the "stimulus package" Available 2011-2016 HMA's 2012 guidance cited an estimated $90- 120M in HITECH meaningful use reimbursement1 The guidance explicitly excluded HITECH incentive payments from Adjusted EBITDA HITECH Incentive Payments (CHART) $92M $963M (104% of Target) $871M (94% of Target) Management Incentive Target: $924M HMA Performance (2012) EBITDA ($M) Management allegedly "beat" its 2012 Performance Target by including HITECH incentive payements Source: Company filings including 2012 proxy statement, press releases, earnings calls and Morgan Stanley equity research. 1. Guidance based on 1/9/12 press release. |

| PAGE 19 HMA Misapplied Management Incentive Compensation Date Reference HMA Management Announcement HITECH Incentive Payments in Adj. Adjusted EBITDA January 9, 2012 HMA Press Release Issued 2012 guidance: Adjusted EBITDA of $875-925M Excluded March 26, 2012 Barclays High-Yield Bond Conference Reiterated guidance: Adjusted EBITDA of $875-925M Excluded May 9, 2012 Deutsche Bank Health Care Conference Reiterated guidance: Adjusted EBITDA of $875-925M Excluded June 4, 2012 Jefferies Global Healthcare Conference Reiterated guidance: Adjusted EBITDA of $875-925M Excluded October 22, 2012 Q3 Earnings Call Revised 2012 guidance: Adjusted EBITDA of $875-915M Excluded November 15, 2012 Credit Suisse Healthcare Conference Reiterated guidance: Adjusted EBITDA of $875-915M Excluded December 12, 2012 Oppenheimer Healthcare Conference Reiterated guidance: Adjusted EBITDA of $875-915M Excluded January 13, 2013 Q4 Investor Call Question: "The 2012 numbers for guidance exclude the meaningful use payments?" HMA CFO: "That's correct." Excluded For a full year, HMA had given 2012 guidance to Wall Street that excluded HITECH incentive payments - while holding themselves to a much lower internal target Source: Company filings, press releases, earnings calls and Morgan Stanley equity research. |
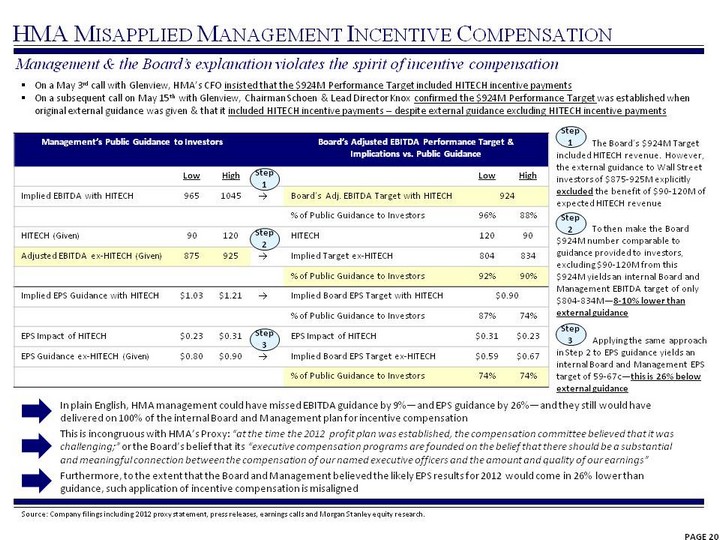
| PAGE 20 HMA Misapplied Management Incentive Compensation On a May 3rd call with Glenview, HMA's CFO insisted that the $924M Performance Target included HITECH incentive payments On a subsequent call on May 15th with Glenview, Chairman Schoen & Lead Director Knox confirmed the $924M Performance Target was established when original external guidance was given & that it included HITECH incentive payments - despite external guidance excluding HITECH incentive payments Management & the Board's explanation violates the spirit of incentive compensation Management's Public Guidance to Investors Management's Public Guidance to Investors Management's Public Guidance to Investors Board's Adjusted EBITDA Performance Target & Implications vs. Public Guidance Board's Adjusted EBITDA Performance Target & Implications vs. Public Guidance Board's Adjusted EBITDA Performance Target & Implications vs. Public Guidance Low High Low High Implied EBITDA with HITECH 965 1045 ? Board's Adj. EBITDA Target with HITECH 924 924 % of Public Guidance to Investors 96% 88% HITECH (Given) 90 120 HITECH 120 90 Adjusted EBITDA ex-HITECH (Given) 875 925 ? Implied Target ex-HITECH 804 834 % of Public Guidance to Investors 92% 90% Implied EPS Guidance with HITECH $1.03 $1.21 ? Implied Board EPS Target with HITECH $0.90 $0.90 % of Public Guidance to Investors 87% 74% EPS Impact of HITECH $0.23 $0.31 EPS Impact of HITECH $0.31 $0.23 EPS Guidance ex-HITECH (Given) $0.80 $0.90 ? Implied Board EPS Target ex-HITECH $0.59 $0.67 % of Public Guidance to Investors 74% 74% The Board's $924M Target included HITECH revenue. However, the external guidance to Wall Street investors of $875-925M explicitly excluded the benefit of $90-120M of expected HITECH revenue Step 1 Step 2 Step 3 To then make the Board $924M number comparable to guidance provided to investors, excluding $90-120M from this $924M yields an internal Board and Management EBITDA target of only $804-834M-8-10% lower than external guidance Applying the same approach in Step 2 to EPS guidance yields an internal Board and Management EPS target of 59-67c-this is 26% below external guidance In plain English, HMA management could have missed EBITDA guidance by 9%-and EPS guidance by 26%-and they still would have delivered on 100% of the internal Board and Management plan for incentive compensation Furthermore, to the extent that the Board and Management believed the likely EPS results for 2012 would come in 26% lower than guidance, such application of incentive compensation is misaligned Step 3 Step 2 Step 1 This is incongruous with HMA's Proxy: "at the time the 2012 profit plan was established, the compensation committee believed that it was challenging;" or the Board's belief that its "executive compensation programs are founded on the belief that there should be a substantial and meaningful connection between the compensation of our named executive officers and the amount and quality of our earnings" Source: Company filings including 2012 proxy statement, press releases, earnings calls and Morgan Stanley equity research. |
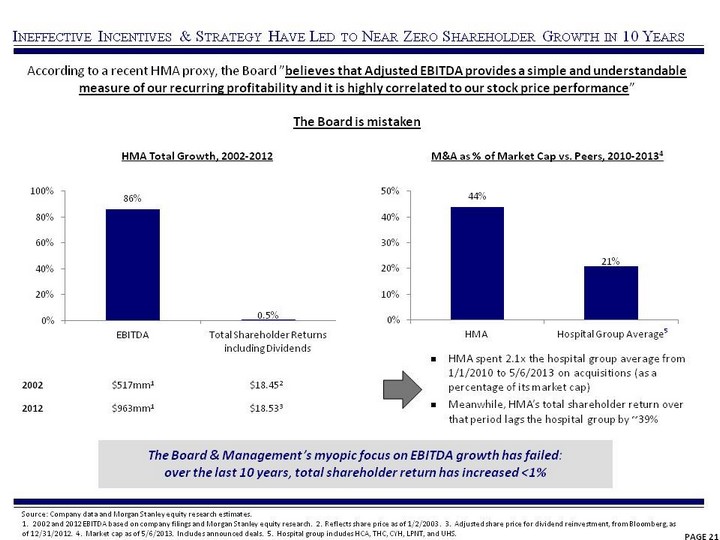
| PAGE 21 Ineffective Incentives & Strategy Have Led to Near Zero Shareholder Growth in 10 Years According to a recent HMA proxy, the Board "believes that Adjusted EBITDA provides a simple and understandable measure of our recurring profitability and it is highly correlated to our stock price performance" The Board is mistaken Source: Company data and Morgan Stanley equity research estimates. 1. 2002 and 2012 EBITDA based on company filings and Morgan Stanley equity research. 2. Reflects share price as of 1/2/2003 . 3. Adjusted share price for dividend reinvestment, from Bloomberg, as of 12/31/2012. 4. Market cap as of 5/6/2013. Includes announced deals. 5. Hospital group includes HCA, THC, CYH, LPNT, and UHS. The Board & Management's myopic focus on EBITDA growth has failed: over the last 10 years, total shareholder return has increased <1% (CHART) HMA Total Growth, 2002-2012 2002 $517mm1 $18.452 2012 $963mm1 $18.533 M&A as % of Market Cap vs. Peers, 2010-20134 (CHART) HMA spent 2.1x the hospital group average from 1/1/2010 to 5/6/2013 on acquisitions (as a percentage of its market cap) Meanwhile, HMA's total shareholder return over that period lags the hospital group by ~39% 5 |
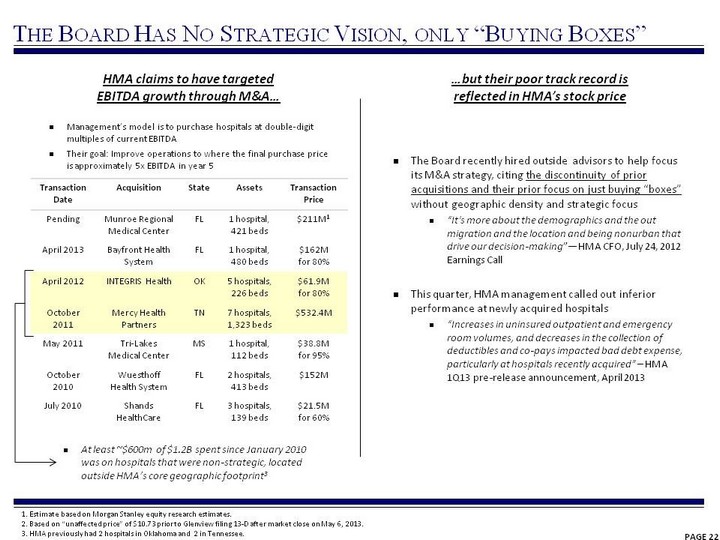
| PAGE 22 The Board Has No Strategic Vision, only "Buying Boxes" HMA claims to have targeted EBITDA growth through M&A... ...but their poor track record is reflected in HMA's stock price The Board recently hired outside advisors to help focus its M&A strategy, citing the discontinuity of prior acquisitions and their prior focus on just buying "boxes" without geographic density and strategic focus "It's more about the demographics and the out migration and the location and being nonurban that drive our decision-making"-HMA CFO, July 24, 2012 Earnings Call This quarter, HMA management called out inferior performance at newly acquired hospitals "Increases in uninsured outpatient and emergency room volumes, and decreases in the collection of deductibles and co-pays impacted bad debt expense, particularly at hospitals recently acquired" - HMA 1Q13 pre-release announcement, April 2013 Management's model is to purchase hospitals at double-digit multiples of current EBITDA Their goal: Improve operations to where the final purchase price is approximately 5x EBITDA in year 5 Transaction Date Acquisition State Assets Transaction Price Pending Munroe Regional Medical Center FL 1 hospital, 421 beds $211M1 April 2013 Bayfront Health System FL 1 hospital, 480 beds $162M for 80% April 2012 INTEGRIS Health OK 5 hospitals, 226 beds $61.9M for 80% October 2011 Mercy Health Partners TN 7 hospitals, 1,323 beds $532.4M May 2011 Tri-Lakes Medical Center MS 1 hospital, 112 beds $38.8M for 95% October 2010 Wuesthoff Health System FL 2 hospitals, 413 beds $152M July 2010 Shands HealthCare FL 3 hospitals, 139 beds $21.5M for 60% At least ~$600m of $1.2B spent since January 2010 was on hospitals that were non-strategic, located outside HMA's core geographic footprint3 1. Estimate based on Morgan Stanley equity research estimates. 2. Based on "unaffected price" of $10.73 prior to Glenview filing 13-D after market close on May 6, 2013. 3. HMA previously had 2 hospitals in Oklahoma and 2 in Tennessee. |
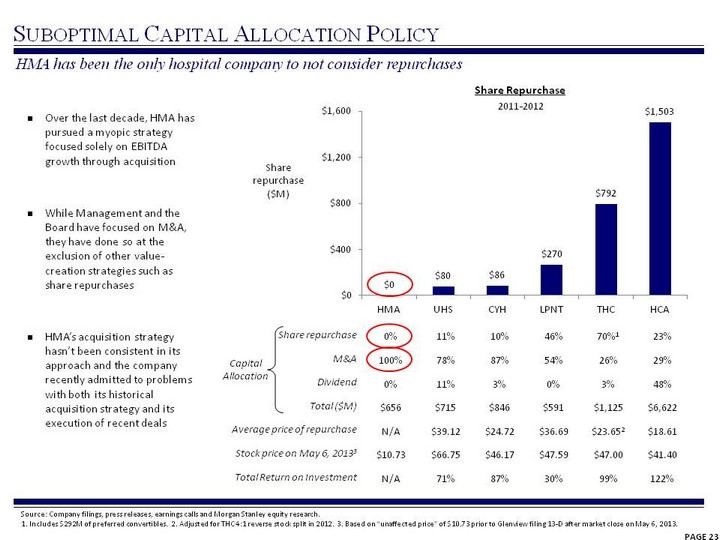
| PAGE 23 Suboptimal Capital Allocation Policy (CHART) Share repurchase ($M) Share repurchase 0% 11% 10% 46% 70%1 23% M&A 100% 78% 87% 54% 26% 29% Dividend 0% 11% 3% 0% 3% 48% Total ($M) $656 $715 $846 $591 $1,125 $6,622 Average price of repurchase N/A $39.12 $24.72 $36.69 $23.652 $18.61 Stock price on May 6, 20133 $10.73 $66.75 $46.17 $47.59 $47.00 $41.40 Total Return on Investment N/A 71% 87% 30% 99% 122% Source: Company filings, press releases, earnings calls and Morgan Stanley equity research. 1. Includes $292M of preferred convertibles. 2. Adjusted for THC 4:1 reverse stock split in 2012. 3. Based on "unaffected price" of $10.73 prior to Glenview filing 13-D after market close on May 6, 2013. HMA has been the only hospital company to not consider repurchases Capital Allocation Over the last decade, HMA has pursued a myopic strategy focused solely on EBITDA growth through acquisition While Management and the Board have focused on M&A, they have done so at the exclusion of other value- creation strategies such as share repurchases HMA's acquisition strategy hasn't been consistent in its approach and the company recently admitted to problems with both its historical acquisition strategy and its execution of recent deals Share Repurchase 2011-2012 |

| 1. EBITDA estimates reflect the mid-point of HMA's guidance respectively. 2. Balance sheet stats as of 1Q12 actual. 3. Balance sheet stats as of 3Q12 actual. Historical intransigence about considering stock repurchases demonstrates a deep seated bias by HMA's Board to even consider share repurchases as an effective tool to increase shareholder value Suboptimal Capital Allocation Policy Despite our repeated attempts to communicate share repurchase as an alternative for capital allocation, to the best of our knowledge, share repurchase was never formally considered and certainly was not adopted by the Board When Glenview met with the senior management on two occasions in 2012, Glenview presented the case of adding leverage to opportunistically repurchase shares at significant discounts to intrinsic value ($6.47 on June 13, 2012, and $9.02 on December 19, 2012). Even at these depressed share price levels, the company didn't agree on the value of the strategy Below are two illustrative examples from those meetings that show the amount of equity that HMA could have repurchased by increasing total leverage to 4.5x and 5.0x PAGE 24 June 13, 2012 Meeting with CFO in NYC June 13, 2012 Meeting with CFO in NYC December 19, 2012 Meeting with CEO in NYC December 19, 2012 Meeting with CEO in NYC HMA Stock Price Current cash on balance sheet Minimum cash (GCM estimate) $6.47 $51 50 $6.47 $51 50 $9.02 $182 50 $9.02 $182 50 Free cash for share repurchase 1 1 132 132 Plus Free Cash Flow for 2Q12-4Q12 227 227 33 (4Q12 only) 33 (4Q12 only) Current Total Debt LTM EBITDA 2012 EBITDA1 2012 EBITDA multiple Current Leverage (debt to LTM EBITDA) 3,5632 853 900 5.7x 4.2x 3,5632 853 900 5.7x 4.2x 3,5693 933 895 6.4x 3.8x 3,5693 933 895 6.4x 3.8x Target Leverage (debt to EBITDA) 4.5x 5.0x 4.5x 5.0x Additional Leverage Capacity $487 $937 $458 $906 Cash available for repurchase $716 $1,166 $623 $1,070 Market Cap $1,654 (6/13/2012) $1,654 (6/13/2012) $2,316 (12/19/2012) $2,316 (12/19/2012) Additional Repurchase Capacity 43% 70% 27% 46% |
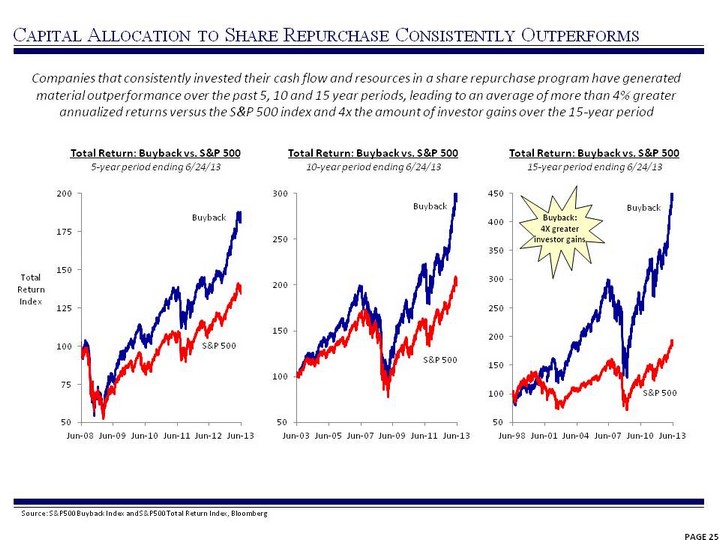
| PAGE 25 Capital Allocation to Share Repurchase Consistently Outperforms Companies that consistently invested their cash flow and resources in a share repurchase program have generated material outperformance over the past 5, 10 and 15 year periods, leading to an average of more than 4% greater annualized returns versus the S&P 500 index and 4x the amount of investor gains over the 15-year period Total Return: Buyback vs. S&P 500 5-year period ending 6/24/13 Total Return Index (CHART) Source: S&P500 Buyback Index and S&P500 Total Return Index, Bloomberg (CHART) (CHART) Total Return: Buyback vs. S&P 500 10-year period ending 6/24/13 Total Return: Buyback vs. S&P 500 15-year period ending 6/24/13 Buyback S&P 500 Buyback S&P 500 Buyback S&P 500 Buyback: 4X greater investor gains |
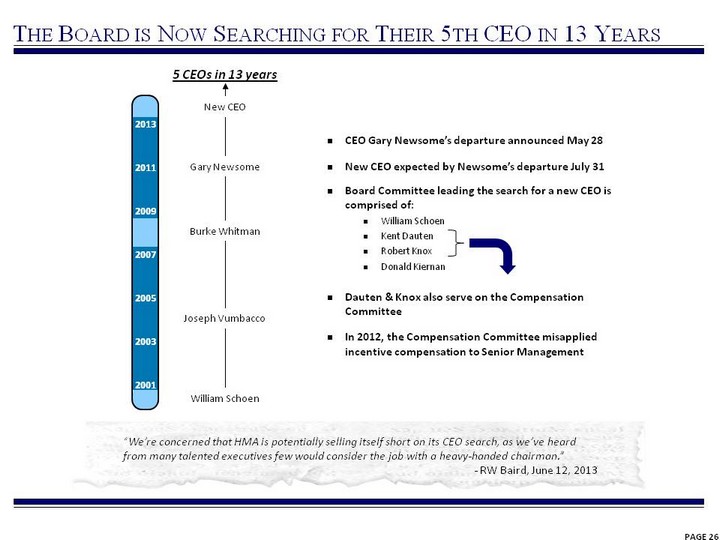
| PAGE 26 The Board is Now Searching for Their 5th CEO in 13 Years CEO Gary Newsome's departure announced May 28 New CEO expected by Newsome's departure July 31 Board Committee leading the search for a new CEO is comprised of: William Schoen Kent Dauten Robert Knox Donald Kiernan Dauten & Knox also serve on the Compensation Committee In 2012, the Compensation Committee misapplied incentive compensation to Senior Management 5 CEOs in 13 years 2013 2011 2009 2005 2003 Burke Whitman Joseph Vumbacco 2001 Gary Newsome William Schoen New CEO 2007 "We're concerned that HMA is potentially selling itself short on its CEO search, as we've heard from many talented executives few would consider the job with a heavy-handed chairman." - RW Baird, June 12, 2013 |

| PAGE 27 Excessive Tenure: The Board is Insular & Stale HMA's peers have not made the same mistake Average tenure for the HMA Board: ~17 years HMA Director Year Appointed Tenure (Years) Dauten 1981 32 Schoen 1983 30 Knox 1985 28 Westerfield 2000 13 Kiernan 2001 12 Steere 2003 10 O'Meara 2005 8 Goldschmidt 2011 2 Average Tenure Average Tenure 16.9 Source: Company filings and proxy statements. 1. Independent Directors. 2. 4/8/13 proxy. 3. 5/12/13 proxy. 4. 6/4/13 proxy. 5. 5/3/13 proxy. 6. 5/21/13 proxy. 7. Spencer Stuart Board Index, 2012. (CHART) Average Board tenure (years)1 Independent Board Members 8 4 7 8 6 New Members: Last 7 years 1 2 2 3 2 % of Total 13% 50% 29% 38% 33% Members with 12+ years tenure 5 2 3 0 0 % of Total 63% 50% 43% 0% 0% 78% of all S&P 500 boards have an average tenure of 10 years or less7 3 2 4 5 6 |
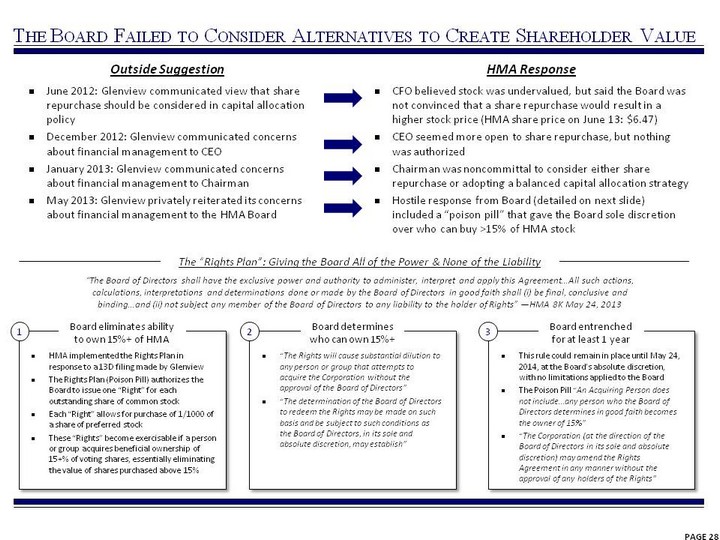
| PAGE 28 The Board Failed to Consider Alternatives to Create Shareholder Value "The Rights will cause substantial dilution to any person or group that attempts to acquire the Corporation without the approval of the Board of Directors" "The determination of the Board of Directors to redeem the Rights may be made on such basis and be subject to such conditions as the Board of Directors, in its sole and absolute discretion, may establish" 1 2 Board eliminates ability to own 15%+ of HMA Board determines who can own 15%+ Board entrenched for at least 1 year HMA implemented the Rights Plan in response to a 13D filing made by Glenview The Rights Plan (Poison Pill) authorizes the Board to issue one "Right" for each outstanding share of common stock Each "Right" allows for purchase of 1/1000 of a share of preferred stock These "Rights" become exercisable if a person or group acquires beneficial ownership of 15+% of voting shares, essentially eliminating the value of shares purchased above 15% 3 This rule could remain in place until May 24, 2014, at the Board's absolute discretion, with no limitations applied to the Board The Poison Pill "An Acquiring Person does not include...any person who the Board of Directors determines in good faith becomes the owner of 15%" "The Corporation (at the direction of the Board of Directors in its sole and absolute discretion) may amend the Rights Agreement in any manner without the approval of any holders of the Rights" The "Rights Plan": Giving the Board All of the Power & None of the Liability "The Board of Directors shall have the exclusive power and authority to administer, interpret and apply this Agreement...All such actions, calculations, interpretations and determinations done or made by the Board of Directors in good faith shall (i) be final, conclusive and binding...and (ii) not subject any member of the Board of Directors to any liability to the holder of Rights" -HMA 8K May 24, 2013 June 2012: Glenview communicated view that share repurchase should be considered in capital allocation policy December 2012: Glenview communicated concerns about financial management to CEO January 2013: Glenview communicated concerns about financial management to Chairman May 2013: Glenview privately reiterated its concerns about financial management to the HMA Board Outside Suggestion HMA Response CFO believed stock was undervalued, but said the Board was not convinced that a share repurchase would result in a higher stock price (HMA share price on June 13: $6.47) CEO seemed more open to share repurchase, but nothing was authorized Chairman was noncommittal to consider either share repurchase or adopting a balanced capital allocation strategy Hostile response from Board (detailed on next slide) included a "poison pill" that gave the Board sole discretion over who can buy >15% of HMA stock |
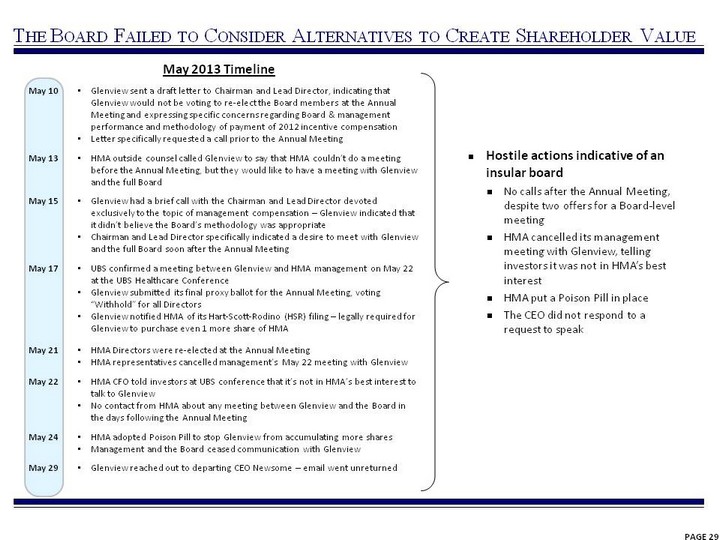
| PAGE 29 The Board Failed to Consider Alternatives to Create Shareholder Value May 2013 Timeline Hostile actions indicative of an insular board No calls after the Annual Meeting, despite two offers for a Board-level meeting HMA cancelled its management meeting with Glenview, telling investors it was not in HMA's best interest HMA put a Poison Pill in place The CEO did not respond to a request to speak May 10 Glenview sent a draft letter to Chairman and Lead Director, indicating that Glenview would not be voting to re-elect the Board members at the Annual Meeting and expressing specific concerns regarding Board & management performance and methodology of payment of 2012 incentive compensation Letter specifically requested a call prior to the Annual Meeting May 13 HMA outside counsel called Glenview to say that HMA couldn't do a meeting before the Annual Meeting, but they would like to have a meeting with Glenview and the full Board May 15 Glenview had a brief call with the Chairman and Lead Director devoted exclusively to the topic of management compensation - Glenview indicated that it didn't believe the Board's methodology was appropriate Chairman and Lead Director specifically indicated a desire to meet with Glenview and the full Board soon after the Annual Meeting May 17 UBS confirmed a meeting between Glenview and HMA management on May 22 at the UBS Healthcare Conference Glenview submitted its final proxy ballot for the Annual Meeting, voting "Withhold" for all Directors Glenview notified HMA of its Hart-Scott-Rodino (HSR) filing - legally required for Glenview to purchase even 1 more share of HMA May 21 HMA Directors were re-elected at the Annual Meeting HMA representatives cancelled management's May 22 meeting with Glenview May 22 HMA CFO told investors at UBS conference that it's not in HMA's best interest to talk to Glenview No contact from HMA about any meeting between Glenview and the Board in the days following the Annual Meeting May 24 HMA adopted Poison Pill to stop Glenview from accumulating more shares Management and the Board ceased communication with Glenview May 29 Glenview reached out to departing CEO Newsome - email went unreturned |
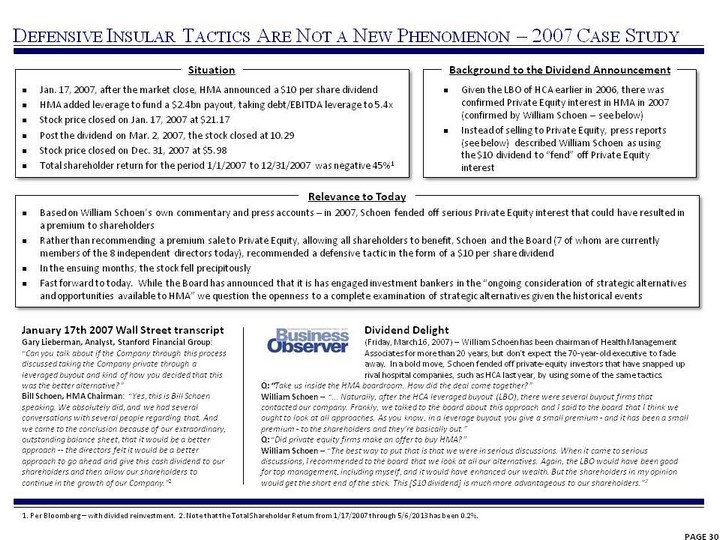
| PAGE 30 Defensive Insular Tactics Are Not a New Phenomenon - 2007 Case Study 1. Per Bloomberg - with divided reinvestment. 2. Note that the Total Shareholder Return from 1/17/2007 through 5/6/2013 has been 0.2%. Given the LBO of HCA earlier in 2006, there was confirmed Private Equity interest in HMA in 2007 (confirmed by William Schoen - see below) Instead of selling to Private Equity, press reports (see below) described William Schoen as using the $10 dividend to "fend" off Private Equity interest Situation Background to the Dividend Announcement Relevance to Today Jan. 17, 2007, after the market close, HMA announced a $10 per share dividend HMA added leverage to fund a $2.4bn payout, taking debt/EBITDA leverage to 5.4x Stock price closed on Jan. 17, 2007 at $21.17 Post the dividend on Mar. 2, 2007, the stock closed at 10.29 Stock price closed on Dec. 31, 2007 at $5.98 Total shareholder return for the period 1/1/2007 to 12/31/2007 was negative 45%1 Based on William Schoen's own commentary and press accounts - in 2007, Schoen fended off serious Private Equity interest that could have resulted in a premium to shareholders Rather than recommending a premium sale to Private Equity, allowing all shareholders to benefit, Schoen and the Board (7 of whom are currently members of the 8 independent directors today), recommended a defensive tactic in the form of a $10 per share dividend In the ensuing months, the stock fell precipitously Fast forward to today. While the Board has announced that it is has engaged investment bankers in the "ongoing consideration of strategic alternatives and opportunities available to HMA" we question the openness to a complete examination of strategic alternatives given the historical events Q: "Take us inside the HMA boardroom. How did the deal come together?" William Schoen - "... Naturally, after the HCA leveraged buyout (LBO), there were several buyout firms that contacted our company. Frankly, we talked to the board about this approach and I said to the board that I think we ought to look at all approaches. As you know, in a leverage buyout you give a small premium - and it has been a small premium - to the shareholders and they're basically out." Q: "Did private equity firms make an offer to buy HMA?" William Schoen - "The best way to put that is that we were in serious discussions. When it came to serious discussions, I recommended to the board that we look at all our alternatives. Again, the LBO would have been good for top management, including myself, and it would have enhanced our wealth. But the shareholders in my opinion would get the short end of the stick. This [$10 dividend] is much more advantageous to our shareholders."2 Dividend Delight (Friday, March 16, 2007) - William Schoen has been chairman of Health Management Associates for more than 20 years, but don't expect the 70-year-old executive to fade away. In a bold move, Schoen fended off private-equity investors that have snapped up rival hospital companies, such as HCA last year, by using some of the same tactics. January 17th 2007 Wall Street transcript Gary Lieberman, Analyst, Stanford Financial Group: "Can you talk about if the Company through this process discussed taking the Company private through a leveraged buyout and kind of how you decided that this was the better alternative?" Bill Schoen, HMA Chairman: "Yes, this is Bill Schoen speaking. We absolutely did, and we had several conversations with several people regarding that. And we came to the conclusion because of our extraordinary, outstanding balance sheet, that it would be a better approach -- the directors felt it would be a better approach to go ahead and give this cash dividend to our shareholders and then allow our shareholders to continue in the growth of our Company."2 |
| PAGE 31 Shareholders' Value-Enhancing Solution: Revitalize HMA |
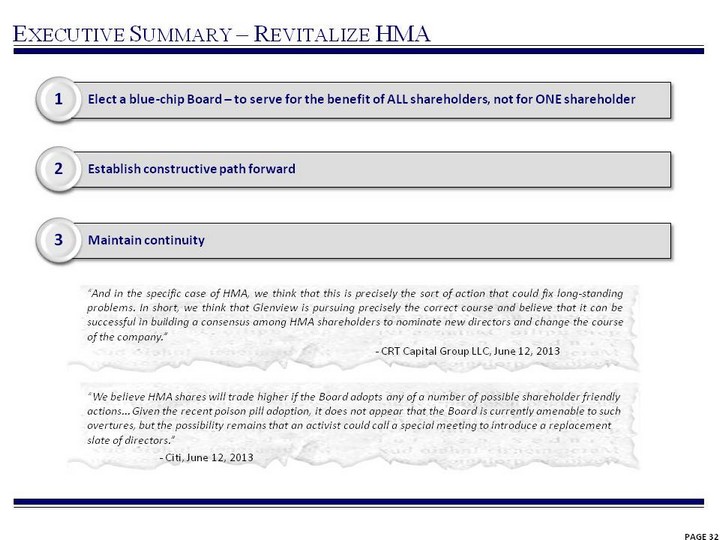
| PAGE 32 Executive Summary - Revitalize HMA "And in the specific case of HMA, we think that this is precisely the sort of action that could fix long-standing problems. In short, we think that Glenview is pursuing precisely the correct course and believe that it can be successful in building a consensus among HMA shareholders to nominate new directors and change the course of the company." - CRT Capital Group LLC, June 12, 2013 1 Elect a blue-chip Board - to serve for the benefit of ALL shareholders, not for ONE shareholder 2 Establish constructive path forward 3 Maintain continuity "We believe HMA shares will trade higher if the Board adopts any of a number of possible shareholder friendly actions... Given the recent poison pill adoption, it does not appear that the Board is currently amenable to such overtures, but the possibility remains that an activist could call a special meeting to introduce a replacement slate of directors." - Citi, June 12, 2013 |
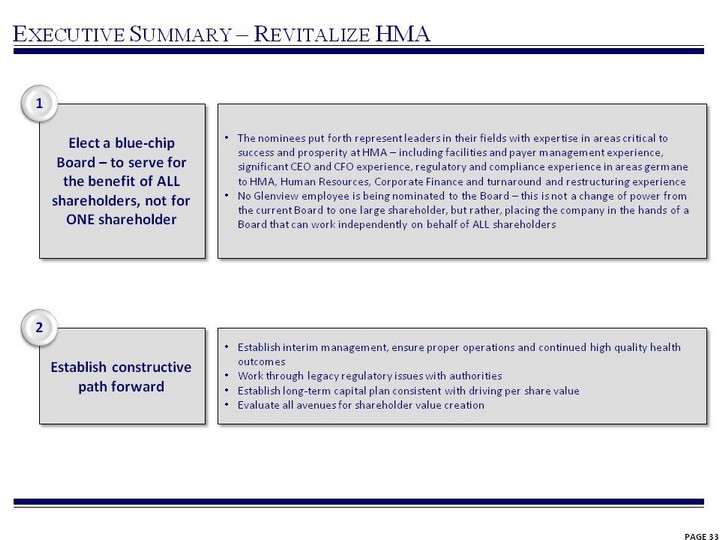
| PAGE 33 Executive Summary - Revitalize HMA Elect a blue-chip Board - to serve for the benefit of ALL shareholders, not for ONE shareholder The nominees put forth represent leaders in their fields with expertise in areas critical to success and prosperity at HMA - including facilities and payer management experience, significant CEO and CFO experience, regulatory and compliance experience in areas germane to HMA, Human Resources, Corporate Finance and turnaround and restructuring experience No Glenview employee is being nominated to the Board - this is not a change of power from the current Board to one large shareholder, but rather, placing the company in the hands of a Board that can work independently on behalf of ALL shareholders Establish constructive path forward Establish interim management, ensure proper operations and continued high quality health outcomes Work through legacy regulatory issues with authorities Establish long-term capital plan consistent with driving per share value Evaluate all avenues for shareholder value creation 1 2 |
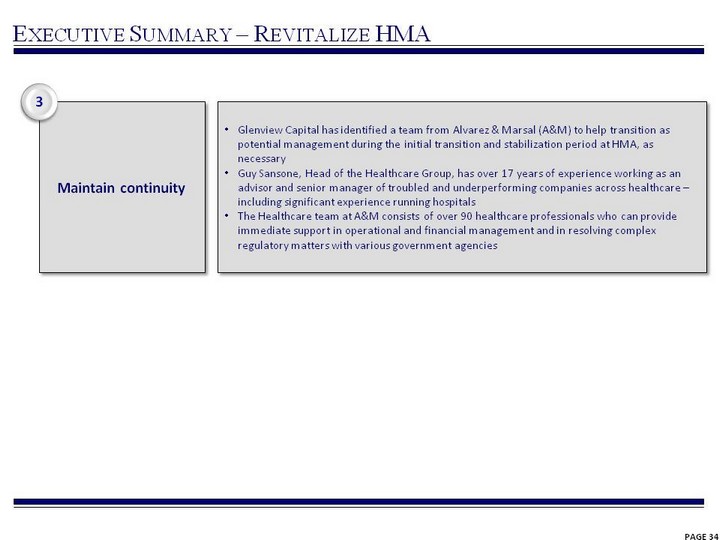
| PAGE 34 Executive Summary - Revitalize HMA Glenview Capital has identified a team from Alvarez & Marsal (A&M) to help transition as potential management during the initial transition and stabilization period at HMA, as necessary Guy Sansone, Head of the Healthcare Group, has over 17 years of experience working as an advisor and senior manager of troubled and underperforming companies across healthcare - including significant experience running hospitals The Healthcare team at A&M consists of over 90 healthcare professionals who can provide immediate support in operational and financial management and in resolving complex regulatory matters with various government agencies Maintain continuity 3 |

| Proposed Board of Directors Mary Taylor Behrens Steve Epstein Kirk Gorman Stephen Guillard Earl Holland John McCarty Steve Shulman Peter Urbanowicz New Proposed Independent Board of Directors PAGE 35 |

| PAGE 36 A Constructive Path Forward Should long-term independence be the value maximizing strategy, then embark on a long-term HR program to build management talent depth and culture Evaluate with an open mind all avenues for shareholder value creation Establish an interim management team with experience in transitional and transformational roles Establish a long-term capital plan and capital allocation strategy consistent with driving per share value, not aggregate value Work constructively and cooperatively with regulatory authorities to resolve legacy issues and establish clear guidelines going forward Ensure proper operations and continued high quality health outcomes Operations Financial & Strategic Alternatives |
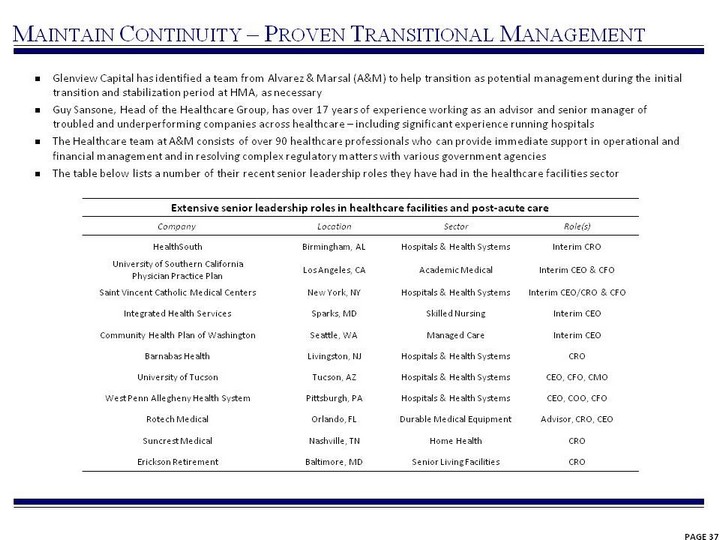
| PAGE 37 Maintain Continuity - Proven Transitional Management Glenview Capital has identified a team from Alvarez & Marsal (A&M) to help transition as potential management during the initial transition and stabilization period at HMA, as necessary Guy Sansone, Head of the Healthcare Group, has over 17 years of experience working as an advisor and senior manager of troubled and underperforming companies across healthcare - including significant experience running hospitals The Healthcare team at A&M consists of over 90 healthcare professionals who can provide immediate support in operational and financial management and in resolving complex regulatory matters with various government agencies The table below lists a number of their recent senior leadership roles they have had in the healthcare facilities sector Extensive senior leadership roles in healthcare facilities and post-acute care Extensive senior leadership roles in healthcare facilities and post-acute care Extensive senior leadership roles in healthcare facilities and post-acute care Extensive senior leadership roles in healthcare facilities and post-acute care Company Location Sector Role(s) HealthSouth Birmingham, AL Hospitals & Health Systems Interim CRO University of Southern California Physician Practice Plan Los Angeles, CA Academic Medical Interim CEO & CFO Saint Vincent Catholic Medical Centers New York, NY Hospitals & Health Systems Interim CEO/CRO & CFO Integrated Health Services Sparks, MD Skilled Nursing Interim CEO Community Health Plan of Washington Seattle, WA Managed Care Interim CEO Barnabas Health Livingston, NJ Hospitals & Health Systems CRO University of Tucson Tucson, AZ Hospitals & Health Systems CEO, CFO, CMO West Penn Allegheny Health System Pittsburgh, PA Hospitals & Health Systems CEO, COO, CFO Rotech Medical Orlando, FL Durable Medical Equipment Advisor, CRO, CEO Suncrest Medical Nashville, TN Home Health CRO Erickson Retirement Baltimore, MD Senior Living Facilities CRO |

| PAGE 38 Revitalize HMA - Board Nominees Mary Taylor Behrens Extensive healthcare finance experience: Managing Director in healthcare investment banking at Merrill Lynch & Co. Inc. and Head of the Americas region of Merrill Lynch Investment Managers Head of Human Resources and member of Executive Committee of Merrill Lynch & Co. Inc. from 1998 to 2001 Currently serves as President of Newfane Advisors, a private consulting firm she formed in 2004 Relevant board experience: Director of Sagent Pharmaceuticals, Inc. and Chair of its Compensation Committee since November 2010 Formerly served as the Director of Manor Care, Inc. and as a member of the Compensation and Quality Committees from December 2004 to December 2007 Extensive knowledge and experience in executive compensation, human resources, strategic planning, succession planning and financial transactions in the healthcare industry |
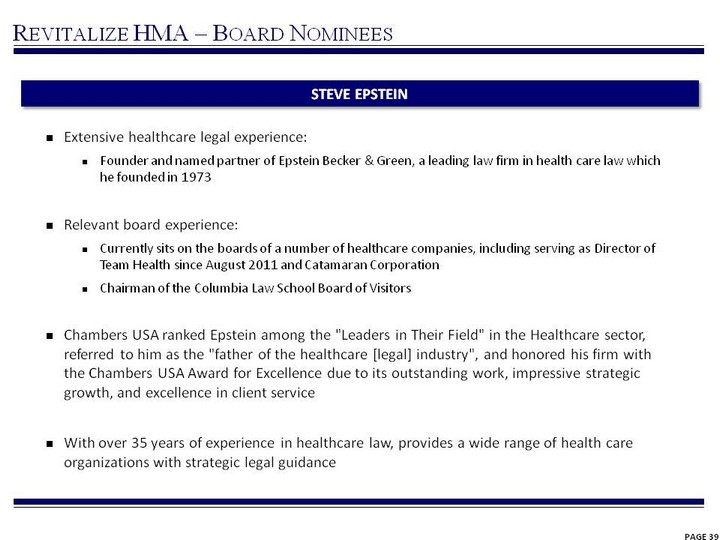
| PAGE 39 Revitalize HMA - Board Nominees Extensive healthcare legal experience: Founder and named partner of Epstein Becker & Green, a leading law firm in health care law which he founded in 1973 Relevant board experience: Currently sits on the boards of a number of healthcare companies, including serving as Director of Team Health since August 2011 and Catamaran Corporation Chairman of the Columbia Law School Board of Visitors Chambers USA ranked Epstein among the "Leaders in Their Field" in the Healthcare sector, referred to him as the "father of the healthcare [legal] industry", and honored his firm with the Chambers USA Award for Excellence due to its outstanding work, impressive strategic growth, and excellence in client service With over 35 years of experience in healthcare law, provides a wide range of health care organizations with strategic legal guidance Steve Epstein |
| PAGE 40 Revitalize HMA - Board Nominees Executive hospital experience: Executive Vice President and Chief Financial Officer of Philadelphia's Jefferson Health System since September 2003 Senior Vice President and Chief Financial Officer of Universal Health Services and President and Chief Financial Officer of Universal Health Realty Income Trust from April 1987 to March 2003 Relevant board experience: Chairman of the Board of CardioNet since 2011 and Director since August 2008 Director of IASIS Healthcare since February 2004 Director of Physician's Dialysis Inc. Prior Director of Care Investment Trust Inc., and Viasys Healthcare Inc. Extensive knowledge, experience and track record of hospital operations, integrating hospital acquisitions, and executive hospital leadership. Extensive experience in mergers and acquisitions, corporate finance, and corporate governance Kirk gorman |
| PAGE 41 Revitalize HMA - Board Nominees Stephen Guillard Executive healthcare facilities experience: Executive Vice President of HCR ManorCare from June 2005 and Chief Operating Officer from January 2007 Chief Executive Officer of Harborside Healthcare from March 1996 to June 2005 and Chief Executive Officer of its predecessor companies since May 1998 Co-Founder, President and Chief Executive Officer of Diversified Health Services, a skilled nursing operator Relevant board experience and affiliations: Currently serves as Chairman of The Alliance for Quality Nursing Home Care, Chairman of the Board of Belmont Nursing Center Corp, and a Director at naviHealth Formerly served as Chairman of Harborside Healthcare, Chairman of Diversified Health Services, and a Director of HCR ManorCare Diverse executive leadership in post-acute care facilities, successful operational track-record, and experienced in mergers and acquisitions |
| PAGE 42 Revitalize HMA - Board Nominees Executive hospital experience: Vice Chairman and Chief Operating Officer of HMA from 1999 to January 2001 and with HMA in other functions since 1981 Relevant board experience and affiliations: Director of Team Health Holdings since August 2001 Director of Cornerstone National Insurance Prior board experience includes Director of Rural/Metro Corporation until 2011, Essent Healthcare, Mariner Health Care Management and Medical Diagnostics Technology Extensive knowledge, experience and track record of hospital operations, integrating hospital acquisitions, and executive hospital leadership Earl Holland |
| PAGE 43 Revitalize HMA - Board Nominees Executive healthcare services experience: From February 2006 until his retirement in December 2009, Mr. McCarty served as the Executive Vice President and Chief Financial Officer of SHPS, Inc., a provider of health improvement programs From October 2011 to May 2012, was a consultant of Metalmark Capital Holdings, LLC, a private equity firm From April 2000 to March 2005, Chief Financial Officer of LabOne (acquired by Quest Diagnostics in October 2005) Relevant hospital experience: Assistant Vice President of Corporate Finance and Vice President of Columbia Capital Corporation for Columbia HCA prior to 1996, responsible for over $7 billion in financing Strong business and financial knowledge, experience in turnaround situations, and diverse financial leadership in the healthcare industry John McCarty |
| PAGE 44 Revitalize HMA - Board Nominees Steve Shulman Executive healthcare services experience: Chairman and Chief Executive Officer of Magellan Health Services from 2002 to 2008 Chairman, President and Chief Executive Officer of Prudential Healthcare from 1997 to 1999 Previously served in leadership positions at CIGNA (1983-1987) and Kaiser Permanente (1973-1983) Currently serves as a Senior Advisor with Water Street Healthcare Partners, a private equity firm Relevant board experience: Chairman of the Boards of Access MediQuip, CareCentrix, and Digital Insurance Director of Accretive Health, Facet Technologies, HealthMarkets, HealthPlan Holdings, and Oasis Outsourcing Co-founder of Value Health, Inc., a managed care company Extensive turnaround experience in the healthcare industry: Spearheaded Magellan Health Services' turnaround and restructuring from bankruptcy Led Prudential Healthcare's turnaround and successful sale to Aetna |
| PAGE 45 Revitalize HMA - Board Nominees Peter Urbanowicz Extensive healthcare regulatory and legal experience: Managing Director at Alvarez & Marsal's Healthcare Industry Group since May 2008, where he leads the firm's healthcare compliance practice Served as Executive Vice President, General Counsel and Secretary of Tenet Healthcare from January 2004 to March 2008 and Deputy General Counsel of the U.S. Department of Health and Human Services (HHS) from October 2001 to December 2003 Relevant board experience: Director and Chairman of the Compliance Committee of Maxim Healthcare Services Extensive expertise in regulatory, compliance, financial and operating issues facing the healthcare industry and regularly advises boards of directors, senior management, and investors/lenders During his tenure at Tenet, was successful in resolving major federal criminal investigations and civil lawsuits facing the company During his tenure at HHS, was a member of the team that drafted the Medicare Prescription Drug Act of 2003 |
| PAGE 46 Who is Glenview Capital $6B+ New York based Hedge Fund Not an activist fund - HMA is the first time Glenview Capital has proposed fully replacing BOD members Investor in HMA for more than 2 years Own 14.6% of HMA Have $2B in capital invested in the hospital sector Historical track record of working collaboratively & collegially with management teams in healthcare Express Scripts (over 10 year holding period) Thermo Fisher (over 9 years) McKesson (over 8 years) Cigna (over 5 years) Life Technologies (5 years) |

| PAGE 47 GLENVIEW CAPITAL PARTNERS, L.P., GLENVIEW CAPITAL MASTER FUND, LTD., GLENVIEW INSTITUTIONAL PARTNERS, L.P., GLENVIEW OFFSHORE OPPORTUNITY MASTER FUND, LTD., GLENVIEW CAPITAL OPPORTUNITY FUND, L.P., GLENVIEW CAPITAL MANAGEMENT, LLC AND LARRY ROBBINS (COLLECTIVELY, "GLENVIEW") INTEND TO FILE WITH THE SECURITIES AND EXCHANGE COMMISSION (THE "SEC") A DEFINITIVE CONSENT STATEMENT AND ACCOMPANYING CONSENT CARD TO BE USED TO SOLICIT WRITTEN CONSENTS FROM THE STOCKHOLDERS OF HEALTH MANAGEMENT ASSOCIATES, INC. ("HMA" OR "THE COMPANY") IN CONNECTION WITH GLENVIEW'S INTENT TO TAKE CORPORATE ACTION BY WRITTEN CONSENT. ALL STOCKHOLDERS OF THE COMPANY ARE ADVISED TO READ THE DEFINITIVE CONSENT STATEMENT AND OTHER DOCUMENTS RELATED TO THE SOLICITATION OF WRITTEN CONSENTS FROM THE STOCKHOLDERS OF THE COMPANY, BY GLENVIEW AND OTHER PARTICIPANTS IN SUCH SOLICITATION (COLLECTIVELY, THE "PARTICIPANTS") WHEN THEY BECOME AVAILABLE, BECAUSE THEY WILL CONTAIN IMPORTANT INFORMATION. INFORMATION RELATING TO THE PARTICIPANTS IS CONTAINED IN THE PRELIMINARY CONSENT STATEMENT FILED ON JUNE 25, 2013 WITH THE SEC AND IS AVAILABLE AT NO CHARGE ON THE SEC'S WEB SITE AT HTTP://WWW.SEC.GOV. WHEN COMPLETED, THE DEFINITIVE CONSENT STATEMENT AND FORM OF WRITTEN CONSENT WILL BE FURNISHED TO SOME OR ALL OF THE STOCKHOLDERS OF THE COMPANY AND WILL, ALONG WITH OTHER RELEVANT DOCUMENTS, BE AVAILABLE AT NO CHARGE ON THE SEC'S WEB SITE AT HTTP://WWW.SEC.GOV. IN ADDITION, GLENVIEW WILL PROVIDE COPIES OF THE DEFINITIVE CONSENT STATEMENT AND ACCOMPANYING CONSENT CARD (WHEN AVAILABLE) WITHOUT CHARGE UPON REQUEST TO OKAPI PARTNERS LLC, TELEPHONE: (877) 869-0171. Cautionary Statement Regarding Forward-Looking Statements This presentation may include "forward-looking statements" that reflect current views of future events. Statements that include the words "expect," "intend," "plan," "believe," "project," "anticipate," "will," "may," "would" and similar statements of a future or forward-looking nature are often used to identify forward-looking statements. Similarly, statements that describe our objectives, plans or goals are forward-looking. Glenview's forward-looking statements are based on its current intent, belief, expectations, estimates and projections regarding the Company and projections regarding the industry in which it operates. These statements are not guarantees of future performance and involve risks, uncertainties, assumptions and other factors that are difficult to predict and that could cause actual results to differ materially. Accordingly, you should not rely upon forward-looking statements as a prediction of actual results and actual results may vary materially from what is expressed in or indicated by the forward- looking statements. Except to the extent required by applicable law, no person undertakes any obligation to update publicly or revise any forward-looking statement, whether as a result of new information, future developments or otherwise. |