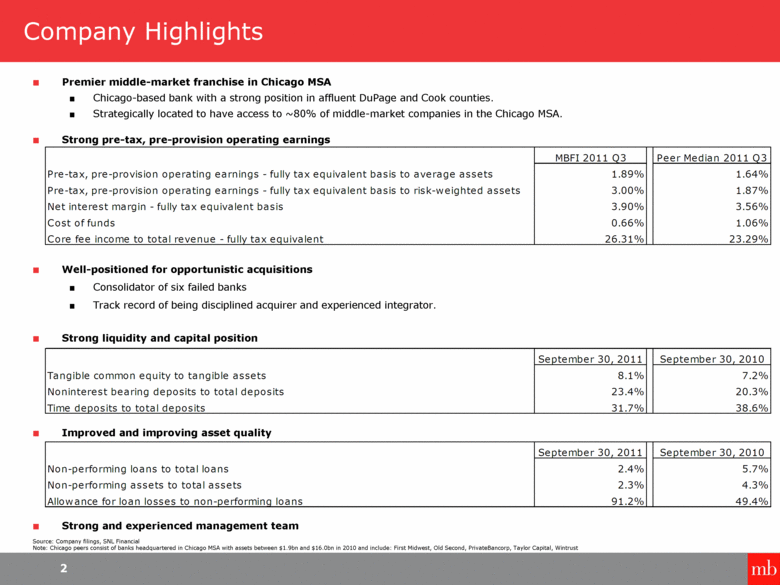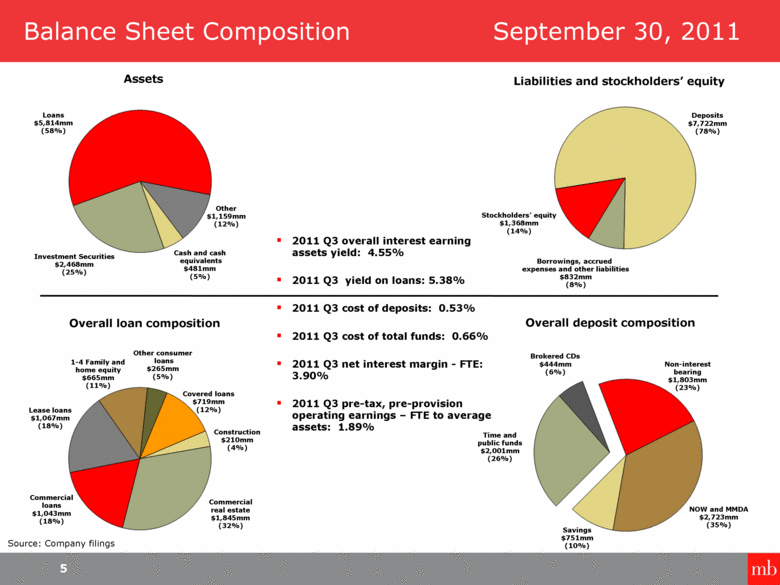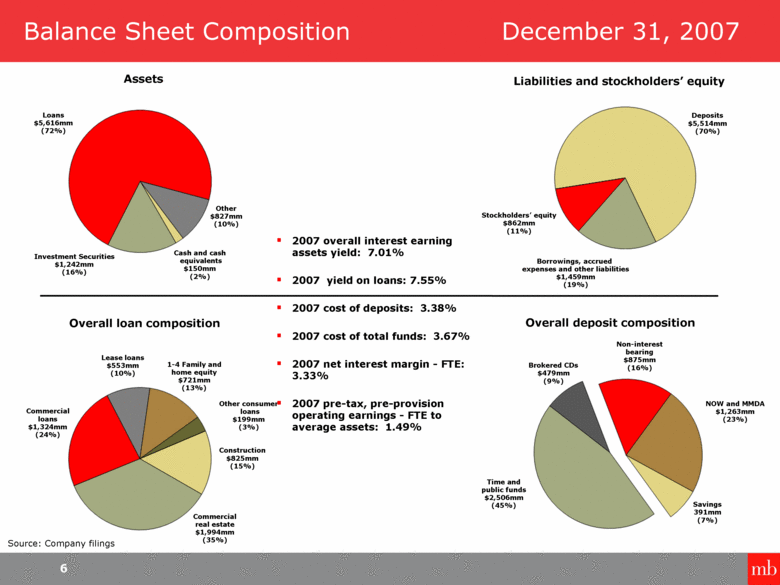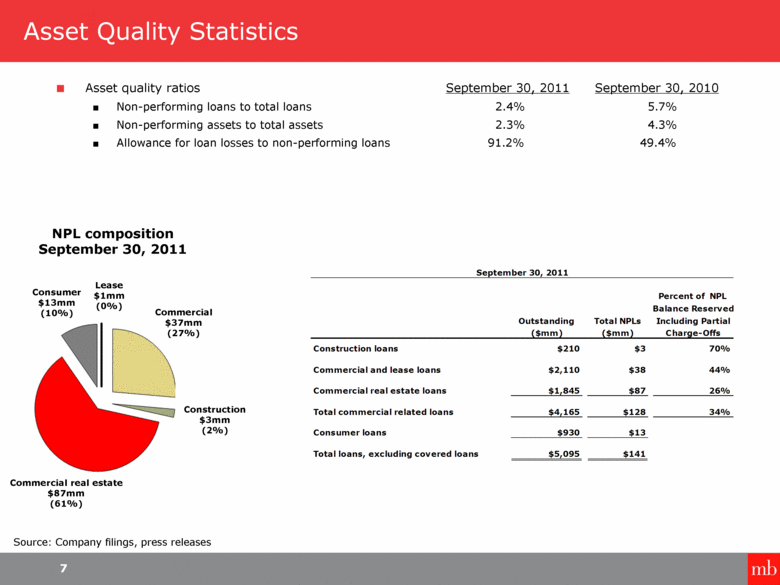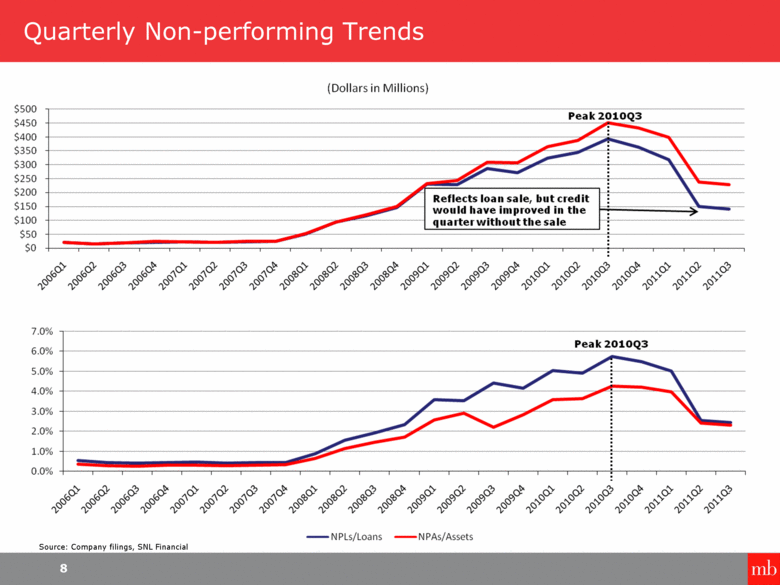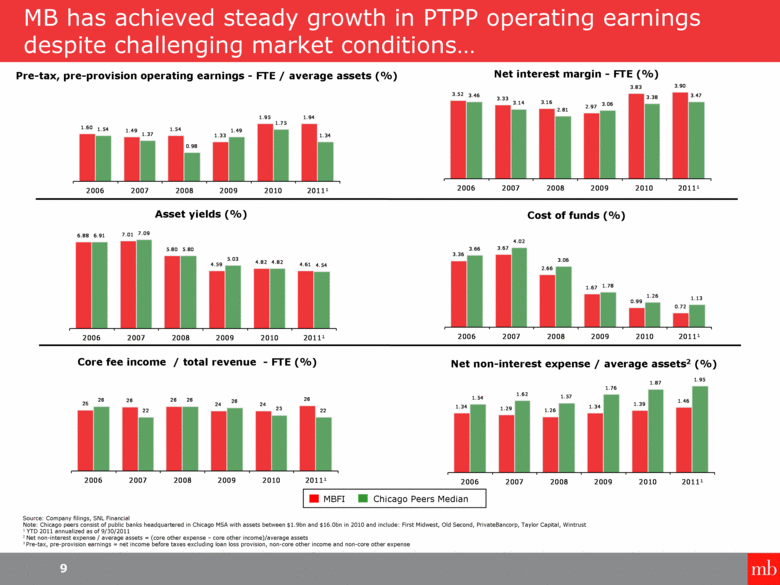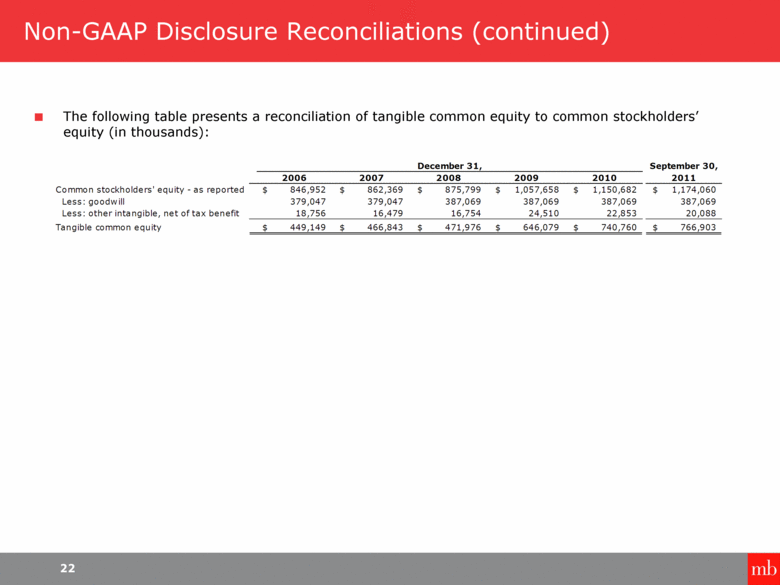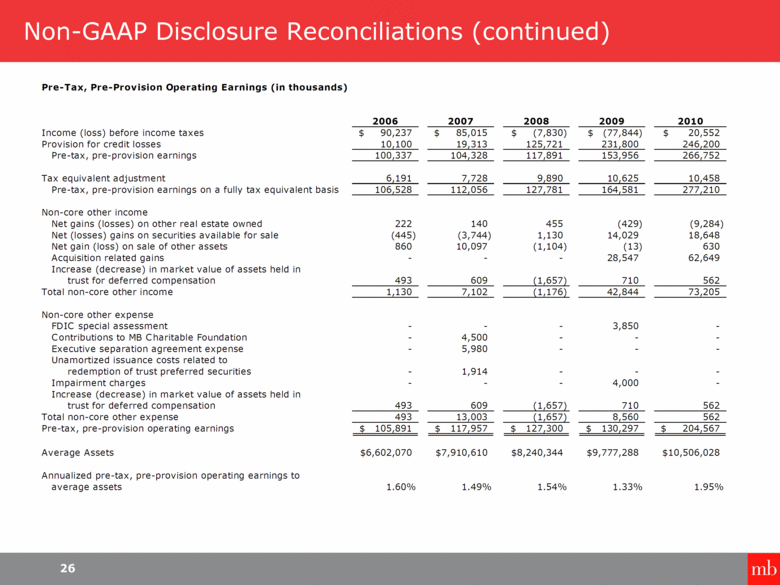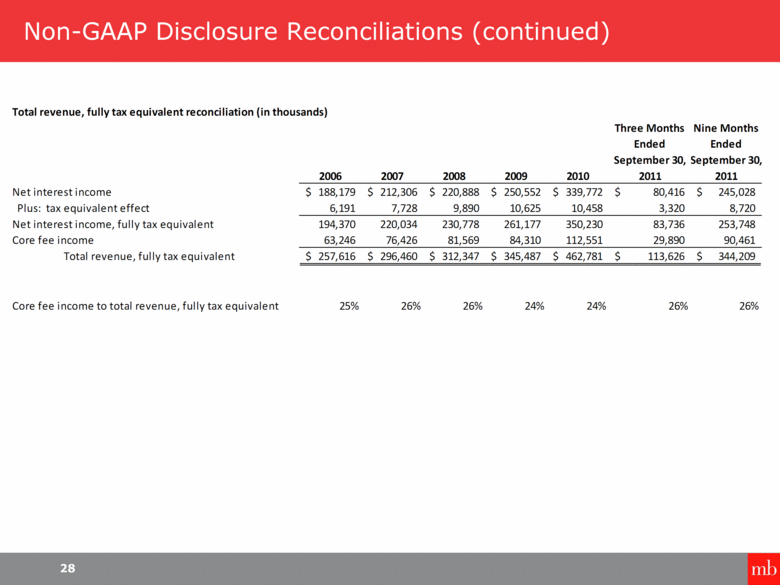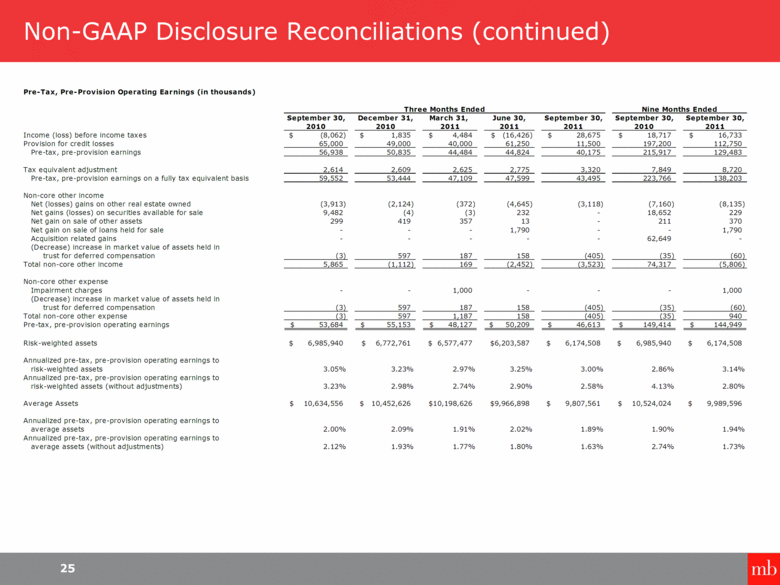
| Non-GAAP Disclosure Reconciliations (continued) 25 Pre-Tax, Pre-Provision Operating Earnings (in thousands) September 30, December 31, March 31, June 30, September 30, September 30, September 30, 2010 2010 2011 2011 2011 2010 2011 Income (loss) before income taxes (8,062) $ 1,835 $ 4,484 $ (16,426) $ 28,675 $ 18,717 $ 16,733 $ Provision for credit losses 65,000 49,000 40,000 61,250 11,500 197,200 112,750 Pre-tax, pre-provision earnings 56,938 50,835 44,484 44,824 40,175 215,917 129,483 Tax equivalent adjustment 2,614 2,609 2,625 2,775 3,320 7,849 8,720 Pre-tax, pre-provision earnings on a fully tax equivalent basis 59,552 53,444 47,109 47,599 43,495 223,766 138,203 Non-core other income Net (losses) gains on other real estate owned (3,913) (2,124) (372) (4,645) (3,118) (7,160) (8,135) Net gains (losses) on securities available for sale 9,482 (4) (3) 232 - 18,652 229 Net gain on sale of other assets 299 419 357 13 - 211 370 Net gain on sale of loans held for sale - - - 1,790 - - 1,790 Acquisition related gains - - - - - 62,649 - (Decrease) increase in market value of assets held in trust for deferred compensation (3) 597 187 158 (405) (35) (60) Total non-core other income 5,865 (1,112) 169 (2,452) (3,523) 74,317 (5,806) Non-core other expense Impairment charges - - 1,000 - - - 1,000 (Decrease) increase in market value of assets held in trust for deferred compensation (3) 597 187 158 (405) (35) (60) Total non-core other expense (3) 597 1,187 158 (405) (35) 940 Pre-tax, pre-provision operating earnings 53,684 $ 55,153 $ 48,127 $ 50,209 $ 46,613 $ 149,414 $ 144,949 $ Risk-weighted assets 6,985,940 $ 6,772,761 $ 6,577,477 $ 6,203,587 $ 6,174,508 $ 6,985,940 $ 6,174,508 $ Annualized pre-tax, pre-provision operating earnings to risk-weighted assets 3.05% 3.23% 2.97% 3.25% 3.00% 2.86% 3.14% Annualized pre-tax, pre-provision operating earnings to risk-weighted assets (without adjustments) 3.23% 2.98% 2.74% 2.90% 2.58% 4.13% 2.80% Average Assets 10,634,556 $ 10,452,626 $ 10,198,626 $ 9,966,898 $ 9,807,561 $ 10,524,024 $ 9,989,596 $ Annualized pre-tax, pre-provision operating earnings to average assets 2.00% 2.09% 1.91% 2.02% 1.89% 1.90% 1.94% Annualized pre-tax, pre-provision operating earnings to average assets (without adjustments) 2.12% 1.93% 1.77% 1.80% 1.63% 2.74% 1.73% Nine Months Ended Three Months Ended |

